IBM Cognos Report Studio Version 10.2.1: User Guide
1056
IBM Cognos Report Studio Version 10.2.1 User Guide
-
Upload
khangminh22 -
Category
Documents
-
view
0 -
download
0
Transcript of IBM Cognos Report Studio Version 10.2.1: User Guide

IBM Cognos Report StudioVersion 10.2.1
User Guide
���

NoteBefore using this information and the product it supports, read the information in “Notices” on page 983.
Product Information
This document applies to IBM Cognos Business Intelligence Version 10.2.1 and may also apply to subsequentreleases.
Licensed Materials - Property of IBM
© Copyright IBM Corporation 2005, 2013.US Government Users Restricted Rights – Use, duplication or disclosure restricted by GSA ADP Schedule Contractwith IBM Corp.

Contents
Introduction. . . . . . . . . . . . . . . . . . . . . . . . . . . . . . . . . xlvii
Chapter 1. What's New in Cognos Report Studio? . . . . . . . . . . . . . . . . . 1New features in version 10.2.1 . . . . . . . . . . . . . . . . . . . . . . . . . . . . . 1
Improved IBM Cognos Active Report performance . . . . . . . . . . . . . . . . . . . . . 1Extensible visualizations in IBM Cognos Active Report . . . . . . . . . . . . . . . . . . . . 1Option to group or ungroup repeating cells in Excel 2007 reports . . . . . . . . . . . . . . . . . 2Crosstab values as percentages . . . . . . . . . . . . . . . . . . . . . . . . . . . . 2Share sets between reports. . . . . . . . . . . . . . . . . . . . . . . . . . . . . . 2Improved text-based relational filters . . . . . . . . . . . . . . . . . . . . . . . . . . 2Improved data container and query naming support . . . . . . . . . . . . . . . . . . . . . 3Search parameter Ends with any of these keywords . . . . . . . . . . . . . . . . . . . . . 3
Removed Features in Version 10.2.1 . . . . . . . . . . . . . . . . . . . . . . . . . . . 3IBM Cognos Statistics . . . . . . . . . . . . . . . . . . . . . . . . . . . . . . . 3
New features in version 10.2.0 . . . . . . . . . . . . . . . . . . . . . . . . . . . . . 4Updated world and Africa maps. . . . . . . . . . . . . . . . . . . . . . . . . . . . 4Interactive repeater tables . . . . . . . . . . . . . . . . . . . . . . . . . . . . . . 4Improved IBM Cognos Active Report integration with IBM Cognos Workspace . . . . . . . . . . . . 4Improved support for bidirectional languages . . . . . . . . . . . . . . . . . . . . . . . 5Macro tab in expression editor . . . . . . . . . . . . . . . . . . . . . . . . . . . . 5Inherited table styles in lists and crosstabs . . . . . . . . . . . . . . . . . . . . . . . . 5Enhanced crosstab headers . . . . . . . . . . . . . . . . . . . . . . . . . . . . . 6Prompt API. . . . . . . . . . . . . . . . . . . . . . . . . . . . . . . . . . . 6Excel 2007 Data report output format . . . . . . . . . . . . . . . . . . . . . . . . . . 6Global classes for accessible reports. . . . . . . . . . . . . . . . . . . . . . . . . . . 6
Changed features in version 10.2.0 . . . . . . . . . . . . . . . . . . . . . . . . . . . . 7Support for inline prompts in reports viewed on mobile devices . . . . . . . . . . . . . . . . . 7Cognos Business Insight and Cognos Business Insight Advanced are renamed . . . . . . . . . . . . 7
Removed Features in Version 10.2.0 . . . . . . . . . . . . . . . . . . . . . . . . . . . 7Saving and opening reports on your computer . . . . . . . . . . . . . . . . . . . . . . . 7
New features in version 10.1.1 . . . . . . . . . . . . . . . . . . . . . . . . . . . . . 7New active report controls. . . . . . . . . . . . . . . . . . . . . . . . . . . . . . 8Conversion of controls to other types of controls . . . . . . . . . . . . . . . . . . . . . . 8Improved user experience when authoring active reports . . . . . . . . . . . . . . . . . . . 8Active report access code . . . . . . . . . . . . . . . . . . . . . . . . . . . . . . 8New startup options . . . . . . . . . . . . . . . . . . . . . . . . . . . . . . . . 8Keyboard shortcuts for accessibility. . . . . . . . . . . . . . . . . . . . . . . . . . . 9Updated maps. . . . . . . . . . . . . . . . . . . . . . . . . . . . . . . . . . 9Custom groups . . . . . . . . . . . . . . . . . . . . . . . . . . . . . . . . . 9Larger worksheet sizes for Microsoft Excel 2007 report outputs . . . . . . . . . . . . . . . . . 10Microsoft Excel 2007 supported as an external data source. . . . . . . . . . . . . . . . . . . 10
Changed features in version 10.1.1. . . . . . . . . . . . . . . . . . . . . . . . . . . . 10Specify how to show no data contents . . . . . . . . . . . . . . . . . . . . . . . . . 10
What's new in version 10.1.0. . . . . . . . . . . . . . . . . . . . . . . . . . . . . . 11New Features in Version 10.1.0 . . . . . . . . . . . . . . . . . . . . . . . . . . . . 11Changed Features in Version 10.1.0 . . . . . . . . . . . . . . . . . . . . . . . . . . 19Removed Features in Version 10.1.0 . . . . . . . . . . . . . . . . . . . . . . . . . . 19
Chapter 2. Getting started with Report Studio . . . . . . . . . . . . . . . . . . . 21Building IBM Cognos Business Intelligence Applications . . . . . . . . . . . . . . . . . . . . 21Relational and dimensional reporting styles . . . . . . . . . . . . . . . . . . . . . . . . 22The User Interface . . . . . . . . . . . . . . . . . . . . . . . . . . . . . . . . . 25Work in design or structure view . . . . . . . . . . . . . . . . . . . . . . . . . . . . 28Report Layout and Queries . . . . . . . . . . . . . . . . . . . . . . . . . . . . . . 29
Layout . . . . . . . . . . . . . . . . . . . . . . . . . . . . . . . . . . . . 29
© Copyright IBM Corp. 2005, 2013 iii

Queries . . . . . . . . . . . . . . . . . . . . . . . . . . . . . . . . . . . . 30Report Objects . . . . . . . . . . . . . . . . . . . . . . . . . . . . . . . . . . 31
Find Objects in a Report . . . . . . . . . . . . . . . . . . . . . . . . . . . . . . 32Options. . . . . . . . . . . . . . . . . . . . . . . . . . . . . . . . . . . . . 32Web Browser Settings . . . . . . . . . . . . . . . . . . . . . . . . . . . . . . . . 36The IBM Cognos Software Development Kit . . . . . . . . . . . . . . . . . . . . . . . . 37
Chapter 3. Creating a report . . . . . . . . . . . . . . . . . . . . . . . . . . 39Specify the Data Package . . . . . . . . . . . . . . . . . . . . . . . . . . . . . . . 39
Refresh the package . . . . . . . . . . . . . . . . . . . . . . . . . . . . . . . 40Choose a Basic Report Layout . . . . . . . . . . . . . . . . . . . . . . . . . . . . . 40
Inserting a data container from the toolbox tab . . . . . . . . . . . . . . . . . . . . . . 41Add Data . . . . . . . . . . . . . . . . . . . . . . . . . . . . . . . . . . . . 41
Data Source Icons . . . . . . . . . . . . . . . . . . . . . . . . . . . . . . . . 41Insert a Single Data Item . . . . . . . . . . . . . . . . . . . . . . . . . . . . . . 42
Validate a Report . . . . . . . . . . . . . . . . . . . . . . . . . . . . . . . . . 43Save a Report. . . . . . . . . . . . . . . . . . . . . . . . . . . . . . . . . . . 44Run a Report . . . . . . . . . . . . . . . . . . . . . . . . . . . . . . . . . . . 45
Specify Not to Render a Page If It Does Not Contain Data. . . . . . . . . . . . . . . . . . . 47Controlling the Rows Per Page for Multiple Containers in HTML and PDF . . . . . . . . . . . . . 48Producing a Report in CSV Format . . . . . . . . . . . . . . . . . . . . . . . . . . 48Producing a Report in Microsoft Excel Format . . . . . . . . . . . . . . . . . . . . . . . 49Producing a Report in XML Format . . . . . . . . . . . . . . . . . . . . . . . . . . 52Set PDF Page Options . . . . . . . . . . . . . . . . . . . . . . . . . . . . . . . 52
View Lineage Information for a Data Item . . . . . . . . . . . . . . . . . . . . . . . . . 53The IBM Cognos Business Intelligence Lineage Tool . . . . . . . . . . . . . . . . . . . . . 54
Access the IBM WebSphere Business Glossary . . . . . . . . . . . . . . . . . . . . . . . . 55Support for bidirectional languages . . . . . . . . . . . . . . . . . . . . . . . . . . . 56Reports for workspaces in Cognos Workspace . . . . . . . . . . . . . . . . . . . . . . . . 57
Prompts in workspaces in Cognos Workspace . . . . . . . . . . . . . . . . . . . . . . . 58Enable filters in workspaces in Cognos Workspace . . . . . . . . . . . . . . . . . . . . . 59
Creating Reports for IBM Cognos for Microsoft Office . . . . . . . . . . . . . . . . . . . . . 59Creating Reports for Mobile Devices . . . . . . . . . . . . . . . . . . . . . . . . . . . 61
Creating location-aware reports. . . . . . . . . . . . . . . . . . . . . . . . . . . . 61
Chapter 4. Lists . . . . . . . . . . . . . . . . . . . . . . . . . . . . . . . . 63Set List Properties . . . . . . . . . . . . . . . . . . . . . . . . . . . . . . . . . 63Hide Columns in List Reports . . . . . . . . . . . . . . . . . . . . . . . . . . . . . 64Using Repeaters . . . . . . . . . . . . . . . . . . . . . . . . . . . . . . . . . . 64
Convert a List into a Repeater . . . . . . . . . . . . . . . . . . . . . . . . . . . . 65Example - Create Mailing Labels . . . . . . . . . . . . . . . . . . . . . . . . . . . 65
Chapter 5. Crosstabs . . . . . . . . . . . . . . . . . . . . . . . . . . . . . 67Crosstab Nodes and Crosstab Node Members . . . . . . . . . . . . . . . . . . . . . . . . 67Set Crosstab Properties . . . . . . . . . . . . . . . . . . . . . . . . . . . . . . . 69Create a Single-Edge Crosstab . . . . . . . . . . . . . . . . . . . . . . . . . . . . . 70Create a Nested Crosstab . . . . . . . . . . . . . . . . . . . . . . . . . . . . . . . 71Creating headers automatically for sets in crosstabs . . . . . . . . . . . . . . . . . . . . . . 72Showing crosstab values as percentages . . . . . . . . . . . . . . . . . . . . . . . . . . 72Specify the Default Measure . . . . . . . . . . . . . . . . . . . . . . . . . . . . . . 73Swap Columns and Rows . . . . . . . . . . . . . . . . . . . . . . . . . . . . . . 74Indent Data . . . . . . . . . . . . . . . . . . . . . . . . . . . . . . . . . . . 74Change a List into a Crosstab . . . . . . . . . . . . . . . . . . . . . . . . . . . . . 75Example - Add Aggregate Data to a Crosstab . . . . . . . . . . . . . . . . . . . . . . . . 75Example - Create a Discontinuous Crosstab. . . . . . . . . . . . . . . . . . . . . . . . . 76
Chapter 6. Charts . . . . . . . . . . . . . . . . . . . . . . . . . . . . . . . 79Current Default Charts and Legacy Charts . . . . . . . . . . . . . . . . . . . . . . . . . 79Creating Charts . . . . . . . . . . . . . . . . . . . . . . . . . . . . . . . . . . 79
Chart Objects . . . . . . . . . . . . . . . . . . . . . . . . . . . . . . . . . . 80
iv IBM Cognos Report Studio Version 10.2.1: User Guide

Chart Types . . . . . . . . . . . . . . . . . . . . . . . . . . . . . . . . . . . 83Choosing a Chart Type and Configuration . . . . . . . . . . . . . . . . . . . . . . . . 83Column Charts . . . . . . . . . . . . . . . . . . . . . . . . . . . . . . . . . 84Line Charts . . . . . . . . . . . . . . . . . . . . . . . . . . . . . . . . . . 85Pie Charts . . . . . . . . . . . . . . . . . . . . . . . . . . . . . . . . . . . 86Bar Charts . . . . . . . . . . . . . . . . . . . . . . . . . . . . . . . . . . . 87Area Charts . . . . . . . . . . . . . . . . . . . . . . . . . . . . . . . . . . 88Point Charts . . . . . . . . . . . . . . . . . . . . . . . . . . . . . . . . . . 89Combination Charts . . . . . . . . . . . . . . . . . . . . . . . . . . . . . . . 90Scatter Charts . . . . . . . . . . . . . . . . . . . . . . . . . . . . . . . . . 90Bubble Charts . . . . . . . . . . . . . . . . . . . . . . . . . . . . . . . . . 91Quadrant Charts. . . . . . . . . . . . . . . . . . . . . . . . . . . . . . . . . 92Bullet Charts . . . . . . . . . . . . . . . . . . . . . . . . . . . . . . . . . . 93Gauge Charts. . . . . . . . . . . . . . . . . . . . . . . . . . . . . . . . . . 94Pareto Charts . . . . . . . . . . . . . . . . . . . . . . . . . . . . . . . . . . 95Progressive Column Charts . . . . . . . . . . . . . . . . . . . . . . . . . . . . . 96Microcharts . . . . . . . . . . . . . . . . . . . . . . . . . . . . . . . . . . 96Marimekko Charts . . . . . . . . . . . . . . . . . . . . . . . . . . . . . . . . 97Radar Charts . . . . . . . . . . . . . . . . . . . . . . . . . . . . . . . . . . 98Polar Charts . . . . . . . . . . . . . . . . . . . . . . . . . . . . . . . . . . 98Range Indicator Charts . . . . . . . . . . . . . . . . . . . . . . . . . . . . . . 99Chart Configurations . . . . . . . . . . . . . . . . . . . . . . . . . . . . . . . 100
Convert Charts From One Type to Another . . . . . . . . . . . . . . . . . . . . . . . . 102Convert Legacy Charts to Current Default Charts . . . . . . . . . . . . . . . . . . . . . . 103
Limitations When Converting Legacy Charts . . . . . . . . . . . . . . . . . . . . . . . 103Customizing Chart Properties . . . . . . . . . . . . . . . . . . . . . . . . . . . . . 104
Resize a Current Default Chart . . . . . . . . . . . . . . . . . . . . . . . . . . . 107Resize a Legacy Chart . . . . . . . . . . . . . . . . . . . . . . . . . . . . . . 108Customizing the Color Palette of a Chart . . . . . . . . . . . . . . . . . . . . . . . . 108Creating a Conditional Color Palette in a Chart . . . . . . . . . . . . . . . . . . . . . . 111Change a Chart Background in a Current Default Chart . . . . . . . . . . . . . . . . . . . 115Change a Chart Background in a Legacy Chart . . . . . . . . . . . . . . . . . . . . . . 115Add Background Effects to a Chart Object in a Legacy Chart . . . . . . . . . . . . . . . . . 116Add Colored Regions in a Current Default Chart . . . . . . . . . . . . . . . . . . . . . 117Specify Custom Label Text . . . . . . . . . . . . . . . . . . . . . . . . . . . . . 119Customizing the Axes of a Chart . . . . . . . . . . . . . . . . . . . . . . . . . . . 119Showing Gridlines in a Chart . . . . . . . . . . . . . . . . . . . . . . . . . . . . 123Customize the Legend in a Current Default Chart . . . . . . . . . . . . . . . . . . . . . 124Customize the Items in the Legend of a Legacy Chart . . . . . . . . . . . . . . . . . . . . 126Adding a Note to a Chart . . . . . . . . . . . . . . . . . . . . . . . . . . . . . 126Adding a Baseline to a Chart . . . . . . . . . . . . . . . . . . . . . . . . . . . . 128Adding Markers to Charts . . . . . . . . . . . . . . . . . . . . . . . . . . . . . 131Display Trendlines in Current Default Charts. . . . . . . . . . . . . . . . . . . . . . . 134Display Regression Lines in Legacy Scatter or Bubble Charts . . . . . . . . . . . . . . . . . 135Showing data values in current default charts . . . . . . . . . . . . . . . . . . . . . . 136Showing data values in current default pie and donut charts . . . . . . . . . . . . . . . . . 137Showing data values in other current default charts . . . . . . . . . . . . . . . . . . . . 138Define Query Context When Customizing Legend Entries, Legend Titles, or Axis Labels . . . . . . . . 138Summarize Small Slices, Bars, or Columns in Current Default Charts . . . . . . . . . . . . . . . 139Customizing Lines and Data Points in a Line Chart . . . . . . . . . . . . . . . . . . . . 139Customize a Current Default Combination Chart . . . . . . . . . . . . . . . . . . . . . 141Create a Matrix of Current Default Charts . . . . . . . . . . . . . . . . . . . . . . . . 142Customize a Current Default Gauge Chart . . . . . . . . . . . . . . . . . . . . . . . 144Customize a Legacy Gauge Chart . . . . . . . . . . . . . . . . . . . . . . . . . . 145Define Color by Value in Current Default Scatter and Bubble Charts . . . . . . . . . . . . . . . 146Specify the Bubble Size in a Current Default Bubble Chart . . . . . . . . . . . . . . . . . . 148Set the Position of the First Slice in a Current Default Pie Chart . . . . . . . . . . . . . . . . 148Create a Donut Chart from a Current Default Pie Chart . . . . . . . . . . . . . . . . . . . 149Pull Out Pie Slices in a Current Default Pie Chart . . . . . . . . . . . . . . . . . . . . . 149Define the Cumulation Line in a Current Default Pareto Chart . . . . . . . . . . . . . . . . . 151Define the Cumulation Line in a Legacy Pareto Chart . . . . . . . . . . . . . . . . . . . . 151
Contents v

Insert a Microchart into a Crosstab . . . . . . . . . . . . . . . . . . . . . . . . . . 152Customize a Current Default Bullet Chart . . . . . . . . . . . . . . . . . . . . . . . . 152
Changing the number of hotspots in a chart . . . . . . . . . . . . . . . . . . . . . . . . 153Create a Drill-up and Drill-down Chart . . . . . . . . . . . . . . . . . . . . . . . . . 153Example - Creating Drill-through Access in a Legacy Chart . . . . . . . . . . . . . . . . . . . 154
Create the target report . . . . . . . . . . . . . . . . . . . . . . . . . . . . . . 155Create the Source Report . . . . . . . . . . . . . . . . . . . . . . . . . . . . . 155Define the Drill Behavior . . . . . . . . . . . . . . . . . . . . . . . . . . . . . 156
Example - Creating and Customizing a Metrics Range Legacy Chart . . . . . . . . . . . . . . . . 156Create a Metrics Range Chart . . . . . . . . . . . . . . . . . . . . . . . . . . . . 156Customize the Chart . . . . . . . . . . . . . . . . . . . . . . . . . . . . . . . 157Customize the Chart Legend Labels . . . . . . . . . . . . . . . . . . . . . . . . . . 157
Adding a Metric Studio Diagram to a Report. . . . . . . . . . . . . . . . . . . . . . . . 158Add a Static Metric Studio Diagram to a Report . . . . . . . . . . . . . . . . . . . . . . 159Add a Data-driven Metric Studio Diagram to a Report . . . . . . . . . . . . . . . . . . . 159
Chapter 7. Maps . . . . . . . . . . . . . . . . . . . . . . . . . . . . . . . 161The Report Studio Map Object . . . . . . . . . . . . . . . . . . . . . . . . . . . . 161Example - Create a Map Report . . . . . . . . . . . . . . . . . . . . . . . . . . . . 162Set Map Properties . . . . . . . . . . . . . . . . . . . . . . . . . . . . . . . . 163Example - Define Data Values for the Region Layer . . . . . . . . . . . . . . . . . . . . . 165Match Data Values to Names in the Map File. . . . . . . . . . . . . . . . . . . . . . . . 166Define Data Values for the Point Layer . . . . . . . . . . . . . . . . . . . . . . . . . . 166Add Colors to the Region or Point Layer . . . . . . . . . . . . . . . . . . . . . . . . . 167Add a Legend Title to a Map . . . . . . . . . . . . . . . . . . . . . . . . . . . . . 168Add a Note to a Map . . . . . . . . . . . . . . . . . . . . . . . . . . . . . . . 168Drill Through to Another Report From a Map . . . . . . . . . . . . . . . . . . . . . . . 168Edit a Map . . . . . . . . . . . . . . . . . . . . . . . . . . . . . . . . . . . 169Additional Maps . . . . . . . . . . . . . . . . . . . . . . . . . . . . . . . . . 170Location Intelligence . . . . . . . . . . . . . . . . . . . . . . . . . . . . . . . . 170
Chapter 8. Active Reports . . . . . . . . . . . . . . . . . . . . . . . . . . . 171Active Report Controls . . . . . . . . . . . . . . . . . . . . . . . . . . . . . . . 171Active Report Variables . . . . . . . . . . . . . . . . . . . . . . . . . . . . . . . 172Convert an Existing Report to an Active Report . . . . . . . . . . . . . . . . . . . . . . . 172Specify Active Report Properties . . . . . . . . . . . . . . . . . . . . . . . . . . . . 173Extensible visualizations. . . . . . . . . . . . . . . . . . . . . . . . . . . . . . . 173
Adding a visualization to an active report . . . . . . . . . . . . . . . . . . . . . . . . 174Adding a treemap visualization . . . . . . . . . . . . . . . . . . . . . . . . . . . 175Adding a heatmap visualization . . . . . . . . . . . . . . . . . . . . . . . . . . . 177Creating a packed bubble visualization . . . . . . . . . . . . . . . . . . . . . . . . . 178Adding a network diagram. . . . . . . . . . . . . . . . . . . . . . . . . . . . . 180Resizing a visualization . . . . . . . . . . . . . . . . . . . . . . . . . . . . . . 181Changing the nesting order. . . . . . . . . . . . . . . . . . . . . . . . . . . . . 181Populating a visualization with data from the visualization definition . . . . . . . . . . . . . . 182Specifying the range values that are displayed . . . . . . . . . . . . . . . . . . . . . . 182Updating visualizations . . . . . . . . . . . . . . . . . . . . . . . . . . . . . . 183
Adding Interactivity to a Report . . . . . . . . . . . . . . . . . . . . . . . . . . . . 184Create and Manage Active Report Variables . . . . . . . . . . . . . . . . . . . . . . . 184Adding Controls to a Report . . . . . . . . . . . . . . . . . . . . . . . . . . . . 185Add Data to a Control . . . . . . . . . . . . . . . . . . . . . . . . . . . . . . 190Define a Connection Between Controls . . . . . . . . . . . . . . . . . . . . . . . . . 192Specify the Selection Behavior of a Control . . . . . . . . . . . . . . . . . . . . . . . 193Specify the Reaction Behavior of a Control . . . . . . . . . . . . . . . . . . . . . . . 194Set the No Value List Item . . . . . . . . . . . . . . . . . . . . . . . . . . . . . 196Show or Hide a Column or Row . . . . . . . . . . . . . . . . . . . . . . . . . . . 197Sort Data in a List . . . . . . . . . . . . . . . . . . . . . . . . . . . . . . . . 197Recommendation - use master detail relationships when authoring decks . . . . . . . . . . . . . 197
Summarizing Data in the Active Report Output . . . . . . . . . . . . . . . . . . . . . . . 198Run or Save an Active Report . . . . . . . . . . . . . . . . . . . . . . . . . . . . . 198
vi IBM Cognos Report Studio Version 10.2.1: User Guide

Example - Create an Active Report Showing Revenue Data for Core Products . . . . . . . . . . . . . 199Create the active report . . . . . . . . . . . . . . . . . . . . . . . . . . . . . . 199Add data to the data drop-down list controls. . . . . . . . . . . . . . . . . . . . . . . 200Add data to the list . . . . . . . . . . . . . . . . . . . . . . . . . . . . . . . 201Add interactivity to the report. . . . . . . . . . . . . . . . . . . . . . . . . . . . 202Specifying default values for the data drop-down list controls . . . . . . . . . . . . . . . . . 202Revenue data for core products report output . . . . . . . . . . . . . . . . . . . . . . 202
Example - Sales analysis active report . . . . . . . . . . . . . . . . . . . . . . . . . . 203Creating a new active report . . . . . . . . . . . . . . . . . . . . . . . . . . . . 203Adding data to the check box group control . . . . . . . . . . . . . . . . . . . . . . . 204Adding a default card to the deck and data to the data discrete values slider . . . . . . . . . . . . 204Defining a connection between the check box group and the deck . . . . . . . . . . . . . . . . 205Adding data to the list object . . . . . . . . . . . . . . . . . . . . . . . . . . . . 205Defining a connection between the slider and the list object . . . . . . . . . . . . . . . . . . 206Adding a title to the list . . . . . . . . . . . . . . . . . . . . . . . . . . . . . . 206Adding data to the data deck and chart . . . . . . . . . . . . . . . . . . . . . . . . 207Defining a connection between the chart and the data deck . . . . . . . . . . . . . . . . . . 207Adding a title to the chart . . . . . . . . . . . . . . . . . . . . . . . . . . . . . 208Sales analysis report output . . . . . . . . . . . . . . . . . . . . . . . . . . . . 208
Example - Network diagram visualization . . . . . . . . . . . . . . . . . . . . . . . . . 209Adding a new visualization in IBM Cognos Active Report . . . . . . . . . . . . . . . . . . 209Adding data to the nodes data container . . . . . . . . . . . . . . . . . . . . . . . . 210Adding data to the links data container . . . . . . . . . . . . . . . . . . . . . . . . 210Defining a connection between the data drop-down list and the visualization object. . . . . . . . . . 210Network diagram visualization output . . . . . . . . . . . . . . . . . . . . . . . . . 211
Chapter 9. Relational Reporting Style . . . . . . . . . . . . . . . . . . . . . . 213Add Relational Data to a Report . . . . . . . . . . . . . . . . . . . . . . . . . . . . 213Group Relational Data . . . . . . . . . . . . . . . . . . . . . . . . . . . . . . . 213
Perform Advanced Grouping . . . . . . . . . . . . . . . . . . . . . . . . . . . . 214Creating relational custom groups . . . . . . . . . . . . . . . . . . . . . . . . . . 215Set the Group Span for a Column . . . . . . . . . . . . . . . . . . . . . . . . . . 216Divide Data into Sections . . . . . . . . . . . . . . . . . . . . . . . . . . . . . 218
Summarizing Data Relationally . . . . . . . . . . . . . . . . . . . . . . . . . . . . 219Add a Simple Summary . . . . . . . . . . . . . . . . . . . . . . . . . . . . . . 220Set the Auto Group & Summarize Property . . . . . . . . . . . . . . . . . . . . . . . 221Specify Detail or Summary Aggregation in the Model . . . . . . . . . . . . . . . . . . . . 222Specify Aggregation Properties for a Data Item . . . . . . . . . . . . . . . . . . . . . . 222Use Summary Functions in Data Item Expressions . . . . . . . . . . . . . . . . . . . . . 222Summary Functions . . . . . . . . . . . . . . . . . . . . . . . . . . . . . . . 224
Focusing Relational Data . . . . . . . . . . . . . . . . . . . . . . . . . . . . . . 228Create a Detail or Summary Filter . . . . . . . . . . . . . . . . . . . . . . . . . . 229Edit or remove a filter . . . . . . . . . . . . . . . . . . . . . . . . . . . . . . 233Browse or Search the Values of a Data Item . . . . . . . . . . . . . . . . . . . . . . . 233Ignoring the Time Component in Date Columns. . . . . . . . . . . . . . . . . . . . . . 234
Sorting Relational Data . . . . . . . . . . . . . . . . . . . . . . . . . . . . . . . 235Perform Advanced Layout Sorting . . . . . . . . . . . . . . . . . . . . . . . . . . 235
Working with Relational Queries . . . . . . . . . . . . . . . . . . . . . . . . . . . . 236Specify a List of Data Items for an Object . . . . . . . . . . . . . . . . . . . . . . . . 237Relate a Query to a Layout . . . . . . . . . . . . . . . . . . . . . . . . . . . . . 237Connecting Queries Between Different Data Sources . . . . . . . . . . . . . . . . . . . . 237Add a Query to a Relational Report . . . . . . . . . . . . . . . . . . . . . . . . . . 238Create a Union Query . . . . . . . . . . . . . . . . . . . . . . . . . . . . . . 239Create a Join Relationship . . . . . . . . . . . . . . . . . . . . . . . . . . . . . 242Reference a Package Item in a Child Query . . . . . . . . . . . . . . . . . . . . . . . 243Create a Master Detail Relationship . . . . . . . . . . . . . . . . . . . . . . . . . . 244Working with Queries in SQL . . . . . . . . . . . . . . . . . . . . . . . . . . . . 246
Using Relational Calculations . . . . . . . . . . . . . . . . . . . . . . . . . . . . . 248Create a Simple Calculation . . . . . . . . . . . . . . . . . . . . . . . . . . . . 249Insert a Query Calculation . . . . . . . . . . . . . . . . . . . . . . . . . . . . . 250Create a Layout Calculation . . . . . . . . . . . . . . . . . . . . . . . . . . . . 252
Contents vii

Chapter 10. Dimensional Reporting Style . . . . . . . . . . . . . . . . . . . . 253Add Dimensional Data to a Report . . . . . . . . . . . . . . . . . . . . . . . . . . . 253
Customize the Source Tree . . . . . . . . . . . . . . . . . . . . . . . . . . . . . 255Insert a Member . . . . . . . . . . . . . . . . . . . . . . . . . . . . . . . . 255Search for a Member . . . . . . . . . . . . . . . . . . . . . . . . . . . . . . . 256Nest Members . . . . . . . . . . . . . . . . . . . . . . . . . . . . . . . . . 257Insert a Hierarchy . . . . . . . . . . . . . . . . . . . . . . . . . . . . . . . . 257Insert a Member Property . . . . . . . . . . . . . . . . . . . . . . . . . . . . . 258Create a Set of Members. . . . . . . . . . . . . . . . . . . . . . . . . . . . . . 258Sharing sets between reports . . . . . . . . . . . . . . . . . . . . . . . . . . . . 259Edit a Set. . . . . . . . . . . . . . . . . . . . . . . . . . . . . . . . . . . 261Extended Data Items . . . . . . . . . . . . . . . . . . . . . . . . . . . . . . . 263Tips for Working with Ragged or Unbalanced Hierarchies . . . . . . . . . . . . . . . . . . 264
Creating dimensional custom groups . . . . . . . . . . . . . . . . . . . . . . . . . . 265Summarizing Data Dimensionally . . . . . . . . . . . . . . . . . . . . . . . . . . . 266
Add a Simple Summary . . . . . . . . . . . . . . . . . . . . . . . . . . . . . . 268Summarizing Values in Crosstabs . . . . . . . . . . . . . . . . . . . . . . . . . . 269Summarizing Member Sets . . . . . . . . . . . . . . . . . . . . . . . . . . . . . 271Rolling and Moving Averages . . . . . . . . . . . . . . . . . . . . . . . . . . . . 272Show Data for Specific Time Periods . . . . . . . . . . . . . . . . . . . . . . . . . 273Summary Functions . . . . . . . . . . . . . . . . . . . . . . . . . . . . . . . 273
Focusing Dimensional Data. . . . . . . . . . . . . . . . . . . . . . . . . . . . . . 278Create a Context Filter . . . . . . . . . . . . . . . . . . . . . . . . . . . . . . 279
Sorting Dimensional Data . . . . . . . . . . . . . . . . . . . . . . . . . . . . . . 281Sort Sets by Label . . . . . . . . . . . . . . . . . . . . . . . . . . . . . . . . 282Sort Sets in the Opposite Axis by Value . . . . . . . . . . . . . . . . . . . . . . . . 282Perform Advanced Set Sorting. . . . . . . . . . . . . . . . . . . . . . . . . . . . 283
Working with Dimensional Queries . . . . . . . . . . . . . . . . . . . . . . . . . . . 283Specify a List of Data Items for an Object . . . . . . . . . . . . . . . . . . . . . . . . 284Relate a Query to a Layout . . . . . . . . . . . . . . . . . . . . . . . . . . . . . 284Using Dimensional Data Sources with Queries . . . . . . . . . . . . . . . . . . . . . . 284Connecting Queries Between Different Data Sources . . . . . . . . . . . . . . . . . . . . 285Multiple-fact Queries . . . . . . . . . . . . . . . . . . . . . . . . . . . . . . . 285Add a Query to a Dimensional Report . . . . . . . . . . . . . . . . . . . . . . . . . 289Add Dimension Information to a Query . . . . . . . . . . . . . . . . . . . . . . . . 290Create a Master Detail Relationship . . . . . . . . . . . . . . . . . . . . . . . . . . 292Working with Queries in SQL or MDX . . . . . . . . . . . . . . . . . . . . . . . . . 295Example - Create a Dynamic Report That Shows Period-to-date Data. . . . . . . . . . . . . . . 300
Using Dimensional Calculations . . . . . . . . . . . . . . . . . . . . . . . . . . . . 302Create a Simple Member Calculation . . . . . . . . . . . . . . . . . . . . . . . . . 302Insert a Query Calculation . . . . . . . . . . . . . . . . . . . . . . . . . . . . . 303Create a Layout Calculation . . . . . . . . . . . . . . . . . . . . . . . . . . . . 305Create an Intersection (Tuple) . . . . . . . . . . . . . . . . . . . . . . . . . . . . 306Assigning a Hierarchy or Dimension . . . . . . . . . . . . . . . . . . . . . . . . . 306
Drilling Up and Drilling Down in Dimensional Reports . . . . . . . . . . . . . . . . . . . . 307Member Sets . . . . . . . . . . . . . . . . . . . . . . . . . . . . . . . . . 307Create a Drill-up and Drill-down Report . . . . . . . . . . . . . . . . . . . . . . . . 308Example - Create a Dashboard Report . . . . . . . . . . . . . . . . . . . . . . . . . 310
Chapter 11. Adding Prompts to Filter Data . . . . . . . . . . . . . . . . . . . . 313Use the Build Prompt Page Tool . . . . . . . . . . . . . . . . . . . . . . . . . . . . 314Build Your Own Prompt and Prompt Page . . . . . . . . . . . . . . . . . . . . . . . . 315
Example - Create a Report Showing Products Shipped for a Specific Time Interval . . . . . . . . . . 318Create a Parameter to Produce a Prompt . . . . . . . . . . . . . . . . . . . . . . . . . 319Create a Prompt Directly in a Report Page . . . . . . . . . . . . . . . . . . . . . . . . 320Modifying Prompts . . . . . . . . . . . . . . . . . . . . . . . . . . . . . . . . 321
Change the Prompt Control Interface . . . . . . . . . . . . . . . . . . . . . . . . . 321Specify That a Prompt Requires User Input . . . . . . . . . . . . . . . . . . . . . . . 322Allow Users to Select Multiple Values in a Prompt . . . . . . . . . . . . . . . . . . . . . 322Show or Hide Prompt Status . . . . . . . . . . . . . . . . . . . . . . . . . . . . 323Specify a Default Selection for a Prompt . . . . . . . . . . . . . . . . . . . . . . . . 323
viii IBM Cognos Report Studio Version 10.2.1: User Guide

Customize Prompt Text . . . . . . . . . . . . . . . . . . . . . . . . . . . . . . 323Specify Prompt Values . . . . . . . . . . . . . . . . . . . . . . . . . . . . . . 324Add a Prompt Button . . . . . . . . . . . . . . . . . . . . . . . . . . . . . . 324Create a Cascading Prompt. . . . . . . . . . . . . . . . . . . . . . . . . . . . . 325
Control the Data That Appears in a Tree Prompt . . . . . . . . . . . . . . . . . . . . . . 326Using in_range Filters with Character Data . . . . . . . . . . . . . . . . . . . . . . . . 326Showing prompt values in generated SQL or MDX . . . . . . . . . . . . . . . . . . . . . . 326
Chapter 12. Laying Out a Report . . . . . . . . . . . . . . . . . . . . . . . . 329Report Layout Recommendations. . . . . . . . . . . . . . . . . . . . . . . . . . . . 329The Page Structure View . . . . . . . . . . . . . . . . . . . . . . . . . . . . . . 329Copy Object Formatting . . . . . . . . . . . . . . . . . . . . . . . . . . . . . . . 330Add a Header or Footer to a Report or List . . . . . . . . . . . . . . . . . . . . . . . . 331Add Borders to an Object . . . . . . . . . . . . . . . . . . . . . . . . . . . . . . 332Add a Text Item to a Report . . . . . . . . . . . . . . . . . . . . . . . . . . . . . 332Specify the Font for a Report . . . . . . . . . . . . . . . . . . . . . . . . . . . . . 333Insert an Image in a Report . . . . . . . . . . . . . . . . . . . . . . . . . . . . . 333
Insert a Background Image in an Object . . . . . . . . . . . . . . . . . . . . . . . . 334Add Background Effects . . . . . . . . . . . . . . . . . . . . . . . . . . . . . . . 334
Add background effects to a chart . . . . . . . . . . . . . . . . . . . . . . . . . . 335Add a background gradient to a page . . . . . . . . . . . . . . . . . . . . . . . . . 335Add a drop shadow to a container . . . . . . . . . . . . . . . . . . . . . . . . . . 336
Insert a Formatting Object in a Report . . . . . . . . . . . . . . . . . . . . . . . . . . 336Elements Supported in Rich Text Items . . . . . . . . . . . . . . . . . . . . . . . . . 338Example - Add a Multimedia File to a Report . . . . . . . . . . . . . . . . . . . . . . 338
Align an Object in a Report . . . . . . . . . . . . . . . . . . . . . . . . . . . . . 339Using a table to control where objects appear . . . . . . . . . . . . . . . . . . . . . . . 339
Apply a Table Style . . . . . . . . . . . . . . . . . . . . . . . . . . . . . . . 340Apply Padding to an Object . . . . . . . . . . . . . . . . . . . . . . . . . . . . . 341Set Margins for an Object . . . . . . . . . . . . . . . . . . . . . . . . . . . . . . 342Add Multiple Items to a Single Column . . . . . . . . . . . . . . . . . . . . . . . . . 342
Example - Create a Report with Multiple Items in One Column . . . . . . . . . . . . . . . . 342Reuse a Layout Object . . . . . . . . . . . . . . . . . . . . . . . . . . . . . . . 344
Change a Reused Object. . . . . . . . . . . . . . . . . . . . . . . . . . . . . . 345Update Reused Objects . . . . . . . . . . . . . . . . . . . . . . . . . . . . . . 346
Specify text and container direction . . . . . . . . . . . . . . . . . . . . . . . . . . . 346Specify Line Spacing and Breaking . . . . . . . . . . . . . . . . . . . . . . . . . . . 348Specify the Height and Width of an Object . . . . . . . . . . . . . . . . . . . . . . . . 348Control How Other Objects Flow Around an Object . . . . . . . . . . . . . . . . . . . . . 349Specify Report Properties . . . . . . . . . . . . . . . . . . . . . . . . . . . . . . 350Create and Modify Report and Object Styles . . . . . . . . . . . . . . . . . . . . . . . . 350
Modify the report style . . . . . . . . . . . . . . . . . . . . . . . . . . . . . . 351Modify object styles . . . . . . . . . . . . . . . . . . . . . . . . . . . . . . . 351(Don't Print) Class . . . . . . . . . . . . . . . . . . . . . . . . . . . . . . . . 352Modify Classes to Format Query Studio Reports . . . . . . . . . . . . . . . . . . . . . 352Modifying the Default Layout Style Sheet . . . . . . . . . . . . . . . . . . . . . . . . 353
Add Color to an Object . . . . . . . . . . . . . . . . . . . . . . . . . . . . . . . 353
Chapter 13. Working With Your External Data . . . . . . . . . . . . . . . . . . 355Preparing to Work with your External Data . . . . . . . . . . . . . . . . . . . . . . . . 357Import Data . . . . . . . . . . . . . . . . . . . . . . . . . . . . . . . . . . . 358Map Data . . . . . . . . . . . . . . . . . . . . . . . . . . . . . . . . . . . 359Finish Importing Data . . . . . . . . . . . . . . . . . . . . . . . . . . . . . . . 360Publish the Package . . . . . . . . . . . . . . . . . . . . . . . . . . . . . . . . 361Edit Your External Data . . . . . . . . . . . . . . . . . . . . . . . . . . . . . . . 361Delete Your External Data . . . . . . . . . . . . . . . . . . . . . . . . . . . . . . 362Running a Report That Contains External Data . . . . . . . . . . . . . . . . . . . . . . . 363Making your Reports Public . . . . . . . . . . . . . . . . . . . . . . . . . . . . . 363
Contents ix

Chapter 14. Using Conditions . . . . . . . . . . . . . . . . . . . . . . . . . 365Highlight Data Using a Conditional Style . . . . . . . . . . . . . . . . . . . . . . . . . 365
Create a New Conditional Style . . . . . . . . . . . . . . . . . . . . . . . . . . . 366Reuse an Existing Conditional Style . . . . . . . . . . . . . . . . . . . . . . . . . . 367Create an Advanced Conditional Style . . . . . . . . . . . . . . . . . . . . . . . . . 368Manage Conditional Styles . . . . . . . . . . . . . . . . . . . . . . . . . . . . . 368Example - Add a Conditional Style to an Existing Report. . . . . . . . . . . . . . . . . . . 368
Highlight Data Using a Style Variable . . . . . . . . . . . . . . . . . . . . . . . . . . 369Adding Conditional Rendering to a Report . . . . . . . . . . . . . . . . . . . . . . . . 370
Add a Variable from the Condition Explorer . . . . . . . . . . . . . . . . . . . . . . . 370Add a Variable from the Properties Pane . . . . . . . . . . . . . . . . . . . . . . . . 371Hide or Show an Object . . . . . . . . . . . . . . . . . . . . . . . . . . . . . . 372Add Conditional Rendering . . . . . . . . . . . . . . . . . . . . . . . . . . . . 373Example - Create a Conditional Report . . . . . . . . . . . . . . . . . . . . . . . . . 373Add Multiple Layouts . . . . . . . . . . . . . . . . . . . . . . . . . . . . . . 375Setting up a Multilingual Reporting Environment . . . . . . . . . . . . . . . . . . . . . 376Create a Multilingual Report in Report Studio . . . . . . . . . . . . . . . . . . . . . . 377
Chapter 15. Bursting Reports . . . . . . . . . . . . . . . . . . . . . . . . . 379Defining Burst Recipients . . . . . . . . . . . . . . . . . . . . . . . . . . . . . . 379
Create a Calculated Field . . . . . . . . . . . . . . . . . . . . . . . . . . . . . 379Creating the Burst Table in the Source Database . . . . . . . . . . . . . . . . . . . . . . 380Importing the Table into a Package . . . . . . . . . . . . . . . . . . . . . . . . . . 381
Specify a Burst Group . . . . . . . . . . . . . . . . . . . . . . . . . . . . . . . 381Set Burst Options . . . . . . . . . . . . . . . . . . . . . . . . . . . . . . . . . 382Enable Bursting . . . . . . . . . . . . . . . . . . . . . . . . . . . . . . . . . 383Creating Burst Reports Using Dimensional Data Sources . . . . . . . . . . . . . . . . . . . . 383Example - Burst a Report . . . . . . . . . . . . . . . . . . . . . . . . . . . . . . 384
Chapter 16. Format Data. . . . . . . . . . . . . . . . . . . . . . . . . . . . 387Set the Default Data Formats . . . . . . . . . . . . . . . . . . . . . . . . . . . . . 387Specify the Data Format for an Object . . . . . . . . . . . . . . . . . . . . . . . . . . 388
Specifying the Number of Decimals in Numbers . . . . . . . . . . . . . . . . . . . . . 388Digit shaping in charts and maps. . . . . . . . . . . . . . . . . . . . . . . . . . . 388
Locale-sensitive Properties . . . . . . . . . . . . . . . . . . . . . . . . . . . . . . 390Suppress Empty Cells . . . . . . . . . . . . . . . . . . . . . . . . . . . . . . . 391
Suppress Null Cells Using Filters . . . . . . . . . . . . . . . . . . . . . . . . . . . 391Example - Suppress Zeros in Rows and Columns in an Existing Report . . . . . . . . . . . . . . 392
Specify what appears for data containers that contain no data . . . . . . . . . . . . . . . . . . 392Using Patterns to Format Data . . . . . . . . . . . . . . . . . . . . . . . . . . . . 393
Pattern Guidelines. . . . . . . . . . . . . . . . . . . . . . . . . . . . . . . . 394Date and Time Symbols . . . . . . . . . . . . . . . . . . . . . . . . . . . . . . 394Decimal Format Symbols . . . . . . . . . . . . . . . . . . . . . . . . . . . . . 401
Chapter 17. Using Query Macros . . . . . . . . . . . . . . . . . . . . . . . . 403Syntax. . . . . . . . . . . . . . . . . . . . . . . . . . . . . . . . . . . . . 403Add a Query Macro . . . . . . . . . . . . . . . . . . . . . . . . . . . . . . . . 405Creating Prompts Using Query Macros . . . . . . . . . . . . . . . . . . . . . . . . . . 406
Examples - selecting country or region prompts . . . . . . . . . . . . . . . . . . . . . . 408Examples - creating prompts that use parameter maps . . . . . . . . . . . . . . . . . . . 410Examples - creating a multiple value prompt . . . . . . . . . . . . . . . . . . . . . . . 411
Chapter 18. Using Drill-through Access . . . . . . . . . . . . . . . . . . . . . 415Understanding Drill-through Concepts . . . . . . . . . . . . . . . . . . . . . . . . . . 416
Drill-through Paths . . . . . . . . . . . . . . . . . . . . . . . . . . . . . . . 416Selection Contexts . . . . . . . . . . . . . . . . . . . . . . . . . . . . . . . . 417Drilling Through to Different Report Formats . . . . . . . . . . . . . . . . . . . . . . 417Drilling Through Between Packages . . . . . . . . . . . . . . . . . . . . . . . . . . 418Bookmark References. . . . . . . . . . . . . . . . . . . . . . . . . . . . . . . 418Members and Values . . . . . . . . . . . . . . . . . . . . . . . . . . . . . . . 418
x IBM Cognos Report Studio Version 10.2.1: User Guide
Member Unique Names . . . . . . . . . . . . . . . . . . . . . . . . . . . . . . 419Conformed Dimensions . . . . . . . . . . . . . . . . . . . . . . . . . . . . . . 420Business Keys . . . . . . . . . . . . . . . . . . . . . . . . . . . . . . . . . 421Scope . . . . . . . . . . . . . . . . . . . . . . . . . . . . . . . . . . . . 422Mapped Parameters . . . . . . . . . . . . . . . . . . . . . . . . . . . . . . . 422Drilling Through on Dates Between PowerCubes and Relational Packages . . . . . . . . . . . . . 423
Set Up Drill-through Access in a Report . . . . . . . . . . . . . . . . . . . . . . . . . 423Create a parameter in the target . . . . . . . . . . . . . . . . . . . . . . . . . . . . 424Create a drill-through definition . . . . . . . . . . . . . . . . . . . . . . . . . . . . 425
Defining independent drill-through definitions for crosstabs. . . . . . . . . . . . . . . . . . 427Specify the Drill-through Text . . . . . . . . . . . . . . . . . . . . . . . . . . . . . 428Example - Drill Through to a Hidden Report from a Report Studio Report . . . . . . . . . . . . . . 429
Check the Target Report . . . . . . . . . . . . . . . . . . . . . . . . . . . . . . 429Create and Test the Drill-Through Definition . . . . . . . . . . . . . . . . . . . . . . . 429
Try it yourself - create a report with drill-through access to itself . . . . . . . . . . . . . . . . . 431Drilling Through from IBM Cognos Series 7 to IBM Cognos BI. . . . . . . . . . . . . . . . . . 433
Setting Up Drill-through Access from IBM Cognos Series 7 Visualizer . . . . . . . . . . . . . . 434Setting Up Drill-through Access from PowerPlay Web . . . . . . . . . . . . . . . . . . . . 434Create and Test the Target for a Series 7 Report . . . . . . . . . . . . . . . . . . . . . . 434
Chapter 19. Working with Multiple Pages . . . . . . . . . . . . . . . . . . . . 437Add a Page to a Report . . . . . . . . . . . . . . . . . . . . . . . . . . . . . . . 437Create a Page Break or Page Set . . . . . . . . . . . . . . . . . . . . . . . . . . . . 437
Create simple page breaks . . . . . . . . . . . . . . . . . . . . . . . . . . . . . 438Create advanced page sets . . . . . . . . . . . . . . . . . . . . . . . . . . . . . 438
Join Nested Page Sets . . . . . . . . . . . . . . . . . . . . . . . . . . . . . . . 439Example - Preparing a Product List Report . . . . . . . . . . . . . . . . . . . . . . . . 440Add a Bookmark . . . . . . . . . . . . . . . . . . . . . . . . . . . . . . . . . 441Create a Table of Contents . . . . . . . . . . . . . . . . . . . . . . . . . . . . . . 443
Example - Add a Table of Contents to a Report . . . . . . . . . . . . . . . . . . . . . . 444Insert Page Numbers in a Report . . . . . . . . . . . . . . . . . . . . . . . . . . . . 446Control Page Breaks and Page Numbering . . . . . . . . . . . . . . . . . . . . . . . . 447Create Page Layers . . . . . . . . . . . . . . . . . . . . . . . . . . . . . . . . 449
Chapter 20. Creating Report Templates . . . . . . . . . . . . . . . . . . . . . 451Convert a Report to a Template . . . . . . . . . . . . . . . . . . . . . . . . . . . . 451Create a New Template . . . . . . . . . . . . . . . . . . . . . . . . . . . . . . . 451
Chapter 21. Managing Existing Reports . . . . . . . . . . . . . . . . . . . . . 453Copy a Report to the Clipboard . . . . . . . . . . . . . . . . . . . . . . . . . . . . 453
Copy a Report to the Clipboard in Internet Explorer . . . . . . . . . . . . . . . . . . . . 453Copy a Report to the Clipboard in Firefox . . . . . . . . . . . . . . . . . . . . . . . . 453
Open a Report from the Clipboard . . . . . . . . . . . . . . . . . . . . . . . . . . . 453Open a File from Another Studio . . . . . . . . . . . . . . . . . . . . . . . . . . . . 454
Analysis Studio Query Specification . . . . . . . . . . . . . . . . . . . . . . . . . . 454Managing Changes in the Package . . . . . . . . . . . . . . . . . . . . . . . . . . . 458
Update a Name Reference . . . . . . . . . . . . . . . . . . . . . . . . . . . . . 459Change the Package . . . . . . . . . . . . . . . . . . . . . . . . . . . . . . . 459
Chapter 22. Upgrading Reports. . . . . . . . . . . . . . . . . . . . . . . . . 461Upgrading Reports from IBM Cognos BI Version 8.4 . . . . . . . . . . . . . . . . . . . . . 461
Upgrading Report Styles . . . . . . . . . . . . . . . . . . . . . . . . . . . . . 461Upgrading Legacy Charts . . . . . . . . . . . . . . . . . . . . . . . . . . . . . 462New Default for Hidden or Deleted Axis Titles . . . . . . . . . . . . . . . . . . . . . . 462Upgrading Reports with SAP BW Prompt Variables . . . . . . . . . . . . . . . . . . . . 462
Upgrading Reports from IBM Cognos BI Version 8.1 or 8.2 . . . . . . . . . . . . . . . . . . . 463Members Containing No Data Are Not Suppressed for SAP BW . . . . . . . . . . . . . . . . 463Thousands Separators Missing . . . . . . . . . . . . . . . . . . . . . . . . . . . 463RQP-DEF-0177 Error When Upgrading Reports . . . . . . . . . . . . . . . . . . . . . . 463
Upgrading Reports from IBM Cognos ReportNet . . . . . . . . . . . . . . . . . . . . . . 464
Contents xi

Undocumented and Unsupported Features . . . . . . . . . . . . . . . . . . . . . . . 464No Sort Order . . . . . . . . . . . . . . . . . . . . . . . . . . . . . . . . . 464Layout Errors . . . . . . . . . . . . . . . . . . . . . . . . . . . . . . . . . 464Report Format . . . . . . . . . . . . . . . . . . . . . . . . . . . . . . . . . 464Customized Style Sheets. . . . . . . . . . . . . . . . . . . . . . . . . . . . . . 464PDF Reports. . . . . . . . . . . . . . . . . . . . . . . . . . . . . . . . . . 464IF-THEN-ELSE Statements . . . . . . . . . . . . . . . . . . . . . . . . . . . . . 464Solve Order . . . . . . . . . . . . . . . . . . . . . . . . . . . . . . . . . . 465Chart Behavior . . . . . . . . . . . . . . . . . . . . . . . . . . . . . . . . . 465Database Only Processing of Queries . . . . . . . . . . . . . . . . . . . . . . . . . 465Changes in the Behavior of Functions Between ReportNet 1.1 and IBM Cognos BI . . . . . . . . . . 465
Appendix A. Accessibility Features . . . . . . . . . . . . . . . . . . . . . . . 467Accessibility features in IBM Cognos Report Studio . . . . . . . . . . . . . . . . . . . . . 467Keyboard Shortcuts . . . . . . . . . . . . . . . . . . . . . . . . . . . . . . . . 467Considerations to Improve Report Accessibility . . . . . . . . . . . . . . . . . . . . . . . 468
Enable Accessible Report Outputs . . . . . . . . . . . . . . . . . . . . . . . . . . 469Alternate text and summary text . . . . . . . . . . . . . . . . . . . . . . . . . . . 469Designate Cells Headers in Tables . . . . . . . . . . . . . . . . . . . . . . . . . . 471Headings and emphasis . . . . . . . . . . . . . . . . . . . . . . . . . . . . . . 471Prompt control labels . . . . . . . . . . . . . . . . . . . . . . . . . . . . . . . 472Example - Conditionally Show a List Below a Chart for an Accessible Report . . . . . . . . . . . . 473
IBM and accessibility . . . . . . . . . . . . . . . . . . . . . . . . . . . . . . . . 475
Appendix B. Troubleshooting . . . . . . . . . . . . . . . . . . . . . . . . . 477Problems Creating Reports . . . . . . . . . . . . . . . . . . . . . . . . . . . . . . 477
Division by Zero Operation Appears Differently in Lists and Crosstabs . . . . . . . . . . . . . . 477Application Error Appears When Upgrading a Report. . . . . . . . . . . . . . . . . . . . 477Nested List Report Containing a Data Item That is Grouped More Than Once Does Not Run After Upgrade 477Background Color in Template Does not Appear . . . . . . . . . . . . . . . . . . . . . 478Subtotals in Grouped Lists . . . . . . . . . . . . . . . . . . . . . . . . . . . . . 478Chart Labels Overwrite One Another . . . . . . . . . . . . . . . . . . . . . . . . . 478Chart Shows Only Every Second Label . . . . . . . . . . . . . . . . . . . . . . . . . 478Chart Gradient Backgrounds Appear Gray in Internet Explorer. . . . . . . . . . . . . . . . . 479Metadata Change in Oracle Essbase Not Reflected in Reports and in the Studios . . . . . . . . . . . 479Relationships Not Maintained in a Report With Overlapping Set Levels . . . . . . . . . . . . . . 479Summaries in Query Calculations Include Nulls with SAP BW Data Sources . . . . . . . . . . . . 480Creating Sections on Reports That Access SAP BW Data Sources . . . . . . . . . . . . . . . . 480Error Characters (--) Appear in Reports. . . . . . . . . . . . . . . . . . . . . . . . . 480Columns, Rows, or Data Disappear With SSAS 2005 Cubes . . . . . . . . . . . . . . . . . . 481Function Unreliable with Sets . . . . . . . . . . . . . . . . . . . . . . . . . . . . 482Searching for values might return unexpected results . . . . . . . . . . . . . . . . . . . . 482Report Differences Between TM1 Executive Viewer and IBM Cognos Business Intelligence with TM1 DataSources . . . . . . . . . . . . . . . . . . . . . . . . . . . . . . . . . . . 482Order of Metadata Tree Differs for TM1 Data Sources . . . . . . . . . . . . . . . . . . . . 483MSR-PD-0012 error when importing external data . . . . . . . . . . . . . . . . . . . . . 483MSR-PD-0013 error when importing external data . . . . . . . . . . . . . . . . . . . . . 483
Problems Calculating Data . . . . . . . . . . . . . . . . . . . . . . . . . . . . . . 483Unexpected Summary Values in Nested Sets . . . . . . . . . . . . . . . . . . . . . . . 483Null Results for Calculations Using SAP BW Data Sources . . . . . . . . . . . . . . . . . . 484Incorrect Results with IBM Cognos PowerCubes and Time Measures . . . . . . . . . . . . . . . 484Incorrect Results in Summaries When Using OLAP Data Sources . . . . . . . . . . . . . . . . 485
Problems Filtering Data . . . . . . . . . . . . . . . . . . . . . . . . . . . . . . . 486Unexplained Discrepancies in Number Calculations . . . . . . . . . . . . . . . . . . . . 486HRESULT= DB_E_CANTCONVERTVALUE Error When Filtering on a _make_timestamp Column . . . . . 488
Problems Running Reports . . . . . . . . . . . . . . . . . . . . . . . . . . . . . . 488Report Runs Slowly . . . . . . . . . . . . . . . . . . . . . . . . . . . . . . . 488Summaries in a report do not correspond to the visible members . . . . . . . . . . . . . . . . 490Cannot Find the Database in the Content Store (Error QE-DEF-0288) . . . . . . . . . . . . . . . 493Parse Errors When Opening or Running an Upgraded Report . . . . . . . . . . . . . . . . . 493
xii IBM Cognos Report Studio Version 10.2.1: User Guide

Overflow Error Occurs When a Value in a Crosstab Is More Than 19 Characters . . . . . . . . . . . 493The ORA-00907 Error Appears When Running a Report . . . . . . . . . . . . . . . . . . . 493A Report or Analysis Does Not Run Because of Missing Items . . . . . . . . . . . . . . . . . 494Cannot View Burst Report . . . . . . . . . . . . . . . . . . . . . . . . . . . . . 494A report upgraded from ReportNet does not retain its original look . . . . . . . . . . . . . . . 495Measure Format Disappears in SSAS 2005 . . . . . . . . . . . . . . . . . . . . . . . . 495Drill-through Links are Not Active in the Safari Browser . . . . . . . . . . . . . . . . . . . 495Data Does Not Appear in a Target Report or the Wrong Data Appears . . . . . . . . . . . . . . 496A Running Total in Grouped Reports Gives Unexpected Results . . . . . . . . . . . . . . . . 496PCA-ERR-0057 Recursive Evaluation Error . . . . . . . . . . . . . . . . . . . . . . . 496Arithmetic Overflow Error When Running a Report in PDF Format . . . . . . . . . . . . . . . 497RQP-DEF-0177 An error occurred while performing operation 'sqlPrepareWithOptions' status='-69'UDA-SQL-0043 Error . . . . . . . . . . . . . . . . . . . . . . . . . . . . . . . 497Unable to View Active Reports in Mozilla Firefox . . . . . . . . . . . . . . . . . . . . . 498Problems with viewing saved Active Report output in Mozilla Firefox 8 or later versions . . . . . . . . 498Problems with large SAP BW queries . . . . . . . . . . . . . . . . . . . . . . . . . 498Master Detail or Burst Reports with Charts or Crosstabs May Result in Denial of Service . . . . . . . . 499PCA-ERR-0087 error when you run a large report . . . . . . . . . . . . . . . . . . . . . 499Differences in the appearance of charts that are run in different formats or on different operating systems . . 499Out-of-memory errors with reports that are run in interactive HTML format . . . . . . . . . . . . 500Charts in PDF Output Show Unexpected Results . . . . . . . . . . . . . . . . . . . . . 501Result set of a multi-fact query contains blanks . . . . . . . . . . . . . . . . . . . . . . 501Cognos Statistics object is not displayed in a report . . . . . . . . . . . . . . . . . . . . 501
Problems When Drilling Through . . . . . . . . . . . . . . . . . . . . . . . . . . . 502Cannot Drill Through Between PowerCubes Because MUNs Do Not Match . . . . . . . . . . . . 502Unexpected or Empty Results When Drilling Through. . . . . . . . . . . . . . . . . . . . 503Cannot Drill Through From a Relational Source to a Cube . . . . . . . . . . . . . . . . . . 504Calculations Do Not Appear in the Target Report . . . . . . . . . . . . . . . . . . . . . 505Nested Crosstab Only Filters on Some Items . . . . . . . . . . . . . . . . . . . . . . . 505Data is Not Filtered in the Target Report After Drill-Through . . . . . . . . . . . . . . . . . 505Drill-through links in active reports do not work . . . . . . . . . . . . . . . . . . . . . 506
Appendix C. Sample Reports and Packages . . . . . . . . . . . . . . . . . . . 507The Sample Outdoors Company . . . . . . . . . . . . . . . . . . . . . . . . . . . . 507
The Sample Outdoors Group of Companies . . . . . . . . . . . . . . . . . . . . . . . 507Employees . . . . . . . . . . . . . . . . . . . . . . . . . . . . . . . . . . 509Sales and marketing . . . . . . . . . . . . . . . . . . . . . . . . . . . . . . . 509Sample Outdoors database, models, and packages . . . . . . . . . . . . . . . . . . . . . 510
Samples in the Sample Outdoors Sales (cube) package. . . . . . . . . . . . . . . . . . . . . 512Consecutive Periods Comparison . . . . . . . . . . . . . . . . . . . . . . . . . . . 512
Samples in the Sales and Marketing (Cube) Package . . . . . . . . . . . . . . . . . . . . . 512Actual vs. Planned Revenue . . . . . . . . . . . . . . . . . . . . . . . . . . . . 512Historical Revenue . . . . . . . . . . . . . . . . . . . . . . . . . . . . . . . 513Revenue by Date Range . . . . . . . . . . . . . . . . . . . . . . . . . . . . . . 513Revenue by Product Brand (2011) . . . . . . . . . . . . . . . . . . . . . . . . . . 513Same Month Prior Year . . . . . . . . . . . . . . . . . . . . . . . . . . . . . . 513Selected Retailer Country or Region . . . . . . . . . . . . . . . . . . . . . . . . . . 514Top Retailers by Country or Region . . . . . . . . . . . . . . . . . . . . . . . . . . 514
Samples in the GO Data Warehouse (analysis) Package . . . . . . . . . . . . . . . . . . . . 514Budget vs. Actual . . . . . . . . . . . . . . . . . . . . . . . . . . . . . . . . 514Core products results . . . . . . . . . . . . . . . . . . . . . . . . . . . . . . . 514Customer Returns and Satisfaction . . . . . . . . . . . . . . . . . . . . . . . . . . 515Employee Satisfaction 2012 . . . . . . . . . . . . . . . . . . . . . . . . . . . . . 515Employee Training by Year . . . . . . . . . . . . . . . . . . . . . . . . . . . . . 515Eyewear Revenue by Brand and Size . . . . . . . . . . . . . . . . . . . . . . . . . 516Global Bonus Report . . . . . . . . . . . . . . . . . . . . . . . . . . . . . . . 516GO Balance Sheet as at Dec 31 2012 . . . . . . . . . . . . . . . . . . . . . . . . . . 516Sample Outdoors Company Balance Sheet as at Dec 31 2012 . . . . . . . . . . . . . . . . . 517Manager Profile . . . . . . . . . . . . . . . . . . . . . . . . . . . . . . . . 517New order methods . . . . . . . . . . . . . . . . . . . . . . . . . . . . . . . 517Planned Headcount . . . . . . . . . . . . . . . . . . . . . . . . . . . . . . . 517
Contents xiii

Positions to Fill . . . . . . . . . . . . . . . . . . . . . . . . . . . . . . . . . 517Promotion Plan Revenue . . . . . . . . . . . . . . . . . . . . . . . . . . . . . 518Promotion Success. . . . . . . . . . . . . . . . . . . . . . . . . . . . . . . . 518Quantity Sold vs. Shipped and Inventory . . . . . . . . . . . . . . . . . . . . . . . . 518Recruitment Report . . . . . . . . . . . . . . . . . . . . . . . . . . . . . . . 518Return Quantity by Order Method . . . . . . . . . . . . . . . . . . . . . . . . . . 519Returned Items . . . . . . . . . . . . . . . . . . . . . . . . . . . . . . . . . 519Returns by Damage, Failed Orders and Complaints in 2012 . . . . . . . . . . . . . . . . . . 519Returns by Failed Orders in 2012 . . . . . . . . . . . . . . . . . . . . . . . . . . . 519Returns by Order Method . . . . . . . . . . . . . . . . . . . . . . . . . . . . . 520Returns by Order Method - Prompted Chart . . . . . . . . . . . . . . . . . . . . . . . 520Revenue by GO Subsidiary 2011 . . . . . . . . . . . . . . . . . . . . . . . . . . . 520Sales Commissions for Central Europe . . . . . . . . . . . . . . . . . . . . . . . . . 521Sales Growth Year Over Year . . . . . . . . . . . . . . . . . . . . . . . . . . . . 521Sales target by region. . . . . . . . . . . . . . . . . . . . . . . . . . . . . . . 521Succession Report . . . . . . . . . . . . . . . . . . . . . . . . . . . . . . . . 521Top 10 Retailers for 2011. . . . . . . . . . . . . . . . . . . . . . . . . . . . . . 521
Samples in the GO Data Warehouse (query) Package . . . . . . . . . . . . . . . . . . . . . 522Advertising-cost vs revenue . . . . . . . . . . . . . . . . . . . . . . . . . . . . 522Bursted Sales Performance Report . . . . . . . . . . . . . . . . . . . . . . . . . . 522Employee Expenses (report) . . . . . . . . . . . . . . . . . . . . . . . . . . . . 522Health Insurance . . . . . . . . . . . . . . . . . . . . . . . . . . . . . . . . 522Pension Plan . . . . . . . . . . . . . . . . . . . . . . . . . . . . . . . . . 523Regular Salary . . . . . . . . . . . . . . . . . . . . . . . . . . . . . . . . . 523TOC Report . . . . . . . . . . . . . . . . . . . . . . . . . . . . . . . . . . 523Total Revenue by Country or Region . . . . . . . . . . . . . . . . . . . . . . . . . 523
Samples in the GO Sales (analysis) Package . . . . . . . . . . . . . . . . . . . . . . . . 5232011 Quarterly Sales Forecast . . . . . . . . . . . . . . . . . . . . . . . . . . . . 5232011 Sales Summary . . . . . . . . . . . . . . . . . . . . . . . . . . . . . . . 524
Samples in the GO Sales (query) Package . . . . . . . . . . . . . . . . . . . . . . . . . 524Active Report Techniques . . . . . . . . . . . . . . . . . . . . . . . . . . . . . 524Briefing Book . . . . . . . . . . . . . . . . . . . . . . . . . . . . . . . . . 524Film strip. . . . . . . . . . . . . . . . . . . . . . . . . . . . . . . . . . . 524Horizontal Pagination . . . . . . . . . . . . . . . . . . . . . . . . . . . . . . 525Matrix-chart and graph . . . . . . . . . . . . . . . . . . . . . . . . . . . . . . 525Order Invoices - Donald Chow, Sales Person . . . . . . . . . . . . . . . . . . . . . . . 525No Data . . . . . . . . . . . . . . . . . . . . . . . . . . . . . . . . . . . 525PDF Page Properties . . . . . . . . . . . . . . . . . . . . . . . . . . . . . . . 525Product details . . . . . . . . . . . . . . . . . . . . . . . . . . . . . . . . . 526Sales analysis . . . . . . . . . . . . . . . . . . . . . . . . . . . . . . . . . 526Sales Dashboard . . . . . . . . . . . . . . . . . . . . . . . . . . . . . . . . 526Singletons on Page Body . . . . . . . . . . . . . . . . . . . . . . . . . . . . . 526Table of Contents . . . . . . . . . . . . . . . . . . . . . . . . . . . . . . . . 526
Interactive Samples . . . . . . . . . . . . . . . . . . . . . . . . . . . . . . . . 526Bursted Sales Performance Report . . . . . . . . . . . . . . . . . . . . . . . . . . 526Percentage Calculation (by year) . . . . . . . . . . . . . . . . . . . . . . . . . . . 527Recruitment Report . . . . . . . . . . . . . . . . . . . . . . . . . . . . . . . 527Revenue by GO Subsidiary 2011 . . . . . . . . . . . . . . . . . . . . . . . . . . . 527Rolling and Moving Averages . . . . . . . . . . . . . . . . . . . . . . . . . . . . 528Top 10 Retailers for 2011. . . . . . . . . . . . . . . . . . . . . . . . . . . . . . 528
Prompt API samples . . . . . . . . . . . . . . . . . . . . . . . . . . . . . . . . 528Clear prompt selections . . . . . . . . . . . . . . . . . . . . . . . . . . . . . . 528Date prompt presets . . . . . . . . . . . . . . . . . . . . . . . . . . . . . . . 528Display all prompt values ignoring user selections . . . . . . . . . . . . . . . . . . . . . 528Display user selected prompt values. . . . . . . . . . . . . . . . . . . . . . . . . . 528Filter country by letter . . . . . . . . . . . . . . . . . . . . . . . . . . . . . . 529Limit date prompt selection by database value . . . . . . . . . . . . . . . . . . . . . . 529Limit numeric prompt selection by database value . . . . . . . . . . . . . . . . . . . . . 529Limit time between two dates . . . . . . . . . . . . . . . . . . . . . . . . . . . . 529Limit user selection to two items . . . . . . . . . . . . . . . . . . . . . . . . . . . 529Pass parameter via hidden prompt . . . . . . . . . . . . . . . . . . . . . . . . . . 529
xiv IBM Cognos Report Studio Version 10.2.1: User Guide

Personal default prompt selections - set selections . . . . . . . . . . . . . . . . . . . . . 529Personal default prompt selections - use selections . . . . . . . . . . . . . . . . . . . . . 529Validate prompt values when button pushed . . . . . . . . . . . . . . . . . . . . . . . 529Validate type-in postal code values . . . . . . . . . . . . . . . . . . . . . . . . . . 529Validate type-in product line code . . . . . . . . . . . . . . . . . . . . . . . . . . 529
Appendix D. Limitations when using dimensional data sources. . . . . . . . . . . 531Running a Report Against a Dimensional Data Source. . . . . . . . . . . . . . . . . . . . . 531Limitations When Using Set Expressions in List Reports . . . . . . . . . . . . . . . . . . . . 532Limitations When Using Clauses in Summary Functions . . . . . . . . . . . . . . . . . . . . 532Limited Support for Relational Functions When Used with OLAP Data Sources . . . . . . . . . . . . 533Limitations When Summarizing Measures in DMR Data Sources . . . . . . . . . . . . . . . . . 534Limitations When Filtering Dimensional Data Sources . . . . . . . . . . . . . . . . . . . . . 534
Error Characters (--) When Filtering . . . . . . . . . . . . . . . . . . . . . . . . . . 535Limitations When Specifying the Scope of Summary Filters with Dimensional Data Sources . . . . . . . 535Limitations When Filtering Data Using an SAP BW Data Source . . . . . . . . . . . . . . . . 536
Considerations when Creating Calculations . . . . . . . . . . . . . . . . . . . . . . . . 537Calculation Solve Order . . . . . . . . . . . . . . . . . . . . . . . . . . . . . . 537Length of Expressions . . . . . . . . . . . . . . . . . . . . . . . . . . . . . . 537Quality of Service Indicators . . . . . . . . . . . . . . . . . . . . . . . . . . . . 537Using Quotation Marks in Literal Strings . . . . . . . . . . . . . . . . . . . . . . . . 538Limitations of Calculations . . . . . . . . . . . . . . . . . . . . . . . . . . . . . 538Creating Expressions Using SAP BW Data Sources . . . . . . . . . . . . . . . . . . . . . 538Using Microsoft Excel Functions with SSAS 2005 Data Sources . . . . . . . . . . . . . . . . . 539Concatenating Strings . . . . . . . . . . . . . . . . . . . . . . . . . . . . . . 539Intersecting Calculations in Crosstabs and Charts . . . . . . . . . . . . . . . . . . . . . 539Null (Missing) Values in Calculations and Summaries . . . . . . . . . . . . . . . . . . . . 542Dimensional Coercion Rules . . . . . . . . . . . . . . . . . . . . . . . . . . . . 544Recommendation - Use Member Unique Name (MUN) Aliases . . . . . . . . . . . . . . . . . 547
Limitations When Formatting Empty Cells in SAP BW Data Sources . . . . . . . . . . . . . . . . 548
Appendix E. Limitations When Producing Reports in Microsoft Excel Format . . . . . 549Unable to Load Images from the IBM Cognos Business Intelligence Content Store in a Report . . . . . . . 549Blank Worksheet Appears . . . . . . . . . . . . . . . . . . . . . . . . . . . . . . 549Warning Message Appears When Excel Opens an IBM Cognos Business Intelligence Report . . . . . . . . 549Spreadsheet Content Not Saved for Reports Saved in XLS Format . . . . . . . . . . . . . . . . . 549Unable to Load Excel Report in Netscape 7.01 . . . . . . . . . . . . . . . . . . . . . . . 550Unable to Nest Labels in Charts . . . . . . . . . . . . . . . . . . . . . . . . . . . . 550Data Series Are Truncated . . . . . . . . . . . . . . . . . . . . . . . . . . . . . . 550Colors Different From Those in HTML or PDF . . . . . . . . . . . . . . . . . . . . . . . 550Repeating Pie Charts . . . . . . . . . . . . . . . . . . . . . . . . . . . . . . . . 550Unable to Skip Discrete Axis Labels . . . . . . . . . . . . . . . . . . . . . . . . . . . 550Unsupported IBM Cognos BI Formatting . . . . . . . . . . . . . . . . . . . . . . . . . 550Cells Contain Series of #. . . . . . . . . . . . . . . . . . . . . . . . . . . . . . . 551Table and Column Widths . . . . . . . . . . . . . . . . . . . . . . . . . . . . . . 551Secure Socket Layer (SSL) Is Not Supported in Some Excel Formats and Versions . . . . . . . . . . . 551Number Formats Become Currency Formats in Japanese Excel . . . . . . . . . . . . . . . . . . 552Reports Show Data in Wrong Columns . . . . . . . . . . . . . . . . . . . . . . . . . . 552Unable to Access Reports on Remote Servers . . . . . . . . . . . . . . . . . . . . . . . . 552Drill-through Reports Are Not Supported in Excel . . . . . . . . . . . . . . . . . . . . . . 552Map Reports Are Not Supported in Excel . . . . . . . . . . . . . . . . . . . . . . . . . 552Unsupported Excel Formatting . . . . . . . . . . . . . . . . . . . . . . . . . . . . 552Hyperlink Buttons Are Not Supported in Excel . . . . . . . . . . . . . . . . . . . . . . . 553Unable to View Reports in Excel Format Sent as Email Attachments . . . . . . . . . . . . . . . . 553Unsupported Chart Properties in Excel . . . . . . . . . . . . . . . . . . . . . . . . . . 553Unsupported Chart Types in Excel . . . . . . . . . . . . . . . . . . . . . . . . . . . 553Cell Height and Width Are Incorrect . . . . . . . . . . . . . . . . . . . . . . . . . . 554
Appendix F. Using the expression editor. . . . . . . . . . . . . . . . . . . . . 555Operators . . . . . . . . . . . . . . . . . . . . . . . . . . . . . . . . . . . 555
Contents xv

(. . . . . . . . . . . . . . . . . . . . . . . . . . . . . . . . . . . . . . 555). . . . . . . . . . . . . . . . . . . . . . . . . . . . . . . . . . . . . . 555*. . . . . . . . . . . . . . . . . . . . . . . . . . . . . . . . . . . . . . 555, . . . . . . . . . . . . . . . . . . . . . . . . . . . . . . . . . . . . . . 555/ . . . . . . . . . . . . . . . . . . . . . . . . . . . . . . . . . . . . . 555|| . . . . . . . . . . . . . . . . . . . . . . . . . . . . . . . . . . . . . 556+ . . . . . . . . . . . . . . . . . . . . . . . . . . . . . . . . . . . . . 556-. . . . . . . . . . . . . . . . . . . . . . . . . . . . . . . . . . . . . . 556< . . . . . . . . . . . . . . . . . . . . . . . . . . . . . . . . . . . . . 556<= . . . . . . . . . . . . . . . . . . . . . . . . . . . . . . . . . . . . . 556<> . . . . . . . . . . . . . . . . . . . . . . . . . . . . . . . . . . . . . 556= . . . . . . . . . . . . . . . . . . . . . . . . . . . . . . . . . . . . . 556> . . . . . . . . . . . . . . . . . . . . . . . . . . . . . . . . . . . . . 556-> . . . . . . . . . . . . . . . . . . . . . . . . . . . . . . . . . . . . . 557>= . . . . . . . . . . . . . . . . . . . . . . . . . . . . . . . . . . . . . 557and. . . . . . . . . . . . . . . . . . . . . . . . . . . . . . . . . . . . . 557auto . . . . . . . . . . . . . . . . . . . . . . . . . . . . . . . . . . . . 557between . . . . . . . . . . . . . . . . . . . . . . . . . . . . . . . . . . . 557case . . . . . . . . . . . . . . . . . . . . . . . . . . . . . . . . . . . . 558contains . . . . . . . . . . . . . . . . . . . . . . . . . . . . . . . . . . . 558currentMeasure. . . . . . . . . . . . . . . . . . . . . . . . . . . . . . . . . 558default . . . . . . . . . . . . . . . . . . . . . . . . . . . . . . . . . . . 558distinct . . . . . . . . . . . . . . . . . . . . . . . . . . . . . . . . . . . 558else. . . . . . . . . . . . . . . . . . . . . . . . . . . . . . . . . . . . . 558end. . . . . . . . . . . . . . . . . . . . . . . . . . . . . . . . . . . . . 559ends with . . . . . . . . . . . . . . . . . . . . . . . . . . . . . . . . . . 559escape . . . . . . . . . . . . . . . . . . . . . . . . . . . . . . . . . . . . 559for . . . . . . . . . . . . . . . . . . . . . . . . . . . . . . . . . . . . . 559for all . . . . . . . . . . . . . . . . . . . . . . . . . . . . . . . . . . . . 559for any . . . . . . . . . . . . . . . . . . . . . . . . . . . . . . . . . . . 559for report. . . . . . . . . . . . . . . . . . . . . . . . . . . . . . . . . . . 560if . . . . . . . . . . . . . . . . . . . . . . . . . . . . . . . . . . . . . 560in . . . . . . . . . . . . . . . . . . . . . . . . . . . . . . . . . . . . . 560in_range . . . . . . . . . . . . . . . . . . . . . . . . . . . . . . . . . . . 560is missing . . . . . . . . . . . . . . . . . . . . . . . . . . . . . . . . . . 561is null . . . . . . . . . . . . . . . . . . . . . . . . . . . . . . . . . . . . 561is not missing . . . . . . . . . . . . . . . . . . . . . . . . . . . . . . . . . 561is not null . . . . . . . . . . . . . . . . . . . . . . . . . . . . . . . . . . 561like . . . . . . . . . . . . . . . . . . . . . . . . . . . . . . . . . . . . . 561lookup . . . . . . . . . . . . . . . . . . . . . . . . . . . . . . . . . . . 562not . . . . . . . . . . . . . . . . . . . . . . . . . . . . . . . . . . . . . 562or . . . . . . . . . . . . . . . . . . . . . . . . . . . . . . . . . . . . . 562prefilter . . . . . . . . . . . . . . . . . . . . . . . . . . . . . . . . . . . 562rows . . . . . . . . . . . . . . . . . . . . . . . . . . . . . . . . . . . . 563rows . . . . . . . . . . . . . . . . . . . . . . . . . . . . . . . . . . . . 563starts with . . . . . . . . . . . . . . . . . . . . . . . . . . . . . . . . . . 563then . . . . . . . . . . . . . . . . . . . . . . . . . . . . . . . . . . . . 563when . . . . . . . . . . . . . . . . . . . . . . . . . . . . . . . . . . . . 563
Summaries . . . . . . . . . . . . . . . . . . . . . . . . . . . . . . . . . . . 563Statistical functions . . . . . . . . . . . . . . . . . . . . . . . . . . . . . . . 563aggregate. . . . . . . . . . . . . . . . . . . . . . . . . . . . . . . . . . . 571average . . . . . . . . . . . . . . . . . . . . . . . . . . . . . . . . . . . 572count . . . . . . . . . . . . . . . . . . . . . . . . . . . . . . . . . . . . 572maximum . . . . . . . . . . . . . . . . . . . . . . . . . . . . . . . . . . 572median . . . . . . . . . . . . . . . . . . . . . . . . . . . . . . . . . . . 573minimum. . . . . . . . . . . . . . . . . . . . . . . . . . . . . . . . . . . 573moving-average . . . . . . . . . . . . . . . . . . . . . . . . . . . . . . . . 573moving-total. . . . . . . . . . . . . . . . . . . . . . . . . . . . . . . . . . 574percentage . . . . . . . . . . . . . . . . . . . . . . . . . . . . . . . . . . 574percentile. . . . . . . . . . . . . . . . . . . . . . . . . . . . . . . . . . . 575quantile . . . . . . . . . . . . . . . . . . . . . . . . . . . . . . . . . . . 575
xvi IBM Cognos Report Studio Version 10.2.1: User Guide

quartile . . . . . . . . . . . . . . . . . . . . . . . . . . . . . . . . . . . 576rank . . . . . . . . . . . . . . . . . . . . . . . . . . . . . . . . . . . . 576running-average . . . . . . . . . . . . . . . . . . . . . . . . . . . . . . . . 577running-count . . . . . . . . . . . . . . . . . . . . . . . . . . . . . . . . . 578running-difference . . . . . . . . . . . . . . . . . . . . . . . . . . . . . . . . 578running-maximum . . . . . . . . . . . . . . . . . . . . . . . . . . . . . . . 579running-minimum. . . . . . . . . . . . . . . . . . . . . . . . . . . . . . . . 579running-total . . . . . . . . . . . . . . . . . . . . . . . . . . . . . . . . . 580total . . . . . . . . . . . . . . . . . . . . . . . . . . . . . . . . . . . . 580
Member Summaries . . . . . . . . . . . . . . . . . . . . . . . . . . . . . . . . 581aggregate. . . . . . . . . . . . . . . . . . . . . . . . . . . . . . . . . . . 581average . . . . . . . . . . . . . . . . . . . . . . . . . . . . . . . . . . . 581count . . . . . . . . . . . . . . . . . . . . . . . . . . . . . . . . . . . . 581maximum . . . . . . . . . . . . . . . . . . . . . . . . . . . . . . . . . . 582median . . . . . . . . . . . . . . . . . . . . . . . . . . . . . . . . . . . 582minimum. . . . . . . . . . . . . . . . . . . . . . . . . . . . . . . . . . . 582percentage . . . . . . . . . . . . . . . . . . . . . . . . . . . . . . . . . . 582percentile. . . . . . . . . . . . . . . . . . . . . . . . . . . . . . . . . . . 583quantile . . . . . . . . . . . . . . . . . . . . . . . . . . . . . . . . . . . 583quartile . . . . . . . . . . . . . . . . . . . . . . . . . . . . . . . . . . . 583rank . . . . . . . . . . . . . . . . . . . . . . . . . . . . . . . . . . . . 583standard-deviation . . . . . . . . . . . . . . . . . . . . . . . . . . . . . . . 583standard-deviation-pop . . . . . . . . . . . . . . . . . . . . . . . . . . . . . . 584total . . . . . . . . . . . . . . . . . . . . . . . . . . . . . . . . . . . . 584variance . . . . . . . . . . . . . . . . . . . . . . . . . . . . . . . . . . . 584variance-pop . . . . . . . . . . . . . . . . . . . . . . . . . . . . . . . . . 584
Constants . . . . . . . . . . . . . . . . . . . . . . . . . . . . . . . . . . . 584date . . . . . . . . . . . . . . . . . . . . . . . . . . . . . . . . . . . . 584date-time . . . . . . . . . . . . . . . . . . . . . . . . . . . . . . . . . . . 584time with time zone . . . . . . . . . . . . . . . . . . . . . . . . . . . . . . . 584timestamp with time zone . . . . . . . . . . . . . . . . . . . . . . . . . . . . . 584interval . . . . . . . . . . . . . . . . . . . . . . . . . . . . . . . . . . . 585interval year. . . . . . . . . . . . . . . . . . . . . . . . . . . . . . . . . . 585interval month . . . . . . . . . . . . . . . . . . . . . . . . . . . . . . . . . 585interval year to month . . . . . . . . . . . . . . . . . . . . . . . . . . . . . . 585interval day . . . . . . . . . . . . . . . . . . . . . . . . . . . . . . . . . . 585interval hour . . . . . . . . . . . . . . . . . . . . . . . . . . . . . . . . . 585interval minute . . . . . . . . . . . . . . . . . . . . . . . . . . . . . . . . . 585interval second . . . . . . . . . . . . . . . . . . . . . . . . . . . . . . . . . 585interval day to hour . . . . . . . . . . . . . . . . . . . . . . . . . . . . . . . 585interval day to minute . . . . . . . . . . . . . . . . . . . . . . . . . . . . . . 585interval day to second . . . . . . . . . . . . . . . . . . . . . . . . . . . . . . 585interval hour to minute . . . . . . . . . . . . . . . . . . . . . . . . . . . . . . 585interval hour to second . . . . . . . . . . . . . . . . . . . . . . . . . . . . . . 585interval minute to second . . . . . . . . . . . . . . . . . . . . . . . . . . . . . 585null . . . . . . . . . . . . . . . . . . . . . . . . . . . . . . . . . . . . 585number . . . . . . . . . . . . . . . . . . . . . . . . . . . . . . . . . . . 585string . . . . . . . . . . . . . . . . . . . . . . . . . . . . . . . . . . . . 586time . . . . . . . . . . . . . . . . . . . . . . . . . . . . . . . . . . . . 586
Constructs . . . . . . . . . . . . . . . . . . . . . . . . . . . . . . . . . . . 586if then else . . . . . . . . . . . . . . . . . . . . . . . . . . . . . . . . . . 586in_range . . . . . . . . . . . . . . . . . . . . . . . . . . . . . . . . . . . 586search case . . . . . . . . . . . . . . . . . . . . . . . . . . . . . . . . . . 587simple case . . . . . . . . . . . . . . . . . . . . . . . . . . . . . . . . . . 587
Business Date/Time Functions. . . . . . . . . . . . . . . . . . . . . . . . . . . . . 587_add_days . . . . . . . . . . . . . . . . . . . . . . . . . . . . . . . . . . 587_add_months . . . . . . . . . . . . . . . . . . . . . . . . . . . . . . . . . 588_add_years . . . . . . . . . . . . . . . . . . . . . . . . . . . . . . . . . . 588_age . . . . . . . . . . . . . . . . . . . . . . . . . . . . . . . . . . . . 589_day_of_week . . . . . . . . . . . . . . . . . . . . . . . . . . . . . . . . . 589_day_of_year . . . . . . . . . . . . . . . . . . . . . . . . . . . . . . . . . 589
Contents xvii

_days_between . . . . . . . . . . . . . . . . . . . . . . . . . . . . . . . . . 589_days_to_end_of_month . . . . . . . . . . . . . . . . . . . . . . . . . . . . . . 590_first_of_month. . . . . . . . . . . . . . . . . . . . . . . . . . . . . . . . . 590_last_of_month . . . . . . . . . . . . . . . . . . . . . . . . . . . . . . . . . 590_make_timestamp . . . . . . . . . . . . . . . . . . . . . . . . . . . . . . . . 591_months_between . . . . . . . . . . . . . . . . . . . . . . . . . . . . . . . . 591_week_of_year . . . . . . . . . . . . . . . . . . . . . . . . . . . . . . . . . 591_years_between . . . . . . . . . . . . . . . . . . . . . . . . . . . . . . . . 592_ymdint_between . . . . . . . . . . . . . . . . . . . . . . . . . . . . . . . . 592
Block Functions . . . . . . . . . . . . . . . . . . . . . . . . . . . . . . . . . 592_firstFromSet . . . . . . . . . . . . . . . . . . . . . . . . . . . . . . . . . 592_remainderSet . . . . . . . . . . . . . . . . . . . . . . . . . . . . . . . . . 593
Aster Data . . . . . . . . . . . . . . . . . . . . . . . . . . . . . . . . . . . 593Aster Data String . . . . . . . . . . . . . . . . . . . . . . . . . . . . . . . . 593Aster Data Data Type Formatting. . . . . . . . . . . . . . . . . . . . . . . . . . . 595Aster Data Math . . . . . . . . . . . . . . . . . . . . . . . . . . . . . . . . 595Aster Data Trigonometry . . . . . . . . . . . . . . . . . . . . . . . . . . . . . 596ascii . . . . . . . . . . . . . . . . . . . . . . . . . . . . . . . . . . . . 597chr . . . . . . . . . . . . . . . . . . . . . . . . . . . . . . . . . . . . . 597current_schema. . . . . . . . . . . . . . . . . . . . . . . . . . . . . . . . . 597translate . . . . . . . . . . . . . . . . . . . . . . . . . . . . . . . . . . . 598date_trunc . . . . . . . . . . . . . . . . . . . . . . . . . . . . . . . . . . 598version . . . . . . . . . . . . . . . . . . . . . . . . . . . . . . . . . . . 598
DB2 . . . . . . . . . . . . . . . . . . . . . . . . . . . . . . . . . . . . . 598DB2 Math . . . . . . . . . . . . . . . . . . . . . . . . . . . . . . . . . . 598DB2 Trigonometry . . . . . . . . . . . . . . . . . . . . . . . . . . . . . . . . 598ascii . . . . . . . . . . . . . . . . . . . . . . . . . . . . . . . . . . . . 600ceiling . . . . . . . . . . . . . . . . . . . . . . . . . . . . . . . . . . . . 600char . . . . . . . . . . . . . . . . . . . . . . . . . . . . . . . . . . . . 601chr . . . . . . . . . . . . . . . . . . . . . . . . . . . . . . . . . . . . . 601concat . . . . . . . . . . . . . . . . . . . . . . . . . . . . . . . . . . . . 601date . . . . . . . . . . . . . . . . . . . . . . . . . . . . . . . . . . . . 601day. . . . . . . . . . . . . . . . . . . . . . . . . . . . . . . . . . . . . 602dayname . . . . . . . . . . . . . . . . . . . . . . . . . . . . . . . . . . . 602dayofweek . . . . . . . . . . . . . . . . . . . . . . . . . . . . . . . . . . 602dayofweek_iso . . . . . . . . . . . . . . . . . . . . . . . . . . . . . . . . . 602dayofyear . . . . . . . . . . . . . . . . . . . . . . . . . . . . . . . . . . 603days . . . . . . . . . . . . . . . . . . . . . . . . . . . . . . . . . . . . 603dec . . . . . . . . . . . . . . . . . . . . . . . . . . . . . . . . . . . . . 603decimal . . . . . . . . . . . . . . . . . . . . . . . . . . . . . . . . . . . 603difference. . . . . . . . . . . . . . . . . . . . . . . . . . . . . . . . . . . 604digits . . . . . . . . . . . . . . . . . . . . . . . . . . . . . . . . . . . . 604double. . . . . . . . . . . . . . . . . . . . . . . . . . . . . . . . . . . . 604event_mon_state . . . . . . . . . . . . . . . . . . . . . . . . . . . . . . . . 604float . . . . . . . . . . . . . . . . . . . . . . . . . . . . . . . . . . . . 604hex . . . . . . . . . . . . . . . . . . . . . . . . . . . . . . . . . . . . . 605hour . . . . . . . . . . . . . . . . . . . . . . . . . . . . . . . . . . . . 605insert . . . . . . . . . . . . . . . . . . . . . . . . . . . . . . . . . . . . 605integer . . . . . . . . . . . . . . . . . . . . . . . . . . . . . . . . . . . 605int . . . . . . . . . . . . . . . . . . . . . . . . . . . . . . . . . . . . . 605julian_day . . . . . . . . . . . . . . . . . . . . . . . . . . . . . . . . . . 606lcase . . . . . . . . . . . . . . . . . . . . . . . . . . . . . . . . . . . . 606left . . . . . . . . . . . . . . . . . . . . . . . . . . . . . . . . . . . . . 606length . . . . . . . . . . . . . . . . . . . . . . . . . . . . . . . . . . . . 606locate . . . . . . . . . . . . . . . . . . . . . . . . . . . . . . . . . . . . 607long_varchar . . . . . . . . . . . . . . . . . . . . . . . . . . . . . . . . . 607ltrim . . . . . . . . . . . . . . . . . . . . . . . . . . . . . . . . . . . . 607microsecond . . . . . . . . . . . . . . . . . . . . . . . . . . . . . . . . . . 607midnight_seconds . . . . . . . . . . . . . . . . . . . . . . . . . . . . . . . . 608minute . . . . . . . . . . . . . . . . . . . . . . . . . . . . . . . . . . . 608month . . . . . . . . . . . . . . . . . . . . . . . . . . . . . . . . . . . . 608
xviii IBM Cognos Report Studio Version 10.2.1: User Guide
monthname . . . . . . . . . . . . . . . . . . . . . . . . . . . . . . . . . . 609quarter . . . . . . . . . . . . . . . . . . . . . . . . . . . . . . . . . . . 609radians . . . . . . . . . . . . . . . . . . . . . . . . . . . . . . . . . . . 609repeat . . . . . . . . . . . . . . . . . . . . . . . . . . . . . . . . . . . . 609replace . . . . . . . . . . . . . . . . . . . . . . . . . . . . . . . . . . . 610right . . . . . . . . . . . . . . . . . . . . . . . . . . . . . . . . . . . . 610round . . . . . . . . . . . . . . . . . . . . . . . . . . . . . . . . . . . . 610rtrim . . . . . . . . . . . . . . . . . . . . . . . . . . . . . . . . . . . . 610second. . . . . . . . . . . . . . . . . . . . . . . . . . . . . . . . . . . . 611sign . . . . . . . . . . . . . . . . . . . . . . . . . . . . . . . . . . . . 611smallint . . . . . . . . . . . . . . . . . . . . . . . . . . . . . . . . . . . 611soundex . . . . . . . . . . . . . . . . . . . . . . . . . . . . . . . . . . . 611space . . . . . . . . . . . . . . . . . . . . . . . . . . . . . . . . . . . . 611substr . . . . . . . . . . . . . . . . . . . . . . . . . . . . . . . . . . . . 612table_name . . . . . . . . . . . . . . . . . . . . . . . . . . . . . . . . . . 612table_schema . . . . . . . . . . . . . . . . . . . . . . . . . . . . . . . . . 612time . . . . . . . . . . . . . . . . . . . . . . . . . . . . . . . . . . . . 612timestamp . . . . . . . . . . . . . . . . . . . . . . . . . . . . . . . . . . 612timestamp_iso . . . . . . . . . . . . . . . . . . . . . . . . . . . . . . . . . 613timestampdiff . . . . . . . . . . . . . . . . . . . . . . . . . . . . . . . . . 613to_char . . . . . . . . . . . . . . . . . . . . . . . . . . . . . . . . . . . 613translate . . . . . . . . . . . . . . . . . . . . . . . . . . . . . . . . . . . 613trunc . . . . . . . . . . . . . . . . . . . . . . . . . . . . . . . . . . . . 614truncate . . . . . . . . . . . . . . . . . . . . . . . . . . . . . . . . . . . 614ucase . . . . . . . . . . . . . . . . . . . . . . . . . . . . . . . . . . . . 614value . . . . . . . . . . . . . . . . . . . . . . . . . . . . . . . . . . . . 615varchar . . . . . . . . . . . . . . . . . . . . . . . . . . . . . . . . . . . 615week . . . . . . . . . . . . . . . . . . . . . . . . . . . . . . . . . . . . 615year . . . . . . . . . . . . . . . . . . . . . . . . . . . . . . . . . . . . 615
Greenplum . . . . . . . . . . . . . . . . . . . . . . . . . . . . . . . . . . . 616Greenplum String . . . . . . . . . . . . . . . . . . . . . . . . . . . . . . . . 616Greenplum Data type formatting . . . . . . . . . . . . . . . . . . . . . . . . . . . 617Greenplum Math . . . . . . . . . . . . . . . . . . . . . . . . . . . . . . . . 618Greenplum Trigonometry . . . . . . . . . . . . . . . . . . . . . . . . . . . . . 618ascii . . . . . . . . . . . . . . . . . . . . . . . . . . . . . . . . . . . . 620chr . . . . . . . . . . . . . . . . . . . . . . . . . . . . . . . . . . . . . 620current_database . . . . . . . . . . . . . . . . . . . . . . . . . . . . . . . . 620current_schema. . . . . . . . . . . . . . . . . . . . . . . . . . . . . . . . . 620{current_user} . . . . . . . . . . . . . . . . . . . . . . . . . . . . . . . . . 620{session_user} . . . . . . . . . . . . . . . . . . . . . . . . . . . . . . . . . 620translate . . . . . . . . . . . . . . . . . . . . . . . . . . . . . . . . . . . 620date_trunc . . . . . . . . . . . . . . . . . . . . . . . . . . . . . . . . . . 620version . . . . . . . . . . . . . . . . . . . . . . . . . . . . . . . . . . . 621
Informix . . . . . . . . . . . . . . . . . . . . . . . . . . . . . . . . . . . . 621Informix Math . . . . . . . . . . . . . . . . . . . . . . . . . . . . . . . . . 621Informix Trigonometry . . . . . . . . . . . . . . . . . . . . . . . . . . . . . . 621cardinality . . . . . . . . . . . . . . . . . . . . . . . . . . . . . . . . . . 622char_length . . . . . . . . . . . . . . . . . . . . . . . . . . . . . . . . . . 622concat . . . . . . . . . . . . . . . . . . . . . . . . . . . . . . . . . . . . 622date . . . . . . . . . . . . . . . . . . . . . . . . . . . . . . . . . . . . 623day. . . . . . . . . . . . . . . . . . . . . . . . . . . . . . . . . . . . . 623extend. . . . . . . . . . . . . . . . . . . . . . . . . . . . . . . . . . . . 623hex . . . . . . . . . . . . . . . . . . . . . . . . . . . . . . . . . . . . . 623initcap. . . . . . . . . . . . . . . . . . . . . . . . . . . . . . . . . . . . 623length . . . . . . . . . . . . . . . . . . . . . . . . . . . . . . . . . . . . 624lpad . . . . . . . . . . . . . . . . . . . . . . . . . . . . . . . . . . . . 624mdy . . . . . . . . . . . . . . . . . . . . . . . . . . . . . . . . . . . . 624month . . . . . . . . . . . . . . . . . . . . . . . . . . . . . . . . . . . . 624nvl . . . . . . . . . . . . . . . . . . . . . . . . . . . . . . . . . . . . . 624octet_length . . . . . . . . . . . . . . . . . . . . . . . . . . . . . . . . . . 624replace . . . . . . . . . . . . . . . . . . . . . . . . . . . . . . . . . . . 625
Contents xix

round . . . . . . . . . . . . . . . . . . . . . . . . . . . . . . . . . . . . 625rpad . . . . . . . . . . . . . . . . . . . . . . . . . . . . . . . . . . . . 625substr . . . . . . . . . . . . . . . . . . . . . . . . . . . . . . . . . . . . 625to_char . . . . . . . . . . . . . . . . . . . . . . . . . . . . . . . . . . . 626to_date . . . . . . . . . . . . . . . . . . . . . . . . . . . . . . . . . . . 626trunc . . . . . . . . . . . . . . . . . . . . . . . . . . . . . . . . . . . . 626weekday . . . . . . . . . . . . . . . . . . . . . . . . . . . . . . . . . . . 626year . . . . . . . . . . . . . . . . . . . . . . . . . . . . . . . . . . . . 626
MS Access . . . . . . . . . . . . . . . . . . . . . . . . . . . . . . . . . . . 626MS Access Cast. . . . . . . . . . . . . . . . . . . . . . . . . . . . . . . . . 626MS Access Math . . . . . . . . . . . . . . . . . . . . . . . . . . . . . . . . 627MS Access Trigonometry . . . . . . . . . . . . . . . . . . . . . . . . . . . . . 628ascii . . . . . . . . . . . . . . . . . . . . . . . . . . . . . . . . . . . . 628ceiling . . . . . . . . . . . . . . . . . . . . . . . . . . . . . . . . . . . . 628chr . . . . . . . . . . . . . . . . . . . . . . . . . . . . . . . . . . . . . 628concat . . . . . . . . . . . . . . . . . . . . . . . . . . . . . . . . . . . . 629curdate . . . . . . . . . . . . . . . . . . . . . . . . . . . . . . . . . . . 629curtime . . . . . . . . . . . . . . . . . . . . . . . . . . . . . . . . . . . 629dayname . . . . . . . . . . . . . . . . . . . . . . . . . . . . . . . . . . . 629dayofmonth . . . . . . . . . . . . . . . . . . . . . . . . . . . . . . . . . . 629dayofweek . . . . . . . . . . . . . . . . . . . . . . . . . . . . . . . . . . 629dayofyear . . . . . . . . . . . . . . . . . . . . . . . . . . . . . . . . . . 630hour . . . . . . . . . . . . . . . . . . . . . . . . . . . . . . . . . . . . 630instr . . . . . . . . . . . . . . . . . . . . . . . . . . . . . . . . . . . . 630lcase . . . . . . . . . . . . . . . . . . . . . . . . . . . . . . . . . . . . 630left . . . . . . . . . . . . . . . . . . . . . . . . . . . . . . . . . . . . . 630length . . . . . . . . . . . . . . . . . . . . . . . . . . . . . . . . . . . . 630locate . . . . . . . . . . . . . . . . . . . . . . . . . . . . . . . . . . . . 631ltrim . . . . . . . . . . . . . . . . . . . . . . . . . . . . . . . . . . . . 631minute . . . . . . . . . . . . . . . . . . . . . . . . . . . . . . . . . . . 631month . . . . . . . . . . . . . . . . . . . . . . . . . . . . . . . . . . . . 631monthname . . . . . . . . . . . . . . . . . . . . . . . . . . . . . . . . . . 631now . . . . . . . . . . . . . . . . . . . . . . . . . . . . . . . . . . . . 631position . . . . . . . . . . . . . . . . . . . . . . . . . . . . . . . . . . . 632quarter . . . . . . . . . . . . . . . . . . . . . . . . . . . . . . . . . . . 632right . . . . . . . . . . . . . . . . . . . . . . . . . . . . . . . . . . . . 632round . . . . . . . . . . . . . . . . . . . . . . . . . . . . . . . . . . . . 632rtrim . . . . . . . . . . . . . . . . . . . . . . . . . . . . . . . . . . . . 632sign . . . . . . . . . . . . . . . . . . . . . . . . . . . . . . . . . . . . 633space . . . . . . . . . . . . . . . . . . . . . . . . . . . . . . . . . . . . 633substr . . . . . . . . . . . . . . . . . . . . . . . . . . . . . . . . . . . . 633substring . . . . . . . . . . . . . . . . . . . . . . . . . . . . . . . . . . . 633truncate . . . . . . . . . . . . . . . . . . . . . . . . . . . . . . . . . . . 633ucase . . . . . . . . . . . . . . . . . . . . . . . . . . . . . . . . . . . . 634week . . . . . . . . . . . . . . . . . . . . . . . . . . . . . . . . . . . . 634year . . . . . . . . . . . . . . . . . . . . . . . . . . . . . . . . . . . . 634
MySQL . . . . . . . . . . . . . . . . . . . . . . . . . . . . . . . . . . . . 634MySQL String . . . . . . . . . . . . . . . . . . . . . . . . . . . . . . . . . 634MySQL Math . . . . . . . . . . . . . . . . . . . . . . . . . . . . . . . . . 635MySQL Trigonometry . . . . . . . . . . . . . . . . . . . . . . . . . . . . . . 636ascii . . . . . . . . . . . . . . . . . . . . . . . . . . . . . . . . . . . . 637database . . . . . . . . . . . . . . . . . . . . . . . . . . . . . . . . . . . 637schema . . . . . . . . . . . . . . . . . . . . . . . . . . . . . . . . . . . 637session_user . . . . . . . . . . . . . . . . . . . . . . . . . . . . . . . . . . 637system_user . . . . . . . . . . . . . . . . . . . . . . . . . . . . . . . . . . 638version . . . . . . . . . . . . . . . . . . . . . . . . . . . . . . . . . . . 638
Netezza . . . . . . . . . . . . . . . . . . . . . . . . . . . . . . . . . . . . 638Netezza Math . . . . . . . . . . . . . . . . . . . . . . . . . . . . . . . . . 638Netezza Trigonometry . . . . . . . . . . . . . . . . . . . . . . . . . . . . . . 638Netezza Fuzzy . . . . . . . . . . . . . . . . . . . . . . . . . . . . . . . . . 639Netezza Phonetic . . . . . . . . . . . . . . . . . . . . . . . . . . . . . . . . 640
xx IBM Cognos Report Studio Version 10.2.1: User Guide

ascii . . . . . . . . . . . . . . . . . . . . . . . . . . . . . . . . . . . . 640chr . . . . . . . . . . . . . . . . . . . . . . . . . . . . . . . . . . . . . 640decode . . . . . . . . . . . . . . . . . . . . . . . . . . . . . . . . . . . 641initcap. . . . . . . . . . . . . . . . . . . . . . . . . . . . . . . . . . . . 641instr . . . . . . . . . . . . . . . . . . . . . . . . . . . . . . . . . . . . 641lpad . . . . . . . . . . . . . . . . . . . . . . . . . . . . . . . . . . . . 641ltrim . . . . . . . . . . . . . . . . . . . . . . . . . . . . . . . . . . . . 641months_between . . . . . . . . . . . . . . . . . . . . . . . . . . . . . . . . 641next_day . . . . . . . . . . . . . . . . . . . . . . . . . . . . . . . . . . . 642nvl . . . . . . . . . . . . . . . . . . . . . . . . . . . . . . . . . . . . . 642round . . . . . . . . . . . . . . . . . . . . . . . . . . . . . . . . . . . . 642rpad . . . . . . . . . . . . . . . . . . . . . . . . . . . . . . . . . . . . 642rtrim . . . . . . . . . . . . . . . . . . . . . . . . . . . . . . . . . . . . 642substr . . . . . . . . . . . . . . . . . . . . . . . . . . . . . . . . . . . . 643{current_db} . . . . . . . . . . . . . . . . . . . . . . . . . . . . . . . . . . 643{current_user} . . . . . . . . . . . . . . . . . . . . . . . . . . . . . . . . . 643{session_user} . . . . . . . . . . . . . . . . . . . . . . . . . . . . . . . . . 643to_char . . . . . . . . . . . . . . . . . . . . . . . . . . . . . . . . . . . 643to_date . . . . . . . . . . . . . . . . . . . . . . . . . . . . . . . . . . . 643to_number . . . . . . . . . . . . . . . . . . . . . . . . . . . . . . . . . . 643translate . . . . . . . . . . . . . . . . . . . . . . . . . . . . . . . . . . . 643date_trunc . . . . . . . . . . . . . . . . . . . . . . . . . . . . . . . . . . 644trunc . . . . . . . . . . . . . . . . . . . . . . . . . . . . . . . . . . . . 644version . . . . . . . . . . . . . . . . . . . . . . . . . . . . . . . . . . . 644
Oracle . . . . . . . . . . . . . . . . . . . . . . . . . . . . . . . . . . . . . 644Oracle Math . . . . . . . . . . . . . . . . . . . . . . . . . . . . . . . . . . 644Oracle Trigonometry . . . . . . . . . . . . . . . . . . . . . . . . . . . . . . . 644add_months . . . . . . . . . . . . . . . . . . . . . . . . . . . . . . . . . . 646ascii . . . . . . . . . . . . . . . . . . . . . . . . . . . . . . . . . . . . 646ceil . . . . . . . . . . . . . . . . . . . . . . . . . . . . . . . . . . . . . 646char_length . . . . . . . . . . . . . . . . . . . . . . . . . . . . . . . . . . 646chr . . . . . . . . . . . . . . . . . . . . . . . . . . . . . . . . . . . . . 646concat . . . . . . . . . . . . . . . . . . . . . . . . . . . . . . . . . . . . 646decode . . . . . . . . . . . . . . . . . . . . . . . . . . . . . . . . . . . 647dump . . . . . . . . . . . . . . . . . . . . . . . . . . . . . . . . . . . . 647greatest . . . . . . . . . . . . . . . . . . . . . . . . . . . . . . . . . . . 647initcap. . . . . . . . . . . . . . . . . . . . . . . . . . . . . . . . . . . . 647instr . . . . . . . . . . . . . . . . . . . . . . . . . . . . . . . . . . . . 647instrb . . . . . . . . . . . . . . . . . . . . . . . . . . . . . . . . . . . . 647least . . . . . . . . . . . . . . . . . . . . . . . . . . . . . . . . . . . . 648length . . . . . . . . . . . . . . . . . . . . . . . . . . . . . . . . . . . . 648lengthb . . . . . . . . . . . . . . . . . . . . . . . . . . . . . . . . . . . 648lpad . . . . . . . . . . . . . . . . . . . . . . . . . . . . . . . . . . . . 648ltrim . . . . . . . . . . . . . . . . . . . . . . . . . . . . . . . . . . . . 648months_between . . . . . . . . . . . . . . . . . . . . . . . . . . . . . . . . 648new_time. . . . . . . . . . . . . . . . . . . . . . . . . . . . . . . . . . . 649next_day . . . . . . . . . . . . . . . . . . . . . . . . . . . . . . . . . . . 649nls_initcap . . . . . . . . . . . . . . . . . . . . . . . . . . . . . . . . . . 649nls_lower. . . . . . . . . . . . . . . . . . . . . . . . . . . . . . . . . . . 649nls_upper . . . . . . . . . . . . . . . . . . . . . . . . . . . . . . . . . . 649nvl . . . . . . . . . . . . . . . . . . . . . . . . . . . . . . . . . . . . . 649replace . . . . . . . . . . . . . . . . . . . . . . . . . . . . . . . . . . . 650round . . . . . . . . . . . . . . . . . . . . . . . . . . . . . . . . . . . . 650rpad . . . . . . . . . . . . . . . . . . . . . . . . . . . . . . . . . . . . 650rtrim . . . . . . . . . . . . . . . . . . . . . . . . . . . . . . . . . . . . 650sign . . . . . . . . . . . . . . . . . . . . . . . . . . . . . . . . . . . . 651soundex . . . . . . . . . . . . . . . . . . . . . . . . . . . . . . . . . . . 651substr . . . . . . . . . . . . . . . . . . . . . . . . . . . . . . . . . . . . 651substrb . . . . . . . . . . . . . . . . . . . . . . . . . . . . . . . . . . . 651{sysdate} . . . . . . . . . . . . . . . . . . . . . . . . . . . . . . . . . . . 652to_char . . . . . . . . . . . . . . . . . . . . . . . . . . . . . . . . . . . 652
Contents xxi

to_date . . . . . . . . . . . . . . . . . . . . . . . . . . . . . . . . . . . 652to_number . . . . . . . . . . . . . . . . . . . . . . . . . . . . . . . . . . 652translate . . . . . . . . . . . . . . . . . . . . . . . . . . . . . . . . . . . 652trunc . . . . . . . . . . . . . . . . . . . . . . . . . . . . . . . . . . . . 652trunc . . . . . . . . . . . . . . . . . . . . . . . . . . . . . . . . . . . . 653{user} . . . . . . . . . . . . . . . . . . . . . . . . . . . . . . . . . . . . 653vsize . . . . . . . . . . . . . . . . . . . . . . . . . . . . . . . . . . . . 653
Paraccel . . . . . . . . . . . . . . . . . . . . . . . . . . . . . . . . . . . . 653Paraccel String . . . . . . . . . . . . . . . . . . . . . . . . . . . . . . . . . 653Paraccel Data type formatting . . . . . . . . . . . . . . . . . . . . . . . . . . . . 654Paraccel Math . . . . . . . . . . . . . . . . . . . . . . . . . . . . . . . . . 654current_database . . . . . . . . . . . . . . . . . . . . . . . . . . . . . . . . 654current_schema. . . . . . . . . . . . . . . . . . . . . . . . . . . . . . . . . 655{current_user} . . . . . . . . . . . . . . . . . . . . . . . . . . . . . . . . . 655{session_user} . . . . . . . . . . . . . . . . . . . . . . . . . . . . . . . . . 655translate . . . . . . . . . . . . . . . . . . . . . . . . . . . . . . . . . . . 655version . . . . . . . . . . . . . . . . . . . . . . . . . . . . . . . . . . . 655
Postgres . . . . . . . . . . . . . . . . . . . . . . . . . . . . . . . . . . . . 655Postgres String . . . . . . . . . . . . . . . . . . . . . . . . . . . . . . . . . 655Postgres Data type formatting . . . . . . . . . . . . . . . . . . . . . . . . . . . . 657Postgres Math . . . . . . . . . . . . . . . . . . . . . . . . . . . . . . . . . 657Postgres Trigonometry . . . . . . . . . . . . . . . . . . . . . . . . . . . . . . 658ascii . . . . . . . . . . . . . . . . . . . . . . . . . . . . . . . . . . . . 659chr . . . . . . . . . . . . . . . . . . . . . . . . . . . . . . . . . . . . . 659{current_db} . . . . . . . . . . . . . . . . . . . . . . . . . . . . . . . . . . 660{current_catalog} . . . . . . . . . . . . . . . . . . . . . . . . . . . . . . . . 660{current_schema} . . . . . . . . . . . . . . . . . . . . . . . . . . . . . . . . 660{current_user} . . . . . . . . . . . . . . . . . . . . . . . . . . . . . . . . . 660{session_user} . . . . . . . . . . . . . . . . . . . . . . . . . . . . . . . . . 660translate . . . . . . . . . . . . . . . . . . . . . . . . . . . . . . . . . . . 660date_trunc . . . . . . . . . . . . . . . . . . . . . . . . . . . . . . . . . . 660version . . . . . . . . . . . . . . . . . . . . . . . . . . . . . . . . . . . 660
Red Brick. . . . . . . . . . . . . . . . . . . . . . . . . . . . . . . . . . . . 660ceil . . . . . . . . . . . . . . . . . . . . . . . . . . . . . . . . . . . . . 660concat . . . . . . . . . . . . . . . . . . . . . . . . . . . . . . . . . . . . 661{current_user} . . . . . . . . . . . . . . . . . . . . . . . . . . . . . . . . . 661date . . . . . . . . . . . . . . . . . . . . . . . . . . . . . . . . . . . . 661dateadd . . . . . . . . . . . . . . . . . . . . . . . . . . . . . . . . . . . 661datediff . . . . . . . . . . . . . . . . . . . . . . . . . . . . . . . . . . . 661datename. . . . . . . . . . . . . . . . . . . . . . . . . . . . . . . . . . . 661dec . . . . . . . . . . . . . . . . . . . . . . . . . . . . . . . . . . . . . 662decimal . . . . . . . . . . . . . . . . . . . . . . . . . . . . . . . . . . . 662decode . . . . . . . . . . . . . . . . . . . . . . . . . . . . . . . . . . . 662float . . . . . . . . . . . . . . . . . . . . . . . . . . . . . . . . . . . . 662ifnull . . . . . . . . . . . . . . . . . . . . . . . . . . . . . . . . . . . . 662int . . . . . . . . . . . . . . . . . . . . . . . . . . . . . . . . . . . . . 662integer . . . . . . . . . . . . . . . . . . . . . . . . . . . . . . . . . . . 662length . . . . . . . . . . . . . . . . . . . . . . . . . . . . . . . . . . . . 663lengthb . . . . . . . . . . . . . . . . . . . . . . . . . . . . . . . . . . . 663ltrim . . . . . . . . . . . . . . . . . . . . . . . . . . . . . . . . . . . . 663nullif . . . . . . . . . . . . . . . . . . . . . . . . . . . . . . . . . . . . 663positionb . . . . . . . . . . . . . . . . . . . . . . . . . . . . . . . . . . . 663real . . . . . . . . . . . . . . . . . . . . . . . . . . . . . . . . . . . . . 664round . . . . . . . . . . . . . . . . . . . . . . . . . . . . . . . . . . . . 664rtrim . . . . . . . . . . . . . . . . . . . . . . . . . . . . . . . . . . . . 664sign . . . . . . . . . . . . . . . . . . . . . . . . . . . . . . . . . . . . 664string . . . . . . . . . . . . . . . . . . . . . . . . . . . . . . . . . . . . 664substr . . . . . . . . . . . . . . . . . . . . . . . . . . . . . . . . . . . . 665substrb . . . . . . . . . . . . . . . . . . . . . . . . . . . . . . . . . . . 665time . . . . . . . . . . . . . . . . . . . . . . . . . . . . . . . . . . . . 665timestamp . . . . . . . . . . . . . . . . . . . . . . . . . . . . . . . . . . 665
xxii IBM Cognos Report Studio Version 10.2.1: User Guide

timestamp . . . . . . . . . . . . . . . . . . . . . . . . . . . . . . . . . . 665to_char . . . . . . . . . . . . . . . . . . . . . . . . . . . . . . . . . . . 665
SAP BW . . . . . . . . . . . . . . . . . . . . . . . . . . . . . . . . . . . . 666SAP BW Trigonometry . . . . . . . . . . . . . . . . . . . . . . . . . . . . . . 666SAP BW Math . . . . . . . . . . . . . . . . . . . . . . . . . . . . . . . . . 667
Salesforce.com . . . . . . . . . . . . . . . . . . . . . . . . . . . . . . . . . . 667Date Functions . . . . . . . . . . . . . . . . . . . . . . . . . . . . . . . . . 667convertCurrency . . . . . . . . . . . . . . . . . . . . . . . . . . . . . . . . 670convertTimezone . . . . . . . . . . . . . . . . . . . . . . . . . . . . . . . . 671
SQL Server . . . . . . . . . . . . . . . . . . . . . . . . . . . . . . . . . . . 671SQL Server Math . . . . . . . . . . . . . . . . . . . . . . . . . . . . . . . . 671SQL Server Trigonometry . . . . . . . . . . . . . . . . . . . . . . . . . . . . . 671ascii . . . . . . . . . . . . . . . . . . . . . . . . . . . . . . . . . . . . 672char . . . . . . . . . . . . . . . . . . . . . . . . . . . . . . . . . . . . 673charindex. . . . . . . . . . . . . . . . . . . . . . . . . . . . . . . . . . . 673{current_user} . . . . . . . . . . . . . . . . . . . . . . . . . . . . . . . . . 673datalength . . . . . . . . . . . . . . . . . . . . . . . . . . . . . . . . . . 673dateadd . . . . . . . . . . . . . . . . . . . . . . . . . . . . . . . . . . . 673datediff . . . . . . . . . . . . . . . . . . . . . . . . . . . . . . . . . . . 674datename. . . . . . . . . . . . . . . . . . . . . . . . . . . . . . . . . . . 674datepart . . . . . . . . . . . . . . . . . . . . . . . . . . . . . . . . . . . 674day. . . . . . . . . . . . . . . . . . . . . . . . . . . . . . . . . . . . . 674difference. . . . . . . . . . . . . . . . . . . . . . . . . . . . . . . . . . . 675getdate . . . . . . . . . . . . . . . . . . . . . . . . . . . . . . . . . . . 675isnull . . . . . . . . . . . . . . . . . . . . . . . . . . . . . . . . . . . . 675left . . . . . . . . . . . . . . . . . . . . . . . . . . . . . . . . . . . . . 675ltrim . . . . . . . . . . . . . . . . . . . . . . . . . . . . . . . . . . . . 676month . . . . . . . . . . . . . . . . . . . . . . . . . . . . . . . . . . . . 676patindex . . . . . . . . . . . . . . . . . . . . . . . . . . . . . . . . . . . 676replace . . . . . . . . . . . . . . . . . . . . . . . . . . . . . . . . . . . 676replicate . . . . . . . . . . . . . . . . . . . . . . . . . . . . . . . . . . . 676reverse . . . . . . . . . . . . . . . . . . . . . . . . . . . . . . . . . . . 677right . . . . . . . . . . . . . . . . . . . . . . . . . . . . . . . . . . . . 677round . . . . . . . . . . . . . . . . . . . . . . . . . . . . . . . . . . . . 677rtrim . . . . . . . . . . . . . . . . . . . . . . . . . . . . . . . . . . . . 677sign . . . . . . . . . . . . . . . . . . . . . . . . . . . . . . . . . . . . 677soundex . . . . . . . . . . . . . . . . . . . . . . . . . . . . . . . . . . . 677space . . . . . . . . . . . . . . . . . . . . . . . . . . . . . . . . . . . . 678str . . . . . . . . . . . . . . . . . . . . . . . . . . . . . . . . . . . . . 678stuff . . . . . . . . . . . . . . . . . . . . . . . . . . . . . . . . . . . . 678year . . . . . . . . . . . . . . . . . . . . . . . . . . . . . . . . . . . . 678
Sybase. . . . . . . . . . . . . . . . . . . . . . . . . . . . . . . . . . . . . 678Sybase Math. . . . . . . . . . . . . . . . . . . . . . . . . . . . . . . . . . 678Sybase Trigonometry . . . . . . . . . . . . . . . . . . . . . . . . . . . . . . . 679ascii . . . . . . . . . . . . . . . . . . . . . . . . . . . . . . . . . . . . 680char . . . . . . . . . . . . . . . . . . . . . . . . . . . . . . . . . . . . 680charindex. . . . . . . . . . . . . . . . . . . . . . . . . . . . . . . . . . . 681datalength . . . . . . . . . . . . . . . . . . . . . . . . . . . . . . . . . . 681dateadd . . . . . . . . . . . . . . . . . . . . . . . . . . . . . . . . . . . 681datediff . . . . . . . . . . . . . . . . . . . . . . . . . . . . . . . . . . . 681datename. . . . . . . . . . . . . . . . . . . . . . . . . . . . . . . . . . . 681datepart . . . . . . . . . . . . . . . . . . . . . . . . . . . . . . . . . . . 682day. . . . . . . . . . . . . . . . . . . . . . . . . . . . . . . . . . . . . 682difference. . . . . . . . . . . . . . . . . . . . . . . . . . . . . . . . . . . 682getdate . . . . . . . . . . . . . . . . . . . . . . . . . . . . . . . . . . . 683left . . . . . . . . . . . . . . . . . . . . . . . . . . . . . . . . . . . . . 683ltrim . . . . . . . . . . . . . . . . . . . . . . . . . . . . . . . . . . . . 683month . . . . . . . . . . . . . . . . . . . . . . . . . . . . . . . . . . . . 683patindex . . . . . . . . . . . . . . . . . . . . . . . . . . . . . . . . . . . 683rand . . . . . . . . . . . . . . . . . . . . . . . . . . . . . . . . . . . . 683replicate . . . . . . . . . . . . . . . . . . . . . . . . . . . . . . . . . . . 684
Contents xxiii

reverse . . . . . . . . . . . . . . . . . . . . . . . . . . . . . . . . . . . 684right . . . . . . . . . . . . . . . . . . . . . . . . . . . . . . . . . . . . 684round . . . . . . . . . . . . . . . . . . . . . . . . . . . . . . . . . . . . 684rtrim . . . . . . . . . . . . . . . . . . . . . . . . . . . . . . . . . . . . 684soundex . . . . . . . . . . . . . . . . . . . . . . . . . . . . . . . . . . . 684space . . . . . . . . . . . . . . . . . . . . . . . . . . . . . . . . . . . . 685str . . . . . . . . . . . . . . . . . . . . . . . . . . . . . . . . . . . . . 685stuff . . . . . . . . . . . . . . . . . . . . . . . . . . . . . . . . . . . . 685substring . . . . . . . . . . . . . . . . . . . . . . . . . . . . . . . . . . . 685to_unichar . . . . . . . . . . . . . . . . . . . . . . . . . . . . . . . . . . 685uhighsurr . . . . . . . . . . . . . . . . . . . . . . . . . . . . . . . . . . 686ulowsurr . . . . . . . . . . . . . . . . . . . . . . . . . . . . . . . . . . . 686uscalar . . . . . . . . . . . . . . . . . . . . . . . . . . . . . . . . . . . 686year . . . . . . . . . . . . . . . . . . . . . . . . . . . . . . . . . . . . 686
Teradata . . . . . . . . . . . . . . . . . . . . . . . . . . . . . . . . . . . . 686Teradata Trigonometry . . . . . . . . . . . . . . . . . . . . . . . . . . . . . . 686account . . . . . . . . . . . . . . . . . . . . . . . . . . . . . . . . . . . 688add_months . . . . . . . . . . . . . . . . . . . . . . . . . . . . . . . . . . 688bytes . . . . . . . . . . . . . . . . . . . . . . . . . . . . . . . . . . . . 688case_n . . . . . . . . . . . . . . . . . . . . . . . . . . . . . . . . . . . . 689char2hexint . . . . . . . . . . . . . . . . . . . . . . . . . . . . . . . . . . 689characters . . . . . . . . . . . . . . . . . . . . . . . . . . . . . . . . . . 689database . . . . . . . . . . . . . . . . . . . . . . . . . . . . . . . . . . . 689date . . . . . . . . . . . . . . . . . . . . . . . . . . . . . . . . . . . . 689format. . . . . . . . . . . . . . . . . . . . . . . . . . . . . . . . . . . . 689index . . . . . . . . . . . . . . . . . . . . . . . . . . . . . . . . . . . . 689log . . . . . . . . . . . . . . . . . . . . . . . . . . . . . . . . . . . . . 690nullif . . . . . . . . . . . . . . . . . . . . . . . . . . . . . . . . . . . . 690nullifzero . . . . . . . . . . . . . . . . . . . . . . . . . . . . . . . . . . . 690profile . . . . . . . . . . . . . . . . . . . . . . . . . . . . . . . . . . . . 690random . . . . . . . . . . . . . . . . . . . . . . . . . . . . . . . . . . . 690role. . . . . . . . . . . . . . . . . . . . . . . . . . . . . . . . . . . . . 690session . . . . . . . . . . . . . . . . . . . . . . . . . . . . . . . . . . . 690soundex . . . . . . . . . . . . . . . . . . . . . . . . . . . . . . . . . . . 691substr . . . . . . . . . . . . . . . . . . . . . . . . . . . . . . . . . . . . 691time . . . . . . . . . . . . . . . . . . . . . . . . . . . . . . . . . . . . 691type . . . . . . . . . . . . . . . . . . . . . . . . . . . . . . . . . . . . 691user . . . . . . . . . . . . . . . . . . . . . . . . . . . . . . . . . . . . 691vargraphic . . . . . . . . . . . . . . . . . . . . . . . . . . . . . . . . . . 691zeroifnull . . . . . . . . . . . . . . . . . . . . . . . . . . . . . . . . . . . 692
Vectorwise . . . . . . . . . . . . . . . . . . . . . . . . . . . . . . . . . . . 692Vectorwise String . . . . . . . . . . . . . . . . . . . . . . . . . . . . . . . . 692Vectorwise Math . . . . . . . . . . . . . . . . . . . . . . . . . . . . . . . . 693Vectorwise Trigonometry . . . . . . . . . . . . . . . . . . . . . . . . . . . . . 693{initial_user} . . . . . . . . . . . . . . . . . . . . . . . . . . . . . . . . . . 694{session_user} . . . . . . . . . . . . . . . . . . . . . . . . . . . . . . . . . 694numeric_trunc . . . . . . . . . . . . . . . . . . . . . . . . . . . . . . . . . 694
Vertica. . . . . . . . . . . . . . . . . . . . . . . . . . . . . . . . . . . . . 694Vertica String . . . . . . . . . . . . . . . . . . . . . . . . . . . . . . . . . 694Vertica Data type formatting . . . . . . . . . . . . . . . . . . . . . . . . . . . . 696Vertica Math. . . . . . . . . . . . . . . . . . . . . . . . . . . . . . . . . . 696Vertica Trigonometry . . . . . . . . . . . . . . . . . . . . . . . . . . . . . . . 697ascii . . . . . . . . . . . . . . . . . . . . . . . . . . . . . . . . . . . . 698chr . . . . . . . . . . . . . . . . . . . . . . . . . . . . . . . . . . . . . 698current_database . . . . . . . . . . . . . . . . . . . . . . . . . . . . . . . . 698current_schema. . . . . . . . . . . . . . . . . . . . . . . . . . . . . . . . . 698{current_user} . . . . . . . . . . . . . . . . . . . . . . . . . . . . . . . . . 699{session_user} . . . . . . . . . . . . . . . . . . . . . . . . . . . . . . . . . 699translate . . . . . . . . . . . . . . . . . . . . . . . . . . . . . . . . . . . 699date_trunc . . . . . . . . . . . . . . . . . . . . . . . . . . . . . . . . . . 699version . . . . . . . . . . . . . . . . . . . . . . . . . . . . . . . . . . . 699
xxiv IBM Cognos Report Studio Version 10.2.1: User Guide

Macro Functions . . . . . . . . . . . . . . . . . . . . . . . . . . . . . . . . . 699+ . . . . . . . . . . . . . . . . . . . . . . . . . . . . . . . . . . . . . 699_add_days . . . . . . . . . . . . . . . . . . . . . . . . . . . . . . . . . . 700_add_months . . . . . . . . . . . . . . . . . . . . . . . . . . . . . . . . . 700_add_years . . . . . . . . . . . . . . . . . . . . . . . . . . . . . . . . . . 701array . . . . . . . . . . . . . . . . . . . . . . . . . . . . . . . . . . . . 701csv . . . . . . . . . . . . . . . . . . . . . . . . . . . . . . . . . . . . . 702dq . . . . . . . . . . . . . . . . . . . . . . . . . . . . . . . . . . . . . 702getConfigurationEntry . . . . . . . . . . . . . . . . . . . . . . . . . . . . . . 702grep . . . . . . . . . . . . . . . . . . . . . . . . . . . . . . . . . . . . 702_first_of_month. . . . . . . . . . . . . . . . . . . . . . . . . . . . . . . . . 703_last_of_month . . . . . . . . . . . . . . . . . . . . . . . . . . . . . . . . . 703join. . . . . . . . . . . . . . . . . . . . . . . . . . . . . . . . . . . . . 704lstrip . . . . . . . . . . . . . . . . . . . . . . . . . . . . . . . . . . . . 704prompt . . . . . . . . . . . . . . . . . . . . . . . . . . . . . . . . . . . 704promptmany . . . . . . . . . . . . . . . . . . . . . . . . . . . . . . . . . 705rstrip . . . . . . . . . . . . . . . . . . . . . . . . . . . . . . . . . . . . 706sb . . . . . . . . . . . . . . . . . . . . . . . . . . . . . . . . . . . . . 706sq . . . . . . . . . . . . . . . . . . . . . . . . . . . . . . . . . . . . . 706sort. . . . . . . . . . . . . . . . . . . . . . . . . . . . . . . . . . . . . 706split . . . . . . . . . . . . . . . . . . . . . . . . . . . . . . . . . . . . 707strip . . . . . . . . . . . . . . . . . . . . . . . . . . . . . . . . . . . . 707substitute. . . . . . . . . . . . . . . . . . . . . . . . . . . . . . . . . . . 707timestampMask . . . . . . . . . . . . . . . . . . . . . . . . . . . . . . . . 708toLocal . . . . . . . . . . . . . . . . . . . . . . . . . . . . . . . . . . . 709tolower . . . . . . . . . . . . . . . . . . . . . . . . . . . . . . . . . . . 709toupper . . . . . . . . . . . . . . . . . . . . . . . . . . . . . . . . . . . 710toUTC. . . . . . . . . . . . . . . . . . . . . . . . . . . . . . . . . . . . 710unique. . . . . . . . . . . . . . . . . . . . . . . . . . . . . . . . . . . . 711urlencode. . . . . . . . . . . . . . . . . . . . . . . . . . . . . . . . . . . 711CSVIdentityName . . . . . . . . . . . . . . . . . . . . . . . . . . . . . . . . 711CSVIdentityNameList . . . . . . . . . . . . . . . . . . . . . . . . . . . . . . 712CAMPassport . . . . . . . . . . . . . . . . . . . . . . . . . . . . . . . . . 712CAMIDList . . . . . . . . . . . . . . . . . . . . . . . . . . . . . . . . . . 712CAMIDListForType . . . . . . . . . . . . . . . . . . . . . . . . . . . . . . . 712simple case . . . . . . . . . . . . . . . . . . . . . . . . . . . . . . . . . . 713
Common Functions . . . . . . . . . . . . . . . . . . . . . . . . . . . . . . . . 713abs . . . . . . . . . . . . . . . . . . . . . . . . . . . . . . . . . . . . . 713cast. . . . . . . . . . . . . . . . . . . . . . . . . . . . . . . . . . . . . 713ceil . . . . . . . . . . . . . . . . . . . . . . . . . . . . . . . . . . . . . 714ceiling . . . . . . . . . . . . . . . . . . . . . . . . . . . . . . . . . . . . 714char_length . . . . . . . . . . . . . . . . . . . . . . . . . . . . . . . . . . 715character_length . . . . . . . . . . . . . . . . . . . . . . . . . . . . . . . . 715coalesce . . . . . . . . . . . . . . . . . . . . . . . . . . . . . . . . . . . 715current_date . . . . . . . . . . . . . . . . . . . . . . . . . . . . . . . . . . 715current_time. . . . . . . . . . . . . . . . . . . . . . . . . . . . . . . . . . 716current_timestamp. . . . . . . . . . . . . . . . . . . . . . . . . . . . . . . . 716exp . . . . . . . . . . . . . . . . . . . . . . . . . . . . . . . . . . . . . 716extract . . . . . . . . . . . . . . . . . . . . . . . . . . . . . . . . . . . . 717floor . . . . . . . . . . . . . . . . . . . . . . . . . . . . . . . . . . . . 717ln . . . . . . . . . . . . . . . . . . . . . . . . . . . . . . . . . . . . . 717localtime . . . . . . . . . . . . . . . . . . . . . . . . . . . . . . . . . . . 718localtimestamp . . . . . . . . . . . . . . . . . . . . . . . . . . . . . . . . . 718lower . . . . . . . . . . . . . . . . . . . . . . . . . . . . . . . . . . . . 718mod . . . . . . . . . . . . . . . . . . . . . . . . . . . . . . . . . . . . 718nullif . . . . . . . . . . . . . . . . . . . . . . . . . . . . . . . . . . . . 719octet_length . . . . . . . . . . . . . . . . . . . . . . . . . . . . . . . . . . 719position . . . . . . . . . . . . . . . . . . . . . . . . . . . . . . . . . . . 719power . . . . . . . . . . . . . . . . . . . . . . . . . . . . . . . . . . . . 719_round . . . . . . . . . . . . . . . . . . . . . . . . . . . . . . . . . . . 720row . . . . . . . . . . . . . . . . . . . . . . . . . . . . . . . . . . . . 720
Contents xxv

sqrt. . . . . . . . . . . . . . . . . . . . . . . . . . . . . . . . . . . . . 721substring . . . . . . . . . . . . . . . . . . . . . . . . . . . . . . . . . . . 721trim . . . . . . . . . . . . . . . . . . . . . . . . . . . . . . . . . . . . 721upper . . . . . . . . . . . . . . . . . . . . . . . . . . . . . . . . . . . . 722width-bucket . . . . . . . . . . . . . . . . . . . . . . . . . . . . . . . . . 722Trigonometric functions . . . . . . . . . . . . . . . . . . . . . . . . . . . . . . 723
Dimensional Functions . . . . . . . . . . . . . . . . . . . . . . . . . . . . . . . 725ancestor . . . . . . . . . . . . . . . . . . . . . . . . . . . . . . . . . . . 725ancestors . . . . . . . . . . . . . . . . . . . . . . . . . . . . . . . . . . . 725bottomCount . . . . . . . . . . . . . . . . . . . . . . . . . . . . . . . . . 726bottomPercent . . . . . . . . . . . . . . . . . . . . . . . . . . . . . . . . . 726bottomSum . . . . . . . . . . . . . . . . . . . . . . . . . . . . . . . . . . 727caption . . . . . . . . . . . . . . . . . . . . . . . . . . . . . . . . . . . 727children . . . . . . . . . . . . . . . . . . . . . . . . . . . . . . . . . . . 728closingPeriod . . . . . . . . . . . . . . . . . . . . . . . . . . . . . . . . . 728cousin . . . . . . . . . . . . . . . . . . . . . . . . . . . . . . . . . . . . 729completeTuple . . . . . . . . . . . . . . . . . . . . . . . . . . . . . . . . . 729currentMember . . . . . . . . . . . . . . . . . . . . . . . . . . . . . . . . . 730defaultMember . . . . . . . . . . . . . . . . . . . . . . . . . . . . . . . . . 730descendants . . . . . . . . . . . . . . . . . . . . . . . . . . . . . . . . . . 731except . . . . . . . . . . . . . . . . . . . . . . . . . . . . . . . . . . . . 732filter . . . . . . . . . . . . . . . . . . . . . . . . . . . . . . . . . . . . 733firstChild . . . . . . . . . . . . . . . . . . . . . . . . . . . . . . . . . . . 733firstSibling . . . . . . . . . . . . . . . . . . . . . . . . . . . . . . . . . . 733_format . . . . . . . . . . . . . . . . . . . . . . . . . . . . . . . . . . . 734emptySet . . . . . . . . . . . . . . . . . . . . . . . . . . . . . . . . . . . 734generate . . . . . . . . . . . . . . . . . . . . . . . . . . . . . . . . . . . 734head . . . . . . . . . . . . . . . . . . . . . . . . . . . . . . . . . . . . 735hierarchize . . . . . . . . . . . . . . . . . . . . . . . . . . . . . . . . . . 735hierarchy . . . . . . . . . . . . . . . . . . . . . . . . . . . . . . . . . . . 736item . . . . . . . . . . . . . . . . . . . . . . . . . . . . . . . . . . . . 736intersect . . . . . . . . . . . . . . . . . . . . . . . . . . . . . . . . . . . 737lag . . . . . . . . . . . . . . . . . . . . . . . . . . . . . . . . . . . . . 737lastChild . . . . . . . . . . . . . . . . . . . . . . . . . . . . . . . . . . . 737lastPeriods . . . . . . . . . . . . . . . . . . . . . . . . . . . . . . . . . . 738lastSibling . . . . . . . . . . . . . . . . . . . . . . . . . . . . . . . . . . 738lead . . . . . . . . . . . . . . . . . . . . . . . . . . . . . . . . . . . . 738level . . . . . . . . . . . . . . . . . . . . . . . . . . . . . . . . . . . . 739levels . . . . . . . . . . . . . . . . . . . . . . . . . . . . . . . . . . . . 739linkMember . . . . . . . . . . . . . . . . . . . . . . . . . . . . . . . . . . 740members . . . . . . . . . . . . . . . . . . . . . . . . . . . . . . . . . . . 740nextMember . . . . . . . . . . . . . . . . . . . . . . . . . . . . . . . . . . 741openingPeriod . . . . . . . . . . . . . . . . . . . . . . . . . . . . . . . . . 741order . . . . . . . . . . . . . . . . . . . . . . . . . . . . . . . . . . . . 741ordinal . . . . . . . . . . . . . . . . . . . . . . . . . . . . . . . . . . . 742parallelPeriod . . . . . . . . . . . . . . . . . . . . . . . . . . . . . . . . . 743parent . . . . . . . . . . . . . . . . . . . . . . . . . . . . . . . . . . . . 743periodsToDate . . . . . . . . . . . . . . . . . . . . . . . . . . . . . . . . . 744prevMember . . . . . . . . . . . . . . . . . . . . . . . . . . . . . . . . . 744member . . . . . . . . . . . . . . . . . . . . . . . . . . . . . . . . . . . 744nestedSet . . . . . . . . . . . . . . . . . . . . . . . . . . . . . . . . . . . 745set . . . . . . . . . . . . . . . . . . . . . . . . . . . . . . . . . . . . . 745siblings . . . . . . . . . . . . . . . . . . . . . . . . . . . . . . . . . . . 745tail . . . . . . . . . . . . . . . . . . . . . . . . . . . . . . . . . . . . . 746topCount . . . . . . . . . . . . . . . . . . . . . . . . . . . . . . . . . . . 746topPercent . . . . . . . . . . . . . . . . . . . . . . . . . . . . . . . . . . 747topSum . . . . . . . . . . . . . . . . . . . . . . . . . . . . . . . . . . . 747tuple . . . . . . . . . . . . . . . . . . . . . . . . . . . . . . . . . . . . 747union . . . . . . . . . . . . . . . . . . . . . . . . . . . . . . . . . . . . 748roleValue . . . . . . . . . . . . . . . . . . . . . . . . . . . . . . . . . . . 748rootMember . . . . . . . . . . . . . . . . . . . . . . . . . . . . . . . . . . 749
xxvi IBM Cognos Report Studio Version 10.2.1: User Guide

rootMembers . . . . . . . . . . . . . . . . . . . . . . . . . . . . . . . . . 749subset . . . . . . . . . . . . . . . . . . . . . . . . . . . . . . . . . . . . 749unique . . . . . . . . . . . . . . . . . . . . . . . . . . . . . . . . . . . 750value . . . . . . . . . . . . . . . . . . . . . . . . . . . . . . . . . . . . 750
Report Functions . . . . . . . . . . . . . . . . . . . . . . . . . . . . . . . . . 751Today . . . . . . . . . . . . . . . . . . . . . . . . . . . . . . . . . . . . 751Now . . . . . . . . . . . . . . . . . . . . . . . . . . . . . . . . . . . . 751AsOfDate. . . . . . . . . . . . . . . . . . . . . . . . . . . . . . . . . . . 751AsOfTime . . . . . . . . . . . . . . . . . . . . . . . . . . . . . . . . . . 751ReportDate . . . . . . . . . . . . . . . . . . . . . . . . . . . . . . . . . . 751ReportName. . . . . . . . . . . . . . . . . . . . . . . . . . . . . . . . . . 751ReportPath . . . . . . . . . . . . . . . . . . . . . . . . . . . . . . . . . . 751ReportDescription . . . . . . . . . . . . . . . . . . . . . . . . . . . . . . . . 752ReportLocale . . . . . . . . . . . . . . . . . . . . . . . . . . . . . . . . . 752GetLocale . . . . . . . . . . . . . . . . . . . . . . . . . . . . . . . . . . 752Locale . . . . . . . . . . . . . . . . . . . . . . . . . . . . . . . . . . . . 752ReportProductLocale . . . . . . . . . . . . . . . . . . . . . . . . . . . . . . . 752ReportAuthorLocale . . . . . . . . . . . . . . . . . . . . . . . . . . . . . . . 752ReportSaveDate . . . . . . . . . . . . . . . . . . . . . . . . . . . . . . . . 752ReportCreateDate . . . . . . . . . . . . . . . . . . . . . . . . . . . . . . . . 752ReportID . . . . . . . . . . . . . . . . . . . . . . . . . . . . . . . . . . . 753ReportOutput . . . . . . . . . . . . . . . . . . . . . . . . . . . . . . . . . 753ReportOption . . . . . . . . . . . . . . . . . . . . . . . . . . . . . . . . . 753ServerName . . . . . . . . . . . . . . . . . . . . . . . . . . . . . . . . . . 753ServerLocale. . . . . . . . . . . . . . . . . . . . . . . . . . . . . . . . . . 753ModelPath . . . . . . . . . . . . . . . . . . . . . . . . . . . . . . . . . . 753BurstKey . . . . . . . . . . . . . . . . . . . . . . . . . . . . . . . . . . . 753BurstRecipients . . . . . . . . . . . . . . . . . . . . . . . . . . . . . . . . . 754IsBursting . . . . . . . . . . . . . . . . . . . . . . . . . . . . . . . . . . 754ParamNames . . . . . . . . . . . . . . . . . . . . . . . . . . . . . . . . . 754ParamName . . . . . . . . . . . . . . . . . . . . . . . . . . . . . . . . . . 754ParamDisplayValue . . . . . . . . . . . . . . . . . . . . . . . . . . . . . . . 754ParamValue . . . . . . . . . . . . . . . . . . . . . . . . . . . . . . . . . . 754ParamCount. . . . . . . . . . . . . . . . . . . . . . . . . . . . . . . . . . 754RowNumber . . . . . . . . . . . . . . . . . . . . . . . . . . . . . . . . . 754PageNumber . . . . . . . . . . . . . . . . . . . . . . . . . . . . . . . . . 755PageCount . . . . . . . . . . . . . . . . . . . . . . . . . . . . . . . . . . 755IsPageCountAvailable . . . . . . . . . . . . . . . . . . . . . . . . . . . . . . 755HorizontalPageNumber . . . . . . . . . . . . . . . . . . . . . . . . . . . . . . 755HorizontalPageCount. . . . . . . . . . . . . . . . . . . . . . . . . . . . . . . 755PageName . . . . . . . . . . . . . . . . . . . . . . . . . . . . . . . . . . 755URLEncode . . . . . . . . . . . . . . . . . . . . . . . . . . . . . . . . . . 755TOCHeadingCount . . . . . . . . . . . . . . . . . . . . . . . . . . . . . . . 755IsAccessible . . . . . . . . . . . . . . . . . . . . . . . . . . . . . . . . . . 756ColumnNumber . . . . . . . . . . . . . . . . . . . . . . . . . . . . . . . . 756IsCrosstabRowNodeMember . . . . . . . . . . . . . . . . . . . . . . . . . . . . 756IsCrosstabColumnNodeMember . . . . . . . . . . . . . . . . . . . . . . . . . . . 756IsInnerMostCrosstabRowNodeMember . . . . . . . . . . . . . . . . . . . . . . . . . 756IsInnerMostCrosstabColumnNodeMember. . . . . . . . . . . . . . . . . . . . . . . . 756IsOuterMostCrosstabRowNodeMember. . . . . . . . . . . . . . . . . . . . . . . . . 756IsOuterMostCrosstabColumnNodeMember . . . . . . . . . . . . . . . . . . . . . . . 756IsFirstColumn . . . . . . . . . . . . . . . . . . . . . . . . . . . . . . . . . 757IsLastColumn . . . . . . . . . . . . . . . . . . . . . . . . . . . . . . . . . 757IsLastInnerMostCrosstabColumnNodeMember . . . . . . . . . . . . . . . . . . . . . . 757IsLastInnerMostCrosstabRowNodeMember . . . . . . . . . . . . . . . . . . . . . . . 757CubeName . . . . . . . . . . . . . . . . . . . . . . . . . . . . . . . . . . 757CubeDescription . . . . . . . . . . . . . . . . . . . . . . . . . . . . . . . . 757CubeCreatedOn . . . . . . . . . . . . . . . . . . . . . . . . . . . . . . . . 757CubeDataUpdatedOn. . . . . . . . . . . . . . . . . . . . . . . . . . . . . . . 758CubeSchemaUpdatedOn. . . . . . . . . . . . . . . . . . . . . . . . . . . . . . 758CubeIsOptimized . . . . . . . . . . . . . . . . . . . . . . . . . . . . . . . . 758
Contents xxvii

CubeDefaultMeasure . . . . . . . . . . . . . . . . . . . . . . . . . . . . . . . 758CubeCurrentPeriod . . . . . . . . . . . . . . . . . . . . . . . . . . . . . . . 758CellValue . . . . . . . . . . . . . . . . . . . . . . . . . . . . . . . . . . . 758InScope . . . . . . . . . . . . . . . . . . . . . . . . . . . . . . . . . . . 758
Data Type Casting Functions . . . . . . . . . . . . . . . . . . . . . . . . . . . . . 759_add_days . . . . . . . . . . . . . . . . . . . . . . . . . . . . . . . . . . 759_add_months . . . . . . . . . . . . . . . . . . . . . . . . . . . . . . . . . 759_add_years . . . . . . . . . . . . . . . . . . . . . . . . . . . . . . . . . . 759_age . . . . . . . . . . . . . . . . . . . . . . . . . . . . . . . . . . . . 759_day_of_week . . . . . . . . . . . . . . . . . . . . . . . . . . . . . . . . . 759_day_of_year . . . . . . . . . . . . . . . . . . . . . . . . . . . . . . . . . 760_days_between . . . . . . . . . . . . . . . . . . . . . . . . . . . . . . . . . 760_days_to_end_of_month . . . . . . . . . . . . . . . . . . . . . . . . . . . . . . 760_first_of_month. . . . . . . . . . . . . . . . . . . . . . . . . . . . . . . . . 760_last_of_month . . . . . . . . . . . . . . . . . . . . . . . . . . . . . . . . . 761_make_timestamp . . . . . . . . . . . . . . . . . . . . . . . . . . . . . . . . 761_months_between . . . . . . . . . . . . . . . . . . . . . . . . . . . . . . . . 761_week_of_year . . . . . . . . . . . . . . . . . . . . . . . . . . . . . . . . . 761_years_between . . . . . . . . . . . . . . . . . . . . . . . . . . . . . . . . 761_ymdint_between . . . . . . . . . . . . . . . . . . . . . . . . . . . . . . . . 761abs . . . . . . . . . . . . . . . . . . . . . . . . . . . . . . . . . . . . . 762ceiling . . . . . . . . . . . . . . . . . . . . . . . . . . . . . . . . . . . . 762character_length . . . . . . . . . . . . . . . . . . . . . . . . . . . . . . . . 762date2string . . . . . . . . . . . . . . . . . . . . . . . . . . . . . . . . . . 762date2timestamp . . . . . . . . . . . . . . . . . . . . . . . . . . . . . . . . 762date2timestampTZ. . . . . . . . . . . . . . . . . . . . . . . . . . . . . . . . 762DTinterval2string . . . . . . . . . . . . . . . . . . . . . . . . . . . . . . . . 762DTinterval2stringAsTime . . . . . . . . . . . . . . . . . . . . . . . . . . . . . 763exp . . . . . . . . . . . . . . . . . . . . . . . . . . . . . . . . . . . . . 763extract . . . . . . . . . . . . . . . . . . . . . . . . . . . . . . . . . . . . 763floor . . . . . . . . . . . . . . . . . . . . . . . . . . . . . . . . . . . . 763int2DTinterval . . . . . . . . . . . . . . . . . . . . . . . . . . . . . . . . . 764int2YMinterval . . . . . . . . . . . . . . . . . . . . . . . . . . . . . . . . . 764ln . . . . . . . . . . . . . . . . . . . . . . . . . . . . . . . . . . . . . 764lower . . . . . . . . . . . . . . . . . . . . . . . . . . . . . . . . . . . . 764mapNumberToLetter . . . . . . . . . . . . . . . . . . . . . . . . . . . . . . . 764mod . . . . . . . . . . . . . . . . . . . . . . . . . . . . . . . . . . . . 765nullif . . . . . . . . . . . . . . . . . . . . . . . . . . . . . . . . . . . . 765number2string . . . . . . . . . . . . . . . . . . . . . . . . . . . . . . . . . 765octet_length . . . . . . . . . . . . . . . . . . . . . . . . . . . . . . . . . . 765position . . . . . . . . . . . . . . . . . . . . . . . . . . . . . . . . . . . 765power . . . . . . . . . . . . . . . . . . . . . . . . . . . . . . . . . . . . 765round . . . . . . . . . . . . . . . . . . . . . . . . . . . . . . . . . . . . 766sqrt. . . . . . . . . . . . . . . . . . . . . . . . . . . . . . . . . . . . . 766status . . . . . . . . . . . . . . . . . . . . . . . . . . . . . . . . . . . . 766string2date . . . . . . . . . . . . . . . . . . . . . . . . . . . . . . . . . . 766string2double . . . . . . . . . . . . . . . . . . . . . . . . . . . . . . . . . 766string2DTinterval . . . . . . . . . . . . . . . . . . . . . . . . . . . . . . . . 766string2int32 . . . . . . . . . . . . . . . . . . . . . . . . . . . . . . . . . . 767string2int64 . . . . . . . . . . . . . . . . . . . . . . . . . . . . . . . . . . 767string2time . . . . . . . . . . . . . . . . . . . . . . . . . . . . . . . . . . 767string2timestamp . . . . . . . . . . . . . . . . . . . . . . . . . . . . . . . . 767string2timestampTZ . . . . . . . . . . . . . . . . . . . . . . . . . . . . . . . 767string2YMinterval . . . . . . . . . . . . . . . . . . . . . . . . . . . . . . . . 767substring . . . . . . . . . . . . . . . . . . . . . . . . . . . . . . . . . . . 767time2string . . . . . . . . . . . . . . . . . . . . . . . . . . . . . . . . . . 768timestamp2date . . . . . . . . . . . . . . . . . . . . . . . . . . . . . . . . 768timestamp2string . . . . . . . . . . . . . . . . . . . . . . . . . . . . . . . . 768timestamp2timestampTZ . . . . . . . . . . . . . . . . . . . . . . . . . . . . . 768timestampTZ2date. . . . . . . . . . . . . . . . . . . . . . . . . . . . . . . . 768timestampTZ2string . . . . . . . . . . . . . . . . . . . . . . . . . . . . . . . 768
xxviii IBM Cognos Report Studio Version 10.2.1: User Guide

timestampTZ2timestamp . . . . . . . . . . . . . . . . . . . . . . . . . . . . . 768timeTZ2string . . . . . . . . . . . . . . . . . . . . . . . . . . . . . . . . . 769trim . . . . . . . . . . . . . . . . . . . . . . . . . . . . . . . . . . . . 769upper . . . . . . . . . . . . . . . . . . . . . . . . . . . . . . . . . . . . 769YMinterval2string . . . . . . . . . . . . . . . . . . . . . . . . . . . . . . . . 769
Appendix G. Report Studio Object and Property Reference . . . . . . . . . . . . 771Report Studio Objects . . . . . . . . . . . . . . . . . . . . . . . . . . . . . . . 771
3-D Area . . . . . . . . . . . . . . . . . . . . . . . . . . . . . . . . . . . 7713-D Bar . . . . . . . . . . . . . . . . . . . . . . . . . . . . . . . . . . . 7713-D Combination Chart . . . . . . . . . . . . . . . . . . . . . . . . . . . . . . 7723-D Line . . . . . . . . . . . . . . . . . . . . . . . . . . . . . . . . . . . 7723-D Scatter Chart . . . . . . . . . . . . . . . . . . . . . . . . . . . . . . . . 772Angular Axis . . . . . . . . . . . . . . . . . . . . . . . . . . . . . . . . . 773Angular Measure . . . . . . . . . . . . . . . . . . . . . . . . . . . . . . . . 773Area . . . . . . . . . . . . . . . . . . . . . . . . . . . . . . . . . . . . 773Area . . . . . . . . . . . . . . . . . . . . . . . . . . . . . . . . . . . . 773As of Time Expression . . . . . . . . . . . . . . . . . . . . . . . . . . . . . . 773Axis Labels . . . . . . . . . . . . . . . . . . . . . . . . . . . . . . . . . . 774Axis Title . . . . . . . . . . . . . . . . . . . . . . . . . . . . . . . . . . . 774Axis Title . . . . . . . . . . . . . . . . . . . . . . . . . . . . . . . . . . . 774Bar . . . . . . . . . . . . . . . . . . . . . . . . . . . . . . . . . . . . . 774Bar . . . . . . . . . . . . . . . . . . . . . . . . . . . . . . . . . . . . . 774Baseline . . . . . . . . . . . . . . . . . . . . . . . . . . . . . . . . . . . 775Baseline . . . . . . . . . . . . . . . . . . . . . . . . . . . . . . . . . . . 775Baseline . . . . . . . . . . . . . . . . . . . . . . . . . . . . . . . . . . . 775Baseline . . . . . . . . . . . . . . . . . . . . . . . . . . . . . . . . . . . 775Block . . . . . . . . . . . . . . . . . . . . . . . . . . . . . . . . . . . . 776Bookmark . . . . . . . . . . . . . . . . . . . . . . . . . . . . . . . . . . 776Bubble Chart . . . . . . . . . . . . . . . . . . . . . . . . . . . . . . . . . 776Bubble Chart . . . . . . . . . . . . . . . . . . . . . . . . . . . . . . . . . 777Bubble Measure . . . . . . . . . . . . . . . . . . . . . . . . . . . . . . . . 777Bubble Measure . . . . . . . . . . . . . . . . . . . . . . . . . . . . . . . . 777Bullet Chart . . . . . . . . . . . . . . . . . . . . . . . . . . . . . . . . . . 777Bullet Measure . . . . . . . . . . . . . . . . . . . . . . . . . . . . . . . . . 778Button. . . . . . . . . . . . . . . . . . . . . . . . . . . . . . . . . . . . 778Button. . . . . . . . . . . . . . . . . . . . . . . . . . . . . . . . . . . . 778Button Bar . . . . . . . . . . . . . . . . . . . . . . . . . . . . . . . . . . 778Button Extra Item . . . . . . . . . . . . . . . . . . . . . . . . . . . . . . . . 779Button Icon . . . . . . . . . . . . . . . . . . . . . . . . . . . . . . . . . . 779Button Label . . . . . . . . . . . . . . . . . . . . . . . . . . . . . . . . . 779Calculated Measure . . . . . . . . . . . . . . . . . . . . . . . . . . . . . . . 779Calculated Member . . . . . . . . . . . . . . . . . . . . . . . . . . . . . . . 779Calculated Member . . . . . . . . . . . . . . . . . . . . . . . . . . . . . . . 779Caption . . . . . . . . . . . . . . . . . . . . . . . . . . . . . . . . . . . 779Card . . . . . . . . . . . . . . . . . . . . . . . . . . . . . . . . . . . . 780Card Extra Item . . . . . . . . . . . . . . . . . . . . . . . . . . . . . . . . 780Card Label . . . . . . . . . . . . . . . . . . . . . . . . . . . . . . . . . . 780Category . . . . . . . . . . . . . . . . . . . . . . . . . . . . . . . . . . . 780Category Axis . . . . . . . . . . . . . . . . . . . . . . . . . . . . . . . . . 780Category axis . . . . . . . . . . . . . . . . . . . . . . . . . . . . . . . . . 780Category Baseline . . . . . . . . . . . . . . . . . . . . . . . . . . . . . . . . 781Chart Body . . . . . . . . . . . . . . . . . . . . . . . . . . . . . . . . . . 781Chart Body . . . . . . . . . . . . . . . . . . . . . . . . . . . . . . . . . . 781Chart Footer. . . . . . . . . . . . . . . . . . . . . . . . . . . . . . . . . . 781Chart Footer. . . . . . . . . . . . . . . . . . . . . . . . . . . . . . . . . . 781Chart Measure . . . . . . . . . . . . . . . . . . . . . . . . . . . . . . . . . 782Chart Node Member . . . . . . . . . . . . . . . . . . . . . . . . . . . . . . . 782Chart Subtitle . . . . . . . . . . . . . . . . . . . . . . . . . . . . . . . . . 782Chart Subtitle . . . . . . . . . . . . . . . . . . . . . . . . . . . . . . . . . 782Chart Text Item. . . . . . . . . . . . . . . . . . . . . . . . . . . . . . . . . 782
Contents xxix

Chart Text Item. . . . . . . . . . . . . . . . . . . . . . . . . . . . . . . . . 783Chart Title . . . . . . . . . . . . . . . . . . . . . . . . . . . . . . . . . . 783Chart Title . . . . . . . . . . . . . . . . . . . . . . . . . . . . . . . . . . 783Check Box . . . . . . . . . . . . . . . . . . . . . . . . . . . . . . . . . . 783Check Box Extra Item . . . . . . . . . . . . . . . . . . . . . . . . . . . . . . 784Check Box Group . . . . . . . . . . . . . . . . . . . . . . . . . . . . . . . . 784Check Box Icon. . . . . . . . . . . . . . . . . . . . . . . . . . . . . . . . . 784Check Box Label . . . . . . . . . . . . . . . . . . . . . . . . . . . . . . . . 784Class . . . . . . . . . . . . . . . . . . . . . . . . . . . . . . . . . . . . 784Color by Value Measure . . . . . . . . . . . . . . . . . . . . . . . . . . . . . . 785Colored Region. . . . . . . . . . . . . . . . . . . . . . . . . . . . . . . . . 785Colored Region. . . . . . . . . . . . . . . . . . . . . . . . . . . . . . . . . 785Combination Chart . . . . . . . . . . . . . . . . . . . . . . . . . . . . . . . 785Combination Chart . . . . . . . . . . . . . . . . . . . . . . . . . . . . . . . 786Component Override . . . . . . . . . . . . . . . . . . . . . . . . . . . . . . . 786Conditional Block . . . . . . . . . . . . . . . . . . . . . . . . . . . . . . . . 787Conditional Block . . . . . . . . . . . . . . . . . . . . . . . . . . . . . . . . 787Context Item Text . . . . . . . . . . . . . . . . . . . . . . . . . . . . . . . . 787Continuous Values Slider . . . . . . . . . . . . . . . . . . . . . . . . . . . . . 787Crosstab . . . . . . . . . . . . . . . . . . . . . . . . . . . . . . . . . . . 788Crosstab Columns . . . . . . . . . . . . . . . . . . . . . . . . . . . . . . . . 788Crosstab Columns . . . . . . . . . . . . . . . . . . . . . . . . . . . . . . . . 788Crosstab Corner . . . . . . . . . . . . . . . . . . . . . . . . . . . . . . . . 789Crosstab Fact Cells . . . . . . . . . . . . . . . . . . . . . . . . . . . . . . . 789Crosstab Intersection . . . . . . . . . . . . . . . . . . . . . . . . . . . . . . . 789Crosstab Member Fact Cells . . . . . . . . . . . . . . . . . . . . . . . . . . . . 790Crosstab Node Member . . . . . . . . . . . . . . . . . . . . . . . . . . . . . . 790Crosstab Rows . . . . . . . . . . . . . . . . . . . . . . . . . . . . . . . . . 790Crosstab Rows . . . . . . . . . . . . . . . . . . . . . . . . . . . . . . . . . 791Crosstab Space . . . . . . . . . . . . . . . . . . . . . . . . . . . . . . . . . 791Crosstab Summary . . . . . . . . . . . . . . . . . . . . . . . . . . . . . . . 791Cumulation Label . . . . . . . . . . . . . . . . . . . . . . . . . . . . . . . . 792Cumulation Line . . . . . . . . . . . . . . . . . . . . . . . . . . . . . . . . 792Cumulation Line . . . . . . . . . . . . . . . . . . . . . . . . . . . . . . . . 792Cumulation Line . . . . . . . . . . . . . . . . . . . . . . . . . . . . . . . . 792Cumulation Line Axis . . . . . . . . . . . . . . . . . . . . . . . . . . . . . . 792Cumulation Line Label . . . . . . . . . . . . . . . . . . . . . . . . . . . . . . 792Custom Groups . . . . . . . . . . . . . . . . . . . . . . . . . . . . . . . . 793Data Button Bar . . . . . . . . . . . . . . . . . . . . . . . . . . . . . . . . 793Data Check Box Group . . . . . . . . . . . . . . . . . . . . . . . . . . . . . . 793Data Container . . . . . . . . . . . . . . . . . . . . . . . . . . . . . . . . . 793Data Deck . . . . . . . . . . . . . . . . . . . . . . . . . . . . . . . . . . 794Data Discrete Values Slider . . . . . . . . . . . . . . . . . . . . . . . . . . . . . 794Data Drop-Down List . . . . . . . . . . . . . . . . . . . . . . . . . . . . . . 794Data Item . . . . . . . . . . . . . . . . . . . . . . . . . . . . . . . . . . 795Data Iterator. . . . . . . . . . . . . . . . . . . . . . . . . . . . . . . . . . 795Data List Box . . . . . . . . . . . . . . . . . . . . . . . . . . . . . . . . . 795Data Radio Button Group . . . . . . . . . . . . . . . . . . . . . . . . . . . . . 795Data Tab Control . . . . . . . . . . . . . . . . . . . . . . . . . . . . . . . . 796Data Toggle Button Bar . . . . . . . . . . . . . . . . . . . . . . . . . . . . . . 796Date . . . . . . . . . . . . . . . . . . . . . . . . . . . . . . . . . . . . 796Date & Time Prompt . . . . . . . . . . . . . . . . . . . . . . . . . . . . . . . 796Date Prompt. . . . . . . . . . . . . . . . . . . . . . . . . . . . . . . . . . 797Deck . . . . . . . . . . . . . . . . . . . . . . . . . . . . . . . . . . . . 797Default Measure . . . . . . . . . . . . . . . . . . . . . . . . . . . . . . . . 797Default Measure . . . . . . . . . . . . . . . . . . . . . . . . . . . . . . . . 797Default Measure . . . . . . . . . . . . . . . . . . . . . . . . . . . . . . . . 797Detail Filter . . . . . . . . . . . . . . . . . . . . . . . . . . . . . . . . . . 798Dimension . . . . . . . . . . . . . . . . . . . . . . . . . . . . . . . . . . 798Dimensional Edge Summary . . . . . . . . . . . . . . . . . . . . . . . . . . . . 798Discrete Values Slider . . . . . . . . . . . . . . . . . . . . . . . . . . . . . . 798
xxx IBM Cognos Report Studio Version 10.2.1: User Guide

Display Layer . . . . . . . . . . . . . . . . . . . . . . . . . . . . . . . . . 798Drop-Down List . . . . . . . . . . . . . . . . . . . . . . . . . . . . . . . . 799Edge Summary . . . . . . . . . . . . . . . . . . . . . . . . . . . . . . . . . 799Equation Label . . . . . . . . . . . . . . . . . . . . . . . . . . . . . . . . . 799Equation Label . . . . . . . . . . . . . . . . . . . . . . . . . . . . . . . . . 799Explicit Member Set . . . . . . . . . . . . . . . . . . . . . . . . . . . . . . . 799Extra Category . . . . . . . . . . . . . . . . . . . . . . . . . . . . . . . . . 799Extra Value . . . . . . . . . . . . . . . . . . . . . . . . . . . . . . . . . . 800Fact . . . . . . . . . . . . . . . . . . . . . . . . . . . . . . . . . . . . 800Field Set . . . . . . . . . . . . . . . . . . . . . . . . . . . . . . . . . . . 800Gauge Axis . . . . . . . . . . . . . . . . . . . . . . . . . . . . . . . . . . 800Gauge Chart. . . . . . . . . . . . . . . . . . . . . . . . . . . . . . . . . . 800Gauge Chart. . . . . . . . . . . . . . . . . . . . . . . . . . . . . . . . . . 801Gauge Labels . . . . . . . . . . . . . . . . . . . . . . . . . . . . . . . . . 801Gauge Numerical Axis . . . . . . . . . . . . . . . . . . . . . . . . . . . . . . 801Generated Prompt . . . . . . . . . . . . . . . . . . . . . . . . . . . . . . . . 802Hierarchy Set . . . . . . . . . . . . . . . . . . . . . . . . . . . . . . . . . 802HTML Item . . . . . . . . . . . . . . . . . . . . . . . . . . . . . . . . . . 802Hyperlink . . . . . . . . . . . . . . . . . . . . . . . . . . . . . . . . . . 802Hyperlink Button . . . . . . . . . . . . . . . . . . . . . . . . . . . . . . . . 803Image . . . . . . . . . . . . . . . . . . . . . . . . . . . . . . . . . . . . 803Intersection (Tuple) . . . . . . . . . . . . . . . . . . . . . . . . . . . . . . . 804Interval Prompt . . . . . . . . . . . . . . . . . . . . . . . . . . . . . . . . 804Iterator . . . . . . . . . . . . . . . . . . . . . . . . . . . . . . . . . . . 804Iterator Extra Item. . . . . . . . . . . . . . . . . . . . . . . . . . . . . . . . 804Iterator First . . . . . . . . . . . . . . . . . . . . . . . . . . . . . . . . . . 805Iterator Label Area . . . . . . . . . . . . . . . . . . . . . . . . . . . . . . . 805Iterator Last . . . . . . . . . . . . . . . . . . . . . . . . . . . . . . . . . . 805Iterator Next . . . . . . . . . . . . . . . . . . . . . . . . . . . . . . . . . 805Iterator Previous . . . . . . . . . . . . . . . . . . . . . . . . . . . . . . . . 805Iterator Value Icon. . . . . . . . . . . . . . . . . . . . . . . . . . . . . . . . 805Iterator Value Label . . . . . . . . . . . . . . . . . . . . . . . . . . . . . . . 805Join . . . . . . . . . . . . . . . . . . . . . . . . . . . . . . . . . . . . 806Key . . . . . . . . . . . . . . . . . . . . . . . . . . . . . . . . . . . . 806Label . . . . . . . . . . . . . . . . . . . . . . . . . . . . . . . . . . . . 806Layout Component Reference . . . . . . . . . . . . . . . . . . . . . . . . . . . . 806Legend . . . . . . . . . . . . . . . . . . . . . . . . . . . . . . . . . . . 806Legend . . . . . . . . . . . . . . . . . . . . . . . . . . . . . . . . . . . 807Legend Title . . . . . . . . . . . . . . . . . . . . . . . . . . . . . . . . . . 807Legend Title . . . . . . . . . . . . . . . . . . . . . . . . . . . . . . . . . . 807Level . . . . . . . . . . . . . . . . . . . . . . . . . . . . . . . . . . . . 807Level Hierarchy . . . . . . . . . . . . . . . . . . . . . . . . . . . . . . . . 807Level Set . . . . . . . . . . . . . . . . . . . . . . . . . . . . . . . . . . . 808Line . . . . . . . . . . . . . . . . . . . . . . . . . . . . . . . . . . . . 808Line . . . . . . . . . . . . . . . . . . . . . . . . . . . . . . . . . . . . 808List . . . . . . . . . . . . . . . . . . . . . . . . . . . . . . . . . . . . . 808List Box . . . . . . . . . . . . . . . . . . . . . . . . . . . . . . . . . . . 809List Cell . . . . . . . . . . . . . . . . . . . . . . . . . . . . . . . . . . . 809List Column . . . . . . . . . . . . . . . . . . . . . . . . . . . . . . . . . . 809List Column Body . . . . . . . . . . . . . . . . . . . . . . . . . . . . . . . . 810List Columns . . . . . . . . . . . . . . . . . . . . . . . . . . . . . . . . . 810List Columns . . . . . . . . . . . . . . . . . . . . . . . . . . . . . . . . . 810List Columns Body Style . . . . . . . . . . . . . . . . . . . . . . . . . . . . . 811List Columns Title Style . . . . . . . . . . . . . . . . . . . . . . . . . . . . . . 811List Column Title . . . . . . . . . . . . . . . . . . . . . . . . . . . . . . . . 811List Footer . . . . . . . . . . . . . . . . . . . . . . . . . . . . . . . . . . 811List Header . . . . . . . . . . . . . . . . . . . . . . . . . . . . . . . . . . 812List Item . . . . . . . . . . . . . . . . . . . . . . . . . . . . . . . . . . . 812List Item Extra Item . . . . . . . . . . . . . . . . . . . . . . . . . . . . . . . 812List Item Icon . . . . . . . . . . . . . . . . . . . . . . . . . . . . . . . . . 812List Item Label . . . . . . . . . . . . . . . . . . . . . . . . . . . . . . . . . 812
Contents xxxi

List Page Footer . . . . . . . . . . . . . . . . . . . . . . . . . . . . . . . . 813List Page Header . . . . . . . . . . . . . . . . . . . . . . . . . . . . . . . . 813List Row . . . . . . . . . . . . . . . . . . . . . . . . . . . . . . . . . . . 813List Row Cells Style . . . . . . . . . . . . . . . . . . . . . . . . . . . . . . . 813List Summary . . . . . . . . . . . . . . . . . . . . . . . . . . . . . . . . . 813List Summary . . . . . . . . . . . . . . . . . . . . . . . . . . . . . . . . . 814Map . . . . . . . . . . . . . . . . . . . . . . . . . . . . . . . . . . . . 814Map Location . . . . . . . . . . . . . . . . . . . . . . . . . . . . . . . . . 814Map Location . . . . . . . . . . . . . . . . . . . . . . . . . . . . . . . . . 815Map Refinement Location . . . . . . . . . . . . . . . . . . . . . . . . . . . . . 815Map Refinement Location . . . . . . . . . . . . . . . . . . . . . . . . . . . . . 815Marimekko Chart . . . . . . . . . . . . . . . . . . . . . . . . . . . . . . . . 815Marker . . . . . . . . . . . . . . . . . . . . . . . . . . . . . . . . . . . 816Marker . . . . . . . . . . . . . . . . . . . . . . . . . . . . . . . . . . . 816Marker . . . . . . . . . . . . . . . . . . . . . . . . . . . . . . . . . . . 816MDX . . . . . . . . . . . . . . . . . . . . . . . . . . . . . . . . . . . . 817Measure . . . . . . . . . . . . . . . . . . . . . . . . . . . . . . . . . . . 817Member . . . . . . . . . . . . . . . . . . . . . . . . . . . . . . . . . . . 817Member Children Set . . . . . . . . . . . . . . . . . . . . . . . . . . . . . . . 817Member Hierarchy . . . . . . . . . . . . . . . . . . . . . . . . . . . . . . . 817Member Property . . . . . . . . . . . . . . . . . . . . . . . . . . . . . . . . 817Member Property . . . . . . . . . . . . . . . . . . . . . . . . . . . . . . . . 818Member Set . . . . . . . . . . . . . . . . . . . . . . . . . . . . . . . . . . 818Metrics Range Chart . . . . . . . . . . . . . . . . . . . . . . . . . . . . . . . 818Metric Studio Diagram . . . . . . . . . . . . . . . . . . . . . . . . . . . . . . 818Named Set . . . . . . . . . . . . . . . . . . . . . . . . . . . . . . . . . . 819Node . . . . . . . . . . . . . . . . . . . . . . . . . . . . . . . . . . . . 819Note . . . . . . . . . . . . . . . . . . . . . . . . . . . . . . . . . . . . 819Note . . . . . . . . . . . . . . . . . . . . . . . . . . . . . . . . . . . . 819Note Content . . . . . . . . . . . . . . . . . . . . . . . . . . . . . . . . . 819No Value List Item . . . . . . . . . . . . . . . . . . . . . . . . . . . . . . . 819Numerical Axis. . . . . . . . . . . . . . . . . . . . . . . . . . . . . . . . . 820Numerical Axis. . . . . . . . . . . . . . . . . . . . . . . . . . . . . . . . . 820Numeric Axis . . . . . . . . . . . . . . . . . . . . . . . . . . . . . . . . . 820Numeric Baseline . . . . . . . . . . . . . . . . . . . . . . . . . . . . . . . . 820Page . . . . . . . . . . . . . . . . . . . . . . . . . . . . . . . . . . . . 821Page Body . . . . . . . . . . . . . . . . . . . . . . . . . . . . . . . . . . 821Page Break Text . . . . . . . . . . . . . . . . . . . . . . . . . . . . . . . . 821Page Footer . . . . . . . . . . . . . . . . . . . . . . . . . . . . . . . . . . 821Page Header . . . . . . . . . . . . . . . . . . . . . . . . . . . . . . . . . 821Page Number . . . . . . . . . . . . . . . . . . . . . . . . . . . . . . . . . 821Page Set . . . . . . . . . . . . . . . . . . . . . . . . . . . . . . . . . . . 822Pareto Bars . . . . . . . . . . . . . . . . . . . . . . . . . . . . . . . . . . 822Pareto Chart. . . . . . . . . . . . . . . . . . . . . . . . . . . . . . . . . . 822Pareto Chart. . . . . . . . . . . . . . . . . . . . . . . . . . . . . . . . . . 823Percentaged Measure . . . . . . . . . . . . . . . . . . . . . . . . . . . . . . . 823Pie Chart . . . . . . . . . . . . . . . . . . . . . . . . . . . . . . . . . . . 823Pie Chart . . . . . . . . . . . . . . . . . . . . . . . . . . . . . . . . . . . 824Pie Labels . . . . . . . . . . . . . . . . . . . . . . . . . . . . . . . . . . 824Point Color Legend Title . . . . . . . . . . . . . . . . . . . . . . . . . . . . . 824Point Layer . . . . . . . . . . . . . . . . . . . . . . . . . . . . . . . . . . 825Point Measure . . . . . . . . . . . . . . . . . . . . . . . . . . . . . . . . . 825Point Size Legend Title . . . . . . . . . . . . . . . . . . . . . . . . . . . . . . 825Point Size Measure . . . . . . . . . . . . . . . . . . . . . . . . . . . . . . . 825Polar Chart . . . . . . . . . . . . . . . . . . . . . . . . . . . . . . . . . . 825Primary Axis . . . . . . . . . . . . . . . . . . . . . . . . . . . . . . . . . 826Primary Bottom Axis . . . . . . . . . . . . . . . . . . . . . . . . . . . . . . . 826Progressive Chart . . . . . . . . . . . . . . . . . . . . . . . . . . . . . . . . 826Progressive Chart . . . . . . . . . . . . . . . . . . . . . . . . . . . . . . . . 827Prompt Button . . . . . . . . . . . . . . . . . . . . . . . . . . . . . . . . . 827Query . . . . . . . . . . . . . . . . . . . . . . . . . . . . . . . . . . . . 828
xxxii IBM Cognos Report Studio Version 10.2.1: User Guide

Query Operation . . . . . . . . . . . . . . . . . . . . . . . . . . . . . . . . 828Query Reference . . . . . . . . . . . . . . . . . . . . . . . . . . . . . . . . 828Radar Chart . . . . . . . . . . . . . . . . . . . . . . . . . . . . . . . . . . 828Radial Axis . . . . . . . . . . . . . . . . . . . . . . . . . . . . . . . . . . 829Radial Measure. . . . . . . . . . . . . . . . . . . . . . . . . . . . . . . . . 829Radio Button . . . . . . . . . . . . . . . . . . . . . . . . . . . . . . . . . 829Radio Button Extra Item. . . . . . . . . . . . . . . . . . . . . . . . . . . . . . 829Radio Button Group . . . . . . . . . . . . . . . . . . . . . . . . . . . . . . . 829Radio Button Icon . . . . . . . . . . . . . . . . . . . . . . . . . . . . . . . . 830Radio Button Label . . . . . . . . . . . . . . . . . . . . . . . . . . . . . . . 830Region Color Legend Title . . . . . . . . . . . . . . . . . . . . . . . . . . . . . 830Region Layer . . . . . . . . . . . . . . . . . . . . . . . . . . . . . . . . . 830Region Measure . . . . . . . . . . . . . . . . . . . . . . . . . . . . . . . . 830Regression Line . . . . . . . . . . . . . . . . . . . . . . . . . . . . . . . . 831Regression Line Label . . . . . . . . . . . . . . . . . . . . . . . . . . . . . . 831Repeater . . . . . . . . . . . . . . . . . . . . . . . . . . . . . . . . . . . 831Repeater Table . . . . . . . . . . . . . . . . . . . . . . . . . . . . . . . . . 831Repeater Table Cell . . . . . . . . . . . . . . . . . . . . . . . . . . . . . . . 831Repeater Table Cell . . . . . . . . . . . . . . . . . . . . . . . . . . . . . . . 832Rich Text Item . . . . . . . . . . . . . . . . . . . . . . . . . . . . . . . . . 832Row Number . . . . . . . . . . . . . . . . . . . . . . . . . . . . . . . . . 832Row Number . . . . . . . . . . . . . . . . . . . . . . . . . . . . . . . . . 832Scatter Chart . . . . . . . . . . . . . . . . . . . . . . . . . . . . . . . . . 833Scatter Chart . . . . . . . . . . . . . . . . . . . . . . . . . . . . . . . . . 833Scatter Marker . . . . . . . . . . . . . . . . . . . . . . . . . . . . . . . . . 834Secondary Axis . . . . . . . . . . . . . . . . . . . . . . . . . . . . . . . . . 834Secondary Bottom Axis . . . . . . . . . . . . . . . . . . . . . . . . . . . . . . 834Select & Search Prompt . . . . . . . . . . . . . . . . . . . . . . . . . . . . . . 834Set Expression . . . . . . . . . . . . . . . . . . . . . . . . . . . . . . . . . 835Singleton . . . . . . . . . . . . . . . . . . . . . . . . . . . . . . . . . . . 835Slicer Member Set . . . . . . . . . . . . . . . . . . . . . . . . . . . . . . . . 835SQL . . . . . . . . . . . . . . . . . . . . . . . . . . . . . . . . . . . . 835Static Repeater Table . . . . . . . . . . . . . . . . . . . . . . . . . . . . . . . 835Summary Filter. . . . . . . . . . . . . . . . . . . . . . . . . . . . . . . . . 836Tab . . . . . . . . . . . . . . . . . . . . . . . . . . . . . . . . . . . . . 836Tab Control . . . . . . . . . . . . . . . . . . . . . . . . . . . . . . . . . . 836Tab Extra Item . . . . . . . . . . . . . . . . . . . . . . . . . . . . . . . . . 836Tab Icon . . . . . . . . . . . . . . . . . . . . . . . . . . . . . . . . . . . 837Tab Label. . . . . . . . . . . . . . . . . . . . . . . . . . . . . . . . . . . 837Table . . . . . . . . . . . . . . . . . . . . . . . . . . . . . . . . . . . . 837Table Cell . . . . . . . . . . . . . . . . . . . . . . . . . . . . . . . . . . 837Table of Contents . . . . . . . . . . . . . . . . . . . . . . . . . . . . . . . . 837Table of Contents Entry . . . . . . . . . . . . . . . . . . . . . . . . . . . . . . 838Table Row . . . . . . . . . . . . . . . . . . . . . . . . . . . . . . . . . . 838Target Measure . . . . . . . . . . . . . . . . . . . . . . . . . . . . . . . . . 838Target Measure . . . . . . . . . . . . . . . . . . . . . . . . . . . . . . . . . 838Text Box Prompt . . . . . . . . . . . . . . . . . . . . . . . . . . . . . . . . 838Text Item . . . . . . . . . . . . . . . . . . . . . . . . . . . . . . . . . . . 839Time . . . . . . . . . . . . . . . . . . . . . . . . . . . . . . . . . . . . 839Time Prompt . . . . . . . . . . . . . . . . . . . . . . . . . . . . . . . . . 839Toggle Button Bar . . . . . . . . . . . . . . . . . . . . . . . . . . . . . . . . 840Tolerance Measure. . . . . . . . . . . . . . . . . . . . . . . . . . . . . . . . 840Total Column . . . . . . . . . . . . . . . . . . . . . . . . . . . . . . . . . 840Total Column Label . . . . . . . . . . . . . . . . . . . . . . . . . . . . . . . 840Tree Prompt . . . . . . . . . . . . . . . . . . . . . . . . . . . . . . . . . . 840Trendline . . . . . . . . . . . . . . . . . . . . . . . . . . . . . . . . . . . 841Trendline Label . . . . . . . . . . . . . . . . . . . . . . . . . . . . . . . . . 841Value . . . . . . . . . . . . . . . . . . . . . . . . . . . . . . . . . . . . 841Value . . . . . . . . . . . . . . . . . . . . . . . . . . . . . . . . . . . . 841Value . . . . . . . . . . . . . . . . . . . . . . . . . . . . . . . . . . . . 841Value Prompt . . . . . . . . . . . . . . . . . . . . . . . . . . . . . . . . . 841
Contents xxxiii
Variable . . . . . . . . . . . . . . . . . . . . . . . . . . . . . . . . . . . 842Variable Text Item . . . . . . . . . . . . . . . . . . . . . . . . . . . . . . . . 842Visualization . . . . . . . . . . . . . . . . . . . . . . . . . . . . . . . . . 842Win-Loss Chart. . . . . . . . . . . . . . . . . . . . . . . . . . . . . . . . . 842Win-Loss Measure . . . . . . . . . . . . . . . . . . . . . . . . . . . . . . . . 843X Axis . . . . . . . . . . . . . . . . . . . . . . . . . . . . . . . . . . . . 843X Axis . . . . . . . . . . . . . . . . . . . . . . . . . . . . . . . . . . . . 843X Axis . . . . . . . . . . . . . . . . . . . . . . . . . . . . . . . . . . . . 843X Axis Measure . . . . . . . . . . . . . . . . . . . . . . . . . . . . . . . . 844Y1 Axis . . . . . . . . . . . . . . . . . . . . . . . . . . . . . . . . . . . 844Y2 Axis . . . . . . . . . . . . . . . . . . . . . . . . . . . . . . . . . . . 844Y Axis . . . . . . . . . . . . . . . . . . . . . . . . . . . . . . . . . . . . 844Y Axis . . . . . . . . . . . . . . . . . . . . . . . . . . . . . . . . . . . . 844Y Axis . . . . . . . . . . . . . . . . . . . . . . . . . . . . . . . . . . . . 845Y Axis Measure . . . . . . . . . . . . . . . . . . . . . . . . . . . . . . . . 845Z Axis . . . . . . . . . . . . . . . . . . . . . . . . . . . . . . . . . . . . 845Z Axis . . . . . . . . . . . . . . . . . . . . . . . . . . . . . . . . . . . . 845Z Axis Measure . . . . . . . . . . . . . . . . . . . . . . . . . . . . . . . . 845
Report Studio Properties . . . . . . . . . . . . . . . . . . . . . . . . . . . . . . 8463-D Viewing Angle . . . . . . . . . . . . . . . . . . . . . . . . . . . . . . . 846Absolute Position . . . . . . . . . . . . . . . . . . . . . . . . . . . . . . . . 846Across. . . . . . . . . . . . . . . . . . . . . . . . . . . . . . . . . . . . 846Active Dot Color . . . . . . . . . . . . . . . . . . . . . . . . . . . . . . . . 846Active Report Variable . . . . . . . . . . . . . . . . . . . . . . . . . . . . . . 846Actual Measure. . . . . . . . . . . . . . . . . . . . . . . . . . . . . . . . . 846Aggregate Data Item . . . . . . . . . . . . . . . . . . . . . . . . . . . . . . . 847Aggregate Function . . . . . . . . . . . . . . . . . . . . . . . . . . . . . . . 847Aggregation Method . . . . . . . . . . . . . . . . . . . . . . . . . . . . . . . 847Aggregation Method . . . . . . . . . . . . . . . . . . . . . . . . . . . . . . . 847Allow 45° Rotation . . . . . . . . . . . . . . . . . . . . . . . . . . . . . . . 847Allow 90° Rotation . . . . . . . . . . . . . . . . . . . . . . . . . . . . . . . 848Allow Skip . . . . . . . . . . . . . . . . . . . . . . . . . . . . . . . . . . 848Allow Sorting . . . . . . . . . . . . . . . . . . . . . . . . . . . . . . . . . 848Allow Stagger . . . . . . . . . . . . . . . . . . . . . . . . . . . . . . . . . 848Allow Ties . . . . . . . . . . . . . . . . . . . . . . . . . . . . . . . . . . 848Alternate Text . . . . . . . . . . . . . . . . . . . . . . . . . . . . . . . . . 848Angular Axis . . . . . . . . . . . . . . . . . . . . . . . . . . . . . . . . . 849Animate . . . . . . . . . . . . . . . . . . . . . . . . . . . . . . . . . . . 849Animation Effect . . . . . . . . . . . . . . . . . . . . . . . . . . . . . . . . 849Application . . . . . . . . . . . . . . . . . . . . . . . . . . . . . . . . . . 849Application Drill-Through . . . . . . . . . . . . . . . . . . . . . . . . . . . . . 849Apply Single Class . . . . . . . . . . . . . . . . . . . . . . . . . . . . . . . 850Area Shape . . . . . . . . . . . . . . . . . . . . . . . . . . . . . . . . . . 850Auto Font Size . . . . . . . . . . . . . . . . . . . . . . . . . . . . . . . . . 850Auto Group & Summarize . . . . . . . . . . . . . . . . . . . . . . . . . . . . . 850Auto-Sort. . . . . . . . . . . . . . . . . . . . . . . . . . . . . . . . . . . 851Auto-Submit . . . . . . . . . . . . . . . . . . . . . . . . . . . . . . . . . 851Auto Truncation . . . . . . . . . . . . . . . . . . . . . . . . . . . . . . . . 851Avoid Division by Zero . . . . . . . . . . . . . . . . . . . . . . . . . . . . . . 851Avoid Label Collision . . . . . . . . . . . . . . . . . . . . . . . . . . . . . . 851Axis Angles . . . . . . . . . . . . . . . . . . . . . . . . . . . . . . . . . . 851Axis Assignment . . . . . . . . . . . . . . . . . . . . . . . . . . . . . . . . 852Axis Assignment . . . . . . . . . . . . . . . . . . . . . . . . . . . . . . . . 852Axis Justification . . . . . . . . . . . . . . . . . . . . . . . . . . . . . . . . 852Axis Labels . . . . . . . . . . . . . . . . . . . . . . . . . . . . . . . . . . 852Axis Labels . . . . . . . . . . . . . . . . . . . . . . . . . . . . . . . . . . 852Axis Line . . . . . . . . . . . . . . . . . . . . . . . . . . . . . . . . . . . 852Axis Line . . . . . . . . . . . . . . . . . . . . . . . . . . . . . . . . . . . 853Axis Line . . . . . . . . . . . . . . . . . . . . . . . . . . . . . . . . . . . 853Axis Range . . . . . . . . . . . . . . . . . . . . . . . . . . . . . . . . . . 853Axis Title . . . . . . . . . . . . . . . . . . . . . . . . . . . . . . . . . . . 853
xxxiv IBM Cognos Report Studio Version 10.2.1: User Guide

Axis Title . . . . . . . . . . . . . . . . . . . . . . . . . . . . . . . . . . . 853Axis Title . . . . . . . . . . . . . . . . . . . . . . . . . . . . . . . . . . . 854Background Color . . . . . . . . . . . . . . . . . . . . . . . . . . . . . . . . 854Background Effects . . . . . . . . . . . . . . . . . . . . . . . . . . . . . . . 855Background Image . . . . . . . . . . . . . . . . . . . . . . . . . . . . . . . 855Bar, Line, or Area Index . . . . . . . . . . . . . . . . . . . . . . . . . . . . . . 856Bar Shape . . . . . . . . . . . . . . . . . . . . . . . . . . . . . . . . . . 856Bar Width . . . . . . . . . . . . . . . . . . . . . . . . . . . . . . . . . . 856Based on . . . . . . . . . . . . . . . . . . . . . . . . . . . . . . . . . . . 856Baselines . . . . . . . . . . . . . . . . . . . . . . . . . . . . . . . . . . . 856Bevel . . . . . . . . . . . . . . . . . . . . . . . . . . . . . . . . . . . . 857Block Variable . . . . . . . . . . . . . . . . . . . . . . . . . . . . . . . . . 857Border. . . . . . . . . . . . . . . . . . . . . . . . . . . . . . . . . . . . 857Border Color . . . . . . . . . . . . . . . . . . . . . . . . . . . . . . . . . 858Border Color . . . . . . . . . . . . . . . . . . . . . . . . . . . . . . . . . 858Borders . . . . . . . . . . . . . . . . . . . . . . . . . . . . . . . . . . . 858Borders . . . . . . . . . . . . . . . . . . . . . . . . . . . . . . . . . . . 858Borders . . . . . . . . . . . . . . . . . . . . . . . . . . . . . . . . . . . 858Bottom Position . . . . . . . . . . . . . . . . . . . . . . . . . . . . . . . . 859Bottom Position (px) . . . . . . . . . . . . . . . . . . . . . . . . . . . . . . . 859Bottom Position (px) . . . . . . . . . . . . . . . . . . . . . . . . . . . . . . . 859Box Type . . . . . . . . . . . . . . . . . . . . . . . . . . . . . . . . . . . 859Box Type . . . . . . . . . . . . . . . . . . . . . . . . . . . . . . . . . . . 860Bubble Size . . . . . . . . . . . . . . . . . . . . . . . . . . . . . . . . . . 860Bubble Size . . . . . . . . . . . . . . . . . . . . . . . . . . . . . . . . . . 860Bullet Indicators . . . . . . . . . . . . . . . . . . . . . . . . . . . . . . . . 860Button Definition . . . . . . . . . . . . . . . . . . . . . . . . . . . . . . . . 861Button Gap . . . . . . . . . . . . . . . . . . . . . . . . . . . . . . . . . . 861Buttons Definition . . . . . . . . . . . . . . . . . . . . . . . . . . . . . . . . 861Button Width . . . . . . . . . . . . . . . . . . . . . . . . . . . . . . . . . 861Button Width . . . . . . . . . . . . . . . . . . . . . . . . . . . . . . . . . 861Calculation Intersection . . . . . . . . . . . . . . . . . . . . . . . . . . . . . . 861Calendar Type . . . . . . . . . . . . . . . . . . . . . . . . . . . . . . . . . 862Caption . . . . . . . . . . . . . . . . . . . . . . . . . . . . . . . . . . . 862Caption . . . . . . . . . . . . . . . . . . . . . . . . . . . . . . . . . . . 862Cardinality . . . . . . . . . . . . . . . . . . . . . . . . . . . . . . . . . . 862Cascade Source . . . . . . . . . . . . . . . . . . . . . . . . . . . . . . . . . 862Case Insensitive . . . . . . . . . . . . . . . . . . . . . . . . . . . . . . . . 862Catalog . . . . . . . . . . . . . . . . . . . . . . . . . . . . . . . . . . . 862Category Axis . . . . . . . . . . . . . . . . . . . . . . . . . . . . . . . . . 863Category Baselines . . . . . . . . . . . . . . . . . . . . . . . . . . . . . . . 863Category Range . . . . . . . . . . . . . . . . . . . . . . . . . . . . . . . . 863Chart Orientation . . . . . . . . . . . . . . . . . . . . . . . . . . . . . . . . 863Chart Type . . . . . . . . . . . . . . . . . . . . . . . . . . . . . . . . . . 863Chart Type . . . . . . . . . . . . . . . . . . . . . . . . . . . . . . . . . . 863Chart Type . . . . . . . . . . . . . . . . . . . . . . . . . . . . . . . . . . 864Check Boxes Definition . . . . . . . . . . . . . . . . . . . . . . . . . . . . . . 864Choices Deselect All Text . . . . . . . . . . . . . . . . . . . . . . . . . . . . . 864Choices Select All Text . . . . . . . . . . . . . . . . . . . . . . . . . . . . . . 864Choices Text . . . . . . . . . . . . . . . . . . . . . . . . . . . . . . . . . . 864Classes . . . . . . . . . . . . . . . . . . . . . . . . . . . . . . . . . . . 865Clickable Region . . . . . . . . . . . . . . . . . . . . . . . . . . . . . . . . 865Clickable Region . . . . . . . . . . . . . . . . . . . . . . . . . . . . . . . . 866Clickable Regions . . . . . . . . . . . . . . . . . . . . . . . . . . . . . . . . 866Clickable Regions . . . . . . . . . . . . . . . . . . . . . . . . . . . . . . . . 866Clock Mode . . . . . . . . . . . . . . . . . . . . . . . . . . . . . . . . . . 866Color by Value . . . . . . . . . . . . . . . . . . . . . . . . . . . . . . . . . 866Colored Regions . . . . . . . . . . . . . . . . . . . . . . . . . . . . . . . . 867Color Legend Title. . . . . . . . . . . . . . . . . . . . . . . . . . . . . . . . 867Color Legend Title. . . . . . . . . . . . . . . . . . . . . . . . . . . . . . . . 867Column Coordinate . . . . . . . . . . . . . . . . . . . . . . . . . . . . . . . 867
Contents xxxv

Column Titles . . . . . . . . . . . . . . . . . . . . . . . . . . . . . . . . . 867Column Visibility . . . . . . . . . . . . . . . . . . . . . . . . . . . . . . . . 867Combinations . . . . . . . . . . . . . . . . . . . . . . . . . . . . . . . . . 868Component Reference . . . . . . . . . . . . . . . . . . . . . . . . . . . . . . 868Component Reference . . . . . . . . . . . . . . . . . . . . . . . . . . . . . . 868Conditional Palette . . . . . . . . . . . . . . . . . . . . . . . . . . . . . . . 868Conditional Palette . . . . . . . . . . . . . . . . . . . . . . . . . . . . . . . 868Conditional Styles . . . . . . . . . . . . . . . . . . . . . . . . . . . . . . . . 868Connecting Lines . . . . . . . . . . . . . . . . . . . . . . . . . . . . . . . . 869Connecting Lines . . . . . . . . . . . . . . . . . . . . . . . . . . . . . . . . 869Contained Text Direction . . . . . . . . . . . . . . . . . . . . . . . . . . . . . 870Container Filter. . . . . . . . . . . . . . . . . . . . . . . . . . . . . . . . . 870Container Select . . . . . . . . . . . . . . . . . . . . . . . . . . . . . . . . 870Contents Height . . . . . . . . . . . . . . . . . . . . . . . . . . . . . . . . 871Control Data Item Value. . . . . . . . . . . . . . . . . . . . . . . . . . . . . . 871Control Data Item Value. . . . . . . . . . . . . . . . . . . . . . . . . . . . . . 871Control Data Item Value. . . . . . . . . . . . . . . . . . . . . . . . . . . . . . 871Control Enable . . . . . . . . . . . . . . . . . . . . . . . . . . . . . . . . . 872Cross Product Allowed . . . . . . . . . . . . . . . . . . . . . . . . . . . . . . 872Cumulation Axis . . . . . . . . . . . . . . . . . . . . . . . . . . . . . . . . 872Cumulation Label . . . . . . . . . . . . . . . . . . . . . . . . . . . . . . . . 872Cumulation Label . . . . . . . . . . . . . . . . . . . . . . . . . . . . . . . . 872Cumulative Line . . . . . . . . . . . . . . . . . . . . . . . . . . . . . . . . 872Cumulative Line . . . . . . . . . . . . . . . . . . . . . . . . . . . . . . . . 873Current Block . . . . . . . . . . . . . . . . . . . . . . . . . . . . . . . . . 873Current Card . . . . . . . . . . . . . . . . . . . . . . . . . . . . . . . . . 873Current Tab . . . . . . . . . . . . . . . . . . . . . . . . . . . . . . . . . . 873Custom Label . . . . . . . . . . . . . . . . . . . . . . . . . . . . . . . . . 873Custom Label . . . . . . . . . . . . . . . . . . . . . . . . . . . . . . . . . 873Data Format . . . . . . . . . . . . . . . . . . . . . . . . . . . . . . . . . . 874Data Format . . . . . . . . . . . . . . . . . . . . . . . . . . . . . . . . . . 874Data Item . . . . . . . . . . . . . . . . . . . . . . . . . . . . . . . . . . 874Data Item . . . . . . . . . . . . . . . . . . . . . . . . . . . . . . . . . . 875Data Item Label . . . . . . . . . . . . . . . . . . . . . . . . . . . . . . . . 875Data Item Label . . . . . . . . . . . . . . . . . . . . . . . . . . . . . . . . 875Data Item Label . . . . . . . . . . . . . . . . . . . . . . . . . . . . . . . . 875Data Item Label . . . . . . . . . . . . . . . . . . . . . . . . . . . . . . . . 875Data Item Value . . . . . . . . . . . . . . . . . . . . . . . . . . . . . . . . 875Data Item Value . . . . . . . . . . . . . . . . . . . . . . . . . . . . . . . . 876Data Item Value . . . . . . . . . . . . . . . . . . . . . . . . . . . . . . . . 876Data Item Value . . . . . . . . . . . . . . . . . . . . . . . . . . . . . . . . 876Data Item Value . . . . . . . . . . . . . . . . . . . . . . . . . . . . . . . . 876Data Item Value . . . . . . . . . . . . . . . . . . . . . . . . . . . . . . . . 876Data Item Value . . . . . . . . . . . . . . . . . . . . . . . . . . . . . . . . 876Data Item Value . . . . . . . . . . . . . . . . . . . . . . . . . . . . . . . . 876Data Language . . . . . . . . . . . . . . . . . . . . . . . . . . . . . . . . . 877Data Points . . . . . . . . . . . . . . . . . . . . . . . . . . . . . . . . . . 877Data Source . . . . . . . . . . . . . . . . . . . . . . . . . . . . . . . . . . 877Days Text . . . . . . . . . . . . . . . . . . . . . . . . . . . . . . . . . . 877Deck Cards Definition . . . . . . . . . . . . . . . . . . . . . . . . . . . . . . 877Default Card . . . . . . . . . . . . . . . . . . . . . . . . . . . . . . . . . 877Default Card . . . . . . . . . . . . . . . . . . . . . . . . . . . . . . . . . 877Default Measure . . . . . . . . . . . . . . . . . . . . . . . . . . . . . . . . 878Default Selections . . . . . . . . . . . . . . . . . . . . . . . . . . . . . . . . 878Default Title . . . . . . . . . . . . . . . . . . . . . . . . . . . . . . . . . . 878Default Title . . . . . . . . . . . . . . . . . . . . . . . . . . . . . . . . . . 878Define Contents . . . . . . . . . . . . . . . . . . . . . . . . . . . . . . . . 878Define Custom Grouping . . . . . . . . . . . . . . . . . . . . . . . . . . . . . 878Define Member Sets . . . . . . . . . . . . . . . . . . . . . . . . . . . . . . . 878Definition . . . . . . . . . . . . . . . . . . . . . . . . . . . . . . . . . . 879Depth . . . . . . . . . . . . . . . . . . . . . . . . . . . . . . . . . . . . 879
xxxvi IBM Cognos Report Studio Version 10.2.1: User Guide

Description . . . . . . . . . . . . . . . . . . . . . . . . . . . . . . . . . . 879Deselect Text . . . . . . . . . . . . . . . . . . . . . . . . . . . . . . . . . 879Detail . . . . . . . . . . . . . . . . . . . . . . . . . . . . . . . . . . . . 879Diagram Identifier. . . . . . . . . . . . . . . . . . . . . . . . . . . . . . . . 880Dial Face Fill . . . . . . . . . . . . . . . . . . . . . . . . . . . . . . . . . 880Dial Outline Color. . . . . . . . . . . . . . . . . . . . . . . . . . . . . . . . 880Dictionary . . . . . . . . . . . . . . . . . . . . . . . . . . . . . . . . . . 880Dimension . . . . . . . . . . . . . . . . . . . . . . . . . . . . . . . . . . 880Direction & Justification . . . . . . . . . . . . . . . . . . . . . . . . . . . . . . 880Display After Overall Header . . . . . . . . . . . . . . . . . . . . . . . . . . . . 881Display for Orientation . . . . . . . . . . . . . . . . . . . . . . . . . . . . . . 881Display Frequency. . . . . . . . . . . . . . . . . . . . . . . . . . . . . . . . 882Display Milliseconds . . . . . . . . . . . . . . . . . . . . . . . . . . . . . . . 882Display Seconds . . . . . . . . . . . . . . . . . . . . . . . . . . . . . . . . 882Display Value . . . . . . . . . . . . . . . . . . . . . . . . . . . . . . . . . 882Display Values . . . . . . . . . . . . . . . . . . . . . . . . . . . . . . . . . 883Dot Color . . . . . . . . . . . . . . . . . . . . . . . . . . . . . . . . . . 883Down . . . . . . . . . . . . . . . . . . . . . . . . . . . . . . . . . . . . 883Drill-Through Definitions . . . . . . . . . . . . . . . . . . . . . . . . . . . . . 883Drop-Down Width . . . . . . . . . . . . . . . . . . . . . . . . . . . . . . . 884Drop Shadow . . . . . . . . . . . . . . . . . . . . . . . . . . . . . . . . . 884Drop Shadow . . . . . . . . . . . . . . . . . . . . . . . . . . . . . . . . . 884Duplicates . . . . . . . . . . . . . . . . . . . . . . . . . . . . . . . . . . 884Embed . . . . . . . . . . . . . . . . . . . . . . . . . . . . . . . . . . . 884End Position. . . . . . . . . . . . . . . . . . . . . . . . . . . . . . . . . . 884Execution Method . . . . . . . . . . . . . . . . . . . . . . . . . . . . . . . . 885Execution Optimization . . . . . . . . . . . . . . . . . . . . . . . . . . . . . . 885Expand Features . . . . . . . . . . . . . . . . . . . . . . . . . . . . . . . . 885Exploded Slices. . . . . . . . . . . . . . . . . . . . . . . . . . . . . . . . . 885Expression . . . . . . . . . . . . . . . . . . . . . . . . . . . . . . . . . . 885Expression . . . . . . . . . . . . . . . . . . . . . . . . . . . . . . . . . . 886Expression . . . . . . . . . . . . . . . . . . . . . . . . . . . . . . . . . . 886Expression . . . . . . . . . . . . . . . . . . . . . . . . . . . . . . . . . . 886Extend Width . . . . . . . . . . . . . . . . . . . . . . . . . . . . . . . . . 886Face Color . . . . . . . . . . . . . . . . . . . . . . . . . . . . . . . . . . 886Fact Cell Data Format . . . . . . . . . . . . . . . . . . . . . . . . . . . . . . 886Fact Cells Precedence. . . . . . . . . . . . . . . . . . . . . . . . . . . . . . . 887Fill Effects . . . . . . . . . . . . . . . . . . . . . . . . . . . . . . . . . . 887First Column Color . . . . . . . . . . . . . . . . . . . . . . . . . . . . . . . 887First Date. . . . . . . . . . . . . . . . . . . . . . . . . . . . . . . . . . . 887First Label Index . . . . . . . . . . . . . . . . . . . . . . . . . . . . . . . . 887First Slice Angle . . . . . . . . . . . . . . . . . . . . . . . . . . . . . . . . 887Floating . . . . . . . . . . . . . . . . . . . . . . . . . . . . . . . . . . . 888Font . . . . . . . . . . . . . . . . . . . . . . . . . . . . . . . . . . . . 888Font Auto-Sizing . . . . . . . . . . . . . . . . . . . . . . . . . . . . . . . . 889Footer . . . . . . . . . . . . . . . . . . . . . . . . . . . . . . . . . . . . 889Footer . . . . . . . . . . . . . . . . . . . . . . . . . . . . . . . . . . . . 889Foreground Color . . . . . . . . . . . . . . . . . . . . . . . . . . . . . . . . 889From Text . . . . . . . . . . . . . . . . . . . . . . . . . . . . . . . . . . 890Gauge Axes . . . . . . . . . . . . . . . . . . . . . . . . . . . . . . . . . . 890Gauge Axis Colors . . . . . . . . . . . . . . . . . . . . . . . . . . . . . . . 890Gauge Axis Inner Radius . . . . . . . . . . . . . . . . . . . . . . . . . . . . . 890Gauge Axis Outer Radius . . . . . . . . . . . . . . . . . . . . . . . . . . . . . 890Gauge Border . . . . . . . . . . . . . . . . . . . . . . . . . . . . . . . . . 891Gauge Labels . . . . . . . . . . . . . . . . . . . . . . . . . . . . . . . . . 891Gauge Needle . . . . . . . . . . . . . . . . . . . . . . . . . . . . . . . . . 891Gauge Palette . . . . . . . . . . . . . . . . . . . . . . . . . . . . . . . . . 891Gauge Pivot . . . . . . . . . . . . . . . . . . . . . . . . . . . . . . . . . . 891Generated SQL . . . . . . . . . . . . . . . . . . . . . . . . . . . . . . . . . 891Gradient . . . . . . . . . . . . . . . . . . . . . . . . . . . . . . . . . . . 891Gridlines . . . . . . . . . . . . . . . . . . . . . . . . . . . . . . . . . . . 892
Contents xxxvii

Gridlines . . . . . . . . . . . . . . . . . . . . . . . . . . . . . . . . . . . 892Gridlines . . . . . . . . . . . . . . . . . . . . . . . . . . . . . . . . . . . 892Grouping & Sorting . . . . . . . . . . . . . . . . . . . . . . . . . . . . . . . 892Grouping Type . . . . . . . . . . . . . . . . . . . . . . . . . . . . . . . . . 892Group Span . . . . . . . . . . . . . . . . . . . . . . . . . . . . . . . . . . 892Has Fact Cells . . . . . . . . . . . . . . . . . . . . . . . . . . . . . . . . . 893Header Text . . . . . . . . . . . . . . . . . . . . . . . . . . . . . . . . . . 893Heading Level . . . . . . . . . . . . . . . . . . . . . . . . . . . . . . . . . 893Height. . . . . . . . . . . . . . . . . . . . . . . . . . . . . . . . . . . . 893Height (px) . . . . . . . . . . . . . . . . . . . . . . . . . . . . . . . . . . 893Hide Adornments . . . . . . . . . . . . . . . . . . . . . . . . . . . . . . . . 893Hide Text. . . . . . . . . . . . . . . . . . . . . . . . . . . . . . . . . . . 893Hierarchy . . . . . . . . . . . . . . . . . . . . . . . . . . . . . . . . . . 894Hierarchy Unique Name . . . . . . . . . . . . . . . . . . . . . . . . . . . . . 894Highest Value Text . . . . . . . . . . . . . . . . . . . . . . . . . . . . . . . 894Hole Size (%) . . . . . . . . . . . . . . . . . . . . . . . . . . . . . . . . . 895Horizontal Alignment . . . . . . . . . . . . . . . . . . . . . . . . . . . . . . 895Hours Text . . . . . . . . . . . . . . . . . . . . . . . . . . . . . . . . . . 895HTML. . . . . . . . . . . . . . . . . . . . . . . . . . . . . . . . . . . . 895HTML Source Variable . . . . . . . . . . . . . . . . . . . . . . . . . . . . . . 896Icon . . . . . . . . . . . . . . . . . . . . . . . . . . . . . . . . . . . . 896Ignore Data with No Features . . . . . . . . . . . . . . . . . . . . . . . . . . . . 896Include Zero For Auto Scale . . . . . . . . . . . . . . . . . . . . . . . . . . . . 896Insert Text . . . . . . . . . . . . . . . . . . . . . . . . . . . . . . . . . . 896Iterator First . . . . . . . . . . . . . . . . . . . . . . . . . . . . . . . . . . 896Iterator Label Area . . . . . . . . . . . . . . . . . . . . . . . . . . . . . . . 897Iterator Last . . . . . . . . . . . . . . . . . . . . . . . . . . . . . . . . . . 897Iterator Next . . . . . . . . . . . . . . . . . . . . . . . . . . . . . . . . . 897Iterator Previous . . . . . . . . . . . . . . . . . . . . . . . . . . . . . . . . 897Iterator Values Definition . . . . . . . . . . . . . . . . . . . . . . . . . . . . . 897Join Relationships . . . . . . . . . . . . . . . . . . . . . . . . . . . . . . . . 897Keywords Text . . . . . . . . . . . . . . . . . . . . . . . . . . . . . . . . . 897Label . . . . . . . . . . . . . . . . . . . . . . . . . . . . . . . . . . . . 898Label . . . . . . . . . . . . . . . . . . . . . . . . . . . . . . . . . . . . 898Label . . . . . . . . . . . . . . . . . . . . . . . . . . . . . . . . . . . . 898Label . . . . . . . . . . . . . . . . . . . . . . . . . . . . . . . . . . . . 898Label . . . . . . . . . . . . . . . . . . . . . . . . . . . . . . . . . . . . 898Label . . . . . . . . . . . . . . . . . . . . . . . . . . . . . . . . . . . . 898Label . . . . . . . . . . . . . . . . . . . . . . . . . . . . . . . . . . . . 898Label . . . . . . . . . . . . . . . . . . . . . . . . . . . . . . . . . . . . 899Label . . . . . . . . . . . . . . . . . . . . . . . . . . . . . . . . . . . . 899Label . . . . . . . . . . . . . . . . . . . . . . . . . . . . . . . . . . . . 899Label Color . . . . . . . . . . . . . . . . . . . . . . . . . . . . . . . . . . 899Label Control . . . . . . . . . . . . . . . . . . . . . . . . . . . . . . . . . 899Label For . . . . . . . . . . . . . . . . . . . . . . . . . . . . . . . . . . . 899Label Location . . . . . . . . . . . . . . . . . . . . . . . . . . . . . . . . . 900Labels . . . . . . . . . . . . . . . . . . . . . . . . . . . . . . . . . . . . 900Last Date . . . . . . . . . . . . . . . . . . . . . . . . . . . . . . . . . . . 900Left Position. . . . . . . . . . . . . . . . . . . . . . . . . . . . . . . . . . 900Left Position (px) . . . . . . . . . . . . . . . . . . . . . . . . . . . . . . . . 900Left Position (px) . . . . . . . . . . . . . . . . . . . . . . . . . . . . . . . . 900Legend . . . . . . . . . . . . . . . . . . . . . . . . . . . . . . . . . . . 900Legend . . . . . . . . . . . . . . . . . . . . . . . . . . . . . . . . . . . 901Legend Label . . . . . . . . . . . . . . . . . . . . . . . . . . . . . . . . . 901Legend Separator . . . . . . . . . . . . . . . . . . . . . . . . . . . . . . . . 901Legend Title . . . . . . . . . . . . . . . . . . . . . . . . . . . . . . . . . . 901Legend Title . . . . . . . . . . . . . . . . . . . . . . . . . . . . . . . . . . 901Legend Title . . . . . . . . . . . . . . . . . . . . . . . . . . . . . . . . . . 901Level . . . . . . . . . . . . . . . . . . . . . . . . . . . . . . . . . . . . 902Level Indentation . . . . . . . . . . . . . . . . . . . . . . . . . . . . . . . . 902Level Unique Name . . . . . . . . . . . . . . . . . . . . . . . . . . . . . . . 902
xxxviii IBM Cognos Report Studio Version 10.2.1: User Guide

Line and Markers . . . . . . . . . . . . . . . . . . . . . . . . . . . . . . . . 902Line Shape . . . . . . . . . . . . . . . . . . . . . . . . . . . . . . . . . . 903Line Style . . . . . . . . . . . . . . . . . . . . . . . . . . . . . . . . . . 903Line Style . . . . . . . . . . . . . . . . . . . . . . . . . . . . . . . . . . 903Line Style . . . . . . . . . . . . . . . . . . . . . . . . . . . . . . . . . . 903Line Styles . . . . . . . . . . . . . . . . . . . . . . . . . . . . . . . . . . 903Line Type . . . . . . . . . . . . . . . . . . . . . . . . . . . . . . . . . . 903Line Weight (pt) . . . . . . . . . . . . . . . . . . . . . . . . . . . . . . . . 903List Items Definition . . . . . . . . . . . . . . . . . . . . . . . . . . . . . . . 904Loss Color . . . . . . . . . . . . . . . . . . . . . . . . . . . . . . . . . . 904Lowest Value Text . . . . . . . . . . . . . . . . . . . . . . . . . . . . . . . . 904Map & Layers . . . . . . . . . . . . . . . . . . . . . . . . . . . . . . . . . 904Map Drills . . . . . . . . . . . . . . . . . . . . . . . . . . . . . . . . . . 904Margin . . . . . . . . . . . . . . . . . . . . . . . . . . . . . . . . . . . 904Marimekko Totals . . . . . . . . . . . . . . . . . . . . . . . . . . . . . . . . 905Marker Color . . . . . . . . . . . . . . . . . . . . . . . . . . . . . . . . . 905Marker Color . . . . . . . . . . . . . . . . . . . . . . . . . . . . . . . . . 905Marker Label . . . . . . . . . . . . . . . . . . . . . . . . . . . . . . . . . 905Markers . . . . . . . . . . . . . . . . . . . . . . . . . . . . . . . . . . . 905Markers . . . . . . . . . . . . . . . . . . . . . . . . . . . . . . . . . . . 906Marker Shape . . . . . . . . . . . . . . . . . . . . . . . . . . . . . . . . . 906Marker Shape . . . . . . . . . . . . . . . . . . . . . . . . . . . . . . . . . 906Marker Size (pt) . . . . . . . . . . . . . . . . . . . . . . . . . . . . . . . . 906Marker Size (pt) . . . . . . . . . . . . . . . . . . . . . . . . . . . . . . . . 906Marker Style . . . . . . . . . . . . . . . . . . . . . . . . . . . . . . . . . 906Marker Text Location . . . . . . . . . . . . . . . . . . . . . . . . . . . . . . . 906Master Detail Relationships. . . . . . . . . . . . . . . . . . . . . . . . . . . . . 907Material Effects. . . . . . . . . . . . . . . . . . . . . . . . . . . . . . . . . 907Material Effects. . . . . . . . . . . . . . . . . . . . . . . . . . . . . . . . . 907Matrix Rows and Columns . . . . . . . . . . . . . . . . . . . . . . . . . . . . . 908Maximum Characters. . . . . . . . . . . . . . . . . . . . . . . . . . . . . . . 908Maximum Execution Time . . . . . . . . . . . . . . . . . . . . . . . . . . . . . 908Maximum Hotspots . . . . . . . . . . . . . . . . . . . . . . . . . . . . . . . 908Maximum Rows Retrieved . . . . . . . . . . . . . . . . . . . . . . . . . . . . . 909Maximum Size (pt) . . . . . . . . . . . . . . . . . . . . . . . . . . . . . . . 909Maximum Tables . . . . . . . . . . . . . . . . . . . . . . . . . . . . . . . . 909Maximum Text Blob Characters . . . . . . . . . . . . . . . . . . . . . . . . . . . 909Maximum Truncation Characters . . . . . . . . . . . . . . . . . . . . . . . . . . . 909Maximum Value . . . . . . . . . . . . . . . . . . . . . . . . . . . . . . . . 910Maximum Value . . . . . . . . . . . . . . . . . . . . . . . . . . . . . . . . 910MDX . . . . . . . . . . . . . . . . . . . . . . . . . . . . . . . . . . . . 910Member . . . . . . . . . . . . . . . . . . . . . . . . . . . . . . . . . . . 910Member Offset (%) . . . . . . . . . . . . . . . . . . . . . . . . . . . . . . . 910Members . . . . . . . . . . . . . . . . . . . . . . . . . . . . . . . . . . . 911Members . . . . . . . . . . . . . . . . . . . . . . . . . . . . . . . . . . . 911Member Unique Name . . . . . . . . . . . . . . . . . . . . . . . . . . . . . . 911Milliseconds Text . . . . . . . . . . . . . . . . . . . . . . . . . . . . . . . . 911Minimum Size (pt) . . . . . . . . . . . . . . . . . . . . . . . . . . . . . . . 911Minimum Value . . . . . . . . . . . . . . . . . . . . . . . . . . . . . . . . 912Minimum Value . . . . . . . . . . . . . . . . . . . . . . . . . . . . . . . . 912Minor Gridlines . . . . . . . . . . . . . . . . . . . . . . . . . . . . . . . . 912Minor Gridlines . . . . . . . . . . . . . . . . . . . . . . . . . . . . . . . . 912Minor Gridlines . . . . . . . . . . . . . . . . . . . . . . . . . . . . . . . . 912Minutes Text . . . . . . . . . . . . . . . . . . . . . . . . . . . . . . . . . 913Multi-Line . . . . . . . . . . . . . . . . . . . . . . . . . . . . . . . . . . 913Multi-Select . . . . . . . . . . . . . . . . . . . . . . . . . . . . . . . . . . 913Name . . . . . . . . . . . . . . . . . . . . . . . . . . . . . . . . . . . . 913Name . . . . . . . . . . . . . . . . . . . . . . . . . . . . . . . . . . . . 913Name . . . . . . . . . . . . . . . . . . . . . . . . . . . . . . . . . . . . 914Name . . . . . . . . . . . . . . . . . . . . . . . . . . . . . . . . . . . . 914Name . . . . . . . . . . . . . . . . . . . . . . . . . . . . . . . . . . . . 914
Contents xxxix

Name . . . . . . . . . . . . . . . . . . . . . . . . . . . . . . . . . . . . 915Name . . . . . . . . . . . . . . . . . . . . . . . . . . . . . . . . . . . . 915Name . . . . . . . . . . . . . . . . . . . . . . . . . . . . . . . . . . . . 915Name . . . . . . . . . . . . . . . . . . . . . . . . . . . . . . . . . . . . 915Name . . . . . . . . . . . . . . . . . . . . . . . . . . . . . . . . . . . . 915Name . . . . . . . . . . . . . . . . . . . . . . . . . . . . . . . . . . . . 915Name . . . . . . . . . . . . . . . . . . . . . . . . . . . . . . . . . . . . 915Name . . . . . . . . . . . . . . . . . . . . . . . . . . . . . . . . . . . . 915Name . . . . . . . . . . . . . . . . . . . . . . . . . . . . . . . . . . . . 916Negative Column Color . . . . . . . . . . . . . . . . . . . . . . . . . . . . . . 916Nested Label Display. . . . . . . . . . . . . . . . . . . . . . . . . . . . . . . 916Nesting Order . . . . . . . . . . . . . . . . . . . . . . . . . . . . . . . . . 916No Data Contents . . . . . . . . . . . . . . . . . . . . . . . . . . . . . . . . 916No Data Features Size (pt) . . . . . . . . . . . . . . . . . . . . . . . . . . . . . 917Node Coordinate . . . . . . . . . . . . . . . . . . . . . . . . . . . . . . . . 917Note Border . . . . . . . . . . . . . . . . . . . . . . . . . . . . . . . . . . 917Notes . . . . . . . . . . . . . . . . . . . . . . . . . . . . . . . . . . . . 917Notes . . . . . . . . . . . . . . . . . . . . . . . . . . . . . . . . . . . . 917Note Text. . . . . . . . . . . . . . . . . . . . . . . . . . . . . . . . . . . 918No Value List Item . . . . . . . . . . . . . . . . . . . . . . . . . . . . . . . 918Number of Minor Intervals . . . . . . . . . . . . . . . . . . . . . . . . . . . . . 918Number of Minor Intervals . . . . . . . . . . . . . . . . . . . . . . . . . . . . . 918Number of Regression Lines . . . . . . . . . . . . . . . . . . . . . . . . . . . . 918Numbers Only . . . . . . . . . . . . . . . . . . . . . . . . . . . . . . . . . 918Number Style . . . . . . . . . . . . . . . . . . . . . . . . . . . . . . . . . 919Number Style . . . . . . . . . . . . . . . . . . . . . . . . . . . . . . . . . 919Numerical Axis. . . . . . . . . . . . . . . . . . . . . . . . . . . . . . . . . 919Numerical Axis. . . . . . . . . . . . . . . . . . . . . . . . . . . . . . . . . 919Numeric Baselines. . . . . . . . . . . . . . . . . . . . . . . . . . . . . . . . 919Numeric Value . . . . . . . . . . . . . . . . . . . . . . . . . . . . . . . . . 919Numeric Value . . . . . . . . . . . . . . . . . . . . . . . . . . . . . . . . . 919Numeric Value . . . . . . . . . . . . . . . . . . . . . . . . . . . . . . . . . 920Options Text. . . . . . . . . . . . . . . . . . . . . . . . . . . . . . . . . . 920Orientation . . . . . . . . . . . . . . . . . . . . . . . . . . . . . . . . . . 920Outer Join Allowed . . . . . . . . . . . . . . . . . . . . . . . . . . . . . . . 920Output Aggregation Method . . . . . . . . . . . . . . . . . . . . . . . . . . . . 920Output Aggregation Method . . . . . . . . . . . . . . . . . . . . . . . . . . . . 920Override Dimension Info . . . . . . . . . . . . . . . . . . . . . . . . . . . . . 921Overrides . . . . . . . . . . . . . . . . . . . . . . . . . . . . . . . . . . 921Padding . . . . . . . . . . . . . . . . . . . . . . . . . . . . . . . . . . . 921Pagination . . . . . . . . . . . . . . . . . . . . . . . . . . . . . . . . . . 921Palette. . . . . . . . . . . . . . . . . . . . . . . . . . . . . . . . . . . . 922Palette. . . . . . . . . . . . . . . . . . . . . . . . . . . . . . . . . . . . 922Palette. . . . . . . . . . . . . . . . . . . . . . . . . . . . . . . . . . . . 922Parameter . . . . . . . . . . . . . . . . . . . . . . . . . . . . . . . . . . 922Pareto Axis . . . . . . . . . . . . . . . . . . . . . . . . . . . . . . . . . . 923PDF Page Setup . . . . . . . . . . . . . . . . . . . . . . . . . . . . . . . . 923Percentage Based On . . . . . . . . . . . . . . . . . . . . . . . . . . . . . . . 923Percentile. . . . . . . . . . . . . . . . . . . . . . . . . . . . . . . . . . . 923Percentile. . . . . . . . . . . . . . . . . . . . . . . . . . . . . . . . . . . 923Percentile. . . . . . . . . . . . . . . . . . . . . . . . . . . . . . . . . . . 923Percent of Axis . . . . . . . . . . . . . . . . . . . . . . . . . . . . . . . . . 923Percent of Axis . . . . . . . . . . . . . . . . . . . . . . . . . . . . . . . . . 924Percent of Axis . . . . . . . . . . . . . . . . . . . . . . . . . . . . . . . . . 924Performance Pattern . . . . . . . . . . . . . . . . . . . . . . . . . . . . . . . 924Pie Labels . . . . . . . . . . . . . . . . . . . . . . . . . . . . . . . . . . 924Plot Area Fill . . . . . . . . . . . . . . . . . . . . . . . . . . . . . . . . . 924Point Shape . . . . . . . . . . . . . . . . . . . . . . . . . . . . . . . . . . 924Polynomial Exponent. . . . . . . . . . . . . . . . . . . . . . . . . . . . . . . 925Position . . . . . . . . . . . . . . . . . . . . . . . . . . . . . . . . . . . 925Position . . . . . . . . . . . . . . . . . . . . . . . . . . . . . . . . . . . 925
xl IBM Cognos Report Studio Version 10.2.1: User Guide

Position in List . . . . . . . . . . . . . . . . . . . . . . . . . . . . . . . . . 925Position type . . . . . . . . . . . . . . . . . . . . . . . . . . . . . . . . . 925Position type . . . . . . . . . . . . . . . . . . . . . . . . . . . . . . . . . 925Position type . . . . . . . . . . . . . . . . . . . . . . . . . . . . . . . . . 925Positive Column Color . . . . . . . . . . . . . . . . . . . . . . . . . . . . . . 926Pre-populate. . . . . . . . . . . . . . . . . . . . . . . . . . . . . . . . . . 926Pre-populate Levels . . . . . . . . . . . . . . . . . . . . . . . . . . . . . . . 926Pre-Sort . . . . . . . . . . . . . . . . . . . . . . . . . . . . . . . . . . . 926Processing . . . . . . . . . . . . . . . . . . . . . . . . . . . . . . . . . . 926Progressive Axis . . . . . . . . . . . . . . . . . . . . . . . . . . . . . . . . 927Progressive Palette . . . . . . . . . . . . . . . . . . . . . . . . . . . . . . . 927Projection List . . . . . . . . . . . . . . . . . . . . . . . . . . . . . . . . . 927Properties . . . . . . . . . . . . . . . . . . . . . . . . . . . . . . . . . . 927Property . . . . . . . . . . . . . . . . . . . . . . . . . . . . . . . . . . . 928Property Unique Name . . . . . . . . . . . . . . . . . . . . . . . . . . . . . . 928Push To Bottom . . . . . . . . . . . . . . . . . . . . . . . . . . . . . . . . 928Query . . . . . . . . . . . . . . . . . . . . . . . . . . . . . . . . . . . . 928Query . . . . . . . . . . . . . . . . . . . . . . . . . . . . . . . . . . . . 929Radar Type . . . . . . . . . . . . . . . . . . . . . . . . . . . . . . . . . . 929Radial Axis . . . . . . . . . . . . . . . . . . . . . . . . . . . . . . . . . . 929Radio Buttons Definition . . . . . . . . . . . . . . . . . . . . . . . . . . . . . 929Range . . . . . . . . . . . . . . . . . . . . . . . . . . . . . . . . . . . . 929Range Label . . . . . . . . . . . . . . . . . . . . . . . . . . . . . . . . . . 930Range Type . . . . . . . . . . . . . . . . . . . . . . . . . . . . . . . . . . 930Regression Line . . . . . . . . . . . . . . . . . . . . . . . . . . . . . . . . 930Regression Type . . . . . . . . . . . . . . . . . . . . . . . . . . . . . . . . 930Relative Alignment . . . . . . . . . . . . . . . . . . . . . . . . . . . . . . . 930Remove Text . . . . . . . . . . . . . . . . . . . . . . . . . . . . . . . . . 931Render . . . . . . . . . . . . . . . . . . . . . . . . . . . . . . . . . . . 931Render Fact Cells . . . . . . . . . . . . . . . . . . . . . . . . . . . . . . . . 931Render Page when Empty . . . . . . . . . . . . . . . . . . . . . . . . . . . . . 931Render Variable . . . . . . . . . . . . . . . . . . . . . . . . . . . . . . . . 932Repeater Direction. . . . . . . . . . . . . . . . . . . . . . . . . . . . . . . . 932Repeater Table Values Definition . . . . . . . . . . . . . . . . . . . . . . . . . . . 933Report Expression . . . . . . . . . . . . . . . . . . . . . . . . . . . . . . . . 933Report Expression . . . . . . . . . . . . . . . . . . . . . . . . . . . . . . . . 933Report Expression . . . . . . . . . . . . . . . . . . . . . . . . . . . . . . . . 933Report Expression . . . . . . . . . . . . . . . . . . . . . . . . . . . . . . . . 933Report Expression . . . . . . . . . . . . . . . . . . . . . . . . . . . . . . . . 933Report Expression . . . . . . . . . . . . . . . . . . . . . . . . . . . . . . . . 934Report Expression . . . . . . . . . . . . . . . . . . . . . . . . . . . . . . . . 934Report Expression . . . . . . . . . . . . . . . . . . . . . . . . . . . . . . . . 934Report Expression . . . . . . . . . . . . . . . . . . . . . . . . . . . . . . . . 934Report Expression . . . . . . . . . . . . . . . . . . . . . . . . . . . . . . . . 934Required . . . . . . . . . . . . . . . . . . . . . . . . . . . . . . . . . . . 934Results Deselect All Text. . . . . . . . . . . . . . . . . . . . . . . . . . . . . . 935Results Select All Text . . . . . . . . . . . . . . . . . . . . . . . . . . . . . . 935Results Text . . . . . . . . . . . . . . . . . . . . . . . . . . . . . . . . . . 935Reverse Category Order . . . . . . . . . . . . . . . . . . . . . . . . . . . . . . 935Right Position . . . . . . . . . . . . . . . . . . . . . . . . . . . . . . . . . 935Right Position (px) . . . . . . . . . . . . . . . . . . . . . . . . . . . . . . . 936Rollup Aggregate Function . . . . . . . . . . . . . . . . . . . . . . . . . . . . . 936Rollup Method . . . . . . . . . . . . . . . . . . . . . . . . . . . . . . . . . 936Rollup Processing . . . . . . . . . . . . . . . . . . . . . . . . . . . . . . . . 936Root Members Only . . . . . . . . . . . . . . . . . . . . . . . . . . . . . . . 936Rotate Values . . . . . . . . . . . . . . . . . . . . . . . . . . . . . . . . . 937Row Coordinate . . . . . . . . . . . . . . . . . . . . . . . . . . . . . . . . 937Rows Per Page . . . . . . . . . . . . . . . . . . . . . . . . . . . . . . . . . 937Scale . . . . . . . . . . . . . . . . . . . . . . . . . . . . . . . . . . . . 937Scale Interval . . . . . . . . . . . . . . . . . . . . . . . . . . . . . . . . . 938Scope . . . . . . . . . . . . . . . . . . . . . . . . . . . . . . . . . . . . 938
Contents xli

Search Instructions Text . . . . . . . . . . . . . . . . . . . . . . . . . . . . . . 938Search Text . . . . . . . . . . . . . . . . . . . . . . . . . . . . . . . . . . 938Seconds Text . . . . . . . . . . . . . . . . . . . . . . . . . . . . . . . . . 938Select UI . . . . . . . . . . . . . . . . . . . . . . . . . . . . . . . . . . . 938Select UI . . . . . . . . . . . . . . . . . . . . . . . . . . . . . . . . . . . 939Select UI . . . . . . . . . . . . . . . . . . . . . . . . . . . . . . . . . . . 939Select UI . . . . . . . . . . . . . . . . . . . . . . . . . . . . . . . . . . . 939Select UI . . . . . . . . . . . . . . . . . . . . . . . . . . . . . . . . . . . 939Select UI . . . . . . . . . . . . . . . . . . . . . . . . . . . . . . . . . . . 939Separator . . . . . . . . . . . . . . . . . . . . . . . . . . . . . . . . . . . 939Series Color . . . . . . . . . . . . . . . . . . . . . . . . . . . . . . . . . . 939Series Type . . . . . . . . . . . . . . . . . . . . . . . . . . . . . . . . . . 940Set Definition . . . . . . . . . . . . . . . . . . . . . . . . . . . . . . . . . 940Set Operation . . . . . . . . . . . . . . . . . . . . . . . . . . . . . . . . . 940Set Sorting . . . . . . . . . . . . . . . . . . . . . . . . . . . . . . . . . . 940Set Variable Values . . . . . . . . . . . . . . . . . . . . . . . . . . . . . . . 941Share Result Set . . . . . . . . . . . . . . . . . . . . . . . . . . . . . . . . 941Sharing . . . . . . . . . . . . . . . . . . . . . . . . . . . . . . . . . . . 941Show Caption . . . . . . . . . . . . . . . . . . . . . . . . . . . . . . . . . 941Show Data Points . . . . . . . . . . . . . . . . . . . . . . . . . . . . . . . . 942Show Data Range in Legend . . . . . . . . . . . . . . . . . . . . . . . . . . . . 942Show Features with No Data . . . . . . . . . . . . . . . . . . . . . . . . . . . . 942Show Feelers . . . . . . . . . . . . . . . . . . . . . . . . . . . . . . . . . 942Show Hover . . . . . . . . . . . . . . . . . . . . . . . . . . . . . . . . . . 942Show Icon . . . . . . . . . . . . . . . . . . . . . . . . . . . . . . . . . . 943Show Icon . . . . . . . . . . . . . . . . . . . . . . . . . . . . . . . . . . 943Show Labels. . . . . . . . . . . . . . . . . . . . . . . . . . . . . . . . . . 943Show Legend Values . . . . . . . . . . . . . . . . . . . . . . . . . . . . . . . 943Show line . . . . . . . . . . . . . . . . . . . . . . . . . . . . . . . . . . 943Show Pointer Cursor . . . . . . . . . . . . . . . . . . . . . . . . . . . . . . . 943Show Tooltip . . . . . . . . . . . . . . . . . . . . . . . . . . . . . . . . . 944Show Values. . . . . . . . . . . . . . . . . . . . . . . . . . . . . . . . . . 944Show Values. . . . . . . . . . . . . . . . . . . . . . . . . . . . . . . . . . 944Show Values. . . . . . . . . . . . . . . . . . . . . . . . . . . . . . . . . . 944Show Values. . . . . . . . . . . . . . . . . . . . . . . . . . . . . . . . . . 944Show Values. . . . . . . . . . . . . . . . . . . . . . . . . . . . . . . . . . 944Show Values. . . . . . . . . . . . . . . . . . . . . . . . . . . . . . . . . . 944Show Values. . . . . . . . . . . . . . . . . . . . . . . . . . . . . . . . . . 945Size . . . . . . . . . . . . . . . . . . . . . . . . . . . . . . . . . . . . 945Size & Overflow . . . . . . . . . . . . . . . . . . . . . . . . . . . . . . . . 945Size & Overflow . . . . . . . . . . . . . . . . . . . . . . . . . . . . . . . . 945Size Legend Title . . . . . . . . . . . . . . . . . . . . . . . . . . . . . . . . 946Slice Direction . . . . . . . . . . . . . . . . . . . . . . . . . . . . . . . . . 946Slide Animation Direction . . . . . . . . . . . . . . . . . . . . . . . . . . . . . 946Slider Values Definition . . . . . . . . . . . . . . . . . . . . . . . . . . . . . . 946Solve Order . . . . . . . . . . . . . . . . . . . . . . . . . . . . . . . . . . 946Solve Order . . . . . . . . . . . . . . . . . . . . . . . . . . . . . . . . . . 947Sorting . . . . . . . . . . . . . . . . . . . . . . . . . . . . . . . . . . . 947Source Type . . . . . . . . . . . . . . . . . . . . . . . . . . . . . . . . . . 947Source Type . . . . . . . . . . . . . . . . . . . . . . . . . . . . . . . . . . 947Source Type . . . . . . . . . . . . . . . . . . . . . . . . . . . . . . . . . . 947Source Type . . . . . . . . . . . . . . . . . . . . . . . . . . . . . . . . . . 948Spacing & Breaking . . . . . . . . . . . . . . . . . . . . . . . . . . . . . . . 948Spider Effects . . . . . . . . . . . . . . . . . . . . . . . . . . . . . . . . . 948SQL . . . . . . . . . . . . . . . . . . . . . . . . . . . . . . . . . . . . 948SQL Join Syntax . . . . . . . . . . . . . . . . . . . . . . . . . . . . . . . . 948SQL Syntax . . . . . . . . . . . . . . . . . . . . . . . . . . . . . . . . . . 949Standard Deviations . . . . . . . . . . . . . . . . . . . . . . . . . . . . . . . 949Standard Deviations . . . . . . . . . . . . . . . . . . . . . . . . . . . . . . . 949Standard Deviations . . . . . . . . . . . . . . . . . . . . . . . . . . . . . . . 949Start Position . . . . . . . . . . . . . . . . . . . . . . . . . . . . . . . . . 949
xlii IBM Cognos Report Studio Version 10.2.1: User Guide

Static Choices . . . . . . . . . . . . . . . . . . . . . . . . . . . . . . . . . 949Step . . . . . . . . . . . . . . . . . . . . . . . . . . . . . . . . . . . . 950Style Variable . . . . . . . . . . . . . . . . . . . . . . . . . . . . . . . . . 950Subtitle . . . . . . . . . . . . . . . . . . . . . . . . . . . . . . . . . . . 950Subtitle . . . . . . . . . . . . . . . . . . . . . . . . . . . . . . . . . . . 951Summarize Small Items . . . . . . . . . . . . . . . . . . . . . . . . . . . . . . 951Summarize Small Slices . . . . . . . . . . . . . . . . . . . . . . . . . . . . . . 951Summary Text . . . . . . . . . . . . . . . . . . . . . . . . . . . . . . . . . 951Suppress . . . . . . . . . . . . . . . . . . . . . . . . . . . . . . . . . . . 951Suppression . . . . . . . . . . . . . . . . . . . . . . . . . . . . . . . . . . 951Table Header . . . . . . . . . . . . . . . . . . . . . . . . . . . . . . . . . 952Table of Contents . . . . . . . . . . . . . . . . . . . . . . . . . . . . . . . . 952Table of Contents Name . . . . . . . . . . . . . . . . . . . . . . . . . . . . . . 952Table Properties . . . . . . . . . . . . . . . . . . . . . . . . . . . . . . . . 952Tab Orientation. . . . . . . . . . . . . . . . . . . . . . . . . . . . . . . . . 952Tabs Definition . . . . . . . . . . . . . . . . . . . . . . . . . . . . . . . . . 953Tab Width . . . . . . . . . . . . . . . . . . . . . . . . . . . . . . . . . . 953Target Color . . . . . . . . . . . . . . . . . . . . . . . . . . . . . . . . . . 953Target Marker . . . . . . . . . . . . . . . . . . . . . . . . . . . . . . . . . 953Target Marker Border Color . . . . . . . . . . . . . . . . . . . . . . . . . . . . 953Target Marker Position . . . . . . . . . . . . . . . . . . . . . . . . . . . . . . 953Target Range (%) . . . . . . . . . . . . . . . . . . . . . . . . . . . . . . . . 953Text . . . . . . . . . . . . . . . . . . . . . . . . . . . . . . . . . . . . 954Text Color . . . . . . . . . . . . . . . . . . . . . . . . . . . . . . . . . . 954Text Color . . . . . . . . . . . . . . . . . . . . . . . . . . . . . . . . . . 954Text Orientation . . . . . . . . . . . . . . . . . . . . . . . . . . . . . . . . 954Text Source Variable . . . . . . . . . . . . . . . . . . . . . . . . . . . . . . . 954Text Truncation . . . . . . . . . . . . . . . . . . . . . . . . . . . . . . . . . 954Tick Interval. . . . . . . . . . . . . . . . . . . . . . . . . . . . . . . . . . 955Tick Interval. . . . . . . . . . . . . . . . . . . . . . . . . . . . . . . . . . 955Tick Label Skip Interval . . . . . . . . . . . . . . . . . . . . . . . . . . . . . . 955Tick Type. . . . . . . . . . . . . . . . . . . . . . . . . . . . . . . . . . . 955Title . . . . . . . . . . . . . . . . . . . . . . . . . . . . . . . . . . . . 955Title . . . . . . . . . . . . . . . . . . . . . . . . . . . . . . . . . . . . 955Title . . . . . . . . . . . . . . . . . . . . . . . . . . . . . . . . . . . . 955Tolerance Color. . . . . . . . . . . . . . . . . . . . . . . . . . . . . . . . . 956Tolerance Label. . . . . . . . . . . . . . . . . . . . . . . . . . . . . . . . . 956Tooltips . . . . . . . . . . . . . . . . . . . . . . . . . . . . . . . . . . . 956Tooltips . . . . . . . . . . . . . . . . . . . . . . . . . . . . . . . . . . . 956Tooltips . . . . . . . . . . . . . . . . . . . . . . . . . . . . . . . . . . . 956Tooltips . . . . . . . . . . . . . . . . . . . . . . . . . . . . . . . . . . . 957Tooltips . . . . . . . . . . . . . . . . . . . . . . . . . . . . . . . . . . . 957Top Position . . . . . . . . . . . . . . . . . . . . . . . . . . . . . . . . . . 957Top Position (px) . . . . . . . . . . . . . . . . . . . . . . . . . . . . . . . . 957Total Column . . . . . . . . . . . . . . . . . . . . . . . . . . . . . . . . . 957Total Column . . . . . . . . . . . . . . . . . . . . . . . . . . . . . . . . . 957Total Column Color . . . . . . . . . . . . . . . . . . . . . . . . . . . . . . . 958To Text . . . . . . . . . . . . . . . . . . . . . . . . . . . . . . . . . . . 958Track Length . . . . . . . . . . . . . . . . . . . . . . . . . . . . . . . . . 958Trendline Label . . . . . . . . . . . . . . . . . . . . . . . . . . . . . . . . . 958Trendlines . . . . . . . . . . . . . . . . . . . . . . . . . . . . . . . . . . 958Truncation . . . . . . . . . . . . . . . . . . . . . . . . . . . . . . . . . . 958Truncation Text . . . . . . . . . . . . . . . . . . . . . . . . . . . . . . . . . 959Type . . . . . . . . . . . . . . . . . . . . . . . . . . . . . . . . . . . . 959Type . . . . . . . . . . . . . . . . . . . . . . . . . . . . . . . . . . . . 959Type . . . . . . . . . . . . . . . . . . . . . . . . . . . . . . . . . . . . 959Type . . . . . . . . . . . . . . . . . . . . . . . . . . . . . . . . . . . . 959Update Variables Live . . . . . . . . . . . . . . . . . . . . . . . . . . . . . . 959Upper Range Skew (%) . . . . . . . . . . . . . . . . . . . . . . . . . . . . . . 960URL . . . . . . . . . . . . . . . . . . . . . . . . . . . . . . . . . . . . 960URL . . . . . . . . . . . . . . . . . . . . . . . . . . . . . . . . . . . . 960
Contents xliii

URL Source Variable . . . . . . . . . . . . . . . . . . . . . . . . . . . . . . . 960Usage . . . . . . . . . . . . . . . . . . . . . . . . . . . . . . . . . . . . 960Use 1.x Behavior . . . . . . . . . . . . . . . . . . . . . . . . . . . . . . . . 960Use Aggregate Cache . . . . . . . . . . . . . . . . . . . . . . . . . . . . . . . 960Use Detail Value on Page . . . . . . . . . . . . . . . . . . . . . . . . . . . . . 961Use Embedded Data . . . . . . . . . . . . . . . . . . . . . . . . . . . . . . . 961Use for Parameter Info . . . . . . . . . . . . . . . . . . . . . . . . . . . . . . 961Use Local Cache . . . . . . . . . . . . . . . . . . . . . . . . . . . . . . . . 961User SAP Member Cache . . . . . . . . . . . . . . . . . . . . . . . . . . . . . 961Use Same Range For All Instances . . . . . . . . . . . . . . . . . . . . . . . . . . 962Use SAP MUN as Business Key . . . . . . . . . . . . . . . . . . . . . . . . . . . 962Use Set Aggregation . . . . . . . . . . . . . . . . . . . . . . . . . . . . . . . 962Use SQL Parameters . . . . . . . . . . . . . . . . . . . . . . . . . . . . . . . 962Use SQL With Clause. . . . . . . . . . . . . . . . . . . . . . . . . . . . . . . 963Use Thousands Separator . . . . . . . . . . . . . . . . . . . . . . . . . . . . . 963Use Value . . . . . . . . . . . . . . . . . . . . . . . . . . . . . . . . . . 963Use Value . . . . . . . . . . . . . . . . . . . . . . . . . . . . . . . . . . 963Value Location: . . . . . . . . . . . . . . . . . . . . . . . . . . . . . . . . . 963Value Markers . . . . . . . . . . . . . . . . . . . . . . . . . . . . . . . . . 963Value Range . . . . . . . . . . . . . . . . . . . . . . . . . . . . . . . . . . 964Value Representation . . . . . . . . . . . . . . . . . . . . . . . . . . . . . . . 964Values . . . . . . . . . . . . . . . . . . . . . . . . . . . . . . . . . . . . 964Values . . . . . . . . . . . . . . . . . . . . . . . . . . . . . . . . . . . . 964Values . . . . . . . . . . . . . . . . . . . . . . . . . . . . . . . . . . . . 964Values . . . . . . . . . . . . . . . . . . . . . . . . . . . . . . . . . . . . 964Value Type . . . . . . . . . . . . . . . . . . . . . . . . . . . . . . . . . . 965Variable . . . . . . . . . . . . . . . . . . . . . . . . . . . . . . . . . . . 965Variable for Maximum . . . . . . . . . . . . . . . . . . . . . . . . . . . . . . 965Variable for Minimum . . . . . . . . . . . . . . . . . . . . . . . . . . . . . . 965Vertical Alignment. . . . . . . . . . . . . . . . . . . . . . . . . . . . . . . . 965Visible. . . . . . . . . . . . . . . . . . . . . . . . . . . . . . . . . . . . 965Visible. . . . . . . . . . . . . . . . . . . . . . . . . . . . . . . . . . . . 966Visual Angle . . . . . . . . . . . . . . . . . . . . . . . . . . . . . . . . . 966White Space . . . . . . . . . . . . . . . . . . . . . . . . . . . . . . . . . . 966Width . . . . . . . . . . . . . . . . . . . . . . . . . . . . . . . . . . . . 967Width (px) . . . . . . . . . . . . . . . . . . . . . . . . . . . . . . . . . . 967Win Color . . . . . . . . . . . . . . . . . . . . . . . . . . . . . . . . . . 967Win-Loss Threshold . . . . . . . . . . . . . . . . . . . . . . . . . . . . . . . 967X Axis . . . . . . . . . . . . . . . . . . . . . . . . . . . . . . . . . . . . 967X Axis . . . . . . . . . . . . . . . . . . . . . . . . . . . . . . . . . . . . 968X-Axis Data Item Value . . . . . . . . . . . . . . . . . . . . . . . . . . . . . . 968Y1 Axis . . . . . . . . . . . . . . . . . . . . . . . . . . . . . . . . . . . 968Y2 Axis . . . . . . . . . . . . . . . . . . . . . . . . . . . . . . . . . . . 968Y2 Axis Position . . . . . . . . . . . . . . . . . . . . . . . . . . . . . . . . 968Y Axis . . . . . . . . . . . . . . . . . . . . . . . . . . . . . . . . . . . . 968Y Axis . . . . . . . . . . . . . . . . . . . . . . . . . . . . . . . . . . . . 968Y-Axis Data Item Value . . . . . . . . . . . . . . . . . . . . . . . . . . . . . . 969
Data Formatting Properties . . . . . . . . . . . . . . . . . . . . . . . . . . . . . . 969"Not Applicable" Characters . . . . . . . . . . . . . . . . . . . . . . . . . . . . 969Any Error Characters. . . . . . . . . . . . . . . . . . . . . . . . . . . . . . . 969Calendar Type . . . . . . . . . . . . . . . . . . . . . . . . . . . . . . . . . 969Clock . . . . . . . . . . . . . . . . . . . . . . . . . . . . . . . . . . . . 969Currency . . . . . . . . . . . . . . . . . . . . . . . . . . . . . . . . . . . 969Currency Display . . . . . . . . . . . . . . . . . . . . . . . . . . . . . . . . 969Currency Symbol . . . . . . . . . . . . . . . . . . . . . . . . . . . . . . . . 969Currency Symbol Position . . . . . . . . . . . . . . . . . . . . . . . . . . . . . 970Date Ordering . . . . . . . . . . . . . . . . . . . . . . . . . . . . . . . . . 970Date Separator . . . . . . . . . . . . . . . . . . . . . . . . . . . . . . . . . 970Date Style . . . . . . . . . . . . . . . . . . . . . . . . . . . . . . . . . . 970Decimal Separator . . . . . . . . . . . . . . . . . . . . . . . . . . . . . . . . 970Digit Shaping . . . . . . . . . . . . . . . . . . . . . . . . . . . . . . . . . 970
xliv IBM Cognos Report Studio Version 10.2.1: User Guide

Digit Shaping . . . . . . . . . . . . . . . . . . . . . . . . . . . . . . . . . 970Display AM / PM Symbols. . . . . . . . . . . . . . . . . . . . . . . . . . . . . 970Display As Exponent . . . . . . . . . . . . . . . . . . . . . . . . . . . . . . . 971Display Days . . . . . . . . . . . . . . . . . . . . . . . . . . . . . . . . . 971Display Eras. . . . . . . . . . . . . . . . . . . . . . . . . . . . . . . . . . 971Display Hours . . . . . . . . . . . . . . . . . . . . . . . . . . . . . . . . . 971Display Milliseconds . . . . . . . . . . . . . . . . . . . . . . . . . . . . . . . 971Display Minutes . . . . . . . . . . . . . . . . . . . . . . . . . . . . . . . . 971Display Months . . . . . . . . . . . . . . . . . . . . . . . . . . . . . . . . 971Display Months . . . . . . . . . . . . . . . . . . . . . . . . . . . . . . . . 971Display Seconds . . . . . . . . . . . . . . . . . . . . . . . . . . . . . . . . 971Display Time Zone . . . . . . . . . . . . . . . . . . . . . . . . . . . . . . . 971Display Weekdays . . . . . . . . . . . . . . . . . . . . . . . . . . . . . . . . 972Display Years . . . . . . . . . . . . . . . . . . . . . . . . . . . . . . . . . 972Display Years . . . . . . . . . . . . . . . . . . . . . . . . . . . . . . . . . 972Divide By Zero Characters . . . . . . . . . . . . . . . . . . . . . . . . . . . . . 972Exponent Symbol . . . . . . . . . . . . . . . . . . . . . . . . . . . . . . . . 972Group Size (digits) . . . . . . . . . . . . . . . . . . . . . . . . . . . . . . . 972International Currency Symbol . . . . . . . . . . . . . . . . . . . . . . . . . . . 972Mantissa (digits) . . . . . . . . . . . . . . . . . . . . . . . . . . . . . . . . 972Maximum No. of Digits . . . . . . . . . . . . . . . . . . . . . . . . . . . . . . 972Minimum No. of Digits . . . . . . . . . . . . . . . . . . . . . . . . . . . . . . 972Missing Value Characters . . . . . . . . . . . . . . . . . . . . . . . . . . . . . 973Negative Pattern . . . . . . . . . . . . . . . . . . . . . . . . . . . . . . . . 973Negative Sign Position . . . . . . . . . . . . . . . . . . . . . . . . . . . . . . 973Negative Sign Symbol . . . . . . . . . . . . . . . . . . . . . . . . . . . . . . 973No. of Decimal Places . . . . . . . . . . . . . . . . . . . . . . . . . . . . . . 973Numeric Overflow Characters . . . . . . . . . . . . . . . . . . . . . . . . . . . . 973Padding Character. . . . . . . . . . . . . . . . . . . . . . . . . . . . . . . . 973Pattern . . . . . . . . . . . . . . . . . . . . . . . . . . . . . . . . . . . 973Percentage Symbol . . . . . . . . . . . . . . . . . . . . . . . . . . . . . . . 973Percent Scale (integer) . . . . . . . . . . . . . . . . . . . . . . . . . . . . . . 973Scale . . . . . . . . . . . . . . . . . . . . . . . . . . . . . . . . . . . . 974Secondary Group Size (digits) . . . . . . . . . . . . . . . . . . . . . . . . . . . . 974Security Error Characters . . . . . . . . . . . . . . . . . . . . . . . . . . . . . 974Thousands Separator . . . . . . . . . . . . . . . . . . . . . . . . . . . . . . . 974Time Separator . . . . . . . . . . . . . . . . . . . . . . . . . . . . . . . . . 974Time Style . . . . . . . . . . . . . . . . . . . . . . . . . . . . . . . . . . 974Time Unit . . . . . . . . . . . . . . . . . . . . . . . . . . . . . . . . . . 974Use Thousands Separator . . . . . . . . . . . . . . . . . . . . . . . . . . . . . 974Zero Value Characters . . . . . . . . . . . . . . . . . . . . . . . . . . . . . . 974
Appendix H. Prompt API for IBM Cognos BI . . . . . . . . . . . . . . . . . . . 975cognos.Prompt object . . . . . . . . . . . . . . . . . . . . . . . . . . . . . . . . 975
cognos.Prompt.getControlByName method . . . . . . . . . . . . . . . . . . . . . . . . 975cognos.Prompt.getControls method . . . . . . . . . . . . . . . . . . . . . . . . . . 975
cognos.Prompt.Control object . . . . . . . . . . . . . . . . . . . . . . . . . . . . . 976cognos.Prompt.Control.addValues method . . . . . . . . . . . . . . . . . . . . . . . 976cognos.Prompt.Control.clearValues method . . . . . . . . . . . . . . . . . . . . . . . 977cognos.Prompt.Control.getName method . . . . . . . . . . . . . . . . . . . . . . . . 977cognos.Prompt.Control.getValues method . . . . . . . . . . . . . . . . . . . . . . . 977cognos.Prompt.Control.setValidator method . . . . . . . . . . . . . . . . . . . . . . 978cognos.Prompt.Control.setValues method . . . . . . . . . . . . . . . . . . . . . . . 979
cognos.Report object . . . . . . . . . . . . . . . . . . . . . . . . . . . . . . . . 980cognos.Report.getReport method . . . . . . . . . . . . . . . . . . . . . . . . . . 980cognos.Report.sendRequest method . . . . . . . . . . . . . . . . . . . . . . . . . . 980
cognos.Report.Action object . . . . . . . . . . . . . . . . . . . . . . . . . . . . . 981cognos.Report.Action.BACK . . . . . . . . . . . . . . . . . . . . . . . . . . . . 981cognos.Report.Action.CANCEL . . . . . . . . . . . . . . . . . . . . . . . . . . . . 981cognos.Report.Action.FINISH . . . . . . . . . . . . . . . . . . . . . . . . . . . . 981cognos.Report.Action.NEXT . . . . . . . . . . . . . . . . . . . . . . . . . . . . 981
Contents xlv

cognos.Report.Action.REPROMPT . . . . . . . . . . . . . . . . . . . . . . . . . . . 981cognos.Value class. . . . . . . . . . . . . . . . . . . . . . . . . . . . . . . . . 982
Notices . . . . . . . . . . . . . . . . . . . . . . . . . . . . . . . . . . . 983
Glossary . . . . . . . . . . . . . . . . . . . . . . . . . . . . . . . . . . 987A . . . . . . . . . . . . . . . . . . . . . . . . . . . . . . . . . . . . . . 987B . . . . . . . . . . . . . . . . . . . . . . . . . . . . . . . . . . . . . . 987C . . . . . . . . . . . . . . . . . . . . . . . . . . . . . . . . . . . . . . 988D . . . . . . . . . . . . . . . . . . . . . . . . . . . . . . . . . . . . . . 989E . . . . . . . . . . . . . . . . . . . . . . . . . . . . . . . . . . . . . . 989F . . . . . . . . . . . . . . . . . . . . . . . . . . . . . . . . . . . . . . 990G . . . . . . . . . . . . . . . . . . . . . . . . . . . . . . . . . . . . . . 990H . . . . . . . . . . . . . . . . . . . . . . . . . . . . . . . . . . . . . . 990I. . . . . . . . . . . . . . . . . . . . . . . . . . . . . . . . . . . . . . . 990J. . . . . . . . . . . . . . . . . . . . . . . . . . . . . . . . . . . . . . . 990L . . . . . . . . . . . . . . . . . . . . . . . . . . . . . . . . . . . . . . 990M . . . . . . . . . . . . . . . . . . . . . . . . . . . . . . . . . . . . . . 990N . . . . . . . . . . . . . . . . . . . . . . . . . . . . . . . . . . . . . . 991O . . . . . . . . . . . . . . . . . . . . . . . . . . . . . . . . . . . . . . 991P . . . . . . . . . . . . . . . . . . . . . . . . . . . . . . . . . . . . . . 992Q . . . . . . . . . . . . . . . . . . . . . . . . . . . . . . . . . . . . . . 992R . . . . . . . . . . . . . . . . . . . . . . . . . . . . . . . . . . . . . . 992S . . . . . . . . . . . . . . . . . . . . . . . . . . . . . . . . . . . . . . 993T . . . . . . . . . . . . . . . . . . . . . . . . . . . . . . . . . . . . . . 993U . . . . . . . . . . . . . . . . . . . . . . . . . . . . . . . . . . . . . . 994W . . . . . . . . . . . . . . . . . . . . . . . . . . . . . . . . . . . . . . 994
Index . . . . . . . . . . . . . . . . . . . . . . . . . . . . . . . . . . . . 995
xlvi IBM Cognos Report Studio Version 10.2.1: User Guide

Introduction
This document is intended for use with IBM® Cognos® Report Studio. It providesstep-by-step procedures and background information to help you create standardand complex reports. Report Studio is a Web product for creating reports thatanalyze corporate data according to specific information needs.
Finding information
To find IBM Cognos product documentation on the web, including all translateddocumentation, access one of the IBM Cognos Information Centers(http://pic.dhe.ibm.com/infocenter/cogic/v1r0m0/index.jsp). Release Notes arepublished directly to Information Centers, and include links to the latest technotesand APARs.
You can also read PDF versions of the product release notes and installation guidesdirectly from IBM Cognos product disks.
Accessibility features
Accessibility features help users who have a physical disability, such as restrictedmobility or limited vision, to use information technology products. Report Studiohas accessibility features. For more information, see Appendix A, “AccessibilityFeatures,” on page 467.
IBM Cognos HTML documentation has accessibility features. PDF documents aresupplemental and, as such, include no added accessibility features.
Forward-looking statements
This documentation describes the current functionality of the product. Referencesto items that are not currently available may be included. No implication of anyfuture availability should be inferred. Any such references are not a commitment,promise, or legal obligation to deliver any material, code, or functionality. Thedevelopment, release, and timing of features or functionality remain at the solediscretion of IBM.
Samples disclaimer
The Sample Outdoors Company, Great Outdoors Company, GO Sales, anyvariation of the Sample Outdoors or Great Outdoors names, and Planning Sampledepict fictitious business operations with sample data used to develop sampleapplications for IBM and IBM customers. These fictitious records include sampledata for sales transactions, product distribution, finance, and human resources.Any resemblance to actual names, addresses, contact numbers, or transactionvalues is coincidental. Other sample files may contain fictional data manually ormachine generated, factual data compiled from academic or public sources, or dataused with permission of the copyright holder, for use as sample data to developsample applications. Product names referenced may be the trademarks of theirrespective owners. Unauthorized duplication is prohibited.
© Copyright IBM Corp. 2005, 2013 xlvii

xlviii IBM Cognos Report Studio Version 10.2.1: User Guide

Chapter 1. What's New in Cognos Report Studio?
This section contains a list of new, changed, and removed features for this release.It will help you plan your upgrade and application deployment strategies and thetraining requirements for your users.
For information about upgrading, see the IBM Cognos Business IntelligenceInstallation and Configuration Guide for your product.
For information about other new features for this release, see the IBM CognosBusiness Intelligence New Features Guide.
To view What's New information for past releases, including version 8.4, accessone of the IBM Cognos Information Centers (http://pic.dhe.ibm.com/infocenter/cogic/v1r0m0/index.jsp).
To review an up-to-date list of the environments that are supported by IBMCognos products, including information about operating systems, patches,browsers, web servers, directory servers, database servers, and application servers,visit the IBM Cognos Customer Center (http://www.ibm.com/software/data/cognos/customercenter).
New features in version 10.2.1The following topics describe the new features in this release.
Improved IBM Cognos Active Report performanceActive Report performance is improved in this release.
You can now compress Active Report output. The compression feature compressesActive Report controls within the output and produces files that are smaller andopen faster. The compression feature significantly improves the performance ofActive Reports that include large amounts data versus graphical content. Theoption to compress Active Report output is set in the Active Report Propertieswindow.
In addition, improvements to the Active Report engine streamline performance,and result in improved memory consumption characteristics. With theseimprovements, large active reports perform better, particularly when they areconsumed within the IBM Cognos Business Intelligence Mobile application.Related tasks:“Specify Active Report Properties” on page 173You can specify properties for active reports, such as the text that appears in thebrowser window title bar, the maximum number of rows that a report can contain,and an access code that users must enter to view a report.
Extensible visualizations in IBM Cognos Active ReportWith extensible visualizations, you can use innovative new visualizations in activereports.
© Copyright IBM Corp. 2005, 2013 1

IBM Cognos Business Intelligence introduces new visualizations to Report Studio,such as treemaps and packed bubble visualizations. Your administrator candownload sample visualizations to a gallery that is accessible from the ActiveReport authoring environment. Sample visualizations can be used or modified tomeet your requirements.Related concepts:“Extensible visualizations” on page 173You can use extensible client-side visualizations in IBM Cognos Active Report tovisualize data.
Option to group or ungroup repeating cells in Excel 2007reports
When you produce reports in Excel 2007 format, you can choose to grouprepeating cells into a single merged cell.
Grouped or ungrouped cells are produced by various report objects, such asgrouped data items, headers and footers, and nested objects. The option to groupor ungroup repeating cells is controlled by the Group repeating cells whenexporting to Excel report property.Related concepts:“Option to group repeating cells in reports produced in Excel 2007 format” onpage 50When you produce reports in Excel 2007 format, you can specify whetherrepeating cells are grouped, or merged, into a single cell.
Crosstab values as percentagesIn crosstabs, you can now show values as a percentage of a summary instead ofthe actual values. For example, you can show the revenue that was generated byeach product line as a percentage of the total revenue.Related tasks:“Showing crosstab values as percentages” on page 72When you work with dimensional data sources, you can show crosstab values as apercentage of a summary instead of the actual values. When you show values as apercentage, you can compare the contribution of an item to the whole.
Share sets between reportsWhen you work with dimensional data, you can now share a set. Shared setsappear in the model tree for inclusion in other reports.
When you include a shared set, you can designate it to be either Run Time orDesign Time. If a set is designated as Run Time, the report always uses whateveris in the shared set as it is defined. If a set is designated as Design Time, thereport caches the contents of the shared set at the time when it is initially included.The report uses this definition until you explicitly refresh it.Related tasks:“Sharing sets between reports” on page 259When you are working with dimensional data, you can share a set to make itavailable for inclusion in multiple reports.
Improved text-based relational filtersYou can now define relational filters that are based on a text pattern.
2 IBM Cognos Report Studio Version 10.2.1: User Guide

In previous releases, text-based relational filters were defined by selecting actualvalues, such as Camping Equipment. Performance is impacted when the number ofstrings in a filter condition increases. This feature automatically generates filtersthat contain strings or members that match a text pattern. The following textmatching options are available:v Starts withv Ends withv Containsv Matches SQL patternRelated tasks:“Create a Detail or Summary Filter” on page 229Add a filter expression to focus a report and minimize processing time byexcluding unwanted data. For example, you can filter data to show only customerswho placed purchase orders that were valued at over one thousand dollars duringthe past year. When you run the report, you see only the filtered data.
Improved data container and query naming supportIn IBM Cognos Report Studio, when you insert a data container from the toolboxtab into a report, you can immediately specify a name for the container and aname for the query that you want to link to the container. You can also link anexisting query to the container.
In previous releases, Cognos Report Studio automatically generated the names fordata containers that are inserted in a report and the names of the queries that arelinked to the containers. For example, when you insert a list, the generated nameof the list is List1, and the name of the query that is linked to the list is Query1. Tochange either name, you must modify the Name property of the object in theProperties pane.Related tasks:“Inserting a data container from the toolbox tab” on page 41In addition to choosing a basic report layout when you create a report, you caninsert data containers from the toolbox tab into a report in IBM Cognos ReportStudio.
Search parameter Ends with any of these keywordsA search parameter, Ends with any of these keywords, is now available when youperform searches, such as when you search for members when you create a filterexpression.
Removed Features in Version 10.2.1The following features were removed since the last release.
IBM Cognos StatisticsIBM Cognos Statistics was removed from this version of IBM Cognos BusinessIntelligence.
To ensure that reports that were created in previous releases, and that containstatistical objects, will run in this and future releases, statistical objects are removedwhen the reports are upgraded. Each removed statistical object is replaced with thefollowing image:
Chapter 1. What's New in Cognos Report Studio? 3

A warning also appears in the Upgrade Information window for each statisticalobject that is replaced with the image.
Tip: Queries and their data items that are associated to statistical objects are notremoved from upgraded reports.
You can use IBM SPSS® Statistics to perform statistical reporting and analysis.
New features in version 10.2.0This section describes new features in this release.
Updated world and Africa mapsThe world and Africa maps were updated to include the region of South Sudan inIBM Cognos Report Studio version 10.2.0.Related tasks:“Use maps from previous versions” on page 9The old versions of the World, Europe, Africa, and India maps that were includedwith IBM Cognos Business Intelligence prior to version 10.1.1 are still available. Tocontinue using the previous maps, your IBM Cognos BI administrator must enablethem.
Interactive repeater tablesYou can now add interactive behavior to repeater tables in IBM Cognos ActiveReport.
Adding interactive behavior to repeater tables is useful for creating button barsand grids of custom content. For example, you can insert a data item in a repeatertable that shows a different chart for each data value. You can customize therepeater table so that the data values appear as buttons in a two-column grid.Related concepts:“Adding Controls to a Report” on page 185IBM Cognos Active Report offers several active report controls. For many controls,two different versions are available, a static version and a data-driven version.
Improved IBM Cognos Active Report integration with IBMCognos Workspace
Check boxes and sliders in workspaces in IBM Cognos Workspace can now driveIBM Cognos Active Report.
You can define public variables and range variables in Cognos Active Report thatallow Cognos Workspace check boxes and sliders to drive active reports in aworkspace.
Figure 1. Image that replaces statistical objects in upgraded reports
4 IBM Cognos Report Studio Version 10.2.1: User Guide

Related tasks:“Create and Manage Active Report Variables” on page 184Create active report variables to allow controls in a report to interact with eachother. Active report variables pass information from one control to another control.
Improved support for bidirectional languagesIBM Cognos Report Studio offers improved support for bidirectional languages.
The improved support for bidirectional languages includes the followingcapabilities:v Base text direction for text in more report objects, such as charts, maps, and
promptsv Control of object direction for charts, maps, and promptsv Digit shaping
In addition, the improved support for bidirectional languages includes the reportformats PDF, Microsoft Excel, and IBM Cognos Active Report.Related concepts:“Support for bidirectional languages” on page 56You can author reports that support bidirectional languages. You can specify basetext direction, digit shaping, and container direction.
Macro tab in expression editorA macro tab is now available in the IBM Cognos Report Studio expression editor.With the macro tab, you can add parameter maps, session parameters, and macrofunctions to expressions.Related tasks:“Insert a Query Calculation” on page 250Insert a query calculation into your report to add a new row or column withvalues that are based on a calculation.“Insert a Query Calculation” on page 303When working with dimensional data, insert a query calculation into your reportto add a new row or column with values that are based on a calculation. Forexample, you create a query calculation named Euros that converts dollars to eurosby multiplying an existing dollar measure by a conversion rate. Euros can then bedisplayed to end users in a separate row or column.
Inherited table styles in lists and crosstabsWhen an item is inserted in a list or crosstab, the item inherits the table style ofone of the items in the data container.
By default, items inherit the style of an item of the same type. For example, if youinsert a measure in a list, the measure inherits the style of a measure that is in thelist, if one exists. Inheritance rules control which style is inherited.
Chapter 1. What's New in Cognos Report Studio? 5

Related tasks:“Apply a Table Style” on page 340Apply a table style to quickly format tables. You can also apply a table style tolists, crosstabs, and repeater tables.
Enhanced crosstab headersIn crosstabs, you can display headers that indicate the parent categories of the dataitems in the columns and rows. The headers help users to understand where thedata is located in the hierarchy.Related tasks:“Creating headers automatically for sets in crosstabs” on page 72You can automatically add header labels on columns and rows when working withsets in a crosstab that uses a dimensional data source. The headers help consumersof the report to understand where the data is in the hierarchy.
Prompt APIA JavaScript Prompt API is available to provide report authors with a method ofcustomizing prompt interaction in the reports that they author.
With the prompt API, JavaScript applications can interact with IBM CognosBusiness Intelligence report prompts for the purposes of validation or custominteraction. The prompt API can query and set user selections, validate typed-invalues using patterns, set default values using expressions or query data, andmore. Sample reports exist to demonstrate various usage scenarios of the promptAPI.Related reference:Appendix H, “Prompt API for IBM Cognos BI,” on page 975The JavaScript Prompt API provides report authors with a method of customizingprompt interaction in the reports they author.
Excel 2007 Data report output formatA new Excel output format, Excel 2007 Data, is available in IBM Cognos ReportStudio. The Excel 2007 Data report output format generates native Microsoft Excel2007 spreadsheets containing list report data for further manipulation.
This format is similar to a comma-separated values file (.csv). It has no formattingsuch as headers, footers, styling, or data formatting.Related concepts:“Producing a Report in Microsoft Excel Format” on page 49You can export your report output to several different Microsoft Excel spreadsheetsoftware formats.
Global classes for accessible reportsNew global classes that you can apply to text objects were added to IBM CognosReport Studio. The new classes make text easier to read for visually impairedusers.
The new global classes are as follows:v Heading 1 to heading 6v Emphasize textv Strong text
6 IBM Cognos Report Studio Version 10.2.1: User Guide

Related concepts:“Headings and emphasis” on page 471You can apply certain global classes to text objects to make the text easier to readfor visually impaired users.
Changed features in version 10.2.0This section describes changed features since the last release.
Support for inline prompts in reports viewed on mobiledevices
IBM Cognos Mobile now supports several inline prompt types. Previously, allinline prompts in reports viewed on a mobile device appeared in a prompt page.
The prompt types that Cognos Mobile supports as inline prompts are as follows:v Text Boxv Valuev Datev Timev Date & Timev Interval
Cognos Business Insight and Cognos Business InsightAdvanced are renamed
Two product components are renamed in this release to avoid confusion with thenames of other components. IBM Cognos Business Insight is now IBM CognosWorkspace. IBM Cognos Business Insight Advanced is now IBM CognosWorkspace Advanced.
Removed Features in Version 10.2.0This section describes features that were removed since the last release.
Saving and opening reports on your computerThe ability to save and open reports locally on your computer by enabling theAllow local file access option was removed in this release.
To save and open reports on your computer, use the Copy Report to Clipboardand Open Report from Clipboard commands in the Tools menu instead.Related concepts:“Copy a Report to the Clipboard” on page 453You can copy a report specification to the clipboard so you can open it from theclipboard later.Related tasks:“Open a Report from the Clipboard” on page 453You can open a report specification that was previously copied to the clipboard.
New features in version 10.1.1Listed below are new features since the last release.
Chapter 1. What's New in Cognos Report Studio? 7

New active report controlsIBM Cognos Active Report offers new controls, including iterators, sliders, and rownumbers.Related concepts:“Adding Controls to a Report” on page 185IBM Cognos Active Report offers several active report controls. For many controls,two different versions are available, a static version and a data-driven version.
Conversion of controls to other types of controlsYou can now convert a control in an active report to another type of control that iscompatible to the original control. For example, you can convert a radio buttongroup control to a check box group control.Related concepts:“Adding Controls to a Report” on page 185IBM Cognos Active Report offers several active report controls. For many controls,two different versions are available, a static version and a data-driven version.
Improved user experience when authoring active reportsImprovements were made to the IBM Cognos Report Studio user interface forauthoring active reports. For example, there are two new tabs that respectivelyshow the controls and variables defined in a report.
Controls are shown in a hierarchical structure, allowing you to see theirrelationships to one another as well as the variables that drive them. For eachvariable in a report, you can see the default values defined for each one, as well asthe controls to which they are linked.Related tasks:“Create and Manage Active Report Variables” on page 184Create active report variables to allow controls in a report to interact with eachother. Active report variables pass information from one control to another control.“Define a Connection Between Controls” on page 192Define a connection between controls to link them together. When you linkcontrols, an action performed on one control affects the behavior of the othercontrol.
Active report access codeYou can now specify an access code that users will have to enter before they canview an active report.Related tasks:“Specify Active Report Properties” on page 173You can specify properties for active reports, such as the text that appears in thebrowser window title bar, the maximum number of rows that a report can contain,and an access code that users must enter to view a report.
New startup optionsA new Start page view option allows you to specify whether IBM Cognos ReportStudio opens in Page Design or Page Structure view (Tools > Options > View).By default, Report Studio opens in Page Design view.
8 IBM Cognos Report Studio Version 10.2.1: User Guide

Related concepts:“Options” on page 32You can set various options that control the appearance and behavior of IBMCognos Report Studio (Tools, Options).
Keyboard shortcuts for accessibilityTo make the report authoring experience more accessible to people who have aphysical disability, such as restricted mobility or limited vision, IBM CognosReport Studio now includes new keyboard shortcuts to allow navigating the userinterface with a keyboard.Related concepts:“Keyboard Shortcuts” on page 467This product uses some standard Microsoft Windows and accessibility shortcutkeys.
Updated mapsSome maps included with IBM Cognos Report Studio version 10.1.1 were updated.v The World and Europe maps were updated to include the countries and regions
of Montenegro and Kosovo.v The India map was updated to include the northern region of Kashmir.Related concepts:Chapter 7, “Maps,” on page 161IBM Cognos Report Studio provides a set of maps that you can use to representtabular data in a spatial context. For example, on a map of the world, countriesand regions can be colored to represent the level of revenue.
Use maps from previous versionsThe old versions of the World, Europe, Africa, and India maps that were includedwith IBM Cognos Business Intelligence prior to version 10.1.1 are still available. Tocontinue using the previous maps, your IBM Cognos BI administrator must enablethem.
Procedure1. Go to the c10_location/maps directory.2. Rename the files world.cmf, europe.cmf, africa.cmf, and india.cmf to remove
the .cmf extension, as follows: world_default_cmf, europe_default_cmf,africa_default_cmf, and india_default_cmf.
3. Rename the files world8_4_cmf, europe8_4_cmf, africa8_4_cmf, andindiaUN_cmf to remove 8_4 and add the .cmf extension, as follows: world.cmf,europe.cmf. africa.cmf, and india.cmf.
Custom groupsYou can create custom groups of existing data items based on elements that youdefine and that are meaningful to you.
For example, you can create custom groups for product names based on theiralphabetical order. You might create groups for products that start with the lettersA to C, D to F, G to H, and so on.
Chapter 1. What's New in Cognos Report Studio? 9

Related tasks:“Creating relational custom groups” on page 215Create custom groups to classify existing data items into groups that aremeaningful to you.“Creating dimensional custom groups” on page 265Create custom groups to classify existing data items into groups that aremeaningful to you.
Larger worksheet sizes for Microsoft Excel 2007 reportoutputs
IBM Cognos Business Intelligence now supports a larger worksheet size for reportoutputs exported in Microsoft Excel 2007 format.
In previous versions of IBM Cognos Business Intelligence, report output inMicrosoft Excel format was limited to a maximum of 256 columns by 65,000 rows.Although this remains as the default worksheet size, administrators can nowenable larger worksheets and change the maximum number of rows in aworksheet - up to a maximum of 16,384 columns by 1,048,576 rows - by usingadvanced server properties. This number matches the Microsoft Excel 2007worksheet size limitations.
For more information, see the IBM Cognos Business Intelligence Administration andSecurity Guide.
For an up-to-date list of environments supported by IBM Cognos products, such asoperating systems, patches, browsers, Web servers, directory servers, databaseservers, and application servers, visit http://www.ibm.com/.Related concepts:“Producing a Report in Microsoft Excel Format” on page 49You can export your report output to several different Microsoft Excel spreadsheetsoftware formats.
Microsoft Excel 2007 supported as an external data sourceIBM Cognos Business Intelligence now supports external data sources fromMicrosoft Excel up to version Microsoft Excel 2007.
For an up-to-date list of environments supported by IBM Cognos products, such asoperating systems, patches, browsers, Web servers, directory servers, databaseservers, and application servers, visit http://www.ibm.com/.Related concepts:“Use Your Own External Data” on page 11You can now supplement your enterprise data with your own external data file.
Changed features in version 10.1.1Listed below are changed features since the last release.
Specify how to show no data contentsThe user interface for specifying what appears for data containers that contain nodata was modified.
You can now select between showing an empty data container, alternate contentthat you specify, or text that you specify.
10 IBM Cognos Report Studio Version 10.2.1: User Guide
The new default for data containers that have no data available is to show the textNo Data Available instead of showing an empty data container.Related tasks:“Specify what appears for data containers that contain no data” on page 392You can specify what appears in a data container when no data is available fromthe database.
What's new in version 10.1.0This section contains a list of new, changed, and removed features for past releases.
Knowing this information will help you plan your upgrade and applicationdeployment strategies and the training requirements for your users.
To review an up-to-date list of environments supported by IBM Cognos products,such as operating systems, patches, browsers, Web servers, directory servers,database servers, and application servers, visit www.ibm.com.
For information about upgrading, see the IBM Cognos Business IntelligenceInstallation and Configuration Guide for your product.
For an overview of new features for this release, see the IBM Cognos BusinessIntelligence New Features Guide.
New Features in Version 10.1.0Listed below are new features since the last release.
Use Your Own External DataYou can now supplement your enterprise data with your own external data file.
You can import an .xls, .txt, .csv, or .xml file into IBM Cognos and create reportsthat contain your own data. This allows you to leverage the IBM Cognos platform,including the security, data integrity, and full range of reporting functionality.
You can perform self-service reporting without the need to ask your IT departmentor administrator to set up a data source connection to your file. You import yourown data file and start reporting on it right away.
After importing, your external data file is protected by the same IBM Cognossecurity as your enterprise data, thus allowing you to report on your data in asecure environment.
Active ReportsYou can now use IBM Cognos Report Studio to create active reports.
IBM Cognos Active Report is a report output type that provides a highlyinteractive and easy-to-use managed report. Active reports are built for businessusers, allowing them to explore their data and derive additional insight.
Active reports make business intelligence easier for the casual user. Report authorsbuild reports targeted at their users' needs, keeping the user experience simple andengaging. Active reports can be consumed by users who are offline, making theman ideal solution for remote users such as the sales force.
Chapter 1. What's New in Cognos Report Studio? 11

Related concepts:Chapter 8, “Active Reports,” on page 171You can use IBM Cognos Report Studio to create active reports. IBM CognosActive Report is a report output type that provides a highly interactive andeasy-to-use managed report. Active reports are built for business users, allowingthem to explore their data and derive additional insight.
Statistical AnalysisIBM Cognos Report Studio now offers statistical functionality in an add-onpackage called IBM Cognos Statistics.
Report Studio integrates statistical analysis and reporting, providing you with thecapability to distribute reports that now can include statistical information. Unlikespecialized statistical tools, this functionality is easy to use within the IBM CognosBusiness Intelligence authoring environment.
This functionality covers three main areas in statistical analysis:v the distribution of datav data analysis and testingv statistical process control
Mozilla Firefox SupportVersions 3.5 and 3.6 of the Mozilla Firefox Web browser are now supported forIBM Cognos Report Studio.
For a full list of supported software environments, see http://www.ibm.com/.
Enhanced chartsChart enhancements concentrate on improved effectiveness of communication. Thenew bullet chart and extensions to pie and gauge charts are especially beneficial indashboard reports. Additional enhancements provide superior presentationthrough conditional notes and markers and improved legends.
Current Default Charts and Legacy Charts:
IBM Cognos Report Studio has a new default chart technology. Any new chartsadded to a report use the current default charts.
The current default charts use more properties that allow you to customize moreaspects of the chart. In addition, the current default charts offer you a preview ofthe style changes that you make to your chart.
If you prefer to continue working with the legacy charts, you can select the Uselegacy chart authoring option.
You can also convert legacy charts to the current default charts. When you converta chart to a different chart type, Report Studio maps the chart properties that existin the new chart type. For more information, see “Upgrading Legacy Charts” onpage 462 and “Convert Charts From One Type to Another” on page 102.
12 IBM Cognos Report Studio Version 10.2.1: User Guide

Related concepts:“Current Default Charts and Legacy Charts” on page 79IBM Cognos Report Studio has a new default chart technology as of version 10.1.0.
Bullet Charts:
You can now create bullet charts to complement your dashboard reports and as analternative to gauge charts.
A bullet chart features a single primary measure, such as current revenue,compares that measure to one or more other measures to enrich its meaning, suchas the target or planned revenue, and displays it in the context of a qualitativerange of performance, such as poor, satisfactory, or good.Related concepts:“Bullet Charts” on page 93Bullet charts are a variation of bar charts. They compare a featured measure (thebullet) to a targeted measure (the target). They also relate the compared measuresagainst colored regions in the background that provide additional qualitativemeasurements, such as good, satisfactory, and poor.
Chart Matrix:
You can now convert a complex nested chart into a matrix configuration thatshows multiple small charts arranged in rows and columns.
The numeric scale of all the charts is the same so that you can easily compare andanalyze values from each chart.Related tasks:“Create a Matrix of Current Default Charts” on page 142You can view a complex chart that includes nested series or categories into amatrix, or crosstab, that shows multiple small charts arranged in rows andcolumns.
Customize the Legend:
You can hide or show the legend and change its position relative to the chartobject, chart area, or using a specific report expression.
For more information, see “Customize the Legend in a Current Default Chart” onpage 124.
If your legend includes items that are too long, you can truncate long legend itemsat a specific number of characters. You can also show the values of the data itemsin your legend. For more information, see “Customize the Items in the Legend of aCurrent Default Chart” on page 125.
Legends can display trend lines and conditional item entries.
Colored Regions:
You can now define colored regions in the body of a chart to make your chartmore informative.
Chapter 1. What's New in Cognos Report Studio? 13

For example, you can divide the background of a scatter chart into quadrants andcolor each quadrant. For more information, see “Add Colored Regions in a CurrentDefault Chart” on page 117.
Enhanced Pie Charts:
You can customize how data labels appear in a pie chart, including their formatand placement.
For more information, see “Showing data values in current default pie and donutcharts” on page 137.
To make your pie charts easier to read and analyze, you can now:v pull out pie slices from the rest of the pie to highlight them. For more
information, see “Pull Out Pie Slices in a Current Default Pie Chart” on page149.
v set the position at which the first slice in a pie chart appears. For moreinformation, see “Set the Position of the First Slice in a Current Default PieChart” on page 148.
v summarize the smaller slices in a pie chart to avoid having many tiny slices inyour pie. For more information, see “Summarize Small Slices, Bars, or Columnsin Current Default Charts” on page 139.
Enhanced Chart Styles:
You can customize the palette, drop shadows, gridlines, backgrounds, and barshapes in charts.
You can create a new chart palette or edit an existing chart palette, includingspecifying colors, fill types, and patterns. For more information, see “Customizingthe Color Palette of a Chart” on page 108.
You can add drop shadows to chart elements, such as lines in line charts. For moreinformation, please see “Add Background Effects to a Chart Object in a LegacyChart” on page 116.
You can customize the color, style, and weight of chart gridlines or set thebackground of your chart to display bands of color. For more information, see“Show Gridlines in a Current Default Chart” on page 123.
You can change the bar shape in a bar or column chart to one of the following twodimensional and three dimensional shapes: box, cylinder, cone, pyramid, rectangle,and triangle. You can also change the width of the bars or columns in a bar orcolumn chart to a percentage of the chart body, such as 80% or 25%.
Chart Axes:
To make your charts easier to read, you can now customize the color, style, weight,and transparency of chart axis lines and specify where to display major and minorgridlines on the chart.
For more information, see “Customize the Axes of a Current Default Chart” onpage 120.
14 IBM Cognos Report Studio Version 10.2.1: User Guide
Color by Value in Scatter and Bubble Charts:
In scatter and bubble charts, you can now specify data to appear in different colorsbased on the data values.
The color of the points or bubbles adds an additional aspect to the chart to assistyou in finding relationships in large amounts of data. An entry appears in thelegend to identify the color and its value. For more information, see “Define Colorby Value in Current Default Scatter and Bubble Charts” on page 146.
Bubble Size:
In a bubble chart, you can now set the maximum and minimum bubble size andspecify the smallest bubble to show in the chart.
For more information, see “Specify the Bubble Size in a Current Default BubbleChart” on page 148.
Positioning and Formatting Notes:
When you add a note to a chart, you can now set the note's position relative to thesides of the chart area or chart body. You can also use a report expression toposition the note next to a data item within the chart.
For example, in a bar chart showing revenue for each product line by country orregion, you could type [Country or Region]='Canada' to position the note relativeto the Canada bar. You can also customize the background of the note with colorand background images. For more information, see “Add a Note to a CurrentDefault Chart” on page 127.
Insert Charts With the Toolbar Button:
You can now insert a specific chart type from any report with the insert chart
button on the toolbar. When you insert a chart into a report that alreadycontains a list, the list data is added to the chart automatically.
Enhancements to the User InterfaceIBM Cognos Report Studio includes enhancements to the user interface layout,buttons, tooltips, and visual aids.
These enhancements include the following:v You can now position the content and Properties panes to the right of the work
area, to match the user interface of IBM Cognos Business Insight and IBMCognos Business Insight Advanced. For more information, see “Options” onpage 32.
v When working with dimensional data sources, the insert individual members
button and the insert member with children button have moved to
the Source tab . These buttons have the same function as they did in theprevious release. For more information, see “Insert a Member” on page 255.
v When working with dimensional and mixed model data sources, you can nowswitch between viewing the full data tree and the dimensional-only data tree by
Chapter 1. What's New in Cognos Report Studio? 15

clicking the view package tree button and the view members tree button
. For more information, see “Add Dimensional Data to a Report” on page253.These same buttons are available in the expression editor.
v You can now remove all of the filters at once from your report with new options
in the filters button . For more information, see “Focusing DimensionalData” on page 278 and “Focusing Relational Data” on page 228.
v Expanded tooltips for toolbar buttons now include a description of what thebutton does. To see a tooltip, pause the pointer over a button in the toolbar. Youcan turn off the expanded tooltips (Tools, Options).
v A new Show Container Selectors visual aid allows you to select list, crosstab,repeater table, table of contents, active report application objects, and tablecontainer objects with one click. When enabled, a small clickable region (threeorange dots) appears in the top left corner of these report objects. This selectorprovides easier access to the container objects' properties and allows you toeasily move containers with one mouse gesture. For more information, see“Visual Aids Button” on page 27.
Improved Set OperationsYou can now perform more operations on a set of members when working withdimensional data sources.
You can do the following by right-clicking a set, and clicking Edit Set:v Exclude members from the initial set or from the set as it is currently shown.
For more information, see “Exclude Members from a Set” on page 261.v Move members to the top or bottom of the set.
For more information, see “Move Members Within a Set” on page 261.v Show only the members with the top or bottom values.
For more information, see “Limit Data to Top or Bottom Values” on page 262.v Filter the members in a set.
For more information, see “Filter the Members Within a Set” on page 262.v Expand and collapse members to add its child members below it as new rows.
For more information, see “Expand and Collapse a Member Within a Set” onpage 263.
Preview Reports when Opening and SavingYou can now see a preview of the report when you open or save it (Tools,Options, Display report preview).
For more information, see “Options” on page 32.
Report Name Used for the Exported Output File NameWhen you run a report in an export format such as PDF, delimited text (CSV),Microsoft Excel (XLS), the IBM Cognos report name is now used as the exportedfile name.
This allows you to save the report output using the same name as the originalreport. For more information, see “Run a Report” on page 45.
16 IBM Cognos Report Studio Version 10.2.1: User Guide

Enhancements for SAP BW Data SourcesIBM Cognos Business Intelligence includes prompting for SAP BW variables andtime-dependent hierarchies when creating reports with SAP BW data sources.
Prompting for SAP BW Variables
SAP BW variables are parameters in a SAP BW query that your businesswarehouse administrator sets up. When the queries run, the SAP BW variables arefilled with values. SAP BW variables are automatically exposed as prompts whenyou run a report or when you add data to a report.
Prompting for SAP BW variables in IBM Cognos BI has improved. You areprompted for optional variables when you initially drag and drop data items.
Time-dependent Hierarchies
Time-dependant hierarchies now automatically reflect hierarchy or structurechanges. When a structure is imported into IBM Cognos Framework Manager, eachSAP BW time hierarchy is depicted as an individual level. IBM Cognos ReportStudio users can use these structures to report on and compare levels that are validfor a specific time period.
Column Titles When Drilling up or DownWhen you drill down or up, you can now specify whether the column title showsthe member caption value or the level label value.
For more information, see “Create a Drill-up and Drill-down Report” on page 308.
Custom Properties for PromptsYou can now customize the text that instructs your report users how to use reportprompts.
For example, you can now change the default text that appears above a search textbox from Keywords to the text of your choice. For more information, see“Customize Prompt Text” on page 323.
Simplified CalculationsTo add a calculation, you now choose to add either a Query Calculation or LayoutCalculation object from the toolbox tab.
For more information, see “Using Relational Calculations” on page 248 and “UsingDimensional Calculations” on page 302.
Function Description Improvements:
The functions that you can use to create calculations now include improveddescriptions and more examples.
The descriptions and examples appear in the Report Studio user interface and inthis user guide. For more information about functions, see Appendix F, “Using theexpression editor,” on page 555.
Chapter 1. What's New in Cognos Report Studio? 17

New Vendor-specific Functions:
Functions that are specific to Postgres, Vertica, Netezza, Paraccel, MySQL, andGreenplum now appear in the expression editor in the Vendor Specific Functionsfolder.
For more information, see Appendix F, “Using the expression editor,” on page 555.
New Report StyleIBM Cognos Business Intelligence includes a new default report style with updatedcolors and gradients.
If your report uses a custom report template, your report will appear the same inthis version of IBM Cognos Report Studio as it did in previous versions. Bydefault, new reports appear in the new report style. For more information, see“Create and Modify Report and Object Styles” on page 350.
If you want to create new reports with the custom template style, you can edit thedefault template for new reports to match your custom template. For moreinformation about custom templates, see Chapter 20, “Creating Report Templates,”on page 451.
List EnhancementsReport Studio includes enhancements to aggregate summaries, grouping, andhiding columns in lists.
You can now specify whether to automatically include an overall aggregatesummary in the list footer. For more information, see Chapter 4, “Lists,” on page63.
You can also specify whether grouping a column automatically makes it the firstcolumn in the list. For more information, see “Group Relational Data” on page 213.
You enable these behaviors in the IBM Cognos Report Studio options, by selectingthe Group and automatic summary behavior for lists check box.
A new Render property allows you to hide columns from the output of listreports. For more information, see “Hide Columns in List Reports” on page 64.
Accessible Report OutputIBM Cognos Report Studio now includes features that allow you to create reportsthat are more accessible to people who have a physical disability, such as restrictedmobility or limited vision.
Accessible reports contain features that allow users with disabilities to accessreport content using assistive technologies, such as screen readers. You canv add alternative text for non-text objects, such as images, charts, and maps.v add summary text for crosstabs, lists, repeater tables, and tables.v specify whether table cells are table headers.v use command keys, or shortcut keys, to navigate through IBM Cognos Business
Insight Advanced.v use a screen-reader software with a digital speech synthesizer to listen to what is
displayed on the screen.v set your system's display settings for high-contrast displays.
18 IBM Cognos Report Studio Version 10.2.1: User Guide

In addition, the documentation now includes alternate text for all graphics so thatscreen readers can interpret graphics.
Braces and Parentheses are BreakableWhen you run a report in PDF format, braces {} and parentheses () no longer stayon the same line as the text before them.
For example, Products(2012) may now break to a new line between Products and(2012).
Changed Features in Version 10.1.0Listed below are changes to features since the last release.
Report Studio Express Authoring Mode Replaced by BusinessInsight AdvancedThe two authoring modes in IBM Cognos Report Studio, Professional and Express,no longer exist.
Report Studio is still the tool that professional report authors use to createadvanced and managed reports. The Express authoring mode is now replaced byIBM Cognos Business Insight Advanced. Business Insight Advanced is part of anew report consumption experience that provides an integrated businessintelligence experience for business users. It offers much greater capability, such asfull support for list reports, charts, and relational data sources. It offers an entirelydifferent user experience that is designed for data exploration.
For more information, see the Business Insight Advanced User Guide.
Order of Drawing Bars in Bar ChartsIn a horizontal bar chart, the new default chart type draws bars from bottom totop. Legacy charts draw the bars or columns in the reverse order.
To control the order of the bars, use the property for the category axis.
Line break rules in PDFs have changedLine break rules for word wrapping in PDFs have changed slightly from the lastrelease. Brackets and parenthesis such as { } and ( ) are now treated as breakable.For example, in past releases, the following string would be treated as a singlenon-breaking string.
Boilers(Steam)
In this release, "Boilers" and "(Steam)" are treated as separate strings which mightresult in the following when the string occurs at the end of a line.
Boilers
(Steam)
Removed Features in Version 10.1.0Listed below are features that are removed since the last release.
Analyze with Analysis StudioThe ability to open a report with IBM Cognos Analysis Studio from within IBMCognos Report Studio (Tools or right-click, Analyze) was removed in this release.
Chapter 1. What's New in Cognos Report Studio? 19

Conformed Dimensions on SAP BW Data SourcesSupport for conformed dimensions generated by IBM Cognos Framework Managerfor SAP BW data sources was removed in this release.
Excel 2000 and Excel 2000 Single Sheet Report OutputsThe Microsoft Excel 2000 spreadsheet software and Excel 2000 Single Sheetspreadsheet software report outputs are no longer supported in this release.
20 IBM Cognos Report Studio Version 10.2.1: User Guide

Chapter 2. Getting started with Report Studio
IBM Cognos Report Studio is a Web-based report authoring tool that professionalreport authors and developers use to build sophisticated, multiple-page,multiple-query reports against multiple databases. With Report Studio, you cancreate any reports that your organization requires, such as invoices, statements,and weekly sales and inventory reports.
Use Report Studio for reports thatv are intended for a wide audiencev exist long enough to require maintenance for changing requirements and datav require detailed control over the appearance
Your reports can contain any number of report objects, such as charts, crosstabs,and lists, as well as non-BI components such as images, logos, and live embeddedapplications that you can link to other information.
Building IBM Cognos Business Intelligence ApplicationsYou use the IBM Cognos Business Intelligence components to build reporting andanalysis applications.
The lifetime of an IBM Cognos Business Intelligence application can be months, oreven years. During that time, data may change and new requirements appear. Asthe underlying data changes, authors must modify existing content and developnew content. Administrators must also update models and data sources over time.For more information about using data sources, see the IBM Cognos BusinessIntelligence Administration and Security Guide and the IBM Cognos FrameworkManager User Guide.
In a working application, the technical and security infrastructure and the portalare in place, as well as processes for change management, data control, and so on.For information about the workflow associated with creating IBM Cognos BIcontent, see the IBM Cognos Architecture and Deployment Guide. For additionalinformation, see the IBM Cognos Solutions Implementation Methodology toolkit,which includes implementation roadmaps and supporting documents. Informationabout the toolkit is available on the IBM Cognos Customer Center(http://www.ibm.com/software/data/cognos/customercenter/).
The following graphic provides an overview for how to use IBM Cognos BI tobuild applications across all of your IBM Cognos BI components.
© Copyright IBM Corp. 2005, 2013 21

1. Locate and prepare data sources and modelsIBM Cognos BI can report from a wide variety of data sources, both relationaland dimensional. Database connections are created in the Web administrationinterface, and are used for modeling, for authoring, and for running theapplication.To use data for authoring and viewing, the business intelligence studios need asubset of a model of the metadata (called a package). The metadata may needextensive modeling in Framework Manager.
2. Build and publish the contentReports, scorecards, analyses, workspaces, and more are created in the businessintelligence studios of IBM Cognos BI. Which studio you use depends on thecontent, lifespan, and audience of the report, and whether the data is modeleddimensionally or relationally. For example, self-service reporting and analysisare done through IBM Cognos Workspace Advanced, IBM Cognos QueryStudio, and IBM Cognos Analysis Studio, and scheduled reports are created inIBM Cognos Report Studio. Report Studio reports and scorecards are usuallyprepared for a wider audience, published to IBM Cognos Connection oranother portal, and scheduled there for bursting, distribution, and so on. Youcan also use Report Studio to prepare templates for self-service reporting.
3. Deliver and view the informationYou deliver content from the IBM Cognos portal or other supported portals,and view information that has been saved to portals, or delivered by othermechanisms. You can also run reports, analyses, scorecards, and more fromwithin the business intelligence studio in which they were created.For information about tuning and performance, see the IBM Cognos BusinessIntelligence Administration and Security Guide and http://www.ibm.com.
Relational and dimensional reporting stylesYou can create reports in IBM Cognos Report Studio using either a relationalreporting style or a dimensional reporting style.
The Report Studio tools and query language are the same for both styles. However,it is important to choose a reporting style to ensure that you are making the mostof your data and to avoid mixing dimensional and relational concepts.
How to choose a reporting style
When authoring a report, first choose your preferred reporting style for workingwith data: relational or dimensional. You can choose a reporting style from yourviewpoint:v If you think about your data as tables and columns, you have a relational
viewpoint and should use a relational reporting style.v If you think about your data as a number of dimensions intersecting at cells,
you have a dimensional viewpoint and should use a dimensional reporting style.
Relational reporting style
The relational reporting style consists of lists. You focus the data with filters andsummarize with header and footer summaries.v If your data is purely relational, then only query subjects and query items
appear in the Source tab , and you must use the relational reporting style.
22 IBM Cognos Report Studio Version 10.2.1: User Guide

v If your data is dimensional, then dimensions appear in the Source tab , andyou can still use a relational reporting style, but instead of query items(columns) and query subjects (tables), you use measures, levels, and levelproperties.To see an example of relational style reporting with dimensional data, see theManager Profile sample report in the GO Data Warehouse (analysis) package.
The relational reporting style is similar to report authoring in IBM Cognos QueryStudio.
Dimensional reporting style
The dimensional reporting style consists of measures and members from differenthierarchies arranged in a crosstab with cell values at the intersections. You focusthe data with set expressions that navigate from specific members in the hierarchyand summarize with set summaries.
To see an example of dimensional style reporting with dimensional data, see theGO Balance Sheet as at Dec 31, 2012 sample report in the GO Data Warehouse(analysis) package.
The dimensional reporting style is similar to report authoring in IBM CognosAnalysis Studio.
Guidelines for each reporting style
This user guide is divided into relational and dimensional reporting sections sothat you can follow the best practices for using this product with the reportingstyle that you have chosen. The following table outlines the best practices for bothreporting styles.
Item Relational reporting Dimensional reporting
Report type Lists
Crosstabs pivoted from lists
Charts created from lists
Maps created from scratch orfrom lists
Crosstabs
Charts created from scratch orfrom crosstabs
Maps created from scratch orfrom crosstabs
Chapter 2. Getting started with Report Studio 23

Item Relational reporting Dimensional reporting
Package treeIn the Source tab , click theview members tree button.
If you are using dimensionaldata, hide members in thesource tree by right-clicking thetree, clicking Package TreeSettings, and clearing the checkboxes for Members andMembers for each level.
The view will include thefollowing:
package
folder
namespace
query subject
query item
measure
level
In the Source tab , click theview members tree button.
Ensure that the source tree toolbar is set to Create sets formembers:
The view will include thefollowing:
package
folder
measure
member
named set
Inserting data From the package tree, addquery items or levels to thereport.
Avoid using hierarchies directlyin the report.
Avoid using named sets.
From the package tree, add setsof members to the report.
You can also choose to insertjust the member, just thechildren of the member, or themember and its children.
Calculating data Add query calculations usingonly relational and commonconstructs.
Choose only Other expression.
Add query calculations usingonly dimensional and commonconstructs.
Use Other expression only forvalue calculations.
Avoid Common functions thatare marked with an exclamationmark (!) because they havelimited support.
Summarizing data Headers and footers in lists
Crosstab member summaries; forexample, aggregate within detail
Member set summaries; forexample, aggregate within set
Focusing data Add detail or summary filters toview only the data you want tosee. For example, add theQuarter query item to a list andfilter by Q3.
Add only the relevant membersto an edge of the crosstab or tothe context filter. For example,only add the Q3 member toyour report.
Use a set expression such asTopcount or Filter.
24 IBM Cognos Report Studio Version 10.2.1: User Guide

Item Relational reporting Dimensional reporting
Drilling Drilling through by value Drilling through by member
Drilling up and down
Page and sectionbreaks
Simple page breaks
Page sets
Sections
Master detail relationships usingparameterized filters
Simple page breaks
Page sets
Page layers
Master detail relationships usingparameterized edge or slicerexpressions
The User InterfaceThe IBM Cognos Report Studio user interface has two panes, an explorer bar, anda work area to help you create reports.
We recommend that you use a screen resolution of at least 1024 by 768 pixels.
Content Pane
The content pane contains objects that you can add to a report. You add objects toa report by dragging them to the work area. The content pane contains these tabs:
Chapter 2. Getting started with Report Studio 25

v The Source tab contains items from the package selected for the report,such as data items and calculations.
v The Data Items tab describes the queries created in the report.
v The Toolbox tab contains a variety of objects that you can add to thereport, such as text and graphics.
v The Search tab contains the results when you perform a search formembers. You can insert the members found in a search directly into a report.
v If you are authoring an active report, the Active Report Controls tabshows the controls and active report variables inserted in a report and theirrelationships to one another. You can click a control in this tab to quickly locatethe control in the report as well as set default values for variables.
v If you are authoring an active report, the Active Report Variables tabshows the active report variables defined in a report. Use this tab to create newvariables and set default values.
Properties Pane
The Properties pane lists the properties that you can set for an object in a report.
You can obtain additional information about a property by selecting it and pressingF1. For example, you can view the list of objects that use each property.
When you specify a value for a property, press Enter, click another property, orsave the report to ensure that the value is saved.
Tip: To view a description of the currently selected property at the bottom of thepane, from the View menu, click Property Descriptions.
Explorer Bar
Pause the pointer over the following buttons on the Explorer bar to work withdifferent parts of a report:
v the page explorer buttonYou use Page Explorer to view or create new report pages and prompt pages orto create and modify classes.
v the query explorer buttonYou use Query Explorer to create or modify queries in relational reporting ordimensional reporting and to perform complex tasks, such as defining unionjoins and writing SQL statements.
v the condition explorer buttonYou use Condition Explorer to work with variables to define conditions in areport.
26 IBM Cognos Report Studio Version 10.2.1: User Guide

Page Layers Area
Use the Page layers area to create sections, or page breaks, in a report to showvalues for each member on a separate page. For example, you can drag Northern
Europe sales territory from the Source tab to the Page layers area. The reportis broken into a separate page for each territory within northern Europe. Eachpage's context appears in the report header.
For more information, see “Create Page Layers” on page 449.
Context Filter Area
When working with dimensional data, use the Context filter area to filter yourreport to show values, or context, for only a specific data item. This technique isalso known as a slicer filter. For example, you can drag Sales Territory from the
Source tab to the Context filter area. When you click a specific territory fromthe list, the values in the crosstab change to represent data for that territory.
For more information, see “Create a Context Filter” on page 279.
Visual Aids Button
The visual aids button provides the following options to help you when youare designing reports in the layout.
Option Description
Show Boundary Lines Shows all boundary lines around objects.
Show Repeating Repeats objects when you insert them. Forexample, when you insert a data item in acrosstab, the data item appears in each rowor in each column of the crosstab.
Show Page Header & Footer Shows the page header and page footer.
Show Drag & Drop Padding Shows drag-and-drop zone when thePadding property for an object is set to 0. Ifthe Padding property is set to a value that isgreater than the minimum padding that IBMCognos Report Studio uses to showdrag-and-drop zones, only the minimumpadding is shown.
Show Hidden Objects Shows objects for which the Box Typeproperty was set to None or for which theVisible property was set to No.
Show Sorting Shows the sorting icon for data items forwhich a sort order was specified. For moreinformation about sorting data, see “SortingRelational Data” on page 235 or “SortingDimensional Data” on page 281.
Show Grouping Shows the grouping icon for grouped dataitems.
Show Source Type Shows the icon for the source type ofobjects, such as layout calculation.
Chapter 2. Getting started with Report Studio 27

Option Description
Show Data Item Type Shows the icon for the type of data item,such as query item, member, or measure.
Show Drill-through Definitions Shows data items for which thedrill-through definition was defined as ahyperlink.
Show Table of Contents Entries Shows table of contents entries inserted inthe report.
Show Bookmarks Shows bookmarks inserted in the report.
Show Master Detail Relationships Shows master detail relationships defined inthe report.
Tip: Pausing the pointer over the masterdetail relationship icon shows therelationship.
Show No Data Contents Tab Control Shows tabs if the data container's No DataContents property is set to Yes.
Show Repeater and Singleton Containers Shows repeater and singleton containersinserted in the report.
Show Interactive Object Controls Shows controls in the top right corner ofactive report application objects. For moreinformation about active reports, seeChapter 8, “Active Reports,” on page 171.
Show Container Selectors Shows a small selector (three orange dots) inthe top left corner of the following containerobjects and allows you to select all theobjects within them: list, crosstab, repeatertable, table of contents, table, and activereport application objects.
Show Empty Extra Item Drop Zones When you are creating a visualization, thisvisual aid shows empty drop zones for extraitems that you can insert. The extra dropzones are displayed only when data itemsare inserted in all required drop zones.
Work in design or structure viewIBM Cognos Report Studio has two views in which you can author reports: PageDesign view and Page Structure view. You can choose a report authoring view onthe View menu.
Different options are available in each view, so you often need to use both views.For example, you must use both views to remove sections in relational reporting.
Page design view
Page Design view is the default view in IBM Cognos Report Studio. In this view,you can see what your report will look like after you run it.
Page structure view
Page Structure view displays an overview of all of the report objects in your reportin a tree structure, which is organized by page.
28 IBM Cognos Report Studio Version 10.2.1: User Guide

Related concepts:“The Page Structure View” on page 329When you add objects to a report, you usually work in the layout. An alternativeview of the report is available.
Report Layout and QueriesAll reports have two components: a layout component that defines the reportappearance and a query component that defines report data. Understanding thesecomponents will help you design effective reports.
LayoutA layout is a set of pages that defines the appearance and formatting of a report.
When you design the layout of a report, youv present the data in a meaningful way by using lists, crosstabs, charts, and mapsv add formatting, such as borders, color, images, and page numbersv specify how the data flows from one page to the next
Pages
Pages are containers for the layout objects that you use to build a report. A page ismade up of the following mandatory and optional components:v page header (optional)v page body (mandatory)v page footer (optional)
When you run a report, the amount of data queried often exceeds one page. As aresult, a page will repeat until all the data is shown. You have control over howdata flows from one page to the next. For example, here are alternativerepresentations of a report that contains a chart and a lengthy list.
Chapter 2. Getting started with Report Studio 29

Objects
You add layout objects to a page when you create a report. Below are objects thatyou will use often when building reports in IBM Cognos Report Studio:v list
Add a list to show data in rows and columns.v crosstab
Add a crosstab to show data in a grid with dimensions along the rows andcolumns and measures in the cells or intersection points.
v chartv mapv repeater
Add a repeater to show each instance of a certain column or data item in aseparate frame.
v textv block
Add a block to hold text or other information. Blocks are often used to lay outhorizontal bands of information.
v tableRelated tasks:“Insert a Formatting Object in a Report” on page 336
In addition to text and images, the Toolbox tab contains other objects thatyou can add to the report layout.
QueriesQueries determine what data items appear in the report. Sometimes you wantdetailed rows of data, which you obtain by using a simple SELECT statement.Other times you must calculate totals or averages using summary functions andgrouped columns or must apply filters to show only the data you want.
�1� The chart appears on its own page. The list begins on the next page and fills subsequentpages until all rows appear.
�2� The chart and the first few rows of the list appear on the first page. The rest of the datain the list appears on the subsequent pages.
30 IBM Cognos Report Studio Version 10.2.1: User Guide

IBM Cognos Report Studio automatically creates the queries you need as you buildreports. However, you can modify these queries or create your own custom queriesto get the results you want.Related concepts:“Working with Relational Queries” on page 236Queries specify what data appears in the report. In IBM Cognos Report Studio,you create and modify queries using Query Explorer.“Working with Dimensional Queries” on page 283Queries specify what data appears in the report. In IBM Cognos Report Studio,you create and modify queries using Query Explorer.
Report ObjectsYou build reports by adding objects and manipulating them to obtain the resultsyou want. To understand how to work with objects in IBM Cognos Report Studio,you must be familiar with the following concepts:v object typesv objects as containersv locking and unlocking objectsv hierarchy of objects
Object Types
In IBM Cognos Report Studio, layout objects are either inline or block. You caninsert other objects on the same line as an inline object, but not on the same line asa block object. When you insert an object to the left or to the right of a blockobject, the object appears on the line above or below the block object, respectively.Examples of inline objects include graphics and text items. Examples of blockobjects include any report type (list, crosstab, chart, map, or repeater) and tables.
You can also use an object's floating property to define how other objects flowaround the object. For example, you can specify how text flows around an image.
Objects as Containers
Objects, such as tables, blocks, and any report frame, are containers in which youcan insert other objects. For example, you can insert a list in one cell of a table anda chart in another.
You can also nest objects to create a sophisticated layout. For example, you caninsert a table in a cell of another table.
Locking and Unlocking Objects
To manipulate the contents of some objects, you must first unlock the object. Forexample, you have a list that contains the column Product Name. You want toinsert a graphic inside the Product Name column to show an image of eachproduct. Unlocking the list allows you to insert the image object inside a listcolumn.
Tip: From the Structure menu, click Lock Page Objects. Toggling this menu itemlocks and unlocks all layout objects in a report. However, this setting is not savedwith the report.
Chapter 2. Getting started with Report Studio 31

Hierarchy of Objects
In IBM Cognos Report Studio, objects are organized hierarchically. For example, alist contains list columns, and each list column contains a text item, which is thename of the inserted data item.
The hierarchy of objects is useful to remember when you apply formatting becauseformatting is applied to the child objects of the object. For example, you canspecify that all list column titles in a list have red as the background color. Theformatting is automatically applied to any new columns you add to the listbecause the formatting is applied to the list and is therefore applied to the objectsin the list. If you apply formatting to a specific object, it will override the sameformatting specified for the parent object.Related concepts:Appendix G, “Report Studio Object and Property Reference,” on page 771This appendix contains definitions of the objects and properties found in IBMCognos Report Studio. They are available contextually, by pressing F1 when anobject or property is active in the Report Studio authoring environment.
Find Objects in a ReportYou can quickly locate specific objects in a report by using Find.
Procedure1. From the Edit menu, click Find.2. Click Find what and choose the type of object to find.3. In the Options box, specify the search criteria.
For example, if you want to find the objects that reference a specific data item,you must specify the query that contains the data item and the data item name.
4. To search for objects that are hidden in the report, in the View box, select theShow Hidden Objects check box.
5. In the View box, under Page view, select whether you want to do the search inthe Page Design or Page Structure view.
6. Click Find Next.
Results
The first object that meets the search criteria is selected in the report. Continueclicking Find Next to show all other objects that meet the search criteria.
Note: In some cases, such as searching for a data item that is used to define aconditional style, IBM Cognos Report Studio cannot directly select the object in thereport. Instead, Report Studio selects the object that uses the object for which youare searching.Related concepts:“Work in design or structure view” on page 28IBM Cognos Report Studio has two views in which you can author reports: PageDesign view and Page Structure view. You can choose a report authoring view onthe View menu.
OptionsYou can set various options that control the appearance and behavior of IBMCognos Report Studio (Tools, Options).
32 IBM Cognos Report Studio Version 10.2.1: User Guide

View Options
Option Description
Use Windows skin Replaces the current appearance of theinterface with the display scheme specifiedby the Windows settings.
Show startup dialog Shows the Welcome dialog box at startup.
Reuse IBM Cognos Viewer window Reuses the same IBM Cognos Viewerwindow when you rerun a report withoutfirst closing the window.
Resize IBM Cognos Viewer window Maximizes the IBM Cognos Viewer windowwhen you run a report.
Enable animation Animates the appearance of dialog boxes,menus, and panes.
Show object and query name dialog oninsert
Specifies whether to show the Object andQuery Name dialog box when you add alist, crosstab, repeater table, repeater, orsingleton from the Toolbox tab.
Use this dialog box to quickly specify aname for the data container and a name forthe query that is associated with the datacontainer. Or you can link an existing queryto the data container.Tip: The Insert Chart and Choose Mapdialog boxes also contain fields to specify aname and query when you add a chart ormap to a report.
Window startup size Specifies the size of the Report Studiowindow at startup.
Position pane on the right (requires restart) Moves the content and Properties panes tothe right of the work area. This check box iscleared by default. For the change to takeeffect, you must close and then restartReport Studio.
Show rich tooltips (requires restart) Specifies whether to show descriptivetooltips when you hover over a button inthe toolbar. This check box is selected bydefault. For the change to take effect, youmust close and then restart Report Studio.
Display report preview Shows a preview of the report when youopen or save a report, within the Open,Save, and Save As dialog boxes.
Start page view Enables you to start Report Studio in PageDesign or Page Structure view. For thechange to take effect, you must close andthen restart Report Studio.
Edit Options
Option Description
Wrap text in editors Automatically wraps text in all editorswhere you can define expressions.
Chapter 2. Getting started with Report Studio 33

Option Description
Automatically populate values list When building expressions in the expressioneditor, automatically shows values whenyou browse the data of a data item.
Automatically validate expressions Automatically validates calculations, such asfilters, created in the expression editor. Formore information, see “Using RelationalCalculations” on page 248 or “UsingDimensional Calculations” on page 302.
In-place edit Enables the editing of text in place whendouble-clicking.
Use chart flyouts in Design View When in Page Design view, shows the chartdrop zones as flyouts that appear only whenyou hover your mouse over the chart. Whencleared, the chart drop zones are alwaysdisplayed.
By default, this option is not enabled.
Drop replace on crosstab and chart nodes Specifies what the existing members arereplaced with when you drag a newmember onto a report.
Double-click on member action When working with dimensional data,specifies what happens when youdouble-click a member data item.
By default, you drill down or up on the itemthat you double-click.
Layout dimensions Specifies the width and height of the areawhere you will create reports.
Report Options
Option Description
Alias member unique names When working with a dimensional datasource, creates an alias when you add amember to the report or to an expression.
Delete unreferenced query objects Automatically deletes query objects linked toanother object. For example, if you delete alist, the query linked to the list is deleted aswell.
Delete unreferenced conditional styles andpalettes
Automatically deletes conditional styles orpalettes when the last data item that refersto the conditional style or palette is alsodeleted.
34 IBM Cognos Report Studio Version 10.2.1: User Guide

Option Description
Always create extended data items for newreports
When working with dimensional datasources, determines whether Report Studiocreates extended data items orexpression-based data items for new reports.
Expression-based data items allow you toview or edit the expression bydouble-clicking the Expression property forthe item.
If you are working with a dimensional datasource and this option is not selected, theappropriate dimensional data item is addedwhen you insert items such as members,levels, or calculated members. For example,if you insert a level, a level set is created.This makes it easier to work withdimensional data items because ReportStudio knows the data item type of theitems that are in the report.
Table Style inheritance When a table style is applied to a list orcrosstab, specifies whether new objectsinserted in the list or crosstab should inheritthe style. For more information, see “Applya Table Style” on page 340.
Automatic group and summary behaviorfor lists
When working with lists, automatically addsan overall aggregate summary in the listfooter and a summary for any groups in thelist. When grouping a column, automaticallymakes it the first column in the list.
Automatically create crosstab headers forsets
When adding sets in a crosstab that uses adimensional data source, automatically addsheader labels on new columns and rows.The headers help consumers of the report tounderstand where the data is in thehierarchy.
Limit on inserted individual members When working with a dimensional datasource, limits the number of child membersthat are inserted. For example, you specify 3for this option and, in the toolbar, youspecify the option to insert children whenyou drag a member to a data container. Youthen drag the Camping Equipment memberto the rows of a crosstab. What you see asrows are the child members Cooking Gear,Tents, and Sleeping Bags and a row namedOthers (Camping Equipment) for theremaining child members of CampingEquipment.
Advanced Options
Option Description
Use operating system clipboard Uses the Microsoft Windows (or otheroperating system) clipboard instead of theinternal Report Studio clipboard.
Chapter 2. Getting started with Report Studio 35

Option Description
Use legacy chart authoring Enables you to create new reports using thelegacy charts instead of the default chartsand disables the automatic upgrade of chartsin existing reports to the current defaultcharts. Select this check box if you do notwant to upgrade the charts in your existingreports.
Disable previews When editing properties such as date andnumber formatting, does not display asample of the formatting that is applied todata. When this option is not enabled, eithersample data or data from your data sourceis displayed with formatting optionsapplied.
Additionally, when in Page Design view,displays a static image for a chart instead ofupdating the chart with a preview of yourchart, using simulated data.
Override 10.x styles with 8.x styles on newreports
Specifies whether to use the Version 8.xreport styles by default when creating newreports.
For more information about report styles,see “Create and Modify Report and ObjectStyles” on page 350.
Active Report validation of visualizations Specifies whether to validate visualizationsin an active report when the report is runfrom Report Studio.
Map feature display limit When working with maps, specifies themaximum number of features that canappear in a map.
Member display count limit (in source tree) When working with dimensional data,specifies the maximum number of members
that can appear in the Source tabbefore you must perform a search.
Related concepts:“Recommendation - Use Member Unique Name (MUN) Aliases” on page 547If you are working with a dimensional data source, use MUN aliases to simplifybuilding reports and expressions. In addition, you can tie the MUN back to themember in the package.
Web Browser SettingsIBM Cognos Report Studio can be used in the Microsoft Internet Explorer andMozilla Firefox Web browsers.
To review an up-to-date list of the environments that are supported by IBMCognos products, including information about operating systems, patches,browsers, web servers, directory servers, database servers, and application servers,visit the IBM Cognos Customer Center (http://www.ibm.com/software/data/cognos/customercenter/).
36 IBM Cognos Report Studio Version 10.2.1: User Guide
IBM Cognos Business Intelligence uses the default browser configurations providedby Internet Explorer and Firefox. Additional required settings are specific to thebrowser.
For Internet Explorer, the following settings are required:v Allow Cookiesv Active Scriptingv Allow META REFRESHv Run ActiveX controls and plug-insv Script ActiveX controls marked safe for scriptingv Binary and script behaviorsv Allow programmatic clipboard accessv Userdata persistencev Enable pop-ups for the IBM Cognos BI server
For Firefox, the following settings are required:v Allow Cookiesv Enable Java™
v Enable JavaScriptv Load Imagesv Enable pop-ups for the IBM Cognos BI server
Report Studio uses the native Microsoft Internet Explorer XML support, which is acomponent of the browser. ActiveX support must be enabled because Microsoftimplements XML using ActiveX. IBM Cognos BI does not provide or downloadActiveX controls. Only the ActiveX controls that are installed as part of InternetExplorer are enabled through this configuration.
For more information about the Web browser configuration and cookies used byIBM Cognos BI, see the IBM Cognos Business Intelligence Installation andConfiguration Guide.
The IBM Cognos Software Development KitWhen you create a report, you are creating a report specification.
A report specification is an XML file that you can view (Tools, Show Specification
). In addition, you can view the specification for a selected object with theShow Specification (Selection) menu option.
You can also programmatically create or modify reports by using an editing tool towork with report specifications. You then use the IBM Cognos SoftwareDevelopment Kit to implement the reports in your IBM Cognos BusinessIntelligence environment. This is useful if, for example, you must make the samemodification in many reports. Rather than opening each report and making thechange, you can automate the process using the Software Development Kit,thereby saving you time. For more information about the Software DevelopmentKit, contact your local sales office.
Chapter 2. Getting started with Report Studio 37

Tipsv When you are viewing the report specification, you cannot modify or copy parts
of it.v You can also modify the XML code in a report specification by saving the report
specification on your computer.
38 IBM Cognos Report Studio Version 10.2.1: User Guide

Chapter 3. Creating a report
When you create a report, you are actually creating a report specification. Thereport specification defines the queries and prompts that are used to retrieve dataand the layouts and styles used to present the data. For simplicity, the reportspecification is named by the same name as the report.
Specify the Data PackageSpecify the package that will provide items for the report.
The packages that you use to generate reports are based on models that are createdin the modeling tool, IBM Cognos Framework Manager. A model is a set of relatedobjects, such as query subjects, dimensions, filters, and calculations. When youopen a package in IBM Cognos Business Intelligence, these model objects arevisible in the left frame.
Before you begin
The package must be previously created and published to the IBM CognosConnection portal. For more information, see the IBM Cognos Framework ManagerUser Guide.
Important: If the package version changed since you opened IBM Cognos ReportStudio, close and restart Report Studio to ensure that you are working with thelatest version of the package.
Procedure1. Open IBM Cognos Report Studio with the package you want to use.2. In the Welcome dialog box, choose whether to open a new or existing report or
template:v To create a new report or template, click Create a new report or template
and choose a basic report layout.
Tip: You can specify a language other than the default language for yourpackage by clicking on the ellipsis (...) button to the right of the Packagefield, clicking the Language ellipsis button in the Report Package dialog box,highlighting the desired language, and then clicking OK. As stated on thelanguage selection dialog box, items such as separators and decimals mayneed to be manually updated for language-specific syntax rules as a result ofyour selection.
v To open an existing report or template, click Open an existing report ortemplate and select a report.
Results
Objects from the selected package, such as query items, appear on the Source tab
.
Tip: You can later change packages.
© Copyright IBM Corp. 2005, 2013 39

Refresh the packageIf the package that a report is using changed, refresh it to ensure that you areworking with the latest content.
About this task
The contents of a package can change without the package version changing. Forexample, your modeler makes changes to a model and republishes the packagewith model versioning disabled.
Procedure
Refresh the package.v To get the latest contents of the current package version being used, in the
Source tab , click the refresh icon .v To get the latest package version, close and restart your component.
Choose a Basic Report LayoutIBM Cognos Report Studio includes several basic report layouts that include reportobjects, such as lists, crosstabs, maps, repeaters, and headers and footers. You canalso choose to start with a blank report or open an existing report.
Tip: The Budget vs. Actual sample report in the GO Data Warehouse (analysis)package is based on a basic report layout. For more information about The SampleOutdoors Company samples, see Appendix C, “Sample Reports and Packages,” onpage 507.
Procedure
1. From the File menu, click New .2. If you want to change the package, click the ellipsis (...) button and click a
different package.3. Choose a basic report layout:
v To create a report from a blank layout, double-click Blank.v To create a report using one of Report Studio's predefined report layouts,
double-click the layout.v To create a new report template that can be applied to reports created in IBM
Cognos Query Studio or IBM Cognos Analysis Studio, double-click ReportTemplate.For more information about creating report templates, see Chapter 20,“Creating Report Templates,” on page 451.
v To create a financial report using the basic financial report layout,double-click Financial.
v To create a new report using another report, double-click Existing, locate thereport, and click Open.
Results
The basic report layout appears in the report page.
40 IBM Cognos Report Studio Version 10.2.1: User Guide

Inserting a data container from the toolbox tabIn addition to choosing a basic report layout when you create a report, you caninsert data containers from the toolbox tab into a report in IBM Cognos ReportStudio.
About this task
When you insert a data container from the Toolbox tab, you can specify a namefor the data container and the query that you want to link to the container insteadof accepting the default names that are generated by Report Studio.
Procedure
1. From the Toolbox tab , drag the data container that you want to insert inthe report.For lists, crosstabs, repeaters, repeater tables, and singletons, the Object andQuery Name window opens. For charts, the Insert Chart dialog box opens, andfor maps, the Choose Map window opens.
Tip: The Object and Query Name window opens when the Show object andquery name dialog on insert option in the Tools menu, View Options tab, isselected.
2. Type a name for the data container and a name for the query to be created forthe container.
Tip: You can link the container to an existing query by clicking the querymenu and choosing from the list of available queries.
Add DataSelect the data items you want to appear in your report.
For more information about adding data to a relational style report, see “AddRelational Data to a Report” on page 213. For more information about adding datato a dimensional style report, see “Add Dimensional Data to a Report” on page253.
Procedure
From the Source tab , drag data items to the report object.A flashing black bar indicates where you can drop a data item. Data items in the
report appear on the Data Items tab .
Data Source IconsEach object in the data source has a representative icon. You can insert all of thefollowing objects in a report, except for packages and dimensions.
Icon Object
Package, which contains the objects you can insert in a report.
Namespace, used to organize objects.
Chapter 3. Creating a report 41

Icon Object
Query subject, which represents a table in the database.
In relational data sources, query item, which represents a column ofqualitative data in the database, such as product name or country orregion.
In dimensional data sources, level attribute, which represents a propertyof a level.
A member is a unique item within a hierarchy. For example, CampingEquipment and 4 Man tent are members of the Products Hierarchy.
Dimension, which represents a broad grouping of descriptive data abouta major aspect of a business, such as products, dates, or markets.
Hierarchy, which represents a collection of dimensional membersorganized into a tree structure.
Level, which is a set of members that have common attributes. Forexample, a geographical dimension might contain levels for country orregion or city.
Multiple levels can exist within a level hierarchy, beginning with the rootlevel. The root level is the parent and rollup of all members in the firstlevel. It is used to obtain a rollup of all values across the hierarchy and toprovide a convenient point to start drilling.
For example, a Years level hierarchy may contain the following levels:
v Root level Years
v First level Year
v Second level Quarter
v Third level Month
Measure or fact, a query item that represents a column of quantitativedata in the database, such as revenue or quantity.
Measures folder, which contains hierarchical measures.
Model filter.
Model calculation.
Folder, used to organize data items. You cannot import a folder into yourreport.
Insert a Single Data ItemYou can insert a single data item anywhere in your report using the singletonobject. The singleton object retrieves only the first row value for that query.Inserting a single data item is useful when you want to show a value that isindependent from the rest of the values in the report or when you want to insertsome boilerplate text, such as a company name and address. For example, you canadd the total revenue value in the header of each page in a report.
You can associate multiple singleton objects with a single query in relationalreporting and dimensional reporting to optimize performance, such as when all thedata items in the singleton are from the same database table. In addition, two or
42 IBM Cognos Report Studio Version 10.2.1: User Guide

more singletons can reference data items from the same query. This is useful whenusing a single query is more efficient to display a set of single values than usingmultiple queries.
You can also filter the data item in the singleton. For example, you can show thetotal revenue for only the year 2012.
Queries that are associated to a singleton object are not supported when producingreport output in delimited text (CSV) format.
Tip: The Returns by Damage, Failed Orders and Complaints in 2012 sample reportin the GO Data Warehouse (analysis) package includes a singleton. For moreinformation about The Sample Outdoors Company samples, see Appendix C,“Sample Reports and Packages,” on page 507.
Procedure
1. From the Toolbox tab , drag Singleton to the report.An empty data container is created.
2. From the Source tab , drag a data item into the Singleton container.
Tip: To create a singleton, you can also drag a data item anywhere in yourreport layout.
3. To change the query associated to the singleton object, in the Properties pane,double-click the Query property and make changes.
Results
When the report is run, the first row value for the data item is retrieved.
Validate a ReportValidate your report to ensure that it contains no errors.
When you open a report created in a previous version of IBM Cognos BusinessIntelligence, it is automatically upgraded and validated. For more information, seeChapter 22, “Upgrading Reports,” on page 461.
Procedure
1. From the Tools menu, click Validate Report .A message box appears indicating whether any errors were found in the report.
2. If you require more detail from the validation process, from the Tools menu,click Validate Options and do the following:v Click one of the following validation levels.
Validation level Description
Error Retrieves all errors returned from the query.
Warning Retrieves all errors and warnings returnedfrom the query. This is the default validationlevel.
Chapter 3. Creating a report 43

Validation level Description
Key Transformation In addition to errors and warnings, retrievesinformational messages describing importanttransformation steps from the reportspecification to the native query sent to thedata source.
These messages can show the cause of errorsand warnings returned from the query.
Information Retrieves errors, warnings, keytransformations, and other informationrelated to query planning and execution.
Tip: Your administrator can change the default validation level. For moreinformation, see the IBM Cognos Business Intelligence Administration andSecurity Guide.
v Select the Interactive data check box to specify that no query optimization isto be used.The Interactive data check box controls how queries will be processedduring validation.Clear the Interactive data check box to set the Execution Optimizationproperty to All Rows.
Tip: For more information about the Execution Optimization property, seeExecution Optimization in Appendix G, “Report Studio Object and PropertyReference,” on page 771.A message box appears indicating whether any errors were found in thereport.
v To view messages that result from the conversion of your report to use thedynamic query mode instead of the compatible query mode, select theDynamic Query Migration check box.For more information about using the dynamic query mode, see the IBMCognos Business Intelligence Dynamic Query Guide. For more information aboutmanaging the migration from the compatible query mode to the dynamicquery mode, see the IBM Cognos Lifecycle Manager Installation and User Guide.
v Revalidate your report.3. If you encounter validation errors and want IBM Cognos Report Studio to
identify incorrect objects in your report, from the Tools menu, click AutoCorrect.Report Studio provides a list of such objects that you can remove individuallyto successfully run your report.In some cases, the information or error message is linked to the location of theissue in your report. To go to the location of the issue, click the message, andthen click Select. If only warnings and information appear in the dialog box,these will disappear when you click OK.
Save a ReportSave your report to preserve the modifications you made.
Reports are saved to the IBM Cognos Business Intelligence server. You can alsosave your report on your computer.
44 IBM Cognos Report Studio Version 10.2.1: User Guide

Procedure
1. From the File menu, click Save or click Save As to save a copy of thereport under a different name.
2. If you are saving the report for the first time, specify where to save the reportand type a file name.For information about setting up folders in IBM Cognos Connection for yourreports, see the IBM Cognos Connection User Guide.
3. Click Save.
Run a ReportRun your report to see the data that is retrieved. Save time by validating it first tocheck for errors.
You can also run a report or a group of reports in IBM Cognos Connection.Furthermore, you can save report outputs to a file system. For more information,see the IBM Cognos Business Intelligence Administration and Security Guide.
You can specify not to render a report page if it does not contain any data.
When you run a report in an export format such as PDF, delimited text (CSV),Microsoft Excel spreadsheet software (XLS), the IBM Cognos report name is usedas the exported file name.
If you run a report that uses functions or features not supported by the datasource, an error message appears. We recommend that you periodically test yourreports while you author them in IBM Cognos Report Studio to ensure that you donot encounter multiple error messages when you run the report.
Procedure1. Open a report.2. If you want to clear parameter values stored on the IBM Cognos Business
Intelligence server, from the File menu, click Clear Parameter Values.Parameter values stored by the IBM Cognos BI server include signon,validation, and prompt information. For example, if you define two data sourceconnections in IBM Cognos Connection that point to the same data source, youare prompted to choose one when you run a report. This information is storedso that you are not prompted each time you run the report.
3. If you want to view only the tabular data, from the Run menu, click View
Tabular Data .If the report contains multiple queries, you must first click an object, such as alist or crosstab, that uses the query for which you want to view the tabulardata.Use this command to ensure that the right results appear. For example, youcreate a calculation and you want to ensure it is giving you the results youwant.
Tip: You can also view tabular data in Query Explorer, which is useful whenyou are building queries.
4. If you want to set run options, from the Run menu, click Run Options.
Chapter 3. Creating a report 45

The default value is the value of the selected corresponding run option in IBMCognos Connection.
Note: The run options that you set apply only to the current session. Whenyou close Report Studio, the options return to the default settings.
5. Change any values for the current session.
Option Description
Format Specify to change the default format fromHTML.
Paper size Specify only if the output format is PDF.
Paper orientation Specify only if the output format is PDF.
Data mode Specify how much data is returned:
v All Data returns all data.
v Limited Data limits the amount of datareturned based on design mode filtersdefined in the package.
v No Data returns artificial data instead ofactual data from the data source.
For more information about design modefilters, see the Framework Manager UserGuide.
Language The content language sets the preferredlanguage for the data, IBM Cognos Viewer,dates, and so on.
Rows per page Specifies the number of rows to appear oneach page.
A Rows Per Page property exists in theProperties pane for lists and crosstabs. Ifyou set this property, the setting overridesthe same-named run option. This propertyapplies to both HTML and PDF outputs. Formore information about this property, see“Controlling the Rows Per Page for MultipleContainers in HTML and PDF” on page 48.
Prompt Select to be prompted for each promptdefined unless the prompt is defined in areport page.
If you clear the Prompt check box, you areprompted only if the report cannot runwithout user intervention. For example, if areport has a single parameterized filter thatis optional, you are not prompted when yourun the report.
46 IBM Cognos Report Studio Version 10.2.1: User Guide

Option Description
Include accessibility features Specifies whether accessibility features, suchas alternate text on images and charts andsummary text in tables, are included in thereport output.
This option is also used for conditionallayouts in Report Studio. When the option isselected, you can specify that a crosstab isrendered as an accessible alternate to achart.
For more information about how to createaccessible reports, see “Considerations toImprove Report Accessibility” on page 468.
Enable bidirectional support Specifies whether to enable bidirectionalsupport in the report output.Tip: You can also enable bidirectionalsupport in Cognos Connection by modifyingyour user preferences (My Preferences link).If you enable bidirectional support inCognos Connection, this run option will beautomatically selected.
6. From the Run menu, click one of the options to produce the report in theformat you want.You can produce a report in HTML, PDF, CSV, various Microsoft Excel formats,and XML. You cannot produce a report in CSV format if you have more thanone query defined in the report unless the additional queries are used forprompts.
Results
The report runs in IBM Cognos Viewer. Once the report has finished running, youcan run the report again in the same format or in a different format. If you run thereport again in CSV or XLS format, the report will appear in a new browserwindow.
The options available in IBM Cognos Viewer depend on the capabilities set by theadministrator for each user. For more information, see the IBM Cognos BusinessIntelligence Administration and Security Guide.Related concepts:“Running a Report Against a Dimensional Data Source” on page 531You can cancel a report that is running against Microsoft SQL Server AnalysisServices only during the initial portion of its execution. After this time, the reportruns to completion.
Specify Not to Render a Page If It Does Not Contain DataYou can specify not to render a report page if the page does not contain any datawhen the report is run.
Procedure1. In the report page, click a data container.
2. In the Properties pane, click the select ancestor button and click the datacontainer type.
Chapter 3. Creating a report 47

For example, if the data container is a list, click List.
Tip: You can also click the container selector (three orange dots) of thecontainer to select it.
3. Set the Render Page when Empty property to No.4. Repeat steps 1 to 3 for all other data containers in the page and any table of
contents objects.
Results
When you run the report, if no data is produced in all data containers and table ofcontents objects in a page, the page is not rendered. The page is not rendered evenif the page contains other objects, such as text items or images.
Controlling the Rows Per Page for Multiple Containers inHTML and PDF
If you have more than one data container in a report, such as a list and a crosstab,you can control how the report is rendered in HTML and PDF by setting the RowsPer Page property for each container.
For HTML output, the report property option Page break by data container forinteractive HTML controls whether the default number of rows is rendered foreach data container on each page.
IBM Cognos Business Intelligence uses the following rules when rendering reportsin HTML and PDF:v If the Rows Per Page property is not set for any of the data containers, 20 rows
per page are rendered in HTML and each page is completely filled in PDF. Thefirst data container is rendered until there is no more data, followed by the nextcontainer, and so on.
Tip: The number of rows that appear on a PDF page depends on the font sizeset in the report.
v If the Rows Per Page property is set for each data container, the specifiednumbers of rows are rendered in HTML and PDF on each page until there is nomore data.
v If the property is set for only some of the containers, the specified numbers ofrows are rendered in HTML and PDF on each page until there is no more data.For the remaining containers, 20 rows per page are rendered on each page inHTML and each page is completely filled in PDF.For example, you have two lists, List1 and List2. You set the Rows Per Pageproperty to 5 for List1. When you run the report in HTML, the first pagecontains the first 5 rows from List1 followed by the first 15 rows of List2.
v If no data is returned for a data container, an empty container is rendered.
Producing a Report in CSV FormatIBM Cognos Business Intelligence can produce reports in CSV format so you canopen them in other applications, such as Microsoft Excel spreadsheet software.
Reports saved in CSV formatv support Unicode data across many client operating systemsv are UTF-16 Little Endian data encoded
48 IBM Cognos Report Studio Version 10.2.1: User Guide

v include a BOM (Byte Order Mark) at the beginning of the filev are tab-delimitedv do not enclose strings in quotation marksv use a new line character to delimit rows
You can open reports saved in CSV format using a variety of spreadsheet softwareapplications. By default, reports produced in CSV format will appear in theapplication associated with the .csv file type.
You cannot produce the following in CSV format:v mapsv charts that do not have at least one category or seriesv reports that have more than one query defined in the report, unless the
additional queries are used for prompts
In IBM Cognos Connection, you can configure the CSV output to suit yourenvironment. For example, you can specify the character used to delimit fields. Formore information, see the IBM Cognos Business Intelligence Administration andSecurity Guide.
Producing a Report in Microsoft Excel FormatYou can export your report output to several different Microsoft Excel spreadsheetsoftware formats.
Excel 2007 and Excel 2007 Data formats render report output in native Excel XMLformat, also known as XLSX. This format provides a fast way to deliver nativeExcel spreadsheets to Microsoft Excel 2002, Microsoft Excel 2003, and MicrosoftExcel 2007. Users of Microsoft Excel 2002 and Microsoft Excel 2003 must install theMicrosoft Office Compatibility Pack, which provides file open and save capabilitiesfor the new format.
Excel 2007 provides fully formatted reports for use in Microsoft Excel version 2007.
The output is similar to other Excel formats, with the following exceptions:v Charts are rendered as static images.v Row height can change in the rendered report to achieve greater fidelity.v Column widths that are explicitly specified in reports are ignored in Microsoft
Excel 2007.v Merged cells are used to improve the appearance of reports.v The default size of worksheets is 65 536 rows by 256 columns.
Your IBM Cognos administrator can enable larger worksheets and change themaximum number of rows in a worksheet, up to a maximum of 16,384 columnsby 1,048,576 rows, by using advanced server properties. For more information,see the IBM Cognos Business Intelligence Administration and Security Guide.
Excel 2007 Data provides data for use in Microsoft Excel version 2007. Thesereports only contain minimal formatting. Default data formatting is applied to thedata based on data type and assumes that each column has a single data type.
The output is similar to other Excel formats, with the following exceptions:
Chapter 3. Creating a report 49

v The generated output includes only the first list query in the report. If a reportcontains multiple queries and the first query is a multi-dimensional query for acrosstab or for a chart, an error message is displayed when the report runs.
v Nested frames and master-detail links are not supported.v Cells in the Microsoft Excel file have a default width and height. You must
adjust the column width and height if the data is larger than the default size.v Style specifications are not rendered, including color, background color, and
fonts.v Borders are not rendered.v User-specified data formatting in the report specification are not applied,
including exception highlighting and color rules for negative numbers.
Excel 2002 provides fully formatted reports for use in Microsoft Excel versionsearlier than 2007. Excel 2002 format also offers the following benefits:v Spreadsheets are contained in a single file for reliable spreadsheet navigation.v The maximum size of worksheets is 65,536 rows by 256 columns.Related concepts:“Larger worksheet sizes for Microsoft Excel 2007 report outputs” on page 10IBM Cognos Business Intelligence now supports a larger worksheet size for reportoutputs exported in Microsoft Excel 2007 format.Appendix E, “Limitations When Producing Reports in Microsoft Excel Format,” onpage 549There are limitations when producing reports in Microsoft Excel format.
Option to group repeating cells in reports produced in Excel2007 formatWhen you produce reports in Excel 2007 format, you can specify whetherrepeating cells are grouped, or merged, into a single cell.
Report outputs to Excel 2007 format are easier to read and look more like otheroutput formats when repeating values are grouped. If further analysis of the datais required within Excel or if the outputs are used to provide data to another tool,it is often preferable for repeating values to be populated in each row or column towhich they apply.
By default, repeating cells are merged in Excel 2007 output. For example, Productline is a grouped column in a list. The values for Product line, such as CampingEquipment and Golf Equipment, appear once in a merged cell in Excel output.When repeating cells are not grouped, the values for Product line appear in eachrepeating cell. The option to merge repeating cells in Excel output is controlled byselecting or clearing the Group repeating cells when exporting to Excel check boxin the Report Properties dialog box.
Crosstabs
In general, grouped data item values appear in each repeating cell. For example, acrosstab contains Product line and Product type as rows. When repeating cells areungrouped, the label for each product line value is rendered in each repeating rowcell.
If a cell on a column edge spans multiple worksheet rows, the cell label is notrepeated in all rows. If a cell on a row edge spans multiple columns, the cell labelvalue is not repeated in multiple worksheet columns. For example, a crosstabcontains Product line, Product type, and Product as rows. A summary is added for
50 IBM Cognos Report Studio Version 10.2.1: User Guide

Product line. The product line summary cell spans Product line, Product type, andProduct. In Excel, repeating cells are produced for the summary row, but the labelfor the summary appears only in the first cell.
Repeating cells that are produced from crosstab headers follow this behavior. Forexample, Product line and Product type are inserted as rows in a crosstab. Headersnamed Product line and Product type are created, and each header spans twocolumns. In Excel, the header labels appear only in the first cell. The repeating cellsare empty.
If a layout object, such as a table or image, is inserted in the crosstab corner, thesize of the object might cause the crosstab corner column edge to span multiplerows and row edges to span multiple columns. When this situation occurs, columnlabels repeat only in the column span and row labels repeat only in the row span.
The following figure shows a crosstab that contains Year as columns and Ordermethod type as rows. A three by three table is inserted in the crosstab corner. InExcel output, the size of the table produces repeating cells in the columns and inthe rows. Year labels, such as 2010, repeat only in the columns and not in the rows.Order method labels, such as E-mail, repeat only in the rows.
Lists
In lists, grouped data values are repeated in ungrouped cells. For example, a listcontains Product line and Product type, and Product line is grouped. Whenrepeating cells are ungrouped in Excel, the label for each product line value isrendered in the repeating cells.
Group header and list page header labels are not repeated. These labels appearonly in the first cell, and repeating cells are empty.
Nested data containers, images, and charts
Nested data containers, images, and charts in a report can produce merged cells.For example, when a crosstab is inserted in a list, other columns in the list appearas merged cells in Excel 2007 output. The following rules are applied when mergedcells are split.1. If a cell is merged as a result of a data item grouping, then data values are
repeated in the split cells.2. If a cell is merged as a result of a nested data container, image, or chart, then
data values are not repeated in split cells.
Figure 2. Excel 2007 output of a crosstab with a table inserted in the crosstab corner
Chapter 3. Creating a report 51

For example, a list contains Product line, Product type, Quantity, and an image ascolumns. The Product line column is grouped. The image produces merged cells inExcel output because its size spans more than one row. When the report is runwith the option to ungroup repeating cells, Product line values are repeated, butProduct type and Quantity values are not.
Bookmarks
When you produce Excel 2007 output with ungrouped repeating cells, clicking anentry in a table of contents brings you to the first row that contains that entry. Forexample, a report contains a list with a table of contents. Product line values arerepeated in the list in Excel output. When you click Camping Equipment in thetable of contents, you are brought to the first cell in the list that contains CampingEquipment.Related tasks:“Specify Report Properties” on page 350You can change the default report property settings.
Producing a Report in XML FormatXML report outputs save the report data in a format that conforms to an internalschema, xmldata.xsd.
You can find this schema file in c10_location/bin.
This format consists of a dataset element, which contains a metadata element and adata element. The metadata element contains the data item information in itemelements. The data element contains all the row and value elements.
You can create models from reports and other data that conform to thexmldata.xsd schema. This is useful if you want to use a report as a data source foranother report, or if you use a database that cannot be read by IBM CognosFramework Manager. In this case, export the data from the data source to an XMLfile, in conformance with the xmldata schema, and then open the XML file inFramework Manager.
For more information, see the Framework Manager User Guide.
You cannot produce the following in XML format:v mapsv charts that do not have at least one category or seriesv reports that have more than one query defined in the report, unless the
additional queries are used for promptsIf a report contains more than one data container, such as a crosstab and a list,and both containers use the same query, only the output for the list is produced.If a report contains multiple lists, only the output for the first list is produced. Ifa report contains multiple crosstabs and multiple lists, only the output for thefirst list is produced.
Set PDF Page OptionsSet PDF page options, such as page orientation and paper size, to control howreport pages appear in PDF. You can set PDF page options for individual reportpages or for all report pages in a layout.
52 IBM Cognos Report Studio Version 10.2.1: User Guide

Tip: The PDF Page Properties sample report in the GO Sales (analysis) packageincludes PDF page options. For more information about The Sample OutdoorsCompany samples, see Appendix C, “Sample Reports and Packages,” on page 507.
You can also set PDF page options in IBM Cognos Connection. For moreinformation, see the IBM Cognos Connection User Guide.
The paper size for PDF output can be a maximum of 200 x 200 inches or 500 x 500centimeters. A larger paper size produces a blank page.
Procedure1. To set PDF page options for all report pages in a layout, do the following:
v From the File menu, click PDF Page Setup and set the page options.2. To set PDF page options for an individual page, do the following:
v Pause the pointer over the page explorer button and click the page.v In the work area, click anywhere on the page.
v In the Properties pane, click the select ancestor button and click Page.v Double-click the PDF Page Setup property, select the Override the page
setup for this page check box, and set the page options.
View Lineage Information for a Data ItemView lineage information of a data item to see what the item represents before youadd it to a report.
Lineage information traces the metadata of an item back through the package andthe data sources used by the package. Lineage also displays any data item filtersthat were added by the report author or that were defined in the data model.Viewing lineage information ensures that you add the correct data items to areport. For example, you can view the lineage information of a model calculationto see how it was created.
Note: Lineage is available only after your administrator has configured it. Formore information, see the IBM Cognos Business Intelligence Administration andSecurity Guide. In addition, lineage is not supported in reports that are not linkedto packages.
You can use the lineage tool that comes with IBM Cognos Business Intelligence, oryou can use another lineage tool by specifying the URL to the tool in IBM CognosAdministration. Note that if the URL source is secured, the source must be able toprompt users for a password because IBM Cognos BI does not pass securityinformation. IBM Cognos BI also supports the IBM Metadata Workbench as alineage tool. For more information about configuring other lineage tools, see theIBM Cognos Business Intelligence Administration and Security Guide.
Tip: The Customer Returns and Satisfaction sample report “Customer Returns andSatisfaction” on page 515in the GO Data Warehouse (analysis) package includeslineage information. For more information about The Sample Outdoors Companysamples, see Appendix C, “Sample Reports and Packages,” on page 507.
You cannot use lineage information to troubleshoot queries. For example, lineageinformation will not explain why a data item is double counted. Also, you cannotview lineage information when running a report from a mobile device.
Chapter 3. Creating a report 53

Before you begin
Before you can access lineage information for a report, your administrator mustconfigure lineage in IBM Cognos Administration. Also, the administrator mustenable the lineage capability and grant read permission for you on the report.
Note: The IBM Cognos BI lineage tool shows lineage on a report at its highestlevel. The lineage does not change after you drill down on a report. Because theselection context used to launch lineage can be affected by drill-down operations,we recommend that you always launch lineage at the highest report level beforedrilling down on the report. Otherwise, the lineage may not start properly.
Procedure
From the Source tab , right-click the data item and click Lineage.
Tip: You can view lineage information for multiple data items at the same time byfirst Ctrl+clicking the items. The IBM Metadata Workbench does not supportviewing lineage for multiple data items at once.
Results
The lineage tool opens showing the lineage information of the selected data item.
The IBM Cognos Business Intelligence Lineage ToolThe IBM Cognos Business Intelligence lineage tool includes two views: thebusiness view and the technical view.
The business view displays high-level textual information that describes the dataitem and the package from which it comes. This information is taken from IBMCognos Connection and the IBM Cognos Framework Manager model.
The technical view is a graphical representation of the lineage of the selected dataitem. The lineage traces the data item from the package to the data sources usedby the package.
When you click an item, its properties appear below it. If you click an item in thePackage area, you see the model properties of the item. If you click an item in theData Sources area, you see the data source properties of the item.
54 IBM Cognos Report Studio Version 10.2.1: User Guide

You can also view lineage information in IBM Cognos Viewer after you run areport. For example, you can click a cell in a crosstab to see how the cell value wascalculated. To view lineage information in IBM Cognos Viewer, right-click an itemin the report and then click Lineage. If you or an administrator runs a saved reportwith the IBM Cognos BI lineage tool, both the business view and the technicalview are visible. Report consumers can see only the business view. In addition tothe Package and Data Sources areas, a Report area exists when looking at thetechnical view.
Access the IBM WebSphere Business GlossaryBusiness glossaries help you manage and share an enterprise vocabulary andclassification system.
If you use the IBM WebSphere® Business Glossary, you can access the glossaryfrom any of the following data objects:v Query subjectv Query itemv Measurev Dimensionv Hierarchyv Levelv Property or attributev Top node memberv Memberv Level item
Procedure
Right-click the data item and click Glossary.The IBM WebSphere Business Glossary appears.
Chapter 3. Creating a report 55

Support for bidirectional languagesYou can author reports that support bidirectional languages. You can specify basetext direction, digit shaping, and container direction.
Arabic, Hebrew, Urdu, and Farsi are languages written from right to left, using theArabic or Hebrew scripts. However, numbers in those languages, as well asembedded segments of Latin, Cyrillic, or Greek text, are written from left to right.Using the bidirectional settings in IBM Cognos Report Studio, you can control thedirection in this type of text in reports.
Report formats
Bidirectional languages are supported for reports produced in HTML, PDF, andMicrosoft Excel. IBM Cognos Active Report also supports bidirectional languages.
Enabling bidirectional support
To enable support for bidirectional languages when a report is run, in IBM CognosConnection, users must open their My Preferences page and select the Enablebidirectional support check box.
To enable support for bidirectional languages when a report is run from ReportStudio, select the Enable bidirectional support check box in the Run Optionswindow.
Tip: If you enable bidirectional support in Cognos Connection and you then startReport Studio, the bidirectional support run option in Report Studio is selected. Ifyou disable bidirectional support in Cognos Connection and you then start ReportStudio, the run option in Report Studio is cleared.
Base text direction
Base text direction sets the text direction as left-to-right or right-to-left. You canspecify the base text direction for any text object in a report. You specify the basetext direction for text by clicking the Direction & Justification property for the textor for the object that contains the text, such as a list column.
A contextual option also exists in the Direction & Justification property that setsthe text direction based on the first letter in the text.
For compound objects that contain text, you specify the base text direction of thetext contained in the object by clicking the Contained Text Direction property forthe object. Examples of compound objects are charts, prompts, and active reports.
Digit shaping
Digit shaping allows users to consume reports with numbers that they can readafter they select the content language in IBM Cognos Connection. You can specifydigit shaping at the following levels:v Reportv Container (except for charts and maps)v Textv Number
56 IBM Cognos Report Studio Version 10.2.1: User Guide

You specify digit shaping for an object by clicking the Data Format property forthe object. To specify digit shaping at the report level, click the Default DataFormats option in the Data menu.
Tip: Digit shaping has no impact on reports produced in Excel format, since theshaping of digits in Excel depends on Windows regional settings.
Container direction
Container direction sets the direction of container objects in a report as left to rightor right to left. You specify container direction for an object by clicking theDirection & Justification property for the object.
Tip: Container direction is not supported in reports produced in Excel format.Excel spreadsheets do not natively support mirroring at the container level.Related concepts:“Digit shaping in charts and maps” on page 388When working with bidirectional content, you cannot specify digit shaping at thechart or map level. You can specify digit shaping for the objects in charts andmaps.Related tasks:“Run a Report” on page 45Run your report to see the data that is retrieved. Save time by validating it first tocheck for errors.“Specify text and container direction” on page 346You can specify text and container direction by choosing any of these options.“Set the Default Data Formats” on page 387Set the default data properties for each type of data, including text, number,currency, percent, date, time, date/time, and time interval.“Specify the Data Format for an Object” on page 388Specify the format for a particular object if you are not getting the results youwant.
Reports for workspaces in Cognos WorkspaceWhen building a workspace in IBM Cognos Workspace, business users can insertan entire IBM Cognos Report Studio report or insert only individual objects fromwithin a report.
To create effective reports for use in workspaces in Cognos Workspace:v Ensure that all the objects and pages within the report have meaningful names.
For some objects, such as data containers, Report Studio gives the object in areport a default name such as List 1, List2, and so on. In Cognos Workspace,these names appear in the Content tree. To help business users recognize thereport objects, rename them to something more meaningful (Properties pane,Name property).If you do not want an object to be added in a workspace, clear the Nameproperty for that object. The object will not appear in the Content tree. However,you cannot clear the name of data containers. Report Studio requires that datacontainers have names.
Chapter 3. Creating a report 57

Note: Cognos Workspace does not support tables and blocks. Unsupportedobjects do not appear in the Content tree in Cognos Workspace, even if youspecify a name for the object.
v Create a container report that includes all the report objects that workspaceusers might want to add in a report. Such a report is not meant to be run anddoes not need to show report objects in a proper layout. It is only used as acontainer for the various report parts. Each page of a report appears as a folderwithin the Cognos Workspace Content pane.For example, on one page named Prompts you can insert all the possibleprompts that users might want to add to a workspace, and give each prompt auseful business name, such as Value Prompt for Region. On a second pagenamed Charts, you can insert a number of charts useful for workspaces.
v Ensure that the titles and labels used in your report are understandable bybusiness users.
v Ensure that you use report objects that are well suited for dashboards. Theyconvey the most information in as little space as possible. For example, if youinclude a chart, use bullet charts, microcharts, line charts, or column and barcharts. Use conditional blocks to show business indicators.
v If your report includes charts, customize the font sizes so that the charts appearcorrectly in a dashboard. You may need to reduce the font sizes.
v If your report includes embedded objects, such as a list with an embedded chartand crosstab, the embedded objects do not appear in the Cognos WorkspaceContent pane, unless the embedded objects are in a table object. When youinsert an object that contains embedded objects, the embedded objects will beinserted in the workspace.When embedded objects are in a table object, the embedded objects appear inthe Content pane. Table objects do not appear in the Content pane becauseCognos Workspace does not support Report Studio table objects. Consequently,you can insert the embedded objects in a workspace, but not the table.
v If your report includes a map, customize the colors of the map in Report Studioso that they match the color palette of the dashboard. You cannot edit the colorpalette of a map from within a workspace in Cognos Workspace.
v If your report is using a dimensional data source and you enable drill-up anddrill-down, in the Drill Behavior window, specify that the column title usesmember caption values.Cognos Workspace does not support drill up and drill down with level labelvalues as the column titles. Cognos Workspace always uses member captions.
Related tasks:“Create a Drill-up and Drill-down Report” on page 308You can link groups of data items from different queries so that when you drill upor drill down in one query, the data item also drills up or drills down in the linkedqueries.
Prompts in workspaces in Cognos WorkspaceA prompt control, when assigned a Name property in IBM Cognos Report Studio,appears as an object that you can insert from the Content pane in a workspace inIBM Cognos Workspace.
If a workspace includes reports and report parts from the same model, promptsautomatically filter the appropriate data item in all the widgets in the dashboard.For example, a prompt filters on Product Line. Any widget in the dashboard thatincludes the Product Line data item is filtered when you select a value from this
58 IBM Cognos Report Studio Version 10.2.1: User Guide

prompt control. If you do not want a prompt to control a widget in the dashboard,you can disable communication between the two widgets.
If a dashboard includes prompted reports or report parts from different models,ensure that the prompts use the same parameter names. For example, a yearprompt should use the same parameter p_Years in reports from both models.Otherwise, the prompt control is unable to control reports from another package.
Enable filters in workspaces in Cognos WorkspaceYou can include a data item in the query of the report, but not show that data itemin the actual report. This is useful for creating calculations and filters. If you wantIBM Cognos Workspace users to filter content in a workspace based on a data itemthat is not visible in the report, you must include this data item in its own queryand name it _BusinessInsight_ within the IBM Cognos Report Studio report.Therefore, the data item must exist in both the query used for the data container(such as the list, crosstab, or chart) and in this separate query.
For example, a chart shows the revenue for the product lines for each region. Youwant to filter the chart to show only data for the year 2012. When you author thereport, in addition to including Year in the Query1 used for the chart datacontainer, you create a new query named _BusinessInsight_ that includes Year.
Procedure1. Pause your pointer over the Query Explorer and click Queries.
2. From the Toolbox tab , drag a Query object to the work area.3. Click the Query object, and in the Properties pane, in the Name box, type
_BusinessInsight_.
4. Double-click the Query object, and from the Source tab , add the data itemto use as a filter.Ensure that the same data item also exists in the query used for the datacontainer.
Creating Reports for IBM Cognos for Microsoft OfficeIBM Cognos for Microsoft Office provides an integrated environment for IBMCognos products and Microsoft Office. You can use IBM Cognos for MicrosoftOffice to select pieces of reports to embed in Microsoft Excel workbooks, MicrosoftWord documents, or Microsoft PowerPoint presentations, including data, metadata,headers, footers, and charts. You can use predefined reports or you can create newcontent using IBM Cognos PowerPlay® Web, IBM Cognos Query Studio, IBMCognos Workspace Advanced, or IBM Cognos Report Studio.
Note: Note that to access PowerPlay content, your administrator must configurePowerPlay to work with IBM Cognos Business Intelligence. PowerPlay content thatis published only to Upfront is not available to IBM Cognos for Microsoft Office.
Because IBM Cognos for Microsoft Office cannot fully convert highly formattedreports into Excel or other Microsoft document output types, you may not get theresults that you want.
To create effective reports for IBM Cognos for Microsoft Office, follow theserecommendations:
Chapter 3. Creating a report 59

v Create content to meet specific Microsoft Office integration needs.For example, in IBM Cognos BI, many options are available to format data. Useless formatting to make data more accessible to Office applications.
v Organize reports.You can publish workbooks to IBM Cognos Connection and organize them withyour reports in Public Folders or My Folders. For more information, see theIBM Cognos Connection User Guide. By organizing your content, you canquickly retrieve the information that you want.
Tip: Workbooks, documents, and presentations that are enabled for IBM Cognosfor Microsoft Office are identified by their own unique icons, helping you todistinguish them from other types of files.
v Optimize report templates for Microsoft Office.If you rely on IT personnel or other report authors to create content, requestreport templates that are optimized for your Microsoft Office integration needs.You may want to request only the data elements or queries that you need andrequest minimal formatting so that you can more easily use Microsoft Officeformatting capabilities with the IBM Cognos content. For example, reportsauthored in Report Studio can contain list objects embedded within list objectswith specific formatting applied. When converted to the tabular representationavailable in Excel, these reports may not be rendered in the same way in whichthey appear in IBM Cognos BI.
v Format elements in the Office application.Instead of formatting objects in IBM Cognos BI, add the formatting in the Officeapplication. By applying less formatting in IBM Cognos BI, you can import moredata into the desired locations.
v Label report elements using descriptive names.This practice makes them more easier to find after you import them. Examplesof report elements include lists, crosstabs, and charts.
v Do not nest report objects.If you nested report objects, some objects may not appear in the correct location,or they may not appear at all. In addition, nesting report objects may cause thefollowing error message to appear:RDS-ERR-1000 Report Data Service could not process from the content provider.
For example, this error occurs if a repeater or repeater table is inside a block ortable. It also appears when layout objects, such as lists, crosstabs, and charts, arein a conditional block that is inside another block or table.
v Keep table sizes small.For example, because of the size of slides, the maximum number of rows andcolumns that you can have in Microsoft PowerPoint tables is 25. Although Wordand Excel permit larger tables, it takes more time to download and render them.
v Use images with transparent backgrounds.The background will show through the image in the Office application, makingthe image look like part of the presentation. If you want, you can then supplyyour own background color.
v Specify the height and width of images in a list.This practice ensures that the image appears in the correct size in the Officeapplication.
v Remember that graphs and charts are imported as images.
60 IBM Cognos Report Studio Version 10.2.1: User Guide

Images in IBM Cognos BI have image maps associated with them to enabletooltips and hotspots. IBM Cognos BI for Microsoft Office cannot import tooltipsand hotspots into Office applications.
v Consider the additional limitations that exist when producing reports in Excelformat.
Creating Reports for Mobile DevicesYou can send IBM Cognos Report Studio reports to mobile devices that have IBMCognos Mobile installed, or that are using the IBM Cognos Mobile Web portal.
Creating location-aware reportsA location-aware report filters report data based on the user's current location asdetermined by the GPS coordinates of the mobile device. For example, a VicePresident of Sales travels frequently to visit his Regional Sales Managers. When hearrives at an airport, he wants to filter his sales report to show information aboutthe region that he is visiting.
You can create location-aware reports in IBM Cognos Report Studio if your IBMCognos Mobile administrator has set up location-aware parameters. For moreinformation, check with your IBM Cognos Mobile administrator or see the IBMCognos Mobile Installation and Administration Guide.
Location-aware reports must include at least one prompt that requests the locationinformation. This location information, as defined by your IBM Cognos Mobileadministrator, could use either coordinates or defined regions, such as states,provinces, cities, or voter regions. Your administrator also defines the parameternames for the prompts, which you must provide when adding the location prompt.
Chapter 3. Creating a report 61

62 IBM Cognos Report Studio Version 10.2.1: User Guide

Chapter 4. Lists
Use lists to show detailed information from your database, such as product listsand customer lists.
A list shows data in rows and columns. Each column shows all the values for adata item in the database or a calculation based on data items in the database.
You can specify whether to automatically add an overall aggregate summary in thelist footer and a summary for any groups in the list by selecting Automatic groupand summary behavior for lists in the IBM Cognos Report Studio options. Thedefault aggregation as specified in your enterprise data source is used.
Tip: The Order Invoices - Donald Chow, Sales Person sample report in the GOSales (query) package includes a list. For more information about The SampleOutdoors Company samples, see Appendix C, “Sample Reports and Packages,” onpage 507.Related concepts:“Limitations When Using Set Expressions in List Reports” on page 532In list reports, we recommend that you avoid using set expressions. When in a list,set expressions, such as TopCount, may produce fewer rows than in thecorresponding crosstab.Related tasks:“Change a List into a Crosstab” on page 75Change a list into a crosstab to view your data from a different perspective.
Set List PropertiesFormat lists to give them the appearance you want. You can specify formatting forindividual column titles or bodies or for all columns in a list. When you specifyformatting for all columns in a list, the formatting is automatically applied to newcolumns you subsequently add.
You can also quickly format lists by applying table styles.
Formatting for specific columns overrides formatting for entire columns. Forexample, you specify red as the background color for a specific column body andgreen as the background color for all columns. When you run the report, thespecific column body is red and the remaining columns in the list are green. Newcolumns added to the list will be green.
© Copyright IBM Corp. 2005, 2013 63

Procedure1. To format an individual column, do the following:
a. Click the column title or column body.b. To format the text in the column title or the data in the column body, click
the unlock button in the toolbar and then click the title or body.
c. To format the whole column, click the select ancestor button in the titlebar of the Properties pane and click List Column.
d. In the Properties pane, set the property value.For example, to specify a background color, click Background Color andchoose the color.
2. To format all columns, do the following:a. Click a column in the list.b. To format list column bodies, click the select ancestor button in the title bar
of the Properties pane and click List Columns Body Style.c. To format list column titles, click the select ancestor button in the title bar of
the Properties pane and click List Columns Title Style.d. To format entire columns, click the select ancestor button in the title bar of
the Properties pane and click List Columns.e. To format the entire list, click the select ancestor button in the title bar of
the Properties pane and click List.
Tip: You can also click the container selector (three orange dots) of the listto select it.
f. In the Properties pane, set the property value.For example, to specify a background color, click Background Color andchoose the color.
Related concepts:Chapter 12, “Laying Out a Report,” on page 329When creating a report, a good layout is essential to ensure that the information inthe report is presented in a clear and effective manner.
Hide Columns in List ReportsYou can hide columns from the output of list reports. If you select to hide acolumn, the query for that column is still executed.
Procedure1. Select the column that you want to hide.
2. Click the select ancestor button in the title bar of the Properties pane andclick List Column.
3. Set the Render property to No.
Results
When you run your report, the column is hidden in the report output.
Using RepeatersUse repeaters to repeat items when you run the report. For example, you can userepeaters to create mailing labels, including customer names and addresses.
64 IBM Cognos Report Studio Version 10.2.1: User Guide

To build a repeater, drag the Repeater or Repeater Table object from the Toolboxtab to the work area. Use repeaters to repeat items across a single row without aparticular structure. For example, you want to create a list that contains Year, andProduct line. For each year, you want all product lines to appear in a single row.To do this, create a list with Year as a column and with a repeater as a secondcolumn. Then insert Product line into the repeater. Use repeater tables to repeatitems in a table structure. Drop the items in the repeater, and modify the propertiesof the repeater to obtain the results you want. For example, you can specify howmany frames appear per page in a repeater table by typing values in the Acrossand Down properties.
Horizontal pagination is not supported for data containers, such as lists orcrosstabs, that are nested in repeater tables.
Convert a List into a RepeaterYou can convert a list into a repeater table to take advantage of an existing list.
Procedure1. Click any part of the list.2. From the Structure menu, click Convert List to Repeater.
Example - Create Mailing LabelsYou are a report author at The Sample Outdoors Company, which sells sportingequipment. You are requested to create mailing labels for all of the company'sretailers.
Procedure1. Open IBM Cognos Report Studio with the GO Data Warehouse (query)
package.2. In the Welcome dialog box, click Create a new report or template.3. In the New dialog box, click Repeater Table and click OK.
4. Click the repeater, click the select ancestor button in the Properties panetitle bar, and click Repeater Table.
Tip: You can also click the container selector (three orange dots) of therepeater table to select it.
5. In the Properties pane, set the following properties:v Set the Across property to 2.v Set the Down property to 5.v Double-click the Table Properties property, select the Fixed size check box,
and click OK.
6. From the Toolbox tab , drag the Table object to the repeater.The Insert Table dialog box appears.
7. In the Number of columns box, type 1 and click OK.8. Click the table, ensure that you see Table Cell in the Properties pane title bar,
and modify the following properties:v Double-click Background Image, click Specified and click Browse.v Click logo.jpg and click OK.v In the Background Image dialog box, under Position, click the align top
right button.
Chapter 4. Lists 65

v Under Tiling, click Do not tile and click OK.v Double-click Size & Overflow, and in the Height box, type 175, and click
OK.9. Click the table, click the select ancestor button in the Properties pane title bar,
and click Table.
Tip: You can also click the container selector (three orange dots) of the tableto select it.
10. In the Properties pane, specify properties for the table:v Double-click Border.v In the Style box, click Solid line.v In the Width box, click 1 pt.v In the Color box, click Black.
v Under Preview, click the apply all borders button and click OK.v Double-click Font, and under the Size box, click 8pt, and click OK.
11. From the Toolbox tab , drag the Block object to the repeater 8 times tocreate 8 blocks.
12. Drag the Text Item object to the first block:v In the Text dialog box, type To: and click OK.v Select the text item.v Double-click the Font property, set the weight to Bold, and click OK.
13. Click the first block, and, in the Properties pane, specify properties for thefirst block:v Double-click the Padding property, type 35 in the box on the right, click
mm as the unit, and click OK.v Set the Horizontal Alignment property to Center.
14. From the Source tab , expand Sales and Marketing (query), Sales(query), and Retailer site and drag seven data items to the remaining sevenblocks.
15. Ctrl+click the seven blocks to select them, and in the Properties pane, specifyproperties for the seven blocks:v Double-click the Padding property, type 25 in the box on the left, click mm
as the unit, and click OK.v Set the Horizontal Alignment property to Left.
Results
When you run the report, each page contains 10 mailing labels in two columns.
66 IBM Cognos Report Studio Version 10.2.1: User Guide

Chapter 5. Crosstabs
Use crosstab reports, also known as matrix reports, to show the relationshipsbetween three or more query items. Crosstab reports show data in rows andcolumns with information summarized at the intersection points.
For example, the crosstab below shows the gross profit and revenue by productline for each year.
Tip: The Same Month Prior Year sample report in the Sales and Marketing (cube)package includes a crosstab. For more information about The Sample OutdoorsCompany samples, see Appendix C, “Sample Reports and Packages,” on page 507.Related tasks:“Insert a Microchart into a Crosstab” on page 152You can use microcharts to improve the visualization of data in crosstabs.
Crosstab Nodes and Crosstab Node MembersWhen you add data items to crosstabs, you create crosstab nodes and crosstabnode members. These objects allow you to easily create crosstabs, by dragging dataitems to crosstabs.
Crosstabs are dimensional objects that have row edges and column edges. Eachedge is composed of a set of crosstab nodes. Each crosstab node contains thefollowing:v One or more crosstab node members.v Zero or one nested crosstab node, which contains one or more crosstab node
members or nested crosstab nodes.
Each crosstab node member refers to a data item that contains an expression todefine the members in the crosstab.
The following crosstab contains four crosstab nodes.
© Copyright IBM Corp. 2005, 2013 67

�1� Crosstab node 1 contains a single node member for the total. This node refersto the data item Total(Product line).
�2� Crosstab node 2 contains a crosstab node member that refers to the data itemProduct line. This member has a nested crosstab node containing a crosstab nodemember that refers to the data item Product type.
�3� Crosstab node 3 contains a single node member for the average. This noderefers to the data item Average(Product line).
�4� Crosstab node 4 contains a crosstab node member that refers to the data itemOrder year. This member has two nested crosstab nodes. The first node contains acrosstab node member that refers to the data item Order month. The second nodecontains a crosstab node member for the total. This node refers to the data itemTotal(Order month).
Tip: Nodes are also created when you add data items to charts.
Moving Crosstab Nodes
Crosstab nodes can be placed anywhere in the crosstab. For example, in theprevious diagram, you can drag Order month under Average to create a row edge.
To move nested items from one edge to another, ensure that you select the crosstabnode and not the crosstab node member. For example, in the previous diagram,you want to move Product line and Product type to the column edge. To do this,click Product line and, in the Properties pane, click the select ancestor buttonand click Crosstab Node. Both Product line and Product type are selected.
Crosstab Node Creation Option
In the Structure menu, the Create Crosstab Nodes option affects thedrag-and-drop behavior in crosstabs. When the option is turned on and you add adata item to a crosstab, the item is created as a crosstab node. If the option isturned off, the item is created as a crosstab node member to an existing crosstabnode.
For example, in the previous diagram, if the option is turned on and you drag
Country or Region from the Source tab to beneath Product line, Country orRegion becomes a new peer node to Product line. If the option is turned off,Country or Region becomes a new peer node to Product line and has Producttype as a nested crosstab node. This happens because instead of adding a newnode, you are adding a new member to the existing node that already containsProduct line.
68 IBM Cognos Report Studio Version 10.2.1: User Guide

Tip: To create discontinuous crosstabs, turn the Create Crosstab Nodes option on.If you want the items on the edges of crosstabs to be related (contain the samenested items), turn the Create Crosstab Nodes option off.
Set Crosstab PropertiesFormat crosstabs to give them the appearance you want. You can specifyformatting for rows, columns, and fact cells in a crosstab or for the entire crosstab.When you specify formatting for all rows, columns, fact cells, or the crosstab, theformatting is automatically applied to any new items you add.
If you apply the same styles, such as font color, to crosstab rows, columns, andcrosstab intersections, the styles are applied in the following order:1. crosstab fact cells2. fact cells in the outermost rows3. fact cells in the innermost rows4. fact cells in the outermost columns5. fact cells in the innermost columns6. crosstab intersections
The style applied to the last object in the list overrides styles applied to previousobjects. In addition, class styles are applied before styles that you apply manually.
You can also quickly format crosstabs by applying table styles and add white spaceto a crosstab by inserting crosstab space objects.
Tip: In cases where fact cell formatting applied to rows conflicts with fact cellformatting applied to columns, you can set the Fact Cells Precedence property inthe Properties pane to determine whether the row formatting or the columnformatting has precedence. To set this property, click anywhere in the crosstab,click the select ancestor button in the title bar of the Properties pane, and clickCrosstab. Or you can click the container selector (three orange dots) of the crosstabto select it.
Procedure1. To format the entire crosstab, do the following:
a. Click anywhere in the crosstab.
b. Click the select ancestor button in the title bar of the Properties paneand click Crosstab.
c. In the Properties pane, set the property value. For example, to specify abackground color, click Background Color and choose a color.
2. To format all rows, columns, or fact cells, click a row, column, or fact cell in thecrosstab and then do the following:a. If you clicked a row, click the select ancestor button in the title bar of the
Properties pane and click Crosstab Rows.b. If you clicked a column, click the select ancestor button in the title bar of
the Properties pane and click Crosstab Columns.c. If you clicked a fact cell, click the select ancestor button in the title bar of
the Properties pane and click Crosstab Fact Cells.d. In the Properties pane, set the property value. For example, to specify a
background color, click Background Color and choose the color.
Chapter 5. Crosstabs 69
Tip: You can also right-click the row or column and click Select Fact Cells.3. To format all crosstab cells for a specific row or column, do the following:
a. Click the row or column.b. Click the select ancestor button in the title bar of the Properties pane and
click Crosstab Member Fact Cells.
Tip: You can also right-click the row or column and click Select MemberFact Cells.
c. In the Properties pane, set the property value. For example, to specify abackground color, click Background Color and choose the color.
4. To format all row or column titles, do the following:a. Click a row or column title.b. Click the select ancestor button in the title bar of the Properties pane and
click Crosstab Rows or Crosstab Columns.c. In the Properties pane, set the property value. For example, to specify a
background color, click Background Color and choose the color.5. To format an individual row, column, or intersection, do the following:
a. Click the row, column, or intersection.
Tip: To format the data in a row, column, or intersection, click the unlock
button in the toolbar and then click the text item to format.b. In the Properties pane, set the property value. For example, to specify a
background color, click Background Color and choose the color.Related concepts:Chapter 12, “Laying Out a Report,” on page 329When creating a report, a good layout is essential to ensure that the information inthe report is presented in a clear and effective manner.
Create a Single-Edge CrosstabCreate a single-edge crosstab report to show data in a list-like form. For example,to show the quantity of products sold for each year and for each order method,you could create a crosstab with Order Year and Order Method as rows andQuantity as the measure.
Procedure
1. From the Toolbox tab , insert a crosstab object to the work area.
2. From the Source tab , drag data items to the Rows or Columns drop zone.A black bar indicates where you can drop the data item.
3. Repeat step 2 to insert additional data items:v If you dragged the data item in step 2 to the Rows drop zone, drag the
additional items above or below the first item.v If you dragged the data item in step 2 to the Columns drop zone, drag the
additional items to the left or right of the first item.4. To add measures to the crosstab, drag the measures to the Measures drop zone.
70 IBM Cognos Report Studio Version 10.2.1: User Guide

Results
When you run the report, a crosstab is produced that has only one edge.
Create a Nested CrosstabNest data in a crosstab report to compare information by using more than one dataitem in a column or row. For example, a report shows the number of sales byproduct line for the past fiscal year. You decide to add a data item to further breakdown the number of sales by quarter.
When nesting columns in a crosstab report, there are four distinct drop zoneswhere you can insert a new data item. The drop zone you choose will define therelationship between the data item and the column.
The following relationships are created when you insert a data item as a row:v Inserting a data item to the left or right of a column creates a parent-child
relationship between them.When you insert a data item to the left of a column, the data item becomes aparent to the column. When you insert a data item to the right of a column, thedata item becomes a child of the column.
v Inserting a data item above or below a column creates a union relationshipbetween them.
The following relationships are created when you insert a data item as a column:v Inserting a data item to the left or right of a column creates a union relationship
between them.v Inserting a data item above or below a column creates a parent-child
relationship between them.
When you insert a data item above a column, the data item becomes a parent tothe column. When you insert a data item below a column, the data item becomes achild of the column.
For example, you have a crosstab with Product line as rows and Quantity andRevenue as nested rows. For columns, you have Order method with Country orRegion as a nested column. In this crosstab,v Product line is a parent to Quantity and Revenue.v Quantity and Revenue are peers.v Order method is a parent to Country or Region.
Procedure
1. From the Source tab , click the data item to add.2. Drag the data item to the report as a nested column or nested row.
A black bar indicates where you can drop the data item.3. Repeat steps 1 to 2 to add other nested columns or rows.
Tip: If you add more than one measure to a crosstab, all measures appear ascolumns. You cannot have one measure appear as a row and another as acolumn. To make all measures appear as rows, swap columns and rows.
Chapter 5. Crosstabs 71
Creating headers automatically for sets in crosstabsYou can automatically add header labels on columns and rows when working withsets in a crosstab that uses a dimensional data source. The headers help consumersof the report to understand where the data is in the hierarchy.
Header labels are added only when you add new sets to your crosstab. The labelsare not added to existing sets. After you enable this option, it remains on until youdisable it, and applies to any new crosstabs that you create.
Procedure1. From the Tools menu, click Options, then click the Report tab.2. Select Automatically create crosstab headers for sets.3. Click OK.
Results
Header labels are created in the rows and columns in a crosstab.
Showing crosstab values as percentagesWhen you work with dimensional data sources, you can show crosstab values as apercentage of a summary instead of the actual values. When you show values as apercentage, you can compare the contribution of an item to the whole.
About this task
You can show crosstab values as a percentage of a summary on the rows, thecolumns, or the rows and columns. For example, a crosstab has Product line asrows, Year as columns, and Revenue as the measure. You can show the followingcrosstab values:v The actual values of Revenuev A percentage of a summary on Product linev A percentage of a summary on Yearv A percentage of a summary on Product line, Year
By default, the summary type that is used to calculate the percentages is Automaticsummary.
When you show values as a percentage, a percentage measure data item is created.
You can also create a custom percentage calculation. For example, you can showvalues as a percentage of an intersection (tuple). Or you can show values as apercentage of a different summary type, such as Maximum.
When you show values as a percentage, the fact cells are formatted with thepercent data format. When you show the actual values, the fact cells are formattedwith the number format. If you modify the data format of the actual values, thechange is lost when you switch between showing the actual values and percentagevalues.
You can show values as a percentage only in crosstabs. If you insert a chart, youcannot fill the chart with data from a crosstab that shows values as a percentage. If
72 IBM Cognos Report Studio Version 10.2.1: User Guide

you create a chart from a crosstab that shows values as percentages, an emptychart is created in the report.
Procedure1. Select the measure for which you want to show values as a percentage.
If there is only one measure in the crosstab, click the crosstab corner.2. From the Data menu, click Show Value As, and click the percentage values
that you want to show.3. If you click Custom, provide the information that is required to calculate the
percentage values.a. To change the default name of the percentage data item that you are
creating, type the new name in the Name field.b. In the Percentage based on box, choose to build the percentage data item
based on a summary of sets in the crosstab or based on an intersection(tuple).
c. If you choose to build the percentage data item based on a summary of sets,in the Choose sets box, click the sets that you want to use. Then, click theSummary type menu and select the summary that you want to use tocalculate the percentage values.If there is more than one data item on the crosstab edge that you chose forthe sets, select which data item that you want to use.
d. If you choose to build the percentage data item based on an intersection(tuple), click the ellipsis and select the items that you want to use to createthe intersection.
e. Click OK.4. To edit a measure percentage data item, follow these steps.
a. Select the measure.b. From the Data menu, click Show Value As > Edit.c. Modify the information for the data item as described in step 3.d. If you replaced a set in the crosstab with a different set, in the Choose sets
box, click Existing sets when you want to base the percentage values on theset that you replaced.
Related tasks:“Create an Intersection (Tuple)” on page 306When working with dimensional data, an intersection, also known as a tuple, isuseful for obtaining a value from the combination of two or more members thatyou specify. Each member must be from a different hierarchy. The intersection caninclude only one measure.
Specify the Default MeasureYou can specify the default measure for crosstabs and certain chart types. Specifythe default measure to be used when the measures cannot be determined by whatis on the edges. For example, you create a crosstab with Order method as rowsand Product line as columns. You add Quantity and Revenue as nested rows,making Order method their parent. You then add Country or Region under Ordermethod. Since there is no measure specified for Country or Region, you specify thedefault measure so that data is returned for each country or region.
Note: In crosstabs, IBM Cognos Report Studio automatically sets the defaultmeasure when you insert a measure into the crosstab cells.
Chapter 5. Crosstabs 73

Procedure1. To specify the default measure for a crosstab, do the following:
v Click any part of the crosstab, and then click the select ancestor button inthe title bar of the Properties pane.
v Click Crosstab.
Tip: You can also click the container selector (three orange dots) of thecrosstab to select it.
v Set the Default Measure property to the default measure.2. To specify the default measure for a chart, drag the measure to the Default
measure box in the chart.
Swap Columns and RowsSwap columns and rows to look at information from a different perspective. Thismay help you discover high and low points in the data that you hadn't previouslynoted.
You can only swap columns and rows in a crosstab or chart. In a chart, you swapthe x- and y-axes.
Procedure
From the toolbar, click the swap rows and columns button .
Results
In the report, the rows become the columns and the columns become the rows.
Indent DataYou can indent crosstab node members to set them apart from surrounding data.
When you insert a hierarchy in rows, all members are automatically indentedaccording to their level. By default, the first member in a set is not indented. If youinsert a hierarchy in columns, the members are not automatically indented. Youcan change the indentation properties of members in the report.
Relative indentation means that the member will shift by one tab when themember's level increases relative to the previous member in the hierarchy.
Indenting based on the level in the hierarchy means that the member will shift thenumber of tabs equivalent to the level in the hierarchy.
You can also indent objects by applying padding.
Procedure1. Click the crosstab node member to indent.2. In the Properties pane, set the Level Indentation property to your indentation
type, length, and direction.
74 IBM Cognos Report Studio Version 10.2.1: User Guide

Change a List into a CrosstabChange a list into a crosstab to view your data from a different perspective.
Procedure1. Click the columns to appear as columns or nested columns in the crosstab.2. From the Structure menu, click Pivot List to Crosstab.
Results
The list becomes a crosstab with the columns you selected in step 2 appearing ascolumns and nested columns. The unselected columns, except for measures, appearas rows and nested rows. If you have one measure, it becomes the cells of thecrosstab. If you have more than one measure, they appear as columns.
Tip: To make all measures appear as rows, swap columns and rows.
Example - Add Aggregate Data to a CrosstabYou are a report author at The Sample Outdoors Company, which sells sportingequipment. You are requested to create a report showing sales by order method todetermine which methods are generating the most revenue and the highest salesvolume.
Procedure1. Open IBM Cognos Report Studio with the GO Data Warehouse (query)
package.2. In the Welcome dialog box, click Create a new report or template.3. In the New dialog box, click Crosstab and click OK.
4. From the Source tab :v Expand Sales and Marketing (query) and Sales (query).v Expand Product and double-click Product line to add it as rows.v Expand Order method and double-click Order method to add it as
columns.v Click Product type and drag it just to the right of Product line.
Product type is now nested in Product line.v Expand Sales fact and drag Quantity to the Measures drop zone to add it
as a measure.v Drag Revenue to the right of Quantity to add it as a second measure.
Tip: Drop Revenue into the crosstab when you see a vertical bar betweenthe Product type column and the Order method column.
5. Click any part of the crosstab, and then click the select ancestor button inthe title bar of the Properties pane.
6. Click Crosstab.
Tip: You can also click the container selector (three orange dots) of thecrosstab to select it.
7. In the Properties pane, double-click the Font property.8. In the Size box, click 8pt and click OK.
Chapter 5. Crosstabs 75

9. Click one of the measures.
10. Click the summarize button and click Maximum.
Results
When you run the report, you can see that for camping equipment, Cooking Geargenerated the highest sales volume for the Special order method and Tentsgenerated the most revenue. Tents ordered by the Web order method generated thelargest revenue.
Example - Create a Discontinuous CrosstabYou are a report author at The Sample Outdoors Company, which sells sportingequipment. You are requested to create a report showing sales for each productline by quarter and by order method. Since the report will have columns with datafrom different dimensions, you create a discontinuous crosstab report.Discontinuous crosstabs are also known as disconnected or disjoint crosstabs orcrosstabs with unrelated columns.
Procedure1. Open IBM Cognos Report Studio with the GO Data Warehouse (query)
package.2. In the Welcome dialog box, click Create a new report or template.3. In the New dialog box, click Crosstab and click OK.
4. From the Source tab :v Expand Sales and Marketing (query) and Sales (query).v Expand Product and drag Product line to the Rows area.v Expand Order method and drag Order method to the Columns area.v Expand Sales fact and drag Revenue to the Measures area.
Figure 3. Crosstab showing quantity and revenue by order method by product line andproduct type
76 IBM Cognos Report Studio Version 10.2.1: User Guide

5. On the Source tab, expand Retailer site and drag Region to the left of Ordermethod.
Tip: Drop Region into the crosstab when a flashing vertical bar appearsbetween the Product line column and the Order method column. Otherwise,Region may appear as a nested row instead of a column.
6. Click Region.7. In the Properties pane, double-click the Sorting property.8. From the Data Items pane, drag Region to the Sort List pane.
9. Click the sort order button to sort in ascending order and click OK.10. Run the report.
Results
Figure 4. Crosstab showing revenue by product line by region
Chapter 5. Crosstabs 77

78 IBM Cognos Report Studio Version 10.2.1: User Guide

Chapter 6. Charts
You can use IBM Cognos Report Studio to create many chart types, such ascolumn, bar, area, and line charts.
Current Default Charts and Legacy ChartsIBM Cognos Report Studio has a new default chart technology as of version 10.1.0.
You will find procedures in this chapter for using both the legacy charts and thecurrent default charts. To use the legacy chart type, set the Use legacy chartauthoring option (Tools > Options > Advanced tab).Related concepts:“Limitations When Converting Legacy Charts” on page 103When you convert a legacy chart to the current default chart, some chart types orchart properties might not be migrated properly. For example, clustered area chartsand 100% stacked line charts are not available in the current default charts. If yourexact chart configuration is not available, select the closest matching template.Related tasks:“Convert Legacy Charts to Current Default Charts” on page 103You can convert charts from the legacy charts to the current default charts. Whenyou convert a legacy chart, select the template that most closely matches yourlegacy chart in order to preserve as many settings as possible.
Creating ChartsBefore creating charts, review the available chart types to select the best chart foryour needs. Also review the chart objects that make up charts.
Tip: To view the available chart types, from the File menu, click New, and then
double-click the chart icon . You can also view the available chart types byadding a Chart object from the Toolbox tab in the Insertable Objects pane to anexisting report.
To create charts, drag data items from the Source tab to the measures, dataseries and categories drop zones.
To help you when creating charts, you can do the following:v Preview your chart style changes.
As you author your chart and edit the chart properties, IBM Cognos ReportStudio provides you with a preview of your chart, using simulated data. Thisallows you to view your style changes without running your report. You need torun your report to see the chart with your actual data. You can disable the chartpreview in the options.
v Resize your charts.v Move the chart drop zones into flyouts so that they appear only when you
pause your pointer over the chart.
© Copyright IBM Corp. 2005, 2013 79

After you create a basic chart, modify the various chart objects to customize yourchart.
Chart ObjectsThe following shows the most common chart objects as they appear in your reportoutput in IBM Cognos Viewer.
The following shows the same chart as it appears in the IBM Cognos ReportStudio user interface. The Y-axis is selected, and the axis titles are displayed.
80 IBM Cognos Report Studio Version 10.2.1: User Guide

Click chart objects to specify properties
The default charts have more properties that allow you to customize more aspectsof the chart than in earlier versions. You can click in different areas of the chart toget access to different properties.
For example, by clicking the axis, you can customize the color, style, weight, andtransparency of chart axis lines and specify where to display major and minorgridlines on the chart.
Chapter 6. Charts 81

Data SeriesA data series is a group of related data points that are plotted in a chart. Eachseries has a unique color or pattern and is described in the legend. You can plotone or more data series in a chart; pie charts have only one data series.
In the example chart, the data series are order years 2010, 2011, 2012, and 2013.
CategoriesCategories are groups of related data from the data series that are plotted on theX-axis. Categories of multiple data series are shown together using clustered andstacked data markers.
In the example chart, the categories are the product lines of The Sample OutdoorsCompany in clustered columns.
AxesAxes are lines that provide references for measurement or comparison.
The primary axis (or Y-axis) refers to measures of quantitative data, such as salesfigures or quantities. Charts can have more than one primary axis.
82 IBM Cognos Report Studio Version 10.2.1: User Guide

The category axis (X-axis or ordinal axis) plots qualitative data, such as products orregions. It runs horizontally, except in bar charts.
The z-axis is the vertical axis in a 3-D chart.
Major gridlines extend from the tick marks on an axis and run behind the datamarkers.Related concepts:“Customizing the Axes of a Chart” on page 119Chart axes are lines that border the chart area and provide a reference formeasurements. They act as a vehicle for tick marks and scales and form a framearound the chart. The Y-axis is usually the vertical axis and contains data. TheX-axis is usually the horizontal axis and contains categories.
LegendA legend is a key to the patterns or colors assigned to the data series or categoriesin a chart.
Columns, Lines, and AreasCharts use graphical elements such as columns, horizontal bars, points, bubbles,lines, and areas as visual representations of data points.
Chart TypesIBM Cognos Report Studio provides many types of charts for presenting your datain a way that is meaningful for your users.
You can select from a variety of chart types (such as pie, bar, line, gauge, scatter,and so on) and you can select from a variety of chart configurations (such asstacked columns, 3-D pies). Combination charts allow you to use more than onechart type within your chart.
Some chart types are not supported for Microsoft Excel output or appeardifferently in Excel. For more information, see Appendix E, “Limitations WhenProducing Reports in Microsoft Excel Format,” on page 549.
Choosing a Chart Type and ConfigurationTo choose a chart type, consider what you want the chart to illustrate. Differentchart types and configurations emphasize different things.
Purpose Chart type or configuration
Show contributions of parts to a whole Bar Charts
Pie Charts
Stacked Charts, when you want to displaymeasures of the whole, as well as the parts
100 Percent Stacked Charts
Chapter 6. Charts 83

Purpose Chart type or configuration
Show trends in time or contrast valuesacross different categories
Line Charts
Area Charts
Bar Charts
Column Charts
Always place time in the horizontal axis.
Compare groups of related informationagainst actual values
Bar Charts
Radar Charts
Compare different kinds of quantitativeinformation
Combination Charts
Rank values in descending or ascendingorder
Bar Charts
Column Charts
Show correlation between two sets ofmeasures
Point Charts
Show key performance indicators in anexecutive dashboard report
Gauge Charts
Bullet Charts
Column ChartsColumn charts are useful for comparing discrete data or showing trends over time.
Column charts use vertical data markers to compare individual values.
Note: The Sales Growth Year Over Year sample report “Sales Growth Year OverYear” on page 521 in the GO Data Warehouse (analysis) package includes a columnchart. For more information about The Sample Outdoors Company samples, seeAppendix C, “Sample Reports and Packages,” on page 507.
The following example shows the revenue for each product line.
84 IBM Cognos Report Studio Version 10.2.1: User Guide

Column charts can plot data using standard, stacked, 100 percent stacked, andthree-dimensional configurations.
Line ChartsLine charts are useful for showing trends over time and comparing many dataseries.
Line charts plot data at regular points connected by lines.
Line charts can plot data using standard, stacked, 100 percent stacked, andthree-dimensional configurations. It is best not to use stacked line charts becausethey are difficult to distinguish from unstacked line charts with multiple dataseries.
The following example shows a revenue trend that peaked in 2012 in everyterritory.
Chapter 6. Charts 85

Note: The Top Retailers by Country or Region sample report “Top Retailers byCountry or Region” on page 514 in the Sales and Marketing (cube) packageincludes a line chart. For more information about The Sample Outdoors Companysamples, see Appendix C, “Sample Reports and Packages,” on page 507.
Pie ChartsPie charts are useful for highlighting proportions.
They use segments of a circle to show the relationship of parts to the whole. Tohighlight actual values, use another chart type, such as a stacked chart.
Pie charts plot a single data series. If you need to plot multiple data series, use a100 percent stacked chart.
Reports in PDF or HTML format show a maximum of 16 pies or gauges per chart.
Note: The Returns by Failed Orders in 2012 sample report “Returns by FailedOrders in 2012” on page 519 in the GO Data Warehouse (analysis) packageincludes a pie chart. For more information about The Sample Outdoors Companysamples, see Appendix C, “Sample Reports and Packages,” on page 507.
The following example shows that the largest proportion of revenue comes fromthe Americas, followed by the Asia Pacific region.
86 IBM Cognos Report Studio Version 10.2.1: User Guide

Pie charts can plot data using standard, 100 percent, and three-dimensionalconfigurations.Related tasks:“Set the Position of the First Slice in a Current Default Pie Chart” on page 148You can specify the angle in a pie chart where the first pie slice starts. You can alsochange the direction of the slices so they appear clockwise or counter-clockwise.“Create a Donut Chart from a Current Default Pie Chart” on page 149You can add a hole to the middle of your pie chart to create a donut chart. You canthen display something in the hole, such as a company logo, a calculation, or thelegend.“Pull Out Pie Slices in a Current Default Pie Chart” on page 149You can highlight pie slices by pulling them out from the rest of the pie. Forexample, the following chart shows revenue by product line with slices of less than1,000,000,000 in revenue pulled out by 25%.
Bar ChartsBar charts are useful for showing trends over time and plotting many data series.
Bar charts use horizontal data markers to compare individual values.
Note: The Manager Profile sample report “Manager Profile” on page 517 in theGO Data Warehouse (analysis) package includes a bar chart. For more informationabout The Sample Outdoors Company samples, see Appendix C, “Sample Reportsand Packages,” on page 507.
The following example shows revenue for every country or region.
Chapter 6. Charts 87

Bar charts can plot data using standard, stacked, and 100 percent stackedconfigurations.
Area ChartsArea charts are useful for emphasizing the magnitude of change over time. Stackedarea charts are also used to show the relationship of parts to the whole.
Area charts are like line charts, but the areas below the lines are filled with colorsor patterns.
Do not use standard area charts to show multiple data series because it is possiblefor areas with lower values to be covered by others. For multiple data series, use astacked area chart.
The following example is a stacked area chart showing the quantity of productssold over a four-year period in multiple territories.
Figure 5. Bar chart
88 IBM Cognos Report Studio Version 10.2.1: User Guide
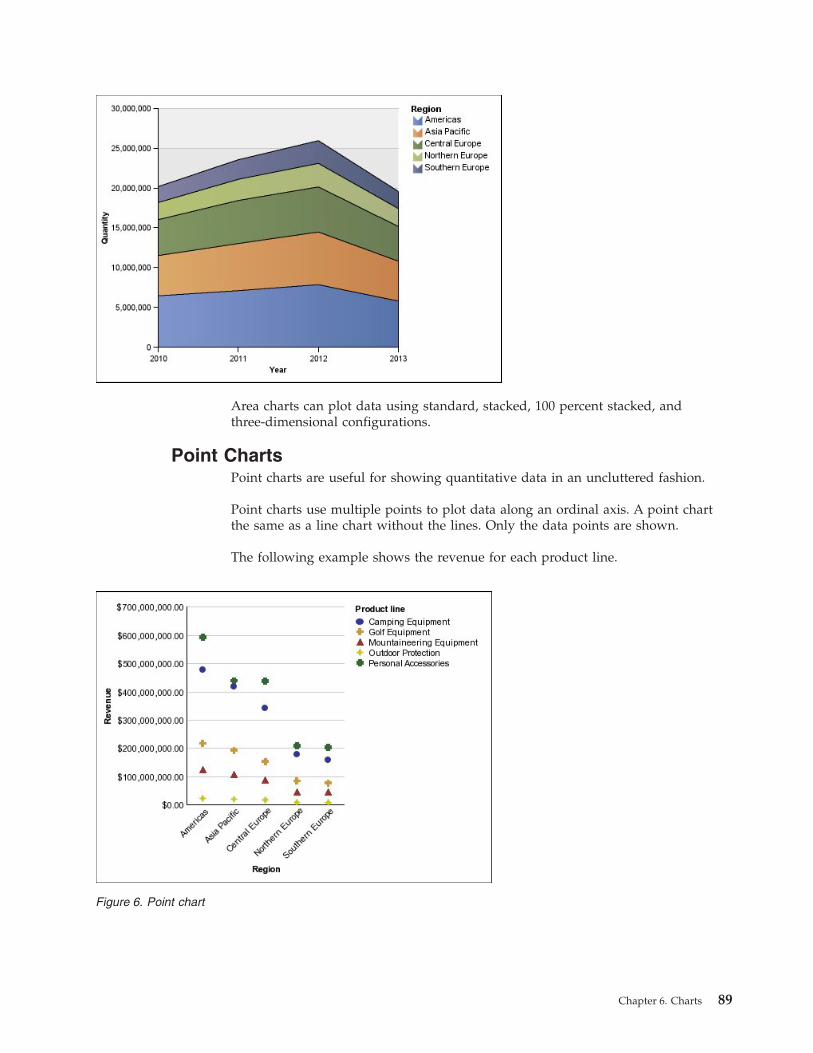
Area charts can plot data using standard, stacked, 100 percent stacked, andthree-dimensional configurations.
Point ChartsPoint charts are useful for showing quantitative data in an uncluttered fashion.
Point charts use multiple points to plot data along an ordinal axis. A point chartthe same as a line chart without the lines. Only the data points are shown.
The following example shows the revenue for each product line.
Figure 6. Point chart
Chapter 6. Charts 89

Combination ChartsCombination charts plot multiple data series by using combinations of columns,areas, and lines within one chart. They are useful for highlighting relationshipsbetween the various data series.
Note: The Quantity Sold vs. Shipped and Inventory sample report in the GO DataWarehouse (analysis) package includes a combination chart. For more informationabout The Sample Outdoors Company samples, see Appendix C, “Sample Reportsand Packages,” on page 507.
The following example shows a combination chart that includes planned revenueas a line chart and actual revenue as a column chart.
Combination charts can plot data using standard, stacked, 100 percent stacked, andthree-dimensional configurations.
Scatter ChartsScatter charts use data points to plot two measures anywhere along a scale, notonly at regular tick marks.
You can also specify a default measure. For example, you might need to specify adefault measure to give context to a calculated measure in the chart. For moreinformation about the default measure, see “Specify the Default Measure” on page73.
Scatter charts are useful for exploring correlations between different sets of data.
Note: The Employee Satisfaction 2012 sample report in the GO Data Warehouse(analysis) package includes a scatter chart. For more information about The SampleOutdoors Company samples, see Appendix C, “Sample Reports and Packages,” onpage 507.
90 IBM Cognos Report Studio Version 10.2.1: User Guide

The following example shows the correlation between production cost and grossprofit for each product line.
Related tasks:“Define Color by Value in Current Default Scatter and Bubble Charts” on page 146In a scatter or bubble chart you can specify that data points or bubbles appear indifferent colors based on an additional measure or fact. The color of the points orbubbles adds an additional aspect to the chart to assist you in finding relationshipsin large amounts of data.
Bubble ChartsBubble charts, like scatter charts, use data points and bubbles to plot measuresanywhere along a scale. The size of the bubble represents a third measure.
You can also specify a default measure. For example, you might need to specify adefault measure to give context to a calculated measure in the chart. For moreinformation about the default measure, see “Specify the Default Measure” on page73.
Bubble charts are useful for representing financial data. These charts are notsupported for Microsoft Excel output.
The following example plots quantity and revenue by product line. The size of thebubble represents the amount of gross profit.
Chapter 6. Charts 91

Related tasks:“Define Color by Value in Current Default Scatter and Bubble Charts” on page 146In a scatter or bubble chart you can specify that data points or bubbles appear indifferent colors based on an additional measure or fact. The color of the points orbubbles adds an additional aspect to the chart to assist you in finding relationshipsin large amounts of data.“Specify the Bubble Size in a Current Default Bubble Chart” on page 148In a bubble chart, you use a measure or fact to determine the size of the bubbles.
Quadrant ChartsQuadrant charts are bubble charts with a background that is divided into fourequal sections. Quadrant charts are useful for plotting data that contains threemeasures using an X-axis, a Y-axis, and a bubble size that represents the value ofthe third measure.
You can also specify a default measure. For example, you might need to specify adefault measure to give context to a calculated measure in the chart. For moreinformation about the default measure, see “Specify the Default Measure” on page73.
Legacy quadrant charts use baselines to create the quadrants. Current defaultcharts use colored regions.
Use a quadrant chart to present data that can be categorized into quadrants, suchas a SWOT (strengths, weaknesses, opportunities, and threats) analysis.
The following example shows the relationship between production cost and grossprofit. The size of the bubble represents the quantity of units sold.
Figure 7. Bubble chart
92 IBM Cognos Report Studio Version 10.2.1: User Guide

Bullet ChartsBullet charts are a variation of bar charts. They compare a featured measure (thebullet) to a targeted measure (the target). They also relate the compared measuresagainst colored regions in the background that provide additional qualitativemeasurements, such as good, satisfactory, and poor.
Bullet charts are often used instead of gauge charts in executive dashboards. Bulletcharts can be horizontal or vertical.
Note: This chart type applies only to the current default charts, and does notapply to the legacy charts.
A bullet chart contains the following components:v A bullet measure.
The bullet measure, Revenue, appears as the blue bar in the chart below.v A target measure.
The target measure, Planned revenue, appears as the black indicator in the chartbelow.
v From zero to five colored regions along the numeric scale to provide informationabout the featured measures' qualitative state.The chart below includes three colored regions: 0-50%, 50-75%, and 75-100%.
v A label that identifies the measures.v A numeric scale.
Chapter 6. Charts 93

Related tasks:“Customize a Current Default Bullet Chart” on page 152After you create a bullet chart, you can customize the shape, color, and size of thebullet and target indicators.
Gauge ChartsGauge charts, also known as dial charts or speedometer charts, use needles toshow information as a reading on a dial.
On a gauge chart, the value for each needle is read against the colored data rangeor chart axis. This chart type is often used in executive dashboard reports to showkey business indicators.
Gauge charts are useful for comparing values between a small number of variableseither by using multiple needles on the same gauge or by using multiple gauges.
Reports in PDF or HTML format are limited to show a maximum of 16 pies orgauges per chart. These charts are not supported for Microsoft Excel output.
A gauge chart consists of a gauge axis (which contains the data range, colorranges, and intervals markers), needles, and a center pivot point. The followingexample shows a basic gauge chart with default attributes. It is a degree dial chartwith two axes.
Figure 8. Bullet chart
94 IBM Cognos Report Studio Version 10.2.1: User Guide

Related tasks:“Customize a Current Default Gauge Chart” on page 144When you create a gauge chart, you can choose from a variety of chart templates,which offer different shape, axis, and border options.“Customize a Legacy Gauge Chart” on page 145You can customize the colors and threshold boundaries of the gauge axis areas andwhether they use numbers instead of percentages. You can also change the colorsof the gauge face and outline and hide gauge labels. By default, the legacy gaugechart uses a band divided into thirds that runs from green to red.
Pareto ChartsPareto charts help you to improve processes by identifying the primary causes ofan event. They rank categories from the most frequent to the least frequent. Thesecharts are frequently used for quality control data, so that you can identify andreduce the primary cause of problems.
Pareto charts include a cumulation line, which shows the percentage of theaccumulated total of all the columns or bars.
You can create before and after comparisons of Pareto charts to show the impact ofcorrective actions. These charts are not supported for Microsoft Excel output.
The following example shows that the most frequent reason for product returns isunsatisfactory product.
You can also create Pareto charts using horizontal bars.
Chapter 6. Charts 95

Related tasks:“Define the Cumulation Line in a Current Default Pareto Chart” on page 151The cumulation line on a Pareto chart displays the percentage of the accumulatedtotal of all the columns or bars. For example, if your chart displays revenue byproduct line by year, the cumulation line at the second year's column would be thetotal revenue of the first and second years.“Define the Cumulation Line in a Legacy Pareto Chart” on page 151The cumulation line on a Pareto chart displays the percentage of the accumulatedtotal of all the columns or bars. For example, if your chart displays revenue byproduct line by year, the cumulation line at the second year's column would be thetotal revenue of the first and second years.
Progressive Column ChartsProgressive column charts, also knows as waterfall charts, are like stacked chartswith each segment of a single stack displaced vertically from the next segment.
Progressive column charts are useful for emphasizing the contribution of theindividual segments to the whole.
These charts are not supported for Microsoft Excel output.
The following example analyzes the contribution of each product line to revenue.
Progressive column charts can plot data using standard and three-dimensionalconfigurations. You can also create progressive charts using horizontal bars.
MicrochartsMicrocharts are smaller versions of column charts, bar charts, and line charts thatyou can use in crosstabs and dashboards. Microcharts include column microchartsand bar microcharts, which are available in stacked and 100 percent stackedconfigurations, and win-loss charts and modified line charts that contain thefollowing:v A closing value marker.v Opening, closing, high, and low value markers.
96 IBM Cognos Report Studio Version 10.2.1: User Guide

v A reference line.
Note: If you specify custom labels for a microchart, the custom labels appear inthe tooltips, not on the chart itself. For more information about custom labels, see“Specify Custom Label Text” on page 119.
Win-loss charts are microcharts in which the value of each column is either 1 or -1,often denoting a win or loss.
Win-loss charts use two measures (the default and the win-loss measure) and noseries. The win-loss measure is the measure or calculation that you define. You canalso specify a default measure. For example, you might need to specify a defaultmeasure to give context to a calculated measure in the chart. For more informationabout the default measure, see “Specify the Default Measure” on page 73.
The following example shows the quarters that have a margin of less than 10,000in red.
Marimekko ChartsMarimekko charts are 100 percent stacked charts in which the width of a column isproportional to the total of the column's values. Individual segment height is apercentage of the respective column total value.
The following example shows the contribution of revenues for product lines indifferent regions.
Chapter 6. Charts 97

Radar ChartsRadar charts integrate multiple axes into a single radial figure. For each figure,data is plotted along a separate axis that starts at the center of the chart.
The following example shows the revenue from multiple retailer types in multipleterritories.
Radar charts can plot data using standard and stacked configurations.
Polar ChartsPolar charts are useful for showing scientific data.
They are circular charts that use values and angles to show information as polarcoordinates.
You can specify a default measure. For example, you might need to specify adefault measure to give context to a calculated measure in the chart. For moreinformation about the default measure, see “Specify the Default Measure” on page73.
Figure 9. Marimekko chart
98 IBM Cognos Report Studio Version 10.2.1: User Guide

The following example shows the revenue and quantity for each product line. Thedistance along the radial axis represents quantity, and the angle around the polaraxis represents revenue.
Range Indicator ChartsRange indicator, or metrics range, charts are useful for showing a target range anda tolerance range.
A range indicator chart adds a target and range marker to a column, line, or areachart.
The following example shows actual revenue versus planned revenue. The markersindicate the planned revenue, and the range and tolerance lines are defined by thechart author.
You can also insert IBM Cognos Metric Studio diagrams in your report to show therelationship between metrics. For more information, see “Add a Static MetricStudio Diagram to a Report” on page 159 and “Add a Data-driven Metric StudioDiagram to a Report” on page 159.
Chapter 6. Charts 99

Chart ConfigurationsChart configurations specify the grouping type of the columns, bars, lines, andareas in a chart. Some examples are standard, stacked, and 100 percent stackedcharts.
Standard ChartsStandard or absolute charts are useful for comparing specific values and forrepresenting discrete data, such as data for different regions or individualemployees. For example, a standard column chart that plots regional salesemphasizes the actual value that each region achieves in sales.
Standard charts plot the actual value of each data series from a common axis.
When you create charts using multiple data series, you can distinguish each seriesby the color or pattern of its data marker. Related data series are shown together inclusters for easy comparison.
In standard area and radar charts that have multiple data series, the colored areasthat represent lower values might be covered by the larger colored areas thatrepresent higher values. Use the stacked configuration for area and radar chartswith multiple data series.
The following example shows the revenue values for each product line within eachterritory.
Stacked ChartsStacked charts are useful for comparing proportional contributions within acategory. They plot the relative value that each data series contributes to the total.For example, a stacked column chart that plots product line sales will emphasizethe proportion that each product line contributes to the total in each territory.
You can distinguish each data series by the color or pattern of its section in thestack. The top of each stack represents the accumulated totals for each category.
100 IBM Cognos Report Studio Version 10.2.1: User Guide

Do not use the stacked configuration in line charts that have multiple data seriesbecause it is difficult to distinguish between unstacked and stacked configurations,and your chart consumers might misunderstand your data.
The following example shows that camping equipment contributed a largeproportion of the actual revenue in most sales territories.
100 Percent Stacked Charts100 percent stacked charts are useful for comparing proportional contributionsacross all categories. They plot the relative contribution of each data series to thetotal as a percentage. For example, a 100 percent stacked column chart that plotsproduct line sales emphasizes the percentage within each region without referringto actual values.
You can distinguish each data series by the color or pattern of its section in thestack. Each stack represents 100 percent.
100 percent stacked charts highlight proportions. When actual values areimportant, use another chart configuration.
The following example shows the percentage of sales for each product line in eachregion.
Chapter 6. Charts 101

Three-dimensional ChartsThree-dimensional charts provide a visually effective display that is suitable forpresentations.
Three-dimensional column, bar, line, and area charts plot data by using three axes.
Three-dimensional pie charts have a three-dimensional visual effect.
Do not use three-dimensional charts when you need to show exact values, such asfor control or monitoring purposes. The distortion in three-dimensional charts canmake them difficult to read accurately. For example, the following chart showsactual revenue for each product line in each territory, but some data labels areomitted because there is not enough room to display them all.
Convert Charts From One Type to AnotherYou can convert a chart from one type (for example, a bar chart) to another type(for example, a line chart).
102 IBM Cognos Report Studio Version 10.2.1: User Guide

When you convert an existing chart to a new chart type, IBM Cognos ReportStudio keeps the properties from the existing chart if those properties exist in thenew chart type. For example, if you convert a pie chart to a bar chart, ReportStudio maps your chart palette to the new chart, but does not map the explodingslices, because the exploding slices property does not exist in a bar chart.
Note: Report Studio converts legacy charts to the current default chart typesautomatically if you change the chart type unless you select the Use legacy chartauthoring option. You can convert legacy charts to current default charts, but youcannot convert current default charts back to legacy charts.
Procedure1. Right-click a chart and click Convert Chart.2. Select a new chart type, and click OK.
If some chart properties cannot be converted, the Chart Property Changesdialog box appears notifying you of the properties that cannot be converted.
Convert Legacy Charts to Current Default ChartsYou can convert charts from the legacy charts to the current default charts. Whenyou convert a legacy chart, select the template that most closely matches yourlegacy chart in order to preserve as many settings as possible.
Note: You can convert legacy charts to current default charts, but you cannotconvert current default charts back to legacy charts.
Procedure1. From the Tools menu, click Options.2. From the Advanced tab, clear the Use legacy chart authoring check box.3. Right-click the legacy chart and click Convert Chart.4. Select a new chart type, and click OK.
If some chart properties cannot be converted, the Chart Property Changesdialog box appears notifying you of the properties that cannot be converted.
Related concepts:“Current Default Charts and Legacy Charts” on page 79IBM Cognos Report Studio has a new default chart technology as of version 10.1.0.
Limitations When Converting Legacy ChartsWhen you convert a legacy chart to the current default chart, some chart types orchart properties might not be migrated properly. For example, clustered area chartsand 100% stacked line charts are not available in the current default charts. If yourexact chart configuration is not available, select the closest matching template.
The following legacy chart properties are not migrated to the current defaultcharts:v Conditional Palette
v Style Variable
v Display Frequency and First Label Index on the category axisv Visual Angle
v Rotate Values
Chapter 6. Charts 103

v Conditional Style, Style Variable, and Drill-Through Definitions on pie labelsand gauge labels
v Connecting Lines on combination chartsv line styles; only four line styles are supported in the current default charts
The following table outlines some behavior differences between legacy charts andthe current default charts.
Legacy Charts Current Default Charts
Combination charts are always ordered fromback to front - area, bar, and line.
Combination charts support any order.
In bar charts, multiple bar definitions for theY1-axis are placed side-by-side.
In bar charts, multiple bars are placed ontop of one another and you can control thewidth of the bars.
In combination charts, the color palette iscontinued over multiple bars, lines, andareas.
In combination charts, color palettes arerestarted for each bar, line, and area.
The legend order respects the order in whichbars, lines, and areas are specified. Forexample, bars can appear before areas in thelegend.
The legend order is the same as the orderspecified in the chart.
The following chart types continue to use the legacy chart technology andtherefore cannot be upgraded to the current default chart technology. If you wantto convert these chart types to the current default charts, upgrade them to adifferent chart type, such as a column or line chart.v Win lossv Radarv Polarv 3-D Bar, 3-D Line, 3-D Area, and 3-D Combinationv 3-D Scatterv Metrics rangev MarimekkoRelated concepts:“Current Default Charts and Legacy Charts” on page 79IBM Cognos Report Studio has a new default chart technology as of version 10.1.0.
Customizing Chart PropertiesAfter you create a chart, you can customize it by changing its properties.
You select the chart object in IBM Cognos Report Studio to view its properties.Some properties are dependent on the existence of other properties.
If you are familiar with using conditional variables, you can customize the chart tochange its appearance or provide information in response to expressions orconditions.
As you edit the chart properties, Report Studio provides you with a preview ofyour chart, using simulated data. This allows you to view your style changeswithout running the report. You can disable the chart preview in the options.
104 IBM Cognos Report Studio Version 10.2.1: User Guide

The following table shows some of the properties you can change in charts. Theseproperties are available when you select the chart object unless specified otherwisein the Action to perform in the Properties pane column.
Goal Action to perform in the Properties pane
Hide or show the title, subtitle, or footer Select the chart. Under Chart Titles, set theTitle, Subtitle, or Footer property.
Hide or show the legend Select the chart. Under Chart Annotations,set the Legend property.
For more information, see “Customize theLegend in a Current Default Chart” on page124.
Hide or show baselines Select the chart. Under Chart Annotations,set the Baselines property.
For more information, see “Add a Baselineto a Current Default Chart” on page 130.
Hide or show trendlines or regression lines Select the chart. Under Chart Annotations,set the Trendlines or Regression Lineproperty.
For more information, see “DisplayTrendlines in Current Default Charts” onpage 134 or “Display Regression Lines inLegacy Scatter or Bubble Charts” on page135.
Hide or show markers Select the chart. Under Chart Annotations,set the Markers property.
For more information, see “Add a Marker toa Current Default Chart” on page 132.
Hide or show notes Select the chart. Under Chart Annotations,set the Notes property.
For more information, see “Add a Note to aCurrent Default Chart” on page 127.
Hide or show the axes Select the chart. Under Axes, set the Y1Axis, Y2 Axis, or Category Axis property.
For more information, see “Customize theAxes of a Current Default Chart” on page120.
Hide or show the axis title or axis line Select the axis. Under General, set the AxisLine or Axis Title property.
For more information, see “Customize theAxes of a Current Default Chart” on page120.
Chapter 6. Charts 105

Goal Action to perform in the Properties pane
Change an axis title Select the axis title. Under General, set theDefault Title property to No, and thendouble-click the axis title and type a newtitle.
Tip: You can use the Properties pane tochange the axis title properties, such as font,positioning, color, and so on.
For more information, see “Customize theAxes of a Current Default Chart” on page120.
Change axis properties, such as range, scaleinterval, and so on
Select the numeric axis. Under General, setthe Minimum Value, Maximum Value,Scale Interval, or Scale property.
For more information, see “Change the AxisScale of a Current Default Chart” on page120.
Hide or show the tooltips Select the chart. Under Chart Labels, set theTooltips property.
When you pause your pointer over a datamarker in the report output, thecorresponding absolute or cumulative valueappears in a tooltip.
Tooltips are not supported in PDF output.
Change the data format Select the numeric axis. Under Data, set theData Format property.
Change the white space around the chart Select the chart. Under Box, set the Paddingor Margin property.
For more information, see “Apply Paddingto an Object” on page 341 and “Set Marginsfor an Object” on page 342.
Change the color or pattern in the palette forcolumns, lines, and areas
Select the chart object. Under Color &Background, set the Palette or ConditionalPalette property.
For more information, see “Customizing theColor Palette of a Chart” on page 108 and“Create a Simple Conditional Palette for aCurrent Default Chart” on page 111.
Change the chart orientation Select the chart. In the Properties pane,under Chart Orientation, select Vertical orHorizontal.
106 IBM Cognos Report Studio Version 10.2.1: User Guide

Goal Action to perform in the Properties pane
Change the default color or font for all chartobjects
Select the chart. Under Color &Background, set the Background Color,Foreground Color, or Fill Effects property.
For more information, see “Change a ChartBackground in a Legacy Chart” on page 115.
Under Font & Text, set the Font or RelativeAlignment property.Tip: The 2011 Quarterly Sales Forecastsample report in the GO Sales (analysis)package includes text alignment. For moreinformation about The Sample OutdoorsCompany samples, see Appendix C, “SampleReports and Packages,” on page 507.
Override the default font or color for axesand chart values Click the unlock button in the toolbar
to unlock the chart object, select the chartbody by clicking between the axes, and setthe Font, Background Color, ForegroundColor, or Fill Effects property.
Change the three-dimensional appearance ofa chart
Select the chart. Under General, set theDepth or Visual Angle property.
For example, for a pie chart, a Depth valueof 0 (zero) leaves the pie flat, ortwo-dimensional. A value of 100 raises thepie almost to a round ball shape.Tip: You can select a value from the Depthlist or type a value that is not listed.
Insert a background image or watermark inthe chart body.
Click the lock button in the toolbar tounlock the chart object, select the chart bodyby clicking between the axes.
Under Color & Background, set theBackground Image property.
For more information, see “Change a ChartBackground in a Legacy Chart” on page 115.
Go to another report Select the chart. Under Data, set theDrill-Through Definitions property.
For more information, see Chapter 18,“Using Drill-through Access,” on page 415.
Specify which labels and values to use whengenerating the text shown on the chart
Select the chart. Under Chart Labels, set theValues property.Note: When you show all the labels andvalues on some chart types, such as scattercharts, bubble charts, and polar charts, thetext shown might be too long.
Resize a Current Default ChartYou can change the size of a current default chart by dragging the resize handle inthe lower right corner of the chart.
Chapter 6. Charts 107

Procedure1. Select the chart object.
2. Click the resize handle in the lower right corner of the chart .Use Shift+drag to maintain the aspect ratio of the chart.
3. To see the actual size of the chart as it will appear in the report output, collapsethe chart objects with the minus (-) button in the upper left corner of the chart.
Results
The new chart size appears in the Size & Overflow property. You can also edit thechart size with this property.Related concepts:“Current Default Charts and Legacy Charts” on page 79IBM Cognos Report Studio has a new default chart technology as of version 10.1.0.
Resize a Legacy ChartYou can resize a legacy chart by defining the height and width in the Size &Overflow property.
The options available with this property are detailed in “Specify the Height andWidth of an Object” on page 348.
Procedure1. Select the chart object.2. In the Properties pane, double-click the Size & Overflow property and specify
the height and width.Related concepts:“Current Default Charts and Legacy Charts” on page 79IBM Cognos Report Studio has a new default chart technology as of version 10.1.0.
Customizing the Color Palette of a ChartYou can use the chart palette to control the colors or patterns used in the columns,lines, data markers or areas in a chart. For example, if "Telephone" is the first in adata series of order methods, and you want it to appear in blue, use the palette tomake the first item in the series blue.
You can customize the color palette for area, bar, bubble, gauge, Pareto, pie, andscatter charts.
You can also apply background effects to chart objects or change the colors ofspecific chart elements.Related tasks:“Add Background Effects to a Chart Object in a Legacy Chart” on page 116You can change the look of certain charts and chart objects by applying visualeffects such as drop shadows, borders, fills, texture effects, and bevel effects.
Customize the Color Palette of a Current Default ChartYou can use the chart palette to control the colors or patterns used in the columns,lines, data markers or areas in a chart.
Progressive charts and legacy charts have different steps.
108 IBM Cognos Report Studio Version 10.2.1: User Guide

If specified, the default color is used for outputs that do not support the palettedefinition. For example, if the palette is defined to use a radial rectangle gradientand you run the report as PDF output, the default color is used because radialrectangle gradients are not supported in PDF output.
Procedure1. Select the chart object. For combination charts, select the bar, line, or area
objects.
2. To choose a preset color palette, click the chart palette presets button onthe style toolbar, and then click a palette.
3. To change the existing color palette:v In the Properties pane, under Color & Background, double-click the Palette
property.v On the Entries tab, click the palette entry that you want to change.v Under Fill, select fill type, color, transparency, and other fill settings. The
options in the Fill type list depend on the chart type you are using.Linear Gradient displays a gradient that changes color horizontally. You canspecify the position of each color in the gradient and add or remove colorsfrom the gradient.Radial Line Gradient displays a gradient that changes color outwards froma central point, or focus. You can specify the position of each color in thegradient and the size and position of the focus. You can also add or removecolors from the gradient.Radial Rectangle Gradient displays a gradient that changes color outwardsfrom a rectangle. You can specify the position of each color in the gradientand the size of the rectangle. You can also add or remove colors from thegradient.Pattern displays a colored pattern that you choose from a preset list. You canspecify the foreground and background colors.Color displays a solid color. You can specify the transparency.Image displays an image. You can specify the image to use.
v To change the color of this palette definition, click the color in the Colors list,click Color, specify the color properties, and click OK.
4. Under Style, depending on the chart type you are customizing and the fill typeyou chose in step 2, you can change the marker shape, line style, default color,and line weight.
5. To add a new palette entry, click the new button and specify the newpalette settings.
6. To change the order in which the colors, gradients, or patterns appear in thechart, use the arrow buttons under the Palette box to change their position.
7. To copy and paste a palette, open the palette dialog box and press Ctrl+C tocopy the palette to the clipboard. Close the palette dialog box. Select anotherchart, open the palette dialog box, and press Ctrl+V to paste the palette fromthe clipboard.
8. To customize the data markers, on the Properties tab, depending on the charttype you are customizing and the fill type you chose in step 2, you can specifywhether data markers are shown and change their color and size.
Chapter 6. Charts 109

Related concepts:“Current Default Charts and Legacy Charts” on page 79IBM Cognos Report Studio has a new default chart technology as of version 10.1.0.
Customize the Color Palette of a Current Default ProgressiveChartYou can use the chart palette to control the colors or patterns used in the columns,lines, data markers or areas in a chart.
Legacy charts and other types of current default charts have different steps.
If specified, the default color is used for outputs that do not support the palettedefinition. For example, if the palette is defined to use a radial rectangle gradientand you run the report as PDF output, the default color is used because radialrectangle gradients are not supported in PDF output.
Procedure1. Select the progressive chart object.2. In the Properties pane, double-click the Progressive Palette property.
You can specify the following:v Positive value fill defines the appearance of the positive bars or columns on
the chart.v Negative value fill defines the appearance of the negative bars or columns
on the chart.v First value fill defines the appearance of the first bar or column on the
chart.v Total value fill defines the appearance of the total bar or column on the
chart, if a total bar or column is present.3. To change the appearance of a fill:
v Click the colored box beside the fill name.v Click a fill type from the Fill type list.
Linear Gradient displays a gradient that changes color horizontally. You canspecify the position of each color in the gradient and add or remove colorsfrom the gradient.Radial Line Gradient displays a gradient that changes color outwards froma central point, or focus. You can specify the position of each color in thegradient and the size and position of the focus. You can also add or removecolors from the gradient.Radial Rectangle Gradient displays a gradient that changes color outwardsfrom a rectangle. You can specify the position of each color in the gradientand the size of the rectangle. You can also add or remove colors from thegradient.Pattern displays a colored pattern that you choose from a preset list. You canspecify the foreground and background colors.Color displays a solid color. You can specify the transparency.Image displays an image. You can specify the image to use.
v To change the color of this fill, click the color in the Colors list, click Color,specify the color properties, and click OK.
4. To change the text of the label that appears next to a bar, double-click the textbox beside the fill name and specify the text.
110 IBM Cognos Report Studio Version 10.2.1: User Guide

Related concepts:“Current Default Charts and Legacy Charts” on page 79IBM Cognos Report Studio has a new default chart technology as of version 10.1.0.
Customize the Color Palette of a Legacy ChartYou can use the chart palette to control the colors or patterns used in the columns,lines, data markers or areas in a chart.
Current default charts have different steps.
Procedure1. Select the chart object.2. In the Color & Background section of the Properties pane, double-click the
Palette property.3. In the Palette dialog box, click the new palette entry button to define a new
palette entry:v To apply color, click Color, specify the color properties, and click OK.v To apply a gradient, click Gradient, specify the Direction, From color, and
To color properties, and click OK.v To apply a pattern, click Pattern, specify the Pattern, Foreground color, and
Background color properties, and click OK.Tip: You can also select a predefined palette from the Palettes box.
4. To change the order in which the colors, gradients, or patterns appear in thechart, use the arrow buttons under the Palette box to change their position.
5. To copy and paste a palette, open the palette dialog box and press Ctrl+C tocopy the palette to the clipboard. Close the palette dialog box. Select anotherchart, open the palette dialog box, and press Ctrl+V to paste the palette fromthe clipboard.
6. Repeat step 3 for each chart series.Related concepts:“Current Default Charts and Legacy Charts” on page 79IBM Cognos Report Studio has a new default chart technology as of version 10.1.0.
Creating a Conditional Color Palette in a ChartYou can create a conditional palette to color data items in your chart in differentways depending on a condition. For example, in a column chart that showsrevenue per month, you want to make the columns for the months that have arevenue greater than $1000000 green.
You can also use conditional styles to highlight exceptional data and use conditionsto control the layout of your report.Related concepts:Chapter 14, “Using Conditions,” on page 365You can define conditions to control what users see when they run a report.Conditions can apply to specific items in a report. For example, you can define aconditional style to highlight exceptional data, such as product revenue thatexceeds your target.
Create a Simple Conditional Palette for a Current Default ChartYou can create a simple conditional palette based on a string data item or anumeric data item. For example, if you want to create a condition to display only
Chapter 6. Charts 111

Revenues over one million dollars, you can create a numeric condition; whereas, ifyou want to create a condition to display only product codes with the letter A inthem, you can create a string condition.
Procedure1. Select the chart series to which you want to apply the conditional palette.2. In the Properties pane, under Color & Background, double-click the
Conditional Palette property.
3. Click the new button and click New Condition.4. If you want to create a conditional palette based on a string, do the following:
a. Select the string data item to determine the condition.b. In the Type of conditional style list, click String, and click OK.c. Click the new button and select how to define the condition:
v To select more than one individual value, click Select Multiple Valuesand click the values.
v To type specific values, click Enter Values and type the values.v To specify your own criteria, such as values that begin with the letter A,
click Enter String Criteria and specify the condition.
d. Under Palette Entry, beside the new condition, click the edit button .e. Define the palette entry fill type, colors, and angle, and click OK.
5. If you want to create a conditional palette based on a numeric range, date/timerange, interval range, date range, or time range, do the following:a. Select a numeric data item to determine the condition.b. In the Type of conditional style list, click the type of condition you want to
create, and click OK.
c. Click the new button and type a value to define a threshold.The value appears in the Range column, and two ranges are created.
d. For each range, under Style, click the edit button to define the paletteentry fill type, colors, and angle, and then click OK.
e. Repeat the steps above to add other conditions.
Tip: Under Style, pause the pointer over each range to see the conditionproduced for that range.
f. If you want to use the default palette for the lowest range instead ofspecifying a conditional palette select the Use default palette for lowestrange check box.
g. To move a value above or below a threshold, click the arrow button nextto the value.For example, you insert a threshold value of five million. By default, theranges are less than or equal to five million and greater than five million.Moving the five million value above the threshold changes the ranges toless than five million and greater than or equal to five million.
6. To customize the label for a conditional palette, do the following:a. Click Label beside the palette entry.
112 IBM Cognos Report Studio Version 10.2.1: User Guide

b. In the Conditional Palette Entry Label dialog box, click Specified text andclick the ellipsis (...) button.
c. Type the default label text in the Label text box.
d. To add customized labels for other languages, click the add button ,select the other languages, and click the language to define the customizedlabel for that language.
7. Specify the order in which to evaluate the conditions by clicking a conditionand then clicking the move up or move down arrow.Conditions are evaluated from top to bottom, and the first condition that is metis applied.
Related concepts:“Current Default Charts and Legacy Charts” on page 79IBM Cognos Report Studio has a new default chart technology as of version 10.1.0.
Create an Advanced Conditional Palette for Current DefaultChartsAdvanced conditions allow you to use a calculations or expression to evaluate thecondition. If multiple advanced conditions are met, only the first conditional styleis applied.
Procedure1. Select the chart series to which you want to apply the conditional palette.2. In the Properties pane, under Color & Background, double-click the
Conditional Palette property.
3. Click the add button and click Advanced Condition.
4. Click the new advanced condition button and specify the expression thatdefines the condition.The new advanced condition appears in the Conditional Palette - Advanceddialog box.
5. Under Palette Entry, beside the new advanced condition, click the edit button
.6. Define the palette entry fill type, colors, and angle, and click OK.7. Specify the order in which to evaluate the conditions by clicking a condition
and then clicking the move up or move down arrow.Conditions are evaluated from top to bottom, and the first condition that is metis applied.
Related concepts:“Current Default Charts and Legacy Charts” on page 79IBM Cognos Report Studio has a new default chart technology as of version 10.1.0.
Create a Conditional Color Palette for a Legacy ChartYou can create a color palette that appears differently depending on a yes or noanswer, an expression or calculation, or the report language.
Procedure1. Click the chart object.2. In the Properties pane, under Color & Background, double-click the
Conditional Palette property.
Chapter 6. Charts 113

3. If you want to create a variable that has only two possible values, Yes and No,do the following:a. Under Variable, click New boolean variable.b. In the New Variable dialog box, type a name for the variable.c. In the Expression Definition box, define the condition and click OK.
For example, the following expression returns the value Yes if revenue isless than one million and the value No if revenue is greater than or equal toone million:[Revenue]<1000000For information about creating expressions, see “Using RelationalCalculations” on page 248 or “Using Dimensional Calculations” on page 302and Appendix F, “Using the expression editor,” on page 555.
d. In the Value box, select whether the expression evaluates to Yes or No.e. Under Effects, specify the color palette to use for the condition.
4. If you want to create a variable whose values are string-based, do thefollowing:a. Under Variable, select New string variable.b. In the Expression Definition box, define the condition and click OK.
For example, the following expression returns the value high if revenue isgreater than one million and the value low if revenue is less than or equalto one million:if ([Revenue]>1000000) then ('high') else ('low')For information about creating expressions, see “Using RelationalCalculations” on page 248 or “Using Dimensional Calculations” on page 302and Appendix F, “Using the expression editor,” on page 555.
c. Click the add button in the Values pane.d. For each value that the variable can assume, type the name of the value that
corresponds with the possible outcomes defined in the expression.For example, in the previous expression, you must create two values for thevariable, high and low.
Tip: You can create a group by clicking two or more values and then
clicking the group values button . For example, you can create a groupthat includes the available French languages.
5. If you want to create a variable whose values are different languages, do thefollowing:a. Under Variable, select Report Language Variable.b. In the Languages dialog box, select the languages to support.
6. Click OK to close the expression editor and leave the Conditional Palettedialog box open.
7. Under Effect, click Pattern.8. Under Pattern, select a pattern and click OK.9. In the Box section of the Properties pane, set the Borders property to Show.
114 IBM Cognos Report Studio Version 10.2.1: User Guide

Related concepts:“Current Default Charts and Legacy Charts” on page 79IBM Cognos Report Studio has a new default chart technology as of version 10.1.0.
Change a Chart Background in a Current Default ChartYou can use a gradient, pattern, color, or image to customize the chart background.
Procedure1. Click the chart object.
2. Click the unlock button , select the chart body by clicking between theaxes, and, in the Properties pane, under Color & Background, double-click thePlot Area Fill property.
3. Click a fill type from the Fill type list.v Linear Gradient displays a gradient that changes color horizontally. You can
specify the position of each color in the gradient and add or remove colorsfrom the gradient.
v Radial Line Gradient displays a gradient that changes color outwards froma central point, or focus. You can specify the position of each color in thegradient and the size and position of the focus. You can also add or removecolors from the gradient.
v Radial Rectangle Gradient displays a gradient that changes color outwardsfrom a rectangle. You can specify the position of each color in the gradientand the size of the rectangle. You can also add or remove colors from thegradient.
v Pattern displays a colored pattern that you choose from a preset list. You canspecify the foreground and background colors.
v Color displays a solid color. You can specify the transparency.v Image displays an image. You can specify the image to use.
Related concepts:“Current Default Charts and Legacy Charts” on page 79IBM Cognos Report Studio has a new default chart technology as of version 10.1.0.
Change a Chart Background in a Legacy ChartYou can use a solid color, a pattern, or a gradient fill effect to customize the chartbackground.
You can also use an image as a background for a chart.
Procedure1. Click the chart object.
2. Click the unlock button , select the chart body by clicking between theaxes, and, in the Properties pane, under Color & Background, double-click theFill Effects property.
3. In the Effect box, choose a color, a gradient fill effect, or a pattern:v To apply a color, click Color and specify the color properties.v To apply a gradient fill effect, click Gradient and then specify the Direction,
From color, and To color properties.v To apply a pattern effect, click Pattern and specify the Pattern, Foreground
Color, and Background Color properties.
Chapter 6. Charts 115

The foreground color is the color of the selected pattern. The backgroundcolor is the color of the area behind the pattern.
4. To remove a background fill effect, click None.Related concepts:“Current Default Charts and Legacy Charts” on page 79IBM Cognos Report Studio has a new default chart technology as of version 10.1.0.Related tasks:“Insert a Background Image in an Object” on page 334You can insert a background image for objects in a report. For example, use abackground image to add a watermark to a page.
Add Background Effects to a Chart Object in a Legacy ChartYou can change the look of certain charts and chart objects by applying visualeffects such as drop shadows, borders, fills, texture effects, and bevel effects.
Procedure1. Select the chart object.2. To apply a preset background fill effect, from the toolbar, click the background
effects presets button.3. To add a custom fill effect and border do the following:
a. In the Properties pane, under Color & Background, double-click theBackground Effects property.
b. Click Border and specify settings for border style, width, color, cornerradius for rounded rectangles, and transparency.If the object also includes a fill with a transparency setting, select the Allowtransparent bleed check box to apply the same transparency to the border.
c. Click Fill and specify the settings.The fill effect can either be a solid color, a gradient, or a pattern.
4. To add a texture effect, in the Properties pane, under Color & Background,select an option under Material Effects.
5. To add a drop shadow, do the following:a. In the Properties pane, under Color & Background, double-click the Drop
Shadow property.b. Select the Drop shadow check box.c. From the Shadow color list, click a color.d. Under Blur, click an intensity to set the drop shadow's blur.e. Under Offset, enter a value and a unit to define the width and height of the
drop shadow.f. Under Transparency, type a percentage to determine the transparency of the
shadow.6. To add a bevel, in the Properties pane, under Color & Background,
double-click the Bevel property and click a bevel effect.
116 IBM Cognos Report Studio Version 10.2.1: User Guide

Related concepts:“Current Default Charts and Legacy Charts” on page 79IBM Cognos Report Studio has a new default chart technology as of version 10.1.0.“Customizing the Color Palette of a Chart” on page 108You can use the chart palette to control the colors or patterns used in the columns,lines, data markers or areas in a chart. For example, if "Telephone" is the first in adata series of order methods, and you want it to appear in blue, use the palette tomake the first item in the series blue.Related tasks:“Add Color to an Object” on page 353You can add background and foreground color to objects in the report. Theforeground color applies to the text within objects.
Add Colored Regions in a Current Default ChartYou can define colored regions in the body of a chart. For example, you can dividethe background of a scatter chart into quadrants and color each quadrant.
You can add colored regions to bubble, bullet, combination, Pareto, progressivecolumn, and scatter charts.
In bullet charts, colored regions are automatically added.
You can use the following criteria to position the colored regions.
Option Position
Percent on Axis (%) Uses a percentage of the full range of theaxis.
For example, if the axis range is -500 to 1100,a Percent on Axis value of 25% puts thebaseline at -100 (25% of the range, 1600).
Numeric Value Uses a static numeric value.
Mean Uses the statistical mean plus or minus anumber of standard deviations based on allcharted data values on the specified axis.
Percentile (%) Uses a specified percentile.
Statistical Maximum Uses the following expression:
25th percentile value - 1.5 * (75th percentilevalue - 25th percentile value)
For example, if 2.5 is the 25th percentile and7.5 is the 75th percentile, the statisticalminimum is -5 [2.5 -1.5(5) = -5].
Statistical Minimum Uses the following expression:
75th percentile value + 1.5 * (75th percentilevalue - 25th percentile value)
For example, if 2.5 is the 25th percentile and7.5 is the 75th percentile, the statisticalmaximum is 15 [7.5 +1.5(5) = 15].
Chapter 6. Charts 117

Option Position
Query Calculation Uses a query calculation from the samequery or from a different query. For moreinformation, see “Using RelationalCalculations” on page 248.
Layout Calculation Uses a layout calculation. For moreinformation, see “Using RelationalCalculations” on page 248.
Category Index Specifies a position based on the index valueof the data item in the categories axis. Thevalue must be between 0 and 100.
For example, a Category index value of 1indicates that the position is located at thefirst data item. This is the default.
You can also combine colored regions with gridlines.
Procedure1. Click the chart object.2. In the Properties pane, under Color & Background, double-click the Colored
Regions property.
3. Click the new button .4. Under Region label, type a name for the region.5. Under Label location, specify whether the label should appear in the legend
or in the chart.6. If your chart includes multiple charts, such as in a combination chart, under
Based on, select the chart to which the colored regions apply.7. Under Region fill, click the color box to specify the color and fill effects.8. Specify the start and end of the category and numeric positions.9. If you want to add more colored regions, repeat steps 3 to 5.
10. If you add more than one colored region, specify their order using the up anddown arrows.The regions are drawn in the same order that they appear in this list. The firstregion is drawn first, on the bottom, and the last region is drawn on top ofthe other regions.Tip: To delete a colored region, click the colored region icon and text and click
the delete button .
Results
The new region appears in the Colored regions box.
118 IBM Cognos Report Studio Version 10.2.1: User Guide

Related concepts:“Current Default Charts and Legacy Charts” on page 79IBM Cognos Report Studio has a new default chart technology as of version 10.1.0.
Specify Custom Label TextBy default, chart labels use the name of the underlying data item label. You canchange the label text to make it more meaningful. For example, you can rename achart item labeled ISO_3_Letter_Code to Country or Region.
If you specify custom labels for a microchart or win-loss charts, the custom labelsappear in the tooltips, not on the chart itself.
Procedure1. Click the chart node member or measure.2. In the Properties pane, under the Chart Labels, set the Custom Label property
to Show.A new chart text item appears above the default measure or below the chartnode member.
3. Do one of the following:v To change the text of the label, double-click the chart text item and type the
text.v To change the source of the label text, select the new chart text item. In the
Text Source section of the Properties pane, set the Source Type property.If nothing is specified in the new chart text item, the label appears blank.
Tip: To remove a custom label, set the Custom Label property to Hide.
Customizing the Axes of a ChartChart axes are lines that border the chart area and provide a reference formeasurements. They act as a vehicle for tick marks and scales and form a framearound the chart. The Y-axis is usually the vertical axis and contains data. TheX-axis is usually the horizontal axis and contains categories.
To make your chart data easier to understand, you can do the following tocustomize each axis:v show or hide the axis labels (data values)v show or hide the axis linev change the color, style, and weight of the axis linev show or hide major and minor tick marks and specify where to display them
In HTML/PDF, if you have a report with a line chart, you can use the IncludeZero For Auto Scale property to adjust the scale of the Y-axis of the chart. If thedifference between your measure's maximum/minimum values is much less thanthe difference between your measure's minimum value and zero, using thisproperty will make the chart Y-axis begin at something closer to your measure'sminimum value, making the line utilize all of the chart's vertical space. In somecases this is significant in improving the readability of the chart.
Chapter 6. Charts 119

Related concepts:“Axes” on page 82Axes are lines that provide references for measurement or comparison.
Customize the Axes of a Current Default ChartYou can customize the axis labels, axis lines, and minor and major tick marks.
You can change the scale for the major and minor tick mark using the Axis Rangeproperty.
Procedure1. Select the Y-axis or the X-axis of the chart.2. To show or hide the axis labels, in the Properties pane, set the Axis Label
property.3. If your chart includes nested categories, to change how the category axis labels
are displayed, set the Nested Label Display property.4. To show or hide axis lines, in the Properties pane, double-click the Axis Line
property, and select or clear the Axis line check box.5. To change the color, style, and weight of the axis line, in the Properties pane,
set the Axis Line property.6. To show or hide minor and major tick marks and specify their location, in the
Properties pane, set the Axis Line property.Related concepts:“Current Default Charts and Legacy Charts” on page 79IBM Cognos Report Studio has a new default chart technology as of version 10.1.0.Related tasks:“Change the Axis Scale of a Current Default Chart”By default, IBM Cognos Report Studio automatically determines the minimum andmaximum scale values for the axes in a chart. For example, a Y-axis showingrevenue values might have an axis range of zero dollars to one million dollars. Youcan customize the axis scale, or range, to make your chart easier to understand.
Customize the Axes of a Legacy ChartYou can customize the axis labels and axis line.
Procedure1. Select the Y-axis or the X-axis of the chart.2. To show or hide the axis labels, in the Properties pane, set the Axis Label
property.3. Select the Axis line check box.4. Click Line color and choose a color for this axis line.5. To show or hide axis lines, in the Properties pane, double-click the Axis Line
property, and select or clear the Axis line check box.6. To change the color, style, and weight of the axis line, in the Properties pane,
double-click the Axis Line property.
Change the Axis Scale of a Current Default ChartBy default, IBM Cognos Report Studio automatically determines the minimum andmaximum scale values for the axes in a chart. For example, a Y-axis showingrevenue values might have an axis range of zero dollars to one million dollars. Youcan customize the axis scale, or range, to make your chart easier to understand.
120 IBM Cognos Report Studio Version 10.2.1: User Guide

You can specify the following for each axis:v the maximum and minimum values of the rangev whether to include zero in an automatic axis rangev whether to use a logarithmic scale, if the values in the chart cover a very large
rangev how often major and minor gridlines appear
Logarithmic scales can be useful when some of the data you are displaying ismuch less or much more than the rest of the data or when the percentage or ratiodifferences between values are important.
A logarithmic scale in Report Studio shows the base value of 10 raised to thepower of a value. For example, 10 has a logarithm of 1 because 10 raised to thepower of 1 is 10, 100 has a logarithm of 2 because 10 raised to the power of 2 is100, and so on.
For example, the chart below is using a normal scale:
In this chart, the Y-axis shows values up to 2,000,000,000 with evenly spacedintervals of 400,000,000. However, the Outdoor Protection column is so much lessthan the other columns that it is difficult to compare them.
The following is the same chart using a logarithmic scale:
Figure 10. Chart with a normal axis range
Chapter 6. Charts 121

In this chart, the Y-axis still shows the same revenue values, but the intervalsreflect a logarithmic scale, which increases exponentially. You can now compare allthe product lines because none of the product lines have much higher or muchlower values than the others.
Logarithmic scales can also be useful when the percentage or ratio differencesbetween values are important. For example, if the logarithmic scale chart aboverepresents data from 2011, and you add data from 2012 as a second set of coloredbars, you could see the differences between the 2011 revenue and 2012 revenue. Ina logarithmic scale, differences between values on the Y-axis represent the samepercentage for each bar. So if the 2011 and 2012 data differs by the same distancefor each product line, you could deduce that your revenue went up by the samepercentage for each product line. This would not be clear on a normal scale.
Procedure1. Select the Y-axis or the X-axis of the chart.2. In the Properties pane, under General, double-click the Axis Range property.3. To set a maximum value for this axis, under Maximum, click Manual, and then
type a maximum value in the Manual box.
Note: You can use either a positive or negative value as the maximum value.4. To set a minimum value for this axis, under Minimum, click Manual, and then
type a minimum value in the Manual box.
Note: You can use either a positive or negative value as the minimum value.5. To include zero on this axis, select the Include zero check box.6. To use a logarithmic scale for this axis, select the Logarithmic scale check box.
Note: If you choose to use a logarithmic scale, ensure that your chartconsumers know that the scale is logarithmic by including that information inthe axis title or in a note on the chart.
7. To set the position of major gridlines and tick marks, under Major interval,click Manual, and then type the distance between major gridlines and tickmarks in the Manual box.
Figure 11. Chart with a logarithmic axis range
122 IBM Cognos Report Studio Version 10.2.1: User Guide

The distance between major gridlines and tick marks is measured in the unitsof that axis. For example, if the axis is revenue in dollars, type the dollar valuein the Manual box.
8. To add minor gridlines, type the number of minor gridlines that you want tosee between each major gridline in the Number of minor intervals box.
Related concepts:“Current Default Charts and Legacy Charts” on page 79IBM Cognos Report Studio has a new default chart technology as of version 10.1.0.Related tasks:“Customize the Axes of a Current Default Chart” on page 120You can customize the axis labels, axis lines, and minor and major tick marks.“Show Gridlines in a Current Default Chart”You can also show alternating bands of color in the chart background thatcorrespond to your axis gridlines.
Showing Gridlines in a ChartTo make the data in a chart that includes axes easier to read, you can showhorizontal and vertical gridlines. You can show gridlines for the major or minorintervals on the axes.
You cannot show gridlines for chart types that do not display axes, such as pie anddonut charts.
Show Gridlines in a Current Default ChartYou can also show alternating bands of color in the chart background thatcorrespond to your axis gridlines.
You can change the scale for the major and minor gridlines using the Axis Rangeproperty.
Procedure1. Select the Y-axis or the X-axis of the chart.2. To show alternating bands of color as your chart background, do the following:
a. In the Properties pane, double-click the Gridlines property.b. Select the Show alternating color bands check box.c. Set the color and transparency of the first and second colors.
3. To show major gridlines as your chart background, do the following:a. In the Properties pane, double-click the Gridlines property.b. Select the Show major gridlines check box.c. Set the color, style, and weight of the major gridlines.d. If you are working with a gauge chart, specify the length of the gridline.
4. To show minor gridlines as your chart background, do the following:a. In the Properties pane, double-click the Minor gridlines property.b. Select the Show minor gridlines check box.c. Set the color, style, and weight of the minor gridlines.d. If you are working with a gauge chart, specify the length of the gridline.e. To specify by how many minor intervals to divide the major intervals, in
the Properties pane, type a number in the Number of Minor Intervalsproperty.
Chapter 6. Charts 123

Related concepts:“Current Default Charts and Legacy Charts” on page 79IBM Cognos Report Studio has a new default chart technology as of version 10.1.0.Related tasks:“Change the Axis Scale of a Current Default Chart” on page 120By default, IBM Cognos Report Studio automatically determines the minimum andmaximum scale values for the axes in a chart. For example, a Y-axis showingrevenue values might have an axis range of zero dollars to one million dollars. Youcan customize the axis scale, or range, to make your chart easier to understand.
Show Gridlines in a Legacy ChartGridlines are the lines on a chart that show the intervals along the axes.
Procedure1. Select the Y-axis or the X-axis of the chart.2. In the Properties pane, under General, double-click the Gridlines property.3. To specify the color, style, and weight of major gridlines do the following:
a. Select the Show major gridlines check box.b. Click Line color and choose a color for the major gridlines.c. To specify the thickness of the gridlines, click Point size and select a line
weight from the list.d. Click a line style in the Line style list.
4. To specify the color, style, and weight of minor gridlines:a. In the Properties pane, under General, double-click the Minor Gridlines
property.b. Select the Show minor gridlines check box.c. Click Line color and choose a color for the minor gridlines.d. To specify the thickness of the gridlines, click Point size and select a line
weight from the list.e. Click a line style in the Line style list.f. To change the transparency of the gridlines, type a percentage in the
Transparency box.Related concepts:“Current Default Charts and Legacy Charts” on page 79IBM Cognos Report Studio has a new default chart technology as of version 10.1.0.
Customize the Legend in a Current Default ChartYou can hide or show the legend and change its position relative to the chart area,chart body, or a data item. For example, in a bar chart showing revenue for eachproduct line by country or region, you could use the expression [Country orRegion] = 'Canada' to position the legend relative to the Canada bar.
Note: When you choose a preset legend position, that position appears inside anypadding that you have added to the chart object. Customized legend positions donot include any chart padding.
Procedure1. Select the chart object.2. In the Properties pane, under Chart Annotations, double-click the Legend
property.
124 IBM Cognos Report Studio Version 10.2.1: User Guide

3. To show the legend on the chart, select the Show Legend check box.4. To choose a preset legend position, click Preset and click a position from the
diagram.5. To choose a customized legend position, do the following:
a. Click Advanced and click the ellipsis (...) button.b. To display the legend at a set distance from the sides of the chart area, from
the Anchor list, click Relative to Chart.c. To display the legend at a set distance from the sides of the chart body,
from the Anchor list, click Relative to Chart Body.d. To display the legend at a set distance from a data item, such as a specific
pie slice in a pie chart, from the Anchor list, click Report Expression, clickthe ellipsis (...) button beside Expression, and enter an expression in theReport Expression dialog box.
e. Set the horizontal and vertical distances from the anchor.Related concepts:“Current Default Charts and Legacy Charts” on page 79IBM Cognos Report Studio has a new default chart technology as of version 10.1.0.
Customize the Items in the Legend of a Current Default ChartIf your legend includes items that are too long, you can truncate long legend itemsat a specific number of characters.
For example, if you want an ellipsis (...) to appear at the end of each truncatedlegend item, type ... in the Truncation text box.
You can also show the values of the data items in your legend.
Procedure1. Select the legend.2. To truncate the legend
a. In the Properties pane, under General, double-click the Text Truncationproperty.
b. To specify the number of characters at which the legend items aretruncated, click Manual and type the number of characters in theMaximum characters box.
c. To shrink the font of the legend item text until all the text fits in the legend,select the Shrink font as needed check box.
d. To specify some text to appear at the end of truncated legend items, in theTruncation text box, type the text that you want to appear at the end oftruncated items.
3. To show the values of legend items within the legenda. In the Properties pane, under General, set the Show Values property.
First Value and Last Value refer to the first and last item in the child setunder the legend data item. Minimum Value and Maximum Value refer tothe lowest and highest value in the child set under the legend data item.
b. If you want to change the separator between the legend item and value,type a new separator in the Legend Separator property.
4. To customize the title of the legenda. Click the default legend title area in the work area.b. In the Properties pane, under General, set the Default Title property to No.
Chapter 6. Charts 125

c. Double-click the default legend title area in the work area and type the newtitle.
Related concepts:“Current Default Charts and Legacy Charts” on page 79IBM Cognos Report Studio has a new default chart technology as of version 10.1.0.
Customize the Items in the Legend of a Legacy ChartIf your legend includes items that are too long, you can truncate long legend itemsat a specific number of characters. For example, if you want an ellipsis (...) toappear at the end of each truncated legend item, type ... in the Truncation text box.
You can also show the values of the data items in your legend and customize thelegend title.
Procedure1. Select the legend.2. To truncate the legend text, do the following:
a. In the Properties pane, under General, set the Auto Truncation property toYes.
b. In the Properties pane, under General, set the Auto Truncation property toYes.
c. In the Maximum Characters property, type the number of characters toappear before the text is truncated.
d. In the Truncation Text property, type the characters to append when thetext is truncated.
e. To shrink the font of the legend item text until all the text fits in the legend,select the Shrink font as needed check box.
f. To specify text to appear at the end of truncated legend items, type it in theTruncation text box.
3. To show the values of legend items within the legend, do the following:a. In the Properties pane, under General, set the Show Legend Values
property.First Value and Last Value refer to the first and last item in the child setunder the legend data item. Minimum Value and Maximum Value refer tothe lowest and highest value in the child set under the legend data item.
b. If you show multiple values and want to change the separator between thevalues, type a new separator in the Separator property.
4. To customize the title of the legend, do the following:a. Click the default legend title area in the work area.b. In the Properties pane, under General, set the Default Title property to No.c. Double-click the default legend title area in the work area and type the new
title.Related concepts:“Current Default Charts and Legacy Charts” on page 79IBM Cognos Report Studio has a new default chart technology as of version 10.1.0.
Adding a Note to a ChartAdd a note to a chart to provide additional detail. Notes appear as text in a chart.
126 IBM Cognos Report Studio Version 10.2.1: User Guide

By default, notes are aligned with the upper left corner of the chart object. Whenyou add a note to a chart, you can set the note's position relative to the sides of thechart area or chart body. You can also use a report expression to position the notenext to a data item within the chart. For example, in a bar chart showing revenuefor each product line by country or region, you could type [Country orRegion]='Canada' to position the note relative to the Canada bar.
Notes overwrite whatever is under them so you must position them properly.
If you apply more than one note, ensure that each note has a different position inthe report so that they do not overwrite each other. You can also specify the orderthat they should be drawn in when the report runs. If you have two notes with thesame coordinates, the first one in the list is drawn first and the next one is drawnon top of the first.
Tip: The Top 10 Retailers for 2011 sample report in the GO Data Warehouse(analysis) package includes a note.Related concepts:Appendix C, “Sample Reports and Packages,” on page 507Sample reports are included with IBM Cognos Business Intelligence. Wheninstalled, you can find them in the Public Folders tab in IBM Cognos Connection.
Add a Note to a Current Default ChartYou can add and position multiple notes on your chart.
Procedure1. Select the chart object.2. In the Properties pane, under Chart Annotations, double-click the Notes
property.
3. Click the new button .4. Type the note text in the Text box and click OK.
Tips: To delete a note, click the note and click the delete button . To movea note up or down in the list, click the up or down arrows.
5. In the Notes dialog box, click OK.6. To position the note, do the following:
a. Click the note icon in the list of notes.b. In the Properties pane, under Positioning, double-click the Position
property.c. To align the note horizontally, click the left, center, or right alignment
button.d. To align the note vertically, click the top, middle, or bottom alignment
button.e. To set the margins around the chart body, type margin values and choose
margin units.f. To display the note at a set distance from the sides of the chart area, from
the Anchor list, click Relative to Chart.g. To display the note at a set distance from the sides of the chart body, from
the Anchor list, click Relative to Chart Body.
Chapter 6. Charts 127

h. To display the note at a set distance from a data item, from the Anchor list,click Report Expression, click the ellipsis (...) button beside Expression, andenter an expression in the Report Expression dialog box.
7. To edit the text, double-click the text next to the note object in the chart.Related concepts:“Current Default Charts and Legacy Charts” on page 79IBM Cognos Report Studio has a new default chart technology as of version 10.1.0.
Add a Note to a Legacy ChartYou can add and position multiple notes on your chart.
Procedure1. Click the chart object.2. In the Properties pane, under Chart Annotations, double-click the Notes
property.
3. Click the new button .4. Type the note text in the Text box and click OK.
Tip: To delete a note, click the note and click the delete button . To move anote up or down in the list, click the up or down arrows.
5. In the Notes dialog box, click OK.
6. Click the note icon and set the note position, size, and border in theProperties pane.You set the location of the note by defining number of pixels from the bottomleft corner of the chart area.
Related concepts:“Current Default Charts and Legacy Charts” on page 79IBM Cognos Report Studio has a new default chart technology as of version 10.1.0.
Adding a Baseline to a ChartBaselines are horizontal or vertical lines that cut through the chart to indicatemajor divisions in the data. For example, you can add a baseline to show a salesquota or break-even point.
Each baseline represents a value on an axis.
Depending on the type of chart, you can use the following options to position thebaseline.
Option Description
Numeric Value Uses a static numeric value.
Query Calculation Uses a query calculation from the chartquery or from a different query. For moreinformation, see “Using RelationalCalculations” on page 248.
Layout Calculation Uses a layout calculation. For moreinformation, see “Using RelationalCalculations” on page 248.
128 IBM Cognos Report Studio Version 10.2.1: User Guide

Option Description
Category Index Uses the index value of the data item in thecategories axis.
For example, a Category index value of 1indicates that the baseline is located at thefirst data item. This is the default.Note: This option applies only to thecurrent default charts, and does not apply tothe legacy charts.
Member Value When working with dimensional datasources, uses a position relative to amember. For example, a member calculationthat uses an expression similar to[Query1].[Current year]=2011 places thebaseline in the middle of the chart objectthat represents 2011. To place the baselinebetween 2011 and 2012 on the chart, a halfmember width to the right, set the MemberOffset property to 50%. To place thebaseline between 2010 and 2011, set theMember Offset property to -50%. You canalso type in 100, -200, and so on to place thebaseline on the chart.
Statistical Limit Statistical maximum uses the followingexpression:
25th percentile value - 1.5 * (75th percentilevalue - 25th percentile value)
For example, if 2.5 is the 25th percentile and7.5 is the 75th percentile, the statisticalminimum is -5 [2.5 -1.5(5) = -5].
Statistical minimum uses the followingexpression:
75th percentile value + 1.5 * (75th percentilevalue - 25th percentile value)
For example, if 2.5 is the 25th percentile and7.5 is the 75th percentile, the statisticalmaximum is 15 [7.5 +1.5(5) = 15].
Statistical minimum and Statisticalmaximum use percentiles to determinevalues, so the baseline might not appear onthe chart if its value is off the axis.
Mean Uses the statistical mean plus or minus anumber of standard deviations based on allcharted data values on the specified axis.
Percentile (%) Uses a specified percentile.
Percent on Axis (%) Uses a percentage of the full range of theaxis.
For example, if the axis range is -500 to 1100,a Percent on Axis value of 25% puts thebaseline at -100 (25% of the range, 1600).
Chapter 6. Charts 129

If you apply more than one baseline, you can specify the order in which theyshould be drawn when the report runs. If you have two baselines with the samecoordinates, the first one in the list is drawn first and the next one is drawn on topof the first one.
By default, the baseline and its label appear in the legend.
Baselines do not support color transparency.
Tip: The Positions to Fill sample report in the GO Data Warehouse (analysis)package includes a baseline.Related concepts:Appendix C, “Sample Reports and Packages,” on page 507Sample reports are included with IBM Cognos Business Intelligence. Wheninstalled, you can find them in the Public Folders tab in IBM Cognos Connection.
Add a Baseline to a Current Default ChartWhen working with current default charts, you can define baselines by values onthe numeric axis or the category axis.
Procedure1. Click the chart object.2. Depending on your chart and the type of baseline you want to add, in the
Properties pane, under Chart Annotations, double-click the Numeric Baselinesor Category Baselines property.
3. Click the new button and choose the type of baseline from the list.4. Specify the necessary criteria for the baseline position5. Under Baseline Properties, type a label for the baseline and specify the line
style.Tip: To remove the baseline from the legend, delete the label.
6. If you add more than one baseline, specify their order using the up and downarrows.The new baselines appear in the Markers, notes, baselines, and trendlines box.
7. To change the label that appears next to the baseline, under the Markers, notes,baselines, and trendlines box, double-click the placeholder text next to the
baseline icon and type your text.8. To change the line style, select the chart and in the Properties pane, under
Chart Annotations, double-click the Baselines, Numeric Baselines, or CategoryBaselines property.
9. To delete a baseline, select the baseline icon and click the delete
button .Related concepts:“Current Default Charts and Legacy Charts” on page 79IBM Cognos Report Studio has a new default chart technology as of version 10.1.0.
Add a Baseline to a Legacy ChartWhen working with legacy charts, you can define baselines by the values on thenumeric axis.
130 IBM Cognos Report Studio Version 10.2.1: User Guide

Procedure1. Click the chart object.2. In the Properties pane, under Chart Annotations, double-click the Baselines
property.
3. Click the new button and choose the type of baseline from the list.4. Specify the necessary criteria for the baseline position.
If you use a calculation to determine the baseline, define an expression.5. If you add more than one baseline, specify their order using the up and down
arrows.6. Click OK.
A baseline icon appears in the Markers, notes, and baselines box.
7. To define the line style, click the baseline icon and set the Line Stylesproperty.
8. To define the text style, click the baseline text and make changes in theProperties pane.
9. To delete a baseline, click its baseline icon and click the delete button .Related concepts:“Current Default Charts and Legacy Charts” on page 79IBM Cognos Report Studio has a new default chart technology as of version 10.1.0.
Adding Markers to ChartsMarkers are symbols that you add to a chart to designate points of significancethat can help you analyze or understand the data.
For example, you might want to add a marker to designate the time when asignificant event happened, such as the date when a new product was launched.
You can add a marker to combination, progressive column, Pareto, scatter, andbubble charts.
When you define the position of the marker, you define the X- and Y-axescoordinates for the placement of the symbol. You can position the marker in thechart using the following options.
Option Position
Numeric Value Uses a static numeric value.
Query Calculation Uses a query calculation from the samequery or from a different query. For moreinformation, see “Using RelationalCalculations” on page 248.
Layout Calculation Uses a layout calculation. For moreinformation, see “Using RelationalCalculations” on page 248.
Chapter 6. Charts 131

Option Position
Statistical Minimum Uses the following expression:
25th percentile value - 1.5 * (75th percentilevalue - 25th percentile value)
For example, if 2.5 is the 25th percentile and7.5 is the 75th percentile, the statisticalminimum is -5 [2.5 -1.5(5) = -5].
Statistical minimum uses percentiles todetermine values, and might not alwaysappear in the chart if the values are off theaxis.
Statistical Maximum Uses the following expression:
75th percentile value + 1.5 * (75th percentilevalue - 25th percentile value)
For example, if 2.5 is the 25th percentile and7.5 is the 75th percentile, the statisticalmaximum is 15 [7.5 +1.5(5) = 15]. Statisticalmaximum uses percentiles to determinevalues, so the marker might not alwaysappear on the chart if its value is off theaxis.
Mean Uses the statistical mean plus or minus anumber of standard deviations based on allcharted data values on the specified axis.
Percentile Uses a specified percentile.
Percent on Axis Uses a percentage of the maximum axisvalue.
If you apply more than one marker, you can specify the order in which theyshould be drawn when the report runs. If you have two markers with the samecoordinates, the first one in the list is drawn first and the next one is drawn on topof the first.
Add a Marker to a Current Default ChartMarkers are symbols that you add to a chart to designate points of significancethat can help you analyze or understand the data.
Note: Current default scatter charts have a different set of steps.
Procedure1. Select the chart object.2. In the Properties pane, under Chart Annotations, double-click the Markers
property.
3. Click the new button , and then set the marker properties4. In the Based on box, select the chart object that will determine the marker
position.5. In the Numeric position box, specify how you want to define the position on
the numeric (Y) axis.
132 IBM Cognos Report Studio Version 10.2.1: User Guide

6. In the Category position box, specify how you want to define the position onthe category (X) axis.
7. In the Marker label box, type the label that you want to give to the marker.8. In the Marker size box, specify the size of the marker symbol.9. To specify the color, fill, and shape of the marker symbol, click the Color and
style box.10. If you add more than one marker, specify their order by using the up and
down arrows.The new markers appear in the Markers, notes, and baselines box.
Tip: To delete a marker, click the marker icon and text and click the delete
button .11. Run the report.Related concepts:“Current Default Charts and Legacy Charts” on page 79IBM Cognos Report Studio has a new default chart technology as of version 10.1.0.
Add a Marker to a Current Default Scatter ChartMarkers are symbols that you add to a chart to designate points of significancethat can help you analyze or understand the data.
Procedure1. Select the scatter chart object.2. In the Properties pane, under Chart Annotations, double-click the Markers
property.
3. Click the new button , and then set the marker properties.4. In the X-axis position box, specify how you want to define the position on the
X-axis.5. In the Y-axis position box, specify how you want to define the position on the
Y-axis.6. In the Marker label box, type the label that you want to give to the marker.7. In the Marker size box, specify the size of the marker symbol8. To specify the color, fill, and shape of the marker symbol, click the Marker
color and style box.9. If you add more than one marker, specify their order using the up and down
arrows.The new markers appear in the Markers, notes, and baselines box.
Tip: To delete a marker, click the marker icon and text and click the delete
button .Related concepts:“Current Default Charts and Legacy Charts” on page 79IBM Cognos Report Studio has a new default chart technology as of version 10.1.0.
Add a Marker to a Legacy ChartMarkers are symbols that you add to a chart to designate points of significancethat can help you analyze or understand the data.
Chapter 6. Charts 133

Procedure1. Select the chart object.2. In the Properties pane, under Chart Annotations, double-click the Markers
property.
3. Click the new button , and then set the Numeric position type, Markerlabel, Marker shape, Numeric value, and Color properties.
4. If you add more than one marker, specify their order by using the up anddown arrows.The new markers appear in the Markers, notes, and baselines box.
Tip: To delete a marker, click the marker icon or marker label and click the
delete button .Related concepts:“Current Default Charts and Legacy Charts” on page 79IBM Cognos Report Studio has a new default chart technology as of version 10.1.0.
Display Trendlines in Current Default ChartsYou can display or hide trendlines in the current default bar, line, area, bubble, orscatter charts.
Trendlines, also known as lines of best fit or regression lines, graphically illustratetrends in data series and are commonly used when charting predictions. Atrendline is typically a line or curve that connects or passes through two or morepoints in the series, showing a trend.
You can specify the following types of trendlines:v Linear
Use a linear trendline when your data increases or decreases along a straightline at a constant rate. For example, if your chart displays a steady increase inrevenue by product line over time, you could use a linear trendline.
v Exponential
Use an exponential trendline when your data values increase or decreaseexponentially, or at an increasingly higher or lower rate. For example, if yourchart displays an exponential increase in revenue by product line over time, youcould use an exponential trendline.
v Polynomial
Use a polynomial trendline when your data values both increase and decrease.For example, if your chart displays both increases and decreases in revenue byproduct line over time, you could use a polynomial trendline.
v Logarithm or Natural Logarithm
Use a logarithmic trendline when your data values increase or decrease rapidlyand then level out. For example, if your chart displays a rapid decrease inrevenue by product line over time and then a plateau, you could use alogarithmic trendline.
v Power
Use a power trendline when your data values increase or decrease in a curve ata steady rate. For example, if your chart displays a steady increase in revenue byproduct line over time and your data points will fit a curved line, you could usea power trendline.
134 IBM Cognos Report Studio Version 10.2.1: User Guide

v Moving Average
Use a moving average trendline when your data values fluctuate and you wantto smooth out the exceptions to see trends. For example, if your chart displayswild fluctuations in revenue by product line over time, but you know that somedata points are exceptions, you could use a moving average trendline.
If you are not sure which trendline type to use, try each type to see which one bestfits most of your data points. For example, a linear trendline will not fit mostpoints on a scatter chart with widely spread data points.
Trendlines do not support color transparency.
Procedure1. Select the chart object.2. In the Properties pane, under Chart Annotations, double-click the Trendlines
property.
3. Click the new button and click a trendline type.4. Define the trendline by specifying the following options. The options that are
available depend on the type of trendline you chose.v To set the order, or degree, of a polynomial trendline, in the Order box, type
a value between 2 and 6.v To set the number of periods to go back in a moving average trendline, in
the Periods box, type a value.v If you have more than one series on your chart, in the Based on list, click the
data you want to use for the trendline.v Click either One trendline for all series items or A trendline for each series
item.v To customize the style of the trendlines, click Line Styles and customize the
line color, weight, and style.v To customize the trendline labels in the legend, click Label and choose None,
Automatic, or Custom.v To display the trendline equation, click Show equation, and then click Show
in legend or Show on chart, and then click Position to define the equation'sposition on the chart.
v To display the R-squared value of the trendline, click Show R-squared value,and then click Show in legend or click Show on chart and then clickPosition to define the position of the value on the chart.
Related concepts:“Current Default Charts and Legacy Charts” on page 79IBM Cognos Report Studio has a new default chart technology as of version 10.1.0.
Display Regression Lines in Legacy Scatter or Bubble ChartsWhen using legacy charts, you can display or hide regression lines on scattercharts and bubble charts. Regression lines, also known as lines of best fit or trendlines, graphically illustrate trends in data series. Regression lines are commonlyused when charting predictions. A regression line is typically a line or curve thatconnects or passes through two or more points in the series, showing a trend.Legacy scatter and bubble regression lines are calculated using a numericalalgorithm that isn't guaranteed to be optimal. Regressions may or may not matchcurrent default chart regressions.
Chapter 6. Charts 135

You can specify the following types of regression lines to determine the positionand slope of the line:v Linear
Use a linear regression line when your data increases or decreases at a consistentrate. For example, if your chart displays a steady increase in revenue by productline over time, you could use a linear regression line.
v Common Log or Natural Log
Use a logarithmic regression line when your data increases or decreases rapidlyand then levels out. For example, if your chart displays a rapid decrease inrevenue by product line over time and then a plateau, you could use alogarithmic regression line.
v Exponential
Use an exponential regression line when your data increases or decreasesexponentially, or at steadily increasing or decreasing rate. For example, if yourchart displays an exponential increase in revenue by product line over time, youcould use an exponential regression line.
v Polynomial Fit
Use a polynomial fit regression line when your data both increases anddecreases. For example, if your chart displays both increases and decreases inrevenue by product line over time, you could use a polynomial fit regressionline.
If you are not sure which regression line type to use, try each type to see whichone best fits most of your data points. For example, a linear regression line is notgoing to fit most points on a scatter chart with widely spread data points.
Procedure1. Select the scatter or bubble chart.2. In the Properties pane, under Chart Annotations, set the Regression Line
property to Show.
3. Click the regression line icon in the report layout.4. In the Properties pane, under General, set the Line Styles, Regression Type,
and Number of Regression Lines properties.Related concepts:“Current Default Charts and Legacy Charts” on page 79IBM Cognos Report Studio has a new default chart technology as of version 10.1.0.
Showing data values in current default chartsYou can show the data labels or data values within the chart so that the datavalues are clearer.
For example, you can display the data values above each column in a columnchart to show the exact height of each column.
Procedure1. For a bar, column, line, or area chart, under Series, select the chart type icon.2. For a bubble, scatter, Pareto, or progressive chart, click the chart.3. In the Properties pane, under Chart Labels, double-click the Show Values
property.
136 IBM Cognos Report Studio Version 10.2.1: User Guide

4. For bar, column, line, area, Pareto, or progressive charts, to specify the datalabel format, in the Values list, select what values to display.v None does not display data values.v Absolute displays the absolute value of the data.v Cumulative displays the cumulative value of the data.
5. For bubble or scatter charts, to specify the data label format, in the Show box,select whether to show values or values and labels for the category, series, andmeasure.
6. For bar, column, line, area, Pareto, or progressive charts, to show lines thatpoint from data labels to data marker they apply to, select the Show leaderlines check box.
7. For bubble or scatter charts, to show lines that point from data labels to datamarker they apply to, select the Leader lines check box.
8. To specify where values and labels are to be rendered in the chart, click theValue Location list and choose the location that you want.
9. To specify how to display the labels if their positions on the chart overlap, inthe Collision Mode list, click one of the following modes:v None specifies that labels appear in default positions and might overlap.v Normal (for pie and donut charts) specifies that labels are placed just above
their corresponding data markers or chart objects. There is no collisiondetection, so labels can overlap.
v Coarse Stagger specifies that labels are placed close to their data markersand staggered so that they do not overlap. This collision mode takes lesstime to render than Fine Stagger but might result in labels that are fartheraway from their corresponding data markers.
v Fine Stagger specifies that labels are staggered so that they do not overlap.The labels are as close to the data markers as possible without overlapping.This collision mode takes more time to render than Coarse Stagger but mightresult in labels that are closer to their corresponding data markers.
Showing data values in current default pie and donut chartsYou can show the data labels or data values within the chart so that the datavalues are more clear.
For example, in a pie chart, show the data values within each pie slice, so that youknow the exact size of each pie slice.
Procedure1. Select the chart object.2. In the Properties pane, double-click the Show values property.3. To display data labels for each slice of the pie, under Show, select the Slice
names check box.4. To show lines pointing from data labels to the slices they apply to, select the
Show leader lines check box.5. To specify the data label format, in the Values list, select what values to
display.v Hide does not display data values.v Absolute displays the absolute value of the data.v Percentage displays the slice's percentage of the whole pie.
Chapter 6. Charts 137

v Absolute and Percentage displays the slice's percentage of the whole pie asan absolute value.
6. In the Position list, select the placement of data labels.
Showing data values in other current default chartsYou can show the data labels or data values within the chart so that the datavalues are more clear.
For example, you can display the data values above each bubble in a bubble chartto show the exact value of each bubble.
You can show data values for the following chart types: Pareto, progressive, scatter,and bubble.
Procedure1. Select the chart object.2. In the Properties pane, under Chart Labels, double-click the Show Values
property.3. For each of the categories, series, and measures, select whether to show only
values, values and labels, or neither.4. To show lines pointing from data labels to the data marker they apply to, select
the Leader lines check box.5. To specify how to display the labels if their positions on the chart overlap, in
the Collision Mode list, click one of the following modes:v None specifies that labels appear in default positions and might overlap.v Normal (for pie and donut charts) specifies that labels are placed just above
their corresponding data markers or chart objects. There is no collisiondetection, so labels can overlap.
v Coarse Stagger specifies that labels are placed close to their data markersand staggered so that they do not overlap. This collision mode takes lesstime to render than Fine Stagger but might result in labels being fartheraway from their corresponding data markers.
v Fine Stagger specifies that labels are staggered so that they do not overlap.The labels are as close to the data markers as possible without overlapping.This collision mode takes more time to render than Coarse Stagger but mightresult in labels being closer to their corresponding data markers.
Related concepts:“Current Default Charts and Legacy Charts” on page 79IBM Cognos Report Studio has a new default chart technology as of version 10.1.0.
Define Query Context When Customizing Legend Entries,Legend Titles, or Axis Labels
You want to use a revenue expression as a chart legend title. If you get an errormessage saying that the query context of a layout object cannot be determined, youmust define the property list for the item to which it refers. You must first add thedesired data item to the query before you can define its property list.
Procedure1. Open the chart to customize.
2. Pause the pointer over the query explorer button and click the query.
138 IBM Cognos Report Studio Version 10.2.1: User Guide

3. From the Source tab , drag the desired item to the Data Items window toadd it to the query.
4. Pause the pointer over the page explorer button and click the chart page.
5. From the Source tab , drag the desired item to the layout object.6. In the Properties pane, under Data, double-click the Properties property.7. Select the check box for the data item to define.Related tasks:“Specify a List of Data Items for an Object” on page 284Specify the list of data items for an object when you must reference a data itemthat is in a query but is not in the layout.
Summarize Small Slices, Bars, or Columns in Current DefaultCharts
You can summarize the smaller slices or bars in charts to avoid having many tinyslices or bars. For example, if your pie chart shows revenue by product and 10 ofyour products have less than 1% of the pie, you can summarize these 10 slices intoone larger slice and name that slice Other.
Similarly, you can summarize small items in a column, bar, area, and line chart.
You cannot summarize small slices or items in charts that have matrix edges or incharts that have multiple numeric axes.
Procedure1. Select the chart object.2. In the Properties pane, under General, double-click the Summarize Small
Slices or Summarize Small Items property.3. To summarize small slices or items up to a maximum number, select the
Maximum number of slices or Maximum number of items check box andtype the maximum number.
4. To summarize all the slices or bars that are smaller than a specific value, selectthe Summarize slices smaller than a value or Summarize items smaller than avalue check box, type a value that represents the upper size limit, and choosewhether the value is a percentage or absolute.
5. Under Small slice summarization type or Small item summarization type,choose whether to summarize the slices or items as a Total or Average.
Note: Averages are calculated using only the summarized items in the report.6. Under Slice label or Item label, type a label for the one large slice, bar, area, or
line that summarizes the smaller ones.Related concepts:“Current Default Charts and Legacy Charts” on page 79IBM Cognos Report Studio has a new default chart technology as of version 10.1.0.
Customizing Lines and Data Points in a Line ChartYou can customize the lines in a line chart to show only lines, only data points, orboth. Data points represent series values for each category on the Y-axis. You canshow special data markers that represent statistically significant values, such asopen, high, low, and close values.
Chapter 6. Charts 139

You can also add markers at other positions on the chart. For more information,see “Add a Marker to a Current Default Chart” on page 132.
You can also change the shape of the line that connects the data points to one ofthe following:v Point to Point shows data points connected by straight lines.v Step at Point shows data points connected by steps that start and end at the
data points.v Step Between Points shows data points connected by steps that start and end
between the data points.v Smooth shows data points connected by smooth curves.Related tasks:“Add a Marker to a Current Default Chart” on page 132Markers are symbols that you add to a chart to designate points of significancethat can help you analyze or understand the data.
Customize Lines and Data Points in a Current Default Line ChartYou can change the color and shape or the line or data markers in a line chart. Youcan also show or hide data labels, the line, and data markers.
You cannot show value markers when the Data points option is selected or whenthe configuration of the line chart is stacked or 100 percent stacked.
Procedure1. Select the chart object.2. In the chart area, under Series, click the line chart icon to view the line
properties.3. To select whether to show only the line, the line and data markers, or only the
data markers, in the Properties pane, select an option from the Line andMarkers list.
4. To show special data markers, double-click the Value Markers property. Selectthe check box for the special data markers that you want to add and for eachmarker, specify the color and shape.The options you specify in Value Markers overwrite the options for Line andMarkers.
5. To change the shape of the line that connects data markers, select an optionfrom the Line Shape list.
6. To show data labels for the data points, double-click the Data Labels property.7. To change the color of the lines, double-click the Palette property.Related concepts:“Current Default Charts and Legacy Charts” on page 79IBM Cognos Report Studio has a new default chart technology as of version 10.1.0.“Customizing the Color Palette of a Chart” on page 108You can use the chart palette to control the colors or patterns used in the columns,lines, data markers or areas in a chart. For example, if "Telephone" is the first in adata series of order methods, and you want it to appear in blue, use the palette tomake the first item in the series blue.
Customize Lines and Data Points in a Legacy Line ChartYou can change the color and shape or the line or data markers in a line chart. Youcan also show or hide data labels, the line, and data markers.
140 IBM Cognos Report Studio Version 10.2.1: User Guide

You cannot show value markers under the following conditions:v The Data points option is selected.v The configuration of the line chart is stacked or 100 percent stacked.v The Show line property is set to No, creating a point chart.
Procedure1. Select the chart object.2. In the chart area, under Series, click the line chart icon to view the line
properties.3. To select whether to show only the line, the line and data markers, or only the
data markers, in the Properties pane, under General, select an option from theLine Type list.
4. To show or hide the line, select an option from the Show line list.5. To show data points or value markers, double-click the Show Data Points
property:v To show or format data points, click Data points and specify the point shape
and point size.The point color is defined by the chart palette.
v To show or format value markers, click Value markers and specify themarkers to show. For each marker, specify the shape and marker size. ClickColor to change the marker color.
Tip: To remove all data points and value markers, in the Show Data Pointsdialog box, select None.
Related concepts:“Current Default Charts and Legacy Charts” on page 79IBM Cognos Report Studio has a new default chart technology as of version 10.1.0.“Customizing the Color Palette of a Chart” on page 108You can use the chart palette to control the colors or patterns used in the columns,lines, data markers or areas in a chart. For example, if "Telephone" is the first in adata series of order methods, and you want it to appear in blue, use the palette tomake the first item in the series blue.
Customize a Current Default Combination ChartCombination charts show data series using two or more types of charts - area, bar,and line. The different charts are overlaid on top of each other. You can customizethe order in which the charts appear along with the type of charts and theirconfigurations.
You can also customize which numeric axes to show and which chart to show oneach axes.
Procedure1. Select the combination chart object.2. In the Properties pane, under General, double-click the Combinations
property.3. Under Numeric axes, select which axes to show.
4. Under Combinations, add or remove data series.5. If you want to change the order in which the series appear, use the up and
down arrows.
Chapter 6. Charts 141

The series appear in the order they are listed. Each chart appears in theforeground of any previous charts.
6. If you want to change the configuration type of the series, such as changingclustered bars to stacked bars, under Combinations, select the series, click the
edit button and select the type.7. If you use the same data series for multiple charts and want to synchronize the
data marker colors, under Color & Background, set the Series Color propertyto Match.
Related concepts:“Current Default Charts and Legacy Charts” on page 79IBM Cognos Report Studio has a new default chart technology as of version 10.1.0.
Create a Matrix of Current Default ChartsYou can view a complex chart that includes nested series or categories into amatrix, or crosstab, that shows multiple small charts arranged in rows andcolumns.
The charts in the rows represent the outer nested levels of the series and categoriesand, the charts in the columns represent the categories. Each data item in the outernested levels of the series and categories becomes a separate chart. The numericscale of all the charts is the same so that you can easily compare.
When working with pie, gauge, and bullet charts, if you include a data item in thecategories, you automatically create a matrix of charts. One chart appears for eachdata item in the category. When working with progressive and bullet charts, if youinclude a data item in the series, you also automatically create a matrix of charts.
For example, the following column chart shows the revenue for each year (in thecategories or X-axis) for all the regions and product lines (in the series or Y-axis).This chart is very complex and difficult to understand.
Figure 12. Complex column chart
142 IBM Cognos Report Studio Version 10.2.1: User Guide

The following chart contains the same series and categories. However, whenconverted to a matrix of charts, the information is much easier to analyze. Thecolumns show charts for each year and the rows show charts for each the productlines. The bars represent the revenue for each region.
Procedure1. Select the chart object.2. In the Properties pane, under General, double-click the Matrix rows and
columns property.3. Select the Show outer nested series as matrix rows or Show outer nested
categories as matrix columns check boxes (or both).4. In the Matrix levels box, select the number of nested levels to include in the
matrix columns or rows.The remaining nested levels are represented in the chart bodies in the matrixif the chart supports additional categories. The pie, gauge, and bullet chartsdo not support additional categories. The bullet and progressive columncharts do not support additional series.For example, in the above chart, Regions are nested under Product Line. Inthe matrix chart, a Matrix level of 1 is specified. Therefore, Product Lineappears as the matrix rows (series) and Regions appear within the chartbodies.
5. If you want labels for the matrix rows and columns to appear on each chart,select the Show row labels or Show column labels check box.
6. In the Labels location list, select where the nested labels should appear oneach chart.
Figure 13. Matrix chart
Chapter 6. Charts 143

The default position is on the left for rows and on the bottom for columns.7. If the labels are too long, click Truncation and specify where to truncate text
or select the Size fonts automatically check box to resize the text to fit.8. To change the font, color, and data format of the labels, click Style.9. To show the title in the row or column axis, select the Show row title or
Show column title check box.10. If you want to hide or show the axes, select the axis object, and in the
Properties pane, under Miscellaneous, set the Show in Matrix property.11. If your matrix chart includes only rows or columns, and you want them to
wrap, select the Wrap rows or columns if possible check box.12. If you want to show the axes and axis labels for each small chart in the
matrix, select the Repeat row and column axis labels check box.When this option is cleared, axes and axis labels appears only along the outeredge of the matrix.
Related concepts:“Current Default Charts and Legacy Charts” on page 79IBM Cognos Report Studio has a new default chart technology as of version 10.1.0.
Customize a Current Default Gauge ChartWhen you create a gauge chart, you can choose from a variety of chart templates,which offer different shape, axis, and border options.
You can customize the following aspects of your gauge chart. As you modifyproperties, the chart preview shows you what your chart will look like.
Unless indicated in the user interface, all sizes are a percentage of the maximumallowed.
If your gauge chart includes a border, long axis labels, such as 250,000,000, mayoverlap the gauge border and be difficult to read. To avoid this problem, customizethe data format of your gauge chart measure and reduce the scale so that lesszeros are displayed. Or change the gauge border color or size or remove theborder.
Procedure1. Click the gauge chart object.
144 IBM Cognos Report Studio Version 10.2.1: User Guide

2. If you want to change the shape of the gauge, modify the start and end anglesof the gauge axes and border, as follows:a. In the Properties pane, under General, double-click the Gauge Axes
property and specify the start and end angles and the direction of the axes.b. Double-click the Gauge Border property and specify the style and the start
and end angles of the border.For example, a border start angle of 0 degrees and end angle of 180 degreesproduces a semi-circular gauge.
3. If you want to add an additional axes to a gauge chart, do the following:a. In the Properties pane, under General, double-click the Gauge Axes
property.
b. Click the new button and specify the start and end angles and thedirection of the new axis.
4. If you want to change the size, shape, and color of the center pivot point,double-click the Gauge Pivot property and specify the style.
5. If you want to change the indicators in the gauge axis, click the Gauge Axisobject in the chart and do the following:a. To change the needle, under Axes, double-click the Gauge Needle property
and specify the style.b. To change, add, or remove color bands that indicate the data range
positions, under Color & Background, double-click the Gauge Axis Colorsproperty and specify the color palette.
c. If you want to change the size or thickness of the gauge axis and colorbands, under Axes, specify a percentage size for the Gauge Axis InnerRadius and Gauge Axis Outer Radius properties.
d. If you want to change the gridlines, under General, double-click theGridlines or Minor Gridlines properties and specify the style.
e. If you want to change the appearance of the gauge axis line, under General,double-click Axis Line.
Related concepts:“Current Default Charts and Legacy Charts” on page 79IBM Cognos Report Studio has a new default chart technology as of version 10.1.0.“Gauge Charts” on page 94Gauge charts, also known as dial charts or speedometer charts, use needles toshow information as a reading on a dial.
Customize a Legacy Gauge ChartYou can customize the colors and threshold boundaries of the gauge axis areas andwhether they use numbers instead of percentages. You can also change the colorsof the gauge face and outline and hide gauge labels. By default, the legacy gaugechart uses a band divided into thirds that runs from green to red.
Procedure1. Click the gauge chart object.2. If you want to customize the color of the gauge face or outline, in the General
section of the Properties pane, double-click the Face Color or Dial OutlineColor property.
3. If you want to hide the gauge labels, in the Chart Labels section of theProperties pane, set the Gauge Labels property to Hide.
Chapter 6. Charts 145

4. If you want to customize the colors and boundaries of the gauge areas, do thefollowing:a. In the Color & Background section of the Properties pane, double-click the
Gauge Palette property.b. To change the color of a boundary area, under Palette, select the color, click
Color, specify the color properties, and click OK.c. To change the value of a boundary area, under Palette, select the boundary
value, and type a new value.
d. To add a new boundary area, click the new button .e. To choose a pre-defined threshold style, click the Palette drop-down menu.You can choose whether to use discrete colors or continuous colors.To use a number instead of a percentage as a boundary, clear the Percentagecheck box, and then type a number in the Numeric boundary box.
Related concepts:“Current Default Charts and Legacy Charts” on page 79IBM Cognos Report Studio has a new default chart technology as of version 10.1.0.“Gauge Charts” on page 94Gauge charts, also known as dial charts or speedometer charts, use needles toshow information as a reading on a dial.
Define Color by Value in Current Default Scatter and BubbleCharts
In a scatter or bubble chart you can specify that data points or bubbles appear indifferent colors based on an additional measure or fact. The color of the points orbubbles adds an additional aspect to the chart to assist you in finding relationshipsin large amounts of data.
For example, the following bubble chart shows the relationship between the unitcost and unit sale price. The size of the bubbles shows the gross profit and thecolor of the bubbles shows whether the quantity sold is above (yellow) or below(green) 1,000,000 units.
146 IBM Cognos Report Studio Version 10.2.1: User Guide

In a bubble chart, you can combine the color by value and bubble size to create amore meaningful chart.
Procedure1. Drag a measure to the Color drop zone under Measures and then select the
measure.2. In the Properties pane, under Color & Background, double-click the Color by
Value property.3. To define the colors by percentages instead of actual values, select the
Percentage check box.For example, if the Percentage check box is selected and your values rangefrom 25 (red) to 50 (green), then the bottom 25 percent of values will be red,the top 50 percent of values will be green, and the values between 25 and 50percent will be an interpolated color, such as yellow.
4. If you want to use a preset color palette, click Palette, and select the palettethat you want to use.
5. If you want to customize a palette color or boundary value, select the paletteentry in the Palette box and specify the color, transparency, and type a newboundary value.
6. To add a new palette entry, select the palette entry below which you want to
add the new entry, click the new palette entry button , and click Color.7. If your chart has lines or markers, under Style, set the marker shape, line style,
and line weight.8. To choose a color and transparency for missing or null values, under Missing
Values, click Color and type a value in the Transparency box.
Figure 14. Bubble chart with color specified by value
Chapter 6. Charts 147

Related concepts:“Current Default Charts and Legacy Charts” on page 79IBM Cognos Report Studio has a new default chart technology as of version 10.1.0.“Scatter Charts” on page 90Scatter charts use data points to plot two measures anywhere along a scale, notonly at regular tick marks.“Bubble Charts” on page 91Bubble charts, like scatter charts, use data points and bubbles to plot measuresanywhere along a scale. The size of the bubble represents a third measure.
Specify the Bubble Size in a Current Default Bubble ChartIn a bubble chart, you use a measure or fact to determine the size of the bubbles.
You can use the Bubble Measure in the Measures drop zone of the chart tospecify bubble size. You can then specify the size range of the bubbles in the chart.You can also specify what value the smallest bubbles represent. For example, yourbubble measure is revenue, and you set the minimum and maximum bubble sizeto 5 pt and 20 pt, respectively. You set the smallest bubble to represent the valuezero. All the bubbles on your chart will be between 5 and 20 pts and any bubblesbetween 0 and 5 pts on this scale will appear at 5 pt.
You can combine bubble size with colors by value to create a chart that showsmultiple dimensions.
Procedure1. Select the chart object.2. In Properties pane, under General, double-click the Bubble Size property.3. Under Smallest bubble, select what value the smallest bubbles represent:
v To show data items with a value of zero at the minimum bubble size, clickZero.
Tip: This setting is consistent with Microsoft Excel 2003.v To show data items with a value of zero at the minimum bubble size and
show negative bubbles as hollow, select the Zero. Negatives shown ashollow check box.
Tip: This setting is consistent with Microsoft Excel 2007.v To set the minimum bubble size to the minimum data value, click Minimum
data value, and type a size for the minimum and maximum bubble size.
Note: The minimum data value can be positive or negative.Related concepts:“Current Default Charts and Legacy Charts” on page 79IBM Cognos Report Studio has a new default chart technology as of version 10.1.0.“Bubble Charts” on page 91Bubble charts, like scatter charts, use data points and bubbles to plot measuresanywhere along a scale. The size of the bubble represents a third measure.
Set the Position of the First Slice in a Current Default PieChart
You can specify the angle in a pie chart where the first pie slice starts. You can alsochange the direction of the slices so they appear clockwise or counter-clockwise.
148 IBM Cognos Report Studio Version 10.2.1: User Guide

The default starting position of the first slice is 90, which displays the first slicebeginning at the 12 o'clock position. By default, the slices appear clockwise aroundthe pie, so a starting position of 90 displays the first slice at the 12 o'clock position,a starting position of 180 displays the first slice at the 9 o'clock position, and so on.
Procedure1. Select the pie chart object.2. In the Properties pane, under General, beside the First Slice Angle property,
enter the angle at which you want the first slice to appear.3. To change the directions in which slices appear, change the Slice Direction
property.Related concepts:“Current Default Charts and Legacy Charts” on page 79IBM Cognos Report Studio has a new default chart technology as of version 10.1.0.“Pie Charts” on page 86Pie charts are useful for highlighting proportions.
Create a Donut Chart from a Current Default Pie ChartYou can add a hole to the middle of your pie chart to create a donut chart. You canthen display something in the hole, such as a company logo, a calculation, or thelegend.
Procedure1. Select the pie chart object.2. In the Properties pane, under General, set the Hole size (%) property to the
percentage of the pie that you want the hole to take up.
Tip: You can select a value from the Hole size (%) list or type a value that isnot listed.
Related concepts:“Current Default Charts and Legacy Charts” on page 79IBM Cognos Report Studio has a new default chart technology as of version 10.1.0.“Pie Charts” on page 86Pie charts are useful for highlighting proportions.
Pull Out Pie Slices in a Current Default Pie ChartYou can highlight pie slices by pulling them out from the rest of the pie. Forexample, the following chart shows revenue by product line with slices of less than1,000,000,000 in revenue pulled out by 25%.
Chapter 6. Charts 149

Procedure1. Select the pie chart object.2. In the Properties pane, under General, double-click the Exploded Slices
property.
3. In the Exploded Slice dialog box, click the new button .4. In the Exploded amount box, type the percentage by which the slice should
appear away from the rest of the pie.0% displays the pie slice in the pie; 100% displays the pie slice as far out fromthe rest of the pie as possible.
5. Define which slice to pull out:v To select a slice to pull out using its slice index, under Exploded slice, click
Slice number and type the slice number.The slice number refers to the order of the slice in the legend. In the exampleabove, Camping Equipment has a slice number of 1 and Personal Accessorieshas a slice number of 5.
v To select a slice to pull out using a calculation, under Exploded slice, clickExpression and click the ellipsis (...) beside the Expression box to define anexpression.In the example above, the expression that defines which slices to pull out isas follows: [Query1].[Revenue] < 100000000.
The slice definitions appear in the Exploded Slices list.6. To pull out other slices, repeat steps 3 to 5.
Figure 15. Exploding slices in a pie chart
150 IBM Cognos Report Studio Version 10.2.1: User Guide

Related concepts:“Current Default Charts and Legacy Charts” on page 79IBM Cognos Report Studio has a new default chart technology as of version 10.1.0.“Pie Charts” on page 86Pie charts are useful for highlighting proportions.
Define the Cumulation Line in a Current Default Pareto ChartThe cumulation line on a Pareto chart displays the percentage of the accumulatedtotal of all the columns or bars. For example, if your chart displays revenue byproduct line by year, the cumulation line at the second year's column would be thetotal revenue of the first and second years.
You can customize the appearance of the cumulation line and its data points.
Procedure1. Select the Pareto chart.2. To hide or show the cumulation line, in the Properties pane, under Chart
Annotations, set the Cumulation Line property.
3. To customize the cumulation line, click the cumulation line icon , and inthe Properties pane, under General, set the following properties:v Line Styles defines the cumulation line color, style, and weight.v Cumulation Label defines the label in the legend for the cumulation line.
You can use the default label from the data source or type a custom label.The color and marker shape of the cumulation line still appears in the legendwhen this property is set to None.
v Data Points defines whether to show or hide data points along thecumulation line, whether to show or hide data point borders, the color ofdata point borders, and the data point size and shape.
v Data Labels specifies whether to show or hide the labels for the data pointsalong the cumulation line.
Related concepts:“Current Default Charts and Legacy Charts” on page 79IBM Cognos Report Studio has a new default chart technology as of version 10.1.0.“Pareto Charts” on page 95Pareto charts help you to improve processes by identifying the primary causes ofan event. They rank categories from the most frequent to the least frequent. Thesecharts are frequently used for quality control data, so that you can identify andreduce the primary cause of problems.
Define the Cumulation Line in a Legacy Pareto ChartThe cumulation line on a Pareto chart displays the percentage of the accumulatedtotal of all the columns or bars. For example, if your chart displays revenue byproduct line by year, the cumulation line at the second year's column would be thetotal revenue of the first and second years.
You can customize the appearance of the cumulation line and its data points.
Procedure1. Select the Pareto chart.2. To hide or show the cumulation line, in the Properties pane, under Chart
Annotations, set the Cumulative Line property to Show.
Chapter 6. Charts 151

3. To customize the cumulation line, click the cumulation line icon and inthe Properties pane, under General, set the following properties:v Cumulation Axis displays or hides the cumulation line's axis on the right of
the Pareto chart.v Cumulation Label displays or hides the cumulation line label in the legend.
The color and marker shape of the cumulation line still appears in the legendwhen this property is set to No.
v Line Styles defines the cumulation line color, style, and weight.v Marker Size (pt) defines the size of the markers along the cumulation line in
points.v Marker Shape defines the shape of the markers along the cumulation line.v Values specifies whether to show or hide the values for the markers along
the cumulation line.v Value Location defines the location of the marker values.
Related concepts:“Current Default Charts and Legacy Charts” on page 79IBM Cognos Report Studio has a new default chart technology as of version 10.1.0.“Pareto Charts” on page 95Pareto charts help you to improve processes by identifying the primary causes ofan event. They rank categories from the most frequent to the least frequent. Thesecharts are frequently used for quality control data, so that you can identify andreduce the primary cause of problems.
Insert a Microchart into a CrosstabYou can use microcharts to improve the visualization of data in crosstabs.
Procedure1. Select a crosstab row or column.2. From the right-click menu, click Insert Chart for Row Data or Insert Chart for
Column Data.3. From the Insert Chart dialog box, select a chart and click OK.4. Specify the data to plot in the microchart.
The chart automatically plots the data in the specified rows or columns. Youcan change this if necessary.
Customize a Current Default Bullet ChartAfter you create a bullet chart, you can customize the shape, color, and size of thebullet and target indicators.
By default, the bullet chart includes three gray colored regions in the background.You can edit the colored regions (Properties pane, Colored Regions).
Procedure1. Select the bullet chart object.2. To change the shape, color, and size of the bullet or target, do the following:
a. In the Properties pane, under General, double-click the Bullet Indicatorsproperty.
b. Under Bullet, specify how to show the bullet.
152 IBM Cognos Report Studio Version 10.2.1: User Guide

The Bar width setting specifies the width of the bullet bar as a percentageof the space available. For example, if you specify 50 percent, the bar useshalf of the space available. If you specify 100 percent, the bar uses all theavailable space.
c. Under Target, specify how to show the target.3. To change the chart orientation, in the Properties pane, under General, set the
Chart Orientation property.Related concepts:“Current Default Charts and Legacy Charts” on page 79IBM Cognos Report Studio has a new default chart technology as of version 10.1.0.“Bullet Charts” on page 93Bullet charts are a variation of bar charts. They compare a featured measure (thebullet) to a targeted measure (the target). They also relate the compared measuresagainst colored regions in the background that provide additional qualitativemeasurements, such as good, satisfactory, and poor.Related tasks:“Add Colored Regions in a Current Default Chart” on page 117You can define colored regions in the body of a chart. For example, you can dividethe background of a scatter chart into quadrants and color each quadrant.
Changing the number of hotspots in a chartTo improve performance, you can limit the number of hotspots that are generatedfor Report Studio charts.
About this task
A hotspot in a chart appears when you pause a pointer over it. For example, ahotspot on a drill-down symbol or a tooltip gives details about the column, line, orpie slice. The browser response time increases with the number of hotspots. Whencharts with many members are generated, the hotspots can become an additionalburden for the system resources, which can freeze the browser.
When you limit the number of hotspots, priority is given to items such as axislabels and legend labels before individual graphical elements such as bars, pieslices, and so on. Depending on the number of items in a chart and the setting formaximum number of hotspots, some axis items may have hotspots while other axisitems and all graphical elements do not, or all axis items and some graphicalelements may have hotspots while other graphical elements do not.
The maximum hotspot setting in Report Studio overrides the default set by theadministrator. For more information, see the IBM Cognos Business IntelligenceAdministration and Security Guide.
Procedure1. Select the chart object.2. In the Properties pane, under Miscellaneous, specify a number for the
Maximum Hotspots property.
Create a Drill-up and Drill-down ChartIf you use a dimensionally-modeled data source, you can create a chart that allowsyou to drill down to lower-level data or drill up to higher-level data.
Chapter 6. Charts 153

Drilling up and down allows you to view more general or more detailedinformation on your data within a predefined dimensional hierarchy.
This is an example of a dimensional hierarchy:
Years - Year - Quarter - Month
Before you begin
Before you begin, ensure that you are using a dimensionally-modeled data source.
Procedure1. Open a chart that uses a dimensionally-modeled data source.2. From the Data menu, click Drill Behavior.3. On the Basic tab, under Report output drill capabilities, select the Allow
drill-up and drill-down check box.By default, the system determines which items can be drilled on based on thedimensional structure.On the Basic tab, you can make drilling unavailable for any data item byselecting the item in either the Disable drill-up for box or the Disabledrill-down for box.On the Advanced tab, you can change the drill-up or drill-down behavior forany parameter by selecting the parameter and then choosing one of the desiredbehaviors.
Results
The chart generates links for any item that can be drilled down on.
You can drill down or drill up by right-clicking and choosing the action from thecontext menu. The menu items are unavailable if an item cannot be drilled up ordown on.Related tasks:“Create a Drill-up and Drill-down Report” on page 308You can link groups of data items from different queries so that when you drill upor drill down in one query, the data item also drills up or drills down in the linkedqueries.
Example - Creating Drill-through Access in a Legacy ChartYou are a report author at The Sample Outdoors Company, which sells sportingequipment. You are requested to create a chart that shows the revenue for eachproduct line and allows the reader to drill through from the revenue chart to viewthe product details for any item selected. You create a drill-through report to linktwo reports containing related information. You can then access related or moredetailed information in one report by selecting a value in the chart. You create tworeports: a target list report that contains the details for the item and a source reportthat contains the chart that shows the product line revenue.
154 IBM Cognos Report Studio Version 10.2.1: User Guide

Related concepts:“Current Default Charts and Legacy Charts” on page 79IBM Cognos Report Studio has a new default chart technology as of version 10.1.0.“Set Up Drill-through Access in a Report” on page 423Set up drill-through access in a source report to link two reports containing relatedinformation.
Create the target reportThis example has three parts: creating the target report, creating the source report,and defining the drill behavior.
Procedure1. Open IBM Cognos Report Studio with the GO Data Warehouse (query)
package.2. In the Welcome dialog box, click Create a new report or template.3. In the New dialog box, click List and click OK.
4. From the Source tab , expand Sales and Marketing (query), Sales (query),and Product.
5. Double-click the following data items to add them to the list:v Product line
v Product type
v Product name
v Introduction date
v Product image
Now you must create a filter to use as a drill-through parameter. Adrill-through parameter begins and ends with a question mark (?) symbol.
6. Click the filters button .
7. Click the add button and type the following in the Expression Definitionwindow:[Sales (query)].[Product].[Product line]=?p_PL?
8. Save the report as Product Line Details.
Create the Source ReportThis example has three parts: creating the target report, creating the source report,and defining the drill behavior.
Procedure1. Create a new report.2. In the New dialog box, click Chart and click OK.3. In the Chart group pane, click Column.4. In the Chart type pane, click Column.5. Click OK.
6. From the Source tab , expand Sales and Marketing (query) and then Sales(query).
7. Expand Sales fact and drag Revenue to the Measure (Y-axis) drop zone.
Chapter 6. Charts 155

8. Expand Order method and drag Order method to the Series drop zone.9. Expand Product and drag Product Line to the Categories (X-axis) drop zone.
Define the Drill BehaviorThis example has three parts: creating the target report, creating the source report,and defining the drill behavior.
Procedure1. From the Data menu, click Drill Behavior.2. On the Basic tab, under Report output drill capabilities, select the Allow this
report to be a package-based drill-through source check box and click OK.3. Right-click the chart object and click Drill-Through Definitions.4. Click New Drill Through.5. Under Report, click the ellipsis (...) button.6. Select the Product Line Details report you created and click Open.7. Under Action, click Run the Report.8. Under Format, click HTML.
9. Click the edit button .Any existing drill-through parameters appear. You see the parameter youcreated for Product Line Details.
10. For item p_PL, under Method, click Pass data item value, and under Value,click Product line.
11. Save the chart as Product Revenue.12. Run the report.
Results
The chart shows the product lines as clickable links. When you click a product line,the second report runs for that product line.
Example - Creating and Customizing a Metrics Range Legacy ChartYou are a report author at The Sample Outdoors Company, which sells sportingequipment. You are asked to create a chart that shows revenue compared toplanned revenue by quarter by product line. You also want to highlight revenuesthat were below target.
This example has three parts: creating a metrics chart, customizing it, andcustomizing the legend labels.Related concepts:“Current Default Charts and Legacy Charts” on page 79IBM Cognos Report Studio has a new default chart technology as of version 10.1.0.
Create a Metrics Range ChartThis example has three parts: creating a metrics range chart, customizing it, andcustomizing the chart legend labels.
Procedure1. Open IBM Cognos Report Studio with the GO Data Warehouse (query)
package.
156 IBM Cognos Report Studio Version 10.2.1: User Guide

2. In the Welcome dialog box, click Create a new report or template.3. In the New dialog box, click Chart and click OK.4. In the Chart group pane, click Metrics Range.5. In the Chart type pane, click Column Chart with Range Indicators and click
OK.
6. From the Source tab , expand Sales and Marketing (query), Sales(query), and Sales fact.
7. Drag Revenue to the Actual (Y-axis) drop zone.8. Drag Planned Revenue to the Target (marker) drop zone.9. Expand Time dimension, and drag Quarter to the Categories (X-axis) drop
zone.
10. From the Toolbox tab , drag a query calculation to the Tolerance (marker)drop zone.
11. In the Create Calculation dialog box, type Tolerance.12. In the Expression Definition box, type [Planned revenue] * 0.1 and click OK.13. Run the report and then pause the pointer over each bar to see the revenue
for that quarter.
Customize the ChartThis example has three parts: creating the metrics range chart, customizing it, andcustomizing the legend labels.
Procedure1. Select the chart body.2. In the Properties pane, under Target Markers, ensure that the Performance
Pattern property is set to On Target.3. Double-click the Marker Color property, click Lime and click OK
4. Set the Upper Range Skew (%) property to 0%.This option removes the upper tolerance line. In this example, you do not needto see the upper tolerance line because the revenue is always below theplanned revenue target.
5. Ensure that the Target Range (%) property is set to 50%.This option sets the size of the range around the planned revenue target. Thepercentage you choose is the percentage of the tolerance measure. In thisexample, a 50% target range would display 50% of the tolerance calculationyou created, which is 50% of 10% of planned revenue.
6. Double-click the Target Color property, click Red and click OK.7. Double-click the Target Marker Border Color property, click Green and click
OK.8. Run the report.
Customize the Chart Legend LabelsThis example has three parts: creating the metrics range chart, customizing it, andcustomizing the legend labels.
Procedure1. Under the chart legend select Marker.2. In the Properties pane, under Text Source, double-click the Text property.
Chapter 6. Charts 157

3. Replace the text in the Text dialog box with Planned revenue and click OK.4. Under the chart legend select Tolerance.5. In the Properties pane, under Text Source, double-click the Text property.6. Replace the text in the Text dialog box with Tolerance: 10% of planned
revenue and click OK.7. Under the chart legend, select Range.8. In the Properties pane, under Text Source, double-click the Text property.9. Replace the text in the Text dialog box with Planned revenue range = 50%
and click OK.10. Run the report.
Results
The report now shows customized legend labels for the markers, tolerances, andranges as shown below.
Adding a Metric Studio Diagram to a ReportYou can add IBM Cognos Metric Studio impact or custom diagrams in yourreports. Impact diagrams show cause-and-effect relationships between metrics.Custom diagrams allow you to monitor your metrics using a predefined visualrepresentation, such as a process diagram or strategy map.
The diagrams are added as images within your report.
You can add a diagram in the following ways:v as a static image with the Metric Studio Diagram objectv as a dynamic image from a metrics package
You can also add range indicator charts.
Figure 16. Metrics range chart with customized legend labels for the markers, tolerances, andranges
158 IBM Cognos Report Studio Version 10.2.1: User Guide
You must first create custom diagrams in Metric Studio before you can add themin an IBM Cognos Report Studio report. Impact diagrams are automatically createdin the metrics package. For information about creating Metric Studio diagrams, seethe Metric Studio User Guide.
Add a Static Metric Studio Diagram to a ReportYou insert the image using the diagram identifier from Metric Studio. Theidentifier is converted to an image URL and the image appears in your reportoutput.
Because the diagram is a static image, any changes to the metrics will not appearin the diagram image within your report.
Procedure
1. From the Toolbox tab , drag a Metric Studio Diagram object to the report.2. Select the Metric Studio diagram object.3. In the Properties pane, paste the diagram identifier in the Diagram Identifier
box.Tip: Copy the identifier from Metric Studio (Diagrams tab, View the DiagramIdentifier button in the Actions column).
4. In the Description box, type a description for the diagram.5. If you want to make the diagram image accessible, in the Alternate Text box,
type a description for the image.Related tasks:“Add Alternate Text to Images and Charts” on page 470You can add alternate text for images, maps, and charts to make your reportsaccessible. When a screen reader encounters one of these objects, it reads thealternate text that you added to the object.
Add a Data-driven Metric Studio Diagram to a ReportIf you use a metrics package (which is a relational data source), you can insert aMetric Studio diagram directly from the Toolbox tab. Because you add the diagramfrom the metrics store, any changes to the metrics will appear in the diagramimage when you re-run your report.
If you add diagrams from the Metric History table of the metrics package, onediagram is added for each metric per time history. As a result, your report couldcontain a large number of diagrams. To improve the performance of your report,consider adding a filter to limit the time period.
Procedure1. Open IBM Cognos Report Studio with a metrics package.
2. From the Toolbox tab , insert a diagram query item to the report.3. If you want to make the diagram image accessible, select the image object for
the diagram, and in the Alternate Text box, type a description for the image.Related tasks:“Add Alternate Text to Images and Charts” on page 470You can add alternate text for images, maps, and charts to make your reportsaccessible. When a screen reader encounters one of these objects, it reads thealternate text that you added to the object.
Chapter 6. Charts 159

160 IBM Cognos Report Studio Version 10.2.1: User Guide

Chapter 7. Maps
IBM Cognos Report Studio provides a set of maps that you can use to representtabular data in a spatial context. For example, on a map of the world, countriesand regions can be colored to represent the level of revenue.
Maps are not supported for reports run in Microsoft Excel format.
The Report Studio Map ObjectMaps are most often used to show geographical areas, but they can be used toshow other spatial information, such as a floor plan in a building, seats in anairplane, or parts of the human body.
Maps are similar to crosstabs in the way their data is organized. The display isdifferent, but maps show the intersection of data the same ways as crosstabs; forexample, you can see the revenue for golf equipment in Canada.
A map in IBM Cognos Business Intelligence consists of a collection of layers. Eachlayer contains different information and acts like a transparency that is placed ontop of the map. Each layer adds more information to the map. For example a mapof the world may contain information related to countries or regions on one layerand information related to cities on another level.
IBM Cognos Report Studio maps provide the following three types of layers:v Region layer
Specifies the regions on a map to be differentiated according to values in thedata source. For example, to show the revenue level for each country and regionon a map of the world, choose Country and Region as the region layer and thenspecify that the color of each country and region is based on the revenue valuefor that country and region. Areas can be set up for drilling through to otherreports.
v Point layerSpecifies the points to be placed on a map. The color and size of the points isbased on the data that you select. For example, you choose to show cities aspoints on a map and set the color of each point by revenue and the size of eachpoint by profit. Points can be set up for drilling through to other reports.
© Copyright IBM Corp. 2005, 2013 161
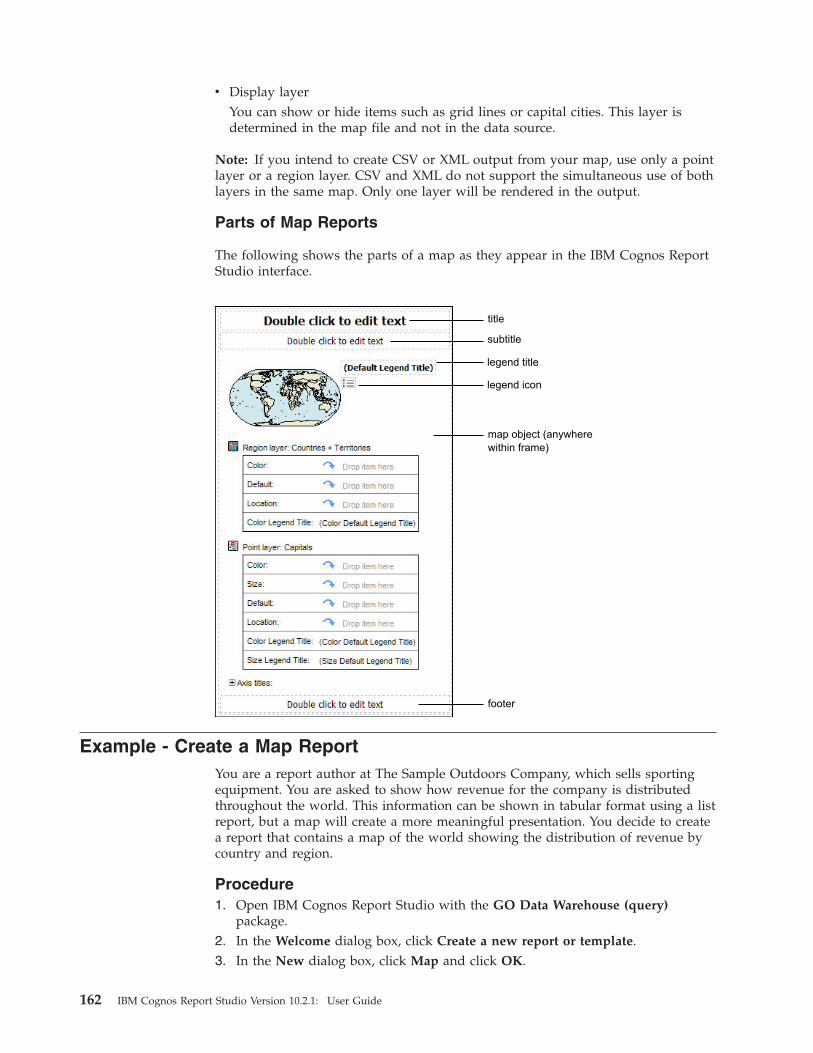
v Display layerYou can show or hide items such as grid lines or capital cities. This layer isdetermined in the map file and not in the data source.
Note: If you intend to create CSV or XML output from your map, use only a pointlayer or a region layer. CSV and XML do not support the simultaneous use of bothlayers in the same map. Only one layer will be rendered in the output.
Parts of Map Reports
The following shows the parts of a map as they appear in the IBM Cognos ReportStudio interface.
Example - Create a Map ReportYou are a report author at The Sample Outdoors Company, which sells sportingequipment. You are asked to show how revenue for the company is distributedthroughout the world. This information can be shown in tabular format using a listreport, but a map will create a more meaningful presentation. You decide to createa report that contains a map of the world showing the distribution of revenue bycountry and region.
Procedure1. Open IBM Cognos Report Studio with the GO Data Warehouse (query)
package.2. In the Welcome dialog box, click Create a new report or template.3. In the New dialog box, click Map and click OK.
162 IBM Cognos Report Studio Version 10.2.1: User Guide

4. In the Choose Map dialog box, in the Maps pane, expand the World folder andclick World.
5. In the Region layers box, click Countries and Regions + Territories.6. In the Point layers box, click None.7. In the Display layers box, click Oceans.
Tip: You can select or deselect multiple display layers by Ctrl+clicking.
Tip: You can return to the Choose Map dialog box at any time bydouble-clicking the map background.
8. Drag the following data items to the map:v Revenue (in Sales fact) to the Color drop zone.v Retailer country and region (in Retailer site) to the Location drop zone.
9. Run the report.
Results
Set Map PropertiesWhen you select an element in a map, you can view its properties in theProperties pane. Some properties are dependent on the existence of otherproperties.
If you are familiar with using conditional variables, you can customize the map tochange appearance or provide information in response to expressions orconditions.
When you change a map property, you usually do not see the change until yourun the report. Changes to the properties of labels and titles are reflectedimmediately.
These are some of the properties you can change in maps. These properties areavailable when you select the map object, unless specified otherwise in the Actionto perform in the Properties pane column.
Figure 17. World map
Chapter 7. Maps 163

Goal Action to perform in the Properties pane
Hide or show the title, subtitle, footer, oraxis title
Under Chart Titles, set the Title, Subtitle,Footer, or Axis Title property.
Hide or show the legendUnder Chart Annotations, set the Legendproperty.
Hide or show region and point layer valuesand labels on the map
Select the region or point layer. Under ChartLabels, double-click the Show Valuesproperty and select the options that youwant.
To hide overlapping labels, select the Hideoverlapping labels check box.
Hide or show display layer labels on themap
Select the display layer. Under Chart Labels,double-click the Show Labels property andselect the option that you want.
To hide overlapping labels, select the Hideoverlapping labels check box.
Hide or show the border around the legend Select the legend icon. Under Box, set theBorders property.
Change the border around the map object Under Box, set the Border property.
Hide or show the tooltipsNote: Some versions of Acrobat Reader donot support tooltips.
Under Chart Labels, set the Tooltipsproperty.
Change the amount of white space aroundthe map
Under Box, set the Padding or Marginproperty.
Change the default colors for all mapelements
Under Color & Background, set theBackground Color, Foreground Color, orFill Effects property.
Change the font and the alignment of textUnder Font & Text, set the Font or RelativeAlignment property.Tip: The 2011 Quarterly Sales Forecastsample report in the GO Sales (analysis)package includes text alignment. For moreinformation about The Sample OutdoorsCompany samples, see Appendix C, “SampleReports and Packages,” on page 507.
Resize the map Under Positioning, set the Size & Overflowproperty.
Change the font for the legend Select the legend icon. Under Font & Text,set the Font property.
Change the format of values in the legend Select the value in the region or point layer.Under Data, set the Data Format property.
Ignore data with no featuresUnder Data, set the Ignore Data with NoFeatures property.
Specify the size of points In the point layer, click the measure in theSize drop zone and set the Minimum Sizeand Maximum Size properties.
Add titles, subtitles, footers, or axis titlesSet the Title, Subtitle, Footer, or Axis Titleproperty.
164 IBM Cognos Report Studio Version 10.2.1: User Guide

Procedure1. Select the map object or map element to change:
v To change general properties, such as size and color, click the map object.v To change specific map elements, such as a layer or title, click the element
itself.
Tip: To cancel a selection, press the Esc key.2. In the Properties pane, set the property value.
An ellipsis (...) button indicates that a dialog box provides further options.
Note: You may have to scroll to see all the properties.
Example - Define Data Values for the Region LayerThe map that you created in the previous topic is not yet linked to a data source.You will now specify the data values from your data source that will determine thecolor of each region.
Procedure
1. From the Source tab , expand Sales and Marketing (query), Sales (query),and Sales fact.
2. Drag Revenue to the Color drop zone.3. Expand Employee by organization.4. Drag Country or Region to the Location drop zone.5. Run the report.
Results
Figure 18. Map showing revenue by country or region
Chapter 7. Maps 165

Match Data Values to Names in the Map FileIf the Ignore Data with No Features property is set to No, then each object that iscalled from the data source must have a matching label in the specified layer of themap file. For example, if your data source has a country and region named UnitedStates and the layer in the map file labels the same country and region USA, thenthere is a mismatch that must be corrected. IBM Cognos Report Studio only makesyou aware of a mismatch if each object in your data source does not have acorresponding label in the map file. If there are extra labels in the map file that donot have a match in the data source, the report will run without an error message.
A mismatch between your data and the map file must be corrected by the reportauthor. It can not be corrected by a consumer of the map report at run time. Thereare two ways to correct a mismatch between your data and the labels in the mapfiles. You can use IBM Cognos Map Manager to edit the labels in the layers of themap file, or you can use the dictionary property to create an alias for eachmismatched object. When you use the dictionary property, it resolves the mismatchonly for a single report, and is not shared with other reports. If you intend tocontinue using a map with the same data source, it is best to edit the map in MapManager so that the labels match the objects in your data source.
For information about using Map Manager, see the Map Manager Installation andUser Guide.
Procedure1. Select the map object.
The title bar of the Properties pane now shows the word Map.2. In the General section of the Properties pane, double-click the Dictionary
property.
3. Click the new button .4. In the Dictionary Entry dialog box, click Search.5. In the Search string box, type a word or part of a word for which to search.
For example, if you are searching for United States, type in part or all of thename.
6. In the Search map layer box, click the layer to search and click Search.7. In the Matching features box, click the label to which to match your data
source and click OK.8. In the Alias box, type the name as it appears in the data source and click OK.
For example, if the country and region in your data source is named USA, typeUSA as the alias.
Note: To find out the name for the objects in your data source, run a listreport. For example, you can run a list report to show the names of all thecountries and regions in your data source. For more information see Chapter 4,“Lists,” on page 63.
Define Data Values for the Point LayerThe Point layer in a map is used to visually represent data for point locations, suchas cities or sales outlets. Both the color and size of points can be based on datafrom your data source.
166 IBM Cognos Report Studio Version 10.2.1: User Guide

Procedure1. Open the Choose Map dialog box:
v When you create a new map report, this dialog box appears automatically.v If you are already in a map report, double-click the map background.
2. In the Point Layers box, select the layer containing the points to show on themap.For example, on a map of the world, you may want the points to representcities.
3. From the Source tab , drag a data item to the Color drop zone in the PointLayer.For example, to have the color of the point based on revenue, drag Revenuefrom the Source tab to the Color drop zone.
4. From the Source tab, drag a data item to the Size drop zone in the PointLayer.
5. From the Source tab, drag a data item to the Location drop zone in the PointLayer.The object must be supported in the map file as a point location. For example,in the World sample map, city is supported as a point location but country orregion is not.
6. If you need to refine the location, drag an object to the Refine Location dropzone.Use this drop zone when there is more than one location with the same name.For example, if you try to run a report with cities in the point layer, and thereis more than one city in your data source with the same name, the report doesnot run. An error message indicates that there are cities in your data sourcewith duplicate names. You can differentiate the cities by using the data objectRegion to refine the location.
Add Colors to the Region or Point LayerYou can add colors for regions or points and specify values to determine whenthose colors are shown.
Procedure1. In the report, click the Region Layer or Point Layer.2. In the Color & Background section of the Properties pane, double-click the
Palette property.
3. Click the new button and click Color.A new color is added to the list of colors.
4. To view the palette colors as a continuous spectrum in which colors blend intoone another, click Continuous Colors.
5. With the new color selected, click Color in the right pane of the dialog box andselect a color.
6. Change the percentage boundaries for the colors.
Tip: To specify absolute values rather than percentages, clear the Percentagecheck box.
Chapter 7. Maps 167

Add a Legend Title to a MapThere are legend titles for the entire legend, for the color of the regions, for thecolor of the points, and for the size of the points.
Procedure
1. If the legend title is not showing, click the legend icon .2. In the General section of the Properties pane, set the Legend Title to Show.3. In the report, double-click the legend title and type the title.4. By default, the legend titles are taken from the object you have selected from
the data source. To change the legend title for the region color, point color, orpoint size, do one of the following:
v From the Toolbox tab , drag a text or calculation object to the ColorLegend Title drop zone in the Region Layer or Point Layer, or the SizeLegend Title drop zone in the Point Layer.
v Double-click the Color Legend Title or Size Legend Title drop zone, tochange from the default legend title, then double-click the drop zone again.In the Text dialog box, type text for the legend title.
Add a Note to a MapYou can add one or more notes, determine their position in the map report, andspecify borders around notes.
Procedure1. Select the map object.2. In the Chart Annotations section of the Properties pane, double-click the
Notes property.
3. Click the new button , and click OK twice.A note icon with the words New Note appears in the report.
4. Click New Note next to the note icon .5. In the Text Source section of the Properties pane, double-click the Text
property.6. Type the text to appear in the note and click OK.
7. In the report, click the note icon .8. In the Positioning section of the Properties pane, type values to specify the
bottom position, left position, height, and width for the note.The location of the note is defined by the number of pixels.
9. Set the Note Border property to specify a border around the note.10. Run the report to view the note.
If necessary, change the position again.
Drill Through to Another Report From a MapYou can link regions or points on a map to another report. For example, on a mapof the world, you can specify that when you click on China, a map of China opens.
168 IBM Cognos Report Studio Version 10.2.1: User Guide

Procedure1. Open the target report.2. From the Data menu, click Filters.
3. On the Detail Filters tab, click the add button .4. In the Available Components box, click the Source or Data Items tab to select
the data item to use.For example, to open the target report when Canada is clicked in the sourcereport, expand Countries and Regions and double-click Country and Region.
5. In the Expression Definition box, type an operator after the data item orselect an operator from the Functions tab and then enter a value.For example, to open the report when Canada is clicked in the source report,the expression would be as follows:[Country and Region]='Canada', where [Country and Region] is the name ofthe data item in the package.
6. Save the target report.7. Open the source report.8. Select the region layer or the point layer.9. In the Data section of the Properties pane, double-click the Map Drills
property.
10. In the Map Drills dialog box, click the new button .11. In the Search string box, type the name of the feature to use for the
drill-through link.For example, to open a report when you click on Canada in the map, searchon all or part of the word Canada.
12. Click Starts with to search for features that start with the search string or clickContains to search for feature names that include the search string.
13. To include a parent layer's name in the results of your search, select a layer inthe Include parent layer list.For example, if you searched for Oslo and you included the parent layer ofCountries and Regions + Territories, the search result would be Oslo(Norway).
14. Click Search.15. Select a feature from Matching features box and click OK
16. In the Drill-Through Definitions dialog box, click the new button.17. Click the ellipsis (...) button beside the Report box, and select the target
report.18. Run the report.
Results
When you click the selected feature in the source report, the target report willopen.
Edit a MapWith IBM Cognos Map Manager you can edit the labels in maps to be consistentwith the object names in your database.
Chapter 7. Maps 169

Administrators and modelers use a Microsoft Windows operating system utilitynamed Map Manager to import maps and update labels for maps in IBM CognosReport Studio. For map features such as country or region and city names,administrators and modelers can define alternative names to provide multilingualversions of text that appears on the map.
For instructions, see the Map Manager Installation and User Guide.
Additional MapsIBM Cognos supplies a set of standard maps that can be used directly with IBMCognos Report Studio as well as IBM Cognos Map Manager.
If you already have proprietary geographic data, you can also create your owncustom .GST files and then import these into Map Manager. To create custom .GSTfiles, you must use an application that produces MapInfo files, such as MapInfoProfessional.
Location IntelligenceSophisticated mapping functionality, known as location intelligence, can be usedfor a broad range of business applications that extend the mapping capability ofIBM Cognos Business Intelligence. MapInfo provides solutions that can be directlyintegrated with IBM Cognos BI. These include the ability to dynamically creategeographic filters and custom areas for aggregating data for ad-hoc analysis.Examples of business applications of location intelligence are listed in thefollowing table.
Business application Benefits
Target marketing Learn who your best clients are and findmore like them.
Network optimization and site locationanalysis
Put stores near your customers and look forgaps in geographical coverage.
Routing and work force optimization Reduce the number of trucks you need andmake your drivers more efficient.
e-government Provide citizens with self-serviceopportunities.
Sales territory creation Create balanced sales territories.
Economic development Plan the development of your community.
Communications network planning Avoid costly mistakes by putting cell towersin the right locations. Identify the locationsof clients in your service area.
You can contact MapInfo for both data and location intelligence solutions throughtheir Web site: http://www.mapinfo.com.
170 IBM Cognos Report Studio Version 10.2.1: User Guide

Chapter 8. Active Reports
You can use IBM Cognos Report Studio to create active reports. IBM CognosActive Report is a report output type that provides a highly interactive andeasy-to-use managed report. Active reports are built for business users, allowingthem to explore their data and derive additional insight.
Active reports make business intelligence easier for the casual user. Report authorsbuild reports targeted at their users' needs, keeping the user experience simple andengaging. Active reports can be consumed by users who are offline, making theman ideal solution for remote users such as the sales force.
Active reports are an extension of the traditional IBM Cognos report. You canleverage existing reports and convert them to active reports by adding interactivebehavior, providing end users with an easy-to-consume interface.
Like existing IBM Cognos reports, you can execute active reports from IBM CognosConnection as well as schedule and burst them to users.
You build active reports with the same objects that you use to build other reporttypes. However, there are objects that are specific to active reports. These objectsfall into two categories:v active report controlsv active report variables
For tips about building active reports, see the Business analytics proven practicespage (http://www.ibm.com/developerworks/analytics/practices.html).
Note: Cognos Active Report does not support JavaScript.
Active Report ControlsYou use active report controls to create the layout of an active report as well asfilter, sort, and navigate through data in the report.
Layout
The following controls are used to build the layout of an active report:v Tab controls, which are used for grouping similar report items.v Decks of cards, which are used for layering report items.v Hiding or showing list columns, which allows users to control the data they see
by using check boxes.v Row numbers, which show the number of rows of data in a control.
Filtering and Sorting
To help report authors deliver the content in the most consumable way possible,IBM Cognos Report Studio provides several new filtering controls:v List and drop-down list controlsv Interactions with charts
© Copyright IBM Corp. 2005, 2013 171

For example, clicking a category in a chart filters the data in a list.v Radial buttonsv Check boxesv Toggle buttonsv Push button controls
Navigation
To help users navigate through data in a report, report authors can add thefollowing controls:v Iteratorsv Sliders
Data Containers
Data containers, such as lists, crosstabs, charts, visualizations, and repeater tables,are also considered controls in an active report, as you can add interactivebehavior to them.Related concepts:“Adding Controls to a Report” on page 185IBM Cognos Active Report offers several active report controls. For many controls,two different versions are available, a static version and a data-driven version.
Active Report VariablesActive report variables work in conjunction with active report controls to addinteractivity to a report.
Actions performed on a control, such as selecting an item in a control or selecting acontrol itself, can set the value of a variable. In turn, controls can respond tochanges in the value of a variable, such as filtering data in a control.Related tasks:“Create and Manage Active Report Variables” on page 184Create active report variables to allow controls in a report to interact with eachother. Active report variables pass information from one control to another control.
Convert an Existing Report to an Active ReportYou can leverage existing reports by converting them to active reports.
Procedure1. Open the report that you want to convert.2. From the File menu, click Convert to Active Report.
Results
IBM Cognos Active Report menu items, objects, and properties become available inIBM Cognos Report Studio. Objects in the report that are not supported in activereports, such as prompt controls in report pages, are removed.
172 IBM Cognos Report Studio Version 10.2.1: User Guide

Specify Active Report PropertiesYou can specify properties for active reports, such as the text that appears in thebrowser window title bar, the maximum number of rows that a report can contain,and an access code that users must enter to view a report.
Procedure1. From the File menu, click Active Report Properties.2. To specify the title that will appear in the browser window title bar when the
report is viewed, under Window Title, type the title that you want.3. If you want to specify the window title in other languages, do the following:
v Under Window Title, click the ellipsis button (...).
v Click the add button .v Select the languages that you want.v In the Language column, click one of the languages that you selected.
v Click the edit button and type the window title for that language.4. In the Window Startup Size box, choose among the available options to specify
the size of the browser window when an active report is viewed.5. In the Maximum query rows box, specify the maximum number of rows of
data that the report can contain.If the number of rows of data returned when the report is run exceeds thisvalue, an error message appears, and users will not be able to view the report.
6. To specify an access code that users will have to enter to view the report, enterthe code in the Access code box.You can use any Unicode character in the access code, and there is no limit tothe number of characters an access code can contain.The access code will not be hidden or treated like a password when entered (*will not appear as the code is entered). Users will have three attempts to enterthe correct code, after which the active report will shut down. To try again,users have to reopen report.
Note: The access code is a tool to help prevent the unauthorized consumptionof an active report within an organization. It is not an enterprise grade securitysolution.
7. If you do not want to compress the MHT file that is produced when the activereport is run, clear the Compress the active report output check box.Compressing the output reduces the size of MHT files so that active reports cansupport more data and load faster in browsers and mobile devices.
8. To support pinch-to-zoom gestures when the active report is viewed on amobile device, select the Scalable check box.
9. To reuse the Window Startup Size and Maximum query rows properties whenyou create other active reports, select the Use as default for new active reportscheck box.
Extensible visualizationsYou can use extensible client-side visualizations in IBM Cognos Active Report tovisualize data.
Chapter 8. Active Reports 173

Visualizations must be imported into IBM Cognos Administration. TheVisualization Gallery is empty until your administrator imports the visualizationsand makes them available to you. Your administrator can set permissions to restrictaccess to only certain report authors.
The visualizations come from the site AnalyticsZone (https://www.analyticszone.com). For more information about administration andvisualizations, see the IBM Cognos Business Intelligence Administration and SecurityGuide.
Because visualizations are extensible, they can be customized by an author withthe necessary skills. Because they are client-side, they can be run when notconnected to the web. You can also use visualizations on mobile devices.
Some of the visualizations that you can add to your active reports are treemaps,heatmaps, packed bubble visualizations, and network diagrams.
Extensible visualizations support all Active Report interactivity. For example, youcan use Active Report controls to dynamically filter visualizations to view only thedata that you want to analyze. You can also set properties that are available foreach visualization type. These properties are determined by the visualizationdefinition. Typically, you can set such properties as width, height, animation effect,and fixed-axis scaling.
For more information about visualizations and their uses, go to Many Eyes®
(http://www-958.ibm.com).
Attention: If you use Microsoft Internet Explorer to view visualizations, you musthave Microsoft Silverlight 5 installed on your computer. Firefox or iPad users donot need Silverlight.
Adding a visualization to an active reportYou can add a visualization to an active report to efficiently represent your data.
Before you begin
Your administrator must make the visualizations available in the VisualizationGallery.
If you use Microsoft Internet Explorer to view visualizations, you must haveMicrosoft Silverlight 5 installed on your computer. Firefox or iPad users do notneed Silverlight.
About this task
You add data to a visualization by inserting data items in drop zones.Visualizations will not run until all of the required drop zones contain data items.When all the required drop zones contain data items, additional drop zones appearfor extra categories or values. You can use extra categories and extra values to filterdata or set variables. Extra items are not visible in the visualization.
When working with dimensional data sources, if the visualization does not containa measure against which to plot data, you must provide one. For example, if youadd a single member to the values drop zone, such as '2012', the default measuredrop zone appears in which you must insert a measure.
174 IBM Cognos Report Studio Version 10.2.1: User Guide

Attention: The supported properties for a visualization are determined by thevisualization definition.
Procedure1. Create a new active report or open an existing active report.
2. From the Toolbox tab , drag a Visualization icon to the work area.3. From the Visualization Gallery, select a visualization and click OK.
4. From the Source tab , drag items to the appropriate location in the datacontainer.
5. Run the visualization.
Adding a treemap visualizationYou can use a treemap visualization in IBM Cognos Active Report to identifypatterns and exceptions.
Treemaps show relationships among large numbers of components by using sizeand color coding in a set of nested rectangles.
A treemap that is colored by category identifies the level 1 category by color. Thesizes of the rectangles represent the values. In a treemap that is colored by value,the sizes of the rectangles represent one of the values and the color represents asecond set of values.
Attention: The supported properties for a visualization are determined by thevisualization definition.
Chapter 8. Active Reports 175

Before you begin
Your administrator must make the visualizations available in the VisualizationGallery.
If you use Microsoft Internet Explorer to view visualizations, you must haveMicrosoft Silverlight 5 installed on your computer. Firefox or iPad users do notneed Silverlight.
About this task
You add data to a visualization by inserting data items in drop zones.Visualizations will not run until all of the required drop zones contain data items.When all the required drop zones contain data items, additional drop zones appearfor extra categories or values. You can use extra categories and extra values to filterdata or set variables. Extra items are not visible in the visualization.
When working with dimensional data sources, if the visualization does not containa measure against which to plot data, you must provide one. For example, if youadd a single member to the values drop zone, such as '2012', the default measuredrop zone appears in which you must insert a measure.
Attention: The supported properties for a visualization are determined by thevisualization definition.
Figure 19. A heatmap visualization
176 IBM Cognos Report Studio Version 10.2.1: User Guide

Procedure
1. From the Toolbox tab , drag a Visualization icon to the work area.2. From the Visualization Gallery, select a Treemap icon:
v If you are plotting a single measure, select a treemap colored by category.v If you are plotting two measures, select a treemap colored by value.
3. Click OK.
4. From the Source tab , drag items to the appropriate location in the datacontainer:a. Under Values, drag items to define the size and color of the rectangles to
Size and Color.b. Under Categories, drag items to the different levels. Each level represents
the category within which the subsequent levels are nested. For example,the levels might be Year, Product Line, and Product Type.
5. Add any active controls that you want and run the visualization.
Adding a heatmap visualizationHeatmaps in IBM Cognos Active Report use colors to represent the individualvalues that are contained in a matrix.
Similar to treemaps, you can use heatmaps to identify patterns and exceptions.Unlike treemaps, the sizes of the rectangles are not proportionate to values.
Before you begin
Your administrator must make the visualizations available in the VisualizationGallery.
Figure 20. A heatmap visualization
Chapter 8. Active Reports 177

If you use Microsoft Internet Explorer to view visualizations, you must haveMicrosoft Silverlight 5 installed on your computer. Firefox or iPad users do notneed Silverlight.
About this task
You add data to a visualization by inserting data items in drop zones.Visualizations will not run until all of the required drop zones contain data items.When all the required drop zones contain data items, additional drop zones appearfor extra categories or values. You can use extra categories and extra values to filterdata or set variables. Extra items are not visible in the visualization.
When working with dimensional data sources, if the visualization does not containa measure against which to plot data, you must provide one. For example, if youadd a single member to the values drop zone, such as '2012', the default measuredrop zone appears in which you must insert a measure.
Attention: The supported properties for a visualization are determined by thevisualization definition.
Procedure
1. From the Toolbox tab , drag a Visualization icon to the work area.2. From the Visualization Gallery, select the Heatmap icon and click OK.
3. From the Source tab , drag items to the appropriate location in the datacontainer:a. Under Values, drag a measure or a single value to define the color shading
of the rectangles.b. Under Categories, drag items to the Y Category and X Category.
Tip: Ensure that the items in the Y Category and X Category come fromdifferent dimensions.
4. Add any active controls that you want and run the visualization.
Creating a packed bubble visualizationA packed bubble visualization in IBM Cognos Active Report is similar to a bubblechart in which the bubbles are tightly packed rather than spread over a grid. Youcan use a packed bubble visualization to display a large amount of data in a smallspace.
178 IBM Cognos Report Studio Version 10.2.1: User Guide

Before you begin
Your administrator must make the visualizations available in the VisualizationGallery.
If you use Microsoft Internet Explorer to view visualizations, you must haveMicrosoft Silverlight 5 installed on your computer. Firefox or iPad users do notneed Silverlight.
About this task
You add data to a visualization by inserting data items in drop zones.Visualizations will not run until all of the required drop zones contain data items.When all the required drop zones contain data items, additional drop zones appearfor extra categories or values. You can use extra categories and extra values to filterdata or set variables. Extra items are not visible in the visualization.
When you work with dimensional data sources, if the visualization does notcontain a measure against which to plot data, you must provide one. For example,if you add a single member to the values drop zone, such as '2012', the defaultmeasure drop zone appears in which you must insert a measure.
Attention: The supported properties for a visualization are determined by thevisualization definition.
Procedure
1. From the Toolbox tab , drag a Visualization icon to the work area.2. From the Visualization Gallery, select the Packed Bubble icon and click OK.
Figure 21. A packed bubble visualization
Chapter 8. Active Reports 179

3. From the Source tab , drag items to the appropriate location in the datacontainer:a. Drag a measure or a single value to the data container, under Values.b. Under Categories, drag an item to plot as the bubbles.c. Under Series, drag an item to apply as a category. Each item in the category
gets a different color from the color palette.4. Add any active controls that you want and run the visualization.
Adding a network diagramYou can create a network diagram in IBM Cognos Active Report. The nodes datacontainer defines the items that you want to link together. The links data containerdefines relationship between the items that you want to link together.
Before you begin
Network node drop zones only take numeric data items. Not all data sources havethe appropriate data to create a network diagram.
Your administrator must make the visualizations available in the VisualizationGallery.
If you use Microsoft Internet Explorer to view visualizations, you must haveMicrosoft Silverlight 5 installed on your computer. Firefox or iPad users do notneed Silverlight.
About this task
You add data to a visualization by inserting data items in drop zones.Visualizations will not run until all of the required drop zones contain data items.When all the required drop zones contain data items, additional drop zones appearfor extra categories or values. You can use extra categories and extra values to filterdata or set variables. Extra items are not visible in the visualization.
Figure 22. A network diagram in an active report showing employees by region
180 IBM Cognos Report Studio Version 10.2.1: User Guide

When working with dimensional data sources, if the visualization does not containa measure against which to plot data, you must provide one. For example, if youadd a single member to the values drop zone, such as '2012', the default measuredrop zone appears in which you must insert a measure.
Attention: The supported properties for a visualization are determined by thevisualization definition.
Procedure
1. From the Toolbox tab , drag a Visualization icon to the work area.2. From the Visualization Gallery, select the Network diagram icon and click OK.
3. From the Source tab , drag items to the appropriate location in the datacontainer:a. In the Nodes1 data container, drag items to Node (Numeric) and Name.
The nodes data container defines the items that you want to link together,such as Employees, defined by an employee code.
b. In the Links1 data container, drag items to From node (Numeric) and Tonode (Numeric). The links data container defines relationship between theitems that you want to link together, such as Employees and Managers.
4. Add any active controls that you want and run the visualization.Related tasks:“Example - Network diagram visualization” on page 209You are a report author at The Sample Outdoors Company, which sells sportingequipment. You are requested to create a visualization in IBM Cognos ActiveReport that shows the hierarchies of employee by region.
Resizing a visualizationYou can change the size of a visualization in IBM Cognos Active Report.
Procedure1. Click and drag the lower right corner of the visualization.2. To maintain the aspect ratio, press the Shift key while you resize the
visualization.You can view the changing height and width of the resized visualization in theProperties pane, under Positioning.
Changing the nesting orderIn IBM Cognos Active Report, you can change the nesting order so that extra itemsare ordered properly in the query. If the items are not ordered properly in thequery, the report might not run.
Extra items are data items that are used for filtering or setting variables. Theseitems are not visible in the visualization. By default, extra categories are nestedbelow other categories, so as not to affect sorting. However, if the extra categoriesare from the same dimension as a category, they must be in the correct hierarchicalorder: Years, Quarters, and Months. You can change the nesting order.
For example, you have Quarters and Months as categories. You then add Years asan extra category. You add an Active Report control and connect to Years as a filter.You might have to change the nesting order of the data items for the report to run.
Chapter 8. Active Reports 181

Procedure1. Select the data container that contains the data set in which you want to
change the nesting order.2. From the Properties pane, under General, click Change Nesting Order.3. In the Change Nesting Order window, select the extra category and use the
arrow icon to reorder it.
Tip: You can click Show Data Container to view the new nesting order whenthe report is run.
Populating a visualization with data from the visualizationdefinition
In IBM Cognos Active Report, you can populate a visualization with data that isspecified in the visualization definition instead of adding data items from apackage.
About this task
You can use data that is specified in the visualization definition to test avisualization before you add your own data. Using data from the visualizationdefinition is also a way to bring external data into a visualization.
Procedure1. Select the visualization.2. In the Properties pane, double-click the Use Embedded Data property.3. Select the check box of the data container for which you want to use data that
is defined in the visualization specification.
Results
The data container is removed from the visualization. The data container is notrequired when the visualization is using data from the visualization definition.
Specifying the range values that are displayedSpecify the values that you want to display in a visualization in IBM CognosActive Report. For example, you can specify the range of values that is displayedwhen users select values in a control that is connected to a visualization.
About this task
You can specify the range of values and categorical data that is displayed invisualizations.
To control the range of values that is displayed, the following choices are availableto calculate the minimum and maximum values of the range.v All data
With this choice, minimum and maximum values are calculated to span thevalues of all Active Report controls that are connected to the visualization.
v Filtered dataWith this choice, minimum and maximum values are calculated from values thatusers select in Active Report controls that are connected to the visualization.
v Specified values
182 IBM Cognos Report Studio Version 10.2.1: User Guide

With this choice, you specify the minimum and maximum values that you wantto display in the visualization.
Note: The minimum and maximum values that are displayed in thevisualization might differ from the values that you specify. For example, if youspecify a range of 0 to 195, IBM Cognos BI might display a range of 0 to 200.
To specify the categorical data that is displayed, the following choices are available.v All data
With this choice, all categorical data that spans the values of all Active Reportcontrols that are connected to the visualization are displayed.
v Filtered dataWith this choice, only the filtered data is shown in the legend and on axes.
The choice that you make for displaying categorical data can affect elements in thevisualization, such as the legend and axes. For example, when all data is selected,all legend items are always shown in the visualization, and the color of eachlegend item stays the same in the visualization. When a category is inserted on anaxis, space is reserved on the axis for all data. When filtered data is selected, thecolor of each legend item can change when users select different values in a controlthat is linked to the visualization. When a category is inserted on an axis, the axisshows only the values that are selected in the control.
Procedure1. To specify the categorical data that is displayed, follow these steps.
a. In the visualization data container, select the category that you want.b. In the Properties pane, click the Category Range property and select the
choice that you want.2. To specify the range of values that is displayed, follow these steps.
a. In the visualization data container, click the data item in the Values sectionthat represents the values in the visualization. For example, in a packedbubble visualization, click the data item that is inserted in the Size box.
b. In the Properties pane, double-click the Value Range property.c. In the Range type box, click one of the available choices.d. If you clicked All data or Filtered data and you want the range of values to
include zero, select the Range includes zero check box.e. If you clicked Specified, type the minimum and maximum values of the
range in the Minimum and Maximum boxes.
Updating visualizationsUpdate visualizations in IBM Cognos Active Report when a change was made tothe visualization definition.
About this task
If any part of a visualization is invalidated by changes that were made to thevisualization definition, the invalidated part is removed.
If a new property or field was added to the visualization definition, you mustdelete and recreate the visualization in the report.
Chapter 8. Active Reports 183
If you do not update visualizations when the visualization definition is changed,the old visualization definition is used when you run the report.
Procedure1. Open the report that contains the visualizations that you want to update.2. Click Tools > Update Visualizations.
Adding Interactivity to a ReportYou create an active report by adding interactive behavior to controls in the report.Adding interactive behavior links controls to each other, allowing an actionperformed on a control to change the state of another control.
Create and Manage Active Report VariablesCreate active report variables to allow controls in a report to interact with eachother. Active report variables pass information from one control to another control.
About this task
You can also create active report variables when you define connections betweencontrols. However, you may want to modify these variables, such as changing thename or defining default values.
In addition, active report variables allow active reports inserted in a workspace inIBM Cognos Workspace to interact with each other. For example, selecting aproduct line in one active report causes another active report to show the data forthe selected product line. In addition, variables allow check boxes and sliders in aworkspace in Cognos Workspace to drive active reports in the workspace.
To work in Cognos Workspace, active report variables must meet the followingcriteria:v The variables must be public.
When you make a public variable, the variable can be consumed in other IBMCognos products.
v For active reports to listen to each other in a workspace, each report must have apublic variable with the same name.
v For a Cognos Workspace slider to drive an active report, a range variable mustbe defined in the active report.The data item of the slider and the range variable in the active report must havethe same name.Two variables are used to define the minimum and maximum values of therange variable. The two variables are used to define the minimum andmaximum values of the slider.
Procedure
1. Click the Active Report Variables tab .2. Create a variable by following these steps:
a. Click Create a New Variable.b. In the Name box, type the name of the variable.c. Click the Data Type drop-down menu and click the type of variable that
you want to create.
184 IBM Cognos Report Studio Version 10.2.1: User Guide

d. To make the variable public, select the Public (External) check box.e. If you want to specify a default value for the variable, click Set Default
Value(s) and define or specify the values that you want.To define your own default values, in the Variable Values Source list, click
Enter Value(s), and then click the new icon .To specify default values that come from a data item in a control, in theVariable Values Source list, click Select Value(s). Specify the control andthe data item from which you want to select default values, and then selectthe values that you want from the Values box.
Tip: Define multiple default values when you want more than one itemselected in a control that allows multiple selections, such as a check boxgroup.
3. To modify an existing variable, right-click the variable and click Edit Variable.4. To add a default value, click Set Default Value(s).
To change a default value, click the name of the current default value specifiedfor the variable.
5. Create a range variable by following these steps:a. Create the variables that will define the minimum and maximum values of
the Cognos Workspace slider.The variables must have the number data type.
Tip: Range variables are automatically set as public variables. Do not makethe variables that are used to define the minimum and maximum values ofthe slider public.
b. Click Manage Ranges.
c. Click the new icon .d. In the Name box, type the name of the range variable.e. Click the Minimum Variable list and select the variable that will be used to
set the minimum value of the slider.f. Click the Maximum Variable list and select the variable that will be used to
set the maximum value of the slider, and then click OK twice.
Note: If you later delete the minimum or maximum variable, the rangevariable is also deleted.
Related tasks:“Define a Connection Between Controls” on page 192Define a connection between controls to link them together. When you linkcontrols, an action performed on one control affects the behavior of the othercontrol.
Adding Controls to a ReportIBM Cognos Active Report offers several active report controls. For many controls,two different versions are available, a static version and a data-driven version.
Use the static version of a control when you want to manually define the valuesthat the control can contain. Use the data-driven version of a control when youwant the values that the control can contain to come from a data item. Controls are
available on the Toolbox tab .
Chapter 8. Active Reports 185

Tip: To view only toolbox items that are specific to active reports, right-clickanywhere in the Toolbox tab and click Active Report Toolbox Items.
When you add a control to an active report, you can convert the control to anothertype of control that is compatible by right-clicking the control and selectingConvert Control. For example, you can convert a data drop-down list control to adata iterator control.
Variable Text Items
Use variable text items to insert active report variables in a report. Variable textitems are useful to show the value of a variable when an item in another control isselected. For example, you can use a variable text item as a title for a list that islinked to a drop-down list control. When an item is selected from the drop-downlist, the item appears as the title of the list.
Row numbers
The active report row number tool adds row numbers that reflectthe visible row number in the report. This is different from the report row numbertool, which reflects the server calculated row number.
Repeater tables
Use static repeater tables and data repeater tables to build a repeating structure ofcontent. Repeater table controls allow you to create button bars or grids of customcontent to control the content that appears in other controls. In data repeater tablecontrols, the content that appears in the repeater table is driven by a data item thatyou insert in the control.
The following image shows a static repeater table when it is inserted in an activereport.
The data repeater table is the repeater table data container that is available for allreport types. The static repeater table is available in the Toolbox tab only whenyou are authoring an active report.
Decks and Data Decks
Use decks and data decks to show different objects and different data respectivelybased on a selection in another control. For example, in a deck, clicking a radiobutton in a radio button group control shows a list object while clicking a differentradio button shows a chart object.
The following image shows a deck control when it is inserted in an active report.
Figure 23. Static repeater table control
186 IBM Cognos Report Studio Version 10.2.1: User Guide

Decks are composed of cards. In static decks, you define the number of cards inthe deck and you insert the objects that you want in each card. This allows you tocreate cards that can contain different objects, such as pie chart in one card and acrosstab in another card. In data decks, the cards are defined by a data container ordata items inserted in the deck, and a data item determines which card appears.
Tab Controls and Data Tab Controls
Use tab controls and data tab controls to define multiple pages for the same area ofa report. In data tab controls, the tabs are driven by a data item that you insert inthe control.
The following image shows a tab control when it is inserted in an active report.
Button Bars and Data Button Bars
Use button bars and data button bars to add a group of push buttons. In databutton bars, the buttons are driven by a data item that you insert in the control.
The following image shows a button bar control when it is inserted in an activereport.
In reports, users can click only one button at a time.
Toggle Button Bars and Data Toggle Button Bars
Use toggle button bars and data toggle button bars to add a group of buttons thatchange appearance when pressed. In data toggle button bars, the buttons aredriven by a data item that you insert in the control.
The following image shows a toggle button bar control when it is inserted in anactive report.
In reports, users can click one or more buttons simultaneously.
Figure 24. Deck control
Figure 25. Tab control
Figure 26. Button bar control
Figure 27. Toggle button bar control
Chapter 8. Active Reports 187

Radio Button Groups and Data Radio Button Groups
Use radio button groups and data radio button groups to group a set of buttonsthat have a common purpose. In data radio button groups, the radio buttons aredriven by a data item that you insert in the control.
The following image shows a radio button group control when it is inserted in anactive report.
In reports, users can click only one radio button at a time.
Check Box Groups and Data Check Box Groups
Use check box groups and data check box groups to group a set of check boxes. Indata check box groups, the check boxes are driven by a data item that you insert inthe control.
The following image shows a check box group control when it is inserted in anactive report.
In reports, users can select one or more check boxes simultaneously.
Drop-Down Lists and Data Drop-Down Lists
Use drop-down lists and data drop-down lists to provide a list of items that userscan choose from. In data drop-down lists, the lists are driven by a data item thatyou insert in the control.
The following image shows a drop-down list control when it is inserted in anactive report.
In reports, users can select only one item at a time.
List Boxes and Data List Boxes
Use list boxes and data list boxes to provide a list of items that users can choosefrom. In data list boxes, the lists are driven by a data item that you insert in thecontrol.
The following image shows a list box control when it is inserted in an activereport.
Figure 28. Radio button group control
Figure 29. Check box group control
Figure 30. Drop-down list control
188 IBM Cognos Report Studio Version 10.2.1: User Guide

In reports, users can select one or more items in a list box.
Iterators and data iterators
Use these controls to allow users to navigate or filter values in a control by clickingbuttons such as previous and next. In data iterators, the iterations are driven by adata item that you insert in the control.
The following image shows an iterator control when it is inserted in an activereport.
Discrete values sliders, continuous values sliders, and datadiscrete values sliders
These controls allow users to navigate or filter data using a slider bar. Discrete anddata discrete values sliders allow users to slide between individual values, such asmonths. In data discrete values sliders, the values are driven by a data item thatyou insert in the control. With continuous values sliders, users slide throughnumeric values between minimum and maximum values that you define, such as 0and 100.
The following image shows a discrete value slider control when it is inserted in anactive report.
Buttons
Use buttons to add individual push buttons to a report.
The following image shows a button control when it is inserted in an active report.
Figure 31. List box control
Figure 32. Iterator control
Figure 33. Discrete values slider control
Chapter 8. Active Reports 189

Data Containers
Lists, crosstabs, charts, maps, visualizations, and repeater tables are also controls inan active report, as you can add interactive behavior to them.
Add Data to a ControlFor every control that you insert in a report, you must add the data that you wantto appear in the control.
Add data to a data-driven controlFor data-driven controls, you insert data items from the package.
Procedure
1. On the Source tab , drag query subjects or query items to the control.2. To add an image to the data in the control, drag the appropriate data item to
the Icon box.3. If the data that will appear in the control depends on other data that you do
not want to show, drag the appropriate data item to the Extra Items box.For example, you add Product type to a data list box control and you want tofilter the product types that appear in the control based on a product lineselected in another control. To filter the data, you must drag Product line to theExtra Items box.
Tip: IBM Cognos Report Studio can automatically copy data items from othercontrols when you create connections between controls.
4. If the control is a data deck and you want to create a default card that willappear when no other card matches the variable value passed to the deck, inthe Properties pane, click Yes for the Default Card property. Then click the No
Data Contents tab for the deck and insert the objects that you want toappear on the default card.
Related tasks:“Define a Connection Between Controls” on page 192Define a connection between controls to link them together. When you linkcontrols, an action performed on one control affects the behavior of the othercontrol.
Add data to a static controlFor static value driven controls, you manually define the data in a data table.
Procedure
1. In the report, click the definition icon of the control.
Tip: The definition icon is visible only when the visual aid Show InteractiveObject Controls is enabled.
2. To add a new object, such as a card in a deck or a button in a button bar, underData Table, click the new button.
Figure 34. Button control
190 IBM Cognos Report Studio Version 10.2.1: User Guide

3. In Data Table, define the values that you want to appear in the control.Values are organized by data item. In addition to the default data item (Label)and values provided, you can create your own data items and values. Forexample, to add an icon to each value, you must create a data item for theicons.
v To define a new data item, click the new button and type the name ofthe data item that you want to create.
v Click inside each table row and type the name of the value.v To add translations for the values, to support users in multiple languages,
click the ellipsis (...) button, choose the languages that you want to support
by clicking the add button , and type the translated text for eachlanguage added.
v If you created new data items, in the Definition box, click the Labeldrop-down list and select the data item that you want to use in the control.
v To add an icon to each value, select the Icon check box, click the drop-downlist, and select the data item that contains the icons that you want to use.You cannot add an icon to values in static decks and discrete values sliders.To add an icon to values in a static repeater table, insert the Image objectfrom the Toolbox. Then specify the data item for the icons by referencing thedata item in the Properties pane.
4. Optional: If you want to copy all data values to another static control, click the
copy control definition icon .After you have copied the data values of the control, click the definition icon of
another static control, and then click the paste control definition icon tocopy the data values.
Tip: You can also drag data items from one control and drop them in anothercontrol. This action moves the data item from one control to another controlinstead of copying the item. You can drag and drop data items only to staticcontrols that can contain objects, such as a deck, tab control, and repeater table.In addition, the data table of the target control must contain a data item withthe same name as the data item you are moving, such as Label.
5. If the control is a deck, click the left and right arrows to navigate to each cardof the deck and insert the objects that you want to appear on each card.To create a default card that will appear when no other card matches thevariable value passed to the deck, in the Properties pane, click Yes for the
Default Card property. Then click the No Data Contents tab for thedeck and insert the objects that you want to appear on the default card.
Related tasks:“Referencing data items defined in a static control”If you insert an object in a static control, such as an image in a static repeater table,you can use a data item in the control to populate the object.
Referencing data items defined in a static controlIf you insert an object in a static control, such as an image in a static repeater table,you can use a data item in the control to populate the object.
Chapter 8. Active Reports 191

Before you begin
You must create the data item in the data table of the control before you canreference the item.
About this task
You can reference data items only for text items, images, hyperlinks, and HTMLitems inserted in decks, tab controls, and repeater tables.
Procedure1. In the static control, click the object for which you want to reference a data
item.2. In the Properties pane, click the Source Type property and choose Control
Data Item Value. The Control Data Item Value property appears below theSource Type property.
3. Click the Control Data Item Value property and select the data item that youwant to reference.
Tip: If the object is a hyperlink, you can specify the data item to be used topopulate the hyperlink text as well as the data item to be used to populate theURL of each link.
Related tasks:“Add data to a static control” on page 190For static value driven controls, you manually define the data in a data table.
Define a Connection Between ControlsDefine a connection between controls to link them together. When you linkcontrols, an action performed on one control affects the behavior of the othercontrol.
Procedure
1. Click the create a new connection icon of a control that you added to thereport.
Tip: The create a new connection icon is visible only when the visual aid ShowInteractive Object Controls is enabled.
2. In the Source Control drop-down list, select the source control for which youwant to define a connection.
3. Click the Data Item drop-down list under the source control and select the dataitem that will drive the behavior of the target control.
4. In the Target Control drop-down list, select the target control for which youwant to define a connection.If the target control is a visualization, select a visualization data container.
5. Click the Data Item drop-down list under the target control and select the dataitem that will determine what appears in the target control.If the data item that you want to use is not in the query of the target control,and the source control is a data-driven control, select Copy Data Item fromSource to copy the source data item specified in the previous step to the targetcontrol query. If the source control is a static control, select Use SourceDefinition.
192 IBM Cognos Report Studio Version 10.2.1: User Guide

If the target control is a data container, the copied data item appears shaded inthe container to indicate that the column visibility property for the item is setto Hidden.
6. Click the Behavior drop-down list between the source and target controls andspecify the type of relationship that you want to define between the twocontrols:v To select data in the target control based on what will be selected in the
source control, click Select.v To filter data in the target control based on what will be selected in the
source control, select Filter.7. Below the Behavior area, click the active variable drop-down list and choose to
create a new variable for the connection or use an existing variable.
Tip: If there are no variables defined in the report, you cannot click the activevariable drop-down list.a. If you create a new variable, type a name for the variable and specify its
data type. You can also specify its default values.b. If you choose to use an existing variable, choose the variable that you want.
You can also specify its default values.8. Click Connect.
Results
When a connection is defined, IBM Cognos Report Studio creates the appropriateconditions for the selection behavior and reaction behavior of the source and targetcontrols.
Tip: The interactive behavior icon of a control changes to indicate that a
connection was defined. The Active Report Controls tab shows the controlsand variables inserted in a report and their relationships to one another. You canclick a control in this tab to quickly locate the control in the report as well as setdefault values for variables.Related tasks:“Show or Hide a Column or Row” on page 197You can show or hide a column in a list or a column or row in a crosstab when thereport is viewed.“Add data to a data-driven control” on page 190For data-driven controls, you insert data items from the package.“Add data to a static control” on page 190For static value driven controls, you manually define the data in a data table.
Specify the Selection Behavior of a ControlSpecify the selection behavior of a control to determine what interactive behaviorshould occur when the control is clicked or when an object in the control, such as abutton, check box, or data item, is selected.
Specifying the selection behavior of a control sets the value of active reportvariables defined in the report. The active report variable values are then used tospecify the reaction behavior of controls. For example, you add two drop-down listcontrols to a report and you create a connection between them. The firstdrop-down list shows product lines and the second drop-down list shows product
Chapter 8. Active Reports 193

types. When a product line is selected in the first drop-down list box, you want topass that information to the second drop-down list box so that it shows only theproduct types of the selected product line.
You can specify a selection behavior for any control, except for decks and datadecks.
IBM Cognos Report Studio automatically sets active report variable values whenyou define a connection between controls. However, you may need to set the valueof other variables to specify additional interactive behavior.
Procedure
1. Click the interactive behavior icon of the source control.
Tip: The interactive behavior icon is visible only when the visual aid ShowInteractive Object Controls is enabled.
The Report Behavior box shows the relationship between the source and targetcontrols when you defined a connection between the controls. You can specifydefault values for the variable associated with the control by clicking SetDefault Value(s).
2. In the Behavior on Select box, click inside the Set Variable Values box and
then click the edit button that appears.3. For each active report variable that you want to set as part of the selection
behavior of the control, click the Value drop-down list and select one of thefollowing choices:v If you want to clear the current value of the variable, click Set to Empty.
Tip: Clearing the current value of a variable is useful when you havecascading controls. For example, if the parent control is reset to a defaultvalue, you want to reset the child control to a default value as well.
v If you want to specify your own value, click Type in a value and type thevalue that you want to use.
v If you want the variable values to be driven by a data item in the report,click the data item that you want to use.
v If you do not want the variable to be used for the control, click Do not set.4. To create a new active report variable, click Create a New Variable.Related tasks:“Specify the Reaction Behavior of a Control”Specify the reaction behavior of a control to determine how a control will reactwhen another control, or an object in the control, is selected.
Specify the Reaction Behavior of a ControlSpecify the reaction behavior of a control to determine how a control will reactwhen another control, or an object in the control, is selected.
You can specify the following reaction behaviors:v Select an item in a control.
For example, you specify a default value for a variable, and the variable drives adrop-down list control. When the report is run, you want the default value toappear in the control.
194 IBM Cognos Report Studio Version 10.2.1: User Guide

You can specify this reaction behavior for any control, except for single buttoncontrols.
v Filter data in a control.For example, you want to filter the product types in a drop-down list controlbased on the product line selected in another drop-down list control.You can specify this reaction behavior for drop-down lists, data drop-down lists,list boxes, data list boxes, radio button groups, data radio button groups, checkbox groups, data check box groups, lists, and crosstabs.
v Enable a control.For example, you want to make a control interactive only when a selection isfirst made in another control.You can specify this reaction behavior for any control, except for decks, datadecks, tabs, data tabs, lists, crosstabs, charts, and maps.
In addition to these behaviors, you can specify the item to appear when nothing isselected in a list control, hide or show a column, and whether to allow data to besorted in a list.
IBM Cognos Report Studio automatically sets the reaction behavior when youdefine a connection between controls. However, you may want to change thereaction behavior or specify additional interactive behavior.
Procedure
1. Click the interactive behavior icon of the control.2. In the Reaction Behavior box, click the reaction behavior box that you want,
such as Container Select, and click the edit button that appears.If a condition has not yet been defined, two dialog boxes appear. The seconddialog box prompts you to define the condition expression that you want touse to specify the reaction behavior.
3. In the Item box on the left, define the left side of the condition expression.v To use a data item, click the Data Item radio button and then click the item
that you want to use.The data items that are available in the drop-down list depend on the dataitems that you inserted into the control.
v To use a static item, click the Value radio button, type the value that youwant to use, and then specify the value's data type.The value must be defined as a value of the selected active report variable inthe next step.
v If you want to set the value of an active report variable to null, click theEmpty Variable radio button.
4. Click the Operator drop-down list and select the operator that you want to use.5. In the Item box on the right, define the right side of the condition expression.
v To use a value in an active report variable, click the Active Report Variableradio button and then click the variable that you want to use.The variables that are available in the drop-down list depend on thevariables that you defined in the report.
v To use a static item, click the Value radio button, type the value that youwant to use, and then specify the value's data type.
v To use null as the value, click the Empty Data Item radio button.
Chapter 8. Active Reports 195

Use null as the value to specify the reaction behavior when no data exists forthe value selected in the source control.
6. If you want to apply the condition when no item is selected in the sourcecontrol, clear the Drop this condition if the variable is empty check box.Clearing the check box can improve performance and prompt users to performan action. For example, a report contains a list with many rows of data, and thelist is filtered by another control. When the check box is cleared, no data willappear in the list until an item is selected in the other control.
Related concepts:“Recommendation - use master detail relationships when authoring decks” onpage 197When authoring deck controls in active reports, use master detail relationships toimprove performance.Related tasks:“Specify the Selection Behavior of a Control” on page 193Specify the selection behavior of a control to determine what interactive behaviorshould occur when the control is clicked or when an object in the control, such as abutton, check box, or data item, is selected.“Set the No Value List Item”Set the no value list item to show a specific item in a control when no value isselected.“Show or Hide a Column or Row” on page 197You can show or hide a column in a list or a column or row in a crosstab when thereport is viewed.“Sort Data in a List” on page 197You can specify whether users can sort data in a list in the report output.
Set the No Value List ItemSet the no value list item to show a specific item in a control when no value isselected.
For example, a report contains a drop-down list control that contains product lines.You create a no value list item named (All) to show all product lines when thereport is initially viewed.
Procedure1. Select the control.2. In the Properties pane, for the No Value List Item property, click Show.
A text item representing the no value list item appears in the control.3. In the Properties pane, double-click the Label property.4. In the Default text box, type the name of the no value list item.5. To specify the text for other languages, do the following:
v Click the add button .v Select the languages that you want.v In the Language column, click one of the languages that you selected.
v Click the edit button and type the name of the no value list item forthat language.
v Repeat for all remaining languages.
196 IBM Cognos Report Studio Version 10.2.1: User Guide

6. In the Properties pane, click the Position in List property and specify whereyou want the no value list item to appear in the control.
Show or Hide a Column or RowYou can show or hide a column in a list or a column or row in a crosstab when thereport is viewed.
Procedure1. Click the title of the column or row that you want to show or hide.2. If the data container is a crosstab, in the Properties pane, click the Visible
property and click Yes or No.3. If the data container is a list, in the Properties pane, double-click the Column
Visibility property.4. To make the list column visible when the report is viewed, click the Visible
radio button.5. To hide the list column when the report is viewed, click the Hidden radio
button.6. To make the list column visible based on a condition, click the Visible based
on condition radio button, click the edit condition button , and specify thecondition.v If you want to specify a value to use for the condition, click the Value radio
button, type the value, and in the Data Type drop-down list, select thevalue’s data type.
v If you want to use null as the value for the condition, click the EmptyVariable radio button instead.
v Click the Operator drop-down list and select the operator that you want touse for the condition.
v In the Active Report Variable drop-down list, select the active reportvariable that you want to use for the condition.
v If you want to apply the condition when no item is selected in a control thatis connected to the list, clear the Drop this condition if the variable isempty check box.
Sort Data in a ListYou can specify whether users can sort data in a list in the report output.
Procedure1. Select the column that you want users to be able to sort.2. In the Properties pane, for the Allow Sorting property, click Yes.
Recommendation - use master detail relationships whenauthoring decks
When authoring deck controls in active reports, use master detail relationships toimprove performance.
Decks offer greater flexibility in active reports by allowing you to show differentobjects in each card of a deck. In data decks, the number of cards that are createddepends on data items inserted in the deck. As a result, a data deck can containmany cards, which may reduce performance when the report is run and viewed.For example, if a data deck contains Product line and Years, there can be up to 20
Chapter 8. Active Reports 197

cards in the deck (five different product lines multiplied by four different years). Inaddition, filtering data in a data deck can affect performance when there are manyrows of data in the deck.
To improve performance, use a master detail relationship to filter data in a datacontainer inserted in a data deck control. A master detail relationship definedbetween a data deck and a data container inserted in the deck results in a specificnumber of cards generated for the deck, which serves as a way to filter the data inthe data container. For example, a data deck contains a list object that has manyrows of data, and you want to filter the list by product line. Creating a masterdetail relationship between the deck and the list using Product line produces fivecards in the deck, one for each product line. When you filter by product line, theappropriate card appears in the data deck.
In addition, specify Select as the behavior instead of Filter when defining theconnection between the data deck control and the control you want to use to filterthe data in the deck.
Tip: If the data container in the data deck is a chart, you must use a master detailrelationship if you want to filter data in the chart.
Summarizing Data in the Active Report OutputYou can add an output summary to a list or crosstab control that reflects the datathat appears in the control when an active report is viewed. In visualizations, youcan specify how the data is summarized when users select multiple values in acontrol that is connected to a visualization.
For example, the data in a list is driven by selecting an item in a data drop-downlist control. An output summary specified for the list is recalculated when adifferent item is selected in the drop-down list.
Procedure1. In a list or crosstab, follow these steps to add an output summary.
a. Click the column or row for which you want to add an output summary.
b. In the toolbar, click the summarize button and then, under Summarizein Output, choose the summary that you want to add to the active reportoutput.
2. In a visualization, follow these steps to specify how to summarize data whenusers select multiple values in a control.a. In the visualization data container, in the Values section, click the box that
represents the data values in the visualization. For example, in a heatmap,click the Color box.
b. In the Properties pane, click the Rollup Method property and select theaggregation method that you want to use to summarize data in thevisualization.
Run or Save an Active ReportYou can run an active report in HTML format or save it as a MIME HTML (MHT)file so that you can send the report to your consumers. The MHT file is viewablein the Microsoft Internet Explorer or Mozilla Firefox browsers.
198 IBM Cognos Report Studio Version 10.2.1: User Guide

To assist you in resolving problems when you are authoring an active report, a runoption that shows the state of active report variables in the report as you clickvarious controls is available. By default, this option is enabled.
If you are using Microsoft Internet Explorer 6.0, you cannot open an active reportin MHT format as a file. You can view the report only by using a URL.
Before you begin
To view an active report in MHT format in Mozilla Firefox, you must firstdownload an UnMHT add-on.
Procedure1. To disable the run option that can show the state of active report variables
when the report is viewed, from the Run menu, click Run Options, and clearthe Enable right-click debug menu check box.
2. To run a report, from the Run menu, click Run Active Report.3. To save a report, from the Run menu, click Download Active Report, and
when prompted, choose to save the report as an MHT file.
Results
When running a report with the Enable right-click debug menu check boxselected, right-clicking in the report output window allows you to choose to viewthe active report variables in the report, reset variables, or print the report.
Tip: The right-click debug menu is not available if you run the report from IBMCognos Connection.Related tasks:“Drill-through links in active reports do not work” on page 506When viewing an active report that contains drill-through links in MicrosoftInternet Explorer 8 and later, the links do not work.
Example - Create an Active Report Showing Revenue Data for CoreProducts
You are a report author at The Sample Outdoors Company, which sells sportingequipment. You are requested to create an active report showing revenue data forthe core products Camping Equipment and Golf Equipment.
The revenue data is specific to countries and regions in the Americas. The reportwill allow users to filter data by product or by country or region.
To create this report, you will need to add two data drop-down list controls and alist container. The first data drop-down list control will contain the core productsthat users can select. The second data drop-down list control will contain countriesand regions that users can select. The list will show revenue data for each coreproduct and country or region. When users click different products or differentcountries and regions, the data in the list will be filtered based on the selectionsmade.
Create the active reportCreate a new active report and add the objects that you need to build the coreproducts revenue report.
Chapter 8. Active Reports 199

Procedure1. Open IBM Cognos Report Studio with the GO Data Warehouse (analysis)
package.2. In the Welcome page, click Create new.3. In the New dialog box, click Active Report.4. Double-click the report title and type
Core Products Revenue
5. Click the Toolbox tab and drag the Table object to the report.6. Clear the Maximize width check box and then click OK to create a table with
two columns and one row.7. Drag the Data Drop-Down List object to each cell in the table.8. Drag the List object to the report so that it appears under the table.
Add data to the data drop-down list controlsThis task adds the required data items to the two drop-down list controls in thereport.
Procedure1. Right-click the first data drop-down list control and click Go to Query.
Query1 opens in the Query Explorer.
2. Click the Source tab and do the following:v Expand the Sales and Marketing (analysis) folder and the Sales
namespace.v Expand the Products dimension and then the Products hierarchy.v Drag Product line to the Data Items area.
3. Click Product line and in the Properties pane, do the following:v Click the Name property, delete the existing name, and type
Core products
v Double-click the Set Definition property.
v Click the new button and then click Exclude.v In the Available members box, expand Sales and Marketing (analysis),
Sales, and Products.v Drag the Mountaineering Equipment, Personal Accessories, and Outdoor
Protection members to the Members box.The Core products member set now contains only Camping Equipment andGolf Equipment.
4. Click OK twice.
5. Pause the pointer over the page explorer button and click Page1.
6. Click the Data Items tab and drag Core products from Query1 to thedrop-down list box in the control.
7. Click the control and in the Properties pane, for the No Value List Itemproperty, click Show.The Properties pane for the no value list item property appears.
200 IBM Cognos Report Studio Version 10.2.1: User Guide

8. Double-click the Label property, type Core products in the Default text box,and click OK.
9. Right-click the second data drop-down list control and click Go to Query.Query2 opens in the Query Explorer.
10. Click the Toolbox tab and drag Data Item to the Data Items area.11. In the Expression Definition box, type
children ([Sales].[Retailers].[Retailers].[Region]->[Retailers].[710])
Tip: This expression returns the children of the Americas member. The MUNfor Americas is used instead of the member name.
12. In the Properties pane, click the Name property, delete the name and typeCountries and regions
13. Pause the pointer over the page explorer button and click Page1.
14. Click the Data Items tab and drag Countries and regions from Query2to the drop-down list box in the control.
15. Click the control and in the Properties pane, for the No Value List Itemproperty, click Show.The Properties pane for the no value list item appears.
16. Double-click the Label property, type Countries and regions in the Defaulttext box, and click OK.
Add data to the listThis task adds the required data items to the list.
Procedure
1. Pause the pointer over the query explorer button and click Query1.2. Copy the Core products data item.
3. Pause the pointer over the query explorer button and click Query3.4. Paste the Core products data item into Query3.5. Repeat steps 1 to 4 to copy the Countries and regions data item from Query2
to Query3.
6. Pause the pointer over the page explorer button and click Page1.
7. Click the Data Items tab and drag Core products and Countries andregions from Query3 to the list.
8. Click the Source tab and do the following:v Expand the Products dimension and then the Products hierarchy.v Drag Product type to the list, inserting it between Core products and
Countries and regions.v Expand Sales fact.v Drag Revenue and Planned revenue to the list, to the right of Countries and
regions.
Chapter 8. Active Reports 201

Add interactivity to the reportThis task defines connections between the various controls and sets an activereport variable so that the controls can interact with each other when users viewthe report.
Procedure
1. Click the interactive behavior icon of the first data drop-down listcontrol.
2. Click Create a New Connection.3. Click the Target Control drop-down list and click List1.4. Ensure that the following information appears in the dialog box and click
Connect.v In the Behavior drop-down list, Filter is selected.v In the Data Item drop-down list for both controls, Core products is
selected.v In the Active Report Variable box, type Core products Variable 1.
5. In the Control drop-down list, click Data Drop-Down List2.6. Click Create a New Connection.7. Click the Target Control drop-down list and click List1.8. Ensure that the following information appears in the dialog box and click
Connect.v In the Behavior drop-down list, Filter is selected.v In the Data Item drop-down list for both controls, Countries and regions is
selected.v In the Active Report Variable box, type Countries and regions Variable
1.9. In the Control drop-down list, click Data Drop-Down List1.
10. In the Behavior on Select section, click the edit button .11. Set Countries and regions Variable 1 to Set to Empty and click OK twice.
When users select a different product in the first data drop-down list control,the second data drop-down list value will reset to the no value list item.
Specifying default values for the data drop-down list controlsThis task specifies default values for the two drop-down list controls in the report.
Procedure
1. Click the Active Report Variables tab .2. Expand Core products Variable 1 and click Set Default Values.3. In the Values box, double-click Camping Equipment and click OK.4. Expand Countries and regions Variable 1 and click Set Default Values.5. In the Values box, double-click United States and click OK.
Revenue data for core products report outputWhen initially viewed, the revenue data for core products active report shows alist containing data for all core products in all countries and regions.
202 IBM Cognos Report Studio Version 10.2.1: User Guide

Selecting a product from the core product drop-down list or selecting a country orregion from the country and region drop-down list filters the list to the selectionsmade.
The following image shows the data that appears in the list when CampingEquipment and United States are selected in the two drop-down lists.
Example - Sales analysis active reportYou are a report author at The Sample Outdoors Company, which sells sportingequipment. You are requested to create an active report analyzing sales by regionand by product line.
You will use a list to show sales by region, with a slider control to allow users tomove between different regions. Users will have the option to show or hide theslider control by respectively selecting or clearing a check box.
You will use a pie chart to show sales by product line. Users will be able to clickproduct lines in the chart legend to highlight sales in the chart.
Creating a new active reportCreate a new active report and add the objects that you need to build the salesanalysis report.
Procedure1. Open IBM Cognos Report Studio with the GO Sales (query) package.2. In the Welcome page, click Create new.3. In the New window, double-click Active Report.4. Double-click the report title and type
Sales Analysis
5. Click the Toolbox tab , drag Table to the report, specify two columns andone row, and click OK.
6. Drag Check Box Group to the first table cell.7. Select the second and third check boxes and delete them.
Only one check box is required for this report.8. Drag Deck to the second table cell.9. Drag Data Discrete Values Slider to the deck, in the space under Card 1.
The slider control becomes the first card in the deck.
Figure 35. Revenue data for core products report
Chapter 8. Active Reports 203

10. Select the slider control and in the Properties pane, click the Track Lengthproperty, change the length of the slider track to 500 px, and click OK.
11. Optional: To animate the movement of the slider when users view the report,set the Animate property to Yes.
12. Optional: To update active report variables associated with the slider whenusers move the slider thumb, set the Update Variables Live property to Yes.The report will be updated live when the thumb is moved. If set to No, thereport is updated only when the thumb is stopped and released.
13. Drag Block below the table.14. Drag List below the block.15. Insert another block below the list.16. Click the second block and in the Properties pane, double-click the Padding
property.17. Specify 20 px for the top of the block and click OK.18. Drag Data Deck below the block.19. Drag Chart to the data deck.
a. In the left column, click Pie, Donut.b. In the right column, click Exploded Pie with 3-D Effects and Flat Bevel.
Tip: This pie chart type is available only when the Use legacy chartauthoring check box (Tools > Options > Advanced tab) is cleared. To findthis specific pie chart type, hover over each choice to view its tooltip.
c. Click OK.
Results
The active report now contains all of the objects that you need to build the salesanalysis report. In the following tasks, you will add data to each control and defineconnections between controls so that they can interact with each other.
Adding data to the check box group controlThis task defines the data that will appear in the check box group control. The datawill appear as the check box label.
Procedure
1. Click the Check Box Definitions icon .2. Under Data Table, click Check Box Label 1 and then click the ellipsis button.3. In the Default text box, type Show Region and click OK twice.
Adding a default card to the deck and data to the datadiscrete values slider
This task adds a default card to the deck and defines the data that will appear inthe data discrete values slider control.
No content will be added to default card so that the slider will be hidden whenthe check box in the check box group control is cleared. The slider control is in thefirst card of the deck.
204 IBM Cognos Report Studio Version 10.2.1: User Guide

Procedure1. Click the container selector (three orange dots) of the deck so that the entire
deck is selected.
Tip: The container selector is visible only when the visual aid Show ContainerSelectors is enabled.
2. In the Properties pane, set the Default Card property to Yes.A No Data Contents tab is created for the deck.
3. Click the Deck tab .
4. Click the Source tab and do the following:a. Expand Sales (query) and then Retailers.b. Drag Region to the Label box of the slider.
Defining a connection between the check box group and thedeck
This task defines a connection between the check box group control and the firstdeck control that you inserted in the report. The connection will allow users toshow or hide the slider control when the check box is selected or cleared.
Procedure
1. In the check box group control, click the Create a New Connection icon .2. Ensure that the following information is specified:
v Deck1 appears in the Target Control list.v Select appears in the Behavior list.v Label appears in the Data Item list for the source control.
3. Under Target Control, click the Data Item list and select Use SourceDefinition.The data value defined for the check box group, Show Region, is copied to thedeck control.
4. Optional: In the Active Report Variable box, change the default name to amore meaningful name.
5. Click Connect.
Adding data to the list objectThis task adds data items and an active report summary to the list object.
Procedure
1. Click the Source tab and drag the following data items to the list:v Sales (query) > Retailers > Region.v Sales (query) > Products > Product line.v Sales (query) > Sales > Quantity.v Sales (query) > Sales > Revenue.v Sales (query) > Sales > Planned revenue.
2. Pause the pointer over the Query Explorer icon and click Query2.
Chapter 8. Active Reports 205

3. Click the Toolbox tab and drag Data Item to the Data Items pane.The Data Item Expression window appears.
4. Copy and paste the following expression into the Expression Definition boxand click OK:([Revenue] - [Planned revenue]) / abs([Planned revenue])
This data item calculates the percentage difference between revenue andplanned revenue.
5. In the Properties pane of the data item, modify the following properties:a. In the Name property, delete the default name and type % Difference.b. Change Aggregate Function to Calculated.
6. Pause the pointer over the Page Explorer icon and click Page1.
7. Click the Data Items tab and drag % Difference from Query2 to the endof the list.
8. Click the % Difference column body in the list.9. In the Properties pane, double-click the Data Format property and do the
following:a. Click the Format type list and select Percent.b. In the list of properties, click the No. of Decimal Places, select 2, and click
OK.10. With the % Difference column still selected, in the toolbar, click the
Summarize icon and under Summarize in Output, click Total.
Defining a connection between the slider and the list objectThis task defines a connection between the slider control and the list object. Theconnection will allow users to filter data in the list as the slider thumb is moved.
Procedure
1. In the slider control, click the Create a New Connection icon .2. Specify the following information:
a. In the Target Control list, click List1.b. In the Behavior list, click Filter.c. Ensure that Region appears in the Data Item list for both the source and
target controls.3. Optional: In the Active Report Variable box, change the default name of the
variable that will be created when the connection is defined to a moremeaningful name.
4. Click Connect.
Adding a title to the listThis task adds a title above the list. The title will change according to the regionselected in the slider.
Procedure
1. Click the Toolbox tab and drag Text Item to the block that you insertedabove the list.
206 IBM Cognos Report Studio Version 10.2.1: User Guide

2. Type Sales by Region:, add a blank space, and then click OK.3. Select the text item in the report and in the Properties pane, modify the
following properties:a. For the Foreground Color property, specify blue and click OK.b. For the Font property, specify 12 pt as the size and bold as the weight and
click OK.4. From the Toolbox tab, drag Variable Text Item to the right of the text item.5. Select the name of the variable that you created when you defined the
connection between the slider and the list.6. Repeat step 3 for the variable text item.
Adding data to the data deck and chartThis task adds data items to the data deck and to the pie chart.
Procedure
1. Click the Source tab and drag the following data item to the Values boxof the data deck:Sales (query) > Products > Product line
2. Drag the following data items to the chart:v Sales (query) > Sales > Quantity to the Default measure box.v Sales (query) > Products > Product line to the Series (pie slices) box.v Sales (query) > Retailers > Region to the Categories (pies) box.
3. With the pie chart selected, in the Properties pane, click the Exploded Slicesproperty and do the following:
a. Select the default value and click the Delete icon .
b. Click the New icon .c. Change Exploded amount to 25.d. In the Exploded slice section, click Expression and then click the ellipsis.e. In the Expression Definition box, type the following, and click OK three
times.[Query3].[Product line]=[Query4].[Product line]
4. In the Properties pane, click the Clickable Regions property, select the LegendLabels check box, and click OK.By default, the Intersections check box is selected. By making the legend labelsclickable, users will be able to click different pie slices in the chart or differentproduct lines in the legend.
5. Optional: If you do not want to use the pie chart default colors, specify thecolors that you want by clicking the available properties in the Color &Background property group.For example, you can change the color palette for the chart by clicking thePalette property.
Defining a connection between the chart and the data deckThis task defines a connection between the pie chart and the data deck. Theconnection will create an active report variable that will be used to update the titlethat will be inserted above the chart. The title is described in the next topic.
Chapter 8. Active Reports 207
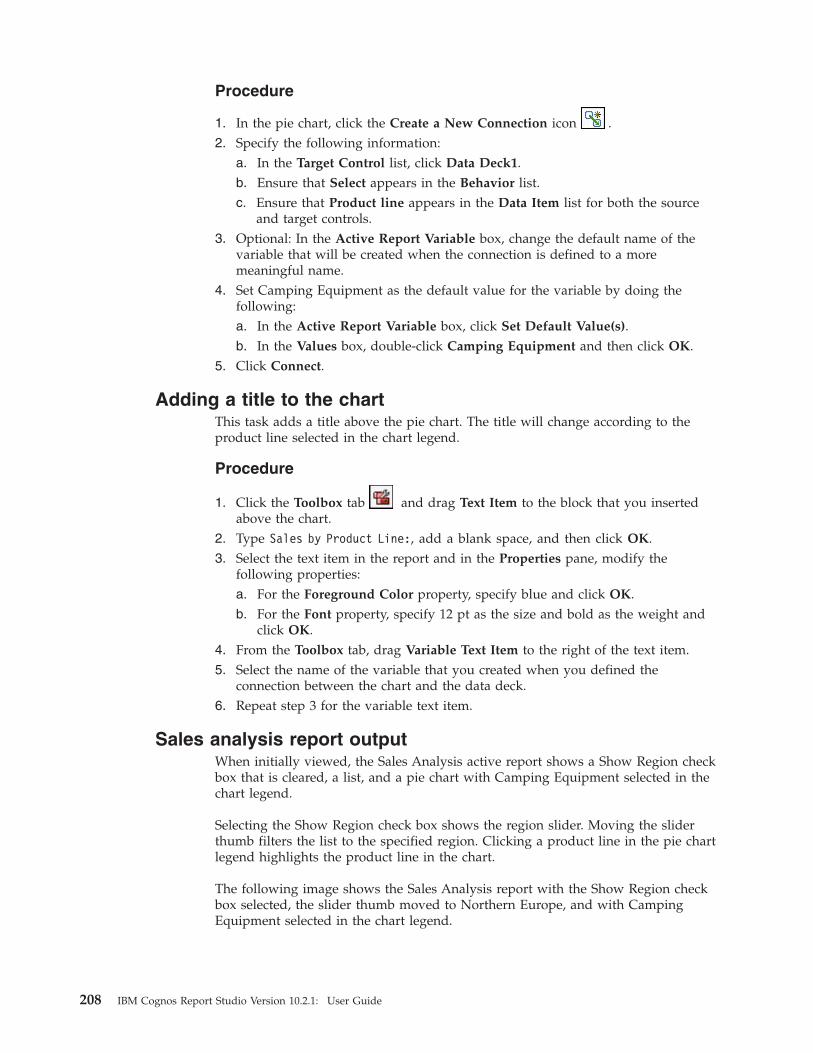
Procedure
1. In the pie chart, click the Create a New Connection icon .2. Specify the following information:
a. In the Target Control list, click Data Deck1.b. Ensure that Select appears in the Behavior list.c. Ensure that Product line appears in the Data Item list for both the source
and target controls.3. Optional: In the Active Report Variable box, change the default name of the
variable that will be created when the connection is defined to a moremeaningful name.
4. Set Camping Equipment as the default value for the variable by doing thefollowing:a. In the Active Report Variable box, click Set Default Value(s).b. In the Values box, double-click Camping Equipment and then click OK.
5. Click Connect.
Adding a title to the chartThis task adds a title above the pie chart. The title will change according to theproduct line selected in the chart legend.
Procedure
1. Click the Toolbox tab and drag Text Item to the block that you insertedabove the chart.
2. Type Sales by Product Line:, add a blank space, and then click OK.3. Select the text item in the report and in the Properties pane, modify the
following properties:a. For the Foreground Color property, specify blue and click OK.b. For the Font property, specify 12 pt as the size and bold as the weight and
click OK.4. From the Toolbox tab, drag Variable Text Item to the right of the text item.5. Select the name of the variable that you created when you defined the
connection between the chart and the data deck.6. Repeat step 3 for the variable text item.
Sales analysis report outputWhen initially viewed, the Sales Analysis active report shows a Show Region checkbox that is cleared, a list, and a pie chart with Camping Equipment selected in thechart legend.
Selecting the Show Region check box shows the region slider. Moving the sliderthumb filters the list to the specified region. Clicking a product line in the pie chartlegend highlights the product line in the chart.
The following image shows the Sales Analysis report with the Show Region checkbox selected, the slider thumb moved to Northern Europe, and with CampingEquipment selected in the chart legend.
208 IBM Cognos Report Studio Version 10.2.1: User Guide

Example - Network diagram visualizationYou are a report author at The Sample Outdoors Company, which sells sportingequipment. You are requested to create a visualization in IBM Cognos ActiveReport that shows the hierarchies of employee by region.
You will use a network diagram visualization to show employees by region, with adata drop-down list to allow users to move between different regions.
Adding a new visualization in IBM Cognos Active ReportCreate a visualization and add the objects that you require to build the networkdiagram.
Procedure1. Open IBM Cognos Report Studio with the GO Sales (query) package.2. In the Welcome page, click Create new.3. In the New window, double-click Active Report.4. Double-click the report title and type
Employees by Region
5. Click the Toolbox tab , drag a Visualization icon to the work area.6. From the Visualization Gallery, select a Network diagram icon.7. Click OK.
Figure 36. Sales Analysis active report
Chapter 8. Active Reports 209

8. From the Toolbox tab , drag a Data Drop-Down List to the report.
Results
The visualization now contains the objects that you require to build the networkdiagram. In the following tasks, you will add data to each control and defineconnections between controls so that they can interact with each other.
Adding data to the nodes data containerIn IBM Cognos Active Report, the nodes data container defines the items that youwant to link together.
Procedure
Click the Source tab , and complete the following steps:1. Expand Sales (query) and then Sales staff.2. Drag Sales staff code to the Nodes1 data container, under Node (numeric).3. Drag Staff name to the Nodes1 data container, under Name.4. Drag Sales region to the Nodes1 data container, under Extra categories.
Adding data to the links data containerIn IBM Cognos Active Report, the links data container defines relationship betweenthe items that you want to link together.
Procedure
Click the Source tab , and complete the following steps:1. Expand Sales (query) and then Sales staff.2. Drag Manager code to the Links1 container, under From node (numeric).3. Drag Sales staff code to the Links1 date container, under to node (numeric).4. Drag Sales region to the Links1 data container, under Extra categories.
Defining a connection between the data drop-down list andthe visualization object
This task in IBM Cognos Active Report defines a connection between the datadrop-down control and the visualization object. The connection will allow users tofilter data in the list as different regions are selected.
Procedure
1. From the Source tab , expand Sales (query) and drag Sales region to thedrop-down list box of the data-drop-down list control.
2. In the data-drop-down control, click the Create a New Connection icon .3. Complete the following steps:
a. In the Source Control list, click Sales region.b. In the Behavior list, click Filter.c. In the Target Control list, leave the default as Links1.
210 IBM Cognos Report Studio Version 10.2.1: User Guide

4. Click Connect.
5. In the data-drop-down control, click the Create a New Connection iconagain.
6. Complete the following steps:a. In the Source Control list, click Sales region.b. In the Behavior list, click Filter.c. From the variable drop-down list, click Reuse an existing variable.d. In the Target Control list, select Nodes1.
7. Click Connect.8. Select the Links1 data container.
9. In the content pane, click the Active Report Controls tab .10. In the Active Report Controls pane, expand and click Data Drop-Down List1
and click Set Default Value(s).11. In the Default Variable Values window, under Values, select Northern Europe
and use the arrow icon to move it to Selected values.12. Click OK.13. Run the report.
Network diagram visualization outputWhen initially viewed, the network diagram visualization in IBM Cognos ActiveReport shows the employee network for the Americas region.
Select different regions from the drop-down list and the employee network for thatregion is displayed.
The following image shows the Employees by Region report with the drop-downlist selected for the Northern Europe sales region.
Figure 37. Network diagram visualization
Chapter 8. Active Reports 211

212 IBM Cognos Report Studio Version 10.2.1: User Guide

Chapter 9. Relational Reporting Style
The relational reporting style is recommended for relational data sources.Relational data is best represented by lists. This data is organized in IBM CognosReport Studio by query items.
In relational reporting, you summarize data by using headers and footers in lists,summary functions, and within detail aggregation. You focus data in relationalreporting with summary or detail filters.
IBM Cognos Query Studio is also available to work with relational data.
Add Relational Data to a ReportSelect the data items to appear in the report.
Note: We recommend using relational data in the relational reporting style.However, if you are using dimensional data, see “Add Dimensional Data to aReport” on page 253.
If you frequently use items from different query subjects or dimensions in thesame reports, ask your modeler to organize these items into a folder or modelquery subject and then to republish the relevant package. For example, if you usethe product code item in sales reports, the modeler can create a folder that containsthe product code item and the sales items you need.
Procedure
1. From the Source tab , drag each query item to the report.
Note: A flashing black bar indicates where you can drop an item. Items
inserted in the report appear on the Data Items tab .Other ways to select data items are to double-click each item or to right-clickeach item and click Insert.
2. If you want to remove a data item from the report, select it and click the delete
button . To remove the data item from the report but keep it on the Data
Items tab , click the cut button instead.3. For more information about a query item, right-click the item in the Source tab
and click Properties. For example, when working with relational data sources,the Usage property identifies the intended use for the data represented by thedata item. You can also obtain more information by clicking Lineage.
Group Relational DataGroup data items in a list report to remove duplicate values. For example, youhave a report that shows all the products purchased and their product type. Yougroup the Product type column so that each product type cell spans the productspurchased cells.
© Copyright IBM Corp. 2005, 2013 213

You can specify whether grouping a column automatically makes it the firstcolumn in the list by selecting Group and automatic summary behavior for listsin the IBM Cognos Report Studio options. With this option selected, if the listcontains any fact or measure columns, footers that show the summary values forthe columns are automatically created for each group. Grouping a second columnmakes it the second column. When you ungroup a column, that column becomesthe first column after the grouped column.
After a column is grouped, you can move it elsewhere in the report.
You can also group data items in repeaters and in page sets.
In addition to grouping, you can specify the sort order of data items. In lists, youcan sort data items within groups as well as ungrouped items. In crosstabs, youcan sort row and column items. For more information, see “Perform AdvancedLayout Sorting” on page 235.
Tip: The Succession Report sample report in the GO Data Warehouse (analysis)package includes grouping. For more information about The Sample OutdoorsCompany samples, see Appendix C, “Sample Reports and Packages,” on page 507.
Procedure1. Click the column on which to group.
You can click either the column title or one of the column cells.
Tip: To perform multiple groupings at once, use Ctrl+click or Shift+click.
2. From the Structure menu, click Group/Ungroup .
Results
A symbol appears indicating that the column is grouped. You can control when itsvalues appear by setting the group span, and the column appears in the list ofheaders and footers that you can add to the report.
Note: Grouping all columns in a list is equivalent to creating a single-edgecrosstab.
Perform Advanced GroupingYou can perform more advanced groupings in a list to get the results you want.
For example, you canv view the entire grouping structure and make changes to the grouping orderv group a data item that appears in a query but not in the layoutv specify a list of properties for a group
You can also perform advanced sorting.
Procedure1. Click a column in the list.
2. Click the select ancestor button in the title bar of the Properties pane andclick List.
214 IBM Cognos Report Studio Version 10.2.1: User Guide

Tip: You can also click the container selector (three orange dots) of the list toselect it.
3. In the Properties pane, double-click the Grouping & Sorting property.4. To change the grouping order, in the Groups pane, click the grouped item in
the Groups folder and drag it to the grouping hierarchy.5. To create a new grouping, in the Data Items pane, click the data item and drag
it to the Groups folder in the Groups pane.6. To specify a list of data items for a group, do the following:
v Click the group.
Tip: Click Overall to specify a list of data items for the overall group. Theoverall group is the grouping of all data into one group. You can specify alist of data items for the overall group to add overall totals to the list.
v Click the properties button .v Select the appropriate check boxes.
Creating relational custom groupsCreate custom groups to classify existing data items into groups that aremeaningful to you.
You can use custom groups to convert numeric values into broader categories. Forexample, you can break down sales results into low, medium, and high categories.Or you can reduce the number of values into a smaller, more meaningful groups.For example, you can change a list of employees into separate teams ordepartments.
When you create custom groups in a list, a new column is added to the report,with the name data item (Custom). You can use this new column to group or sortthe report. If you want to show only the new groups, you can delete the originalcolumn.
Procedure1. Click the column that you want to group on and, from the Data menu, click
Calculate > Define Custom Groups.
Tip: You can click either the column heading or one of the column cells.
2. Click the New Custom Group icon .3. To group by values that you select, click New Select Values Groups, type a
New Group Name, select the required values from the Values box, and movethe values to the Selected Values box.
4. To group by a range of values, click New Range Group, type a New GroupName, and enter the From and To values.
5. If you do not want a group name to appear for remaining values, select Do notshow remaining values. Clicking this option will produce empty cells forremaining values.
6. If you want the group name for remaining values to match each value, selectUse each remaining value as a group name.
7. If you want to specify your own group name for all remaining values, selectGroup remaining values into a single group and type the name that youwant.
Chapter 9. Relational Reporting Style 215

8. If you are adding custom groups in a list, under New data item name, selecteither the default data item name or type a new data item name.
Set the Group Span for a ColumnWhen columns are grouped, you can choose how often to show column names bychanging the group spanning.
For example, when country or region and city are both grouped, you can choose toshow the country or region name each timev the country or region changes, by spanning Country or Region by Country or
Regionv the city changes, by spanning Country or Region by Cityv there is a new record, by specifying no spanning
Spanning one grouped column by another column is helpful if the second columncontains many items.
Procedure1. Click the column that will span the other column(s).2. In the Properties pane, set the Group Span property to the column to span.
Example - Remove Identical Values in a ListYou are a report author at The Sample Outdoors Company, which sells sportingequipment. You are requested to create a report that lists all product ordersorganized by order number. To make the report easy to read, you group the Ordernumber column so that only one instance of each order number appears. However,because each order contains different products, the same order date appears foreach product. You decide to show the order date only when the order numberchanges.
Procedure1. Open IBM Cognos Report Studio with the GO Data Warehouse (query)
package.2. In the Welcome dialog box, click Create a new report or template.3. In the New dialog box, click List and click OK.
4. In the Source tab , expand Sales and Marketing (query) and Sales(query).
5. Expand Sales order and add Order number by double-clicking it.6. Expand Time dimension and add Date by double-clicking it.7. Expand Product and add Product name by double-clicking it.8. Expand Sales fact and add Quantity and Revenue by double-clicking them.9. Group the Order number column.
10. Click the Date column.11. In the Properties pane, set the Group Span property to Order number.
Results
When you run the report, the first row of the Order date column appears for eachOrder number row.
216 IBM Cognos Report Studio Version 10.2.1: User Guide

Example - Repeat a Column Value in a ListYou are a report author at The Sample Outdoors Company, which sells sportingequipment. You are requested to create a report that lists all products sold by thecompany, organized by the product line and product type. To make the reporteasier to read, you group the Product line and Product type columns so that onlyone instance of each column appears. However, because some product linescontain many different product types and products, you decide to show theproduct line for each product type.
Procedure1. Open IBM Cognos Report Studio with the GO Data Warehouse (query)
package.2. In the Welcome dialog box, click Create a new report or template.3. In the New dialog box, click List and click OK.
4. In the Source tab , expand Sales and Marketing (query).5. Expand Sales (query) and Product and add the following data items by
double-clicking them:v Product line
v Product type
v Product name
6. Expand Sales fact and add Product cost by double-clicking it.7. Group the Product line and Product type columns.8. Click the Product line column.9. In the Properties pane, set the Group Span property to Product type.
Chapter 9. Relational Reporting Style 217

10. Click any part of the list and then click the select ancestor button in thetitle bar of the Properties pane.
11. Click List.
Tip: You can also click the container selector (three orange dots) of the list toselect it.
12. In the Properties pane, double-click the Font property.13. In the Size box, click 8pt.
Results
When you run the report, the product line appears whenever the product typechanges.
Divide Data into SectionsCreate sections in a report to show a data item as the heading of a section. Whenyou run the report, separate sections appear for each value.
Creating sections is similar to creating headers by grouping on a data item Thedifference is that section headers appear outside the list, crosstab, chart, orrepeater. In addition, you can group data items only in lists.
When working with dimensional data, you can also create page layers to showvalues on a separate page for each member.
Figure 38. List showing product line, product type, product name, and product cost
218 IBM Cognos Report Studio Version 10.2.1: User Guide

Procedure1. Click the column to make a section heading.2. Do one of the following:
v From the Structure menu, click Section .If the column is in a list or repeater, this menu option will create sectionswithout creating a master detail relationship. This can improve performancewhen running the report.If the column is in a crosstab or chart, this menu option will create sectionsusing a master detail relationship.
v From the Structure menu, click Section Using Master/Detail.This menu option creates sections using a master detail relationship.
Sections are created, and a section header appears. The data container thatcontains the column used to create sections is embedded in a list.
3. To add or remove section headers and footers, from the Structure menu, clickHeaders & Footers, click List Headers & Footers, and select or clear theappropriate check boxes.The section header and footer check boxes appear under Overall header.
Remove SectionsYou can remove sections and reinsert the data item that was used to create thesections in the data container.
Procedure1. From the View menu, click Page Structure.2. Expand the page containing the data container with the section.3. Expand Page Body until you see the data container in which you added the
section.The data container is nested in the List Column Body object of the List objectthat is created when you add a section.
4. Drag the data container to Page Body.The data container appears as a node of Page Body.
5. Delete the List object.6. From the View menu, click Page Design.
7. From the Data Items tab , drag the data item that was used as a sectionheader back into the data container.
8. If you created sections in a list without creating a master detail relationship,
click the data item, and then click the group/ungroup button to ungroupthe item.
Summarizing Data RelationallySummarize data in your reports to obtain totals, averages, and so on.
In a report, you can add both detail and summary aggregation. Detail aggregation,which is supported only for relational data sources, specifies how a data item istotaled at the lowest level in a report. In lists, detail aggregation specifies how thevalues that appear in the rows are totaled. In crosstabs, detail aggregation specifieshow the values in the cells are totaled. For example, detail aggregation for a
Chapter 9. Relational Reporting Style 219

measure like Revenue might be Total in both lists and crosstabs. In the followinglist report, this means that the values you see for the Revenue column representthe total revenue for each product type.
Summaries, which are supported for all data sources, specify how data items aretotaled in the headers and footers of a list and in the total rows and columns of acrosstab. For list reports, these summaries only summarize the data that is visibleon that page of the report.
You can specify detail and summary aggregation in different ways by using any ofthe following:v aggregation properties that are specified in the modelv the Auto Group & Summarize propertyv the summarize button in the toolbarv aggregation properties for a data itemv summary functions in data item expressionsv the solve order of calculations
Limitation
If a summary is applied to a report that contains binary large object (BLOB) data,such as images or multimedia objects, you cannot also perform grouping orsorting.
The Type of Data
How data is aggregated also depends on the type of data that you are aggregating.Aggregation rules are applied differently to facts, identifiers, and attributes. Forexample, if you aggregate a data item that represents part numbers, the onlyaggregate rules that apply are count, count distinct, count non-zero, maximum,and minimum. For information about how to determine the type of data that adata item represents, see “Add Relational Data to a Report” on page 213 and “AddDimensional Data to a Report” on page 253.
Add a Simple SummaryYou can add simple summaries to the groups in a report by using the summarizebutton in the toolbar. This button provides a subset of the summary functions
Figure 39. A list showing product line, product type, and revenue
220 IBM Cognos Report Studio Version 10.2.1: User Guide

available in IBM Cognos Report Studio. For list reports, a Custom option is alsoavailable so that you can add your own summary function in the expression of thedata item.
The summarize button sets the rollup aggregate property for the data item to theselected summary, and places the data item into an appropriate footer. A footer iscreated for each group as well as an overall footer, unless they already exist.
In lists, the summary appears as a footer. If the column to which you added asummary is grouped, group and overall summaries appear. In crosstabs and charts,the summary appears as a node.
To change a summary, select it and, in the Properties pane, under Data Item, clickRollup Aggregate Function and choose a different function.
In crosstabs, you can add multiple summaries at the same level. For example, youhave a crosstab with Product line as rows, Order year as columns, and Revenue asthe measure. For Product line, you can add the Total summary as a header, whichwill total all revenue for each order year. You can then add the Average summaryas a footer, which will give the average revenue of all product lines for each orderyear.
For information about adding a rolling or moving average, see “Rolling andMoving Averages” on page 272.
Procedure1. Click the column to which to add a summary.
2. Click the summarize button and click a summary type.3. To change the summary label, do the following:
v Click the label.v In the Properties pane, under Text Source, set the Source Type property to
the source type to define the label.For example, set it as Data Item Value to produce a dynamic label for thesummary based on data item values.
v Set the property below Source Type to specify the label.This property depends on the source type you chose. For example, if youchose Data Item Value as the source type, set the Data Item Value propertyto the data item to use to define the label.
Set the Auto Group & Summarize PropertySet the Auto Group & Summarize query property to specify whether IBM CognosReport Studio should group non-fact data items (identifiers and attributes) andapply aggregate functions to aggregate fact data items in lists.
If you are using an OLAP data source, data is always summarized regardless ofhow this property is set.
Procedure
1. Pause the pointer over the query explorer button and click a query.2. In the Properties pane, set the Auto Group & Summarize property:
Chapter 9. Relational Reporting Style 221

v To group non-aggregate fact data items and apply aggregate functions toaggregate fact data items in lists, set this property to Yes.
v To render detail rows, set this property to No.
Specify Detail or Summary Aggregation in the ModelWhen working with relational or dimensionally-modeled relational (DMR) datasources, you can use the aggregation properties specified for the query item in theIBM Cognos Framework Manager model instead of specifying detail or summaryaggregation in the report. The model specifies the default summary function foreach query item.
Aggregation functions are mapped between data sources, Framework Manager,and IBM Cognos Report Studio.
Specify Aggregation Properties for a Data ItemWhen working with relational data sources and list reports, for each data item in areport, you can specify detail and summary aggregation properties to managesummaries without having to create complex data item expressions.
Procedure1. Click the data item for which to set detail or summary aggregation.2. In the Properties pane, set the Aggregate Function or the Rollup Aggregate
Function property to a function.
Use Summary Functions in Data Item ExpressionsYou can use summary functions in data item expressions. The summary functionsin the expression editor that have the same name as the summary functionsavailable through the Aggregate Function and Rollup Aggregate Functionproperties operate the same way. For example, in a relational report, setting theAggregate Function property to Total is the same as changing the expression ofthe data item to total ( [Revenue] ).
In general, report maintenance is easier if the Aggregate Function and RollupAggregate Function properties are used rather than adding summary functions todata item expressions. Use summary functions in expressions if the requiredsummary is not supported as an aggregate or rollup aggregate property or if thecomplexity of the expression cannot be managed using the data item properties.Add a summary function to a data item expression if one of the followingconditions applies:v The underlying data source is relational, and you want to use database
vendor-specific summary functions.v You want to use summary functions that require more than one parameter, such
as percentile.v You require summary expressions that are not available in the aggregation
properties, such as a for clause. You should use for clauses only in relationalstyle reports (list reports).
For example, your report uses Product line, Product type, and Quantity. You wantto calculate the percentage of the parent quantity that is represented by eachproduct type. This requires you to compare the total quantity for each producttype to the total quantity for the parent product line. In other words, your
222 IBM Cognos Report Studio Version 10.2.1: User Guide

expression requires summaries at different group levels. You use summaryfunctions, such as aggregate, in the data item expression with a for clause tospecify the group level as follows:
[Quantity] / aggregate ([Quantity] for [Product line])
In some cases, you may need a summary that is different from the default. Forexample, if the default summary for Quantity is total, you can calculate theaverage as follows:
[Quantity] / average ( aggregate ([Quantity]) for [Product line])
The inner summary gives you the expected Quantity values at the Product Typelevel, which are then averaged to the Product Line level. This two-stageaggregation is required for OLAP data sources and recommended for relationaldata sources also.
Chapter 9. Relational Reporting Style 223

Why is this necessary? Here's what would happen if you simply averagedQuantity, as follows:
[Quantity] / average([Quantity] for [Product line])
The denominator is now computed as the average of the detail Quantity rows inthe underlying fact table. Since these values are much smaller than thepre-summarized Quantity values you see in the report, the resulting percentage isfar too big, and not what we wanted.
Tip: The Total Revenue by Country or Region sample report in the GO DataWarehouse (query) package includes a totalsummary function. For moreinformation about The Sample Outdoors Company samples, see Appendix C,“Sample Reports and Packages,” on page 507.
Procedure1. Click a data item.2. In the Properties pane, double-click the Expression property and add summary
functions to the expression for the data item.Related concepts:“Limitations When Using Clauses in Summary Functions” on page 532A summary function that uses a for clause may yield unexpected results. Thesemay include error messages, warnings, incorrect numbers, and more or fewer thanexpected rows, columns, or chart points and lines.
Summary FunctionsThis section describes the summary functions that are available in IBM CognosReport Studio. Some functions, such as Custom, are available only when you click
the summarize button on the toolbar. Additional summary functions areavailable in the expression editor.
Automatic Summary
Depending on the type of data item, applies the function None, Summarize, orCalculated based on the context in which the data item appears.
224 IBM Cognos Report Studio Version 10.2.1: User Guide

Calculated is applied if the data item expressionv contains a summary functionv is an if then else or case expression that contains a reference to at least a
modeled measure in its conditionv contains a reference to a model calculation or to a measure that has the Regular
Aggregate property set to a value other than Unsupported
v contains a reference to at least one data item that has the Rollup AggregateFunction property set to a value other than None
If the underlying data source is relational and if the data item expression containsno summary functions and a reference to at least one fact that has the RegularAggregate property set to a value other than Unsupported, Summarize is applied.
In all other contexts, None is applied.
For relational and dimensionally modeled relational (DMR) data sources, if thisfunction is applied to a data item expression that has the average function,weighted averages are computed based on the lowest level detail values in thedata source.
Note: This is the default function.
Average
Adds all existing values and then divides by the count of existing values.
Calculated
Specifies that all the terms within the expression for a data item are aggregatedaccording to their own rollup rules, and then the results of those aggregations arecomputed within the overall expression.
For example, a list contains the data item Quantity with the Aggregation propertyset to Total. You add a query calculation named Quantity Calculated. You defineits expression as Quantity + 100 and you set its Aggregation property toCalculated. When you run the report, the values for Quantity Calculated arecomputed by first adding all values for Quantity and then adding 100 to eachvalue.
Note: In crosstabs, this function overrides any solve orders that are specified.
Count
Counts all existing values.
If the underlying data source is dimensionally modeled relational (DMR), Countbehaves as follows if it is specified in the Aggregate Function or Rollup AggregateFunction property for a data item.
Object Behavior
Level Count distinct is used. A warning appearswhen you validate the report.
Member set Count distinct is used. A warning appearswhen you validate the report.
Chapter 9. Relational Reporting Style 225

Object Behavior
Attribute Supported.
Measure Supported.
If you add the count summary to a non-fact column in a list and then group thecolumn, the column will not be grouped when you run the report. To resolve thisissue, group the column first before adding the count summary.
Count Distinct
Returns the total number of unique non-null records.
If the underlying data source is dimensionally modeled relational (DMR), countdistinct is supported for levels, member sets, attributes, and measures when it isspecified in the Aggregate Function or Rollup Aggregate Function property for adata item.
Custom
Summarizes data based on an expression that you define.
Maximum
Selects the largest existing value.
Median
Returns the median value of the selected data item.
Minimum
Selects the smallest existing value.
None
Does not aggregate values.
If the underlying data source is relational, the data item is grouped when thequery property Auto Group & Summarize is set to Yes.
Not Applicable
This function is available only for the Aggregate Function property. It specifiesthat the aggregate attribute is ignored. For example, the calculation will be appliedafter the data is aggregated.
This function differs from the Calculated function, which applies aggregation tothe rows and then performs the calculation.
For example, for the average ( [Quantity] ) + 5 expression, when the AggregateFunction property is set to Not Applicable, five is added to the average of thesingle Quantity value. When the function is set to Calculated, five is added to theaverage of a set of numbers.
226 IBM Cognos Report Studio Version 10.2.1: User Guide

This setting should not be applied to a simple model reference.
This setting is relevant only for reports that are upgraded from IBM CognosReportNet 1.x.
Standard Deviation
Returns the standard deviation of the selected data item.
Note: From a mathematical perspective, this function is not useful for smallnumbers of items and is not supported if the query property Auto Group &Summarize is set to Yes.
Summarize
Aggregates data based on model or data type information. This function can bethought of as a calculate and then aggregate rule. Data is aggregated using thefollowing rules:
If the underlying data source type is relational and the data item or calculation is areference to a single fact query item in the model that has the Regular Aggregateproperty set to Sum, Maximum, Minimum, Average, or Count, aggregate datausing this function. Otherwise, data is aggregated according to the data type of thedata item as follows:v Total is applied for numeric and interval values.v Maximum is applied for date, time, and date-time values.v Count is applied for everything else.
The underlying data source type can be dimensional and the data item orcalculation a reference to a single item in the model. In this case, if the RegularAggregate property of the model item is not unknown, the summary function thatcorresponds to the Regular Aggregate property is applied. If the RegularAggregate property is unknown, set the function to Calculated.
For example, a list contains the data item Quantity with the Aggregation propertyset to Average. You add a query calculation named Quantity Summarize. Youdefine its expression as Quantity + 100 and you set its Aggregation property toSummarize. When you run the report, the values for Quantity Summarize arecomputed by first adding 100 to each value for Quantity and then calculating thetotal. The total is calculated because Quantity contains numeric values and theexpression for Quantity Summarize is not a simple data item reference. If QuantitySummarize is defined as Quantity, the function Average is applied to each value.
Total
Adds all existing values.
Variance
Returns the variance of the selected data item.
Note: From a mathematical perspective, this function is not useful for smallnumbers of items and is not supported if the query property Auto Group &Summarize is set to Yes.
Chapter 9. Relational Reporting Style 227

Mapping Aggregation Functions From Data Sources toFramework Manager and Report StudioThe summary functions available in IBM Cognos Framework Manager and IBMCognos Report Studio reflect summary functions supported by relational anddimensional data sources. The following table shows how summary functions indata sources are mapped to Framework Manager and Report Studio.
Data source Framework Manager Report Studio
None specified, or none Unsupported None
average (avg) Average Average
count Count Count
count distinct Count Distinct Count distinct
maximum (max) Maximum Maximum
minimum (min) Minimum Minimum
median Median Median
standard deviation (stddev) Standard Deviation Standard Deviation
sum Sum Total
variance (var) Variance Variance
count non zero Count Non-Zero Automatic
average non zero unknown Automatic
external unknown Automatic
any unknown Automatic
calculated unknown Automatic
unknown unknown Automatic
first_period unknown Automatic
last_period unknown Automatic
The following summary functions exist only in either Framework Manager orReport Studio. There is no corresponding summary function in data sources.
Framework Manager Report Studio
Automatic Automatic
Calculated Calculated
No corresponding summary function Summarize
No corresponding summary function Not Applicable
Focusing Relational DataYou can limit the data in your report with filters or query parameters. The methodyou choose should depend on the capabilities of the data source, the performancerequirements, the persistence of the dataset, and how complex you want the reportto be.
In IBM Cognos Report Studio, summary and detail filters are best for list reports inthe relational reporting style. Summary filters are applied to summaries and detailfilters are applied to details. These filters remove rows and columns from yourreports.
228 IBM Cognos Report Studio Version 10.2.1: User Guide
You can also use prompts, or prompt controls, to allow report users to provideinput for the filter.
Create a Detail or Summary FilterAdd a filter expression to focus a report and minimize processing time byexcluding unwanted data. For example, you can filter data to show only customerswho placed purchase orders that were valued at over one thousand dollars duringthe past year. When you run the report, you see only the filtered data.
Detail filters are applied only to detail data items from the data source, and not tosummary data items. Examples of detail data items include customer names,product numbers, and order numbers. Detail filters are Boolean expressions thatapply one or more conditions and evaluate to either true or false. If the conditionsare true for a row of data, the row is retrieved from the data source and appears inyour report. If the conditions are false, the row is not retrieved and does notappear in your report. You can specify whether detail filters are applied before orafter summaries using the Application property.
Tip: The 2011 Sales Summary sample report in the GO Sales (analysis) packageincludes a detail filter. For more information about The Sample OutdoorsCompany samples, see Appendix C, “Sample Reports and Packages,” on page 507.
Summary filters are applied to summary data items in a report. They are alsoBoolean expressions, however they are used to exclude specific groups of dataitems based on the group summaries. They are based on summary calculations.
You can combine multiple conditions using AND, OR, and NOT operators. Bydefault, multiple conditions are combined with an AND operator, which meansthat all conditions must be met for the filter to take effect.
For relational data sources, if a filter expression is used in multiple reports or bydifferent report authors, ask your modeler to create the filter as a standalone objectin the model and include it in the relevant package. For information about creatingfilters in the package, see the IBM Cognos Framework Manager User Guide.
If you are filtering a multiple-fact query, you should understand the differencesbetween using a detail filter and summary filter.
If you filter values that are floating-point numbers, you may encounter imprecisefiltering results due to rounding or data truncation. Floating-point numbers mayappear differently in the report than how than how they are stored in the datasource. To ensure accurate results, your filter criteria should account for anyrounding issues.
If you are working with a Microsoft SQL Server 2005 Analysis Services (SSAS) datasource, we recommend that you not use OR filters in summaries. Doing so causeserror characters (--) to appear in summaries instead of values.
Procedure1. To add a filter that was already created in the package, from the Source tab
, drag the filter to the report.You must drag the filter to a data container object that is linked to a query,such as a list, crosstab, or chart.
Chapter 9. Relational Reporting Style 229

2. To create your own filter, from the Data menu, click Filters , and clickEdit Filters.To create a simple filter condition based on only one data item, click CreateCustom Filter.If more than one query is defined in the report, you must first select a datacontainer object that is linked to a query.
Tip: You can also define filters in Query Explorer. Pause the pointer over the
query explorer button and click a query.3. In the Filters dialog box, decide what type of filter to create:
v To add a filter that will apply to detail values, click the Detail Filters tab.v To add a filter that will apply to summary values, click the Summary
Filters tab.
4. Click the add button .5. In the Create Filter dialog box, decide what conditions to include in the filter:
v To create a simple filter condition based on only one data item, clickCustom based on data item, select a data item from the query, and clickOK.
v To combine multiple filter conditions, click Combined, and click OK.v To create a filter condition that uses advanced calculations, click Advanced,
and click OK.6. If you create a simple filter condition based on one data item, do the
following:a. In the Filter Condition window, under Condition, select the type of
condition that you want.b. If you want to parameterize the filter so that users are prompted when
they run the report, select the Prompt for values when report is run inviewer check box.
c. To choose specific data item values for the filter condition, in the Valuesbox, click Specific values and choose the values that you want to filter on.
Tip: You can search for values by typing a string in the Keywords box.Click the arrow beside Search and select the search parameter that youwant to use. If you select Use Tab as keyword delimiter, you can add atab in the Keywords box only by copying and pasting a tab (or the stringyou want to search on with a tab in it), from another application, such asNotepad.
d. To filter values based on a pattern, in the Values box, click Starts with,Ends with, Contains, or Matches SQL pattern, and type the pattern in theValue box.With the Matches SQL pattern choice, you can filter values by usingstandard SQL syntax to create a SQL supported pattern. You can use a %(percent) symbol to substitute for zero or more characters, or _(underscore) to substitute for one single character. For example, the pattern'%a_b_c%' returns every value that contains the sequence 'a, any character,b, any character, c' anywhere in the string.If you search for patterns that include the '%' or '_' characters, specify anescape character in the Escape character (optional) box. The value must bea single character. When specified, each occurrence of the escape character
230 IBM Cognos Report Studio Version 10.2.1: User Guide

causes the next character to be treated as text and not as a specialcharacter. For example, if you specify '\' as the escape character, enteringTEST\% in the Value box searches for the string 'TEST%' rather than astring that begins with 'TEST' followed by any other characters. Similarly,entering TEST\\\% searches for strings that begin with 'TEST\%'.You can specify whether the filter condition is case sensitive or not. Acase-sensitive filter is applied only when the data source supportscase-sensitive filtering.
Note: When a filter based on a pattern is converted into a prompt, usersare prompted to specify a pattern when the report is run.
e. If you want the filter to include null values, select the Include missingvalues (NULL) check box.
f. Click OK.7. If you create a Combined filter, do the following:
a. In the Create Filter dialog box, select the data item for the first filtercondition and click OK.
b. In the Filter Conditions dialog box, specify the details for the firstcondition and click OK.
c. Click the new condition button and, in the Create Filter dialog box,select the data item for the second filter condition and click OK.
d. In the Filter Conditions dialog box, specify the details for the secondcondition and click OK.
e. In the Combined Filter dialog box, use the AND, OR, and NOT operatorsto combine the filter conditions. Select the conditions that you want tocombine, and click an operator. To change an operator, double-click theoperator to toggle among available ones or select the operator and thenselect a different one from the list.
f. Click OK.8. If you create an Advanced filter condition, in the Filter Expression dialog box,
define the filter expression:a. To add data items that are not shown in the report, on the Source tab
, double-click data items.b. To add data items that are in the report but not necessarily in the model
(such as calculations), on the Data Items tab , double-click data items.c. To add data items from a specific query in the report, on the Queries tab
, double-click data items.
d. To add functions, summaries, and operators, on the Functions tab ,double-click elements. You can insert only functions that return a Booleanvalue (true or false). For example, you cannot insert the functiontopCountbecause it returns a set of data. Filter expressions must resolve toa Boolean in order to be valid.
e. To add a value that is derived from a parameter, on the Parameters tab
, double-click the parameter. Parameters define prompts, drill-throughreports, and master detail relationships.
Chapter 9. Relational Reporting Style 231

f. To add a macro, on the macros tab , double-click the parametermaps, session parameters, or macro functions you want to add to themacro expression.
Tip: Use Insert macro block to get you started with creating the macroexpression. Insert macro block inserts number signs in the expression.Make sure that the macro expression you create is between the numbersigns.
g. Click the validate button and click OK.h. Click OK.
Tip: You can also type the filter expression directly in the ExpressionDefinition box. When typing date values, use the YYYY-MM-DD format.For more information about creating expressions, see “Using RelationalCalculations” on page 248.
9. In the Usage box, specify whether the filter is required, optional, or not to beused.
10. If you create a detail filter, under Application, click one of the followingoptions:v To apply the filter to individual records in the data source, click Before auto
aggregation.For example, for a specific product type within a product line, you want tofilter out individual orders that generated less than one thousand dollars inrevenue.
v To apply the filter to data after the query has grouped and summarized atthe lowest level of detail, click After auto aggregation.For example, you want to filter out the product types that generated lessthan ten thousand dollars in revenue within a product line.
For example, you have a list that contains the data items Product line, Producttype, and Revenue. The revenue values you see are aggregated to the producttype level. If you create a detail filter on Revenue and you choose to filtervalues before auto aggregation, you are filtering non-aggregated revenuevalues. If you choose to filter values after auto aggregation, you are filteringrevenue values aggregated to the product type level.
11. If you create a summary filter, under Scope, click the ellipsis (...) button andselect the grouping level at which to apply the filter.For example, a revenue report is grouped on product line and product type.You can choose to filter total revenue for either the product line or producttype level.If the query in which you are creating the summary filter is linked to morethan one data container, the data item that you select as the grouping levelmust be grouped in all data containers linked to the query. Otherwise, thereport will not run successfully.
Tip: To filter at the overall level, do not click a level. For example, if a reporthas an overall footer that shows the total revenue for all products, by notchoosing a level you will apply the filter to the footer. In addition, if you areusing a dimensional data source, excluding a parent level excludes itschildren, and excluding all children excludes the parent.
232 IBM Cognos Report Studio Version 10.2.1: User Guide

Edit or remove a filterAfter you created filters, you can edit or remove them.
Procedure1. Click a data container object that contains a filter.
2. To remove all filters from the object, from the Data menu, click Filters ,and click Remove all Filters.
3. To edit a filter or remove a single filter, from the Data menu, click Filters ,and click Edit Filters.
Tip: You can also edit filters from Query Explorer. Pause the pointer over the
query explorer button and click the query that contains your filter.
Browse or Search the Values of a Data ItemWhen building expressions in the expression editor, you can browse the data of adata item. This is useful when you do not know how a particular value is stored inthe database. For example, you want to filter a report so that it shows data foronly New South Wales. The actual value in the database for New South Wales isNSW, and this is what you must insert in the filter expression to obtain the correctresults.
Procedure1. In the source, data items, or query tab, right-click the data item you want to
browse.
2. If you want to insert a single value, click Select Value .
3. If you want to insert multiple values, click Select Multiple Values .4. In the Values box, click the value you want to insert in the expression.
Tip: Use the Keywords box to search for specific values. If you select Use Tabas keyword delimiter, you can add a tab in the Keywords box only by copyingand pasting a tab (or the string you want to search on with a tab in it), fromanother application, such as Notepad. If the data source is case sensitive andyou want to perform a case insensitive search, click the Search arrow and thenclick Case Insensitive.
5. If you clicked multiple values, click the right arrow button to add them tothe Selected values box.
6. Click Insert.
Tip: To control where values appear in the Expression Definition box, you can
click the copy button if you selected a single value or the copy all buttonif you selected multiple values instead. The values are copied to the clipboard,and you can then paste them where you want.
Chapter 9. Relational Reporting Style 233

Related concepts:“Searching for values might return unexpected results” on page 482In the expression editor, when searching for values for a data item, the results youobtain might contain unexpected results if the data item is not a string data type.Because you can edit the expression for a data item, IBM Cognos BusinessIntelligence cannot determine with certainty what the data type is.
Ignoring the Time Component in Date ColumnsDatabase systems use Date, Time, and Timestamp to represent date and timevalues. While a timestamp type holds a date and time component, an applicationmay allow the RDBMS to default the time component. When rows are inserted,updated, or queried, the application may specify only a date value and leave theRDBMS to extend the value to include a default time (usually 00:00:00.000).
The challenge with a timestamp is when the application has no immediate interestin the time component. For example, the business question How many orders weretaken today? implies all orders taken irrespective of what time the order wasbooked. If the application defaulted the time component as it stored rows, thequery that was used to answer the question returns the count of orders takentoday. If the application stored the actual time component, the query likely returnsno data, because the number of orders entered at midnight is probably zero.
Relying on the time defaults can be dangerous if the application changes and startsto capture actual times. To avoid this problem, you canv truncate the time by creating a derived columnv convert the timestamp to a datev create a hi-low filter
Truncating the Time by Creating a Derived ColumnIn the IBM Cognos Framework Manager model, create a derived column using acalculated expression that truncates the time from a timestamp, and returns atimestamp containing the original date and a default time. For example, if you usean Oracle data source, the following expression creates the derived columnDATEONLY from COL1, where COL1 contains the values as stored by theapplication while DATEONLY contains the dates with the default time of 12:00:00AM:
Select COL1,trunc(COL1) as DATEONLY from [SCOTT_TIGER].DATES
Tip: You can change the data format of the column to show only the date value bysetting the Date Style property to Short.
You can then apply filters to the DATEONLY column that would return the correctresults. If you create a parameter in IBM Cognos Report Studio that filters on thiscolumn, the default prompt will present a date and time control because the datatype is still a timestamp.
Converting the Timestamp to a DateIn the IBM Cognos Framework Manager model, define a calculation that uses thecast function to convert the timestamp to a date. For example, the followingexpression converts the data type of the column COL1 to date:
cast ([SCOTT_TIGER].[DATES].[COL1],DATE)
234 IBM Cognos Report Studio Version 10.2.1: User Guide

If you create a parameter in IBM Cognos Report Studio that filters on thiscalculation, the default prompt presents a date control.
Ignoring the Time by Creating a Hi-Low FilterYou can create a hi-low filter to ignore the time. In the IBM Cognos FrameworkManager model, create a filter in the form date-column between date-lowtime anddate-hightime. For example, the following expression returns all values between00:00:00:000 and 23:59:59:000 for a given day:
[SCOTT_TIGER].[DATES].[COL1] between?p1? andcast(substring(?p1?,1,10),’23:59.59.000’,timestamp)
Sorting Relational DataYou can sort items to view them in your preferred order. By default, IBM CognosReport Studio retrieves items in the order defined in the data source. OLAP datasources always have a defined order. Relational and dimensionally-modeledrelational data sources may not always have a defined order. The data modelerdefines the sorting options in the model.
For more information about data modeling, see the IBM Cognos FrameworkManager User Guide. Sorting applied in Report Studio applies only to the layoutwithin the report.
You can sort items in a list in ascending or descending order based on a value or alabel, such as revenue or employee name. You can also perform advanced sortingto sort columns within groups or to sort a row or column using another data item.
Tip: The Sales Growth Year Over Year sample report in the GO Data Warehouse(analysis) package includes sorting. For more information about The SampleOutdoors Company samples, see Appendix C, “Sample Reports and Packages,” onpage 507.
Procedure1. Click the column or row on which to sort.
2. Click the sort button and click Ascending or Descending.An arrow appears beside the data item to indicate that a sort order was set.When you specify a sort order for more than one column, the columns aresorted in the order in which they were inserted in the report. For example, youadd columns A, B, and C to a report and specify a sort order for each. Whenyou run the report, column A is sorted first, then column B, and then columnC. You can change the order in which the columns are sorted in the EditLayout Sorting options.
Tip: To remove a sort order, click Don't Sort.
Perform Advanced Layout SortingIf you use relational data, in a list, you can sort columns within groups and changethe sort order of columns. In a crosstab, you can sort a row or column by anotheritem, such as Order year by Revenue.
Procedure1. Click a column.
Chapter 9. Relational Reporting Style 235
In a crosstab, click the sorted row or column on which to perform advancedsorting.
2. Click the sort button and click Edit Layout Sorting.3. To sort a list column within a group, do the following:
v In the Groups pane, under the Groups folder, expand the folder of thegrouped column.
v In the Data Items pane, drag the data items to sort to the Sort List folder.
Tip: You can also drag data items from the Detail Sort List folder.
v Click the sort order button to specify ascending or descending order.4. To change the sort order of columns, in the Groups pane, change the order of
columns in the Sort List folder of a group or in the Detail Sort List folder.
Tip: Add items to the Detail Sort List folder to sort items that are not groups.5. If you are sorting a crosstab, do the following:
v From the Data Items pane, drag the item on which to sort to the Sort Listpane.For example, you have a crosstab with Product line as rows, Order year ascolumns, and Revenue as the measure. To sort Order year by Revenue, dragRevenue to the Sort List pane.
v Click the sort order button to specify ascending or descending order.
Working with Relational QueriesQueries specify what data appears in the report. In IBM Cognos Report Studio,you create and modify queries using Query Explorer.
Query Explorer provides an alternative way to modify existing reports or toauthor new reports. You can use Query Explorer to perform complex tasks andother tasks that are more difficult to do in the report layout. For example, useQuery Explorer tov improve performance by changing the order in which items are queried from the
database, or by changing query properties to allow the report server to executequeries concurrently where possible
Note: Only queries that are referenced in the report layout can be executedconcurrently. If a query is defined in Query Explorer by joining two or moreexisting queries, IBM Cognos Business Intelligence cannot execute the sourcequeries concurrently. By default, queries run sequentially. Your administratormust enable the concurrent query execution feature. For more information, seethe IBM Cognos Business Intelligence Administration and Security Guide.
v view or add filters and parameters and modify their propertiesv view or add dimensions, levels, and factsv incorporate SQL statements that come from other reports or reports that you
writev create complex queries using set operations and joins
236 IBM Cognos Report Studio Version 10.2.1: User Guide

Related concepts:“Queries” on page 30Queries determine what data items appear in the report. Sometimes you wantdetailed rows of data, which you obtain by using a simple SELECT statement.Other times you must calculate totals or averages using summary functions andgrouped columns or must apply filters to show only the data you want.
Specify a List of Data Items for an ObjectSpecify the list of data items for an object when you must reference a data itemthat is in a query but is not in the layout.
For example, you want to add a layout calculation to a list that uses a data itemthat is in the query definition. If the data item does not appear in the list, youmust reference it in order to make the layout calculation work. You must alsospecify the list of data items if you apply conditional formatting that uses a dataitem that is not in the query.
Procedure1. Click a layout object.
Tip: For a list of layout objects for which you can specify a list of properties,see the Properties property in Appendix G, “Report Studio Object and PropertyReference,” on page 771.
2. In the Properties pane, double-click the Properties property and select dataitems.
Relate a Query to a LayoutQueries and layouts work together. After you decide the type of data that youneed, you must create a layout in which to show the results. Each column of datamust be both selected for the query and shown in a layout unless there are somecolumns that you do not want to show. The query and layout portions of a reportmust be linked to produce a valid report.
IBM Cognos Report Studio automatically links query and layout. For example,when you use Report Studio and the list report layout, query and layout areautomatically linked.
Procedure1. Select a data container.2. In the Properties pane, set the Query property to a query.
3. From the Data Items tab , drag data items from the query to the datacontainer.
Connecting Queries Between Different Data SourcesThis section lists the data sources between which you can and cannot connectqueries.
IBM Cognos Business Intelligence supports the following:v RDBMS to RDBMS joinsv set operations of any two queriesv master detail relationships between any two queries
Chapter 9. Relational Reporting Style 237

v drill from any query to any other query
You cannot create the following types of joins:v cube-to-cube (homogeneous)v cube-to-cube (heterogeneous)v cube-to-RDBMSv cube-to-SAP BWv SAP-BW-to-RDBMS
Add a Query to a Relational ReportYou can create multiple queries in Query Explorer to suit your particular needs.For example, you can create a separate query for each data container in a report toshow different data.
Tip: The Briefing Book sample report in the GO Sales (analysis) package and theTop 10 Retailers for 2011 sample report in the GO Data Warehouse (analysis)package include multiple queries. For more information about The SampleOutdoors Company samples, see Appendix C, “Sample Reports and Packages,” onpage 507.
Procedure
1. Pause the pointer over the query explorer button and click Queries.
2. From the Toolbox tab , drag one of the following objects to the work area.
Object Description
Query Adds a query.
Join Adds a join relationship.
Union Adds a union operator.
Intersect Adds an intersect operator.
Except Adds an except (minus) operator.
SQL Adds SQL commands.
Note: When adding queries to the reportv right-click the work area and click Show Package Sources to see the queries
that use data items from a packagev right-click the work area and click Expand References to see the
relationships that exist between queries in the report, which is useful whenyou are creating complex queries
3. In the Properties pane, set the object properties.For example, if you added a join, set the Join Relationships property to definethe join.
4. Double-click a query.
5. From the Source tab , drag data items to the Data Items pane.
Tip: You can add data items to the query that you do not want to appear inthe layout. For example, to filter on Product line code and show Product line inthe layout, you must add both data items to the query.
238 IBM Cognos Report Studio Version 10.2.1: User Guide

6. To create a new data item, from the Toolbox tab , drag Data Item to theData Item pane.
7. To add a filter, from the Toolbox tab, drag Filter to the Detail Filters orSummary Filters pane and define the filter expression.
Tip: You can also create a filter by dragging a data item from the Source tab toone of the filters panes and completing the filter expression.
Create a Union QueryCreate a union query to combine two or more queries into one result set.
You can combine queries that use different data sources. For example, you cancombine a query that returns data from a dimensional data source with a querythat returns data from a relational data source.
Before you begin
To combine two queries, the following conditions must be met:v The two queries must have the same number of data items.v The data items must have compatible types and appear in the same order.
For numeric data types, integer, float, double, and decimal are compatible.For string data types, char, varChar, and longVarChar are compatible.For binary data types, binary and varBinary are compatible.Date data types must match exactly.
Procedure
1. Pause the pointer over the query explorer button and click Queries.
2. From the Toolbox tab , do the following:v Drag Query to the work area.v Drag Union, Intersect, or Except to the right of the query.
Two drop zones appear to the right of the operator.v Drag a Query object to each drop zone.Two queries are created in the work area, and a shortcut to each queryappears in the drop zones.
3. Double-click each query that makes up the union query and add data items tothe query.
4. Return to the Queries work area.5. Click the set operator that you added in step 2.6. In the Properties pane, set the Duplicates property to remove or preserve
duplicate rows.7. Double-click the Projection List property.
The projection list shows the list of projected data items for the set operation.8. To automatically produce the list of projected data items, click Automatically
generated.IBM Cognos Report Studio generates the projection list using only one of thetwo queries in the union.
Chapter 9. Relational Reporting Style 239

9. To add, delete, move, or rename data items in the projection list, click Manualand make the changes.
10. Double-click the union query.
11. From the Source tab , drag data items to the Data Items pane.
Results
The union query is complete. You can now link the union query to a datacontainer in the layout.
Example - Create a Two-column List Report for Three Data ItemsYou are a report author at The Sample Outdoors Company, which sells sportingequipment. You are requested to create a list report that shows revenue for allproduct lines and order methods. However, you want the product lines and ordermethods to appear in a single column. To create this report, you use a union queryto join the Product line and Order method data items.
Procedure1. Open IBM Cognos Report Studio with the GO Data Warehouse (query)
package.2. In the Welcome dialog box, click Create a new report or template.3. In the New dialog box, click Blank.
4. Pause the pointer over the query explorer button and click Queries.
5. From the Toolbox tab , do the following:v Drag Query to the work area.v Drag Union to the right of the query.
Two drop zones appear to the right of the operator.v Drag a Query object to each drop zone.
Query2 and Query3 are created in the work area, and a shortcut to eachquery appears in the drop zones.
6. Double-click Query2.
7. From the Source tab , open Sales and Marketing (query), then openSales (query). Then drag the following data items to the Data Items pane:v from the Products folder, drag Product line
v from the Sales fact folder, drag Revenue
8. From the Toolbox tab , drag Data Item to the Data Items pane.The data item will be used to sort product lines and order methods in thereport.
9. In the Expression Definition box, type 'A' and click OK.10. In the Properties pane, set the Name property to
Sort key
11. On the toolbar, press the back button to return to the Queries work area.12. Double-click Query3.
240 IBM Cognos Report Studio Version 10.2.1: User Guide

13. From the Source tab , drag the following data items to the Data Itemspane:v from the Order method folder, drag Order method type
v from the Sales fact folder, drag Revenue
14. Repeat steps 8 to 10 to create a Sort key data item in Query3 with 'B' as itsdefinition.
15. On the toolbar, press the back button to return to the Queries work area.16. Click the Union operator.17. Double-click the Projection List property.
The Product line item in the projection list contains both product lines andorder methods.
18. Click Manual.
19. Click Product line, and then click the edit button .20. In the Edit box, type the following after Product line:
& Order method
21. Click OK twice.22. Double-click Query1.
23. From the Source tab , drag the following data items to the Data Itemspane:v Product line & Order method
v Revenue
v Sort key
24. Select the Sort key data item and, in the Properties pane, set the Pre-Sortproperty to Sort ascending.When you run the report, all product lines will appear first followed by allorder methods.
25. Pause the pointer over the page explorer button and click Page1.
26. From the Toolbox tab , drag List to the work area.27. Click the list.
28. Click the select ancestor button in the title bar of the Properties pane andclick List.
Tip: You can also click the container selector (three orange dots) of the list toselect it.
29. In the Properties pane, set the Query property to Query1.The list is linked to the union query.
30. Double-click the Properties property.31. Select the Sort key check box and click OK.
Since the Sort key data item does not appear in the list, you must make it aproperty of the list before it can sort product lines and order methods.
32. From the Data Items tab , drag the following items from Query1 to thelist:
Chapter 9. Relational Reporting Style 241

v Product line & Order method
v Revenue
33. Run the report.
Results
A list report with two columns is produced. All product lines and order methodsappear in the first column.
Create a Join RelationshipYou can create a join relationship to join two queries.
In general, join relationships should be created in the IBM Cognos FrameworkManager model. Create a join relationship in IBM Cognos Report Studio if whatyou are trying to do cannot be modeled in Framework Manager.
Procedure
1. Pause the pointer over the query explorer button and click Queries.
2. From the Toolbox tab , do the following:v Drag Query to the work area.v Drag Join to the right of the query.
Two drop zones appear to the right of the operator.v Drag a Query object to each drop zone.
Two queries are created in the work area, and a shortcut to each queryappears in the drop zones.
3. Double-click each query that makes up the join query and add data items tothe query.
4. On the toolbar, press the back button to return to the Queries work area.5. Click Join.
242 IBM Cognos Report Studio Version 10.2.1: User Guide

6. In the Properties pane, double-click the Join Relationships property.7. Click New Link.8. To create the link, click a data item in the left query, and then click a data item
in the right query.9. For each query, click Cardinality and click a cardinality option.
10. Click Operator and click an operator.11. To convert the join relationship to an expression, click Convert to expression.
Convert the join relationship to an expression to make changes to the joindefinition.
Note: After you convert the relationship to an expression, you cannot changeit back to a relationship.
12. Double-click the join query.
13. From the Source tab , drag data items to the Data Items pane.
Results
The join query is complete. You can now link the join query to a data container inthe layout.
Reference a Package Item in a Child QueryWhen you create a child query in IBM Cognos Report Studio, you can onlyreference items from its parent or from other queries. For example, if you add afilter to a child query, the only items that you can insert into the expression areitems that exist in other queries defined in the report. To add an item from thepackage, you must unlink the child query from its parent.
Procedure
1. Pause the pointer over the query explorer button and click Queries.2. Unlink the child query from its parent by selecting the parent query shortcut to
the right of the child query and clicking the delete button .3. Double-click the child query.
Package items are now available on the Source tab .4. Add package items.
For example, to create a detail filter that references a package item, drag thefilter object from the Toolbox tab to the Detail Filters pane, and then add theitems in the Expression Definition box.
5. Click the up arrow button in the toolbar to return to the queries work area.6. Recreate the link between the child query and the parent query by dragging the
parent query to the right of the child query.7. If necessary, double-click the child query to complete it.
For example, if you created a filter, you may need to complete the filterexpression.
Chapter 9. Relational Reporting Style 243

Create a Master Detail RelationshipCreate a master detail relationship to deliver information that would otherwiserequire two or more reports. For example, you can combine a list with a chart. Thelist can contain product lines and the chart can show details for each product line.
Master detail relationships must appear in nested frames to produce the correctresults. You can create a master detail relationship in two ways:v Use a parent frame for the master query and a nested frame for the detail query.v Associate a report page with the master query and use a data container, such as
a list or crosstab, for the detail query.
You cannot display parent data in the child frame or child data in the parentframe. Also, you cannot perform calculations across master detail queries.
You can use a master detail relationship to show data from separate data sourcesin a single report. However, the data sources must be contained in the samepackage.
If you are working with an SAP BW data source, you cannot use a data item fromthe master query that contains non-ASCII values.
Before you begin
To create a master detail relationship using queries that reference two differentdimensional data sources, you must first link the members by aliasing the levelsthat contain the members.
Procedure1. To use a parent frame for the master query and a nested frame for the detail
query:
v From the Toolbox tab , drag a List, Repeater Table, or Repeater to thereport.
v Add a second data container to the object you inserted.You can insert a list, crosstab, chart, repeater table, or repeater into a list.You can add a list to a repeater table or repeater.
v Add data items to both data containers.2. To associate a report page with the master query and use a data container for
the detail query:v Click anywhere in the report page.
v In the Properties pane, click the select ancestor button and click Page.v Set the Query property.v From the Toolbox tab, drag a data container to the report.
3. To link a data item in the master query to a parameter in the detail queryinstead of to another data item, create the parameter in the detail query.Use parameters to filter values at a lower level in the detail query.
v Pause the pointer over the query explorer button and click the detailquery.
v From the Toolbox tab, drag the Filter object to the Detail Filters box.v In the Expression Definition box, create the parameter.
244 IBM Cognos Report Studio Version 10.2.1: User Guide

4. Pause the pointer over the page explorer button and click the reportpage.
5. Click anywhere in the report page.6. In the Properties pane, click the select ancestor button and click Page.7. Click the data container containing the details.8. From the Data menu, click Master Detail Relationships.9. Click New Link.
10. In the Master box, click the data item that will provide the primaryinformation.
11. To link the master query to a data item, in the Detail box, click the data itemthat will provide the detailed information.
12. To link the master query to a parameter, in the Parameters box, click theparameter that will provide the detailed information.
Tip: To delete a link, select the link and press the Delete key.13. If your detail query object is a chart, you can disconnect a chart title from the
master query.v Click the chart title, and then, from the Data menu, click Master Detail
Relationships.v Clear the Use the master detail relationships from the chart check box.
14. If your master detail relationship includes a chart as the detail and you areusing automatic axis ranges, you can set the same axis range for all the detailcharts:v Select the axis.v In the Properties pane, under General, double-click the Axis Range
property.v Under Maximum and Minimum, click Automatic.
The master detail report option is only available with automatic axis ranges.v Under Master detail reports, select the Same range for all instances of
chart check box.For more information about axis ranges, see “Change the Axis Scale of aCurrent Default Chart” on page 120.
Tip: To avoid seeing the same data item twice in the report, click the dataitem in the data container driven by the detail query and click the cut button.This removes the item from the report display but keeps it in the query.
Master Detail or Burst Reports with Charts or Crosstabs MayResult in Denial of ServiceWhen running a master detail or burst report that includes a chart or crosstab, diskspace exhaustion may cause the report or other requests to fail. A large set of burstkeys or master rows may produce one or more charts per detail, resulting in manymaster detail executions. This may cause the temp folder to accumulate manygigabytes of temporary files containing data required for successful chartrendering.
To avoid this issue, we recommend that you test large master detail or burstreports that include charts or crosstabs to determine the potential peak diskrequirements for the report.
Chapter 9. Relational Reporting Style 245

Working with Queries in SQLFor each query in a report, you can work with the SQL that is executed when yourun a report.
You canv view the SQL for an entire report or a queryv build a report using your own SQLv convert a report to use SQL directlyv edit the SQL
When working with a relational data source, the SQL that is produced by IBMCognos Report Studio depends on the report output selected.
Note: MDX is not available with relational or DMR data sources.
View the SQL for an Entire Report or a QueryView the SQL to see what is passed to the database when you run a report.
Procedure1. To view the SQL for the entire report, from the Tools menu, click Show
Generated SQL/MDX.This option shows the SQL that will be executed in the data source. The SQL isorganized by query and by query result. If a query is used in more than onedata container, a query result is generated for each data container.
2. To view the SQL for a specific query, do the following:
v Pause the pointer over the query explorer button and click the query.v In the Properties pane, double-click the Generated SQL/MDX property.The Generated SQL/MDX property shows the SQL that is executed when youview tabular data (from the Run menu, click View Tabular Data). Tabular datashows the data that is produced by the query in the form of a list. You can usethis property to help you build advanced queries.
Results
The SQL for the query appears in the Generated SQL/MDX dialog box. You canchoose to view native SQL, which is the SQL that is passed to the database whenyou execute the query, or Cognos SQL, which is a generic form of SQL that IBMCognos Report Studio uses. Cognos SQL is converted to native SQL before thequery is executed.Related tasks:“Showing prompt values in generated SQL or MDX” on page 326You can show prompt values when viewing the generated SQL or MDX of a queryor report.
Build a Report Using Your Own SQLYou can build a report by adding SQL from an external source, such as anotherreport.
If you edit the SQL of a query, you must change the Processing property for thatquery to Limited Local.
246 IBM Cognos Report Studio Version 10.2.1: User Guide

Procedure1. From the File menu, click New.2. Click Blank.
3. Pause the pointer over the query explorer button and click Queries.
4. From the Toolbox tab , drag Query to the work area.5. From the Toolbox tab, to build an SQL query, drag SQL to the right of the
query
Tip: You can drag SQL anywhere in the work area, and IBM Cognos ReportStudio will automatically create a query.
6. In the Properties pane, double-click the Data Source property and click a datasource.
7. If required, set the Catalog property to the name of the catalog.8. Double-click the SQL property and type the SQL.9. Click Validate to check for errors.
10. In the Properties pane, set the Processing property to Limited Local.11. Double-click the query.
If the SQL is valid, the data items defined in the SQL appear in the DataItems pane.
12. Pause the pointer over the page explorer button and click a report page.13. From the Toolbox tab, drag an object to the work area.
For example, drag a list, crosstab, chart, or repeater.14. Click the data container.
15. In the Properties pane, click the select ancestor button and click thecontainer you just created.For example, if you created a list, click List.
Tip: You can also click the container selector (three orange dots) of thecontainer to select it.
16. Set the Query property to the query for the report type.
17. From the Data Items tab , drag the items from the query you chose in theprevious step to the data container.
Convert a Query to SQLYou can convert a query to SQL to edit it. You may want to do this to improveperformance or to use SQL features that are not supported directly by IBM CognosReport Studio.
Converting a query to SQL is an irreversible process.
Procedure
1. Pause the pointer over the query explorer button and click the query.2. In the Properties pane, double-click the Generated SQL property.3. Click Convert.4. Click Validate to check for errors.
Chapter 9. Relational Reporting Style 247

5. In the Properties pane, set the Processing property to Limited Local.
Edit the SQLYou can edit the SQL for a query that has been created as an SQL query or that hasbeen converted to SQL.
Procedure
1. Pause the pointer over the query explorer button and click the SQL itemunder the query.
2. Double-click the SQL item.3. Make changes in the text box.4. Click Validate to check for errors.
First-Rows OptimizationThe SQL produced by IBM Cognos Report Studio depends on the report formatyou choose. For example, if you specify HTML format, first-rows optimization isrequested. All-rows is requested if you specify PDF.
It is important for database administrators and programmers to remember thatReport Studio does not always use first-rows optimization. If you assumefirst-rows optimization is always requested, this can cause the RDBMS optimizer toprocess the query differently than you expect.
Using Relational CalculationsInsert a calculation to make your report more meaningful by deriving additionalinformation from the data source. For example, you create an invoice report, andyou want to see the total sale amount for each product ordered. Create a calculatedcolumn that multiplies the product price by the quantity ordered.
You build calculations in the expression editor using functions.
If a calculation is used in multiple reports, or by different report authors, ask yourmodeler to create the calculation as a standalone object in the model and include itin the relevant package.
You can add calculations to lists, crosstabs, and all other data containers. You canalso add calculations directly to a page header, body, or footer. However, you mustfirst associate a query to the page. For more information, see “Add a Page to aReport” on page 437
Units of Measure
When creating calculations in IBM Cognos Report Studio and IBM Cognos QueryStudio, you may encounter problems with the units of measure. For example, thecalculation Cost*Cost returns the unit of measure * instead of a currency unit ofmeasure. To avoid this problem, change the format of the corresponding column toobtain the desired unit of measure.
Calculation Solve Order
When calculations in the rows and columns of a report intersect, calculations areperformed in the following order: addition or subtraction, multiplication ordivision, aggregation (rollup), and then the remaining arithmetic functions.
248 IBM Cognos Report Studio Version 10.2.1: User Guide

The remaining functions are as follows:v absolute, round, round down, average, minimum, maximum, medium, countv percentage, % difference (growth) or % of totalv rank, quartile, quantile, or percentile
If both calculations have the same precedence, for example, if they are bothbusiness functions, then the row calculation takes precedence.
Limitations of Calculations
You should use only the expressions and functions available in Report Studio, andfollow their syntax.
Minimal checking exists for calculations. If your calculation uses an invalidexpression, your report results may contain unexpected values.
In addition, you should define member summaries as follows:
summary_function (currentMeasure within set set_reference)
where set_reference is a level or set inserted from the Source tab .
Unless otherwise required, summary_function should be the aggregate function. Ifyou use an explicit summary function, you may encounter problems withmeasures and scenario or account dimension members (such as profit margin,distinct count, and so on) that have complex rollup rules, or members that do notroll up.
Know your data, and confirm with the owner of the cube where overriding theautomatic aggregation is safe.
Because of the above limitations, summaries of calculations may not providereliable values. For convenience, you may have to build reports where rowsummaries and calculated member columns intersect. In such reports, theseintersections may contain unexpected values. In contrast, row calculationsintersecting with column aggregates using the aggregate function are safe becausethe calculation is performed on the reliably summarized values.
Create a Simple CalculationYou can select items in your report and create simple calculations.
In addition to simple arithmetic calculations, you can perform the followingcalculations:
Calculation Description
Rollup Summarizes, or rolls up, all the values in ahierarchy.
% Calculates the value of a selected item as apercentage of another item.
Chapter 9. Relational Reporting Style 249

Calculation Description
% Growth Calculates the difference between two itemsas a percentage.
% Of Base This calculation is only available if youselect two members from differenthierarchies, each from a different edge.
This calculation takes the first selectedmember from edge A and the secondselected member from edge B. Thecalculation result of a percent of base shouldbe such that all the values for member Awill compare itself to the intersect value ofmember A and B.
Custom Allows you to specify your own value whenperforming a simple arithmetic calculation.Also allows you to change the order ofoperands or type a custom name for thenew calculated row or column.
Procedure1. Select the items in your report to calculate.
2. Click the insert calculation button and select the calculation to perform.
Tip: Calculations that are not applicable to the items you selected are greyedout.
3. To change the order of the operands, the name of the calculated item added tothe report, or to create a custom calculation, click Custom.
Results
The calculation appears as a new row or column in your report.
Insert a Query CalculationInsert a query calculation into your report to add a new row or column withvalues that are based on a calculation.
For example, you create a query calculation named Euros that converts dollars toeuros by multiplying an existing dollar measure by a conversion rate. Euros canthen be displayed to end users in a separate row or column.
Note: When creating an expression that will be used in a double-byteenvironment, such as Japanese, the only special characters that will work areASCII-7 and ~ -- || - $ ¢ £ ¬.
Not all data sources support functions the same way. The data modeler can set aquality of service indicator on functions to give a visual clue about the behavior ofthe functions. Report authors can use the quality of service indicators to determinewhich functions to use in a report. The quality of service indicators are:v not available (X)
250 IBM Cognos Report Studio Version 10.2.1: User Guide

The function is not available for any data source in the package.v limited availability (!!)
The function is not available for some data sources in the package.v limited support (!)
The function is available for all data sources in the package but is not naturallysupported for that data source. IBM Cognos Business Intelligence uses a localapproximation for that function. Because an approximation is used, performancecan be poor and the results may not be what you expect.
v unconstrained (check mark)The function is available for all data sources.
When inserting literal strings in an expression, you must enclose the string insingle quotation marks. If the string contains a quotation mark, it must be escaped.For example, if you want to insert the string ab'c, you must type 'ab''c'.
Procedure
1. From the Toolbox tab , drag Query Calculation to the report.2. Type a meaningful name for your expression in the Name box.
For example, if you are calculating the difference between 2012 revenue and2011 revenue, you could name your expression 2012 - 2011 Revenue.
3. In the Available Components pane, define the calculation:
v To add data items that are not shown in the report, on the source tab ,double-click the data items.
v To add data items that are in the report but not necessarily in the model,
such as calculations, on the data items tab , double-click the data items.
v To add data items from a specific query, on the queries tab , double-clickdata items.
v To add functions, summaries, and operators, on the functions tab ,double-click elements.
v To add a value that is derived from a parameter, on the parameters tab ,double-click a parameter.Parameters define prompts, drill-through reports, and master detailrelationships.
v To add a macro, on the macros tab , double-click the parameter maps,session parameters, or macro functions you want to add to the macroexpression.
Tip: Use Insert macro block to get you started with creating the macroexpression. Insert macro block inserts number signs in the expression. Makesure that the macro expression you create is between the number signs.
Tips:
v You can also type the calculation directly in the Expression Definition box.v When typing date values, ensure that the date format is correct for your
database type.
Chapter 9. Relational Reporting Style 251

v To copy and paste expression components in the Expression Definition
pane, you can use the copy button and the paste button .For information about specific functions, see Appendix F, “Using the expressioneditor,” on page 555.
4. Click the validate button .Any validation errors appear on the Errors tab of the Information pane.
Related concepts:Chapter 17, “Using Query Macros,” on page 403A macro is a fragment of code that you can insert in the Select statement of aquery or in an expression. For example, add a macro to insert a new data itemcontaining the user's name.
Create a Layout CalculationCreate a layout calculation to add run-time information to your report, such ascurrent date, current time, and user name.
When creating layout calculations, only report functions are available to you in theexpression editor. These functions are executed in the report layout, as opposed tothe other functions which are executed in the query.
Procedure
1. From the Toolbox tab , drag Layout Calculation to the report.2. In the Available Components box, define the calculation:
v To add data items that are not shown in the report, on the source tab ,double-click data items.
v To add data items from a specific query, on the queries tab , double-clickdata items.
v To add functions, summaries, and operators, on the functions tab ,double-click elements.
v To add a value that is derived from a parameter, on the parameters tab ,double-click a parameter.Parameters define prompts, drill-through reports, and master detailrelationships.
Tip: You can also type the expression directly in the Expression Definitionbox.For more information about creating expressions, see Appendix F, “Using theexpression editor,” on page 555.
3. Click the validate button .
252 IBM Cognos Report Studio Version 10.2.1: User Guide

Chapter 10. Dimensional Reporting Style
The dimensional reporting style is recommended for dimensionally-modeledrelational (DMR) and Online Analytical Processing (OLAP) data sources.Dimensional data is best represented by crosstabs, maps, and charts. This data isshown in IBM Cognos Report Studio in dimensions, hierarchies, levels, andmembers.
In dimensional reporting, you summarize data by using member summaries andwithin set aggregation. You focus data in dimensional reporting by adding only therelevant members to the edge of a crosstab or to the context filter. You can alsoenable drilling up and drilling down in dimensional reports.
IBM Cognos Analysis Studio and IBM Cognos Workspace Advanced are alsoavailable to work with dimensional data.
Add Dimensional Data to a ReportFor dimensional and mixed model data sources, you can view the full data tree by
clicking the view package tree button in the Source tab. You can switch to the
dimensional-only data tree by clicking the view members tree button .
Note: We recommend using dimensional data in the dimensional reporting style.However, if you are using relational data, see “Add Relational Data to a Report”on page 213.
If you are working with a dimensional data source, data items are organizedhierarchically. Dimensional data sources include OLAP and dimensionally-modeled
relational (DMR) data sources. The Source tab shows a metadata-based viewof the data.
© Copyright IBM Corp. 2005, 2013 253

Note: The names of levels and members in a dimension come from the model. It isthe responsibility of the modeler to provide meaningful names.1. Package
Packages are subsets of a model containing items that you can insert in areport.
2. DimensionDimensions are broad groupings of descriptive data about a major aspect of abusiness, such as products, dates, or markets.
3. Level hierarchyLevel hierarchies are more specific groupings within a dimension. For example,for the Years dimension, data can be organized into smaller groups, such asYears, Current Month, and Last Month.
4. Members folderMembers folders contain the available members for a hierarchy or level. Forexample, the Members folder for the Years level hierarchy contains everythingfound in the Year, Quarter, and Month levels.
5. LevelLevels are positions within the dimensional hierarchy that contain informationat the same order of detail and have attributes in common. Multiple levels canexist within a level hierarchy, beginning with a root level. For example, theYears level hierarchy has the following related levels.
Level Level name Description
Root Years The root level.
First Year Years in the Years root level.For example, 2013, 2012, and2011.
Second Quarter Quarters for each year in theYear level. For example, 2013Q1, 2013 Q2, and 2013 Q3.
254 IBM Cognos Report Studio Version 10.2.1: User Guide

Level Level name Description
Third Month Months for each quarter inthe Quarter level. Forexample, Jan., Feb., and Mar.
Tip: The Measures dimension contains the measures available in the datasource.
6. Member propertyMember properties are attributes that each member possesses. For example,gender could be a property for all employee members. For more informationabout member properties, see “Insert a Member Property” on page 258.
Related concepts:“Limited Support for Relational Functions When Used with OLAP Data Sources”on page 533When working with an OLAP data source, we recommend that you not userelational functions, such as substring and concatenation functions, in a report thatalso contains a measure with the Aggregate Function property set to Calculated orAutomatic in the model. If you do so, you may encounter unexpected results. Forexample, some summaries are calculated using the Minimum function instead ofthe aggregate function derived from the individual query items.
Customize the Source TreeWhen using dimensional data, you can customize how you see data in the sourcetree. You can select a full package tree view that shows dimensions, hierarchies,levels, an optional members folder, and member properties.
Or you can select a members-only tree view, such as the one in IBM CognosAnalysis Studio. This view allows you to add only members in your report.
Procedure
1. Click the Source tab .
2. To view the members-only tree view, click the view members tree button .
3. To view the full package tree, click the view package tree button .4. To change what is included in the tree, right-click and click Package Tree
Settings.Use the Preview pane to choose the appropriate settings.
Insert a MemberBy default, when you insert members from the source tree into your report withIBM Cognos Report Studio, single members are inserted without any details orchildren. You can change how members are inserted. For example, you may wantto insert a member along with all its children or insert only the member's children.Or you may want to insert members as a set.
When you double-click a member that you have already inserted in your report,by default, its children are inserted after the parent member. You can controlwhether the children are inserted before or after, nested, or not inserted at all: fromthe Tools menu, click Options, and then choose a setting on the Edit tab.
Chapter 10. Dimensional Reporting Style 255

When inserting members into a crosstab, ensure that you insert members from thesame hierarchy on only one of the crosstab edges. If you insert members from thesame hierarchy on both edges of the crosstab, you may encounter unexpectedresults. For example, a report that uses members from years in the rows andQuarters in the columns is very difficult to read because the useful numbers aredistributed over a large area of mostly blank cells.
Calculated members from the data source also appear in the source tree. However,calculated members in Microsoft SQL Server Analysis Services (SSAS) cubes do notappear in the list of descendants in the query. If you want these calculatedmembers to appear in a report or a prompt, you must insert them explicitly.
Procedure
1. From the Source tab , click the insert single member button andselect how to insert members.
2. If you want to insert members within a set instead of inserting individual
members, click the create sets for members button .3. Do one of the following:
v To insert a member above or below another member, drag the new memberabove or below a cell.A flashing black bar appears where you can drop the new member.
v To replace a member, drag the new member to the cell with the member toreplace.A flashing black box appears where you can drop the new member.
Search for a MemberYou can perform a member search to quickly find data.
You can control the number of members that are returned in a search by specifyinga value for the Member display count limit (in source tree) option (Tools,Options, Advanced tab).
Procedure
1. From the Source tab , select and then right-click a hierarchy or level
and click Search.2. In the Words box, type the words or characters for which to search.3. Click the search parameter to use.4. To search all descendants instead of just the immediate children, select the
Search all descendants check box.For example, when performing a search in a hierarchy, selecting this check boxreturns members found in all the levels of the hierarchy.
5. Click Search.
Results
The search results appear in a hierarchical structure on the Search tab . Youcan browse the hierarchy to explore members at lower levels.
256 IBM Cognos Report Studio Version 10.2.1: User Guide

Tip: You can insert members directly from the Search tab into a report. This cansave you time, because you do not have to define a filter. For example, instead ofinserting Product line from the Source tab and adding a filter for CampingEquipment, you can insert Camping Equipment from the Search tab.
Nest MembersWhen you insert members in your report, you may want to nest them in anotherrow or column to make your report easier to use. You can nest members fromdifferent dimensions. You can also nest sets.
For example, in the following report, the quarters (Q1 to Q4) were selected fromthe Time dimension and nested only for the GO Americas member, which is froma different dimension.
When you filter out children from nested sets, the parent set still appears in yourreport. To avoid this, filter only the top level set and nest only the complete set ofdescendants at the desired levels.
Procedure
From the Source tab , drag the members to the work area.A flashing black bar indicates where you can drop an item.
Insert a HierarchyYou can quickly insert entire hierarchies in a report.
When using an IBM Cognos PowerCube, a SSAS cube, or a dimensionally-modeledrelational data source, you can insert multiple hierarchies from the same dimensionin a crosstab. For example, you can place one hierarchy from a dimension on anedge of the crosstab and nest another hierarchy from the same dimension on thesame edge, on another edge, or in the Context filter area.
You can also perform arithmetic, percentage, and ranking calculations usingmultiple hierarchies.
Summary or analytic calculations that refer to different hierarchies from the samedimension, such as total, count, average, minimum, and maximum, are notsupported. These calculations cause an OP-ERR-0250 error.
Figure 40. Crosstab showing the year to date amount for all four quarters nested beside GOAmericas
Chapter 10. Dimensional Reporting Style 257

Procedure
1. From the Source tab , drag the hierarchy to the report.2. In the Insert Hierarchy dialog box, choose which members to insert:
v To insert only the root members of the hierarchy, click Root members.v To insert all members of the hierarchy, click All members.
Tip: The default Level Indentation property for all members is to show thehierarchical structure when the report is run.
Insert a Member PropertyYou can insert member properties, which are attributes of a member, in yourreport. Member properties provides additional information about the member. Forexample, an employee level may have a property named gender.
In the data tree of the Source tab , member properties are identified by the
icon .
You can only insert properties. You cannot group them.
Procedure
From the Source tab , drag the member property to the report.
Create a Set of MembersUse sets to group members that are logically related for various actions, such asformatting, nesting, and sorting. Creating sets is also useful when members may bedynamic over time. For example, the child accounts of a total assets account maychange from year to year. By creating a set, you do not have to modify the reporteach time accounts are added or removed.
After you create a set of members, you can add or remove members within the set.
You can perform operations on the set such as excluding specific members, movingmembers within the set, showing only the top or bottom members, filtering the set,and expanding or collapsing the members within a set. You can view the setdefinition to see and edit operations that are performed on the set.
Procedure
1. From the Source tab , click the create sets for members button totoggle between adding individual members and creating sets for members.
2. From the Source tab, select the items to include in the set and drag them to thework area.
3. To add or remove members from the set, right-click the set and click EditMembers.Tip: you can also select the set and, in the Properties pane, double-click theMembers property.
258 IBM Cognos Report Studio Version 10.2.1: User Guide
Sharing sets between reportsWhen you are working with dimensional data, you can share a set to make itavailable for inclusion in multiple reports.
You must first create a set in a source crosstab report, create a shared set definition,then refer to it in a target report.
A shared set definition is copied from one report to another. As a result, the setdefinition must not depend on any context from the source report. For example, itmust meet the following criteria:v It cannot reference other shared sets.v It cannot reference other data items.v It cannot contain calculated members.
You cannot change the definition of a shared set from within the target report.However, you can carry out other set operations on it, such as excluding a memberor creating a top 10 list.
Procedure1. In the source crosstab report, create a set that you want to share.2. Select the set. In the Properties pane, in the Sharing property, enter a name
and description for the set.3. Save the report.
4. In the Source tab , right-click the model. Click Add Shared Set Report.5. In the Open box, select the source report that contains the shared set
definition. If it does not exist, a new folder that is called Shared Sets iscreated. It is displayed at the bottom of the source tree.
6. Optional: To add or delete other reports in the Shared Sets folder, right-clickit and click Add Report or Delete Report.
7. Create or open a crosstab target report that you want to refer to the shared setdefinition.
8. In the Source tab , open the Shared Sets folder. Open the source reportthat contains the shared set definition that you want to use.
9. Add the shared set definition into your target report.10. Right-click the shared set in the target report and click Edit Set.11. In the Set Definition box, select the shared set.
12. Click Edit . The Set Reference Properties window opens.13. Set the Inclusion property.
a. Select Run time to retrieve the latest shared set definition every time thatthe report runs.
b. Select Design time to store the shared set definition in the target report.This definition is used until you refresh it.
14. Click OK, then save the report.
Managing shared set referencesAfter you share a set to make it available for inclusion in multiple reports, you canmanage references to it. You can also copy it locally.
Chapter 10. Dimensional Reporting Style 259

You can manage set references in the following ways:v Create a copy of a shared set to be used in a report.
Converting a shared set reference into a copy replaces the reference with a setdefinition that is stored in the report. The report does not reference the sharedset from the source report. Any changes that are made to the shared set in thesource report are not reflected in the target report. Instead of converting thereference to a copy, you can change the Inclusion property of the reference toDesign time. Design time references use a static stored version of the shared setdefinition. However, you can later change the Inclusion property to be Runtime to use the latest shared set definition.
v Modify the properties of a set reference in the target report, including itsInclusion property. You can also modify a set reference in the target report bychanging the set definition it refers to.
v Refresh an existing set reference after a set changed in a source report and youwant to use the updated set. To use the updated set if the Inclusion property isset to Design time, you must refresh its reference.
v Review problems with an existing set reference.
Procedure1. Open the target report that contains the reference to the shared set that you
want to work with.2. Click Tools > Manage Shared Set References.3. To create a copy of a shared set to be used in a report, do the following steps:
a. Select the shared set reference that you want to copy.b. Click Convert Reference to Copy. The Confirm Convert window is
displayed.c. If you want to convert the set reference into a copy that is stored in this
report, click Yes. If you do not want to create a copy, click No.
Important: If you convert the set reference into a copy, it is not updatedwhen the set in the original report changes.
4. To modify an existing set reference in a target report, do the following steps:a. Select the shared set reference that you want to modify.b. Click Edit Reference.c. To modify the set reference properties, select the reference, then click Edit
. The Set Reference Properties window opens. You can now modify theset reference properties.
d. To modify the definition of the set, click New . The Set Definitionwindow opens. You can now modify the set definition.
5. To refresh an existing set reference after a set changed in a source report, do thefollowing steps:a. Select the set reference that you want to refresh.b. Click Refresh Reference.
6. To review problems with an existing set reference in a target report, do thefollowing steps:a. Select the set reference that is causing the problem.b. Review and act upon the message that is displayed.
7. Save the report.
260 IBM Cognos Report Studio Version 10.2.1: User Guide

Edit a SetAfter you create a set, you can view its definition to see, change, add, or deleteoperations, such as the following, that are performed on the set:v excluding a memberv moving members to the top or bottom of a setv applying a top or bottom filterv filtering the setv expanding or collapsing members in a set
The definition of a set shows you, in the graphical tree, the history of all theoperations that are performed on the set.
You can see and change the order in which the operations are performed. Forexample, you apply a top three filter and then exclude one member. Your set nowcontains only two members. You can choose to exclude the member before the topthree filter so that your set still contains three members.
Procedure1. Right-click a set and click Edit Set.
A graphical tree shows all the operations that are performed on the set ofmembers.
2. To see the details of an operation, hover your mouse over an operation node.3. To change the order of an operation, click the operation node, and click the
right or left arrow.
4. To edit an operation, click the operation node and click the edit button .
5. To add a new operation, click the new button .
Exclude Members from a SetYou can choose to remove individual items that are not needed in your analysis.
Procedure1. Right-click the set and click Edit Set.
2. Click the new button and click Exclude.3. In the Exclude box, choose the members to exclude and use the right arrow to
move them to the Members pane.
Move Members Within a SetYou can move one or more members to the top or bottom of a set.
Procedure1. Right-click the set and click Edit Set.
2. Click the new button and click Move to Top or Move to Bottom.3. In the Available members list, select the member to move to the top or bottom
and click the right arrow.The members appear in the order shown in the Members list.
Chapter 10. Dimensional Reporting Style 261

Limit Data to Top or Bottom ValuesYou want to focus your report on the items of greatest significance to yourbusiness question. For example, you want to identify your top 100 customers andwhat that group of customers is worth.
You can limit the data to the top or bottom values of a set. This keeps the amountof data shown in the work area small, even when using large data sources.
You can define a top or bottom rule by specifyingv a number, such as the 50 top or bottom performing sales peoplev a percentage, such as customers who contribute to the top 10% of overall
revenuev a cumulative sum, such as customers who contribute to the first ten million
dollars of overall revenue
If the selected set contains a user-defined filter, the top or bottom rule applies onlyto the included values. For example, if you apply a filter to show only retailerswith revenue greater than one million dollars, the bottom rule applies to the lowestvalues within those results.
You can filter a set of members to show only those at the top or bottom and basethe filter on the measure you are using and the set of members on the oppositeedge. You can also specify a custom filter.
Procedure1. Right-click the set and click Edit Set.
2. Click the new button and click Top or Bottom.3. Under Type, select whether to filter the Top or Bottom values.4. To choose how and how much you want to filter, under Number of items, click
Count, Percent, or Sum and type the number of data items to show, thepercent of data items to show, or the value to sum.
5. Choose the intersection on which to base your filter by clicking the ellipsis (...)button and selecting the members and measure for the intersection from eitherthe Source tab or the Calculated Members and Measures tab.For more information, see “Create an Intersection (Tuple)” on page 306.
Filter the Members Within a SetYou can remove members from within a set by specifying filter conditions so thatonly the members that you require remain. You can filter a set based onv member captions
For example, your set includes employee names and you want to keep only theemployees with names that begin with a specific letter.
v properties that are numeric or stringsFor example, your set includes employee names and you want to filteremployees using the gender property.
v intersection of values (tuple)For example, you want to keep only the employees who used less that ten sickdays for the year 2012.
262 IBM Cognos Report Studio Version 10.2.1: User Guide

If you want to create a more complex filter, you can combine multiple conditionsusing AND, OR, and NOT operators. By default, multiple conditions are combinedwith an AND operator, which means that all conditions must be met for the filterto take effect.
Filtering the members in a set is not the same as relation detail or summary filters.
Procedure1. Right-click the set and click Edit Set.
2. Click the new button and click Set Filter.3. Select how you want to filter.
v If you want to filter the set using a caption, click Caption.v If you want to filter the set using a member property, click Property and
select from the drop-down list.v If you want to filter the set using an intersection of members, or tuple, click
Intersection (tuple) and click the ellipsis (...) button. Then, from Availablemembers and measures, select the desired items and click the right arrow tomove them to the Intersection members and measures list.
4. Specify the Operator and Value to complete your condition and click OK.
5. To add additional conditions, click the new button .6. If you include multiple conditions in your filter, use the AND, OR, and NOT
operators to combine them.v To add an operator, select the conditions that you want to combine, and click
an operator.v To change an operator, double-click the operator to toggle among available
ones or select the operator and then select a different one from the list.v To remove an operator, select it in the condition string, and then click the
delete button .
7. To change a condition, click the edit button .
Expand and Collapse a Member Within a SetYou can expand a member to add its child members below it as new rows, andyou can collapse expanded members to remove the expanded member's childmembers.
Procedure1. Right-click the set and click Edit Set.
2. Click the new button and click Expand or Collapse.3. In the Available members list, select the member to expand or collapse and
click the right arrow to move it to the Members list.
Extended Data ItemsExtended data items differ from the traditional, expression-based text strings byenabling you to add children, view details, select sets, sort sets, and applycontextual calculations.
Chapter 10. Dimensional Reporting Style 263

Note: Extended data items do not apply to relational packages ornon-dimensionally modeled packages.
You can do the following with extended data items that are not available withtraditional data items:v Add an extended data item's child members
You can double-click an extended data item to insert its child members beside itin the report object.
v View an extended data item's detailsYou can select an extended data item and see where the data item appears in thepackage in the Properties pane under Data Item.
v Select member setsYou can select a member in a set to highlight it as the primary selection and theother members as secondary selections.
v Sort sets
You can select an extended data item, click the sort button , and clickAdvanced Set Sorting to sort a set in ascending or descending order, to sorthierarchically, and to sort by caption, by a property, or by an intersection (tuple).
v Apply contextual calculationsYou can select an extended data item and then, from the Data menu, clickCalculate to see a contextual list of calculations that are available for thisextended data item.
Extended data items are optional. If you use extended data items in a report, werecommend that you use them for the entire report instead of mixing them withexpression-based data items. For information about turning on extended dataitems, see “Specify Report Properties” on page 350.
Note: In IBM Cognos Workspace Advanced, extended data items are always used.Therefore, if you are authoring a report in IBM Cognos Report Studio for reportconsumers who are working in Cognos Workspace Advanced, you should useextended data items.
Tips for Working with Ragged or Unbalanced HierarchiesIn ragged or unbalanced hierarchies, some members that are not at the lowest levelof the hierarchy may have no descendants at one or more lower levels. Support forthese hierarchy gaps in relational data sources is limited. More complete support isprovided for OLAP data sources, but some reports may still result in unexpectedbehavior.
For example, the following may occur:v Groups corresponding to missing members may appear or disappear when
grouped list reports are pivoted to a crosstab. This happens with set expressionsusing the filter function, and detail filters on members.
v Ragged and unbalanced sections of the hierarchy are suppressed when setexpressions in that hierarchy are used on an edge.
v When a crosstab is sectioned or is split into a master detail report, sectionscorresponding to missing members become empty.
v Cells that were suppressed may still appear in the report output for reports withragged or unbalanced hierarchies.
264 IBM Cognos Report Studio Version 10.2.1: User Guide

Some of these behaviors may be corrected in a future release, while others may becodified as supported behavior. To avoid these behaviors, do not use levels fromragged or unbalanced hierarchies. Instead of using levels, use the descendants,children, or ancestors.
We consider the following scenarios to be safe:v One or more nested level references on an edge with no modifying expression.v A hierarchy reference on only one level of one edge.v One or more explicit members or sets of explicit members as siblings on only
one level of one edge.v Summaries of the previous three scenarios.
In all cases, you should test reports based on ragged and unbalanced hierarchies toconfirm that hierarchy gaps are handled correctly.
For more information about ragged or unbalanced hierarchies, see the IBM CognosFramework Manager User Guide.Related concepts:“Creating Sections on Reports That Access SAP BW Data Sources” on page 480SAP BW data sources may have problems with sections in reports under differentcircumstances:
Creating dimensional custom groupsCreate custom groups to classify existing data items into groups that aremeaningful to you.
You can reduce the number of values into smaller, more meaningful groups. Forexample, you can change a list of employees into my team and others.
When you are working with dimensional data and crosstabs or charts, you cancreate custom groups only on sets of members. After you create a custom group ina set, the members in the set are replaced by the custom groups.
When you create custom groups in a list, a new column is added to the report,with the name data_item (Custom). You can use this new column to group or sortthe report. If you want to show only the new groups, you can delete the originalcolumn.
When you are creating custom groups on sets of members, consider the followingconstraints:v Members included in a custom group must be from the same level in a
hierarchy.v If you insert a hierarchy that is used in a custom group elsewhere in the data
container, it must be inserted as a sibling of the custom group.v Automatic aggregation on a custom group might not work as expected. For
example, you might encounter error cells (- -).
Procedure1. To add custom groups in a crosstab or chart that includes sets of members, do
the following steps:a. Right-click a set and click Edit Set.
Chapter 10. Dimensional Reporting Style 265

b. Click New and select Custom Grouping.
c. In the Custom Grouping window, click New Custom Group .d. Type a New group name.e. Select members from the Available members list and move them to the
Members list.2. To add custom groups to a list, do the following steps:
a. Click the column that you want to group on and from the Data menu,select Calculate > Define Custom Groups.
Tip: You can click either the column heading or one of the column cells.
b. Click New Group Entry .c. To group by values that you select, click New Select Values Group, type a
New Group Name, select the required values from the Values box, andmove the values to the Selected Values box.
d. To group by a range of values, click New Range Group, type a New GroupName, and enter the From and To values.
3. If you do not want a group name to be displayed for remaining values, selectDo not show remaining values. Clicking this option produces empty cells forremaining values.
4. If you want the group name for remaining values to match each value, selectUse each remaining value as a group name.
5. If you want to specify your own group name for all remaining values, selectGroup remaining values into a single group and type the name that youwant.
6. If you are adding custom groups in a list, under New data item name, selecteither the default data item name or type a new data item name.
Summarizing Data DimensionallySummarize data in your reports to obtain totals, averages, and so on.
The summary options that you can use depend on the type of data source that youare using. If you are querying an OLAP data source, all measure values thatappear in reports are pre-summarized because the data source contains rolled upvalues. The type of summary that is used is specified in the data source itself. As aresult, we recommend that you use the Automatic summary when creatingdimensional style reports. This ensures that the report always uses the type ofsummary that the data modeler specified in the data source.
For example, the modeler may have specified that the rollup for revenue is totaland the rollup for stock prices is average.
If you use other types of summaries with dimensional style reports, you mayencounter unexpected results.
You can also add summaries, which are supported for any data source. Summariesspecify how data items are totaled in the headers and footers of a list and in thetotal rows and columns of a crosstab. For list reports, these summaries onlysummarize the data that is visible on that page of the report.
266 IBM Cognos Report Studio Version 10.2.1: User Guide

You can specify summary aggregation in different ways by using any of thefollowing:v aggregation properties that are specified in the modelv the Auto Group & Summarize propertyv the summarize button in the toolbarv aggregation properties for a data itemv the solve order of calculations
Limitation
If a summary is applied to a report that contains binary large object (BLOB) data,such as images or multimedia objects, you cannot also perform grouping orsorting.
The Type of Data
How data is summarized also depends on the type of data that you aresummarizing. Summary rules are applied differently to facts, identifiers, andattributes. For example, if you summarize a data item that represents partnumbers, the only summary rules that apply are count, count distinct, countnon-zero, maximum, and minimum. For information about how to determine thetype of data that a data item represents, see “Add Relational Data to a Report” onpage 213 and “Add Dimensional Data to a Report” on page 253.
For information about how null or missing values are handled in summaries, see“Null (Missing) Values in Calculations and Summaries” on page 542.
Limitations on Measure Rollups
For all OLAP data sources except IBM Cognos PowerCube and Microsoft SQLServer 2005 Analysis Services (SSAS), aggregation and re-aggregation aresupported only for calculations and measures that use the following rollups: Sum(Total), Maximum, Minimum, First, Last, and Count.
All other types of rollup either fail or return error cells, which typically appear astwo dash characters (--).
This problem occurs in, but is not limited to, the following:v footersv aggregate functionv context filters that select more than one member of a hierarchy that is used
elsewhere on the report
Figure 41. Crosstab showing automatic summaries for rows and columns
Chapter 10. Dimensional Reporting Style 267

Summarizing Sets
When working with Microsoft SQL Server Analysis Services (SSAS) data sources,we recommend that you not summarize values for sets which contain membersthat are descendants of other members in the same set. If you do so, SSASdouble-counts values for automatic summaries and all data sources double-countsvalues for explicit summaries.Related concepts:“Limitations When Summarizing Measures in DMR Data Sources” on page 534There are limitations when summarizing dimensionally-modeled relational (DMR)measures and semi-additive measures in crosstabs using the aggregation functioncount distinct, median, standard-deviation, or variance. The followinglimitations can produce empty or error cells when the report is run:
Add a Simple Summary
You can add simple summaries in a report by using the summarize button .This button provides a subset of the summary functions available in IBM CognosReport Studio.
The summarize button sets the rollup aggregate property for the data item to theselected summary, and places the data item into an appropriate footer. A footer iscreated for each set, hierarchy, or level.
In crosstabs and charts, the summary appears as a node.
In crosstabs, you can add multiple summaries at the same level. For example, youhave a crosstab with Product line as rows, Order year as columns, and Revenue asthe measure. For Product line, you can add the Total summary as a header, whichwill total all revenue for each order year. You can then add the Average summaryas a footer, which will give the average revenue of all product lines for each orderyear.
For information about adding a rolling or moving average, see “Rolling andMoving Averages” on page 272.
Procedure1. Click the item to which to add a summary.
2. Click the summarize button and click a summary type.3. To change the summary label, do the following:
v Click the label.v In the Properties pane, under Text Source, set the Source Type property to
the source type to define the label.For example, set it as Data Item Value to produce a dynamic label for thesummary based on data item values.
v Set the property below Source Type to specify the label.This property depends on the source type you chose. For example, if youchose Data Item Value as the source type, set the Data Item Value propertyto the data item to use to define the label.
4. To change a summary, select it and, in the Properties pane, under Data Item,click Aggregation Method and choose a different function.
268 IBM Cognos Report Studio Version 10.2.1: User Guide

Summarizing Values in CrosstabsIn crosstabs, summaries are calculated using two summary expressions.
The expressions used to summarize data are:v aggregate ([measure within set [data item]) summarizes the member values
from the data source within the current content.v aggregate ([measure within detail [data item]) summarizes the lowest level of
details in the report.
The expression that is used to calculate a summary is controlled by the summary’sUse Set Aggregation property. For example, in the following crosstab, if youspecified Total as the summary, the following aggregate expressions are producedwhen the Use Set Aggregation is set to Yes and No respectively:
v Total ([Revenue] within set [Quarter])This expression totals the quarter values from the data source at the intersectingproduct line. At the bottom right corner, it totals the aggregate over all productlines for each quarter.
v Total ([Revenue] within detail [Quarter])This expression totals the month values visible in the report at the intersectingproduct line. At the bottom right corner, it totals all of the intersecting month -product line values visible in the report.
In simple cases, the members and values visible in the report and the aggregaterules in the report are the same as those in the data source and all of theseexpressions produce the same results.
For example, for the quarter and month values, if you are totaling the values forall months in all quarters, it makes no difference whether the visible values, thevalues in the cube, or the month and quarter values are used. The result is thesame.
Chapter 10. Dimensional Reporting Style 269

Tip: The Total Revenue by Country or Region sample report in the GO DataWarehouse (query) package includes a totalsummary function. For moreinformation about The Sample Outdoors Company samples, see Appendix C,“Sample Reports and Packages,” on page 507.
Different results appear when you start filtering, changing aggregation types, orusing set expressions or unions.
For example, the following crosstab shows the quantity of products sold across allproduct types for each product line. The bottom of the crosstab has two summaryvalues that show the average quantity of products sold by product line.
270 IBM Cognos Report Studio Version 10.2.1: User Guide
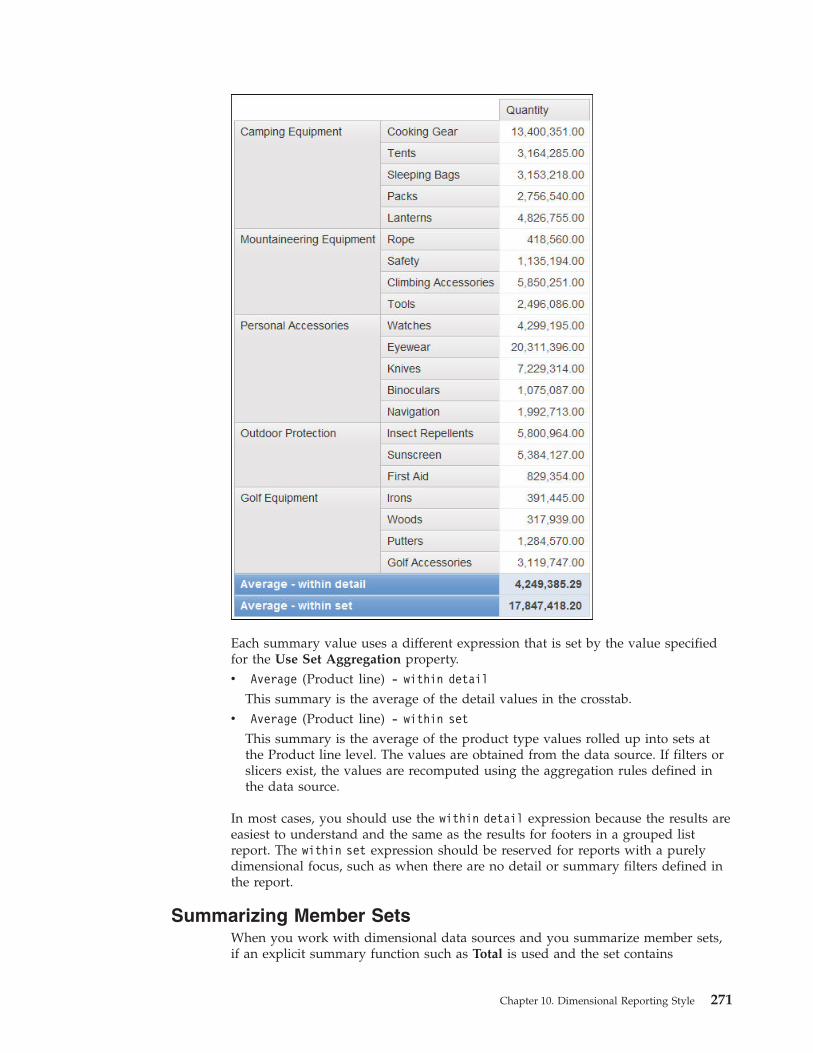
Each summary value uses a different expression that is set by the value specifiedfor the Use Set Aggregation property.v Average (Product line) - within detail
This summary is the average of the detail values in the crosstab.v Average (Product line) - within set
This summary is the average of the product type values rolled up into sets atthe Product line level. The values are obtained from the data source. If filters orslicers exist, the values are recomputed using the aggregation rules defined inthe data source.
In most cases, you should use the within detail expression because the results areeasiest to understand and the same as the results for footers in a grouped listreport. The within set expression should be reserved for reports with a purelydimensional focus, such as when there are no detail or summary filters defined inthe report.
Summarizing Member SetsWhen you work with dimensional data sources and you summarize member sets,if an explicit summary function such as Total is used and the set contains
Chapter 10. Dimensional Reporting Style 271

duplicates, the result is double-counted. If you are using an OLAP data source, theresult produced for the automatic summary function depends on the data source.
For example, the product line rows below were defined using the expression
union ([Product line], [Camping Equipment], ALL)
where [Product line] is the level that contains Camping Equipment.
For PowerCubes, Aggregate (Product line) is the sum of the product linesexcluding duplicates. For more information about how the aggregate function isprocessed, see “Summary Functions” on page 273.
Rolling and Moving AveragesUse rolling and moving averages to analyze data for specific time series and tospot trends in that data. When viewing these averages on a line chart, use a longerperiod of time to reveal long-term trends.
In IBM Cognos Report Studio, to add a rolling or moving average, you must createsummary and custom calculations using layout expressions “Insert a QueryCalculation” on page 303.
The Rolling and Moving Averages interactive sample report includes rolling andmoving calculations. For more information about The Sample Outdoors Company,see Appendix C, “Sample Reports and Packages,” on page 507.
Rolling Average
A rolling average continuously updates the average of a data set to include all thedata in the set until that point. For example, the rolling average of returnquantities at March 2012 would be calculated by adding the return quantities inJanuary, February, and March, and then dividing that sum by three.
Tip: The Historical Revenue sample report in the Sales and Marketing (Cube)package also includes a rolling average. For more information about The SampleOutdoors Company samples, see Appendix C, “Sample Reports and Packages,” onpage 507.
Figure 42. Crosstab showing revenue by product line with an aggregate row and a total row
272 IBM Cognos Report Studio Version 10.2.1: User Guide

Moving Average
A moving average calculates the average of a data set for a specified period. Forexample, the moving average of return quantities at March 2012 with a specifiedperiod of two would be calculated by adding the return quantities in February andMarch and then dividing that sum by two. In IBM Cognos Report Studio, you canuse a prompt to specify the period.
Show Data for Specific Time PeriodsShow data for a specific time period to associate a report with a business timeperiod rather than the execution time. For example, you have a monthly reportthat you run at the beginning of each month, and you want the last business dayof the previous month to appear rather than the day on which you run the report.
If the report functions AsOfDate and AsOfTime are added to the report, they willreturn a value based on the results of the As of Time Expression object. If the Asof Time Expression object is not added to the report, these two functions returnthe date and time at which the report is run.
If the As of Time Expression object is added more than once in the report, the firstoccurrence of the object in the layout that returns a valid value is used.
Procedure
1. From the Toolbox tab , drag As of Time Expression to the report.2. Double-click As of Time Expression.3. In the Expression Definition box, type the expression.
The expression must return a date-time value.
Tip: You can drag a function that returns a constant from the Constants folderin the Functions tab. You can then change the constant to the value to use.If you do not specify a time, the default time 12:00:00.000 AM is used.
Summary FunctionsThis section describes the summary functions that are available in IBM CognosReport Studio. Some functions, such as Custom, are available only when you click
the summarize button on the toolbar. Additional summary functions areavailable in the expression editor.
Automatic Summary
Depending on the type of data item, applies the function None, Summarize, orCalculated based on the context in which the data item appears.
Calculated is applied if the underlying data source is OLAP. It is also applied ifthe data item expressionv contains a summary functionv is an if then else or case expression that contains a reference to at least a
modeled measure in its conditionv contains a reference to a model calculation or to a measure that has the Regular
Aggregate property set to a value other than Unsupported
Chapter 10. Dimensional Reporting Style 273

v contains a reference to at least one data item that has the Rollup AggregateFunction property set to a value other than None
If the underlying data source is relational and if the data item expression containsno summary functions and a reference to at least one fact that has the RegularAggregate property set to a value other than Unsupported, Summarize is applied.
If the underlying data source is OLAP and if the data item expression contains nosummary functions and a reference to at least one fact that has the RegularAggregate property set to a value other than Unsupported, Calculated is applied.
If the underlying data source is SAP BW, reports containing aggregations andsummaries run more efficiently if the aggregation applied to a query item matchesthe aggregation rule for the underlying key figure on the SAP BW server. In ReportStudio, the easiest way to accomplish this is to change the value of the AggregateFunction property to Automatic.
In all other contexts, None is applied.
For relational and dimensionally modeled relational (DMR) data sources, if thisfunction is applied to a data item expression that has the average function,weighted averages are computed based on the lowest level detail values in thedata source.
Note: This is the default function.
Average
Adds all existing values and then divides by the count of existing values.
Calculated
Specifies that all the terms within the expression for a data item are aggregatedaccording to their own rollup rules, and then the results of those aggregations arecomputed within the overall expression.
For example, a list contains the data item Quantity with the Aggregation propertyset to Total. You add a query calculation named Quantity Calculated. You defineits expression as Quantity + 100 and you set its Aggregation property toCalculated. When you run the report, the values for Quantity Calculated arecomputed by first adding all values for Quantity and then adding 100 to eachvalue.
Note: In crosstabs, this function overrides any solve orders that are specified.
Count
Counts all existing values.
If the underlying data source is OLAP, Count behaves as follows if it is specified inthe Rollup Aggregate Function property for a data item.
Object Behavior
Level Count distinct is used. A warning appearswhen you validate the report.
274 IBM Cognos Report Studio Version 10.2.1: User Guide

Object Behavior
Member set Count distinct is used. A warning appearswhen you validate the report.
Attribute Not supported. An error is returned whenyou run the report.
Measure Supported.
If the underlying data source is dimensionally modeled relational (DMR), Countbehaves as follows if it is specified in the Aggregate Function or Rollup AggregateFunction property for a data item.
Object Behavior
Level Count distinct is used. A warning appearswhen you validate the report.
Member set Count distinct is used. A warning appearswhen you validate the report.
Attribute Supported.
Measure Supported.
If you add the count summary to a non-fact column in a list and then group thecolumn, the column will not be grouped when you run the report. To resolve thisissue, group the column first before adding the count summary.
Count Distinct
Returns the total number of unique non-null records.
If the underlying data source is OLAP, count distinct behaves as follows if it isspecified in the Rollup Aggregate Function property for a data item.
Object Behavior
Level Supported.
Member set Supported.
Attribute Not supported. An error is returned whenyou run the report.
Measure Not supported. An error is returned whenyou run the report.
If the underlying data source is dimensionally modeled relational (DMR), countdistinct is supported for levels, member sets, attributes, and measures when it isspecified in the Aggregate Function or Rollup Aggregate Function property for adata item.
Custom
Summarizes data based on an expression that you define.
Maximum
Selects the largest existing value.
Chapter 10. Dimensional Reporting Style 275

Median
Returns the median value of the selected data item.
Minimum
Selects the smallest existing value.
None
Does not aggregate values.
If the underlying data source is relational, the data item is grouped when thequery property Auto Group & Summarize is set to Yes.
Not Applicable
This function is available only for the Aggregate Function property. It specifiesthat the aggregate attribute is ignored. For example, the calculation will be appliedafter the data is aggregated.
This function differs from the Calculated function, which applies aggregation tothe rows and then performs the calculation.
For example, for the average ( [Quantity] ) + 5 expression, when the AggregateFunction property is set to Not Applicable, five is added to the average of thesingle Quantity value. When the function is set to Calculated, five is added to theaverage of a set of numbers.
This setting should not be applied to a simple model reference.
This setting is relevant only for reports that are upgraded from IBM CognosReportNet 1.x.
Standard Deviation
Returns the standard deviation of the selected data item.
Note: From a mathematical perspective, this function is not useful for smallnumbers of items and is not supported if the query property Auto Group &Summarize is set to Yes.
Summarize
Aggregates data based on model or data type information. This function can bethought of as a calculate and then aggregate rule. Data is aggregated using thefollowing rules:
If the underlying data source type is relational and the data item or calculation is areference to a single fact query item in the model that has the Regular Aggregateproperty set to Sum, Maximum, Minimum, Average, or Count, aggregate datausing this function. Otherwise, data is aggregated according to the data type of thedata item as follows:v Total is applied for numeric and interval values.v Maximum is applied for date, time, and date-time values.
276 IBM Cognos Report Studio Version 10.2.1: User Guide

v Count is applied for everything else.
The underlying data source type can be dimensional and the data item orcalculation a reference to a single item in the model. In this case, if the RegularAggregate property of the model item is not unknown, the summary function thatcorresponds to the Regular Aggregate property is applied. If the RegularAggregate property is unknown, set the function to Calculated.
For example, a list contains the data item Quantity with the Aggregation propertyset to Average. You add a query calculation named Quantity Summarize. Youdefine its expression as Quantity + 100 and you set its Aggregation property toSummarize. When you run the report, the values for Quantity Summarize arecomputed by first adding 100 to each value for Quantity and then calculating thetotal. The total is calculated because Quantity contains numeric values and theexpression for Quantity Summarize is not a simple data item reference. If QuantitySummarize is defined as Quantity, the function Average is applied to each value.
Total
Adds all existing values.
Variance
Returns the variance of the selected data item.
Note: From a mathematical perspective, this function is not useful for smallnumbers of items and is not supported if the query property Auto Group &Summarize is set to Yes.
Mapping Summary Functions From Data Sources to FrameworkManager and Report StudioThe summary functions available in IBM Cognos Framework Manager and IBMCognos Report Studio reflect summary functions supported by relational anddimensional data sources. The following table shows how summary functions indata sources are mapped to Framework Manager and Report Studio.
Data source Framework Manager Report Studio
None specified, or none Unsupported None
average (avg) Average Average
count Count Count
count distinct Count Distinct Count distinct
maximum (max) Maximum Maximum
minimum (min) Minimum Minimum
median Median Median
standard deviation (stddev) Standard Deviation Standard Deviation
sum Sum Total
variance (var) Variance Variance
count non zero Count Non-Zero Automatic
average non zero unknown Automatic
external unknown Automatic
any unknown Automatic
Chapter 10. Dimensional Reporting Style 277

Data source Framework Manager Report Studio
calculated unknown Automatic
unknown unknown Automatic
first_period unknown Automatic
last_period unknown Automatic
The following summary functions exist only in either Framework Manager orReport Studio. There is no corresponding summary function in data sources.
Framework Manager Report Studio
Automatic Automatic
Calculated Calculated
No corresponding summary function Summarize
No corresponding summary function Not Applicable
Focusing Dimensional DataIn IBM Cognos Report Studio, there are three approaches to focusing dimensionaldata in a crosstab:v drag data items to the edges of your crosstabv drag data items to the context filter areav create set expressions on the edges of your crosstab that return members or sets
of members, such as the filter function
Note: Summary and detail filters are recommended only for focusing data inrelational reporting.
The approach you choose should depend on the capabilities of the data source, theperformance requirements, the persistence of the dataset, and how complex youwant the report to be.
If you filter values that are floating-point numbers, you may encounter imprecisefiltering results due to rounding or data truncation. Floating-point numbers mayappear differently in the report than how than how they are stored in the datasource. To ensure accurate results, your filter criteria should account for anyrounding issues.
Consider the limitations when filtering dimensional data and when filtering datafrom SAP BW data sources.
You can also use prompts, or prompt controls, to allow users to provide input forthe filter.
278 IBM Cognos Report Studio Version 10.2.1: User Guide

Related concepts:“Limitations When Filtering Dimensional Data Sources” on page 534Avoid combining context filters (slicers) with dimensional constructs that involvemembers from hierarchies that are used elsewhere in the report. This combinationgives results that are often not what you might expect and that may change in afuture release.
Create a Context FilterWhen working with dimensional data, you can use context filters, or slicer filters,to quickly focus your report on a particular view of the data.
For example, the following crosstab contains product lines in the rows, years in thecolumns, and revenue as the measure. We want to filter the values to show us therevenue for only Web orders from Asia Pacific. To change the context, you dragAsia Pacific and Web from the source tree to the Context filter section of theoverview area. The crosstab then shows the revenue for only Asia Pacific and Web.Changing context changes only the values that appear. It does not limit or changethe items in the rows or columns.
The members that are used as the context filter appear in the report header whenyou run the report.
Any summary values in the report are recomputed to reflect the results returnedby the context filter.
You can create multiple context filters to filter across two or more differenthierarchies.
Tip: The Budget vs. Actual sample report in the Sales and Marketing (cube)package includes a context filter. For more information about The SampleOutdoors Company samples, see Appendix C, “Sample Reports and Packages,” onpage 507.
Note: There are limitations when using context filters:v Calculated measures do not get suppressed by the filter. To avoid this, drag the
desired members from the Source tab directly onto the row or column edgeinstead of using the members in the context filter.
v Suppression can be slow on large cubes, because all of the data is retrieved andthen filtered.
Figure 43. Crosstab showing revenue by product line by year filtered to show only AsiaPacific and web orders
Chapter 10. Dimensional Reporting Style 279

If the desired data in the context filter is from a hierarchy that appears on thecrosstab edge, drag the desired members from the Source tab directly onto thecrosstab edge.If the desired data is from a hierarchy that does not appear on the crosstab edge,use a context filter in conjunction with other means to limit the data, such as atop or bottom filter.
To use a calculation or expression to define a context filter, create a slicer memberset using the query explorer. A slicer member set is an expression that returns a setof members from the same dimension. For example, you can define a slicermember set that filters for the top five products with the greatest revenue.
Context filters are different from other filters. When you filter data, members thatdo not meet the filter criteria are removed from the report. A context filter does notremove members from a report. Instead, their values are filtered or and you seeblank cells.
You can also use context filters as prompts when the report is run.
When creating context filters,v use only members from hierarchies that are not already projected on an edge of
the crosstabv use only one member per hierarchy
Create a simple context filterWhen working with dimensional data, you can use context filters, or slicer filters,to quickly focus your report on a particular view of the data.
Procedure1. If you do not see the Context filter area, show it using the View menu (Panes,
Context Area).
2. From the Source tab , select or search for one or more items on which tofilter.
3. Drag the item on which to filter into the Context filter section of the overviewarea.
4. To change context, select a new item from the Context filter box.
Create an advanced slicer filterTo use a calculation or expression to define a context filter, create a slicer memberset using the query explorer. A slicer member set is an expression that returns a setof members from the same dimension. For example, you can define a slicermember set that filters for the top five products with the greatest revenue.
Procedure
1. Pause the pointer over the query explorer button and click the query towhich to add a slicer.
2. On the Toolbox tab , drag Slicer Member Set to the Slicer pane.3. Drag the members to the Expression Definition box.
You must join the members in the expression by using the set function. Forexample, the following expression contains the Fax and Telephone membersfrom the Order Method dimension:
280 IBM Cognos Report Studio Version 10.2.1: User Guide

set ([Fax],[Telephone])4. To add members from another dimension, repeat step 2 to create a separate
slicer member set.
Define a Prompt Using a Context FilterIf context filters (or slicers) are defined, you can use these filters to create promptsin the report.
Prompts provide questions that help users to customize the information in a reportto suit their own needs. For example, you create a prompt so that users can selecta region. Only data for the specified region is retrieved and shown in the report.
Before you begin
Before you define a prompt, you must create context filters.
Procedure1. In the Context filter section of the overview area, click the down arrow next to
the filter to use as a prompt.2. Click Prompt and do one of the following:
v To remove the prompt, click No Prompt.v To allow users who run the report to select any member from the hierarchy,
click Prompt on Hierarchy.v To allow users who run the report to select from a list of members in the
current level, click Prompt on Level.
Sorting Dimensional DataYou can sort items to view them in your preferred order. By default, IBM CognosReport Studio retrieves items in the order defined in the data source. OLAP datasources always have a defined order. The data modeler defines the sorting optionsin the model.
For more information about data modeling, see the IBM Cognos FrameworkManager User Guide.
Tip: The Sales Growth Year Over Year sample report in the GO Data Warehouse(analysis) package includes sorting. For more information about The SampleOutdoors Company samples, see Appendix C, “Sample Reports and Packages,” onpage 507.
Limitations When Sorting SAP BW Data
If you use a SAP BW data source, each level in a hierarchy has an item with thesame name as the level and a role of _businessKey. Such items are known as levelidentifiers. You should use only the level identifier of all the time-relatedcharacteristics, such as 0CALDAY and 0CALMONTH, for sorting. All other(attribute) items in these hierarchies are formatted string representations of thecharacteristic values with which they are associated. These formatted values sortalphanumerically and not chronologically.
Tip: By level identifier, we are referring to a query item with the same name as thelevel that has the role of _businessKey. Each level in a SAP BW hierarchy has alevel identifier.
Chapter 10. Dimensional Reporting Style 281

Sort Sets by LabelYou can sort sets of members based on their label (or caption). By default, whenyou select Sort by Label, Ascending or Descending, the members within the setare sorted only by their labels. You can also perform advanced sorting to sort setsusing an intersection (tuple) or a member property.
For example, a set contains regions and you sort the regions within the set indescending alphabetical order. Only extended data items that represent setssupport set sorting.
Before you can perform set sorting, you must create sets for the members in yourreport.
You cannot sort data items from different dimensions that are intermixed. Forexample, if you have years and products on the same edge and at the same levelin your crosstab, you can sort the years, and you can sort the product lines, butyou cannot sort them as combined set because years and products come fromdifferent dimensions.
Procedure1. In a crosstab, select a set to sort.
2. Click the sort button and under Sort by Label, click Ascending orDescending.
Tip: To remove a sort order, click Don't Sort.
Sort Sets in the Opposite Axis by ValueYou can sort members in the sets on the opposite axis based on the value of amember or measure that you select.
For example, a crosstab contains years inserted as individual members in thecolumns, product lines inserted as a member set in the rows, and revenue as themeasure. You select the 2012 column and then select Sort by Value, Descending.The values in the 2012 column are sorted.
Before you can perform this sorting, you must create sets for the members in yourreport.
In nested crosstabs, items are sorted based on the values of the innermost nestedrow or column of the opposite axis. For example, a crosstab contains years in thecolumns and retailers nested within product line in the rows. Select 2004, sort indescending order, and you see retailers listed from the largest value to the smallestvalue for each product line.
Figure 44. Crosstab showing revenue by year by product line with the 2012 column sorted indescending order
282 IBM Cognos Report Studio Version 10.2.1: User Guide

Procedure1. In a crosstab, select a member or measure to sort.
For example, to sort a set in the row axis, select a member or measure in thecolumn axis.
2. Click the sort button and under Sort by Value, click Ascending orDescending.
Tip: To remove a sort order, click Don't Sort.
Perform Advanced Set SortingIf you use dimensional data, you can sort using the property of a member.
For example, your report includes employee names and you want to sort theemployees using the gender property. You can also sort using an intersection ofmembers, also known as a tuple. For example, you want to sort the employeesusing the value of sick days taken for the year 2012.
Procedure1. Select a set.
2. Click the sort button and under Other Sort Options, click Edit SetSorting.
3. Specify the sorting options.4. If you are sorting members from different levels and want to preserve the
hierarchy, select the Hierarchized sorting check box.5. To sort items using a member property, under Sort by, double-click Property,
navigate the tree, and select the member property to use.6. To sort items using an intersection of members, or a tuple, under Sort by, click
Intersection (tuple) and click the ellipsis (...) button. Then, from the Availablemembers and measures box, select the items to use and click the right arrow tomove them to the Intersection members and measures box. You can also selectitems from the Calculated Members and Measures tab.
Working with Dimensional QueriesQueries specify what data appears in the report. In IBM Cognos Report Studio,you create and modify queries using Query Explorer.
Query Explorer provides an alternative way to modify existing reports or to authornew reports. You can use Query Explorer to perform complex tasks and other tasksthat are more difficult to do in the report layout. For example, use Query Explorertov improve performance by changing the order in which items are queried from the
database, or by changing query properties to allow the report server to executequeries concurrently where possible
Note: Only queries that are referenced in the report layout can be executedconcurrently. If a query is defined in Query Explorer by joining two or moreexisting queries, IBM Cognos Business Intelligence cannot execute the sourcequeries concurrently. By default, queries run sequentially. Your administratormust enable the concurrent query execution feature. For more information, seethe IBM Cognos Business Intelligence Administration and Security Guide.
Chapter 10. Dimensional Reporting Style 283

v view or add filters and parameters and modify their propertiesv view or add dimensions, levels, and factsv incorporate SQL statements that come from other reports or reports that you
writev create complex queries using set operations and joinsRelated concepts:“Queries” on page 30Queries determine what data items appear in the report. Sometimes you wantdetailed rows of data, which you obtain by using a simple SELECT statement.Other times you must calculate totals or averages using summary functions andgrouped columns or must apply filters to show only the data you want.
Specify a List of Data Items for an ObjectSpecify the list of data items for an object when you must reference a data itemthat is in a query but is not in the layout.
For example, you want to add a layout calculation to a list that uses a data itemthat is in the query definition. If the data item does not appear in the list, youmust reference it in order to make the layout calculation work. You must alsospecify the list of data items if you apply conditional formatting that uses a dataitem that is not in the query.
Procedure1. Click a layout object.
Tip: For a list of layout objects for which you can specify a list of properties,see the Properties property in Appendix G, “Report Studio Object and PropertyReference,” on page 771.
2. In the Properties pane, double-click the Properties property and select dataitems.
Relate a Query to a LayoutQueries and layouts work together. After you decide the type of data that youneed, you must create a layout in which to show the results. Each column of datamust be both selected for the query and shown in a layout unless there are somecolumns that you do not want to show. The query and layout portions of a reportmust be linked to produce a valid report.
IBM Cognos Report Studio automatically links query and layout. For example,when you use Report Studio and the list report layout, query and layout areautomatically linked.
Procedure1. Select a data container.2. In the Properties pane, set the Query property to a query.
3. From the Data Items tab , drag data items from the query to the datacontainer.
Using Dimensional Data Sources with QueriesWhen you are working with SAP BW data sources, you can use only a singlehierarchy in a query.
284 IBM Cognos Report Studio Version 10.2.1: User Guide

Creating queries using a mix of OLAP and relational data is not supported. If youcreate queries using a database for which you do not know the type, consult yourdatabase administrator or modeler.
When performing multi-cube queries using dimensional data sources, thefollowing restrictions apply:v Only basic operators (+, *, /,-) are available for cross-cube calculations.v Inner joins are not supported.v All joins for multi-cube queries are outer joins.v Viewing MDX using the Generated SQL/MDX query property may not show
you the actual MDX that is executed. This is because when a multi-cube query isexecuted, a number of smaller queries are actually executed.
Related concepts:“Problems with large SAP BW queries” on page 498When you are working with an SAP BW data source, if your report includes a dataset greater than 1,000,000 cells, you might encounter an XQE error.
Connecting Queries Between Different Data SourcesThis section lists the data sources between which you can and cannot connectqueries.
IBM Cognos Business Intelligence supports the following:v RDBMS to RDBMS joinsv set operations of any two queriesv master detail relationships between any two queriesv drill from any query to any other query
You cannot create the following types of joins:v cube-to-cube (homogeneous)v cube-to-cube (heterogeneous)v cube-to-RDBMSv cube-to-SAP BWv SAP-BW-to-RDBMS
Multiple-fact QueriesYou must understand the result of a query on more than one fact table to achievethe results that you want. The result of a multiple-fact query varies depending onwhether you are working with conformed or non-conformed dimensions, on thelevel of granularity, and on the additive nature of the data.
The GO Data Warehouse (analysis) package has characteristics that affect theresults if you use a multiple-fact query with the Inventory and Sales namespaces.Granularity for time differs in that inventory levels are recorded monthly and salesare recorded daily. Also, Sales includes a non-conformed dimension, Ordermethod.
The following examples will help you interpret the results of a multiple-fact queryand understand the options for changing a query to obtain the results that youwant.
Chapter 10. Dimensional Reporting Style 285

Conformed Dimensions
Individual queries on Inventory and Sales by Quarter and Product yield thefollowing results.
A query on multiple facts and conformed dimensions respects the cardinalitybetween each fact table and its dimensions and returns all the rows from each facttable. The fact tables are matched on their common keys, Product and Time.
Product and Time apply to both Inventory and Sales. However, inventory levelsare recorded monthly and sales are recorded daily. In this example, results areautomatically aggregated to the lowest common level of granularity. Quantity,which comes from Sales, is rolled up to months.
Nulls are often returned for this type of query because a combination ofdimensional elements in one fact table may not exist in the other. For example, ifHusky Rope 50 was available in inventory in Q1 2011, but there were no sales ofthis product in the same time period, Quantity would show a null in the HuskyRope 50 row.
IBM Cognos Business Intelligence does not support conformed dimensionsgenerated by IBM Cognos Framework Manager for SAP BW data sources.
Non-conformed Dimensions
If a non-conformed dimension is added to the query, the nature of the resultsreturned by the query is changed.
286 IBM Cognos Report Studio Version 10.2.1: User Guide

Order method type exists only in Sales. Therefore, it is no longer possible toaggregate records to a lowest common level of granularity because one side of thequery has dimensionality that is not common to the other side of the query.Opening inventory and Closing inventory results are repeated because it is nolonger possible to relate a single value from these columns to one value fromQuantity.
Grouping on the Quarter key demonstrates that the result in this example is basedon the same data set as the query on conformed dimensions. Summary values arethe same. For example, the total quantity for Q1 2011 is 88,320 in both examples.
Filters on Non-conformed Dimensions
By default, to improve performance, filters are applied at the database level. Thedefault behavior can result in unexpected nulls when you add a filter to amultiple-fact query. If you create a filter on the Order method dimension to showonly the fax order method and apply the filter at the data source, the reportincludes nulls.
Chapter 10. Dimensional Reporting Style 287

The filter is applied only to one subject area, Sales. Because Order method typedoes not exist in Inventory, all products still appear in the report. For example,Course Pro Umbrella was in inventory in Q2 2012. Because there were no salesusing the fax order method for this product in Q2 2012, Order method type andQuantity are null.
To remove the nulls, change the filter so that it is applied to the result set insteadof the data source. By applying the filter to the result set, you get the same resultsthat you would get if you were working with conformed dimensions. Only theproducts that were ordered using the fax order method appear in the report.
288 IBM Cognos Report Studio Version 10.2.1: User Guide

The overall summary for Quantity is 8,043 using either filter method, which showsthat the results are based on the same data set.
In IBM Cognos Report Studio, there are two types of filters. A detail filter isapplied to the data source. A summary filter is applied to the result set. For moreinformation about how to apply detail and summary filters, see “Create a Detail orSummary Filter” on page 229.
Add a Query to a Dimensional ReportYou can create multiple queries in Query Explorer to suit your particular needs.For example, you can create a separate query for each data container in a report toshow different data.
Tip: The Briefing Book sample report in the GO Sales (analysis) package and theTop 10 Retailers for 2011 sample report in the GO Data Warehouse (analysis)package include multiple queries. For more information about The SampleOutdoors Company samples, see Appendix C, “Sample Reports and Packages,” onpage 507.
Procedure
1. Pause the pointer over the query explorer button and click Queries.
2. From the Toolbox tab , drag one of the following objects to the work area.
Object Description
Query Adds a query.
Chapter 10. Dimensional Reporting Style 289

Object Description
SQL Adds SQL commands.
MDX Adds MDX commands.
Note: When adding queries to the reportv right-click the work area and click Show Package Sources to see the queries
that use data items from a packagev right-click the work area and click Expand References to see the
relationships that exist between queries in the report, which is useful whenyou are creating complex queries
3. In the Properties pane, set the object properties.4. Double-click a query.
5. From the Source tab , drag data items to the Data Items pane.
Tip: You can add data items to the query that you do not want to appear inthe layout. For example, to filter on Product line code and show Product line inthe layout, you must add both data items to the query.
6. To create a new data item, from the Toolbox tab , drag Data Item to theData Item pane.
7. To add a filter, from the Toolbox tab, drag Filter to the Detail Filters orSummary Filters pane and define the filter expression.
Tip: You can also create a filter by dragging a data item from the Source tab toone of the filters panes and completing the filter expression. When workingwith a dimensional data source, you can quickly filter data by dragging amember to a filter pane instead of dragging the level to which the memberbelongs. For example, dragging the member 2012 from the Years level will filterdata for the year 2012. This method is quicker than dragging the Years leveland specifying data only for the year 2012 in the filter expression.
Add Dimension Information to a QueryAdd dimension information to a query when the data source has no dimensioninformation available or when you want to override, extend, or restrict theinformation.
Add dimension information if any of the following apply:v There is no dimension information available in the data source.
For example, the data source contains flat data that you want to modeldimensionally.
v You want to override the dimension information in the data source.v You want to extend or restrict dimension information in the data source.
If you do not add dimension information and the data source contains dimensions,then the dimension structure of the data source is used. If the data source containsno dimensions, IBM Cognos Business Intelligence creates a default dimensionstructure.
290 IBM Cognos Report Studio Version 10.2.1: User Guide

Dimension information is not intended to define the presentation of information,but to help query planning. Dimension information can be considered as a form ofquery hint. In addition, users will not be able to drill down on dimensions thatyou add to a report.
Procedure
1. Pause the pointer over the query explorer button and click a query.2. In the Properties pane, set the Override Dimension Info property to Yes.
The Dimension Info tab appears in the work area.3. Click the Dimension Info tab.
4. To create a dimension from an existing data item, from the Source tab ,drag the data item to the Dimensions pane.IBM Cognos Report Studio automatically generates the entire dimension.
5. To create a new dimension, from the Toolbox tab , drag Dimension to theDimensions pane, and then build the new dimension by adding objects to thedimension:v To create a level, drag Level.v To create a level hierarchy, drag Level Hierarchy.v To create a member hierarchy, drag Member Hierarchy.For information about these objects, see “Add Dimensional Data to a Report”on page 253.
6. From the Source tab , drag data items to the objects you added in theprevious step.For example, if you created a level, define a key by dragging a data item to theKeys folder.
7. To create a fact, from the Source tab, drag a data item to the Facts pane.
Example - Create a Crosstab Report that Shows Empty RowsYou are a report author at The Sample Outdoors Company, which sells sportingequipment. You are requested to create a crosstab report that shows the totalrevenue per year for each product line broken down by order method. By default,if no revenue was produced for a particular product line in a specific year, no rowappears in the crosstab for that product line and year. You override the dimensioninformation of the crosstab so that empty rows appear in the report.
Procedure1. Open IBM Cognos Report Studio with the GO Data Warehouse (query)
package.2. In the Welcome dialog box, click Create a new report or template.3. In the New dialog box, click Crosstab and click OK.
4. From the Source tab , drag the following data items from Sales andMarketing (query), Sales (query) to the crosstab:v from the Product folder, drag Product line as rowsv from the Time dimension folder, drag Year as nested rowsv from the Order method folder, drag Order method as columnsv from the Sales fact folder, drag Revenue as the measure
Chapter 10. Dimensional Reporting Style 291

5. Right-click the crosstab and click Go to Query.6. In the Properties pane, set the Override Dimension Info property to Yes.
The Dimension Info tab appears at the bottom of the work area.7. Click the Dimension Info tab.8. From the Source tab, drag the following items to the Dimensions pane:
v Product line
v Year
Product line and Year become separate dimensions in the query.
9. Pause the pointer over the page explorer button and click Page1.10. Click Year.11. In the Properties pane, double-click the Sorting property.12. In the Data Items box, drag Year to the Sort List box.13. Run the report.
Results
All order years appear for all product lines, even if no revenue was produced.
Create a Master Detail RelationshipCreate a master detail relationship to deliver information that would otherwiserequire two or more reports. For example, you can combine a list with a chart. Thelist can contain product lines and the chart can show details for each product line.
Master detail relationships must appear in nested frames to produce the correctresults. You can create a master detail relationship in two ways:
292 IBM Cognos Report Studio Version 10.2.1: User Guide

v Use a parent frame for the master query and a nested frame for the detail query.v Associate a report page with the master query and use a data container, such as
a list or crosstab, for the detail query.
You cannot display parent data in the child frame or child data in the parentframe. Also, you cannot perform calculations across master detail queries.
When you are working with dimensional data, IBM Cognos Report Studio doesnot support master detail relationships that use a custom group.
You can use a master detail relationship to show data from separate data sourcesin a single report. However, the data sources must be contained in the samepackage.
If you are working with an SAP BW data source, you cannot use a data item fromthe master query that contains non-ASCII values.
Before you begin
To create a master detail relationship using queries that reference two differentdimensional data sources, you must first link the members by aliasing the levelsthat contain the members.
Procedure1. To use a parent frame for the master query and a nested frame for the detail
query:
v From the Toolbox tab , drag a List, Repeater Table, or Repeater to thereport.
v Add a second data container to the object you inserted.You can insert a list, crosstab, chart, repeater table, or repeater into a list.You can add a list to a repeater table or repeater.
v Add data items to both data containers.2. To associate a report page with the master query and use a data container for
the detail query:v Click anywhere in the report page.
v In the Properties pane, click the select ancestor button and click Page.v Set the Query property.v From the Toolbox tab, drag a data container to the report.
3. To link a data item in the master query to a parameter in the detail queryinstead of to another data item, create the parameter in the detail query.Use parameters to filter values at a lower level in the detail query.
v Pause the pointer over the query explorer button and click the detailquery.
v From the Toolbox tab , drag the Filter object to the Detail Filters box.v In the Expression Definition box, create the parameter.
4. Pause the pointer over the page explorer button and click the reportpage.
5. Click anywhere in the report page.
Chapter 10. Dimensional Reporting Style 293

6. In the Properties pane, click the select ancestor button and click Page.7. Click the data container containing the details.8. From the Data menu, click Master Detail Relationships.9. Click New Link.
10. In the Master box, click the data item that will provide the primaryinformation.
11. To link the master query to a data item, in the Detail box, click the data itemthat will provide the detailed information.
12. To link the master query to a parameter, in the Parameters box, click theparameter that will provide the detailed information.
Tip: To delete a link, select the link and press the Delete key.13. If your detail query object is a chart, you can disconnect a chart title from the
master query.v Click the chart title, and then, from the Data menu, click Master Detail
Relationships.v Clear the Use the master detail relationships from the chart check box.
14. If your master detail relationship includes a chart as the detail and you areusing automatic axis ranges, you can set the same axis range for all the detailcharts:v Select the axis.v In the Properties pane, under General, double-click the Axis Range
property.v Under Maximum and Minimum, click Automatic.
The master detail report option is only available with automatic axis ranges.v Under Master detail reports, select the Same range for all instances of
chart check box.For more information about axis ranges, see “Change the Axis Scale of aCurrent Default Chart” on page 120.
Tip: To avoid seeing the same data item twice in the report, click the dataitem in the data container driven by the detail query and click the cut button.This removes the item from the report display but keeps it in the query.
Related concepts:“Master Detail or Burst Reports with Charts or Crosstabs May Result in Denial ofService” on page 499When running a master detail or burst report that includes a chart or crosstab, diskspace exhaustion may cause the report or other requests to fail. A large set of burstkeys or master rows may produce one or more charts per detail, resulting in manymaster detail executions. This may cause the temp folder to accumulate manygigabytes of temporary files containing data required for successful chartrendering.
Link Members from Two Data SourcesIf you create a master detail relationship using queries that reference two differentdimensional data sources, you may need to create a relationship between levelswith the same member captions but different Member Unique Names (MUNs).
For more information about MUNs, see “Recommendation - Use Member UniqueName (MUN) Aliases” on page 547.
294 IBM Cognos Report Studio Version 10.2.1: User Guide
For example, you may want to link the Americas member in the Sales territorylevel in the Sample Outdoors cube with Americas in the GO Subsidiary level in theSample Outdoors Finance cube. To create the relationship, you must alias the levelsthat contain the members to link.
Procedure1. In the parent frame or the report page, double-click the level that contains the
member that will provide the primary information.The Data Item Expression dialog box appears.
2. In the Expression Definition box, use the expression in the following function:caption ( expression )For example, caption ( [great_outdoors_company].[Sales Territory].[SalesTerritory].[Sales territory] )
3. Repeat steps 1 to 2 for the level in the data container that contains the details.A caption alias is created for each level. You can now use the caption alias foreach level to create a master detail relationship using member captions, whichare the same, instead of MUNs, which are different.
Results
You can now create the master detail relationship between the two levels.
Working with Queries in SQL or MDXFor each query in a report, you can work with the SQL or MDX that is executedwhen you run a report.
Note: MDX is not available with DMR data sources.
View the SQL or MDX for an Entire Report or a QueryView the SQL or MDX to see what is passed to the database when you run areport.
Only SQL is available when using DMR data sources because these data sourceswere relational.
Procedure1. To view the SQL or MDX for the entire report, from the Tools menu, click
Show Generated SQL/MDX.This option shows the SQL or MDX that will be executed in the data source.The SQL or MDX is organized by query and by query result. If a query is usedin more than one data container, a query result is generated for each datacontainer.
2. To view the SQL or MDX for a specific query, do the following:
v Pause the pointer over the query explorer button and click the query.v In the Properties pane, double-click the Generated SQL/MDX property.The Generated SQL/MDX property shows the SQL or MDX that is executedwhen you view tabular data (from the Run menu, click View Tabular Data).Tabular data shows the data that is produced by the query in the form of a list.You can use this property to help you build advanced queries.
Chapter 10. Dimensional Reporting Style 295

Results
The SQL or MDX for the query appears in the Generated SQL/MDX dialog box.For SQL, you can choose to view native SQL, which is the SQL that is passed tothe database when you execute the query, or Cognos SQL, which is a generic formof SQL that IBM Cognos Report Studio uses. Cognos SQL is converted to nativeSQL before the query is executed.Related tasks:“Showing prompt values in generated SQL or MDX” on page 326You can show prompt values when viewing the generated SQL or MDX of a queryor report.
Build a Report Using Your Own SQL or MDXYou can build a report by adding SQL or MDX from an external source, such asanother report.
If you are working with MDX, you must be aware of the MDX syntax that IBMCognos Report Studio supports.
If you edit the SQL of a query, you must change the Processing property for thatquery to Limited Local.
You cannot build a report by adding your own MDX if the data source is IBMCognos TM1®. IBM Cognos TM1 does not support custom MDX.
Procedure1. From the File menu, click New.2. Click Blank.
3. Pause the pointer over the query explorer button and click Queries.
4. From the Toolbox tab , drag Query to the work area.5. From the Toolbox tab, do one of the following:
v To build an SQL query, drag SQL to the right of the query.v To build an MDX query, drag MDX to the right of the query.
Tip: You can drag SQL or MDX anywhere in the work area, and ReportStudio will automatically create a query.
6. In the Properties pane, double-click the Data Source property and click a datasource.
7. If required, set the Catalog property to the name of the catalog.8. Double-click the SQL or MDX property and type the SQL or MDX.9. Click Validate to check for errors.
10. If you are working with SQL, in the Properties pane, set the Processingproperty to Limited Local.
11. Double-click the query.If the SQL or MDX is valid, the data items defined in the SQL or MDX appearin the Data Items pane.
12. Pause the pointer over the page explorer button and click a report page.13. From the Toolbox tab, drag an object to the work area.
For example, drag a list, crosstab, chart, or repeater.
296 IBM Cognos Report Studio Version 10.2.1: User Guide

14. Click the data container.
15. In the Properties pane, click the select ancestor button and click thecontainer you just created.For example, if you created a list, click List.
Tip: You can also click the container selector (three orange dots) of thecontainer to select it.
16. Set the Query property to the query for the report type.
17. From the Data Items tab , drag the items from the query you chose in theprevious step to the data container.
Convert a Query to SQLYou can convert a query to SQL to edit it. You may want to do this to improveperformance or to use SQL features that are not supported directly by IBM CognosReport Studio.
Converting a query to SQL is an irreversible process.
Procedure
1. Pause the pointer over the query explorer button and click the query.2. In the Properties pane, double-click the Generated SQL property.3. Click Convert.4. Click Validate to check for errors.5. In the Properties pane, set the Processing property to Limited Local.
Edit the SQL or MDXYou can edit the SQL or MDX for a query that has been created as an SQL or MDXquery or that has been converted to SQL.
Procedure
1. Pause the pointer over the query explorer button and click the SQL orMDX item under the query.
2. Double-click the SQL or MDX item.3. Make changes in the text box.
If you are working with MDX, you must be aware of the MDX syntax that IBMCognos Report Studio supports.
4. Click Validate to check for errors.
First-Rows OptimizationThe SQL produced by IBM Cognos Report Studio depends on the report formatyou choose. For example, if you specify HTML format, first-rows optimization isrequested. All-rows is requested if you specify PDF.
It is important for database administrators and programmers to remember thatReport Studio does not always use first-rows optimization. If you assumefirst-rows optimization is always requested, this can cause the RDBMS optimizer toprocess the query differently than you expect.
Chapter 10. Dimensional Reporting Style 297

Supported MDX SyntaxIf you are working with MDX, you must be aware of the syntax that Report Studiosupports. IBM Cognos Report Studio supports the MDX grammar as specified inMicrosoft Data Access Software Developer Kit version 2.8.
Report Studio supports the following MDX functions. This is a partial list andapplies only when you are working with the following data sources:v cubesv SAP BWv IBM Cognos TM1v DB2® OLAPv IBM Cognos Consolidationv IBM Cognos Contributor
For these data sources, IBM Cognos Business Intelligence uses a variation of theMicrosoft SQL Server Analysis Services syntax.v Acos
v Aggregate
v Ancestor
v Ancestors
v Asin
v Atan
v Avg
v BottomCount
v BottomPercent
v BottomSum
v Children
v ClosingPeriod
v CoalesceEmpty
v Convert
v Cos
v Cosh
v Count
v Cousin
v Crossjoin
v CurrentMember
v DefaultMember
v Descendants
v Dimension
v Distinct
v Except
v Exp
v Filter
v FirstChild
v FirstSibling
v Generate
v Head
298 IBM Cognos Report Studio Version 10.2.1: User Guide

v Hierarchize
v Hierarchy
v IIf
v Intersect
v Is
v IsAncestor
v IsEmpty
v Item
v Lag
v LastChild
v LastPeriods
v LastSibling
v Lead
v Level
v Levels
v LinkMember
v Ln
v Log10
v Max
v Median
v Members
v Min
v Mtd
v Name
v NextMember
v OpeningPeriod
v Order
v Ordinal
v ParallelPeriod
v Parent
v PeriodsToDate
v PrevMember
v PreviousMember
v Properties
v Qtd
v Rank
v Siblings
v Sin
v Sinh
v Stddev
v Subset
v Sum
v Tail
v Tan
v Tanh
Chapter 10. Dimensional Reporting Style 299

v TopCount
v TopPercent
v TopSum
v Union
v Value
v Var
v Wtd
v Ytd
Example - Create a Dynamic Report That ShowsPeriod-to-date Data
When you are working with a dimensional data source, you can use dimensionalfunctions to retrieve data for a specific period-to-date.
In this topic, you learn how to create a dynamic report that retrieves year-to-daterevenue for each product line. The report also shows the percentage of the revenuethat is generated in the month users select when they run the report.
It should take 15-20 minutes to complete this topic, and your report will look likethis.
Procedure1. Create a crosstab report that uses the Go Data Warehouse (analysis) package.2. Add the following data items to the report:
v From Product, drag Product line to the Rows drop zone.v From Sales fact, drag Revenue to the Measures drop zone.
Tip: Use the Source tab .3. Create the following query calculation named Selected Month in the
Columns drop zone:[Sales].[Time].[Time].[Month]->?Month?
4. Create this query calculation named Year to Date Set next to the SelectedMonth column:periodsToDate([Sales].[Time].[Time].[Year],[Selected Month])
Figure 45. Crosstab report showing year-to-date revenue for product lines
300 IBM Cognos Report Studio Version 10.2.1: User Guide

Tip: Information about the periodsToDate function is displayed in theInformation pane when you click the function in the Functions tab. TheperiodsToDate function is in the M-Q folder in the Dimensional Functionsfolder.
5. Click the Year to Date Set column and click the cut icon .6. Create the following query calculation named YTD Revenue next to the
Selected Month column:total (currentMeasure within set [Year to Date Set])
7. Create the following query calculation named Percent of YTD Revenue nextto the YTD Revenue column:[Selected Month]/[YTD Revenue]
8. Click the Unlock icon to unlock the report.9. Add this text item to the left of the text in the YTD Revenue column, and add
a blank space after the text:YTD Revenue:
10. Set the font style of the text to italic.11. In the YTD Revenue column, click <#YTD Revenue#> and change the Source
Type property to Report Expression.12. Double-click the Report Expression property and drag the Month parameter
to the Expression Definition box.
Tip: You can find the Month parameter in the Parameters tab.13. Click the lock icon to lock the report.14. Right-click the Percent of YTD Revenue column title and click Select
Member Fact Cells.15. In the Properties pane, double-click the Data Format property.16. Under Format type, click Percent.17. Set the No. of Decimals property to 2.18. Run the report to view it.
Results
Users are prompted to select a month. When they click OK, the report showsyear-to-date revenue for each product line and the percentage of revenue that isgenerated for the selected month.
For more information, see the following references:v Creating Report Templatesv Add Relational Data to a Report or Add Dimensional Data to a Reportv Using Dimensional Calculationsv Format Crosstabsv Specify the Fontv Format Data
Chapter 10. Dimensional Reporting Style 301

Using Dimensional CalculationsInsert a calculation to make your report more meaningful by deriving additionalinformation from the data source. For example, you create an invoice report, andyou want to see the total sale amount for each product ordered. Create a calculatedcolumn that multiplies the product price by the quantity ordered.
You build calculations in the expression editor using functions.
If a calculation is used in multiple reports, or by different report authors, ask yourmodeler to create the calculation as a standalone object in the model and include itin the relevant package.Related concepts:“Considerations when Creating Calculations” on page 537Consider the following information and limitations when creating dimensionalcalculations.
Create a Simple Member CalculationWhen working with dimensional data sources, you can select members in yourreport and create simple calculations.
In addition to simple arithmetic calculations, you can perform the followingcalculations:
Calculation Description
Rollup Summarizes, or rolls up, all the values of theselected items in a hierarchy.
% Calculates the value of a selected item as apercentage of another item.
% Difference Calculates the difference between two itemsas a percentage.
% Of Base This calculation is only available if youselect two members from differenthierarchies, each from a different edge.
This calculation takes the first selectedmember from edge A and the secondselected member from edge B. Thecalculation result of a percent of base shouldbe such that all the values for member Awill compare itself to the intersect value ofmember A and B.
For example, you have a crosstab showingquantity sold by year by product line. Youselect 2012 and Camping Equipment,right-click the selection, click Calculate, andthen click % of Base (2012, CampingEquipment). The calculated row shows thepercentage value of each product line for2012 as compared to Camping Equipmentfor 2012.
302 IBM Cognos Report Studio Version 10.2.1: User Guide

Calculation Description
Custom Allows you to specify your own value whenperforming a simple arithmetic calculation.Also allows you to change the order ofoperands or type a custom name for thenew calculated row or column.
Procedure1. Select the items in your report to calculate.
2. Click the insert calculation button and select the calculation to perform.
Tip: Calculations that are not applicable to the items you selected are greyedout.
3. To change the order of the operands or the name of the calculated item addedto the report, click Custom.
Results
The calculation appears as a new row or column in your report.
Insert a Query CalculationWhen working with dimensional data, insert a query calculation into your reportto add a new row or column with values that are based on a calculation. Forexample, you create a query calculation named Euros that converts dollars to eurosby multiplying an existing dollar measure by a conversion rate. Euros can then bedisplayed to end users in a separate row or column.
In IBM Cognos Report Studio, you can create the following types of calculations:v Create calculated members or calculated measures where the expression is a
member or a tuple-based (as opposed to property-based) value expression. Forexample, [2013] - [2012] is a calculated member and [Revenue] - [PlannedRevenue] is a calculated measure.
v Use set expressions to create calculated sets of members. For example, children([2012]) is a set expression that displays the child members of 2012.You must base each set expression on a hierarchy and the set expression mustcontain only members from this hierarchy.
v Create value expressions when you want to insert a string, number, date, orinterval value.
You can also create a calculation that uses an intersection (tuple) that you alreadydefined.
If you are using a DB2 data source, the subtract operator is invalid if you combinethe datatypes timestamp2 and packed decimal.
When creating an expression that will be used in a double-byte environment, suchas Japanese, the only special characters that will work are ASCII-7 and ~ -- || - $ ¢£ ¬.
Chapter 10. Dimensional Reporting Style 303

Procedure
1. From the Toolbox tab , drag Query Calculation to the report.2. In the Name box, type a meaningful name for your calculation.
For example, if you are calculating the difference between 2012 revenue and2011 revenue, you could name your expression 2012 - 2011 Revenue.
3. Click the type of calculation you want to create and select the hierarchy thatcontains the data that is the focus of your calculation.
4. In the Available Components pane, define the calculation:v Specify how you want to view the available data items in your data package
by clicking the view member tree button or the view package tree
button .
v To add data items that are not shown in the report, on the source tab ,double-click the data items.
v To add data items that are in the report but not necessarily in the model,
such as calculations, on the data items tab , double-click the data items.
v To add data items from a specific query, on the queries tab , double-clickdata items.
v To add functions, summaries, and operators, on the functions tab ,double-click elements.
Tip: To filter the visible functions, summaries, and operators in the
Available Components pane, click the filter button and filter by thefunction type, what the function returns, or what the function acts on.
v To add a value that is derived from a parameter, on the parameters tab ,double-click a parameter.Parameters define prompts, drill-through reports, and master detailrelationships.
v To add a macro, on the macros tab , drag the parameter maps, sessionparameters, or functions you want to add to the macro.
Tip: Use Insert macro block to get you started with creating the macroexpression. Insert macro block inserts number signs in the expression. Makesure that the macro expression you create is between the number signs.
Tips:
v You can also type the calculation directly in the Expression Definition box.v When typing date values, ensure that the date format is correct for your
database type.v To copy and paste expression components in the Expression Definition
pane, you can use the copy button and the paste button .For information about specific functions, see Appendix F, “Using the expressioneditor,” on page 555.
304 IBM Cognos Report Studio Version 10.2.1: User Guide

5. Click the validate button .Any validation errors appear on the Errors tab of the Information pane.Tips:
v To show or hide the Available Components pane, click the available
components button .
v To show or hide the Information pane, click the information button .v To copy and paste expression components in the Expression Definition
pane, you can use the copy button and the paste button .Related concepts:Chapter 17, “Using Query Macros,” on page 403A macro is a fragment of code that you can insert in the Select statement of aquery or in an expression. For example, add a macro to insert a new data itemcontaining the user's name.
Create a Layout CalculationCreate a layout calculation to add run-time information to your report, such ascurrent date, current time, and user name.
When you create layout calculations, unsupported functions do not appear in theFunctions tab of the expression editor. Specifically, there is no Summaries folder,and some operators, constants, and constructs are also unavailable. These functionsare not available because only the database can perform them. Report expressionsand calculations based on layout expressions are performed in IBM Cognos ReportStudio.
To see the complete list of functions available in the expression editor, except forreport functions, create a query calculation. All functions are available when youcreate a query calculation because these calculations are performed in the databaseand not in Report Studio.
Procedure
1. From the Toolbox tab , drag Layout Calculation to the report.2. In the Available Components box, define the calculation:
v To add data items that are not shown in the report, on the source tab ,double-click data items.
v To add data items from a specific query, on the queries tab , double-clickdata items.
v To add functions, summaries, and operators, on the functions tab ,double-click elements.
v To add a value that is derived from a parameter, on the parameters tab ,double-click a parameter.Parameters define prompts, drill-through reports, and master detailrelationships.
Tips:
Chapter 10. Dimensional Reporting Style 305

v You can also type the calculation directly in the Expression Definition box.v When typing date values, ensure that the date format is correct for your
database type.v To copy and paste expression components in the Expression Definition
pane, you can use the copy button and the paste button .For more information about creating expressions, see Appendix F, “Using theexpression editor,” on page 555.
3. Click the validate button .
Create an Intersection (Tuple)When working with dimensional data, an intersection, also known as a tuple, isuseful for obtaining a value from the combination of two or more members thatyou specify. Each member must be from a different hierarchy. The intersection caninclude only one measure.
For example, the intersection (Revenue, 2012, Cooking Gear) shows the revenuevalue for the year 2012 and for the product line Cooking Gear.
Use tuples to avoid report summaries that do not reflect the visible data. For moreinformation about this issue, see “Summaries in a report do not correspond to thevisible members” on page 490.
Procedure
1. From the Toolbox tab , drag the Intersection (Tuple) object to the report.2. From the Available members and measures pane, select items and click the
right arrow to move them to the Intersection members and measures box. You
can also use items from the Calculated Members and Measures tab .3. To define the hierarchy for this intersection, click a parent object in the
Intersection hierarchy box.
Assigning a Hierarchy or DimensionYou must assign each calculated member, set expression, and intersection (tuple) toa hierarchy or dimension. We recommend that you select the hierarchy ordimension upon which your calculation focuses. For example, if your calculatedmember is based on years, select the Time hierarchy. If you create a calculatedmeasure, select the Measures dimension.
Select only a hierarchy that cannot affect the value of the calculation. For example,the hierarchy Camping Equipment has the same value no matter what Productscontext it appears in the report. Therefore,v the calculation ([Camping Equipment]-[Mountaineering Equipment]) has a
well-defined meaning only in the Products hierarchy, so select that hierarchy.v the calculation tuple ([Revenue], [Camping Equipment]) can be assigned to
either the Products or Measures hierarchy, as it is not affected by either context.v the calculations ([2013] - [Camping Equipment]) and ([Fiscal Year 2013] -
[Calendar Year 2013]) do not have a well-defined meaning in any hierarchy, andtherefore cannot be used reliably at all.
306 IBM Cognos Report Studio Version 10.2.1: User Guide

Drilling Up and Drilling Down in Dimensional ReportsWhen working with dimensional or dimensionally-modeled relational (DMR) datasources, you can create reports that allow the reader to view more general or moredetailed information on your data within a predefined dimensional hierarchy (suchas Years - Year - Quarter - Month) without having to create different reports.
You can link groups of data items from different queries so that when you drill upor drill down in one query, the data item also drills up or drills down in the linkedqueries. Linking data items is useful if your report includes more than one querywith the same data item. For example, if your report shows a list and a crosstabthat each include the Product Line data item, you can link the Product Line dataitem from the crosstab query to the Product Line data item from the list query sothat when you drill up in the crosstab Product Line data item, the list Product Linedata item also drills up.
Member SetsMember sets are used to group data items that are logically related for variousactions, such as drill actions, zero suppression, and ranking. They can be definedas a flat list or as a tree structure in which member sets in the same parent chainare considered related.
For example, for drill operations, a member set defines the set of items that canpotentially change when a given item in the set is drilled on. The values of otheritems in the query or even those in the same hierarchy are preserved when anyitem in this set is drilled on. Usually, a member set references items that havelogical roles in a drill action, such as a detail, a summary of the detail, or a parentof the detail. A single data item can belong to only one member set.
If you do not define member sets for items, the IBM Cognos Business Intelligenceserver associates items into default member sets and behaviors using simpledimension rules on item expressions. You can override the behavior for a particularitem while other items continue to use the default.
When you define a member set, you must explicitly define behaviors for each itemin the set. Items in the set that have no behaviors have their values preserved.
Drill behaviors always act from a root member set. This means that when an itemis drilled on, the root member of its member set is found and all items from theroot down are processed. Although calculations and aggregates are not directlyrelated by hierarchy, they respond because of their dependence on the items uponwhich they are based.
Create Member SetsCreate a member set when you want to define a non-default drill behavior. Youspecify what items respond to a drill action by adding them to the member set.
Procedure
1. Pause the pointer over the query explorer button and click the query inwhich to create a member set.
2. In the Properties pane, set the Define Member Sets property to Yes.3. Double-click the query and click the Member Sets tab.
4. From the Source tab , drag items to the work area.
Chapter 10. Dimensional Reporting Style 307

To define a member set as a tree structure, drag the item that will serve as theroot item of the set to the work area, and then drag other items over the rootitem to create the tree structure.
Note: You can also nest member sets.
Create a Drill-up and Drill-down ReportYou can link groups of data items from different queries so that when you drill upor drill down in one query, the data item also drills up or drills down in the linkedqueries.
When you drill down or up, you can specify whether the column title shows themember caption value or the level label value. By default, titles use membercaptions. Using level labels may be more meaningful. For example, within theCountry or Region column, you drill down on Australia. By default, the columntitle becomes Australia, the member caption. It may be more meaningful to useCountry or Region, the level label, as the column title.
Tip: The Returned Items sample report in the GO Data Warehouse (analysis)package includes drilling. For more information about The Sample OutdoorsCompany samples, see Appendix C, “Sample Reports and Packages,” on page 507.
Before you begin
Before you begin, ensure that you are using a dimensional data source.
Procedure1. From the Data menu, click Drill Behavior.2. On the Basic tab, in the Report output drill capabilities box, select the Allow
drill-up and drill-down check box.By default, IBM Cognos Report Studio determines which items can be drilledon based on the dimensional structure.
Tip: To enable the report to be used as the source during a packagedrill-through, select the Allow this report to be a package-based drill-throughsource check box and click OK. For more information about packagedrill-through, see the Administration and Security Guide.
3. To disable drill-up or drill-down for a data item, select the data item in eitherthe Disable drill-up for box or the Disable drill-down for box.
4. From the Advanced tab, you can change the drill-up or drill-down behavior forany data item by selecting the data item and then choosing one of thefollowing behaviors.
Behavior name Drill-up behavior Drill-down behavior
Preserve The data item's value willremain unchanged.
The data item's value willremain unchanged.
Empty Set The set of values associatedwith this data item is set tobe the empty set (novalues).For crosstabs, the data itemwill effectively be removedfrom the report.
The data item will beremoved from the report.
308 IBM Cognos Report Studio Version 10.2.1: User Guide

Behavior name Drill-up behavior Drill-down behavior
Replace Item The data item's value willchange to become the parent(if a lowest-level summarywas drilled up on) or thegrandparent (if a lowest-leveldetail of a dimension wasdrilled up on) of the itemthat was drilled on.
The data item's value willchange to become the itemthat was drilled on.
Replace Expression The data item's value willchange to become thechildren of the parent (if alowest-level summary wasdrilled up on) or the childrenof the grandparent (if alowest-level detail of adimension was drilled upon) of the item that wasdrilled on.
The data item's value willchange to become thechildren of the item that wasdrilled on.
Change Expression The data item's value willchange to become the valueof some other data item inthe query.
The data item's value willchange to become the valueof some other data item inthe query.
Depth Based Expression The data item's value willchange to become all dataitems n generations higher inthe dimensional hierarchythan the item that wasdrilled on. The number ofgenerations or levels isdetermined by the Depthvalue.
The data item's value willchange to become all dataitems n generations higher inthe dimensional hierarchythan the item that wasdrilled on. The number ofgenerations or levels isdetermined by the Depthvalue.
Ancestor The data item's value willchange to become the datavalue of the ancestor ngenerations higher in thedimensional hierarchy thanthe item that was drilled on.The number of generationsor levels is determined bythe Depth value.
The data item's value willchange to become the datavalue of the ancestor ngenerations higher in thedimensional hierarchy thanthe item that was drilled on.The number of generationsor levels is determined bythe Depth value.
5. In the Column title drill behavior box, specify whether to use membercaptions or level labels as the columns titles for each data item.
6. From the Data Items Linking tab, you can link groups of data items:
v Click the new button .v Type a name for this group of linked data items and click OK.
To rename a group of linked data items, click the group, click the rename
button , type a name, and click OK.v Use the arrows to move data items from the queries on the left to the groups
on the right.
Note: You can only add a data item to one group.
Chapter 10. Dimensional Reporting Style 309

Results
The report will generate links for any item that can be drilled up or down on.
When you run a report, you can drill down or drill up by right-clicking the dataitem and choosing the action from the context menu. The menu items will bedisabled if an item cannot be drilled up or down on.Related tasks:“Create a Drill-up and Drill-down Chart” on page 153If you use a dimensionally-modeled data source, you can create a chart that allowsyou to drill down to lower-level data or drill up to higher-level data.
Recommendation - Drilling Down in Very Large Data SourcesWhen you drill down in a report that uses a very large data sources query resultscan be much larger than what can be held in memory. For example, if you insertthe lowest level of four hierarchies that each contain 1000 members, the report cancontain 1000,000,000,000 cells. At best, this query will take a very long time to run.While this large query executes, all other queries for the same server process willlikely be blocked. For most data sources, the query will likely fail due toinsufficient memory or timing out. Then the memory is released and normalservices resume.
However, when using a Microsoft SQL Server 2005 Analysis Services (SSAS) cube,the memory consumed by the SSAS client is not always released in a way thatother queries can effectively re-use. The server continues to run with insufficientmemory, causing new queries to either run very slowly or fail completely. You mayencounter an error, and, to continue, the system administrator must manually stopand restart the IBM Cognos BI service.
To avoid these problems, consider the size of hierarchy levels and sets whencreating reports and avoid combining them in ways that create large queries. Todetermine the size of a set, create and run a very small report that includes only acount of the members within that set. You can also use filtering techniques to focusyour data.
Example - Create a Dashboard ReportCreate a dashboard report to show a high-level graphical view of companyperformance indicators.
By using dashboard reports, users canv drill up and drill down to see higher and lower levels of detailv navigate to other targets, including IBM Cognos Report Studio reports, IBM
Cognos Query Studio reports, and IBM Cognos Analysis Studio analysesv include multiple charts derived from different data sources in a single report
Dashboard reports are not the same as workspaces or dashboards created in IBMCognos Workspace. Dashboard reports display several different report objects inone report, but the information in the report is static. Workspaces created inCognos Workspace are a collection of IBM Cognos content that you assemble intoan interactive workspace. Content is displayed in widgets. For information aboutcreating interactive and sophisticated workspaces, see the IBM Cognos WorkspaceUser Guide. You can also create dashboards within IBM Cognos Connection. Inthese dashboards, content is displayed in portlets within pages. For moreinformation, see the IBM Cognos Connection User Guide.
310 IBM Cognos Report Studio Version 10.2.1: User Guide

In this topic, you learn how to create a dashboard report so that users can examineimportant sales data in a single view.
It should take 15 to 20 minutes to complete this topic, and your dashboard reportwill look like this.
Procedure1. Create a blank report with the GO Data Warehouse (analysis) sample
package.2. Add a column chart, a bullet chart, and a crosstab.3. Drag the following items to the bullet chart:
v Revenue (in Sales and Marketing (analysis), Sales, Sales fact) to theBullet Measure drop zone
v Planned Revenue to the Target Measure drop zonev Product line level (in Products) to the Series (matrix rows) drop zonev Region level (in Retailers) to the Categories (matrix columns) drop zone
4. Drag the following items to the column chart:v Revenue (in Sales fact) to the Default measure (y-axis) drop zonev Product line level (in Product) to the Categories (x-axis) drop zonev Retailers level (in Retailers) to the Series (primary axis) drop zone
Chapter 10. Dimensional Reporting Style 311

5. Drag the following items to the crosstab:v Gross margin (in Sales fact) to the Measures drop zonev Product line level (in Product) to the Rows drop zonev Region level (in Retailer site) to the Columns drop zone
6. Click the bullet chart.7. Set the Size & Overflow property width to 300 px and height to 300 px.8. Set the Title property to Show.9. Double-click the chart title and type the following text:
Gross Profit for Product Lines by Region
10. Set the Font property for the chart title to Arial, 12pt, Bold.11. Set the Padding property for the left and bottom padding to 20 px.12. In the Bullet Indicators property, set the bar width to 30%.
13. Click the chart, click the palette button , and click Contemporary fromthe available palettes.
14. Set the Size & Overflow property width to 300 px.15. Set the Title property to Show.16. Double-click the chart title and type the following text:
Product Lines: Revenue by Retailer
17. Set the Font property for the chart title to Arial, 12pt, Bold.18. From the Data menu, click Drill Behavior.19. Select the Allow drill-up and drill-down check box.20. Run the dashboard report to view what it will look like for your users.
Results
Users can drill up or drill down on values in the report to view relatedinformation.
For more information, see the following references:v Creating Report Templatesv Add Relational Data to a Report or Add Dimensional Data to a Reportv “Customize a Current Default Gauge Chart” on page 144v Customize a Legacy Gauge Chartv Specify the Height and Widthv Specify the Fontv Create a Drill-up and Drill-down Report
312 IBM Cognos Report Studio Version 10.2.1: User Guide

Chapter 11. Adding Prompts to Filter Data
You can add prompts to a report to add interactivity for users. Prompts act asquestions that help users to customize the information in a report to suit their ownneeds. For example, you create a prompt so that users can select a product type.Only products belonging to the selected product type are retrieved and shown inthe report.
Prompts are composed of three interrelated components: parameters, promptcontrols, and parameter values. Parameters are based on parameterized filters andform the questions to ask users. Prompt controls provide the user interface inwhich the questions are asked. Parameter values provide the answers to thequestions.
IBM Cognos Report Studio provides several ways to create prompts. You canv use the Build Prompt Page toolv build your own prompt and prompt pagev create a parameter to produce a promptv insert prompts directly into the report pagev in dimensional reporting, you can also define prompts using context filters
If you include reports from different packages in an interactive dashboard thatuses global filters, ensure that you use the same parameter name for the prompt inall the reports. For more information about creating interactive dashboards in IBMCognos Connection, see the IBM Cognos Business Intelligence Administration andSecurity Guide.
You can also create prompts in the package. For more information, see the IBMCognos Framework Manager User Guide.
You can also use context filters, also known as slicer filters, to focus the data inyour report.
Syntax of Prompt Expressions
Prompt expressions use the following syntax, where p represents the parametername.
You can also use these expressions to create parameterized data items that you canthen use in master detail relationships.
The type of expression you use depends on whether you have chosen relational ordimensional reporting style. For more information about reporting styles, see“Relational and dimensional reporting styles” on page 22.
Relational: Detail Filter ExpressionsDimensional: Context (Slicer) or EdgeExpressions
[data item] = ?p?
for single-select prompts and master detailrelationships
[level or hierarchy]->?p?
For single-select member prompts andmaster detail relationships
© Copyright IBM Corp. 2005, 2013 313

Relational: Detail Filter ExpressionsDimensional: Context (Slicer) or EdgeExpressions
[data item] in ?p?
for multi-select prompts
set([level or hierarchy]->?p?)
For multi-select member prompts
filter [set], [property expression] = ?p? )
For single-select value prompts and masterdetail relationships
A property expression is an expression thatis assigned to a property to enable dynamicupdate of the property when the reportruns.
filter [set], [property expression] IN ?p? )
For multi-select value prompts
A property expression is an expression thatis assigned to a property to enable dynamicupdate of the property when the reportruns.
Related concepts:“Prompt control labels” on page 472You can associate labels to prompt controls to make the prompts accessible.Related reference:Appendix H, “Prompt API for IBM Cognos BI,” on page 975The JavaScript Prompt API provides report authors with a method of customizingprompt interaction in the reports they author.
Use the Build Prompt Page ToolUse the Build Prompt Page tool to quickly add filters and prompts to a report.This tool creates filters in the query using the prompt information properties thatare set in the IBM Cognos Framework Manager model. For more informationabout the prompt information properties, see the Framework Manager User Guide.
Note: The Promotion Success sample report in the GO Data Warehouse (analysis)package includes a prompt page. The Historical Revenue sample report in theSales and Marketing (cube) package and the Eyewear Revenue by Brand and Sizesample report in the GO Data Warehouse (analysis) package include multipleprompts. For more information about The Sample Outdoors Company samples, seeAppendix C, “Sample Reports and Packages,” on page 507.
Before you begin
Note: The Build Prompt Page tool creates a static report specification, so if theprompt information properties are updated in the Framework Manager model,those updates will not be reflected in your report.
Procedure1. Click the column or row on which users will be prompted.
To create multiple prompts or a cascading prompt, click more than one columnor row.
314 IBM Cognos Report Studio Version 10.2.1: User Guide

2. From the Tools menu, click Build Prompt Page.A prompt page is created that hasv a page headerv a prompt control for each selected columnv a page footer containing Cancel, Back, Next, and Finish buttons
Build Your Own Prompt and Prompt PageCreate your own prompt and prompt page to control how they appear in a report.
Note: The Promotion Success sample report in the GO Data Warehouse (analysis)package includes a prompt page. For more information about The SampleOutdoors Company samples, see Appendix C, “Sample Reports and Packages,” onpage 507.
Procedure
1. Pause the pointer over the page explorer button and click Prompt Pages.
2. From the Toolbox tab , drag Page to the Prompt Pages box.3. Double-click the page you just created.4. From the Toolbox tab, drag one of the following prompt controls to the prompt
page.
Prompt control Description
Text Box PromptRetrieves data based on a value that userstype.
Use this control when users know exactlywhat value they want to enter, such as aname or account number.
Value PromptRetrieves data based on values that usersselect from a list.
Use this control to show a list of possiblevalues from which users can choose.Note: The maximum number of items thatcan appear in a list is 5000.
Select & Search PromptRetrieves values based on search criteria thatusers specify. Data is then retrieved basedon values users select from the searchresults.
Use this control instead of a value prompt ifthe list of values is very long, which canslow down performance.Tip: Users have the option of performing acase sensitive or case insensitive search. Acase sensitive search is faster, while a caseinsensitive search usually returns morevalues.
You cannot use this control if you areworking with SAP BW data sources.
Chapter 11. Adding Prompts to Filter Data 315

Prompt control Description
Date PromptRetrieves data based on a date that usersselect.
Use this control to filter a date column.Users can retrieve data for a specific day, aset of days, or a range of days.
Time PromptRetrieves data based on a time that usersselect.
Use this control to restrict a report to aparticular time or time range. For example,users can see how many orders are receivedafter business hours. Users can then use thisinformation to determine the number of staffneeded to work after hours.
Date & Time PromptRetrieves data based on a date and time thatusers select.
Use this control to filter a datetime ortimestamp column. This control is useful forspecifying ranges. For example, users canretrieve all orders received from Monday at12:00 a.m. to Friday at 5:00 p.m.
Interval PromptRetrieves data based on a time interval thatusers specify.
Use this control to retrieve data that isrelated to the passage of time. For example,users can retrieve a list of products thatwere returned 30 or more days after theywere purchased.
Tree PromptRetrieves data based on values that usersselect from a list. Values are organizedhierarchically.
This control is useful when you are workingwith dimensional data sources. Data isshown from the top of a dimensionhierarchy to the most detailed member, andusers can choose the level of detail theywant to view in the report. For moreinformation about tree prompts, see “Controlthe Data That Appears in a Tree Prompt” onpage 326.
Tree prompts let you page through largenumbers of prompt values with a More linkat the bottom of the tree.
Generated PromptSelects a prompt control based on the datatype of the data item.
This control acts like a placeholder. Whenusers run the report, the control is replacedby the appropriate prompt control. Forexample, if users are prompted for datevalues, the control is replaced by a date &time prompt.
316 IBM Cognos Report Studio Version 10.2.1: User Guide

The Prompt Wizard dialog box appears.5. If you are creating a text box, date, time, date and time, interval, or generated
prompt, do the following:v Create a new parameter for the prompt or use an existing parameter.v Click Next.v If you created a new parameter, define the expression by selecting a data
item from the package and the operator to use.
Tip: Make the prompt optional by selecting the Make the filter optionalcheck box.
v Go to step 7.6. If you are creating a value, select & search, or tree prompt, do the following:
v Create a new parameter for the prompt or use an existing parameter.v Click Next.v If you created a new parameter and you want to use the parameter to filter
data, select the Create a parameterized filter check box and define theexpression by selecting a data item from the package and the operator to use.If you are creating a tree prompt, you must choose in in the Operator box.You can also use a parameter to provide a value for a layout calculation,such as showing a user's name in the report. When the report is run, you canuse a parameter to prompt the user to type his name and have it appear inthe report.
Tip: Make the prompt optional by selecting the Make the filter optionalcheck box.
v Click Next.v If you created a parameterized filter and you have more than one query
defined in the report, select the check box for the query on which to filterand click Next.
v Select the Create new query check box to create the query that will be usedto build the list of data values shown when the report is run.
Tip: Do not create a new query if you want to link the prompt to an existingquery or if you intend to create the query at a later time.
v Click the ellipsis (...) button beside Values to use and click the data item onwhich to prompt.
v To choose a data item that is different than what users will see when theyare prompted, click the ellipsis (...) button beside Values to display and clickthe data item.
v To create a cascading prompt, in the Cascading source box, click theparameter that represents the cascade source.
7. Click Finish.
Results
The prompt control is added to the prompt page. A prompt page is like a reportpage. You can insert graphics and text and apply formatting.
You can also modify the properties of the prompt control by clicking it and makingchanges in the Properties pane.
Chapter 11. Adding Prompts to Filter Data 317

Example - Create a Report Showing Products Shipped for aSpecific Time Interval
You are a report author at The Sample Outdoors Company, which sells sportingequipment. You are requested to create a report that shows the time intervalbetween closing and shipping dates.
Procedure1. Open IBM Cognos Report Studio with the GO Data Warehouse (query)
package.2. In the Welcome dialog box, click Create a new report or template.3. In the New dialog box, click List and click OK.
4. From the Source tab , expand Sales and Marketing (query) and Sales(query).
5. Expand Sales fact and double-click Quantity.6. Expand Products and double-click Product type.7. Expand Sales order and double-click Order number.8. Create a time interval calculation:
v From the Toolbox tab , drag Query Calculation to the right ofQuantity in the list.
v In the Name box, type the following and click OK:Time Interval
v In the Expression Definition box, type the following and click OK:[Sales (query)].[Time (close date)].[Date (close date)]-[Sales (query)].[Time(ship date)].[Date (ship date)]
9. Create a filter:
v From the Data menu, click Filters .
v Click the add button .
v In the Expression Definition box, from the Data Items tab ,double-click Time Interval calculation you created.– Add > ?p1? after Time Interval to create the following expression:
[Time Interval] > ?p1?
v Click OK twice.A parameterized filter is created that will return data when the differencebetween the return date and the order date is greater than the value specifiedby the user.
10. Create a prompt page:
v Pause the pointer over the page explorer button and click PromptPages.
v From the Toolbox tab, drag Page to the Prompt Pages pane, and thendouble-click it.
v From the Toolbox tab, drag Interval Prompt to the work area.The Prompt Wizard dialog box appears.
v Click Use existing parameter, and then click p1.
318 IBM Cognos Report Studio Version 10.2.1: User Guide

v Click Finish.11. Run the report.
An interval prompt appears.12. In the Days box, type a value and click Finish.
Tip: You can also type values for the Hrs and Mins boxes.
Results
A list report appears showing all products that were shipped after the time intervalyou specified. For example, if you typed 5, the list will show products that wereshipped more than 5 days after the order date.
Create a Parameter to Produce a PromptIBM Cognos Report Studio can automatically generate prompted reports based onparameters you create. When you run the report, Report Studio can generate aprompt page for each parameter not associated to an existing prompt pagedepending on whether the prompt run option is selected or not.
Note: When Report Studio automatically generates a prompt, it creates filters inthe query using the prompt information properties that are set in the IBM CognosFramework Manager model. For more information about the prompt informationproperties, see the Framework Manager User Guide.
You can also define parameters when you want to create a drill-through report ordefine master detail relationships.
Procedure
1. From the Data menu, click Filters .
2. On the Detail Filters tab, click the add button .The Detail Filter dialog box appears.
Figure 46. List showing order number, product name, quantity, date, and time interval
Chapter 11. Adding Prompts to Filter Data 319

3. In the Available Components box, click the Source tab or the Data Items
tab to select the data item to use for the prompt:v To filter data based on data items not shown in the report, double-click a
data item on the Source tab.v To filter data that appears in the report but not necessarily in the model,
such as calculations, double-click a data item on the Data Items tab.The data item appears in the Expression Definition box.
4. In the Expression Definition box, type an operator after the data item or select
an operator from the Functions tab .The operator sets some of the default properties of the prompt. For example, ifthe operator is equals (=), users will be able to select only a single promptvalue and the prompt's Multi-Select property is set to No.For more information about creating expressions, see “Using RelationalCalculations” on page 248 or “Using Dimensional Calculations” on page 302.
5. Type a name after the operator to define the prompt parameter. A questionmark must precede and follow the name.
6. To specify whether the prompt is mandatory, in the Usage box, click Required,Optional, or Disabled.
Create a Prompt Directly in a Report PageYou can add prompt controls directly in a report page instead of creating a promptpage.
Prompt controls that are added to report pages will not appear in the following:v saved reportsv PDF reportsv reports that are sent to users by emailv scheduled reports
Prompt controls are interactive. They are used to satisfy parameter values beforerunning a report. As a result, prompt controls added to a report page only appearwhen you run the report in HTML format. When you run a report in HTMLformat, users select which values they want to see, and the report is refreshed,producing a new report.
For the non-interactive reports listed above, prompt parameter values must becollected and satisfied before the report is run. You provide the parameter valuesusing the Run options tab in IBM Cognos Connection. If you do not provide allthe required values, the report will fail to run. You can access the Run options tab
by clicking the set properties button for the report.
Tip: The Revenue by Product Brand (2011) sample report in the Sales andMarketing (cube) package and the Rolling and Moving Averages interactive samplereport include value prompts. For more information about The Sample OutdoorsCompany samples, see Appendix C, “Sample Reports and Packages,” on page 507.
320 IBM Cognos Report Studio Version 10.2.1: User Guide

Procedure
1. From the Toolbox tab , drag a prompt control to the report.The Prompt Wizard dialog box appears.
2. Provide the information necessary to create the prompt.
Tip: Make the prompt optional by selecting the Make the filter optional checkbox. Otherwise, when you run the report for the first time, the prompt appearsin a generated prompt page rather than in the report page. Alternatively, youcan specify a default selection for the prompt.
3. In the work area, click the prompt.4. In the Properties pane, set the Auto-Submit property to Yes.
If you do not set the Auto-Submit property to Yes, the report will not refreshwhen users select a different prompt value.
Tip: An alternative to setting the prompt to auto-submit is to add a promptbutton from the Toolbox tab and set its Type property to Finish.
Results
The prompt control is added to the report page. You can modify its properties byclicking it and making changes in the Properties pane.
Modifying PromptsFor each prompt you create, you can modify its properties by specifying values inthe Properties pane.
For example, you canv change the prompt control interfacev require user inputv enable multiple selectionsv show or hide prompt statusesv specify default selectionsv specify prompt valuesv add prompt buttonsv create cascading prompts
Some properties you set for a prompt may be overridden under some conditions.For example, some properties set for the filter associated with a prompt mayoverride the corresponding prompt property.
Change the Prompt Control InterfaceBy default, when you create a prompt, IBM Cognos Report Studio selects theprompt control interface. You can change the prompt control interface dependingon the type of prompt you created. For example, for a value prompt, you canchoose a drop-down list, a list box, or a radio button group.
Procedure1. Click the prompt control.2. In the Properties pane, set the Select UI property to the interface.
Chapter 11. Adding Prompts to Filter Data 321

Specify That a Prompt Requires User InputYou can specify that a prompt requires user input before the report can run.
Procedure1. Click the prompt control.2. In the Properties pane, set the Required property to Yes.
3. Pause the pointer over the page explorer button and click a report page.
4. From the Data menu, click Filters .5. Click the filter associated with the prompt.6. In the Usage box, click Required.
Results
When you run the report, a star appears next to the prompt indicating that theuser must select or type a value.
If you have a cascading prompt and the parent prompt control is required, thechild prompt control is disabled. This ensures that users choose at least one valuein the parent prompt before they can choose a value in the child prompt.Conversely, if the parent control is optional, then the child control is populated.This gives users the ability to choose values in the child prompt without having tochoose a value in the parent prompt.
Allow Users to Select Multiple Values in a PromptYou can allow users to select more than one value in a prompt. For example, youhave a prompt for which users must select a product line. You can modify theprompt so that users can select more than one product line.
If you enable multiple selections, the Auto-Submit property is always set to no.
Procedure1. Click the prompt control.2. In the Properties pane, choose whether to allow users to specify more than one
value or a range of values:v To allow users to specify more than one value, set the Multi-Select property
to Yes.v To allow users to specify a range of values, set the Range property to Yes.
3. Pause the pointer over the page explorer button and click a report page.
4. From the Data menu, click Filters .If you have more than one query defined in the report, you must first click anobject linked to a query.
5. Double-click the filter associated with the prompt.6. Change the operator to one of the following:
v If you are creating a multi-select prompt, change the operator to in.For example, [Product_line] in ?Product line? where [Product_Line] is thename of the data item allows users to select multiple product lines.
v If you are creating a range prompt, change the operator to in_range.
322 IBM Cognos Report Studio Version 10.2.1: User Guide

For example, [Margin] in_range ?Margin? where [Margin] is the name of thedata item allows users to specify a margin range.
Show or Hide Prompt StatusEach prompt you create in a report provides dynamic validation when the report isrun. Validity checks are performed to ensure that the data is correct and thatrequired values are supplied. For example, a star appears next to each requiredprompt. An arrow appears next to a prompt if you must select or type a value. Ifyou type an incorrect value, a dotted line appears. You can choose whether toshow the star and arrow for each prompt.
Procedure1. Click the prompt control.2. In the Properties pane, set the Hide Adornments property to Yes to hide the
prompt characters or No to show them.
Specify a Default Selection for a PromptYou can specify a default selection for a prompt so that users do not have to selector type a value when they run the report.
Procedure1. Click the prompt control.2. To define a range of values, in the Properties pane, set the Range property to
Yes.3. To specify more than one default selection, in the Properties pane, set the
Multi-Select property to Yes.4. In the Properties pane, double-click the Default Selections property.
5. Click the add button and do one of the following:v If you chose to define a single value, type the value as the default selection.v If you chose to define a range of values, type the minimum and maximum
values of the range in the Minimum value and Maximum value boxes,respectively.
6. Repeat step 4 to specify other default selections.
Customize Prompt TextYou can customize the instructional text that appears around prompts. Forexample, a value prompt with multiple selections includes a Select all link belowthe choices that you can customize to text other than Select all. You can alsospecify translated text in many languages for international report users.
Procedure1. Click the prompt control.2. To change the default prompt text, in the Properties pane, double-click any of
the properties under Prompt Text.
Note: When you select a property in the Properties pane, its descriptionappears in the information pane below the Properties pane.
3. Click Specified text, and then click the ellipsis (...) button.4. In the Localized Text dialog box, type the text that you want to appear.5. To add customized text for other languages:
Chapter 11. Adding Prompts to Filter Data 323

v Click Add.v Select the countries and regions for which you want to specify localized text
and click OK.v To specify text for a country and region, select the country and region and
click Edit, and then type the localized text in the text box.
Specify Prompt ValuesYou can provide your own values in a prompt instead of the default values thatcome from the database.
You can specify your own prompt values tov show something different from what is in the databasev improve performance by not accessing the databasev provide text for optional prompts, such as Select a valuev restrict the number of values available
For example, you have a prompt in which users choose a country or region. Forthe database value United States, you want USA to appear in the prompt.
Tip: The Rolling and Moving Averages interactive sample report includes a valueprompt. For more information about The Sample Outdoors Company samples, seeAppendix C, “Sample Reports and Packages,” on page 507.
Procedure1. Click the prompt control.2. In the Properties pane, double-click the Static Choices property.
3. Click the add button .4. In the Use box, type the prompt value to add.5. In the Display box, type the value that will appear in the prompt.6. Repeat steps 3 to 5 to add other prompt values.7. To link a prompt value to a condition, do the following:
v In the Variable box, choose the variable to use or create your own.For information about creating variables, see “Add a Variable from theCondition Explorer” on page 370.
v In the Value box, click one of the possible values for the variable.
v Click the static value to link to the variable and click the edit button .v In the Display box, type the value to appear in the prompt.v Repeat this procedure for each additional value.
Add a Prompt ButtonAdd prompt buttons so that users can submit selected items, cancel reports, ornavigate between pages.
When you are building prompts and prompt pages, you may have to add promptbuttons to submit selections. Some prompt controls, such as the value prompt, canbe set to submit selections automatically. Other prompt controls, such as the dateprompt, require a prompt button.
324 IBM Cognos Report Studio Version 10.2.1: User Guide

Procedure
1. Pause the pointer over the page explorer button and click the page towhich to add a prompt button.
2. From the Toolbox tab , drag Prompt Button to the work area.3. Click the prompt button and, in the Properties pane, set the Type property to
one of the following actions.
Goal Action
Cancel the report Cancel
Go to the previous prompt page Back
Go to the next prompt page Next
Run the report Finish
Reprompt the userTip: Reprompting users is useful when youhave cascading prompts.
Reprompt
Create a Cascading PromptCreate a cascading prompt to use values from one prompt to filter values inanother prompt. For example, a report contains the columns Product line andProduct type. You create prompts for these columns, and you specify that theProduct type prompt is a cascading prompt that uses Product line as the source.When users select a product line, they see only the product types related to theselected product line.
Tip: The Employee Training by Year sample report in the GO Data Warehouse(analysis) package includes cascading prompts. For more information about TheSample Outdoors Company samples, see Appendix C, “Sample Reports andPackages,” on page 507.
Procedure1. To make the cascading source a required prompt, select it and, in the Properties
pane, set the Required property to Yes.2. Click the prompt control to use as a cascading prompt.3. In the Properties pane, double-click the Cascade Source property.4. Click the parameter that represents the cascade source.5. If the prompt allows users to select multiple values, add a prompt button to the
cascade source to provide the cascading prompt with the appropriate values:
v From the Toolbox tab , drag Prompt Button to the report.v Click the prompt button and, in the Properties pane, set the Type property
to Reprompt.v To change the text in the prompt button, on the Toolbox tab, drag Text Item
to the prompt button and type the text.
Chapter 11. Adding Prompts to Filter Data 325

Control the Data That Appears in a Tree PromptYou can control what data appears in a tree prompt and how the data is structuredto get the results that you want. To do this, you add various functions to the filterexpression.
In addition, the operator that you chose in the Prompt Wizard dialog box controlswhat appears next to each prompt value. If the operator is in or not in, checkboxes appear next to each prompt value. If the operator is equals (=), no checkboxes appear.
Procedure
1. Pause the pointer over the query explorer button and click the query thatis associated with the prompt.
2. In the Data Items pane, double-click the data item on which you areprompting.
3. In the Expression Definition box, type one of the following functions.
Goal Function
Show the hierarchical structure of allmembers in the hierarchy. If this function isnot used, all members are shown in a flatlist.
rootmembers (data_item)
Show the descendants of the data item in ahierarchical structure where x represents thelevel. For example, if you are prompting onthe Year hierarchy and x=1, you will see2010, 2011, and 2012 in the tree. If x=2, youwill see 2010 Q1, 2010 Q2, and so on.
descendants (rootmembers (data_item), x)
Show the children of a member. Forexample, 2012 Q1, 2012 Q2, 2012 Q3, and2012 Q4 appear for the member 2012.
children (member)
Using in_range Filters with Character DataIf you use an in_range filter with character data, and the From value is greaterthan the To value, the filter returns no results. For example, if the From value is"Zone" and the To value is "Aloe Relief", the report returns no data.
To allow results within a range regardless of whether the From value is greaterthan the To value, your IBM Cognos administrator can enable a prompting setting.For more information, see the IBM Cognos Business Intelligence Administration andSecurity Guide.
Showing prompt values in generated SQL or MDXYou can show prompt values when viewing the generated SQL or MDX of a queryor report.
Procedure
1. Pause the pointer over the query explorer button and click the query forwhich you want to view the generated SQL or MDX.
326 IBM Cognos Report Studio Version 10.2.1: User Guide

2. In the Properties pane, set the Use SQL Parameters property to Literal.Related tasks:“View the SQL for an Entire Report or a Query” on page 246View the SQL to see what is passed to the database when you run a report.“View the SQL or MDX for an Entire Report or a Query” on page 295View the SQL or MDX to see what is passed to the database when you run areport.
Chapter 11. Adding Prompts to Filter Data 327

328 IBM Cognos Report Studio Version 10.2.1: User Guide

Chapter 12. Laying Out a Report
When creating a report, a good layout is essential to ensure that the information inthe report is presented in a clear and effective manner.
Report Layout RecommendationsConsider the following recommendations when creating the layout of a report.v Define the page structure.
Determine what goes into the page header, body, and footer. The page headercontains information that appears at the top of each page. The page bodycontains information that starts on the first instance of the page. If there is toomuch data to fit on a single page, it continues across all instances of the page.The page footer contains information that appears at the bottom of each page.
v Identify horizontal bands of information.Look for natural bands of information running across the page. Each of thesebands typically translates into a block.
v Identify vertical bands of information.In each horizontal band of information, look for bands that run up and downthe page. Each of these bands typically translates into table cells.
v Decide which data frames to use to lay out the data.Choose a list, crosstab, chart, repeater, or text frame.
v Set properties at the highest level item possible.By setting properties at the highest level, you set them once instead of settingthem for each child object. For example, if you want all text items in a report toappear in a specific font, set the font for the page.
Tip: When setting properties for an object, click the select ancestor button inthe Properties pane title bar to see the different levels available.
v Use padding and margins to create white space.Do not use fixed object sizing unless it is absolutely necessary. When you specifythat an object has a fixed size, your layout becomes less flexible.
The Page Structure ViewWhen you add objects to a report, you usually work in the layout. An alternativeview of the report is available.
From the View menu, click Page Structure to view the report in a different way.
© Copyright IBM Corp. 2005, 2013 329

Use the page structure viewv to view the entire contents of a report page in a tree structure
Using a tree structure is useful for locating the objects in a page andtroubleshooting problems with nested objects.
v to quickly move objects from one area of a page to anotherIf you have a complex layout, it may be difficult to select, cut, and paste objectsin the layout view. Objects are easier to locate in the page structure view.
v to modify object propertiesYou can modify object properties in the layout or in the page structure view.
Tip: To switch back to the report layout, from the View menu, click Page Design.Related concepts:“Work in design or structure view” on page 28IBM Cognos Report Studio has two views in which you can author reports: PageDesign view and Page Structure view. You can choose a report authoring view onthe View menu.
Copy Object FormattingYou can quickly copy the formatting of items in your report, such as fonts, colors,borders, and number formats, and apply that formatting to other items.
Procedure1. Click an item that has the formatting to copy.2. Do one of the following:
v To copy all the formatting applied to the item, click the pick up style button
, click the item to format, and then click the apply style button .v To copy only one of the formatting styles, click the down arrow to the right
of the pick up style button and click the style to copy. Then click the item toformat and click the apply style button.
3. If you want to make changes to a style that you copied, click the down arrowto the right of the pick up style button and click Edit Dropper Style.
4. In the Style dialog box, specify basic and advanced style characteristics.
Figure 47. Example of the page structure view
330 IBM Cognos Report Studio Version 10.2.1: User Guide

Add a Header or Footer to a Report or ListAdd a header or footer to make a report easier to read. Headers and footers arecontainers in which you can add objects like text, images, and report expressionssuch as the current date and page numbers. You can add headers and footers topages and lists.
Tip: The Revenue by Product Brand (2011) sample report in the Sales andMarketing (cube) package includes a customized header and footer. For moreinformation about The Sample Outdoors Company samples, see Appendix C,“Sample Reports and Packages,” on page 507.
Add a page header or footer when you want information to appear on every pagein the report, such as a title or page numbers. You can use combinations of text,data items, and report expressions in titles.
You can add the following headers and footers to lists to organize data into logicalsections or to identify every change in value of a column.
Type Description
List page header Adds a header that appears at the top of thelist on every page in which list data appears.
Overall header Adds a header that appears once at the topof the list.
Group or section header Adds a header that appears for each groupof a grouped column or each section.
Group or section footer Adds a footer that appears for each group ofa grouped column or each section.
Overall footer Adds a footer that appears once at thebottom of the list.
List page footer Adds a footer that appears at the bottom ofthe list on every page in which list dataappears. Note that summary calculations inlist page footers only summarize the datathat is visible on that page of the list report.
You can also add section footers by adding a summary.
Before you begin
To see the headers and footers, ensure that the visual aids are turned on.
Procedure1. If you want to add a page header or footer, from the Structure menu, click
Headers & Footers, Page Header & Footer, select the appropriate check boxes,and click OK.
Tip: You can also click the headers & footers button on the toolbar.2. If you want to add a list header or footer, from the Structure menu, click
Headers & Footers, List Headers & Footers, select the appropriate check boxes,and click OK.
Chapter 12. Laying Out a Report 331

Tip: You can also click the headers & footers button on the toolbar and then
click the list headers & footers button .3. If you want to add objects to a header or footer, drag the objects from the
Toolbox tab to the appropriate location.To add objects to a list header or footer, you must first unlock the report. Fromthe Structure menu, click Lock Page Objects.
Tip: To add data items to the page header or footer, you must associate aquery to the page.
4. To split a header or footer into multiple cells that span the list, from theStructure menu, click Headers & Footers and click Split List Row Cell.
5. To merge multiple cells in a header or footer, from the Structure menu, clickHeaders & Footers and click Merge List Row Cells.
6. To add rows to a header or footer, from the Structure menu, click Headers &Footers and click Insert List Row Cells Above or Insert List Row Cells Below.
Add Borders to an ObjectYou can add borders to objects in a report such as a column, a header, or a footeror to the whole report.
Tip: You can also add borders using the IBM Cognos Report Studio toolbar.
Procedure1. Click the object to which to add a border.
Tip: To quickly select the parent of an object, click the object, and then click theselect ancestor button in the title bar of the Properties pane.
2. In the Properties pane, double-click the Border property and select values inthe Color, Style, and Width boxes.
Note: Specifying a width using % as the unit of measure is not supportedwhen producing reports in PDF.
3. Apply the selected values to the top, bottom, left side, right side, or all sides ofthe object by clicking the appropriate button in the Preview section.
Tip: To clear the border applied, click the clear borders button .
Add a Text Item to a ReportYou can add text to a report. You can insert text in other objects, such as a block ortable cell, or directly in the report page.
You can also add multilingual text to a report.
You can now format the text by changing the font, color, size, and so on. Select thetext and make the appropriate changes in the Properties pane.
332 IBM Cognos Report Studio Version 10.2.1: User Guide

Procedure
1. From the Toolbox tab , drag the Text Item object to the report.The Text dialog box appears.
2. Type the text and click OK.
Tip: You can also paste text from another part of the report.
Specify the Font for a ReportYou can specify the font for text in a report.
Procedure1. Click the object.
Tip: To specify the default font for the report, click the page.2. Do one of the following:
v From the toolbar, specify the font properties.v In the Properties pane, double-click the Font property and specify the font
properties.To specify the color of the text, click Foreground Color. Alternatively, youcan specify the color of the text by clicking the Foreground Color propertyfor the object.
Tip: Type a list of fonts in the Family box if you are not sure whether aspecific font is installed on a user's computer. For example, if you type TimesNew Roman, Arial, monospace, IBM Cognos Report Studio checks to see ifTimes New Roman is installed. If it is not, Report Studio checks for Arial. IfArial is not installed, the monospace font used by the computer is used.
Results
If you clicked (Default) for any of the font properties, the default value for theproperty is used. Default values are stored in a style sheet that is used across allIBM Cognos Business Intelligence tools. You can modify default values bymodifying classes.
Insert an Image in a ReportYou can insert an image in a report. You can insert images in other objects, such asblocks or table cells, directly in the report page or as the background image ofanother object.
Before you begin
The images that you insert must first be uploaded to the IBM Cognos BusinessIntelligence server or another Web server and must be .gif or .jpg format.
Procedure
1. From the Toolbox tab , drag the Image object to the report and thendouble-click it.
2. In the Image URL dialog box, type the URL of the image to insert or clickBrowse to go to the location containing the image.
Chapter 12. Laying Out a Report 333

To browse images on a Web server, you must enable Web-based DistributedAuthoring and Versioning (WebDAV) on your Web server. For moreinformation about configuring Web servers, see the IBM Cognos BusinessIntelligence Installation and Configuration Guide.
Insert a Background Image in an ObjectYou can insert a background image for objects in a report. For example, use abackground image to add a watermark to a page.
You can also create your own background visual effects, such as drop shadows andgradient fills. For more information, see “Add Background Effects.”
Before you begin
The images that you insert must first be uploaded to the IBM Cognos BusinessIntelligence server or another Web server and must be .gif or .jpg format.
Procedure1. Select the object.2. In the Properties pane, under Color & Background, double-click the
Background Image property.3. To use the background from the default style for the object (Cascading Style
Sheet (CSS) class), click Default.4. To explicitly not insert a background image, click None.
This option overrides any default background images including backgroundgradients on objects that appear in the 10.x report styles.
5. To insert a specific image, click Specified and in the Image URL box, type theURL of the image to insert or click Browse to go to the location containing theimage.To browse images on a Web server, you must enable Web-based DistributedAuthoring and Versioning (WebDAV) on your Web server. For moreinformation about configuring Web servers, see the IBM Cognos BusinessIntelligence Installation and Configuration Guide.
6. In the Position box, choose how to align the image in the object.7. In the Tiling box, click a tiling option.Related tasks:“Change a Chart Background in a Legacy Chart” on page 115You can use a solid color, a pattern, or a gradient fill effect to customize the chartbackground.
Add Background EffectsYou can add background effects to enhance the appearance of your report. You canenhance objects, such as data containers (lists, crosstabs, and charts), headers,footers, page bodies, and so on with borders, gradient fill effects, drop shadows,and background images. You can also apply background effects as a class style.
The background effect is rendered within the rectangle area that bounds the object.To use a generated background in a chart, the chart must have a fixed size.
If the background image is complex and large, the size of the report output may beaffected proportionately.
334 IBM Cognos Report Studio Version 10.2.1: User Guide

Background effects are rendered only if the data container has a fixed height andwidth; if a percentage size is used, the effects are ignored.
Resizing or overflow behavior is ignored for generated images in HTML reports.
Add background effects to a chartBackground effects include borders, fills, drop shadows, and images.
Procedure1. Click the chart object.2. To choose a preset background effect, click the background effects presets
button on the style toolbar, and then click a background.3. In the Properties pane, under Color & Background, double-click the
Background Effects property.4. Select one or more of the following:
v To apply a border, click Border and specify settings for border style, width,color, corner radius for rounded rectangles, and transparency.If the element also includes a fill with a transparency setting, select theAllow transparent bleed check box to apply the same transparency to theborder.
v To apply a fill effect, click Fill and specify the settings. The fill effect caneither be a solid color, a gradient, or a pattern. You can define a gradient filleffect as a linear, radial line, or radial rectangle gradient.
v To apply a drop shadow effect, click Drop Shadow and specify the shadowcolor, transparency value, color, and offset settings. The default horizontaland vertical offset is 5 pixels.
v To specify one or more images as a background, click Images. You canspecify the transparency value and the position for each defined image. Youcan also specify a custom position for each image.
Tip: To remove the effect, clear its check box.
Add a background gradient to a pageA background gradient is a shading that goes from one color to another eitherhorizontally or vertically across your page.
Procedure1. Click anywhere in the report page.
2. In the Properties pane title bar, click the select ancestor button and clickPage.
3. Under Color & Background, double-click the Gradient property.4. Select the Gradient check box and then select the colors and direction for the
gradient.Background gradients and drop shadows do not appear in Microsoft Excelspreadsheet software output. They are also supported only for report outputsrun in the Microsoft Internet Explorer Web browser.Tip: To remove the effect, clear the Gradient check box.
Chapter 12. Laying Out a Report 335

Add a drop shadow to a containerA drop shadow is a border on the bottom and right of an object. You can specifythe color and transparency of this shadow.
Procedure1. Click the crosstab, list, repeater table, or table in the report.
2. In the Properties pane title bar, click the select ancestor button and clickCrosstab, List, Repeater Table, or Table.
Tip: You can also click the container selector (three orange dots) of thecontainer to select it.
3. Under Color & Background, double-click the Drop Shadow property.4. Select the Drop shadow check box and then select the color, offset, and
transparency values.Background gradients and drop shadows do not appear in Excel output. Theyare also supported only for report outputs run in the Internet Explorer Webbrowsers.If you add a drop shadow, ensure that you also specify a background color forthe object. Otherwise, if you keep the default transparent background, datavalues also have a drop shadow and are difficult to read.Tip: To remove the effect, clear the Drop shadow check box.
Insert a Formatting Object in a Report
In addition to text and images, the Toolbox tab contains other objects thatyou can add to the report layout.
Object Description
BlockAdds an empty block, which is a container in which youcan insert other objects. This is useful for controllingwhere objects appear.Tip: You can use blocks to add space between objects.However, empty blocks are not rendered. You must insertan object or specify the height and width.Tip: The Revenue by GO Subsidiary 2011 sample report inthe GO Data Warehouse (analysis) package includes anempty block. For more information about The SampleOutdoors Company samples, see Appendix C, “SampleReports and Packages,” on page 507.
Table Adds a table, which is a container in which you can insertother objects. This is useful for controlling where objectsappear.
Field SetAdds an empty block that has a caption. This is similar tothe Block object, but with a caption.
Intersection (Tuple) Adds an intersection (tuple). For more information, see“Create an Intersection (Tuple)” on page 306.
Query Calculation Adds a calculated column. For more information, see“Using Relational Calculations” on page 248 or “UsingDimensional Calculations” on page 302.
336 IBM Cognos Report Studio Version 10.2.1: User Guide

Object Description
Crosstab Space Inserts an empty cell on a crosstab edge. Allows for theinsertion of non-data cells on an edge. Blank cells appearfor the edge when the report is run.
Insert this object when a crosstab edge does not produceuseful data and you want blanks to appear in the cellsinstead.
Crosstab Space (with factcells)
Inserts an empty cell on a crosstab edge. Allows for theinsertion of non-data cells on an edge. The contents of thefact cells for the edge are rendered when a measure isadded or the default measure is specified.
v If the crosstab space is nested, the scope of the fact cellsis the scope of the item that is at the level before thespace.
v If the crosstab space is not nested and there are noitems nested below it, the scope of the fact cells is thedefault measure.
Singleton Inserts a single data item.
Conditional BlocksAdds an empty block that you can use for conditionalformatting.
HTML ItemAdds a container in which you can insert HTML code.HTML items can be anything that your browser willexecute, including links, images, multimedia, tooltips, orJavaScript.
HTML items appear only when you run the report inHTML format.Note: You cannot include <form> tags in HTML items.Tip: The Table of Contents sample report in the GO Sales(analysis) package includes an HTML item. For moreinformation about The Sample Outdoors Companysamples, see Appendix C, “Sample Reports and Packages,”on page 507.Note: When you upgrade to the next version of IBMCognos Business Intelligence, the report upgrade processesdo not account for the use of undocumented andunsupported mechanisms or features, such as JavaScript,that refers to IBM Cognos HTML objects.
Rich Text ItemInserts an object that is used to render HTML in thelayout. This object is similar to the HTML Item, exceptthat rich text items also render in PDF output. Using richtext items is useful when you want to add annotationsdefined in a data source to a report.Note: Rich text items support only a restricted set ofwell-formed XHTML.
HyperlinkAdds a hyperlink so that users can jump to another place,such as a Web site.
Hyperlink Button Adds a hyperlink in the form of a button.
As of Time Expression Adds an As of Time expression so that you can show datafor a specific time period.
Page Number Inserts page numbers that you can customize.
Chapter 12. Laying Out a Report 337

Object Description
Row NumberNumbers each row of data returned when the report isrun.Note: You can add row numbers only to lists andrepeaters.
Layout Component ReferenceAdds a reference to another object. Useful when you wantto reuse an object.
Table of Contents Creates a table of contents that is rendered in the outputof a report.
Table of Contents Entry Adds a table of contents marker.
Bookmark Inserts a bookmark so that users can move from one partof a report to another.
For information about each prompt control and prompt buttons, see Chapter 11,“Adding Prompts to Filter Data,” on page 313. The Toolbox tab contains otherobjects when you work in other areas such as Query Explorer and ConditionExplorer.
Before you begin
Before you can add a hyperlink, HTML item, or hyperlink button, you must havethe HTML Items in Report capability. For more information, see the IBM CognosBusiness Intelligence Administration and Security Guide.
Procedure
To add an object, drag or double-click it from the Toolbox tab .
Elements Supported in Rich Text ItemsRich text items support all XHTML character entities, such as (non-breaking space), and the following elements: div, span, ul, ol, and li.
Each element only supports the style attribute, which must contain a valid CSSstyle. In addition, ul and ol elements support list-style attributes. Specifically, the olelement supports decimal, and the ul element supports circle, disc, and square, aswell as list-style-image.
For example, the following code produces an unordered list entitled List: withthree items. Each list item is in a different color, and the list-style attribute used iscircle.<div style="font-size:14pt; text-decoration:underline">List:</div><ul style="list-style-type:circle"><li style="color:green">Item <span style="font-weight:bold">A</span></li><li style="color:red">Item B</li><li style="color:blue">Item C</li></ul>
Example - Add a Multimedia File to a ReportYou are a report author at The Sample Outdoors Company, which sells sportingequipment. You want to insert a Microsoft Windows Media Audio/Video filenamed GO.wmv in a template that serves as a cover page for all reports.
338 IBM Cognos Report Studio Version 10.2.1: User Guide
You must have Windows Media Player installed on your computer.
Procedure1. Open IBM Cognos Report Studio with the GO Data Warehouse (query)
package.2. In the Welcome dialog box, click Create a new report or template and in the
New dialog box, click Blank.
3. From the Toolbox tab , drag the HTML Item object to the report.4. Select the HTML Item.5. In the Properties pane, double-click the HTML property.6. In the HTML dialog box, type the following:
<OBJECT classid="CLSID:6BF52A52-394A-11D3-B153-00C04F79FAA6"><PARAM NAME="URL" VALUE="/c10/webcontent/samples/images/GO.wmv"/> </OBJECT>
Results
When you run the report in HTML format, the multimedia file plays in WindowsMedia Player.
Align an Object in a ReportYou can specify a horizontal and vertical alignment for an object in a report todetermine where they appear.
Tables can also be used to determine where objects appear in a report.
Note: The Justify horizontal alignment works with HTML output but does notapply to PDF output.
Procedure1. Select the object to align.2. From the toolbar, click one of the available horizontal or vertical alignment
buttons.
Using a table to control where objects appearYou can use tables in your report to control where objects appear. Tables can beinserted anywhere in a report, such as a header, a footer, or the page body. Afteryou create a table, insert the objects you want in the cells.
You can also apply a predefined table style to tables. Other table properties aredescribed in Appendix G, “Report Studio Object and Property Reference,” on page771.
The alignment buttons can also be used to determine where objects appear in areport.
Tip: The Singletons on Page Body sample report in the GO Sales (analysis)package includes a table to control the report layout. For more information aboutThe Sample Outdoors Company samples, see Appendix C, “Sample Reports andPackages,” on page 507.
Chapter 12. Laying Out a Report 339

Procedure
1. From the Toolbox tab , drag Table to the report.The Insert Table dialog box appears.
2. In the Number of columns and Number of rows boxes, type the number ofcolumns and rows for the table.
3. If you want to have the table span the width of the report page, select theMaximize width check box.
4. If you want to add borders to the table, select the Show borders check box.5. If you want to merge cells in the table, select the cells and click the merge cells
button.6. Select the table object.7. In the Properties pane, under Positioning, double-click the Table Properties
property.8. To display both the inside and outside borders, do the following:
v Clear the Collapse borders check box.v Type a number in the Cell spacing text box to define how much space to
add between the table cells.v Select the Show empty cell borders check box to display the borders even
for empty cells.9. To fix the size of the columns in the table, check the Fixed size check box.
When this check box is cleared, the table columns expand to fit the text.
Apply a Table StyleApply a table style to quickly format tables. You can also apply a table style tolists, crosstabs, and repeater tables.
About this task
By default, when a new object is inserted in a list or crosstab, the object inheritsthe style from an object of the same type in the data container. For example, if youinsert a measure in a list, the measure inherits the style of a measure that isalready in the list, if there is one. If you do not want objects to inherit styles, clearthe Table Style inheritance option in the Tools menu (Tools, Options, Report tab).
The following rules explain how style inheritance is applied to lists and crosstabs.v Styles are inherited in the following order: custom, client default, and server
default.A custom style is a style that you manually apply. A client default style is one ofthe styles available in the Apply Table Style dialog box. The server default styleis the style applied when Default is selected in the Apply Table Style window.
v When a new column or row is inserted, it inherits the style from the sibling ofthe same type that is on its right or below.
v If there is no sibling of the same type, then the nearest sibling that is on its leftor above is applied.
v If there is no sibling of the same type in the container, then the client or serverdefault table style is applied.
v If a custom style is applied to a column or row and the object is then moved toanother location, the object retains the custom style.
340 IBM Cognos Report Studio Version 10.2.1: User Guide

Custom styles applied to part of an object, such as the header, body, or footer,may be lost. For example, if a container has a footer, the footer is recreated whena column is moved. The recreated footer is rendered using the style that wasapplied to the footer before you customized its style.
v Deleting a column or row has no impact on the styles of the other objects in thecontainer.
v Styles are preserved if a column is grouped or ungrouped. The same applieswhen creating or removing sections.
v When drilling up or down, the style of the parent item is applied.
Procedure1. Click the table, list, crosstab, or repeater table.2. From the Table menu, click Apply Table Style.3. In the Table styles box, click a table style.
Tip: Some styles are unique to tables, lists, or crosstabs.4. If you are applying a table style to a table or list, in the Apply special styles to
section, select or clear the various column and row check boxes based on howyou want to treat the first and last columns and rows.Some check boxes may not be available for particular table styles, or toparticular columns or rows.
5. If you are applying a table style to a list or crosstab and you want the style tobe applied to all lists or crosstabs in the report, select the Set this style as thedefault for this object type check box.For a list, you may need to clear the First column and Last column checkboxes in the Apply special styles to section before you can select this checkbox. In addition, some table styles cannot be set as the default.
Apply Padding to an ObjectApply padding to an object to add white space between the object and its marginor, if there is a border, between the object and its border.
Tip: You can quickly apply left or right padding by either pressing Tab and
Shift+Tab or by clicking the increase indent and the decrease indent buttonsin the toolbar. When using the toolbar buttons, you can indent an object by up tonine times the indentation length. You can specify the indentation length to use byclicking the arrow beside either button and clicking Set Default Indent Length.
Tip: The GO Balance Sheet as at Dec 31 2012 sample report in the GO DataWarehouse (analysis) package includes padding. For more information about TheSample Outdoors Company samples, see Appendix C, “Sample Reports andPackages,” on page 507.
Procedure1. Select the object to which to apply padding.2. In the Properties pane, double-click the Padding property.3. Specify top, bottom, left, and right padding by typing values in the
corresponding boxes and choosing the unit of measure.
Note: Specifying padding using % as the unit of measure is not supportedwhen producing reports in PDF.
Chapter 12. Laying Out a Report 341

Set Margins for an ObjectSet the margins for objects in a report to add white space around them.
For Date, Time, Row Number, and Page Number objects, you can only set the leftand right margins. If you want to set the top or bottom margins for these objects,place them in a table or a block. Then set the margin or padding properties on thetable or block object.
Procedure1. Select the object.2. In the Properties pane, double-click the Margin property.3. Specify the top, bottom, left, and right margins by typing values in the
corresponding boxes and choosing the unit of measure.
Note: Specifying margins using % as the unit of measure is not supportedwhen producing reports in PDF.
Add Multiple Items to a Single ColumnYou can add multiple items to a single column to condense a report. For example,you have a list report that contains many columns. You can reduce the number ofcolumns in the list by putting related information in a single column.
Procedure1. From the Structure menu, click Lock Page Objects to unlock the report.2. From the content pane, drag the items to the column.
For example, you can add data items from the Source tab or text items
from the Toolbox tab .
Example - Create a Report with Multiple Items in One ColumnYou are a report author at The Sample Outdoors Company, which sells sportingequipment. You are requested to create a list report showing the name, position,email address, phone number, extension, and fax number for each salesrepresentative in each city organized by country or region. To reduce the numberof columns in the list, you show email addresses, phone numbers, extensions, andfax numbers in a single column.
Procedure1. Open IBM Cognos Report Studio with the GO Data Warehouse (query)
package.2. In the Welcome dialog box, click Create a new report or template.3. In the New dialog box, click List and click OK.
4. From the Source tab , expand HR (query), Employee summary (query),and Employee by region. Add the following data items to the list bydouble-clicking them:v Country or Region
v City
v Employee name
342 IBM Cognos Report Studio Version 10.2.1: User Guide

v Position name
v Email
v Work phone
v Extension
v Fax
5. Click the Country or Region column and, from the Structure menu, click
Section .6. From the Structure menu, ensure that the report is unlocked7. Click Country or Region and, in the Properties pane, double-click the Font
property.8. Change the font to Arial Black, 11 pt, and Bold, and then click OK.
9. From the Toolbox tab , drag Table to the right of the Work phone textitem in the first row of Work phone column and create a table that has onecolumn and three rows.
10. Drag the following data items to the table:v Email to the first rowv Work phone to the second rowv Fax to the third row
11. Drag Extension to the right of Work phone in the table.12. From the Toolbox tab, drag Text Item to the left of each item in the table and
type the following for each item, putting a blank space before and after thetext:v Email:
v Work phone:
v ext:
v Fax:
13. Ctrl+click the Extension, Email, and Fax column titles and click the delete
button .14. Click the Work phone column title.15. In the Properties pane, click the Source Type property and click Text.16. Double-click the Text property.17. Type the following and click OK:
Contact Information
18. Select the Work phone data item in the first row of the list above the tableand click the delete button.
19. Double-click the text item in the page header, type the following, and clickOK:Sales Representatives Contact List
20. From the Structure menu, click Lock Page Objects.The report is locked.
21. Run the report.
Results
Contact information for each sales representative appears in a single column.
Chapter 12. Laying Out a Report 343

Reuse a Layout ObjectYou can save time by reusing layout objects that you add to a report instead ofre-creating them. For example, you have a multiple-page report and you want toshow the company logo in the page header of each page. Insert the logo once andreuse it on all other pages.
Procedure1. Click the object to reuse.
Tip: To quickly select the parent of an object, click the object, and then click theselect ancestor button in the title bar of the Properties pane.
2. In the Properties pane, set the Name property to a value beginning with aletter to uniquely identify the object and press the Enter key.IBM Cognos Report Studio may have already specified a name for the object.
3. To reuse the object in another report, open that report.
4. From the Toolbox tab , drag the Layout Component Reference object tothe location in which it will be reused.
Figure 48. List showing the city, employee name, position, and contact information forAustralia
344 IBM Cognos Report Studio Version 10.2.1: User Guide
5. In the Component Location box, do one of the following:v To reference an object in the current report, click This report.v To reference an object in another report, click Another report, click the
ellipsis (...) button, and open the report.
Note: In active reports, you cannot reference objects from another activereport.
6. In the Available components to reference box, click the object and click OK.7. If the referenced object is in another report, click the Layout Component
Reference object and in the Properties pane, set the Embed property to specifyhow to store the referenced object in the report:v Click Copy to store a copy of the object.
The copy is not automatically updated if the source object is modified.
Note: In active reports, you can store referenced objects only by copyingthem to the report.
v Click Reference to store a reference, or pointer, of the object.The reference of the object is automatically updated if the source object ismodified. For example, if you open or run the report, you see the modifiedobject.
Results
A copy or reference of the object appears where you placed the LayoutComponent Reference object. If a source object is changed, you can update reusedobjects.
Tip: You can also create a new report or template and add all the objects to share.All your shared objects then reside in a single location, like a library.
Change a Reused ObjectIf you reuse an object that contains other objects, you can change the child objectsto something different. For example, you have a block object containing a text itemin the page header and you decide to reuse the block in the page footer. However,you want the text item in the page footer block to show different text from that inthe page header.
About this task
If you reuse a visualization, you cannot change the data container of thevisualization.
Procedure1. In the parent object to reuse, click the child object to change.2. In the Properties pane, set the Name property to a value beginning with a
letter to uniquely identify the object.IBM Cognos Report Studio may have already specified a name for the object.
3. Select the copy of the parent object you created with the Layout ComponentReference object.
4. In the Properties pane, double-click the Overrides property.5. In the Overrides dialog box, select the child object to change and click OK.
Chapter 12. Laying Out a Report 345

The child object in the copy of the parent object is replaced by the followingtext:Drop item to override component child.
6. Drag an object to replace the child object.You can replace the child object with any other object, not just an object of thesame type. For example, if the child object is a text item, you can replace itwith an image.
Update Reused ObjectsIf a report contains objects referenced in another report, you can quickly updatethe referenced objects if the source objects have changed. Shared objects are storedin the layout component cache.
Procedure1. Open the report to update.2. From the Tools menu, click Layout Component Cache.
The Layout Component Cache dialog box appears, showing all reports thatcontain referenced objects and the source reports where the objects exist.
3. To view which components are reused, click a source report.The components that are reused appear in the Components used pane.
4. Click Reload Components to refresh all referenced objects.Although referenced objects are automatically refreshed when you open or runa report, clicking this button updates components that were changed while thereport is open.
5. Click Update All Component Copies to refresh all copied objects.6. Click Close.
Specify text and container directionYou can specify text and container direction by choosing any of these options.
Option Description
Direction Sets the reading order of an object, such as right-to-left. IfInherit is selected, the direction is inherited from theparent object. The default is left-to-right.
For text objects, an additional choice named Contextualexists. This choice sets the text direction based on the firstletter in the text. If the letter belongs to a right-to-leftscript, the text direction is right-to-left. Otherwise, the textdirection is left-to-right. Numbers and special characters donot influence the text direction. For example, if the textstarts with a number followed by an Arabic letter, thedirection is right-to-left. If the text starts with a numberfollowed by a Latin letter, the direction is left-to-right.Tip: You can also set the direction of text objects by
clicking the Text direction icon in the toolbar. Thisicon is visible only when the IBM Cognos Connection userpreference Enable bidirectional support is selected.
Writing mode Sets the direction and flow of content in an object.
346 IBM Cognos Report Studio Version 10.2.1: User Guide

Option Description
Bidirectional Sets the level of embedding in an object.
For text objects, if the Direction option is set to a valueother than (Default) and no value is selected for thisoption, this option is set to Embed. Setting this option toEmbed ensures that the base text direction specified for thetext is applied.
Justification Sets the type of alignment used to justify text in an object.
Kashida space Sets the ratio of kashida expansion to white spaceexpansion when justifying lines of text in the object. Thisproperty is used in languages that use the Arabic writingscript.
About this task
Specifying text direction and container direction depends on the object selected inthe report. The following list describes the types of objects in Report Studio thatyou can specify text or container direction.v Compound objects
Compound objects are container objects that contain text. Examples includecharts, maps, active reports, and prompts. You cannot set text direction forspecific text objects in a compound object.To specify container direction for compound objects, click the Direction &Justification property for the object. To specify text direction for text incompound objects, click the Contained Text Direction property for the object.
v Container objectsYou can specify only container direction for container objects, such as a reportpage. Click the Direction & Justification property for the object to specifycontainer direction.By default, the text direction of text in a container object is inherited from thecontainer.
v Text objectsFor all text objects, the Direction & Justification property specifies the textdirection.
In charts, container direction impacts all aspects of a chart. The following listdescribes the parts of a chart that are affected by container direction.v The chart itself.v The location of the Y-axis and the horizontal run direction of the X-axis.v The labeling, including the orientation of angled labels on axes.v The location of the legend as well as the legend content.
Container direction has no impact on rotary axes. For example, the slices in a piealways progress in the same direction around the pie. However, container directiondoes affect labelling as well as position and direction of the legend.
Note: You cannot specify base text direction and container direction for legacycharts.
Chapter 12. Laying Out a Report 347

Procedure1. Click an object.
Tip: To specify the base text direction of a text object that is inside another
object, such as a list column, you must first unlock the report.2. In the Properties pane, click one of the following properties:
v Direction & Justification
v Contained Text Direction
This property applies only to compound objects.3. Specify the text direction and container direction options that you want.Related concepts:“Support for bidirectional languages” on page 56You can author reports that support bidirectional languages. You can specify basetext direction, digit shaping, and container direction.
Specify Line Spacing and BreakingYou can specify text properties by choosing any of these options.
Option Description
Line Height Sets the distance between lines of text in anobject.
Letter Spacing Sets the amount of additional space betweenletters in an object.
Text Indent Sets the indentation of the first line of text inan object.
Note: This property works with HTMLoutput but does not apply to PDF output.
Word Break Sets line-breaking behavior within words.
Break words when necessary Sets whether to break words when thecontent exceeds the boundaries of an object.
Enforce stricter line-breaking rules forJapanese Text
Sets line-breaking rules for Japanese text.
Procedure1. Click an object.2. In the Properties pane, double-click the Spacing & Breaking property.3. Specify the text properties.
Specify the Height and Width of an ObjectYou can specify the height and width of objects using various units ofmeasurement. In addition, if the object is a field set, text box prompt, promptbutton, hyperlink button, block, or a conditional block, you can specify how tohandle content overflow. Specify the height and width by choosing any of theseoptions.
Option Description
Height Sets the height of the object.
348 IBM Cognos Report Studio Version 10.2.1: User Guide

Option Description
Width Sets the width of the object.
Content is not clipped If the contents of the block exceed the heightor width of the block, the blockautomatically resizes to fit the contents.
Content is clipped If the contents of the block exceed the heightor width of the block, the content is clipped.Note: The clipped content still exists. It isjust not visible in the block.
Use scrollbars only when necessary If the contents of the block exceed the heightor width of the block, scrollbars are addedto the block.
Always use scrollbars Scrollbars are added to the block.
Do not use percentages to resize charts and maps that contain interactive elementsthat are activated when you pause the pointer over them, such as tooltips ordrill-through links, because the browser is unable to realign the hard-coded hotspots after an image is resized.
When you use a percentage to specify the size of an object, the percentage isrelative to the object's parent. In some cases, setting the size of an object usingpercentages will not give you the results that you want unless you also specify thesize of the parent container.
Procedure1. Click an object.2. In the Properties pane, double-click the Size & Overflow property and specify
the height and width.
Control How Other Objects Flow Around an ObjectYou can control how objects flow around other objects by choosing any of thefollowing options.
Option Description
Float Sets how other objects flow around theobject.
Allow floating objects on both sides Allows other objects to flow on both sides.The Float property must be set.
Move below any floating object on the leftside
If there are other objects to the left of theobject, the object moves below those objects.The Float property must be set.
Move below any floating object on theright side
If there are other objects to the right of theobject, the object moves under those objects.The Float property must be set.
Move below any floating object Moves the object under any other object inwhich the Float property was set.
Procedure1. Click an object.2. In the Properties pane, double-click the Floating property.
Chapter 12. Laying Out a Report 349

3. Specify how other objects flow around the object by specifying the floatingoptions.
Specify Report PropertiesYou can change the default report property settings.
Procedure1. From the File menu, click Report Properties.2. To specify the classes that IBM Cognos Report Studio uses to format objects,
click Report styles and choose one of the available options.For more information, see “Create and Modify Report and Object Styles.”
3. For reports with multiple data containers, to render the default number of rowsof each data container on each HTML page, you must set the Page break bydata container for interactive HTML option to Yes. The default value is No.For more information, see “Controlling the Rows Per Page for MultipleContainers in HTML and PDF” on page 48.
4. To automatically create extended data items every time a data item is inserted,select the Always create extended data items check box.IBM Cognos Report Studio creates extended data items by default. For moreinformation about extended data items, see “Extended Data Items” on page263.
5. To create a single, scrollable HTML page when you run and save this report asHTML from IBM Cognos Connection, clear the Paginate saved HTML outputcheck box.The default is to paginate HTML reports with the same page breaks as PDFreports. The single, scrollable HTML page will be available from IBM Cognos
Connection when you click the view report output versions action .6. When producing reports in Excel 2007 format, if you do not want to group
repeating cells in lists and crosstabs, clear the Group repeating cells whenexporting to Excel check box.When this check box is selected, grouped cells in crosstab rows and columnsand grouped columns in lists are merged into a cell area in the Excel output.When the check box is cleared, merged cells are split. For more information, see“Option to group repeating cells in reports produced in Excel 2007 format” onpage 50.
7. If you are working with reports created in IBM Cognos ReportNet and youwant to create CSV report output, click Use 1.x CSV export.This option ensures that all the query columns are exported. In IBM CognosReportNet, if a data item was referenced using the Properties property of a list,it was included in the CSV output. In IBM Cognos Business Intelligence, thedefault is to export only the columns in the list.
Create and Modify Report and Object StylesCreate your own classes or modify existing classes in a report to format objectsacross a report according to your particular needs. In IBM Cognos Report Studio,objects in reports are assigned a Cascading Style Sheet (CSS) class that provides adefault style for the object. For example, when you create a new report, the reporttitle has the class property Report title text assigned to it. In addition, objectsinherit the classes set on their parent objects.
350 IBM Cognos Report Studio Version 10.2.1: User Guide

You can use classes to highlight data using conditional styles.
Classes you create or modify can be applied only to the current report. To create ormodify classes for all reports, you must modify a layout style sheet. In addition,some classes can be used to format Query Studio reports.
If you use the Microsoft Internet Explorer Web browser, version 6, some colorgradients used in the 10.x default report styles are not supported.
Modify the report styleYou can define whether your report uses the default styles for this version or thestyles from a previous version.
Procedure1. From the File menu, click Report Properties.2. Click Report styles and select one of the following options:
v To work with classes in the default style sheet, click 10.x styles.v To work with classes that were used in IBM Cognos 8, click 8.x styles.
Use 8.x report styles when you are working with reports created in IBMCognos 8 and you want to preserve their original appearance.
v To work with classes that were used in IBM Cognos ReportNet, click 1.xstyles.Use 1.x report styles when you are working with reports created inReportNet and you want to preserve their original appearance.
v To work with classes that have minimal styling defined, click Simplifiedstyles.This option is useful when creating financial reports.
Modify object stylesYou can change global classes to modify the style of all objects in a report or youcan modify local classes and apply them to specific objects.
Procedure
1. Pause the pointer over the page explorer button and click Classes.
2. To create a new class, from the Toolbox tab , drag Class to the LocalClasses pane.
3. To modify an existing class, in the Local Classes or Global Class Extensionspane, click the class.Modify a global class to apply a change to all objects that use that class. Forexample, if you modified the style List column title cell, all column titles inlists will reflect your modifications.
Tip: Ctrl+click classes to make the same change to more than one class.4. In the Properties pane, modify the properties to specify your desired
formatting.
Tip: Look at the Preview pane to preview your changes for different reportobjects, such as blocks, table cells, and text items.If you modify a global class, a pencil symbol appears beside the global classicon to indicate that the class was modified.
Chapter 12. Laying Out a Report 351

5. Apply the class to objects:v Pause the pointer over the page explorer button and click a report page.v Click an object to which to apply a class.v In the Properties pane, double-click the Class property.v Click the classes to apply from the Local classes and Global classes panes
and click the right arrow button .v If you applied more than one class, in the Selected classes pane, specify the
order in which the classes are applied using the up and down arrow buttons.Classes in the Selected classes pane are applied from top to bottom. Thestyle properties from all classes are merged together when they are applied.However, if the classes have style properties in common, the properties fromthe last class applied override those from previous classes.
(Don't Print) ClassThe (Don't Print) class allows HTML items to display in the Web browser but notto print.
The (Don't Print) class behaves as follows in the various report output formats:v HTML
The Web browser defines the behavior. The HTML standard is that the itemappears on the screen in the Web browser but is excluded by the print operationof the Web browser.
v PDFThe item is excluded from the output.
v Microsoft Excel 2002 spreadsheet softwareThe class is specified in the HTML that IBM Cognos uses to render MicrosoftExcel 2002 output. However, Microsoft Excel 2002 does not appear to honor itand displays the item as missing some or all other style definitions.
v Microsoft Excel 2007 spreadsheet softwareThe item is excluded from the output.
v CSVThe item is included in the output.
v XMLThe item is included in the output.
An alternative way to consistently exclude a report object from HTML, PDF andMicrosoft Excel output is to set the Box Type property for the object to None. CSVand XML report outputs will still contain the object.
Modify Classes to Format Query Studio ReportsSome global classes are specific to IBM Cognos Query Studio or can be applied toQuery Studio reports. You can modify the following classes to format Query Studioreports.
To format a Query Studio report using the modified classes, the template must beapplied to the report. For more information about applying a template to a QueryStudio report, see the Query Studio User Guide.
352 IBM Cognos Report Studio Version 10.2.1: User Guide

Class Description
List column body cell Style used to format list data.
List column title cell Style used to format list column titles.
To modify classes, you must1. Create a Query Studio template.2. Modify the global classes.3. Save the template.
Modifying the Default Layout Style SheetIn addition to creating or modifying classes in a report, you can create and modifyclasses that will apply to all reports. Default styles are stored in a style sheetnamed GlobalReportStyles.css.
For information about modifying the style sheet, see the IBM Cognos BusinessIntelligence Administration and Security Guide.
Add Color to an ObjectYou can add background and foreground color to objects in the report. Theforeground color applies to the text within objects.
Tip: The TOC Report sample report in the GO Data Warehouse (query) packageincludes objects with color. For more information about The Sample OutdoorsCompany samples, see Appendix C, “Sample Reports and Packages,” on page 507.
Procedure1. Select the object.
Tip: To quickly select the parent of an object, click the object, and then click theselect ancestor button in the title bar of the Properties pane.
2. Do one of the following:
v Click the background color button or the foreground color button .v In the Properties pane, double-click the Background Color or Foreground
Color property.3. To apply an existing color, click the Named Colors tab or Web Safe Colors tab
and choose one of the available colors.Use a named color to select a color from a small set of colors. Use Web safecolors to select from 216 available colors.
4. To apply a custom color, click the Custom Color tab and type values in theRed, Green, and Blue boxes.The values must be hexadecimal.
Related tasks:“Add Background Effects to a Chart Object in a Legacy Chart” on page 116You can change the look of certain charts and chart objects by applying visualeffects such as drop shadows, borders, fills, texture effects, and bevel effects.
Chapter 12. Laying Out a Report 353

354 IBM Cognos Report Studio Version 10.2.1: User Guide

Chapter 13. Working With Your External Data
You can supplement your enterprise data with your own external or personal datafile.
This allows you to create a report using an external file that contains data which isnot part of your IBM Cognos Business Intelligence enterprise data. For example,you are an analyst and you receive a spreadsheet that contains what-if data aboutopening new branches of your retail store. You are asked to analyze the impact ofthese possible new branches on existing sales volumes. You link this scenario datawith your enterprise data and create a professional report using IBM Cognos BI.
You import your own data file and start reporting on it right away. Afterimporting, your external data file is protected by the same IBM Cognos security asyour enterprise data, thus allowing you to report on your data in a secure andprivate environment.
You can use the following types of files:v Microsoft Excel (.xls) spreadsheet software files
IBM Cognos BI supports external data sources from Microsoft Excel up toversion Microsoft Excel 2007.To review an up-to-date list of the environments that are supported by IBMCognos products, including information about operating systems, patches,browsers, web servers, directory servers, database servers, and applicationservers, see Supported Software Environments (http://www.ibm.com/support/docview.wss?uid=swg27037784).
v tab-delimited text (.txt) filesv comma-separated (.csv) filesv XML (*.xml) files
Your XML files must adhere to the IBM Cognos schema specified atc10_location/bin/xmldata.xsd. For more information, contact your IBM Cognosadministrator.This schema consists of a dataset element, which contains a metadata elementand a data element. The metadata element contains the data item information initem elements. The data element contains all the row and value elements.For example, the following simple XML code produces a table with two columns(Product Number and Color) and two rows of data.<?xml version="1.0" ?> <dataset xmlns="http://developer.cognos.com/schemas/xmldata/1/" xmlns:xs="http://www.w3.org/2001/XMLSchema-instance"><metadata> <item name="Product Number" type="xs:string" length="6"scale="0" precision="2" /> <item name="Color" type="xs:string"length="18" scale="0" precision="8" /> </metadata> <data> <row><value>1</value> <value>Red</value> </row> <row> <value>2</value><value>Blue</value> </row> </data> </dataset>
To work with your external data, you start with an existing IBM Cognos package.You import data from your external file into the package and create links betweendata items in your file and data items in your enterprise data source. You thenpublish a new package that allows you to create reports that use your data and
© Copyright IBM Corp. 2005, 2013 355
your enterprise data, or reports that use only your data. You can link your externaldata with both dimensional and relational data sources.
Before you can import your own external data file, your IBM Cognos administratormust grant you permission for the Allow External Data capability found withinthe Report Studio capability, and you must have permission to use IBM CognosReport Studio or IBM Cognos Workspace Advanced. For more information, see theIBM Cognos Business Intelligence Administration and Security Guide.
External Data Packages
When you import external data into a package, you do not overwrite the originalpackage. You create a new package that includes the original package, the newexternal data, and any links or relationships that you defined between the two. Bydefault, the new package is saved in the My Folders area of IBM CognosConnection, with External Data appended to the original package name. You canchange where your package is published.
Note: The current content language is used to create the new package, and userscannot select the language for the package. For example, the content language inCognos Connection is set to English. External data is imported into the GO Sales(query) package, and a new package called GO Sales (query) External Data iscreated. If the content language is changed to a different language, the packagename is not translated, even though GO Sales (query) is a multilingual package.
IBM Cognos Samples
Sample external data sources in Microsoft Excel (.xls) format are provided withIBM Cognos BI. You can import these sample files into the Sample OutdoorsCompany sample reports found within the Cognos Workspace Advanced folder ofthe GO Data Warehouse (analysis) or GO Data Warehouse (query) package.
You can find the following external data source files on the server where IBMCognos BI is installed in the c10_location/webcontent/samples/datasources/otherdirectory.v accounts.xlsv employee.xlsv organization.xlsv product_brand.xlsv product_color.xlsv product_line.xlsv product_name.xlsv product_size.xlsv product_type.xlsv products.xlsv promo_sets.xlsv promotions.xlsv region.xlsv retailers_site.xlsv time.xls
To obtain these files, contact your IBM Cognos administrator.
356 IBM Cognos Report Studio Version 10.2.1: User Guide
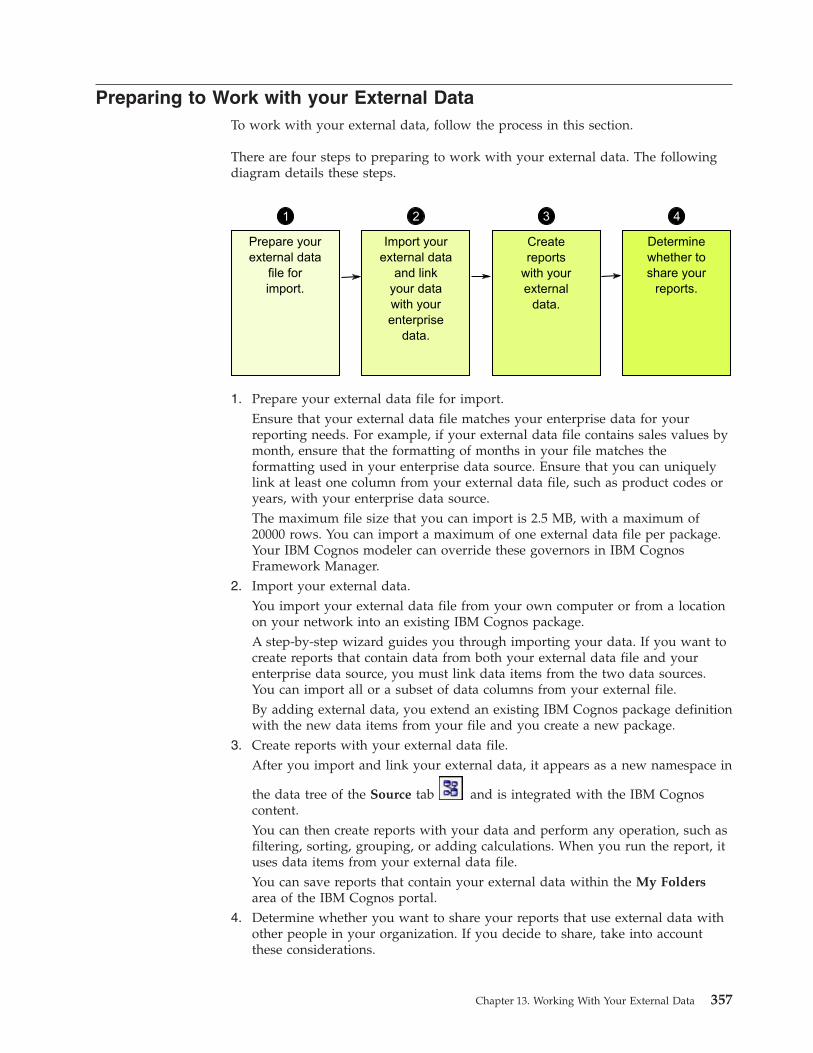
Preparing to Work with your External DataTo work with your external data, follow the process in this section.
There are four steps to preparing to work with your external data. The followingdiagram details these steps.
1. Prepare your external data file for import.Ensure that your external data file matches your enterprise data for yourreporting needs. For example, if your external data file contains sales values bymonth, ensure that the formatting of months in your file matches theformatting used in your enterprise data source. Ensure that you can uniquelylink at least one column from your external data file, such as product codes oryears, with your enterprise data source.The maximum file size that you can import is 2.5 MB, with a maximum of20000 rows. You can import a maximum of one external data file per package.Your IBM Cognos modeler can override these governors in IBM CognosFramework Manager.
2. Import your external data.You import your external data file from your own computer or from a locationon your network into an existing IBM Cognos package.A step-by-step wizard guides you through importing your data. If you want tocreate reports that contain data from both your external data file and yourenterprise data source, you must link data items from the two data sources.You can import all or a subset of data columns from your external file.By adding external data, you extend an existing IBM Cognos package definitionwith the new data items from your file and you create a new package.
3. Create reports with your external data file.After you import and link your external data, it appears as a new namespace in
the data tree of the Source tab and is integrated with the IBM Cognoscontent.You can then create reports with your data and perform any operation, such asfiltering, sorting, grouping, or adding calculations. When you run the report, ituses data items from your external data file.You can save reports that contain your external data within the My Foldersarea of the IBM Cognos portal.
4. Determine whether you want to share your reports that use external data withother people in your organization. If you decide to share, take into accountthese considerations.
Chapter 13. Working With Your External Data 357

Working with Date Data
If the data that you import contains dates, ensure that the dates use the formatyyyy-mm-dd.
Working with Dimensional Data Sources
If your enterprise data source is dimensional, such as OLAP ordimensionally-modeled relational, and you want to link your external data withyour enterprise data, you must first create a tabular or list report. Create and savea list report with your enterprise data that contains the data items that you want touse to link with your external data. Ensure that you remove the aggregate rowsthat are automatically added in the footer of the list. This list is a projection ofyour dimensional data source.
When you import your external data, use the list report that you created to linkyour external data with the query subject from your enterprise data.
Data in your external file is relational by nature because it consists of tables androws. If your enterprise data source is dimensional, you can still import and workwith your external data. However, you cannot mix relational data from yourexternal data files, and dimensional data from your enterprise data source withinthe same query. For example, a data container, such as a list, crosstab, or chart,uses one query and you cannot mix relational and dimensional data within thesame list, crosstab, or chart. Doing so will cause an error.
If you want to use data from both the external data file and the original packagewithin the same query, you must link the external data to a query subject withinthe current package instead of another report.
Working with External Data in an Unsecured IBM CognosApplication
If your IBM Cognos application is not secured, and users can log on anonymously,you may encounter issues if multiple people import external data in the samepackage.
For example, Robert imports his external data into package A and saves thepackage and reports he created in My Folders. Then, Valerie also imports herexternal data into the same package A and saves the package in My Folders.Valerie has therefore overwritten Robert's external data in package A. Now, ifRobert tries to run one of his reports, he encounters errors because his externaldata is no longer in package A.
To avoid this problem,v save packages that contain external data with a unique name.v apply security to your IBM Cognos applications so that users do not share the
same My Folders area.
Import DataYou select the file to import from your own computer, or from your local areanetwork.
You select which columns to import.
358 IBM Cognos Report Studio Version 10.2.1: User Guide

You then specify a namespace to use. The namespace provides a unique name toassociate with the data items that you import. The namespace appears in the data
tree in the Source tab and is used to organize the data items. By default, thenamespace is the imported file name without the extension.
If you change the default name for the namespace, you are prompted to select theexternal data file each time you run the report. To avoid this, select the Allowserver to automatically load file check box.
Procedure1. From the Tools menu, click Manage External Data.
Tip: You can also click the manage external data button at the top of the
Source tab .2. On the Select Data page of the wizard, under External data file, click Browse
and select your external data file to import.If you want the server to load the file without prompting users when they runthe report, select the Allow the server to automatically load the file check box.If selected, you must use the Universal Naming Convention (UNC) path, suchas \\servername\filename and you must ensure that the IBM Cognos server hasaccess to the file.
3. Under Data items, select the check box for the data items that you want toimport.
4. Type a name for the namespace and click Next.The namespace appears in the Source tree, and identifies the external datawithin the package. By default, the name is the name of your imported externaldata file.
5. If you do not want to link your data or change the data attributes, click Finishnow.
Related tasks:“MSR-PD-0012 error when importing external data” on page 483When you try to import an external data file, you receive an MSR-PD-0012 error.“MSR-PD-0013 error when importing external data” on page 483When you try to import an external data file, you receive an MSR-PD-0013 error.
Map DataIf you want to create reports that contain data from both your external file andfrom your enterprise data, you must link at least one query subject from yourpackage or from an existing report to a data item in your external data. Thismapping creates a relationship between your external data and your enterprisedata. For example, your external data contains information about employees,including an employee number. You map the employee number from your externaldata file to the employee number in your enterprise data. This ensures that yourdata is integrated smoothly.
About this task
Mapping a data item in your external data to a query subject that references otherquery subjects is not supported. For example, the query subject cannot contain a
Chapter 13. Working With Your External Data 359

calculation that references a query item from another query subject. Such amapping produces the following error message:
MSR-PD-0001 Failed to relate external data to objects in the underlying package. The item[query item] does not lead to a query subject.
Procedure1. On the Data Mapping page, link existing query subjects in your enterprise data
to data items in your external data file.2. Under Existing query subject / report, click the ellipsis (...) button and do one
of the following:v If you want to select a query subject from the data tree, click Choose Query
Subject and select a query subject.
Note: This option is not available when working with dimensional packages.v If you want to select from the query subjects included in a report, click
Choose a Report and select a report.3. Click the two data items that you want to link and click the New link button.
You cannot link a data item in your external data to a calculation in a querysubject.A link appears linking two data items.Tip: You can create multiple links for multiple data items. To delete a link,select the link and click Delete Link.
4. Click Next.
Finish Importing DataYou can change how query items from your external data file appear after they areimported into IBM Cognos Business Intelligence. For example, you can change thenumber of decimal places or the default summary.
If you want to use numeric data from your external data source as a measure in acrosstab, you must assign that data item a default summary other thanUnsupported. A specified default summary makes the data item appear as a
measure in the data tree in the Source tab . Otherwise, if you add the dataitem with an Unsupported default summary as the measure in a crosstab, novalues appear.
Attribute Description
Data type Identifies whether data in the file is one of the following types:
Integer, which represents numeric values.
Decimal, which represents integer values that are scaled by avariable power of 10.
Text, which represents values that contain letters and symbols.
Date or Date Time, which represent dates and times.
Default summary Identifies Sum, Average, Max, Min, Count or Unsupported as thedefault type of summary for the data item.
Applies only to Integer and Decimal data types.
360 IBM Cognos Report Studio Version 10.2.1: User Guide

Attribute Description
Decimal places Specifies the number of decimal places for the data item.
Applies only to the Decimal data type.
If you mapped links between data items in your external data and data items inyour enterprise data, specify the options that define the relationships between thedata items.
For each data item that you import and link, specify whether values are unique orexist more than once in both your external data and in your enterprise data. Youcan also specify how to handle rows that contain missing values in the reportresults.
Procedure1. On the Data Attributes page, specify the attributes for each data item after it is
imported and click Next.For example, if you import numeric data items, you can change the defaultsummary and number of decimal places.
2. On the Mapping Options page, specify the relationships between the linkeddata items and how to process the results in the report output.
3. Click Finish.
Publish the PackageYou can change the name and location of the package with your external data tohelp you differentiate between data packages.
Procedure1. If you want to rename the package that will be published or change the
location where it is published, do the following:v In the Manage External Data dialog, under Package name, click the ellipsis
(...) button.v Type a new name for the package and select the location where to save it.v Click Save.
2. Click Publish.
Results
IBM Cognos Business Intelligence imports your external data into a new package.A namespace with the data items from your external file appears in the data tree in
the Source tab .
You can now create reports with your external data.
Edit Your External DataAfter you import your data, you can change the data mappings and options thatyou originally specified and republish the package.
You can
Chapter 13. Working With Your External Data 361

v rename the namespace, which renames the organizational folder that appears in
the data tree in the Source tab . If you change the namespace, you areprompted for the external data file when you run the report.
v change which columns to importv change the data mapping linksv change the data attributesv change the mapping options
You can also import multiple external data files into the same package. To do this,your data modeler must modify governors in the model and republish the packagethat contains your enterprise data. For more information, see the IBM CognosFramework Manager User Guide.
Procedure
1. From the Tools menu, click Manage External Data .2. In the Manage External Data dialog box, select the external data to edit and
click the edit button .3. In the left pane, select the options that you want to change.4. Click OK and then republish the package.
Results
IBM Cognos Business Intelligence re-imports your external data and updates the
data items that appears in the data tree in the Source tab .
You can now create and update reports with your external data.
Delete Your External DataYou can delete your external data from within the package that you created if youno longer need it.
Procedure
1. From the Tools menu, click Manage External Data .2. In the Manage External Data dialog box, select the external data package to
delete and click the delete button .3. Click Publish.
Results
The external data namespace is removed from the package.
If you also no longer require the external data package or any reports created withthe package, you can delete it from within IBM Cognos Connection.
362 IBM Cognos Report Studio Version 10.2.1: User Guide

Running a Report That Contains External DataReports that contain external data run the same way as reports that contain onlyenterprise data. If you have access to the report, you will also have access to theexternal data included within the report.
You may be prompted to select the location of the external data file when you runthe report if eitherv the report author did not specify to automatically load the file.v the IBM Cognos Business Intelligence server cannot locate the file.
However, you are not re-prompted within the same Web browser session.
You can determine whether data in a report uses external data by tracing itslineage. For more information, see “View Lineage Information for a Data Item” onpage 53.
Making your Reports PublicAfter you create a report that uses your external data, you may want to make itpublic to share it with coworkers. They can run your report using your externaldata file that you made available on a public network drive that the IBM Cognosserver can access. They can also use their own version of the file. If they use theirown version, the file must contain the same columns as your original external datafile that you used to import the data and create the report. In addition, you mustclear the Allow server to automatically load file check box in the Select Datapage of the Manage External Data wizard.
To make reports public, you must save them in the Public Folders area of the IBMCognos portal. To save content in Public Folders, you must have the appropriatepermissions. Contact your IBM Cognos administrator to obtain permissions and toinform him or her that you are sharing a package or files.
If you share your reports, ensure that you maintain the reports.
Chapter 13. Working With Your External Data 363

364 IBM Cognos Report Studio Version 10.2.1: User Guide

Chapter 14. Using Conditions
You can define conditions to control what users see when they run a report.Conditions can apply to specific items in a report. For example, you can define aconditional style to highlight exceptional data, such as product revenue thatexceeds your target.
Conditions can also apply at the report layout level. Conditional layouts are usefulfor delivering reports to a multilingual audience. For example, you can have textitems, such as titles and cover pages, appear in the same language as the data inthe report.Related concepts:“Creating a Conditional Color Palette in a Chart” on page 111You can create a conditional palette to color data items in your chart in differentways depending on a condition. For example, in a column chart that showsrevenue per month, you want to make the columns for the months that have arevenue greater than $1000000 green.
Highlight Data Using a Conditional StyleAdd conditional styles to your report to better identify exceptional or unexpectedresults. A conditional style is a format, such as cell shading or font color, that isapplied to objects if a specified condition is true.
For example, you want to automatically highlight in green the departments in yourorganization that meet their budget quotas and highlight in red the departmentsthat go over budget. Creating conditional styles color-codes information in yourreports so that you can find areas that need attention.
You can apply multiple conditional styles to objects. For example, you can applyone style in specific cells and another style for the overall report. If multiple stylesset the same property, such as font color, the last style in the list is applied.
You can apply conditional styles based on any data item in your report.
You can create the following types of conditional styles.
Type Description
Numeric Range Highlights straight numerical data, such asrevenues and losses.
Date/Time Range Highlights data from specific dates andtimes.
Date Range Highlights data from specific dates.
Time Range Highlights data from specific times.
Interval Highlights data falling between set intervals.
© Copyright IBM Corp. 2005, 2013 365

Type Description
String Highlights specific alphanumeric items in areport. For example, you can highlight allinstances of a specific word or phrase, suchas Equipment. String criteria arecase-sensitive.
If multiple string conditions are met, onlythe first conditional style is applied.
Advanced Creates conditional styles that usecalculations or expressions.
If multiple advanced conditions are met,only the first conditional style is applied.
You can also apply a conditional color palette to a chart.
Note: Conditional styles and conditional data formatting do not work on chartaxis labels. If you apply a conditional style or conditional data formatting to achart axis, only the first style defined is applied.
You can perform a search to find objects in your report that use conditional styles.You can also view all the conditional styles used in your report to delete or modifythem.
You can also use variables to highlight data. If a report contains both conditionalstyles and style variables, the style variables are applied first and then theconditional styles are applied.
Tip: The Return Quantity by Order Method sample report in the GO DataWarehouse (analysis) package includes conditional highlighting. For moreinformation about The Sample Outdoors Company samples, see Appendix C,“Sample Reports and Packages,” on page 507.
Create a New Conditional StyleYou can apply conditional styles based on any data item in your report.
Procedure1. Click the object for which you want to define a conditional style and click the
conditional styles button .
Tip: You can also right-click the object and click Style, Conditional Styles orclick the object, and then, in the Properties pane, set the Conditional Stylesproperty.
2. Click the add button and click New Conditional Style.3. Select the data item to determine the condition and click OK.
The type of conditional style that you can use depends on the type of data itemyou select.
4. In the Name box, type a name for the conditional style.5. To define a numeric value, date/time, date, time, or interval condition:
v Click the new button and select a value to define a threshold.
366 IBM Cognos Report Studio Version 10.2.1: User Guide

The value appears in the Range column, and two ranges are created.v For each range, under Style, click one of the predefined styles to apply to the
range or click the edit button and create a new style.
Tip: You can also define a style for the cells in your report that have missingvalues.
v Repeat the steps above to add other conditions.
Tip: Under Style, pause the pointer over each range to see the conditionproduced for that range.
v To move a value above or below a threshold, click the arrow button nextto the value.For example, you insert a threshold value of five million. By default, theranges are less than or equal to five million and greater than five million.Moving the five million value above the threshold changes the ranges to lessthan five million and greater than or equal to five million.
6. To define a string condition:v Click the new button and select how to define the condition.v To select more than one individual value, click Select Multiple Values and
click the values.v To type specific values, click Enter Values and type the values.v To specify your own criteria, such as values that begin with the letter A, click
Enter String Criteria and specify the condition.v For each condition, under Style, click one of the predefined styles to apply
or click the edit style button and create a new style. Specify the style toapply to remaining values by clicking one of the predefined styles besideRemaining values (including future values).
v Specify the order in which to evaluate the conditions.Conditions are evaluated from top to bottom, and the first condition that ismet is applied.
Reuse an Existing Conditional StyleYou can create a conditional style once and reuse it on multiple objects in yourreport. You can specify the order in which conditional styles are applied. You canalso use existing local classes as your conditional styles.
Procedure1. Click the data item for which you want to define a conditional style, and then
click the conditional styles button .
Tip: You can also right-click the data item and click Style, Conditional Stylesor click the data item, and then, in the Properties pane, set the ConditionalStyles property.
2. Click the add button , click Use Existing Conditional Style, and select thestyle.
Chapter 14. Using Conditions 367

Create an Advanced Conditional StyleYou can create advanced conditional styles that use calculations or expressions.
If multiple advanced conditions are met, only the first conditional style is applied.
Procedure1. Click the data item for which you want to define a conditional style, and then
click the conditional styles button .
Tip: You can also right-click the data item and click Style, Conditional Stylesor click the data item, and then, in the Properties pane, set the ConditionalStyles property.
2. Click the add button and click Advanced Conditional Style.3. Type a name for the conditional style.
4. Click the add button and specify the expression that defines the condition.5. For each condition, under Style, click one of the predefined styles to apply or
click the edit button and create a new style. Specify the style to apply toremaining values by clicking one of the predefined styles beside Remainingvalues (including future values).
6. Specify the order in which to evaluate the conditions by clicking a conditionand then clicking the move up or move down arrow.Conditions are evaluated from top to bottom, and the first condition that is metis applied.
Manage Conditional StylesYou can view, modify, or delete the conditional styles that are applied to yourreport. You can also define a new conditional style.
In the IBM Cognos Report Studio options, you can specify whether toautomatically delete conditional styles that are no longer used in a report.
Procedure
From the Tools menu, click Manage Conditional Styles.
Example - Add a Conditional Style to an Existing ReportYou are a report writer at The Sample Outdoors Company, which sells sportingequipment. You have a report that compares current year data to previous yeardata and highlights negative percentage variances in red (Poor) and positivepercentage variances in green (Excellent). You want to add a third conditional styleto indicate percentage variances above 0 but less than 10. You create a conditionalstyle that highlights percentage variances between 0 and 10% in yellow (Average).
Procedure1. Open the GO Balance Sheet as at Dec 31 2012 report from the GO Data
Warehouse (analysis) package.2. Right-click any cell in the % Variance column and click Style, Conditional
Styles.
368 IBM Cognos Report Studio Version 10.2.1: User Guide
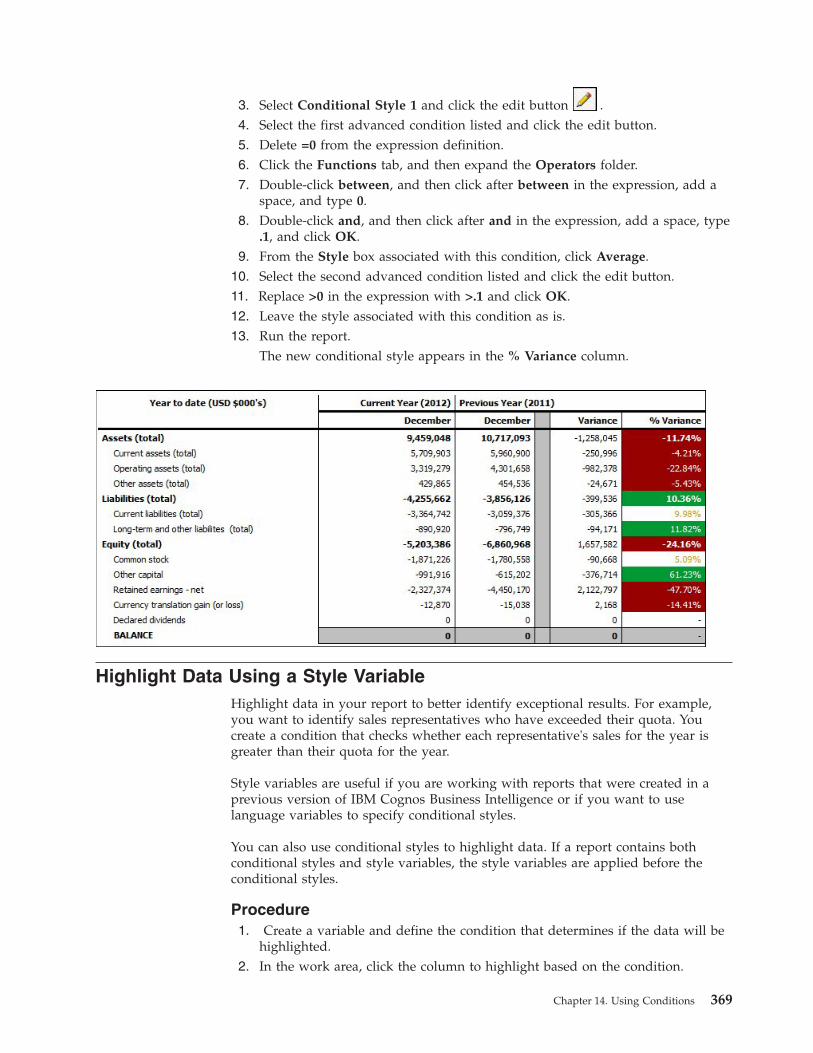
3. Select Conditional Style 1 and click the edit button .4. Select the first advanced condition listed and click the edit button.5. Delete =0 from the expression definition.6. Click the Functions tab, and then expand the Operators folder.7. Double-click between, and then click after between in the expression, add a
space, and type 0.8. Double-click and, and then click after and in the expression, add a space, type
.1, and click OK.9. From the Style box associated with this condition, click Average.
10. Select the second advanced condition listed and click the edit button.11. Replace >0 in the expression with >.1 and click OK.12. Leave the style associated with this condition as is.13. Run the report.
The new conditional style appears in the % Variance column.
Highlight Data Using a Style VariableHighlight data in your report to better identify exceptional results. For example,you want to identify sales representatives who have exceeded their quota. Youcreate a condition that checks whether each representative's sales for the year isgreater than their quota for the year.
Style variables are useful if you are working with reports that were created in aprevious version of IBM Cognos Business Intelligence or if you want to uselanguage variables to specify conditional styles.
You can also use conditional styles to highlight data. If a report contains bothconditional styles and style variables, the style variables are applied before theconditional styles.
Procedure1. Create a variable and define the condition that determines if the data will be
highlighted.2. In the work area, click the column to highlight based on the condition.
Chapter 14. Using Conditions 369

3. In the Properties pane, double-click the Style Variable property.4. Click Variable, click the variable to assign to the object, and click OK.5. If you assigned a string variable, in the Values box, select the values for the
condition to support.
Tip: A default value exists for the variable, and it is always selected.6. If you assigned a language variable, in the Values box, select the languages
for the condition to support.
Tip: A default value exists for the variable, and it is always selected.7. Click OK.
8. Pause the pointer over the condition explorer button and click a valueother than the default value.
Tip: When you select a value in the condition explorer, the Explorer barbecomes green to indicate that conditional formatting is turned on and thatany changes you make to the report apply only to the variable value.For example, if you created a Boolean variable, click Yes.
9. In the Properties pane, specify the formatting with which to highlight thecolumn when the condition is satisfied.For example, click the Border property to create a thicker border around thecolumn.
10. Repeat steps 8 to 9 for other possible values defined for the variable.
Tip: To view the report with no variables applied, pause the pointer over thecondition explorer button and click (No variable) or triple-click the Explorerbar.
Results
When you run the report, the report objects to which you applied the variable arehighlighted when the condition is satisfied. For example, if you created a Booleanvariable, the objects are highlighted when the condition is met. If the condition isnot satisfied for any object, no conditional formatting is applied.
Adding Conditional Rendering to a ReportYou can specify which objects are rendered when a report is run.
Before you can add conditional formatting or conditional rendering to your report,you must add a variable. You can create a variable in the condition explorer or inthe Properties pane.
Add a Variable from the Condition ExplorerBefore you can add conditional formatting or conditional rendering to your report,you must add a variable. You can create a variable in the condition explorer or inthe Properties pane.
Procedure
1. Pause the pointer over the condition explorer button and click Variables.
370 IBM Cognos Report Studio Version 10.2.1: User Guide

2. From the Toolbox tab , drag one of the following variables to the Variablespane:v To create a variable that has only two possible values, Yes and No, drag
Boolean Variable.v To create a variable whose values are string-based, drag String Variable.v To create a variable whose values are different languages, drag Report
Language Variable.3. If you created a Boolean variable, in the Expression Definition box, define the
condition and click OK.For example, the following expression returns the value Yes if revenue is lessthan one million and the value No if revenue is greater than or equal to onemillion:[Revenue]<1000000For information about creating expressions, see “Using Relational Calculations”on page 248 or “Using Dimensional Calculations” on page 302 and Appendix F,“Using the expression editor,” on page 555.
4. If you created a string variable, do the following:v In the Expression Definition box, define the condition and click OK.
For example, the following expression returns the value high if revenue isgreater than one million and the value low if revenue is less than or equal toone million:if ([Revenue]>1000000) then ('high') else ('low')For information about creating expressions, see “Using RelationalCalculations” on page 248 or “Using Dimensional Calculations” on page 302and Appendix F, “Using the expression editor,” on page 555.
v Click the add button in the Values pane.v For each value that the variable can assume, type the name of the value that
corresponds with the possible outcomes defined in the expression.For example, in the previous expression, you must create two values for thevariable, high and low.
Tip: You can create a group by clicking two or more values and then
clicking the group values button . For example, you can create a groupthat includes the available French languages.
5. If you created a language-specific variable, in the Languages dialog box, selectthe languages to support.
Add a Variable from the Properties PaneBefore you can add conditional formatting or conditional rendering to your report,you must add a variable. You can create a variable in the condition explorer or inthe Properties pane.
Procedure1. Select the report object.2. In the Properties pane, under Conditional, double-click the conditional
property to which to assign the variable.The following conditional properties are available:
Chapter 14. Using Conditions 371

Goal Conditional Property
Specify a variable based on which text canbe conditionally shown.
For example, you want different text toappear when a report is run in a differentlanguage.
Text Source Variable
Specify a variable based on which object canbe conditionally rendered.
For example, you want to make a revenuereport smaller by not rendering rows thatare below a threshold.
Render Variable
Specify a variable based on which object canbe conditionally styled.
For example, you want data that meets somecriterion to appear in a different color.
Style Variable
Specify a variable based on which objects ina block can be conditionally rendered.Applies only to conditional block objectsthat you insert in a report.
Block Variable
3. In the Variable box, click an existing variable or one of the following variabletypes:v <New language variable>
v <New string variable>
v <New boolean variable>
4. In the New Variable dialog box, in the Name box, type the name of thevariable.
5. If you created a string variable, click the add button , type the stringvalues to define, and click OK.
6. If you created a language variable, select the languages to support and clickOK.
7. In the Expression Definition box, define the condition.
Hide or Show an ObjectYou can hide and show objects in a report based on a condition you define.
You can also specify that an object should not be rendered based on a condition.
Tip: The Global Bonus Report sample report in the GO Data Warehouse (analysis)package includes hidden objects. For more information about The SampleOutdoors Company samples, see Appendix C, “Sample Reports and Packages,” onpage 507.
Procedure1. Create a variable, and define the condition that determines if the object is
shown or hidden.
Tip: Create a Boolean variable to show and hide objects, as this type ofvariable has only two possible values.
372 IBM Cognos Report Studio Version 10.2.1: User Guide

2. From the Toolbox tab , drag a Conditional Blocks object to the work area.3. Select the conditional block.4. In the Properties pane, double-click the Block Variable property.5. In the Variable box, click the variable you created and click OK.6. Set the Current Block property to Yes.7. From the content pane, drag the object to show or hide to the conditional block.
For example, drag a data item from the Source tab or from the Data Items tab.You may need to link the report page to a query before you can add a dataitem to the block.
Results
When you run the report, the report objects to which you applied the variable arevisible when the condition is satisfied and invisible when it is not.
Add Conditional RenderingAdd conditional rendering to specify which objects are rendered when a report isrun. This is useful when your report contains sensitive data.
Conditional rendering is not the same as hiding objects. When you hide an object,the object exists but is transparent. If an object is not rendered, it is not in thereport.
For a list of objects that can be rendered conditionally, see the Render Variableproperty in Appendix G, “Report Studio Object and Property Reference,” on page771.
Procedure1. Select the list column to be rendered conditionally.
Tip: You must select the list column, not the list column body or the listcolumn title. If the body or title is selected, as indicated in the Properties pane,click the select ancestor button and click the list column.
2. In the Properties pane, double-click the Render Variable property.3. Click Variable and click the variable that will determine if the column will be
rendered.4. In the Render for box, select the values that the condition will support.
Tip: A default value exists for the variable, and it is always selected.
Example - Create a Conditional ReportYou are a report author at The Sample Outdoors Company, which sells sportingequipment. You are requested to create a report that shows orders after a datespecified by the user. The report will prompt the user for a date and ask whetherthe user wants to see a description for each order.
Procedure1. Open IBM Cognos Report Studio with the GO Data Warehouse (query)
package.2. In the Welcome dialog box, click Create a new report or template.
Chapter 14. Using Conditions 373

3. In the New dialog box, click List and click OK.
4. From the Source tab , expand Sales and Marketing (query), and Sales(query) and add data items to the list:v Expand Time dimension and add Date.v Expand Sales order and add Order number.v Expand Product and add Product name and Product description.v Expand Sales fact and add Quantity, Unit price, and Revenue.
5. Click Date, and then click the section button .
6. Select the Order Number column and click the group button .
7. Click Revenue, and then click the summarize button and click Total.8. Change the title of the report to New Orders.
9. Pause the pointer over the page explorer button and click Prompt Pages.
10. Create a new prompt page by double-clicking Page in the Toolbox tab .11. Double-click the new prompt page.12. From the Toolbox tab, double-click Text Item and type the following text:
Enter the start date, and select if descriptions will be shown.13. Insert a 2 by 2 table into the prompt page by clicking the insert table button
and moving the pointer until four squares are highlighted in a 2 by 2pattern.
14. From the Toolbox tab, drag a Text Item into the upper-left cell and type thefollowing text:Starting Date
15. From the Toolbox tab, drag a Text Item into the lower-left cell and type thefollowing text:Show Descriptions
16. From the Toolbox tab, drag a Date Prompt into the upper-right cell.17. In the Prompt Wizard window, select Create a new parameter, type p_Date in
the space provided, and then click Next.18. In the Create Filter window, select Create a parameterized filter with the
following entries:v For Package item, click the ellipsis (...) button and open Sales (query) and
Time dimension, and then click Date.v For Operator, click >.
19. Click Finish.20. From the Toolbox tab, drag a Value Prompt into the lower-right cell.21. In the Prompt Wizard, in the Choose Parameter window, select Create a new
parameter, type p_ShowDesc in the space provided, and then click Finish.22. Select the Value Prompt and, in the Properties pane, double-click Static
Choices.
23. Click the add button .24. In the Edit dialog box, type Yes in both the Use and Display boxes.25. Click the add button.
374 IBM Cognos Report Studio Version 10.2.1: User Guide

26. In the Edit dialog box, type No in both the Use and Display boxes.27. Click OK.
28. Pause the pointer over the condition explorer button and click Variables.29. From the Toolbox tab, create a new Boolean variable by double-clicking
Boolean Variable.30. In the Report Expression dialog box, type the following in the Expression
Definition window and click OK:ParamDisplayValue("p_ShowDesc") = 'Yes'
31. In the Properties pane, set the Name property to showDesc.
32. Pause the pointer over the page explorer button and click the reportpage.
33. Click the Product descriptions column.
34. In the Properties pane, click the select ancestor button and click ListColumn.
35. In the Properties pane, set the Render Variable property to the showDescBoolean variable you created.
36. Run the report.
Results
The report prompts you for a date. Orders that occur after the date you entered areshown. The report also asks whether to show the Descriptions column, and thecolumn is rendered only if you choose Yes.
Add Multiple LayoutsAdd multiple layouts to show a report in different ways. For example, you candefine a different layout for each language in a multilingual report. This allowsyou to create a single report that can be viewed by report consumers that usedifferent regional settings.
Procedure1. Create a variable and define the condition that will be used for each layout.
For example, create a report language variable that includes each language thatrequires a conditional layout.Note: Expressions used in a conditional layout cannot reference a query.
2. From the File menu, click Conditional Layouts.3. Select a variable, and then select the values that require a separate layout.
Results
A layout is created for each value you selected. Use the page explorer to navigatethe different layouts. For each layout, click Report Pages to create a report page orPrompt Pages to create a prompt page and add objects.
Tip: You can create new variables from the Conditional Layouts dialog. Thevariables are added to the condition explorer. For more information, see “Add aVariable from the Condition Explorer” on page 370.
Chapter 14. Using Conditions 375

Setting up a Multilingual Reporting EnvironmentYou can create reports that show data in more than one language and use differentregional settings. This means that you can create a single report that can be usedby report consumers anywhere in the world.
The samples databases provided with IBM Cognos store a selection of text fields,such as names and descriptions, in more than 25 languages to demonstrate amultilingual reporting environment. For information about how data is stored inthe samples databases and how the samples databases are set up to usemultilingual data, see the Administration and Security Guide.
Here is the process for creating a multilingual reporting environment:v Use multilingual metadata.
The data source administrator can store multilingual data in either individualtables, rows, or columns.For more information about configuring your database for multilingualreporting, see the Administration and Security Guide.
v Create a multilingual model.Modelers use IBM Cognos Framework Manager to add multilingual metadata tothe model from any data source type except OLAP. They add multilingualmetadata by defining which languages the model supports, translating textstrings in the model for things such as object names and descriptions, anddefining which languages are exported in each package. If the data sourcecontains multilingual data, modelers can define queries that retrieve data in thedefault language for the report user.For more information, see the Framework Manager User Guide.
v Create multilingual maps.Administrators and modelers use a Microsoft Windows operating system utilitynamed Map Manager to import maps and update labels for maps in IBMCognos Report Studio. For map features such as country or region and citynames, administrators and modelers can define alternative names to providemultilingual versions of text that appears on the map.For more information, see the Map Manager Installation and User Guide.
v Create a multilingual report.The report author uses Report Studio to create a report that can be viewed indifferent languages. For example, you can specify that text, such as the title,appears in German when the report is opened by a German user. You can alsoadd translations for text objects, and create other language-dependent objects.
v Specify the language in which a report is viewed.You can use IBM Cognos Connection to do the following:– Define multilingual properties, such as a name, screen tip, and description,
for each entry in the portal.– Specify the default language to be used when a report is run.
Tip: You can specify the default language on the run options page, in thereport properties, or in your preferences.
– Specify a language, other than the default, to be used when a report is run.For more information, see the IBM Cognos Connection User Guide.
The data then appears in the language and with the regional settings specified inv the user's Web browser options
376 IBM Cognos Report Studio Version 10.2.1: User Guide

v the run optionsv the IBM Cognos Connection preferences
Any text that users or authors add appears in the language in which they typed it.
Create a Multilingual Report in Report StudioYou can create a report in IBM Cognos Report Studio that can be viewed indifferent languages. For example, you can specify that text such as the title appearsin German when the report is opened by a German user. You can also addtranslations for text objects and create other language-dependent objects.
Before you begin
If you want the report to show data in different languages, the model must also bemultilingual.
Procedure1. Create a report language variable.2. In the work area, select the object to modify based on a language.3. In the Properties pane, double-click the Style Variable property.
If you are changing the language of a text string, click Text Source Variableinstead.
4. Click Variable and click the language variable you created.5. In the Values box, select the languages for the condition to support and click
OK.
Tip: A default value exists for the variable, and it is always selected.
6. Pause the pointer over the condition explorer button and a language forthe variable.
Tip: When you select a value in the condition explorer, the Explorer barbecomes green to indicate that conditional formatting is turned on and that anychanges you make to the report apply only to the variable value.
7. In the Properties pane, specify the formatting for the language.For example, to change the language of a text string, double-click the Textproperty and select the new string.
8. Press Enter when you are done.9. Repeat steps 6 to 8 for all other languages specified for the variable.
Tip: To view the report with no variables applied, pause the pointer over thecondition explorer button and click (No variable) or triple-click the Explorerbar.
Results
When you run the report, the report objects to which you applied the variable areformatted according to the browser's language.
Chapter 14. Using Conditions 377

378 IBM Cognos Report Studio Version 10.2.1: User Guide

Chapter 15. Bursting Reports
Burst a report to distribute its contents to various recipients. Bursting is the processof running a report once and then dividing the results for recipients who eachview a subset of the data. For example, salespeople in different regions each need areport showing the sales target for their country or region. You use burst reports tosend each salesperson only the information they need. Burst reports can bedistributed by email or saved to a folder for viewing in IBM Cognos Connection.
Tip: The Bursted Sales Performance Report sample report in the GO DataWarehouse (analysis) package includes bursting. For more information about TheSample Outdoors Company samples, see Appendix C, “Sample Reports andPackages,” on page 507.
To burst a report against a dimensional data source, see “Creating Burst ReportsUsing Dimensional Data Sources” on page 383.
You cannot burst crosstab or chart reports. However you can burst a report wherea container includes a crosstab or chart that is part of a master detail relationship.In this situation, you can burst only HTML, PDF, and XLS output formats; youcannot burst CSV or XML output formats.
For information about avoiding disk space exhaustion when bursting charts orcrosstabs, see “Master Detail or Burst Reports with Charts or Crosstabs May Resultin Denial of Service” on page 499.
Procedure1. define burst recipients2. specify burst groups3. set burst options4. enable bursting
Defining Burst RecipientsDefine the recipients who will receive data when the report is run. You candistribute burst reports to individual users, groups, roles, distribution lists, andcontacts.
To define the recipients, you create a calculated field, create the burst table in thesource database, and then import the table into a package.
Create a Calculated FieldYou can use a calculated field to dynamically create burst report recipients.
Procedure
1. Pause the pointer over the query explorer button and click the query thatwill produce the data to distribute.
2. From the Toolbox tab , drag Data Item to the Data Items pane.
© Copyright IBM Corp. 2005, 2013 379

3. In the Expression Definition box, type the expression that will generate the listof recipients and click OK.For example, typing the following expression builds the list of the employees ofThe Samples Outdoors Company. The expression concatenates the first letter ofeach employee's first name with their last name.lower(substring([Employee summary (query)].[Employee byorganization].[First name],1,1) + [Employee summary (query)].[Employee byorganization].[Last name])
4. To give the data item a more meaningful name, in the Properties pane, set theName property to a different name and press the Enter key.
Creating the Burst Table in the Source DatabaseYou can create a burst table in the source database for the list of recipients. Thesteps you must follow depend on the database system you are using. The bursttable must contain the following columns:v A unique identifier
Tip: Some database systems do not require a unique identifier for each table.v A recipient columnv The data item on which to burst
You can also include other columns that provide additional information. Forexample, if you plan to distribute reports by email, you can add a column for theemail address of each recipient.
After you create the table, add the recipients who will receive the report. You cancreate a mixed recipients list that includes individual users, groups, roles, contacts,distribution lists, or email addresses. For example, a burst table may contain thefollowing recipients.
Recipient example Recipient type
CAMID(":Canada") Group
CAMID(":")/contact[@name='Silvano Allessori'] Contact
CAMID(":")/distributionList[@name='EuropeanPartners']
Distribution list
CAMID("LDAP_Local_ID
:u:uid=gbelding,ou=people")
Authentication provider user or group,where LDAP_Local_ID is the name ofan LDAP namespace ID, and people isthe name of an organizational unit
[email protected] Email address
CAMID stands for Cognos Access Manager ID, and it represents an internal searchpath to the recipients. Specify search paths when you want to save burst reports ina folder. You can obtain the search path in IBM Cognos Connection by opening theSet properties page for each recipient and clicking View the search path. Ensurethat you use the proper syntax when adding recipients to the burst table.
In the case of NTLM namespaces, user IDs in the search path use alphanumeric ornumeric characters that make them difficult to read. You can use the followingalternate search path syntax:directory/namespace[@name="Local NT"]//account[@userName="gbelding"]
380 IBM Cognos Report Studio Version 10.2.1: User Guide

where Local NT is the name of a namespace and gbelding is the name of a user.The double slash before the account element indicates that you are searching allaccounts under the specified namespace.
Note: If you have a mixed recipients list, do not mix email address recipients andalternate path recipients. Because the alternate path syntax contains the @ symbol,it will be mistaken for an email address.
For more information about users, groups, roles, contacts, and distribution lists, seethe IBM Cognos Business Intelligence Administration and Security Guide.
Importing the Table into a PackageAfter you create the burst table in the source database, you must add it to thepackage that you will use to create the report.
For more information about importing tables and creating relationships, see theFramework Manager User Guide.
Procedure1. Open the package.2. Import the table.3. Define the relationship between the burst table and the table containing the
data item on which to burst.For example, you are bursting on country or region code. You define arelationship between country or region code in the burst table and country orregion code in the Country or Region table.
4. Save and publish the package.
Specify a Burst GroupSpecify burst groups to set how the report will be distributed. Burst groups aredefined by a data item that you create in the report or that you add from the bursttable.
Procedure
1. Pause the pointer over the query explorer button and click the query thatwill produce the data to distribute.
2. If you are creating a data item, do the following:
v From the Toolbox tab , drag Data Item to the Data Items pane.v In the Expression Definition box, type the expression that defines the burst
key.For example, the following expression builds an email address for each salesrepresentative in The Sample Outdoors Company. The expressionincorporates the calculated field that was previously created, which is nameduserID below, with ibmcognos99.com as the domain name.[userID]+’@ibmcognos99.com’
Tip: To give the data item a more meaningful name, in the Properties pane,set the Name property to a different name and press Enter.
3. To specify a burst table column as the data item, do the following:
Chapter 15. Bursting Reports 381

v From the Source tab , expand the burst table.v Drag the data item to the Data Items pane.
For example, if you are bursting reports by email, drag the data itemcontaining email addresses.
Set Burst OptionsSet burst options for the report to indicate the data item on which to burst and therecipients.
Before you begin
Before you set burst options, ensure that the data item on which you intend toburst is in the report and is grouped. The grouped column will create theappropriate subsets of data. In addition, you must associate the burst key with thislevel of grouping.
Procedure1. From the File menu, click Burst Options.2. Select the Make report available for bursting check box.3. Under Burst Groups, in the Query box, click the query that contains the data
item on which to burst.
Tip: You can choose a query that does not appear in the layout. This is usefulto distribute the same report to all burst recipients.
4. In the Label box, click the data item with which to label each burst report.
5. Click the edit button .6. In the Data Items box, drag the data item on which to burst to the Groups
folder and click OK.
Tip: You can specify the sort order of data within each group by draggingdata items to the Sort List folder and then clicking the sort order button
.7. Under Burst Recipient, in the Query box, click the query that contains the
data item to be used as the distribution list.8. In the Data Item box, click the data item that contains the recipients.9. In the Type box, choose the method to burst the report:
v Click Automatic to let IBM Cognos Business Intelligence determine fromthe data item whether to email reports or send them to folders in IBMCognos Connection.
v Click Email addresses to distribute reports by email.v Click Directory entries to distribute reports to folders that recipients can
access in IBM Cognos Connection.
Note: To burst reports to multiple mobile device users, you must choose todistribute reports to folders. You can choose Directory entries, or you canchoose Automatic if the data item returns directory entries instead of emailaddresses. To view the reports, the recipients must have IBM Cognos Mobileinstalled on their mobile devices. For more information about IBM CognosMobile, see the IBM Cognos Mobile Installation and Administration Guide.
382 IBM Cognos Report Studio Version 10.2.1: User Guide

When recipients log into IBM Cognos BI, they will see only the report that isspecific to them.
10. If the report contains two nested data containers, such as a list and a chart,click the ellipsis (...) button beside Master detail relationships and define therelationship between the data containers.For information about master detail relationships, see “Create a Master DetailRelationship” on page 292.
Enable BurstingWhen the report is ready to be distributed, enable bursting for the report in IBMCognos Connection.
Procedure1. Locate the report in IBM Cognos Connection.
2. Under Actions, click the run with options button .3. Click advanced options on the right of the screen.4. Under Time and mode, click Run in the background.5. Select the Burst the report check box.6. If you are distributing reports by email, select the Send the report by email
check box.
Tip: If you are bursting the report to a folder, you can also send the report byemail if the Send the report by email check box is selected. Reports will beemailed if the recipient's email address is stored in the authentication sourceyou are using or if they are entered in the recipient's personal information inIBM Cognos Connection.
7. If the burst report contains a drill-through link to another report and you aredistributing the burst report by email, do the following:v Click Edit the options.v Select the Include a link to the report check box.If you do not select the check box, the drill-through links in the burst reportwill not work.
8. Run the report.
Results
Allow a few moments for the report to run. If you are an administrator, you canview all outputs for the report. Under Actions, click View the output versions forthis report. When burst recipients log into IBM Cognos Connection or access theiremail accounts, they will see only the data that is meant for them.
Creating Burst Reports Using Dimensional Data SourcesYou can burst a report using a dimensional data source by using burst informationthat is stored in the data source. Because you do not want to append burstinginformation to existing dimensional data sources, you can create a relational datasource that contains the burst information.
Report bursting is limited when the underlying data source is a cube (MOLAPdata source such as IBM Cognos PowerCube, Microsoft Analysis Services, OracleEssbase, or IBM DB2/OLAP). The burst report must be a grouped report, and the
Chapter 15. Bursting Reports 383

burst is restricted to the outermost grouping in the report. For example, if youhave a report grouped on Country or Region and State, then you can burst thereport only on Country or Region.
Procedure1. In IBM Cognos Framework Manager, include both the dimensional data source
that is the basis for reporting and the relational burst table in the model.For more information about models, see the Framework Manager User Guide.
2. In IBM Cognos Report Studio, create a master detail report in which the masterquery drives the report and the detail query contains the burst information.You must group the master query on the data item on which you are bursting.This data item must have a corresponding data item in the relational bursttable.Author the detail query against the relational burst table. The burst table mustcontain two columns: the data item corresponding to the data item used in themaster report for bursting and the data item that contains the recipientinformation. The recipient can be an email address or an expression that resultsin a search path to an object in IBM Content Manager, such as an account,group, role, contact, or distribution list.For more information about master detail queries, see “Create a Master DetailRelationship” on page 292.
3. Ensure that the detail query, which must be evaluated by IBM Cognos BusinessIntelligence when the report is executed, is not visible:v Place a list that is based on the detail query in a conditional block with a box
type of None.v Link the master and detail queries using the following expression:
[Master Burst Key] = [Detail Burst Key]
Results
When you set the burst options for the report, the master query provides the dataitems for the burst key and the detail report provides the data items for the burstrecipients.
Example - Burst a ReportYou are a report author at The Sample Outdoors Company, which sells sportingequipment. You are requested to create a report that lists product sales for eachsales representative. The report is to be emailed to each sales representative, butthey only need to see the data that pertains to them. You create a list report thatyou burst to each sales representative.
Procedure1. Open IBM Cognos Report Studio with the GO Data Warehouse (query)
package.2. In the Welcome dialog box, click Create a new report or template.3. In the New dialog box, click List and click OK.
4. From the Source tab , expand Sales and marketing (query) and Sales(query). Add the following data items:v Expand Employee by region and add Employee name.v Expand Products and add Product line, Product type, and Product.
384 IBM Cognos Report Studio Version 10.2.1: User Guide
v Expand Sales fact and add Quantity and Revenue.5. Group the Employee name, Product line, and Product type columns.
6. Click the Employee name column, click the headers and footers button ,and then click Create Header.Employee name appears as a header in the list. You no longer need to keepthe data item as a list column.
7. In the list, click the Employee name column and click the delete button .
8. Click Revenue, and then click the summarize button and click Total.
9. Pause the pointer over the query explorer button and click Query1.10. From the Source tab, drag Email from the Employee by region folder to the
Data Items pane.11. From the File menu, click Burst Options.12. Select the Make report available for bursting check box.13. Under Burst Groups, in the Query box, click Query1.14. In the Label box, click Employee name.
15. Click the edit button .16. In the Data items box, drag Employee name to the Groups folder and click
OK.17. Under Burst Recipient, in the Query box, click Query1.18. In the Data Item box, click Email.19. In the Type box, click Email addresses.20. Save the report.21. Locate the report in IBM Cognos Connection.
22. Under Actions, click Run with options .23. Click advanced options on the right of the screen.24. Under Time and mode, click Run in the background.25. Select the Burst the report check box.26. Select the Send the report by email check box.27. Run the report.
Results
When sales representatives access their email accounts, they will see reports withonly the data that is meant for them.
Chapter 15. Bursting Reports 385

386 IBM Cognos Report Studio Version 10.2.1: User Guide

Chapter 16. Format Data
Format data in a report to improve readability. For example, you can show all datevalues in the order year, month, and day. If you do not set Data Format propertieshere, data is formatted according to the properties set in the model. If theproperties were not set in the model, data is formatted according to theInternational Components for Unicode (ICU) formats.
Special cells, such as overflow or underflow, errors, or not applicable values,appear with two dash (--) characters unless you override them.
You can also format data based on a condition or specify the format for aparticular object.
If you create a calculation that uses mixed currency values, an asterisk character (*)appears as the unit of measure. To remove the asterisk character, change the formatof the corresponding row or column.
Set the Default Data FormatsSet the default data properties for each type of data, including text, number,currency, percent, date, time, date/time, and time interval.
Procedure1. From the Data menu, click Default Data Formats.2. In the Format type box, click a format type.
The properties that you can set for the selected format type appear in theProperties box.
3. If you clicked the Currency format type and require different currencies in the
report, click the add button and select currency check boxes.For example, you may have one column with values are in euros and anothercolumn whose values are in US dollars.
4. Set the properties.If you added currencies in step 3, click each one and set the properties. If youdid not add any currencies, any properties you set will apply to all currencies.For properties in which you type meta-characters that represent certain types ofinformation, such as YYYY-MM-DD for dates, the meta-characters that arerequired depend on the authoring language specified for the report. For moreinformation, see “Using Patterns to Format Data” on page 393.If you set a value for the Pattern property, all other formatting properties areignored with the following exceptions:v Missing Value Characters
v Zero Value Characters
v Negative Pattern
Some properties are language-sensitive and should be changed only withcaution.
© Copyright IBM Corp. 2005, 2013 387

Results
The data formatting properties you set are applied to objects only in the currentlayout. If a data item contains values in multiple currencies but only a subset ofthose currencies have defined formats, the default format for the locale in whichyou are working is applied to values with no specified format.
Specify the Data Format for an ObjectSpecify the format for a particular object if you are not getting the results youwant.
For example, you add a measure to a report and you want to see two decimalswhen you run the report. You set the number of decimals to two for the Numberformat type for the current layout. However, when you run the report, you seemore than two decimals for the measure. To get the results you want, you mustmap the measure to the Number format type.
Data formats are not applied in delimited text (CSV) and XML report outputs.
Procedure1. Click the object.2. In the Properties pane, double-click the Data Format property.3. Under Format type, click the format type to apply to the object.4. To override any of the properties of the format type that were defined for the
current layout, in the Properties box, click the property and specify its value.
Specifying the Number of Decimals in NumbersWhen specifying the number of decimals, IBM Cognos Business Intelligence usesthe IEEE 754 default rounding mode known as half even. With half even rounding,numbers are rounded toward the nearest truncated value, unless both truncatedvalues are equidistant, in which case the value ending in an even digit is chosen,as follows:v If the digit immediately after the precision to be shown is greater than 5, the
number is rounded up.v If the digit immediately after the precision to be shown is less than 5, the
number is rounded down.v If the digit immediately after the precision is a 5, the number is rounded down
when the preceding digit is even and rounded up when the preceding digit isodd.For example, the number 78.5 is rounded to 78, while the number 73.5 isrounded to 74.
In addition, if the maximum number of decimals is lower than the actual numberof decimals in the number, the number is rounded to the maximum number ofdecimals.
Digit shaping in charts and mapsWhen working with bidirectional content, you cannot specify digit shaping at thechart or map level. You can specify digit shaping for the objects in charts andmaps.
388 IBM Cognos Report Studio Version 10.2.1: User Guide

To understand how digit shaping is applied to charts and maps, you must knowwhich chart and map objects are considered text and which objects are considerednumeric values.
The following table describes the chart and map objects that are considered text.
Table 1. Chart and map objects that are considered text
Container Object
Chart chart title, subtitle, footer, notes, legend item, legend title, regression label,marker label, background image label, axis titles, discrete axis label (forexample, category axis label, x-axis), baseline labels
Map map title, subtitle, footer, legend title, notes, axis labels
The following table describes the chart and map objects that are considerednumeric values.
Table 2. Chart and map objects that are considered numeric values
Container Object
Chart numeric axis label (for example, measure axis label, y-axis), numeric valuesthat appear in the legend (you can select to show the first, last, maximum,minimum value for each item in legends), numeric values that appear in thechart
Map legend items
The following list describes the different digit shaping options and how digitshaping is applied to charts and maps.v The digit shape options for text objects, which include titles, footers, and labels,
are Default, None, National, and Contextual. Digit shape options for numericvalues are Default, None, and National. There is no Contextual option fornumeric values.
v By default, digit shaping is not applied to numbers that appear on an object thatis considered text. For example, if a chart shows year data on the x-axis and thecontent language specified in IBM Cognos Connection is Arabic (Egypt), no digitshaping is applied because the x-axis label is considered a string.
The following list describes the default digit shaping behavior for charts and mapswhen the content language implies non-European digits, such as Arabic (Egypt).v Numeric values that have a specific format, such as decimal or currency, are
displayed as Arabic-Indic.v Except for matrix charts, numeric axis labels for charts and maps are displayed
in European digits.This is due to the way that charts and maps are rendered. The engine used torender charts and maps does not perform any formatting for numeric axis labels.No locale information is passed, and consequently the labels are displayed asEuropean digits. To display the labels as Arabic-Indic, select the digit shapingoption National.Matrix charts are rendered using International Components for Unicode (ICU) toformat numbers. Locale information is passed and the numbers are shapedaccordingly. For example, when the content language is Arabic (Egypt), ICUdisplays numbers as Arabic-Indic.
v Numbers within text labels are displayed as is. That is, no digit shaping isapplied.
Chapter 16. Format Data 389

The following list describes the default digit shaping behavior for charts and mapswhen the content language is Thai.v Numeric values that have a specific format, such as decimal or currency, are
displayed as European digits.v Numbers within text labels are displayed as is. That is, no digit shaping is
applied.Related concepts:“Support for bidirectional languages” on page 56You can author reports that support bidirectional languages. You can specify basetext direction, digit shaping, and container direction.Related information:“Digit Shaping” on page 970Specifies the digit shaping option to apply. When National is selected, digit shapesare determined from the user’s content language. When Contextual is selected,digit shapes are determined from adjoining characters in the value. For example, ifthe most recent strongly directional character before the numerical character isleft-to-right, the number is displayed as a European number. If the most recentstrongly directional character before the numerical character is right-to-left, thenumber is displayed in Arabic-Indic format. If there are no strongly directionalcharacters before the numerical character, the number is displayed according to thebase text direction of the field. When None is selected, no shaping is performed,and the value as it appears in the data source is shown. The default depends onthe type of value. When the value is a string, the default is None.
Locale-sensitive PropertiesIBM Cognos Report Studio contains an extensive library of customized propertiesadapted to users from different regions who speak different languages. Forexample, if a modeler specifies that a given data item is a currency, only the propercurrency symbol must be specified. When reports are created, Report Studioautomatically adapts the format of the currency numbers to each user according tothe content language specified in IBM Cognos Connection.
When modelers or report authors specify properties, these properties override userpreferences and risk creating inconsistent formatting for users of other cultures. Itis usually much easier and safer to let Report Studio take care of formatting. Forexample, for the date format type, different regions use different characters torepresent the date separator. If you specify a date separator, you may confuse usersin other regions.
The following data formatting properties are locale-sensitive:v Currency Symbol Position
v Date Separator
v Date Ordering
v Calendar Type
v Time Separator
v Display AM/PM Symbols
v Clock
v Decimal Symbol
v Negative Sign Position
v Thousands Separator
v Group Size (digits)
390 IBM Cognos Report Studio Version 10.2.1: User Guide

v Secondary Group Size (digits)
v Missing Value Characters
v Zero Value Characters
v Pattern
v Negative Pattern
Suppress Empty CellsSparse data may result in crosstabs showing empty cells. For example, a crosstabthat matches employees with products results in many rows of empty values forthe revenue measure if the employee does not sell those products.
You can suppress rows, columns, or rows and columns based on divide by zero,missing, and overflow values. Suppressing rows or columns without data givesyou a more concise view or your report.
Calculations are performed before suppression is applied. If you have multiplecrosstabs or charts, you must select one in order to access suppression options.
Within a list report, suppression applies only to rows and is based on non-groupeddata items. If details of a group are null, then the header and footer are alsosuppressed.
Suppression can also be applied to charts, repeaters, and repeater tables.
Access to the suppression feature depends on the settings in your modelingcomponent, IBM Cognos Transformer, IBM Cognos Framework Manager, and IBMCognos Administration.
Procedure
1. From the Data menu, click Suppress and click Suppression Options.2. Under Suppress, choose what sections to suppress.3. Under Suppress the following, choose which values to suppress.Related concepts:“Limitations When Formatting Empty Cells in SAP BW Data Sources” on page 548When working with SAP BW data sources, if the SAP BW server administratorconfigured custom formatting for empty cells on the SAP BW server, this customformat does not appear in IBM Cognos Business Intelligence reports. Ask youradministrator to configure the formatting of empty cells in IBM Cognos BI.
Suppress Null Cells Using FiltersYou can also use filters to suppress null cells in your reports. Using filters ensuresthat calculations take suppression into account. You may also obtain better reportperformance because the filtering is done at the data source.
If your report includes more than one measure or fact expression, it is best to basethe filter on only one underlying fact or measure.
Relational-style Reports
In relational-style reports, you can use detail and summary filters.
Chapter 16. Format Data 391

Dimensional-style Reports
In dimensional-style reports, you can use the filter function.
For example, insert a set expression in your crosstab and use the expression filter( descendants ([Set]) is not null). If your crosstab includes three or more levelswithin the same dimension on an edge, use the expression filter ( descendants (currentMember([Hierarchy] ) is not null).
If your crosstab includes nested sets, filter the sets using a cascading approach toimprove performance. For example, first filter the outermost (or highest nestedlevel) set, and then filter the remaining sets proceeding inward.
Example - Suppress Zeros in Rows and Columns in anExisting Report
You are a report writer at The Sample Outdoors Company, which sells sportingequipment. You have a report that compares current year data to previous yeardata. You want to suppress zeros in the report to make the report more concise.You use the zero suppression tool to set the level of suppression.
Procedure1. Open the GO Balance Sheet as at Dec. 31, 2012 report.
2. From the Data menu, click Suppress and click Suppression Options.3. Under Suppress the following, click Rows and columns.4. Under Suppress the following type of values, select the Zero values check
box.5. Run the report.
Rows and columns containing zeros are hidden.
Specify what appears for data containers that contain no dataYou can specify what appears in a data container when no data is available fromthe database.
When no data is available, you can show one of the following options:v An empty data container, such as a blank list.
Figure 49. Balance sheet with zero suppression applied in rows and columns
392 IBM Cognos Report Studio Version 10.2.1: User Guide

v Alternate content, such as another data container or an image. You can insertany object from the Toolbox tab.
v Text, such as There is no data available for this month. If you show text, you canformat it. By default, the text No Data Available appears.
You can specify what appears when no data is available for the following datacontainers: lists, crosstabs, charts, maps, repeaters, repeater tables, and tables ofcontents.
If your report includes multiple data containers, you can specify different no datacontents for each container.
Tip: The No Data sample report in the GO Sales (query) package includes datacontainers that have no data. For more information about The Sample OutdoorsCompany samples, see Appendix C, “Sample Reports and Packages,” on page 507.
Procedure1. Select a data container.
2. In the Properties pane, click the select ancestor icon and click the datacontainer type.
3. Click the ellipsis (...) button next to the No Data Contents property and selectwhat should appear for data containers that contain no data:v To show an empty data container, click No Contents.v To show alternate content, click Content specified in the No data tab.
Two tabs appear at the top of the data container and the No Data Contents
tab is selected automatically.
From the Toolbox tab , insert the objects to appear when there is no dataavailable into the No Data Contents tab.
v To show text, click Specified text and type the text that you want to appear.
Using Patterns to Format DataYou can format data so that it matches any pattern of text and numbers whendefault formats are not appropriate. For example, you can format dates to use fulltext including the era, or you can format them to only use numbers and show thelast two digits of years to save space.
Using symbols and patterns can provide similar results as basic data formattingtasks. For example, you can set how many digits appear after the decimal point.You can achieve these types of results with a pattern, or you can set the No. ofDecimal Places property. Patterns allow flexibility for more complex requirements.
Each supported content language code requires a specific set of symbols to be usedin patterns. For each language code, there are two tables you will need; one fordate and time symbols, and one for decimal symbols. The decimal symbols are thesame for all locales, however, date and time symbols are grouped into six localegroups. Check the Date and Time Symbol section to see which locale group is usedfor your locale.
To define patterns, open the Data Format dialog box, and edit the Pattern propertyfor each format type. Use the symbols that are defined in the language code tables,and follow these guidelines.
Chapter 16. Format Data 393

Pattern GuidelinesWhen you define a pattern, the number of symbols you use affects how the datawill be shown. There are different rules for text, numbers, and values that can takethe form of text or numbers.
Text
You can specify whether text is produced in full or abbreviated form.
Number of symbols Meaning Example
4 or more Full text form EEEE produces Monday
Less than 4 Abbreviated form EEE produces Mon
Numbers
The number of symbols you use in a pattern sets the minimum number of digitsthat are produced in a report. Numbers that have fewer digits than specified arezero-padded. For example, if you specify mm for minutes, and the database valueis 6, the report will show 06.
Note: The year value is handled differently. If you specify two symbols for year,the last two digits of the year value is produced. For example, yyyy produces 2013,and yy produces 13.
Text and Numbers
For values that can produce text or numbers, such as months, you can specifywhether text or numbers are produced, and whether words are abbreviated.
Number of symbols Meaning Example
3 or more Text MMMM produces January
MMM produces Jan
Less than 3 Numbers MM produces 01
M produces 1
Date and Time SymbolsDate and time symbols are divided into locales, each of which is detailed below.
Locale Group A
Locales: af-za, en, en-au, en-be, en-bw, en-ca, en-gb, en-hk, en-ie, en-in, en-mt,en-nz, en-ph, en-sg, en-us, en-vi, en-za, fo-fo, gl-es, id, id-id, is, is-is, it, it-ch, it-it,kk-kz, ms, ms-bn, ms-my, nb-no, nl, nl-be, nl-nl, no, no-no, om-et, om-so, pl, pl-pl,pt, pt-br, pt-pt, so-dj, so-et, so-ke, so-so, sv, sv-fi, sv-se, sw-ke, sw-tz
394 IBM Cognos Report Studio Version 10.2.1: User Guide

Meaning Symbol Presentation Example
Era G Text AD
Year y Number 2013
Year (of 'Week ofYear')
Y Number 2013
Month in year M Text and number July and 07
Week in year w Number 27
Week in month W Number 2
Day in year D Number 189
Day in month d Number 10
Day of week inmonth
F Number 2 (2nd Wed in July)
Day of Week (1=firstday)
e Number 2
Day in week E Text Tuesday
a.m. or p.m. marker a Text pm
Hour in day (1 to 24) k Number 24
Hour in a.m. or p.m.(0 to 11)
K Number 0
Hour in a.m. or p.m.(1 to 12)
h Number 12
Hour in day (0 to 23) H Number 0
Minute in hour m Number 30
Second in minute s Number 55
Millisecond S Number 978
Time zone z Text Pacific Standard Time
Escape used in text ' n/a n/a
Single quote '' n/a '
Chapter 16. Format Data 395

Locale Group B
Locales: be-by, bg-bg, el, el-gr, fi, fi-fi, hr, hr-hr, hu, hu-hu, ja, ja-jp, ko, ko-kr, ro,ro-ro, ru, ru-ua, ru-ru, sh-yu, sk, sk-sk, sl-si, sq-al, sr-sp, th, tr, tr-tr, uk-ua, zh,zh-cn, zh-hk, zh-mo, zh-sg, zh-tw
Meaning Symbol Presentation Example
Era G Text AD
Year a Number 2013
Year (of 'Week ofYear')
A Number 2013
Month in year n Text and number July and 07
Week in year w Number 27
Week in month W Number 2
Day in year D Number 189
Day in month j Number 10
Day of week inmonth
F Number 2 (2nd Wed in July)
Day of Week (1=firstday)
e Number 2
Day in week E Text Tuesday
a.m. or p.m. marker x Text pm
Hour in day (1 to 24) h Number 24
Hour in a.m. or p.m.(0 to 11)
K Number 0
Hour in a.m. or p.m.(1 to 12)
k Number 12
Hour in day (0 to 23) H Number 0
Minute in hour m Number 30
Second in minute s Number 55
Millisecond S Number 978
Time zone z Text Pacific Standard Time
Escape used in text ' n/a n/a
396 IBM Cognos Report Studio Version 10.2.1: User Guide

Meaning Symbol Presentation Example
Single quote '' n/a '
Locale Group C
Locales: ca-es, cs, cs-cz, da, da-dk, es, es-ar, es-bo, es-cl, es-co, es-cr, es-do, es-ec,es-es, es-gt, es-hn, es-mx, es-ni, es-pa, es-pe, es-pr, es-py, es-sv, es-us, es-uy, es-ve,eu-es, mk-mk
Meaning Symbol Presentation Example
Era G Text AD
Year u Number 2013
Year (of 'Week ofYear')
U Number 2013
Month in year M Text and number July and 07
Week in year w Number 27
Week in month W Number 2
Day in year D Number 189
Day in month t Number 10
Day of week inmonth
F Number 2 (2nd Wed in July)
Day of Week (1=firstday)
e Number 2
Day in week E Text Tuesday
a.m. or p.m. marker a Text pm
Hour in day (1 to 24) h Number 24
Hour in a.m. or p.m.(0 to 11)
K Number 0
Hour in a.m. or p.m.(1 to 12)
k Number 12
Hour in day (0 to 23) H Number 0
Minute in hour m Number 30
Second in minute s Number 55
Chapter 16. Format Data 397

Meaning Symbol Presentation Example
Millisecond S Number 978
Time zone z Text Pacific Standard Time
Escape used in text ' n/a n/a
Single quote '' n/a '
Locale Group D
Locales: de, de-at, de-be, de-ch, de-de, de-lu
Meaning Symbol Presentation Example
Era G Text AD
Year j Number 2013
Year (of 'Week ofYear')
J Number 2013
Month in year M Text and number July and 07
Week in year w Number 27
Week in month W Number 2
Day in year D Number 189
Day in month t Number 10
Day of week inmonth
F Number 2 (2nd Wed in July)
Day of Week (1=firstday)
e Number 2
Day in week E Text Tuesday
a.m. or p.m. marker a Text pm
Hour in day (1 to 24) h Number 24
Hour in a.m. or p.m.(0 to 11)
K Number 0
Hour in a.m. or p.m.(1 to 12)
k Number 12
Hour in day (0 to 23) H Number 0
398 IBM Cognos Report Studio Version 10.2.1: User Guide

Meaning Symbol Presentation Example
Minute in hour m Number 30
Second in minute s Number 55
Millisecond S Number 978
Time zone z Text Pacific Standard Time
Escape used in text ' n/a n/a
Single quote '' n/a '
Locale Group E
Locales: fr, fr-be, fr-ca, fr-ch, fr-fr, fr-lu
Meaning Symbol Presentation Example
Era G Text AD
Year a Number 2013
Year (of 'Week ofYear')
A Number 2013
Month in year M Text and number July and 07
Week in year w Number 27
Week in month W Number 2
Day in year D Number 189
Day in month j Number 10
Day of week inmonth
F Number 2 (2nd Wed in July)
Day of Week (1=firstday)
e Number 2
Day in week E Text Tuesday
a.m. or p.m. marker x Text pm
Hour in day (1 to 24) h Number 24
Hour in a.m. or p.m.(0 to 11)
K Number 0
Chapter 16. Format Data 399

Meaning Symbol Presentation Example
Hour in a.m. or p.m.(1 to 12)
k Number 12
Hour in day (0 to 23) H Number 0
Minute in hour m Number 30
Second in minute s Number 55
Millisecond S Number 978
Time zone z Text Pacific Standard Time
Escape used in text ' n/a n/a
Single quote '' n/a '
Locale Group F
Locales: ga-ie
Meaning Symbol Presentation Example
Era R Text AD
Year b Number 2013
Year (of 'Week ofYear')
B Number 2013
Month in year M Text and number July and 07
Week in year t Number 27
Week in month T Number 2
Day in year l Number 189
Day in month L Number 10
Day of week inmonth
F Number 2 (2nd Wed in July)
Day of Week (1=firstday)
e Number 2
Day in week E Text Tuesday
a.m. or p.m. marker a Text pm
400 IBM Cognos Report Studio Version 10.2.1: User Guide

Meaning Symbol Presentation Example
Hour in day (1 to 24) u Number 24
Hour in a.m. or p.m.(0 to 11)
K Number 0
Hour in a.m. or p.m.(1 to 12)
k Number 12
Hour in day (0 to 23) U Number 0
Minute in hour n Number 30
Second in minute s Number 55
Millisecond S Number 978
Time zone c Text Pacific Standard Time
Escape used in text ' n/a n/a
Single quote '' n/a '
Decimal Format SymbolsAll locales
Symbol Meaning
0 A digit that is shown even if the value iszero.
# A digit that is suppressed if the value iszero.
. A placeholder for decimal separator.
, A placeholder for thousands groupingseparator.
E Separates mantissa and exponent forexponential formats.
; Separates formats for positive numbers andformats for negative numbers.
- The default negative prefix.
% Multiplied by 100, as percentage.
Multiplied by 1000, as per mille.
The currency symbol. If this symbol ispresent in a pattern, the monetary decimalseparator is used instead of the decimalseparator.
Chapter 16. Format Data 401

Symbol Meaning
The international currency sign. It will bereplaced by an international currencysymbol. If it is present in a pattern, themonetary decimal separator is used insteadof the decimal separator.
X Other characters that can be used in theprefix or suffix.
' Used to quote special characters in a prefixor suffix.
/u221E Infinity symbol.
/uFFFD Not a Number symbol.
402 IBM Cognos Report Studio Version 10.2.1: User Guide

Chapter 17. Using Query Macros
A macro is a fragment of code that you can insert in the Select statement of aquery or in an expression. For example, add a macro to insert a new data itemcontaining the user's name.
You can include references to session parameters, parameter maps, and parametermap entries in macros. Parameter values are set when you run the query. Forexample, you can use the language session parameter to show only the data thatmatches the language setting for the current user.
Macros can be used in these different ways:v They can be inserted in the SQL.
An example is Select * from Country where Country.Name =#$myMap{$runLocale}#
v They can supply an argument to a stored procedure query subject.If a value is not hard-coded for the argument, the stored procedure querysubject can be used to return different data.
v They can be inserted in expressions, such as calculations and filters.An example is a filter [gosales].[Sales staff].[Staff name] =#$UserLookUpMap{$UserId}#
v They can be used as a parameter wizard.Parameters can reference other parameters. An example is Map1, Key = en-us,Value = #$myMap{$UserId}#
You can also add query macros to the IBM Cognos Framework Manager model.For more information, see the Framework Manager User Guide.
Support for query macros in IBM Cognos Report Studio includes the samecapabilities as macros used in Framework Manager. However, Report Studio querymacros do not extend to the layout. Therefore, when making changes to the queryusing macros, you must bear in mind the side-effects on the layout. For example, ifa macro removes a column from the query that the layout refers to, a run-timeerror will occur.
SyntaxUse the following syntax to reference session parameter and parameter values.
Object Syntax Example
Session key $session_key #$my_account#
Parameter map key $map{<key>} #$map_one{’abc’}#
Parameter map entry whosekey is defined by a sessionparameter
$map{$session_key} #$map_one{$my_account}#
You can add the following elements to further define the macro expression.
© Copyright IBM Corp. 2005, 2013 403
Symbol Purpose
Single quotation marks ' Delineates a literal string that has a singlequotation mark as part of the string.
If the single quotation mark displays in astring, such as a query item, the string mustbe enclosed in a single quotation mark onboth sides of the string and the singlequotation mark must be doubled. Forexample, ab'c is written as ’ab’’c’
If the single quotation mark displays in amacro, the string must be enclosed in squarebrackets. For example, ab'c is written as[ab’c]
If the single quotation mark displays in aprompt, there is no need to enclose thestring.
To escape a single quotation mark in anexpression, use '
Square brackets [ ] Encloses model objects, such as a namespaceor query subject and macro names thatcontain restricted characters, such as anumber sign, hyphen, or space.
Curly brackets, also known as braces { } Calls a function that is unknown to theparser, such as dateadd in DB2, and whosefirst argument is a keyword.
Example:
dateadd({month},2,<dateexpression>)
+ operator Concatenates two strings, such as ’abc’ +’xyz’
Single quote function (sq) Surrounds the result of a string expressionwith single quotation marks. If the singlequotation mark displays in a string, such asa query item, the string must be enclosed ina single quotation mark on both sides of thestring and the single quotation mark mustbe doubled. You can use this function tobuild clauses to test against literalparameter-driven values.
Here is an example:
#sq($my_sp)#
If a session parameter (my_sp) has the valueab'cc, the result is
’ab"cc’
404 IBM Cognos Report Studio Version 10.2.1: User Guide

Symbol Purpose
Double quote function (dq) Surrounds the result of a string expressionwith double quotation marks. You can usethis function to refer to table and columnnames with non-identifier characters, suchas a blank space or a percent sign (%).
Here is an example:
#dq(’Column’ + $runLocale)#
If runLocale=en-us, the result is
"Column en-us"
Square bracket function (sb) Inserts a set of square brackets into theargument to build object references in amodel query and model expressions, such asfilters and calculations.
Here is an example:
#sb(’my item in ’ + $runLocale)#
If runLocale=en-us, the result is
[my item in en-us]
For information about functions, see Appendix F, “Using the expression editor,” onpage 555.
Add a Query MacroAdd a query macro to allow run-time changes to be made to SQL queries.
About this task
When you reference a parameter, you must do the following:v Use a number sign (#) at the beginning and end of each set of one or more
parameters.Everything between the number signs is treated as a macro expression, which isprocessed at runtime. Framework Manager removes anything that is outside thenumber signs.
v Precede each parameter map entry with a dollar sign ($)v Use a name that starts with an alpha character (a..z, A..Z)
Do not insert macros between existing quotation marks or square brackets becauseIBM Cognos Report Studio does not execute anything within these elements.
Tip: For a list of supported macro functions, see Appendix F, “Using theexpression editor,” on page 555.
Procedure1. To add a macro to an expression, in the Expression Editor, click the macros tab
.
Chapter 17. Using Query Macros 405

2. Pause the pointer over the query explorer button and click Queries.3. If the query to which you are adding a macro was built by using your own
SQL, do the following:v Click the SQL object that is linked to the query.v In the Properties pane, double-click the SQL property.v In the SQL dialog box, type the macro.
4. If the query to which you are adding a macro was not built by using your ownSQL, do the following:v Click the query.v In the Properties pane, double-click the Generated SQL/MDX property.v In the Generated SQL/MDX dialog box, click Convert.v In the SQL dialog box, type the macro.
Creating Prompts Using Query MacrosYou can create mandatory and optional prompts in reports using query macros.
Use the prompt macro functions prompt and promptmany to create single-value andmultiple-value prompts. You can use prompt macro functions when working witha relational data source or a dimensionally-modeled relational (DMR) data source.
If you want to use a prompt macro in an expression such as a calculation, youmust specify the data type when using an overloaded operator, such as a plus sign(+). You can use the plus sign to concatenate two items and to add two items.
If you want to define a filter on a dimension level and have the filter use theprompt or promptmany macro, you must provide the data type as memberuniquenameand a default value.
Here is an example:members( [MS_gosales].[New Dimension].[PRODUCTLINE].[PRODUCTLINE])
in ( set( #promptmany(’what’, ’memberuniquename’,
’[MS_gosales].[PROD1].[PRODUCTLINE].[PRODUCTLINE]
->[all].[1]’)# ) )
Here is an example of a mandatory prompt:selectCOUNTRY_MULTILINGUAL.COUNTRY_CODE as COUNTRY_CODE,COUNTRY_MULTILINGUAL.COUNTRY as COUNTRY,COUNTRY_MULTILINGUAL."LANGUAGE" as LANGUAGE1,COUNTRY_MULTILINGUAL.CURRENCY_NAME as CURRENCY_NAMEfromgosales.gosales.dbo.COUNTRY_MULTILINGUAL COUNTRY_MULTILINGUALwhere COUNTRY_MULTILINGUAL.COUNTRY = #prompt(’CountryName’)#
When default values are specified in the syntax of macro prompts, you may see anerror. Use prompt syntax such as where Country = ?Enter Country?.
The prompt and promptmany functions have the following mandatory and optionalparameters. All argument values must be specified as strings.
406 IBM Cognos Report Studio Version 10.2.1: User Guide

Name
This mandatory parameter is the name of the prompt. Name can also refer to thename of a parameter on a user-created prompt page, in which case the user-createdprompt page appears when the report is run instead of the default prompt pagethat the macro would generate.
Datatype
This optional parameter is the prompt value data type. The default value is string.Prompt values are validated. In the case of strings, the provided value is enclosedin single quotation marks and embedded single quotation marks are doubled.
Values include the following:v booleanv datev datetimev decimalv doublev floatv intv integerv intervalv longv memberuniquename
Memberuniquename is not an actual data type. This value must be used whenthe data type of the parameter is member unique name (MUN).
v numericv realv shortv stringv timev timeintervalv timestampv token
Token is not an actual data type. It is a way to pass SQL. A token does not passvalues.
v xsddatev xsddatetimev xsddecimalv xsddoublev xsddurationv xsdfloatv xsdintv xsdlongv xsdshortv xsdstringv xsdtime
Chapter 17. Using Query Macros 407

DefaultText
This optional parameter is the text to be used by default. If a value is specified, theprompt is optional.
If you use a space and no values are provided in the Prompt Value dialog box, aWhere clause is usually not generated.
If you use text and no values are provided in the Prompt Value dialog box, aWhere clause is usually generated using the default value.
Ensure that the text you provide results in a valid SQL statement.
Note: If the data type is memberuniquename, a value for the DefaultText parametermust be provided. For example:
(#prompt(’WhichLevel’, ’memberuniquename’,’[goSalesAgain].[PRODUCT1].[PRODUCT].[PRODUCT(All)]->[all]’)#)
Text
This optional parameter is text that precedes any user-provided values, such as'and column1 = '.
QueryItem
This parameter is optional. The prompt engine can take advantage of the PromptInfo properties of the query item. Descriptive information can be shown, althoughthe prompt value is a code.
TextFollowing
This optional parameter is the closing parenthesis that is used most often for thepromptmany function. This parameter is also useful when the prompt is optionaland is followed by hardcoded filters in the SQL statement.
Examples - selecting country or region promptsWhen a report is run, you want your users to be prompted to choose the countryor region for which they want to see data. The following code examples describehow you can use macros to create different prompts.
Mandatory prompt with no data type specified
Note the following:v The Datatype argument is not specified. Therefore, it is a string, which is correct
in this case.v The DefaultText argument is not specified. Therefore, it is a mandatory prompt.selectCOUNTRY_MULTILINGUAL.COUNTRY_CODE as COUNTRY_CODE,COUNTRY_MULTILINGUAL.COUNTRY as COUNTRY,COUNTRY_MULTILINGUAL."LANGUAGE" as LANGUAGE1,COUNTRY_MULTILINGUAL.CURRENCY_NAME as CURRENCY_NAMEfromgosales.gosales.dbo.COUNTRY_MULTILINGUAL COUNTRY_MULTILINGUALwhere COUNTRY_MULTILINGUAL.COUNTRY = #prompt(’CountryName’)#
408 IBM Cognos Report Studio Version 10.2.1: User Guide

Mandatory prompt with the data type specified
Note the following:v This prompt requires a valid integer value as response.v The DefaultText argument is not specified. Therefore, it is a mandatory prompt.selectCOUNTRY_MULTILINGUAL.COUNTRY_CODE as COUNTRY_CODE,COUNTRY_MULTILINGUAL.COUNTRY as COUNTRY,COUNTRY_MULTILINGUAL."LANGUAGE" as LANGUAGE1,COUNTRY_MULTILINGUAL.CURRENCY_NAME as CURRENCY_NAMEfromgosales.gosales.dbo.COUNTRY_MULTILINGUAL COUNTRY_MULTILINGUALwhere COUNTRY_MULTILINGUAL.COUNTRY_CODE >#prompt(’Starting CountryCode’,
’integer’,’’,’’,
’[gosales].[COUNTRY_MULTILINGUAL].[COUNTRY_CODE]’)#
Optional prompt and mandatory filter with the data type anddefault value specified
Note the following:v This prompt allows the user to supply a valid integer response.v The DefaultText argument is specified. Therefore, the user may omit entering a
value, in which case the value 10 is used. This makes it an optional prompt, butnot an optional filter.
Example 1:selectCOUNTRY_MULTILINGUAL.COUNTRY_CODE as COUNTRY_CODE,COUNTRY_MULTILINGUAL.COUNTRY as COUNTRY,COUNTRY_MULTILINGUAL."LANGUAGE" as LANGUAGE1,COUNTRY_MULTILINGUAL.CURRENCY_NAME as CURRENCY_NAMEfromgosales.gosales.dbo.COUNTRY_MULTILINGUAL COUNTRY_MULTILINGUALwhere COUNTRY_MULTILINGUAL.COUNTRY_CODE >#prompt(’Starting CountryCode’,
’integer’,’10’
)#
Example 2:[gosales].[COUNTRY].[COUNTRY] = #prompt(’countryPrompt’,’string’,’’’Canada’’’)#Result 2:[gosales].[COUNTRY].[COUNTRY] = 'Canada’
Note the following:v The defaultTextparameter must be specified such that is literally valid in the
context of the macro, because no formatting takes place on this value. See detailsbelow.
v The default string Canada in Example 2 is specified as a string using singlequotes, in which the embedded single quotes are doubled up, thus 3 quotes.This results in the string being properly displayed within single quotes in theexpression.
v As a general rule for the string datatype, the defaultText should always bespecified as in the previous note, except in the context of a stored procedureparameter.
Chapter 17. Using Query Macros 409
v For the defaultText of types date or datetime, a special format should be usedin the context of SQL. Examples of these formats are ’DATE ’’2012-12-25’’’ and’DATETIME ’’2012-12-25 12:00:00’’’. In all other contexts, you use thedate/datetime without the keyword and escaped single quotes (e.g.,’2012-12-25’).
Prompt that appends text to the value
Note the following:v The DefaultText argument is specified as a space character. In this case, the
generated text is just the space character, which eliminates the Where clause fromthe query.
v The Text argument is specified, which is written into the generated SQL beforethe user-provided prompt value.
selectCOUNTRY_MULTILINGUAL.COUNTRY_CODE as COUNTRY_CODE,COUNTRY_MULTILINGUAL.COUNTRY as COUNTRY,COUNTRY_MULTILINGUAL."LANGUAGE" as LANGUAGE1,COUNTRY_MULTILINGUAL.CURRENCY_NAME as CURRENCY_NAMEfromgosales.gosales.dbo.COUNTRY_MULTILINGUAL COUNTRY_MULTILINGUAL#prompt(’Starting CountryCode’,
’integer’,’ ’, // < = = this is a space
’where COUNTRY_MULTILINGUAL.COUNTRY_CODE >’)#
Syntax substitution
Note the following:v The Datatype argument is set to token, which means that the user-provided
value is entered without any checking on the provided value.Because checking is not performed on the value, the expression editor mayindicate that the expression is not valid. When a valid user-provided value issupplied or if you provide a valid default value, expression editor will interpretthe expression as valid.
v Token should be used only if there is a list of pick-values for the user.v The DefaultText argument is specified. Therefore, this is an optional prompt and
group by COUNTRY is used in the generated SQL.SelectCOUNTRY_MULTILINGUAL.COUNTRY_CODE as COUNTRY_CODE,COUNTRY_MULTILINGUAL.COUNTRY as COUNTRY,COUNTRY_MULTILINGUAL."LANGUAGE" as LANGUAGE1,COUNTRY_MULTILINGUAL.CURRENCY_NAME as CURRENCY_NAMEfromgosales.gosales.dbo.COUNTRY_MULTILINGUAL COUNTRY_MULTILINGUAL#prompt(’Sort column’,
’token’,’group by COUNTRY’,
’group by ’)#
Examples - creating prompts that use parameter mapsWhen a report is run, you want your users to select a language for the data in thereport. The following examples describe several ways you can do this.
410 IBM Cognos Report Studio Version 10.2.1: User Guide

Prompt that uses session variables
Note the following:v The name of the prompt is specified using a lookup in the parameter map
named PromptLabels. The key value is the session variable $language.v The Where clause is using a parameterized column.selectORDER_METHOD.ORDER_METHOD_CODE as ORDER_METHOD_CODE,ORDER_METHOD.ORDER_METHOD_#$language#as ORDER_METHOD_ENfromgosales.gosales.dbo.ORDER_METHOD ORDER_METHOD#prompt($PromptLabels{$language},’’,’ ’,’where ORDER_METHOD.ORDER_METHOD_’ + $language + ’>’)#
A parameter map that nests prompts
Note the following:v In the model, there is a parameter map DynPromptLabels with
#$PromptLabels{$language}#
v Part of the prompt information is run from a parameter map instead of beingcoded directly inside the SQL.
v The whole macro containing the prompt can be a value in a parameter map.selectORDER_METHOD.ORDER_METHOD_CODE as ORDER_METHOD_CODE,ORDER_METHOD.ORDER_METHOD_#$language#as ORDER_METHOD_ENfromgosales.gosales.dbo.ORDER_METHOD ORDER_METHOD#prompt($DynPromptLabels{’ex9’},’’,’ ’,’where ORDER_METHOD.ORDER_METHOD_’ + $language + ’>’)#
Examples - creating a multiple value promptWhen a report is run, you want your users to select one or more values. Thefollowing examples describe several ways you can do this.
Prompt with a required minimumNote the following:v The user must enter at least a single value.v This resembles the first example on prompting for a country or region
“Mandatory prompt with no data type specified” on page 408.selectCOUNTRY_MULTILINGUAL.COUNTRY_CODE as COUNTRY_CODE,COUNTRY_MULTILINGUAL.COUNTRY as COUNTRY,COUNTRY_MULTILINGUAL."LANGUAGE" as LANGUAGE1,COUNTRY_MULTILINGUAL.CURRENCY_NAME as CURRENCY_NAMEfromgosales.gosales.dbo.COUNTRY_MULTILINGUAL COUNTRY_MULTILINGUALwhere COUNTRY_MULTILINGUAL.COUNTRY IN (#promptmany(’CountryName’)#)
Chapter 17. Using Query Macros 411

Prompt with a required minimum with the data type specifiedNote the following:v This resembles the second example on prompting for a country or region
“Mandatory prompt with the data type specified” on page 409.selectCOUNTRY_MULTILINGUAL.COUNTRY_CODE as COUNTRY_CODE,COUNTRY_MULTILINGUAL.COUNTRY as COUNTRY,COUNTRY_MULTILINGUAL."LANGUAGE" as LANGUAGE1,COUNTRY_MULTILINGUAL.CURRENCY_NAME as CURRENCY_NAMEfromgosales.gosales.dbo.COUNTRY_MULTILINGUAL COUNTRY_MULTILINGUALwhere COUNTRY_MULTILINGUAL.COUNTRY_CODE IN (#promptmany(’Selected CountryCodes’,
’integer’,’’,’’,’[gosales].[COUNTRY_MULTILINGUAL].[COUNTRY_CODE]’)#
)
Optional prompt with the data type and default value specified
The In clause and both parentheses are part of the SQL statement.selectCOUNTRY_MULTILINGUAL.COUNTRY_CODE as COUNTRY_CODE,COUNTRY_MULTILINGUAL.COUNTRY as COUNTRY,COUNTRY_MULTILINGUAL."LANGUAGE" as LANGUAGE1,COUNTRY_MULTILINGUAL.CURRENCY_NAME as CURRENCY_NAMEfromgosales.gosales.dbo.COUNTRY_MULTILINGUAL COUNTRY_MULTILINGUALwhere COUNTRY_MULTILINGUAL.COUNTRY_CODE IN (#promptmany(’Selected CountryCodes’,
’integer’,’10’
)#)
Prompt that adds text before the syntaxNote the following:v This example uses the TextFollowing argument.selectCOUNTRY_MULTILINGUAL.COUNTRY_CODE as COUNTRY_CODE,COUNTRY_MULTILINGUAL.COUNTRY as COUNTRY,COUNTRY_MULTILINGUAL."LANGUAGE" as LANGUAGE1,COUNTRY_MULTILINGUAL.CURRENCY_NAME as CURRENCY_NAMEfromgosales.gosales.dbo.COUNTRY_MULTILINGUAL COUNTRY_MULTILINGUAL#promptmany(’Selected CountryCodes’,
’integer’,’ ’, // < = = this
is a space’where COUNTRY_MULTILINGUAL.COUNTRY_CODE IN
( ’,’’,’)’
)#
Optional prompt that adds text before the syntaxSelectCOUNTRY_MULTILINGUAL.COUNTRY_CODE as COUNTRY_CODE,COUNTRY_MULTILINGUAL.COUNTRY as COUNTRY,COUNTRY_MULTILINGUAL."LANGUAGE" as LANGUAGE1,COUNTRY_MULTILINGUAL.CURRENCY_NAME as CURRENCY_NAMEfrom
412 IBM Cognos Report Studio Version 10.2.1: User Guide

gosales.gosales.dbo.COUNTRY_MULTILINGUAL COUNTRY_MULTILINGUAL,gosales.gosales.dbo.COUNTRY XXwhere COUNTRY_MULTILINGUAL.COUNTRY_CODE = XX.COUNTRY_CODE#promptmany(’Selected CountryCodes’,
’integer’,’ ’,
’ and COUNTRY_MULTILINGUAL.COUNTRY_CODE IN (’,’’,’)’
)#
Chapter 17. Using Query Macros 413

414 IBM Cognos Report Studio Version 10.2.1: User Guide

Chapter 18. Using Drill-through Access
Using drill-through access, you can move from one report to another within asession while maintaining your focus on the same piece of data. For example, youselect a product in a sales report and move to an inventory report about thatproduct.
Drill-through access helps you to build business intelligence applications that arebigger than a single report. Drill-through applications are a network of linkedreports that users can navigate, retaining their context and focus, to explore andanalyze information.
Drill-through access works by defining the target report or object and then usinginformation from the source report to filter the target. IBM Cognos BI can matchdata from the source to metadata in the target report, or you can define parametersin the target for greater control.
Note: In the dimensional reporting style, you can also enable drilling up anddrilling down. For more information about drilling up and drilling down, see“Create a Drill-up and Drill-down Report” on page 308.
What You Should Know
For a drill-through link to work, it is necessary to knowv the sourcev the targetv how the data in the packages that contain these objects is related
Depending on the underlying data, you may create a drill-through definitionand have IBM Cognos BI match the data (dynamic drill-through) or createparameters in the target (parameterized drill-through).
v whether to run the target report or to open itThe target of drill-through access is usually a saved report definition. The reportcan be created in IBM Cognos Report Studio, IBM Cognos Query Studio, IBMCognos PowerPlay Studio, or IBM Cognos Analysis Studio. The target ofdrill-through access can also be a package that contains an IBM CognosPowerCube, in which case a default view of the PowerCube is created.
v whether the users of the drill-through link in the source report have theappropriate permissions to view or run the target report
v if the target is being run, in what format to run it, and what filters to use on thetarget
If you do not want to run the target report on demand, you may link to abookmark in the saved output instead of running the report. For more information,see the IBM Cognos Business Intelligence Administration and Security Guide.
Sources and Targets
In IBM Cognos BI, there are many different examples of source and target. Forexample, you can drill through
© Copyright IBM Corp. 2005, 2013 415

v between reports created in different packages against different data source types,such as from an analysis against a package that contains a PowerCube to adetailed report against a package based on a relational data source
v from one existing report to another report using definitions created in ReportStudio
v between IBM Cognos Viewer reports authored in Report Studio, Query Studio,and Analysis Studio
v to and from a package built on a PowerCubev from IBM Cognos Series 7 to IBM Cognos BI reportsv from Metric Studio to other IBM Cognos BI reports by passing parameters using
URLsFor more information, see the IBM Cognos Metric Studio User Guide.
Tip: In the GO Data Warehouse (analysis) package, the Positions to Fill samplereport is a drill-through target report and the Recruitment Report sample report isa drill-through source report. For more information about The Sample OutdoorsCompany samples, see Appendix C, “Sample Reports and Packages,” on page 507.
Understanding Drill-through ConceptsBefore you set up drill-through access, you must understand the key conceptsabout drilling through. Knowing these concepts will help you to avoid errors sothat report consumers drill through as efficiently as possible.
Drill-through PathsYou can create a drill-through path in a source report in IBM Cognos ReportStudio, or using Drill-through Definitions in IBM Cognos Connection. Adrill-through path is the definition of the path that is taken when moving from onereport to another, including how the data values are passed between the reports.
Using Drill-through Definitions, you can create a drill-through path from anyreport in the source package to any target report in any other package in IBMCognos Connection. This type of drill-through definition is stored in the sourcepackage. Users of any report in the package can use the drill-through definition todrill between any combination of IBM Cognos Analysis Studio, IBM Cognos QueryStudio, IBM Cognos PowerPlay Studio, or IBM Cognos Viewer reports in anypackage.
For any target report that contains parameters, you should map the targetparameters to the correct metadata in the drill-through path. This ensures that thevalues from the source report are passed to the correct parameter values, and thatthe target report is filtered correctly. If you do not map parameters, then the usersmay be prompted for values when the target report is run.
A report-based drill-through path refers to a path created and stored in a ReportStudio source report. This type of drill-through path is also called authored drillthrough. The path is associated with a specific data column, chart, or cross tab inthe source report, and is available only when users select that area of the report. Ifan authored drill-through definition is available, a hyperlink appears in the sourcereport when it is run.
Report-based drill-through is limited to Report Studio source reports and anytarget reports. Use this type of drill-through access when you want to pass data
416 IBM Cognos Report Studio Version 10.2.1: User Guide

item values or parameter results from within a source report to the target report,pass the results of a report expression to a target report, or a use URL link as apart of the drill-through definition.
Selection ContextsThe selection context represents the structure of the values selected by the user inthe source.
In IBM Cognos Analysis Studio, this includes the context area. When a packagedrill-through definition is used, the selection context is used to give values formapped parameters (parameterized drill-through) or also to map the appropriatedata items and values.
Drill-through links can also be defined to open the target object at a bookmark.The content of this bookmark may also specified by the selection context.
Drill-through access is possible between most combinations of the IBM CognosBusiness Intelligence studios. Each studio is optimized for the goals and skills ofthe audience that uses it, and in some cases for the type of data source it isdesigned for. Therefore, you may need to consider how the various studiosmanage the selection context when you drill through between objects created indifferent studios, and how the data sources are conformed. During testing ordebugging, you can see how source values are being mapped in different contextsusing the drill-through assistant.
Drilling Through to Different Report FormatsThe settings in the drill-through definition determine the format in which users seethe report results.
For example, the users may see the reports in IBM Cognos Viewer as an HTMLWeb page, or the reports may open in IBM Cognos Query Studio, IBM CognosPowerPlay Studio, or IBM Cognos Analysis Studio. If your users have PowerPlayStudio, then they may also see the default view of a PowerCube.
Reports can be opened as HTML pages, or as PDF, XML, CSV, or Microsoft Excelspreadsheet software formats. When you define a drill-through path, you canchoose the output format. This can be useful if the expected use of the targetreport is something other than online viewing. If the report will be printed, outputit as PDF; if it will be exported to Excel for further processing, output it as Excel orCSV, and so on.
If you define a drill-through path to a report that is created in Analysis Studio,PowerPlay Studio, or Query Studio, consumers can open the report in its studioinstead of in IBM Cognos Viewer. This can be useful if you expect a consumer touse the drill-through target report as the start of an analysis or query session tofind more information.
For example, if an application contains a dashboard style report of high-level data,you can define a drill-through link to Analysis Studio to investigate items ofinterest. The Analysis Studio view can then be drilled through to a PDF report forprinting.
Note: IBM Cognos Report Studio does not display data results.
Chapter 18. Using Drill-through Access 417

Drilling Through Between PackagesYou can set up drill-through access between packages.
The two packages can be based on different types of data source, but there aresome limits. The following table shows the data source mappings that supportdrill-through access.
Table 3. Data source mappings that support drill-through access
Source data source Target data source
OLAP OLAP
Note: OLAP to OLAP drill through issupported only if the data source type is thesame, for example, SSAS to SSAS.
OLAP Dimensionally modeled relational
OLAP Relational data
Note: For more information, see “BusinessKeys” on page 421.
Dimensionally modeled relational Dimensionally modeled relational
Dimensionally modeled relational Relational
Relational Relational
Bookmark ReferencesWhen you drill through, the values that you pass are usually, but not always, usedto filter the report. IBM Cognos Business Intelligence supports bookmarks withinsaved PDF and HTML reports so that a user can scroll a report to view therelevant part based on a URL parameter.
For example, you have a large inventory report scheduled to run daily or weeklyduring off hours because of resource considerations. Your users may want to viewthis report as a target because it contains detailed information, but you want themto view the saved output rather than run this large report. Using this Action optionand bookmark settings, users can drill through from another source location basedon products to open the saved report to the page that shows the product theywant to focus on.
When a bookmark in the source report is used in a drill-through definition, itprovides the value for the URL parameter. When report consumers drill throughusing this definition, they see the relevant section of the target report.
Bookmark references are limited to previously run reports that are output as PDFor HTML and contain bookmark objects.
Members and ValuesDimensionally modeled data, whether stored in cubes or stored as dimensionallymodeled relational (DMR) data, organizes data into dimensions. These dimensionscontain hierarchies. The hierarchies contain levels. And the levels contain members.
An example of a dimension is Locations. A Locations dimension may contain twohierarchies: Locations by Organization Structure and Locations by Geography.Either of these hierarchies may contain levels like Country or Region and City.
418 IBM Cognos Report Studio Version 10.2.1: User Guide

Members are the instances in a level. For example, New York and London aremembers in the City level. A member may have multiple properties, such asPopulation, Latitude, and Longitude. Internally, a member is identified by aMember Unique Name (MUN). The method by which a MUN is derived dependson the cube vendor.
Relational data models are made up of data subjects, such as Employees, which aremade up of data items, such as Name or Extension. These data items have values,such as Peter Smith.
In IBM Cognos Business Intelligence, the methods of drilling through available arev Dimensional (member) to Dimensional (member)v Dimensional (member) to Relational (data item value)v Relational (data item value) to Relational (data item value)
If the target parameter is a member, the source must be a member. The source andtarget should usually be from a conformed dimension. However, if the datasupports it, you may also choose to define a mapping using different properties ofthe source metadata item.
If the target parameter is a value, the source can be either a value or a member. Ifthe source is a dimensional member, you must ensure that the level or dimensionis mapped to the target data item correctly in the drill-through definition. Thebusiness key from which the member is sourced should usually match therelational target value, which is most often the business key. However, if the datasupports it, you may also choose to define a mapping from the caption of thesource metadata item.
Member Unique NamesThe member unique name (MUN) is a unique identifier for a member in IBMCognos reports. It is stored in the report specification when the member isreferenced in the report directly.
The MUN is used in drill-through between OLAP data sources. The member keysin the MUN for the different OLAP data sources must match.
The MUN is used to find the member in the data source, which is similar to howbusiness keys are used to find records in a table. For example, when you createOLAP dimension Products, you use the Product Line database column as s labelfor the members in your Product Line level. However, you use the Product LineCode business key from the database table to ensure that all the Product lines areunique in that level. The source value that you used to create the members is usedin combination with the data source name, hierarchy, and level information in themember unique name.
If the MUN changes, members that are directly referenced in expressions, filters, orreports are no longer found. Changes to the MUN may be related to other changes.For example, changes to the hierarchy and level structures may change the levelunique name, and changes to the business key values may change the member keypath. Other factors that can affect the MUN are application changes during thedesign stage or over time, IBM Cognos PowerCube category codes that areunpredictably unique, the production environment that has more members thanthe test environment, or removing the member from the data source.
Chapter 18. Using Drill-through Access 419

To avoid potential problems, we recommend the following best practices when youbuild OLAP data sources:v Use unique codes and keys within a dimension for the member keys.v Define your OLAP and relational packages using unique conformed values for
the source values (business keys) within similar dimensions or data valueswhere drill-through between applications may be required.
v Ensure that the business keys and dimension metadata structure are the same inthe production and test environments.
v Do not change the business keys in IBM Cognos Framework Manager in theproduction environment.
v Resolve the non-unique keys in a dimension in the data source before you buildthe cube.Ensure that there are no duplicate source values in all levels of a dimensionbefore you build a PowerCube. We do not recommend using the tilde character(~) in the category codes.For more information, see the section about uniqueness in the IBM CognosSeries 7 Step-by-Step Transformer.
For information about PowerCubes migrated from IBM Cognos Series 7, see theIBM Cognos PowerPlay Migration and Administration Guide.
Conformed DimensionsIf you work with more than one dimensional data source, you may notice thatsome dimensions are structured the same, and some are not.
The reason that dimensions can be structured differently is that the data sourcesmay serve different purposes.
For example, a Customer dimension appears in a Revenue data store, but not in anInventory data store. However, the Products dimension and the Time dimensionappear in both data stores.
Dimensions that appear in multiple data stores are conformed if their structure isidentical for all of the following:v hierarchy namesv level namesv level orderv internal keys
Drilling through is possible between different dimensional data stores only if thedimensions are conformed, and if the dimension data store is of the same vendortype, such as IBM Cognos PowerCube as the source and the target. For example, intwo data stores for Revenue and Inventory that contain Products and Timedimensions, it is possible to define the Products and Time dimensions differentlyfor each data store. However, for drill-through between the Products and Timedimensions to work, their structures must be identical in each data store.
If you are not sure whether your dimensions are conformed, then you shouldcheck with the data modeler to ensure that the drilling through will producemeaningful results.
IBM Cognos Business Intelligence does not support conformed dimensionsgenerated by IBM Cognos Framework Manager for SAP BW data sources.
420 IBM Cognos Report Studio Version 10.2.1: User Guide

Dimensionally modeled Relational Data Sources
Ensure that each level contains a business key that has values that match yourPowerCube or other DMR models. Also, you must also ensure that the RootBusiness Key property is set and uses the business key of the first level in thehierarchy. This helps to ensure that you have a conformed member unique namewhen attempting to drill through using members from this dimension.Related concepts:“Data Does Not Appear in a Target Report or the Wrong Data Appears” on page496If no data appears when you drill through to a target report or if the wrong dataappears, the problem might be data source conformance. The business keys mightbe different or might be mismatched.Related tasks:“Unexpected or Empty Results When Drilling Through” on page 503When you drill from a source report to a target report, there might be no datareturned. This might be the correct result if there is no data that corresponds to thedrill-through selections or if you do not have permission to view the data.
Business KeysWhen drill-through access is defined from a member to a relational value, thebusiness key of the member is passed by default.
This means that your relational target parameter must be set up using the dataitem with a matching value, which is most often the business key data item. Youcan also choose to pass the caption of the source metadata item.
For example, employees are usually uniquely identified by an employee number,not by their name, because their name is not necessarily unique. When you drillthrough from a dimensional member to a relational data item, the value providedis the business key. Therefore, the parameter in the target report must be definedto accept a business key value. The exact logic used to define the business keyvalue supplied depends on the cube vendor. For IBM Cognos PowerCubes, thebusiness key value is the Source property defined for the level in IBM CognosTransformer. IBM Cognos Series 7 Transformer PowerCubes pass the source valueif the drill-through flag was enabled before the cube was built. Otherwise, thecategory code is used.
In IBM Cognos Report Studio, you can determine what the member business keyis using an expression such as roleValue(’_businessKey’,[Camping Equipment]).This expression is case-sensitive.
SSAS 2005 multipart business keys are not supported in drill-through operations.
Tip: When other users run your drill-through report, you may not want them tobe prompted for a business key. In Report Studio, you can build a prompt pagewith a text that is familiar to the users, but filters on the business key. Your IBMCognos Framework Manager modeler can also set the Display Item Referenceoption for the Prompt Info property to use the business key when the data item isused in a prompt.
Chapter 18. Using Drill-through Access 421

Related concepts:“Data Does Not Appear in a Target Report or the Wrong Data Appears” on page496If no data appears when you drill through to a target report or if the wrong dataappears, the problem might be data source conformance. The business keys mightbe different or might be mismatched.Related tasks:“Unexpected or Empty Results When Drilling Through” on page 503When you drill from a source report to a target report, there might be no datareturned. This might be the correct result if there is no data that corresponds to thedrill-through selections or if you do not have permission to view the data.
ScopeScope is specific to drill-through definitions created using Drill-through Definitionsin IBM Cognos Connection (package drill-through definitions). The scope you setdefines when the target report is shown to the users, based on the items they havein the source report.
Usually, you define the scope of a drill-through path to match a parameter that itpasses. For example, if a target report contains a list of employees, typically youwant to display the report as an available drill-through choice only when a user isviewing employee names in a source report. If employee names are not in thesource report and the scope was set on the employee name in the drill-throughdefinition, the employee report does not appear on the list of availabledrill-through target reports in the Go To page. You can set the scope to a measureor to an item in the report.
In report-based drill-through access, where the drill-through path is associatedwith a specific report column, the column serves as the scope.
Mapped ParametersDrill-through targets may contain existing parameters or you can add parametersto the target for greater control over the drill-through link.
You usually map all parameters in a drill-through target to items from the source.
When you map source items that are OLAP or DMR members to targetparameters, you can select from a set of related member properties to satisfy therequirements of the target parameter. For a dimensional target, a dimensionalsource item uses the member unique name by default. For a relational target, adimensional source item uses the business key by default.
For example, you could change the source member property that is used for amapping to the member caption instead of the business key to match theparameter in a relational target. For a dimensional target, you could define aparameter that accepts a particular property (such as business key or parentunique name), then pass the appropriate source property to satisfy that target.
Note: If you define drill through between non-conformed dimensions, you shouldtest carefully to ensure that the results behave as expected.
If you do not specify parameter mappings, then by default, you will be promptedfor any parameters required in the target when you use the drill-through link. Tocustomize this behavior, use the display prompt pages setting.
422 IBM Cognos Report Studio Version 10.2.1: User Guide

When the action is set to Run using dynamic filtering, then additional filtering isapplied if names from the context in the source report match names of items in thetarget. Use this action as well when there are no parameters defined in the target.
If parameters are not mapped correctly, then you may receive an empty report, thewrong results, or an error message.
The source and target cannot contain identical parameter names when they arefrom different packages, even if the data structure is conformed. If the source andtarget are from the same package, there is no restriction.
If you have the necessary permissions, you can use the drill-through assistant tolook at what source parameters are passed, and what target parameters aremapped for a given drill-through link.
You can change the dynamic drill-through filter behavior if you want drill-throughto generate a filter using the Member Business Key instead of the default MemberCaption. For more information, see Changing Drill-Through Filter Behavior in theIBM Cognos Administration and Security Guide.
Drilling Through on Dates Between PowerCubes andRelational Packages
The usual method of drilling through from OLAP to relational packages requiresthat the target report parameter is set using the business key in the relational data,which does not work well for dates.
OLAP data sources typically view dates as members, such as Quarter 1 2012, whilerelational data sources view dates as ranges, such as 1/Jan/2012 to31/March/2012.
A special feature exists for drilling through between PowerCubes and relationalpackages. Ensure that the target report parameter is set up using in_range. Theparameter must be of type date-time, and not integer.
An example follows:[gosales_goretailers].[Orders].[Order date] in_range ?Date?
Also ensure that the drill-through definition maps the parameter at the dimensionlevel and that the PowerCube date level is not set to suppress blank categories.Enabling the option to suppress blank categories in the Transformer model beforeyou build the cube may cause the drill-through on dates to be unsuccessful. Thishappens because there are missing values in the range.
Set Up Drill-through Access in a ReportSet up drill-through access in a source report to link two reports containing relatedinformation.
You can then access related or more detailed information in one report (the target)by selecting one or more data item values from another report (the source). IBMCognos passes values from the source to the target and uses the passed values tofilter the target object. If the data in the source and target is conformed or if thedata item names are the same, then the system may map the source values to filterthe target (dynamic drill-through). If you require greater control, you may defineparameters in the target object (parameterized drill-through).
Chapter 18. Using Drill-through Access 423

For instructions about creating parameters in other kinds of targets, see the IBMCognos Business Intelligence Administration and Security Guide.
When you define the drill-through path in IBM Cognos Report Studio, you canpass a value from a different data item that is hidden from the user for displaypurposes but still in the query. For example, users see the Product Name data itemand can drill through on that item, but the drill-through definition passes theProduct Number value for the product name the user chose. You can also definethe target parameter to accept multiple values or a range of values from the dataitem in the drill-through source report or to accept a value from a parameter in thesource report.
Drill-through definitions that have been authored inside a Report Studio reportappear in the source report as blue underlined links. Users click the hyperlink toselect the value they want passed to the target and to drill through to the targetreport. If a user selects multiple items within a single column then when thedrill-through target report is run, the values from each selected row are passed tothe target parameters. This occurs as an and condition.
You can also drill through within the same report by creating bookmarks. As well,you can create drill-through definitions in the source package instead of the ReportStudio report. Users can use package drill-through definitions to navigate to atarget report from an IBM Cognos Analysis Studio analysis, an IBM Cognos QueryStudio report, an IBM Cognos PowerPlay Studio report or IBM Cognos PowerCubepackage, or a Report Studio report. For more information, see the Administrationand Security Guide.
If you have the IBM Cognos Software Development Kit, you can use URLs to setup drill-through access to and from third-party sources.
You can also drill through from a map.Related concepts:“Example - Creating Drill-through Access in a Legacy Chart” on page 154You are a report author at The Sample Outdoors Company, which sells sportingequipment. You are requested to create a chart that shows the revenue for eachproduct line and allows the reader to drill through from the revenue chart to viewthe product details for any item selected. You create a drill-through report to linktwo reports containing related information. You can then access related or moredetailed information in one report by selecting a value in the chart. You create tworeports: a target list report that contains the details for the item and a source reportthat contains the chart that shows the product line revenue.
Create a parameter in the targetSet up drill-through access in a source report to link two reports containing relatedinformation. You can then access related or more detailed information in one report(the target) by selecting one or more data item values from another report (thesource).
If you are using an SAP BW data source for the target report and the target reportcontains a variable for a hierarchy node, values from the source report can bevalues only of the data item representing the leaf-level identifier of the hierarchy.
424 IBM Cognos Report Studio Version 10.2.1: User Guide

Before you begin
Before you begin, ensure that you have a report that will serve as the source reportand another report that will serve as the target report.
Procedure1. In IBM Cognos Report Studio, open the target report.2. Create a parameter that will serve as the drill-through column or that will filter
the report.For example, to drill through or filter Product line, create the followingparameter:[Product line]=?prodline_p?
Tip: Use the operators inor in_rangeto enable the target report to acceptmultiple values or a range of values.
3. In the Usage box, specify what to do when a value for the target parameter isnot passed as part of a drill through:v To specify that users must select a value, click Required.
If a value for the target parameter is not passed, users are prompted tochoose a value.
v To specify that users do not need to select a value, click Optional.Users are not prompted to choose a value and so the value is unfiltered.
v To specify not to use the parameter, click Disabled.The parameter is not used during the drill-through. It will also not be usedin the report for any other purposes.Tip: If the parameter is needed in the report for other reasons, then you canalso specify not to use it in the drill-through definition (Parameters table,Method, Do not use parameter).
Create a drill-through definitionCreate a drill-through definition to link two reports containing related information(the source report and the target report).
Drill-through definitions that have been authored inside an IBM Cognos ReportStudio report appear in the source report as blue underlined links. Users click thehyperlink to select the value they want passed to the target and to drill through tothe target report. If a user selects multiple items within a single column then whenthe drill-through target report is run, the values from each selected row are passedto the target parameters. This occurs as an and condition.
Before you begin
Before you begin, ensure that you have a report that will serve as the source reportand another report that will serve as the target report.
Procedure1. Check the drill-through target:
v Confirm that the drill-through users have access to the target.v If necessary, check what parameters exist in the target.
2. Open the source report.
Chapter 18. Using Drill-through Access 425

3. Click the element in the report that will serve as the starting point for thedrill-through link.You can select a data item that your report users are likely to choose to drillon for more detailed information, such as an Employee Name data item.
Tip: If you are passing only parameter values to the target report, you do nothave to drill on a data item. Instead, you can drill on any object in the report,such as the report title. Therefore, you can drill from outside the context of aquery.
4. Click the drill-through definitions button, or, from the Properties pane,double-click the Drill-Through Definitions property.
5. Click the new drill-through definition button.A drill-through definition is created.
Tip: To change the drill-through name, click the rename button, type the newname, and click OK.
6. On the Target Report tab, click the ellipsis (...) button next to the Report boxand select the drill-through target report.
7. In the Action box, decide how users will view the target report when theyclick the drill-through link in the parent report:v To view the latest data in IBM Cognos Viewer, select Run the report.v To edit an IBM Cognos Query Studio, IBM Cognos Analysis Studio, or IBM
Cognos PowerPlay Studio target, select Edit the report.v To have IBM Cognos Business Intelligence match values from the selection
context with data in the target (dynamic filtering), select Run the reportusing dynamic filtering.Note: If you chose this option, any parameters in the target report are stillused for the drill-through access.
v To view the most recently saved output version of the target report fromIBM Cognos Connection, select View the most recent report.
v To use the default action specified for the report in IBM CognosConnection, select (Default).
8. If the target report contains parameters, then, under the Parameters box, clickthe edit button.Each required and optional parameter defined in the target report appears inthe Parameters dialog box.
9. For each parameter, specify the Method of treatment:v To specify not to pass any value, click (Default).v To specify not to use this parameter, click Do not use parameter.
The target report will not be filtered by this parameter.v To pass values from a data item, click Pass data item value, click Value,
and then click the data item.Values for the selected data item are passed to the target report.
v To pass values from a source report parameter, click Pass parameter value,click Value, and then click the parameter.Values for the selected parameter are passed to the target report.
v If you choose to pass parameters, and the source report is based on adimensional package, then click an item from the drop-down list in the
426 IBM Cognos Report Studio Version 10.2.1: User Guide

Source metadata item properties column. You can pass the default propertyof the source metadata item (business key) or another property, such as themember caption.
10. Click OK.11. If you chose to run the target report, in the Format box, click the output
format for your report.
Tip: Click (Default) to run the report using the default format specified forthe report in IBM Cognos Connection.
12. To open the target report in a new window, select the Open in new windowcheck box.
13. In the Display prompt pages box, choose how to display prompt pages:v To always display prompt pages when the drill-through action occurs
regardless of whether values were specified for the required parametervalues, click Always.
v To use the prompt settings of the target report (specified by the Prompt forValues check box in IBM Cognos Connection, Report Properties, Reporttab) to determine whether to show the prompt pages, click Based on thedefault prompt settings of the target report.
v To not display prompt pages when the required parameter values areprovided by the drill-through definition, click Only when requiredparameter values are missing. This is the default setting.
Results
The drill-through text appears as a blue hyperlink in text items in the non-chartareas of the report. Report consumers can also start the drill-through action byclicking the Go To button or by right-clicking the item and clicking Go To, Relatedlinks. If you have the necessary permissions, you can view which parameters werepassed from the source and how they are mapped in the target object from the GoTo page using the drill-through assistant.
For more information, see the Administration and Security Guide.
Defining independent drill-through definitions for crosstabsBy default, you can create only one drill-through definition for fact cells in acrosstab, regardless of how many facts there are. This topic describes how to definedifferent drill-through definitions for different measures in crosstab fact cells.
For example, a crosstab has Quantity and Revenue as measures. For the Quantitycells, you want to define a drill-through definition to a target report that containsmore information about quantities sold. For the Revenue cells, you want to definea drill-through definition to a different target report that shows details aboutrevenue generated.
Procedure1. Open the source report.
2. On the toolbar, click the unlock icon .3. In the crosstab, click the white space inside one of the fact cells of the measure
for which you want to define a drill-through definition.
Chapter 18. Using Drill-through Access 427

Do not click the measure text. You want to select the crosstab intersection andnot the text item. In the Properties pane title bar, ensure that CrosstabIntersection appears.
4. In the Properties pane, set the Define Contents property to Yes. The text itemin the crosstab intersection disappears.
5. Click the Data Items tab .6. From the crosstab query, drag the measure that disappeared in step 4 to the
empty crosstab intersection.7. Right-click the measure in the crosstab intersection and then click
Drill-Through Definitions.8. Create the drill-through definition.
Results
A drill-through definition is defined for the selected measure. Repeat the steps todefine different drill-through definitions for other measures in the crosstab. Whenusers run the report, clicking values from different measures takes them to adifferent target report.
Specify the Drill-through TextYou can specify the drill-through text that appears when users can drill through tomore than one target.
For example, if users from different regions view the report, you can show text in adifferent language for each region.
Procedure1. Right-click the drill-through object and click Drill-Through Definitions.2. If more than one drill-through definition exists for the object, in the
Drill-Through Definitions box, click a drill-through definition.3. Click the Label tab.4. To link the label to a condition, in the Condition box, do the following:
v Click Variable and click an existing variable or create a new one.v Click Value and click one of the possible values for the variable.
5. In the Source type box, click the source type to use.6. If the source type is Text, click the ellipsis (...) button that corresponds to the
Text box and type text.7. If the source type is Data Item Value or Data Item Label, click Data Item and
click a data item.8. If the source type is Report Expression, click the ellipsis (...) button that
corresponds to the Report Expression box and define the expression.9. If the label is linked to a condition, repeat steps 5 to 8 for the remaining
possible values.
Results
When users run the source report and click a drill-through link, the Go to pageappears. The drill-through text you specified appears for each target. If you did notspecify the drill-through text for a target, the drill-through name is used.
428 IBM Cognos Report Studio Version 10.2.1: User Guide
Example - Drill Through to a Hidden Report from a Report StudioReport
You want to set up a drill-through link from an employee satisfaction reportcreated in IBM Cognos Report Studio to a hidden list report about compensation,also created in Report Studio.
The source report (Employee Satisfaction 2012) is based on the package GO DataWarehouse (analysis) which is modeled on a DMR data source. The target report(Compensation (hidden)) is based on the package GO Data Warehouse (query).You set up this drill-through connection from within Report Studio (report-based,or authored drill through) because you do not want to make a report aboutcompensation available for drill through from any source report in the package.The target report is already hidden in the portal, so that it is unlikely to be run byanyone who does not use the drill through link.
You must have the IBM Cognos Business Intelligence samples from thedeployment zip file IBM_Cognos_DrillThroughSamples installed to follow thisexercise, and you must have access to Report Studio.
The Compensation report is a hidden report. You may be able to set whetherhidden reports are visible (My Preferences, General tab) and whether you canhide reports. This capability is set by your administrator.
Check the Target ReportCheck the target report to make sure the drill-through will work.
Procedure1. Open the target report:
v In IBM Cognos Connection, go to Public Folders, Samples, Models, GOData Warehouse (query), Report Studio Report Samples.
v Locate the report Compensation (hidden) and open it in Report Studio.
Tip: If you do not see the report, go to IBM Cognos Connection and confirmthat you can view hidden reports (My Preferences, General tab).
2. In Report Studio, from the Data menu, click Filters and check what filterparameters are available.You want to filter from the source report on department, not time, so you willonly use the pPosition parameter in the drill-through definition.
3. In the report body, select the list column body Position-department (level 3)and review the data item properties.Because the drill-through definition goes from DMR to relational, the data itemvalues will need to match.
4. Close the Compensation (hidden) report.
Create and Test the Drill-Through DefinitionCreate and test the drill-through definition to make sure it works.
Procedure1. Open the source report:
v In IBM Cognos Connection, go to Public Folders, Samples, Models, GOData Warehouse (analysis), Report Studio Report Samples.
Chapter 18. Using Drill-through Access 429

v Locate the Employee Satisfaction 2012 report and open it in Report Studio.2. Save the Employee Satisfaction 2012 report with a new name, such as
Employee Satisfaction 2012 New.This is to keep the original report and drill-through definition intact forcomparison.
3. In the table Employee rankings and terminations by department, select thecolumn Position-department (level 3).
4. In the properties pane, review the data item properties, to confirm that thedata item names match values in the target report.
5. In the properties pane, under Data, double-click Drill-through definitions.6. Select the definition DrilltoHiddenRep and delete it.
Note: In the following steps, you recreate the drill-through definition. Forcomparison, use the original sample report.
7. In the Drill-through Definitions box, click the new drill-through definitionbutton.
8. Click the rename button, and type a name for the drill-through definition.Tip: This is the name that consumers see when they select from a list ofpossible drill-through definitions in the final report.
9. In the Target Report tab, select the target report:v Under Report, click the ellipsis button (...).v Navigate to GO Data Warehouse (query), Report Studio Report Samples,
and select the Compensation (hidden) report.Tip: If you do not see the report, go to IBM Cognos Connection andconfirm that you can see hidden reports (My Preferences, General tab).
10. Under Action, select Run the report.11. Under Parameters, click the edit button.
A table of parameters available in the target report appears, showing theparameter pPosition.
12. Map the parameter from the Compensation (Hidden) report to the metadatain the Employee Satisfaction 2012 report:v In the Method column, select Pass data item value, because the target
report is based on a relational data source.v In the Value column, select Position-department (level 3).
Tip: In this report, you pass values from the column where thedrill-through is defined. In other cases, you might pass a related parameter.For example, you could drill through on employee name, but pass theemployee number.
13. Save the report.14. Run the report, and click a department to test the drill-through definition.
Results
When you test the drill-through link, the Compensation (hidden) report appears,filtered by the department you selected. The report appears as a drill-throughtarget whether or not it is hidden in IBM Cognos Connection.
If your administrator has given you the Drill Through Assistant capability, thenyou can see additional information you right-click on the link and select Go To seea list of drill-through targets. From the Go To page, you can see what source
430 IBM Cognos Report Studio Version 10.2.1: User Guide

values are passed, and what target parameters are mapped.
Try it yourself - create a report with drill-through access to itselfYou can create a report that drills through to itself so that users can view detailedinformation in the same report.
In this topic, you learn how to create a report that shows revenue by each retailer.Users can access detailed order information for a particular retailer.
It should take 20-25 minutes to complete this topic, and your report will look likethis.
Procedure1. Create a new blank report that uses the GO Data Warehouse (query) package.2. Add a table with two columns and one row.3. Add a list object to each column in the table.4. Open Sales and Marketing (query), then open Sales (query). Add these data
items to the first list:v Retailer name in Retailers
v Revenue in Sales fact
Figure 50. A report with drill-through access to itself
Chapter 18. Using Drill-through Access 431

Tip: Use the Source tab .5. Set the sort order for the Retailer name column to Sort Ascending.6. Add these data items to the second list:
v Retailer name in Retailers
v Order number in Sales order
v Date in Time
v Product in Products
v Quantity in Sales fact
v Revenue in Sales fact
Tip: To simultaneously add all the data items to the list, Ctrl+click the itemsbefore dragging them to the list.
7. In the second list, select the Retailer name list column and in the Propertiespane, set its Render property to No.
8. In the second list, create the following parameterized filter:[Retailer name]=?Selected retailer?
9. Save the report.10. In the left list, right-click the Retailer name column (and not the column title)
and click Drill-Through Definitions.11. Create a new drill-through definition.12. Specify the report as the target report.13. Under Parameters, click the edit button.14. Set the Selected retailer parameter to pass data item values using the Retailer
name data item.15. In the Toolbox tab, add a value prompt under the table.
Because you are setting up drill-through access to the same report, you mustadd a prompt with a default value so that users are not prompted when theyrun the report.
16. In the Prompt Wizard, specify that the prompt is to use the existing parameternamed Selected retailer, and click Finish.
17. Click the value prompt.18. In the Properties pane, double-click the Default Selections property and add
a simple selection named NoRetailer.19. Set the following properties:
v Required to No
v Hide Adornments to Yes
v Visible to No
20. Create a title for the report.a. In the Toolbox tab, add a block above the table.b. Click the block and, in the Properties pane, set the class to Report title
area.c. Insert a text item above the table. Type the following text, adding a blank
space at the end:Order Details:
d. In the Toolbox tab, add the following layout calculation immediatelyfollowing the text item:
432 IBM Cognos Report Studio Version 10.2.1: User Guide

if(ParamDisplayValue(’Selected retailer’)=’NoRetailer’)then ’All Retailers’ else (ParamDisplayValue(’Selected retailer’))
When the report runs, the report title changes to reflect the retailer selectedby the user. If no retailer is selected, 'All Retailers' appears.
e. Click the text item and the layout calculation and, in the Properties pane,set the class to Report title text.
21. Pause the pointer over the condition explorer button and click Variables.Use conditional formatting to show a message above the second list whenusers have not selected a retailer from the first list.
22. Create a Boolean variable named HighLevel:ParamDisplayValue('Selected retailer')<>'NoRetailer'
23. Pause the pointer over the page explorer button and click Page1.24. In the Toolbox tab, add a block above the second list.25. Insert a text item in the block with the following text:
Select a retailer in the Retailer list to view order details
26. Set the font style for the text to bold.27. Click the text item and, in the Properties pane, set the Style Variable property
to the HighLevel variable.28. Pause the pointer over the condition explorer and click the Yes value for the
HighLevel variable.29. Set the Visible property for the text item to No.30. Triple-click the explorer bar to turn off conditional formatting.31. Run the report to view what it will look like for your users.
Results
A list appears on the left that shows revenue for each retailer. When users click aretailer, order information for the selected retailer appears in the second list. Toreturn to the original report, in IBM Cognos Viewer, click Previous Report.
For more information, see the following references:v “Using a table to control where objects appear” on page 339v Add Relational Data to a Reportv Create a Parameter to Produce a Promptv Set Up Drill-through Access in a Reportv Create a Prompt Directly in a Report Pagev Using Calculationsv Calculation Componentsv Add a Variablev Hide and Show Objects
Drilling Through from IBM Cognos Series 7 to IBM Cognos BIYou can set up drill-through access from IBM Cognos Series 7 to IBM CognosBusiness Intelligence. Specifically, you can drill through to an IBM Cognos BIreport from an IBM Cognos Series 7 PowerPlay Web report or IBM Cognos Series 7Visualizer report. Drill through is supported for both PowerCubes and other cubes.
You must complete steps in both IBM Cognos Series 7 and IBM Cognos BI toenable drill through. Refer to the IBM Cognos Series 7 documentation for the
Chapter 18. Using Drill-through Access 433

specific steps you must complete in the IBM Cognos Series 7 components. Crossreferences to the appropriate IBM Cognos Series 7 documents are included below.
Setting Up Drill-through Access from IBM Cognos Series 7Visualizer
Setting up drill-through access from IBM Cognos Series 7 Visualizer to IBMCognos Business Intelligence involves setting up the target report.
To set up drill-through access, you must do the following:v Specify the IBM Cognos BI target and select the filters to add to the target
report.You must configure drill through to IBM Cognos BI for individual IBM CognosVisualizer reports. For more information, see the IBM Cognos Visualizer UserGuide.
v Create and test the target report.
Setting Up Drill-through Access from PowerPlay WebSetting up drill-through access from IBM Cognos Series 7 PowerPlay Web to IBMCognos Business Intelligence involves setting up target reports.
To set up drill-through access, you must do the following:v For PowerCubes, specify drill-through targets for IBM Cognos BI reports in the
Transformer model.For more information, see the Transformer documentation.
v For other cubes, specify drill-through targets for IBM Cognos BI reports in IBMCognos Series 7 PowerPlay Connect.For more information, see the PowerPlay OLAP Server Connection Guide.
v Configure drill-through access in PowerPlay Server Administration.In addition to enabling drill-through access to IBM Cognos BI, you must specifythe location of the IBM Cognos BI server and the IBM Cognos BI folder thatcontains the target reports. For more information, see the PowerPlay EnterpriseServer Guide.
v Select the filters to add to the target report.In PowerPlay Enterprise Server Administration, enable and use IBM Cognos BIAssistance to identify the filter expressions required in the target report. Formore information, see the PowerPlay Enterprise Server Guide.
v Create and test the target report.
Create and Test the Target for a Series 7 ReportYou can create and test an IBM Cognos Series 7 report target to ensure thedrill-through works properly.
When you create the target report, ensure that the names of the parameters youadd are identical to the parameter names listed in the Drill Through Assistantpage in IBM Cognos Series 7. However, the metadata item that you use in thetarget report for that parameter name does not have to be the identical label. Thedata values between the target parameter and the source value shown in the drillassistant must match. You may also need to change the type of operator in thetarget parameter from what is recommended in the Drill Through Assistant. Forexample, if the assistant recommends an = operator but you want to pass a daterange, you should change the parameter operator in the target to in_range.
434 IBM Cognos Report Studio Version 10.2.1: User Guide

Before you begin
The target report must be based on a published package that contains the metadataitems that you want to filter on, or contains items that are mapped to thosemetadata items.
Procedure1. Start IBM Cognos Report Studio and create a new report.2. Add the data items and other objects you want.3. From the Data menu, click Filters.4. In the Detail Filters tab, click the add button.5. In the Expression Definition box, create the parameterized filter you want by
typing the filter expression.6. Click OK.7. In the Usage box, click Optional.
If you do not make the filter optional, a prompt page appears when you drillthrough to the report.
8. Repeat steps 4 to 7 for other parameterized filters you want to add.9. Save the report.
The report name must match what you specified as a target in thePowerCube, other cube, or IBM Cognos Series 7 Visualizer report.
10. Test the drill through in the IBM Cognos Series 7 PowerPlay report or IBMCognos Visualizer report.
Chapter 18. Using Drill-through Access 435

436 IBM Cognos Report Studio Version 10.2.1: User Guide

Chapter 19. Working with Multiple Pages
Divide a report into multiple pages and add navigation elements to make it easierto use.
Note: The pages that you see in the Page Explorer differ from physical, printedpages. For example, if you create page breaks in a long report, the Page Explorercould show only one page, but your report could include several physical pageswhen you print it.
Add a Page to a ReportReports may contain pages with a variety of content. Pages may be added to createa multiple-page report. For example, you are creating a sales report and you wantto include general information about the company. You decide to create anintroduction page to show this information. When you run the report, page 1 ofthe report is the introduction page and the following pages contain data.
Tip: The TOC Report sample report in the GO Data Warehouse (query) packageincludes multiple pages. For more information about The Sample OutdoorsCompany samples, see Appendix C, “Sample Reports and Packages,” on page 507.
You can also create page sets to control the rendering of pages in a report.
Procedure
1. Pause the pointer over the page explorer button and click Report Pages.
Tip: Click Prompt Pages to add a prompt page.
2. From the Toolbox tab , drag Page to the work area.3. To change the order of pages, drag pages above or below other pages.4. To associate a query to the page, in the Properties pane, set the Query property
to the query.Associate the page to a query to add data-related objects directly to the pageheader, body, or footer, such as data items and filters.
5. Double-click the page to open it in page design view.6. Add objects to the page.
Create a Page Break or Page SetYou can create simple page breaks, or you can create advanced page sets toassociate pages with a query structure to force page breaks.
For example, a query contains the data item Product line, which is grouped.Creating a page set that is associated with this query adds page breaks for eachproduct line. When working with dimensional data, you can use the Page layersarea to show values on a separate page for each member.
When you are working with dimensional data, IBM Cognos Report Studio doesnot support page breaks or page sets that are based on custom groups.
© Copyright IBM Corp. 2005, 2013 437
Tip: The Global Bonus Report sample report in the GO Data Warehouse (analysis)package includes page sets. For more information about The Sample OutdoorsCompany samples, see Appendix C, “Sample Reports and Packages,” on page 507.
Create simple page breaksSimple page breaks use data items to define where your report starts a new page.
Procedure1. Click the data item at which the report should break to a new page.2. From the Structure menu, do one of the following:
v To create a page break without creating a master detail relationship, click SetPage Break.This option only works if the data item is in a list or repeater. If the dataitem is in a crosstab or chart, IBM Cognos Report Studio creates a page breakusing a master detail relationship. Setting page breaks without using masterdetail relationships can improve performance when running the report.
v To create a page break using a master detail relationship, click Set PageBreak Using Master/Detail.
Report Studio confirms the page break setting.Tip: To modify simple page break settings, pause the pointer over the page
explorer button and click Report Pages, and then select and modify thepage set.
Create advanced page setsYou can use advanced page sets to define sets of pages within your report, andthen customize the grouping and sorting for each page set.
Procedure
1. Pause the pointer over the page explorer button and click Report Pages.2. Create the report pages.
3. From the Toolbox tab , drag the Page Set object to the Report Pages pane.4. In the Properties pane, set the Query property to the query to associate with
the page set.5. Organize the pages in the report by dragging report pages to page sets.6. Insert the page containing details in the Detail Pages folder.
Detail pages are the pages that repeat based on the items by which you groupin the following step.
Tip: You can insert multiple detail pages into the same page set and link themusing a master detail relationship.
7. Define the grouping structure for the page set:v Click the page set.v In the Properties pane, double-click the Grouping & Sorting property.v In the Data Items pane, drag the data item by which to group data items to
the Groups folder in the Groups pane.v To sort the data within each group, in the Data Items pane, drag the data
item by which to sort to the Detail Sort List folder, and then click the sort
438 IBM Cognos Report Studio Version 10.2.1: User Guide

order button to specify the sort order. For more information aboutsorting data, see “Sorting Relational Data” on page 235 or “SortingDimensional Data” on page 281.
Note: Grouping an item for a page set is not the same as grouping a column inthe layout. Grouping a column in the layout visually shows groups in a report.Grouping an item for a page set groups the item in the query. If you want touse an item that is already grouped in the layout, you must still perform step 7.
8. Repeat steps 3 to 7 to create other page sets.
Tip: You can nest page sets and join them by defining a master detailrelationship. Create nested page sets to have pages occur within other pages.For example, you want pages containing product type information to occurwithin pages containing product line information.
Join Nested Page SetsIf you have nested page sets in your report, define a master detail relationshipbetween them to see data in the nested page set that is related to the data in theparent page set.
For example, you have a page set that shows pages of product line information.The page set contains a nested page set that shows pages of product typeinformation. For each product line page, you want to see the related product typepages, as shown below:
Product line_1v Product type_1v Product type_2v Product type_3
Product line_2v Product type_4v Product type_5v Product type_6
For more information about master detail relationships, see “Create a Master DetailRelationship” on page 292.
Procedure
1. Pause the pointer over the page explorer button and click Report Pages.2. In the Report Pages pane, click the nested page set.3. In the Properties pane, double-click the Master Detail Relationships property.4. Click the New Link button.5. In the Master Query box, click the data item that provides the primary
information.6. Link the master data item to the details by doing one of the following:
v To link to another data item in the detail query, in the Detail Query box,click the data item that provides the detailed information.
Chapter 19. Working with Multiple Pages 439

v To link to a parameter, in the Parameters box, click the parameter thatprovides the detailed information.
7. Repeat steps 4 to 6 to create other links.
Tip: To delete a link, select it and press the Delete key.
Example - Preparing a Product List ReportYou are a report author at The Sample Outdoors Company, which sells sportingequipment. You are requested to create a multiple-page report showing allproducts sold by the company. You are asked to create title and end pages and tohave each product line appear on a new page preceded by a header page andfollowed by a footer page.
Procedure1. Open IBM Cognos Report Studio with the GO Data Warehouse (query)
package.2. In the Welcome dialog box, click Create a new report or template.3. In the New dialog box, click List and click OK.
4. From the Source tab , expand Sales and Marketing (query), Sales(query), and Product, and double-click the following:v Product line
v Product type
v Product name
5. Expand Sales fact and double-click Product cost.6. Group the Product line and Product type columns.
7. Pause the pointer over the page explorer button and click Report Pages.
8. From the Toolbox tab , drag Page Set to the work area and associate it toQuery1.
9. From the Toolbox tab, drag Page to the work area four times to add four newpages.
10. For each page, click the page, and in the Properties pane, set the Nameproperty as follows:v Title page
v End page
v Product Line Header
v Product Line Footer
11. For each page you just created, add objects.For example, add a text item to each page to uniquely identify it.
12. Rename the Page1 page, which contains the list, to List.13. Click the page set and, in the Properties pane, double-click the Grouping &
Sorting property.14. In the Data Items box, drag Product line to the Groups folder in the Groups
box and click OK.15. Organize the report pages into the following hierarchy by dragging them to
the appropriate location.
440 IBM Cognos Report Studio Version 10.2.1: User Guide

Results
When you run the report, the following pages appear:v Title pagev Product line header pagev A page for Product line_1v Product line footer pagev Product line headerv A page for Product line_2v Product line footerv ...v End page
Add a BookmarkAdd a bookmark so that users can quickly move from one part of a report toanother. For example, a list report contains many rows of data. You addbookmarks so that users can move to specific rows.
You can also drill through to another report.
If you want to use page numbers to move from one part of a report to another,you can also create a table of contents.
Bookmarks work for reports produced in HTML format or PDF. In HTML format,they work best when viewing saved report outputs, as the entire report appears ina single HTML page. When reports are run interactively, more than one HTMLpage may be generated, and a bookmark works only if the target exists in the pagecurrently being viewed.
If you run a saved report using a URL, and you specify a bookmark within theURL, you always go to the first page of the report. The bookmark defined in theURL is not honored. For more information about using URLs to run reports, seethe Administration and Security Guide.
Tip: You can reduce the number of HTML pages generated when a report is runinteractively by specifying a value for the Rows Per Page property for a datacontainer in the report.
Figure 51. Page hierarchy showing title page, page set1, product line, product line header,detail pages, list, product line footer, and end page
Chapter 19. Working with Multiple Pages 441

Tip: The Briefing Book sample report in the GO Sales (analysis) package includesbookmarks. For more information about The Sample Outdoors Company samples,see Appendix C, “Sample Reports and Packages,” on page 507.
Procedure
1. From the Toolbox tab , drag a Bookmark object to the report.2. Click the bookmark and, in the Properties pane, set the Source Type property
to a source type.
Source type Description
Text Creates a static bookmark using a text value.
For example, a list has sections and youwant users to jump from each section to thetop of the report.
Report Expression Creates a dynamic bookmark whose valuesare derived from an expression that youdefine.
Data Item Value Creates a dynamic bookmark that has dataas possible values. This is useful for creatinga context-based bookmark.
For example, a list has sections and youwant users to jump from the top of thereport to a specific section.Note: This source type appears only if thebookmark is inserted next to a data item.
Data Item Label Creates a bookmark that has the label of adata item as its value. Use this source typeto jump to the first occurrence of a data itemlabel.
For example, a list is divided into sectionsusing Product line. You want users to jumpto the first product line section that appearsin the list rather than to a specific section,such as Camping Equipment.Note: This source type appears only if thebookmark is inserted next to a data item.
Member Caption In a crosstab, creates a dynamic bookmarkthat uses member captions as possiblevalues.
Cell Value In a crosstab, creates a dynamic bookmarkthat uses cell values as possible values.
3. Set the property that appears under the source type you chose to the bookmarkvalue.For example, if the source type is Data Item Value, set the Data Item Valueproperty to the data item.
4. Right-click the object that will jump to the bookmark and click Drill-ThroughDefinitions.For example, right-click a data item, image, chart, or text item.
Tip: The object can exist in a different report, so you can jump from one reportto another.
442 IBM Cognos Report Studio Version 10.2.1: User Guide

5. Click the new drill-through definition button .6. Click the Bookmark tab.7. Click Source type and click one of the source types described in step 3.
Click the source type to use to produce the value needed to jump to thebookmark. For example, click Data Item Values if you want the value to comefrom a data item such as Product line.
8. If you clicked one of the following source types, specify the value to use tojump to the bookmark.v For Text, click the ellipsis (...) button next to Text and type a text value.v For Data Item Value or Data Item Label, in the Data item list, choose a data
item.v For Report Expression, click the ellipsis (...) button next to Report
expression and define the expression.
Create a Table of ContentsYou can create a table of contents that appears in the rendered output of yourreport. A table of contents is useful for reports that include sectioned items,grouped items, or multiple pages in the layout. The report output indicates pagenumbers and allows for easy navigation.
You can include multiple tables of contents in your report, which are useful if yourreport contains grouped lists. You can also add section numbers in front of entriesin the table of contents by modifying the heading level property.
Table of contents entries are logical markers placed anywhere in a report. Forexample, you can place entries at the top of a page or in a list group header tomark each grouped data value. Although table of contents entries are visible inIBM Cognos Report Studio, they cannot be seen when a report is run.
A table of contents works only for reports produced in PDF or non-interactiveHTML format. In HTML format, they work best when viewing saved reportoutputs, as the entire report appears in a single HTML page. When reports are runinteractively, more than one HTML page may be generated, and a table of contentsworks only if the target exists in the page currently being viewed.
Tip: You can reduce the number of HTML pages generated when a report is runinteractively by specifying a value for the Rows Per Page property for a datacontainer in the report.
If you want to quickly move from one part of a report to another without usingpage numbers, you can add bookmarks.
Tip: The Briefing Book sample report in the GO Sales (analysis) package includes atable of contents. For more information about The Sample Outdoors Companysamples, see Appendix C, “Sample Reports and Packages,” on page 507.
Before you begin
You must first create a table of contents before adding entries in the report. Allentries must be inserted after the table of contents in the report layout.
Chapter 19. Working with Multiple Pages 443

Procedure
1. From the Toolbox tab , drag the Table of Contents object to the newlocation, which can be anywhere in the report.A table of contents placeholder appears.
2. Drag the Table of Contents Entry object to the location of your first table ofcontents marker.
Tip: You can also click Insert Table of Contents Entry from the Structuremenu.The new entry appears in the table of contents.
3. Double-click the Double click to edit text box of the new marker.4. In the Text box, type the text to appear in the table of contents and click OK.5. To edit the heading level of a table of contents entry, click the entry and, in the
Properties pane, set the Heading Level property to the level.The heading level is used to insert section numbers in front of entries in thetable of contents using layout calculations.
6. When you finish creating the table of contents, run the report. By clicking thearrow to the right of the run report button, you can specify whether to run thereport as HTML or PDF.
Example - Add a Table of Contents to a ReportYou are a report author at The Sample Outdoors Company, which sells sportingequipment. You are requested to add a table of contents to an existing report sothat users can more easily navigate your report.
Procedure1. Open IBM Cognos Report Studio with the GO Data Warehouse (analysis)
package.2. Open the Budget vs. Actual sample report from the Report Studio Report
Samples folder.3. Create the report pages:
v Pause the pointer over the page explorer button and click ReportPages.
v Click Page1, and then, in the Properties pane, set the Name property toBudget vs. Actual Sales.
v Click the Budget vs. Actual Sales page and, from the Edit menu, clickCopy.
v From the Edit menu, click Paste to paste the copy of the page in the ReportPages pane.
v Select the new page, and in the Properties pane, set the Name property toTable of Contents.
v In the Report Pages pane, drag the Table of Contents page to the top of thelist.
4. Pause the pointer over the page explorer button and click Table of Contents.5. Delete the crosstab object:
v Click somewhere in the report page.
v In the Properties pane, click the select ancestor button and clickCrosstab.
444 IBM Cognos Report Studio Version 10.2.1: User Guide

Tip: You can also click the container selector (three orange dots) of thecrosstab to select it.
v Click the delete button .6. Select the Camping Equipment block object and click the delete button.7. Double-click the report title, type Table of Contents, and click OK.
8. From the Toolbox tab , drag a Table of Contents object onto the page.9. Pause the pointer over the page explorer button and click Budget vs. Actual
Sales.10. From the Toolbox tab, drag a Table of Contents Entry object to the left of
each region.11. Pause the pointer over the page explorer button and click Table of Contents.12. Double-click the first entry in the table of contents, type Americas, and click
OK.13. Rename the other table of contents entries as Asia Pacific, Northern Europe,
Central Europe, and Southern Europe.14. Save the report.15. Number the table of contents entries:
v From the Toolbox tab, drag a Layout Calculation object to just before theword Americas.
v In the Report Expression dialog box, on the Functions tab , expand theReport Functions folder and double-click the TOCHeadingCountexpression.
v At the end of the expression definition, type 1) and click OK.v Repeat the above three steps to add layout calculations before the other
table of contents entries.v Ctrl+click only the five table of contents entries and not the five layout
calculations.v In the Properties pane, double-click the Padding property and set the left
padding to 10 px.16. Change the color of table of contents entries:
v Ctrl+click the five layout calculations, the five table of contents entries, andthe five page number calculations.
v In the Properties pane, double-click the Foreground Color property and setthe foreground color to blue.
17. Add links to the table of contents from another page:v From the Toolbox tab, drag a Bookmark object to just before the title.v Select the bookmark and, in the Properties pane, double-click the Label
property, type TOC, and click OK.
v Pause the pointer over the page explorer button and click Budget vs.Actual Sales.
v From the Toolbox tab, drag a Text Item object to the right of the crosstabobject.
v In the Text dialog box, type Return to the Table of Contents and click OK.v Right-click the text object and click Drill Through Definitions.
v Click the add button .
Chapter 19. Working with Multiple Pages 445

v On the Bookmark tab, in the Source Type list, click Text.v Click the ellipsis (...) button, type TOC, and then click OK twice.
18. Save the report.
19. Click the arrow to the right of the run report button and click RunReport - PDF.
Results
On the first page, the table of contents appears. Clicking a region brings you to thecorresponding page in the report. You can return to the table of contents byclicking Return to the Table of Contents at the end of the last page.
Insert Page Numbers in a ReportYou can insert page numbers in a report and specify the number style to use.
You can select a predefined page numbering scheme or create a custom scheme.You can easily insert page numbers using the Page Number object.
You can also manually create an expression to insert page numbers by inserting alayout calculation and using the different page report functions in the expressioneditor.
Procedure
1. From the Toolbox tab , drag Page Number to the report.
Tip: When you create a new report using one of the existing report layouts,Page Number is already inserted in the page footer.
2. Right-click the page number symbol and click Edit Number Style.3. Choose the style to use.
The first three choices apply only to vertical page numbers. The remainingchoices specify how vertical and horizontal page values appear.
Note: The 1 of 3 number style works only for reports produced in PDF ornon-interactive HTML format. In HTML format, the 1 of 3 number style workswhen viewing saved report outputs, as the entire report appears in a singleHTML page.
4. If you want to customize the choice that you made in the previous step, click
the edit button , make your changes, and click OK.A custom number style is created. If you later choose a different number style,the custom style is removed from the list.
446 IBM Cognos Report Studio Version 10.2.1: User Guide

Tip: In the Custom Number Style dialog box, when you pause the pointerover a box, a tooltip describes how that box affects page numbers. For example,the Separator Text box contains the text, such as a hyphen, that separates pagevalues for both vertical and horizontal pages.
Control Page Breaks and Page NumberingYou can control page breaks and page numbering in a list, crosstab, table, or reportpage by choosing any of these options.
The options that are available depend on which object you have selected. All theoptions for all the objects are described in the following table.
Option Description
Keep with header Keeps all headers on the same page with thenumber of detail rows specified.
Keep with footer Keeps all footers on the same page with thenumber of detail rows specified.
Keep with previous Keeps the object with the specified numberof preceding objects on the same page, ifspace permits.
Keep with next Keeps the object with the specified numberof subsequent objects on the same page, ifspace permits.
Reset page count Resets the page count after a page break tothe value specified.
Reset page number Resets the page number after a page breakto the value specified.
Repeat every page If the report renders multiple pages, thisobject is repeated on every page.
Allow contents to break across pages Allows contents to break across pages. Inlists and crosstabs, controls whether a cell isbroken across pages, which is useful whenthere is a lot of text.
Chapter 19. Working with Multiple Pages 447

Option Description
Allow horizontal pagination In PDF output, allows the columns of a listor crosstab to break across horizontal pagesif they do not fit on a single page.Tip: In lists, you can select the Repeat everypage option for list columns that show onevery horizontal page.
If the Allow horizontal pagination option isnot selected, the size of the list or crosstab isscaled down when necessary so that it fitson a single page.Tip: The Horizontal Pagination samplereport in the GO Sales (analysis) packageincludes horizontal pagination. For moreinformation about The Sample OutdoorsCompany samples, see Appendix C, “SampleReports and Packages,” on page 507.
If your report includes nested data framessuch as a list within a list, horizontalpagination is supported on either the parentor child frame, but not both. If horizontalpagination is enabled on both the parent andchild frame, it will be ignored on the childframe when the report runs. We recommendthat you do not enable horizontal paginationon both the parent and child frames.Horizontal pagination is not supported fordata containers, such as a list or crosstab,that are nested in repeater tables.
You can also specify page number optionsthat use compound numbering schemes. Forexample, you can use the numbering scheme1-1, 1-2, 2-1, 2-2, and so on. For moreinformation, see “Insert Page Numbers in aReport” on page 446.
Enable horizontal page numbering Increments page numbers of horizontalpages separately from the main pagenumbers when you select a page numberingstyle that includes horizontal pages. Forexample, if a page has three page breakshorizontally and you selected the pagenumber style 1a, the horizontal pages arenumbered 1a, 1b, and 1c. If you did notselect a numbering style that includeshorizontal pages, the horizontal pages are allnumbered 1 for the first vertical page, 2 forthe second vertical page, and so on.
If this option is not selected and there arehorizontal pages, all pages are numberedsequentially. For example, if a report hastwo vertical pages and three horizontalpages, the PDF pages are numbered from 1to 6. Pages 1 to 3 are the three horizontalpages for the first vertical page and pages 4to 6 are the three horizontal pages for thesecond vertical page.
448 IBM Cognos Report Studio Version 10.2.1: User Guide

Option Description
Allow row contents to break across pages In tables, allows the contents of a row tobreak across pages. For example, if a rowcontains four lines of text, the first two linesfrom the row appear on the first page, andthe last two lines appear on the next page.
Repeat table rows on page break In tables, if a row breaks across pages,repeats the rows that were previouslyrendered on each page. By default, tablerows are repeated.Note: This option applies to saved reportsonly. In interactive HTML reports, tablerows are always repeated even if this optionis not selected.
You can also specify the style to use for page numbers.
Procedure1. Click an object.2. In the Properties pane, double-click the Pagination property.3. Specify the page break and numbering options.
Create Page LayersWhen working with dimensional data, you can create page layers in a report toshow values for each member on a separate page. For example, your reportcontains payroll information for the entire company. You want to view values foreach department on a separate page.
After you create page layers, a caption appears in the header to indicate thecontents of each page. You can navigate between the different pages using linksbelow the report.
Creating page layers is similar to filtering using context. However, with contextfilters, values are filtered according to the member you add to the Context filterarea. With page layers, the report is split into a separate page for each child of themember you add to the Page layers area.
To create more complex page layers in your reports, such as a report book withtitle and end pages, create page sets.
Procedure1. In the source tree, select or search for one or more items on which to filter.2. Drag the item into the Page layers section of the overview area.
The crosstab shows the results for the children of the selected item on separatepages, and a list appears under Page layers.
Tip: To navigate between pages, click Page down and Page up below thereport.
3. To replace the page breaks with items from the same dimension, select an itemfrom the list. To delete the page breaks, from the list, click Delete. To delete allthe page breaks, right-click the Page layers area and click Delete All.
Chapter 19. Working with Multiple Pages 449

450 IBM Cognos Report Studio Version 10.2.1: User Guide

Chapter 20. Creating Report Templates
A report template is a pattern you use to build reports. Create your own reporttemplates when you frequently produce the same type of report.
Tip: You can add your own report templates to the New dialog box that appearswhen you open IBM Cognos Report Studio. For more information, see the IBMCognos Business Intelligence Administration and Security Guide.
Convert a Report to a TemplateConvert a new or existing report to a template so it can be reused. You can usesample reports provided with IBM Cognos Report Studio.
Procedure1. Create a new report or open an existing report.2. Add objects to the work area.3. From the File menu, click Convert To Template.
Any query-related information in the original report, such as data items,calculations, and filters, is removed from the template.
4. From the File menu, click Save As to save the template as a new file and keepthe original report intact.
Create a New TemplateCreate a new template to provide report authors with a layout that they can use tocreate reports or they can apply to existing reports. IBM Cognos Query Studio andIBM Cognos Analysis Studio users can also use these templates. You can also usethe template in Query Studio to define a layout for prompt pages.
When you create a new template, the Source tab is empty; you can add onlyreport objects.
Procedure1. From the File menu, click New.2. Click Report Template and click OK.
3. Pause the pointer over the page explorer button and click the report pageor prompt page to format.
Tip: To create a new report page or prompt page, click the Report Pages orPrompt Pages folder and drag the page to the Report Pages or Prompt Pagespane.
4. From the Toolbox tab , add the objects to the work area.
Note: If you add objects that are not supported by Query Studio, the objectswill be ignored when you apply the template.
5. Save the template.
© Copyright IBM Corp. 2005, 2013 451

452 IBM Cognos Report Studio Version 10.2.1: User Guide

Chapter 21. Managing Existing Reports
After you have created a report, you can make changes or enhancements, such assetting up the report for bursting.
Before you modify an existing report, ensure that you have the proper securitypermissions. For more information, see the IBM Cognos Business IntelligenceAdministration and Security Guide.
Copy a Report to the ClipboardYou can copy a report specification to the clipboard so you can open it from theclipboard later.
This process is different for the Microsoft Internet Explorer and Mozilla FirefoxWeb browsers because the clipboard works differently in each Web browser.
Copy a Report to the Clipboard in Internet ExplorerThis process is different for the Microsoft Internet Explorer and Mozilla FirefoxWeb browsers because the clipboard works differently in each Web browser.
Procedure
From the Tools menu, click Copy To Clipboard.
Copy a Report to the Clipboard in FirefoxThis process is different for the Microsoft Internet Explorer and Mozilla FirefoxWeb browsers because the clipboard works differently in each Web browser.
Procedure1. From the Tools menu, click Copy To Clipboard.2. In the Copy Report to Clipboard dialog box, copy the entire report
specification.3. Open a text editor and paste the report specification.4. Copy all the text from the text editor report specification.
Now the text is saved on your computer's clipboard.
Open a Report from the ClipboardYou can open a report specification that was previously copied to the clipboard.
To copy a report to the clipboard, see “Copy a Report to the Clipboard.” This isuseful for importing an XML report specification from outside the IBM CognosBusiness Intelligence environment.
Although IBM Cognos Report Studio attempts to validate the report specification,it is your responsibility to ensure that it is correct. For more information, see theIBM Cognos Software Developer Kit Developer Guide.
© Copyright IBM Corp. 2005, 2013 453

Procedure
From the Tools menu, click Open Report from Clipboard.
Open a File from Another StudioYou can open reports, templates, or analyses that were created in IBM CognosQuery Studio or IBM Cognos Analysis Studio in IBM Cognos Report Studio. Allthe capabilities of Report Studio are available to you so you can change formatting,layout, calculations, and queries.
You can also open a report, template, or analysis in Report Studio from IBM
Cognos Connection with the Open with Report Studio action .
Note: If you make and save changes to a Query Studio report or an AnalysisStudio analysis in Report Studio, the report or analysis can no longer be opened inQuery Studio and Analysis Studio.
Procedure1. From the File menu, click Open.2. Click the report, template, or analysis.3. Click Open.
Analysis Studio Query SpecificationIBM Cognos Analysis Studio defines each group of rows and columns as a set.When you import an analysis into IBM Cognos Report Studio, the report will haveone query that processes all the sets found on the crosstab. Each set is defined bydata items that segment and summarize the base set definition. To maintain reportsconverted from Cognos Analysis Studio, you must understand what each of theseitems represents and how they relate to each other.
Before you modify any of the data items in the Cognos Analysis Studio setdefinitions, we recommend that you fully understand each data item and itsdependencies. Modifying the data items may cause unpredictable results and mayslow the performance of your report.
The data items for a set specify the following:v the set definitionv set segments, including which members were excluded and hidden individuallyv filter rules for defining which members are to be retrievedv calculations for Subtotal (N items), More & Hidden, Subtotal (included), Subtotal
(excluded), and the totalFor more information, see the IBM Cognos Analysis Studio User Guide.
v which subtotals should appearv any user-defined calculations
454 IBM Cognos Report Studio Version 10.2.1: User Guide

The default measure identifies which measure is the default for the crosstab orchart. If no default measure is specified, the default measure may be empty.
Set Definitions
The following table shows the definitions and dependencies for the data items inthe set definition.
Data item Definition Dependencies
<set name> (base) Defines the set of membersto be used for sorting,filtering, and summaryoperations. This data itemprovides a generic referencefor all other data items andmay reference one of theother set definitions.
None
<set name> (level) Identifies the level for alevel-based set.
None
<set name> (list) Defines the list of membersin a selection-based set.
None
<set name> (depth N) Defines the set of membersat N, number of levels down.
None
<set name> (named set) References a predefined set. None
Set Segments Definitions
The following table shows the definitions and dependencies for the data items inthe set segment definition.
Figure 52. Components of a Cognos Analysis Studio crosstab
Chapter 21. Managing Existing Reports 455

Data item Definition Dependencies
<set definition> (hidden list) Lists the members that aremanually hidden using theHide command in CognosAnalysis Studio. This setappears when you try tounhide a member.
<set definition>
<set definition> (included set) Lists the set of members afterfilters are applied andhidden items are excluded,but before the More limit isapplied. Sort or orderoperations, if any, aredefined in this data item.
<set definition> (hidden list)
<set definition> (visible itemsset)
Limits the set to show thenumber of membersaccording to the More limitwith a small tolerance. Thetolerance allows showing thelast two members if they areall that remain in the Moreportion of the set.
The choice of visiblemembers can be based on asort order.
<set definition> (included set)
<set definition> (excluded list) Identifies members that weremanually excluded from theanalysis. If no members weremanually excluded, theexpression defines anemptySet. This set appearswhen you try to remove amember from the Excludeditems list in the Propertiespane.
<set definition>
Filters
The following table shows the definitions and dependencies for the data items inthe filter.
Data item Definition Dependencies
<set definition> (filter rules) Specifies the user-definedfilter rules to reduce the setdefinition using operatorssuch as greater than or lessthan based on measures,calculations, or attributes.
<set definition>
456 IBM Cognos Report Studio Version 10.2.1: User Guide

Data item Definition Dependencies
<set definition> (excludedfilters)
Removes members that weremanually excluded from theresults after applying theuser-defined rules.
<set definition> (excludedlist), <set definition> (filterrules)
<set definition> (filter topbottom)
Focuses on the membersbased on top / bottom / firstn where n can be a count ora percentile. For moreinformation aboutTop/Bottom filters, see theIBM Cognos Analysis StudioUser Guide.
<set definition> (excludedfilters) and totals for sets onthe opposite axis
<set definition> (filter rules) Specifies the user-definedfilter rules to reduce the setdefinition using operatorssuch as greater than or lessthan based on measures,calculations, or attributes.
<set definition>
Subtotals and Related Conditions
The following table shows the definitions and dependencies for the data items inthe subtotals and related conditions.
Data item Definition Dependencies
<set definition> (subtotal) Aggregates the visible itemsin the set.
<set definition> (visible itemsset)
<set definition> (subtotaldisplay)
Shows the subtotal if thenumber of included items isgreater than the number ofvisible items.
<set definition> (visible itemsset), <set definition> (includedset), <set definition> (subtotal)
<set definition> (more andhidden subtotal)
Calculates the More &hidden subtotal bysubtracting the aggregationof the included membersfrom the aggregation of thosemembers that were manuallyhidden or hidden byexceeding the maximumdisplay limit. Not availablefor selection-based sets.
<set definition> (included set),<set definition> (visible itemsset), <set definition>
<set definition> (more andhidden subtotal as set)
Converts the More & hiddensubtotal member to a set foruse in set operations.
<set definition> (more andhidden subtotal)
<set definition> (more andhidden subtotal as member)
Generically references theMore & hidden subtotal.
<set definition> (more andhidden subtotal)
Chapter 21. Managing Existing Reports 457

Data item Definition Dependencies
<set definition> (more andhidden subtotal display)
Shows the More & hiddensubtotal if the number ofitems hidden or clipped isgreater than zero.
<set definition> (more andhidden subtotal)
<set definition> (includedsubtotal)
Calculates the Subtotal(included). Forselection-based sets, this dataitem references the summarydata item for the set.
<set definition> (included set)
<set definition> (includedsubtotal display)
Shows the Subtotal(included) if any memberspassed the filter criteria.
<set definition> (included set)
<set definition> (excludedsubtotal)
Calculates the value forSubtotal (excluded). Thisdata item is not available forselection-based sets.
<set definition> (total), <setdefinition> (includedsubtotal), <set definition>
<set definition> (excludedsubtotal display)
Shows Subtotal (excluded) ifthe number of members inthe filtered set is less thanthe base set. This means thatthe filter rule is filtering outsomething.
<set definition> (excludedsubtotal), <set definition>
<set definition> (total) Identifies the total for the set.This value is calculateddirectly from the data store.
The expression used tocalculate the summarydepends on the set type:
v Details-based set: Theselected member.
v Level-based anddepth-based sets: The rootmember for the hierarchy.
v Selection-based set: Theaggregate, typically thesum, of the selectedmembers.
<set definition>
Managing Changes in the PackageIf changes were made to the package that was used to create a report, the reportmust be updated.
When you open a report, IBM Cognos Report Studio automatically checks to see ifthe package has changed. If it has, a message appears indicating that the reportwill be updated to the latest version of the package. However, you may need tomake additional changes to the report if
458 IBM Cognos Report Studio Version 10.2.1: User Guide

v the namespace name or query subject and data item names in the package havechanged
v the name of the package has changed
Update a Name ReferenceIf the namespace name or query subject and data item names in the package havechanged, you must update reports that were created with the package to reflect thechange.
The names of data items in a report are a concatenation of the namespace name,the query subject name, and the data item name. For example, if you add Ordernumber from the GO Data Warehouse (query) sample package to a filterexpression, you will see [Sales (query)].[Sales order].[Order number] in theexpression. Similarly, package filter names are a concatenation of the namespacename and the filter name.
Procedure1. To update a data item name reference:
v Click the data item.v In the Properties pane, double-click the Expression property.v In the Expression Definition box, update the data item name reference.
2. To update a package filter name reference:
v From the Data menu, click Filters .v Double-click the package filter.v In the Expression Definition box, update the namespace name.
Change the PackageIf the name of the package that were used to create a report has changed, youmust change the package connection to update the report.
At the same time, you can also change the authoring language for the report.
Procedure1. From the File menu, click Report Package.2. Click Another package and choose the new package.3. To change the authoring language, click the ellipsis (...) button beside the
Language box and choose a different report language.You may need to update the report to reflect the change. For example, any filterexpressions in the report must be modified to reflect the syntax rules of thenew language.
4. Click OK.The new package is loaded and the report is validated. If errors are found, theValidation Errors dialog box appears, showing the elements that must beupdated to reflect the package change.
5. Click Close.6. Make any required changes in the report to support the new package.
For example, you may need to link the data items in the report to the newpackage.
Tip: You can use Query Explorer to make the changes.
Chapter 21. Managing Existing Reports 459

460 IBM Cognos Report Studio Version 10.2.1: User Guide

Chapter 22. Upgrading Reports
When you open a report that was created in a previous version of IBM CognosBusiness Intelligence, it is automatically upgraded.
Any problems detected during the upgrade process appear as information
messages and error messages in the Upgrade Information dialog box.You must fix any errors in the report and then validate the report before you canrun it. In some cases, the information or error message is linked to the location ofthe issue in your report. To go to the location of the issue, click the message, andthen click Select. If only warnings and information appear in the dialog box, thesewill disappear when you click OK.
Tip: To view this dialog box again, from the File menu, click UpgradeInformation.
After you upgrade a report to the most recent version of IBM Cognos BI, you canno longer open it with a previous version.
Lifecycle Manager
You can download IBM Cognos Lifecycle Manager from http://www.ibm.com/ tohelp you test your reports. Lifecycle Manager is a verification tool that checks thatyour reports run and produce the same results in the new environment.
Lifecycle Manager is a Microsoft Windows operating system-based application forauditing upgrades to the latest version of IBM Cognos BI from IBM CognosReportNet 1.1 MR3 or MR4, and from IBM Cognos 8 versions 8.2, 8.3, or 8.4.
It provides a verification feature that validates, executes, and compares reportresults from two different IBM Cognos BI releases. This helps to identify upgradeand compatibility issues between releases. User interface design and statusreporting functionality provide both a proven practice process and support forupgrade project planning and status reporting. Lifecycle Manager also automatesmuch of the process of bundling the required files, such as reports and models, forthe test case. For more information, see the Lifecycle Manager User Guide.
Upgrading Reports from IBM Cognos BI Version 8.4When you upgrade to IBM Cognos Business Intelligence version 10 from IBMCognos 8 BI version 8.4, some reports may look or behave differently after theupgrade. This section describes changes that you may encounter in your reports.
Upgrading Report StylesIBM Cognos Business Intelligence includes a new default report style with updatedcolors and gradients. If your report uses a custom report template, your report willappear the same in this version of IBM Cognos Report Studio as it did in previousversions. By default, new reports and new report objects, such a lists and crosstabs,appear in the new report style.
© Copyright IBM Corp. 2005, 2013 461

If you want to continue to work with the previous 8.x report style, set theOverride 10.x styles with 8.x styles on new reports option (Tools, Options,Advanced tab).
You can update the style of an upgraded report to use the new 10.x style (File,Report Properties, Report styles, 10.x styles).
For more information about report styles, see “Create and Modify Report andObject Styles” on page 350.
Upgrading Legacy ChartsIBM Cognos Report Studio version 10.1.0 includes a new default chart technology.You can continue to use and work with the legacy charts or upgrade your legacycharts to the current default charts.
When you open a report that uses the legacy charts, the legacy charts is notupgraded to the current default charts automatically. You can upgrade your legacycharts one at a time to the current default chart. For more information, see“Convert Charts From One Type to Another” on page 102.
When you add a new chart to a report, Report Studio adds the current defaultcharts. If you want to add new legacy charts or continue to work with existinglegacy charts, set the Use legacy chart authoring option (Tools, Options,Advanced tab).
New Default for Hidden or Deleted Axis TitlesThe default for rendering hidden or deleted axis titles has changed. This canchange the size or placement of chart elements in your chart report output.
In previous versions of IBM Cognos Report Studio, hidden or deleted axis titleswere defined and rendered as empty spaces in the report.
In Report Studio, Version 10.1.0, hidden or deleted axis titles are not rendered atall, so the space that was reserved for the title is available for other chart elements.This can affect the placement or size of chart elements, such as labels, the chartbody, or the bars in a bar chart.
To make the charts appear the way they did in the previous version, set the x-axis'Title property to Show and then set the x-axis title's Default Title property to No.This adds the space for a custom axis title to the report specification but leaves thetitle blank.
Upgrading Reports with SAP BW Prompt VariablesWhen you upgrade reports that use SAP BW data sources and contain variables asprompts from version 8.3 SP2 to version 8.4 or 10.1.0, the upgrade may fail.Prompts that contained SAP BW variables are now empty. This occurs because adefault setting in an IBM Cognos configuration file changed in version 8.4.
To successfully upgrade these reports, do one of the following:1. Fully qualify all of the variables in the report by changing [variable_name] to
[infoquery].[variable_name].2. Ask your IBM Cognos administrator to change the value for the
DetectSAPVariableUniqueness parameter in the configuration file, as follows:v In the c10_location\configuration directory, locate the qfs_config.xml file.
462 IBM Cognos Report Studio Version 10.2.1: User Guide

v Find the DetectSAPVariableUniqueness parameter and change its value tofalse.
v Save the qfs_config.xml file.v Restart the IBM Cognos service.If more than one variable with the same name exists in the package, thischange may cause problems.
Upgrading Reports from IBM Cognos BI Version 8.1 or 8.2When you upgrade IBM Cognos Business Intelligence, some features in IBMCognos BI may behave differently after the upgrade. When you upgrade reports,for example, changes in behavior may cause validation errors.
Members Containing No Data Are Not Suppressed for SAP BWIf you upgrade a crosstab report that uses a SAP BW data source and includescalculations, filters, or nesting, the suppression of null values may not occur asexpected. You may see additional empty rows and columns.
By default, null values are suppressed for list and grouped list reports.
To effectively remove null values in crosstabs that use a SAP BW data source,insert individual members to create the report. You can also ensure that SAP BWmembers are assigned to proper dimension hierarchies and levels within the BWcube.
Thousands Separators MissingYou may encounter missing thousands separators in your reports in the followingcircumstances:v The report contains an item that does not specify an explicit data format.v The report item refers to another item in the same report.v That second report item refers to an item in the IBM Cognos Framework
Manager model with Usage property set to Identifier or Attribute.v The model item does not specify an explicit format.
To restore the data formats, specify an explicit format either in the report itemproperties or in the model item properties.
RQP-DEF-0177 Error When Upgrading ReportsWhen you upgrade your report from IBM Cognos Business Intelligence, version8.2, you encounter the following errors:
RQP-DEF-0177 An error occurred while performing operation'sqlPrepareWithOptions' status='-120'.
UDA-SQL-0458 PREPARE failed because the query requires local processing of thedata. The option to allow local processing has not been enabled.
This error occurs when the query requires local processing because some or all ofits constructs are not supported by the database vendor. In IBM Cognos BI, version8.2 and earlier, IBM Cognos BI proceeded with local processing. In version 8.3 andlater versions, you must explicitly set the query Processing property to LimitedLocal in order to enable local processing.
Chapter 22. Upgrading Reports 463

Procedure1. In IBM Cognos Report Studio, pause the pointer over the query explorer button
and click the query.2. In the Properties pane, set the Processing property to Limited Local.
Upgrading Reports from IBM Cognos ReportNetWhen you upgrade from IBM Cognos ReportNet, some reports may look orbehave differently after the upgrade. The upgrade does not account for thefollowing issues.
Undocumented and Unsupported FeaturesIf advanced report authors used undocumented and unsupported features such asJavaScript that refer to IBM Cognos HTML objects, they may have to recreate thefeatures to complete the upgrade of the report.
No Sort OrderData may appear in a different order after upgrading. If sort order is important,ensure that the report or model specifies a sort order before upgrading.
Layout ErrorsLayout errors are suppressed by default in ReportNet. IBM Cognos BusinessIntelligence does not suppress layout errors. Users may have to correct or removereport layout expressions that cause errors.
Report FormatIf you used the default format in ReportNet, upgraded reports will retain thatformat. However, new reports in IBM Cognos Business Intelligence will use theIBM Cognos BI format. If you want a consistent style across all reports, you mustedit the styles property in each report and select or deselect the Use 1.x reportstyles option.
Customized Style SheetsIf you edited the ReportNet style sheet (default_layout.css) or the IBM CognosBusiness Intelligence stylesheet (globalreportstyles.css), reports will lose theformatting after upgrading. You must reapply the changes to the IBM Cognos BIstylesheets and copy the stylesheets to the IBM Cognos BI server and the Webserver.
PDF ReportsPDF rendering in IBM Cognos Business Intelligence behaves like HTML rendering.After upgrading, PDF reports may have different font size, column wrapping, orword wrapping. You may have to change each affected report or change thedefault font in the IBM Cognos BI style sheet.
IF-THEN-ELSE StatementsIf you use assignments of different data types after THEN and ELSE in ReportNet,the reports will generate invalid coercion errors after upgrading. You may have torecast the variables or change the assignments in the affected reports.
464 IBM Cognos Report Studio Version 10.2.1: User Guide

Solve OrderIn previous versions of IBM Cognos Business Intelligence, you could specify thesolve order for objects such as crosstab node members. Solve order is nowspecified for data items. When you upgrade a report, solve orders specified in thereport are moved to data items.
For more information about solve order, see “Resolve Multiple Calculations forCrosstabs and Charts” on page 540.
Chart BehaviorIn ReportNet, if a chart is created with a user-specified minimum value and alldata values are below the minimum value, the chart starts at the user-specifiedminimum value and contains no data.
In IBM Cognos Business Intelligence, the same parameters result in a chart thatignores the user-specified minimum value and uses a range that includes all of thedata values for the chart.
Database Only Processing of QueriesIf you specified in ReportNet that the processing for a query should be DatabaseOnly, when you upgrade your report to IBM Cognos Business Intelligence, someprocessing may now occur locally.
Changes in the Behavior of Functions Between ReportNet 1.1and IBM Cognos BI
In ReportNet 1.1, double counting could occur when applying count or countdistinct to a query item. This occurred primarily when querying multiple querysubjects that were joined 1-to-N in the model if the counted item existed in thequery subject on the 1 side of the join. The explanation is that count or countdistinct was applied after the join operation.
Count distinct worked only when the item to which count distinct was appliedwas the column used in the join. In this case, the column to be counted could haveidentical values for the different values used in the join condition.
In IBM Cognos Business Intelligence, improvements to the count functionalitycannot be handled through an automatic upgrade. The new approach avoidsdouble counting on the 1 side of a 1-to-N join. The explanation is that count orcount distinct is now applied before the join operation.
There is now a lesser need to use count distinct and, when used, it will besuccessful more often. Count distinct is no longer required to overcome doublecounting. Instead, it can be used as intended to select distinct values that exist in aquery subject.
When you want to count repeated occurrences of a value, we recommend that youdo one of the following:v Apply a count operation on a column based on a query in which an explicit join
occurs.This applies the count after the join.
v Count rows in a report by using a layout calculation object or by counting theliteral value 1.
Chapter 22. Upgrading Reports 465

466 IBM Cognos Report Studio Version 10.2.1: User Guide
Appendix A. Accessibility Features
Accessibility features help users who have a physical disability, such as restrictedmobility or limited vision, to use information technology products.
See the IBM Accessibility Center (http://www.ibm.com/able) for more informationabout the commitment that IBM has to accessibility.
Accessibility features in IBM Cognos Report StudioThere are several accessibility features in IBM Cognos Report Studio.
The major accessibility features are described in the following list:v You can use command keys, or shortcut keys, to navigate through Report
Studio. Shortcut keys directly trigger an action and usually make use of the Ctrlkeys.
v Report Studio uses Web Accessibility Initiative—Accessible Rich InternetApplications (WAI-ARIA). This means that people with limited vision can usescreen-reader software, along with a digital speech synthesizer, to listen to whatis displayed on the screen.
Note: To take full advantage of the accessible features of Report Studio, useMozilla Firefox version 4.0 or higher and Freedom Scientific JAWS version 12.0.
Keyboard ShortcutsThis product uses some standard Microsoft Windows and accessibility shortcutkeys.
Action Shortcut keys
Enables or disables the accessibility feature -an IBM Cognos Report Studio restart isrequired. The default is disabled.
Ctrl+Shift+Tab
Opens the context menu for the selecteditem, if available.
Shift+F10
Switches focus from or to the main menubar and the main worksheet.
Ctrl+F10
Opens the online help. F1
Closes the Web browser window. Alt+F4
Copies objects. Ctrl+C
Pastes objects. Ctrl+V
Closes objects, such as a dialog box, menu,drop-down list, or page.
Esc
Cycles through objects, such as the tabs in adialog, the objects in a page, the cells in alist, the rows in a crosstab, or check boxes.
Tab, Shift+Tab, Arrow keys
Selects the first or last item in a list. Home/Pg Up or End/Pg Dn keys
© Copyright IBM Corp. 2005, 2013 467

Action Shortcut keys
Selects or clicks one or multiple objects, suchas a radio button, menu or toolbar item, ornode in a tree widget.
In the Properties pane, expands or collapsesa property group.
Space or Enter, Ctrl+space or Shift+space,Ctrl+Enter or Shift+Enter
Considerations to Improve Report AccessibilityCreating accessible reports ensures access of information to all users, with all levelsof ability.
For example, people with a visual impairment may use screen reading technologyto access the information in a report.
The following are some design considerations for creating accessible reports:v Avoid using visual cues, such as bold text or color, to convey important
information.v Avoid using pictures and OLE Objects in PDF documents, as these items are
tagged as artifacts and ignored by the screen reader.v Avoid using conditional formatting to convey important information.v When selecting color palettes for report objects, choose patterns or shades of
gray.v Ensure that there is a table corresponding to chart types that are rendered as
images because the screen reader ignores this information.v Deliver reports in HTML format, which is the most supported output format for
most screen readers.v Ensure that the report has a title.v Gain an understanding for screen reading technology.v Avoid spelling and grammatical errors, as they cause the screen reading software
to misinterpret the information.v Avoid using features like calendar boxes and up and down selections on time
controls. Instead use prompts such as check boxes, radio buttons, combo boxes,and multi-select boxes.
v Ensure that the target application is accessible when using embedded Webapplications or drill-through paths.
v Avoid using large, complex list or crosstab reports.Displaying the information in multiple simple lists or crosstab reports is moremanageable for assistive technology users.
v Add alternate text to images, charts, and other visual objects so that screenreaders can provide context for them.
v When using tables, add summary text to provide context for the table content. Ifthe top cells in a table behave as headers, designate these cells as headers so thatscreen readers can identify the relationships.
v Avoid using range prompt controls that contain radio buttons.
468 IBM Cognos Report Studio Version 10.2.1: User Guide

When users tab to a radio group, the focus should be in the selected radiobutton. In the case of range prompts, for both the From and To sections, theradio button groups start first in the tab order. However, the secondary inputelements, which can be text boxes, drop-down lists, date edit boxes, and so on,are located before the selected radio button in the tab order. Instead of going tothe selected radio button, the focus goes to the secondary input element. As aresult, users using a screen reader do not know that the input element is one oftwo options.
Enable Accessible Report OutputsIf you want to include accessibility features, such as alternate text, summary text,designated cell headers in tables and accessible conditional layouts, you mustenable these accessibility features in the report output.
You can enable accessible report outputs in one of the following ways:v in the IBM Cognos Report Studio run options, so that the report has accessibility
features enabled when you run the report from within Report Studio.v in IBM Cognos Connection as a run option (Run with options, Enable
accessibility support), so that report consumers can run the report once withaccessibility features.
v in IBM Cognos Connection as a property (Set properties, Report tab), so thatreport consumers can always run the report with accessibility features.
v in IBM Cognos Connection, as a user preference (My area, My preferences), sothat report consumers can enable accessibility features for all of their reports.Accessibility settings in the report properties overwrite this setting.
v in IBM Cognos Administration, as a server-wide option, so that all reports for allIBM Cognos users have accessibility features enabled. Accessibility settings inthe user preferences and report properties overwrite this setting.Administrators can also change a system-level setting that forces the accessibilityfeatures on or off regardless of any other settings.
For information about the last four options, see the IBM Cognos Connection UserGuide or the IBM Cognos Administration and Security Guide.
Procedure
In Report Studio, from the Run menu, click Run Options and select the Includeaccessibility features check box.
Alternate text and summary textTo make reports accessible, you can add alternate text or summary text to objectssuch as images, charts, and tables. When a screen reader encounters one of theseobjects, it reads the text that you added to the object.
Figure 53. Range prompt with From and To sections
Appendix A. Accessibility Features 469

Related tasks:“Customize Prompt Text” on page 323You can customize the instructional text that appears around prompts. Forexample, a value prompt with multiple selections includes a Select all link belowthe choices that you can customize to text other than Select all. You can alsospecify translated text in many languages for international report users.
Add Alternate Text to Images and ChartsYou can add alternate text for images, maps, and charts to make your reportsaccessible. When a screen reader encounters one of these objects, it reads thealternate text that you added to the object.
You can add translations for the text to support users in multiple languages. Whenusers run a report, IBM Cognos Business Intelligence uses the alternate text in theappropriate language.
If you use images only for visual spacing in your report, leave the Alternate Textproperty empty.
Before you begin
For the report output to contain the alternate text, you must enable the accessibilityfeatures for the report. For more information, see “Enable Accessible ReportOutputs” on page 469.
Procedure1. Select the image or chart object.
2. In the Properties pane, click the select ancestor button and select theImage, Map, or chart object.
3. Double-click the Alternate Text property.4. Select Specified text and click the ellipsis (...) button.5. In the Default text box, type a description for the object, and click the add icon
.6. In the Languages dialog box, select the languages that apply to your text.7. Double-click a language and type the translation of the text for each language
and click OK.
Add Summary Text to TablesYou can provide summary text for crosstabs, lists, repeater tables, and table objects.This text provides context for the entire object to make your reports accessible.When a screen reader encounters one of these objects in HTML report outputs, itreads the description that you added to the object.
The table summary is not displayed in visual Web browsers. Only screen readersand speech browsers use the summary text. The summary text is usually readimmediately before the table caption.
You can add translations for the text to support users in multiple languages. Whenusers run a report, IBM Cognos Business Intelligence uses the summary text in theappropriate language.
470 IBM Cognos Report Studio Version 10.2.1: User Guide

If you use tables for report layout, leave the summary empty to indicate to screenreaders that the table is used exclusively for visual layout and not for presentingtabular data.
Before you begin
For the report output to contain the summary text, you must enable theaccessibility features for the report. For more information, see “Enable AccessibleReport Outputs” on page 469.
Procedure1. Select the crosstab, list, or table.
2. In the Properties pane, click the select ancestor button and select theCrosstab, List, Repeater Table, or Table object.
Tip: You can also click the container selector (three orange dots) of thecontainer to select it.
3. Double-click the Summary Text property.4. Select Specified text and click the ellipsis (...) button.5. In the Default text box, type a description for the object, and click the add icon
.6. In the Languages dialog box, select the languages that apply to your text.7. Double-click a language and type the translation of the text for each language.
Designate Cells Headers in TablesYou can specify whether specific table cells are table headers. This allows screenreaders and speech browsers to identify the relationships between the cells in yourtables.
Before you begin
For the report output to contain the cell headers, you must enable the accessibilityfeatures for the report. For more information, see “Enable Accessible ReportOutputs” on page 469.
Procedure1. Select the table cells.2. In the Properties pane, set the Table Header property to Yes.
Headings and emphasisYou can apply certain global classes to text objects to make the text easier to readfor visually impaired users.
The following global classes are available to improve text readability for headingsand blocks of text:v Heading 1 through 6
Tip: In HTML output, these classes are converted to <h1> to <h6> tags.v Emphasize Text and Strong Text
Tip: In HTML output, these classes are converted to <em> and <strong> tags.
Appendix A. Accessibility Features 471

You apply one of these global classes to text by accessing the Classes property ofthe text and choosing the class that you want to apply.
Prompt control labelsYou can associate labels to prompt controls to make the prompts accessible.
There are several methods that you can use to associate a label to a promptcontrol:v Associate a text item to the prompt control.v Insert the prompt control in a field set and use the caption of the field set to
specify the label.v Use HTML items to define a field set.
When a text item is associated to a prompt control, the text is read by screenreaders when users tab to the control. When a prompt control is inserted in a fieldset, screen readers read the label of the field set when the focus moves to anyinput element within the field set.
Associating a text item to a prompt control in IBM CognosReport StudioAssociate a text item to a prompt control to create a label for the prompt.
Before you begin
You must specify a name for the prompt control before you can associate a textitem to the control.
Procedure1. To specify a name for the prompt control, select the control, and in the
Properties pane, type the name in the Name property.2. Create a text item or select an existing text item.3. In the Properties pane, in the Label For property, type the name of the prompt
control.
Associating labels with prompt controls using field setsYou can associate labels with prompt controls using field sets.
Procedure
1. From the Toolbox tab , drag Field Set to the report.2. Double-click the caption of the field set and type the text that you want to
appear as the prompt control label.
3. From the Toolbox tab , drag a prompt control to the field set.4. Optional: To hide the field set border so that only the prompt control border
appears in the prompt page, set the border to none.a. Select the field set.b. In the Properties pane, click the Border property.c. In the Style box, click None.
d. Under Preview, click the apply all borders icon and click OK.
472 IBM Cognos Report Studio Version 10.2.1: User Guide

Associating labels with prompt controls using HTML itemsInstead of using the field set object, you can associate labels with prompt controlsusing HTML items. You use the HTML items to create the field sets.
Procedure
1. From the Toolbox tab , drag HTML Item to the left of the prompt.2. Click the HTML item.3. In the Properties pane, double-click the HTML property.4. In the HTML window, type the following text and click OK.
<fieldset style="border:0;">
<legend>Prompt label</legend>
5. From the Toolbox tab , drag HTML Item to the right of the prompt.6. Click the HTML item.7. In the Properties pane, double-click the HTML property.8. In the HTML window, type the following text and click OK.
</fieldset>
Example - Conditionally Show a List Below a Chart for anAccessible Report
Charts are rendered as images in report outputs, such as HTML and PDF. As aresult, they are difficult to navigate for visually impaired users and screen readerscannot convey the information shown in charts. To make your reports accessible,you can add a conditional layout that shows list or crosstab equivalents of thechart when the accessibility features are enabled for the report output.
To set up this conditional layout, use a conditional block that contains the list orcrosstab and the report function IsAccessible. The IsAccessible function is aBoolean function that returns Yes (or true) when the accessibility features areenabled for the report output and No (or false) when the accessibility features arenot enabled.
Therefore, the list or crosstab becomes conditional and appears only when theaccessible report output option is enabled. In addition, you should add alternatetext for the chart object so that screen readers can let users know that an accessiblelist or crosstab follows.
Procedure1. Open IBM Cognos Report Studio with the sample GO Sales (query) package.2. Create a new report with a pie chart.
3. Add data items to the chart. From the Source tab , do the following:v Expand Sales (query) and Sales and then insert Quantity in the Default
measure area.v Expand Products and insert Product line in the Series (Pie Slices) area.
4. Run the report to see your chart.5. Add alternate text for the pie chart:
v Select the chart and, in the Properties pane, double-click the Alternate Textproperty.
Appendix A. Accessibility Features 473

v Select Specified text and click the ellipsis (...) button.v Type default text for the chart, such as
A pie chart shows the quantity of sales by product line as a percentage oftotal sales. An equivalent list is below.
If you want to add the alternate text in additional languages, click the add
button .
6. From the Toolbox tab , insert a Conditional Blocks object below thechart.
7. Select the conditional block and, from the Properties pane, double-click theBlock Variable property.
8. Under Variable, select New boolean variable and type a name for thevariable, such as accessibility_condition.
9. In the Report Expression dialog box, specify the expression that defines thevariable:
v From the Functions tab , expand Report Functions and insert theIsAccessible function to the Expression Definition box.
v Type a closing bracket at the end of the function IsAccessible () and clickOK.
10. Select the conditional block and in the Properties pane, change the CurrentBlock property to Yes.
11. From the Toolbox tab , add a list inside the conditional block.
12. Add the same data items from the chart to the list. From the Source tab ,do the following:v Expand Sales (query) and Products and insert Product line in the list.v Expand Sales and insert Quantity as the second column in the list.
13. Add summary text for the listv Select the list and in the Properties pane, double-click the Summary Text
property.v Select Specified text and click the ellipsis (...) button.v Type default text for the list, such as
The first column lists all product lines and the second column lists salesquantities.
If you want to add the alternate text in additional languages, click the add
button .14. Select the conditional block and in the Properties pane, change the Current
Block property to No.15. From the Run menu, click Run Options and select the Include accessibility
features check box.16. Run the report.
Results
Because we just chose to include the accessibility features, you see both the chartand the list. Also, when a screen reader encounters the image for the chart, it readsthe alternate text that you added.
474 IBM Cognos Report Studio Version 10.2.1: User Guide

If you clear the Include accessibility features check box and run the report again,you see only the chart.
IBM and accessibilitySee the IBM Accessibility Center for more information about the commitment thatIBM has to accessibility.
The IBM Accessibility Center is available online at http://www.ibm.com/able.
Figure 54. Report showing both a pie chart and a list
Appendix A. Accessibility Features 475

476 IBM Cognos Report Studio Version 10.2.1: User Guide

Appendix B. Troubleshooting
This appendix describes some common problems you may encounter.
For more troubleshooting problems, see the IBM Cognos Business IntelligenceTroubleshooting Guide.
Problems Creating ReportsThe topics in this section document problems you may encounter when creatingreports.
Division by Zero Operation Appears Differently in Lists andCrosstabs
If you have a list that accesses a relational data source, a calculation containing adivision by zero operation appears as a null value, such as an empty cell. In acrosstab, the division by zero operation appears as /0. This happens when theAvoid Division by Zero property is set to Yes, which is the default.
To have a consistent display of null values in lists and crosstabs, define anif-then-else statement in the expression in the crosstab cell that changes the value/0 to the value null.
Application Error Appears When Upgrading a ReportWhen upgrading a report, the following error appears if the report contains dataitems in the page layout that are not in a data container:RSV-SRV-0040 An application error has occurred. Please contact your Administrator.
This error occurs when IBM Cognos BI cannot determine the query reference for adata item. Such data items are identified by a small red circle with a white x iconthat appears in the lower left corner.
To correct the error, drag the data items into a container. If the container is a list,we recommend that you drag the data items into the list page header or footer, orthe overall header or footer. If you want to see the first row of the item on eachpage or in the overall report, drag the item to the list page header or overallheader. If you want to see the item's last row on each page or in the overall report,drag the item to the list page footer or overall footer.
Tip: If a header or footer does not exist, create it.
Nested List Report Containing a Data Item That is GroupedMore Than Once Does Not Run After Upgrade
When you upgrade a nested list report that contains a data item that is grouped inboth lists, the report does not run.
The following error occurs when the report is run against a dimensional datasource and both lists are using the same query. This error does not occur if thereport is run against a relational data source.
© Copyright IBM Corp. 2005, 2013 477

OP-ERR-0199: The query is not supported. The dimensions on the edge are inconsistent.The dataItems from dimension="[Product line]" must be adjacent.
For example, you have a list that contains the grouped items Product line andProduct type and a nested list that contains the data items Year, Quarter, Productline, and Unit sale price. Year, Quarter, and Product line are grouped items in thenested list.
To resolve the issue, delete the data item that is grouped in both lists from theinner list.
Procedure1. Click anywhere in the report.2. In the Properties pane, click the select ancestor button and click the List link
that represents the inner list.3. Double-click the Grouping & Sorting property.4. In the Groups pane, select the data item that you want and click the delete
button.
Background Color in Template Does not AppearWhen creating a Query Studio template in Report Studio, if you add a list objectand change its background color, the color change does not appear when youapply the template to a Query Studio report.
To work around this issue, do one of the following:v Edit the style sheet (CSS) classes for lists in Report Studio.v Do not add any objects to the page body when you are creating a Query Studio
template.v Leave the page body blank.
Subtotals in Grouped ListsWhen using an IBM Cognos PowerCube that contains a ragged hierarchy, if yougroup on the first level in the hierarchy, subtotals may appear in the wrong placeor show wrong values.
To resolve the issue, group on the second level.
Chart Labels Overwrite One AnotherIn Report Studio and Query Studio, if you define a chart and render it in HTML orPDF format using the default sizes, the axis labels of the chart may overwrite eachother.
To avoid this problem, make the chart wider or taller by modifying the height andwidth properties of the chart or enable the Allow Skip property.
Chart Shows Only Every Second LabelYou create a report that includes a chart. The Allow Skip option is set to false, butwhen you run the report, labels are skipped.
478 IBM Cognos Report Studio Version 10.2.1: User Guide

This can occur if there is not enough room for all labels and the options Allow 45Degree Rotation, Allow 90 Degree Rotation, and Allow Stagger are also set tofalse. IBM Cognos BI has no options for making the labels fit, so it skips everysecond label.
The solution is to select either Allow 45 Degree Rotation, Allow 90 DegreeRotation, or Allow Stagger.
Chart Gradient Backgrounds Appear Gray in Internet ExplorerIn Report Studio, you can define a custom palette for a chart that includes agradient. When the chart is rendered in HTML format in Microsoft InternetExplorer, the chart background appears gray. This is an Internet Explorer issue.
To avoid this problem, select the chart and define the color white as the chartbackground.
For more information, see the Microsoft Knowledge Base article # 294714 athttp://support.microsoft.com.
Metadata Change in Oracle Essbase Not Reflected in Reportsand in the Studios
When there is a metadata change on the Oracle Essbase server, the change is notimmediately reflected in the metadata tree in the studios. In addition, when areport is run, the report does not pick up the republished changes.
To view the new structure, you must restart the IBM Cognos Content Managerserver.
Relationships Not Maintained in a Report With OverlappingSet Levels
In a report, the relationship between nested or parallel member sets at overlappinglevels in the same dimension may not always be maintained.
For example, a named set in the data source that contains members from both aYear and Month member is nested under Year, but is not properly grouped byyear.
In another example, an error message such as this appears:
OP-ERR-0201 Values cannot be computed correctly in the presence of multiple hierarchies([Product].[B1], [Product].[Product]) that each have a level based on the same attribute(Product).
This problem occurs in the following scenarios involving non-measure data itemsX and Y, which overlap in the same dimension:v X and Y together as ungrouped report detailsv Y nested under Xv Y appended as an attribute of a group based on X
When using named sets, or sets that cover more than one level of a hierarchy, donot use sets from the same dimension in more than one place in the same report.They should appear on only one level of one edge.
Appendix B. Troubleshooting 479

Summaries in Query Calculations Include Nulls with SAP BWData Sources
When using an SAP BW data source in IBM Cognos Report Studio, null values inthe database are returned in the result set and the count summary functionincludes the empty cells in the following scenarios:v A query calculation includes an arithmetic calculation where one or more NULL
operands and an aggregation is performed on the calculation.v The result of a query calculation is a constant, such as current_time and
current_date.
The count summary function should normally exclude null values.
To avoid this problem, for the first scenario, ensure that both operands do notreturn null values. For example, the original expression is [num1]+[num2]. Instead,use the following expression:
if ([num1] is null) then ( 0 ) else ([num1])
if ([num2] is null) then ( 0 ) else ([num2])
There is no workaround for the second scenario.
Creating Sections on Reports That Access SAP BW DataSources
SAP BW data sources may have problems with sections in reports under differentcircumstances:
If a section in a report uses the lowest-level query item in a ragged hierarchy, suchas the children of the not assigned node, the following BAPI error may appear:
BAPI error occurred in function module BAPI_MDDATASET_SELECT_DATA. Value<valueName> for characteristic <cubeName> unknown
Lowest-level Query Item in a Ragged Hierarchy
The solution is to remove the section from the lowest-level query item.
Several Multicubes with SAP Variables
The solution is to use one SAP multicube when creating sections in reports.Related concepts:“Tips for Working with Ragged or Unbalanced Hierarchies” on page 264In ragged or unbalanced hierarchies, some members that are not at the lowest levelof the hierarchy may have no descendants at one or more lower levels. Support forthese hierarchy gaps in relational data sources is limited. More complete support isprovided for OLAP data sources, but some reports may still result in unexpectedbehavior.
Error Characters (--) Appear in ReportsWhen you run a report, you see two dash (--) characters in your report instead ofvalues.
480 IBM Cognos Report Studio Version 10.2.1: User Guide

These characters may appear if you use an OLAP data sources other thanPowerCube and Microsoft SQL Server 2005 Analysis Services (SSAS), and youapply aggregation to calculations and measures that use rollups other than Sum(Total), Maximum, Minimum, First, Last, and Count.
All other types of rollup either fail or return error cells, which typically display astwo dash characters (--).
This problem occurs in, but is not limited to, the following:v footersv aggregate functionv summary filters and detail filters that use a summaryv detail, summary, and context filters that select more than one member of a
hierarchy that is used elsewhere on the report
If you are working with a SSAS 2005 data source, these characters may also appearin summary cells if you use an OR filter in the summary. To avoid this problem,do not use OR filters in summaries.
Columns, Rows, or Data Disappear With SSAS 2005 CubesMicrosoft SQL Server 2005 Analysis Services (SSAS) has a feature called AutoExiststhat removes tuples that have no facts at the intersection of two hierarchies of thesame dimension.
Columns, rows, or data can disappear if you set the default member of a hierarchyto a member that does not exist with every other member in the dimension. Toavoid this problem, change the default member that caused the disappearance to amember that exists with all other members in the dimension.
Columns, rows, or data can also disappear if members are specified that result inone or more non-existent tuples. There is currently no workaround for thisscenario. For more information, see Microsoft Knowledge Base article #944527 athttp://support.microsoft.com.
You may also encounter unexpected results if the default member of a hierarchy isa member that doesn't also exist in all other hierarchies in the dimension, and ifyou query members from different hierarchies in the same dimension.
For example a crosstab includes the following (using the Adventure Works cube):v Rows: Generate([Adventure_Works].[Account].[Accounts],set([Balance
Sheet],[Units])) nested withchildren([Adventure_Works].[Department].[Departments]->:[YK].[[Department]].[Departments]].&[1]]])
v Column: [Adventure_Works].[Account].[Account Number].[Account Number]v Measure: [Adventure_Works].[Measures].[Amount]
You run the report and notice that the query renders with some blanks cells. Youthen apply the simple detail filter [Amount]>1 and run the report. Only row labelsare displayed and all data and columns are missing.
In the Adventure Works cube, the [Account].[Accounts] attribute has a defaultmember set to [Net Income]. When evaluating the GENERATE set expression,SSAS looks in the entire cube space and looks at all coordinates for the [Account]
Appendix B. Troubleshooting 481

dimension. These coordinates include both [Account][Account Type].&[] and[Account].[Accounts].[Net Income]. Because these two coordinates don't existwithin the same hierarchy, SSAS returns an empty set.
To avoid this problem the SSAS administrator must set the default member in thecube to a member that exists in all other hierarchies.
Function Unreliable with SetsIf you create an expression that uses the descendants function with sets, you mayencounter unpredictable results. Some expected members may be missing or mayhave blank captions or labels.
This problem occurs if the descendants function uses a set as its first parameterinstead of a single member and if the descendants function is nested underanother data item from the same hierarchy.
To avoid this problem, replace the first parameter in the descendants function withthe function currentmember(H), where H is the hierarchy of the desired set andunder which the expression is nested. For example, usedescendants(currentmember(H).
Searching for values might return unexpected resultsIn the expression editor, when searching for values for a data item, the results youobtain might contain unexpected results if the data item is not a string data type.Because you can edit the expression for a data item, IBM Cognos BusinessIntelligence cannot determine with certainty what the data type is.
Therefore, IBM Cognos Business Intelligence guesses the data type of the data itemby looking at its aggregate and rollup aggregate set.Related tasks:“Browse or Search the Values of a Data Item” on page 233When building expressions in the expression editor, you can browse the data of adata item. This is useful when you do not know how a particular value is stored inthe database. For example, you want to filter a report so that it shows data foronly New South Wales. The actual value in the database for New South Wales isNSW, and this is what you must insert in the filter expression to obtain the correctresults.
Report Differences Between TM1 Executive Viewer and IBMCognos Business Intelligence with TM1 Data Sources
When using an IBM Cognos TM1 data source, comparable reports created in anIBM Cognos Business Intelligence studio and in TM1 Executive Viewer maycontain different cell values. This occurs because the TM1 Executive Viewerproduct uses an algorithm for selecting default members for non-projecteddimensions that differs slightly from traditional OLAP clients.
To avoid this problem, when filtering your reports in the IBM Cognos BusinessIntelligence studios, use context filters that match the default selections shown inthe Executive Viewer user interface. This ensures that the cell values in IBMCognos Business Intelligence match the values in Executive Viewer.
482 IBM Cognos Report Studio Version 10.2.1: User Guide

Order of Metadata Tree Differs for TM1 Data SourcesWhen using a an IBM Cognos TM1 data source, the order of members in themetadata tree of the Source tab of an IBM Cognos Business Intelligence studio maydiffer from the order shown in TM1 Architect.
By default, TM1 Architect renders members of hierarchies using a slightly differentalgorithm than does IBM Cognos BI. IBM Cognos BI automatically rendersmember metadata from TM1 data sources in hierarchical order.
From within TM1 Architect, if you want to see how an IBM Cognos BI studio willrender a hierarchy, click the Hierarchy Sort button.
MSR-PD-0012 error when importing external dataWhen you try to import an external data file, you receive an MSR-PD-0012 error.
MSR-PD-0012: Unable to upload the specified external data file. It exceeds the permittedfile size of "0(KB)", as specified by your system administrator.
This error occurs when the size of the file you are trying to import is greater thanthe value specified for the Maximum external data file size (KB) governor in theFramework Manager model.
To resolve the issue, the modeler must update the governor, save the model, andrepublish the package.
MSR-PD-0013 error when importing external dataWhen you try to import an external data file, you receive an MSR-PD-0013 error.
MSR-PD-0013: Unable to upload the specified external data file. It exceeds the permittedmaximum number of rows "0", as specified by your system administrator.
This error occurs when the number of lines in the file you are trying to import isgreater than the value specified for the Maximum external data row countgovernor in the Framework Manager model.
To resolve the issue, the modeler must update the governor, save the model, andrepublish the package.
Problems Calculating DataThe topics in this section document problems you may encounter when calculatingor summarizing data.
Unexpected Summary Values in Nested SetsIf a report contains nested sets, summaries other than the inner set summaries maycontain unexpected values. For example, you insert a summary in a crosstab thatcontains a set with years in the rows.
Appendix B. Troubleshooting 483

You then nest a product line set within years.
Notice that the summary value does not change to represent the total of the newvalues. This occurs because the within set aggregation used with dimensionalpackages does not take into account sets that are nested below the set that issummarized.
To show the correct summary values, if the inner and outer sets do not belong tothe same dimension, you can nest a copy of the inner summary item under theouter summary item, as follows.
Null Results for Calculations Using SAP BW Data SourcesWhen using a SAP BW data source, the expression you use in your calculation isevaluated as a null value if your expression contains a null item. For example, inthe calculation some_expression = result, the result is null if a row or column thatthe expression references includes a null value.
To avoid obtaining null values as the result of your calculations, suppress nullvalues before you create the calculation.
Incorrect Results with IBM Cognos PowerCubes and TimeMeasures
If a report uses an IBM Cognos PowerCube data source and a combination of dataitems, you will encounter incorrect results.
Figure 55. Example of revenue numbers for the years 2012 and 2013
Figure 56. Example of revenue numbers for the listed products for the years 2012 and 2013
Figure 57. Example of the combined aggregate set for the years 2012 and 2013
484 IBM Cognos Report Studio Version 10.2.1: User Guide

The following combination of data items in a report that uses an IBM CognosPowerCube data source will give incorrect results.v a measure with a Time State Rollup set to Average or Weighted Average
v an aggregate ( members from time dimension ) expressionv an intersection with a member in a relative time hierarchy
To avoid incorrect results, do not use this combination in your reports.
Incorrect Results in Summaries When Using OLAP DataSources
When using an OLAP data source, summaries that use for clauses give incorrectresults.
This occurs because for clauses require access to the detail rows of the fact table.OLAP data sources do not have detail rows.
For example, this report uses a dimensionally-modeled relational (DMR) datasource and contains the following summaries:v mx: maximum ([Revenue] for [Year (ship date)])v mx2: maximum (Aggregate([Revenue]) for [Year (ship date)])
Notice that the mx and mx2 values are different, where mx2 is based on visibledata, but mx is not. This result is correct.
Figure 58. Example list report that uses a dimensionally-modeled relational data source andrevenue for four years
Appendix B. Troubleshooting 485

The following report uses an OLAP data source and contains the same summaries.
In the example report, mx and mx2 values are now the same. Both summaries arebased on visible data. The mx value is incorrect.
Incorrect results also appear for footer summaries.
To avoid this problem, when using OLAP data sources, ensure that the parameterthat precedes the for clause is an aggregate function.
Problems Filtering DataThe topics in this section document problems you may encounter when filteringdata.
Unexplained Discrepancies in Number CalculationsYou might find unexplained discrepancies in number calculations due to round-offerrors.
For example:v You run regression tests and find differences in numbers. They are different only
because of the rounding off of decimal places.v You choose not display zeros in reports, but the zeros are displayed anyway
because there are decimal places (0.00000000000000426, for example) that arerounded off to zero in reports.
Figure 59. Example list report that uses a dimensional data source and revenue for fouryears
486 IBM Cognos Report Studio Version 10.2.1: User Guide

Round-off problems are not specific to IBM Cognos software. They can occur inany environment where rounding off occurs.
Binary Round-Off Errors
Discrepancies in calculations might occur due to binary round-off errors. Forexample, if the number 1.1 is represented as a binary floating point number andyour report format includes a large number of decimal places, the number 1.1might actually be something like 1.09999999999997.
If your report is formatted to use only one decimal point, decimal round-off takesplace, compensating for the binary round-off. So the number appears to be 1.1when it is really 1.09999999999997. When the number is used in calculations, youmight get round-off errors. For example, Microsoft Excel calculations use binarynumbers (without rounding off decimal places) but formatting in reports showsrounded off decimal places, which can create small discrepancies.
Division Round-Off Errors
Calculations that involve division typically incur round-off errors, regardless ofhow the numbers are represented. Examples of such calculations are Average andPercent of Base.
Design Guidelines to Minimize Round-Off Effect
The best solution is to change the underlying database schema or cube model butthat may not always be possible. Another solution is to minimize the round-offeffect by following these guidelines when authoring reports and creating models inIBM Cognos Framework Manager and external OLAP cubes:v Avoid storing data in floating point format whenever possible. This is especially
true for currency values, which should be stored as either fixed-point decimalsor as integers with a scale value such as 2.For example, in a cube, the Revenue for Camping Equipment in 2012 is$20,471,328.88. If revenue details are stored as floating point numbers, round-offerrors might occur when revenue is calculated.The round up errors might have slight differences, depending on the order ofcalculation. If revenue for Products is calculated first and revenue for Time iscalculated second, you might get a different round-off error than if Time iscalculated first and Products is calculated second.Total revenue might be calculated as the number above. Or there might be slightdiscrepancies, for example, $20,471,328.8800001 as opposed to $20,471,328.88. Theinternal number might be slightly different than what is displayed. The numbermight even be for different runs of the same report, depending on the order thatthe OLAP engine uses for calculation.
v In reports, avoid division whenever possible. When division is unavoidable, tryto do it as late as possible in the calculation process. For example, instead ofTotal([Revenue]/1000), use Total([Revenue])/1000.
v When doing comparisons, add a margin to allow for round-off. For example,you may want [Profit %] to be a fractional value formatted as a percentage withno decimals. However, the filter [Profit %]<>0 (or [Profit %] NOT BETWEEN 0and 0) rejects zero values and may still return values that appear to be 0% afterformatting.To avoid this, filter in one of these two ways:– [Profit %] NOT BETWEEN -0.005 and 0.005
Appendix B. Troubleshooting 487

– ([Profit %] <- 0.005) OR ([Profit %]> 0.005)Note that 0.005 is equivalent to 0.5%, which displays as either 0% or 1%,depending on floating point precision losses.In some cases, you may prefer control round-off errors by rounding valuesexplicitly. For example, instead of [Profit %], use round([Profit %],2).
v Recalculate numbers every time instead of reusing calculations that mightcontain rounded off decimals.
There might be additional considerations for Microsoft Analysis Services2005/2008, especially when comparing report results from different runs (ashappens in Lifecycle Manager). Refer to Microsoft documentation for moreinformation.
HRESULT= DB_E_CANTCONVERTVALUE Error When Filteringon a _make_timestamp Column
You cannot filter on a _make_timestamp column, and the following error messagesappear:
UDA-SQL-0114 The cursor supplied to the operation "sqlOpenResult" is inactive
UDA-SQL-0206 The OLEDB driver returned the following value: HRESULT=DB_E_CANTCONVERTVALUE
RSV-SRV-0025 Unable to execute this request
The solution is to apply the filter after aggregation and not before.
Problems Running ReportsThe topics in this section document problems you may encounter when viewing orrunning reports.
Report Runs SlowlyThe following is a list of questions that will help you to troubleshoot a slow report.v Does your IBM Cognos environment conform with the supported environments?v Has the report always been slow or did it recently become slow?
If it recently became slow, can you identify an event that occurred just before thereport began to run slowly? Events could include changes to configurationsettings, changes to tuning settings, a recent upgrade where your previoussettings have not been applied, an introduction of firewalls or proxies, changesto existing firewalls or proxies, changes to virus scans on temp directories, ortemporary table space restrictions on the database. This event could have causedthe change in report performance.
v Is the performance slow for all reports or just one report?If all reports are slow, the issue may be due to your environment or database. Ifall reports from a specific package are slow, the issue may due to the modeldesign. If just one report is slow, the issue may be due to a specific reportelement.
v How many queries does your report contain?The number of queries on the report will proportionally affect the reportexecution time.
v Does the report run slowly for everyone, or just for one user?
488 IBM Cognos Report Studio Version 10.2.1: User Guide

If the report runs slowly for just one user, the issue may be due to something inthat user's environment, such as virus scanning, page file size or locationsettings, or their location on the network.
v Is the report burst or run often by many people?If many people are running the same report at the same time, you may need toscale your environment or consider using dispatcher routing rules to direct allrequests for a specific package or group of users to a specific server or servergroup. For more information, see the IBM Cognos Business IntelligenceAdministration and Security Guide.
v Do your queries require local processing?The following report elements require local processing: crosstabs and charts,master relationships, unions or joins, multiple fact queries, bursting, andnon-vendor specific functions. Local processing requires the IBM Cognos serverto compute operations on the result set returned by the database, which canimpact the SQL execution time.
v Does your environment use a Custom Authentication Provider?Using a Custom Authentication Provider could cause a memory leak if the codeis not destroying objects correctly.
v Have you reviewed the logs in the c10_location/logs directory and the auditlogs?They may help you identify the source of the problem. Monitoring yourprocesses, such as the Java and Business Intelligence bus processes could alsoidentify excessive memory use.
v Is your environment tuned correctly?For more information, see the Performance Tuning Settings for IBM Cognos 8Business Intelligence and the IBM Cognos 8 Business Intelligence PerformanceTuning Cheat Sheet documents.
v Have you recently upgraded?Ensure that any tuning settings that were applied to your previous installationare applied to the new environment. Ensure that your models have beenverified, upgraded, and republished. Verify that the IBM Cognos FrameworkManager governor that allows enhanced model portability at runtime is notenabled. Depending on your upgrade method, you may also need to open andsave the reports again after upgrading.
The following tips may help you improve report performance.v Change the order in which items are queried from the database. For more
information, see “Working with Relational Queries” on page 236 or “Workingwith Dimensional Queries” on page 283.
v Create sections without creating master detail relationships. For moreinformation, see “Divide Data into Sections” on page 218.
v Share queries between lists and repeaters.You can share an identical query between data containers that use it. To share aquery, data containers must be lists, repeaters, or repeater tables and must usethe same grouping structure and list of properties. The data containers cannot bepart of a master detail relationship. Sharing queries improves performance byminimizing the number of queries executed against the database.To share a query, set the Share Result Set property for the data container to Yes.
v Convert queries to SQL. For more information, see “Convert a Query to SQL”on page 247 for relational reporting or “Convert a Query to SQL” on page 297for dimensional reporting.
Appendix B. Troubleshooting 489

v Avoid using functions with limited support, as indicated by the quality ofservice indicators. For more information, see “Insert a Query Calculation” onpage 250 for relational reporting or “Quality of Service Indicators” on page 537for dimensional reporting.
v Be aware of the limitations of creating expressions with SAP BW data sources.For more information, see “Using Microsoft Excel Functions with SSAS 2005Data Sources” on page 539.
v Use Select & Search prompts instead of value prompts if your list of prompts islong. For more information, see “Build Your Own Prompt and Prompt Page” onpage 315.
v Provide your own prompt values in a prompt to avoid accessing the database.For more information, see “Specify Prompt Values” on page 324.
v Suppress null cells using filters. For more information, see “Suppress Null CellsUsing Filters” on page 391.
v Set page breaks without creating master detail relationships. For moreinformation, see “Create a Page Break or Page Set” on page 437.
v Do not modify IBM Cognos Analysis Studio set definitions. For moreinformation, see “Analysis Studio Query Specification” on page 454.
v Do not put filters on non-identifiers.v Avoid combining large hierarchy levels and sets in a drill-through report in a
way that creates large queries. For more information, see “Recommendation -Drilling Down in Very Large Data Sources” on page 310.
v Use database functions when possible. For more information, see Appendix F,“Using the expression editor,” on page 555.
v Use fixed width objects in PDF reports by setting their Size & Overflowproperties. For more information, see “Set List Properties” on page 63, “SetCrosstab Properties” on page 69, “Customizing Chart Properties” on page 104,or “Set Map Properties” on page 163.
The following are Proven Practices (www.ibm.com) documents that may help youimprove your report performance.v Performance Tuning Settings for IBM Cognos 8 Business Intelligencev IBM Cognos 8 Business Intelligence Performance Tuning Cheat Sheetv Writing Efficient OLAP Queriesv Cognos 8 Business Intelligence (BI) on IBM AIX® best practicesv IBM Cognos ReportNet and Java Heap
The IBM Cognos Business Intelligence Installation and Configuration Guide alsoincludes a section on performance maintenance.
Summaries in a report do not correspond to the visiblemembers
If a crosstab or chart created in IBM Cognos Report Studio using a dimensionaldata source has a context-dependent set function such as filter or topCount on anedge, summaries do not correspond to the visible members.
This problem occurs because a summary that has the Use Set Aggregation set toYes, which produces an expression that contains the within set clause, uses a setthat is dependent on the members that it intersects with on the opposite edge. Forexample, the following crosstab has the top three products returned as columns.The expression used to generate the columns is
490 IBM Cognos Report Studio Version 10.2.1: User Guide

topCount ([Product],3,[Return quantity])
where [Product] is the level.
The summary values for Total and Minimum for all rows except Central Europedo not correspond to the member values in the crosstab. This means that the topthree products returned in all regions except for Central Europe are not Bug ShieldLotion, Bug Shield Extreme, and Sun Shelter 30. Note that the summary values forTotal and Minimum for all columns do correspond to the visible member values.That is because those summary values represent the total and minimum quantitiesreturned for those three products in each region.
You can see what the top three products returned in each region are by draggingthe columns to the right of the rows.
Figure 60. A crosstab showing that the summary values for all rows do not correspond to thevisible members.
Appendix B. Troubleshooting 491

To obtain summary values that reflect the visible members, modify the expressionof the data item containing the context-dependent set function so that it includes atuple that is locked to the default member of every hierarchy that appears on theopposite edge. For this example, modify the expression to the following:
topCount ([Product],3,tuple([Return quantity], defaultMember([Retailer site])))
where [Product] is the level and [Retailer site] is the hierarchy.
When you run the report, all summary values reflect the visible members in thecrosstab.
Figure 61. A single-edge crosstab showing the Total Returned Products and MinimumReturned Products for each region
492 IBM Cognos Report Studio Version 10.2.1: User Guide

Cannot Find the Database in the Content Store (ErrorQE-DEF-0288)
You cannot retrieve data from the selected database when running a report fromIBM Cognos Query Studio, IBM Cognos Connection, or Report Studio.
The following error message appears:
QE-DEF-0288 Unable to find the database...
If this error does not occur when you are logged on as an administrator, then tosolve the problem, ensure that the user has permissions to the signon embedded. Ifthis error always occurs, the data source has not been created. Create the datasource with the name mentioned in the error message.
Parse Errors When Opening or Running an Upgraded ReportEarlier versions of ReportNet and IBM Cognos Business Intelligence included thecast_Date function for reports that run on an Oracle database. This function doesnot exist for Oracle in IBM Cognos 8.1.2 MR1 and later versions. If a report thatuses an Oracle database includes the cast_Date function, parse errors will bereceived when you try to open or run the report.
Overflow Error Occurs When a Value in a Crosstab Is MoreThan 19 Characters
In a crosstab report, values support a maximum of 19 characters, including thedecimal point. If a value exceeds 19 digits, an overflow error occurs. By default,the decimal precision is set to 7 digits, which restricts the number of integers to 11digits.
To use more than 11 integers, you must edit the qfs_config.xml file in thec10_location\configuration directory. For more information, see the section aboutreducing decimal precision in the IBM Cognos Business Intelligence Administrationand Security Guide.
The ORA-00907 Error Appears When Running a ReportWhen using an Oracle 9.2 data source, under certain circumstances, multiple ornested join operations may fail and produce the following error.
Figure 62. A crosstab showing the return quantity of products in different regions of the world
Appendix B. Troubleshooting 493

ORA-00907: missing right parenthesis
A query that uses both a left outer join and an ON clause condition returns zerovalues instead of null values.
A Report or Analysis Does Not Run Because of Missing ItemsYou attempt to run a report or analysis and a message indicates that one or moreitems are missing or changed. Each missing item is listed by its MUN (memberunique name). The MUN includes the complete path within the hierarchy for the
item. When you place your cursor on an item in the Source tab , the MUN forthat item is displayed in a tooltip. This situation may occur if members have beenremoved from or changed in the data source. It may also occur when you attemptto run a report that uses items to which you do not have access. For example, anadministrator may create an analysis that includes items that you do not have thecorrect permission to access.
The solution is to find a suitable replacement in the Source tab, and drag it to theNew Item column. The report or analysis will then run.
Cannot View Burst ReportWhen you burst a report, each burst output is sent to the associated list ofrecipients.
If a list of recipients contains invalid entries, the following occurs:v The burst output is not saved to IBM Cognos Content Manager.
Consequently, you cannot view the burst output in IBM Cognos Connection.v If you choose to send the output by email, only valid recipients will receive an
email. Although the output is sent as an attachment if you select the Attach thereport check box, no link is generated if you select the Include a link to thereport check box.
v The following error message appears in the run history for the report, whereparameter 1 is the burst key, parameter 2 is the list of recipients, and parameter3 contains the error messages returned by Content Manager:An error occurred while saving the output for the burst instance <param type="string"index="1"/> with the recipients (<param type="string" index="2"/>). Here are thedetails: <param type="string" index="3"/>
Note: The list of recipients includes both the valid and invalid recipients.
For example, a report is set up to burst on Country or Region, and the recipientsare managers. Running the report produces the following countries and regionsand recipients:v Canada: John, Maryv US: Peter, Frankv France: Danielle, Maryse
Frank is an invalid recipient. The burst outputs for Canada and France are savedto Content Manager, but not the U.S. output. If you choose to send an e-mail toeach recipient and you selected the Include a link to the report check box, thee-mail to Peter will not contain a link to the output for US. The error message thatis generated will contain Peter and Frank as values for parameter 2 with noindication as to which is invalid.
494 IBM Cognos Report Studio Version 10.2.1: User Guide

Procedure1. View the error message in the run history for the report.2. From the list of recipients, determine which recipients are invalid.
You may need to consult with your administrator to find out which recipientsare invalid.
3. Correct or remove the invalid recipients.Correcting or removing invalid recipients will depend on how the list ofrecipients was defined, such as through a calculated field or a burst table.
4. Run the report again.
A report upgraded from ReportNet does not retain its originallook
When you upgrade a report to IBM Cognos Business Intelligence, a new style sheetis applied that changes the look of the report.
To preserve the formatting that was used in the original report, you can select adifferent style sheet. This retains the original look of the report and specifies thatany new items added to the report, such as list columns or crosstab levels, havethe original formatting applied to them.
Procedure1. In IBM Cognos Report Studio, from the File menu, click Report Properties.2. Click Report styles and select 1.x styles.
Measure Format Disappears in SSAS 2005Microsoft SQL Server 2005 Analysis Services (SSAS) does not propagate formattingthrough calculations. IBM Cognos compensates for this whenever possible, butcannot guarantee to do so in all cases. As a result, if you are working with aMicrosoft SSAS cube, any calculation (other than a non-count summary) that isbased on or intersects with a formatted measure, such as a currency, may lose themeasure format. This may also happen if you use a detail filter or context filter(slicer).
For example, a crosstab includes members on one edge and a measure withformatting, such as a currency symbol and decimal places, applied on the otheredge. When you run the report, you see the formatting for each cell. However, ifyou add a detail filter, such as measure > 1 and run the report, all the formattingdisappears.
Additionally, the fine details of the MDX generated by IBM Cognos BusinessIntelligence can change from release to release. As the SSAS behavior depends onthe MDX generated, the loss of formatting in reports might not occur in a futurerelease.
To avoid this problem, specify explicit formatting for the affected row, column, orcell.
Drill-through Links are Not Active in the Safari BrowserWhen viewing a PDF report in the Macintosh Safari browser, you cannot openhyperlinks. This is because the Macintosh Safari browser does not have thenecessary Adobe Acrobat plug-in.
Appendix B. Troubleshooting 495

To avoid this problem, use the HTML format when creating drill-through reportsthat may be viewed in Safari.
Data Does Not Appear in a Target Report or the Wrong DataAppears
If no data appears when you drill through to a target report or if the wrong dataappears, the problem might be data source conformance. The business keys mightbe different or might be mismatched.
For example, the business key for Camping Equipment might be 100 in the datasource for the source report and 1 in the data source for the target report, in whichcase no data appears in the target report. Another example might be that thebusiness key for Camping Equipment is 100 in the data source for the sourcereport but, in the data source for the target report, 100 is the business key for GolfEquipment, in which case the wrong data appears in the target report.
To solve the problem, ensure that business keys have the same value in both datasources. If there are cases where data does not appear to match, contact yourdatabase administrator or data modeler.
For more information about data source conformance, search for "conformeddimensions" and "business keys" in the IBM Cognos Transformer User Guide.
You might also want to see “Unexpected or Empty Results When DrillingThrough” on page 503.Related concepts:“Conformed Dimensions” on page 420If you work with more than one dimensional data source, you may notice thatsome dimensions are structured the same, and some are not.“Business Keys” on page 421When drill-through access is defined from a member to a relational value, thebusiness key of the member is passed by default.
A Running Total in Grouped Reports Gives UnexpectedResults
You have a running total calculation in a grouped report that returns unexpectedvalues.
Because tabulation of the running total calculation depends on the order in whichthe grouping is executed, you must ensure that the grouped totals are tabulatedbefore applying the running total.
To ensure that the grouping is executed in correct order, define a running totalcalculation as a freestanding calculation outside the query subject in IBM CognosFramework Manager, and ensure that the Regular Aggregate property is set toAutomatic.
This may also be an issue with other running, moving, and ranking aggregations.
PCA-ERR-0057 Recursive Evaluation ErrorYou run a report and encounter the following error.
496 IBM Cognos Report Studio Version 10.2.1: User Guide
PCA-ERR-0057 Recursive evaluation has exceeded limit. Calculated member trace:COG_OQP_USR_Aggregate(Retailer Type): COG_OQP_INT_m2: COG_OQP_INT_m1:COG_OQP_USR_Aggregate(Retailer Type): COG_OQP_INT_m2: COG_OQP_INT_m1:COG_OQP_USR_Aggregate(Retailer Type): COG_OQP_INT_m2: COG_OQP_INT_m1:COG_OQP_USR_Aggregate(Retailer Type): COG_OQP_INT_m2: COG_OQP_INT_m1
You may encounter this error when two or more data items form a recursiveevaluation. For example, in the above error, the calculation of Aggregate(RetailerType) is dependent on a column expression while at the same time the columnexpression is dependent on Aggregate(Retailer Type). Therefore, the cyclicrelationship cannot be resolved.
To avoid this problem, ensure that calculations do not have cyclic relationships.
Arithmetic Overflow Error When Running a Report in PDFFormat
If you use a Microsoft SQL Server 2005 data source and your report includesaggregations, you may encounter the following error when you run your report inPDF format:
RQP-DEF-0177 An error occurred while performing operation 'sqlOpenResult'status='-28'. UDA-SQL-0114 The cursor supplied to the operation "sqlOpenResult" isinactive. UDA-SQL-0564 [Microsoft OLE DB Provider for SQL Server] Arithmeticoverflow error converting expression to data type int. (SQLSTATE=22003,SQLERRORCODE=8115)
This error occurs because the action is performed in the database, and the databasedata type is too small.
This error did not occur in IBM Cognos Business Intelligence version 8.3 or earlierbecause aggregation was processed locally, by the Business Intelligence server. Inversion 8.4 or later, aggregation is processed at the database level.
To avoid this problem, increase the size of the the database data type.
RQP-DEF-0177 An error occurred while performing operation'sqlPrepareWithOptions' status='-69' UDA-SQL-0043 Error
You cannot run a report in IBM Cognos Report Studio or IBM Cognos QueryStudio, and the following error messages appear.
RQP-DEF-0177 An error occurred while performing operation 'sqlPrepareWithOptions'status='-69' UDA-SQL-0043 The underlying database detected an error during processingthe SQL request.[NCR][ODBC Teradata Driver][Teradata Database] Partial stringmatching requires character operands
These error messages do not indicate an IBM Cognos Application Firewallproblem.
There is a problem with your data source not converting numeric data items. Askyour administrator to consult the topic Enable Conversion of Numeric Search Keys toStrings in Queries in the IBM Cognos Business Intelligence Administration and SecurityGuide.
Appendix B. Troubleshooting 497

Unable to View Active Reports in Mozilla FirefoxWhen you try to view an active report in the Mozilla Firefox browser, you may seea blank page or a message such as the one below appears.
Your report is ready and will download to your Web browser in a few moments.
However, the report never appears. This problem occurs in the following scenarios:v You try to open the saved output of an active report in IBM Cognos Connection.v You try to run an active report from within IBM Cognos Report Studio.
The issue is with the UnMHT add-on, and was reported on the UnMHTWarehouse Web site.
A solution was implemented for each scenario above to work around the issuewhen using the Mozilla Firefox browser.v When you try to view an active report in IBM Cognos Connection, instead of
opening directly, the download dialog box appears, prompting you to open orsave the report.
v In Report Studio, the default action is Download Active Report when clicking
the run report button .Note that if you click the drop-down arrow and choose Run Active Report, thereport will not render.
Problems with viewing saved Active Report output in MozillaFirefox 8 or later versions
When you try to view saved Active Report output in Mozilla Firefox 8 or later, youreceive errors. The problem also occurs when you try to insert a saved activereport in a workspace in IBM Cognos Workspace.
No problems occur when you use an earlier version of Firefox. In Firefox 8 andabove, you see the following errors:
Error: ReferenceError: HTMLIsIndexElement is not defined
Error: TypeError: _IS1 is undefined
The problem occurs because HTMLISIndexElement was deprecated as of Firefox 8.To resolve the problem, rerun the active report and create a new saved outputversion using IBM Cognos Business Intelligence 10.2.1 or later.
Tip: If you must rerun many active reports, you can create a job in IBM CognosConnection to run multiple reports. For more information, see the IBM CognosConnection User Guide.
Problems with large SAP BW queriesWhen you are working with an SAP BW data source, if your report includes a dataset greater than 1,000,000 cells, you might encounter an XQE error.
XQE-CON-0007 XQE error encountered: XSB-ERR-0022 Execution of MDX failed:XSB-ERR-0038 SAP Error executing BAPI BAPI_MDDATASET_SELECT_DATA:com.cognos.xqe.data.providers.olap.sbwodp.bapi.JBapiSAPException: RFC Error:MDX result contains too many cells (more than 1 million).
498 IBM Cognos Report Studio Version 10.2.1: User Guide

To avoid this error, set the Processing property for the query to Limited Local.This option allows the report to process locally.
Master Detail or Burst Reports with Charts or Crosstabs MayResult in Denial of Service
When running a master detail or burst report that includes a chart or crosstab, diskspace exhaustion may cause the report or other requests to fail. A large set of burstkeys or master rows may produce one or more charts per detail, resulting in manymaster detail executions. This may cause the temp folder to accumulate manygigabytes of temporary files containing data required for successful chartrendering.
To avoid this issue, we recommend that you test large master detail or burstreports that include charts or crosstabs to determine the potential peak diskrequirements for the report.
PCA-ERR-0087 error when you run a large reportYou run a large report and you receive a PCA-ERR-0087 error that indicates thatthe report exceeds the maximum number of tuples allowed.
PCA-ERR-0087 The "crossJoinSet" operator is not applicable. The limit on the number oftuples per edge has been exceeded (<value>).
This error appears when there is an item in a query that has no relationship to therest of the data or does not make sense in the query.
To resolve the problem, review the query for unrelated items. If an item is found,redesign the query or apply a filter on the item to reduce the number of resultsreturned.
If you still receive the error, ask your administrator to modify the maximumnumber of tuples setting in IBM Cognos Business Intelligence. The setting is anXML attribute named maxTuplesPerEdge. For more information, see the IBMCognos Business Intelligence Administration and Security Guide.
Differences in the appearance of charts that are run indifferent formats or on different operating systems
IBM Cognos Report Studio charts can appear differently when reports are run indifferent formats or on different operating systems. For example, donut and piecharts can appear smaller in reports that are run on the Linux on System z®
operating system compared to the Windows operating system.
The differences in appearance occur only with Report Studio default charts. ReportStudio legacy charts are not affected. When default charts are rendered in HTMLor PDF, the following font-related problems might occur.v The font that is used in HTML output is different than the font used in PDF
output.v Some chart items appear misaligned. For example, a pie chart might show
smaller pies in PDF output than in HTML output.v The font that is used in the chart is different from the expected font.v The font that is used in the chart is different when you run the chart in different
operating systems.
Appendix B. Troubleshooting 499

There are two possible causes to the font-related problems.v The Java Runtime Environment (JRE) used by IBM Cognos Business Intelligence
did not find the font that is specified in the chart, and substituted the font witha different font.
v An unknown default font is specified.
To resolve the problem, ask your administrator to configure JRE to find theinstalled fonts on the Cognos BI server. There are two ways that you can configureJRE to find the installed fonts:v Copy the installed fonts to the jre/lib/fonts folder.
For example, to use the Cognos BI default font Andale WT, copy Andalewt.ttffrom the c10_location/bin/fonts folder to jre/lib/fonts.
v Configure the JRE font search path to point to the location where the fonts areinstalled.On AIX, set the shell environment variable JAVA_FONTS=<list of directories>
Tip: Setting this variable is equivalent to setting the properties java.awt.fontsand sun.java2d.fontpath.
The default fonts configuration in your Cognos BI server default style sheet canalso cause font-related problems, particularly when the operating system is UNIX.On UNIX systems, fonts must be purchased and installed. To ensure that a specificfont is used, perform one of the following tasks:v Ask your administrator to update the Cognos BI server default style sheet to
reflect the fonts that are installed on the server.v Update the chart fonts that are used in your report to use that font, and do not
rely on any default fonts.
Tip: For information about changing the default font for reports, see the technoteHow to change the default font for reports in Cognos 8 BI in the IBM Cognos CustomerCenter (http://www.ibm.com/software/data/cognos/customercenter/).
Out-of-memory errors with reports that are run in interactiveHTML format
Out-of-memory errors occur when you run a report in interactive HTML format.The errors do not occur when you run the report in other formats, such as PDF orsaved HTML.
Out-of-memory errors occur in reports that contain many objects that requirememory intensive processing, such as crosstabs and charts that are linked togetherwith master-detail relationships. Running reports in interactive HTML canconsume more memory than running reports in other formats. When a report isrun in interactive HTML, data sets are kept in memory for all pages in the report.For report formats like PDF, data sets are released from memory after the report isrendered.
Under certain conditions, you can exceed the memory limitations of a 32-bitconfiguration of the Cognos BI server report server component when you interactwith an interactive HTML report. For example, scrolling through a report page bypage or drilling up or drilling down can consume more memory and processingcapacity in interactive HTML than in other output formats.
500 IBM Cognos Report Studio Version 10.2.1: User Guide

Charts in PDF Output Show Unexpected ResultsCharts, when viewed in PDF output, have different levels of interaction support,depending on the version of Adobe Acrobat Reader and the style of chart element.
Adobe Reader version 5 does not support tooltips. Drill up and down and Go tolinks have limited support, due to technical limitations. Only rectangular areas incharts, such as bars, columns, horizontal labels on the axis, or legend labels can beenabled for drill or Go to interaction. Non-rectangular areas, such as pie slices inpie charts, cannot be enabled for drill or Go to interactions.
Adobe Reader version 6 and 7 supports tooltips, drill up and down, and Go tolinks for all chart types. When chart elements overlap or are separated by only afew pixels, the interactive region may be smaller than the area shown.
Result set of a multi-fact query contains blanksThe result set of a multi-fact query contains blanks in some columns, even thoughthere is a conformed dimension that should join the records from both fact tables.
When IBM Cognos Business Intelligence processes a multi-fact query, it breaks itup into two single fact queries (each with items from a single star in the starschema), then stitches the results of both of those queries together to create a singleresult set. You can see the two queries and stitching in the native SQL generatedfor the multi-fact query in Report Studio.
Stitching these queries together is not the same as joining tables in the model.Stitching the two sides together requires a stitch key that exists in each single factquery as a unique value for the row. The rows from the two single fact queries arethen matched 1:0, based on the stitch key values. The stitching must be 1:0.Otherwise, you can get double counting of measure data, or exclude rows thatshould be included. The stitching also means that it is possible for a row from oneof the single fact queries to not have a corresponding row from the other singlefact query, leading to blanks in the result set.
When the fact tables contain non-conformed dimensions between them, there is nota suitable stitch key among the query items selected. As a result, IBM Cognos BIcreates one using RSUM, and joins the results of the two queries. For moreinformation, see the topic Multiple-fact, Multiple-grain Query on Non-ConformedDimensions in Guidelines for Modeling Metadata Guide.
When there is a conformed dimension, it is still possible to not have a suitablestitch key, depending on what items are used in the query and other model designfactors. In such cases, IBM Cognos BI uses the conformed dimensions and the rownumbers from the results of each query to create a stitch key. If one single factquery returns more rows than the other, there are blanks in the result.
To resolve the problem, it might be possible to avoid splitting the query bychanging the model. For more information, see Resolving Queries That Should NotHave Been Split in the Framework Manager User Guide. If you cannot avoid splittingthe query and the report needs these two result sets to be joined differently, createtwo separate, single-fact queries in Report Studio, create a join between them, anddefine the join links and cardinality as needed.
Cognos Statistics object is not displayed in a reportAn IBM Cognos Statistics object is not displayed in a report.
Appendix B. Troubleshooting 501

Each removed statistical object is replaced with an image in the report:
A warning also is displayed in the Upgrade Information window for eachstatistical object that is replaced with the image.
Beginning with IBM Cognos Business Intelligence version 10.2.1, IBM CognosStatistics is no longer available.
To ensure that reports that were created in previous releases and that containstatistical objects run, statistical objects are removed when the reports areupgraded.
Tip: Queries, and their data items, that are associated to statistical objects are notremoved from upgraded reports.
You can use IBM SPSS Statistics to perform statistical reporting and analysis.
Problems When Drilling ThroughThe topics in this section document problems you may encounter when drillingthrough reports.
Cannot Drill Through Between PowerCubes Because MUNsDo Not Match
We recommend that business keys be unique throughout the dimension forPowerCubes. These keys are used as the source value for levels in a hierarchy of adimension. If the values are not unique throughout the dimension, thecorresponding Category Code values may be generated with tildes.
For example, if a category for the Product Line level has a source value of 101 anda category in the Product Type level has a source value of 101, the Category Codevalue for the Product Type level is automatically generated with a unique valuesuch as 101~245. The Category Code values are used in the Member Unique Name(MUN) for each member, for example, [Sales andMarketing].[Products].[Products].[Product type]->:[PC].[@MEMBER].[101~245].
Because these values are generated automatically, they cannot be guaranteed fromone cube build to the next or in a build for another cube with the same dimensionstructure using the same source values. Therefore, drilling from one PowerCube toanother on what appears to be the same member might not work since the MUNsmight not match.
If the MUNs do not match, consult the cube modellers to see if the business keyscan be made unique throughout the dimension. If this is not likely, or might takesome time to resolve, you can use calculations to pass the source value from onePowerCube to another for drill-through.
Figure 63. Image that replaces statistical objects in upgraded reports
502 IBM Cognos Report Studio Version 10.2.1: User Guide

For more information about drill-through access, see the Drill-Through Accesschapter in the IBM Cognos Business Intelligence Administration and Security Guide.
Procedure1. In the target report, create a filter with the following syntax: filter([Hierarchy
or Level], roleValue('_businessKey', [Hierarchy or Level]) =?Parameter?)
For example:filter([Sales Cube].[Products].[Products].[Product type],roleValue('_businessKey',[Sales Cube].[Products].[Products].[Producttype]) = ?Prod Type?)
2. In the source report, create a Query Calculation which is used to pass thebusiness key (source value) to the target report by mapping it to the targetparameter in the drill-through definition. Use the following syntax:roleValue('_businessKey', [Hierarchy or Level])
For example:roleValue('_businessKey',[sales_and_marketing].[Products].[Products].[Product type])
Unexpected or Empty Results When Drilling ThroughWhen you drill from a source report to a target report, there might be no datareturned. This might be the correct result if there is no data that corresponds to thedrill-through selections or if you do not have permission to view the data.
In other cases, if no data or the wrong data appears, the source item might not bemapped to the target correctly or the values in the data sources might not beconformed (the values do not match in both data sources).
If you have the necessary permissions, you can debug drill-through definitions byusing the drill-through assistant from the Go To page (right-click the selection inthe source report and select Go To). You can view the passed source values andthe mapping to the target report parameters. You can use this tool for bothauthored and package drill-through definitions.
You might be able to correct the problem by modifying the parameter mapping inthe drill-through definition. For example, when you drill from a cube to arelational data source, sometimes no data is returned or the wrong data is returnedbecause the business key values in the two data sources do not match. You canchange the drill-through definition to pass the caption of the IBM CognosPowerCube member instead of the business key, but you must also change thetarget report to filter on the corresponding string value and not the business keyvalue.
However, it is best to ensure the data sources are conformed. In this example, thebusiness keys in the cube should match the business keys in the relational source.Filtering on a key is more efficient than filtering on a larger string that may or maynot be indexed in the database.
For more information on data source conformance, search for "conformeddimensions" and "business keys" in the IBM Cognos Business Intelligence TransformerUser Guide.
Procedure1. Ensure that the target report filters on a string value that matches the caption
being passed from the PowerCube.
Appendix B. Troubleshooting 503

2. Edit the drill-through definition as follows:v If the drill-through definition was created in IBM Cognos Report Studio,
open the report, and go to the drill-through definition associated with thedrill-through source object. On the parameter mapping page, select MemberCaption in the Property to pass column.
v If the drill-through definition was created in the source package, go to IBMCognos Connection, Drill-Through Definitions, and open the packagedrill-through definition. On the Target tab of the drill-through definition,select Member Caption in the Property to pass column for the appropriateparameter.
Results
When you drill through, instead of the business key, the caption is passed to thetarget.
You might also want to see “Data Does Not Appear in a Target Report or theWrong Data Appears” on page 496. For more information about drill-throughaccess, see the Drill-Through Access chapter in the IBM Cognos Business IntelligenceAdministration and Security Guide.Related concepts:“Conformed Dimensions” on page 420If you work with more than one dimensional data source, you may notice thatsome dimensions are structured the same, and some are not.“Business Keys” on page 421When drill-through access is defined from a member to a relational value, thebusiness key of the member is passed by default.
Cannot Drill Through From a Relational Source to a CubeBy default, you cannot drill through from a relational data source to a cube. This isbecause a cube expects a Member Unique Name (MUN) as a parameter value andrelational sources do not use MUNs.
Members have properties which include a business key and a caption. If either ofthese match data items within the relational source, drilling through can beperformed as long as the cube target report is authored in Report Studio.
If the source data source has a query item, for example display name, thatcorresponds to a member property in the target cube, for example caption, youmust create the parameter on the caption in the target report.
To pass the data item to the cube target, do the following:v In the cube target report, create a parameter that accepts the caption of the
member. This parameter should be created in a Query Calculation object fromthe Toolbox tab with the following syntax. Type the followingfilter([ Hierarchy or Level],caption([Hierarchy of Level]) = ?Parameter?)
For example:filter([sales_and_marketing].[Products].[Products].[Product line],caption([sales_and_marketing].[Products].[Products].[Product line])= ?Product Line?)
For more information about drill-through access, see the Drill-Through Accesschapter in the IBM Cognos Business Intelligence Administration and Security Guide.
504 IBM Cognos Report Studio Version 10.2.1: User Guide

Calculations Do Not Appear in the Target ReportIf you drill through to PowerPlay Studio from a report in Report Studio, AnalysisStudio, or PowerPlay Studio, calculations on the edges in the target report mightnot appear.
For example, you have a target report with the calculation PersonalAccessories+100 as a column in a crosstab report. When you drill through from asource report to the target report, if Personal Accessories is filtered out of the targetreport (Personal Accessories is not one of the items that is returned on the columnedge), then the Personal Accessories+100 calculation does not appear. PersonalAccessories has been filtered out of the target report and is not available to fulfillthe calculation.
To see the calculations in the target report, ensure the items used in thecalculations are returned in the result set (not filtered out). For more informationand examples, see Understanding Drill-Through Behavior in IBM Cognos 8 atdeveloperWorks (http://www.ibm.com/developerworks/).
Nested Crosstab Only Filters on Some ItemsIf you perform a parameter-based drill-through from a source report to a ReportStudio target report with two or more dimensions nested on a row or column, youmay encounter unexpected results depending on the filters applied to the targetreport.
For example, a target Report Studio report has the following two filters:v [sales_and_marketing_mdc].[Order method].[Order method].[Order method
type]=?Order Method Type?v [sales_and_marketing_mdc].[Retailers].[Retailers].[Region]=?Region?
Order method type and Region both have filters, but Product line does not. Adrill-through definition mapped to the appropriate parameters, in this case Ordermethod type and Region, is created.
When the source report is run and the intersection of Outdoor protection, NorthernEurope, and Telephone is selected to drill through to the target report, the ordermethod type and region display as expected, but all product lines are returned.This is because there are filters on Order method type and Region but not Productline.
For more information and examples, see Understanding Drill-Through Behavior inIBM Cognos 8 at developerWorks (http://www.ibm.com/developerworks/).
Data is Not Filtered in the Target Report After Drill-ThroughYou drill through to a target report, but no filtering occurs in the target report. Forexample, you drill through on a crosstab intersection of Camping Equipment and2010 and expect to see only data for Camping Equipment for 2010 in the targetreport. Instead you see all products for all years. This occurs because the targetreport has no filters for the parameters that were passed.
To solve the problem, ensure that the target report has the correct filters. In theabove example, the correct filters in the target report are Product line and Year.Alternatively, you can enable Dynamic Drill-Through in a package-baseddrill-through definition.
Appendix B. Troubleshooting 505

Drill-through links in active reports do not workWhen viewing an active report that contains drill-through links in MicrosoftInternet Explorer 8 and later, the links do not work.
Clicking on a drill-through link produces an error like the following:
The search path "<drill_through_target_search_path>" is invalid. An object maycontain invalid syntax, or an unsupported character, or the user account in thenamespace may not have sufficient privileges. Check the object to ensure that thetarget destination location does not contain special characters.
Details
CM-REQ-4069 The property "na" is unknown. Replace it with a valid property.
When clicking a link in an active report, you are attempting to move from a localdomain (the active report MHT file on your computer) to the IBM Cognos BusinessIntelligence server's domain. Internet Explorer views this as a potential risk. Toresolve the problem, make the following changes to the security settings in InternetExplorer.
Procedure1. Click Tools, Internet Options.2. Click the Security tab.3. Click Trusted sites and then click Sites.4. In the Add this website to the zone box, type the IBM Cognos BI server's
domain.5. Click Add and then Close.6. Click Custom level.7. In the Scripting section, under Enable XSS filter, click Disable and then click
OK twice.
506 IBM Cognos Report Studio Version 10.2.1: User Guide

Appendix C. Sample Reports and Packages
Sample reports are included with IBM Cognos Business Intelligence. Wheninstalled, you can find them in the Public Folders tab in IBM Cognos Connection.
The Sample Outdoors CompanyThe Sample Outdoors Company samples illustrate product features and technicaland business best practices.
You can also use them for experimenting with and sharing report designtechniques and for troubleshooting. As you use the samples, you can connect tofeatures in the product.
For examples related to different kinds of businesses, see the product blueprints onthe IBM Cognos Information Centers (http://pic.dhe.ibm.com/infocenter/cogic/v1r0m0/index.jsp).
The Sample Outdoors Company, or GO Sales, or any variation of the SampleOutdoors name, is the name of a fictitious business operation whose sample data isused to develop sample applications for IBM and IBM customers. Its fictitiousrecords include sample data for sales transactions, product distribution, finance,and human resources. Any resemblance to actual names, addresses, contactnumbers, or transaction values, is coincidental. Unauthorized duplication isprohibited.
Samples outline
The samples consist of the following:v Two databases that contain all corporate data, and the related sample models for
query and analysisv Sample cubes and the related modelsv A metrics data source including associated metrics and a strategy map for the
consolidated company, and a model for Metric extracts.v Reports, queries, query templates, and workspaces
To run interactive reports, scripts are required. To see all the reports included inthe samples packages, copy the files from the samples content installation intodeployment folder and then import the deployments into the IBM CognosBusiness Intelligence product.
Security
Samples are available to all users.
The Sample Outdoors Group of CompaniesTo make designing examples faster, especially financial examples, some generalinformation about The Sample Outdoors Company is useful.
To look for samples that use particular product features, see the individual sampledescriptions in this section.
© Copyright IBM Corp. 2005, 2013 507

Revenue for The Sample Outdoors Company comes from corporate stores andfrom franchise operations. The revenues are consolidated from the wholly-ownedsubsidiaries. There are six distinct organizations, each with its own departmentsand sales branches. Five of these are regionally-based companies.
The sixth company, GO Accessories:v Has its own collection of products, differentiated from the other GO companies
by brand, name, price, color and size.v Sells from a single branch to all regions and retailers.v Functions both as an operating company based in Geneva, and as a part owner
of the three GO subsidiaries in Europe.
The diagram illustrates the consolidated corporate structure, including thepercentage changes in ownership for GO Central Europe, and shows the reportingcurrency and GL prefix for each subsidiary.
Each corporation has the same departmental structure and the same GL structure,shown in the table. Divisions may not report in the same currencies. For example,the Americas subsidiary reports in US dollars, but the Corporate division localcurrency is Canadian dollars, and the Operations division local currency is pesos.
Figure 64. Consolidated corporate structure
508 IBM Cognos Report Studio Version 10.2.1: User Guide

Table 4. Departmental structure
Division (GL) Department (GL)
Corporate (1700) Sales (1720)
Marketing (1750)
IS&T (1760)
Human Resources (1730)
Finance (1740)
Procurement (1710)
Operations (1800) Production and Distribution (1820)
Customer Service (1820)
Each corporation has a complete chart of accounts. Most of the accounts, such asthose under non-personnel expenses, are at the department level, and contain onlysummary amounts. For example, although each marketing department hasexpenses, the cost is unspecified at the transaction level where marketingpromotions occur.
EmployeesThe Sample Outdoors data contains a full list of employees in all divisions,departments, and locations.
Data is available for reports about bonuses (Global Bonus report) and salescommissions (Sales Commissions for Central Europe report), training (EmployeeTraining by Year report), and performance reviews and employee satisfactionsurveys (Employee Satisfaction 2012). If you use Metric Studio, sample metrics forhuman resources are also available.
In the GO Data Warehouse (analysis) package, groups of measures and the relateddimensions are organized into folders. The employees are organized in hierarchiesfor region and manager, to make different kinds of aggregation easy to report on.Aggregation has been defined for the Employee Position Summary measures, sothat Position count and Planned position count aggregate correctly at each level oftime: monthly, quarterly, or yearly. For example, see the Planned Headcount report.
The employees are also listed in a sample LDIF file which could be used for anyLDAP IBM product authentication including Tivoli®. This authentication directoryis necessary for IBM Cognos Planning samples. No other samples depend onsecurity profiles.
Sales and marketingData about sales and marketing is available for all of the companies in the SampleOutdoors group.
GO Accessories has richer details to support analysis examples. For example, seethe Revenue vs % Profit Margin by Product Brand analysis, based on the Sales andMarketing cube. Marketing and sales campaigns are tied to the Sample Outdoorsregional companies.
Appendix C. Sample Reports and Packages 509

Overall, the GO companies have experienced solid growth across most productlines (Sales Growth Year Over Year), in all regions (Revenue by GO Subsidiary2011), because of factors like an increase in repeat business and new or improvedproducts, such as the high margin sunglasses product line. In the product linessold by the five regional companies (all but GO Accessories) promotions have hadmixed success (Promotion Success by Campaign, Bundle and Quarter). If you useMetric Studio, this can also be seen in the sample metrics.
Customer surveys
The data also contains information from customer surveys. For example, theproduct line that includes bug spray, sun screen, and so on has not been successful(Product Satisfaction - Outdoor Protection 2011) and a source of retailerdissatisfaction may be the level of customer service rather than the returns(Customer Returns and Satisfaction). If you use Metric Studio, this information canalso be monitored in metrics.
Sales outlets
Revenue from the corporate outlets is available at the transaction level. Revenuefrom the franchise outlets is available at the consolidated level only (Sales andMarketing cube). Metrics about retailers show that the number of new retail outletshas dropped over the time period covered by this data.
GO Accessories sells worldwide, and sells only accessories. Transaction data forGO Accessories is the primary source for analysis of product by brand, color andsize. The other five subsidiaries in the group of companies are regional and sell allproduct lines for retailers in their region. For example, the report Top 10 Retailersin 2011 uses sparklines and list data to review revenues at the retailer level.
Sample Outdoors database, models, and packagesThe Sample Outdoors Framework Manager models illustrate modeling techniquesand support the samples.
The models are based on the GO data warehouse and the GO sales transactionaldatabase and are the basis for the sample reports and queries. Each model containstwo packages for publishing analysis (dimensional) and query views of the data.
You must have access to Framework Manager, the modeling tool in IBM CognosBusiness Intelligence, to look at the sample models. You may also need to set upthe sample databases and connections.
GO Data Warehouse
The GO Data Warehouse model, great_outdoors_data_warehouse.cpf, is based onthe database GOSALESDW. It contains data about human resources, sales andmarketing, and finance, grouped into business areas. In the Database view, thethree business areas are grouped into separate namespaces. The Database viewcontains a fourth namespace (GO Data) for the common information.
The Database view is very similar to the structure of the underlying database. Alltables (database query subjects) are unchanged. This enables IBM Cognos BI toretrieve metadata directly from the package in most cases, instead of using ametadata call to the database. The following changes and additions have beenmade in the Database view:
510 IBM Cognos Report Studio Version 10.2.1: User Guide

v Joins have been added as necessary.v To allow for aggregation at different levels of granularity, some model query
subjects have been created. For example, see the relationships between Time andSales or Sales fact.
v To allow single joins to be made between the lookup tables and each level in adimension, lookup tables have been copied. For example, see the Products lookup tables.
The Business view contains only model query subjects, with no joins. Thefollowing changes and additions have been made in the Business view:v Calculations were added to the model query subjects. For example, the time
dimension contains language calculations.v Where the database has multiple hierarchies, new dimensions have been created
to organize each hierarchy. For example, the employee hierarchies are organizedinto several categories, such as manager and region.
The GO Sales transactional database
The GO Sales model, great_outdoors_sales.cpf, is based on the GOSALESdatabase, which is structured as a transactional database. It contains principallysales data.
The Database view is very similar to the underlying database structure. Thefollowing changes and additions have been made in the Database view:v To make it possible to join the fact tables to the time dimension, model query
subjects and multipart joins have been used.v Other joins have been added as necessary.
The Business view contains only model query subjects, with no joins. Thefollowing changes and additions have been made in the Business view:v Calculations were added to the model query subjects.v Model query subjects that were created in the Database view to enable joins on
the time dimension have been linked as reference shortcuts.v Where the database has multiple hierarchies, new dimensions have been created
to organize each hierarchy.v Sales Staff is a subset of the slowly changing Employee dimension. There is no
unique Employee key in GO Sales, so a filter retrieves the current record only.This model does not use historical data.
The samples PowerCubes
The following cubes are delivered with the Sample Outdoors samples in English,French, German, Japanese and Chinese:v sales_and_marketing.mdc
v employee_expenses.mdc
v go_accessories.mdc
v go_americas.mdc
v go_asia_pacific.mdc
v great_outdoors_sales_en.mdc
v great_outdoors_7.mdc
Appendix C. Sample Reports and Packages 511

The samples packages
The Sample Outdoors samples include six packages. A brief description of eachavailable package is provided.
Go Data Warehouse (analysis) is a dimensionally modeled view of theGOSALESDW database. This package can be used in all studios, including IBMCognos Analysis Studio. Using this package you can drill up and down.
Go Sales (analysis) is a dimensionally modeled view of the GOSALES database.This package can be used in all studios, including Analysis Studio. Using thispackage you can drill up and down.
Go Data Warehouse (query) is a non-dimensional view of the GOSALESDWdatabase. This package can be used in all studios except Analysis Studio, and isuseful for reporting when there is no need for drilling up and down.
Go Sales (query) is a non-dimension view of the GOSALES database. This packagecan be used in all studios except Analysis Studio, and is useful for reporting whenthere is no need for drilling up and down.
Sales and Marketing (cube) is an OLAP package, based on thesales_and_marketing.mdc cube.
Great Outdoor Sales (cube) is an OLAP package, based on thegreat_outdoors_sales_en.mdc cube.
Note: The OLAP packages, Great Outdoor Sales (cube) and Sales and Marketing(cube), are not multilingual. The IBM_Cognos_PowerCube.ziparchive contains fiveversions of each package; one in English, French, German, Japanese and Chinese.
Samples in the Sample Outdoors Sales (cube) packageThe following report is found in the Sample Outdoors Sales (cube) package.
Consecutive Periods ComparisonThis report shows the revenue and gross profit for Camping Equipment andPersonal Accessories, as well as quantity for Camping Equipment, in twoconsecutive periods selected by the user.
Samples in the Sales and Marketing (Cube) PackageThe following reports are some of the reports found in the Sales and Marketing(Cube) package.
Actual vs. Planned RevenueThis report shows the actual revenue versus planned revenue by order method andyear. This report is also a target for the measure based scope drill-through fromother reports in the same package.
This report uses the following features:v listsv filtersv multiple prompts
512 IBM Cognos Report Studio Version 10.2.1: User Guide

v groupingv sortingv summarizing
Historical RevenueThis prompted report shows a 13-month rolling forecast of monthly andyear-to-date revenue.
This report uses the following features:v filtersv cascading promptsv combination chartsv axis titles
Revenue by Date RangeThis report shows revenue for a date range that is specified on a prompt page.
This report uses the following features:v listsv crosstabsv context filtersv custom headers and footersv multiple promptsv calculations
Revenue by Product Brand (2011)This report shows the revenue and gross profit by product filtered by the productbrand. There is always product turnover, so the report conditionally highlightsproducts that are discontinued.
This report uses the following features:v listsv filtersv promptsv combination chartsv bar chartsv HTML itemsv groupingv sortingv axis titles
Same Month Prior YearThis report shows sales volume by product line in one or more months. The reportis filtered by a prompt for month. The report generates totals for the selectedmonths and for the same months in the prior year.
This report uses the following features:v crosstabs
Appendix C. Sample Reports and Packages 513

v promptsv custom headers and footers
Selected Retailer Country or RegionThis report uses the revenue from a selected country or region as a baseline valuefor a set of countries or regions. A chart shows the difference in revenue for eachcountry and region as it compares to the base country and region. The report isfiltered by a prompt for country and region.
This report uses the following features:v crosstabsv bar chartsv tables to control where objects appear
Top Retailers by Country or RegionThis report shows the top 10 retailers by country or region. It is used as source fordrill-through to the Total Revenue by Country or Region report.
This report uses the following features:v crosstabsv promptsv filtersv line chartsv prompt pagesv query calculationsv calculationsv singletonsv bar chartsv custom headers and footers
Samples in the GO Data Warehouse (analysis) PackageThe following reports are some of the reports found in the GO Data Warehouse(analysis) package.
Sample reports that were created in Report Studio are located in the Active Reportfolder and the Report Studio Report Samples folder.
Budget vs. ActualThis report shows three years of data by retailer and retailer site for the campingequipment product line. Each year includes budget and actual data.
This report uses the following features:v summarizingv crosstabsv context filters
Core products resultsThis active report shows revenue data for the core products Camping Equipmentand Golf Equipment.
514 IBM Cognos Report Studio Version 10.2.1: User Guide

This list report uses two drop-down list controls to filter data by the followingcriteria:v core productv country or region
Customer Returns and SatisfactionThis report shows the customer satisfaction survey results for Asia Pacific in 2013.It highlights the customers who are the least satisfied. It also provides informationabout customers with the highest number of product returns.
This report uses the following features:v combination chartsv customizing the color and size of a chartv listsv formatting a listv conditional highlightingv filtersv custom headers and footersv colorsv lineagev text itemsv groupingv baselinesv summarizingv calculationsv drilling through
Employee Satisfaction 2012This report shows employee satisfaction survey results by department, comparedto targets and industry standards. It also shows employee rankings andterminations.
This report uses the following features:v crosstabsv conditional highlightingv combination chartsv lineagev text itemsv calculations
Employee Training by YearThis report shows employee training data for the selected year and quarter(s). Abar chart shows training costs by region and a crosstab shows data for the selectedquarter(s).
This report uses the following features:v context filtersv cascading prompts
Appendix C. Sample Reports and Packages 515

v bar chartsv customizing the color of a chartv crosstabsv calculations
Eyewear Revenue by Brand and SizeThis report shows a summary of eyewear revenue by brand and compares twoprompted retailer sites. The report is filtered by prompts for region, retailer type,and year.
This report uses the following features:v promptsv bar chartsv listsv conditional stylesv calculationsv text itemsv custom headers and footersv combination chartsv axis titlesv crosstabsv grouping
Global Bonus ReportThis list report shows employees who received more than $2,500 bonus in a yearby region. It is grouped by country or region. It also shows how much the salestarget was exceeded for each region.
This report uses the following features:v listsv page sets (page breaks by country or region with different sorting and grouping)v multiple prompts and parametersv calculationsv filtersv conditional highlightingv hidden objectsv lineage
GO Balance Sheet as at Dec 31 2012This is the Balance sheet report for Americas where current year data is comparedto the previous year data. Analysts can see negative trends under Variance wherenegative percentages are highlighted.
This report uses the following features:v conditional highlightingv paddingv crosstabsv text items
516 IBM Cognos Report Studio Version 10.2.1: User Guide

v context filters
Sample Outdoors Company Balance Sheet as at Dec 31 2012This report shows a simple balance sheet with assets, liabilities, and equity for 2012with a 2011 comparative. It uses IBM Cognos Workspace Advanced. The IBMCognos Business Intelligence Getting Started guide provides a step-by-stepexample of how to create this report.
This report uses the following feature:v crosstabs
Manager ProfileThis report shows information about managers, including salary, bonuses, and allcompensations grouped by year.
This report uses the following features:v column chartsv listsv groupingv summarizingv custom chart palettev prompts
New order methodsThis active report shows revenue by order method, with focus on the new ordermethods.
This list report has the following features:v check box control that allows you to filter data by new order methodv sorting by year or new order method
Planned HeadcountThis chart report shows headcount variance compared to the plan for eachorganization for 2013.
This report uses the following features:v progressive column chartsv templatesv hidden objectsv custom headers and footersv listsv baselines
Positions to FillThis report shows a list of department names, positions, longest days to fill thepositions, and ranking. The report uses a prompt for the year and is a drill-throughtarget for the Recruitment report.
This report uses the following features:
Appendix C. Sample Reports and Packages 517

v combination chartsv listsv promptsv baselines
Promotion Plan RevenueThis report shows the planned revenue for all the promotions of a selectedcampaign. It is a drill-through target for the Top 10 Promotions by Retailer reportthat is based on the Sales and Marketing (cube) package.
This report uses the following features:v promptsv bar chartsv crosstabsv axis titles
Promotion SuccessThis report shows the financial results of the company's promotions. It shows howmuch of the company's total revenue is attributable to each promotional campaign.
This report uses the following features:v prompt pagesv HTML itemsv summarizingv axis titlesv bar chartsv listsv grouping
Quantity Sold vs. Shipped and InventoryThis report compares the quantity of goods sold and shipped with the openingand closing inventory levels.
This report uses the following features:v filtersv combination chartsv defined y-axesv custom headers and footers
Recruitment ReportThis report shows a variety of recruitment techniques for certain positions ororganizations.
This report uses the following features:v drilling throughv crosstabsv prompt pagesv colors
518 IBM Cognos Report Studio Version 10.2.1: User Guide

v floating object adjustmentv custom headers and footers
Return Quantity by Order MethodThis report shows quantity sold, number of returns, and percentage of returns(with those greater than 5% highlighted) by return reason for each product in theOutdoor Protection product line.
This report uses the following features:v filtersv listsv conditional highlightingv grouping
Returned ItemsThis report shows the number of returned items by return reason and retailer type.A column chart shows returned items by product line and region for the selecteddate range.
This report uses the following features:v date and time promptsv crosstabsv bar chartsv drilling downv text itemsv sorting
Returns by Damage, Failed Orders and Complaints in 2012This report shows quality measures based on product returns.
This report uses the following features:v pie chartsv crosstabsv indented textv singletonsv calculationsv drilling throughv text itemsv custom headers and footers
Returns by Failed Orders in 2012This report shows quality measures based on product returns and focuses on failedorders.
This report uses the following features:v pie chartsv crosstabsv indented text
Appendix C. Sample Reports and Packages 519
v singletonsv drilling throughv calculations, including the tuple function
Returns by Order MethodThis report shows product returns and reasons filtered on the order method. TheGetting Started guide provides a step-by-step example of how to create this report.
This report uses the following features:v bar chartsv promptsv crosstabsv filtersv custom headers and footers
Returns by Order Method - Prompted ChartThis prompted chart report shows product returns and reasons filtered on aprompted order method.
This report uses the following features:v bar chartsv promptsv crosstabsv filtersv custom headers and footers
Revenue by GO Subsidiary 2011This prompted chart report shows 2011 quarterly revenues for each GO subsidiary.
This report uses the following features:v templatesv colorsv promptsv hyperlinksv customizing chartsv singletonsv bar chartsv drilling throughv layout calculationsv pie chartsv calculationsv combination chartsv text itemsv blocksv sorting
520 IBM Cognos Report Studio Version 10.2.1: User Guide

Sales Commissions for Central EuropeThis report shows an annual summary of sales commissions, revenues, and grossprofit for each branch in Central Europe. It also compares actual commissionexpenses with planned commission expenses.
This report uses the following features:v promptsv calculationsv bar chartsv listsv conditional highlightingv drilling throughv custom headers and footersv axis titles
Sales Growth Year Over YearThis report shows annual sales growth in both percentage and dollar amounts.
This report uses the following features:v bar chartsv listsv filtersv sortingv baselinesv axis titles
Sales target by regionThis active report shows sales target by region, including the percentagedifferences between planned and actual revenue.
Succession ReportThis report shows the succession data by department and status for percent readyin a column chart. It also contains a detailed crosstab for the managers associatedwith the possible successors.
This report uses the following features:v drilling through to the Manager Profile reportv filtersv listsv grouping
Top 10 Retailers for 2011This report shows the top 10 retailers for 2011 by revenue and sales target.
This report uses the following features:v bar chartsv listsv filters
Appendix C. Sample Reports and Packages 521

v multiple queriesv combination chartsv line chartsv notesv axis titlesv text itemsv custom headers and footers
Samples in the GO Data Warehouse (query) PackageThe following reports are some of the reports found in the GO Data Warehouse(query) package.
Sample reports that were created in Report Studio are located in the Active Reportfolder and the Report Studio Report Samples folder.
Advertising-cost vs revenueThis active report shows the advertising cost vs revenue by year. Tab controls areused for grouping similar report items.
Bursted Sales Performance ReportThis list report shows how to burst a product sales report to a sales manager forNorthern Europe sales staff. To successfully burst this report, IBM Cognos BusinessIntelligence must be configured to use an email server.
This report uses the following features:v listsv burstingv conditional highlightingv filtersv calculationsv summarizingv blocksv custom headers and footersv sortingv grouping
Employee Expenses (report)This report is used as a data source for the Employee Expenses Power Cube.
This report uses the following feature:v lists
Health InsuranceThis report is used as a data source for the Employee Expenses Power Cube.
This report uses the following features:v listsv filters
522 IBM Cognos Report Studio Version 10.2.1: User Guide

Pension PlanThis report is used as a data source for the Employee Expenses Power Cube.
This report uses the following features:v listsv filters
Regular SalaryThis report is used as a data source for the Employee Expenses Power Cube.
This report uses the following features:v listsv filters
TOC ReportThis report takes advantage of the bookmark object to allow a user to navigatethrough this report easily. This report should be run in PDF or saved HTMLformat. The report contents show a product order table and an expected volumefact table.
This report uses the following features:v listsv bookmarksv background colorv multiple pagesv grouping
Total Revenue by Country or RegionThis report summarizes revenue for Retailer Country or Region and Product Line.It is also a drill-through target for the Top Retailers by Country or Region andRevenue by Order Method reports.
This report uses the following features:v crosstabsv combination chartsv summarizingv tables to control where objects appear
Samples in the GO Sales (analysis) PackageThe following reports are some of the reports found in the GO Sales (analysis)package.
2011 Quarterly Sales ForecastThis report shows the sales forecast by product line and region for each quarter in2011.
This report uses the following features:v listsv summarizing
Appendix C. Sample Reports and Packages 523

v groupingv sorting
2011 Sales SummaryThis report summarizes revenue and gross profit for 2011 and shows the top salesrepresentatives by revenue and quantity sold.
This report uses the following features:v listsv filtersv combination chartsv axis titlesv custom headers and footersv conditions
Samples in the GO Sales (query) PackageThe following reports are some of the reports found in the GO Sales (query)package.
Sample reports that were created in Report Studio are located in the Active Reportfolder and the Report Studio Report Samples folder.
Active Report TechniquesThis report demonstrates common active report and dashboard features andfunctionality.
Briefing BookThis report shows a Briefing Book style of report.
This report uses the following features:v multiple pagesv crosstabsv multiple queriesv filtersv pie chartsv singletonsv tables of contentsv bookmarksv PDF optionsv horizontal paginationv sortingv custom headers and footersv text items
Film stripThis active report shows detailed sales facts in different charts. Deck controls areused for navigation.
524 IBM Cognos Report Studio Version 10.2.1: User Guide

Horizontal PaginationThis report shows crosstabs rendered across several horizontal pages. The firstcrosstab shows the fit-to-page behavior while the second crosstab shows thehorizontal pagination.
This report uses the following features:v multiple pagesv horizontal paginationv crosstabsv custom headers and footers
Matrix-chart and graphThis active report shows a summary of sales facts for each province or state in theAmericas. Clicking a category in the map displays the data in a list.
Order Invoices - Donald Chow, Sales PersonThis report generates invoices for all the sales by Donald Chow.
This report uses the following features:v listsv adding list row cellsv calculationsv formatting tablesv calculationsv filtersv groupingv tables to control where objects appear
No DataEach page of this report presents a different option for dealing with a No Datacondition. It also generates invoices of sales for the Order Invoices - Donald Chow,Sales Person report in the GO Sales (query) package.
This report uses the following features:v crosstabsv custom headers and footersv no datav lists
PDF Page PropertiesThe two pages of this report appear with different Page Orientation (portrait andlandscape) when the report is run in PDF format.
This report uses the following features:v crosstabsv listsv page orientationv PDF options
Appendix C. Sample Reports and Packages 525

v custom headers and footers
Product detailsThis active report shows attributes as color, size, and description for products.
Sales analysisThis active report shows interactions with charts. Clicking a pie series in a chartfilters the product line selected.
Sales DashboardThis active report focuses on sales details by region and product brand. Describesthe top performers and the best performance by region.
Singletons on Page BodyThis report uses singleton results to display information with no data relationshipin the same layout context.
This report uses the following features:v singletonsv tablesv custom headers and footers
Table of ContentsThis report shows two Tables of Contents: one for the main pages and another forthe appendices.
This report uses the following features:v crosstabsv pie chartsv bookmarksv tablesv tables of contentsv custom headers and footersv hyperlinks
Interactive SamplesThe following reports are some of the reports found in the Interactive Samplesfolder.
Bursted Sales Performance ReportThis list report shows how to burst a product sales report to a sales manager forNorthern Europe sales staff. To successfully burst this report, IBM Cognos BusinessIntelligence must be configured to use an email server.
This report uses the following features:v listsv burstingv conditional highlighting
526 IBM Cognos Report Studio Version 10.2.1: User Guide

v filtersv calculationsv summarizingv blocksv custom headers and footersv sortingv grouping
Percentage Calculation (by year)This prompted report shows a percentage calculation based on a particular year.
This report uses the following features:v listsv pie charts
Recruitment ReportThis report shows a variety of recruitment techniques for certain positions ororganizations.
This report uses the following features:v drilling throughv crosstabsv prompt pagesv colorsv floating object adjustmentv custom headers and footers
Revenue by GO Subsidiary 2011This prompted chart report shows 2011 quarterly revenues for each GO subsidiary.
This report uses the following features:v templatesv colorsv promptsv hyperlinksv customizing chartsv singletonsv bar chartsv drilling throughv layout calculationsv pie chartsv calculationsv combination chartsv text itemsv blocksv sorting
Appendix C. Sample Reports and Packages 527

Rolling and Moving AveragesThis report shows the rolling and moving average count for the return quantity. Aprompt uses a macro to provide static choices within a time dimension.
This report uses the following features:v promptsv calculationsv crosstabsv combination charts
Top 10 Retailers for 2011This report shows the top 10 retailers for 2011 by revenue and sales target.
This report uses the following features:v bar chartsv listsv filtersv multiple queriesv combination chartsv line chartsv notesv axis titlesv text itemsv custom headers and footers
Prompt API samplesThe following reports are some of the reports found in the Samples_Prompt_APIfolder.Related reference:Appendix H, “Prompt API for IBM Cognos BI,” on page 975The JavaScript Prompt API provides report authors with a method of customizingprompt interaction in the reports they author.
Clear prompt selectionsThis report demonstrates using the prompt API to clear selections from allprompts.
Date prompt presetsThis report uses the prompt API to provide the user with a set of prompt selectionpresets based on today's date.
Display all prompt values ignoring user selectionsThis report uses the prompt API to display all the values in the prompt, whetherthey are selected or not.
Display user selected prompt valuesThis report uses the prompt API to display the prompt values selected by the user.
528 IBM Cognos Report Studio Version 10.2.1: User Guide

Filter country by letterThis report uses a custom prompt control to provide parameters to filter the report.
Limit date prompt selection by database valueThis report demonstrates limiting the selection of a date to a value less than orequal to a latest date value in a query item.
Limit numeric prompt selection by database valueThis report demonstrates limiting the selection of a value less than or equal to alargest value in a query item.
Limit time between two datesThis report demonstrates preventing the user from selecting a date range greaterthan 10 days.
Limit user selection to two itemsThis report shows how to validate prompt values to stop the user from selectingmore than two items.
Pass parameter via hidden promptThis report demonstrates setting the value of a hidden prompt.
Personal default prompt selections - set selectionsThis report allows the user to save a set of default prompt selections for use insubsequent reports. The prompt selections are saved to browser cookies for reusein other reports.
Personal default prompt selections - use selectionsThis report shows how to use the personal default prompt selections.
Validate prompt values when button pushedThis sample shows how to validate prompt values when a prompt button isclicked.
Validate type-in postal code valuesThe report uses the prompt API to validate user input as the user types.
Validate type-in product line codeThe report uses the prompt API to validate user input as the user types.
Appendix C. Sample Reports and Packages 529

530 IBM Cognos Report Studio Version 10.2.1: User Guide

Appendix D. Limitations when using dimensional datasources
There are limitations when authoring or running reports against dimensional datasources.
Running a Report Against a Dimensional Data SourceYou can cancel a report that is running against Microsoft SQL Server AnalysisServices only during the initial portion of its execution. After this time, the reportruns to completion.
The same behavior applies to SAP BW data sources.
In IBM Cognos Framework Manager, you can also control the number of levelswithin a hierarchy from which members, or values, are extracted from thehierarchy to populate a tree prompt.
For SAP BW, you can reduce the number of hierarchy levels to limit the number ofnodes by setting the SAP BW variable property trimHierarchyLevels to 1. Thisremoves the lowest level from the hierarchy prior to creating the list of nodes.
Units of Measure Notation
When running a report against an SAP BW data source, units of measure areincluded in the same column as the data values, separated by one space. Forexample, Celsius and Fahrenheit notations are appended to the end of the value.
If you see an asterisk character (*), one of the following was detected:v an unknown currencyv a value with an unknown or questionable unit of measure, such as a mixed
currency calculation or rollupMixed currency values occur when you calculate values with differentcurrencies.
This behavior occurs when you are using an IBM Cognos cube as a data source.
This behavior also occurs for SAP BW data sources.
Unsupported SAP Variable Properties
The following SAP variable properties are not supported:v Exclusionary ranges appear as an inclusionary prompt.v Mandatory not initial appears as a mandatory prompt.
When using Business Explorer (BEx) to define variables in your SAP data source,avoid using exclusionary ranges and the mandatory not initial property.
© Copyright IBM Corp. 2005, 2013 531

Limitations When Using Set Expressions in List ReportsIn list reports, we recommend that you avoid using set expressions. When in a list,set expressions, such as TopCount, may produce fewer rows than in thecorresponding crosstab.
For example, the following list report includes Year in the first column, followedby a column containing an expression that returns the top three months byrevenue. Only three rows appear in the report and they correspond to the top threemonths across all years. If you group by Year, the report still shows only threemonths. However, the corresponding crosstab report, you see three months foreach year.
In crosstab reports in IBM Cognos Business Intelligence, set evaluation is alwaysdone in the context of what the set is nested under in the report. However, in listreports set evaluation is done independently of the grouping. For example, if thefirst column contains Country or Region instead of Year, you see the top threemonths for each country or region (across all years) in both cases.
In the case of different dimensions, you can force context independence byreplacing [Revenue] in the topCount expression with tuple ([Revenue], X), where Xis the default member of the hierarchy that contains Month.
However, for nested levels in the same hierarchy, there is no such workaround atthis time.
Limitations When Using Clauses in Summary FunctionsA summary function that uses a for clause may yield unexpected results. Thesemay include error messages, warnings, incorrect numbers, and more or fewer thanexpected rows, columns, or chart points and lines.
Figure 65. a list showing the top three revenue months in 2013 and a crosstab showing thetop three revenue months for each year
532 IBM Cognos Report Studio Version 10.2.1: User Guide

To avoid these problems, ensure that the parameters that follow the for clauseadhere to the following constraints:v Parameters must be simple data item references.v All data items in the parameter list must appear on every list, crosstab, or chart
that uses that summary.v For any edge used in the for clause, data items listed in the for clause must
start with the first data item on that edge.v Data items must be listed in the order in which they appear on each edge of the
report with no gaps.v In crosstabs and charts, there must be no sibling data items that are considered
details. Summaries are normally not considered details.v Section headers must not be included in the parameter list.
If following these constraints does not resolve the problems and your report usesdimensional data with no detail or summary filters, consider using the within setclause instead of the for clause.
Limited Support for Relational Functions When Used with OLAP DataSources
When working with an OLAP data source, we recommend that you not userelational functions, such as substring and concatenation functions, in a report thatalso contains a measure with the Aggregate Function property set to Calculated orAutomatic in the model. If you do so, you may encounter unexpected results. Forexample, some summaries are calculated using the Minimum function instead ofthe aggregate function derived from the individual query items.
In the expression editor, an exclamation mark (!) that precedes a function indicatesthat the function is not naturally supported for that data source. IBM CognosBusiness Intelligence uses a local approximation for that function. Because anapproximation is used, performance can be degraded and the results may not bewhat you expect.
For example, you create an IBM Cognos Query Studio report that contains the dataitems Product line and Retailer site count. The footer summary is set to Calculated.You then insert a calculated column that returns the first three characters of theProduct line item, which uses the relational concatenation function. The footersummary now shows the lowest gross margin value.
Appendix D. Limitations when using dimensional data sources 533

Related concepts:“Summarizing Data Dimensionally” on page 266Summarize data in your reports to obtain totals, averages, and so on.
Limitations When Summarizing Measures in DMR Data SourcesThere are limitations when summarizing dimensionally-modeled relational (DMR)measures and semi-additive measures in crosstabs using the aggregation functioncount distinct, median, standard-deviation, or variance. The followinglimitations can produce empty or error cells when the report is run:v The aggregation function must apply to all members of a level or all children of
a member.v To use OLAP functions in detail filters that are applied to a dimension that is
not in the report, or is at a level below what is being reported, only thefunctions children, level, members, roleValue, and rootMembers will work.
v You cannot define detail filters that reference one or more measures and are setto After auto aggregation.
v You cannot define context filters that have more than one member from adimension that does not appear in the report.
v Context filters that have more than one member from a dimension that appearsin the report produce errors in all cells that are ancestors of the slicer members.
v If a crosstab has a row that is a set of members from one dimension (dimensionA) and another row that is a set of members from another dimension (dimensionB), and a context filter containing members from dimension A is defined, errorcells are produced in the row that contains members from dimension B.
v If a context filter contains members from a dimension, and a crosstab has a rowthat is a set of members from a higher level than the slicer members, error cellsare produced for that row.
v Error cells are produced when drilling down on a crosstab that has two nestedlevels.
If you do not consider these limitations in a calculation, the report may returninaccurate results.
If there is a non-measure calculation that returns a constant or contains a summaryfunction, and the calculation has a lower solve order than the measure beingaggregated, error cells are returned for the aggregated measure.
In list reports, error cells are produced as a result of these limitations if the listuses an OLAP function other than children, filter, level, members, roleValue,and rootMembers.
Limitations When Filtering Dimensional Data SourcesAvoid combining context filters (slicers) with dimensional constructs that involvemembers from hierarchies that are used elsewhere in the report. This combinationgives results that are often not what you might expect and that may change in afuture release.
Dimensional data sources provide implicit rollup at all levels of each dimensionalhierarchy. Context filters and slicers with more than one member invalidate anypre-computed rollup of members at hierarchy levels above the level at which thefilter applies.
534 IBM Cognos Report Studio Version 10.2.1: User Guide

The following types of filtering are safe for dimensional reporting:v Context filters (slicers) with one or more explicit, non-calculated members per
hierarchy, if those hierarchies are not used elsewhere in the report.v Expressions that use the filter function (not in a slicer), comparing measure,
tuple, or attribute values.
Nesting Incomplete Sets
When you nest sets (especially sets of explicit members, and sets that result fromthe functions such as filter and intersect), there may be members at one nestinglevel that have no corresponding members that can appear nested below them. Insuch cases, filtering results may not be what you expect: the higher-lever membersmay or may not appear in the result.
While this is most commonly seen within a single hierarchy, it can also happenacross different hierarchies and dimensions.
To avoid this problem, ensure that the lower-level sets are constructed to ensurethat they are never empty for any of the members in the higher-level set. Forexample, you could filter only the top level set and nest only the complete set ofdescendants at the desired levels below.
Error Characters (--) When FilteringWhen you use slicers or context filters with a calculated fact or measure, you maysee two dashes (--) as values for some or all of the cells in the report that representaggregates that are calculated in the database (aggregation is set to Automatic).This means that the data source is unable to compute these values.
You can avoid this error by using an explicit rollup rule or aggregation functionsuch as Total. However, do this only if you are familiar with the data andabsolutely certain that this is the appropriate answer for that report.
Time Hierarchies
Error characters also appear in summaries if your report includes a time hierarchyand you use two or more members from a different time hierarchy as a contextfilter. To avoid the error, use only one member as the context filter.
Filters in Queries and Sub-queries
For dimensional data sources, filters in queries and sub-queries are consideredequivalent. The same applies to slicers.
Limitations When Specifying the Scope of Summary Filterswith Dimensional Data Sources
When you specify the scope for a summary filter, consider the followinglimitations. The scope of a summary filterv must refer to a grouped data item for list reports. Otherwise, you encounter the
following error:OP-ERR-0212 The summary filter scope (Scope1) found in the query (Query1) is notvalid. It must refer to a grouped query item.
v can refer to multiple data items, but it can refer to only one data item per edgeof the crosstab. Otherwise, you encounter the following error:
Appendix D. Limitations when using dimensional data sources 535

OP-ERR-0213 The summary filter scope (Scope1) found in the query (Query1) is notvalid. Referencing more than one query item from the same edge is not supported.
v must refer to a level and cannot refer to a measure. Otherwise, you encounterthe following error:OP-ERR-0209 The summary filter scope (Scope1) found in the query (Query1) is notvalid. It must refer to a level.
v must refer to a data item that is projected on an edge of the crosstab. If thescope of a summary filter refers to a data item that was deleted from the reportlayout, you may encounter unexpected results. Otherwise, you encounter thefollowing error:OP-ERR-0213 The summary filter scope (Scope1) found in the query (Query1) is notvalid. Referencing more than one query item from the same edge is not supported.
v must refer to unique data items. For example, the summary filter cannot refer tothe same data item more than once.
Limitations When Filtering Data Using an SAP BW DataSource
If you are working with an SAP BW data source, you must consider additionalexceptions when applying filters.
If you apply a filter and a sort to an item that corresponds to the leaf-level of arecursive hierarchy, siblings may appear in the report even though the aggregatedvalues are correct. Siblings are characteristic values with the same parent as thefiltered member.
Each level in an SAP BW hierarchy has an item with the same name as the leveland a role of _businessKey. Such items are known as level identifiers. The levelidentifier must be an exact value for the operators =, <, and > to work. Forexample, for the filter [Office] > 'Chicago' to work, the value 'Chicago' must existin the data source. If you do not know the exact values, you can apply the filter toone of the attribute items associated with the level, such as [OfficeLongName] >'C'. Filters on non-identifiers are possible, but they are slower because SAP BWdata sources are optimized for queries based on level identifiers.
When filtering time-related data, only the level identifier items of the time-relatedcharacteristics in SAP BW, such as 0CALDAY and 0CALMONTH, should be usedfor performing anything other than equality filters. All other (attribute) items inthese hierarchies are formatted string representations of the characteristic valueswith which they are associated. These formatted values sort alphanumerically andnot chronologically.
Using Prompt Expressions in Filters
If you create a filter expression using report item attributes, such as the following,no data is returned.
[ report item attribute ] = ?prompt?
To resolve the problem, do one of the following:v Fully qualify the item by using items from the source tree instead of data items
from the report.v Use prompt controls in the report instead of hand coded prompts.
536 IBM Cognos Report Studio Version 10.2.1: User Guide

Considerations when Creating CalculationsConsider the following information and limitations when creating dimensionalcalculations.
Calculation Solve OrderWhen calculations in the rows and columns of a report intersect, calculations areperformed in the following order: addition or subtraction, multiplication ordivision, aggregation (rollup), and then the remaining arithmetic functions.
The remaining functions are as follows:v absolute, round, average, minimum, maximum, medium, countv percentage, % difference (growth), or % of totalv rank, quartile, quantile, percentile
If both calculations have the same precedence, for example, if they are bothbusiness functions, then the row calculation takes precedence.
You can override the order of precedence by changing the solve order property. Formore information, see “Resolve Multiple Calculations for Crosstabs and Charts” onpage 540.
Length of ExpressionsWhen creating layout calculations that use complex expressions, limit the length ofthe expression to less than 1,000 tokens. A token is a keyword, identifier, constant,or special character symbol that the server identifies when it parses the SQL. Forexample, the expression 1+1+1+1+1+1+1+1+1+1 contains approximately 28 tokens,whereas the expression 1+1+1...+1 (400 times) contains more than 1000 tokens.
Tip: The Sales Commissions for Central Europe sample report in the GO DataWarehouse (analysis) package includes expressions. For more information aboutThe Sample Outdoors Company samples, see Appendix C, “Sample Reports andPackages,” on page 507.
Quality of Service IndicatorsNot all data sources support functions the same way. The data modeler can set aquality of service indicator on functions to give a visual clue about the behavior ofthe functions. Report authors can use the quality of service indicators to determinewhich functions to use in a report. The quality of service indicators are:v not available (X)
The function is not available for any data source in the package.v limited availability (!!)
The function is not available for some data sources in the package.v limited support (!)
The function is available for all data sources in the package but is not naturallysupported for that data source. IBM Cognos Business Intelligence uses a localapproximation for that function. Because an approximation is used, performancecan be poor and the results may not be what you expect.
v unconstrained (check mark)The function is available for all data sources.
Appendix D. Limitations when using dimensional data sources 537

Using Quotation Marks in Literal StringsWhen inserting literal strings in an expression, you must enclose the string insingle quotation marks. If the string contains a quotation mark, it must be escaped.For example, if you want to insert the string ab'c, you must type 'ab''c'.
Limitations of CalculationsYou should use only the expressions and functions available in IBM Cognos ReportStudio, and follow their syntax.
Minimal checking exists for calculations. If your calculation uses an invalidexpression, your report results may contain unexpected values.
In addition, you should define member summaries as follows:
summary_function (currentMeasure within set set_reference)
where set_reference is a level or set inserted from the Source tab .
Unless otherwise required, summary_function should be the aggregate function. Ifyou use an explicit summary function, you may encounter problems withmeasures (such as profit margin, distinct count, and so on) that have complexrollup values, and/or scenario or account dimension members that do not roll up.
Know your data, and confirm with the owner of the cube where overriding theautomatic aggregation is safe.
Because of the above limitations, summaries of calculations may not providereliable values. For convenience, you may have to build reports where rowsummaries and calculated member columns intersect. In such reports, theseintersections may contain unexpected values. In contrast, row calculationsintersecting with column aggregates using the aggregate function are safe becausethe calculation is performed on the reliably summarized values.
Units of Measure
When creating calculations in IBM Cognos Report Studio and IBM Cognos QueryStudio, you may encounter problems with the units of measure. For example, thecalculation Cost*Cost returns the unit of measure * instead of a currency unit ofmeasure. To avoid this problem, change the format of the corresponding column toobtain the desired unit of measure.
Limitation When Using Dimensional Functions with Running andMoving Summaries
IBM Cognos Business Intelligence does not currently support queries that containboth dimensional functions and running summaries or moving summaries. Forexample, when you drill down in a report, the query uses the dimensional functionchildren, which is not compatible with running and moving summaries. Runningand moving summaries are supported for only the overall level of a dimension.
Creating Expressions Using SAP BW Data SourcesYou must consider the following when creating expressions using an SAP BW datasource, or you may not get the results you expect.
538 IBM Cognos Report Studio Version 10.2.1: User Guide

v The case and if/then/else constructs are not supported in filters.v The query item identifier of the leaf-level of the 0CALDAY characteristic and its
presentation hierarchies is of type date. When the values for the query itemidentifier are presented in IBM Cognos Report Studio, they are formatted asdates. These formatted values should not be used in filter expressions. Thecorrect date constant format for use in expressions is YYYY-MM-DD.
v You can apply a comparison expression with an operator other than equals to aquery item that represents a level identifier. However, level identifiers are moreefficient for identifying specific values. Range comparisons must be performedon the IBM Cognos application server, which slows down the performance ofthe report.
Using Microsoft Excel Functions with SSAS 2005 DataSources
If you are working with a Microsoft SQL Server 2005 Analysis Services (SSAS) datasource and you want to use Microsoft Excel VBA functions such asROUNDDOWN in MDX queries, the following Microsoft Office features must beinstalled on the SSAS server:v Microsoft Office Excelv Microsoft Visual Basic for Applications
To see a list of Excel VBA functions, see the Microsoft Web site(http://www.microsoft.com).
If these Microsoft Office features are not installed on the SSAS 2005 server, andyou use Excel VBA functions, you encounter an error such as the following:YK-ERR-0008 The data provider returned an error message: "The'[Excel].[ROUNDDOWN]' function does not exist.".
This error occurs because the OLAP server cannot process the function since Excelfunction libraries are missing.
For more information, see the Microsoft Knowledge Base article # 932214 athttp://support.microsoft.com.
Concatenating StringsWhen IBM Cognos Business Intelligence concatenates strings locally and if any ofthe involved strings contain null values, the result of the concatenation is an emptycell or a null value. This occurs because IBM Cognos BI requires that an expressionthat involves a null value returns a null value. Many databases ignore null stringswhen they perform concatenations. For example, if you concatenate strings A, B,and C, and if string B is a null value, the database may concatenate only strings Aand C.
Intersecting Calculations in Crosstabs and ChartsAn intersection point in a crosstab or chart can contain a value that is derived frommultiple calculations.
If the query expressions for the row and column that intersect in a crosstab bothinclude calculations, the intersecting value is the result of performing bothcalculations. The second calculation is performed on the result of the firstcalculation. If you change the order in which the calculations are performed, theresulting value at the intersection point changes.
Appendix D. Limitations when using dimensional data sources 539

The solve order is a positive numeric value that you assign to data items. Negativevalues are not supported. The data item with the lowest value is calculated first,followed by the next higher value, and so on. The data item with the highest solveorder is computed last. If you do not specify a solve order, the default value of 0 isused. In crosstabs, if more than one data item has the same solve order, columnitems are calculated first and row items are calculated second.
For example, a crosstab contains the columns Revenue, Sales target, and a columnthat calculates the percentage by which actual revenue exceeds target revenue. Thecrosstab contains a row for each Year and a summary row that calculates theoverall totals for each of the three columns. The cell where the percentagecalculation and the overall total calculation intersect contains only one value. Bydefault, IBM Cognos Business Intelligence calculates the column percentage firstand the summary row last. The value that appears at the intersection is therefore asum of the percentages, which is not a meaningful result. The value is moremeaningful if the overall percentage is calculated after the actual and sales targetrevenues are summed. Specifying a solve order for the percentage calculation thatis higher than the overall total calculation gives the following result:
It is not necessary to specify the solve order for the overall total calculation.Because the default solve order is 0, setting the solve order for the percentagecalculation to a value higher than 0 is sufficient.
Nested Calculations in Crosstabs
If a crosstab contains nested calculations, the calculations are performed in thefollowing order by default:1. outermost calculation on the columns2. innermost calculation on the columns3. outermost calculation on the rows4. innermost calculation on the rows
If there are solve order ties, column items are calculated before row items andouter nesting items are calculated before inner nesting items.
Resolve Multiple Calculations for Crosstabs and ChartsIf an intersection in a crosstab or chart contains a value that is derived frommultiple calculations, you can specify the order in which to perform thecalculations. The solve order must be a positive numeric value. The calculations areperformed from lowest to highest solve order value.
Setting the Rollup Aggregate Function property to Calculated for a data itemassigns a solve order that is higher than any other data item in a query unless a
Figure 66. Crosstab showing a calculation that has a solve order specified
540 IBM Cognos Report Studio Version 10.2.1: User Guide

solve order is explicitly specified. If there are multiple data items that have theRollup Aggregate Function property set to Calculated, the normal rules for solveorder apply.
Procedure1. Click the data item for which to specify the solve order.
A data item can have only one solve order value. Consequently, if a data itemis in a query that is used in more than one context and you want the data itemto have a different solve order in each context, you must use a separate dataitem.
Tip: In crosstabs, to specify the solve order for the default measure, click thecrosstab and, in the Properties pane, click the select ancestor button andclick Crosstab. Or you can click the container selector (three orange dots) of thecrosstab to select it.
2. In the Properties pane, set the Solve Order property to an integer value.Tip: To specify the solve order for the default measure, click Default MeasureSolve Order.
Resolve Query Calculations that Intersect with CalculatedMeasures Defined in Microsoft Analysis ServicesMicrosoft SQL Server Analysis Services (SSAS) data sources may include datasource calculations. Because IBM Cognos Business Intelligence cannot predict thepresence of a solve order on such calculations, setting the Solve Order propertymay not resolve the solve order correctly. You can suppress potentially meaninglessresults when querying dimensional data sources that include data sourcecalculations. In the following example, the columns YTD Change and YTDGrowth are data source calculated members and the summary values for these twocolumns were suppressed.
When a query-defined calculated member and a data source calculated memberintersect, the value is the result of performing both calculations. The secondcalculation is performed on the result of the first calculation. Whether the finalvalue is meaningful depends on the order in which the calculations are performed.Because IBM Cognos BI cannot determine the presence of these members ahead oftime, it cannot automatically determine the correct solve order.
In most cases, SSAS 2005 gives the expected results when no solve order is definedin the cube. Therefore, when using SSAS 2005, you do not need to set either theSolve Order property in the query or the Calculation Intersection property.
Figure 67. Crosstab showing revenue by product line with a summary row
Appendix D. Limitations when using dimensional data sources 541

Note: Dimensionally-modeled relational (DMR) data sources query one or moreunderlying relational databases, and therefore cannot contain data sourcecalculations. They are not considered dimensional data sources in the context ofthis topic.
Procedure
1. Pause the pointer over the query explorer button and click the query thatcontains the data item for which to suppress values.
2. In the Data Items pane, click the data item.3. In the Properties pane, set the Calculation Intersection property to Show "Not
applicable".
Results
When a query-defined calculated member and a data source calculated memberintersect, the resulting value is suppressed. If the intersecting members do notcontain data source calculations, the value is not suppressed.
Null (Missing) Values in Calculations and SummariesThe data source that you use determines how null (or missing) values are handledin calculations, summaries, and other expressions.
Null values represent missing data values. For example, a new eyewear product,called Abby, is introduced in 2012. Therefore there are no sales in 2011. If youcreate a report with the years 2011 and 2012, the values for sales of Abby for theyear 2011 are null (missing).
By default, null values appear as blank cells in a crosstab or list report. You canchange the default to specify the display of other characters, such as the word null,by changing the data format of the Missing Value Characters property for the cellsor report. For more information, see “Set the Default Data Formats” on page 387.
Arithmetic Operations
Null values in arithmetic operations yield different results depending on the typeof data source.
In Microsoft SQL Server Analysis Services (SSAS) and Cubing Services datasources, a null value in arithmetic operations is treated as follows:v In operations such as addition (+), a null value yields the same result as zero (9
+ NULL = 9)v In operations such as multiplication (*), a null value yields a null result (9 *
NULL = NULL)
You can accommodate this behavior by using more complex expressions such asthe following:v if ([M] is not NULL, then ([M]) else (0)v if ([M] is not NULL, then (<expression involving M> else NULL)
In relational and other OLAP data sources the result of an operation that includesa null value is always null. For example, 9 + NULL = NULL.
542 IBM Cognos Report Studio Version 10.2.1: User Guide

Equality Comparisons
Equality comparisons, such as equal to (=) and not equal to (<>), compare twovalues and return a Boolean value of true or false.
For all data sources, equality comparisons are treated as tests for missing data.Inequality comparisons are treated as tests for non-missing data.
For example, NULL=NULL is true and NULL=0 is false.
Ordered Comparisons
In ordered comparisons, such as rank and quantile functions, null values arehandled as follows.
For relational data sources, the result of the comparison is always false. Forexample, NULL < 1 is false.
For Microsoft SSAS, Cubing Services, and other OLAP data sources, the null valueis treated as zero. For example, NULL < 1 is true.
Boolean Functions
In Boolean operations, such as or, null values are handled as follows.
For relational and dimensionally-modeled relational data sources, the result of aBoolean operation is always null. Boolean functions are used in conditions and thenull result is treated as a false condition. For example, NULL OR TRUE = NULL(FALSE)
For Microsoft SSAS, Cubing Services, and other OLAP data sources, the null valueis treated as if it is false. For example, NULL OR TRUE = TRUE.
Summary Functions
All summary functions, such as aggregate, average, and maximum, ignore nullvalues. For all functions except count, if all values in the expression are null, theresult is null. For count, if all values in the expression are null, the result is zero.
For example, if the value for Quantity for 2013 is 10 and the values for 2011 and2012 are null, then the average is as follows:v average ([Quantity] within set set([2012], [2013] ) ) = 10v average ([Quantity] within set set([2012], [2011] ) ) = NULL
The count is as follows:v count ([Quantity] within set set([2012], [2013] ) ) = 1v count ([Quantity] within set set([2012], [2011] ) ) = 0
String Operations
For all data sources, the result of string operations, such as concatenation (||), thatinclude a null value is always null.
For example, 'A' || NULL = NULL and NULL || NULL = NULL.
Appendix D. Limitations when using dimensional data sources 543

Dimensional Coercion RulesIBM Cognos Business Intelligence uses dimensional coercion rules to automaticallyconvert dimensional types to better match other types. These conversions help youbuild simpler expressions, making them easier to understand. In addition to theimplicit rules that IBM Cognos BI provides, you can make explicit data typeconversions using various functions, such as children.
IBM Cognos BI supports the following types of coercion:v coercion of an object of one dimensional type into another, such as a level into a
member setv coercion of a dimensional object into a numeric, date, time, or string value, such
as a numeric measure into a numeric value
Coercion rules are applied to expressions and data items. In expressions, anoperator or function may require operands to be of a particular dimensional type.When an operand is not of the required type, one or more coercion rules may beapplied to coerce the operand to the appropriate type. Coercion rules may also beapplied to data items to coerce the data item to a collection of members or values.
Function Operands
The following describes how coercion rules are applied to function operands:v If the operand is of the required type, no coercion is required.v If the function operand is supposed to be a numeric value, it is coerced into one.
A coercion rule exists for each type of dimensional object coercion.v If the function operand is supposed to be a dimensional object and a coercion
exists to coerce the operand to the required type, the coercion is applied.v
If no coercion exists, an error message with the code QE-DEF-0478 appears toindicate that an unsupported conversion of a dimensional object from the sourceto target type occurred.
Comparison and Other Symmetric Operators
Binary operators that accept operands of more than one type, such as equals (=)and in, need both operands to be the same dimensional type.
No coercion is possible between value domains (numeric, date, time, and string) orbetween members and values. Consequently, if either operand is a value type, bothmust be in the same value domain and converted explicitly using a function.Otherwise, the query fails.
Members and member set operands are valid only with the operators equals (=),not equals (<>), in, and not in, where the right side of the expression is a member,member set, or prompt. Only the following are valid:v [member / member set] = [member]v [member / member set] <> [member]v [member / member set] = ?p?
v [member / member set] <> ?p?
v [member / member set] in ([member], ...)[member / member set] not in ([member], ...)v [member / member set] in ([member set])[member / member set] not in ([member
set])[member / member set] in ?p?[member / member set] not in ?p?
544 IBM Cognos Report Studio Version 10.2.1: User Guide

Exceptions
For the left operand, member sets are supported in detail and summary filterexpressions, but not in expressions that use the filter function. Members are notsupported in detail and summary filters, but they may be used in expressions thatuse the filter function.
The in_range operator is not supported for members and member sets.
Normal coercion rules apply to these operands.
NULL operands are considered values, rather than members.
Examples
The following examples illustrate how coercion is applied to levels in expressionswith operators.
[Sales].[Products].[].[Product Line] = [Sales].[Products].[].[Product Line]->[OutdoorEquipment]
The left operand is coerced to the following member set:
members ([Sales].[Products].[].[Product Line])
The following expressions are invalid:v [Sales].[Products].[].[Product Line] = NULL
v [Sales].[Products].[].[Product Line] + 1
v [Sales].[Products].[].[Product Line] = ’Canada’v [Sales].[Products].[].[Product Line] > 2000
The following examples illustrate how coercion is applied to members inexpressions with operators. In each of the examples below, the left operand iscoerced to a value of the current cell at this member:
(tuple ([Sales].[Products].[].[Product Line]->[Outdoor Equipment]))v [Sales].[Products].[].[Product Line]->[Outdoor Equipment] = NULL
v [Sales].[Products].[].[Product Line]->[Outdoor Equipment] + 1
v [Sales].[Products].[].[Product Line]->[Outdoor Equipment] > 2000v [Sales].[Products].[].[Product Line]->[Outdoor Equipment] + ’Canada’
Coercion Rules for Dimensional ObjectsThe following table describes coercion rules that are applied when coercing anobject of one dimensional type into another.
Note: Measures and Member Unique Names (MUNs) are considered members.
Source type Target type Result
Measure dimension Hierarchy A measure dimension can beused without any conversionas a hierarchy.
Appendix D. Limitations when using dimensional data sources 545

Source type Target type Result
Measure dimension Member set The member set contains themembers of the measuredimension.
This coercion is done in twosteps. First, measuredimensions are coerced tohierarchies, and thenhierarchies are coerced tomember sets.
Hierarchy Member set A set containing themembers of the hierarchy.
Level Member set A set containing themembers of the level.
The equivalent expression ismembers (level).
Measure Member A measure can be usedwithout any conversion as amember.
Measure Tuple This coercion is done in twosteps. First, measures arecoerced to members, andthen members are coerced totuples.
Measure Member set This coercion is done in twosteps. First, measures arecoerced to members, andthen members are coerced tomember sets.
Member Tuple The tuple consists of themember.
The equivalent expression istuple (member).
Member Member set The set consists of themember.
This coercion is done in twosteps. First, members arecoerced to tuples, and thentuples are coerced to membersets.
Coercion Rules for Numeric and String ValuesThe following table describes the coercion rules for expressions or prompts thatreturn a numeric or string value. These rules apply to functions and operators thatrequire an operand of a particular data type, as well as to binary operators thatrequire operands of the same type.
Source type Target type Result
Measure Number, Date/Time, orString
The result is the value of themeasure at the current cubeintersection.
546 IBM Cognos Report Studio Version 10.2.1: User Guide

Source type Target type Result
Member Number The result is the value of thecell at the cube intersectionspecified by the member.
This coercion is done in twosteps. First, members arecoerced to tuples, and thentuples are coerced to thetarget type.
Tuple Number The value of the cell at thecube intersection specified bythe tuple.
The equivalent expression isvalue (operand or parameter).
Coercion PathsThe following diagram shows how coercion rules are connected. The expressionthat coerces a source node type to a target node type is built by following the paththat connects them. A dotted line indicates a coercion that does not require anexplicit conversion function. This occurs whenever the source type is aspecialization of the target type. For example, every measure is a member so youcan use measures without conversion wherever a member is required.
Recommendation - Use Member Unique Name (MUN) AliasesIf you are working with a dimensional data source, use MUN aliases to simplifybuilding reports and expressions. In addition, you can tie the MUN back to themember in the package.
When working with dimensional data sources, IBM Cognos Business Intelligenceuses MUNs to uniquely identify members. MUNs are very complex. For example,the MUN for the member 2012 might appear as
Appendix D. Limitations when using dimensional data sources 547

[great_outdoors_company].[Years].[Years].[Year]->:[PC].[@MEMBER].[20120101-20121231].
When you build expressions that involve members, the use of MUNs makes theseexpressions difficult to read and maintain.
Tip: To view the MUN of a member, in the Source tab , right-click themember and click Properties.
IBM Cognos Report Studio has an option that automatically generates an alias forMUNs (Tools > Options > Report tab > Alias member unique names). The MUNalias is a data item that has the MUN as its definition. For the previous example,you would see 2012 as the MUN alias in the Expression property for the data item.If the MUN alias is not enabled, you would see the complex MUN as shown abovein the Expression property.
Important: Do not modify or rename MUN aliases, because they will lose theirconnection to their respective members in the package.
Running a Report That Contains MembersIf you are using members in a report and your modeler has updated the datasource in a way that changes member unique names, the following problems mayarise when you run the report.v If the report queries an OLAP data source, you receive an error message
explaining that some specific members cannot be found.v If the report queries a dimensionally modeled relational (DMR) data source, data
items whose member unique names have changed do not appear in the report.Calculations that refer to members that have changed no longer contain valuesfrom the members.
To resolve these problems, you must update the member unique names in thereport. Open the query that contains the members that you need to update inQuery Explorer. Delete the member from the pane in which it appears and reinsertit from the Source tab. For example, if you inserted the member as a detail filter,delete it from the Detail Filters pane and reinsert it.
Limitations When Formatting Empty Cells in SAP BW Data SourcesWhen working with SAP BW data sources, if the SAP BW server administratorconfigured custom formatting for empty cells on the SAP BW server, this customformat does not appear in IBM Cognos Business Intelligence reports. Ask youradministrator to configure the formatting of empty cells in IBM Cognos BI.Related tasks:“Suppress Empty Cells” on page 391Sparse data may result in crosstabs showing empty cells. For example, a crosstabthat matches employees with products results in many rows of empty values forthe revenue measure if the employee does not sell those products.
548 IBM Cognos Report Studio Version 10.2.1: User Guide

Appendix E. Limitations When Producing Reports in MicrosoftExcel Format
There are limitations when producing reports in Microsoft Excel format.
Unable to Load Images from the IBM Cognos Business IntelligenceContent Store in a Report
If a report contains an image whose URL points to the IBM Cognos BusinessIntelligence content store, the Microsoft Excel spreadsheet software generates anaccess violation error and shuts down.
This problem is a known issue in the Microsoft knowledge base, and Microsoft iscurrently investigating the problem. This problem occurs only in Excel 2002.
Blank Worksheet AppearsIf the Microsoft Excel spreadsheet software cannot download a worksheet within atimeout period, Excel may instead open a blank worksheet.
Warning Message Appears When Excel Opens an IBM CognosBusiness Intelligence Report
Each time the Microsoft Excel spreadsheet software opens an IBM Cognos BusinessIntelligence report, a warning message appears.
The warning message is as follows:
Some of the files in this Web page are not in the expected location. Do you want todownload them anyway? If you are sure the Web page is from a trusted source,click Yes.
The Excel workbook in HTML/XML format requires the presence of the filefilelist.xml. IBM Cognos BI does not allow the creation of local files on the clientside. In addition, a local file that contains URLs introduces a security issue.Consequently, this message will appear whenever you open an IBM Cognos BIreport in Excel. If you see this error message, click Yes to open the report.
Spreadsheet Content Not Saved for Reports Saved in XLS FormatIf you open a report that was saved in XLS format or run a report in XLS format,and security settings in your Web browser are set so that you are prompted toopen or save the report, do not click Save. If you save the report, the spreadsheetcontent will not be saved. This is because Microsoft Excel reports in MicrosoftOffice 2000 HTML format use relative paths to the spreadsheets. The relative URLpaths are no longer available when you open a saved XLS report.
Instead, click Open first and then choose to save the report.
© Copyright IBM Corp. 2005, 2013 549

Unable to Load Excel Report in Netscape 7.01This version of IBM Cognos Business Intelligence does not support loadingMicrosoft Excel reports in Netscape 7.01.
Unable to Nest Labels in ChartsCurrently, it is not possible to specify nested labels for the category axis via XML.
Data Series Are TruncatedThe Microsoft Excel spreadsheet software may group data series or categoriesdifferently when compared to a chart produced by IBM Cognos BusinessIntelligence.
A 1 KB buffer limit in Excel limits the maximum number of data series per chart to120. Data series over 120 are truncated.
Colors Different From Those in HTML or PDFIf an IBM Cognos Business Intelligence report contains a chart that uses customcolors, the Microsoft Excel spreadsheet software may not be able to add the customcolor to the Excel color palette. Excel will attempt to match the custom color to oneof its available standard colors. As a result, colors in Excel may vary from thoseseen in HTML or PDF.
We recommend that you use standard colors in charts.
Repeating Pie ChartsIf you have a report that has repeating pie charts and you define a chart title, theMicrosoft Excel spreadsheet software will show each pie with a title that is aconcatenation of the chart title and the data series. For example, if the chart title isQuantity Sold by Order Method and Product Line and the data series is Ordermethod, the title of each pie in Excel will be Quantity Sold by Order Method andProduct Line, order method.
Unable to Skip Discrete Axis LabelsIn IBM Cognos Business Intelligence charts, you can control the skipping ofdiscrete axis labels. This feature is not supported in Microsoft Excel charts.
Unsupported IBM Cognos BI FormattingAbout 30% of the formatting functions available in IBM Cognos BusinessIntelligence are not supported in the Microsoft Excel spreadsheet software.
In particular, Excel does not allow changing locale-dependent formatting attributes,such as the following:v Decimal Separatorv Exponential Symbolv Group Separatorv Monetary Decimal Separatorv AM String
550 IBM Cognos Report Studio Version 10.2.1: User Guide

v Day Namev Day Short Namev Decimal Delimiter Symbolv Month Namev Month Short Namev PM String
In addition, Excel does not support the following:v Format Widthv International Currency Symbolv List Separatorv Percent Symbol (Excel does not support percent symbols for charts)v Multiplierv Overline Text Formatv PerMill Symbolv Plus Signv Scale (Excel has a different scaling formula than IBM Cognos BI)v Calendar (Excel does not allow changing the calendar)v Era Namev First Day Of Weekv Show Era
Cells Contain Series of #Cells in the Microsoft Excel spreadsheet software have a limit of 255 characters. Ifyour report contains text strings that are longer than 255 characters, they will beformatted as text and appear as ######.
To resolve this problem, use fewer characters.
Table and Column WidthsThe Microsoft Excel spreadsheet software does not support using percentages todetermine the width of tables.
If the report contains only one table, the value of the width attribute for the Tableelement in the report specification determines the width of the table in the Excelworksheet. If the report contains more than one table, Excel determines the widthof all the tables in the worksheet. If the tables are nested, the width specified forthe outer table is used and, if necessary, the width is adjusted to accommodatedata in the nested tables. The columns and rows around the table are merged topreserve the appearance of the nested table. When you save the workbook, only asingle table is saved per worksheet.
Secure Socket Layer (SSL) Is Not Supported in Some Excel Formatsand Versions
SSL is supported for only the Microsoft Excel 2002 format in Microsoft Excel 2002and Microsoft Excel 2003.
Appendix E. Limitations When Producing Reports in Microsoft Excel Format 551

Number Formats Become Currency Formats in Japanese ExcelA report uses the Number data format and you save it as Microsoft Excel output.When you open the report in the Japanese version of Microsoft Excel, the dataformat is listed as Currency rather than Number. This occurs because JapaneseExcel interprets the standard Number data format slightly differently than otherversions of Excel.
The value appears correctly in Number format. For example, if you specified fivedigits as your number format, five digits still appear. In Excel, click the Customnumber format to see the exact format string being used.
Reports Show Data in Wrong ColumnsA report contains a large amount of data that is presented using a large number ofnested report objects, such as tables and blocks. When the report is produced inMicrosoft Excel format, some of the data appears in the wrong columns. Thisoccurs because Excel has a 64K limit on how many nested cell objects can appearin a single spreadsheet.
To solve this problem, you can redesign the report to present the data usingnon-nested structures.
Unable to Access Reports on Remote ServersYou cannot access a report in Microsoft Excel format on a remote server.
To resolve this problem, you must change the hostname portion of the gatewayURI from localhost to either the IP address of the computer or the computer name.You do this using IBM Cognos Configuration.
Drill-through Reports Are Not Supported in ExcelIBM Cognos Business Intelligence does not support drill-through for reports inMicrosoft Excel format.
Map Reports Are Not Supported in ExcelIBM Cognos Business Intelligence does not support map reports in Microsoft Excelformat.
Unsupported Excel FormattingIBM Cognos Business Intelligence does not support some formatting.
The following formatting functions that are available in the Microsoft Excelspreadsheet software are not supported by IBM Cognos BI:v background images in table cellsv Excel-specific headers and footersv text flow and justificationv floating text objectsv white space, normal, and wrap text formattingv maximum characters
552 IBM Cognos Report Studio Version 10.2.1: User Guide

Some layouts do not show exactly in HTML and PDF due to Excel limitations.
Hyperlink Buttons Are Not Supported in ExcelThe Microsoft Excel spreadsheet software does not support hyperlink buttons.
Unable to View Reports in Excel Format Sent as Email AttachmentsIBM Cognos Business Intelligence can send Microsoft Excel reports in HTML andXML format by email. However, you cannot open them directly from the emailmessage.
Save the Excel email attachments to your computer and view them from there.
Unsupported Chart Properties in ExcelThe following IBM Cognos Business Intelligence chart properties are not supportedin the Microsoft Excel spreadsheet software:v tool tipsv conditional textv depthv visual anglev show valuesv marker text locationv show baselinev new notev new markerv truncation text and allow n-degrees rotation category labelsv borderv marginv box typev font and font alignmentv footerv subtitlev regression linev baselinev Include Zero For Auto Scale
In addition, IBM Cognos BI makes sure that Excel reuses the same color palettethat is defined in IBM Cognos BI. However, Excel can only use the first 16 colorsfrom the IBM Cognos BI palette. If the number of categories in a chart exceeds 16,the rest of the colors are taken from the default Excel palette.
Unsupported Chart Types in ExcelAbout 30% of the chart types available in IBM Cognos Business Intelligence are notmatched in the Microsoft Excel spreadsheet software.
The following chart types appear differently or are not supported. Charts that arenot supported appear as a default column chart in Excel.v Bipolar charts
Appendix E. Limitations When Producing Reports in Microsoft Excel Format 553

v Bubble chartsExcel does not support regression lines.
v Combination chartsIn Excel, combination charts appear as two-dimensional. If a three-dimensionalor two-dimensional combination chart includes only an area, column, or linechart, only the one chart appears.
v Gauge chartsv Donut charts
Excel may fill in the donut hole to accommodate extra measures. Excel showsdonut three-dimensional charts as donut charts.
v MapsIn Excel, no chart appears.
v Matrix chartsv Metrics range charts
In Excel, they appear as combination charts with two line charts for thetolerance bars.
v Pareto chartsIn Excel, the cumulative line is not displayed.
v Pie chartsExcel shows only one type of pie chart and may show it at a different angle.
v Progressive column chartsv Polar charts
In Excel, a scatter chart appears instead.v Quadrant chartsv Radar charts
Excel does not support stacked area radar charts. Excel names area radar chartsas filled radar charts. Excel shows radar charts as radar with markers.
v Scatter chartsIn Excel, three-dimensional scatter charts appear as two-dimensional scattercharts. The z-axis is dropped.
v 100% stacked bar and column chartsIn Excel, the percentage of each value in the bar or column is not displayed.Instead, the underlying values are displayed.
Cell Height and Width Are IncorrectThe width and height of cells that contain data with curly brackets {} orparentheses () may appear incorrectly.
This is because the Microsoft Excel spreadsheet software uses different wordwrapping algorithms than IBM Cognos Business Intelligence.
554 IBM Cognos Report Studio Version 10.2.1: User Guide

Appendix F. Using the expression editor
An expression is any combination of operators, constants, functions, and othercomponents that evaluates to a single value. You build expressions to createcalculation and filter definitions. A calculation is an expression that you use tocreate a new value from existing values contained within a data item. A filter is anexpression that you use to retrieve a specific subset of records.
You build expressions using the components that are defined below.
OperatorsOperators specify what happens to the values on either side of the operator.Operators are similar to functions, in that they manipulate data items and return aresult.
(Identifies the beginning of an expression.
Syntax( expression )
)Identifies the end of an expression.
Syntax( expression )
*Multiplies two numeric values.
Syntaxvalue1 * value2
,Separates expression components.
Syntaxexpression ( parameter1, parameter2 )
/Divides two numeric values.
Syntaxvalue1 / value2
© Copyright IBM Corp. 2005, 2013 555
||Concatenates, or joins, strings.
Syntaxstring1 || string2
+Adds two numeric values.
Syntaxvalue1 + value2
-Subtracts two numeric values or negates a numeric value.
Syntaxvalue1 - value2or- value
<Compares the values that are represented by "value1" against "value2" andretrieves the values that are less than "value2".
Syntaxvalue1 < value2
<=Compares the values that are represented by "value1" against "value2" andretrieves the values that are less than or equal to "value2".
Syntaxvalue1 <= value2
<>Compares the values that are represented by "value1" against "value2" andretrieves the values that are not equal to "value2".
Syntaxvalue1 <> value2
=Compares the values that are represented by "value1" against "value2" andretrieves the values that are equal to "value2".
Syntaxvalue1 = value2
>Compares the values that are represented by "value1" against "value2" andretrieves the values that are greater than "value2".
556 IBM Cognos Report Studio Version 10.2.1: User Guide

Syntaxvalue1 > value2
->Separates the components in a literal member expression.
Syntax[namespace].[dimension].[hierarchy].[level]->[L1]
>=Compares the values that are represented by "value1" against "value2" andretrieves the values that are greater than or equal to "value2".
Syntaxvalue1 >= value2
andReturns "true" if the conditions on both sides of the expression are true.
Syntaxargument1 and argument2
autoWorks with summary expressions to define the scope to be adjusted based on thegrouping columns in the query. The scope is context-dependent.
Syntaxaggregate_function ( expression AUTO )
betweenDetermines if a value falls in a given range.
Syntaxexpression between value1 and value2
Example[Revenue] between 200 and 300
Result
Returns the number of results with revenues between 200 and 300.
Result data
Revenue Between$332.06 false$230.55 true$107.94 false
Appendix F. Using the expression editor 557

caseWorks with when, then, else, and end. Case identifies the beginning of a specificsituation, in which when, then, and else actions are defined.
Syntaxcase expression { when expression then expression } [ elseexpression ] end
containsDetermines if "string1" contains "string2".
Syntaxstring1 contains string2
currentMeasureKeyword that can be used as the first argument of member summary functions.This function appears in the Total Revenue by Country sample report in the GOData Warehouse (query) package.
Syntaxaggregate_function ( currentMeasure within set expression )
defaultWorks with the lookup construct.
Syntaxlookup (....) in (....) default (....)
distinctA keyword used in an aggregate expression to include only distinct occurrences ofvalues. See also the function unique.
Syntaxdistinct dataItem
Examplecount ( distinct [OrderDetailQuantity] )
Result
1704
elseWorks with the if or case constructs. If the if condition or the case expression arenot true, then the else expression is used. This function appears in the Top 10Retailers for 2005 sample report in the GO Data Warehouse (analysis) package.
Syntaxif ( condition ) then .... else ( expression ) , or case .... else (expression ) end
558 IBM Cognos Report Studio Version 10.2.1: User Guide
endIndicates the end of a case or when construct.
Syntaxcase .... end
ends withDetermines if "string1" ends with "string2".
Syntaxstring1 ends with string2
escapeDetermines if "string1" matches the pattern of "string2", with the character "char"optionally used to escape characters in the pattern string.
Syntaxstring1 LIKE string2 [ ESCAPE char ]
Example 1[PRODUCT_LINE] like ’G%’
Result
All product lines that start with 'G'.
Example 2[PRODUCT_LINE] like ’%Ga%’ escape ’a’
Result
All the product lines that end with 'G%'.
forWorks with summary expressions to define the scope of the aggregation in thequery.
Syntaxaggregate_function ( expression for expression { , expression } )
for allWorks with summary expressions to define the scope to be all the specifiedgrouping columns in the query. See also the for clause.
Syntaxaggregate_function ( expression for ALL expression { , expression } )
for anyWorks with summary expressions to define the scope to be adjusted based on asubset of the grouping columns in the query. Equivalent to the for clause.
Syntax
Appendix F. Using the expression editor 559

aggregate_function ( expression for ANY expression { , expression } )
for reportWorks with summary expressions to set the scope to be the whole query. See alsothe for clause. This function appears in the Customer Returns and Satisfactionsample report in the GO Data Warehouse (analysis) package.
Syntaxaggregate_function ( expression for report )
ifWorks with the then and else constructs. If defines a condition; when the ifcondition is true, the then expression is used. When the if condition is not true, theelse expression is used. This function appears in the Top 10 Retailers for 2005sample report in the GO Data Warehouse (analysis) package.
Syntaxif ( condition ) then ( expression ) else ( expression )
inDetermines if "expression1" exists in a given list of expressions.
Syntaxexpression1 in ( expression_list )
in_rangeDetermines if "expression1" exists in a given list of constant values or ranges.
Syntaxexpression1 in_range { constant : constant [ , constant :constant ] }
Example 1[code] in_range { 5 }
Result
This is equivalent to [code] = 5.
Example 2[code] in_range { 5: }
Result
This is equivalent to [code] >= 5.
Example 3[code] in_range { :5 }
Result
This is equivalent to [code] <= 5.
560 IBM Cognos Report Studio Version 10.2.1: User Guide

Example 4[code] in_range { 5:10 }
Result
This is equivalent to ( [code] >= 5 and [code] <= 10 ).
Example 5[code] in_range { :5,10,20: }
Result
This is equivalent to ( [code] <= 5 or [code] = 10 or [code] >= 20 ).
is missingDetermines if "value" is undefined in the data.
Syntaxvalue is missing
is nullDetermines if "value" is undefined in the data.
Syntaxvalue is null
is not missingDetermines if "value" is defined in the data.
Syntaxvalue is not missing
is not nullDetermines if "value" is defined in the data.
Syntaxvalue is not null
likeDetermines if "string1" matches the pattern of "string2", with the character "char"optionally used to escape characters in the pattern string.
Syntaxstring1 LIKE string2 [ ESCAPE char ]
Example 1[PRODUCT_LINE] like ’G%’
Result
All product lines that start with 'G'.
Appendix F. Using the expression editor 561

Example 2[PRODUCT_LINE] like ’%Ga%’ escape ’a’
Result
All the product lines that end with 'G%'.
lookupFinds and replaces data with a value you specify. It is preferable to use the caseconstruct.
Syntaxlookup ( name ) in ( value1 --> value2 ) default ( expression )
Examplelookup ( [Country]) in ( ’Canada’--> ( [List Price] * 0.60),’Australia’--> ( [List Price] * 0.80 ) ) default ( [List Price] )
notReturns TRUE if "argument" is false or returns FALSE if "argument" is true.
SyntaxNOT argument
orReturns TRUE if either of "argument1" or "argument2" are true.
Syntaxargument1 or argument2
prefilterPerforms a summary calculation before applying the summary filter.
Syntaxsummary_function ([expression] prefilter)
Exampletotal ( [Quantity] for report prefilter )summaryFilter: total([Quantity] for [ProductNo] ) > 50000
Result
Sums the quantities in a report before the summary filter is applied.
Result data
ProductNo Total_forProductNo Total_forReport Total_forReport_Prefilter88 54928 298140 221535489 51126 298140 221535490 69996 298140 221535494 69004 298140 221535495 53086 298140 2215354
562 IBM Cognos Report Studio Version 10.2.1: User Guide

rowsCounts the number of rows output by the query. Use with Count ().
Syntaxcount ( ROWS )
rowsCounts the number of rows output by the query. Use with Count ().
Syntaxcount ( ROWS [ expression ])
starts withDetermines if "string1" starts with "string2".
Syntaxstring1 starts with string2
thenWorks with the if or case constructs. When the if condition or the when expressionare true, the then expression is used. This function appears in the Top 10 Retailersfor 2005 sample report in the GO Data Warehouse (analysis) package.
Syntaxif ( condition ) then ..., or case expression when expressionthen .... end
whenWorks with the case construct. You can define conditions to occur when theWHEN expression is true.
Syntaxcase [expression] when ... end
SummariesThis list contains predefined functions that return either a single summary valuefor a group of related values or a different summary value for each instance of agroup of related values.
Statistical functionsThis list contains predefined summary functions of statistical nature.
corrReturns the coefficient of correlation of a set of number pairs. This is computed asfollows: COVAR_POP(numeric_expression1, numeric_expression2) /(STDDEV_POP(numeric_expression1) * STDDEV_POP(numeric_expression2))
Syntaxcorr ( numeric_expression1 , numeric_expression2 [ auto ] )corr ( numeric_expression1 , numeric_expression2 for [ all|any ]expression { , expression } )corr ( numeric_expression1 , numeric_expression2 for report )
Appendix F. Using the expression editor 563

Examplecorr ( Cost , Margin for report)
Result
The coefficient of correlation between Cost and Margin.
Result data
Cost Margincorr (Cost, Margin forreport)
4 0.33 0.08726485 0.28 0.08726489.22 0.23 0.087264815.93 0.28 0.087264834.97 0.3 0.0872648
covariance-popReturns the population covariance of a set of number pairs.
Syntaxcovariance-pop ( numeric_expression1 , numeric_expression2 )covariance-pop ( numeric_expression1 , numeric_expression2 for[ all|any ] expression { , expression } )covariance-pop ( numeric_expression1 , numeric_expression2 forreport )
Examplecovariance-pop ( Cost , Margin for report)
Result
The population covariance between Cost and Margin.
Result data
Cost Margincovariance-pop (Cost,Margin for report)
4 0.33 0.0323845 0.28 0.0323849.22 0.23 0.03238415.93 0.28 0.03238434.97 0.3 0.032384
covariance-sampReturns the sample covariance of a set of number pairs.
Syntaxcovariance-samp ( numeric_expression1 , numeric_expression2 )covariance-samp ( numeric_expression1 , numeric_expression2 for[ all|any ] expression { , expression } )covariance-samp ( numeric_expression1 , numeric_expression2 forreport )
Examplecovariance-samp ( Cost , Margin for report)
564 IBM Cognos Report Studio Version 10.2.1: User Guide
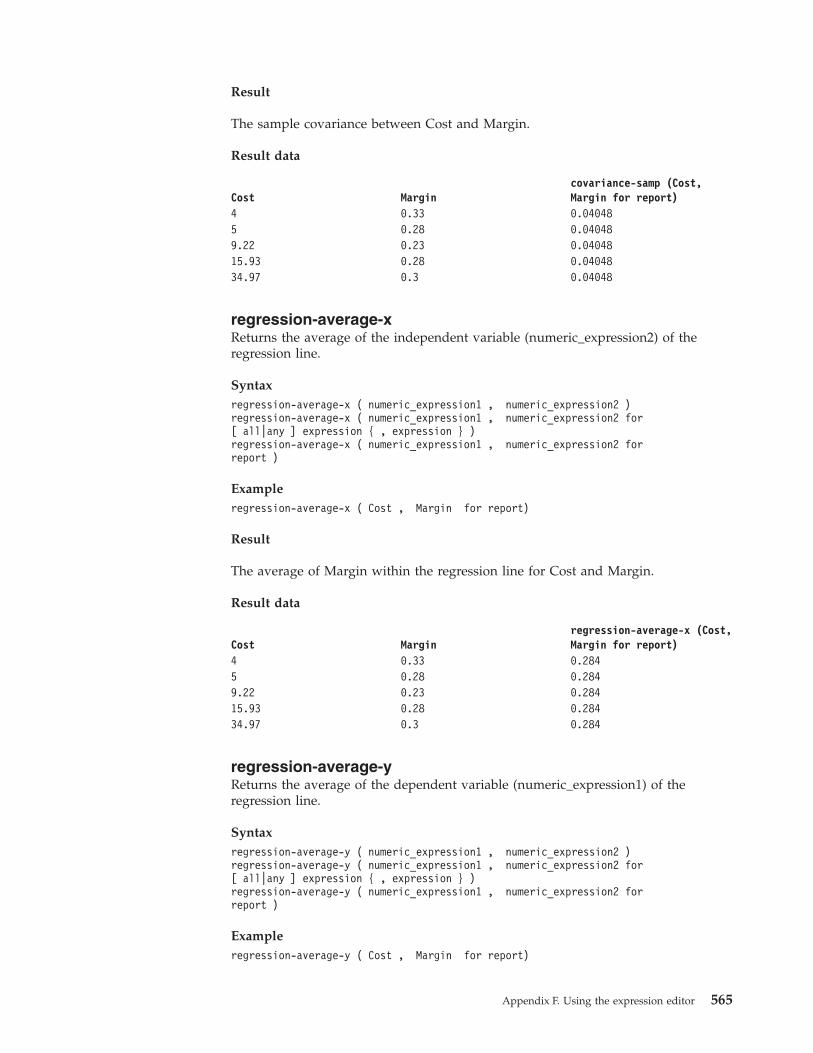
Result
The sample covariance between Cost and Margin.
Result data
Cost Margincovariance-samp (Cost,Margin for report)
4 0.33 0.040485 0.28 0.040489.22 0.23 0.0404815.93 0.28 0.0404834.97 0.3 0.04048
regression-average-xReturns the average of the independent variable (numeric_expression2) of theregression line.
Syntaxregression-average-x ( numeric_expression1 , numeric_expression2 )regression-average-x ( numeric_expression1 , numeric_expression2 for[ all|any ] expression { , expression } )regression-average-x ( numeric_expression1 , numeric_expression2 forreport )
Exampleregression-average-x ( Cost , Margin for report)
Result
The average of Margin within the regression line for Cost and Margin.
Result data
Cost Marginregression-average-x (Cost,Margin for report)
4 0.33 0.2845 0.28 0.2849.22 0.23 0.28415.93 0.28 0.28434.97 0.3 0.284
regression-average-yReturns the average of the dependent variable (numeric_expression1) of theregression line.
Syntaxregression-average-y ( numeric_expression1 , numeric_expression2 )regression-average-y ( numeric_expression1 , numeric_expression2 for[ all|any ] expression { , expression } )regression-average-y ( numeric_expression1 , numeric_expression2 forreport )
Exampleregression-average-y ( Cost , Margin for report)
Appendix F. Using the expression editor 565

Result
The average of Cost within the regression line for Cost and Margin.
Result data
Cost Marginregression-average-y (Cost,Margin for report)
4 0.33 13.8245 0.28 13.8249.22 0.23 13.82415.93 0.28 13.82434.97 0.3 13.824
regression-countReturns the number of non-null numbers used to fit the regression line.
Syntaxregression-count ( numeric_expression1 , numeric_expression2 )regression-count ( numeric_expression1 , numeric_expression2 for[ all|any ] expression { , expression } )regression-count ( numeric_expression1 , numeric_expression2 forreport )
Exampleregression-count ( Cost , Margin for report)
Result
The number of non-null numbers used to fit the regression line for Cost andMargin.
Result data
Cost Marginregression-count (Cost,Margin for report)
4 0.33 55 0.28 59.22 0.23 515.93 0.28 534.97 0.3 5
regression-interceptReturns the y-intercept of the regression line. This is computed as follows:AVG(numeric_expression1) - REGR_SLOPE(numeric_expression1,numeric_expression2) * AVG(numeric_expression2)
Syntaxregression-intercept ( numeric_expression1 , numeric_expression2 )regression-intercept ( numeric_expression1 , numeric_expression2 for[ all|any ] expression { , expression } )regression-intercept ( numeric_expression1 , numeric_expression2 forreport )
Exampleregression-intercept ( Cost , Margin for report)
566 IBM Cognos Report Studio Version 10.2.1: User Guide

Result
The y-intercept of the regression line for Cost and Margin.
Result data
Cost Marginregression-intercept (Cost,Margin for report)
4 0.33 5.180150385 0.28 5.180150389.22 0.23 5.1801503815.93 0.28 5.1801503834.97 0.3 5.18015038
regression-r2Returns the coefficient of determination (also known as "R-squared" or "goodnessof fit") of the regression line. This value is computed based on the followingconditions: IF VAR_POP(numeric_expression2) = 0 THEN NULL IFVAR_POP(numeric_expression1) = 0 AND VAR_POP(numeric_expression2) <> 0THEN 1 IF VAR_POP(numeric_expression1) > 0 andVAR_POP(numeric_expression2) <> 0 THEN POWER(CORR (numeric_expression1,numeric_expression2))
Syntaxregression-r2 ( numeric_expression1 , numeric_expression2 )regression-r2 ( numeric_expression1 , numeric_expression2 for[ all|any ] expression { , expression } )regression-r2 ( numeric_expression1 , numeric_expression2 forreport )
Exampleregression-r2 ( Cost , Margin for report)
Result
The coefficient of determination of the regression line for Cost and Margin.
Result data
Cost Marginregression-r2 (Cost, Marginfor report)
4 0.33 0.007615145 0.28 0.007615149.22 0.23 0.0076151415.93 0.28 0.0076151434.97 0.3 0.00761514
regression-slopeReturns the slope of the regression line. This is computed as follows:COVAR_POP(numeric_expression1,numeric_expression2) /VAR_POP(numeric_expression2)
Syntax
Appendix F. Using the expression editor 567

regression-slope ( numeric_expression1 , numeric_expression2 )regression-slope ( numeric_expression1 , numeric_expression2 for[ all|any ] expression { , expression } )regression-slope ( numeric_expression1 , numeric_expression2 forreport )
Exampleregression-slope ( Cost , Margin )
Result
The slope of the regression line for Cost and Margin.
Result data
Cost Marginregression-slope (Cost,Margin for report)
4 0.33 30.436090235 0.28 30.436090239.22 0.23 30.4360902315.93 0.28 30.4360902334.97 0.3 30.43609023
regression-sxxReturns the following computation after eliminating NULL pairs:REGR_COUNT(numeric_expression1, numeric_expression2) *VAR_POP(numeric_expression2)
Syntaxregression-sxx ( numeric_expression1 , numeric_expression2 )regression-sxx ( numeric_expression1 , numeric_expression2 for[ all|any ] expression { , expression } )regression-sxx ( numeric_expression1 , numeric_expression2 forreport )
Exampleregression-sxx ( Cost , Margin for report)
Result
The sxx computation of the regression line for Cost and Margin.
Result data
Cost Marginregression-sxx (Cost,Margin for report)
4 0.33 0.005325 0.28 0.005329.22 0.23 0.0053215.93 0.28 0.0053234.97 0.3 0.00532
regression-sxyReturns the following computation after eliminating NULL pairs:REGR_COUNT(numeric_expression1, numeric_expression2) *COVAR_POP(numeric_expression1, numeric_expression2)
568 IBM Cognos Report Studio Version 10.2.1: User Guide

Syntaxregression-sxy ( numeric_expression1 , numeric_expression2 )regression-sxy ( numeric_expression1 , numeric_expression2 for[ all|any ] expression { , expression } )regression-sxy ( numeric_expression1 , numeric_expression2 forreport )
Exampleregression-sxy ( Cost , Margin for report)
Result
The sxy computation of the regression line for Cost and Margin.
Result data
Cost Marginregression-sxy (Cost,Margin for report)
4 0.33 0.161925 0.28 0.161929.22 0.23 0.1619215.93 0.28 0.1619234.97 0.3 0.16192
regression-syyReturns the following computation after eliminating NULL pairs:REGR_COUNT(numeric_expression1, numeric_expression2) *VAR_POP(numeric_expression1)
Syntaxregression-syy ( numeric_expression1 , numeric_expression2 )regression-syy ( numeric_expression1 , numeric_expression2 for[ all|any ] expression { , expression } )regression-syy ( numeric_expression1 , numeric_expression2 forreport )
Exampleregression-syy ( Cost , Margin for report)
Result
The syy computation of the regression line for Cost and Margin.
Result data
Cost Marginregression-syy (Cost,Margin for report)
4 0.33 647.159325 0.28 647.159329.22 0.23 647.1593215.93 0.28 647.1593234.97 0.3 647.15932
Appendix F. Using the expression editor 569

standard-deviationReturns the standard deviation of selected data items.
Syntaxstandard-deviation ( expression [ auto ] )standard-deviation ( expression for [ all|any ] expression { ,expression } )standard-deviation ( expression for report )
Examplestandard-deviation ( ProductCost )
Result
Returns a value indicating the deviation between product costs and the averageproduct cost.
standard-deviation-popComputes the population standard deviation and returns the square root of thepopulation variance.
Syntaxstandard-deviation-pop ( expression [ auto ] )standard-deviation-pop ( expression for [ all|any ] expression { ,expression } )standard-deviation-pop ( expression for report )
Examplestandard-deviation-pop ( ProductCost )
Result
Returns a value of the square root of the population variance.
standard-deviation-sampComputes the sample standard deviation and returns the square root of thepopulation variance.
Syntaxstandard-deviation-samp ( expression [ auto ] )standard-deviation-samp ( expression for [ all|any ] expression { ,expression } )standard-deviation-samp ( expression for report )
Examplestandard-deviation-samp ( ProductCost )
Result
Returns a value of the square root of the sample variance.
varianceReturns the variance of selected data items.
Syntax
570 IBM Cognos Report Studio Version 10.2.1: User Guide

variance ( expression [ auto ] )variance ( expression for [ all|any ] expression { , expression } )variance ( expression for report )
Examplevariance ( Product Cost )
Result
Returns a value indicating how widely product costs vary from the averageproduct cost.
variance-popReturns the population variance of a set of numbers after discarding the nulls inthis set.
Syntaxvariance-pop ( expression [ auto ] )variance-pop ( expression for [ all|any ] expression { ,expression } )variance-pop ( expression for report )
Examplevariance-pop ( Qty )
Result
For each row, returns the population variance of a set of numbers after discardingthe nulls in this set.
variance-sampReturns the sample variance of a set of numbers after discarding the nulls in thisset.
Syntaxvariance-samp ( expression [ auto ] )variance-samp ( expression for [ all|any ] expression { ,expression } )variance-samp ( expression for report )
Examplevariance-samp ( Qty )
Result
For each row, returns the sample variance of a set of numbers after discarding thenulls in this set.
aggregateReturns a calculated value using the appropriate aggregation function, based onthe aggregation type of the expression. This function appears in the Budget vs.Actual sample report in the GO Data Warehouse (analysis) package.
Syntax
Appendix F. Using the expression editor 571

aggregate ( expression [ auto ] )aggregate ( expression for [ all|any ] expression { , expression } )aggregate ( expression for report )
averageReturns the average value of selected data items. Distinct is an alternativeexpression that is compatible with earlier versions of the product.
Syntaxaverage ( [ distinct ] expression [ auto ] )average ( [ distinct ] expression for [ all|any ] expression { ,expression } )average ( [ distinct ] expression for report )
Exampleaverage ( Sales )
Result
Returns the average of all Sales values.
countReturns the number of selected data items excluding null values. Distinct is analternative expression that is compatible with earlier versions of the product.
Syntaxcount ( [ distinct ] expression [ auto ] )count ( [ distinct ] expression for [ all|any ] expression { ,expression } )count ( [ distinct ] expression for report )
Examplecount ( Sales )
Result
Returns the total number of entries under Sales.
maximumReturns the maximum value of selected data items. Distinct is an alternativeexpression that is compatible with earlier versions of the product.
Syntaxmaximum ( [ distinct ] expression [ auto ] )maximum ( [ distinct ] expression for [ all|any ] expression { ,expression } )maximum ( [ distinct ] expression for report )
Examplemaximum ( Sales )
Result
Returns the maximum value out of all Sales values.
572 IBM Cognos Report Studio Version 10.2.1: User Guide

medianReturns the median value of selected data items.
Syntaxmedian ( expression [ auto ] )median ( expression for [ all|any ] expression { , expression } )median ( expression for report )
minimumReturns the minimum value of selected data items. Distinct is an alternativeexpression that is compatible with earlier versions of the product.
Syntaxminimum ( [ distinct ] expression [ auto ] )minimum ( [ distinct ] expression for [ all|any ] expression { ,expression } )minimum ( [ distinct ] expression for report )
Exampleminimum ( Sales )
Result
Returns the minimum value out of all Sales values.
moving-averageReturns a moving average by row for a specified set of values of over a specifiednumber of rows. The "<for-option>" defines the scope of the function. The "at"option defines the level of aggregation and can be used only in the context ofrelational datasources.
Syntaxmoving-average ( numeric_expression , numeric_expression [ atexpression { , expression } ] [ <for-option> ] [ prefilter ] )moving-average ( numeric_expression , numeric_expression[ <for-option> ] [ prefilter ] )<for-option> ::= for expression { , expression }|for report|auto
Examplemoving-average ( Qty , 3 )
Result
For each row, returns the quantity and a moving average of the current row andthe preceding two rows.
Result data
Qty Moving-Average (Qty, 3)200 200700 450400 433.3333200 433.3333200 266.6667500 300.0000
Appendix F. Using the expression editor 573

moving-totalReturns a moving total by row for a specified set of values over a specifiednumber of rows. The "<for-option>" defines the scope of the function. The "at"option defines the level of aggregation and can be used only in the context ofrelational datasources.
Syntaxmoving-total ( numeric_expression , numeric_expression [ atexpression { , expression } ] [ <for-option> ] [ prefilter ] )moving-total ( numeric_expression , numeric_expression[ <for-option> ] [ prefilter ] )<for-option> ::= for expression { , expression }|for report|auto
Examplemoving-total ( Qty , 3 )
Result
For each row, returns the quantity and a moving total of the current row and thepreceding two rows.
Result data
Qty Moving-Total (Qty, 3)200 200700 900400 1300200 1300200 800500 900
percentageReturns the percent of the total value for selected data items. The "<for-option>"defines the scope of the function. The "at" option defines the level of aggregationand can be used only in the context of relational datasources. This functionappears in the Percentage Calculation (by year) interactive sample report.
Syntaxpercentage ( numeric_expression [ at expression { , expression } ][ <for-option> ] [ prefilter ] )percentage ( numeric_expression [ <for-option> ] [ prefilter ] )<for-option> ::= for expression { , expression }|for report|auto
Examplepercentage ( Sales 98 )
Result
Returns the percentage of the total sales for 1998 that is attributed to each salesrepresentative.
Result data
Sales Rep Sales 98 PercentageGibbons 60646 7.11%
574 IBM Cognos Report Studio Version 10.2.1: User Guide

Sales Rep Sales 98 PercentageFlertjan 62523 7.35%Cornel 22396 2.63%
percentileReturns a value, on a scale of one hundred, that indicates the percent of adistribution that is equal to or below the selected data items. The "<for-option>"defines the scope of the function. The "at" option defines the level of aggregationand can be used only in the context of relational datasources.
Syntaxpercentile ( numeric_expression [ at expression { , expression } ][ <for-option> ] [ prefilter ] )percentile ( numeric_expression [ <for-option> ] [ prefilter ] )<for-option> ::= for expression { , expression }|for report|auto
Examplepercentile ( Sales 98 )
Result
For each row, returns the percentage of rows that are equal to or less than thequantity value of that row.
Result data
Qty Percentile (Qty)800 1700 0.875600 0.75500 0.625400 0.5400 0.5200 0.25200 0.25
quantileReturns the rank of a value within a range that you specify. It returns integers torepresent any range of ranks, such as 1 (highest) to 100 (lowest). The"<for-option>" defines the scope of the function. The "at" option defines the level ofaggregation and can be used only in the context of relational datasources.
Syntaxquantile ( numeric_expression , numeric_expression [ at expression { ,expression } ] [ <for-option> ] [ prefilter ] )quantile ( numeric_expression , numeric_expression [ <for-option> ][ prefilter ] )<for-option> ::= for expression { , expression }|for report|auto
Examplequantile ( Qty , 4 )
Result
Appendix F. Using the expression editor 575

Returns the quantity, the rank of the quantity value, and the quantity valuesbroken down into 4 quantile groups (quartiles).
Result data
Qty Rank (Qty) Quantile (Qty, 4)800 1 1700 2 1600 3 2500 4 2400 5 3400 5 3200 7 4200 7 4
quartileReturns the rank of a value, represented as integers from 1 (highest) to 4 (lowest),relative to a group of values. The "<for-option>" defines the scope of the function.The "at" option defines the level of aggregation and can be used only in the contextof relational datasources.
Syntaxquartile ( numeric_expression [ at expression { , expression } ][ <for-option> ] [ prefilter ] )quartile ( numeric_expression [ <for-option> ] [ prefilter ] )<for-option> ::= for expression { , expression }|for report|auto
Examplequartile ( Qty )
Result
Returns the quantity and the quartile of the quantity value represented as integersfrom 1 (highest) to 4 (lowest).
Result data
Qty Quartile (Qty)450 1400 1350 2300 2250 3200 3150 4100 4
rankReturns the rank value of selected data items. The sort order is optional;descending order (DESC) is assumed by default. If two or more rows tie, thenthere is a gap in the sequence of ranked values (also known as Olympic ranking).The "<for-option>" defines the scope of the function. The "at" option defines thelevel of aggregation and can be used only in the context of relational datasources.Distinct is an alternative expression that is compatible with earlier versions of the
576 IBM Cognos Report Studio Version 10.2.1: User Guide

product. Null values are ranked last. This function appears in the Top 10 Retailersfor 2005 sample report in the GO Data Warehouse (analysis) package.
Syntaxrank ( expression [ ASC|DESC ] { , expression [ ASC|DESC ] } [ atexpression { , expression } ] [ <for-option> ] [ prefilter ] )rank ( [ distinct ] expression [ ASC|DESC ] { , expression[ ASC|DESC ] } [ <for-option>] [ prefilter ] )<for-option> ::= for expression { , expression }|for report|auto
Examplerank ( Sales 98 )
Result
For each row, returns the rank value of sales for 1998 that is attributed to eachsales representative. Some numbers are skipped when a tie between rows occurs.
Result data
Sales Rep Sales 98 RankGibbons 60000 1Flertjan 50000 2Cornel 50000 2Smith 48000 4
running-averageReturns the running average by row (including the current row) for a set of values.The "<for-option>" defines the scope of the function. The "at" option defines thelevel of aggregation and can be used only in the context of relational datasources.
Syntaxrunning-average ( numeric_expression [ at expression { ,expression } ] [ <for-option> ] [ prefilter ] )running-average ( numeric_expression [ <for-option> ] [ prefilter ] )<for-option> ::= for expression { , expression }|for report|auto
Examplerunning-average ( Qty )
Result
For each row, returns the quantity and a running average of the current and theprevious rows.
Result data
Name Qty AvgRunning-Average forname
Smith 7 5 7Smith 3 5 5Smith 6 5 5.33Smith 4 5 5Wong 3 4 3Wong 5 4 4
Appendix F. Using the expression editor 577

running-countReturns the running count by row (including the current row) for a set of values.The "<for-option>" defines the scope of the function. The "at" option defines thelevel of aggregation and can be used only in the context of relational datasources.
Syntaxrunning-count ( numeric_expression [ at expression { , expression } ][ <for-option> ] [ prefilter ] )running-count ( numeric_expression [ <for-option> ] [ prefilter ] )<for-option> ::= for expression { , expression }|for report|auto
Examplerunning-count ( Qty )
Result
For each row, returns the quantity and a running count of the position of thecurrent row.
Result data
Name Qty CountRunning-Count forname
Smith 7 4 1Smith 3 4 2Smith 6 4 3Smith 4 4 4Wong 3 3 1Wong 5 3 2
running-differenceReturns a running difference by row, calculated as the difference between the valuefor the current row and the preceding row, (including the current row) for a set ofvalues. The "<for-option>" defines the scope of the function. The "at" optiondefines the level of aggregation and can be used only in the context of relationaldatasources.
Syntaxrunning-difference ( numeric_expression [ at expression { ,expression } ] [ <for-option> ] [ prefilter ] )running-difference ( numeric_expression [ <for-option> ][ prefilter ] )<for-option> ::= for expression { , expression }|for report|auto
Examplerunning-difference ( Qty )
Result
For each row, returns the quantity and a running difference between the value forthe current row and the preceding row.
Result data
578 IBM Cognos Report Studio Version 10.2.1: User Guide

Name Qty Running-Difference for nameSmith 7 NULLSmith 3 -4Smith 6 3Smith 4 -2Wong 3 -1Wong 5 2
running-maximumReturns the running maximum by row (including the current row) for a set ofvalues. The "<for-option>" defines the scope of the function. The "at" optiondefines the level of aggregation and can be used only in the context of relationaldatasources.
Syntaxrunning-maximum ( numeric_expression [ at expression { ,expression } ] [ <for-option> ] [ prefilter ] )running-maximum ( numeric_expression [ <for-option> ] [ prefilter ] )<for-option> ::= for expression { , expression }|for report|auto
Examplerunning-maximum ( Qty )
Result
For each row, returns the quantity and a running maximum of the current andprevious rows.
Result data
Name Qty MaxRunning-Maximum(Qty) for name
Smith 2 7 2Smith 3 7 3Smith 6 7 6Smith 7 7 7Wong 3 5 3Wong 5 5 5
running-minimumReturns the running minimum by row (including the current row) for a set ofvalues. The "<for-option>" defines the scope of the function. The "at" optiondefines the level of aggregation and can be used only in the context of relationaldatasources.
Syntaxrunning-minimum ( numeric_expression [ at expression { ,expression } ] [ <for-option> ] [ prefilter ] )running-minimum ( numeric_expression [ <for-option> ] [ prefilter ] )<for-option> ::= for expression { , expression }|for report|auto
Examplerunning-minimum ( Qty )
Appendix F. Using the expression editor 579

Result
For each row, returns the quantity and a running minimum of the current andprevious rows.
Result data
Name Qty MinRunning-Minimum(Qty) for name
Smith 7 2 7Smith 3 2 3Smith 6 2 3Smith 2 2 2Wong 4 3 4Wong 5 3 4
running-totalReturns a running total by row (including the current row) for a set of values. The"<for-option>" defines the scope of the function. The "at" option defines the level ofaggregation and can be used only in the context of relational datasources.
Syntaxrunning-total ( numeric_expression [ at expression { ,expression } ] [ <for-option> ] [ prefilter ] )running-total ( numeric_expression [ <for-option> ] [ prefilter ] )<for-option> ::= for expression { , expression }|for report|auto
Examplerunning-total ( Qty )
Result
For each row, returns the quantity and a running total of the current and previousrows.
Result data
Name Qty TotalRunning-Total (Qty)for name
Smith 2 18 2Smith 3 18 5Smith 6 18 11Smith 7 18 18Wong 3 12 3Wong 5 12 8
totalReturns the total value of selected data items. Distinct is an alternative expressionthat is compatible with earlier versions of the product. This function appears in theBudget vs. Actual sample report in the GO Data Warehouse (analysis) package.
Syntax
580 IBM Cognos Report Studio Version 10.2.1: User Guide

total ( [ distinct ] expression [ auto ] )total ( [ distinct ] expression for [ all|any ] expression { ,expression } )total ( [ distinct ] expression for report )
Exampletotal ( Sales )
Result
Returns the total value of all Sales values.
Member SummariesThis list contains predefined functions that return either a single summary valuefor a set of members or a different summary value for each member of a set ofmembers.
aggregateReturns a calculated value using the appropriate aggregation function based on theaggregation type of the expression.
Syntaxaggregate ( < currentMeasure|numeric_expression > within setset_expression )aggregate ( < currentMeasure|numeric_expression > within <detail|aggregate > expression )
averageReturns the average value of the selected data items.
Syntaxaverage ( < currentMeasure|numeric_expression > within setset_expression )average ( < currentMeasure|numeric_expression > within <detail|aggregate > expression )
Exampleaverage ( Sales )
Result
Returns the average of all Sales values.
countReturns the number of selected data items excluding null values.
Syntaxcount ( < currentMeasure|numeric_expression > within setset_expression )count ( < currentMeasure|numeric_expression > within <detail|aggregate > expression )
Examplecount ( Sales )
Appendix F. Using the expression editor 581

Result
Returns the total number of entries under Sales.
maximumReturns the maximum value of selected data items.
Syntaxmaximum ( < currentMeasure|numeric_expression > within setset_expression )maximum ( < currentMeasure|numeric_expression > within <detail|aggregate > expression )
Examplemaximum ( Sales )
Result
Returns the maximum value out of all Sales values.
medianReturns the median value of selected data items.
Syntaxmedian ( < currentMeasure|numeric_expression > within setset_expression )median ( < currentMeasure|numeric_expression > within <detail|aggregate > expression )
minimumReturns the minimum value of selected data items.
Syntaxminimum ( < currentMeasure|numeric_expression > within setset_expression )minimum ( < currentMeasure|numeric_expression > within <detail|aggregate > expression )
Exampleminimum ( Sales )
Result
Returns the minimum value out of all Sales values.
percentageReturns the percent of the total value for the selected data items.
Syntaxpercentage ( numeric_expression [ tuple member_expression { ,member_expression } ] within set set_expression )
Example
582 IBM Cognos Report Studio Version 10.2.1: User Guide

percentage ( [gosales].[sales measures].[quantity] tuple [gosales].[Staff].[].[department] -> [West] within set children ( [gosales].[Staff].[].[Staff] ) )
percentileReturns a value, on a scale from 0 to 100, that indicates the percent of adistribution that is equal to or below the selected data items.
Syntaxpercentile ( numeric_expression [ tuple member_expression { ,member_expression } ] within set set_expression )
quantileReturns the rank of a value for the specified range. It returns integers to representany range of ranks, such as 1 (highest) to 100 (lowest).
Syntaxquantile ( numeric_expression , numeric_expression [ tuplemember_expression { , member_expression } ] within setset_expression )
quartileReturns the rank of a value, represented as integers from 1 (highest) to 4 (lowest),relative to a group of values.
Syntaxquartile ( numeric_expression [ tuple member_expression { ,member_expression } ] within set set_expression )
rankReturns the rank value of the selected data items. The type of ranking returned(Olympic, dense, or serial) is data source dependent. The sort order is optional;DESC is assumed by default.
Syntaxrank ( numeric_expression [ ASC|DESC ] [ tuple member_expression { ,member_expression } ] within set set_expression )
Examplerank ( [gosales].[sales measures].[quantity] tuple [gosales].[Staff].[].[department] -> [West] within set children ( [gosales].[Staff].[].[Staff] ) )
standard-deviationReturns the standard deviation of the selected data items.
Syntaxstandard-deviation ( < currentMeasure|numeric_expression > within setset_expression )standard-deviation ( < currentMeasure|numeric_expression > within <detail|aggregate > expression )
Appendix F. Using the expression editor 583

standard-deviation-popReturns the standard deviation population of the selected data items.
Syntaxstandard-deviation-pop ( < currentMeasure|numeric_expression > withinset set_expression )standard-deviation-pop ( < currentMeasure|numeric_expression > within< detail|aggregate > expression )
totalReturns the total value of the selected data items.
Syntaxtotal ( < currentMeasure|numeric_expression > within setset_expression )total ( < currentMeasure|numeric_expression > within <detail|aggregate > expression )
varianceReturns the variance of the selected data items.
Syntaxvariance ( < currentMeasure|numeric_expression > within setset_expression )variance ( < currentMeasure|numeric_expression > within <detail|aggregate > expression )
variance-popReturns the variance population of the selected data items.
Syntaxvariance-pop ( < currentMeasure|numeric_expression > within setset_expression )variance-pop ( < currentMeasure|numeric_expression > within <detail|aggregate > expression )
ConstantsA constant is a fixed value that you can use in an expression.
dateInserts the current system date.
date-timeInserts the current system date and time.
time with time zoneInserts a zero time with time zone.
timestamp with time zoneInserts an example of a timestamp with time zone.
584 IBM Cognos Report Studio Version 10.2.1: User Guide

intervalInserts a zero interval: 000 00:00:00.000.
interval yearInserts a zero year interval: 0 year.
interval monthInserts a zero month interval: 0 month.
interval year to monthInserts a zero year to month interval: 0000-00 year to month.
interval dayInserts a zero day interval: 0 day.
interval hourInserts a zero hour interval: 0 hour.
interval minuteInserts a zero minute interval: 0 minute.
interval secondInserts a zero second interval: 0 second.
interval day to hourInserts a zero day to hour interval: 0 00 day to hour.
interval day to minuteInserts a zero day to minute interval: 0 00:00 day to minute.
interval day to secondInserts a zero day to second interval: 0 00:00:00.000000000 day to second.
interval hour to minuteInserts a zero hour to minute interval: 00:00 hour to minute.
interval hour to secondInserts a zero hour to second interval: 00:00:00.000000000 hour to second.
interval minute to secondInserts a zero minute to second interval: 00:00.000000000 minute to second.
nullInserts "null" if the expression conditions are not met.
numberInserts the number 0, which can be replaced with a new numeric value.
Appendix F. Using the expression editor 585

stringInserts an empty string as two single quotation marks between which you can typea string.
timeInserts the current system time.
ConstructsThis list contains constructs and templates that can be used to create an expression.Templates combine multiple functions into a group. For example, the search casetemplate includes the case, when, else, and end functions.
if then elseThis construct is the template for an if...then...else statement. This constructappears in the Top 10 Retailers for 2005 sample report in the GO Data Warehouse(analysis) package.
SyntaxIF ([Country] = ’Canada’) THEN ([List Price] * 0.60) ELSE ([ListPrice])
in_rangeThis is the template for an in_range expression.
Syntax[code] IN_RANGE { :30 , 40, 50, 999: }
Example 1[code] IN_RANGE { 5 }
Result
This is equivalent to [code] = 5.
Example 2[code] IN_RANGE { 5: }
Result
This is equivalent to [code] >= 5.
Example 3[code] IN_RANGE { :5 }
Result
This is equivalent to [code] <= 5.
Example 4[code] IN_RANGE { 5:10 }
Result
586 IBM Cognos Report Studio Version 10.2.1: User Guide

This is equivalent to ( [code] >= 5 and [code] <= 10 ).
Example 5[code] IN_RANGE { :5,10,20: }
Result
This is equivalent to ( [code] <= 5 or [code] = 10 or [code] >= 20 ).
search caseThis construct is the template for a search case, including the CASE, WHEN, ELSE,and END functions.
SyntaxCASE WHEN [Country] = ’Canada’ THEN ([List Price] * 0.60) WHEN[CountryCode] > 100 THEN [List Price] * 0.80ELSE [List Price] END
simple caseThis construct is the template for a simple case, including the CASE, WHEN, ELSE,and END functions.
SyntaxCASE [Country] WHEN ’Canada’ THEN ([List Price] * 0.60) WHEN’Australia’ THEN [List Price] * 0.80ELSE [List Price] END
Business Date/Time FunctionsThis list contains business functions for performing date and time calculations.
_add_daysReturns the date or datetime, depending on the format of "date_expression", thatresults from adding "integer_expression" days to "date_expression".
Syntax_add_days ( date_expression, integer_expression )
Example 1_add_days ( 2002-04-30 , 1 )
Result
2002-05-01
Example 2_add_days ( 2002-04-30 12:10:10.000, 1 )
Result
2002-05-01 12:10:10.000
Example 3
Appendix F. Using the expression editor 587

_add_days ( 2002-04-30 00:00:00.000, 1/24 )Note that the secondargument is not a whole number. This is supported by some databasetechnologies and increments the time portion.
Result
2002-04-30 01:00:00.000
_add_monthsReturns the date or datetime, depending on the format of "date_expression", thatresults from the addition of "integer_expression" months to "date_expression".
Syntax_add_months ( date_expression, integer_expression )
Example 1_add_months ( 2002-04-30 , 1 )
Result
2002-05-30
Example 2_add_months ( 2002-04-30 12:10:10.000, 1 )
Result
2002-05-30 12:10:10.000
_add_yearsReturns the date or datetime, depending on the format of "date_expression", thatresults from the addition of "integer_expression" years to "date_expression".
Syntax_add_years ( date_expression, integer_expression )
Example 1_add_years ( 2002-04-30 , 1 )
Result
2003-04-30
Example 2_add_years ( 2002-04-30 12:10:10.000 , 1 )
Result
2003-04-30 12:10:10.000
588 IBM Cognos Report Studio Version 10.2.1: User Guide

_ageReturns a number that is obtained from subtracting "date_expression" from today'sdate. The returned value has the form YYYYMMDD, where YYYY represents thenumber of years, MM represents the number of months, and DD represents thenumber of days.
Syntax_age ( date_expression )
Example_age ( 1990-04-30 ) (if today’s date is 2003-02-05)
Result
120906, meaning 12 years, 9 months, and 6 days.
_day_of_weekReturns the day of week (1 to 7), where 1 is the first day of the week as indicatedby the second parameter (1 to 7, 1 being Monday and 7 being Sunday). Note thatin ISO 8601 standard, a week begins with Monday being day 1.
Syntax_day_of_week ( date_expression, integer )
Example_day_of_week ( 2003-01-01 , 1 )
Result
3
_day_of_yearReturns the day of year (1 to 366) in "date_ expression". Also known as Julian day.
Syntax_day_of_year ( date_expression )
Example_day_of_year ( 2003-03-01 )
Result
61
_days_betweenReturns a positive or negative number representing the number of days between"date_expression1" and "date_expression2". If "date_expression1" <"date_expression2", then the result will be a negative number.
Syntax_days_between ( date_expression1 , date_expression2 )
Example
Appendix F. Using the expression editor 589

_days_between ( 2002-04-30 , 2002-06-21 )
Result
-52
_days_to_end_of_monthReturns a number representing the number of days remaining in the monthrepresented by "date_expression".
Syntax_days_to_end_of_month ( date_expression )
Example_days_to_end_of_month ( 2002-04-20 14:30:22.123 )
Result
10
_first_of_monthReturns a date or datetime, depending on the argument, by converting"date_expression" to a date with the same year and month but with the day set to1.
Syntax_first_of_month ( date_expression )
Example 1_first_of_month ( 2002-04-20 )
Result
2002-04-01
Example 2_first_of_month ( 2002-04-20 12:10:10.000 )
Result
2002-04-01 12:10:10.000
_last_of_monthReturns a date or datetime, depending on the argument, that is the last day of themonth represented by "date_expression".
Syntax_last_of_month ( date_expression )
Example 1_last_of_month ( 2002-01-14 )
Result
590 IBM Cognos Report Studio Version 10.2.1: User Guide

2002-01-31
Example 2_last_of_month ( 2002-01-14 12:10:10.000 )
Result
2002-01-31 12:10:10.000
_make_timestampReturns a timestamp constructed from "integer_expression1" (the year),"integer_expression2" (the month), and "integer_expression3" (the day). The timeportion defaults to 00:00:00.000 .
Syntax_make_timestamp ( integer_expression1, integer_expression2,integer_expression3 )
Example_make_timestamp ( 2002 , 01 , 14 )
Result
2002-01-14 00:00:00.000
_months_betweenReturns a positive or negative integer number representing the number of monthsbetween "date_expression1" and "date_expression2". If "date_expression1" is earlierthan "date_expression2", then a negative number is returned.
Syntax_months_between ( date_expression1, date_expression2 )
Example_months_between ( 2002-04-03 , 2002-01-30 )
Result
2
_week_of_yearReturns the number of the week of the year of "date_expression" according to theISO 8601 standard. Week 1 of the year is the first week of the year to contain aThursday, which is equivalent to the first week containing January 4th. A weekstarts on Monday (day 1) and ends on Sunday (day 7).
Syntax_week_of_year ( date_expression )
Example_week_of_year ( 2003-01-01 )
Result
Appendix F. Using the expression editor 591
1
_years_betweenReturns a positive or negative integer number representing the number of yearsbetween "date_expression1" and "date_expression2". If "date_expression1" <"date_expression2" then a negative value is returned.
Syntax_years_between ( date_expression1, date_expression2 )
Example_years_between ( 2003-01-30 , 2001-04-03 )
Result
1
_ymdint_betweenReturns a number representing the difference between "date_expression1" and"date_expression2". The returned value has the form YYYYMMDD, where YYYYrepresents the number of years, MM represents the number of months, and DDrepresents the number of days.
Syntax_ymdint_between ( date_expression1 , date_expression2 )
Example_ymdint_between ( 1990-04-30 , 2003-02-05 )
Result
120906, meaning 12 years, 9 months and 6 days.
Block FunctionsThis list contains functions used to access members of a set, usually in the contextof Analysis Studio.
_firstFromSetReturns the first members found in the set up to "numeric_expression_maximum"+ "numeric_expression_overflow". If "numeric_expression_maximum" +"numeric_expression_overflow" is exceeded, then only the maximum number ofmembers are returned. For a set that has only a few members more than thespecified numeric_expression_maximum, the numeric_expression_overflow allowsthe small set of extra members to be included. If the set has more members thanthe overflow allows, then only the numeric_expression_maximum members will bereturned.
Syntax_firstFromSet ( set_expression , numeric_expression_maximum ,numeric_expression_overflow )
Example 1
592 IBM Cognos Report Studio Version 10.2.1: User Guide

_firstFromSet ( [great_outdoors_company].[Products].[Products].[Product line] , 2 , 8 )
Result
Returns the five members in the Product line set. The first two members arereturned within the maximum and the following three members are returned asthe overflow.
Result dataCamping EquipmentGolf EquipmentMountaineering EquipmentOutdoor ProtectionPersonal Accessories
Example 2_firstFromSet ( [great_outdoors_company].[Products].[Products].[Product line] , 2 , 2 )
Result
Camping Equipment, Golf Equipment
_remainderSetReturns the set containing "member_expression" when the size of "set_expression"is greater than "numeric_expression"; i.e., a new member will be generated if thenumber of members in "set_expression" is larger than the specified"numeric_expression".
Syntax_remainderSet ( member_expression, set_expression ,numeric_expression )
Example_remainderSet ( member ( aggregate ( currentMeasure within set[great_outdoors_company].[Products].[Products].[Product line] ) ,’Product Aggregate’ , ’Product Aggregate’ , [great_outdoors_company].[Products].[Products] ) , [great_outdoors_company].[Products].[Products].[Product line] , 1 )
Result
Quantity sold for Product Aggregate
Aster Data
Aster Data String
overlayReturns the "string_exp1" replacing "string_exp2" from character positionnumeric_exp.
Syntaxoverlay ( string_exp1, string_exp2, numeric_exp1 [, numeric_exp2] )
Appendix F. Using the expression editor 593

btrimReturns string_exp1 after removing the longest string of characters in string_exp2.
Syntaxbtrim( string_exp1 [, string_exp2] )
initcapReturns "string_exp", with the first letter of each word in uppercase and all otherletters in lowercase. Words are delimited by white space or characters that are notalphanumeric.
Syntaxinitcap ( string_exp )
lpadReturns "string_exp1" padded to length "integer_exp" with occurrences of"string_exp2". If "string_exp1" is longer than "integer_exp", the appropriate portionof "string_exp1" is returned.
Syntaxlpad ( string_exp1, integer_exp [ , string_exp2 ] )
ltrimReturns "string_exp1", with leading characters removed up to the first characternot in "string_exp2", e.g., ltrim('xyxXxyAB', 'xy') returns 'XxyAB'.
Syntaxltrim ( string_exp1 [ , string_exp2 ] )
md5Returns the MD5 hash of "string_exp1".
Syntaxmd5 ( string_exp1 )
to_hexReturns the hexadecimal string representation of "numeric_exp1".
Syntaxto_hex ( numeric_exp1 )
repeatReturns the "string_exp" repeated "numeric_exp1" times.
Syntaxrepeat ( string_exp, numeric_exp1 )
replaceReturns "string_exp" having replaced "string_exp2" with "string_exp3".
Syntaxreplace( string_exp, string_exp2, string_exp3)
594 IBM Cognos Report Studio Version 10.2.1: User Guide

rpadReturns "string_exp1" right-padded to length "integer_exp" with occurrences of"string_exp2". If "string_exp1" is longer than "integer_exp", the appropriate portionof "string_exp1" is returned. If "string_exp2" is not specified, then spaces are used.
Syntaxrpad ( string_exp1, integer_exp [ , string_exp2 ] )
rtrimReturns "string_exp1", with final characters removed after the last character not in"string_exp2", e.g., rtrim('ABxXxyx', 'xy') returns 'ABxX'. If "string_exp2" is notspecified, the final space characters are removed.
Syntaxrtrim ( string_exp1 [ , string_exp2 ] )
split_partReturns "numeric_exp" field having split "string_exp1" on "string_exp2".
Syntaxsplit_part ( string_exp1 , string_exp2 , numeric_exp )
Aster Data Data Type Formatting
to_charReturns the string representation of "exp" with the format of "string_exp". "Exp"can be either a date value or a numeric value.
Syntaxto_char ( exp , string_exp )
to_dateConverts "string_exp1" to a date value as specified by the format "string_exp2".
Syntaxto_date ( string_exp1 , string_exp2 )
to_numberConverts "string_exp1" to a numeric value as specified by the format "string_exp2".
Syntaxto_number ( string_exp1, string_exp2 )
to_timestampConverts "string_exp1" to a timestamp value as specified by the format"string_exp2".
Syntaxto_timestamp ( string_exp1, string_exp2 )
Aster Data Math
logReturns the base 10 logarithm of "numeric_exp1" or logarithm to the base"numeric_exp2".
Appendix F. Using the expression editor 595

Syntaxlog ( numeric_exp1[, numeric_exp2] )
lnReturns the natural logarithm of "numeric_exp1".
Syntaxln ( numeric_exp )
cbrtReturns the cube root of "numeric_exp1".
Syntaxcbrt ( numeric_exp )
piReturns the constant of pi.
Syntaxpi( )
Aster Data Trigonometry
acosReturns the arccosine of "numeric_exp" in radians. The arccosine is the anglewhose cosine is "numeric_exp".
Syntaxacos ( numeric_exp )
asinReturns the arcsine of "numeric_exp" in radians. The arcsine is the angle whosesine is "numeric_exp".
Syntaxasin ( numeric_exp )
atanReturns the arctangent of "numeric_exp" in radians. The arctangent is the anglewhose tangent is "numeric_exp".
Syntaxatan ( numeric_exp )
atan2Returns the arctangent of the x and y coordinates specified by "numeric_exp1" and"numeric_exp2", respectively, in radians. The arctangent is the angle whose tangentis "numeric_exp2" / "numeric_exp1".
Syntaxatan2 ( numeric_exp1, numeric_exp2 )
cosReturns the cosine of "numeric_exp", where "numeric_exp" is an angle expressed inradians.
596 IBM Cognos Report Studio Version 10.2.1: User Guide

Syntaxcos ( numeric_exp )
cotReturns the cotangent of "numeric_exp", where "numeric_exp" is an angleexpressed in radians.
Syntaxcot ( numeric_exp )
degreesReturns the degrees where "numeric_exp" is an angle expressed in radians.
Syntaxdegrees ( numeric_exp )
radiansReturns the radians where "numeric_exp" is an angle expressed in degrees.
Syntaxradians ( numeric_exp )
sinReturns the sine of "numeric_exp", where "numeric_exp" is an angle expressed inradians.
Syntaxsin ( numeric_exp )
tanReturns the tangent of "numeric_exp", where "numeric_exp" is an angle expressedin radians.
Syntaxtan ( numeric_exp )
asciiReturns a number representing the ASCII code value of the leftmost character of"string_exp", e.g., ascii('A') is 65.
Syntaxascii ( string_exp )
chrReturns the character that has the ASCII code value specified by "integer_exp"."Integer_exp" should be between 0 and 255.
Syntaxchr ( integer_exp )
current_schemaReturns the name of the current schema
Syntax
Appendix F. Using the expression editor 597

current_schema ()
translateReturns "string_exp1", with each occurrence of each character in "string_exp2"replaced by its corresponding character in "string_exp3".
Syntaxtranslate ( string_exp1, string_exp2, string_exp3 )
date_truncReturns the timestamp to the specified precision.
Syntaxdate_trunc ( string_exp, timestamp_exp)
versionReturns the string value of the database version.
Syntaxversion ( )
DB2
DB2 Math
logReturns the natural logarithm of "numeric_expression".
Syntaxlog ( numeric_expression )
log10Returns the base ten logarithm of "numeric_expression".
Syntaxlog10 ( numeric_expression )
randGenerates a random number using "integer_expression" as a seed value.
Syntaxrand ( integer_expression )
DB2 Trigonometry
acosReturns the arccosine of "numeric_expression" in radians. The arccosine is theangle whose cosine is "numeric_expression".
Syntaxacos ( numeric_expression )
598 IBM Cognos Report Studio Version 10.2.1: User Guide
asinReturns the arcsine of "numeric_expression" in radians. The arcsine is the anglewhose sine is "numeric_expression".
Syntaxasin ( numeric_expression )
atanReturns the arctangent of "numeric_expression" in radians. The arctangent is theangle whose tangent is "numeric_expression".
Syntaxatan ( numeric_expression )
atanhReturns the hyperbolic arctangent of "numeric_expression" where"numeric_expression" is an angle expressed in radians.
Syntaxatanh ( numeric_expression )
atan2Returns the arctangent of the x and y coordinates specified by"numeric_expression1" and "numeric_expression2", respectively, in radians. Thearctangent is the angle whose tangent is "numeric_expression2" /"numeric_expression1".
Syntaxatan2 ( numeric_expression1 , numeric_expression2 )
cosReturns the cosine of "numeric_expression" where "numeric_expression" is an angleexpressed in radians.
Syntaxcos ( numeric_expression )
coshReturns the hyperbolic cosine of "numeric_expression" where "numeric_expression"is an angle expressed in radians.
Syntaxcosh ( numeric_expression )
cotReturns the cotangent of "numeric_expression" where "numeric_expression" is anangle expressed in radians.
Syntaxcot ( numeric_expression )
degreesReturns "numeric_expression" radians converted to degrees.
Syntax
Appendix F. Using the expression editor 599

degrees ( numeric_expression )
sinReturns the sine of "numeric_expression" where "numeric_expression" is an angleexpressed in radians.
Syntaxsin ( numeric_expression )
sinhReturns the hyperbolic sine of "numeric_expression" where "numeric_expression" isan angle expressed in radians.
Syntaxsinh ( numeric_expression )
tanReturns the tangent of "numeric_expression" where "numeric_expression" is anangle expressed in radians.
Syntaxtan ( numeric_expression )
tanhReturns the hyperbolic tangent of "numeric_expression" where"numeric_expression" is an angle expressed in radians.
Syntaxtanh ( numeric_expression )
asciiReturns the ASCII code value of the leftmost character of the argument as aninteger.
Syntaxascii ( string_expression )
Exampleascii ( a )
Result
Returns 65, the ASCII code value of "a".
ceilingReturns the smallest integer greater than or equal to "numeric_expression".
Syntaxceiling ( numeric_expression )
Exampleceiling ( 0.75 )
Result
600 IBM Cognos Report Studio Version 10.2.1: User Guide

Returns 0.8.
charReturns a string representation of a date/time value or a decimal number.
Syntaxchar ( expression )
chrReturns the character that has the ASCII code value specified by"integer_expression". "Integer_expression" should be between 0 and 255.
Syntaxchr ( integer_expression )
Examplechr ( 65 )
Result
Returns a, the character for the ASCII code value of 65.
concatReturns a string that is the result of concatenating "string_expression1" with"string_expression2".
Syntaxconcat ( string_expression1, string_expression2 )
Exampleconcat ( [Sales target (query)].[Sales staff].[First name], [Salestarget (query)].[Sales staff].[Last name] )
Result
Returns the first name and last name; e.g., Bob Smith.
dateReturns a date from a single input value. "Expression" can be a string or integerrepresentation of a date.
Syntaxdate ( expression )
Exampledate ( ’1998-01-08’ )
Result
Returns 8 January 1998.
Appendix F. Using the expression editor 601

dayReturns the day of the month (1-31) from "date_expression". "Date_expression" canbe a date value or a string representation of a date.
Syntaxday ( date_expression )
Exampleday ( ’1998-01-08’ )
Result
Returns 8.
daynameReturns a character string containing the data source-specific name of the day (forexample, Sunday through Saturday or Sun. through Sat. for a data source that usesEnglish, or Sonntag through Samstag for a data source that uses German) for theday portion of "date_expression". "Date_expression" can be a date value or a stringrepresentation of a date.
Syntaxdayname ( date_expression )
Exampledayname ( ’1998-01-08’ )
Result
Returns Thursday.
dayofweekReturns the day of the week in "date_expression" as an integer in the range 1 to 7,where 1 represents Sunday. "date_expression" can be a date value or a stringrepresentation of a date.
Syntaxdayofweek ( date_expression )
Exampledayofweek ( ’1998-01-08’ )
Result
Returns 5.
dayofweek_isoReturns the day of the week in "date_expression" as an integer in the range 1 to 7,where 1 represents Monday. "date_expression" can be a date value or a stringrepresentation of a date.
Syntaxdayofweek_iso ( date_expression )
602 IBM Cognos Report Studio Version 10.2.1: User Guide

Exampledayofweek_iso ( ’1998-01-08’ )
Result
Returns 4.
dayofyearReturns the day of the year in "date_expression" as an integer in the range 1 to366. "Date_expression" can be a date value or a string representation of a date.
Syntaxdayofyear ( date_expression )
Exampledayofyear ( current_date )
Result
Returns the day of the year for the current date; e.g., if it was January 28, theexpression would return 28.
daysReturns an integer representation of a date. "Expression" can be a date value or astring representation of a date.
Syntaxdays ( expression )
decReturns the decimal representation of "string-expression" using "precision-integer"and "scale-integer". The "decimal-character" can be used to specify the single-bytecharacter constant used to delimit the decimal digits in "string-expression". The"string-expression" must be formatted as an SQL Integer or Decimal constant.Alternate syntax: dec ( numeric-expression [ , precision-integer[ , scale-integer ] ] ) Returns the decimal representation of "numeric-expression"using "precision-integer" and "scale-integer".
Syntaxdec ( string-expression [ , precision-integer [ , scale-integer [ ,decimal-character ] ] ] )
decimalReturns the decimal representation of "string-expression" using "precision-integer"and "scale-integer". The "decimal-character" can be used to specify the single-bytecharacter constant used to delimit the decimal digits in "string-expression". The"string-expression" must be formatted as an SQL Integer or Decimal constant.Alternate syntax: decimal ( numeric-expression [ , precision-integer[ , scale-integer ] ] ) Returns the decimal representation of "numeric-expression"using "precision-integer" and "scale-integer".
Syntax
Appendix F. Using the expression editor 603

decimal ( string-expression [ , precision-integer [ , scale-integer[ , decimal-character ] ] ] )
differenceReturns an integer value representing the difference between the values returnedby the data source-specific soundex function for "string_expression1" and"string_expression2". The value returned ranges from 0 to 4, with 4 indicating thebest match. Note that 4 does not mean that the strings are equal.
Syntaxdifference ( string_expression1 , string_expression2 )
Example 1difference ([Sales target (query)].[Sales staff].[First name],[Sales (query)].[Retailers].[Contact first name])
Result
0
Example 2difference ([Sales target (query)].[Sales staff].[First name],[Salestarget (query)].[Sales staff].[First name])
Result
4
digitsReturns the character string representation of a non-floating point number.
Syntaxdigits ( numeric_expression )
doubleReturns the floating-point representation of an expression. "Expression" can eitherbe a numeric or string expression.
Syntaxdouble ( expression )
event_mon_stateReturns the operational state of a particular state monitor.
Syntaxevent_mon_state ( string_expression )
floatReturns the floating-point representation of a number.
Syntaxfloat ( numeric_expression )
604 IBM Cognos Report Studio Version 10.2.1: User Guide

hexReturns the hexadecimal representation of a value.
Syntaxhex ( expression )
hourReturns the hour, an integer from 0 (midnight) to 23 (11:00 pm), from"time_expression". "Time_expression" can be a time value or a string representationof a time.
Syntaxhour ( time_expression )
Examplehour ( 01:22:45 )
Result
Returns 1.
insertReturns a string where "integer_expression2" characters have been deleted from"string_expression1" beginning at "integer_expression1" and where"string_expression2" has been inserted into "string_expression1" at its start. Thefirst character in the string is at position 1.
Syntaxinsert ( string_expression1, integer_expression1,integer_expression2, string_expression2 )
integerReturns the integer representation of an expression. "Expression" can be a numericvalue or a string representation of a number.
Syntaxinteger ( expression )
Exampleinteger ( 84.95 )
Result
85
intReturns the integer representation of an expression. "Expression" can be a numericvalue or a string representation of a number.
Syntaxint ( expression )
Appendix F. Using the expression editor 605

Exampleint ( 84.95 )
Result
85
julian_dayReturns an integer value representing the number of days from January 1, 4712 BC(the start of the Julian date calendar) to the date value specified in "expression"."Expression" can be a date value or a string representation of a date.
Syntaxjulian_day ( expression )
Examplejulian_day ( ’2009-06-29’ )
Result
2455012.22130739595741034
lcaseReturns "string_expression" with all uppercase characters shifted to lowercase.
Syntaxlcase ( string_expression )
Examplelcase ( [Sales (query)].[Sales staff].[Last name] )
Result
Returns last names with no uppercase letters.
leftReturns the leftmost "integer_expression" characters of "string_expression".
Syntaxleft ( string_expression, integer_expression )
Exampleleft ( [Sales (query)].[Sales staff].[Last name] , 3 )
Result
Returns the first three characters of each last name.
lengthReturns the length of the operand in bytes. Exception: double byte string typesreturn the length in characters.
Syntax
606 IBM Cognos Report Studio Version 10.2.1: User Guide

length ( expression )
Examplelength ( [Sales (query)].[Sales staff].[Record start date] )
Result
Returns 4; dates always return a value of 4.
locateReturns the starting position of the first occurrence of "string_expression1" within"string_expression2". The search starts at position start "integer_expression" of"string_expression2". The first character in a string is at position 1. If"string_expression1" is not found, zero is returned.
Syntaxlocate ( string_expression1, string_expression2 [ ,integer_expression ] )
Examplelocate ( A, [Sales (query)].[Sales staff].[Last name] , 2 )
Result
Returns the position of the character A in the last names starting at the secondcharacter of the last name.
long_varcharReturns a long string.
Syntaxlong_varchar ( string_expression )
ltrimReturns "string_expression" with leading spaces removed.
Syntaxltrim ( string_expression )
Exampleltrim ( [Sales (query)].[Sales staff].[Last name] )
Result
Returns last names with any leading spaces removed.
microsecondReturns the microsecond (time-unit) part of a value. "Expression" can be atimestamp or a string representation of a timestamp.
Syntaxmicrosecond ( expression )
Appendix F. Using the expression editor 607

Examplemicrosecond ( 01:45:34.056 )
Result
Returns 056.
midnight_secondsReturns an integer value in the range 0 to 86400 representing the number ofseconds between midnight and time value specified in the argument. "Expression"can be a time value, a timestamp or a string representation of a time.
Syntaxmidnight_seconds ( expression )
Examplemidnight_seconds ( 01:45:34.056 )
Result
Returns 6334.
minuteReturns the minute (an integer from 0-59) from "time_expression"."Time_expression" can be a time value, a timestamp, or a string representation of atime.
Syntaxminute ( time_expression )
Exampleminute ( 01:45:34.056 )
Result
Returns 45.
monthReturns the month (an integer from 1-12) from "date_expression".
Syntaxmonth ( date_expression )
Examplemonth ( 2005-11-01 )
Result
Returns 11.
608 IBM Cognos Report Studio Version 10.2.1: User Guide

monthnameReturns a character string containing the data source-specific name of the month(for example, January through December or Jan. through Dec. for an English datasource, or Januar through Dezember for a German data source) for the monthportion of "date_expression".
Syntaxmonthname ( date_expression )
Examplemonthname ( 2005-11-01 )
Result
November
quarterReturns the quarter in "date_expression" as a number in the range 1 to 4, where 1represents January 1 through March 31.
Syntaxquarter ( date_expression )
Examplequarter ( 2005-11-01 )
Result
Returns 4.
radiansReturns the number of radians converted from "numeric_expression" degrees.
Syntaxradians ( numeric_expression )
repeatReturns a string consisting of "string_expression" repeated "integer_expression"times.
Syntaxrepeat ( string_expression, integer_expression )
Examplerepeat ( XYZ, 3 )
Result
Returns XYZXYZXYZ.
Appendix F. Using the expression editor 609

replaceReplaces all occurrences of "string_expression2" in "string_expression1" with"string_expression3".
Syntaxreplace ( string_expression1, string_expression2, string_expression3 )
Examplereplace ( [Sales (query)].[Sales staff].[Position code], A, a )
Result
Returns position codes with all occurrences of "A" replaced by "a".
rightReturns the rightmost "integer_expression" characters of "string_expression".
Syntaxright ( string_expression, integer_expression )
Exampleright ( [Sales (query)].[Sales staff].[Position code], 3 )
Result
Returns the rightmost 3 characters of each position code.
roundReturns "numeric_expression" rounded to "integer_expression" places to the rightof the decimal point. If "integer_expression" is negative, "numeric_expression" isrounded to the nearest absolute value "integer_expression" places to the left of thedecimal point. Rounding takes place before data formatting is applied.
Syntaxround ( numeric_expression, integer_expression )
Exampleround ( 3.14159265, 3 )
Result
Returns 3.142.
rtrimReturns "string_expression" with trailing spaces removed.
Syntaxrtrim ( string_expression )
Examplertrim ( [Sales (query)].[Sales staff].[Last name] )
Result
610 IBM Cognos Report Studio Version 10.2.1: User Guide

Returns last names with any spaces at the end of the name removed.
secondReturns the second (an integer from 0-59) from "time_expression".
Syntaxsecond ( time_expression )
Examplesecond ( 01:45:34.056 )
Result
Returns 34.
signReturns an indicator of the sign of "numeric_expression": +1 if"numeric_expression" is positive, 0 if zero, or -1 if negative.
Syntaxsign ( numeric_expression )
Examplesign ( [Revenue] )
Result
Returns + for positive values and - for negative values.
smallintReturns the small integer representation of a number.
Syntaxsmallint ( expression )
soundexReturns a 4 character string code obtained by systematically abbreviating wordsand names in "string_expression" according to phonetics. Can be used to determineif two strings sound the same. For example, does sound-of ('SMITH') = sound-of('SMYTH').
Syntaxsoundex ( string_expression )
spaceReturns a string consisting of "integer_expression" spaces.
Syntaxspace ( integer_expression )
Examplespace ( 5 )
Appendix F. Using the expression editor 611

Result
Returns 5 spaces.
substrReturns the substring of "string_expression" that starts at position"integer_expression1" for "integer_expression2" characters. The first character in"string_expression" is at position 1.
Syntaxsubstr ( string_expression , integer_expression1 [ ,integer_expression2 ] )
Examplesubstr ( [Sales (query)].[Sales staff].[Position code], 3 , 5 )
Result
Returns characters 3 to 7 of the position codes.
table_nameReturns an unqualified name of a table or view based on the object name in"string_expression1" and the schema name given in "string_expression2". It is usedto resolve aliases.
Syntaxtable_name ( string_expression1 [ , string_expression2 ] )
table_schemaReturns the schema name portion of the two-part table or view name based on theobject name in "string_expression1" and the schema name in "string_expression2".It is used to resolve aliases.
Syntaxtable_schema ( string_expression1 [ , string_expression2 ] )
timeReturns a time from a value.
Syntaxtime ( expression )
timestampReturns a timestamp from a value or a pair of values. "Expression1" must representa date value, and "expression2" must represent a time value.
Syntaxtimestamp ( expression1 [ , expression2 ] )
Exampletimestamp ( 11 November 2005 , 12:00:00.000000 )
612 IBM Cognos Report Studio Version 10.2.1: User Guide

Result
Returns 2005-11-11-12:00:00.000000.
timestamp_isoReturns a datetime in the ISO format (yyyy-mm-dd hh:mm:ss.nnnnnn) convertedfrom the IBM format (yyyy-mm-dd-hh.mm.ss.nnnnnn). If "expression" is a time, itinserts the value of the CURRENT DATE for the date elements and zero for thefractional time element.
Syntaxtimestamp_iso ( expression )
Exampletimestamp_iso ( 11 November 2005 , 12:00:00.000000 )
Result
Returns 2005-11-11 12:00:00.000000.
timestampdiffReturns an estimated number of intervals of type "expression1" based on thedifference between two timestamps. "Expression2" is the result of subtracting twotimestamp types and converting the result to CHAR. Valid values of "expression1"are: 1 Fractions of a second; 2 Seconds; 4 Minutes; 8 Hours; 16 Days; 32 Weeks; 64Months; 128 Quarters; 256 Years.
Syntaxtimestampdiff ( expression1, expression2 )
to_charReturns the string representation of a timestamp with the format of"string_expression".
Syntaxto_char ( timestamp_expression , string_expression )
translateReturns "string_expression1" in which characters from "string_expression3" aretranslated to the equivalent characters in "string_expression2". "String_expression4"is a single character that is used to pad "string_expression2" if it is shorter than"string_expression3". If only "string_expression1" is present, then this functiontranslates it to uppercase characters.
Syntaxtranslate ( string_expression1 [ , string_expression2,string_expression3 [ , string_expression4 ] ] )
Example 1translate ( ’abcdefg’ )
Result
Appendix F. Using the expression editor 613

Returns ABCDEFG.
Example 2translate ( ’mnlop’ , n, m , - )
Result
Returns n-nlop.
truncReturns "numeric_expression1" truncated to "numeric_expression2" places to theright of the decimal point. If "numeric_expression2" is negative,"numeric_expression1" is truncated to the absolute value of "numeric_expression2"places to the left of the decimal point.
Syntaxtrunc ( numeric_expression1, numeric_expression2 )
Exampletrunc ( 3.14159265, 3 )
Result
Returns 3.141.
truncateReturns "numeric_expression1" truncated to "numeric_expression2" places to theright of the decimal point. If "numeric_expression2" is negative,"numeric_expression1" is truncated to the absolute value of "numeric_expression2"places to the left of the decimal point.
Syntaxtruncate ( numeric_expression1, numeric_expression2 )
Exampletruncate ( 3141.59265, -3 )
Result
Returns 3.
ucaseReturns "string_expression" with all lowercase characters shifted to uppercase.
Syntaxucase ( string_expression )
Exampleucase ( XY896Zbced789 )
Result
Returns XY896ZBCED789.
614 IBM Cognos Report Studio Version 10.2.1: User Guide

valueReturns the first non-null argument (or null if all arguments are null). The Valuefunction takes two or more arguments.
Syntaxvalue ( expression_list )
Examplevalue ( [Unit cost], [Unit price], [Unit sale price] )
Result
Returns the first non-null value.
varcharReturns a VARCHAR representation of expression, with lengthnumeric_expression.
Syntaxvarchar ( expression [ , numeric_expression ] )
weekReturns the week of the year in "date_expression" as an integer value in the range1 to 53.
Syntaxweek ( date_expression )
Exampleweek ( 11 November 2005 )
Result
Returns 45.
yearReturns the year from "date_expression".
Syntaxyear ( date_expression )
Exampleyear ( 11 November 2005 )
Result
Returns 2005.
Appendix F. Using the expression editor 615

Greenplum
Greenplum String
overlayReturns the "string_expression1" replacing "string_expression2" from characterposition "numeric_expression".
Syntaxoverlay ( string_expression1 , string_expression2 ,numeric_expression1 [ , numeric_expression2 ] )
btrimReturns "string_expression1" after removing the longest string of characters in"string_expression2".
Syntaxbtrim ( string_expression1 [ , string_expression2 ] )
initcapReturns "string_expression" with the first letter of each word in uppercase and allother letters in lowercase. Words are delimited by white space or characters thatare not alphanumeric.
Syntaxinitcap ( string_expression )
lpadReturns "string_expression1" padded to length "integer_expression" withoccurrences of "string_expression2". If "string_expression1" is longer than"integer_expression", the appropriate portion of "string_expression1" is returned.
Syntaxlpad ( string_expression1 , integer_expression [ , string_expression2] )
ltrimReturns "string_expression1", with leading characters removed up to the firstcharacter not in "string_expression2"; for example, ltrim ( 'xyxXxyAB' , 'xy' )returns XxyAB.
Syntaxltrim ( string_expression1 [ , string_expression2 ] )
md5Returns the MD5 hash of "string_expression1".
Syntaxmd5 ( string_expression1 )
to_hexReturns the hexadecimal string representation of "numeric_expression1".
Syntaxto_hex ( numeric_expression1 )
616 IBM Cognos Report Studio Version 10.2.1: User Guide

repeatReturns the "string_expression" repeated "numeric_expression1" times.
Syntaxrepeat ( string_expression , numeric_expression1 )
replaceReturns "string_expression" having replaced "string_expression2" with"string_expression3".
Syntaxreplace ( string_expression , string_expression2 , string_expression3)
rpadReturns "string_expression1" right-padded to length "integer_expression" withoccurrences of "string_expression2". If "string_expression1" is longer than"integer_expression", the appropriate portion of "string_expression1" is returned. If"string_expression2" is not specified, then spaces are used.
Syntaxrpad ( string_expression1 , integer_expression [ , string_expression2] )
rtrimReturns "string_expression1", with final characters removed after the last characternot in "string_expression2"; for example, rtrim ( 'ABxXxyx' , 'xy' ) returns ABxX. If"string_expression2" is not specified, the final space characters are removed.
Syntaxrtrim ( string_expression1 [ , string_expression2 ] )
split_partReturns "numeric_expression" field having split "string_expression1" on"string_expression2".
Syntaxsplit_part ( string_expression1 , string_expression2 ,numeric_expression )
Greenplum Data type formatting
to_charReturns the string representation of "expression" with the format of"string_expression". "Expression" can either be a date value or a numeric value.
Syntaxto_char ( expression , string_expression )
to_dateConverts "string_expression1" to a date value as specified by the format"string_expression2".
Syntaxto_date ( string_expression1 , string_expression2 )
Appendix F. Using the expression editor 617

to_numberConverts "string_expression1" to a numeric value as specified by the format"string_expression2".
Syntaxto_number ( string_expression1 , string_expression2 )
to_timestampConverts "string_expression1" to a timestamp value as specified by the format"string_expression2".
Syntaxto_timestamp ( string_expression1 , string_expression2 )
Greenplum Math
logReturns the base 10 logarithm of "numeric_expression1" or logarithm to the base"numeric_expression2".
Syntaxlog ( numeric_expression1 [ , numeric_expression2 ] )
lnReturns the natural logarithm of "numeric_expression1".
Syntaxln ( numeric_expression )
cbrtReturns the cube root of "numeric_expression1".
Syntaxcbrt ( numeric_expression )
piReturns the constant of pi.
Syntaxpi ()
Greenplum Trigonometry
acosReturns the arccosine of "numeric_expression" in radians. The arccosine is theangle whose cosine is "numeric_expression".
Syntaxacos ( numeric_expression )
asinReturns the arcsine of "numeric_expression" in radians. The arcsine is the anglewhose sine is "numeric_expression".
Syntax
618 IBM Cognos Report Studio Version 10.2.1: User Guide

asin ( numeric_expression )
atanReturns the arctangent of "numeric_expression" in radians. The arctangent is theangle whose tangent is "numeric_expression".
Syntaxatan ( numeric_expression )
atan2Returns the arctangent of the x and y coordinates specified by"numeric_expression1" and "numeric_expression2", respectively, in radians. Thearctangent is the angle whose tangent is "numeric_expression2" /"numeric_expression1".
Syntaxatan2 ( numeric_expression1 ,numeric_expression2 )
cosReturns the cosine of "numeric_expression" where "numeric_expression" is an angleexpressed in radians.
Syntaxcos ( numeric_expression )
cotReturns the cotangent of "numeric_expression" where "numeric_expression" is anangle expressed in radians.
Syntaxcot ( numeric_expression )
degreesReturns the degrees where "numeric_expression" is an angle expressed in radians.
Syntaxdegrees ( numeric_expression )
radiansReturns the radians where "numeric_expression" is an angle expressed in degrees.
Syntaxradians ( numeric_expression )
sinReturns the sine of "numeric_expression" where "numeric_expression" is an angleexpressed in radians.
Syntaxsin ( numeric_expression )
tanReturns the tangent of "numeric_expression" where "numeric_expression" is anangle expressed in radians.
Syntax
Appendix F. Using the expression editor 619

tan ( numeric_expression )
asciiReturns a number representing the ascii code value of the leftmost character of"string_expression"; for example, ascii ( 'A' ) is 65.
Syntaxascii ( string_expression )
chrReturns the character that has the ASCII code value specified by"integer_expression". "Integer_expression" should be between 0 and 255.
Syntaxchr ( integer_expression )
current_databaseReturns the name of the current database.
Syntaxcurrent_database ()
current_schemaReturns the name of the current schema.
Syntaxcurrent_schema ()
{current_user}Syntax{current_user}
{session_user}Syntax{session_user}
translateReturns "string_expression1" with each occurrence of each character in"string_expression2" replaced by its corresponding character in"string_expression3".
Syntaxtranslate ( string_expression1 , string_expression2 ,string_expression3 )
date_truncReturns the timestamp to the specified precision.
Syntaxdate_trunc ( string_expression , timestamp_expression)
620 IBM Cognos Report Studio Version 10.2.1: User Guide

versionReturns the string value of the database version.
Syntaxversion ()
Informix
Informix Math
log10Returns the logarithm of "numeric_expression" to base 10.
Syntaxlog10 ( numeric_expression )
lognReturns the natural logarithm of "numeric_expression".
Syntaxlogn ( numeric_expression )
rootReturns the root value of "numeric_expression1". Requires at least one numericargument (the radians argument). If only "numeric_expression1" is supplied, 2 isused as a default value for "numeric_expression2". Zero cannot be used as thevalue of "numeric_expression2".
Syntaxroot ( numeric_expression1 [ , numeric_expression2 ] )
Informix Trigonometry
acosReturns the arccosine of "numeric_expression" in radians. The arccosine is theangle whose cosine is "numeric_expression".
Syntaxacos ( numeric_expression )
asinReturns the arcsine of "numeric_expression" in radians. The arcsine is the anglewhose sine is "numeric_expression".
Syntaxasin ( numeric_expression )
atanReturns the arctangent of "numeric_expression" in radians. The arctangent is theangle whose tangent is "numeric_expression".
Syntaxatan ( numeric_expression )
Appendix F. Using the expression editor 621

atan2Returns the arctangent of the x and y coordinates specified by"numeric_expression1" and "numeric_expression2", respectively, in radians. Thearctangent is the angle whose tangent is "numeric_expression1".
Syntaxatan2 ( numeric_expression1 , numeric_expression2 )
cosReturns the cosine of "numeric_expression" where "numeric_expression" is an angleexpressed in radians.
Syntaxcos ( numeric_expression )
sinReturns the sine of "numeric_expression" where "numeric_expression" is an angleexpressed in radians.
Syntaxsin ( numeric_expression )
tanReturns the tangent of "numeric_expression" where "numeric_expression" is anangle expressed in radians.
Syntaxtan ( numeric_expression )
cardinalityReturns the number of elements in a collection column (SET, MULTISET, LIST).
Syntaxcardinality ( string_expression )
char_lengthReturns the number of logical characters in "string_expression". The number oflogical characters can be distinct from the number of bytes in some East Asianlocales.
Syntaxchar_length ( string_expression )
concatReturns a string that is the result of concatenating, or joining, "string_expression1"to "string_expression2".
Syntaxconcat ( string_expression1 , string_expression2 )
Exampleconcat ( [Sales (query)].[Sales staff].[First name], [Sales (query)].[Sales staff].[Last name] )
622 IBM Cognos Report Studio Version 10.2.1: User Guide

Result
Returns the first name and last name; e.g., Bob Smith.
dateReturns the date value of "string_expression", "date_expression", or"integer_expression".
Syntaxdate ( string_expression|date_expression|integer_expression )
dayReturns an integer that represents the day of the month (1-31).
Syntaxday ( date_expression )
extendAdjusts the precision of a datetime or date expression. The expression cannot be aquoted string representation of a date value. If you do not specify first and lastqualifiers, the default qualifiers are year to fraction (3). If the expression containsfields that are not specified by the qualifiers, the unwanted fields are discarded. Ifthe first qualifier specifies a larger (more significant) field than what exists in theexpression, the new fields are filled in with values returned by the currentfunction. If the last qualifier specifies a smaller (less significant) field than whatexists in the expression, the new fields are filled in with constant values. A missingmonth or day field is filled in with 1, and missing hour to fraction fields are filledin with 0.
Syntaxextend ( date_expression , ’ { ’ year to second ’ } ’ )
Exampleextend ( some_date_column , { year to second } )
hexReturns the hexadecimal encoding of "integer_expression".
Syntaxhex ( integer_expression )
initcapReturns "string_expression" with the first letter of each word in uppercase and allother letters in lowercase. A word begins after any character other than a letter.Thus, in addition to a blank space, symbols such as commas, periods, and colonscan introduce a new word.
Syntaxinitcap ( string_expression )
Appendix F. Using the expression editor 623

lengthReturns the number of bytes in "string_expression", not including any trailingblank spaces. For byte or text "string_expression", length returns the full number ofbytes, including any trailing blank spaces.
Syntaxlength ( string_expression )
lpadReturns "string_expression1" left-padded by "string_expression2" to the totalnumber of characters specified by "integer_expression". The sequence of"string_expression2" occurs as many times as necessary to make the return stringthe length specified by "integer_expression".
Syntaxlpad ( string_expression1 , integer_expression , string_expression2 )
mdyReturns a type date value with three expressions that evaluate to integers thatrepresent the month (integer_expression1), day (integer_expression2), and year(integer_expression3).
Syntaxmdy ( integer_expression1 , integer_expression2 ,integer_expression3 )
monthReturns an integer corresponding to the month portion of "date_expression".
Syntaxmonth ( date_expression )
nvlReturns the value of "expression1" if "expression1" is not NULL. If "expression1" isNULL, then returns the value of "expression2".
Syntaxnvl ( expression1 , expression2 )
Examplenvl ( [Unit sale price] , [Unit price] )
Result
Returns the unit sale price, or returns the unit price if the unit sale price is NULL.
octet_lengthReturns the number of bytes in "string_expression", including any trailing spaces.
Syntaxoctet_length ( string_expression )
624 IBM Cognos Report Studio Version 10.2.1: User Guide

replaceReturns "string_expression1" in which every occurrence of "string_expression2" isreplaced by "string_expression3". If you omit the "string_expression3" option, everyoccurrence of "string_expression2" is omitted from the return string.
Syntaxreplace ( string_expression1 , string_expression2 [ ,string_expression3 ] )
Examplereplace ( [Sales (query)].[Products].[Product line code] , - )
Result
Returns all product line codes without the character "-"
roundReturns the rounded value of "numeric_expression". If you omit"integer_expression", the value is rounded to zero digits or to the units place. Thedigit range of 32 (+ and -) refers to the entire decimal value. Rounding takes placebefore data formatting is applied.
Syntaxround ( numeric_expression [ , integer_expression ] )
Exampleround (125, -1)
Result
130
rpadReturns "string_expression1" right-padded by "string_expression2" to the totalnumber of characters specified by "integer_expression". The sequence of"string_expression2" occurs as many times as necessary to make the return stringthe length specified by "integer_expression".
Syntaxrpad ( string_expression1 , integer_expression , string_expression2 )
substrReturns the substring of "string_expression" that starts at position"integer_expression1" for "integer_expression2" characters. The first character in"string_expression" is at position 1. If you omit "integer_expression2", returns thesubstring of "string_expression" that starts at position "integer_expression1" andends at the end of "string_expression".
Syntaxsubstr ( string_expression , integer_expression1 [ ,integer_expression2 ] )
Example
Appendix F. Using the expression editor 625
substr ( [Sales (query)].[Sales staff].[Position code], 3 , 5 )
Result
Returns characters 3 to 7 of the position codes.
to_charReturns the character string "date_expression" with the specified"string_expression" formatting. You can use this function only with built-in datatypes.
Syntaxto_char ( date_expression , string_expression )
to_dateReturns "string_expression1" as a date according to the date format you specify in"string_expression2". If "string_expression1" is NULL, then a NULL value isreturned.
Syntaxto_date ( string_expression1 , string_expression2 )
truncReturns the truncated value of "numeric_expression". If you omit"integer_expression", then "numeric_expression" is truncated to zero digits or to theunit’s place. The digit limitation of 32 (+ and -) refers to the entire decimal value.
Syntaxtrunc ( numeric_expression [ , integer_expression ] )
weekdayReturns an integer that represents the day of the week of "date_expression". Zero(0) represents Sunday, one (1) represents Monday, and so on.
Syntaxweekday ( date_expression )
yearReturns a four-digit integer that represents the year of "date_expression".
Syntaxyear ( date_expression )
MS Access
MS Access Cast
cast_decimalReturns the value of "expression" cast as a decimal.
Syntaxcast_decimal ( expression )
626 IBM Cognos Report Studio Version 10.2.1: User Guide

cast_floatReturns the value of "expression" cast as a float.
Syntaxcast_float ( expression )
cast_integerReturns the value of "expression" cast as an integer.
Syntaxcast_integer ( expression )
Examplecast_integer ( 84.95 )
Result
84
cast_numericReturns "string_expression" cast as a numeric value.
Syntaxcast_numeric ( string_expression )
cast_realReturns the value of "expression" cast as a real value.
Syntaxcast_real ( expression )
cast_smallintReturns "expression" cast as a small integer.
Syntaxcast_smallint ( expression )
cast_varcharReturns the value of "expression" cast as a variable character field.
Syntaxcast_varchar ( expression )
MS Access Math
logReturns the natural logarithm of "numeric_expression".
Syntaxlog ( numeric_expression )
randGenerates a random number using "integer_expression" as a seed value.
Syntax
Appendix F. Using the expression editor 627

rand ( integer_expression )
MS Access Trigonometry
atanReturns the arctangent of "numeric_expression" in radians. The arctangent is theangle whose tangent is "numeric_expression".
Syntaxatan ( numeric_expression )
cosReturns the cosine of "numeric_expression" where "numeric_expression" is an angleexpressed in radians.
Syntaxcos ( numeric_expression )
sinReturns the sine of "numeric_expression" where "numeric_expression" is an angleexpressed in radians.
Syntaxsin ( numeric_expression )
tanReturns the tangent of "numeric_expression" where "numeric_expression" is anangle expressed in radians.
Syntaxtan ( numeric_expression )
asciiReturns the ascii code value of the leftmost character of "string_expression".
Syntaxascii ( string_expression )
ceilingReturns the smallest integer greater than or equal to "numeric_expression".
Syntaxceiling ( numeric_expression )
chrReturns the character that has the ASCII code value specified by"integer_expression". "Integer_expression" should be between 0 and 255.
Syntaxchr ( integer_expression )
628 IBM Cognos Report Studio Version 10.2.1: User Guide

concatReturns a string that is the result of concatenating, or joining, "string_expression1"to "string_expression2".
Syntaxconcat ( string_expression1 , string_expression2 )
Exampleconcat ( [Sales (query)].[Sales staff].[First name], [Sales (query)].[Sales staff].[Last name] )
Result
Returns the first name and last name; e.g., Bob Smith.
curdateReturns a date value representing the current date of the computer that thedatabase software runs on.
Syntaxcurdate ()
curtimeReturns a time value representing the current time of the computer that thedatabase software runs on.
Syntaxcurtime ()
daynameReturns a character string containing the data source-specific name of the day (forexample, Sunday through Saturday or Sun. through Sat. for an English data source,or Sonntag through Samstag for a German data source) for the day portion of"date_expression".
Syntaxdayname ( date_expression )
dayofmonthReturns the day of the month (1-31) from "date_expression". Returns the days field(a signed integer) from "interval_expression".
Syntaxdayofmonth ( date_expression|interval_expression )
dayofweekReturns the day of the week in "date_expression" as an integer (1-7), where 1represents Monday.
Syntaxdayofweek ( date_expression )
Appendix F. Using the expression editor 629

dayofyearReturns the day of the year in "date_expression" as an integer (1-366).
Syntaxdayofyear ( date_expression )
hourReturns the hour from "time_expression" as an integer from 0 (midnight) to 23(11:00 pm).
Syntaxhour ( time_expression )
instrSearches "string_expression1" for the first occurrence of "string_expression2" andreturns an integer specifying the position of "string_expression2"."Integer_expression1" sets the starting position for the search. If"integer_expression1" is omitted, the search begins at the first character position of"string_expression1". "Integer_expression2" specifies the type of string comparison."Integer_expression1" is required if "integer_expression2" is specified.
Syntaxinstr ( [ integer_expression1 , ] string_expression1 ,string_expression2 [ , integer_expression2 ] )
lcaseReturns "string_expression" with all uppercase characters converted to lowercase.
Syntaxlcase ( string_expression )
leftReturns the leftmost "integer_expression" characters of "string_expression".
Syntaxleft ( string_expression , integer_expression )
Exampleleft ( [Sales (query)].[Sales staff].[Last name] , 3 )
Result
Returns the first three characters of each last name.
lengthReturns the number of characters in "string_expression", excluding trailing blanksand the string termination character.
Syntaxlength ( string_expression )
630 IBM Cognos Report Studio Version 10.2.1: User Guide

locateReturns the starting position of the first occurrence of "string_expression1" within"string_expression2". The search starts at position "integer_expression" of"string_expression2". The first character in a string is at position 1. If"string_expression1" is not found, then zero is returned.
Syntaxlocate ( string_expression1 , string_expression2 [ ,integer_expression ] )
ltrimReturns "string_expression" with leading spaces removed.
Syntaxltrim ( string_expression )
minuteReturns the minute (an integer from 0-59) from "time_expression".
Syntaxminute ( time_expression )
monthReturns the month (an integer from 1-12) from "date_expression".
Syntaxmonth ( date_expression )
monthnameReturns a character string containing the data source-specific name of the month(for example, January through December or Jan. through Dec. for an English datasource, or Januar through Dezember for a German data source) for the monthportion of "date_expression".
Syntaxmonthname ( date_expression )
Examplemonthname ( 2005-11-01 )
Result
November
nowReturns a datetime value representing the current date and time of the computerthat the database software runs on.
Syntaxnow ()
Appendix F. Using the expression editor 631

positionReturns the starting position of "string_expression1" in "string_expression2". Thefirst character in a string is at position 1.
Syntaxposition ( string_expression1 , string_expression2 )
quarterReturns the quarter in "date_expression" as a number (1-4), where 1 representsJanuary 1 through March 31.
Syntaxquarter ( date_expression )
rightReturns the rightmost "integer_expression" characters of "string_expression".
Syntaxright ( string_expression , integer_expression )
roundReturns "numeric_expression" rounded to the nearest value "integer_expression"places right of the decimal point. If "integer_expression" is negative,"numeric_expression" is rounded to the nearest absolute value "integer_expression"places to the left of the decimal point. Rounding takes place before data formattingis applied.
Syntaxround ( numeric_expression , integer_expression )
Exampleround (125, -1)
Result
130
rtrimReturns "string_expression" with trailing spaces removed.
Syntaxrtrim ( string_expression )
Examplertrim ( [Sales (query)].[Sales staff].[Last name] )
Result
Returns last names with any spaces at the end of the name removed.
632 IBM Cognos Report Studio Version 10.2.1: User Guide

signReturns an indicator of the sign of "numeric_expression", +1 if positive, 0 if zero,or -1 if negative.
Syntaxsign ( numeric_expression )
spaceReturns a string consisting of "integer_expression" spaces.
Syntaxspace ( integer_expression )
substrReturns the substring of "string_expression" that starts at position"integer_expression1" for "integer_expression2" characters. The first character in"string_expression" is at position 1.
Syntaxsubstr ( string_expression , integer_expression1 ,integer_expression2 )
Examplesubstr ( [Sales (query)].[Sales staff].[Position code], 3 , 5 )
Result
Returns characters 3 to 7 of the position codes.
substringReturns the substring of "string_expression" that starts at position"integer_expression1" for "integer_expression2" characters. The first character in"string_expression" is at position 1.
Syntaxsubstring ( string_expression , integer_expression1 ,integer_expression2 )
Examplesubstring ( [Sales (query)].[Sales staff].[Position code], 3 , 5 )
Result
Returns characters 3 to 7 of the position codes.
truncateReturns "string_expression" with trailing spaces removed.
Syntaxtruncate ( string_expression )
Appendix F. Using the expression editor 633

ucaseReturns "string_expression" with all lowercase characters converted to uppercase.
Syntaxucase ( string_expression )
weekReturns the week of the year in "date_expression" as an integer value (1-53), where1 represents the first week of the year.
Syntaxweek ( date_expression )
yearReturns the year from "date_expression".
Syntaxyear ( date_expression )
MySQL
MySQL String
lpadReturns "string_expression1" padded to length "integer_expression" withoccurrences of "string_expression2". If "string_expression1" is longer than"integer_expression", the appropriate portion of "string_expression1" is returned.
Syntaxlpad ( string_expression1 , integer_expression [ , string_expression2] )
ltrimReturns "string_expression1", with leading characters removed up to the firstcharacter not in "string_expression2"; for example, ltrim ( 'xyxXxyAB' , 'xy' )returns XxyAB.
Syntaxltrim ( string_expression1 [ , string_expression2 ] )
hexReturns the hexadecimal string representation of "numeric_expression1".
Syntaxhex ( numeric_expression1 )
repeatReturns the "string_expression" repeated "numeric_expression1" times.
Syntaxrepeat ( string_expression , numeric_expression1 )
634 IBM Cognos Report Studio Version 10.2.1: User Guide

replaceReturns "string_expression" having replaced "string_expression2" with"string_expression3".
Syntaxreplace ( string_expression , string_expression2 , string_expression3)
reverseReturns "string_expression" reversed.
Syntaxreverse ( string_expression )
rightReturns the rightmost "numeric_expression" characters from "string_expression1".
Syntaxright ( string_expression1 , numeric_expression )
rpadReturns "string_expression1" right-padded to length "integer_expression" withoccurrences of "string_expression2". If "string_expression1" is longer than"integer_expression", the appropriate portion of "string_expression1" is returned. If"string_expression2" is not specified, then spaces are used.
Syntaxrpad ( string_expression1 , integer_expression [ , string_expression2] )
rtrimReturns "string_expression1", with final characters removed after the last characternot in "string_expression2"; for example, rtrim ( 'ABxXxyx' , 'xy' ) returns ABxX. If"string_expression2" is not specified, the final space characters are removed.
Syntaxrtrim ( string_expression1 [ , string_expression2 ] )
soundexReturns a soundex string of "string_expression1".
Syntaxsoundex ( string_expression1 )
MySQL Math
logReturns the base 10 logarithm of "numeric_expression1" or logarithm to the base"numeric_expression2".
Syntaxlog ( numeric_expression )
Appendix F. Using the expression editor 635

lnReturns the natural logarithm of "numeric_expression1".
Syntaxln ( numeric_expression )
piReturns the constant of pi.
Syntaxpi ()
MySQL Trigonometry
acosReturns the arccosine of "numeric_expression" in radians. The arccosine is theangle whose cosine is "numeric_expression".
Syntaxacos ( numeric_expression )
asinReturns the arcsine of "numeric_expression" in radians. The arcsine is the anglewhose sine is "numeric_expression".
Syntaxasin ( numeric_expression )
atanReturns the arctangent of "numeric_expression" in radians. The arctangent is theangle whose tangent is "numeric_expression".
Syntaxatan ( numeric_expression )
atan2Returns the arctangent of the x and y coordinates specified by"numeric_expression1" and "numeric_expression2", respectively, in radians. Thearctangent is the angle whose tangent is "numeric_expression2" /"numeric_expression1".
Syntaxatan2 ( numeric_expression1 ,numeric_expression2 )
cosReturns the cosine of "numeric_expression" where "numeric_expression" is an angleexpressed in radians.
Syntaxcos ( numeric_expression )
cotReturns the cotangent of "numeric_expression" where "numeric_expression" is anangle expressed in radians.
636 IBM Cognos Report Studio Version 10.2.1: User Guide

Syntaxcot ( numeric_expression )
degreesReturns the degrees where "numeric_expression" is an angle expressed in radians.
Syntaxdegrees ( numeric_expression )
radiansReturns the radians where "numeric_expression" is an angle expressed in degrees.
Syntaxradians ( numeric_expression )
sinReturns the sine of "numeric_expression" where "numeric_expression" is an angleexpressed in radians.
Syntaxsin ( numeric_expression )
tanReturns the tangent of "numeric_expression" where "numeric_expression" is anangle expressed in radians.
Syntaxtan ( numeric_expression )
asciiReturns a number representing the ASCII code value of the leftmost character of"string_expression"; for example, ascii ( 'A' ) is 65.
Syntaxascii ( string_expression )
databaseReturns the current database name
Syntaxdatabase ()
schemaReturns the current schema name
Syntaxschema ()
session_userReturn the user name returned by the client
Syntaxsession_user ()
Appendix F. Using the expression editor 637

system_userReturn the user name returned by the client
Syntaxsystem_user ()
versionReturns the string value of the database version.
Syntaxversion ()
Netezza
Netezza Math
logReturns the logarithm of "numeric_expression2" to the base "numeric_expression1".When the optional argument "numeric_expression1" is not specified, the base 10 isused.
Syntaxlog ( [numeric_expression1 ,] numeric_expression2 )
Netezza Trigonometry
acosReturns the arccosine of "numeric_expression" in radians. The arccosine is theangle whose cosine is "numeric_expression".
Syntaxacos ( numeric_expression )
asinReturns the arcsine of "numeric_expression" in radians. The arcsine is the anglewhose sine is "numeric_expression".
Syntaxasin ( numeric_expression )
atanReturns the arctangent of "numeric_expression" in radians. The arctangent is theangle whose tangent is "numeric_expression".
Syntaxatan ( numeric_expression )
atan2Returns the arctangent of the x and y coordinates specified by"numeric_expression1" and "numeric_expression2", respectively, in radians. Thearctangent is the angle whose tangent is "numeric_expression2" /"numeric_expression1".
638 IBM Cognos Report Studio Version 10.2.1: User Guide

Syntaxatan2 ( numeric_expression1 , numeric_expression2 )
cosReturns the cosine of "numeric_expression" where "numeric_expression" is an angleexpressed in radians.
Syntaxcos ( numeric_expression )
degreesReturns the degrees where "numeric_expression" is an angle expressed in radians.
Syntaxdegrees ( numeric_expression )
radiansReturns the radians where "numeric_expression" is an angle expressed in degrees.
Syntaxradians ( numeric_expression )
sinReturns the sine of "numeric_expression" where "numeric_expression" is an angleexpressed in radians.
Syntaxsin ( numeric_expression )
tanReturns the tangent of "numeric_expression" where "numeric_expression" is anangle expressed in radians.
Syntaxtan ( numeric_expression )
Netezza Fuzzy
le_dstReturns a value indicating how different the two input strings are, calculatedaccording to the Levenshtein edit distance algorithm.
Syntaxle_dst ( string_expression1 , string_expression2 )
dle_dstReturns a value indicating how different the two input strings are, calculatedaccording to the Damerau-Levenshtein distance algorithm
Syntaxdle_dst ( string_expression1 , string_expression2 )
Appendix F. Using the expression editor 639

Netezza Phonetic
nysiisReturns a Soundex representation of "string_expression" using the New York StateIdentification and Intelligence System (NYSIIS) variation of Soundex.
Syntaxnysiis ( string_expression )
dbl_mpReturns a composite 32-bit value of "string_expression".
Syntaxdbl_mp ( string_expression )
pri_mpReturns the 4 character primary metaphone string from "numeric_expression"returned by dbl_mp.
Syntaxpri_mp ( numeric_expression )
sec_mpReturns the 4 character secondary metaphone string from "numeric_expression"returned by dbl_mp.
Syntaxsec_mp ( numeric_expression )
score_mpReturns a score for how closely "numeric_expression" and "numeric_expression2"match.
Syntaxscore_mp ( numeric_expression , numeric_expression2 ,numeric_expression3 , numeric_expression4 , numeric_expression5 ,numeric_expression6 )
asciiReturns a number representing the ASCII code value of the leftmost character of"string_expression"; for example, ascii ( 'A' ) is 65.
Syntaxascii ( string_expression )
chrReturns the character that has the ASCII code value specified by"integer_expression". "Integer_expression" should be between 0 and 255.
Syntaxchr ( integer_expression )
640 IBM Cognos Report Studio Version 10.2.1: User Guide

decodeCompares "expr" to each search value one by one. If "expr" is equal to a search,then it returns the corresponding result. If no match is found, it returns "default". If"default" is omitted, it returns null.
Syntaxdecode ( expr , search , result [ , search , result]... [ , default] )
initcapReturns "string_expression", with the first letter of each word in uppercase, allother letters in lowercase. Words are delimited by white space or characters thatare not alphanumeric.
Syntaxinitcap ( string_expression )
instrSearches "string_expression1" starting at position "integer_expression1" for the"integer_expression2" occurrence of "string_expression2". If "integer_expression1" isnegative then the search is backwards from the end of "string_expression1".Returns an integer indicating the position of "string_expression2".
Syntaxinstr ( string_expression1 , string_expression2 [ ,integer_expression1 [ , integer_expression2 ] ] )
lpadReturns "string_expression1" padded to length "integer_expression" withoccurrences of "string_expression2". If "string_expression1" is longer than"integer_expression", the appropriate portion of "string_expression1" is returned.
Syntaxlpad ( string_expression1 , integer_expression [ , string_expression2] )
ltrimReturns "string_expression1", with leading characters removed up to the firstcharacter not in "string_expression2"; for example, ltrim ( 'xyxXxyAB' , 'xy' )returns XxyAB.
Syntaxltrim ( string_expression1 [ , string_expression2 ] )
months_betweenReturns the number of months from "date_expression1" to "date_expression2". If"date_expression1" is later than "date_expression2" then the result will be a positivenumber. The days and time portions of the difference are ignored, i.e., the monthsare not rounded, except if "date_expression1" and "date_expression2" are the lastdays of a month.
Syntaxmonths_between ( date_expression1 , date_expression2 )
Appendix F. Using the expression editor 641

next_dayReturns the datetime of the first weekday named by "string_expression" that islater than "datetime_expression". The return value has the same hours, minutes,and seconds as "datetime_expression".
Syntaxnext_day ( datetime_expression , string_expression )
nvlReturns the value of "expression1" if "expression1" is not NULL. If "expression1" isNULL, then returns the value of "expression2".
Syntaxnvl ( expression1 , expression2 )
Examplenvl ( [Unit sale price] , 0 )
Result
Returns the unit sale price, or returns 0 if the unit sale price is NULL.
roundReturns "numeric_expression" rounded to the nearest value "integer_expression"places right of the decimal point. If "integer_expression" is negative,"numeric_expression" is rounded to the nearest absolute value "integer_expression"places to the left of the decimal point; for example, round (125, -1) rounds to 130.
Syntaxround ( numeric_expression [ , integer_expression ] )
rpadReturns "string_expression1" right-padded to length "integer_expression" withoccurrences of "string_expression2". If "string_expression1" is longer than"integer_expression", the appropriate portion of "string_expression1" is returned. If"string_expression2" is not specified, then spaces are used.
Syntaxrpad ( string_expression1 , integer_expression [ , string_expression2] )
rtrimReturns "string_expression1", with final characters removed after the last characternot in "string_expression2"; for example, rtrim ( 'ABxXxyx' , 'xy' ) returns ABxX. If"string_expression2" is not specified, the final space characters are removed.
Syntaxrtrim ( string_expression1 [ , string_expression2 ] )
642 IBM Cognos Report Studio Version 10.2.1: User Guide

substrReturns the substring of "string_expression" that starts at position"integer_expression1". The first character in "string_expression" is at position 1."Integer_expression2" can be used to select fewer characters; by default it selectscharacters to the end of the string.
Syntaxsubstr ( string_expression , integer_expression1 [ ,integer_expression2 ] )
{current_db}Syntax{current_db}
{current_user}Syntax{current_user}
{session_user}Syntax{session_user}
to_charReturns the string representation of "expression" with the format of"string_expression". "Expression" can be either a date value or a numeric value.
Syntaxto_char ( expression [ , string_expression ] )
to_dateConverts "string_expression1" to a datetime value as specified by the format"string_expression2".
Syntaxto_date ( string_expression1 , string_expression2 )
to_numberConverts "string_expression1" to a numeric value as specified by the format"string_expression2".
Syntaxto_number ( string_expression1 , string_expression2 )
translateReturns "string_expression1", with all occurrences of each character in"string_expression2" replaced by its corresponding character in"string_expression3".
Syntaxtranslate ( string_expression1 , string_expression2 ,string_expression3 )
Appendix F. Using the expression editor 643

date_truncTruncates "date_expression1" to a value as specified by the format"string_expression1".
Syntaxdate_trunc ( string_expression1 , date_expression1 )
truncTruncates digits from "numeric_expression1" using "numeric_expression2" as theprecision.
Syntaxtrunc ( numeric_expression1 [ , numeric_expression2 ] )
versionReturns the "string_expression1" value of the database version.
Syntaxversion ()
Oracle
Oracle Math
logReturns the logarithm of "numeric_expression2" to the base "numeric_expression1".When the optional argument "numeric_expression1" is not specified, the base usedis the contsant e (which is approximately equal to 2.71282).
Syntaxlog ([ numeric_expression1 , ] numeric_expression2 )
Oracle Trigonometry
acosReturns the arccosine of "numeric_expression" in radians. The arccosine is theangle whose cosine is "numeric_expression".
Syntaxacos ( numeric_expression )
asinReturns the arcsine of "numeric_expression" in radians. The arcsine is the anglewhose sine is "numeric_expression".
Syntaxasin ( numeric_expression )
atanReturns the arctangent of "numeric_expression" in radians. The arctangent is theangle whose tangent is "numeric_expression".
644 IBM Cognos Report Studio Version 10.2.1: User Guide

Syntaxatan ( numeric_expression )
atan2Returns the arctangent of the x and y coordinates specified by"numeric_expression1" and "numeric_expression2", respectively, in radians. Thearctangent is the angle whose tangent is "numeric_expression2" /"numeric_expression1".
Syntaxatan2 ( numeric_expression1 ,numeric_expression2 )
cosReturns the cosine of "numeric_expression" where "numeric_expression" is an angleexpressed in radians.
Syntaxcos ( numeric_expression )
coshReturns the hyperbolic cosine of "numeric_expression" where "numeric_expression"is an angle expressed in radians.
Syntaxcosh ( numeric_expression )
sinReturns the sine of "numeric_expression" where "numeric_expression" is an angleexpressed in radians.
Syntaxsin ( numeric_expression )
sinhReturns the hyperbolic sine of "numeric_expression" where "numeric_expression" isan angle expressed in radians.
Syntaxsinh ( numeric_expression )
tanReturns the tangent of "numeric_expression" where "numeric_expression" is anangle expressed in radians.
Syntaxtan ( numeric_expression )
tanhReturns the hyperbolic tangent of "numeric_expression" where"numeric_expression" is an angle expressed in radians.
Syntaxtanh ( numeric_expression )
Appendix F. Using the expression editor 645

add_monthsReturns the datetime resulting from adding "integer_expression" months to"date_expression".
Syntaxadd_months ( date_expression , integer_expression )
asciiReturns a number representing the ASCII code value of the leftmost character of"string_expression".
Syntaxascii ( string_expression )
Exampleascii ( ’A’ )
Result
Returns '65'
ceilReturns the smallest integer greater than or equal to "numeric_expression".
Syntaxceil ( numeric_expression )
char_lengthReturns the number of logical characters in "string_expression". The number oflogical characters can be distinct from the number of bytes in some East Asianlocales.
Syntaxchar_length ( string_expression )
chrReturns the character that has the ASCII code value specified by"integer_expression". "Integer_expression" should be between 0 and 255.
Syntaxchr ( integer_expression )
concatReturns a string that is the result of concatenating, or joining, "string_expression1"to "string_expression2".
Syntaxconcat ( string_expression1 , string_expression2 )
Exampleconcat ( [Sales (query)].[Sales staff].[First name], [Sales (query)].[Sales staff].[Last name] )
646 IBM Cognos Report Studio Version 10.2.1: User Guide

Result
Returns the first name and last name; e.g., Bob Smith.
decodeCompares "expression" to each search value one by one. If "expression" is equal toa search, then it returns the corresponding result. If no match is found, it returns"default", or if "default" is omitted, it returns null.
Syntaxdecode ( expression , search , result [ , search , result ]... [ ,default ] )
dumpReturns internal representation of "expression" with the format of"numeric_expression1" starting from position "numeric_expression2" for"numeric_expression3" characters.
Syntaxdump ( expression [ , numeric_expression1 [ , numeric_expression2 [ ,numeric_expression3 ] ] ] )
greatestReturns the greatest value in "expression_list".
Syntaxgreatest ( expression_list )
initcapReturns "string_expression" with the first letter of each word in uppercase and allother letters in lowercase. Words are delimited by white space or characters thatare not alphanumeric.
Syntaxinitcap ( string_expression )
instrSearches "string_expression1" starting at position "integer_expression1" for the"integer_expression2" occurrence of "string_expression2". If "integer_expression1" isnegative, then the search occurs backwards from the end of "string_expression1".Returns an integer indicating the position of "string_expression2".
Syntaxinstr ( string_expression1, string_expression2 [ ,integer_expression1 [ , integer_expression2 ] ] )
instrbSearches "string_expression1" starting at position "integer_expression1" for the"integer_expression2" occurrence of "string_expression2". If "integer_expression1" isnegative, then the search occurs backwards from the end of "string_expression1".Returns the position (byte number) where "string_expression2" was found.
Syntax
Appendix F. Using the expression editor 647

instrb ( string_expression1, string_expression2 [ ,integer_expression1 [ , integer_expression2 ] ] )
leastReturns the least value in "expression_list".
Syntaxleast ( expression_list )
lengthReturns the number of characters in "string_expression".
Syntaxlength ( string_expression )
lengthbReturns the number of bytes in "string_expression".
Syntaxlengthb ( string_expression )
lpadReturns "string_expression1" left-padded to the length defined by"integer_expression" with occurrences of "string_expression2". If"string_expression1" is longer than "integer_expression", the appropriate portion of"string_expression1" is returned.
Syntaxlpad ( string_expression1, integer_expression [ ,string_expression2 ] )
ltrimReturns "string_expression1" with leading characters removed up to the firstcharacter not in "string_expression2".
Syntaxltrim ( string_expression1 [ , string_expression2 ] )
Exampleltrim ( ’xyxXxyAB’ , ’xy’ )
Result
XxyAB
months_betweenReturns the number of months from "date_expression1" to "date_expression2". If"date_expression1" is later than "date_expression2" then the result will be a positivenumber. The days and time portion of the difference are ignored, so the monthsare not rounded unless "date_expression1" and "date_expression2" are the last daysof a month.
648 IBM Cognos Report Studio Version 10.2.1: User Guide

Syntaxmonths_between ( date_expression1 , date_expression2 )
new_timeReturns the datetime in "new_timezone" for "datetime_expression" in"old_timezone". "Old_timezone" and "new_timezone" can be one of 'AST', 'ADT','BST', 'BDT', 'CST', 'CDT', 'EST', 'EDT', 'HST', 'HDT', 'MST', 'MDT', 'NST', 'PST','PDT', 'YST', or 'YDT'.
Syntaxnew_time ( datetime_expression , old_timezone , new_timezone )
next_dayReturns the datetime of the first weekday named by "string_expression" that islater than "datetime_expression". The return value has the same format as"datetime_expression".
Syntaxnext_day ( datetime_expression , string_expression )
nls_initcapReturns "string_expression1" with the first letter of each word in uppercase and allother letters in lowercase. A word begins after any character other than a letter.Thus, in addition to a blank space, symbols such as commas, periods, and colonscan introduce a new word. "String_expression2" specifies the sorting sequence.
Syntaxnls_initcap ( string_expression1 [ , string_expression2 ] )
nls_lowerReturns "string_expression1" with all letters in lowercase. "String_expression2"specifies the sorting sequence.
Syntaxnls_lower ( string_expression1 [ , string_expression2 ] )
nls_upperReturns "string_expression1" with all letters in uppercase. "String_expression2"specifies the sorting sequence.
Syntaxnls_upper ( string_expression1 [ , string_expression2 ] )
nvlReturns the value of "expression1" if "expression1" is not NULL. If "expression1" isNULL, then returns the value of "expression2".
Syntaxnvl ( expression1 , expression2 )
Examplenvl ( [Unit sale price] , 0 )
Appendix F. Using the expression editor 649

Result
Returns the unit sale price, or returns 0 if the unit sale price is NULL.
replaceReplaces all occurrences of "string_expression2" in "string_expression1" with"string_expression3". If "string_expression3" is not specified, then it removes alloccurrences of "string_expression2".
Syntaxreplace ( string_expression1 , string_expression2 [ ,string_expression3 ] )
roundReturns "numeric_expression" rounded to the nearest value "integer_expression"places right of the decimal point. If "integer_expression" is negative,"numeric_expression" is rounded to the nearest absolute value "integer_expression"places to the left of the decimal point. Rounding takes place before data formattingis applied.
Syntaxround ( numeric_expression [ , integer_expression ] )
Exampleround ( 125 , -1 )
Result
Returns 130
rpadReturns "string_expression1" right-padded to length "integer_expression" withoccurrences of "string_expression2". If "string_expression1" is longer than"integer_expression", the appropriate portion of "string_expression1" is returned. If"string_expression2" is not specified, then occurrences of "string_expression2" arereplaced with spaces.
Syntaxrpad ( string_expression1 , integer_expression [ ,string_expression2 ] )
rtrimReturns "string_expression1" with the final characters removed after the lastcharacter not in "string_expression2". If "string_expression2" is not specified, thefinal space characters are removed.
Syntaxrtrim ( string_expression1 [ , string_expression2 ] )
Examplertrim ( ’ABxXxyx’ , ’xy’ )
Result
650 IBM Cognos Report Studio Version 10.2.1: User Guide

Returns 'ABxX'
signReturns an indicator of the sign of "numeric_expression", +1 if positive, 0 if zero,or -1 if negative.
Syntaxsign ( numeric_expression )
soundexReturns a character string containing the phonetic representation of"string_expression".
Syntaxsoundex ( string_expression )
substrReturns the substring of "string_expression" that starts at position"integer_expression1" for "integer_expression2" characters or to the end of"string_expression" if "integer_expression2" is omitted. The first character in"string_expression" is at position 1.
Syntaxsubstr ( string_expression , integer_expression1 [ ,integer_expression2 ] )
Examplesubstr ( [Sales (query)].[Sales staff].[Position code], 3 , 5 )
Result
Returns characters 3 to 7 of the position codes.
substrbReturns the substring of "string_expression" that starts at position"numeric_expression1" and ends after "numeric_expression2" bytes. The first bytein "string_expression" is at position 1. If you omit "numeric_expression2", returnsthe substring of "string_expression" that starts at position "numeric_expression1"and ends at the end of "string_expression".
Syntaxsubstrb ( string_expression , numeric_expression1 [ ,numeric_expression2 ] )
Examplesubstrb ( [Sales (query)].[Sales staff].[Position code], 3 , 5 )
Result
Returns characters 3 to 7 of the position codes.
Appendix F. Using the expression editor 651

{sysdate}Returns a datetime value representing the current date and time of the computerthat the database software runs on.
Syntax{ sysdate }
to_charReturns the string representation of "expression" with the format of"string_expression". "Expression" can be either a date value or a numeric value.
Syntaxto_char ( expression [ , string_expression ] )
to_dateConverts "string_expression1" to a datetime value as specified by the format"string_expression2". "String_expression3" specifies the format elements, such aslanguage.
Syntaxto_date ( string_expression1 [ , string_expression2 [ ,string_expression3 ] ] )
to_numberConverts "string_expression1" to a numeric value as specified by the format"string_expression2". "String_expression3" specifies the format elements, such ascurrency information.
Syntaxto_number ( string_expression1 , string_expression2 ,string_expression3 )
translateReturns "string_expression1" with all occurrences of each character in"string_expression2" replaced by the corresponding character in"string_expression3".
Syntaxtranslate ( string_expression1 , string_expression2 ,string_expression3 )
truncTruncates "date_expression" using the format specified by "string_expression". Forexample, if "string_expression" is 'year', then "date_expression" is truncated to thefirst day of the year.
Syntaxtrunc ( date_expression , string_expression )
Exampletrunc ( 2003-08-22 , ’year’ )
652 IBM Cognos Report Studio Version 10.2.1: User Guide

Result
Returns 2003-01-01.
truncTruncates digits from "numeric_expression1" using "numeric_expression2" as theprecision.
Syntaxtrunc ( numeric_expression1 , numeric_expression2 )
{user}Returns the username of the current Oracle user.
Syntax{ user }
vsizeReturns the number of bytes in the internal representation of "expression"."Expression" must be a string expression.
Syntaxvsize ( expression )
Paraccel
Paraccel String
overlayReturns the "string_expression1", replacing "string_expression2" from characterposition numeric_expression.
Syntaxoverlay ( string_expression1 , string_expression2 ,numeric_expression1 [ , numeric_expression2 ] )
ltrimReturns "string_expression1", with leading characters removed up to the firstcharacter not in "string_expression2"; for example, ltrim ( 'xyxXxyAB' , 'xy' )returns XxyAB.
Syntaxltrim ( string_expression1 [ , string_expression2 ] )
replaceReturns "string_expression", having replaced "string_expression2" with"string_expression3".
Syntaxreplace ( string_expression , string_expression2 , string_expression3)
Appendix F. Using the expression editor 653

rtrimReturns "string_expression1", with final characters removed after the last characternot in "string_expression2"; for example, rtrim ( 'ABxXxyx' , 'xy' ) returns ABxX. If"string_expression2" is not specified, the final space characters are removed.
Syntaxrtrim ( string_expression1 [ , string_expression2 ] )
Paraccel Data type formatting
to_charReturns the string representation of "expression" with the format of"string_expression". "Expression" can be either a date value or a numeric value.
Syntaxto_char ( expression , string_expression )
to_dateConverts "string_expression1" to a date value as specified by the format"string_expression2".
Syntaxto_date ( string_expression1 , string_expression2 )
to_numberConverts "string_expression1" to a numeric value as specified by the format"string_expression2".
Syntaxto_number ( string_expression1 , string_expression2 )
Paraccel Math
cbrtReturns the cube root of "numeric_expression1".
Syntaxcbrt ( numeric_expression )
piReturns the constant of pi.
Syntaxpi ()
current_databaseReturns the name of the current database.
Syntaxcurrent_database ()
654 IBM Cognos Report Studio Version 10.2.1: User Guide

current_schemaReturns the name of the current schema
Syntaxcurrent_schema ()
{current_user}Syntax{current_user}
{session_user}Syntax{session_user}
translateReturns "string_expression1", with each occurrence of each character in"string_expression2" replaced by its corresponding character in"string_expression3".
Syntaxtranslate ( string_expression1 , string_expression2 ,string_expression3 )
versionReturns the string value of the database version.
Syntaxversion ()
Postgres
Postgres String
overlayReturns the "string_expression1" replacing "string_expression2" from characterposition numeric_expression.
Syntaxoverlay ( string_expression1 , string_expression2 ,numeric_expression1 [ , numeric_expression2 ] )
btrimReturns string_expression1 after removing the longest string of characters in"string_expression2".
Syntaxbtrim ( string_expression1 [ , string_expression2 ] )
initcapReturns "string_expression", with the first letter of each word in uppercase and allother letters in lowercase. Words are delimited by white space or characters thatare not alphanumeric.
Appendix F. Using the expression editor 655

Syntaxinitcap ( string_expression )
lpadReturns "string_expression1" padded to length "integer_expression" withoccurrences of "string_expression2". If "string_expression1" is longer than"integer_expression", the appropriate portion of "string_expression1" is returned.
Syntaxlpad ( string_expression1 , integer_expression [ , string_expression2] )
ltrimReturns "string_expression1", with leading characters removed up to the firstcharacter not in "string_expression2"; for example, ltrim ( 'xyxXxyAB' , 'xy' )returns XxyAB.
Syntaxltrim ( string_expression1 [ , string_expression2 ] )
md5Returns the MD5 hash of "string_expression1".
Syntaxmd5 ( string_expression1 )
to_hexReturns the hexadecimal string representation of "numeric_expression1".
Syntaxto_hex ( numeric_expression1 )
repeatReturns the "string_expression" repeated "numeric_expression1" times.
Syntaxrepeat ( string_expression , numeric_expression1 )
replaceReturns "string_expression" with "string_expression2" replaced with"string_expression3".
Syntaxreplace ( string_expression , string_expression2 , string_expression3)
rpadReturns "string_expression1" right-padded to length "integer_expression" withoccurrences of "string_expression2". If "string_expression1" is longer than"integer_expression", the appropriate portion of "string_expression1" is returned. If"string_expression2" is not specified, then spaces are used.
Syntaxrpad ( string_expression1 , integer_expression [ , string_expression2] )
656 IBM Cognos Report Studio Version 10.2.1: User Guide

rtrimReturns "string_expression1", with final characters removed after the last characternot in "string_expression2"; for example, rtrim ( 'ABxXxyx' , 'xy' ) returns ABxX. If"string_expression2" is not specified, the final space characters are removed.
Syntaxrtrim ( string_expression1 [ , string_expression2 ] )
split_partReturns "numeric_expression" field having split "string_expression1" on"string_expression2".
Syntaxsplit_part ( string_expression1 , string_expression2 ,numeric_expression )
Postgres Data type formatting
to_charReturns the string representation of "expression" with the format of"string_expression". "Expression" can be either a date value or a numeric value.
Syntaxto_char ( expression , string_expression )
to_dateConverts "string_expression1" to a date value as specified by the format"string_expression2".
Syntaxto_date ( string_expression1 , string_expression2 )
to_numberConverts "string_expression1" to a numeric value as specified by the format"string_expression2".
Syntaxto_number ( string_expression1 , string_expression2 )
to_timestampConverts "string_expression1" to a timestamp value as specified by the format"string_expression2". Alternate syntax: to_timestamp ( numeric-expression )Converts an Unix epoch clock time to a timestamp value.
Syntaxto_timestamp ( string_expression1 , string_expression2 )
Postgres Math
logReturns the base 10 logarithm of "numeric_expression1" or logarithm to the base"numeric_expression2".
Syntaxlog ( numeric_expression1 [ , numeric_expression2 ] )
Appendix F. Using the expression editor 657

lnReturns the natural logarithm of "numeric_expression1".
Syntaxln ( numeric_expression )
cbrtReturns the cube root of "numeric_expression1".
Syntaxcbrt ( numeric_expression )
divReturns the integer quotient of "numeric_expression1" divided by"numeric_expression2".
Syntaxdiv ( numeric_expression1 , numeric_expression2 )
piReturns the constant of pi.
Syntaxpi ()
Postgres Trigonometry
acosReturns the arccosine of "numeric_expression" in radians. The arccosine is theangle whose cosine is "numeric_expression".
Syntaxacos ( numeric_expression )
asinReturns the arcsine of "numeric_expression" in radians. The arcsine is the anglewhose sine is "numeric_expression".
Syntaxasin ( numeric_expression )
atanReturns the arctangent of "numeric_expression" in radians. The arctangent is theangle whose tangent is "numeric_expression".
Syntaxatan ( numeric_expression )
atan2Returns the arctangent of the x and y coordinates specified by"numeric_expression1" and "numeric_expression2", respectively, in radians. Thearctangent is the angle whose tangent is "numeric_expression2" /"numeric_expression1".
Syntax
658 IBM Cognos Report Studio Version 10.2.1: User Guide
atan2 ( numeric_expression1 , numeric_expression2 )
cosReturns the cosine of "numeric_expression", where "numeric_expression" is anangle expressed in radians.
Syntaxcos ( numeric_expression )
cotReturns the cotangent of "numeric_expression", where "numeric_expression" is anangle expressed in radians.
Syntaxcot ( numeric_expression )
degreesReturns the degrees where "numeric_expression" is an angle expressed in radians.
Syntaxdegrees ( numeric_expression )
radiansReturns the radians where "numeric_expression" is an angle expressed in degrees.
Syntaxradians ( numeric_expression )
sinReturns the sine of "numeric_expression", where "numeric_expression" is an angleexpressed in radians.
Syntaxsin ( numeric_expression )
tanReturns the tangent of "numeric_expression", where "numeric_expression" is anangle expressed in radians.
Syntaxtan ( numeric_expression )
asciiReturns a number representing the ASCII code value of the leftmost character of"string_expression"; for example, ascii ( 'A' ) is 65.
Syntaxascii ( string_expression )
chrReturns the character that has the ASCII code value specified by"integer_expression". "Integer_expression" should be between 0 and 255.
Syntax
Appendix F. Using the expression editor 659

chr ( integer_expression )
{current_db}Syntaxcurrent_database()
{current_catalog}Syntax{current_catalog}
{current_schema}Syntax{current_schema}
{current_user}Syntax{current_user}
{session_user}Syntax{session_user}
translateReturns "string_expression1", with each occurrence of each character in"string_expression2" replaced by its corresponding character in"string_expression3".
Syntaxtranslate ( string_expression1 , string_expression2 ,string_expression3 )
date_truncReturns the timestamp to the specified precision.
Syntaxdate_trunc ( string_expression , timestamp_expression )
versionReturns the string value of the database version.
Syntaxversion ()
Red Brick
ceilReturns the smallest integer greater than or equal to "numeric_expression" or"string_expression". Note that "string_expression" must represent a valid numericvalue.
660 IBM Cognos Report Studio Version 10.2.1: User Guide

Syntaxceil ( numeric_expression|string_expression )
concatReturns a string that is the result of concatenating, or joining, "string_expression1"to "string_expression2".
Syntaxconcat ( string_expression1 , string_expression2 )
Exampleconcat ( [Sales (query)].[Sales staff].[First name], [Sales (query)].[Sales staff].[Last name] )
Result
Returns the first name and last name; e.g., Bob Smith.
{current_user}Returns the database username (authorization ID) of the current user.
Syntax{ current_user }
dateReturns a date value. "Expression" can be either characters or a timestamp.
Syntaxdate ( expression )
dateaddAdds "interval" to "datetime_expression" and returns a result that is the samedatetime data type as "datetime_expression". "Datepart" refers to the year, month,day, hour, minute, second. "Interval" must be an integer and "datetime_expression"can be a date, time, or timestamp.
Syntaxdateadd ( { datepart } , interval, datetime_expression )
datediffDetermines the difference between two datetime expressions and returns an integerresult in "datepart" units. "Datepart" refers to a year, month, day, hour, minute, orsecond. "Datetime_expression1" and "datetime_expression2" can be dates, times, ortimestamps.
Syntaxdatediff ( { datepart } , datetime_expression1, datetime_expression2 )
datenameExtracts "datepart" of "datetime_expression" and returns its value as a characterstring. "Datepart" refers to a year, month, day, hour, minute, or second."Datetime_expression" can be a date, a time, or a timestamp.
Appendix F. Using the expression editor 661

Syntaxdatename ( { datepart } , datetime_expression )
decConverts "expression" to a decimal value with the data type decimal (precision,scale). The default value of precision is 9. The default value of scale is 0.
Syntaxdec ( expression , [ precision , scale ] )
decimalConverts "expression" to a decimal value with the data type decimal (precision,scale). The default value of precision is 9. The default value of scale is 0.
Syntaxdecimal ( expression , [ precision , scale ] )
decodeCompares and converts "expression" to another value. If "expression" matches"target", it is replaced, otherwise it is replaced by "default" or null if no default isspecified. The expressions can be any data type as long as they are all the samedata type.
Syntaxdecode ( expression , target , replacement [ ,default ] )
floatConverts "numeric_expression" into a double-precision floating-point value.
Syntaxfloat ( numeric_expression )
ifnullTests "expression" for missing values and replaces each one with "substitute". If"expression" is null, "substitute" is returned, otherwise it returns the value of"expression". The expressions can be any data type as long as they are all the samedata type.
Syntaxifnull ( expression, substitute )
intConverts "numeric_expression" into an integer value and returns an integer value.If "numeric_expression" is null, it returns null.
Syntaxint ( numeric_expression )
integerConverts "numeric_expression" into an integer value and returns an integer value.If "numeric_expression" is null, it returns null.
662 IBM Cognos Report Studio Version 10.2.1: User Guide
Syntaxinteger ( numeric_expression )
Exampleinteger ( 84.95 )
Result
85
lengthReturns an integer result specifying the number of characters in"string_expression". If "string_expression" is null, it returns null.
Syntaxlength ( string_expression )
lengthbReturns an integer result specifying the number of bytes in "string_expression". If"string_expression" is null, it returns null.
Syntaxlengthb ( string_expression )
ltrimRemoves leading blanks from "string_expression". If "string_expression" is null, itreturns null.
Syntaxltrim ( string_expression )
nullifReturns null if both "expression1" and "expression2" have the same value. If theyhave different values, the value of "expression1" is returned. "Expression1" and"expression2" can be any data type as long as they are the same data type.
Syntaxnullif ( expression1 , expression2 )
positionbReturns an integer that is relative to the beginning byte position of"string_expression1" in "string_expression2". If "string_expression1" is not located,the result is 0. If "string_expression1" is of zero length, the result is 1. If"string_expression1" is null, an error message is returned. If "string_expression2" isnull, the result is 0.
Syntaxpositionb ( string_expression1, string_expression2 )
Appendix F. Using the expression editor 663

realReturns a real value. If "numeric_expression" is null, it returns null.
Syntaxreal ( numeric_expression )
roundReturns "numeric_expression" rounded to the nearest value "integer_expression"places to the right of the decimal point. If "integer_expression" is negative,"numeric_expression" is rounded to the nearest absolute value "integer_expression"places to the left of the decimal point. Rounding takes place before data formattingis applied.
Syntaxround ( numeric_expression , integer_expression )
Exampleround (125, -1)
Result
130
rtrimRemoves trailing blanks from "string_expression". If "string_expression" is null, itreturns null.
Syntaxrtrim ( string_expression )
Examplertrim ( [Sales (query)].[Sales staff].[Last name] )
Result
Returns last names with any spaces at the end of the name removed.
signDetermines the sign of "numeric_expression", and returns 1 for a positive value, –1for a negative value, and 0 for zero.
Syntaxsign ( numeric_expression )
stringConverts "expression" to a character string. "Expression" can be either numeric ordatetime.
Syntaxstring ( expression [ , length [ , scale ] ] )
664 IBM Cognos Report Studio Version 10.2.1: User Guide
substrReturns a substring of "string_expression" that begins at position "start_integer"and continues for "length_integer" characters. If "length_integer" is not specified, asubstring from "start_integer" to the end of "string_expression" is returned.
Syntaxsubstr ( string_expression , start_integer , length_integer )
Examplesubstr ( [Sales (query)].[Sales staff].[Position code], 3 , 5 )
Result
Returns characters 3 to 7 of the position codes.
substrbReturns a substring of "string_expression" that begins at position "start_integer"and continues for "length_integer" bytes. If "length_integer" is not specified, asubstring from "start_integer" to the end of "string_expression" is returned.
Syntaxsubstrb ( string_expression , start_integer , length_integer )
timeCreates a time value from "expression", which can be a character string or atime-stamp data type expression.
Syntaxtime ( expression )
timestampCreates a time-stamp value from "timestamp_expression", which is a characterstring.
Syntaxtimestamp ( timestamp_expression )
timestampCreates a time-stamp value from "time_expression" and "date_expression". If either"time_expression" or "date_expression" is null, the resulting time-stamp expressionis also null.
Syntaxtimestamp ( date_expression , time_expression )
to_charConverts "source_date" to the character string specified by "format_string"."Source_date" can be a date, time, or timestamp data type.
Syntaxto_char ( source_date, format_string )
Appendix F. Using the expression editor 665

SAP BW
SAP BW Trigonometry
arccosReturns the arccosine of "numeric_expression" in radians. The arccosine is theangle whose cosine is "numeric_expression".
Syntaxarccos ( numeric_expression )
arcsinReturns the arcsine of "numeric_expression" in radians. The arcsine is the anglewhose sine is "numeric_expression".
Syntaxarcsin ( numeric_expression )
arctanReturns the arctangent of "numeric_expression" in radians. The arctangent is theangle whose tangent is "numeric_expression".
Syntaxarctan ( numeric_expression )
cosReturns the cosine of "numeric_expression" where "numeric_expression" is an angleexpressed in radians.
Syntaxcos ( numeric_expression )
sinReturns the sine of "numeric_expression" where "numeric_expression" is an angleexpressed in radians.
Syntaxsin ( numeric_expression )
tanReturns the tangent of "numeric_expression" where "numeric_expression" is anangle expressed in radians.
Syntaxtan ( numeric_expression )
coshypReturns the hyperbolic cosine of "numeric_expression" where "numeric_expression"is an angle expressed in radians.
Syntaxcoshyp ( numeric_expression )
666 IBM Cognos Report Studio Version 10.2.1: User Guide

sinhypReturns the hyperbolic sine of "numeric_expression" where "numeric_expression" isan angle expressed in radians.
Syntaxsinhyp ( numeric_expression )
tanhypReturns the hyperbolic tangent of "numeric_expression" where"numeric_expression" is an angle expressed in radians.
Syntaxtanhyp ( numeric_expression )
SAP BW Math
log10Returns the base ten logarithm of "numeric_expression".
Syntaxlog10 ( numeric_expression )
Salesforce.com
Date Functions
CALENDAR_MONTHReturns a number representing the calendar month of "date_expression".
SyntaxCALENDAR_MONTH ( date_expression )
ExampleCALENDAR_MONTH ( ’2012-02-29’ )
Result
2
CALENDAR_QUARTERReturns a number representing the calendar quarter of "date_expression".
SyntaxCALENDAR_QUARTER ( date_expression )
ExampleCALENDAR_QUARTER ( ’2012-02-29’ )
Result
1
Appendix F. Using the expression editor 667

CALENDAR_YEARReturns a number representing the calendar year of "date_expression".
SyntaxCALENDAR_YEAR ( date_expression )
ExampleCALENDAR_YEAR ( ’2012-02-29’ )
Result
2012
DAY_IN_MONTHReturns a number representing the day in the month of "date_expression".
SyntaxDAY_IN_MONTH ( date_expression )
ExampleDAY_IN_MONTH ( ’2012-02-29’ )
Result
29
DAY_IN_WEEKReturns a number representing the day of the week for "date_expression" 1 forSunday, 7 for Saturday.
SyntaxDAY_IN_WEEK ( date_expression )
ExampleDAY_IN_WEEK ( ’2012-02-29’ )
Result
4 (Wednesday)
DAY_IN_YEARReturns a number representing the day in the year for "date_expression".
SyntaxDAY_IN_YEAR ( date_expression )
ExampleDAY_IN_YEAR ( ’2012-02-29’ )
Result
60
668 IBM Cognos Report Studio Version 10.2.1: User Guide
DAY_ONLYReturns a date representing the day portion of "dateTime_expression".
SyntaxDAY_ONLY ( dateTime_expression )
ExampleDAY_ONLY ( ’2012-02-29T23:00:01Z’ )
Result
2012-02-29
FISCAL_MONTHReturns a number representing the fiscal month of "date_expression". This differsfrom CALENDAR_MONTH() if your organization uses a fiscal year that does notmatch the Gregorian calendar. If your fiscal year starts in March, 1 for March 12for February.
SyntaxFISCAL_MONTH ( date_expression )
ExampleFISCAL_MONTH ( ’2012-02-29’ )
Result
12
FISCAL_QUARTERReturns a number representing the fiscal quarter of "date_expression". This differsfrom CALENDAR_QUARTER() if your organization uses a fiscal year that does notmatch the Gregorian calendar. If your fiscal year starts in July, 1 for July 15 and 4for June 6
SyntaxFISCAL_QUARTER ( date_expression )
ExampleFISCAL_QUARTER ( ’2012-02-29’ )
Result
3
FISCAL_YEARReturns a number representing the fiscal year of "date_expression". This differsfrom CALENDAR_YEAR() if your organization uses a fiscal year that does notmatch the Gregorian calendar.
SyntaxFISCAL_YEAR ( date_expression )
ExampleFISCAL_YEAR ( ’2012-02-29’ )
Appendix F. Using the expression editor 669

Result
2012
HOUR_IN_DAYReturns a number representing the hour in the day for "dateTime_expression".
SyntaxHOUR_IN_DAY ( dateTime_expression )
ExampleHOUR_IN_DAY ( ’2012-02-29T23:00:01Z’ )
Result
23
WEEK_IN_MONTHReturns a number representing the week in the month for "date_expression". Thefirst week is from the first through the seventh day of the month
SyntaxWEEK_IN_MONTH ( date_expression )
ExampleWEEK_IN_MONTH ( ’2012-02-29’ )
Result
5
WEEK_IN_YEARReturns a number representing the calendar week of a "date_expression". The firstweek is from January 1 through January 7
SyntaxWEEK_IN_YEAR ( date_expression )
ExampleWEEK_IN_YEAR ( ’2012-02-29’ )
Result
9
convertCurrencyConverts "numeric_expression" to the user's currency when multicurrency isenabled.
SyntaxconvertCurrency ( numeric_expression )
670 IBM Cognos Report Studio Version 10.2.1: User Guide

convertTimezoneConverts "dateTime_expression" to the user's time zone.
SyntaxconvertTimezone ( dateTime_expression )
SQL Server
SQL Server Math
logReturns the natural logarithm of "numeric_expression".
Syntaxlog ( numeric_expression )
log10Returns the base ten logarithm of "numeric_expression".
Syntaxlog10 ( numeric_expression )
piReturns the constant value of pi as a floating point value.
Syntaxpi ()
randGenerates a random number using "integer_expression" as the seed value.
Syntaxrand ( integer_expression )
SQL Server Trigonometry
acosReturns the arccosine of "numeric_expression" in radians. The arccosine is theangle whose cosine is "numeric_expression".
Syntaxacos ( numeric_expression )
asinReturns the arcsine of "numeric_expression" in radians. The arcsine is the anglewhose sine is "numeric_expression".
Syntaxasin ( numeric_expression )
atanReturns the arctangent of "numeric_expression" in radians. The arctangent is theangle whose tangent is "numeric_expression".
Appendix F. Using the expression editor 671

Syntaxatan ( numeric_expression )
atn2Returns the arctangent of the x and y coordinates specified by"numeric_expression1" and "numeric_expression2", respectively, in radians. Thearctangent is the angle whose tangent is "numeric_expression1".
Syntaxatn2 ( numeric_expression1, numeric_expression2 )
cosReturns the cosine of "numeric_expression" where "numeric_expression" is an angleexpressed in radians.
Syntaxcos ( numeric_expression )
cotReturns the cotangent of "numeric_expression" where "numeric_expression" is anangle expressed in radians.
Syntaxcot ( numeric_expression )
degreesReturns "numeric_expression" radians converted to degrees.
Syntaxdegrees ( numeric_expression )
radiansReturns the number of radians converted from "numeric_expression" degrees.
Syntaxradians ( numeric_expression )
sinReturns the sine of "numeric_expression" where "numeric_expression" is an angleexpressed in radians.
Syntaxsin ( numeric_expression )
tanReturns the tangent of "numeric_expression" where "numeric_expression" is anangle expressed in radians.
Syntaxtan ( numeric_expression )
asciiReturns a number representing the ascii code value of the leftmost character of"string_expression".
672 IBM Cognos Report Studio Version 10.2.1: User Guide

Syntaxascii ( string_expression )
Exampleascii ( ’A’ )
Result
65
charReturns the character that has the ASCII code value specified by"integer_expression". "Integer_expression" should be between 0 and 255.
Syntaxchar ( integer_expression )
Examplechar ( 65 )
Result
A
charindexSearches "string_expression2" for the first occurrence of "string_expression1" andreturns an integer. "Start_location" is the character position to start searching for"string_expression1" in "string_expression2". If "start_location" is not specified, is anegative number, or is zero, the search starts at the beginning of"string_expression2".
Syntaxcharindex ( string_expression1 , string_expression2 [ ,start_location ] )
{current_user}Returns the name of the current user.
Syntax{ current_user }
datalengthReturns the length in bytes of "string_expression".
Syntaxdatalength ( string_expression )
dateaddReturns the date resulting from the addition of "integer_expression" units(indicated by "datepart" (day, month, year)) to "date_expression".
Syntax
Appendix F. Using the expression editor 673

dateadd ( { datepart } , integer_expression , date_expression )
datediffReturns the number of "datepart" (day, month, year) units between"date_expression1" and "date_expression2".
Syntaxdatediff ( {datepart} , date_expression1 , date_expression2 )
Exampledatediff ( {yy} , 1984-01-01 , 1997-01-01 )
Result
13
datenameReturns "datepart" from "date_expression", which can be a datetime, smalldatetime,date, or time value as an ASCII string. Note that "datepart" must be a keywordrepresenting a datepart or its abbreviation recognized by Microsoft® SQL Serverand must be enclosed in curly brackets.
Syntaxdatename ( ’ { ’ datepart ’ } ’ , date_expression )
Exampledatename ( {mm} , 2000-01-01 )
Result
January
datepartReturns part of "date_expression" (for example, the month) as an integer."date_expression" can be a datetime, smalldatetime, date, or time value. Note that"datepart" must be a keyword representing a datepart or its abbreviationrecognized by Microsoft® SQL Server and must be enclosed in curly brackets.
Syntaxdatepart ( ’ { ’ datepart ’ } ’ , date_expression )
Exampledatepart ( {wk} , 2000-01-01 )
Result
1 (first week of the year)
dayReturns the day portion of "date_expression". Same as extract (day fromdate_expression).
Syntax
674 IBM Cognos Report Studio Version 10.2.1: User Guide

day ( date_expression )
differenceReturns an integer value representing the difference between the values returnedby the data source-specific soundex function for "string_expression1" and"string_expression2". The value returned ranges from 0 to 4, with 4 indicating thebest match. Note that 4 does not mean that the strings are equal.
Syntaxdifference ( string_expression1 , string_expression2 )
Example 1difference ([Sales target (query)].[Sales Staff].[First name],[Sales (query)].[Retailers].[Contact first name])
Result
0
Example 2difference ([Sales target (query)].[Sales Staff].[First name],[Salestarget (query)].[Sales Staff].[First name])
Result
4
getdateReturns a datetime value representing the current date and time of the computerthat the database software runs on.
Syntaxgetdate ()
isnullReturns the first non-null argument (or null if both arguments are null). It isrecommended to use the sql standard COALESCE function instead.
Syntaxisnull ( expression , expression )
Exampleisnull ( [Sales (query)].[Sales Fact].[Sales quantity] , 0 )
Result
Returns the sales quantity if it's not null, otherwise returns 0.
leftReturns the leftmost "integer_expression" characters of "string_expression".
Syntaxleft ( string_expression , integer_expression )
Appendix F. Using the expression editor 675

Exampleleft ( [Sales (query)].[Sales staff].[Last name] , 3 )
Result
Returns the first three characters of each last name.
ltrimReturns "string_expression" with leading spaces removed.
Syntaxltrim ( string_expression )
monthReturns the month portion of "date_expression". Same as extract (month fromdate_expression).
Syntaxmonth ( date_expression )
patindexReturns an integer that represents the starting position of the first occurrence of"string_expression1" in the "string_expression2". Returns 0 if "string_expression1" isnot found. The % wildcard character must precede and follow "string_expression1",except when searching for first or last characters.
Syntaxpatindex ( string_expression1 , string_expression2 )
Examplepatindex ( ’%po%’, ’Report’ )
Result
3
replaceReplaces all occurrences of "string_expression2" in "string_expression1" with"string_expression3".
Syntaxreplace ( string_expression1 , string_expression2 ,string_expression3 )
replicateReturns a string consisting of "string_expression" repeated "integer_expression"times.
Syntaxreplicate ( string_expression , integer_expression )
676 IBM Cognos Report Studio Version 10.2.1: User Guide

reverseReturns "string_expression" in reverse order.
Syntaxreverse ( string_expression )
rightReturns the rightmost "integer_expression" characters of "string_expression".
Syntaxright ( string_expression , integer_expression )
roundReturns "numeric_expression" rounded to the nearest value "integer_expression"places to the right of the decimal point. Rounding takes place before dataformatting is applied.
Syntaxround ( numeric_expression , integer_expression )
Exampleround (125, -1)
Result
130
rtrimReturns "string_expression" with trailing spaces removed.
Syntaxrtrim ( string_expression )
Examplertrim ( [Sales (query)].[Sales staff].[Last name] )
Result
Returns last names with any spaces at the end of the name removed.
signReturns an indicator of the sign "numeric_expression": +1 if "numeric_expression"is positive, 0 if zero or -1 if negative.
Syntaxsign ( numeric_expression )
soundexReturns a four character string representing the sound of the words in"string_expression".
Syntax
Appendix F. Using the expression editor 677

soundex ( string_expression )
spaceReturns a string consisting of "integer_expression" spaces.
Syntaxspace ( integer_expression )
strReturns a string representation of "numeric_expression" where"integer_expression1" is the length of the string returned and "integer_expression2"is the number of decimal digits.
Syntaxstr ( numeric_expression [ , integer_expression1 [ ,integer_expression2 ] ] )
stuffReturns a string where "integer_expression2" characters have been deleted from"string_expression1" beginning at "integer_expression1", and where"string_expression2" has been inserted into "string_expression1" at its start. Thefirst character in a string is at position 1.
Syntaxstuff ( string_expression1 , integer_expression1 ,integer_expression2 , string_expression2 )
yearReturns the year portion of "date_expression". Same as extract (year fromdate_expression).
Syntaxyear ( date_expression )
Sybase
Sybase Math
logReturns the natural logarithm of "numeric_expression".
Syntaxlog ( numeric_expression )
log10Returns the base ten logarithm of "numeric_expression".
Syntaxlog10 ( numeric_expression )
678 IBM Cognos Report Studio Version 10.2.1: User Guide

piReturns the constant value of pi as a floating point value.
Syntaxpi ()
signReturns an indicator denoting the sign of "numeric_expression": +1 if"numeric_expression" is positive, 0 if "numeric_expression" is zero, or -1 if"numeric_expression" is negative.
Syntaxsign ( numeric_expression )
Sybase Trigonometry
acosReturns the arccosine of "numeric_expression" in radians. The arccosine is theangle whose cosine is "numeric_expression".
Syntaxacos ( numeric_expression )
asinReturns the arcsine of "numeric_expression" in radians. The arcsine is the anglewhose sine is "numeric_expression".
Syntaxasin ( numeric_expression )
atanReturns the arctangent of "numeric_expression" in radians. The arctangent is theangle whose tangent is "numeric_expression".
Syntaxatan ( numeric_expression )
tanReturns the tangent of "numeric_expression" where "numeric_expression" is anangle expressed in radians.
Syntaxtan ( numeric_expression )
atn2Returns the angle, in radians, whose tangent is "numeric_expression1" /"numeric_expression2".
Syntaxatn2 ( numeric_expression1, numeric_expression2 )
cosReturns the cosine of "numeric_expression" where "numeric_expression" is an angleexpressed in radians.
Appendix F. Using the expression editor 679

Syntaxcos ( numeric_expression )
cotReturns the cotangent of "numeric_expression" where "numeric_expression" is anangle expressed in radians.
Syntaxcot ( numeric_expression )
degreesReturns "numeric_expression" radians converted to degrees.
Syntaxdegrees ( numeric_expression )
radiansReturns the degree equivalent of "numeric_expression". Results are of the sametype as "numeric_expression". For numeric or decimal expressions, the results havean internal precision of 77 and a scale equal to that of "numeric_expression". Whenthe money datatype is used, an internal conversion to float may cause some loss ofprecision.
Syntaxradians ( numeric_expression )
sinReturns the sine of "numeric_expression" where "numeric_expression" is an angleexpressed in radians.
Syntaxsin ( numeric_expression )
asciiReturns a number representing the ascii code value of the leftmost character of"string_expression".
Syntaxascii ( string_expression )
Exampleascii ( ’A’ )
Result
65
charConverts "integer_expression" to a character value. Char is usually used as theinverse of ascii where "integer_expression" must be between 0 and 255. If theresulting value is the first byte of a multibyte character, the character may beundefined.
Syntax
680 IBM Cognos Report Studio Version 10.2.1: User Guide

char ( integer_expression )
charindexReturns an integer that represents the starting position of "string_expression1"within "string_expression2". If "string_expression1" is not found, zero is returned. If"string_expression1" contains wildcard characters, charindex treats them as literals.
Syntaxcharindex ( string_expression1 , string_expression2 )
datalengthReturns the length in bytes of "string_expression".
Syntaxdatalength ( string_expression )
dateaddReturns the date resulting from adding "integer_expression" units indicated bydatepart (day, month, year) to "date_expression". Note that "datepart" must beenclosed in curly brackets.
Syntaxdateadd ( ’ { ’ datepart ’ } ’ , integer_expression ,date_expression )
Exampledateadd ( {dd} , 16 , 1997-06-16 )
Result
Jul 2, 1997
datediffReturns the number of units indicated by "datepart" (day, month, year) between"date_expression1" and "date_expression2". Note that "datepart" must be enclosedin curly brackets.
Syntaxdatediff ( ’ { ’ datepart ’ } ’ , date_expression1 ,date_expression2 )
Exampledatediff ( {yy} , 1984-01-01 , 1997-01-01 )
Result
13
datenameReturns "datepart" of "date_expression" as an ASCII string. "Date_expression" canbe a datetime, smalldatetime, date, or time value. Note that "datepart" must beenclosed in curly brackets.
Appendix F. Using the expression editor 681

Syntaxdatename ( ’ { ’ datepart ’ } ’ , date_expression )
Exampledatename ( {mm} , 1999-05-01 )
Result
May
datepartReturns "datepart" of "date_expression" as an integer. "Date_expression" can be adatetime, smalldatetime, date, or time value. Note that the datepart argument mustbe enclosed in curly brackets.
Syntaxdatepart ( ’ { ’ datepart ’ } ’ , date_expression )
Exampledatepart ( {mm} , 1999-05-01 )
Result
5
dayReturns the day of the month (1-31) from "date_expression".
Syntaxday ( date_expression )
differenceReturns an integer value representing the difference between the values returnedby the data source-specific soundex function for "string_expression1" and"string_expression2". The value that is returned ranges from 0 to 4, with 4indicating the best match. Note that 4 does not mean that the strings are equal.
Syntaxdifference ( string_expression1 , string_expression2 )
Example 1difference ([Sales target (query)].[Sales staff].[First name],[Sales (query)].[Retailers].[Contact first name])
Result
0
Example 2difference ([Sales target (query)].[Sales staff].[First name],[Salestarget (query)].[Sales staff].[First name])
Result
682 IBM Cognos Report Studio Version 10.2.1: User Guide

4
getdateReturns current system date and time.
Syntaxgetdate ()
leftReturns the leftmost "integer_expression" characters of "string_expression".
Syntaxleft ( string_expression , integer_expression )
Exampleleft ( [Sales (query)].[Sales staff].[Last name] , 3 )
Result
Returns the first three characters of each last name.
ltrimReturns "string_expression" with any leading spaces removed.
Syntaxltrim ( string_expression )
monthReturns the month number (1-12) from "date_expression".
Syntaxmonth ( date_expression )
patindexReturns an integer representing the starting position of the first occurrence of"string_expression1" in "string_expression2" or returns 0 if "string_expression1" isnot found. By default, patindex returns the offset in characters. The offset can bereturned in bytes by setting the return type to bytes. The % wildcard charactermust precede and follow the pattern in "string_expression1", except whensearching for first or last characters.
Syntaxpatindex ( string_expression1 , string_expression2 [ using{bytes|chars|characters} ] )
randReturns a random float value between 0 and 1, using the optional"integer_expression" as a seed value.
Syntaxrand ( integer_expression )
Appendix F. Using the expression editor 683

replicateReturns a string with the same datatype as "string_expression", containing thesame expression repeated "integer_expression" times or as many times as will fitinto a 225-byte space, whichever is less.
Syntaxreplicate ( string_expression , integer_expression )
reverseReturns the reverse of "string_expression".
Syntaxreverse ( string_expression )
rightReturns the rightmost "integer_expression" characters of "string_expression".
Syntaxright ( string_expression , integer_expression )
roundReturns "numeric_expression" rounded to the nearest value "integer_expression"places to the right of the decimal point. Rounding takes place before dataformatting is applied.
Syntaxround ( numeric_expression, integer_expression )
Exampleround (125, -1)
Result
130
rtrimReturns "string_expression" with trailing spaces removed.
Syntaxrtrim ( string_expression )
Examplertrim ( [Sales (query)].[Sales staff].[Last name] )
Result
Returns last names with any spaces at the end of the name removed.
soundexReturns a four-character soundex code for character strings that are composed of acontiguous sequence of valid single- or double-byte Roman letter.
684 IBM Cognos Report Studio Version 10.2.1: User Guide

Syntaxsoundex ( string_expression )
spaceReturns a string with "integer_expression" single-byte spacing.
Syntaxspace ( integer_expression )
strReturns a string representation of "numeric_expression". "Integer_expression1" isthe length of the returned string and has a default setting of 10."Integer_expression2" is the number of decimal digits and has a default setting of0. Both are optional values.
Syntaxstr ( numeric_expression [ , integer_expression1 [ ,integer_expression2 ] ] )
stuffDeletes "integer_expression2" characters from "string_expression1" starting at"integer_expression1", and inserts "string_expression2" into "string_expression1" atthat position. To delete characters without inserting other characters,"string_expression2" should be null and not " ", which indicates a single space.
Syntaxstuff ( string_expression1 , integer_expression1 ,integer_expression2 , string_expression2 )
substringReturns the substring of "string_expression" that starts at position"integer_expression1". "Integer_expression2" specifies the number of characters inthe substring.
Syntaxsubstring ( string_expression , integer_expression1 ,integer_expression2 )
Examplesubstring ( [Sales (query)].[Sales staff].[Position code], 3 , 5 )
Result
Returns characters 3 to 7 of the position codes.
to_unicharReturns a unichar expression with the value "integer_expression". If"integer_expression" is in the range 0xD800..0xDFFF, the operation is aborted. If the"integer_expression" is in the range 0..0xFFFF, a single Unicode value is returned. If"integer_expression" is in the range 0x10000..0x10FFFF, a surrogate pair is returned.
Syntaxto_unichar ( integer_expression )
Appendix F. Using the expression editor 685

uhighsurrReturns 1 if the Unicode value at "integer_expression" is the high half of asurrogate pair (which should appear first in the pair). Otherwise, it returns 0. Thisfunction allows you to write explicit code for surrogate handling. Particularly, if asubstring starts on a Unicode character where uhighsurr () is true, extract asubstring of at least 2 Unicode values, as substr() does not extract just 1. Substr ()does not extract half of a surrogate pair.
Syntaxuhighsurr ( string_expression , integer_expression )
ulowsurrReturns 1 if the Unicode value at "integer_expression" is the low half of a surrogatepair (which should appear second in the pair). Otherwise, it returns 0. Thisfunction allows you to explicitly code around the adjustments performed by substr(), stuff (), and right (). Particularly, if a substring ends on a Unicode value whereulowsurr () is true, extract a substring of 1 less characters (or 1 more), since substr() does not extract a string that contains an unmatched surrogate pair.
Syntaxulowsurr ( string_expression , integer_expression )
uscalarReturns the Unicode scalar value for the first Unicode character in"string_expression". If the first character is not the high-order half of a surrogatepair, then the value is in the range 0..0xFFFF. If the first character is the high-orderhalf of a surrogate pair, a second value must be a low-order half, and the returnvalue is in the range 0x10000..0x10FFFF. If this function is called on a Unicodecharacter expression containing an unmatched surrogate half, the operation isaborted.
Syntaxuscalar ( string_expression )
yearReturns the year from date_expression.
Syntaxyear ( date_expression )
Teradata
Teradata Trigonometry
acosReturns the arccosine of "numeric_expression" in radians. The arccosine is theangle whose cosine is "numeric_expression". "Numeric_expression" must bebetween -1 and 1, inclusive.
Syntaxacos ( numeric_expression )
686 IBM Cognos Report Studio Version 10.2.1: User Guide

acoshReturns the inverse hyperbolic cosine of "numeric_expression" where"numeric_expression" can be any real number equal to or greater than 1.
Syntaxacosh ( numeric_expression )
asinReturns the arcsine of "numeric_expression" in radians. The arcsine is the anglewhose sine is "numeric_expression". "Numeric_expression" must be between -1 and1, inclusive.
Syntaxasin ( numeric_expression )
asinhReturns the inverse hyperbolic sine of "numeric_expression" where"numeric_expression" can be any real number.
Syntaxasinh ( numeric_expression )
atanReturns the arctangent of "numeric_expression" in radians where the arctangent isthe angle whose tangent is "numeric_expression".
Syntaxatan ( numeric_expression )
atan2Returns the arctangent of the x and y coordinates specified by"numeric_expression1" and "numeric_expression2", respectively, in radians. Thereturned angle will be between - and π radians, excluding π.
Syntaxatan2 ( numeric_expression1, numeric_expression2 )
atanhReturns the inverse hyperbolic tangent of "numeric_expression" where"numeric_expression" can be any real number between 1 and -1, excluding 1 and-1.
Syntaxatanh ( numeric_expression )
cosReturns the cosine of "numeric_expression" where "numeric_expression" is an angleexpressed in radians.
Syntaxcos ( numeric_expression )
coshReturns the hyperbolic cosine of "numeric_expression" where "numeric_expression"can be any real number.
Appendix F. Using the expression editor 687

Syntaxcosh ( numeric_expression )
sinReturns the sine of "numeric_expression" where "numeric_expression" is an angleexpressed in radians.
Syntaxsin ( numeric_expression )
sinhReturns the hyperbolic sine of "numeric_expression" where "numeric_expression"can be any real number.
Syntaxsinh ( numeric_expression )
tanReturns the tangent of "numeric_expression" where "numeric_expression" is anangle expressed in radians.
Syntaxtan ( numeric_expression )
tanhReturns the hyperbolic tangent of "numeric_expression" where"numeric_expression" can be any real number.
Syntaxtanh ( numeric_expression )
accountReturns the account string for the current user.
Syntax{account}
add_monthsReturns the date or the datetime resulting from adding "integer_expression"months to "date_expression" or "datetime_expression".
Syntaxadd_months ( date_expression|datetime_expression ,integer_expression )
bytesReturns the number of bytes contained in "byte_expression". "Byte_expression" isrestricted to BYTE or VARBYTE.
Syntaxbytes ( byte_expression )
688 IBM Cognos Report Studio Version 10.2.1: User Guide

case_nEvaluates "condition_expression_list" and returns the position of the first truecondition, provided that no prior condition in the list evaluates to unknown. Thekeywords must be enclosed in curly brackets. No case is an optional condition thatevaluates to true if every expression in the list evaluates to false. No case orunknown is an optional condition that evaluates to true if every expression in thelist evaluates to false, or if an expression evaluates to unknown and all priorconditions in the list evaluate to false. Unknown is an optional condition thatevaluates to true if an expression evaluates to unknown and all prior conditions inthe list evaluate to false.
Syntaxcase_n ( condition_expression_list [ , NO CASE|UNKNOWN|NO CASE ORUNKNOWN [ , UNKNOWN ] ] )
char2hexintReturns the hexadecimal representation for "string_expression".
Syntaxchar2hexint ( string_expression )
charactersReturns an integer value representing the number of logical characters or bytescontained in "string_expression".
Syntaxcharacters ( string_expression )
databaseReturns the name of the default database for the current user.
Syntax{database}
dateReturns the current date.
Syntax{date}
formatReturns the declared format for "expression" as a variable character string of up to30 characters.
Syntaxformat ( expression )
indexReturns the starting position of "string_expression2" in "string_expression1".
Syntax
Appendix F. Using the expression editor 689

index ( string_expression1 , string_expression2 )
logComputes the base 10 logarithm of "numeric_expression". "Numeric_expression"must be a non-zero, positive, numeric expression.
Syntaxlog ( numeric_expression )
nullifReturns null if "scalar_expression1" and "scalar_expression2" are equal. Otherwise,it returns "scalar_expression1". "Scalar_expression1" and "scalar_expression2" can beany data type.
Syntaxnullif ( scalar_expression1 , scalar_expression2 )
nullifzeroIf "numeric_expression" is zero, converts it to null to avoid division by zero.
Syntaxnullifzero ( numeric_expression )
profileReturns the current profile for the session or null if none.
Syntax{profile}
randomReturns a random integer number for each row of the results table. "Lower_bound"and "upper_bound" are integer constants. The limits for "lower_bound" and"upper_bound" range from -2147483648 to 2147483647 inclusive. "Upper_bound"must be greater than or equal to "lower_bound".
Syntaxrandom ( lower_bound , upper_bound )
roleReturns the current role for the session or null if none.
Syntax{role}
sessionReturns the number of the session for the current user.
Syntax{session}
690 IBM Cognos Report Studio Version 10.2.1: User Guide

soundexReturns a character string that represents the Soundex code for "string_expression".
Syntaxsoundex ( string_expression )
substrReturns the substring of "string_expression" that starts at position"integer_expression1" for "integer_expression2" characters. The first character in"string_expression" is at position 1. If "integer_expression2" is omitted, returns thesubstring of "string_expression" that starts at position "integer_expression1" andends at the end of "string_expression".
Syntaxsubstr ( string_expression , integer_expression1 [ ,integer_expression2 ] )
Examplesubstr ( [Sales (query)].[Sales staff].[Position code], 3 , 5 )
Result
Returns characters 3 to 7 of the position codes.
timeReturns the current time based on a 24-hour day. According to Teradatadocumentation, the system function TIME is deprecated. Use CURRENT_TIMEfunction instead. Please note that in Compatible Mode TIME returns time datatype, while in Dynamic Query Mode time returns a value of type FLOAT.
Syntax{time}
typeReturns the data type defined for "expression".
Syntaxtype ( expression )
userReturns the user name of the current user.
Syntax{user}
vargraphicReturns a character string that represents the vargraphic code for"string_expression".
Syntaxvargraphic ( string_expression )
Appendix F. Using the expression editor 691

zeroifnullConverts data from null to 0 to avoid errors created by a null value. If"numeric_expression" is not null, returns the value of "numeric_expression". If"numeric_expression" is a character string, it is converted to a numeric value offloat data type. If "numeric_expression" is null or zero, it returns zero.
Syntaxzeroifnull ( numeric_expression )
Vectorwise
Vectorwise String
lpadReturns "string_exp1" padded to length "integer_exp" with occurrences of"string_exp2". If "string_exp1" is longer than "integer_exp", the appropriate portionof "string_exp1" is returned.
Syntaxlpad ( string_exp1, integer_exp [ , string_exp2 ] )
ltrimReturns "string_exp1", with leading blank characters removed.
Syntaxltrim ( string_exp1 )
rtrimReturns "string_exp1", with trailing blank characters removed.
Syntaxrtrim ( string_exp1 )
shiftReturns "string_exp1" shifted by numeric_exp character. If "numeric_exp" is greaterthan zero shift to the right else shift to the left.
Syntaxshift ( string_exp1, numeric_exp )
soundexReturns a four character code for the "string_exp1".
Syntaxsoundex ( string_exp1 )
squeezeReturns "string_exp1" with multiple whitespace characters collapsed into a singlewhitespace character.
Syntaxsqueeze ( string_exp1 )
692 IBM Cognos Report Studio Version 10.2.1: User Guide

Vectorwise Math
logReturns the base 10 logarithm of "numeric_exp1".
Syntaxlog ( numeric_exp1 )
lnReturns the natural logarithm of "numeric_exp1".
Syntaxln ( numeric_exp )
piReturns the constant of pi.
Syntaxpi( )
Vectorwise Trigonometry
acosReturns the arccosine of "numeric_exp" in radians. The arccosine is the anglewhose cosine is "numeric_exp".
Syntaxacos ( numeric_exp )
asinReturns the arcsine of "numeric_exp" in radians. The arcsine is the angle whosesine is "numeric_exp".
Syntaxasin ( numeric_exp )
atanReturns the arctangent of "numeric_exp" in radians. The arctangent is the anglewhose tangent is "numeric_exp".
Syntaxatan ( numeric_exp )
atan2Returns the arctangent of the x and y coordinates specified by "numeric_exp1" and"numeric_exp2", respectively, in radians. The arctangent is the angle whose tangentis "numeric_exp2" / "numeric_exp1".
Syntaxatan2 ( numeric_exp1 ,numeric_exp2 )
cosReturns the cosine of "numeric_exp" where "numeric_exp" is an angle expressed inradians.
Appendix F. Using the expression editor 693

Syntaxcos ( numeric_exp )
sinReturns the sine of "numeric_exp" where "numeric_exp" is an angle expressed inradians.
Syntaxsin ( numeric_exp )
tanReturns the tangent of "numeric_exp" where "numeric_exp" is an angle expressedin radians.
Syntaxtan ( numeric_exp )
{initial_user}Returns the initial username.
Syntax{ initial_user }
{session_user}Returns the session username.
Syntax{ session_user }
numeric_truncReturns the numeric_exp1 truncated at the decimal place or numeric_exp2 digits tothe left or right of the decimal place.
Syntaxtrunc ( numeric_exp1 , numeric_exp2 )
Vertica
Vertica String
overlayReturns the "string_expression1", replacing "string_expression2" from characterposition numeric_expression.
Syntaxoverlay ( string_expression1 , string_expression2 ,numeric_expression1 [ , numeric_expression2 ] )
btrimReturns string_expression1 after removing the longest string of characters instring_expression2.
Syntax
694 IBM Cognos Report Studio Version 10.2.1: User Guide
btrim ( string_expression1 [ , string_expression2 ] )
initcapReturns "string_expression", with the first letter of each word in uppercase and allother letters in lowercase. Words are delimited by white space or characters thatare not alphanumeric.
Syntaxinitcap ( string_expression )
lpadReturns "string_expression1" padded to length "integer_expression" withoccurrences of "string_expression2". If "string_expression1" is longer than"integer_expression", the appropriate portion of "string_expression1" is returned.
Syntaxlpad ( string_expression1 , integer_expression [ , string_expression2] )
ltrimReturns "string_expression1", with leading characters removed up to the firstcharacter not in "string_expression2"; for example, ltrim ( 'xyxXxyAB' , 'xy' )returns XxyAB.
Syntaxltrim ( string_expression1 [ , string_expression2 ] )
to_hexReturns the hexadecimal string representation of "numeric_exp1".
Syntaxto_hex ( numeric_expression1 )
repeatReturns the "string_expression" repeated "numeric_expression1" times.
Syntaxrepeat ( string_expression , numeric_expression1 )
replaceReturns "string_expression" having replaced "string_expression2" with"string_expression3".
Syntaxreplace ( string_expression , string_expression2 , string_expression3)
rpadReturns "string_expression1" right-padded to length "integer_expression" withoccurrences of "string_expression2". If "string_expression1" is longer than"integer_expression", the appropriate portion of "string_expression1" is returned. If"string_expression2" is not specified, then spaces are used.
Syntaxrpad ( string_expression1 , integer_expression [ , string_expression2] )
Appendix F. Using the expression editor 695
rtrimReturns "string_expression1", with final characters removed after the last characternot in "string_expression2"; for example, rtrim ( 'ABxXxyx' , 'xy' ) returns ABxX. If"string_expression2" is not specified, the final space characters are removed.
Syntaxrtrim ( string_expression1 [ , string_expression2 ] )
Vertica Data type formatting
to_charReturns the string representation of "expression" with the format of"string_expression". "Expression" can be either a date value or a numeric value.
Syntaxto_char ( expression , string_expression )
to_dateConverts "string_expression1" to a date value as specified by the format"string_expression2".
Syntaxto_date ( string_expression1 , string_expression2 )
to_numberConverts "string_expression1" to a numeric value as specified by the format"string_expression2".
Syntaxto_number ( string_expression1, string_expression2 )
to_timestampConverts "string_expression1" to a timestamp value as specified by the format"string_expression2".
Syntaxto_timestamp ( string_expression1, string_expression2 )
Vertica Math
logReturns the base 10 logarithm of "numeric_expression1" or logarithm to the base"numeric_expression2".
Syntaxlog ( numeric_expression1 [ , numeric_expression2 ] )
lnReturns the natural logarithm of "numeric_expression1".
Syntaxln ( numeric_expression )
696 IBM Cognos Report Studio Version 10.2.1: User Guide

cbrtReturns the cube root of "numeric_expression1".
Syntaxcbrt ( numeric_expression )
piReturns the constant of pi.
Syntaxpi ()
Vertica Trigonometry
acosReturns the arccosine of "numeric_expression" in radians. The arccosine is theangle whose cosine is "numeric_expression".
Syntaxacos ( numeric_expression )
asinReturns the arcsine of "numeric_expression" in radians. The arcsine is the anglewhose sine is "numeric_expression".
Syntaxasin ( numeric_expression )
atanReturns the arctangent of "numeric_expression" in radians. The arctangent is theangle whose tangent is "numeric_expression".
Syntaxatan ( numeric_expression )
atan2Returns the arctangent of the x and y coordinates specified by"numeric_expression1" and "numeric_expression2", respectively, in radians. Thearctangent is the angle whose tangent is "numeric_expression2" /"numeric_expression1".
Syntaxatan2 ( numeric_expression1 , numeric_expression2 )
cosReturns the cosine of "numeric_expression" where "numeric_expression" is an angleexpressed in radians.
Syntaxcos ( numeric_expression )
cotReturns the cotangent of "numeric_expression" where "numeric_expression" is anangle expressed in radians.
Appendix F. Using the expression editor 697

Syntaxcot ( numeric_expression )
degreesReturns the degrees where "numeric_expression" is an angle expressed in radians.
Syntaxdegrees ( numeric_expression )
radiansReturns the radians where "numeric_expression" is an angle expressed in degrees.
Syntaxradians ( numeric_expression )
sinReturns the sine of "numeric_exp" where "numeric_expression" is an angleexpressed in radians.
Syntaxsin ( numeric_expression )
tanReturns the tangent of "numeric_expression" where "numeric_expression" is anangle expressed in radians.
Syntaxtan ( numeric_expression )
asciiReturns a number representing the ASCII code value of the leftmost character of"string_expression"; for example, ascii ( 'A' ) is 65.
Syntaxascii ( string_expression )
chrReturns the character that has the ASCII code value specified by"integer_expression". "Integer_expression" should be between 0 and 255.
Syntaxchr ( integer_expression )
current_databaseReturns the name of the current database.
Syntaxcurrent_database ()
current_schemaReturns the name of the current schema
Syntax
698 IBM Cognos Report Studio Version 10.2.1: User Guide

current_schema ()
{current_user}Syntax{current_user}
{session_user}Syntax{session_user}
translateReturns "string_expression1", with each occurrence of each character in"string_expression2" replaced by its corresponding character in"string_expression3".
Syntaxtranslate ( string_expression1 , string_expression2 ,string_expression3 )
date_truncReturns the timestamp to the specified precision.
Syntaxdate_trunc ( string_expression , timestamp_expression)
versionReturns the string value of the database version.
Syntaxversion ()
Macro FunctionsThis list contains functions that can be used within a macro. A macro may containone or more macro functions. A macro is delimited by a number sign (#) at thebeginning and at the end. Everything between the number signs is treated as amacro expression and is executed at run time. For macro functions that acceptexpressions of datatype timestamp with time zone as arguments, the acceptedformat is 'yyyy-mm-dd hh:mm:ss[.ff]+hh:mm' where fractional seconds are optionaland can be represented by 1 to 9 digits. In lieu of a space separating the dateportion to the time portion, the character 'T' is also accepted. Also, in lieu of thetime zone '+hh:mm', the character 'Z' is accepted and will be processed internallyas '+00:00'. The macro functions that return expressions of datatype timestampwith time zone return 9 digits by default for their fractional seconds. The macrofunction timestampMask () can be used to trim the output if required.
+Concatenates two strings.
Syntaxvalue1 + value2
Appendix F. Using the expression editor 699

Example# ’{ ’ + $runLocale + ’ }’ #
Result
{en-us}
_add_daysReturns the timestamp with time zone (as a string) that results from adding"integer_expression" number of days to "string_expression", where"string_expression" represents a timestamp with time zone.
Syntax_add_days ( string_expression , integer_expression )
Example 1# _add_days ( ’2005-11-01 12:00:00.000-05:00’ , -1 ) #
Result
2005-10-31 12:00:00.000000000-05:00
Example 2# _add_days ( $current_timestamp , 1 ) #
Result
2005-11-02 12:00:00.000000000-05:00
Example 3# timestampMask ( _add_days ( $current_timestamp , 1 ) ,’yyyy-mm-dd’ ) #
Result
2005-11-02
_add_monthsReturns the timestamp with time zone (as a string) that results from adding"integer_expression" number of months to "string_expression", where"string_expression" represents a timestamp with time zone.
Syntax_add_months ( string_expression , integer_expression )
Example 1# _add_months ( ’2005-11-01 12:00:00.000-05:00’ , -1 ) #
Result
2005-10-01 12:00:00.000000000-05:00
Example 2# _add_months ( $current_timestamp , 1 ) #
700 IBM Cognos Report Studio Version 10.2.1: User Guide

Result
2005-12-01 12:00:00.000000000-05:00
Example 3# timestampMask ( _add_months ( $current_timestamp , 1 ) ,’yyyy-mm-dd’ ) #
Result
2005-12-01
_add_yearsReturns the timestamp with time zone (as a string) that results from adding"integer_expression" number of years to "string_expression", where"string_expression" represents a timestamp with time zone.
Syntax_add_years ( string_expression , integer_expression )
Example 1# _add_years ( ’2005-11-01 12:00:00.000-05:00’ , -1 ) #
Result
2004-11-01 12:00:00.000000000-05:00
Example 2# _add_years ( $current_timestamp , 1 ) #
Result
2006-11-01 12:00:00.000000000-05:00
Example 3# timestampMask ( _add_years ( $current_timestamp , 1 ) ,’yyyy-mm-dd’ ) #
Result
2006-11-01
arrayConstructs an array out of the list of parameters.
Syntaxarray ( string_expression|array_expression { ,string_expression|array_expression } )
Example# csv ( array ( ’a1’ , array ( ’x1’ , ’x2’ ) , ’a2’ ) ) #
Result
Appendix F. Using the expression editor 701

'a1' , 'x1' , 'x2' , 'a2'
csvConstructs a string from the elements of the array where the values are separatedby commas. Optionally, the separator and quote strings can be specified. Thedefault separator is a comma ( , ) and the default quote character is a single quote( ' ).
Syntaxcsv ( array_expression [ , separator_string [ , quote_string ] ] )
Example# csv ( array ( ’a1’ , ’a2’ ) ) #
Result
'a1', 'a2'
dqSurrounds "string_expression" with double quotes.
Syntaxdq ( string_expression )
Example# dq ( ’zero’ ) #
Result
"zero"
getConfigurationEntryGet an entry from the IBM® Cognos® configuration file. The force_decode_flag isoptional and must be one of: 'true' , '1', 1 , 'false', '0', 0. The default is 'true'. Whentrue, the value of the configuration entry will be decrypted into plain text if it isencrypted.
SyntaxgetConfigurationEntry ( entry_string , force_decode_flag )
Example# getConfigurationEntry ( ’serverLocale’ ) #
Result
en
grepSearches for and returns elements of an array that match the pattern specified in"pattern_string".
Syntaxgrep ( pattern_string , array_expression )
702 IBM Cognos Report Studio Version 10.2.1: User Guide

Example# csv ( grep ( ’s’ , array ( ’as’, ’an’, ’arts’ ) ) ) #
Result
'as', 'arts'
_first_of_monthReturns a timestamp with time zone (as a string) by converting the day value in"string_expression" to 1, where "string_expression" is a timestamp with time zone.
Syntax_first_of_month ( string_expression )
Example 1# _first_of_month ( ’2005-11-11 12:00:00.000-05:00’ ) #
Result
2005-11-01 12:00:00.000000000-05:00
Example 2# timestampMask ( _first_of_month ( ’2005-11-11 12:00:00.000-05:00’ ) , ’yyyymmdd’ ) #
Result
20051101
_last_of_monthReturns a timestamp with time zone (as a string) that is the last day of the monthrepresented by "string_expression", where "string_expression" is a timestamp withtime zone.
Syntax_last_of_month ( string_expression )
Example 1# _last_of_month ( ’2005-11-11 12:00:00.000-05:00’ ) #
Result
2005-11-30 12:00:00.000000000-05:00
Example 2# timestampMask ( _last_of_month ( ’2005-11-11 12:00:00.000-05:00’ ) ,’yyyy-mm-dd’ ) #
Result
2005-11-30
Appendix F. Using the expression editor 703

joinJoins the elements of an array using "separator_string".
Syntaxjoin ( separator_string , array_expression )
Example# sq ( join ( ’ | | ’ , array ( ’as’, ’an’, ’arts’ ) ) ) #
Result
'as | | an | | arts'
lstripStrips the leading characters from the first argument. The optional secondargument defines the set of characters to strip. By default, this function stripswhite space (ie. space, tab, carriage return and line feed).
Syntaxlstrip ( string_expression [ , set_of_characters ] )
Example 1# sq( lstrip ( ’ abc ’ ) ) #
Result
'abc '
Example 2’ ) #
Result
53.2100
promptPrompts the user for a single value. Only "prompt_name" is required. The datatypedefaults to "string" when it is not specified. The prompt is optional when"defaultText" is specified. "Text", when specified, will precede the value."QueryItem" can be specified to take advantage of the prompt informationproperties of "queryItem". "Trailing_text", when specified, will be appended to thevalue.
Syntaxprompt ( prompt_name , datatype , defaultText , text , queryItem ,trailing_text )
Example 1select . . . where COUNTRY_MULTILINGUAL.COUNTRY_CODE > #prompt (’Starting CountryCode’ , ’integer’ , ’10’ ) #
Result
select . . . where COUNTRY_MULTILINGUAL.COUNTRY_CODE > 10
704 IBM Cognos Report Studio Version 10.2.1: User Guide

Example 2[gosales].[COUNTRY].[COUNTRY] = # prompt ( ’countryPrompt’ ,’string’ , ’’’Canada’’’ ) #
Result
[gosales].[COUNTRY].[COUNTRY] = 'Canada'
Notesv The "defaultText" parameter must be specified such that it is literally valid in the
context of the macro since no formatting takes place on this value. The defaultstring '''Canada''' in Example 2 is specified as a string using single quotes, inwhich the embedded single quotes are doubled up, thus 3 quotes. This results inthe string being properly displayed within single quotes in the expression. As ageneral rule for the string datatype, "defaultText" should always be specified likethis, except in the context of a stored procedure parameter. For "defaultText" oftypes 'date' or 'datetime', a special format should be used in the context of SQL.Examples of these formats are 'DATE ''2001-12-25''' and 'DATETIME ''2001-12-2512:00:00'''. In all other contexts, use the date/datetime without the keyword andescaped single quotes (e.g., '2001-12-25').
promptmanyPrompts the user for one or more values. Only "prompt_name" is required. Thedatatype defaults to string when it is not specified. The prompt is optional when"defaultText" is specified. "Text", when specified, will precede the list of values."QueryItem" can be specified to take advantage of the prompt informationproperties of "queryItem". "Trailing_text", when specified, will be appended to thelist of values.
Syntaxpromptmany ( prompt_name , datatype , defaultText , text , queryItem ,trailing_text )
Example 1select . . . where COUNTRY_MULTILINGUAL.COUNTRY in ( # promptmany (’CountryName’ ) # )
Result
select . . . where COUNTRY_MULTILINGUAL.COUNTRY_CODE in( 'Canada' , 'The Netherlands' , 'Russia' )
Example 2select . . . from gosales.gosales.dbo.COUNTRY_MULTILINGUALCOUNTRY_MULTILINGUAL , gosales.gosales.dbo.COUNTRY XX whereCOUNTRY_MULTILINGUAL.COUNTRY_CODE = XX.COUNTRY_CODE # promptmany (’Selected CountryCodes’ , ’integer’ , ’ ’ , ’ andCOUNTRY_MULTILINGUAL.COUNTRY_CODE in ( ’ , ’’ , ’ ) ’ ) #
Result
select . . . from gosales.gosales.dbo.COUNTRY_MULTILINGUALCOUNTRY_MULTILINGUAL , gosales.gosales.dbo.COUNTRY XX whereCOUNTRY_MULTILINGUAL.COUNTRY_CODE = XX.COUNTRY_CODE andCOUNTRY_MULTILINGUAL.COUNTRY_CODE in ( 'Canada' , 'TheNetherlands' , 'Russia' )
Appendix F. Using the expression editor 705

rstripStrips the trailing characters from the first argument. The optional secondargument defines the set of characters to strip. By default, this function stripswhite space (ie. space, tab, carriage return and line feed).
Syntaxrstrip ( string_expression [ , set_of_characters ] )
Example 1# sq( rstrip ( ’ abc ’ ) ) #
Result
' abc'
Example 2’ ) #
Result
0053.21
sbSurrounds "string_expression" with square brackets.
Syntaxsb ( string_expression )
Example# sb ( ’abc’ ) #
Result
[abc]
sqSurrounds "string_expression" with single quotes.
Syntaxsq ( string_expression )
Example# sq ( ’zero’ ) #
Result
'zero'
sortSorts the elements of the array in alphabetical order. Duplicates are retained.
Syntaxsort ( array_expression )
706 IBM Cognos Report Studio Version 10.2.1: User Guide

Example# csv ( sort ( array ( ’s3’, ’a’, ’x’ ) ) ) #
Result
'a', 's3', 'x'
splitSplits a string or string elements of the array into separate elements.
Syntaxsplit ( pattern_string, string_expression|array_expression )
Example 1# csv ( split ( ’::’, ’ab=c::de=f::gh=i’ ) ) #
Result
'ab=c', 'de=f', 'gh=i'
Example 2# csv ( split ( ’=’ , split ( ’::’, ’ab=c::de=f::gh=i’ ) ) ) #
Result
'ab', 'c', 'de', 'f', 'gh', 'i'
stripStrips the leading and trailing characters from the first argument. The optionalsecond argument defines the set of characters to strip. By default, this functionstrips white space (ie. space, tab, carriage return and line feed).
Syntaxstrip ( string_expression [ , set_of_characters ] )
Example 1# sq( strip ( ’ abc ’ ) ) #
Result
'abc'
Example 2’ ) #
Result
53.21
substituteSearches for a pattern in a string or in the string elements of an array andsubstitutes the first occurrence of "pattern_string" with "replacement_string".
Appendix F. Using the expression editor 707

Syntaxsubstitute ( pattern_string, replacement_string,string_expression|array_expression )
Example 1#sq ( substitute ( ’^cn=’, ’***’, ’cn=help’ ) )#
Result
'***help'
Example 2# csv ( substitute ( ’^cn=’, ’***’, array ( ’cn=help’ , ’acn=5’ ) ) )#
Result
'***help', 'acn=5'
Example 3# csv ( substitute ( ’cn=’, ’’, array ( ’cn=help’ , ’acn=5’ ) ) ) #
Result
'help', 'a5'
timestampMaskReturns "string_expression1", representing a timestamp with time zone, trimmed tothe format specified in "string_expression2". The format in "string_expression2"must be one of the following: 'yyyy', 'mm', 'dd', 'yyyy-mm', 'yyyymm','yyyy-mm-dd', 'yyyymmdd', 'yyyy-mm-dd hh:mm:ss', 'yyyy-mm-ddhh:mm:ss+hh:mm', 'yyyy-mm-dd hh:mm:ss.ff3', 'yyyy-mm-ddhh:mm:ss.ff3+hh:mm', 'yyyy-mm-ddThh:mm:ss', 'yyyy-mm-ddThh:mm:ss+hh:mm','yyyy-mm-ddThh:mm:ss.ff3+hh:mm', or 'yyyy-mm-ddThh:mm:ss.ff3+hh:mm'. Themacro functions that return a string representation of a timestamp with time zoneshow a precision of 9 digits for the fractional part of the seconds by default. Theformat options allow this to be trimmed down to a precision of 3 or 0.
SyntaxtimestampMask ( string_expression1 , string_expression2 )
Example 1# timestampMask ( $current_timestamp , ’yyyy-dd-mm’ ) #
Result
2005-11-01
Example 2# timestampMask ( ’2005-11-01 12:00:00.000-05:00’ , ’yyyy-mm-ddhh:mm:ss+hh:mm’ ) #
Result
2005-11-01 12:00:00-05:00
708 IBM Cognos Report Studio Version 10.2.1: User Guide

Example 3# timestampMask ( ’2005-11-01 12:00:00.123456789-05:00’ ,’yyyy-mm-ddThh:mm:ss+hh:mm.ff3+hh:mm’ ) #
Result
2005-11-01T12:00:00.123-05:00
toLocalReturns the string representing a timestamp with time zone resulting fromadjusting "string_expression" to the time zone of the operating system. Note thatthe macro function timestampMask () can be used to trim the output.
SyntaxtoLocal ( string_expression )
Example 1# toLocal ( ’2005-11-01 17:00:00.000-00:00’ ) # where OS local timezone is -05:00
Result
2005-11-01 12:00:00.000000000-05:00
Example 2# timestampMask ( toLocal ( ’2005-11-01 17:00:00.000-00:00’ ) ,’yyyy-mm-dd hh:mm:ss+hh:mm’ ) # where OS local time zone is -05:00
Result
2005-11-01 12:00:00-05:00
Example 3# toLocal ( ’2005-11-01 13:30:00.000-03:30’ ) # where OS local timezone is -05:00
Result
2005-11-01 12:00:00.000000000-05:00
tolowerReturns the string "string_expression" with all the characters converted to lowercase using the rules of the locale "locale_string". If no locale is specified, the locale'en' is used.
Syntaxtolower ( string_expression [ , locale_string ] )
Example 1# tolower ( ’ABC’ ) #
Result
abc
Appendix F. Using the expression editor 709

Example 2# tolower ( ’ABC’ , ’fr’ ) #
Result
abc
toupperReturns the string "string_expression" with all the characters converted to uppercase using the rules of the locale defined in "locale_string". If "locale_string" is notspecified, the locale 'en' is used.
Syntaxtoupper ( string_expression [ , locale_string ] )
Example 1# toupper ( ’abc’ ) #
Result
ABC
Example 2# toupper ( ’abc’ , ’fr’ ) #
Result
ABC
toUTCReturns the string representing a timestamp with time zone resulting fromadjusting "string_expression" to the zero-point reference UTC time zone, alsoknown as GMT time. Note that the macro function timestampMask () can be usedto trim the output.
SyntaxtoUTC ( string_expression )
Example 1# toUTC ( ’2005-11-01 12:00:00.000-05:00’ ) #
Result
2005-11-01 17:00:00.000000000-00:00
Example 2# timestampMask( toUTC ( ’2005-11-01 12:00:00.000-05:00’ ) ,’yyyy-mm-dd hh:mm:ss.ff3+hh:mm’ ) #
Result
2005-11-01 17:00:00.000-00:00
Example 3
710 IBM Cognos Report Studio Version 10.2.1: User Guide

# toUTC ( $current_timestamp ) #
Result
2005-11-01 17:00:00.000000000-00:00
uniqueRemoves duplicate entries from the array. The order of the elements is retained.
Syntaxunique ( array_expression )
Example# csv ( unique ( array ( ’s3’, ’a’, ’s3’, ’x’ ) ) ) #
Result
's3', 'a', 'x'
urlencodeURL-encodes the passed argument. This function is useful when specifying XMLconnection strings.
Syntaxurlencode ( prompt ( ’userValue’ ) )
Exampleurlencode ( prompt ( ’some_val’ ) )
Result
%27testValue%27
CSVIdentityNameUses the identity information of the current authenticated user to look up values inthe specified parameter map. Each individual piece of the user's identity (accountname, group names, role names) is used as a key into the map. The unique list ofvalues that is retrieved from the parameter map is then returned as a string, whereeach value is surrounded by single quotes and where multiple values are separatedby commas.
SyntaxCSVIdentityName ( %parameter_map_name [ , separator_string ] )
Example# CSVIdentityName ( %security_clearance_level_map ) #
Result
'level_500', 'level_501', 'level_700'
Appendix F. Using the expression editor 711

CSVIdentityNameListReturns the pieces of the user's identity (account name, group names, role names)as a list of strings. The unique list of values is returned as a string, where eachvalue is surrounded by single quotes and where multiple values are separated bycommas.
SyntaxCSVIdentityNameList ( [ separator_string ] )
Example# CSVIdentityNameList ( ) #
Result
'Everyone', 'Report Administrators', 'Query User'
CAMPassportReturns the Cognos® Access Manager passport.
SyntaxCAMPassport ( )
Example# CAMPassport ( ) #
Result
111:98812d62-4fd4-037b-4354-26414cf7ebef:3677162321
CAMIDListReturns the pieces of the user's Cognos® Access Manager ID (CAMID), such asaccount name, group names, or role names, as a list of values separated bycommas.
SyntaxCAMIDList ( [ separator_string ] )
Example#CAMIDList ( ) #
Result
CAMID ( "::Everyone" ) , CAMID ( ":Authors" ) , CAMID ( ":QueryUsers" ) , CAMID ( ":Consumers" ) , CAMID ( ":Metrics Authors" )
CAMIDListForTypeReturns an array of the user's Cognos® Access Manager IDs (CAMIDs) based onthe identity type (account, group, or role). CAMIDListForType can be used withthe macro functions csv or join.
SyntaxCAMIDListForType ( identity type )
712 IBM Cognos Report Studio Version 10.2.1: User Guide

Example[qs].[userRole] in ( # csv ( CAMIDListForType ( ’role’ ) ) # )
Result
[qs].[userRole] in ( 'CAMID ( "::System Administrators" ) ' , 'CAMID( ":Authors" )' )
simple caseThis macro construct is the template for a simple case, including the case, when,else, and end functions. Note that this macro construct is only supported in DQMmode.
SyntaxCASE <expression> WHEN <literal> THEN <expression> [ELSE<expression>] END
Example#CASE prompt(’pDateRange’,’token’) WHEN ’Current Week’ THEN ’[PRCurrent Week]’ ELSE ’[PR Prior Week]’ END#
Result
[PR Current Week]
Common Functions
absReturns the absolute value of "numeric_expression". Negative values are returnedas positive values.
Syntaxabs ( numeric_expression )
Example 1abs ( 15 )
Result
15
Example 2abs ( -15 )
Result
15
castConverts "expression" to a specified data type. Some data types allow for a lengthand precision to be specified. Make sure that the target is of the appropriate typeand size. The following can be used for "datatype_specification": character, varchar,char, numeric, decimal, integer, smallint, real, float, date, time, timestamp, time
Appendix F. Using the expression editor 713

with time zone, timestamp with time zone, and interval. When type casting to aninterval type, one of the following interval qualifiers must be specified: year,month, or year to month for the year-to-month interval datatype; day, hour,minute, second, day to hour, day to minute, day to second, hour to minute, hourto second, or minute to second for the day-to-second interval datatype. Notes:When you convert a value of type timestamp to type date, the time portion of thetimestamp value is ignored. When you convert a value of type timestamp to typetime, the date portion of the timestamp is ignored. When you convert a value oftype date to type timestamp, the time components of the timestamp are set to zero.When you convert a value of type time to type timestamp, the date component isset to the current system date. It is invalid to convert one interval datatype to theother (for instance because the number of days in a month is variable). Note thatyou can specify the number of digits for the leading qualifier only, i.e. YEAR(4) TOMONTH, DAY(5). Errors will be reported if the target type and size are notcompatible with the source type and size.
Syntaxcast ( expression , datatype_specification )
Example 1cast ( ’123’ , integer )
Result
123
Example 2cast ( 12345 , varchar ( 10 ) )
Result
a string containing 12345
ceilReturns the smallest integer that is greater than or equal to "numeric_expression".
Syntaxceil ( numeric_expression )
ceilingReturns the smallest integer that is greater than or equal to "numeric_expression".
Syntaxceiling ( numeric_expression )
Example 1ceiling ( 4.22 )
Result
5
Example 2ceiling ( -1.23 )
714 IBM Cognos Report Studio Version 10.2.1: User Guide

Result
-1
char_lengthReturns the number of logical characters in "string_expression". The number oflogical characters can be distinct from the number of bytes in some East Asianlocales.
Syntaxchar_length ( string_expression )
Examplechar_length ( ’Canada’ )
Result
6
character_lengthReturns the number of characters in "string_expression".
Syntaxcharacter_length ( string_expression )
Examplecharacter_length ( ’Canada’ )
Result
6
coalesceReturns the first non-null argument (or null if all arguments are null). Requirestwo or more arguments in "expression_list".
Syntaxcoalesce ( expression_list )
Examplecoalesce ( [Unit price], [Unit sale price] )
Result
Returns the unit price, or the unit sale price if the unit price is null.
current_dateReturns a date value representing the current date of the computer that thedatabase software runs on.
Syntaxcurrent_date
Appendix F. Using the expression editor 715
Examplecurrent_date
Result
2003-03-04
current_timeReturns a time with time zone value, representing the current time of the computerthat runs the database software if the database supports this function. Otherwise, itrepresents the current time of the computer that runs IBM® Cognos® BI software.
Syntaxcurrent_time
Examplecurrent_time
Result
16:33:11.354+05:00
current_timestampReturns a datetime with time zone value, representing the current time of thecomputer that runs the database software if the database supports this function.Otherwise, it represents the current time of the computer that runs IBM® Cognos®
BI software.
Syntaxcurrent_timestamp
Examplecurrent_timestamp
Result
2003-03-03 16:40:15.535+05:00
expReturns 'e' raised to the power of "numeric_expression". The constant 'e' is the baseof the natural logarithm.
Syntaxexp ( numeric_expression )
Exampleexp ( 2 )
Result
7.389056
716 IBM Cognos Report Studio Version 10.2.1: User Guide

extractReturns an integer representing the value of datepart (year, month, day, hour,minute, second) in "datetime_expression".
Syntaxextract ( datepart , datetime_expression )
Example 1extract ( year , 2003-03-03 16:40:15.535 )
Result
2003
Example 2extract ( hour , 2003-03-03 16:40:15.535 )
Result
16
floorReturns the largest integer that is less than or equal to "numeric_expression".
Syntaxfloor ( numeric_expression )
Example 1floor ( 3.22 )
Result
3
Example 2floor ( -1.23 )
Result
-2
lnReturns the natural logarithm of "numeric_expression".
Syntaxln ( numeric_expression )
Exampleln ( 4 )
Result
1.38629
Appendix F. Using the expression editor 717

localtimeReturns a time value, representing the current time of the computer that runs thedatabase software.
Syntaxlocaltime
Examplelocaltime
Result
16:33:11
localtimestampReturns a datetime value, representing the current timestamp of the computer thatruns the database software.
Syntaxlocaltimestamp
Examplelocaltimestamp
Result
2003-03-03 16:40:15
lowerReturns "string_expression" with all uppercase characters shifted to lowercase.
Syntaxlower ( string_expression )
Examplelower ( ’ABCDEF’ )
Result
abcdef
modReturns the remainder (modulus) of "integer_expression1" divided by"integer_expression2". "Integer_expression2" must not be zero or an exceptioncondition is raised.
Syntaxmod ( integer_expression1, integer_expression2 )
Examplemod ( 20 , 3 )
Result
718 IBM Cognos Report Studio Version 10.2.1: User Guide

2
nullifReturns null if "expression1" equals "expression2", otherwise returns "expression1".
Syntaxnullif ( expression1, expression2 )
octet_lengthReturns the number of bytes in "string_expression".
Syntaxoctet_length ( string_expression )
Example 1octet_length ( ’ABCDEF’ )
Result
6
Example 2octet_length ( ’’ )
Result
0
positionReturns the integer value representing the starting position of "string_expression1"in "string_expression2" or 0 when the "string_expression1" is not found.
Syntaxposition ( string_expression1 , string_expression2 )
Example 1position ( ’C’ , ’ABCDEF’ )
Result
3
Example 2position ( ’H’ , ’ABCDEF’ )
Result
0
powerReturns "numeric_expression1" raised to the power "numeric_expression2". If"numeric_expression1" is negative, then "numeric_expression2" must result in aninteger value.
Appendix F. Using the expression editor 719

Syntaxpower ( numeric_expression1 , numeric_expression2 )
Examplepower ( 3 , 2 )
Result
9
_roundReturns "numeric_expression" rounded to "integer_expression" places to the rightof the decimal point. Notes: "integer_expression" must be a non-negative integer.Rounding takes place before data formatting is applied.
Syntax_round ( numeric_expression , integer_expression )
Example_round ( 1220.42369, 2 )
Result
1220.42
rowThe row constructor represents a collection of values organized as a row of data. Itcan be used in conditional expressions (i.e. IF-THEN-ELSE) and filter expressions(i.e. IN clause).
Syntaxrow ( expression_list )
Example 1if ( row([RetailerName],[OrderMethodCode]) = row(’ActiForme’,4) )
then (’A’)else (’B’)
Result
Returns 'A' if the Retailer Name is 'ActiForme' and the order method code is 4.Otherwise, the value 'B' is returned.
Example 2case row([RetailerName],[OrderMethodCode])
when row(’AdvancedClimbing Ltd’,3) then 1
when row(’ActiForme’,5) then 2else 3
end
Result
720 IBM Cognos Report Studio Version 10.2.1: User Guide

Returns 1 if the Retailer Name is 'Advanced Climbing Ltd' and the order methodcode is 3. Returns 2 if the Retailer Name is 'ActiForme' and the order method codeis 5. Otherwise, the value 3 is returned.
Example 3row ( [OrderMethodCode], [Year] ) in ( [Query].[OMC], [Query].[YR] )
Result
The returned data is filtered on the following two conditions: 1)[OrderMethodCode] in ([Query].[OMC]) 2) [Year] in ([Query].[YR])
sqrtReturns the square root of "numeric_expression". "Numeric_expression" must benon-negative.
Syntaxsqrt ( numeric_expression )
Examplesqrt ( 9 )
Result
3
substringReturns the substring of "string_expression" that starts at position"integer_expression1" for "integer_expression2" characters or to the end of"string_expression" if "integer_expression2" is omitted. The first character in"string_expression" is at position 1.
Syntaxsubstring ( string_expression , integer_expression1 [ ,integer_expression2 ] )
Examplesubstring ( ’abcdefg’ , 3 , 2 )
Result
cd
trimReturns "string_expression" trimmed of leading and trailing blanks or trimmed of acertain character specified in "match_character_expression". "Both" is implicit whenthe first argument is not stated and blank is implicit when the second argument isnot stated.
Syntaxtrim ( [ [ trailing|leading|both ] [ match_character_expression ] , ]string_expression )
Example 1
Appendix F. Using the expression editor 721
trim ( trailing ’A’ , ’ABCDEFA’ )
Result
ABCDEF
Example 2trim ( both , ’ ABCDEF ’ )
Result
ABCDEF
upperReturns "string_expression" with all lowercase characters converted to uppercase.
Syntaxupper ( string_expression )
Exampleupper ( ’abcdef’ )
Result
ABCDEF
width-bucketFor a given expression, this function returns the bucket number into which thevalue of this expression would fall after being evaluated.
Syntaxwidth-bucket ( numeric_expression , min_value , max_value ,num_of_buckets )
Examplewidth-bucket ( Quantity , 100 , 5000 , 10 )
Result
For each row, returns the bucket number (from 0 to 11) for the current Quantityvalue.
Result data
Quantity width-bucket (Quantity)50 0450 11400 33600 84900 105000 11
722 IBM Cognos Report Studio Version 10.2.1: User Guide

Trigonometric functions
arccosThis inverse trigonometric function returns the arc cosine of the argument, wherethe argument is in the range of -1 to 1 and the result is a value expressed inradians.
Syntaxarccos ( numeric_expression )
Examplearccos ( -1 )
Result
3.1415
arcsinThis inverse trigonometric function returns the arc sine of the argument, where theargument is in the range of -1 to 1 and the result is a value expressed in radians.
Syntaxarcsin ( numeric_expression )
Examplearcsin ( 0 )
Result
3.1415
arctanThis inverse trigonometric function returns the arc tangent of the argument, wherethe argument is in the range of -1 to 1 and the result is a value expressed inradians.
Syntaxarctan ( numeric_expression )
Examplearctan ( 0 )
Result
3.1415
cosThis trigonometric function returns the cosine of the argument, where theargument is an angle expressed in radians.
Syntaxcos ( numeric_expression )
Examplecos ( 0.3333 * 3.1415 )
Appendix F. Using the expression editor 723

Result
0.5
coshypThis trigonometric function returns the hyperbolic cosine of the argument, wherethe argument is an angle expressed in radians.
Syntaxcoshyp ( numeric_expression )
Examplecoshyp ( 0 )
Result
1
sinThis trigonometric function returns the sine of the argument, where the argumentis an angle expressed in radians.
Syntaxsin ( numeric_expression )
Examplesin ( 0.1667 * 3.1415 )
Result
0.5
sinhypThis trigonometric function returns the hyperbolic sine of the argument, where theargument is an angle expressed in radians.
Syntaxsinhyp ( numeric_expression )
Examplesinhyp ( 0 )
Result
0
tanThis trigonometric function returns the tangent of the argument, where theargument is an angle expressed in radians.
Syntaxtan ( numeric_expression )
Exampletan ( 0.25 * 3.1415 )
724 IBM Cognos Report Studio Version 10.2.1: User Guide
Result
1
tanhypThis trigonometric function returns the hyperbolic tangent of the argument, wherethe argument is an angle expressed in radians.
Syntaxtanhyp ( numeric_expression )
Exampletanhyp ( 0 )
Result
0
Dimensional Functions
ancestorReturns the ancestor of "member" at "level" or at "integer" number of levels above"member". Note: The result is not guaranteed to be consistent when there is morethan one such ancestor.
Syntaxancestor ( member, level|integer )
Example 1ancestor ( [TrailChef Water Bag] , 1 )
Result
Cooking Gear
Example 2ancestor ( [TrailChef Water Bag] , 2 )
Result
Camping Equipment
Example 3ancestor ( [TrailChef Water Bag] , [great_outdoors_company].[Products].[Products].[Product type] )
Result
Cooking Gear
ancestorsReturns all the ancestors of "member" at "level" or "index" distance above themember. (Most data sources support only one ancestor at a specified level. If thedata source supports more than one ancestor, the result is a member set.)
Appendix F. Using the expression editor 725

Syntaxancestors ( member , level|index )
Example 1ancestors ( [TrailChef Water Bag] , 1 )
Result
Cooking Gear
Example 2ancestors ( [TrailChef Water Bag] , 2 )
Result
Camping Equipment
Example 3ancestors ( [TrailChef Water Bag] , [great_outdoors_company].[Products].[Products].[Product type] )
Result
Cooking Gear
bottomCountSorts a set according to the value of "numeric_expression" evaluated at each of themembers of "set_expression" and returns the bottom "index_expression" members.
SyntaxbottomCount ( set_expression , index_expression , numeric_expression )
ExamplebottomCount ( [great_outdoors_company].[Products].[Products].[Productline] , 2 , [Revenue] )
Result
Returns the bottom two members of the set sorted by revenue.
Result data
Product line RevenueOutdoor Protection $3,171,114.92Mountaineering Equipment $20,891,350.60
bottomPercentSorts the set specified in "set_expression" in ascending order and returns thebottommost elements from the sorted set whose cumulative percentage of the totalis greater than or equal to "percentage".
SyntaxbottomPercent ( set_expression , percentage , numeric_expression )
726 IBM Cognos Report Studio Version 10.2.1: User Guide

ExamplebottomPercent ( set ( [Camping Equipment] , [Golf Equipment] ,[Mountaineering Equipment] ) , 40 , [2006] )
Result
For the set of Camping Equipment, Golf Equipment, and MountaineeringEquipment, returns the members with the smallest Gross profit whose total for theyear 2006 is at least 40% of the overall total.
bottomSumSorts the set specified in "set_expression" in ascending order and returns thebottommost elements from the sorted set whose cumulative total is greater than orequal to "value".
SyntaxbottomSum ( set_expression , value , numeric_expression )
ExamplebottomSum ( members ( [great_outdoors_company].[Products].[Products].[Product line] ) , 6000000 , tuple ( [2006] ,[great_outdoors_company].[Measures].[Gross profit] ) )
Result
For the Product line members, returns the members with the smallest Gross profitwhose total for the year 2006 is at least $6,000,000.
captionReturns the caption values of "level", "member", or "set_expression". The caption isthe string display name for an element and does not necessarily match the uniqueidentifier used to generate the business key or member unique name (MUN) forthe element. The caption is not necessarily unique; for example, the caption for amonth may return the month name without further year details to make the valueunique.
Syntaxcaption ( level|member|set_expression )
Example 1caption ( [TrailChef Water Bag] )
Result
TrailChef Water Bag
Example 2caption ( [great_outdoors_company].[Products].[Products].[Productline] )
Result
Returns the caption values of the Product line set.
Result data
Appendix F. Using the expression editor 727

Camping EquipmentMountaineering EquipmentPersonal AccessoriesOutdoor ProtectionGolf Equipment
childrenReturns the set of children of a specified member.
Syntaxchildren ( member )
Examplechildren ( [Camping Equipment] )
Result
Returns the set of children for Camping Equipment.
Result dataCooking GearTentsSleeping BagsPacksLanterns
closingPeriodReturns the last sibling member among the descendants of a member at "level".This function is typically used with a time dimension.
SyntaxclosingPeriod ( level [ , member ] )
Example 1closingPeriod ( [great_outdoors_company].[Years].[Years].[Month] )
Result
2006/Dec
Example 2closingPeriod ( [great_outdoors_company].[Years].[Years].[Year] )
Result
2006
Example 3closingPeriod ( [great_outdoors_company].[Years].[Years].[Month] ,[2006 Q 4] )
Result
2006/Dec
728 IBM Cognos Report Studio Version 10.2.1: User Guide

cousinReturns the child member of "member2" with the same relative position as"member1" to its parent. This function appears in the Revenue by GO Subsidiary2005 sample report in the GO Data Warehouse (analysis) package.
Syntaxcousin ( member1 , member2 )
Example 1cousin ( [Irons] , [Camping Equipment] )
Result
Cooking Gear
Example 2cousin ( [Putters] , [Camping Equipment] )
Result
Sleeping Bags
completeTupleIdentifies a cell location (intersection) based on the specified members, each ofwhich must be from a different dimension. However, completeTuple () implicitlyincludes the default member from all dimensions not otherwise specified in thearguments, rather than the current member. CompleteTuple will use the defaultmeasure rather than the currentMeasure in the query if the measure is not definedin the completetuple function. This function appears in the Planned Headcountsample report in the GO Data Warehouse (analysis) package.
SyntaxcompleteTuple ( member { , member } )
Example 1completeTuple ( [Mountaineering Equipment] , [Fax] )
Result
The completeTuple does not pick up the currentMember by default as the tuplefunction does. The values in the first column are identical across each year becausethe default member of the Years dimension, the root member, is used rather thanthe current member. Likewise, the first column displays Revenue rather thanQuantity Sold because the Revenue measure is the default from the Measuresdimension. CompleteTuple will use the default measure rather than thecurrentMeasure in the query if the measure is not defined in the completetuplefunction.
Result data
Quantity Sold Mountaineering Sales by Fax2004 $1,220,329.382005 $1,220,329.382006 $1,220,329.38
Appendix F. Using the expression editor 729

Example 2completeTuple ( [Mountaineering Equipment] , [Fax] , [Quantity sold] ,currentMember ( [great_outdoors_company].[Years].[Years] ) )
Result
The completeTuple function uses the currentMember of the Years dimension andthe Quantity sold measure.
Result data
Quantity Sold Mountaineering Sales by Fax2004 02005 8,7462006 7,860
currentMemberReturns the current member of the hierarchy during an iteration. If "hierarchy" isnot present in the context in which the expression is being evaluated, its defaultmember is assumed. This function appears in the Rolling and Moving Averagesinteractive sample report.
SyntaxcurrentMember ( hierarchy )
defaultMemberReturns the default member of "hierarchy".
SyntaxdefaultMember ( hierarchy )
Example 1defaultMember ( [great_outdoors_company].[Products].[Products] )
Result
Products
Example 2defaultMember ( [great_outdoors_company].[Years].[Years] )
Result
Year
Example 3defaultMember ( hierarchy ( [great_outdoors_company].[Measures].[Quantity sold] ) )
Result
Revenue
730 IBM Cognos Report Studio Version 10.2.1: User Guide

descendantsReturns the set of descendants of "member" or "set_expression" at "level" (qualifiedname) or "distance" (integer 0..n) from the root. Multiple options may be specified(separated by a space) to determine which members are returned. self: Only themembers at the specified level are included in the final set (this is the defaultbehaviour in the absence of any options). before: If there are any intermediatelevels between the member's level and the one specified, members from thoselevels are included. If the level specified is the same as the member upon whichthe function is applied, the member is included in the final set. beforewithmember:If there are any intermediate levels between the member's level and the onespecified, members from those levels are included. The member upon which thefunction is applied is also included in the final set. after: If other levels exist afterthe specified level, members from those levels are included in the final set. Thisfunction appears in the Sales Commissions for Central Europe sample report in theGO Data Warehouse (analysis) package.
Syntaxdescendants ( member|set_expression , level|distance [ ,{ self|before|beforewithmember|after } ] )
Example 1descendants ( [great_outdoors_company].[Products].[Products].[Products] , [great_outdoors_company].[Products].[Products].[Producttype] )
Result
Returns the set of descendants of the Products set at the Product type level. Note:[great_outdoors_company].[Products].[Products].[Products] is the root member ofthe Products hierarchy.
Result dataCooking GearSleeping BagsPacksTents...EyewearKnivesWatches
Example 2descendants ( [great_outdoors_company].[Products].[Products].[Products] , 1 )
Result
Returns the set of descendants of the Products set at the first level.
Result dataCamping EquipmentGolf EquipmentMountaineering EquipmentOutdoor ProtectionPersonal Accessories
Example 3
Appendix F. Using the expression editor 731

descendants ( [great_outdoors_company].[Products].[Products].[Products] , 3 , before )
Result
Returns the descendants of the Products set before the third level.
Result dataCamping EquipmentCooking GearSleeping BagsPacksTents...EyewearKnivesWatches
Example 4descendants ( [great_outdoors_company].[Products].[Products].[Products] , 2 , self before )
Result
Returns the set of descendants of the Products set before and including the secondlevel.
Result dataCamping EquipmentCooking GearSleeping BagsPacksTents...EyewearKnivesWatches
exceptReturns the members of "set_expression1" that are not also in "set_expression2".Duplicates are retained only if the optional keyword "all" is supplied as the thirdargument.
Syntaxexcept ( set_expression1 , set_expression2 [ , all ] )
Exampleexcept ( set ( [Camping Equipment] , [Mountaineering Equipment] ) ,set ( [Camping Equipment] , [Golf Equipment] ) )
Result
Mountaineering Equipment
732 IBM Cognos Report Studio Version 10.2.1: User Guide

filterReturns the set resulting from filtering a specified set based on the Booleancondition. Each member is included in the result if and only if the correspondingvalue of "Boolean_expression" is true.
Syntaxfilter ( set_expression , Boolean_expression )
Examplefilter ( [Product line] , [Gross margin] > .30 )
Result
Mountaineering Equipment
firstChildReturns the first child of "member".
SyntaxfirstChild ( member )
Example 1firstChild ( [By Product Lines] )
Result
Camping Equipment
Example 2firstChild ( [Camping Equipment] )
Result
Cooking Gear
firstSiblingReturns the first child of the parent of "member".
SyntaxfirstSibling ( member )
Example 1firstSibling ( [Outdoor Protection] )
Result
Camping Equipment
Example 2firstSibling ( [Camping Equipment] )
Result
Appendix F. Using the expression editor 733

Camping Equipment
_formatAssociates a format with the expression. The format_keyword can bePERCENTAGE_0, PERCENTAGE_1, or PERCENTAGE_2. PERCENTAGE_1 returnsa percentage with one digit to the right of the decimal point, PERCENTAGE_2returns a percentage with two digits to the right of the decimal point, andPERCENTAGE_3 returns a percentage value out of one with three digits to theright of the decimal point (for example, 0.965).
Syntax_format ( expression , format_keyword )
Example_format ( [Unit Sale Price] / [Unit Price] , PERCENTAGE_2 )
Result
75.12%
emptySetReturns an empty member set for "hierarchy". This is most often used as aplaceholder during development or with dynamic report design (either with theIBM® Cognos® Software Development Kit or via report design). By creating a dataitem that contains the emptyset function, it is possible to build complexexpressions that can later be revised by redefining the emptyset data item.
SyntaxemptySet ( hierarchy )
Exampleexcept ( [great_outdoors_company].[Products].[Products].[Productline] , emptySet ( [great_outdoors_company].[Products].[Products] ) )
Result
Returns the Product line set and an empty set for the Products set.
Result dataCamping EquipmentGolf EquipmentMountaineering EquipmentOutdoor ProtectionPersonal Accessories
generateEvaluates "set_expression2" for each member of "set_expression1" and joins theresulting sets by union. The result retains duplicates only when the optionalkeyword "all" is supplied as the third argument.
Syntaxgenerate ( set_expression1 , set_expression2 [ , all ] )
Example
734 IBM Cognos Report Studio Version 10.2.1: User Guide

generate ( [Product line] , topCount ( descendants ( currentMember ([great_outdoors_company].[Products].[Products] ) ,[great_outdoors_company].[Products].[Products].[Product name] ) , 2 ,[Revenue] ) )
Result
Returns the top two products by revenue for each product line.
headReturns the first "index_expression" elements of "set_expression". The default for"index_expression" is 1.
Syntaxhead ( set_expression [ , index_expression ] )
Example 1head ( members ( [great_outdoors_company].[Products].[Products].[Product line] ) )
Result
Camping Equipment
Example 2head ( members ( [great_outdoors_company].[Products].[Products].[Product line] ) , 2 )
Result
Returns the top two members of the Product line set.
Result dataCamping EquipmentMountaineering Equipment
hierarchizeOrders the members of "set_expression" in a hierarchy. Members in a level aresorted in their natural order. This is the default ordering of the members along adimension when no other sort conditions are specified.
Syntaxhierarchize ( set_expression )
Examplehierarchize ( set ( [Golf Equipment] , [Mountaineering Equipment] ,[Camping Equipment] ) )
Result
Returns Camping Equipment, Golf Equipment, Mountaineering Equipment.
Appendix F. Using the expression editor 735

hierarchyReturns the hierarchy that contains "level", "member", or "set_expression".
Syntaxhierarchy ( level|member|set_expression )
Example 1hierarchy ( [Cooking Gear] )
Result
Returns every member in the hierarchy that contains Cooking Gear.
Result dataProductsCamping EquipmentCooking GearTrailChef Water BagTrailChef Canteen...Mountain Man ExtremeMountain Man Deluxe
Example 2hierarchy ( [great_outdoors_company].[Products].[Products].[Productline] )
Result
Returns every member in the hierarchy that contains the Product line.
Result dataProductsCamping EquipmentCooking GearTrailChef Water BagTrailChef Canteen...Mountain Man ExtremeMountain Man Deluxe
itemReturns a member from the "index" location within "set_expression". The indexinto the set is zero based.
Syntaxitem ( set_expression , index )
Exampleitem ( children ( [Camping Equipment] ) , 2 )
Result
Sleeping Bags
736 IBM Cognos Report Studio Version 10.2.1: User Guide

intersectReturns the intersection of "set_expression1" and "set_expression2". The resultretains duplicates only when the optional keyword "all" is supplied as the thirdargument.
Syntaxintersect ( set_expression1 , set_expression2 [ , all ] )
Exampleintersect ( set ( [Camping Equipment] , [Mountaineering Equipment] ) ,set ( [Camping Equipment] , [Outdoor Protection] , ) , all )
Result
Camping Equipment
lagReturns the sibling member that is "index_expression" number of positions prior to"member".
Syntaxlag ( member , index_expression )
Example 1lag ( [Tents] , 1 )
Result
Cooking Gear
Example 2lag ( [Tents] , -2 )
Result
Packs
lastChildReturns the last child of a specified member.
SyntaxlastChild ( member )
Example 1lastChild ( Cooking Gear )
Result
TrailChef Utensils
Example 2lastChild ( [By Product Line] )
Appendix F. Using the expression editor 737

Result
Golf Equipment
lastPeriodsReturns the set of members from the same level that ends with "member". Thenumber of members returned is the absolute value of "integer_expression". If"integer_expression" is negative, members following and including the specifiedmember are returned. Typically used with a time dimension. This function appearsin the Rolling and Moving Averages interactive sample report.
SyntaxlastPeriods ( integer_expression , member )
Example 1lastPeriods ( 2 , [2006 Q 4] )
Result
Returns the last two members from the level that ends with 2006 Q 4.
Result data2006 Q 32006 Q 4
Example 2lastPeriods ( -3 , [2006 Q 4] )
Result
Returns the last three members from the level that starts with 2006 Q 4.
Result data2006 Q 42007 Q 12007 Q 2
lastSiblingReturns the last child of the parent of a specified member.
SyntaxlastSibling ( member )
ExamplelastSibling ( [Camping Equipment] )
Result
Golf Equipment
leadReturns the sibling member that is "index_expression" number of positions after"member". If "index_expression" is negative, returns the sibling member that is"index_expression" number of positions before "member".
738 IBM Cognos Report Studio Version 10.2.1: User Guide

Syntaxlead ( member , index_expression )
Example 1lead ( [Outdoor Protection] , 1 )
Result
Personal Accessories
Example 2lead ( [Outdoor Protection] , -2 )
Result
Golf Equipment
levelReturns the level of "member".
Syntaxlevel ( member )
Examplelevel ( [Golf Equipment] )
Result
Returns the members on the Golf Equipment level.
Result dataCamping EquipmentMountaineering EquipmentPersonal AccessoriesOutdoor ProtectionGolf Equipment
levelsReturns the level in "hierarchy" whose distance from the root is specified by"index".
Syntaxlevels ( hierarchy , index )
Example 1levels ( [great_outdoors_company].[Products].[Products] , 2 )
Result
Returns the members two levels from the root Products hierarchy.
Result data
Appendix F. Using the expression editor 739

Cooking GearSleeping BagsPacksTents...IronsPuttersWoodsGolf Accessories
Example 2levels ( [great_outdoors_company].[Products].[Products] , 1 )
Result
Returns the members one level from the root Products hierarchy.
Result dataCamping EquipmentMountaineering EquipmentPersonal AccessoriesOutdoor ProtectionGolf Equipment
linkMemberReturns the corresponding member in "level" or "hierarchy" (of the samedimension). For level-based hierarchies, a level must be specified as the secondargument, and for parent-child hierarchies, a hierarchy must be specified. Anexception is thrown when the second parameter does not resolve to a hierarchy ofthe member's dimension. Note that calculated members are not supported as thefirst argument.
SyntaxlinkMember ( member , level|hierarchy )
membersReturns the set of members in "hierarchy" or "level". In the case of a hierarchy, theorder of the members in the result is not guaranteed. If a predictable order isrequired, an explicit ordering function (such as hierarchize) must be used.
Syntaxmembers ( hierarchy|level )
Example 1members ( [great_outdoors_company].[Years].[Years] )
Result
Returns the members in Years.
Example 2members ( [great_outdoors_company].[Products].[Products].[Productline] )
Result
740 IBM Cognos Report Studio Version 10.2.1: User Guide

Returns the members in Product line.
nextMemberReturns the next member in the "member" level.
SyntaxnextMember ( member )
ExamplenextMember ( [Outdoor Protection] )
Result
Golf Equipment
openingPeriodReturns the first sibling member among the descendants of a member at "level".This function is typically used with a time dimension.
SyntaxopeningPeriod ( level [ , member ] )
Example 1openingPeriod ( [great_outdoors_company].[Years].[Years].[Month] )
Result
2004/Jan
Example 2openingPeriod ( [great_outdoors_company].[Years].[Years].[Year] )
Result
2004
Example 3openingPeriod ( [great_outdoors_company].[Years].[Years].[Month] ,[2006 Q 4] )
Result
2006/Oct
orderArranges the members of "set_expression" according to their "value_expression"and the third parameter. ASC and DESC arrange members in ascending ordescending order, respectively, according to their position in the set hierarchy. Thenthe children of each member are arranged according to "value_expression". BASCand BDESC arrange members in the set without regard to the hierarchy. In theabsence of an explicit specification, ASC is the default.
Syntax
Appendix F. Using the expression editor 741

order ( set_expression , value_expression [ , ASC|DESC|BASC|BDESC ] )
Example 1order ( members ( [Great Outdoors Company].[Product].[Product].[Product type] ) , [Quantity sold] , BASC )
Result
Returns the quantity sold for each product type in no particular order.
Result data
Product Line QuantityWoods 13,924Irons 14,244Safety 22,332... ...Sunscreen 215,432Insect Repellents 270,074Lanterns 345,096
Example 2order ( members ( [Great Outdoors Company].[Product].[Product].[Product type] ) , [Quantity sold] , ASC )
Result
Returns the quantity sold for each product type in ascending order.
Result data
Product Line QuantityWoods 13,924Irons 14,244Putters 23,244... ...Tents 130,664Cooking Gear 198,676Lanterns 345,096
ordinalReturns the zero-based ordinal value (distance from the root level) of "level".
Syntaxordinal ( level )
Example 1ordinal ( [great_outdoors_company].[Products].[Products].[Productline] )
Result
1
742 IBM Cognos Report Studio Version 10.2.1: User Guide

Example 2ordinal ( [great_outdoors_company].[Products].[Products].[Producttype] )
Result
2
parallelPeriodReturns a member from a prior period in the same relative position as "member".This function is similar to the cousin function, but is more closely related to timeseries. It takes the ancestor of "member" at "level" (called "ancestor") and thesibling of "ancestor" that lags by "integer_expression" positions, and returns theparallel period of "member" among the descendants of that sibling. Whenunspecified, "integer_expression" defaults to 1 and "member" defaults to thecurrent member.
SyntaxparallelPeriod ( level [ , integer_expression [ , member ] ] )
Example 1parallelPeriod ( [great_outdoors_company].[Years].[Years].[Quarter] ,-1 , [2006/Aug] )
Result
2006/Nov
Example 2parallelPeriod ( [great_outdoors_company].[Years].[Years].[Quarter] ,1 , [2006/Aug] )
Result
2006/May
Example 3parallelPeriod ( [great_outdoors_company].[Years].[Years].[Year] , 2 ,[2006/Aug] )
Result
2004/Aug
parentReturns the member that is the parent of "member" or "measure".
Syntaxparent ( member|measure )
Exampleparent ( [Cooking Gear] )
Result
Appendix F. Using the expression editor 743

Camping Equipment
periodsToDateReturns a set of sibling members from the same level as "member", as constrainedby "level". It locates the ancestor of "member" at "level" and returns that ancestor'sdescendants at the same level as "member" (up to and including "member").Typically used with a time dimension. This function appears in the Rolling andMoving Averages interactive sample report.
SyntaxperiodsToDate ( level , member )
ExampleperiodsToDate ( [great_outdoors_company].[Years].[Years].[Year] ,[2004/Mar] )
Result
Returns values for [2004/Jan], [2004/Feb], [2004/Mar]
prevMemberReturns the member that immediately precedes "member" in the same level. Thisfunction appears in the Sales Growth Year Over Year sample report in the GO DataWarehouse (analysis) package.
SyntaxprevMember ( member )
Example 1prevMember ( [Outdoor Protection] )
Result
Personal Accessories
Example 2prevMember ( [2005] )
Result
2004
memberDefines a member based on "value_expression" in "hierarchy". "String1" identifiesthe member created by this function. It must be unique in the query and differentfrom any other member in the same hierarchy. "String2" is the caption of themember; if it is absent, the caption is empty. To ensure predictable results, it isrecommended that you supply the "hierarchy". Note: All calculations used asgrouping items whose sibling items are other calculations or member sets shouldbe explicitly assigned to a hierarchy using this function. The results are notpredictable otherwise. The only exception is where the calculation involves onlymembers of the same hierarchy as the siblings. In this case, the calculation isassumed to belong to that hierarchy.
744 IBM Cognos Report Studio Version 10.2.1: User Guide

Syntaxmember ( value_expression [ , string1 [ , string2 [ ,hierarchy ] ] ] )
Examplemember ( total ( currentMeasure within set filter ([great_outdoors_company].[Products].[Products].[Product name] ,caption ( [great_outdoors_company].[Products].[Products].[Productname] ) starts with ’B’ ) ) , ’BProducts’ , ’B Products’ ,[great_outdoors_company].[Products].[Products] )
Result
Returns the quantity sold and revenue for all products that start with the letter B.
nestedSetThis function is intended for use only by Analysis Studio
SyntaxnestedSet ( set_expression1 , set_expression2 )
setReturns the list of members defined in the expression. The members must belongto the same hierarchy.
Syntaxset ( member { , member } )
Exampleset ( [Golf Equipment] , [Irons] , [TrailChef Cup] )
Result
Returns Golf Equipment, Irons, and TrailChef Cup.
siblingsReturns the children of the parent of the specified member.
Syntaxsiblings ( member )
Examplesiblings ( [Golf Equipment] )
Result
Returns the siblings of Golf Equipment.
Result dataCamping EquipmentGolf EquipmentMountaineering EquipmentOutdoor ProtectionPersonal Accessories
Appendix F. Using the expression editor 745

tailReturns the last "index_expression" elements of "set expression". The default for"index_expression" is 1.
Syntaxtail ( set_expression [ , index_expression ] )
Example 1tail (members ( [great_outdoors_company].[Products].[Products].[Product line] ) )
Result
Returns the last member of the Product line set.
Result dataPersonal Accessories
Example 2tail ( members ( [great_outdoors_company].[Products].[Products].[Product line] ) , 2 )
Result
Returns the last two members of the Product line set.
Result dataOutdoor ProtectionPersonal Accessories
topCountSorts a set according to the values of "numeric_expression" evaluated at each of themembers of "set_expression" and returns the top "index_expression" members.
SyntaxtopCount ( set_expression , index_expression , numeric_expression )
ExampletopCount ( [great_outdoors_company].[Products].[Products].[Productline] , 2 , [Revenue] )
Result
Returns the top two revenues for the Product line set.
Result data
Product line RevenueCamping Equipment $89,713,990.92Personal Accessories $31,894,465.86
746 IBM Cognos Report Studio Version 10.2.1: User Guide

topPercentSorts the set specified in "set_expression" in descending order and returns thetopmost elements from the sorted set whose cumulative percentage of the total isgreater than or equal to "percentage".
SyntaxtopPercent ( set_expression , percentage , numeric_expression2 )
ExampletopPercent ( set ( [Camping Equipment] , [Golf Equipment] ,[Mountaineering Equipment] ) , 40 , [2006] )
Result
For the set of Camping Equipment, Golf Equipment, and MountaineeringEquipment, returns the members with the largest Gross profit whose total for theyear 2006 is at least 40% of the overall total.
topSumSorts the set specified in "set_expression" in descending order and returns thetopmost elements from the sorted set whose cumulative total is greater than orequal to "value".
SyntaxtopSum ( set_expression , value , numeric_expression2 )
ExampletopSum ( children ( [Products] ) , 16000000 , tuple ( [2006] ,[great_outdoors_company].[Measures].[Gross profit] ) )
Result
For the Product line members, returns the members with the largest Gross profitwhose total for the year 2006 is at least $6,000,000.
tupleIdentifies a cell location (intersection) based on the specified members, each ofwhich must be from a different dimension. This function implicitly includes thecurrent member from all dimensions that are not otherwise specified in thearguments. The current member of any dimension not specified in the evaluatingcontext is assumed to be the default member of that dimension. The value of thiscell can be obtained with the "value" function.
Syntaxtuple ( member { , member } )
Exampletuple ( [Mountaineering Equipment] , [Fax] )
Result
Returns the Mountaineering Equipment sales by fax.
Appendix F. Using the expression editor 747

unionReturns data for "set_expression1" and "set_expression2". The result retainsduplicates only when the optional keyword "all" is supplied as the third argument.
Syntaxunion ( set_expression1 , set_expression2 [ , all ] )
Example 1union ( set ( [Camping Equipment] , [Golf Equipment] ) , set ( [GolfEquipment] , [Mountaineering Equipment] ) )
Result
Returns data for both sets as one new set, showing the Golf Equipment columnonly once.
Example 2union ( set ( [Camping Equipment] , [Golf Equipment] ) , set ( [GolfEquipment] , [Mountaineering Equipment] ) , all )
Result
Returns data for both sets as one new set, showing the Golf Equipment columntwice.
roleValueReturns the value of the attribute that is associated with the role whose name isspecified by "string" within the specified context. "Member" or "set_expression" isoptional only in a number of limited circumstances, where it can be derived fromanother context. Applications can be made portable across different data sourcesand models by accessing attributes by role rather than by query item ID. Fordimensionally-modeled relational (DMR) data sources, assignment of roles is themodeler's responsibility. Intrinsic roles that are defined for members of all datasource types include: '_businessKey', '_memberCaption', '_memberDescription','_memberUniqueName'. Additional roles can be defined in Framework Managerfor each level in a hierarchy. For example, a Product type level may have anattribute column called "Type Shipping Container", and the Product level may havea "Product Shipping Container" attribute. Each of these could be assigned a customrole in Framework Manager called "Container". The property could then bereferenced independently of the actual column name by using the roleValuefunction.
SyntaxroleValue ( string [ , member|set_expression ] )
Example 1roleValue ( ’_memberCaption’ , [Sales].[Product].[Product].[Productline] -> [all].[1] )
Result
Camping Equipment
Example 2
748 IBM Cognos Report Studio Version 10.2.1: User Guide

roleValue ( ’_businessKey’ , [great_outdoors_company].[Years].[Years].[Year] )
Result
Returns the value of the attribute that is associated with the business key role.
Result data("2004-01-01","2004-12-31")("2005-01-01","2005-12-31")("2006-01-01","2006-12-31")
Example 3roleValue ( ’_memberUniqueName’ , [great_outdoors_company].[Years].[Years].[Year] )
Result
Returns the value of the attribute that is associated with the MUN role.
Result data[great_outdoors_company].[Years].[Years].[Year] ->:[PC].[Years (Root)].[20040101-20041231][great_outdoors_company].[Years].[Years].[Year] ->:[PC].[Years (Root)].[20050101-20051231][great_outdoors_company].[Years].[Years].[Year] ->:[PC].[Years (Root)].[20060101-20061231]
rootMemberReturns the root member of a single-root hierarchy. This function appears in thePromotion Success sample report in the GO Data Warehouse (analysis) package.
SyntaxrootMember ( hierarchy )
rootMembersReturns the root members of a hierarchy.
SyntaxrootMembers ( hierarchy )
ExamplerootMembers ( [great_outdoors_company].[Years].[Years] )
Result
By Time
subsetReturns a subset of members in "set_expression" starting at "index_expression1"from the beginning. If the count "index_expression2" is specified, that manymembers are returned (if available). Otherwise, all remaining members arereturned.
Syntax
Appendix F. Using the expression editor 749

subset ( set_expression, index_expression1 [ , index_expression2 ] )
Example 1subset ( members ( [great_outdoors_company].[Products].[Products].[Product line] ) , 2 )
Result
Returns the members of the Product line set starting at the second member.
Result dataMountaineering EquipmentOutdoor ProtectionPersonal Accessories
Example 2subset ( members ( [great_outdoors_company].[Products].[Products].[Product line] ) , 2 , 2 )
Result
Returns two members of the Product line set starting at the second member.
Result dataMountaineering EquipmentOutdoor Protection
uniqueRemoves all duplicates from "set_expression". The remaining members retain theiroriginal order.
Syntaxunique ( set_expression )
valueReturns the value of the cell identified by "tuple". Note that the default member ofthe Measures dimension is the Default Measure.
Syntaxvalue ( tuple )
Example 1value ( tuple ( [great_outdoors_company].[Years].[Years].[Year]->:[PC].[Years (Root)].[20040101-20041231] , [great_outdoors_company].[Measures].[Revenue] ) )
Result
$34,750,563.50
Example 2value ( tuple ( [2004] , [Camping Equipment] , [Revenue] ) )
Result
750 IBM Cognos Report Studio Version 10.2.1: User Guide

$20,471,328.88
Report Functions
TodayReturns the current system date.
SyntaxToday ()
NowReturns the current system time.
SyntaxNow ()
AsOfDateReturns the date value of the AsOfDate expression, if it is defined. Otherwise,AsOfDate returns the report execution date.
SyntaxAsOfDate ()
AsOfTimeReturns the time value of the AsOfTime expression, if it is defined. Otherwise,AsOfTime returns the report execution time.
SyntaxAsOfTime ()
ReportDateReturns the report execution date and time.
SyntaxReportDate ()
ReportNameReturns the report name. This function works only when the report is run fromIBM® Cognos® Connection.
SyntaxReportName ()
ReportPathReturns the report path. This function works only when the report is run fromIBM® Cognos® Connection.
SyntaxReportPath ()
Appendix F. Using the expression editor 751

ReportDescriptionReturns the report description. This function works only when the report is runfrom IBM® Cognos® Connection.
SyntaxReportDescription ()
ReportLocaleReturns the run locale.
SyntaxReportLocale ()
GetLocaleReturns the run locale (deprecated).
SyntaxGetLocale ()
LocaleReturns the run locale.
SyntaxLocale ()
ReportProductLocaleReturns the product locale.
SyntaxReportProductLocale ()
ReportAuthorLocaleReturns the author locale.
SyntaxReportAuthorLocale ()
ReportSaveDateReturns the date when the report was last saved.
SyntaxReportSaveDate ()
ReportCreateDateReturns the date when the report was created.
SyntaxReportCreateDate ()
752 IBM Cognos Report Studio Version 10.2.1: User Guide

ReportIDReturns the report ID.
SyntaxReportID ()
ReportOutputReturns the name of the output format, such as CSV, HTML, layoutDataXML,MHT, PDF, rawXML, singleXLS, spreadsheetML, XLS, XML, or XLWA.
SyntaxReportOutput ()
ReportOptionReturns the value of the run option variable identified by "optionName", such asattachmentEncoding, burst, cssURL, email, emailAsAttachment, emailAsURL,emailBody, emailSubject, emailTo, emailToAddress, metadataModel,outputEncapsulation, outputFormat, outputLocale, outputPageDefinition,outputPageOrientation, primaryWaitThreshold, print, printer, printerAddress,prompt, promptFormat, saveAs, saveOutput, secondaryWaitThreshold,verticalElements, or xslURL.
SyntaxReportOption (’optionName’)
ServerNameReturns the name of the web server where the run request originated from. Thevalue may be empty if the request is executed from the scheduler.
SyntaxServerName ()
ServerLocaleReturns the locale of the server that runs the report.
SyntaxServerLocale ()
ModelPathReturns the model path.
SyntaxModelPath ()
BurstKeyReturns the burst key.
SyntaxBurstKey ()
Appendix F. Using the expression editor 753

BurstRecipientsReturns the distribution list of burst recipients.
SyntaxBurstRecipients ()
IsBurstingReturns Boolean 1 (true) when the report will be distributed to the recipient;otherwise, returns Boolean 0 (false).
SyntaxIsBursting (’recipientName’)
ParamNamesReturns all parameter names.
SyntaxParamNames ()
ParamNameReturns the parameter name of "parameterName".
SyntaxParamName (’parameterName’)
ParamDisplayValueReturns a string that is the parameter display value of "parameterName". Thisfunction appears in the Recruitment Report sample report in the GO DataWarehouse (analysis) package.
SyntaxParamDisplayValue (’parameterName’)
ParamValueReturns the parameter value of "parameterName".
SyntaxParamValue (’parameterName’)
ParamCountReturns the parameter count of "parameterName".
SyntaxParamCount (’parameterName’)
RowNumberReturns the current row.
SyntaxRowNumber ()
754 IBM Cognos Report Studio Version 10.2.1: User Guide

PageNumberReturns the current page number.
SyntaxPageNumber ()
PageCountReturns the current page count. This function works only when the report outputis Adobe® PDF or Microsoft® Excel. If you save the report output, this functionworks for all formats.
SyntaxPageCount ()
IsPageCountAvailableReturns Boolean 1 (true) if the page count is available for the current execution ofthe report; otherwise, returns Boolean 0 (false).
SyntaxIsPageCountAvailable ()
HorizontalPageNumberReturns the current horizontal page number.
SyntaxHorizontalPageNumber ()
HorizontalPageCountReturns the current horizontal page count.
SyntaxHorizontalPageCount ()
PageNameReturns the current page name.
SyntaxPageName ()
URLEncodeReturns the URL encoded value of the input text.
SyntaxURLEncode (’text’)
TOCHeadingCountReturns the table of contents heading count for a specified heading level.
SyntaxTOCHeadingCount ( headingLevel )
Appendix F. Using the expression editor 755

IsAccessibleReturns Boolean 1 (true) if the report is run with the accessibility features enabled.Use this function as a variable expression with a conditional block to make yourreports accessible. For example, you can add a list or crosstab equivalent to a chartin reports that are run with accessibility features enabled.
SyntaxIsAccessible()
ColumnNumberReturns the current column number.
SyntaxColumnNumber ()
IsCrosstabRowNodeMemberReturns Boolean 1 (true) if the current node is a crosstab row node member.
SyntaxIsCrosstabRowNodeMember ()
IsCrosstabColumnNodeMemberReturns Boolean 1 (true) if the current node is a crosstab column node member.
SyntaxIsCrosstabColumnNodeMember ()
IsInnerMostCrosstabRowNodeMemberReturns Boolean 1 (true) if the current node is an innermost crosstab row nodemember.
SyntaxIsInnerMostCrosstabRowNodeMember ()
IsInnerMostCrosstabColumnNodeMemberReturns Boolean 1 (true) if the current node is an innermost crosstab column nodemember.
SyntaxIsInnerMostCrosstabColumnNodeMember ()
IsOuterMostCrosstabRowNodeMemberReturns Boolean 1 (true) if the current node is an outermost crosstab row nodemember.
SyntaxIsOuterMostCrosstabRowNodeMember ()
IsOuterMostCrosstabColumnNodeMemberReturns Boolean 1 (true) if the current node is an outermost crosstab column nodemember.
756 IBM Cognos Report Studio Version 10.2.1: User Guide

SyntaxIsOuterMostCrosstabColumnNodeMember ()
IsFirstColumnReturns Boolean 1 (true) if the current column is the first column.
SyntaxIsFirstColumn ()
IsLastColumnReturns Boolean 1 (true) if the current column is the last column.
SyntaxIsLastColumn ()
IsLastInnerMostCrosstabColumnNodeMemberReturns Boolean 1 (true) if the current node is the last innermost crosstab columnnode member.
SyntaxIsLastInnerMostCrosstabColumnNodeMember ()
IsLastInnerMostCrosstabRowNodeMemberReturns Boolean 1 (true) if the current node is the last innermost crosstab rownode member.
SyntaxIsLastInnerMostCrosstabRowNodeMember ()
CubeNameReturns the name of the cube. "Dimension" specifies from which cube to retrievethe metadata.
SyntaxCubeName ( dimension )
CubeDescriptionReturns the description of the cube. "Dimension" specifies from which cube toretrieve the metadata.
SyntaxCubeDescription ( dimension )
CubeCreatedOnReturns the date and time when the cube was created. "Dimension" specifies fromwhich cube to retrieve the metadata. If the dimension source is an IBM® Cognos®
PowerCube (.mdc), the function returns a blank string because the initial creationdate of a PowerCube is not maintained.
SyntaxCubeCreatedOn ( dimension )
Appendix F. Using the expression editor 757

CubeDataUpdatedOnReturns the date time that data in the cube was last updated. "Dimension" specifiesfrom which cube to retrieve the metadata.
SyntaxCubeDataUpdatedOn ( dimension )
CubeSchemaUpdatedOnReturns the date time that the cube schema was last updated. "Dimension"specifies from which cube to retrieve the metadata.
SyntaxCubeSchemaUpdatedOn ( dimension )
CubeIsOptimizedReturns "true" if the cube is optimized. "Dimension" specifies from which cube toretrieve the metadata.
SyntaxCubeIsOptimized ( dimension )
CubeDefaultMeasureReturns the name of the default measure for the cube. "Dimension" specifies fromwhich cube to retrieve the metadata.
SyntaxCubeDefaultMeasure ( dimension )
CubeCurrentPeriodReturns the current period for the cube. "Dimension" specifies from which cube toretrieve the metadata.
SyntaxCubeCurrentPeriod ( dimension )
CellValueReturns the value of the current crosstab cell.
SyntaxCellValue ()
InScopeReturns Boolean 1 (true) when the cell is in the scope of the data items and MUNs;otherwise, returns Boolean 0 (false).
SyntaxInScope ( dataItem , MUN, ... )
758 IBM Cognos Report Studio Version 10.2.1: User Guide
Data Type Casting Functions
_add_daysReturns the datetime resulting from adding "integer_expression" days to"timestamp_expression".
Syntax_add_days ( timestamp_expression , integer_expression )
Example_add_days ( 2007-01-14 00:00:00.000 , 3 )
Result
2007-01-17 00:00:00.000
_add_monthsReturns the datetime resulting from adding "integer_expression" months to"timestamp_expression".
Syntax_add_months ( timestamp_expression , integer_expression )
_add_yearsReturns the datetime resulting from adding "integer_expression" years to"timestamp_expression".
Syntax_add_years ( timestamp_expression , integer_expression )
_ageReturns a number by subtracting "timestamp_expression" from today's date.
Syntax_age ( timestamp_expression )
Example_age ([Query1].[Date]), where [Query1].[Date] is March 2, 2004, andtoday is July 8, 2009
Result
50,406, where 5 is the number of years, 04 is the number of months, and 06 is thenumber of days.
_day_of_weekReturns the day of the week (between 1 and 7) for "timestamp_expression" where"integer_expression" indicates which day of that week is day 1. To determine"integer_expression", choose the day of the week and count from Monday; forexample, if you choose Wednesday, "integer_expression" would be 3 becauseWednesday is the third day from Monday.
Appendix F. Using the expression editor 759

Syntax_day_of_week ( timestamp_expression , integer_expression )
Example_day_of_week ( 2009-01-01 , 7 ), where 7 means that Sunday is thefirst day of the week.
Result
5
_day_of_yearReturns the ordinal for the day of the year in "timestamp_ expression" (1 to 366).Also known as Julian day.
Syntax_day_of_year ( timestamp_expression )
_days_betweenReturns a positive or negative number representing the number of days between"timestamp_expression1" and "timestamp_expression2". If "timestamp_expression1"< "timestamp_expression2", the result will be a negative number.
Syntax_days_between ( timestamp_expression1 , timestamp_expression2 )
_days_to_end_of_monthReturns a number representing the number of days remaining in the monthrepresented by "timestamp_expression".
Syntax_days_to_end_of_month ( timestamp_expression )
_first_of_monthReturns a datetime that is the first day of the month represented by"timestamp_expression".
Syntax_first_of_month ( timestamp_expression )
Example 1_first_of_month ( 2009-05-04 00:00:00.000 )
Result
Returns 2009-05-01 00:00:00.000
Example 2_first_of_month (current_date)
Result
Returns Jul 1, 2009 if the current date is July 30, 2009.
760 IBM Cognos Report Studio Version 10.2.1: User Guide

_last_of_monthReturns a datetime that is the last day of the month represented by"timestamp_expression".
Syntax_last_of_month ( timestamp_expression )
_make_timestampReturns a timestamp constructed from "integer_expression1" (the year),"integer_expression2" (the month), and "integer_expression3" (the day). The timeportion defaults to 00:00:00.000 .
Syntax_make_timestamp ( integer_expression1 , integer_expression2 ,integer_expression3 )
_months_betweenReturns a positive or negative number representing the number of months between"timestamp_expression1" and "timestamp_expression2". If "timestamp_expression1"< "timestamp_expression2", the result will be a negative number.
Syntax_months_between ( timestamp_expression1 , timestamp_expression2 )
_week_of_yearReturns the week number (1-53) of the year for "timestamp_expression". Accordingto the ISO 8601, week 1 of the year is the first week to contain a Thursday, whichis equivalent to the first week containing January 4th. A week starts on a Monday(day 1) and ends on a Sunday (day 7).
Syntax_week_of_year ( timestamp_expression )
_years_betweenReturns a positive or negative integer representing the number of years between"timestamp_expression1" and "timestamp_expression2". If "timestamp_expression1"< "timestamp_expression2", a negative value is returned.
Syntax_years_between ( timestamp_expression1 , timestamp_expression2 )
_ymdint_betweenReturns a number representing the difference between "timestamp_expression1"and "timestamp_expression2". This value has the form YYMMDD, where YYrepresents the number of years, MM represents the number of months, and DDrepresents the number of days.
Syntax_ymdint_between ( timestamp_expression1 , timestamp_expression2 )
Example
Appendix F. Using the expression editor 761
_ymdint_between ( [Query1].[Date (close date)] , [Query1].[Date (shipdate)] ), where [Query1].[Date (close date)] is February 20, 2004,and [Query1].[Date (ship date)] is January 19, 2004.
Result
101, where 1 is the number of months and 01 is the number of days.
absReturns the absolute value of "numeric_expression". If "numeric_expression" isnegative, a positive value is returned.
Syntaxabs ( numeric_expression )
ceilingReturns the smallest integer that is greater than or equal to "numeric_expression".
Syntaxceiling ( numeric_expression )
character_lengthReturns the number of characters in "string_expression".
Syntaxcharacter_length ( string_expression )
date2stringReturns a date as a string in YYYY-MM-DD format.
Syntaxdate2string ( date_expression )
date2timestampConverts "date_expression" to a timestamp. The time part of the timestamp willequal zero.
Syntaxdate2timestamp ( date_expression )
date2timestampTZConverts "date_expression" to a timestamp with a time zone. The time and timezone parts of the timestamp will equal zero.
Syntaxdate2timestampTZ ( date_expression )
DTinterval2stringReturns a date time interval as a string in DDDD HH:MM:SS.FFFFFFF or -DDDDHH:MM:SS.FFF format.
Syntax
762 IBM Cognos Report Studio Version 10.2.1: User Guide

DTinterval2string ( date_time_interval_expression )
DTinterval2stringAsTimeReturns a date time interval as a string in HHHH:MM:SS.FFFFFFF orHH:MM:SS.FFF format. Days are converted to hours.
SyntaxDTinterval2stringAsTime ( date_time_interval_expression )
expReturns the constant 'e' raised to the power of "numeric_expression". The constant'e' is the base of the natural logarithm.
Syntaxexp ( numeric_expression )
Exampleexp ( 2 )
Result
7.389056
extractReturns an integer representing the value of "date_part_expression" in"datetime_expression". "Date_part_expression" could be the year, month, day, hour,minute, or second.
Syntaxextract ( date_part_expression , datetime_expression )
Example 1extract ( year , 2003-03-03 16:40:15.535 )
Result
2003
Example 2extract ( hour , 2003-03-03 16:40:15.535 )
Result
16
floorReturns the largest integer that is less than or equal to "numeric_expression".
Syntaxfloor ( numeric_expression )
Appendix F. Using the expression editor 763

int2DTintervalConverts an integer to a date time interval. "String_expression" specifies what"integer_expression" represents: "ns" = nanoseconds, "s" = seconds (default), "m" =minutes, "h" = hours, "d" = days.
Syntaxint2DTinterval ( integer_expression , string_expression )
Example 1int2DTinterval (1020,"h")
Result
42 days 12 hours
Example 2int2DTinterval (1020,"s")
Result
17 minutes
int2YMintervalConverts "integer_expression" to a year month interval. "String_expression"specifies what "integer_expression" represents: "y" = years, "m" = months (default).
Syntaxint2YMinterval ( integer_expression , string_expression )
lnReturns the natural logarithm of "numeric_expression".
Syntaxln ( numeric_expression )
lowerReturns "string_expression" with all uppercase characters converted to lowercase.This function appears in the Bursted Sales Performance Report sample report inthe GO Data Warehouse (query) package.
Syntaxlower ( string_expression )
mapNumberToLetterAdds "integer_expression" to "string_expression".
SyntaxmapNumberToLetter ( string_expression , integer_expression )
ExamplemapNumberToLetter ( ’a’ , 1 )
764 IBM Cognos Report Studio Version 10.2.1: User Guide

Result
b
modReturns an integer value representing the remainder (modulo) of"integer_expression1" / "integer_expression2".
Syntaxmod ( integer_expression1 , integer_expression2 )
nullifReturns null if "string_expression1" equals "string_expression2" (case-insensitive),otherwise returns "string_expression1".
Syntaxnullif ( string_expression1 , string_expression2 )
number2stringConverts "numeric_expression" to a string, using the %g format specifier (C/C++syntax).
Syntaxnumber2string ( numeric_expression )
octet_lengthReturns the number of bytes in "string_expression".
Syntaxoctet_length ( string_expression )
positionReturns the integer value representing the starting position of "string_expression1"in "string_expression2". Returns 0 if "string_expression1" is not found.
Syntaxposition ( string_expression1 , string_expression2 )
powerReturns "numeric_expression1" raised to the power of "numeric_expression2".
Syntaxpower ( numeric_expression1 , numeric_expression2 )
Examplepower ( 3 , 2 )
Result
9
Appendix F. Using the expression editor 765

roundReturns "numeric_expression" rounded to the nearest value with"integer_expression" significant digits to the right of the decimal point. If"integer_expression" is negative, "numeric_expression" is rounded to the nearestabsolute value with "integer_expression" significant digits to the left of the decimalpoint. Rounding takes place before data formatting is applied.
Syntaxround ( numeric_expression , integer_expression )
Exampleround (125, -1)
Result
130
sqrtReturns the square root of "numeric_expression". "Numeric_expression" must notbe a negative value.
Syntaxsqrt ( numeric_expression )
statusReturns the status of "expression". Possible values are: 0 - OK, 1 - null, 2 - notavailable, 4 - divide by zero, 8 - overflow, 16 - security, 32 - error, 64 - new, 128 -sample, 256 - pending.
Syntaxstatus ( expression )
string2dateReturns "string_expression" as a date in YYYY-MM-DD format.
Syntaxstring2date ( string_expression )
string2doubleReturns a floating point number. "String_expression" has the following form:"[whitespace] [sign] [digits] [digits] [ {d|D|e|E }[sign]digits]"
Syntaxstring2double ( string_expression )
string2DTintervalReturns "string_expression" as a date time interval in [-]DD HH:MM[:SS[.FFF]]format.
Syntaxstring2DTinterval ( string_expression )
766 IBM Cognos Report Studio Version 10.2.1: User Guide

string2int32Returns an integer. "String_expression" has the following form: "[whitespace][{+|-}] [digits]"
Syntaxstring2int32 ( string_expression )
string2int64Returns a long integer. "String_expression" has the following form: "[whitespace][{+|-}] [digits]"
Syntaxstring2int64 ( string_expression )
string2timeReturns "string_expression" as a time in HH:MM:SS.FFFFFFF format.
Syntaxstring2time ( string_expression )
string2timestampReturns "string_expression" as a timestamp in YYYY-MM-DD [T|t|[white space]+]HH:MM:SS.FFFFFFF format.
Syntaxstring2timestamp ( string_expression )
string2timestampTZReturns "string_expression" in YYYY-MM-DD HH:MM:SS.FFFFFFF +HHMM orYYYY-MM-DD [T|t] HH:MM:SS.FFF -HHMM format.
Syntaxstring2timestampTZ ( string_expression )
string2YMintervalReturns "string_expression" as a Year Month Interval in [-]YY MM format.
Syntaxstring2YMinterval ( string_expression )
substringReturns the substring of "string_expression" that starts at position"integer_expression1" for "integer_expression2" characters or to the end of"string_expression" if "integer_expression2" is -1. The first character in"string_expression" is at position 1.
Syntaxsubstring ( string_expression , integer_expression1 ,integer_expression2 )
Example
Appendix F. Using the expression editor 767

substring ( [Sales (analysis)].[Sales staff].[Sales staff].[Salesstaff].[Position code], 3 , 5 )
Result
Returns characters 3 to 7 of the position codes.
time2stringReturns a time as a string in HH:MM:SS.FFF format.
Syntaxtime2string ( time_expression )
timestamp2dateConverts "timestamp_expression" to a date. The time part of the timestamp will beignored.
Syntaxtimestamp2date ( timestamp_expression )
timestamp2stringReturns a timestamp as a string in YYYY-MM-DD HH:MM:SS.FFFFFFF format.
Syntaxtimestamp2string ( timestamp_expression )
timestamp2timestampTZConverts "timestamp_expression" to a timestamp with a time zone. Thedisplacement part of the timestamp with the time zone will be zero.
Syntaxtimestamp2timestampTZ ( timestamp_expression )
timestampTZ2dateConverts "timestamp_time_zone_expression" to a date. The time and time zoneparts of the timestamp will be ignored.
SyntaxtimestampTZ2date ( timestamp_time_zone_expression )
timestampTZ2stringReturns a timestamp with the time zone as a string in YYYY-MM-DDHH:MM:SS.FFFFFFF +HHMM or YYYY-MM-DD HH:MM:SS.FFF -HHMM format.
SyntaxtimestampTZ2string ( timestamp_time_zone_expression )
timestampTZ2timestampConverts "timestamp_time_zone_expression" to a timestamp. The displacementpart of the timestamp with the time zone will be ignored.
Syntax
768 IBM Cognos Report Studio Version 10.2.1: User Guide

timestampTZ2timestamp ( timestamp_time_zone_expression )
timeTZ2stringReturns a time with the time zone as a string in HH:MM:SS.FFF +HHMM orHH:MM:SS.FFFFFFF -HHMM format. For example, -05:30 means a timezone ofGMT minus 5 hours and 30 minutes
SyntaxtimeTZ2string ( timeTZ_expression )
trimReturns "string_expression" trimmed of any leading and trailing blanks or trimmedof the character specified by "match_character_expression". "Trim_what_expression"may be "leading", "trailing", or "both" (default). "Match_character_expression" canbe an empty string to trim blanks or can specify a character to be trimmed.
Syntaxtrim ( trim_what_expression , match_character_expression ,string_expression )
upperReturns "string_expression" with all lowercase characters converted to uppercase.
Syntaxupper ( string_expression )
YMinterval2stringReturns "year_month_interval_expression" as a string in (YY MM) or -(YY MM)format.
SyntaxYMinterval2string ( year_month_interval_expression )
Appendix F. Using the expression editor 769

770 IBM Cognos Report Studio Version 10.2.1: User Guide

Appendix G. Report Studio Object and Property Reference
This appendix contains definitions of the objects and properties found in IBMCognos Report Studio. They are available contextually, by pressing F1 when anobject or property is active in the Report Studio authoring environment.
Objects
Objects are visible in the Report Studio work area. They can be inserted from the
Toolbox tab .
Properties
Properties can be set on Report Studio objects. They are available in the lower-leftpane of Report Studio.
Data formatting properties
Data formatting properties can be set on data values by selecting Default DataFormat from the Data menu, or by editing the Data Format property for ReportStudio objects.
Report Studio ObjectsThe following is a list of objects available in IBM
®
Cognos®
Report Studio.
3-D AreaA chart in which members of a data series are represented by three-dimensionalareas of varying size and color. The three-dimensional area chart is one of threechart types that can be included in a three-dimensional combination chart.
Properties of 3-D Area
“Border Color” on page 858, “Borders” on page 858, “Chart Type” on page 864,“Values” on page 964
3-D BarA chart in which members of a data series are represented by three-dimensionalbars of varying length and color. The three-dimensional bar chart is one of threechart types that can be included in a three-dimensional combination chart.
Properties of 3-D Bar
“Border Color” on page 858, “Borders” on page 858, “Chart Type” on page 864,“Values” on page 964
© Copyright IBM Corp. 2005, 2013 771

3-D Combination ChartA chart that includes any number and combination of three-dimensional bar charts,line charts, and area charts. This chart plots any number of data series against onecommon measure on the vertical numeric axis and one or two common data serieson ordinal axes.
Properties of 3-D Combination Chart
“3-D Viewing Angle” on page 846, “Alternate Text” on page 848, “ApplicationDrill-Through” on page 849, “Background Color” on page 854, “BackgroundEffects” on page 855, “Baselines” on page 856, “Border” on page 857, “Box Type”on page 859, “Classes” on page 865, “Clickable Regions” on page 866, “ConditionalPalette” on page 868, “Container Select” on page 870, “Display for Orientation” onpage 881, “Drill-Through Definitions” on page 883, “Margin” on page 904, “MasterDetail Relationships” on page 907, “Maximum Hotspots” on page 908, “Name” onpage 914, “No Data Contents” on page 916, “Notes” on page 917, “NumericalAxis” on page 919, “Padding” on page 921, “Pagination” on page 921, “Palette” onpage 922, “Query” on page 928, “Relative Alignment” on page 930, “Render Pagewhen Empty” on page 931, “Render Variable” on page 932, “Series Color” on page939, “Set Variable Values” on page 941, “Show Hover” on page 942, “Show PointerCursor” on page 943, “Size & Overflow” on page 945, “Suppression” on page 951,“Title” on page 955, “Tooltips” on page 957, “Visible” on page 966, “X Axis” onpage 967, “Y Axis” on page 968
3-D LineA chart in which members of a data series are represented by three-dimensionallines of varying colors. The three-dimensional line chart is one of three chart typesthat can be included in a three-dimensional combination chart.
Properties of 3-D Line
“Border Color” on page 858, “Borders” on page 858, “Chart Type” on page 864,“Values” on page 964
3-D Scatter ChartA chart that plots three measures against one or more data series on athree-dimensional X-Y-Z graph.
Properties of 3-D Scatter Chart
“3-D Viewing Angle” on page 846, “Alternate Text” on page 848, “ApplicationDrill-Through” on page 849, “Background Color” on page 854, “BackgroundEffects” on page 855, “Baselines” on page 856, “Border” on page 857, “BorderColor” on page 858, “Borders” on page 858, “Box Type” on page 859, “Classes” onpage 865, “Clickable Regions” on page 866, “Conditional Palette” on page 868,“Container Select” on page 870, “Display for Orientation” on page 881,“Drill-Through Definitions” on page 883, “Legend” on page 900, “Margin” on page904, “Marker Size (pt)” on page 906, “Master Detail Relationships” on page 907,“Maximum Hotspots” on page 908, “Name” on page 914, “No Data Contents” onpage 916, “Notes” on page 917, “Padding” on page 921, “Pagination” on page 921,“Palette” on page 922, “Point Shape” on page 924, “Query” on page 928, “RelativeAlignment” on page 930, “Render Page when Empty” on page 931, “RenderVariable” on page 932, “Set Variable Values” on page 941, “Show Feelers” on page942, “Show Hover” on page 942, “Show Pointer Cursor” on page 943, “Size &
772 IBM Cognos Report Studio Version 10.2.1: User Guide

Overflow” on page 945, “Suppression” on page 951, “Title” on page 955, “Tooltips”on page 957, “Values” on page 964, “Visible” on page 966
Angular AxisThe angular numeric axis for a polar chart, including labels, titles, range, and scale.
Properties of Angular Axis
“Axis Labels” on page 852, “Axis Line” on page 852, “Axis Title” on page 853,“Axis Title” on page 853, “Classes” on page 865, “Data Format” on page 874,“Gridlines” on page 892, “Include Zero For Auto Scale” on page 896, “MaximumValue” on page 910, “Minimum Value” on page 912, “Minor Gridlines” on page912, “Scale” on page 937, “Scale Interval” on page 938, “Use Same Range For AllInstances” on page 962
Angular MeasureThe measure that determines the angular position of each data marker on a polarchart.
Properties of Angular Measure
“Conditional Styles” on page 868, “Custom Label” on page 873, “Data Format” onpage 874, “Style Variable” on page 950
AreaThe data marker used to represent data series in an area chart.
Properties of Area
“Aggregate Function” on page 847, “Area Shape” on page 850, “Border Color” onpage 858, “Borders” on page 858, “Chart Type” on page 863, “Conditional Palette”on page 868, “Expression” on page 886, “Extend Width” on page 886, “Hierarchy”on page 894, “Hierarchy Unique Name” on page 894, “Level” on page 902, “LevelUnique Name” on page 902, “Member” on page 910, “Member Unique Name” onpage 911, “Palette” on page 922, “Property Unique Name” on page 928, “RollupAggregate Function” on page 936, “Root Members Only” on page 936, “SeriesType” on page 940, “Set Definition” on page 940, “Set Sorting” on page 940, “ShowValues” on page 944
AreaThe data marker used to represent data series in an area chart. This object appliesonly to legacy charts.
Properties of Area
“Axis Assignment” on page 852, “Border Color” on page 858, “Borders” on page858, “Chart Type” on page 863, “Grouping Type” on page 892, “Value Location:”on page 963, “Values” on page 964, “Value Type” on page 965
As of Time ExpressionAn expression that produces a Date-Time value. This expression can be used toshow report results for a specific time period that is defined by an expression thatyou create.
Appendix G. Report Studio Object and Property Reference 773

Properties of As of Time Expression
“Report Expression” on page 934
Axis LabelsThe labels that appear on an axis.
Properties of Axis Labels
“Auto Font Size” on page 850, “Classes” on page 865, “Conditional Styles” on page868, “Data Format” on page 874, “Drill-Through Definitions” on page 883, “Font”on page 888, “Foreground Color” on page 889, “Nested Label Display” on page916, “Render Variable” on page 932, “Text Truncation” on page 954
Axis TitleThe title for an axis of the chart. This object applies only to legacy charts.
Properties of Axis Title
“Box Type” on page 860, “Classes” on page 865, “Conditional Styles” on page 868,“Default Title” on page 878, “Master Detail Relationships” on page 907,“Properties” on page 927, “Query” on page 928, “Style Variable” on page 950
Axis TitleThe title for an axis of the chart.
Properties of Axis Title
“Auto Font Size” on page 850, “Box Type” on page 860, “Classes” on page 865,“Conditional Styles” on page 868, “Default Title” on page 878, “Master DetailRelationships” on page 907, “Properties” on page 927, “Query” on page 928,“Render Variable” on page 932
BarA chart in which members of a data series are represented by bars of varyinglength and color.
Properties of Bar
“Aggregate Function” on page 847, “Bar Shape” on page 856, “Bar Width” on page856, “Bevel” on page 857, “Border Color” on page 858, “Borders” on page 858,“Chart Type” on page 863, “Conditional Palette” on page 868, “Expression” onpage 886, “Hierarchy” on page 894, “Hierarchy Unique Name” on page 894,“Level” on page 902, “Level Unique Name” on page 902, “Member” on page 910,“Member Unique Name” on page 911, “Palette” on page 922, “Property UniqueName” on page 928, “Rollup Aggregate Function” on page 936, “Root MembersOnly” on page 936, “Series Type” on page 940, “Set Definition” on page 940, “SetSorting” on page 940, “Show Values” on page 944
BarA chart in which members of a data series are represented by bars of varyinglength and color. This object applies only to legacy charts.
774 IBM Cognos Report Studio Version 10.2.1: User Guide

Properties of Bar
“Axis Assignment” on page 852, “Border Color” on page 858, “Borders” on page858, “Chart Type” on page 863, “Connecting Lines” on page 869, “Grouping Type”on page 892, “Value Location:” on page 963, “Values” on page 964, “Value Type”on page 965
BaselineA baseline to be rendered on a chart.
Properties of Baseline
“Axis Assignment” on page 852, “Bar, Line, or Area Index” on page 856, “BoxType” on page 860, “Data Item Value” on page 876, “Label” on page 898, “LegendLabel” on page 901, “Line Styles” on page 903, “Master Detail Relationships” onpage 907, “Member Offset (%)” on page 910, “Numeric Value” on page 919,“Percentile” on page 923, “Percent of Axis” on page 923, “Position type” on page925, “Properties” on page 927, “Query” on page 928, “Report Expression” on page934, “Report Expression” on page 933, “Standard Deviations” on page 949
BaselineA baseline for a polar chart, scatter chart, or bubble chart.
Properties of Baseline
“Axis Assignment” on page 852, “Data Item Value” on page 876, “Label” on page898, “Legend Label” on page 901, “Line Styles” on page 903, “Master DetailRelationships” on page 907, “Numeric Value” on page 919, “Percentile” on page923, “Percent of Axis” on page 923, “Position type” on page 925, “Properties” onpage 927, “Query” on page 928, “Report Expression” on page 933, “StandardDeviations” on page 949
BaselineA baseline for a three-dimensional combination chart.
Properties of Baseline
“Bar, Line, or Area Index” on page 856, “Box Type” on page 860, “Data ItemValue” on page 876, “Line Styles” on page 903, “Master Detail Relationships” onpage 907, “Numeric Value” on page 919, “Percentile” on page 923, “Percent ofAxis” on page 923, “Position type” on page 925, “Properties” on page 927, “Query”on page 928, “Report Expression” on page 933, “Standard Deviations” on page 949
BaselineA baseline for a three-dimensional scatter chart.
Properties of Baseline
“Box Type” on page 860, “Data Item Value” on page 876, “Line Styles” on page903, “Master Detail Relationships” on page 907, “Numeric Value” on page 919,“Percentile” on page 923, “Percent of Axis” on page 923, “Position type” on page925, “Properties” on page 927, “Query” on page 928, “Report Expression” on page933, “Standard Deviations” on page 949
Appendix G. Report Studio Object and Property Reference 775

BlockA container into which you can insert other objects.
Properties of Block
“Background Color” on page 854, “Background Effects” on page 855, “Border” onpage 857, “Box Type” on page 859, “Classes” on page 865, “Conditional Styles” onpage 868, “Direction & Justification” on page 880, “Display for Orientation” onpage 881, “Font” on page 888, “Foreground Color” on page 889, “HorizontalAlignment” on page 895, “Margin” on page 904, “Name” on page 914, “Padding”on page 921, “Render Variable” on page 932, “Size & Overflow” on page 945,“Spacing & Breaking” on page 948, “Style Variable” on page 950, “Visible” on page966, “White Space” on page 966
BookmarkA link to another area within the same report. The link can be defined as a staticvalue, a query item, or as the result of a report expression.
Properties of Bookmark
“Data Item Label” on page 875, “Data Item Value” on page 876, “Label” on page898, “Report Expression” on page 933, “Source Type” on page 948
Bubble ChartA point chart that plots one or more data series against three measures: a Y-value,an X-value, and a bubble whose relative size represents the third measure. Multiplepoints are plotted for each category. This object applies only to legacy charts.
To help distinguish values, set the Tooltips property of this object to Yes.
Properties of Bubble Chart
“Alternate Text” on page 848, “Application Drill-Through” on page 849,“Background Color” on page 854, “Background Effects” on page 855, “Baselines”on page 856, “Border” on page 857, “Border Color” on page 858, “Borders” onpage 858, “Box Type” on page 859, “Bubble Size” on page 860, “Classes” on page865, “Clickable Regions” on page 866, “Conditional Palette” on page 868,“Container Select” on page 870, “Display for Orientation” on page 881,“Drill-Through Definitions” on page 883, “Legend” on page 900, “Margin” on page904, “Markers” on page 905, “Marker Text Location” on page 906, “Master DetailRelationships” on page 907, “Maximum Hotspots” on page 908, “Name” on page914, “No Data Contents” on page 916, “Notes” on page 917, “Padding” on page921, “Pagination” on page 921, “Palette” on page 922, “Point Shape” on page 924,“Query” on page 928, “Regression Line” on page 930, “Relative Alignment” onpage 930, “Render Page when Empty” on page 931, “Render Variable” on page932, “Set Variable Values” on page 941, “Show Hover” on page 942, “Show PointerCursor” on page 943, “Size & Overflow” on page 945, “Suppression” on page 951,“Title” on page 955, “Tooltips” on page 957, “Value Location:” on page 963,“Values” on page 964, “Visible” on page 966, “X Axis” on page 968, “Y Axis” onpage 968
776 IBM Cognos Report Studio Version 10.2.1: User Guide

Bubble ChartA point chart that plots one or more data series against three measures: a Y-value,an X-value, and a bubble whose relative size represents the third measure. Multiplepoints are plotted for each category.
To help distinguish values, set the Tooltips property of this object to Yes.
Properties of Bubble Chart
“Alternate Text” on page 848, “Application Drill-Through” on page 849,“Background Effects” on page 855, “Border” on page 857, “Box Type” on page 859,“Bubble Size” on page 860, “Classes” on page 865, “Clickable Regions” on page866, “Color by Value” on page 866, “Colored Regions” on page 867, “ConditionalPalette” on page 868, “Contained Text Direction” on page 870, “Container Select”on page 870, “Direction & Justification” on page 880, “Display for Orientation” onpage 881, “Drill-Through Definitions” on page 883, “Drop Shadow” on page 884,“Legend” on page 901, “Margin” on page 904, “Markers” on page 906, “MasterDetail Relationships” on page 907, “Material Effects” on page 907, “Matrix Rowsand Columns” on page 908, “Maximum Hotspots” on page 908, “Name” on page914, “No Data Contents” on page 916, “Notes” on page 917, “Numeric Baselines”on page 919, “Padding” on page 921, “Pagination” on page 921, “Palette” on page922, “Plot Area Fill” on page 924, “Query” on page 928, “Relative Alignment” onpage 930, “Render Page when Empty” on page 931, “Render Variable” on page932, “Set Variable Values” on page 941, “Show Hover” on page 942, “Show PointerCursor” on page 943, “Show Values” on page 945, “Size & Overflow” on page 945,“Suppression” on page 951, “Title” on page 955, “Tooltips” on page 956,“Trendlines” on page 958, “Visible” on page 966
Bubble MeasureThe measure that determines the size of each bubble on a bubble chart.
Properties of Bubble Measure
“Conditional Styles” on page 868, “Custom Label” on page 873, “Data Format” onpage 874
Bubble MeasureThe measure that determines the size of each bubble on a bubble chart. This objectapplies only to legacy charts.
Properties of Bubble Measure
“Conditional Styles” on page 868, “Custom Label” on page 873, “Data Format” onpage 874, “Style Variable” on page 950
Bullet ChartA chart that compares a measure to a target. Use the Colored Regions property torelate the compared measures against additional qualitative measurements, such ascolored regions for good, satisfactory, and poor.
Properties of Bullet Chart
“Alternate Text” on page 848, “Application Drill-Through” on page 849,“Background Effects” on page 855, “Bevel” on page 857, “Border” on page 857,
Appendix G. Report Studio Object and Property Reference 777

“Box Type” on page 859, “Bullet Indicators” on page 860, “Chart Orientation” onpage 863, “Classes” on page 865, “Clickable Regions” on page 866, “ColoredRegions” on page 867, “Contained Text Direction” on page 870, “Container Select”on page 870, “Direction & Justification” on page 880, “Display for Orientation” onpage 881, “Drill-Through Definitions” on page 883, “Drop Shadow” on page 884,“Legend” on page 901, “Margin” on page 904, “Master Detail Relationships” onpage 907, “Matrix Rows and Columns” on page 908, “Maximum Hotspots” onpage 908, “Name” on page 914, “No Data Contents” on page 916, “Notes” on page917, “Padding” on page 921, “Pagination” on page 921, “Query” on page 928,“Relative Alignment” on page 930, “Render Page when Empty” on page 931,“Render Variable” on page 932, “Set Variable Values” on page 941, “Show Hover”on page 942, “Show Pointer Cursor” on page 943, “Size & Overflow” on page 945,“Suppression” on page 951, “Title” on page 955, “Tooltips” on page 956, “Visible”on page 966
Bullet MeasureThe measure that determines the size of the bullet for a bullet chart.
Properties of Bullet Measure
“Custom Label” on page 873, “Data Format” on page 874
ButtonA button in a static button bar control.
Properties of Button
“Icon” on page 896, “Label” on page 898
ButtonA single static button control. The button requires a row in the data table of thecontrol.
Properties of Button
“Application Drill-Through” on page 849, “Button Definition” on page 861,“Contained Text Direction” on page 870, “Control Enable” on page 872, “Direction& Justification” on page 880, “Display for Orientation” on page 881, “Icon” onpage 896, “Label” on page 898, “Name” on page 914, “Render Variable” on page932, “Set Variable Values” on page 941, “Size” on page 945
Button BarA static button bar control. Each button requires a corresponding row in the datatable of the control.
Properties of Button Bar
“Application Drill-Through” on page 849, “Button Gap” on page 861, “ButtonsDefinition” on page 861, “Button Width” on page 861, “Contained Text Direction”on page 870, “Container Select” on page 870, “Control Enable” on page 872,“Direction & Justification” on page 880, “Display for Orientation” on page 881,“Name” on page 914, “Orientation” on page 920, “Render Variable” on page 932,“Set Variable Values” on page 941
778 IBM Cognos Report Studio Version 10.2.1: User Guide

Button Extra ItemData items that are used to determine what appears as the button labels in a databutton bar control.
Properties of Button Extra Item
“Data Item” on page 874
Button IconThe icon used to identify each button in a data button bar control. The icons areobtained from a data item inserted into the control.
Properties of Button Icon
“Data Item” on page 874
Button LabelThe label used to identify each button in a data button bar control. Each label isdetermined by the data items inserted into the control.
Properties of Button Label
“Data Item” on page 874
Calculated MeasureA data item that is a calculated member.
Properties of Calculated Measure
“Calculation Intersection” on page 861, “Dimension” on page 880, “Expression” onpage 886, “Label” on page 899, “Name” on page 913, “Solve Order” on page 947,“Type” on page 959
Calculated MemberAn item, within a dimension, that represents an occurrence of schema data definedas a calculation of two or more members.
Properties of Calculated Member
“Caption” on page 862, “Data Item” on page 875, “Name” on page 916
Calculated MemberA data item that is a calculated member.
Properties of Calculated Member
“Calculation Intersection” on page 861, “Detail” on page 879, “Dimension” on page880, “Expression” on page 886, “Hierarchy” on page 894, “Label” on page 899,“Name” on page 913, “Solve Order” on page 947, “Type” on page 959
CaptionThe caption on a Field Set object.
Appendix G. Report Studio Object and Property Reference 779

Properties of Caption
“Background Color” on page 854, “Border” on page 857, “Classes” on page 865,“Conditional Styles” on page 868, “Font” on page 888, “Foreground Color” onpage 889, “Margin” on page 904, “Padding” on page 921, “Style Variable” on page950
CardA card in a static deck control.
Properties of Card
“Current Card” on page 873
Card Extra ItemA data item that is used to determine the data that appears in the cards of a datadeck control.
Properties of Card Extra Item
“Data Item” on page 874
Card LabelThe label used to identify a card in a deck control.
Properties of Card Label
“Data Item” on page 874
CategoryA category that is used to plot data in a visualization.
Properties of Category
“Category Range” on page 863, “Label” on page 899
Category AxisThe axis line for an ordinal, or non-numeric, axis. This object applies only to legacycharts.
Properties of Category Axis
“Allow 45° Rotation” on page 847, “Allow 90° Rotation” on page 848, “AllowSkip” on page 848, “Allow Stagger” on page 848, “Axis Labels” on page 852, “AxisLine” on page 852, “Axis Title” on page 853, “Axis Title” on page 853, “Classes” onpage 865, “Display Frequency” on page 882, “Drill-Through Definitions” on page883, “First Label Index” on page 887, “Gridlines” on page 892, “Label Control” onpage 899, “Maximum Truncation Characters” on page 909, “Minor Gridlines” onpage 912, “Truncation” on page 958, “Truncation Text” on page 959
Category axisThe axis line for an ordinal, or non-numeric, axis.
780 IBM Cognos Report Studio Version 10.2.1: User Guide

Properties of Category axis
“Axis Labels” on page 852, “Axis Line” on page 853, “Axis Title” on page 854,“Axis Title” on page 853, “Gridlines” on page 892, “Minor Gridlines” on page 912,“Number of Minor Intervals” on page 918, “Reverse Category Order” on page 935
Category BaselineA baseline for the category in a chart.
Properties of Category Baseline
“Aggregate Function” on page 847, “Category Baselines” on page 863,“Expression” on page 886, “Hierarchy” on page 894, “Hierarchy Unique Name” onpage 894, “Level” on page 902, “Level Unique Name” on page 902, “Line Style” onpage 903, “Master Detail Relationships” on page 907, “Member” on page 910,“Member Offset (%)” on page 910, “Member Unique Name” on page 911,“Properties” on page 927, “Property Unique Name” on page 928, “Query” on page928, “Render Variable” on page 932, “Rollup Aggregate Function” on page 936,“Root Members Only” on page 936, “Set Definition” on page 940, “Set Sorting” onpage 940
Chart BodyDefines the body style of the chart itself. The style of the body can be setindependently of the chart itself. This object applies only to legacy charts.
Properties of Chart Body
“Background Color” on page 854, “Conditional Styles” on page 868, “Fill Effects”on page 887, “Font” on page 888, “Foreground Color” on page 889, “HorizontalAlignment” on page 895, “Style Variable” on page 950
Chart BodyDefines the body style of the chart itself. The style of the body can be setindependently of the chart itself.
Properties of Chart Body
“Background Color” on page 854, “Background Effects” on page 855, “Font” onpage 888, “Foreground Color” on page 889, “Horizontal Alignment” on page 895
Chart FooterA footer for the chart. This object applies only to legacy charts.
Properties of Chart Footer
“Background Effects” on page 855, “Box Type” on page 860, “Classes” on page 865,“Conditional Styles” on page 868, “Horizontal Alignment” on page 895, “MasterDetail Relationships” on page 907, “Properties” on page 927, “Query” on page 928,“Style Variable” on page 950
Chart FooterA footer for the chart.
Appendix G. Report Studio Object and Property Reference 781

Properties of Chart Footer
“Background Effects” on page 855, “Box Type” on page 860, “Classes” on page 865,“Conditional Styles” on page 868, “Horizontal Alignment” on page 895, “MasterDetail Relationships” on page 907, “Properties” on page 927, “Query” on page 928,“Render Variable” on page 932
Chart MeasureThe measure for the chart.
Properties of Chart Measure
“Conditional Styles” on page 868, “Custom Label” on page 873, “Data Format” onpage 874
Chart Node MemberA data item, and its accompanying text, to render on the chart.
Properties of Chart Node Member
“Aggregate Function” on page 847, “Custom Label” on page 873, “Data Format”on page 874, “Expression” on page 886, “Hierarchy” on page 894, “HierarchyUnique Name” on page 894, “Level” on page 902, “Level Unique Name” on page902, “Member” on page 910, “Member Unique Name” on page 911, “Properties”on page 927, “Property Unique Name” on page 928, “Rollup Aggregate Function”on page 936, “Root Members Only” on page 936, “Set Definition” on page 940,“Set Sorting” on page 940, “Sorting” on page 947
Chart SubtitleThe subtitle for a chart. This object applies only to legacy charts.
Properties of Chart Subtitle
“Background Effects” on page 855, “Box Type” on page 860, “Classes” on page 865,“Conditional Styles” on page 868, “Horizontal Alignment” on page 895, “MasterDetail Relationships” on page 907, “Properties” on page 927, “Query” on page 928,“Style Variable” on page 950
Chart SubtitleThe subtitle for a chart.
Properties of Chart Subtitle
“Background Effects” on page 855, “Box Type” on page 860, “Classes” on page 865,“Conditional Styles” on page 868, “Horizontal Alignment” on page 895, “MasterDetail Relationships” on page 907, “Properties” on page 927, “Query” on page 928,“Render Variable” on page 932
Chart Text ItemThe data source and format for a text item, such as a legend item, legend title, axislabel, or axis title. This object applies only to legacy charts.
782 IBM Cognos Report Studio Version 10.2.1: User Guide

Properties of Chart Text Item
“Aggregate Function” on page 847, “Conditional Styles” on page 868, “ControlData Item Value” on page 871, “Data Format” on page 874, “Data Item Label” onpage 875, “Data Item Value” on page 875, “Expression” on page 886, “Hierarchy”on page 894, “Hierarchy Unique Name” on page 894, “Level” on page 902, “LevelUnique Name” on page 902, “Member” on page 910, “Member Unique Name” onpage 911, “Property Unique Name” on page 928, “Report Expression” on page 933,“Rollup Aggregate Function” on page 936, “Root Members Only” on page 936,“Set Definition” on page 940, “Set Sorting” on page 940, “Source Type” on page947, “Style Variable” on page 950, “Text” on page 954, “Text Source Variable” onpage 954
Chart Text ItemThe data source and format for a text item, such as a legend item, legend title, axislabel, or axis title.
Properties of Chart Text Item
“Aggregate Function” on page 847, “Conditional Styles” on page 868, “ControlData Item Value” on page 871, “Data Format” on page 874, “Data Item Label” onpage 875, “Data Item Value” on page 875, “Expression” on page 886, “Hierarchy”on page 894, “Hierarchy Unique Name” on page 894, “Level” on page 902, “LevelUnique Name” on page 902, “Member” on page 910, “Member Unique Name” onpage 911, “Property Unique Name” on page 928, “Render Variable” on page 932,“Report Expression” on page 933, “Rollup Aggregate Function” on page 936, “RootMembers Only” on page 936, “Set Definition” on page 940, “Set Sorting” on page940, “Source Type” on page 947, “Text” on page 954, “Text Source Variable” onpage 954
Chart TitleThe title text that appears at the top of the chart. This object applies only to legacycharts.
Properties of Chart Title
“Background Effects” on page 855, “Box Type” on page 860, “Classes” on page 865,“Conditional Styles” on page 868, “Horizontal Alignment” on page 895, “MasterDetail Relationships” on page 907, “Properties” on page 927, “Query” on page 928,“Style Variable” on page 950
Chart TitleThe title text that appears at the top of the chart.
Properties of Chart Title
“Background Effects” on page 855, “Box Type” on page 860, “Classes” on page 865,“Conditional Styles” on page 868, “Horizontal Alignment” on page 895, “MasterDetail Relationships” on page 907, “Properties” on page 927, “Query” on page 928,“Render Variable” on page 932
Check BoxA check box in a static check box group control.
Appendix G. Report Studio Object and Property Reference 783

Properties of Check Box
“Icon” on page 896, “Label” on page 898
Check Box Extra ItemData items that are used to determine what appears as the check box labels in adata check box group control.
Properties of Check Box Extra Item
“Data Item” on page 874
Check Box GroupA static check box group control. Each check box requires a corresponding row inthe data table of the control.
Properties of Check Box Group
“Application Drill-Through” on page 849, “Check Boxes Definition” on page 864,“Contained Text Direction” on page 870, “Container Filter” on page 870,“Container Select” on page 870, “Control Enable” on page 872, “Direction &Justification” on page 880, “Display for Orientation” on page 881, “Name” on page914, “Orientation” on page 920, “Render Variable” on page 932, “Set VariableValues” on page 941, “Text Color” on page 954
Check Box IconThe icon used to identify each check box in a data check box group control. Theicons are obtained from a data item inserted into the control.
Properties of Check Box Icon
“Data Item” on page 874
Check Box LabelThe label used to identify a check box in a data check box group control. The labelis determined by the data items inserted into the control.
Properties of Check Box Label
“Data Item” on page 874
ClassThe HTML class name for a layout object. Use this attribute to indicate the type ofstyling to apply to the object when the report is rendered.
Properties of Class
“Background Effects” on page 855, “Description” on page 879, “Label” on page898, “Label” on page 898
784 IBM Cognos Report Studio Version 10.2.1: User Guide

Color by Value MeasureThe measure or value used to determine the color of the points in a scatter orbubble chart. The points are colored according to the range of the data item insteadof using the palette.
Properties of Color by Value Measure
“Color by Value” on page 866, “Conditional Styles” on page 868, “Custom Label”on page 873, “Data Format” on page 874
Colored RegionDefines a collection of colored regions, which are rectangles drawn in the chartbody to highlight parts of the chart. The regions are drawn behind the datamarkers and in the same order that they appear in this element. The first region isdrawn first, on the bottom, and the last region is drawn on top of the otherregions.
Properties of Colored Region
“Aggregate Function” on page 847, “End Position” on page 884, “Expression” onpage 886, “Hierarchy” on page 894, “Hierarchy Unique Name” on page 894,“Level” on page 902, “Level Unique Name” on page 902, “Master DetailRelationships” on page 907, “Member” on page 910, “Member Unique Name” onpage 911, “Properties” on page 927, “Property Unique Name” on page 928,“Query” on page 928, “Render Variable” on page 932, “Rollup AggregateFunction” on page 936, “Root Members Only” on page 936, “Set Definition” onpage 940, “Set Sorting” on page 940, “Start Position” on page 949
Colored RegionDefines a collection of colored regions, which are rectangles drawn in the chartbody to highlight parts of the chart. The regions are drawn behind the datamarkers and in the same order that they appear in this element. The first region isdrawn first, on the bottom, and the last region is drawn on top of the otherregions.
Properties of Colored Region
“Aggregate Function” on page 847, “Bottom Position” on page 859, “Expression”on page 886, “Hierarchy” on page 894, “Hierarchy Unique Name” on page 894,“Left Position” on page 900, “Level” on page 902, “Level Unique Name” on page902, “Master Detail Relationships” on page 907, “Member” on page 910, “MemberUnique Name” on page 911, “Properties” on page 927, “Property Unique Name”on page 928, “Query” on page 928, “Render Variable” on page 932, “RightPosition” on page 935, “Rollup Aggregate Function” on page 936, “Root MembersOnly” on page 936, “Set Definition” on page 940, “Set Sorting” on page 940, “TopPosition” on page 957
Combination ChartA chart that uses combinations of column charts, area charts, and line charts asdata markers to plot multiple data series. This object applies only to legacy charts.
Appendix G. Report Studio Object and Property Reference 785

Properties of Combination Chart
“Alternate Text” on page 848, “Application Drill-Through” on page 849,“Background Color” on page 854, “Background Effects” on page 855, “Baselines”on page 856, “Border” on page 857, “Box Type” on page 859, “Category Axis” onpage 863, “Chart Orientation” on page 863, “Classes” on page 865, “ClickableRegions” on page 866, “Conditional Palette” on page 868, “Container Select” onpage 870, “Depth” on page 879, “Display for Orientation” on page 881,“Drill-Through Definitions” on page 883, “Legend” on page 900, “Margin” on page904, “Markers” on page 905, “Marker Text Location” on page 906, “Master DetailRelationships” on page 907, “Maximum Hotspots” on page 908, “Name” on page914, “No Data Contents” on page 916, “Notes” on page 917, “Padding” on page921, “Pagination” on page 921, “Palette” on page 922, “Query” on page 928,“Relative Alignment” on page 930, “Render Page when Empty” on page 931,“Render Variable” on page 932, “Rotate Values” on page 937, “Series Color” onpage 939, “Set Variable Values” on page 941, “Show Hover” on page 942, “ShowPointer Cursor” on page 943, “Size & Overflow” on page 945, “Suppression” onpage 951, “Title” on page 955, “Tooltips” on page 957, “Value Location:” on page963, “Visible” on page 966, “Visual Angle” on page 966, “Y1 Axis” on page 968,“Y2 Axis” on page 968, “Y2 Axis Position” on page 968
Combination ChartA chart that uses combinations of column charts, area charts, and line charts asdata markers to plot multiple data series.
Properties of Combination Chart
“Alternate Text” on page 848, “Application Drill-Through” on page 849,“Background Effects” on page 855, “Border” on page 857, “Box Type” on page 859,“Category Baselines” on page 863, “Chart Orientation” on page 863, “Classes” onpage 865, “Clickable Regions” on page 866, “Colored Regions” on page 867,“Combinations” on page 868, “Contained Text Direction” on page 870, “ContainerSelect” on page 870, “Depth” on page 879, “Direction & Justification” on page 880,“Display for Orientation” on page 881, “Drill-Through Definitions” on page 883,“Drop Shadow” on page 884, “Legend” on page 901, “Margin” on page 904,“Markers” on page 906, “Master Detail Relationships” on page 907, “MaterialEffects” on page 907, “Matrix Rows and Columns” on page 908, “MaximumHotspots” on page 908, “Name” on page 914, “No Data Contents” on page 916,“Notes” on page 917, “Numeric Baselines” on page 919, “Padding” on page 921,“Pagination” on page 921, “Plot Area Fill” on page 924, “Query” on page 928,“Relative Alignment” on page 930, “Render Page when Empty” on page 931,“Render Variable” on page 932, “Series Color” on page 939, “Set Variable Values”on page 941, “Show Hover” on page 942, “Show Pointer Cursor” on page 943,“Size & Overflow” on page 945, “Summarize Small Items” on page 951,“Suppression” on page 951, “Title” on page 955, “Tooltips” on page 956,“Trendlines” on page 958, “Visible” on page 966
Component OverrideOverrides a child object of the Layout Component Reference object.
Properties of Component Override
“Component Reference” on page 868
786 IBM Cognos Report Studio Version 10.2.1: User Guide

Conditional BlockA block that can be used for conditional display.
Properties of Conditional Block
“Background Color” on page 854, “Background Effects” on page 855, “BlockVariable” on page 857, “Border” on page 857, “Box Type” on page 859, “Classes”on page 865, “Conditional Styles” on page 868, “Current Block” on page 873,“Direction & Justification” on page 880, “Display for Orientation” on page 881,“Font” on page 888, “Foreground Color” on page 889, “Horizontal Alignment” onpage 895, “Margin” on page 904, “Padding” on page 921, “Size & Overflow” onpage 945, “Spacing & Breaking” on page 948, “Style Variable” on page 950,“Visible” on page 966, “White Space” on page 966
Conditional BlockContains the default set of layout objects to render based on a report variable.
Properties of Conditional Block
“Background Color” on page 854, “Background Effects” on page 855, “BlockVariable” on page 857, “Border” on page 857, “Box Type” on page 859, “Classes”on page 865, “Conditional Styles” on page 868, “Current Block” on page 873,“Direction & Justification” on page 880, “Display for Orientation” on page 881,“Font” on page 888, “Foreground Color” on page 889, “Horizontal Alignment” onpage 895, “Margin” on page 904, “Padding” on page 921, “Size & Overflow” onpage 945, “Spacing & Breaking” on page 948, “Style Variable” on page 950,“Visible” on page 966, “White Space” on page 966
Context Item TextThe text associated with a context area item.
Properties of Context Item Text
“Background Color” on page 854, “Border” on page 857, “Box Type” on page 859,“Classes” on page 865, “Conditional Styles” on page 868, “Direction &Justification” on page 880, “Display for Orientation” on page 881, “Font” on page888, “Foreground Color” on page 889, “Margin” on page 904, “Padding” on page921, “Relative Alignment” on page 930, “Render Variable” on page 932,“Separator” on page 939, “Size & Overflow” on page 945, “Spacing & Breaking” onpage 948, “Style Variable” on page 950, “Visible” on page 966
Continuous Values SliderA slider control that allows users to slide through numeric values betweenminimum and maximum values that you define, such as 0 and 100.
Properties of Continuous Values Slider
“Animate” on page 849, “Application Drill-Through” on page 849, “Contained TextDirection” on page 870, “Control Enable” on page 872, “Data Format” on page 874,“Direction & Justification” on page 880, “Display for Orientation” on page 881,“Label Color” on page 899, “Maximum Value” on page 910, “Minimum Value” onpage 912, “Name” on page 914, “Orientation” on page 920, “Range Type” on page930, “Render Variable” on page 932, “Set Variable Values” on page 941, “ShowTooltip” on page 944, “Step” on page 950, “Tick Interval” on page 955, “Tick Label
Appendix G. Report Studio Object and Property Reference 787
Skip Interval” on page 955, “Tick Type” on page 955, “Track Length” on page 958,“Update Variables Live” on page 959, “Variable” on page 965, “Variable forMaximum” on page 965, “Variable for Minimum” on page 965
CrosstabA layout object used to render the results of a query that aggregates data, and thenarranges it in a two-dimensional grid.
Properties of Crosstab
“Application Drill-Through” on page 849, “Background Color” on page 854,“Border” on page 857, “Box Type” on page 859, “Classes” on page 865, “ClickableRegions” on page 866, “Conditional Styles” on page 868, “Container Filter” onpage 870, “Container Select” on page 870, “Default Measure” on page 878,“Direction & Justification” on page 880, “Display for Orientation” on page 881,“Drop Shadow” on page 884, “Fact Cells Precedence” on page 887, “Font” on page888, “Foreground Color” on page 889, “Has Fact Cells” on page 893, “HorizontalAlignment” on page 895, “Margin” on page 904, “Master Detail Relationships” onpage 907, “Name” on page 914, “No Data Contents” on page 916, “Pagination” onpage 921, “Query” on page 928, “Relative Alignment” on page 930, “Render Pagewhen Empty” on page 931, “Render Variable” on page 932, “Rows Per Page” onpage 937, “Set Variable Values” on page 941, “Show Hover” on page 942, “ShowPointer Cursor” on page 943, “Size & Overflow” on page 945, “Style Variable” onpage 950, “Summary Text” on page 951, “Suppression” on page 951, “TableProperties” on page 952, “Visible” on page 966
Crosstab ColumnsOverrides the style for Crosstab Column Member objects that is defined in theGlobalReportStyles.css file.
Properties of Crosstab Columns
“Background Color” on page 854, “Background Effects” on page 855, “Border” onpage 857, “Box Type” on page 860, “Conditional Styles” on page 868, “DataFormat” on page 874, “Direction & Justification” on page 880, “Font” on page 888,“Foreground Color” on page 889, “Horizontal Alignment” on page 895, “Padding”on page 921, “Size & Overflow” on page 945, “Spacing & Breaking” on page 948,“Style Variable” on page 950, “Vertical Alignment” on page 965, “White Space” onpage 966
Crosstab ColumnsA list of columns in a crosstab.
Properties of Crosstab Columns
“Background Color” on page 854, “Background Effects” on page 855, “Border” onpage 857, “Box Type” on page 860, “Conditional Styles” on page 868, “DataFormat” on page 874, “Direction & Justification” on page 880, “Font” on page 888,“Foreground Color” on page 889, “Horizontal Alignment” on page 895, “Padding”on page 921, “Size & Overflow” on page 945, “Spacing & Breaking” on page 948,“Style Variable” on page 950, “Vertical Alignment” on page 965, “White Space” onpage 966
788 IBM Cognos Report Studio Version 10.2.1: User Guide

Crosstab CornerThe top-left corner of a crosstab, on top of the row labels and to the left of thecolumn labels. It is generally used to represent crosstab members.
Properties of Crosstab Corner
“Aggregate Function” on page 847, “Background Color” on page 854, “BackgroundEffects” on page 855, “Border” on page 857, “Box Type” on page 860, “Classes” onpage 865, “Conditional Styles” on page 868, “Data Format” on page 874, “Direction& Justification” on page 880, “Expression” on page 886, “Font” on page 888,“Foreground Color” on page 889, “Hierarchy” on page 894, “Hierarchy UniqueName” on page 894, “Horizontal Alignment” on page 895, “Level” on page 902,“Level Unique Name” on page 902, “Member” on page 910, “Member UniqueName” on page 911, “Padding” on page 921, “Property Unique Name” on page928, “Rollup Aggregate Function” on page 936, “Root Members Only” on page 936,“Set Definition” on page 940, “Set Sorting” on page 940, “Size & Overflow” onpage 945, “Spacing & Breaking” on page 948, “Style Variable” on page 950,“Vertical Alignment” on page 965, “White Space” on page 966
Crosstab Fact CellsThe contents of the fact cells of the crosstab. There is only one fact cell definitionfor the crosstab, regardless of the number of measures.
Properties of Crosstab Fact Cells
“Aggregate Function” on page 847, “Apply Single Class” on page 850,“Background Color” on page 854, “Background Effects” on page 855, “Border” onpage 857, “Box Type” on page 860, “Classes” on page 865, “Clickable Region” onpage 865, “Conditional Styles” on page 868, “Data Format” on page 874, “Direction& Justification” on page 880, “Drill-Through Definitions” on page 883,“Expression” on page 886, “Font” on page 888, “Foreground Color” on page 889,“Hierarchy” on page 894, “Hierarchy Unique Name” on page 894, “HorizontalAlignment” on page 895, “Level” on page 902, “Level Unique Name” on page 902,“Member” on page 910, “Member Unique Name” on page 911, “Padding” on page921, “Property Unique Name” on page 928, “Rollup Aggregate Function” on page936, “Root Members Only” on page 936, “Set Definition” on page 940, “SetSorting” on page 940, “Size & Overflow” on page 945, “Spacing & Breaking” onpage 948, “Style Variable” on page 950, “Vertical Alignment” on page 965, “WhiteSpace” on page 966
Crosstab IntersectionAn intersection in a crosstab. The cell contents of a specific intersection can beoverridden and the style defined.
Properties of Crosstab Intersection
“Aggregate Function” on page 847, “Background Color” on page 854, “BackgroundEffects” on page 855, “Border” on page 857, “Box Type” on page 860, “Classes” onpage 865, “Clickable Region” on page 866, “Column Coordinate” on page 867,“Conditional Styles” on page 868, “Data Format” on page 874, “Define Contents”on page 878, “Direction & Justification” on page 880, “Drill-Through Definitions”on page 883, “Expression” on page 886, “Font” on page 888, “Foreground Color”on page 889, “Hierarchy” on page 894, “Hierarchy Unique Name” on page 894,“Horizontal Alignment” on page 895, “Level” on page 902, “Level Unique Name”on page 902
Appendix G. Report Studio Object and Property Reference 789

on page 900, “Member” on page 910, “Member Unique Name” on page 911,“Padding” on page 921, “Property Unique Name” on page 928, “Rollup AggregateFunction” on page 936, “Root Members Only” on page 936, “Row Coordinate” onpage 937, “Set Definition” on page 940, “Set Sorting” on page 940, “Size &Overflow” on page 945, “Spacing & Breaking” on page 948, “Style Variable” onpage 950, “Vertical Alignment” on page 965, “White Space” on page 966
Crosstab Member Fact CellsThe contents of the fact cells of a crosstab node member.
Properties of Crosstab Member Fact Cells
“Aggregate Function” on page 847, “Background Color” on page 854, “BackgroundEffects” on page 855, “Border” on page 857, “Box Type” on page 860, “Classes” onpage 865, “Clickable Region” on page 866, “Conditional Styles” on page 868, “DataFormat” on page 874, “Define Contents” on page 878, “Direction & Justification”on page 880, “Drill-Through Definitions” on page 883, “Expression” on page 886,“Font” on page 888, “Foreground Color” on page 889, “Hierarchy” on page 894,“Hierarchy Unique Name” on page 894, “Horizontal Alignment” on page 895,“Level” on page 902, “Level Unique Name” on page 902, “Member” on page 910,“Member Unique Name” on page 911, “Padding” on page 921, “Property UniqueName” on page 928, “Rollup Aggregate Function” on page 936, “Root MembersOnly” on page 936, “Set Definition” on page 940, “Set Sorting” on page 940, “Size& Overflow” on page 945, “Spacing & Breaking” on page 948, “Style Variable” onpage 950, “Vertical Alignment” on page 965, “White Space” on page 966
Crosstab Node MemberA member in the crosstab node.
Properties of Crosstab Node Member
“Aggregate Function” on page 847, “Background Color” on page 854, “BackgroundEffects” on page 855, “Border” on page 857, “Box Type” on page 860, “Classes” onpage 865, “Clickable Region” on page 866, “Conditional Styles” on page 868, “DataFormat” on page 874, “Data Item” on page 874, “Direction & Justification” on page880, “Drill-Through Definitions” on page 883, “Expression” on page 886, “Font” onpage 888, “Foreground Color” on page 889, “Hierarchy” on page 894, “HierarchyUnique Name” on page 894, “Horizontal Alignment” on page 895, “Level” on page902, “Level Indentation” on page 902, “Level Unique Name” on page 902,“Member” on page 910, “Member Unique Name” on page 911, “Node Coordinate”on page 917, “Padding” on page 921, “Pagination” on page 921, “Properties” onpage 927, “Property Unique Name” on page 928, “Rollup Aggregate Function” onpage 936, “Root Members Only” on page 936, “Set Definition” on page 940, “SetSorting” on page 940, “Size & Overflow” on page 945, “Sorting” on page 947,“Spacing & Breaking” on page 948, “Style Variable” on page 950, “VerticalAlignment” on page 965, “Visible” on page 965, “White Space” on page 966
Crosstab RowsOverrides the style for Crosstab Row Member objects that is defined in theGlobalReportStyles.css file.
790 IBM Cognos Report Studio Version 10.2.1: User Guide

Properties of Crosstab Rows
“Background Color” on page 854, “Background Effects” on page 855, “Border” onpage 857, “Box Type” on page 860, “Conditional Styles” on page 868, “DataFormat” on page 874, “Direction & Justification” on page 880, “Font” on page 888,“Foreground Color” on page 889, “Horizontal Alignment” on page 895, “Padding”on page 921, “Size & Overflow” on page 945, “Spacing & Breaking” on page 948,“Style Variable” on page 950, “Vertical Alignment” on page 965, “White Space” onpage 966
Crosstab RowsA list of rows in a crosstab.
Properties of Crosstab Rows
“Background Color” on page 854, “Background Effects” on page 855, “Border” onpage 857, “Box Type” on page 860, “Conditional Styles” on page 868, “DataFormat” on page 874, “Direction & Justification” on page 880, “Font” on page 888,“Foreground Color” on page 889, “Horizontal Alignment” on page 895, “Padding”on page 921, “Size & Overflow” on page 945, “Spacing & Breaking” on page 948,“Style Variable” on page 950, “Vertical Alignment” on page 965, “White Space” onpage 966
Crosstab SpaceInserts an empty cell on a crosstab edge. Allows for the insertion of non-data cellson an edge.
Properties of Crosstab Space
“Background Color” on page 854, “Background Effects” on page 855, “Border” onpage 857, “Box Type” on page 860, “Classes” on page 865, “Clickable Region” onpage 866, “Conditional Styles” on page 868, “Data Format” on page 874, “Direction& Justification” on page 880, “Drill-Through Definitions” on page 883, “Font” onpage 888, “Foreground Color” on page 889, “Horizontal Alignment” on page 895,“Node Coordinate” on page 917, “Padding” on page 921, “Pagination” on page921, “Render Fact Cells” on page 931, “Size & Overflow” on page 945, “Spacing &Breaking” on page 948, “Style Variable” on page 950, “Vertical Alignment” on page965, “Visible” on page 965, “White Space” on page 966
Crosstab SummaryThe crosstab summary that appears in executed active reports.
Properties of Crosstab Summary
“Background Color” on page 854, “Background Effects” on page 855, “Border” onpage 857, “Box Type” on page 860, “Classes” on page 865, “Clickable Region” onpage 866, “Conditional Styles” on page 868, “Data Format” on page 874, “DataItem” on page 874, “Direction & Justification” on page 880, “Font” on page 888,“Foreground Color” on page 889, “Horizontal Alignment” on page 895, “NodeCoordinate” on page 917, “Output Aggregation Method” on page 920, “Padding”on page 921, “Size & Overflow” on page 945, “Solve Order” on page 946, “Spacing& Breaking” on page 948, “Style Variable” on page 950, “Vertical Alignment” onpage 965, “Visible” on page 965, “White Space” on page 966
Appendix G. Report Studio Object and Property Reference 791

Cumulation LabelA label that is rendered for the cumulation line in a Pareto chart.
Properties of Cumulation Label
“Conditional Styles” on page 868, “Data Format” on page 874, “Properties” onpage 927, “Query” on page 928
Cumulation LineThe cumulation line in a Pareto chart.
Properties of Cumulation Line
“Axis Labels” on page 852, “Axis Line” on page 853, “Axis Range” on page 853,“Axis Title” on page 854, “Axis Title” on page 853, “Gridlines” on page 892,“Minor Gridlines” on page 912, “Number of Minor Intervals” on page 918
Cumulation LineA line that shows the cumulative effect of multiple series members on a measure ina Pareto chart. This object applies only to legacy charts.
Properties of Cumulation Line
“Cumulation Axis” on page 872, “Cumulation Label” on page 872, “Line Styles” onpage 903, “Marker Shape” on page 906, “Marker Size (pt)” on page 906,“Properties” on page 927, “Value Location:” on page 963, “Values” on page 964
Cumulation LineA line that shows the cumulative effect of multiple series members on a measure ina Pareto chart.
Properties of Cumulation Line
“Cumulation Label” on page 872, “Data Points” on page 877, “Line Style” on page903, “Show Values” on page 944
Cumulation Line AxisThe axis for the cumulation line in a Pareto chart.
Properties of Cumulation Line Axis
“Axis Labels” on page 852, “Axis Line” on page 852, “Axis Title” on page 853,“Classes” on page 865, “Conditional Styles” on page 868, “Data Format” on page874, “Font” on page 888, “Foreground Color” on page 889, “Gridlines” on page892, “Minor Gridlines” on page 912, “Scale Interval” on page 938, “Style Variable”on page 950, “Visible” on page 966
Cumulation Line LabelA label that is rendered with the cumulation line in a Pareto chart. This objectapplies only to legacy charts.
792 IBM Cognos Report Studio Version 10.2.1: User Guide

Properties of Cumulation Line Label
“Aggregate Function” on page 847, “Control Data Item Value” on page 871, “DataItem Label” on page 875, “Data Item Value” on page 875, “Expression” on page886, “Hierarchy” on page 894, “Hierarchy Unique Name” on page 894, “Level” onpage 902, “Level Unique Name” on page 902, “Member” on page 910, “MemberUnique Name” on page 911, “Property Unique Name” on page 928, “ReportExpression” on page 933, “Rollup Aggregate Function” on page 936, “RootMembers Only” on page 936, “Set Definition” on page 940, “Set Sorting” on page940, “Source Type” on page 947, “Text” on page 954, “Text Source Variable” onpage 954
Custom GroupsA group of data items defined by the report author.
Properties of Custom Groups
“Define Custom Grouping” on page 878, “Label” on page 899, “Name” on page913, “Type” on page 959
Data Button BarA data-driven button bar control. Each button label is determined by the dataitems inserted into the control.
Properties of Data Button Bar
“Application Drill-Through” on page 849, “Button Gap” on page 861, “ButtonWidth” on page 861, “Contained Text Direction” on page 870, “Container Select”on page 870, “Control Enable” on page 872, “Direction & Justification” on page880, “Display for Orientation” on page 881, “Master Detail Relationships” on page907, “Name” on page 914, “Orientation” on page 920, “Query” on page 928,“Render Variable” on page 932, “Set Variable Values” on page 941, “Sorting” onpage 947, “Suppression” on page 951
Data Check Box GroupA data-driven check box group control. Each check box label is determined by thedata items inserted into the control.
Properties of Data Check Box Group
“Application Drill-Through” on page 849, “Contained Text Direction” on page 870,“Container Filter” on page 870, “Container Select” on page 870, “Control Enable”on page 872, “Direction & Justification” on page 880, “Display for Orientation” onpage 881, “Master Detail Relationships” on page 907, “Name” on page 914,“Orientation” on page 920, “Query” on page 928, “Render Variable” on page 932,“Set Variable Values” on page 941, “Sorting” on page 947, “Suppression” on page951, “Text Color” on page 954
Data ContainerA set of data that is used to populate a visualization.
Appendix G. Report Studio Object and Property Reference 793

Properties of Data Container
“Application Drill-Through” on page 849, “Container Filter” on page 870,“Container Select” on page 870, “Drill-Through Definitions” on page 883, “MasterDetail Relationships” on page 907, “Name” on page 914, “Nesting Order” on page916, “Query” on page 928, “Set Variable Values” on page 941, “Show Hover” onpage 942, “Tooltips” on page 957
Data DeckA data-driven deck control. Each card in the deck is determined by the data itemsinserted into the control.
Properties of Data Deck
“Application Drill-Through” on page 849, “Container Filter” on page 870,“Container Select” on page 870, “Default Card” on page 877, “Direction &Justification” on page 880, “Display for Orientation” on page 881, “Master DetailRelationships” on page 907, “Name” on page 914, “Query” on page 928, “RenderVariable” on page 932, “Set Variable Values” on page 941, “Size” on page 945,“Slide Animation Direction” on page 946, “Sorting” on page 947, “Suppression” onpage 951
Data Discrete Values SliderA slider control that allows users to slide through discrete values. The values onthe slider are determined by the data items inserted in the control.
Properties of Data Discrete Values Slider
“Animate” on page 849, “Application Drill-Through” on page 849, “Contained TextDirection” on page 870, “Container Filter” on page 870, “Container Select” on page870, “Control Enable” on page 872, “Data Format” on page 874, “Direction &Justification” on page 880, “Display for Orientation” on page 881, “Label Color” onpage 899, “Master Detail Relationships” on page 907, “Name” on page 914,“Orientation” on page 920, “Query” on page 928, “Range Type” on page 930,“Render Variable” on page 932, “Set Variable Values” on page 941, “Show Tooltip”on page 944, “Sorting” on page 947, “Suppression” on page 951, “Tick Interval” onpage 955, “Tick Label Skip Interval” on page 955, “Tick Type” on page 955, “TrackLength” on page 958, “Update Variables Live” on page 959
Data Drop-Down ListA data-driven drop-down list control. The items that appear in the list aredetermined by the data items inserted into the control.
Properties of Data Drop-Down List
“Application Drill-Through” on page 849, “Contained Text Direction” on page 870,“Container Filter” on page 870, “Container Select” on page 870, “Control Enable”on page 872, “Direction & Justification” on page 880, “Display for Orientation” onpage 881, “Master Detail Relationships” on page 907, “Name” on page 914, “NoValue List Item” on page 918, “Query” on page 928, “Render Variable” on page932, “Set Variable Values” on page 941, “Show Icon” on page 943, “Size” on page945, “Sorting” on page 947, “Suppression” on page 951
794 IBM Cognos Report Studio Version 10.2.1: User Guide

Data ItemA set of data values or members.
Properties of Data Item
“Aggregate Function” on page 847, “Calculation Intersection” on page 861,“Detail” on page 879, “Expression” on page 886, “Pre-Sort” on page 926, “RollupAggregate Function” on page 936, “Solve Order” on page 947
Data IteratorA data-driven iterator control that allows users to navigate through values byusing buttons such as previous and next. The values on the iterator are determinedby the data items inserted in the control.
Properties of Data Iterator
“Application Drill-Through” on page 849, “Contained Text Direction” on page 870,“Container Filter” on page 870, “Container Select” on page 870, “Control Enable”on page 872, “Direction & Justification” on page 880, “Display for Orientation” onpage 881, “Iterator First” on page 896, “Iterator Label Area” on page 897, “IteratorLast” on page 897, “Iterator Next” on page 897, “Iterator Previous” on page 897,“Master Detail Relationships” on page 907, “Name” on page 914, “Orientation” onpage 920, “Query” on page 928, “Render Variable” on page 932, “Set VariableValues” on page 941, “Sorting” on page 947, “Suppression” on page 951
Data List BoxA data-driven list box control. The items that appear in the list are determined bythe data items inserted into the control.
Properties of Data List Box
“Application Drill-Through” on page 849, “Contained Text Direction” on page 870,“Container Filter” on page 870, “Container Select” on page 870, “Control Enable”on page 872, “Direction & Justification” on page 880, “Display for Orientation” onpage 881, “Master Detail Relationships” on page 907, “Multi-Select” on page 913,“Name” on page 914, “No Value List Item” on page 918, “Query” on page 928,“Render Variable” on page 932, “Set Variable Values” on page 941, “Size” on page945, “Sorting” on page 947, “Suppression” on page 951
Data Radio Button GroupA data-driven radio button group control. Each radio button label is determined bythe data items inserted into the control.
Properties of Data Radio Button Group
“Application Drill-Through” on page 849, “Contained Text Direction” on page 870,“Container Filter” on page 870, “Container Select” on page 870, “Control Enable”on page 872, “Direction & Justification” on page 880, “Display for Orientation” onpage 881, “Master Detail Relationships” on page 907, “Name” on page 914,“Orientation” on page 920, “Query” on page 928, “Render Variable” on page 932,“Set Variable Values” on page 941, “Sorting” on page 947, “Suppression” on page951, “Text Color” on page 954
Appendix G. Report Studio Object and Property Reference 795

Data Tab ControlA data-driven tab control. The label of each tab is determined by the data itemsinserted into the control.
Properties of Data Tab Control
“Application Drill-Through” on page 849, “Contained Text Direction” on page 870,“Container Select” on page 870, “Direction & Justification” on page 880, “Displayfor Orientation” on page 881, “Master Detail Relationships” on page 907, “Name”on page 914, “Query” on page 928, “Render Variable” on page 932, “Set VariableValues” on page 941, “Size” on page 945, “Sorting” on page 947, “Suppression” onpage 951, “Tab Orientation” on page 952, “Tab Width” on page 953
Data Toggle Button BarA data-driven toggle button bar control. Each toggle button label is determined bythe data items inserted into the control.
Properties of Data Toggle Button Bar
“Application Drill-Through” on page 849, “Button Gap” on page 861, “ButtonWidth” on page 861, “Contained Text Direction” on page 870, “Container Select”on page 870, “Control Enable” on page 872, “Direction & Justification” on page880, “Display for Orientation” on page 881, “Master Detail Relationships” on page907, “Name” on page 914, “Orientation” on page 920, “Query” on page 928,“Render Variable” on page 932, “Set Variable Values” on page 941, “Sorting” onpage 947, “Suppression” on page 951
DateThe date when the report runs.
Properties of Date
“Background Color” on page 854, “Classes” on page 865, “Data Format” on page874, “Display for Orientation” on page 881, “Font” on page 888, “ForegroundColor” on page 889, “Margin” on page 904, “Relative Alignment” on page 930
Date & Time PromptA prompt control with which you can select a date and time value.
Properties of Date & Time Prompt
“Box Type” on page 860, “Calendar Type” on page 862, “Choices Deselect All Text”on page 864, “Choices Select All Text” on page 864, “Choices Text” on page 864,“Clock Mode” on page 866, “Conditional Styles” on page 868, “Contained TextDirection” on page 870, “Default Selections” on page 878, “Deselect Text” on page879, “Direction & Justification” on page 880, “Display Milliseconds” on page 882,“Display Seconds” on page 882, “First Date” on page 887, “From Text” on page890, “Hide Adornments” on page 893, “Highest Value Text” on page 894, “InsertText” on page 896, “Last Date” on page 900, “Lowest Value Text” on page 904,“Multi-Select” on page 913, “Name” on page 914, “Parameter” on page 922,“Range” on page 929, “Remove Text” on page 931, “Render Variable” on page 932,“Required” on page 934, “Select UI” on page 939, “Style Variable” on page 950,“To Text” on page 958, “Visible” on page 966
796 IBM Cognos Report Studio Version 10.2.1: User Guide

Date PromptA prompt control with which you can to select a date value.
Properties of Date Prompt
“Box Type” on page 860, “Calendar Type” on page 862, “Choices Deselect All Text”on page 864, “Choices Select All Text” on page 864, “Choices Text” on page 864,“Conditional Styles” on page 868, “Contained Text Direction” on page 870,“Default Selections” on page 878, “Deselect Text” on page 879, “Direction &Justification” on page 880, “First Date” on page 887, “From Text” on page 890,“Hide Adornments” on page 893, “Highest Value Text” on page 894, “Insert Text”on page 896, “Last Date” on page 900, “Lowest Value Text” on page 904,“Multi-Select” on page 913, “Name” on page 914, “Parameter” on page 922,“Range” on page 929, “Relative Alignment” on page 930, “Remove Text” on page931, “Render Variable” on page 932, “Required” on page 934, “Select UI” on page939, “Style Variable” on page 950, “To Text” on page 958, “Visible” on page 966
DeckA static deck control. Each card in the deck requires a corresponding row in thedata table of the control.
Properties of Deck
“Application Drill-Through” on page 849, “Container Filter” on page 870,“Container Select” on page 870, “Current Card” on page 873, “Deck CardsDefinition” on page 877, “Default Card” on page 877, “Direction & Justification”on page 880, “Display for Orientation” on page 881, “Name” on page 914, “RenderVariable” on page 932, “Set Variable Values” on page 941, “Size” on page 945,“Slide Animation Direction” on page 946
Default MeasureA default measure for the chart. If the chart measure cannot be determined by thedata series rendered on the chart edges, the default measure is used. This objectapplies only to legacy charts.
Properties of Default Measure
“Conditional Styles” on page 868, “Custom Label” on page 873, “Data Format” onpage 874, “Style Variable” on page 950
Default MeasureA default measure for the chart. If the chart measure cannot be determined by thedata series rendered on the chart edges, the default measure is used.
Properties of Default Measure
“Conditional Styles” on page 868, “Custom Label” on page 873, “Data Format” onpage 874
Default MeasureWhen using a dimensional data source, the default measure for the visualization. Ifthe visualization measure cannot be determined by the data series that is renderedon the visualization edges, the default measure is used.
Appendix G. Report Studio Object and Property Reference 797

Detail FilterA set of conditions in a query that narrow the scope of the data returned. A detailfilter is applied before aggregation is complete.
Properties of Detail Filter
“Application” on page 849, “Definition” on page 879, “Usage” on page 960
DimensionA grouping of descriptive information about an aspect of a business. Dimensionscontain levels, whose order defines the hierarchy of organizational structures anddata. Dimensions and levels are values by which measures can be viewed, filtered,or aggregated.
Properties of Dimension
“Name” on page 915
Dimensional Edge SummaryA summary that appears on the edge of a crosstab.
Properties of Dimensional Edge Summary
“Aggregate Data Item” on page 847, “Aggregation Method” on page 847,“Calculation Intersection” on page 861, “Dimension” on page 880, “Hierarchy” onpage 894, “Label” on page 899, “Name” on page 913, “Solve Order” on page 947,“Type” on page 959, “Use Set Aggregation” on page 962
Discrete Values SliderA static slider control that allows users to slide through discrete values. Each valuein the slider comes from a row in the data table of the control.
Properties of Discrete Values Slider
“Animate” on page 849, “Application Drill-Through” on page 849, “Contained TextDirection” on page 870, “Container Filter” on page 870, “Container Select” on page870, “Control Enable” on page 872, “Data Format” on page 874, “Direction &Justification” on page 880, “Display for Orientation” on page 881, “Label Color” onpage 899, “Name” on page 914, “Orientation” on page 920, “Range Type” on page930, “Render Variable” on page 932, “Set Variable Values” on page 941, “ShowTooltip” on page 944, “Slider Values Definition” on page 946, “Tick Interval” onpage 955, “Tick Label Skip Interval” on page 955, “Tick Type” on page 955, “TrackLength” on page 958, “Update Variables Live” on page 959
Display LayerA map layer that is there for appearance only. Display layers do not correspond todata series or measures.
Properties of Display Layer
“Border Color” on page 858, “Borders” on page 858, “Conditional Styles” on page868, “Fill Effects” on page 887, “Show Labels” on page 943, “Style Variable” onpage 950
798 IBM Cognos Report Studio Version 10.2.1: User Guide

Drop-Down ListA static drop-down list control. Each item in the list requires a corresponding rowin the data table of the control.
Properties of Drop-Down List
“Application Drill-Through” on page 849, “Contained Text Direction” on page 870,“Container Filter” on page 870, “Container Select” on page 870, “Control Enable”on page 872, “Direction & Justification” on page 880, “Display for Orientation” onpage 881, “List Items Definition” on page 904, “Name” on page 914, “No ValueList Item” on page 918, “Render Variable” on page 932, “Set Variable Values” onpage 941, “Show Icon” on page 943, “Size” on page 945
Edge SummaryA summary that appears on the edge of a crosstab.
Properties of Edge Summary
“Aggregate Data Item” on page 847, “Aggregation Method” on page 847,“Calculation Intersection” on page 861, “Label” on page 899, “Name” on page 913,“Solve Order” on page 947, “Type” on page 959, “Use Set Aggregation” on page962
Equation LabelAn equation label for a trendline that is displayed on a chart.
Properties of Equation Label
“Conditional Styles” on page 868, “Data Format” on page 874
Equation LabelAn equation label for a trendline displayed on a chart.
Properties of Equation Label
“Background Effects” on page 855, “Conditional Styles” on page 868, “Font” onpage 888, “Foreground Color” on page 889, “Horizontal Alignment” on page 895,“Position” on page 925
Explicit Member SetA set of data items that define an explicit set of members.
Properties of Explicit Member Set
“Detail” on page 879, “Dimension” on page 880, “Hierarchy” on page 894, “Label”on page 899, “Members” on page 911, “Name” on page 913, “Set Sorting” on page940, “Type” on page 959
Extra CategoryA data item that is used for filtering or setting variables. The item is not visible inthe visualization.
Appendix G. Report Studio Object and Property Reference 799

Extra ValueA measure or single value that is used for filtering or setting variables. The item isnot visible in the visualization.
FactThe central values that are aggregated and analyzed. Also known as measures,they are special business measurement values, such as sales or inventory levels.
Properties of Fact
“Data Item” on page 875, “Name” on page 915
Field SetA container with a caption, into which you can insert other objects. It is similar toa block object, except that it also has a caption.
Properties of Field Set
“Background Color” on page 854, “Border” on page 857, “Box Type” on page 859,“Classes” on page 865, “Conditional Styles” on page 868, “Display for Orientation”on page 881, “Font” on page 888, “Foreground Color” on page 889, “HorizontalAlignment” on page 895, “Margin” on page 904, “Name” on page 914, “RelativeAlignment” on page 930, “Render Variable” on page 932, “Show Caption” on page941, “Size & Overflow” on page 945, “Style Variable” on page 950, “Visible” onpage 966
Gauge AxisThe axis on the face of the gauge that contains gauge indicators, such as dataranges, color ranges, and interval markers.
Properties of Gauge Axis
“Aggregate Function” on page 847, “Axis Angles” on page 851, “Axis Justification”on page 852, “Axis Labels” on page 852, “Axis Line” on page 853, “Axis Range” onpage 853, “Axis Title” on page 854, “Conditional Palette” on page 868,“Expression” on page 886, “Gauge Axis Colors” on page 890, “Gauge Axis InnerRadius” on page 890, “Gauge Axis Outer Radius” on page 890, “Gauge Needle” onpage 891, “Gridlines” on page 892, “Hierarchy” on page 894, “Hierarchy UniqueName” on page 894, “Level” on page 902, “Level Unique Name” on page 902,“Member” on page 910, “Member Unique Name” on page 911, “Minor Gridlines”on page 912, “Number of Minor Intervals” on page 918, “Palette” on page 922,“Property Unique Name” on page 928, “Rollup Aggregate Function” on page 936,“Root Members Only” on page 936, “Set Definition” on page 940, “Set Sorting” onpage 940, “Text Orientation” on page 954
Gauge ChartA chart that plots a data series against a measure using a dial or gauge for themeasure, and needles or indicators for the series members.
Properties of Gauge Chart
“Alternate Text” on page 848, “Application Drill-Through” on page 849,“Background Effects” on page 855, “Border” on page 857, “Box Type” on page 859,
800 IBM Cognos Report Studio Version 10.2.1: User Guide

“Classes” on page 865, “Clickable Regions” on page 866, “Contained TextDirection” on page 870, “Container Select” on page 870, “Dial Face Fill” on page880, “Direction & Justification” on page 880, “Display for Orientation” on page 881,“Drill-Through Definitions” on page 883, “Drop Shadow” on page 884, “GaugeAxes” on page 890, “Gauge Border” on page 891, “Gauge Pivot” on page 891,“Legend” on page 901, “Margin” on page 904, “Master Detail Relationships” onpage 907, “Matrix Rows and Columns” on page 908, “Maximum Hotspots” onpage 908, “Name” on page 914, “No Data Contents” on page 916, “Notes” on page917, “Padding” on page 921, “Pagination” on page 921, “Query” on page 928,“Relative Alignment” on page 930, “Render Page when Empty” on page 931,“Render Variable” on page 932, “Set Variable Values” on page 941, “Show Hover”on page 942, “Show Pointer Cursor” on page 943, “Size & Overflow” on page 945,“Suppression” on page 951, “Title” on page 955, “Tooltips” on page 956, “Visible”on page 966
Gauge ChartA chart that plots a data series against a measure using a dial or gauge for themeasure, and needles or indicators for the series members. This object applies onlyto legacy charts.
Properties of Gauge Chart
“Alternate Text” on page 848, “Application Drill-Through” on page 849, “AxisTitle” on page 853, “Background Color” on page 854, “Background Effects” onpage 855, “Border” on page 857, “Border Color” on page 858, “Borders” on page858, “Box Type” on page 859, “Classes” on page 865, “Clickable Regions” on page866, “Conditional Palette” on page 868, “Container Select” on page 870, “DialOutline Color” on page 880, “Display for Orientation” on page 881, “Drill-ThroughDefinitions” on page 883, “Face Color” on page 886, “Gauge Labels” on page 891,“Gauge Palette” on page 891, “Legend” on page 900, “Margin” on page 904,“Master Detail Relationships” on page 907, “Maximum Hotspots” on page 908,“Name” on page 914, “No Data Contents” on page 916, “Notes” on page 917,“Numerical Axis” on page 919, “Padding” on page 921, “Pagination” on page 921,“Palette” on page 922, “Query” on page 928, “Relative Alignment” on page 930,“Render Page when Empty” on page 931, “Render Variable” on page 932, “SetVariable Values” on page 941, “Show Hover” on page 942, “Show Pointer Cursor”on page 943, “Size & Overflow” on page 945, “Suppression” on page 951, “Title”on page 955, “Tooltips” on page 957, “Visible” on page 966
Gauge LabelsA label for each gauge in a multiple gauge chart.
Properties of Gauge Labels
“Classes” on page 865, “Conditional Styles” on page 868, “Drill-ThroughDefinitions” on page 883, “Font” on page 888, “Foreground Color” on page 889,“Horizontal Alignment” on page 895, “Maximum Truncation Characters” on page909, “Style Variable” on page 950, “Truncation” on page 958, “Truncation Text” onpage 959, “Visible” on page 966
Gauge Numerical AxisThe numeric axis for the gauge chart, including labels, titles, range, and scale.
Appendix G. Report Studio Object and Property Reference 801

Properties of Gauge Numerical Axis
“Conditional Styles” on page 868, “Data Format” on page 874, “Font” on page 888,“Foreground Color” on page 889, “Gridlines” on page 892, “Include Zero For AutoScale” on page 896, “Maximum Value” on page 910, “Minimum Value” on page912, “Minor Gridlines” on page 912, “Scale” on page 937, “Scale Interval” on page938, “Style Variable” on page 950, “Use Same Range For All Instances” on page962, “Visible” on page 966
Generated PromptA control that acts as a placeholder. The report server will replace this control withan appropriate generated prompt control, as if it was on a generated prompt page.
Properties of Generated Prompt
“Hide Adornments” on page 893, “Name” on page 914, “Parameter” on page 922,“Render Variable” on page 932, “Required” on page 934
Hierarchy SetA set of data items that define the members of a hierarchy.
Properties of Hierarchy Set
“Detail” on page 879, “Dimension” on page 880, “Hierarchy” on page 894,“Hierarchy Unique Name” on page 894, “Label” on page 899, “Name” on page913, “Root Members Only” on page 936, “Set Sorting” on page 940, “Type” onpage 959
HTML ItemA container into which you can add HTML, such as a link to a multimedia file.HTML items will only appear when you run the report in HTML format.
When you upgrade to the next version of IBM® Cognos® Business Intelligence, thereport upgrade processes do not account for the use of undocumented andunsupported mechanisms or features such as JavaScript that refers to IBM CognosHTML items.
Properties of HTML Item
“Aggregate Function” on page 847, “Control Data Item Value” on page 871, “DataItem Label” on page 875, “Data Item Value” on page 876, “Description” on page879, “Expression” on page 886, “Hierarchy” on page 894, “Hierarchy UniqueName” on page 894, “HTML” on page 895, “HTML Source Variable” on page 896,“Level” on page 902, “Level Unique Name” on page 902, “Member” on page 910,“Member Unique Name” on page 911, “Name” on page 914, “Property UniqueName” on page 928, “Render Variable” on page 932, “Report Expression” on page933, “Rollup Aggregate Function” on page 936, “Root Members Only” on page 936,“Set Definition” on page 940, “Set Sorting” on page 940, “Source Type” on page947
HyperlinkA hyperlink that can be defined as a static value, a query item, or as the result of areport expression. If a report expression is used, then the other values are ignored.
802 IBM Cognos Report Studio Version 10.2.1: User Guide

Properties of Hyperlink
“Background Color” on page 854, “Border” on page 857, “Box Type” on page 859,“Classes” on page 865, “Conditional Styles” on page 868, “Control Data ItemValue” on page 871, “Control Data Item Value” on page 871, “Data Item Label” onpage 875, “Data Item Label” on page 875, “Data Item Value” on page 876, “DataItem Value” on page 875, “Direction & Justification” on page 880, “Display forOrientation” on page 881, “Font” on page 888, “Foreground Color” on page 889,“Margin” on page 904, “Name” on page 914, “Padding” on page 921, “RelativeAlignment” on page 930, “Render Variable” on page 932, “Report Expression” onpage 933, “Report Expression” on page 933, “Size & Overflow” on page 945,“Source Type” on page 947, “Source Type” on page 947, “Spacing & Breaking” onpage 948, “Style Variable” on page 950, “Text” on page 954, “Text Source Variable”on page 954, “URL” on page 960, “URL Source Variable” on page 960, “Visible” onpage 966
Hyperlink ButtonA hyperlink that is formatted as a button. The hyperlink can be defined as a staticvalue, a query item, or as the result of a report expression. If a report expression isused, then the other values are ignored.
Properties of Hyperlink Button
“Background Color” on page 854, “Border” on page 857, “Classes” on page 865,“Conditional Styles” on page 868, “Control Data Item Value” on page 871, “ControlData Item Value” on page 871, “Data Item Label” on page 875, “Data Item Label”on page 875, “Data Item Value” on page 876, “Data Item Value” on page 875,“Display for Orientation” on page 881, “Foreground Color” on page 889, “Margin”on page 904, “Name” on page 914, “Padding” on page 921, “Relative Alignment”on page 930, “Render Variable” on page 932, “Report Expression” on page 933,“Report Expression” on page 933, “Size & Overflow” on page 945, “Source Type”on page 947, “Source Type” on page 947, “Style Variable” on page 950, “Text” onpage 954, “Text Source Variable” on page 954, “URL” on page 960, “URL SourceVariable” on page 960
ImageA link to an image file. The link can be a static value, or it can come from a reportexpression or query item. Use the URL source properties of the image object todefine the link.
Properties of Image
“Aggregate Function” on page 847, “Alternate Text” on page 848, “BackgroundColor” on page 854, “Border” on page 857, “Box Type” on page 859, “Classes” onpage 865, “Conditional Styles” on page 868, “Control Data Item Value” on page871, “Data Item Label” on page 875, “Data Item Value” on page 876, “Display forOrientation” on page 881, “Drill-Through Definitions” on page 883, “Expression”on page 886, “Hierarchy” on page 894, “Hierarchy Unique Name” on page 894,“Level” on page 902, “Level Unique Name” on page 902, “Margin” on page 904,“Member” on page 910, “Member Unique Name” on page 911, “Name” on page914, “Property Unique Name” on page 928, “Relative Alignment” on page 930,“Render Variable” on page 932, “Report Expression” on page 933, “RollupAggregate Function” on page 936, “Root Members Only” on page 936, “SetDefinition” on page 940, “Set Sorting” on page 940, “Size & Overflow” on page945, “Source Type” on page 947, “Style Variable” on page 950, “URL” on page 960,
Appendix G. Report Studio Object and Property Reference 803

“URL Source Variable” on page 960, “Visible” on page 966
Intersection (Tuple)A data item obtained from the combination of two or more members that youspecify. An intersection appears as a single, unified member instead of itscomponent members. Each member must be from a different dimension.
Properties of Intersection (Tuple)
“Dimension” on page 880, “Hierarchy” on page 894, “Label” on page 899,“Members” on page 911, “Name” on page 913, “Type” on page 959
Interval PromptAn advanced prompt control that allows you to enter time duration values.
Properties of Interval Prompt
“Box Type” on page 860, “Choices Deselect All Text” on page 864, “Choices SelectAll Text” on page 864, “Choices Text” on page 864, “Conditional Styles” on page868, “Contained Text Direction” on page 870, “Days Text” on page 877, “DefaultSelections” on page 878, “Deselect Text” on page 879, “Direction & Justification” onpage 880, “Display Milliseconds” on page 882, “Display Seconds” on page 882,“From Text” on page 890, “Hide Adornments” on page 893, “Highest Value Text”on page 894, “Hours Text” on page 895, “Insert Text” on page 896, “Lowest ValueText” on page 904, “Milliseconds Text” on page 911, “Minutes Text” on page 913,“Multi-Select” on page 913, “Name” on page 914, “Parameter” on page 922,“Range” on page 929, “Remove Text” on page 931, “Render Variable” on page 932,“Required” on page 934, “Seconds Text” on page 938, “Style Variable” on page 950,“To Text” on page 958, “Visible” on page 966
IteratorA static iterator control that allows users to navigate through values by usingbuttons such as previous and next. Each value in the iterator comes from a row inthe data table of the control.
Properties of Iterator
“Application Drill-Through” on page 849, “Contained Text Direction” on page 870,“Container Filter” on page 870, “Container Select” on page 870, “Control Enable”on page 872, “Direction & Justification” on page 880, “Display for Orientation” onpage 881, “Iterator First” on page 896, “Iterator Label Area” on page 897, “IteratorLast” on page 897, “Iterator Next” on page 897, “Iterator Previous” on page 897,“Iterator Values Definition” on page 897, “Name” on page 914, “Orientation” onpage 920, “Render Variable” on page 932, “Set Variable Values” on page 941
Iterator Extra ItemA data item that is used to determine the data that appears in an iterator control.
Properties of Iterator Extra Item
“Data Item” on page 874
804 IBM Cognos Report Studio Version 10.2.1: User Guide

Iterator FirstThe button in the iterator that moves the control to the first value.
Properties of Iterator First
“Button Width” on page 861, “Label” on page 899, “Select UI” on page 938, “TextColor” on page 954
Iterator Label AreaThe area in the iterator that shows the label of the current value.
Properties of Iterator Label Area
“Active Dot Color” on page 846, “Dot Color” on page 883, “Drop-Down Width” onpage 884, “Number Style” on page 919, “Select UI” on page 939, “Show Icon” onpage 943, “Text Color” on page 954
Iterator LastThe button in the iterator that moves the control to the last value.
Properties of Iterator Last
“Button Width” on page 861, “Label” on page 899, “Select UI” on page 938, “TextColor” on page 954
Iterator NextThe button in the iterator that moves the control to the next value.
Properties of Iterator Next
“Button Width” on page 861, “Label” on page 899, “Select UI” on page 938, “TextColor” on page 954
Iterator PreviousThe button in the iterator that moves the control to the previous value.
Properties of Iterator Previous
“Button Width” on page 861, “Label” on page 899, “Select UI” on page 938, “TextColor” on page 954
Iterator Value IconThe icon used to identify each value in an iterator control. The icons are obtainedfrom a data item inserted into the control.
Properties of Iterator Value Icon
“Data Item” on page 874
Iterator Value LabelThe label used to identify each value in a data iterator control. Each label isdetermined by the data items inserted into the control.
Appendix G. Report Studio Object and Property Reference 805

Properties of Iterator Value Label
“Data Item” on page 874
JoinA relationship between a field in one table or query and a field of the same datatype in another table or query.
Properties of Join
“Join Relationships” on page 897
KeyAn object that uniquely identifies members of a level.
If the unique identifier is a primary or alternate key, you need only one key object.If the unique identifier is a composite key, you need one key object for every dataitem that participates in making the members of a level unique.
Properties of Key
“Data Item” on page 875, “Name” on page 916
LabelSpecifies the text, or label, for the object in a chart.
Properties of Label
“Conditional Styles” on page 868, “Data Format” on page 874, “Master DetailRelationships” on page 907, “Properties” on page 927, “Query” on page 928,“Render Variable” on page 932
Layout Component ReferenceA reference to another layout object. Before you can reference an object, its IDproperty must be set.
Properties of Layout Component Reference
“Component Reference” on page 868, “Embed” on page 884, “Overrides” on page921
LegendA key to the patterns or colors assigned to the data series in a chart. This objectapplies only to legacy charts.
Properties of Legend
“Absolute Position” on page 846, “Auto Truncation” on page 851, “BackgroundColor” on page 854, “Border Color” on page 858, “Borders” on page 858, “BottomPosition (px)” on page 859, “Box Type” on page 860, “Classes” on page 865,“Conditional Styles” on page 868, “Drill-Through Definitions” on page 883, “FillEffects” on page 887, “Font” on page 888, “Font Auto-Sizing” on page 889,“Foreground Color” on page 889, “Horizontal Alignment” on page 895, “Left
806 IBM Cognos Report Studio Version 10.2.1: User Guide

Position (px)” on page 900, “Legend Title” on page 901, “Legend Title” on page901, “Maximum Characters” on page 908, “Position” on page 925, “Right Position(px)” on page 936, “Separator” on page 939, “Show Legend Values” on page 943,“Style Variable” on page 950, “Top Position (px)” on page 957, “Truncation Text”on page 959, “Visible” on page 966
LegendA key to the patterns or colors assigned to the data series in a chart.
Properties of Legend
“Auto Font Size” on page 850, “Background Effects” on page 855, “Classes” onpage 865, “Conditional Styles” on page 868, “Drill-Through Definitions” on page883, “Font” on page 888, “Foreground Color” on page 889, “Horizontal Alignment”on page 895, “Legend Separator” on page 901, “Legend Title” on page 901,“Legend Title” on page 901, “Render Variable” on page 932, “Show Values” onpage 944, “Text Truncation” on page 954
Legend TitleThe title for the legend, including the title text and text style. If this object isempty, a default title is rendered, if available. This object applies only to legacycharts.
Properties of Legend Title
“Box Type” on page 860, “Classes” on page 865, “Conditional Styles” on page 868,“Default Title” on page 878, “Horizontal Alignment” on page 895, “Master DetailRelationships” on page 907, “Properties” on page 927, “Query” on page 928, “StyleVariable” on page 950
Legend TitleThe title for the legend, including the title text and text style. If this object isempty, a default title is rendered, if available.
Properties of Legend Title
“Auto Font Size” on page 850, “Box Type” on page 860, “Classes” on page 865,“Conditional Styles” on page 868, “Default Title” on page 878, “HorizontalAlignment” on page 895, “Master Detail Relationships” on page 907, “Properties”on page 927, “Query” on page 928, “Render Variable” on page 932
LevelA set of members with a predefined set of similar characteristics. For example, themembers Year 2011 and Year 2012 in the Time dimension form a year level, whilethe corresponding quarters form a quarter level.
Properties of Level
“Caption” on page 862, “Name” on page 915, “Sorting” on page 947
Level HierarchySpecifies how the levels in a dimension are logically ordered.
Appendix G. Report Studio Object and Property Reference 807

Properties of Level Hierarchy
“Name” on page 916
Level SetA set of data items that define the members of a level.
Properties of Level Set
“Detail” on page 879, “Dimension” on page 880, “Hierarchy” on page 894, “Label”on page 899, “Level” on page 902, “Level Unique Name” on page 902, “Name” onpage 913, “Set Sorting” on page 940, “Type” on page 959
LineThe data marker used to represent a data series in a line chart.
Properties of Line
“Aggregate Function” on page 847, “Chart Type” on page 863, “ConditionalPalette” on page 868, “Expression” on page 886, “Hierarchy” on page 894,“Hierarchy Unique Name” on page 894, “Level” on page 902, “Level UniqueName” on page 902, “Line and Markers” on page 902, “Line Shape” on page 903,“Member” on page 910, “Member Unique Name” on page 911, “Palette” on page922, “Property Unique Name” on page 928, “Rollup Aggregate Function” on page936, “Root Members Only” on page 936, “Series Type” on page 940, “SetDefinition” on page 940, “Set Sorting” on page 940, “Show Values” on page 944,“Value Markers” on page 963
LineThe data marker used to represent a data series in a line chart. This object appliesonly to legacy charts.
Properties of Line
“Axis Assignment” on page 852, “Border Color” on page 858, “Borders” on page858, “Chart Type” on page 863, “Grouping Type” on page 892, “Line Style” onpage 903, “Line Type” on page 903, “Line Weight (pt)” on page 903, “Show DataPoints” on page 942, “Show line” on page 943, “Value Location:” on page 963,“Values” on page 964, “Value Type” on page 965
ListA layout object that is used to present query results in a list fashion.
Properties of List
“Application Drill-Through” on page 849, “Background Color” on page 854,“Border” on page 857, “Box Type” on page 859, “Classes” on page 865, “ClickableRegions” on page 866, “Column Titles” on page 867, “Conditional Styles” on page868, “Container Filter” on page 870, “Container Select” on page 870, “ContentsHeight” on page 871, “Direction & Justification” on page 880, “Display forOrientation” on page 881, “Drop Shadow” on page 884, “Font” on page 888,“Foreground Color” on page 889, “Grouping & Sorting” on page 892, “HorizontalAlignment” on page 895, “Margin” on page 904, “Master Detail Relationships” onpage 907, “Name” on page 914, “No Data Contents” on page 916, “Pagination” onpage 921
808 IBM Cognos Report Studio Version 10.2.1: User Guide

page 919, “Properties” on page 927, “Query” on page 928, “Relative Alignment” onpage 930, “Render Page when Empty” on page 931, “Render Variable” on page932, “Rows Per Page” on page 937, “Set Variable Values” on page 941, “ShareResult Set” on page 941, “Show Hover” on page 942, “Show Pointer Cursor” onpage 943, “Size & Overflow” on page 945, “Style Variable” on page 950, “SummaryText” on page 951, “Suppression” on page 951, “Table Properties” on page 952,“Visible” on page 966
List BoxA static list box control. Each item in the list requires a corresponding row in thedata table of the control.
Properties of List Box
“Application Drill-Through” on page 849, “Contained Text Direction” on page 870,“Container Filter” on page 870, “Container Select” on page 870, “Control Enable”on page 872, “Direction & Justification” on page 880, “Display for Orientation” onpage 881, “List Items Definition” on page 904, “Multi-Select” on page 913, “Name”on page 914, “No Value List Item” on page 918, “Render Variable” on page 932,“Set Variable Values” on page 941, “Size” on page 945
List CellA cell in a row, you can use for a list header or footer.
Properties of List Cell
“Aggregate Function” on page 847, “Background Color” on page 854, “BackgroundEffects” on page 855, “Border” on page 857, “Box Type” on page 860, “Classes” onpage 865, “Conditional Styles” on page 868, “Data Format” on page 874, “Direction& Justification” on page 880, “Expression” on page 886, “Font” on page 888,“Foreground Color” on page 889, “Hierarchy” on page 894, “Hierarchy UniqueName” on page 894, “Horizontal Alignment” on page 895, “Level” on page 902,“Level Unique Name” on page 902, “Member” on page 910, “Member UniqueName” on page 911, “Output Aggregation Method” on page 920, “Padding” onpage 921, “Property Unique Name” on page 928, “Rollup Aggregate Function” onpage 936, “Root Members Only” on page 936, “Set Definition” on page 940, “SetSorting” on page 940, “Size & Overflow” on page 945, “Spacing & Breaking” onpage 948, “Style Variable” on page 950, “Table Header” on page 952, “VerticalAlignment” on page 965, “White Space” on page 966
List ColumnA column in a list. Generally, the column will contain a query item, but it may alsocontain any number of layout objects. For example, the To column in a statementlist may present the address in a table format. If the column only contains a queryitems, then the column will automatically span the group if the query item isgrouped.
Properties of List Column
“Allow Sorting” on page 848, “Background Color” on page 854, “BackgroundEffects” on page 855, “Border” on page 857, “Box Type” on page 860, “ClickableRegion” on page 865, “Column Visibility” on page 867, “Conditional Styles” onpage 868, “Data Format” on page 874, “Direction & Justification” on page 880,“Font” on page 888, “Foreground Color” on page 889, “Horizontal Alignment” onpage 895
Appendix G. Report Studio Object and Property Reference 809
page 893, “Padding” on page 921, “Pagination” on page 921, “Render” on page931, “Render Variable” on page 932, “Size & Overflow” on page 945, “Spacing &Breaking” on page 948, “Style Variable” on page 950, “Vertical Alignment” on page965, “White Space” on page 966
List Column BodyThe contents of a column in a list report.
Properties of List Column Body
“Aggregate Function” on page 847, “Allow Sorting” on page 848, “BackgroundColor” on page 854, “Background Effects” on page 855, “Border” on page 857,“Box Type” on page 860, “Classes” on page 865, “Clickable Region” on page 865,“Column Visibility” on page 867, “Conditional Styles” on page 868, “Data Format”on page 874, “Direction & Justification” on page 880, “Drill-Through Definitions”on page 883, “Expression” on page 886, “Font” on page 888, “Foreground Color”on page 889, “Group Span” on page 892, “Hierarchy” on page 894, “HierarchyUnique Name” on page 894, “Horizontal Alignment” on page 895, “Level” on page902, “Level Unique Name” on page 902, “Member” on page 910, “Member UniqueName” on page 911, “Padding” on page 921, “Property Unique Name” on page928, “Rollup Aggregate Function” on page 936, “Root Members Only” on page 936,“Set Definition” on page 940, “Set Sorting” on page 940, “Size & Overflow” onpage 945, “Spacing & Breaking” on page 948, “Style Variable” on page 950,“Vertical Alignment” on page 965, “White Space” on page 966
List ColumnsA set of columns in a list.
Properties of List Columns
“Background Color” on page 854, “Background Effects” on page 855, “Border” onpage 857, “Box Type” on page 860, “Conditional Styles” on page 868, “DataFormat” on page 874, “Direction & Justification” on page 880, “Font” on page 888,“Foreground Color” on page 889, “Horizontal Alignment” on page 895, “Padding”on page 921, “Size & Overflow” on page 945, “Spacing & Breaking” on page 948,“Style Variable” on page 950, “Vertical Alignment” on page 965, “White Space” onpage 966
List ColumnsOverrides the style for List Column objects that is defined in theGlobalReportStyles.css file.
Properties of List Columns
“Background Color” on page 854, “Background Effects” on page 855, “Border” onpage 857, “Box Type” on page 860, “Conditional Styles” on page 868, “DataFormat” on page 874, “Direction & Justification” on page 880, “Font” on page 888,“Foreground Color” on page 889, “Horizontal Alignment” on page 895, “Padding”on page 921, “Size & Overflow” on page 945, “Spacing & Breaking” on page 948,“Style Variable” on page 950, “Vertical Alignment” on page 965, “White Space” onpage 966
810 IBM Cognos Report Studio Version 10.2.1: User Guide

List Columns Body StyleOverrides the style for List Column Body objects that is defined in theGlobalReportStyles.css file.
Properties of List Columns Body Style
“Background Color” on page 854, “Background Effects” on page 855, “Border” onpage 857, “Box Type” on page 860, “Conditional Styles” on page 868, “DataFormat” on page 874, “Direction & Justification” on page 880, “Font” on page 888,“Foreground Color” on page 889, “Horizontal Alignment” on page 895, “Padding”on page 921, “Size & Overflow” on page 945, “Spacing & Breaking” on page 948,“Style Variable” on page 950, “Vertical Alignment” on page 965, “White Space” onpage 966
List Columns Title StyleOverrides the style for List Column Title objects that is defined in theGlobalReportStyles.css file.
Properties of List Columns Title Style
“Background Color” on page 854, “Background Effects” on page 855, “Border” onpage 857, “Box Type” on page 860, “Conditional Styles” on page 868, “DataFormat” on page 874, “Direction & Justification” on page 880, “Font” on page 888,“Foreground Color” on page 889, “Horizontal Alignment” on page 895, “Padding”on page 921, “Size & Overflow” on page 945, “Spacing & Breaking” on page 948,“Style Variable” on page 950, “Vertical Alignment” on page 965, “White Space” onpage 966
List Column TitleThe title of a list column.
Properties of List Column Title
“Aggregate Function” on page 847, “Allow Sorting” on page 848, “BackgroundColor” on page 854, “Background Effects” on page 855, “Border” on page 857,“Box Type” on page 860, “Classes” on page 865, “Clickable Region” on page 865,“Column Visibility” on page 867, “Conditional Styles” on page 868, “Data Format”on page 874, “Direction & Justification” on page 880, “Drill-Through Definitions”on page 883, “Expression” on page 886, “Font” on page 888, “Foreground Color”on page 889, “Hierarchy” on page 894, “Hierarchy Unique Name” on page 894,“Horizontal Alignment” on page 895, “Level” on page 902, “Level Unique Name”on page 902, “Member” on page 910, “Member Unique Name” on page 911,“Padding” on page 921, “Property Unique Name” on page 928, “Rollup AggregateFunction” on page 936, “Root Members Only” on page 936, “Set Definition” onpage 940, “Set Sorting” on page 940, “Size & Overflow” on page 945, “Spacing &Breaking” on page 948, “Style Variable” on page 950, “Vertical Alignment” on page965, “White Space” on page 966
List FooterOverall footer that appears once at the end of lists. Footers are containers in whichyou can insert text, images, data items, and report expressions such as the pagenumber.
Appendix G. Report Studio Object and Property Reference 811

Properties of List Footer
“Background Color” on page 854, “Background Effects” on page 855, “Border” onpage 857, “Box Type” on page 860, “Conditional Styles” on page 868, “DataFormat” on page 874, “Direction & Justification” on page 880, “Font” on page 888,“Foreground Color” on page 889, “Horizontal Alignment” on page 895, “Padding”on page 921, “Properties” on page 927, “Push To Bottom” on page 928, “Size &Overflow” on page 945, “Spacing & Breaking” on page 948, “Style Variable” onpage 950, “Vertical Alignment” on page 965, “White Space” on page 966
List HeaderOverall header that appears once at the top of lists. Headers are containers inwhich you can insert text, images, data items, and report expressions such as thecurrent date.
Properties of List Header
“Background Color” on page 854, “Background Effects” on page 855, “Border” onpage 857, “Box Type” on page 860, “Conditional Styles” on page 868, “DataFormat” on page 874, “Direction & Justification” on page 880, “Font” on page 888,“Foreground Color” on page 889, “Horizontal Alignment” on page 895, “Padding”on page 921, “Pagination” on page 921, “Properties” on page 927, “Size &Overflow” on page 945, “Spacing & Breaking” on page 948, “Style Variable” onpage 950, “Vertical Alignment” on page 965, “White Space” on page 966
List ItemA list item in a static list box control.
Properties of List Item
“Icon” on page 896, “Label” on page 898
List Item Extra ItemData items that are used to determine what appears as the item labels in a data listbox control.
Properties of List Item Extra Item
“Data Item” on page 874
List Item IconThe icon used to identify each item in a data list box control. The icons areobtained from a data item inserted into the control.
Properties of List Item Icon
“Data Item” on page 874
List Item LabelThe label used to identify each item in a data list box control. Each label isdetermined by the data items inserted into the control.
812 IBM Cognos Report Studio Version 10.2.1: User Guide

Properties of List Item Label
“Data Item” on page 874
List Page FooterThe footer that appears at the bottom of every page of a list report. This object isrendered after the list details and other list footers. It is useful for presenting pagetotals.
Properties of List Page Footer
“Push To Bottom” on page 928
List Page HeaderThe header in the list that will appear on every page rendered. It occurs after thecolumn titles and before the overall group header of the list. It is useful forpresenting carry forward totals.
Properties of List Page Header
“Display After Overall Header” on page 881
List RowA row in a list.
Properties of List Row
“Background Color” on page 854, “Background Effects” on page 855, “Border” onpage 857, “Box Type” on page 860, “Clickable Region” on page 865, “ConditionalStyles” on page 868, “Data Format” on page 874, “Direction & Justification” onpage 880, “Font” on page 888, “Foreground Color” on page 889, “HorizontalAlignment” on page 895, “Padding” on page 921, “Size & Overflow” on page 945,“Spacing & Breaking” on page 948, “Style Variable” on page 950, “VerticalAlignment” on page 965, “White Space” on page 966
List Row Cells StyleOverrides the style for Row Cells Style objects that is defined in theGlobalReportStyles.css file.
Properties of List Row Cells Style
“Background Color” on page 854, “Background Effects” on page 855, “Border” onpage 857, “Box Type” on page 860, “Conditional Styles” on page 868, “DataFormat” on page 874, “Direction & Justification” on page 880, “Font” on page 888,“Foreground Color” on page 889, “Horizontal Alignment” on page 895, “Padding”on page 921, “Size & Overflow” on page 945, “Spacing & Breaking” on page 948,“Style Variable” on page 950, “Vertical Alignment” on page 965, “White Space” onpage 966
List SummaryA summary that is automatically added as the footer row in a list.
Appendix G. Report Studio Object and Property Reference 813

Properties of List Summary
“Aggregate Data Item” on page 847, “Aggregation Method” on page 847, “Label”on page 899, “Name” on page 913, “Type” on page 959
List SummaryThe list summary that appears in executed active reports.
Properties of List Summary
“Background Color” on page 854, “Border” on page 857, “Box Type” on page 859,“Classes” on page 865, “Conditional Styles” on page 868, “Data Format” on page874, “Data Item” on page 874, “Direction & Justification” on page 880, “Display forOrientation” on page 881, “Font” on page 888, “Foreground Color” on page 889,“Margin” on page 904, “Output Aggregation Method” on page 920, “Padding” onpage 921, “Relative Alignment” on page 930, “Render Variable” on page 932, “Size& Overflow” on page 945, “Spacing & Breaking” on page 948, “Style Variable” onpage 950, “Visible” on page 966
MapA chart that uses a map to show data.
Properties of Map
“Alternate Text” on page 848, “Application Drill-Through” on page 849, “AxisTitle” on page 853, “Background Color” on page 854, “Background Effects” onpage 855, “Border” on page 857, “Box Type” on page 859, “Classes” on page 865,“Clickable Regions” on page 866, “Contained Text Direction” on page 870,“Container Select” on page 870, “Data Language” on page 877, “Dictionary” onpage 880, “Direction & Justification” on page 880, “Display for Orientation” onpage 881, “Drill-Through Definitions” on page 883, “Expand Features” on page885, “Ignore Data with No Features” on page 896, “Legend” on page 900, “Map &Layers” on page 904, “Margin” on page 904, “Master Detail Relationships” on page907, “Maximum Hotspots” on page 908, “Name” on page 914, “No Data Contents”on page 916, “No Data Features Size (pt)” on page 917, “Notes” on page 917,“Padding” on page 921, “Pagination” on page 921, “Query” on page 928, “RelativeAlignment” on page 930, “Render Page when Empty” on page 931, “RenderVariable” on page 932, “Set Variable Values” on page 941, “Show Hover” on page942, “Show Pointer Cursor” on page 943, “Size & Overflow” on page 945,“Suppression” on page 951, “Title” on page 955, “Tooltips” on page 957, “Visible”on page 966
Map LocationAssociates a data series with regions on the region layer of the map.
Properties of Map Location
“Aggregate Function” on page 847, “Expression” on page 886, “Hierarchy” on page894, “Hierarchy Unique Name” on page 894, “Level” on page 902, “Level UniqueName” on page 902, “Member” on page 910, “Member Unique Name” on page911, “Property Unique Name” on page 928, “Rollup Aggregate Function” on page936, “Root Members Only” on page 936, “Set Definition” on page 940, “SetSorting” on page 940
814 IBM Cognos Report Studio Version 10.2.1: User Guide

Map LocationAssociates a data series with points on the point layer of the map.
Properties of Map Location
“Aggregate Function” on page 847, “Expression” on page 886, “Hierarchy” on page894, “Hierarchy Unique Name” on page 894, “Level” on page 902, “Level UniqueName” on page 902, “Member” on page 910, “Member Unique Name” on page911, “Property Unique Name” on page 928, “Rollup Aggregate Function” on page936, “Root Members Only” on page 936, “Set Definition” on page 940, “SetSorting” on page 940
Map Refinement LocationQualifies the data series members that are associated with regions on the map.
Properties of Map Refinement Location
“Aggregate Function” on page 847, “Expression” on page 886, “Hierarchy” on page894, “Hierarchy Unique Name” on page 894, “Level” on page 902, “Level UniqueName” on page 902, “Member” on page 910, “Member Unique Name” on page911, “Property Unique Name” on page 928, “Rollup Aggregate Function” on page936, “Root Members Only” on page 936, “Set Definition” on page 940, “SetSorting” on page 940
Map Refinement LocationQualifies the data series members that are associated with points on the map.
Properties of Map Refinement Location
“Aggregate Function” on page 847, “Expression” on page 886, “Hierarchy” on page894, “Hierarchy Unique Name” on page 894, “Level” on page 902, “Level UniqueName” on page 902, “Member” on page 910, “Member Unique Name” on page911, “Property Unique Name” on page 928, “Rollup Aggregate Function” on page936, “Root Members Only” on page 936, “Set Definition” on page 940, “SetSorting” on page 940
Marimekko ChartA type of bar chart that can show three levels of data.
Properties of Marimekko Chart
“Alternate Text” on page 848, “Application Drill-Through” on page 849,“Background Color” on page 854, “Background Effects” on page 855, “Baselines”on page 856, “Border” on page 857, “Border Color” on page 858, “Borders” onpage 858, “Box Type” on page 859, “Category Axis” on page 863, “Classes” onpage 865, “Clickable Regions” on page 866, “Conditional Palette” on page 868,“Container Select” on page 870, “Depth” on page 879, “Display for Orientation” onpage 881, “Drill-Through Definitions” on page 883, “Legend” on page 900,“Margin” on page 904, “Marimekko Totals” on page 905, “Markers” on page 905,“Marker Text Location” on page 906, “Master Detail Relationships” on page 907,“Maximum Hotspots” on page 908, “Name” on page 914, “No Data Contents” onpage 916, “Notes” on page 917, “Padding” on page 921, “Pagination” on page 921,“Palette” on page 922, “Query” on page 928, “Relative Alignment” on page 930,“Render Page when Empty” on page 931, “Render Variable” on page 932, “Set
Appendix G. Report Studio Object and Property Reference 815

Variable Values” on page 941, “Show Hover” on page 942, “Show Pointer Cursor”on page 943, “Size & Overflow” on page 945, “Suppression” on page 951, “Title”on page 955, “Tooltips” on page 957, “Values” on page 964, “Visible” on page 966,“Visual Angle” on page 966, “Y Axis” on page 968
MarkerA marker, or symbol, that you can place at a static place in a chart. Markers candesignate a point of significance that may help you analyze or understand thedata.
Properties of Marker
“Aggregate Function” on page 847, “Data Item Value” on page 876, “Expression”on page 886, “Hierarchy” on page 894, “Hierarchy Unique Name” on page 894,“Label Location” on page 900, “Level” on page 902, “Level Unique Name” on page902, “Marker Shape” on page 906, “Marker Size (pt)” on page 906, “Marker Style”on page 906, “Master Detail Relationships” on page 907, “Member” on page 910,“Member Offset (%)” on page 910, “Member Unique Name” on page 911,“Properties” on page 927, “Property Unique Name” on page 928, “Query” on page928, “Render Variable” on page 932, “Rollup Aggregate Function” on page 936,“Root Members Only” on page 936, “Set Definition” on page 940, “Set Sorting” onpage 940
MarkerA marker, or symbol, that you can place at a static place in a chart. Markers candesignate a point of significance that may help you analyze or understand thedata. This object applies only to legacy charts.
Properties of Marker
“Axis Assignment” on page 852, “Bar, Line, or Area Index” on page 856, “BoxType” on page 860, “Data Item Value” on page 876, “Label” on page 898, “MarkerColor” on page 905, “Marker Shape” on page 906, “Marker Size (pt)” on page 906,“Master Detail Relationships” on page 907, “Numeric Value” on page 919,“Percentile” on page 923, “Percent of Axis” on page 923, “Position type” on page925, “Properties” on page 927, “Query” on page 928, “Report Expression” on page934, “Report Expression” on page 933, “Standard Deviations” on page 949
MarkerA marker on a point chart. Point charts include scatter charts, polar charts, radarcharts, and bubble charts. This object applies only to legacy charts.
Properties of Marker
“Box Type” on page 860, “Data Item Value” on page 876, “Data Item Value” onpage 876, “Expression” on page 886, “Expression” on page 886, “Label” on page898, “Marker Color” on page 905, “Marker Shape” on page 906, “Marker Size (pt)”on page 906, “Master Detail Relationships” on page 907, “Numeric Value” on page919, “Numeric Value” on page 920, “Percentile” on page 923, “Percentile” on page923, “Percent of Axis” on page 924, “Percent of Axis” on page 924, “Position type”on page 925, “Position type” on page 925, “Properties” on page 927, “Query” onpage 928, “Report Expression” on page 934, “Report Expression” on page 934,“Standard Deviations” on page 949, “Standard Deviations” on page 949
816 IBM Cognos Report Studio Version 10.2.1: User Guide

MDXA multidimensional expression (MDX) query against an OLAP data source.
Properties of MDX
“Catalog” on page 862, “Data Source” on page 877, “MDX” on page 910, “Name”on page 915
MeasureA data item that defines a measure.
Properties of Measure
“Dimension” on page 880, “Label” on page 899, “Member” on page 910, “MemberUnique Name” on page 911, “Name” on page 913, “Type” on page 959
MemberA data item that defines a member.
Properties of Member
“Detail” on page 879, “Dimension” on page 880, “Hierarchy” on page 894, “Label”on page 899, “Member” on page 910, “Member Unique Name” on page 911,“Name” on page 913, “Type” on page 959
Member Children SetA set of data items that define the children set of a member.
Properties of Member Children Set
“Detail” on page 879, “Dimension” on page 880, “Hierarchy” on page 894, “Label”on page 899, “Member” on page 910, “Member Unique Name” on page 911,“Name” on page 913, “Set Sorting” on page 940, “Type” on page 959
Member HierarchyThe organization of a dimension's members into a logical tree structure, with eachmember having one or more "parent" members and an arbitrary number of "child"members.
Properties of Member Hierarchy
“Name” on page 916
Member PropertyA property that is associated with members of a level. Attributes can be used torefine a search within level members, or to provide additional information aboutmembers.
Properties of Member Property
“Data Item” on page 875, “Name” on page 916
Appendix G. Report Studio Object and Property Reference 817

Member PropertyA member property from either a level or a hierarchy.
Properties of Member Property
“Dimension” on page 880, “Hierarchy” on page 894, “Label” on page 899, “Level”on page 902, “Name” on page 913, “Property” on page 928, “Property UniqueName” on page 928, “Type” on page 959
Member SetA data item that represents a named set. Member sets supply the context forexpressions that require evaluation for multiple dimensions. For example, theydetermine the contexts for which you can apply analytical functions such as rank.
Properties of Member Set
“Data Item” on page 874, “Name” on page 915
Metrics Range ChartA chart that superimposes target value markers, target range markers, andtolerance range markers over any number or combination of bar, line, and areacharts.
Properties of Metrics Range Chart
“Alternate Text” on page 848, “Application Drill-Through” on page 849,“Background Color” on page 854, “Background Effects” on page 855, “Baselines”on page 856, “Border” on page 857, “Box Type” on page 859, “Category Axis” onpage 863, “Classes” on page 865, “Clickable Regions” on page 866, “ConditionalPalette” on page 868, “Container Select” on page 870, “Depth” on page 879,“Display for Orientation” on page 881, “Drill-Through Definitions” on page 883,“Legend” on page 900, “Margin” on page 904, “Marker Color” on page 905,“Marker Label” on page 905, “Markers” on page 905, “Marker Text Location” onpage 906, “Master Detail Relationships” on page 907, “Maximum Hotspots” onpage 908, “Name” on page 914, “No Data Contents” on page 916, “Notes” on page917, “Padding” on page 921, “Pagination” on page 921, “Palette” on page 922,“Performance Pattern” on page 924, “Query” on page 928, “Range Label” on page930, “Relative Alignment” on page 930, “Render Page when Empty” on page 931,“Render Variable” on page 932, “Set Variable Values” on page 941, “Show Hover”on page 942, “Show Pointer Cursor” on page 943, “Size & Overflow” on page 945,“Suppression” on page 951, “Target Color” on page 953, “Target Marker” on page953, “Target Marker Border Color” on page 953, “Target Marker Position” on page953, “Target Range (%)” on page 953, “Title” on page 955, “Tolerance Color” onpage 956, “Tolerance Label” on page 956, “Tooltips” on page 957, “Upper RangeSkew (%)” on page 960, “Value Location:” on page 963, “Visible” on page 966,“Visual Angle” on page 966, “Y1 Axis” on page 968
Metric Studio DiagramA Metric Studio diagram rendered as a static image.
Properties of Metric Studio Diagram
“Alternate Text” on page 848, “Description” on page 879, “Diagram Identifier” onpage 880
818 IBM Cognos Report Studio Version 10.2.1: User Guide

Named SetA reference to a named set from the model.
Properties of Named Set
“Detail” on page 879, “Dimension” on page 880, “Hierarchy” on page 894, “Label”on page 899, “Name” on page 913, “Set Sorting” on page 940, “Type” on page 959
NodeData item that represents categorical data in the visualization. For example, thebubbles in a packed bubble visualization.
Properties of Node
“Data Format” on page 874, “Fact Cell Data Format” on page 886, “Sorting” onpage 947
NoteA note on a chart. The source of the note text can be static text, a query item, or areport expression.
Properties of Note
“Background Effects” on page 855, “Conditional Styles” on page 868, “Font” onpage 888, “Foreground Color” on page 889, “Horizontal Alignment” on page 895,“Master Detail Relationships” on page 907, “Note Text” on page 918, “Position” onpage 925, “Properties” on page 927, “Render Variable” on page 932, “Size &Overflow” on page 945
NoteA note on a chart. The source of the note text can be static text, a query item, or areport expression. This object applies only to legacy charts.
Properties of Note
“Bottom Position (px)” on page 859, “Height (px)” on page 893, “Left Position(px)” on page 900, “Note Border” on page 917, “Note Text” on page 918, “Width(px)” on page 967
Note ContentThe content and style of a note.
Properties of Note Content
“Background Color” on page 854, “Box Type” on page 860, “Classes” on page 865,“Conditional Styles” on page 868, “Horizontal Alignment” on page 895, “MasterDetail Relationships” on page 907, “Properties” on page 927, “Query” on page 928,“Style Variable” on page 950
No Value List ItemThe default item in a list control. When the default item is selected when thereport is run, it sets the value of the data item in the control to null. By default, theno value item is the first item in the list.
Appendix G. Report Studio Object and Property Reference 819

Properties of No Value List Item
“Label” on page 898, “Position in List” on page 925
Numerical AxisThe numeric axis for a progressive chart, including labels, titles, range, scale, andgridlines. This object applies only to legacy charts.
Properties of Numerical Axis
“Axis Labels” on page 852, “Axis Line” on page 852, “Axis Title” on page 853,“Axis Title” on page 853, “Classes” on page 865, “Data Format” on page 874,“Gridlines” on page 892, “Include Zero For Auto Scale” on page 896, “MaximumValue” on page 910, “Minimum Value” on page 912, “Minor Gridlines” on page912, “Scale” on page 937, “Scale Interval” on page 938, “Use Same Range For AllInstances” on page 962
Numerical AxisThe numeric axis for a Pareto chart, including labels, titles, and gridlines. Thisobject applies only to legacy charts.
Properties of Numerical Axis
“Axis Labels” on page 852, “Axis Line” on page 852, “Axis Title” on page 853,“Axis Title” on page 853, “Classes” on page 865, “Data Format” on page 874,“Gridlines” on page 892, “Include Zero For Auto Scale” on page 896, “MaximumValue” on page 910, “Minimum Value” on page 912, “Minor Gridlines” on page912, “Scale” on page 937, “Scale Interval” on page 938, “Use Same Range For AllInstances” on page 962
Numeric AxisThe axis that displays numbers.
Properties of Numeric Axis
“Axis Labels” on page 852, “Axis Line” on page 853, “Axis Range” on page 853,“Axis Title” on page 854, “Axis Title” on page 853, “Gridlines” on page 892,“Minor Gridlines” on page 912, “Number of Minor Intervals” on page 918
Numeric BaselineThe baseline on a numeric axis.
Properties of Numeric Baseline
“Aggregate Function” on page 847, “Data Item Value” on page 876, “Expression”on page 886, “Hierarchy” on page 894, “Hierarchy Unique Name” on page 894,“Level” on page 902, “Level Unique Name” on page 902, “Line Style” on page 903,“Master Detail Relationships” on page 907, “Member” on page 910, “MemberUnique Name” on page 911, “Numeric Baselines” on page 919, “Properties” onpage 927, “Property Unique Name” on page 928, “Query” on page 928, “RenderVariable” on page 932, “Rollup Aggregate Function” on page 936, “Root MembersOnly” on page 936, “Set Definition” on page 940, “Set Sorting” on page 940
820 IBM Cognos Report Studio Version 10.2.1: User Guide

PageA page in a layout.
Properties of Page
“Background Color” on page 854, “Border” on page 857, “Classes” on page 865,“Conditional Styles” on page 868, “Direction & Justification” on page 880, “Font”on page 888, “Foreground Color” on page 889, “Gradient” on page 891,“Horizontal Alignment” on page 895, “Margin” on page 904, “Master DetailRelationships” on page 907, “Name” on page 914, “Pagination” on page 921, “PDFPage Setup” on page 923, “Properties” on page 927, “Query” on page 929, “RenderVariable” on page 932, “Size & Overflow” on page 945, “Style Variable” on page950
Page BodyThe main body of a page.
Properties of Page Body
“Classes” on page 865, “Size & Overflow” on page 945
Page Break TextThe text associated with a page break.
Properties of Page Break Text
“Background Color” on page 854, “Border” on page 857, “Box Type” on page 859,“Classes” on page 865, “Conditional Styles” on page 868, “Direction &Justification” on page 880, “Display for Orientation” on page 881, “Font” on page888, “Foreground Color” on page 889, “Margin” on page 904, “Padding” on page921, “Relative Alignment” on page 930, “Render Variable” on page 932, “Size &Overflow” on page 945, “Spacing & Breaking” on page 948, “Style Variable” onpage 950, “Visible” on page 966
Page FooterThe footer of a page.
Properties of Page Footer
“Classes” on page 865, “Size & Overflow” on page 945
Page HeaderThe header of a page.
Properties of Page Header
“Classes” on page 865, “Size & Overflow” on page 945
Page NumberThe number of a page.
Appendix G. Report Studio Object and Property Reference 821

Properties of Page Number
“Background Color” on page 854, “Classes” on page 865, “Display for Orientation”on page 881, “Font” on page 888, “Foreground Color” on page 889, “Margin” onpage 904, “Number Style” on page 919, “Relative Alignment” on page 930
Page SetThe set of pages to render according to a grouping structure.
Properties of Page Set
“Grouping & Sorting” on page 892, “Master Detail Relationships” on page 907,“Name” on page 913, “Pagination” on page 921, “Properties” on page 927,“Query” on page 928
Pareto BarsThe bars in a Pareto chart.
Properties of Pareto Bars
“Axis Labels” on page 852, “Axis Line” on page 853, “Axis Range” on page 853,“Axis Title” on page 854, “Axis Title” on page 853, “Gridlines” on page 892,“Minor Gridlines” on page 912, “Number of Minor Intervals” on page 918
Pareto ChartA chart in which data series appear as colored sections stacked in columns or bars.The maximum of each column or bar represents the series total as a percentage ofthe overall total of all data series in the chart.
Negative values are not supported in Pareto charts.
Properties of Pareto Chart
“Alternate Text” on page 848, “Application Drill-Through” on page 849,“Background Effects” on page 855, “Bar Width” on page 856, “Bevel” on page 857,“Border” on page 857, “Border Color” on page 858, “Borders” on page 858, “BoxType” on page 859, “Category Baselines” on page 863, “Chart Orientation” on page863, “Classes” on page 865, “Clickable Regions” on page 866, “Colored Regions”on page 867, “Conditional Palette” on page 868, “Contained Text Direction” onpage 870, “Container Select” on page 870, “Cumulative Line” on page 873,“Depth” on page 879, “Direction & Justification” on page 880, “Display forOrientation” on page 881, “Drill-Through Definitions” on page 883, “DropShadow” on page 884, “Legend” on page 901, “Margin” on page 904, “Markers”on page 906, “Master Detail Relationships” on page 907, “Material Effects” on page907, “Matrix Rows and Columns” on page 908, “Maximum Hotspots” on page 908,“Name” on page 914, “No Data Contents” on page 916, “Notes” on page 917,“Numeric Baselines” on page 919, “Padding” on page 921, “Pagination” on page921, “Palette” on page 922, “Plot Area Fill” on page 924, “Query” on page 928,“Relative Alignment” on page 930, “Render Page when Empty” on page 931,“Render Variable” on page 932, “Set Variable Values” on page 941, “Show Hover”on page 942, “Show Pointer Cursor” on page 943, “Show Values” on page 944,“Size & Overflow” on page 945, “Summarize Small Items” on page 951,“Suppression” on page 951, “Title” on page 955, “Tooltips” on page 956, “Visible”on page 966
822 IBM Cognos Report Studio Version 10.2.1: User Guide

Pareto ChartA chart in which data series appear as colored sections stacked in columns or bars.The maximum of each column or bar represents the series total as a percentage ofthe overall total of all data series in the chart. This object applies only to legacycharts.
Negative values are not supported in Pareto charts.
Properties of Pareto Chart
“Alternate Text” on page 848, “Application Drill-Through” on page 849,“Background Color” on page 854, “Background Effects” on page 855, “Baselines”on page 856, “Border” on page 857, “Border Color” on page 858, “Borders” onpage 858, “Box Type” on page 859, “Category Axis” on page 863, “ChartOrientation” on page 863, “Classes” on page 865, “Clickable Regions” on page 866,“Conditional Palette” on page 868, “Connecting Lines” on page 869, “ContainerSelect” on page 870, “Cumulative Line” on page 872, “Depth” on page 879,“Display for Orientation” on page 881, “Drill-Through Definitions” on page 883,“Legend” on page 900, “Margin” on page 904, “Markers” on page 905, “MarkerText Location” on page 906, “Master Detail Relationships” on page 907, “MaximumHotspots” on page 908, “Name” on page 914, “No Data Contents” on page 916,“Notes” on page 917, “Padding” on page 921, “Pagination” on page 921, “Palette”on page 922, “Pareto Axis” on page 923, “Query” on page 928, “RelativeAlignment” on page 930, “Render Page when Empty” on page 931, “RenderVariable” on page 932, “Rotate Values” on page 937, “Set Variable Values” on page941, “Show Hover” on page 942, “Show Pointer Cursor” on page 943, “Size &Overflow” on page 945, “Suppression” on page 951, “Title” on page 955, “Tooltips”on page 957, “Value Location:” on page 963, “Values” on page 964, “Visible” onpage 966, “Visual Angle” on page 966
Percentaged MeasureA measure that shows values as a percentage of a summary.
Properties of Percentaged Measure
“Actual Measure” on page 846, “Dimension” on page 880, “Label” on page 899,“Name” on page 913, “Percentage Based On” on page 923, “Type” on page 959
Pie ChartA chart that uses sections of a circle as data markers to plot one or more dataseries. The size of each section is proportional to the value of each data series for agiven category value. Each pie corresponds to a category value. This object appliesonly to legacy charts.
Properties of Pie Chart
“Alternate Text” on page 848, “Application Drill-Through” on page 849, “AvoidLabel Collision” on page 851, “Axis Title” on page 853, “Background Color” onpage 854, “Background Effects” on page 855, “Border” on page 857, “Border Color”on page 858, “Borders” on page 858, “Box Type” on page 859, “Classes” on page865, “Clickable Regions” on page 866, “Conditional Palette” on page 868,“Container Select” on page 870, “Depth” on page 879, “Display for Orientation” onpage 881, “Drill-Through Definitions” on page 883, “Hole Size (%)” on page 895,“Labels” on page 900, “Legend” on page 900, “Margin” on page 904, “Master
Appendix G. Report Studio Object and Property Reference 823

Detail Relationships” on page 907, “Maximum Hotspots” on page 908, “Name” onpage 914, “No Data Contents” on page 916, “Notes” on page 917, “Padding” onpage 921, “Pagination” on page 921, “Palette” on page 922, “Pie Labels” on page924, “Query” on page 928, “Relative Alignment” on page 930, “Render Page whenEmpty” on page 931, “Render Variable” on page 932, “Set Variable Values” onpage 941, “Show Hover” on page 942, “Show Pointer Cursor” on page 943, “Size &Overflow” on page 945, “Suppression” on page 951, “Title” on page 955, “Tooltips”on page 957, “Value Representation” on page 964, “Values” on page 964, “Visible”on page 966
Pie ChartA chart that uses sections of a circle as data markers to plot one or more dataseries. The size of each section is proportional to the value of each data series for agiven category value. Each pie corresponds to a category value.
Properties of Pie Chart
“Alternate Text” on page 848, “Application Drill-Through” on page 849, “AxisTitle” on page 854, “Background Effects” on page 855, “Bevel” on page 857,“Border” on page 857, “Border Color” on page 858, “Borders” on page 858, “BoxType” on page 859, “Classes” on page 865, “Clickable Regions” on page 866,“Conditional Palette” on page 868, “Contained Text Direction” on page 870,“Container Select” on page 870, “Depth” on page 879, “Direction & Justification”on page 880, “Display for Orientation” on page 881, “Drill-Through Definitions” onpage 883, “Drop Shadow” on page 884, “Exploded Slices” on page 885, “First SliceAngle” on page 887, “Hole Size (%)” on page 895, “Legend” on page 901,“Margin” on page 904, “Master Detail Relationships” on page 907, “MaterialEffects” on page 907, “Matrix Rows and Columns” on page 908, “MaximumHotspots” on page 908, “Name” on page 914, “No Data Contents” on page 916,“Notes” on page 917, “Padding” on page 921, “Pagination” on page 921, “Palette”on page 922, “Query” on page 928, “Relative Alignment” on page 930, “RenderPage when Empty” on page 931, “Render Variable” on page 932, “Set VariableValues” on page 941, “Show Hover” on page 942, “Show Pointer Cursor” on page943, “Show Values” on page 944, “Size & Overflow” on page 945, “Slice Direction”on page 946, “Summarize Small Slices” on page 951, “Suppression” on page 951,“Title” on page 955, “Tooltips” on page 956, “Visible” on page 966
Pie LabelsThe labels that will be drawn if multiple pie charts are rendered. If this object doesnot exist, no labels will be rendered.
Properties of Pie Labels
“Classes” on page 865, “Conditional Styles” on page 868, “Drill-ThroughDefinitions” on page 883, “Font” on page 888, “Foreground Color” on page 889,“Horizontal Alignment” on page 895, “Maximum Truncation Characters” on page909, “Style Variable” on page 950, “Truncation” on page 958, “Truncation Text” onpage 959, “Visible” on page 966
Point Color Legend TitleThe title for the point color legend. If this object is empty, a default title isrendered, if available.
824 IBM Cognos Report Studio Version 10.2.1: User Guide

Properties of Point Color Legend Title
“Master Detail Relationships” on page 907, “Properties” on page 927, “Query” onpage 928
Point LayerA map layer that includes points, such as cities. The color and size of each point isdetermined by their respective measure.
Properties of Point Layer
“Border Color” on page 858, “Borders” on page 858, “Color Legend Title” on page867, “Conditional Palette” on page 868, “Conditional Styles” on page 868, “FillEffects” on page 887, “Map Drills” on page 904, “Palette” on page 922, “Show DataRange in Legend” on page 942, “Show Features with No Data” on page 942,“Show Values” on page 944, “Size Legend Title” on page 946, “Style Variable” onpage 950
Point MeasureThe measure that determines the colors of points on a map chart.
Properties of Point Measure
“Conditional Styles” on page 868, “Custom Label” on page 873, “Data Format” onpage 874, “Style Variable” on page 950
Point Size Legend TitleThe title for the point size legend. If this object is empty, a default title is rendered,if available.
Properties of Point Size Legend Title
“Master Detail Relationships” on page 907, “Properties” on page 927, “Query” onpage 928
Point Size MeasureThe measure that determines the size of the points on a map chart.
Properties of Point Size Measure
“Conditional Styles” on page 868, “Custom Label” on page 873, “Data Format” onpage 874, “Maximum Size (pt)” on page 909, “Minimum Size (pt)” on page 911,“Style Variable” on page 950
Polar ChartA point chart that plots one or more data series against two measures. The radiusof a data series is determined by one measure and the arc is determined by theother measure. Multiple points are plotted for each category. They can bedistinguished with the help of tool tips if the Tool Tip property is set to Yes.
Appendix G. Report Studio Object and Property Reference 825

Properties of Polar Chart
“Alternate Text” on page 848, “Angular Axis” on page 849, “ApplicationDrill-Through” on page 849, “Background Color” on page 854, “BackgroundEffects” on page 855, “Baselines” on page 856, “Border” on page 857, “BorderColor” on page 858, “Borders” on page 858, “Box Type” on page 859, “Classes” onpage 865, “Clickable Regions” on page 866, “Conditional Palette” on page 868,“Container Select” on page 870, “Display for Orientation” on page 881,“Drill-Through Definitions” on page 883, “Legend” on page 900, “Margin” on page904, “Markers” on page 905, “Marker Size (pt)” on page 906, “Marker TextLocation” on page 906, “Master Detail Relationships” on page 907, “MaximumHotspots” on page 908, “Name” on page 914, “No Data Contents” on page 916,“Notes” on page 917, “Padding” on page 921, “Pagination” on page 921, “Palette”on page 922, “Point Shape” on page 924, “Query” on page 928, “Radial Axis” onpage 929, “Relative Alignment” on page 930, “Render Page when Empty” on page931, “Render Variable” on page 932, “Set Variable Values” on page 941, “ShowHover” on page 942, “Show Pointer Cursor” on page 943, “Size & Overflow” onpage 945, “Spider Effects” on page 948, “Suppression” on page 951, “Title” on page955, “Tooltips” on page 957, “Value Location:” on page 963, “Values” on page 964,“Visible” on page 966
Primary AxisThe generic numeric axis for the combination chart. This axis is normally shown asthe top-left axis but can be in a different position depending on the chartorientation, as specified in the Chart Orientation property of the chart.
Properties of Primary Axis
“Axis Labels” on page 852, “Axis Line” on page 853, “Axis Range” on page 853,“Axis Title” on page 854, “Axis Title” on page 853, “Gridlines” on page 892,“Minor Gridlines” on page 912, “Number of Minor Intervals” on page 918
Primary Bottom AxisThe numeric axis for a combination chart. This axis is normally rendered as thebottom-left axis, but can change depending on the orientation of the chart, asspecified in the Chart Orientation property of the chart.
Properties of Primary Bottom Axis
“Axis Labels” on page 852, “Axis Line” on page 853, “Axis Range” on page 853,“Axis Title” on page 854, “Axis Title” on page 853, “Gridlines” on page 892,“Minor Gridlines” on page 912, “Number of Minor Intervals” on page 918
Progressive ChartA chart that uses columns as data markers to plot one category across a singlemeasure. The top of the first column represents the starting value for the secondcolumn. This chart emphasizes the positive or negative contribution of each valueto the total.
Properties of Progressive Chart
“Alternate Text” on page 848, “Application Drill-Through” on page 849,“Background Effects” on page 855, “Bar Width” on page 856, “Bevel” on page 857,“Border” on page 857, “Border Color” on page 858, “Borders” on page 858, “Box
826 IBM Cognos Report Studio Version 10.2.1: User Guide

Type” on page 859, “Category Baselines” on page 863, “Chart Orientation” on page863, “Classes” on page 865, “Clickable Regions” on page 866, “Colored Regions”on page 867, “Conditional Palette” on page 868, “Connecting Lines” on page 869,“Contained Text Direction” on page 870, “Container Select” on page 870, “Depth”on page 879, “Direction & Justification” on page 880, “Display for Orientation” onpage 881, “Drill-Through Definitions” on page 883, “Drop Shadow” on page 884,“Legend” on page 901, “Margin” on page 904, “Markers” on page 906, “MasterDetail Relationships” on page 907, “Material Effects” on page 907, “Matrix Rowsand Columns” on page 908, “Maximum Hotspots” on page 908, “Name” on page914, “No Data Contents” on page 916, “Notes” on page 917, “Numeric Baselines”on page 919, “Padding” on page 921, “Pagination” on page 921, “Plot Area Fill” onpage 924, “Progressive Palette” on page 927, “Query” on page 928, “RelativeAlignment” on page 930, “Render Page when Empty” on page 931, “RenderVariable” on page 932, “Set Variable Values” on page 941, “Show Hover” on page942, “Show Pointer Cursor” on page 943, “Show Values” on page 944, “Size &Overflow” on page 945, “Suppression” on page 951, “Title” on page 955, “Tooltips”on page 956, “Total Column” on page 957, “Visible” on page 966
Progressive ChartA chart that uses columns as data markers to plot one category across a singlemeasure. The top of the first column represents the starting value for the secondcolumn. This chart emphasizes the positive or negative contribution of each valueto the total. This object applies only to legacy charts.
Properties of Progressive Chart
“Alternate Text” on page 848, “Application Drill-Through” on page 849,“Background Color” on page 854, “Background Effects” on page 855, “Baselines”on page 856, “Border” on page 857, “Border Color” on page 858, “Borders” onpage 858, “Box Type” on page 859, “Category Axis” on page 863, “ChartOrientation” on page 863, “Classes” on page 865, “Clickable Regions” on page 866,“Conditional Palette” on page 868, “Connecting Lines” on page 869, “ContainerSelect” on page 870, “Depth” on page 879, “Display for Orientation” on page 881,“Drill-Through Definitions” on page 883, “First Column Color” on page 887,“Margin” on page 904, “Markers” on page 905, “Marker Text Location” on page906, “Master Detail Relationships” on page 907, “Maximum Hotspots” on page908, “Name” on page 914, “Negative Column Color” on page 916, “No DataContents” on page 916, “Notes” on page 917, “Padding” on page 921, “Pagination”on page 921, “Palette” on page 922, “Positive Column Color” on page 926,“Progressive Axis” on page 927, “Query” on page 928, “Relative Alignment” onpage 930, “Render Page when Empty” on page 931, “Render Variable” on page932, “Rotate Values” on page 937, “Set Variable Values” on page 941, “ShowHover” on page 942, “Show Pointer Cursor” on page 943, “Size & Overflow” onpage 945, “Suppression” on page 951, “Title” on page 955, “Tooltips” on page 957,“Total Column” on page 957, “Value Location:” on page 963, “Values” on page 964,“Visible” on page 966, “Visual Angle” on page 966
Prompt ButtonA predefined button used in prompt pages. Its usage changes according to its Typeproperty, which can be set to Cancel, Back, Next, Finish, or Reprompt.
Properties of Prompt Button
“Background Color” on page 854, “Border” on page 857, “Classes” on page 865,“Conditional Styles” on page 868, “Font” on page 888, “Foreground Color” onpage 889
Appendix G. Report Studio Object and Property Reference 827

page 887, “Margin” on page 904, “Name” on page 914, “Padding” on page 921,“Relative Alignment” on page 930, “Size & Overflow” on page 945, “StyleVariable” on page 950, “Type” on page 959
QueryThe data that is to be retrieved from the database. The query consists of a source, aselection, detailed and summary filters, and dimension information.
Properties of Query
“Auto Group & Summarize” on page 850, “Auto-Sort” on page 851, “AvoidDivision by Zero” on page 851, “Cross Product Allowed” on page 872, “DefineMember Sets” on page 878, “Execution Method” on page 885, “ExecutionOptimization” on page 885, “Generated SQL” on page 891, “Maximum ExecutionTime” on page 908, “Maximum Rows Retrieved” on page 909, “Maximum Tables”on page 909, “Maximum Text Blob Characters” on page 909, “Name” on page 914,“Outer Join Allowed” on page 920, “Override Dimension Info” on page 921,“Processing” on page 926, “Rollup Processing” on page 936, “SQL Join Syntax” onpage 948, “Suppress” on page 951, “Use 1.x Behavior” on page 960, “UseAggregate Cache” on page 960, “Use for Parameter Info” on page 961, “Use LocalCache” on page 961, “User SAP Member Cache” on page 961, “Use SAP MUN asBusiness Key” on page 962, “Use SQL Parameters” on page 962, “Use SQL WithClause” on page 963
Query OperationUnion, Intersect, Except (minus) operations on one or more queries that result in aprojection list upon which other queries can be based.
Properties of Query Operation
“Duplicates” on page 884, “Name” on page 915, “Projection List” on page 927, “SetOperation” on page 940
Query ReferenceA reference to another query defined in the same query set.
Properties of Query Reference
“Cardinality” on page 862
Radar ChartA chart that integrates multiple axes into a single radial figure as lines or stackedareas.
Properties of Radar Chart
“Alternate Text” on page 848, “Application Drill-Through” on page 849,“Background Color” on page 854, “Background Effects” on page 855, “Baselines”on page 856, “Border” on page 857, “Border Color” on page 858, “Borders” onpage 858, “Box Type” on page 859, “Category Axis” on page 863, “Classes” onpage 865, “Clickable Regions” on page 866, “Conditional Palette” on page 868,“Container Select” on page 870, “Display for Orientation” on page 881,“Drill-Through Definitions” on page 883, “Legend” on page 900, “Margin” on page904, “Markers” on page 905, “Marker Size (pt)” on page 906, “Marker Text
828 IBM Cognos Report Studio Version 10.2.1: User Guide

Location” on page 906, “Master Detail Relationships” on page 907, “MaximumHotspots” on page 908, “Name” on page 914, “No Data Contents” on page 916,“Notes” on page 917, “Padding” on page 921, “Pagination” on page 921, “Palette”on page 922, “Point Shape” on page 924, “Query” on page 928, “Radar Type” onpage 929, “Radial Axis” on page 929, “Relative Alignment” on page 930, “RenderPage when Empty” on page 931, “Render Variable” on page 932, “Set VariableValues” on page 941, “Show Hover” on page 942, “Show Pointer Cursor” on page943, “Size & Overflow” on page 945, “Spider Effects” on page 948, “Suppression”on page 951, “Title” on page 955, “Tooltips” on page 957, “Value Location:” onpage 963, “Values” on page 964, “Visible” on page 966
Radial AxisThe radial numeric axis for a polar chart or radar chart, including labels, titles,range, and scale.
Properties of Radial Axis
“Axis Labels” on page 852, “Axis Line” on page 852, “Axis Title” on page 853,“Axis Title” on page 853, “Classes” on page 865, “Data Format” on page 874,“Gridlines” on page 892, “Include Zero For Auto Scale” on page 896, “MaximumValue” on page 910, “Minimum Value” on page 912, “Minor Gridlines” on page912, “Scale” on page 937, “Scale Interval” on page 938, “Use Same Range For AllInstances” on page 962
Radial MeasureThe measure that determines the distance between the center of the chart and eachdata marker.
Properties of Radial Measure
“Conditional Styles” on page 868, “Custom Label” on page 873, “Data Format” onpage 874, “Style Variable” on page 950
Radio ButtonA radio button in a static radio button group control.
Properties of Radio Button
“Icon” on page 896, “Label” on page 898
Radio Button Extra ItemData items that are used to determine what appears as the radio button labels in adata radio button group control.
Properties of Radio Button Extra Item
“Data Item” on page 874
Radio Button GroupA static radio button group control. Each radio button requires a correspondingrow in the data table of the control.
Appendix G. Report Studio Object and Property Reference 829

Properties of Radio Button Group
“Application Drill-Through” on page 849, “Contained Text Direction” on page 870,“Container Filter” on page 870, “Container Select” on page 870, “Control Enable”on page 872, “Direction & Justification” on page 880, “Display for Orientation” onpage 881, “Name” on page 914, “Orientation” on page 920, “Radio ButtonsDefinition” on page 929, “Render Variable” on page 932, “Set Variable Values” onpage 941, “Text Color” on page 954
Radio Button IconThe icon used to identify each radio button in a data radio button group control.The icons are obtained from a data item inserted into the control.
Properties of Radio Button Icon
“Data Item” on page 874
Radio Button LabelThe label used to identify each radio button in a data radio button group control.Each label is determined by the data items inserted into the control.
Properties of Radio Button Label
“Data Item” on page 874
Region Color Legend TitleThe title for the region color legend. If this object is empty, a default title isrendered, if available.
Properties of Region Color Legend Title
“Master Detail Relationships” on page 907, “Properties” on page 927, “Query” onpage 928
Region LayerA map layer that includes regions, such as provinces.
Properties of Region Layer
“Border Color” on page 858, “Borders” on page 858, “Color Legend Title” on page867, “Conditional Palette” on page 868, “Conditional Styles” on page 868, “FillEffects” on page 887, “Map Drills” on page 904, “Palette” on page 922, “Show DataRange in Legend” on page 942, “Show Features with No Data” on page 942,“Show Values” on page 944, “Style Variable” on page 950
Region MeasureThe measure that determines the colors of regions on a map chart.
Properties of Region Measure
“Conditional Styles” on page 868, “Custom Label” on page 873, “Data Format” onpage 874, “Style Variable” on page 950
830 IBM Cognos Report Studio Version 10.2.1: User Guide

Regression LineA regression line for a bubble chart or scatter chart.
Properties of Regression Line
“Box Type” on page 860, “Line Styles” on page 903, “Number of Regression Lines”on page 918, “Polynomial Exponent” on page 925, “Properties” on page 927,“Regression Type” on page 930
Regression Line LabelA label that will be will be shown in the legend for the regression line.
RepeaterA table into which you can insert items that will be repeated.
Properties of Repeater
“Grouping & Sorting” on page 892, “Master Detail Relationships” on page 907,“Name” on page 914, “No Data Contents” on page 916, “Pagination” on page 921,“Properties” on page 927, “Query” on page 928, “Render Page when Empty” onpage 931, “Render Variable” on page 932, “Rows Per Page” on page 937, “ShareResult Set” on page 941, “Suppression” on page 951
Repeater TableRenders query data in a table.
Properties of Repeater Table
“Across” on page 846, “Application Drill-Through” on page 849, “BackgroundColor” on page 854, “Border” on page 857, “Box Type” on page 859, “Classes” onpage 865, “Clickable Regions” on page 866, “Conditional Styles” on page 868,“Container Filter” on page 870, “Container Select” on page 870, “Direction &Justification” on page 880, “Display for Orientation” on page 881, “Down” on page883, “Drop Shadow” on page 884, “Font” on page 888, “Foreground Color” onpage 889, “Grouping & Sorting” on page 892, “Horizontal Alignment” on page 895,“Margin” on page 904, “Master Detail Relationships” on page 907, “Name” onpage 914, “No Data Contents” on page 916, “Pagination” on page 921, “Properties”on page 927, “Query” on page 928, “Relative Alignment” on page 930, “RenderPage when Empty” on page 931, “Render Variable” on page 932, “RepeaterDirection” on page 932, “Set Variable Values” on page 941, “Share Result Set” onpage 941, “Show Hover” on page 942, “Show Pointer Cursor” on page 943, “Size &Overflow” on page 945, “Style Variable” on page 950, “Summary Text” on page951, “Suppression” on page 951, “Table Properties” on page 952, “Visible” on page966
Repeater Table CellThe contents of a repeater table object.
Properties of Repeater Table Cell
“Background Color” on page 854, “Background Effects” on page 855, “Border” onpage 857, “Box Type” on page 860, “Classes” on page 865, “Conditional Styles” onpage 868, “Direction & Justification” on page 880, “Font” on page 888,
Appendix G. Report Studio Object and Property Reference 831

“Foreground Color” on page 889, “Horizontal Alignment” on page 895, “Padding”on page 921, “Render Variable” on page 932, “Size & Overflow” on page 945,“Spacing & Breaking” on page 948, “Style Variable” on page 950, “VerticalAlignment” on page 965, “White Space” on page 966
Repeater Table CellA cell in an active report repeater table.
Properties of Repeater Table Cell
“Background Color” on page 854, “Background Effects” on page 855, “Border” onpage 857, “Box Type” on page 860, “Classes” on page 865, “Conditional Styles” onpage 868, “Direction & Justification” on page 880, “Font” on page 888,“Foreground Color” on page 889, “Horizontal Alignment” on page 895, “Padding”on page 921, “Size & Overflow” on page 945, “Spacing & Breaking” on page 948,“Style Variable” on page 950, “Vertical Alignment” on page 965, “White Space” onpage 966
Rich Text ItemInserts an object that is used to render a subset of HTML in the layout. The HTMLmay come from either a static or dynamic source, and the object will also render inPDF output. For information about what elements are allowed in rich text items,see Elements Supported in Rich Text Items.
Properties of Rich Text Item
“Aggregate Function” on page 847, “Control Data Item Value” on page 871, “DataItem Label” on page 875, “Data Item Value” on page 876, “Description” on page879, “Expression” on page 886, “Hierarchy” on page 894, “Hierarchy UniqueName” on page 894, “HTML” on page 895, “HTML Source Variable” on page 896,“Level” on page 902, “Level Unique Name” on page 902, “Member” on page 910,“Member Unique Name” on page 911, “Name” on page 914, “Property UniqueName” on page 928, “Render Variable” on page 932, “Report Expression” on page933, “Rollup Aggregate Function” on page 936, “Root Members Only” on page 936,“Set Definition” on page 940, “Set Sorting” on page 940, “Source Type” on page947
Row NumberShows the row numbers in a column.
Properties of Row Number
“Background Color” on page 854, “Classes” on page 865, “Data Format” on page874, “Display for Orientation” on page 881, “Font” on page 888, “ForegroundColor” on page 889, “Margin” on page 904, “Relative Alignment” on page 930
Row NumberShows the row numbers in a column in an active report. The active report rownumber object will always reflect the visible row number in the report. The reportrow number object reflects the server calculated row number.
832 IBM Cognos Report Studio Version 10.2.1: User Guide

Properties of Row Number
“Background Color” on page 854, “Classes” on page 865, “Data Format” on page874, “Direction & Justification” on page 880, “Display for Orientation” on page 881,“Font” on page 888, “Foreground Color” on page 889, “Margin” on page 904,“Relative Alignment” on page 930
Scatter ChartA point chart that plots one or more data series against two measures. Multiplepoints are plotted for each category. This object applies only to legacy charts.
Properties of Scatter Chart
“Alternate Text” on page 848, “Application Drill-Through” on page 849,“Background Color” on page 854, “Background Effects” on page 855, “Baselines”on page 856, “Border” on page 857, “Border Color” on page 858, “Borders” onpage 858, “Box Type” on page 859, “Classes” on page 865, “Clickable Regions” onpage 866, “Conditional Palette” on page 868, “Container Select” on page 870,“Display for Orientation” on page 881, “Drill-Through Definitions” on page 883,“Legend” on page 900, “Margin” on page 904, “Markers” on page 905, “MarkerSize (pt)” on page 906, “Marker Text Location” on page 906, “Master DetailRelationships” on page 907, “Maximum Hotspots” on page 908, “Name” on page914, “No Data Contents” on page 916, “Notes” on page 917, “Padding” on page921, “Pagination” on page 921, “Palette” on page 922, “Point Shape” on page 924,“Query” on page 928, “Regression Line” on page 930, “Relative Alignment” onpage 930, “Render Page when Empty” on page 931, “Render Variable” on page932, “Set Variable Values” on page 941, “Show Hover” on page 942, “Show PointerCursor” on page 943, “Size & Overflow” on page 945, “Suppression” on page 951,“Title” on page 955, “Tooltips” on page 957, “Value Location:” on page 963,“Values” on page 964, “Visible” on page 966, “X Axis” on page 968, “Y Axis” onpage 968
Scatter ChartA point chart that plots one or more data series against two measures. Multiplepoints are plotted for each category.
Properties of Scatter Chart
“Alternate Text” on page 848, “Application Drill-Through” on page 849,“Background Effects” on page 855, “Border” on page 857, “Box Type” on page 859,“Classes” on page 865, “Clickable Regions” on page 866, “Color by Value” on page866, “Colored Regions” on page 867, “Conditional Palette” on page 868,“Contained Text Direction” on page 870, “Container Select” on page 870,“Direction & Justification” on page 880, “Display for Orientation” on page 881,“Drill-Through Definitions” on page 883, “Drop Shadow” on page 884, “Legend”on page 901, “Margin” on page 904, “Markers” on page 906, “Master DetailRelationships” on page 907, “Material Effects” on page 907, “Matrix Rows andColumns” on page 908, “Maximum Hotspots” on page 908, “Name” on page 914,“No Data Contents” on page 916, “Notes” on page 917, “Numeric Baselines” onpage 919, “Padding” on page 921, “Pagination” on page 921, “Palette” on page 922,“Plot Area Fill” on page 924, “Query” on page 928, “Relative Alignment” on page930, “Render Page when Empty” on page 931, “Render Variable” on page 932, “SetVariable Values” on page 941, “Show Hover” on page 942, “Show Pointer Cursor”on page 943, “Show Values” on page 944, “Size & Overflow” on page 945,“Suppression” on page 951, “Title” on page 955, “Tooltips” on page 956,
Appendix G. Report Studio Object and Property Reference 833
“Trendlines” on page 958, “Visible” on page 966
Scatter MarkerA marker, or symbol, that you can place at a static place in a chart. Markers candesignate a point of significance that may help you analyze or understand thedata.
Properties of Scatter Marker
“Aggregate Function” on page 847, “Expression” on page 886, “Hierarchy” on page894, “Hierarchy Unique Name” on page 894, “Label Location” on page 900,“Level” on page 902, “Level Unique Name” on page 902, “Marker Shape” on page906, “Marker Size (pt)” on page 906, “Marker Style” on page 906, “Master DetailRelationships” on page 907, “Member” on page 910, “Member Unique Name” onpage 911, “Properties” on page 927, “Property Unique Name” on page 928,“Query” on page 928, “Render Variable” on page 932, “Rollup AggregateFunction” on page 936, “Root Members Only” on page 936, “Set Definition” onpage 940, “Set Sorting” on page 940, “X-Axis Data Item Value” on page 968,“Y-Axis Data Item Value” on page 969
Secondary AxisThe generic numeric axis for the combination chart. This axis is normally shown asthe top-right axis but can be in a different position depending on the chartorientation, as specified in the Chart Orientation property of the chart.
Properties of Secondary Axis
“Axis Labels” on page 852, “Axis Line” on page 853, “Axis Range” on page 853,“Axis Title” on page 854, “Axis Title” on page 853, “Gridlines” on page 892,“Minor Gridlines” on page 912, “Number of Minor Intervals” on page 918
Secondary Bottom AxisThe numeric axis for a combination chart. This axis is normally shown as thebottom-right axis, but can change depending on the orientation of the chart, asspecified in the Chart Orientation property of the chart.
Properties of Secondary Bottom Axis
“Axis Labels” on page 852, “Axis Line” on page 853, “Axis Range” on page 853,“Axis Title” on page 854, “Axis Title” on page 853, “Gridlines” on page 892,“Minor Gridlines” on page 912, “Number of Minor Intervals” on page 918
Select & Search PromptAn advanced prompt control that allows you to search for values. You cannot usethis prompt control with SAP BW data sources.
Properties of Select & Search Prompt
“Box Type” on page 860, “Cascade Source” on page 862, “Case Insensitive” onpage 862, “Choices Deselect All Text” on page 864, “Choices Select All Text” onpage 864, “Choices Text” on page 864, “Conditional Styles” on page 868,“Contained Text Direction” on page 870, “Data Format” on page 874, “DeselectText” on page 879, “Direction & Justification” on page 880, “Display Value” onpage 882, “Hide Adornments” on page 893, “Insert Text” on page 896, “Keywords
834 IBM Cognos Report Studio Version 10.2.1: User Guide

Text” on page 897, “Multi-Select” on page 913, “Name” on page 914, “OptionsText” on page 920, “Parameter” on page 922, “Properties” on page 927, “Query” onpage 929, “Remove Text” on page 931, “Render Variable” on page 932, “Required”on page 934, “Results Deselect All Text” on page 935, “Results Select All Text” onpage 935, “Results Text” on page 935, “Rows Per Page” on page 937, “SearchInstructions Text” on page 938, “Search Text” on page 938, “Sorting” on page 947,“Static Choices” on page 949, “Style Variable” on page 950, “Use Value” on page963, “Visible” on page 966
Set ExpressionA set of members.
Properties of Set Expression
“Detail” on page 879, “Dimension” on page 880, “Expression” on page 886,“Hierarchy” on page 894, “Label” on page 899, “Name” on page 913, “Set Sorting”on page 940, “Type” on page 959
SingletonA query item that you can insert anywhere in the layout of your report wherethere is no query associated. When the report is run, the singleton object retrievesonly the first row value for that query. Singletons are useful for adding boilerplatetext to a report, such as a company name or address, to add overall calculations ina report, or to add multidimensional cell calculations in a report.
Properties of Singleton
“Name” on page 914, “Properties” on page 927, “Query” on page 928, “RenderVariable” on page 932
Slicer Member SetA set expression that returns members from a single hierarchy of a singledimension.
Properties of Slicer Member Set
“Expression” on page 885
SQLAn SQL query against a relational data source.
Properties of SQL
“Data Source” on page 877, “Name” on page 915, “SQL” on page 948, “SQLSyntax” on page 949
Static Repeater TableAn active report layout object that is used to present data in a repeating structure.Repeater table controls allow you to create button bars or grids of custom contentthat control the content that appears in other controls.
Appendix G. Report Studio Object and Property Reference 835

Properties of Static Repeater Table
“Across” on page 846, “Application Drill-Through” on page 849, “BackgroundColor” on page 854, “Border” on page 857, “Box Type” on page 859, “Classes” onpage 865, “Clickable Regions” on page 866, “Conditional Styles” on page 868,“Container Filter” on page 870, “Container Select” on page 870, “Direction &Justification” on page 880, “Display for Orientation” on page 881, “Down” on page883, “Font” on page 888, “Foreground Color” on page 889, “Horizontal Alignment”on page 895, “Margin” on page 904, “Name” on page 914, “Relative Alignment” onpage 930, “Render Variable” on page 932, “Repeater Direction” on page 932,“Repeater Table Values Definition” on page 933, “Set Variable Values” on page 941,“Show Hover” on page 942, “Show Pointer Cursor” on page 943, “Size &Overflow” on page 945, “Style Variable” on page 950, “Table Properties” on page952, “Visible” on page 966
Summary FilterA set of conditions in a query that narrow the scope of the data returned. Asummary filter is applied after aggregation is complete.
Properties of Summary Filter
“Definition” on page 879, “Scope” on page 938, “Usage” on page 960
TabA tab in a static tab control.
Properties of Tab
“Icon” on page 896, “Label” on page 898
Tab ControlA static tab control. Each tab requires a corresponding row in the data table of thecontrol.
Properties of Tab Control
“Application Drill-Through” on page 849, “Contained Text Direction” on page 870,“Container Select” on page 870, “Current Tab” on page 873, “Direction &Justification” on page 880, “Display for Orientation” on page 881, “Name” on page914, “Render Variable” on page 932, “Set Variable Values” on page 941, “Size” onpage 945, “Tab Orientation” on page 952, “Tabs Definition” on page 953, “TabWidth” on page 953
Tab Extra ItemData items that are used to determine what appears as the tab labels in a data tabcontrol.
Properties of Tab Extra Item
“Data Item” on page 874
836 IBM Cognos Report Studio Version 10.2.1: User Guide
Tab IconThe icon used to identify each tab in a data tab control. The icons are obtainedfrom a data item inserted into the control.
Properties of Tab Icon
“Data Item” on page 874
Tab LabelThe label used to identify each tab in a data tab control. Each label is determinedby the data items inserted into the control.
Properties of Tab Label
“Data Item” on page 874
TableA collection of cells in which objects can be organized in a grid fashion.
Properties of Table
“Background Color” on page 854, “Border” on page 857, “Box Type” on page 859,“Classes” on page 865, “Conditional Styles” on page 868, “Direction &Justification” on page 880, “Display for Orientation” on page 881, “Drop Shadow”on page 884, “Font” on page 888, “Foreground Color” on page 889, “HorizontalAlignment” on page 895, “Margin” on page 904, “Name” on page 914,“Pagination” on page 921, “Relative Alignment” on page 930, “Render Variable” onpage 932, “Size & Overflow” on page 945, “Style Variable” on page 950, “SummaryText” on page 951, “Table Properties” on page 952, “Visible” on page 966
Table CellThe cells within a row.
Properties of Table Cell
“Background Color” on page 854, “Background Effects” on page 855, “Border” onpage 857, “Box Type” on page 860, “Classes” on page 865, “Conditional Styles” onpage 868, “Direction & Justification” on page 880, “Font” on page 888,“Foreground Color” on page 889, “Horizontal Alignment” on page 895, “Padding”on page 921, “Size & Overflow” on page 945, “Spacing & Breaking” on page 948,“Style Variable” on page 950, “Table Header” on page 952, “Vertical Alignment” onpage 965, “White Space” on page 966
Table of ContentsA collection of Table of Contents Entry objects that refer the same table of contents.The table of contents is generated in the rendered output.
Properties of Table of Contents
“Background Color” on page 854, “Border” on page 857, “Box Type” on page 859,“Classes” on page 865, “Conditional Styles” on page 868, “Direction &Justification” on page 880, “Font” on page 888, “Foreground Color” on page 889,“Horizontal Alignment” on page 895, “Margin” on page 904, “No Data Contents”on page 916
Appendix G. Report Studio Object and Property Reference 837

on page 914, “Padding” on page 921, “Render Page when Empty” on page 931,“Render Variable” on page 932, “Size & Overflow” on page 945, “Spacing &Breaking” on page 948, “Style Variable” on page 950, “Table of Contents Name” onpage 952, “Visible” on page 966, “White Space” on page 966
Table of Contents EntryAn entry in the table of contents.
Properties of Table of Contents Entry
“Background Color” on page 854, “Border” on page 857, “Box Type” on page 859,“Classes” on page 865, “Conditional Styles” on page 868, “Direction &Justification” on page 880, “Font” on page 888, “Foreground Color” on page 889,“Heading Level” on page 893, “Horizontal Alignment” on page 895, “Margin” onpage 904, “Padding” on page 921, “Render Variable” on page 932, “Size &Overflow” on page 945, “Spacing & Breaking” on page 948, “Style Variable” onpage 950, “Table of Contents” on page 952, “Visible” on page 966, “White Space”on page 966
Table RowThe rows in a table.
Properties of Table Row
“Background Color” on page 854, “Box Type” on page 860, “Classes” on page 865,“Conditional Styles” on page 868, “Font” on page 888, “Foreground Color” onpage 889, “Horizontal Alignment” on page 895, “Style Variable” on page 950,“Vertical Alignment” on page 965
Target MeasureThe target measure for a bullet chart.
Properties of Target Measure
“Custom Label” on page 873, “Data Format” on page 874
Target MeasureThe target measure for a metrics range chart.
Properties of Target Measure
“Conditional Styles” on page 868, “Custom Label” on page 873, “Data Format” onpage 874, “Style Variable” on page 950
Text Box PromptA prompt control that allows you to type in a value.
Properties of Text Box Prompt
“Background Color” on page 854, “Border” on page 857, “Box Type” on page 860,“Choices Deselect All Text” on page 864, “Choices Select All Text” on page 864,“Choices Text” on page 864, “Conditional Styles” on page 868, “Contained TextDirection” on page 870, “Default Selections” on page 878, “Deselect Text” on page879
838 IBM Cognos Report Studio Version 10.2.1: User Guide

877, “Direction & Justification” on page 880, “Font” on page 888, “ForegroundColor” on page 889, “From Text” on page 890, “Hide Adornments” on page 893,“Hide Text” on page 893, “Highest Value Text” on page 894, “Insert Text” on page896, “Lowest Value Text” on page 904, “Multi-Line” on page 913, “Multi-Select” onpage 913, “Name” on page 914, “Numbers Only” on page 918, “Parameter” onpage 922, “Range” on page 929, “Relative Alignment” on page 930, “Remove Text”on page 931, “Render Variable” on page 932, “Required” on page 934, “Size &Overflow” on page 945, “Style Variable” on page 950, “To Text” on page 958, “UseThousands Separator” on page 963, “Visible” on page 966
Text ItemA text item in a report. The content can be static text, or it can come from a queryitem or report expression.
Properties of Text Item
“Aggregate Function” on page 847, “Background Color” on page 854, “Border” onpage 857, “Box Type” on page 859, “Classes” on page 865, “Conditional Styles” onpage 868, “Control Data Item Value” on page 871, “Data Format” on page 874,“Data Item Label” on page 875, “Data Item Value” on page 875, “Direction &Justification” on page 880, “Display for Orientation” on page 881, “Drill-ThroughDefinitions” on page 883, “Expression” on page 886, “Font” on page 888,“Foreground Color” on page 889, “Hierarchy” on page 894, “Hierarchy UniqueName” on page 894, “Label For” on page 899, “Level” on page 902, “Level UniqueName” on page 902, “Margin” on page 904, “Maximum Characters” on page 908,“Member” on page 910, “Member Unique Name” on page 911, “Name” on page914, “Padding” on page 921, “Property Unique Name” on page 928, “RelativeAlignment” on page 930, “Render Variable” on page 932, “Report Expression” onpage 933, “Rollup Aggregate Function” on page 936, “Root Members Only” onpage 936, “Set Definition” on page 940, “Set Sorting” on page 940, “Size &Overflow” on page 945, “Source Type” on page 947, “Spacing & Breaking” on page948, “Style Variable” on page 950, “Text” on page 954, “Text Source Variable” onpage 954, “Use Detail Value on Page” on page 961, “Visible” on page 966
TimeReturns the time on the report server when the report server started rendering thereport.
Properties of Time
“Background Color” on page 854, “Classes” on page 865, “Data Format” on page874, “Display for Orientation” on page 881, “Font” on page 888, “ForegroundColor” on page 889, “Margin” on page 904, “Relative Alignment” on page 930
Time PromptAn advanced prompt control that allows you to select a time value.
Properties of Time Prompt
“Box Type” on page 860, “Choices Deselect All Text” on page 864, “Choices SelectAll Text” on page 864, “Choices Text” on page 864, “Clock Mode” on page 866,“Conditional Styles” on page 868, “Contained Text Direction” on page 870,“Default Selections” on page 878, “Deselect Text” on page 879, “Direction &Justification” on page 880, “Display Milliseconds” on page 882, “Display Seconds”on page 882
Appendix G. Report Studio Object and Property Reference 839

on page 880, “From Text” on page 890, “Hide Adornments” on page 893, “HighestValue Text” on page 894, “Insert Text” on page 896, “Lowest Value Text” on page904, “Multi-Select” on page 913, “Name” on page 914, “Parameter” on page 922,“Range” on page 929, “Remove Text” on page 931, “Render Variable” on page 932,“Required” on page 934, “Select UI” on page 939, “Style Variable” on page 950,“To Text” on page 958, “Visible” on page 966
Toggle Button BarA static toggle button bar control. Each toggle button requires a corresponding rowin the data table of the control.
Properties of Toggle Button Bar
“Application Drill-Through” on page 849, “Button Gap” on page 861, “ButtonsDefinition” on page 861, “Button Width” on page 861, “Contained Text Direction”on page 870, “Container Select” on page 870, “Control Enable” on page 872,“Direction & Justification” on page 880, “Display for Orientation” on page 881,“Name” on page 914, “Orientation” on page 920, “Render Variable” on page 932,“Set Variable Values” on page 941
Tolerance MeasureThe tolerance measure for a metrics chart.
Properties of Tolerance Measure
“Conditional Styles” on page 868, “Custom Label” on page 873, “Data Format” onpage 874, “Style Variable” on page 950
Total ColumnA column or bar representing the total cumulative value of all other columns orbars in a progressive chart.
Properties of Total Column
“Aggregate Function” on page 847, “Data Format” on page 874, “Data Item Value”on page 875, “Expression” on page 886, “Hierarchy” on page 894, “HierarchyUnique Name” on page 894, “Level” on page 902, “Level Unique Name” on page902, “Member” on page 910, “Member Unique Name” on page 911, “Properties”on page 927, “Property Unique Name” on page 928, “Report Expression” on page933, “Rollup Aggregate Function” on page 936, “Root Members Only” on page 936,“Set Definition” on page 940, “Set Sorting” on page 940, “Text” on page 954, “TotalColumn Color” on page 958
Total Column LabelThe label to be rendered for the total column.
Properties of Total Column Label
“Properties” on page 927
Tree PromptA data-driven prompt control that shows hierarchical information and allows youto select one or more members.
840 IBM Cognos Report Studio Version 10.2.1: User Guide

Properties of Tree Prompt
“Cascade Source” on page 862, “Conditional Styles” on page 868, “Contained TextDirection” on page 870, “Default Selections” on page 878, “Deselect Text” on page879, “Direction & Justification” on page 880, “Hide Adornments” on page 893,“Multi-Select” on page 913, “Name” on page 914, “Parameter” on page 922,“Pre-populate” on page 926, “Pre-populate Levels” on page 926, “Query” on page929, “Render Variable” on page 932, “Required” on page 934, “Results Deselect AllText” on page 935, “Results Select All Text” on page 935, “Rows Per Page” on page937, “Size & Overflow” on page 945, “Sorting” on page 947, “Style Variable” onpage 950, “Use Value” on page 963, “Visible” on page 966
TrendlineA line or curve that indicates the general direction of the data over time.
Properties of Trendline
“Based on” on page 856, “Line Style” on page 903, “Render Variable” on page 932,“Trendline Label” on page 958, “Type” on page 959
Trendline LabelA label that will be will be shown in the legend for the trend line.
Properties of Trendline Label
“Conditional Styles” on page 868, “Data Format” on page 874, “Properties” onpage 927, “Query” on page 928
ValueThe return value from the evaluation of the report variable.
ValueA group of two or more variable values.
ValueA measure or single value that is used to plot data in a visualization.
Properties of Value
“Data Format” on page 874, “Label” on page 899, “Rollup Method” on page 936,“Value Range” on page 964
Value PromptA prompt control that allows you to select one or more values from a list.
Properties of Value Prompt
“Auto-Submit” on page 851, “Background Color” on page 854, “Box Type” on page860, “Cascade Source” on page 862, “Choices Deselect All Text” on page 864,“Choices Select All Text” on page 864, “Choices Text” on page 864, “ConditionalStyles” on page 868, “Contained Text Direction” on page 870, “Data Format” onpage 874, “Default Selections” on page 878, “Deselect Text” on page 879, “Direction& Justification” on page 880, “Display Value” on page 882, “Font” on page 888,
Appendix G. Report Studio Object and Property Reference 841
“Foreground Color” on page 889, “From Text” on page 890, “Header Text” on page893, “Hide Adornments” on page 893, “Highest Value Text” on page 894, “InsertText” on page 896, “Lowest Value Text” on page 904, “Multi-Select” on page 913,“Name” on page 914, “Parameter” on page 922, “Pre-populate” on page 926,“Properties” on page 927, “Query” on page 929, “Range” on page 929, “RelativeAlignment” on page 930, “Remove Text” on page 931, “Render Variable” on page932, “Required” on page 934, “Results Deselect All Text” on page 935, “ResultsSelect All Text” on page 935, “Rows Per Page” on page 937, “Select UI” on page939, “Size & Overflow” on page 945, “Sorting” on page 947, “Static Choices” onpage 949, “Style Variable” on page 950, “To Text” on page 958, “Use Value” onpage 963, “Visible” on page 966
VariableA report variable.
Properties of Variable
“Name” on page 915, “Report Expression” on page 934, “Type” on page 959
Variable Text ItemA text item that renders the value of an active report variable.
Properties of Variable Text Item
“Active Report Variable” on page 846, “Background Color” on page 854, “Border”on page 857, “Box Type” on page 859, “Classes” on page 865, “Data Format” onpage 874, “Direction & Justification” on page 880, “Display for Orientation” onpage 881, “Display Values” on page 883, “Font” on page 888, “Foreground Color”on page 889, “Margin” on page 904, “Padding” on page 921, “Relative Alignment”on page 930, “Render Variable” on page 932, “Size & Overflow” on page 945,“Spacing & Breaking” on page 948, “Visible” on page 966
VisualizationA visual representation of data.
Properties of Visualization
“Alternate Text” on page 848, “Animation Effect” on page 849, “Clickable Regions”on page 866, “Data Format” on page 874, “Display for Orientation” on page 881,“Height” on page 893, “Name” on page 914, “Render Variable” on page 932, “UseEmbedded Data” on page 961, “Width” on page 967
Win-Loss ChartA microchart in which the value of each column is either 1 or -1, often denoting awin or a loss.
Properties of Win-Loss Chart
“Allow Ties” on page 848, “Axis Line” on page 852, “Background Color” on page854, “Background Effects” on page 855, “Border” on page 857, “Border Color” onpage 858, “Borders” on page 858, “Box Type” on page 859, “Chart Orientation” onpage 863, “Classes” on page 865, “Conditional Styles” on page 868, “Drill-ThroughDefinitions” on page 883, “Font” on page 888, “Footer” on page 889, “ForegroundColor” on page 889, “Loss Color” on page 904, “Margin” on page 904, “Master
842 IBM Cognos Report Studio Version 10.2.1: User Guide

Detail Relationships” on page 907, “Maximum Hotspots” on page 908, “Name” onpage 914, “No Data Contents” on page 916, “Padding” on page 921, “Pagination”on page 921, “Query” on page 928, “Relative Alignment” on page 930, “RenderPage when Empty” on page 931, “Render Variable” on page 932, “Size &Overflow” on page 945, “Style Variable” on page 950, “Subtitle” on page 950,“Suppression” on page 951, “Title” on page 955, “Tooltips” on page 957, “Visible”on page 966, “Win Color” on page 967, “Win-Loss Threshold” on page 967
Win-Loss MeasureThe measure for a win-loss chart.
Properties of Win-Loss Measure
“Aggregate Function” on page 847, “Custom Label” on page 873, “Data Format”on page 874, “Expression” on page 886, “Hierarchy” on page 894, “HierarchyUnique Name” on page 894, “Level” on page 902, “Level Unique Name” on page902, “Member” on page 910, “Member Unique Name” on page 911, “PropertyUnique Name” on page 928, “Rollup Aggregate Function” on page 936, “RootMembers Only” on page 936, “Set Definition” on page 940, “Set Sorting” on page940
X AxisThe horizontal numeric axis for the chart, including labels, titles, range, and scale.
Properties of X Axis
“Axis Labels” on page 852, “Axis Line” on page 852, “Axis Title” on page 853,“Axis Title” on page 853, “Classes” on page 865, “Data Format” on page 874,“Gridlines” on page 892, “Include Zero For Auto Scale” on page 896, “MaximumValue” on page 910, “Minimum Value” on page 912, “Minor Gridlines” on page912, “Scale” on page 937, “Scale Interval” on page 938, “Use Same Range For AllInstances” on page 962
X AxisThe x-axis on a scatter or bubble chart.
Properties of X Axis
“Axis Labels” on page 852, “Axis Line” on page 853, “Axis Range” on page 853,“Axis Title” on page 854, “Axis Title” on page 853, “Gridlines” on page 892,“Minor Gridlines” on page 912, “Number of Minor Intervals” on page 918
X AxisThe axis line for an ordinal, or non-numeric, axis.
Properties of X Axis
“Allow 45° Rotation” on page 847, “Allow 90° Rotation” on page 848, “AllowSkip” on page 848, “Allow Stagger” on page 848, “Axis Labels” on page 852, “AxisLine” on page 852, “Axis Title” on page 853, “Axis Title” on page 853, “Classes” onpage 865, “Display Frequency” on page 882, “Drill-Through Definitions” on page883, “First Label Index” on page 887, “Gridlines” on page 892, “Label Control” onpage 899, “Maximum Truncation Characters” on page 909, “Minor Gridlines” onpage 912, “Truncation” on page 958, “Truncation Text” on page 959
Appendix G. Report Studio Object and Property Reference 843

X Axis MeasureThe measure for the horizontal axis of a scatter chart or bubble chart.
Properties of X Axis Measure
“Conditional Styles” on page 868, “Custom Label” on page 873, “Data Format” onpage 874, “Style Variable” on page 950
Y1 AxisThe numeric axis of a metrics chart, or the primary numeric axis of a combinationchart.
Properties of Y1 Axis
“Axis Labels” on page 852, “Axis Line” on page 852, “Axis Title” on page 853,“Axis Title” on page 853, “Classes” on page 865, “Data Format” on page 874,“Gridlines” on page 892, “Include Zero For Auto Scale” on page 896, “MaximumValue” on page 910, “Minimum Value” on page 912, “Minor Gridlines” on page912, “Scale” on page 937, “Scale Interval” on page 938, “Use Same Range For AllInstances” on page 962
Y2 AxisThe secondary numeric axis of a combination chart.
Properties of Y2 Axis
“Axis Labels” on page 852, “Axis Line” on page 852, “Axis Title” on page 853,“Axis Title” on page 853, “Classes” on page 865, “Data Format” on page 874,“Gridlines” on page 892, “Include Zero For Auto Scale” on page 896, “MaximumValue” on page 910, “Minimum Value” on page 912, “Minor Gridlines” on page912, “Scale” on page 937, “Scale Interval” on page 938, “Use Same Range For AllInstances” on page 962
Y AxisThe vertical numeric axis for the chart, including labels, titles, range, and scale.
Properties of Y Axis
“Axis Labels” on page 852, “Axis Line” on page 852, “Axis Title” on page 853,“Axis Title” on page 853, “Classes” on page 865, “Data Format” on page 874,“Gridlines” on page 892, “Include Zero For Auto Scale” on page 896, “MaximumValue” on page 910, “Minimum Value” on page 912, “Minor Gridlines” on page912, “Scale” on page 937, “Scale Interval” on page 938, “Use Same Range For AllInstances” on page 962
Y AxisThe y-axis on a scatter or bubble chart.
Properties of Y Axis
“Axis Labels” on page 852, “Axis Line” on page 853, “Axis Range” on page 853,“Axis Title” on page 854, “Axis Title” on page 853, “Gridlines” on page 892,“Minor Gridlines” on page 912, “Number of Minor Intervals” on page 918
844 IBM Cognos Report Studio Version 10.2.1: User Guide

Y AxisThe axis line for an ordinal, or non-numeric, axis.
Properties of Y Axis
“Allow 45° Rotation” on page 847, “Allow 90° Rotation” on page 848, “AllowSkip” on page 848, “Allow Stagger” on page 848, “Axis Labels” on page 852, “AxisLine” on page 852, “Axis Title” on page 853, “Axis Title” on page 853, “Classes” onpage 865, “Display Frequency” on page 882, “Drill-Through Definitions” on page883, “First Label Index” on page 887, “Gridlines” on page 892, “Label Control” onpage 899, “Maximum Truncation Characters” on page 909, “Minor Gridlines” onpage 912, “Truncation” on page 958, “Truncation Text” on page 959
Y Axis MeasureThe measure for the vertical axis of a scatter chart or bubble chart.
Properties of Y Axis Measure
“Conditional Styles” on page 868, “Custom Label” on page 873, “Data Format” onpage 874, “Style Variable” on page 950
Z AxisThe third numeric axis for a three-dimensional scatter chart, including labels, titles,range, and scale.
Properties of Z Axis
“Axis Labels” on page 852, “Axis Line” on page 852, “Axis Title” on page 853,“Axis Title” on page 853, “Classes” on page 865, “Data Format” on page 874,“Gridlines” on page 892, “Include Zero For Auto Scale” on page 896, “MaximumValue” on page 910, “Minimum Value” on page 912, “Minor Gridlines” on page912, “Scale” on page 937, “Scale Interval” on page 938, “Use Same Range For AllInstances” on page 962
Z AxisThe vertical numeric axis for a three-dimensional combination chart, includinglabels, titles, range, and scale.
Properties of Z Axis
“Axis Labels” on page 852, “Axis Line” on page 852, “Axis Title” on page 853,“Axis Title” on page 853, “Classes” on page 865, “Data Format” on page 874,“Gridlines” on page 892, “Include Zero For Auto Scale” on page 896, “MaximumValue” on page 910, “Minimum Value” on page 912, “Minor Gridlines” on page912, “Scale” on page 937, “Scale Interval” on page 938, “Use Same Range For AllInstances” on page 962
Z Axis MeasureThe measure for the third axis of a three-dimensional scatter chart.
Appendix G. Report Studio Object and Property Reference 845

Properties of Z Axis Measure
“Conditional Styles” on page 868, “Custom Label” on page 873, “Data Format” onpage 874, “Style Variable” on page 950
Report Studio PropertiesThe following is a list of properties available in the lower left pane of IBM®
Cognos® Report Studio.
3-D Viewing AngleSpecifies the 3-D viewing angle of the chart.
Applies to
“3-D Combination Chart” on page 772, “3-D Scatter Chart” on page 772
Absolute PositionSpecifies that the legend will be positioned absolutely, by setting its pixel position.
Applies to
“Legend” on page 806
AcrossSets the number of times across, or horizontally, that the contents of the object maybe rendered.
The default value depends on the setting of the Repeater Direction property. If itis set to Left to right, top to bottom, the default is one. If it is set to Top tobottom, left to right, the default is 20.
Applies to
“Repeater Table” on page 831, “Static Repeater Table” on page 835
Active Dot ColorSpecifies the color of the dot of the selected value in the iterator.
Applies to
“Iterator Label Area” on page 805
Active Report VariableSpecifies the variable to use in the control.
Applies to
“Variable Text Item” on page 842
Actual MeasureThe measure that is used to show values as a percentage of a summary.
846 IBM Cognos Report Studio Version 10.2.1: User Guide

Applies to
“Percentaged Measure” on page 823
Aggregate Data ItemSpecifies the data item that is used to calculate the summary or aggregation.
Applies to
“Dimensional Edge Summary” on page 798, “Edge Summary” on page 799, “ListSummary” on page 813
Aggregate FunctionSpecifies the type of aggregation to apply. The Automatic setting means that theapplication groups or summarizes based on the data type. The Summarize settingmeans that any setting found in the model will be used to determine the type ofaggregation. The default setting is Automatic.
Applies to
“Area” on page 773, “Bar” on page 774, “Category Baseline” on page 781, “ChartNode Member” on page 782, “Chart Text Item” on page 782, “Chart Text Item” onpage 783, “Colored Region” on page 785, “Colored Region” on page 785, “CrosstabCorner” on page 789, “Crosstab Fact Cells” on page 789, “Crosstab Intersection” onpage 789, “Crosstab Member Fact Cells” on page 790, “Crosstab Node Member” onpage 790, “Cumulation Line Label” on page 792, “Data Item” on page 795, “GaugeAxis” on page 800, “HTML Item” on page 802, “Image” on page 803, “Line” onpage 808, “List Cell” on page 809, “List Column Body” on page 810, “List ColumnTitle” on page 811, “Map Location” on page 814, “Map Location” on page 815,“Map Refinement Location” on page 815, “Map Refinement Location” on page 815,“Marker” on page 816, “Numeric Baseline” on page 820, “Rich Text Item” on page832, “Scatter Marker” on page 834, “Text Item” on page 839, “Total Column” onpage 840, “Win-Loss Measure” on page 843
Aggregation MethodSpecifies the type of summary or aggregation that is applied.
Applies to
“Dimensional Edge Summary” on page 798, “Edge Summary” on page 799
Aggregation MethodSpecifies the type of summary or aggregation that is applied.
Applies to
“List Summary” on page 813
Allow 45° RotationSpecifies whether the labels can be rotated 45 degrees if the labels are long.
Appendix G. Report Studio Object and Property Reference 847

Applies to
“Category Axis” on page 780, “X Axis” on page 843, “Y Axis” on page 845
Allow 90° RotationSpecifies whether the labels can be rotated 90 degrees if the labels are long.
Applies to
“Category Axis” on page 780, “X Axis” on page 843, “Y Axis” on page 845
Allow SkipSpecifies whether some labels can be skipped if they are long.
Applies to
“Category Axis” on page 780, “X Axis” on page 843, “Y Axis” on page 845
Allow SortingSpecifies whether sorting is allowed for the column when the active report isexecuted. You can set the value of this property for multiple objects simultaneouslyby first control+clicking the items in the report.
Applies to
“List Column” on page 809, “List Column Body” on page 810, “List Column Title”on page 811
Allow StaggerSpecifies whether the labels can be staggered if they are long.
Applies to
“Category Axis” on page 780, “X Axis” on page 843, “Y Axis” on page 845
Allow TiesSpecifies whether data values that equal the Win Loss Threshold property areconverted to zero and mapped on the zero line.
Applies to
“Win-Loss Chart” on page 842
Alternate TextSpecifies a text alternative for non-text objects such as images and charts. Use tomake reports accessible for people who use screen readers.
Applies to
“3-D Combination Chart” on page 772, “3-D Scatter Chart” on page 772, “BubbleChart” on page 776, “Bubble Chart” on page 777, “Bullet Chart” on page 777,“Combination Chart” on page 785, “Combination Chart” on page 786, “GaugeChart” on page 800, “Gauge Chart” on page 801, “Image” on page 803, “Map” onpage 814
848 IBM Cognos Report Studio Version 10.2.1: User Guide
page 814, “Marimekko Chart” on page 815, “Metrics Range Chart” on page 818,“Metric Studio Diagram” on page 818, “Pareto Chart” on page 822, “Pareto Chart”on page 823, “Pie Chart” on page 823, “Pie Chart” on page 824, “Polar Chart” onpage 825, “Progressive Chart” on page 826, “Progressive Chart” on page 827,“Radar Chart” on page 828, “Scatter Chart” on page 833, “Scatter Chart” on page833, “Visualization” on page 842
Angular AxisSpecifies whether the axis is rendered.
Applies to
“Polar Chart” on page 825
AnimateSpecifies whether to animate the movement of the slider.
Applies to
“Continuous Values Slider” on page 787, “Data Discrete Values Slider” on page794, “Discrete Values Slider” on page 798
Animation EffectSpecifies the effect that is used to animate data changes in the visualization.
Applies to
“Visualization” on page 842
ApplicationSpecifies if the condition will be applied before or after aggregation andsummarization. When true, the condition will apply to the summarized rows, anda fact, or aggregate, in the expression will be interpreted as the aggregated value ofthe summarized rows. When false, the condition will apply to the detail databaserows from the tabular result set prior to aggregation or summarization, and a fact,or aggregate, in the expression will be interpreted as the individual database valuebefore it has been summarized. This property has no effect on OLAP data sources,on references to non-aggregate items, or when automatic summarization isdisabled.
Applies to
“Detail Filter” on page 798
Application Drill-ThroughApplies to
“3-D Combination Chart” on page 772, “3-D Scatter Chart” on page 772, “BubbleChart” on page 776, “Bubble Chart” on page 777, “Bullet Chart” on page 777,“Button” on page 778, “Button Bar” on page 778, “Check Box Group” on page 784,“Combination Chart” on page 785, “Combination Chart” on page 786, “ContinuousValues Slider” on page 787, “Crosstab” on page 788, “Data Button Bar” on page793, “Data Check Box Group” on page 793, “Data Container” on page 793, “Data
Appendix G. Report Studio Object and Property Reference 849

Deck” on page 794, “Data Discrete Values Slider” on page 794, “Data Drop-DownList” on page 794, “Data Iterator” on page 795, “Data List Box” on page 795, “DataRadio Button Group” on page 795, “Data Tab Control” on page 796, “Data ToggleButton Bar” on page 796, “Deck” on page 797, “Discrete Values Slider” on page798, “Drop-Down List” on page 799, “Gauge Chart” on page 800, “Gauge Chart”on page 801, “Iterator” on page 804, “List” on page 808, “List Box” on page 809,“Map” on page 814, “Marimekko Chart” on page 815, “Metrics Range Chart” onpage 818, “Pareto Chart” on page 822, “Pareto Chart” on page 823, “Pie Chart” onpage 823, “Pie Chart” on page 824, “Polar Chart” on page 825, “Progressive Chart”on page 826, “Progressive Chart” on page 827, “Radar Chart” on page 828, “RadioButton Group” on page 829, “Repeater Table” on page 831, “Scatter Chart” on page833, “Scatter Chart” on page 833, “Static Repeater Table” on page 835, “TabControl” on page 836, “Toggle Button Bar” on page 840
Apply Single ClassSpecifies whether to apply all of the classes defined or only one class. When set toYes, the last class that was applied is used.
For example, if you applied a class to a crosstab intersection and another class tothe member fact cells of a crosstab row, the class applied to the intersection is thelast class applied to the fact cells. For information about the order in which classesare applied, see the topic Create and Modify Report and Object Styles.
This property is set to Yes when you are upgrading a report so that the upgradedreport will look the same as the original report. This is because objects in reportscreated using earlier versions of IBM® Cognos® Business Intelligence support onlyone class.
Applies to
“Crosstab Fact Cells” on page 789
Area ShapeSpecifies the shape of an area in an area chart.
Applies to
“Area” on page 773
Auto Font SizeSpecifies whether to automatically resize the font to fit the labels.
Applies to
“Axis Labels” on page 774, “Axis Title” on page 774, “Legend” on page 807,“Legend Title” on page 807
Auto Group & SummarizeSpecifies whether the application will apply suggested aggregate functions toaggregate data items and group all non-aggregate data items, producing groupsand summary rows. If it is set to No, detail rows will be rendered.
850 IBM Cognos Report Studio Version 10.2.1: User Guide

Applies to
“Query” on page 828
Auto-SortWhen running the report, specifies whether to automatically sort based on datatype.
Applies to
“Query” on page 828
Auto-SubmitSpecifies whether the application submits the prompt page automatically, as soonas a value is changed.
Applies to
“Value Prompt” on page 841
Auto TruncationSpecifies whether to allow truncation of text.
Applies to
“Legend” on page 806
Avoid Division by ZeroSpecifies whether the application will return a null value when it encounters adivision by zero. This property applies only to relational data sources.
Applies to
“Query” on page 828
Avoid Label CollisionControls how labels are arranged. If set to false, the chart uses the defaultpositions. If set to true, the chart uses a different layout to avoid label collision. Tokeep existing reports unchanged, set this property to false.
Applies to
“Pie Chart” on page 823
Axis AnglesSpecifies the start and end angle and the direction of the gauge axis. All angles aremeasured in degrees starting from the three o'clock position.
Applies to
“Gauge Axis” on page 800
Appendix G. Report Studio Object and Property Reference 851

Axis AssignmentSpecifies the numeric axis to use. This property applies only to legacy charts.
Applies to
“Area” on page 773, “Bar” on page 774, “Baseline” on page 775, “Line” on page808, “Marker” on page 816
Axis AssignmentSpecifies which numeric axis to use.
Applies to
“Baseline” on page 775
Axis JustificationSpecifies whether the data labels are aligned to the inside or outside of the gaugeaxis.
Applies to
“Gauge Axis” on page 800
Axis LabelsSpecifies whether to show or hide axis labels.
Applies to
“Category axis” on page 780, “Cumulation Line” on page 792, “Gauge Axis” onpage 800, “Numeric Axis” on page 820, “Pareto Bars” on page 822, “Primary Axis”on page 826, “Primary Bottom Axis” on page 826, “Secondary Axis” on page 834,“Secondary Bottom Axis” on page 834, “X Axis” on page 843, “Y Axis” on page844
Axis LabelsSpecifies whether to show or hide axis labels. This property applies only to legacycharts.
Applies to
“Angular Axis” on page 773, “Category Axis” on page 780, “Cumulation LineAxis” on page 792, “Numerical Axis” on page 820, “Numerical Axis” on page 820,“Radial Axis” on page 829, “X Axis” on page 843, “X Axis” on page 843, “Y1 Axis”on page 844, “Y2 Axis” on page 844, “Y Axis” on page 844, “Y Axis” on page 845,“Z Axis” on page 845, “Z Axis” on page 845
Axis LineSpecifies the properties of the axis line in a chart. This property applies only tolegacy charts.
852 IBM Cognos Report Studio Version 10.2.1: User Guide

Applies to
“Angular Axis” on page 773, “Category Axis” on page 780, “Cumulation LineAxis” on page 792, “Numerical Axis” on page 820, “Numerical Axis” on page 820,“Radial Axis” on page 829, “Win-Loss Chart” on page 842, “X Axis” on page 843,“X Axis” on page 843, “Y1 Axis” on page 844, “Y2 Axis” on page 844, “Y Axis” onpage 844, “Y Axis” on page 845, “Z Axis” on page 845, “Z Axis” on page 845
Axis LineSpecifies the properties of the axis line in a chart.
Applies to
“Category axis” on page 780, “Cumulation Line” on page 792, “Numeric Axis” onpage 820, “Pareto Bars” on page 822, “Primary Axis” on page 826, “PrimaryBottom Axis” on page 826, “Secondary Axis” on page 834, “Secondary BottomAxis” on page 834, “X Axis” on page 843, “Y Axis” on page 844
Axis LineSpecifies the properties of the gauge axis line in a gauge chart.
Applies to
“Gauge Axis” on page 800
Axis RangeSpecifies the appearance of the range of values on an axis.
Applies to
“Cumulation Line” on page 792, “Gauge Axis” on page 800, “Numeric Axis” onpage 820, “Pareto Bars” on page 822, “Primary Axis” on page 826, “PrimaryBottom Axis” on page 826, “Secondary Axis” on page 834, “Secondary BottomAxis” on page 834, “X Axis” on page 843, “Y Axis” on page 844
Axis TitleSpecifies whether an axis title is rendered.
Applies to
“Angular Axis” on page 773, “Category Axis” on page 780, “Category axis” onpage 780, “Cumulation Line” on page 792, “Numerical Axis” on page 820,“Numerical Axis” on page 820, “Numeric Axis” on page 820, “Pareto Bars” onpage 822, “Primary Axis” on page 826, “Primary Bottom Axis” on page 826,“Radial Axis” on page 829, “Secondary Axis” on page 834, “Secondary BottomAxis” on page 834, “X Axis” on page 843, “X Axis” on page 843, “X Axis” on page843, “Y1 Axis” on page 844, “Y2 Axis” on page 844, “Y Axis” on page 844, “YAxis” on page 844, “Y Axis” on page 845, “Z Axis” on page 845, “Z Axis” on page845
Axis TitleSpecifies whether an axis title will be rendered. This property applies only tolegacy charts.
Appendix G. Report Studio Object and Property Reference 853
Applies to
“Angular Axis” on page 773, “Category Axis” on page 780, “Cumulation LineAxis” on page 792, “Gauge Chart” on page 801, “Map” on page 814, “NumericalAxis” on page 820, “Numerical Axis” on page 820, “Pie Chart” on page 823,“Radial Axis” on page 829, “X Axis” on page 843, “X Axis” on page 843, “Y1 Axis”on page 844, “Y2 Axis” on page 844, “Y Axis” on page 844, “Y Axis” on page 845,“Z Axis” on page 845, “Z Axis” on page 845
Axis TitleSpecifies whether to show the axis titles in a chart.
Applies to
“Category axis” on page 780, “Cumulation Line” on page 792, “Gauge Axis” onpage 800, “Numeric Axis” on page 820, “Pareto Bars” on page 822, “Pie Chart” onpage 824, “Primary Axis” on page 826, “Primary Bottom Axis” on page 826,“Secondary Axis” on page 834, “Secondary Bottom Axis” on page 834, “X Axis” onpage 843, “Y Axis” on page 844
Background ColorSpecifies the background color for the object.
Applies to
“3-D Combination Chart” on page 772, “3-D Scatter Chart” on page 772, “Block”on page 776, “Bubble Chart” on page 776, “Caption” on page 779, “Chart Body”on page 781, “Chart Body” on page 781, “Combination Chart” on page 785,“Conditional Block” on page 787, “Conditional Block” on page 787, “Context ItemText” on page 787, “Crosstab” on page 788, “Crosstab Columns” on page 788,“Crosstab Columns” on page 788, “Crosstab Corner” on page 789, “Crosstab FactCells” on page 789, “Crosstab Intersection” on page 789, “Crosstab Member FactCells” on page 790, “Crosstab Node Member” on page 790, “Crosstab Rows” onpage 790, “Crosstab Rows” on page 791, “Crosstab Space” on page 791, “CrosstabSummary” on page 791, “Date” on page 796, “Field Set” on page 800, “GaugeChart” on page 801, “Hyperlink” on page 802, “Hyperlink Button” on page 803,“Image” on page 803, “Legend” on page 806, “List” on page 808, “List Cell” onpage 809, “List Column” on page 809, “List Column Body” on page 810, “ListColumns” on page 810, “List Columns” on page 810, “List Columns Body Style”on page 811, “List Columns Title Style” on page 811, “List Column Title” on page811, “List Footer” on page 811, “List Header” on page 812, “List Row” on page813, “List Row Cells Style” on page 813, “List Summary” on page 814, “Map” onpage 814, “Marimekko Chart” on page 815, “Metrics Range Chart” on page 818,“Note Content” on page 819, “Page” on page 821, “Page Break Text” on page 821,“Page Number” on page 821, “Pareto Chart” on page 823, “Pie Chart” on page823, “Polar Chart” on page 825, “Progressive Chart” on page 827, “Prompt Button”on page 827, “Radar Chart” on page 828, “Repeater Table” on page 831, “RepeaterTable Cell” on page 831, “Repeater Table Cell” on page 832, “Row Number” onpage 832, “Row Number” on page 832, “Scatter Chart” on page 833, “StaticRepeater Table” on page 835, “Table” on page 837, “Table Cell” on page 837, “Tableof Contents” on page 837, “Table of Contents Entry” on page 838, “Table Row” onpage 838, “Text Box Prompt” on page 838, “Text Item” on page 839, “Time” onpage 839, “Value Prompt” on page 841, “Variable Text Item” on page 842,“Win-Loss Chart” on page 842
854 IBM Cognos Report Studio Version 10.2.1: User Guide

Background EffectsSpecifies the characteristics of a background. You can add background effects onlyto objects that have a fixed height and width; if a percentage size is given, theeffects are ignored.
Applies to
“3-D Combination Chart” on page 772, “3-D Scatter Chart” on page 772, “Block”on page 776, “Bubble Chart” on page 776, “Bubble Chart” on page 777, “BulletChart” on page 777, “Chart Body” on page 781, “Chart Footer” on page 781,“Chart Footer” on page 781, “Chart Subtitle” on page 782, “Chart Subtitle” on page782, “Chart Title” on page 783, “Chart Title” on page 783, “Class” on page 784,“Combination Chart” on page 785, “Combination Chart” on page 786, “ConditionalBlock” on page 787, “Conditional Block” on page 787, “Crosstab Columns” onpage 788, “Crosstab Columns” on page 788, “Crosstab Corner” on page 789,“Crosstab Fact Cells” on page 789, “Crosstab Intersection” on page 789, “CrosstabMember Fact Cells” on page 790, “Crosstab Node Member” on page 790, “CrosstabRows” on page 790, “Crosstab Rows” on page 791, “Crosstab Space” on page 791,“Crosstab Summary” on page 791, “Equation Label” on page 799, “Gauge Chart”on page 800, “Gauge Chart” on page 801, “Legend” on page 807, “List Cell” onpage 809, “List Column” on page 809, “List Column Body” on page 810, “ListColumns” on page 810, “List Columns” on page 810, “List Columns Body Style”on page 811, “List Columns Title Style” on page 811, “List Column Title” on page811, “List Footer” on page 811, “List Header” on page 812, “List Row” on page813, “List Row Cells Style” on page 813, “Map” on page 814, “Marimekko Chart”on page 815, “Metrics Range Chart” on page 818, “Note” on page 819, “ParetoChart” on page 822, “Pareto Chart” on page 823, “Pie Chart” on page 823, “PieChart” on page 824, “Polar Chart” on page 825, “Progressive Chart” on page 826,“Progressive Chart” on page 827, “Radar Chart” on page 828, “Repeater TableCell” on page 831, “Repeater Table Cell” on page 832, “Scatter Chart” on page 833,“Scatter Chart” on page 833, “Table Cell” on page 837, “Win-Loss Chart” on page842
Background ImageSpecifies an image to be used as the background for the object.
Applies to
“3-D Combination Chart” on page 772, “3-D Scatter Chart” on page 772, “Block”on page 776, “Bubble Chart” on page 776, “Caption” on page 779, “Chart Body”on page 781, “Chart Body” on page 781, “Combination Chart” on page 785,“Conditional Block” on page 787, “Conditional Block” on page 787, “Context ItemText” on page 787, “Crosstab” on page 788, “Crosstab Columns” on page 788,“Crosstab Columns” on page 788, “Crosstab Corner” on page 789, “Crosstab FactCells” on page 789, “Crosstab Intersection” on page 789, “Crosstab Member FactCells” on page 790, “Crosstab Node Member” on page 790, “Crosstab Rows” onpage 790, “Crosstab Rows” on page 791, “Crosstab Space” on page 791, “CrosstabSummary” on page 791, “Field Set” on page 800, “Gauge Chart” on page 801,“Hyperlink” on page 802, “Hyperlink Button” on page 803, “Image” on page 803,“Legend” on page 806, “List” on page 808, “List Cell” on page 809, “List Column”on page 809, “List Column Body” on page 810, “List Columns” on page 810, “ListColumns” on page 810, “List Columns Body Style” on page 811, “List ColumnsTitle Style” on page 811, “List Column Title” on page 811, “List Footer” on page811, “List Header” on page 812, “List Row” on page 813, “List Row Cells Style” onpage 813, “List Summary” on page 814, “Map” on page 814, “Marimekko Chart”on page 815
Appendix G. Report Studio Object and Property Reference 855

on page 815, “Metrics Range Chart” on page 818, “Page” on page 821, “Page BreakText” on page 821, “Pareto Chart” on page 823, “Pie Chart” on page 823, “PolarChart” on page 825, “Progressive Chart” on page 827, “Prompt Button” on page827, “Radar Chart” on page 828, “Repeater Table” on page 831, “Repeater TableCell” on page 831, “Repeater Table Cell” on page 832, “Scatter Chart” on page 833,“Static Repeater Table” on page 835, “Table” on page 837, “Table Cell” on page837, “Table of Contents” on page 837, “Table of Contents Entry” on page 838,“Table Row” on page 838, “Text Item” on page 839, “Variable Text Item” on page842, “Win-Loss Chart” on page 842
Bar, Line, or Area IndexSpecifies which combination object to use when calculating the position. Whenmultiple series exist, the index of 0 represents the topmost bar, line, or area in theSeries drop zone, the index of 1 represents the second one, and so on.
Applies to
“Baseline” on page 775, “Baseline” on page 775, “Marker” on page 816
Bar ShapeSpecifies the shape of the bars in a bar chart.
Applies to
“Bar” on page 774
Bar WidthSpecifies the width of the bars as a percentage of the space available. For example,if you specify 50 percent, the bar takes up half of the space available and the barsare separated from each other. If you specify 100 percent, there is no space betweenthe bars.The default value is 80.
Applies to
“Bar” on page 774, “Pareto Chart” on page 822, “Progressive Chart” on page 826
Based onSpecifies the series data item on which the trendline is based.
Applies to
“Trendline” on page 841
BaselinesAdds reference lines to a chart based on numeric or statistical values, calculations,or layout calculations. This property applies only to legacy charts.
Applies to
“3-D Combination Chart” on page 772, “3-D Scatter Chart” on page 772, “BubbleChart” on page 776, “Combination Chart” on page 785, “Marimekko Chart” onpage 815, “Metrics Range Chart” on page 818, “Pareto Chart” on page 823, “Polar
856 IBM Cognos Report Studio Version 10.2.1: User Guide

Chart” on page 825, “Progressive Chart” on page 827, “Radar Chart” on page 828,“Scatter Chart” on page 833
BevelSpecifies whether the chart appears with a beveled edge.
Applies to
“Bar” on page 774, “Bullet Chart” on page 777, “Pareto Chart” on page 822, “PieChart” on page 824, “Progressive Chart” on page 826
Block VariableSpecifies a variable based on which the block can be conditionally rendered.
Applies to
“Conditional Block” on page 787, “Conditional Block” on page 787
BorderSpecifies the width, style, and color for the border of the object.
Applies to
“3-D Combination Chart” on page 772, “3-D Scatter Chart” on page 772, “Block”on page 776, “Bubble Chart” on page 776, “Bubble Chart” on page 777, “BulletChart” on page 777, “Caption” on page 779, “Combination Chart” on page 785,“Combination Chart” on page 786, “Conditional Block” on page 787, “ConditionalBlock” on page 787, “Context Item Text” on page 787, “Crosstab” on page 788,“Crosstab Columns” on page 788, “Crosstab Columns” on page 788, “CrosstabCorner” on page 789, “Crosstab Fact Cells” on page 789, “Crosstab Intersection” onpage 789, “Crosstab Member Fact Cells” on page 790, “Crosstab Node Member” onpage 790, “Crosstab Rows” on page 790, “Crosstab Rows” on page 791, “CrosstabSpace” on page 791, “Crosstab Summary” on page 791, “Field Set” on page 800,“Gauge Chart” on page 800, “Gauge Chart” on page 801, “Hyperlink” on page 802,“Hyperlink Button” on page 803, “Image” on page 803, “List” on page 808, “ListCell” on page 809, “List Column” on page 809, “List Column Body” on page 810,“List Columns” on page 810, “List Columns” on page 810, “List Columns BodyStyle” on page 811, “List Columns Title Style” on page 811, “List Column Title” onpage 811, “List Footer” on page 811, “List Header” on page 812, “List Row” onpage 813, “List Row Cells Style” on page 813, “List Summary” on page 814, “Map”on page 814, “Marimekko Chart” on page 815, “Metrics Range Chart” on page 818,“Page” on page 821, “Page Break Text” on page 821, “Pareto Chart” on page 822,“Pareto Chart” on page 823, “Pie Chart” on page 823, “Pie Chart” on page 824,“Polar Chart” on page 825, “Progressive Chart” on page 826, “Progressive Chart”on page 827, “Prompt Button” on page 827, “Radar Chart” on page 828, “RepeaterTable” on page 831, “Repeater Table Cell” on page 831, “Repeater Table Cell” onpage 832, “Scatter Chart” on page 833, “Scatter Chart” on page 833, “StaticRepeater Table” on page 835, “Table” on page 837, “Table Cell” on page 837, “Tableof Contents” on page 837, “Table of Contents Entry” on page 838, “Text BoxPrompt” on page 838, “Text Item” on page 839, “Variable Text Item” on page 842,“Win-Loss Chart” on page 842
Appendix G. Report Studio Object and Property Reference 857

Border ColorSpecifies the color of the border rendered around specific chart elements, such asbars, stacks, areas, points, or pie slices.
Applies to
“3-D Area” on page 771, “3-D Bar” on page 771, “3-D Line” on page 772, “3-DScatter Chart” on page 772, “Area” on page 773, “Area” on page 773, “Bar” onpage 774, “Bar” on page 774, “Bubble Chart” on page 776, “Display Layer” onpage 798, “Gauge Chart” on page 801, “Legend” on page 806, “Line” on page 808,“Marimekko Chart” on page 815, “Pareto Chart” on page 822, “Pareto Chart” onpage 823, “Pie Chart” on page 823, “Point Layer” on page 825, “Polar Chart” onpage 825, “Progressive Chart” on page 826, “Progressive Chart” on page 827,“Radar Chart” on page 828, “Region Layer” on page 830, “Scatter Chart” on page833, “Win-Loss Chart” on page 842
Border ColorSpecifies the color of the borders around the chart body in a pie chart.
Applies to
“Pie Chart” on page 824
BordersSpecifies whether borders are rendered around specific chart elements, such asbars, stacks, areas, points, or pie slices.
Applies to
“3-D Area” on page 771, “3-D Bar” on page 771, “3-D Line” on page 772, “3-DScatter Chart” on page 772, “Area” on page 773, “Bar” on page 774, “BubbleChart” on page 776, “Display Layer” on page 798, “Gauge Chart” on page 801,“Legend” on page 806, “Line” on page 808, “Marimekko Chart” on page 815,“Pareto Chart” on page 823, “Pie Chart” on page 823, “Point Layer” on page 825,“Polar Chart” on page 825, “Progressive Chart” on page 827, “Radar Chart” onpage 828, “Region Layer” on page 830, “Scatter Chart” on page 833, “Win-LossChart” on page 842
BordersSpecifies whether borders appear around the chart body.
Applies to
“Area” on page 773, “Bar” on page 774, “Pareto Chart” on page 822, “ProgressiveChart” on page 826
BordersSpecifies whether borders appear around the chart body in a pie chart.
Applies to
“Pie Chart” on page 824
858 IBM Cognos Report Studio Version 10.2.1: User Guide

Bottom PositionSpecifies the position of the bottom edge of the colored region.
Applies to
“Colored Region” on page 785
Bottom Position (px)Specifies the pixel position of the bottom edge of the note measured from thebottom of the chart.
Applies to
“Note” on page 819
Bottom Position (px)Specifies the pixel position of the bottom edge of the legend measured from thebottom of the chart.
Applies to
“Legend” on page 806
Box TypeEach report object has a container, or box, which can be set to display the contents(the default) or not. This property specifies whether to override the default boxtype for the object.
When set to None, the object is not rendered and its space is not reserved in thereport. You could use this property to remove an object completely from a reportwhen a specific condition is met. When set to Inline, you can insert other objectson the same line as the object. When set to Block, you can insert other objects onlyon the lines above and below the object.
Applies to
“3-D Combination Chart” on page 772, “3-D Scatter Chart” on page 772, “Block”on page 776, “Bubble Chart” on page 776, “Bubble Chart” on page 777, “BulletChart” on page 777, “Combination Chart” on page 785, “Combination Chart” onpage 786, “Conditional Block” on page 787, “Conditional Block” on page 787,“Context Item Text” on page 787, “Crosstab” on page 788, “Field Set” on page 800,“Gauge Chart” on page 800, “Gauge Chart” on page 801, “Hyperlink” on page 802,“Image” on page 803, “List” on page 808, “List Summary” on page 814, “Map” onpage 814, “Marimekko Chart” on page 815, “Metrics Range Chart” on page 818,“Page Break Text” on page 821, “Pareto Chart” on page 822, “Pareto Chart” onpage 823, “Pie Chart” on page 823, “Pie Chart” on page 824, “Polar Chart” on page825, “Progressive Chart” on page 826, “Progressive Chart” on page 827, “RadarChart” on page 828, “Repeater Table” on page 831, “Scatter Chart” on page 833,“Scatter Chart” on page 833, “Static Repeater Table” on page 835, “Table” on page837, “Table of Contents” on page 837, “Table of Contents Entry” on page 838, “TextItem” on page 839, “Variable Text Item” on page 842, “Win-Loss Chart” on page842
Appendix G. Report Studio Object and Property Reference 859

Box TypeEach report object has a container, or box, which can be set to display the contents(the default) or not. This property specifies whether to override the default boxtype for the object. When set to None, the object is not rendered and its space isnot reserved in the report.
Applies to
“Axis Title” on page 774, “Axis Title” on page 774, “Baseline” on page 775,“Baseline” on page 775, “Baseline” on page 775, “Chart Footer” on page 781,“Chart Footer” on page 781, “Chart Subtitle” on page 782, “Chart Subtitle” on page782, “Chart Title” on page 783, “Chart Title” on page 783, “Crosstab Columns” onpage 788, “Crosstab Columns” on page 788, “Crosstab Corner” on page 789,“Crosstab Fact Cells” on page 789, “Crosstab Intersection” on page 789, “CrosstabMember Fact Cells” on page 790, “Crosstab Node Member” on page 790, “CrosstabRows” on page 790, “Crosstab Rows” on page 791, “Crosstab Space” on page 791,“Crosstab Summary” on page 791, “Date & Time Prompt” on page 796, “DatePrompt” on page 797, “Interval Prompt” on page 804, “Legend” on page 806,“Legend Title” on page 807, “Legend Title” on page 807, “List Cell” on page 809,“List Column” on page 809, “List Column Body” on page 810, “List Columns” onpage 810, “List Columns” on page 810, “List Columns Body Style” on page 811,“List Columns Title Style” on page 811, “List Column Title” on page 811, “ListFooter” on page 811, “List Header” on page 812, “List Row” on page 813, “ListRow Cells Style” on page 813, “Marker” on page 816, “Marker” on page 816,“Note Content” on page 819, “Regression Line” on page 831, “Repeater Table Cell”on page 831, “Repeater Table Cell” on page 832, “Select & Search Prompt” on page834, “Table Cell” on page 837, “Table Row” on page 838, “Text Box Prompt” onpage 838, “Time Prompt” on page 839, “Value Prompt” on page 841
Bubble SizeSpecifies how the bubble size is computed. Minimum-Based assigns the smallestbubble to the minimum data value. Zero-Based computes the bubble size relativeto 0. This option is compatible with Excel 2002. Zero-Based with Negatives showsnegative bubbles as hollow, and the bubbles get larger as they get further from 0.This option is compatible with Excel 2007.
Applies to
“Bubble Chart” on page 776
Bubble SizeSpecifies how bubble sizes are calculated on a bubble chart.
Applies to
“Bubble Chart” on page 777
Bullet IndicatorsSpecifies the size and shape of the bullet chart data marker that represents theactual value.
Applies to
“Bullet Chart” on page 777
860 IBM Cognos Report Studio Version 10.2.1: User Guide

Button DefinitionDefines the button in the control.
Applies to
“Button” on page 778
Button GapSpecifies the gap between buttons in the button bar.
Applies to
“Button Bar” on page 778, “Data Button Bar” on page 793, “Data Toggle ButtonBar” on page 796, “Toggle Button Bar” on page 840
Buttons DefinitionDefines the buttons in the button bar.
Applies to
“Button Bar” on page 778, “Toggle Button Bar” on page 840
Button WidthSpecifies the width of buttons in the button bar.
Applies to
“Button Bar” on page 778, “Data Button Bar” on page 793, “Data Toggle ButtonBar” on page 796, “Toggle Button Bar” on page 840
Button WidthSpecifies the width of the button.
Applies to
“Iterator First” on page 805, “Iterator Last” on page 805, “Iterator Next” on page805, “Iterator Previous” on page 805
Calculation IntersectionSpecifies whether to suppress calculated values that occur at the intersection of adata source calculated member and a query-defined calculated member. Whenvalues are suppressed, the characters specified for the Not Applicable charactersdata format appear in the cells.
Applies to
“Calculated Measure” on page 779, “Calculated Member” on page 779, “DataItem” on page 795, “Dimensional Edge Summary” on page 798, “Edge Summary”on page 799
Appendix G. Report Studio Object and Property Reference 861

Calendar TypeSpecifies the type of calendar to show. The date values are mapped to the selectedcalendar before being formatted. The default value is inherited from the user'scontent language.
Applies to
“Date & Time Prompt” on page 796, “Date Prompt” on page 797
CaptionSpecifies the caption for the level.
Applies to
“Level” on page 807
CaptionSpecifies the caption.
Applies to
“Calculated Member” on page 779
CardinalitySpecifies the cardinality for this join operand.
Applies to
“Query Reference” on page 828
Cascade SourceSpecifies the parameter whose value is used to filter the values displayed in thiscontrol.
Applies to
“Select & Search Prompt” on page 834, “Tree Prompt” on page 840, “ValuePrompt” on page 841
Case InsensitiveSpecifies whether to perform a case insensitive search by default.
Applies to
“Select & Search Prompt” on page 834
CatalogSpecifies the OLAP catalog.
Applies to
“MDX” on page 817
862 IBM Cognos Report Studio Version 10.2.1: User Guide

Category AxisSpecifies whether the axis is rendered.
Applies to
“Combination Chart” on page 785, “Marimekko Chart” on page 815, “MetricsRange Chart” on page 818, “Pareto Chart” on page 823, “Progressive Chart” onpage 827, “Radar Chart” on page 828
Category BaselinesAdds reference lines on the category axis of a chart based on numeric or statisticalvalues, calculations, or layout calculations.
Applies to
“Category Baseline” on page 781, “Combination Chart” on page 786, “ParetoChart” on page 822, “Progressive Chart” on page 826
Category RangeSpecifies whether to show all categorical data in the visualization or categoricaldata that is filtered when users select values in an Active Report control. Forexample, when all data is selected, all legend items are always shown in thevisualization, and the color of each legend item stays the same in the visualization.When a category is inserted on an axis, space is reserved on the axis for all data.When filtered data is selected, only the filtered data is shown in the legend and onaxes. The color of each legend item can change when users select different valuesin the control.
Applies to
“Category” on page 780
Chart OrientationSpecifies whether the chart is rendered vertically or horizontally.
Applies to
“Bullet Chart” on page 777, “Combination Chart” on page 785, “CombinationChart” on page 786, “Pareto Chart” on page 822, “Pareto Chart” on page 823,“Progressive Chart” on page 826, “Progressive Chart” on page 827, “Win-LossChart” on page 842
Chart TypeSpecifies whether the data may be rendered as either a bar, line, or area. Thisproperty applies only to legacy charts.
Applies to
“Area” on page 773, “Bar” on page 774, “Line” on page 808
Chart TypeSpecifies whether the data may be rendered as either a bar, line, or area.
Appendix G. Report Studio Object and Property Reference 863

Applies to
“Area” on page 773, “Bar” on page 774, “Line” on page 808
Chart TypeSpecifies whether the data may be rendered as either a bar, line or area.
Applies to
“3-D Area” on page 771, “3-D Bar” on page 771, “3-D Line” on page 772
Check Boxes DefinitionDefines the check boxes in the check box group.
Applies to
“Check Box Group” on page 784
Choices Deselect All TextSpecifies the text for the link below the choices box that deselects all the items inthe box. This property applies to all prompts with either multiple selections andranges or multiple selections and search. The default link text is Deselect All.
Applies to
“Date & Time Prompt” on page 796, “Date Prompt” on page 797, “IntervalPrompt” on page 804, “Select & Search Prompt” on page 834, “Text Box Prompt”on page 838, “Time Prompt” on page 839, “Value Prompt” on page 841
Choices Select All TextSpecifies the text for the link below the choices box that selects all the items in thebox. This property applies to all prompts with either multiple selections andranges or multiple selections and search. The default link text is Select All.
Applies to
“Date & Time Prompt” on page 796, “Date Prompt” on page 797, “IntervalPrompt” on page 804, “Select & Search Prompt” on page 834, “Text Box Prompt”on page 838, “Time Prompt” on page 839, “Value Prompt” on page 841
Choices TextSpecifies the title that appears above the choices box when multiple selections areenabled. This property applies to the following prompt types: value, text box, date,date & time, time, interval, and select & search. The default title text is Choices.
Applies to
“Date & Time Prompt” on page 796, “Date Prompt” on page 797, “IntervalPrompt” on page 804, “Select & Search Prompt” on page 834, “Text Box Prompt”on page 838, “Time Prompt” on page 839, “Value Prompt” on page 841
864 IBM Cognos Report Studio Version 10.2.1: User Guide

ClassesSpecifies a class to apply to the object. The class provides a default style. If youapply more than one class, the style properties from all classes are merged togetherwhen they are applied. However, if the classes have style properties in common,the style properties from the last class applied override those from previousclasses.
Applies to
“3-D Combination Chart” on page 772, “3-D Scatter Chart” on page 772, “AngularAxis” on page 773, “Axis Labels” on page 774, “Axis Title” on page 774, “AxisTitle” on page 774, “Block” on page 776, “Bubble Chart” on page 776, “BubbleChart” on page 777, “Bullet Chart” on page 777, “Caption” on page 779, “CategoryAxis” on page 780, “Chart Footer” on page 781, “Chart Footer” on page 781,“Chart Subtitle” on page 782, “Chart Subtitle” on page 782, “Chart Title” on page783, “Chart Title” on page 783, “Combination Chart” on page 785, “CombinationChart” on page 786, “Conditional Block” on page 787, “Conditional Block” on page787, “Context Item Text” on page 787, “Crosstab” on page 788, “Crosstab Corner”on page 789, “Crosstab Fact Cells” on page 789, “Crosstab Intersection” on page789, “Crosstab Member Fact Cells” on page 790, “Crosstab Node Member” on page790, “Crosstab Space” on page 791, “Crosstab Summary” on page 791,“Cumulation Line Axis” on page 792, “Date” on page 796, “Field Set” on page 800,“Gauge Chart” on page 800, “Gauge Chart” on page 801, “Gauge Labels” on page801, “Hyperlink” on page 802, “Hyperlink Button” on page 803, “Image” on page803, “Legend” on page 806, “Legend” on page 807, “Legend Title” on page 807,“Legend Title” on page 807, “List” on page 808, “List Cell” on page 809, “ListColumn Body” on page 810, “List Column Title” on page 811, “List Summary” onpage 814, “Map” on page 814, “Marimekko Chart” on page 815, “Metrics RangeChart” on page 818, “Note Content” on page 819, “Numerical Axis” on page 820,“Numerical Axis” on page 820, “Page” on page 821, “Page Body” on page 821,“Page Break Text” on page 821, “Page Footer” on page 821, “Page Header” onpage 821, “Page Number” on page 821, “Pareto Chart” on page 822, “ParetoChart” on page 823, “Pie Chart” on page 823, “Pie Chart” on page 824, “PieLabels” on page 824, “Polar Chart” on page 825, “Progressive Chart” on page 826,“Progressive Chart” on page 827, “Prompt Button” on page 827, “Radar Chart” onpage 828, “Radial Axis” on page 829, “Repeater Table” on page 831, “RepeaterTable Cell” on page 831, “Repeater Table Cell” on page 832, “Row Number” onpage 832, “Row Number” on page 832, “Scatter Chart” on page 833, “ScatterChart” on page 833, “Static Repeater Table” on page 835, “Table” on page 837,“Table Cell” on page 837, “Table of Contents” on page 837, “Table of ContentsEntry” on page 838, “Table Row” on page 838, “Text Item” on page 839, “Time” onpage 839, “Variable Text Item” on page 842, “Win-Loss Chart” on page 842, “XAxis” on page 843, “X Axis” on page 843, “Y1 Axis” on page 844, “Y2 Axis” onpage 844, “Y Axis” on page 844, “Y Axis” on page 845, “Z Axis” on page 845, “ZAxis” on page 845
Clickable RegionSpecifies whether to make the object clickable when the active report is executed.You can set the value of this property for multiple objects simultaneously by firstcontrol+clicking the items in the report.
Applies to
“Crosstab Fact Cells” on page 789, “List Column” on page 809, “List ColumnBody” on page 810, “List Column Title” on page 811, “List Row” on page 813
Appendix G. Report Studio Object and Property Reference 865

Clickable RegionSpecifies whether to make the object clickable. When (Default) is selected, thevalue is inherited from the Clickable Regions property of the parent object.
Applies to
“Crosstab Intersection” on page 789, “Crosstab Member Fact Cells” on page 790,“Crosstab Node Member” on page 790, “Crosstab Space” on page 791, “CrosstabSummary” on page 791
Clickable RegionsSpecifies which areas of the data container are clickable. For some data containers,if you select to make parts clickable, you can further refine which areas areclickable with the Clickable Region property.
Applies to
“3-D Combination Chart” on page 772, “3-D Scatter Chart” on page 772, “BubbleChart” on page 776, “Bubble Chart” on page 777, “Bullet Chart” on page 777,“Combination Chart” on page 785, “Combination Chart” on page 786, “Crosstab”on page 788, “Gauge Chart” on page 800, “Gauge Chart” on page 801, “List” onpage 808, “Map” on page 814, “Marimekko Chart” on page 815, “Metrics RangeChart” on page 818, “Pareto Chart” on page 822, “Pareto Chart” on page 823, “PieChart” on page 823, “Pie Chart” on page 824, “Polar Chart” on page 825,“Progressive Chart” on page 826, “Progressive Chart” on page 827, “Radar Chart”on page 828, “Repeater Table” on page 831, “Scatter Chart” on page 833, “ScatterChart” on page 833, “Static Repeater Table” on page 835
Clickable RegionsSpecifies which areas of the visualization are clickable. Visualization as a Wholemakes the entire visualization the clickable region. Visualization Intersectionsmakes each element in the visualization clickable.
Applies to
“Visualization” on page 842
Clock ModeSpecifies whether the arms of the clock move.
Applies to
“Date & Time Prompt” on page 796, “Time Prompt” on page 839
Color by ValueSpecifies how color by value is rendered in a chart.
Applies to
“Bubble Chart” on page 777, “Color by Value Measure” on page 785, “ScatterChart” on page 833
866 IBM Cognos Report Studio Version 10.2.1: User Guide

Colored RegionsSpecifies rectangular colored regions drawn in the chart body to highlight parts ofthe chart. The regions are rendered behind the data markers. The regions aredrawn in the same order that they appear in this property. The first region isdrawn first, on the bottom, and the last region is drawn on top of the otherregions.
Applies to
“Bubble Chart” on page 777, “Bullet Chart” on page 777, “Combination Chart” onpage 786, “Pareto Chart” on page 822, “Progressive Chart” on page 826, “ScatterChart” on page 833
Color Legend TitleSpecifies a title within the legend above the palette for the region color. If thisobject is not defined, no additional title is drawn. If no legend is drawn, this objectis ignored. Styling for this object is inherited from the legend title.
Applies to
“Region Layer” on page 830
Color Legend TitleSpecifies a title within the legend above the palette for the point color. If this objectis not defined, no additional title is drawn. If no legend is drawn, this object isignored. Styling for this object is inherited from the legend title.
Applies to
“Point Layer” on page 825
Column CoordinateUniquely identifies the column of a node member or spacer on an edge of thecrosstab. You cannot modify this value.
Applies to
“Crosstab Intersection” on page 789
Column TitlesSpecifies where or whether column titles may be rendered.
Applies to
“List” on page 808
Column VisibilitySpecifies whether a column is visible when the active report is executed. You canset column visibility based on a condition.
Appendix G. Report Studio Object and Property Reference 867

Applies to
“List Column” on page 809, “List Column Body” on page 810, “List Column Title”on page 811
CombinationsSpecifies which axes to show and the chart types to use for the series.
Applies to
“Combination Chart” on page 786
Component ReferenceSpecifies the layout object that is referenced. An object is a reusable componentonly if it has a name.
Applies to
“Layout Component Reference” on page 806
Component ReferenceSpecifies the layout object that is referenced. An object is a reusable componentonly if it has a name. You cannot modify this value.
Applies to
“Component Override” on page 786
Conditional PaletteSpecifies a conditional palette for the chart.
Applies to
“Area” on page 773, “Bar” on page 774, “Bubble Chart” on page 777, “GaugeAxis” on page 800, “Line” on page 808, “Pareto Chart” on page 822, “Pie Chart”on page 824, “Progressive Chart” on page 826, “Scatter Chart” on page 833
Conditional PaletteSpecifies a conditional palette for the chart. This property applies only to legacycharts.
Applies to
“3-D Combination Chart” on page 772, “3-D Scatter Chart” on page 772, “BubbleChart” on page 776, “Combination Chart” on page 785, “Gauge Chart” on page801, “Marimekko Chart” on page 815, “Metrics Range Chart” on page 818, “ParetoChart” on page 823, “Pie Chart” on page 823, “Point Layer” on page 825, “PolarChart” on page 825, “Progressive Chart” on page 827, “Radar Chart” on page 828,“Region Layer” on page 830, “Scatter Chart” on page 833
Conditional StylesSpecifies the conditions and styles used to style the object.
868 IBM Cognos Report Studio Version 10.2.1: User Guide

Applies to
“Angular Measure” on page 773, “Axis Labels” on page 774, “Axis Title” on page774, “Axis Title” on page 774, “Block” on page 776, “Bubble Measure” on page 777,“Bubble Measure” on page 777, “Caption” on page 779, “Chart Body” on page 781,“Chart Footer” on page 781, “Chart Footer” on page 781, “Chart Measure” on page782, “Chart Subtitle” on page 782, “Chart Subtitle” on page 782, “Chart Text Item”on page 782, “Chart Text Item” on page 783, “Chart Title” on page 783, “ChartTitle” on page 783, “Color by Value Measure” on page 785, “Conditional Block” onpage 787, “Conditional Block” on page 787, “Context Item Text” on page 787,“Crosstab” on page 788, “Crosstab Columns” on page 788, “Crosstab Columns” onpage 788, “Crosstab Corner” on page 789, “Crosstab Fact Cells” on page 789,“Crosstab Intersection” on page 789, “Crosstab Member Fact Cells” on page 790,“Crosstab Node Member” on page 790, “Crosstab Rows” on page 790, “CrosstabRows” on page 791, “Crosstab Space” on page 791, “Crosstab Summary” on page791, “Cumulation Label” on page 792, “Cumulation Line Axis” on page 792, “Date& Time Prompt” on page 796, “Date Prompt” on page 797, “Default Measure” onpage 797, “Default Measure” on page 797, “Display Layer” on page 798, “EquationLabel” on page 799, “Equation Label” on page 799, “Field Set” on page 800,“Gauge Labels” on page 801, “Gauge Numerical Axis” on page 801, “Hyperlink”on page 802, “Hyperlink Button” on page 803, “Image” on page 803, “IntervalPrompt” on page 804, “Label” on page 806, “Legend” on page 806, “Legend” onpage 807, “Legend Title” on page 807, “Legend Title” on page 807, “List” on page808, “List Cell” on page 809, “List Column” on page 809, “List Column Body” onpage 810, “List Columns” on page 810, “List Columns” on page 810, “ListColumns Body Style” on page 811, “List Columns Title Style” on page 811, “ListColumn Title” on page 811, “List Footer” on page 811, “List Header” on page 812,“List Row” on page 813, “List Row Cells Style” on page 813, “List Summary” onpage 814, “Note” on page 819, “Note Content” on page 819, “Page” on page 821,“Page Break Text” on page 821, “Pie Labels” on page 824, “Point Layer” on page825, “Point Measure” on page 825, “Point Size Measure” on page 825, “PromptButton” on page 827, “Radial Measure” on page 829, “Region Layer” on page 830,“Region Measure” on page 830, “Repeater Table” on page 831, “Repeater TableCell” on page 831, “Repeater Table Cell” on page 832, “Select & Search Prompt” onpage 834, “Static Repeater Table” on page 835, “Table” on page 837, “Table Cell”on page 837, “Table of Contents” on page 837, “Table of Contents Entry” on page838, “Table Row” on page 838, “Target Measure” on page 838, “Text Box Prompt”on page 838, “Text Item” on page 839, “Time Prompt” on page 839, “ToleranceMeasure” on page 840, “Tree Prompt” on page 840, “Trendline Label” on page 841,“Value Prompt” on page 841, “Win-Loss Chart” on page 842, “X Axis Measure” onpage 844, “Y Axis Measure” on page 845, “Z Axis Measure” on page 845
Connecting LinesSpecifies the properties of the lines that connect the segments of a stacked bar. Thisproperty is ignored for clustered bars. This property applies only to legacy charts.
Applies to
“Bar” on page 774, “Pareto Chart” on page 823, “Progressive Chart” on page 827
Connecting LinesSpecifies the properties of the lines that connect the segments of a stacked bar in aprogressive chart. This property is ignored for clustered bars.
Appendix G. Report Studio Object and Property Reference 869

Applies to
“Progressive Chart” on page 826
Contained Text DirectionSpecifies the direction of text contained in compound objects. Compound objectsinclude charts, maps, and prompts. Contextual sets the text direction based on thefirst alphabetic character in the text. If the character belongs to a language thatsupports bidirectional script, the direction is right to left. Otherwise, the directionis left to right. Numbers and special characters do not influence the text direction.For example, if the text starts with a number followed by an Arabic character, thedirection will be right to left. If the text starts with a number followed by a Latincharacter, the direction will be left to right.
Applies to
“Bubble Chart” on page 777, “Bullet Chart” on page 777, “Button” on page 778,“Button Bar” on page 778, “Check Box Group” on page 784, “Combination Chart”on page 786, “Continuous Values Slider” on page 787, “Data Button Bar” on page793, “Data Check Box Group” on page 793, “Data Discrete Values Slider” on page794, “Data Drop-Down List” on page 794, “Data Iterator” on page 795, “Data ListBox” on page 795, “Data Radio Button Group” on page 795, “Data Tab Control” onpage 796, “Data Toggle Button Bar” on page 796, “Date & Time Prompt” on page796, “Date Prompt” on page 797, “Discrete Values Slider” on page 798,“Drop-Down List” on page 799, “Gauge Chart” on page 800, “Interval Prompt” onpage 804, “Iterator” on page 804, “List Box” on page 809, “Map” on page 814,“Pareto Chart” on page 822, “Pie Chart” on page 824, “Progressive Chart” on page826, “Radio Button Group” on page 829, “Scatter Chart” on page 833, “Select &Search Prompt” on page 834, “Tab Control” on page 836, “Text Box Prompt” onpage 838, “Time Prompt” on page 839, “Toggle Button Bar” on page 840, “TreePrompt” on page 840, “Value Prompt” on page 841
Container FilterFilters items in the control or container based on the value of a variable.
Applies to
“Check Box Group” on page 784, “Crosstab” on page 788, “Data Check BoxGroup” on page 793, “Data Container” on page 793, “Data Deck” on page 794,“Data Discrete Values Slider” on page 794, “Data Drop-Down List” on page 794,“Data Iterator” on page 795, “Data List Box” on page 795, “Data Radio ButtonGroup” on page 795, “Deck” on page 797, “Discrete Values Slider” on page 798,“Drop-Down List” on page 799, “Iterator” on page 804, “List” on page 808, “ListBox” on page 809, “Radio Button Group” on page 829, “Repeater Table” on page831, “Static Repeater Table” on page 835
Container SelectSelects an item in the control or container based on the value of a variable. Forexample, selects a row in a list, selects a named list item from a drop-down list, orselects a named tab from a tab control.
870 IBM Cognos Report Studio Version 10.2.1: User Guide

Applies to
“3-D Combination Chart” on page 772, “3-D Scatter Chart” on page 772, “BubbleChart” on page 776, “Bubble Chart” on page 777, “Bullet Chart” on page 777,“Button Bar” on page 778, “Check Box Group” on page 784, “Combination Chart”on page 785, “Combination Chart” on page 786, “Crosstab” on page 788, “DataButton Bar” on page 793, “Data Check Box Group” on page 793, “Data Container”on page 793, “Data Deck” on page 794, “Data Discrete Values Slider” on page 794,“Data Drop-Down List” on page 794, “Data Iterator” on page 795, “Data List Box”on page 795, “Data Radio Button Group” on page 795, “Data Tab Control” on page796, “Data Toggle Button Bar” on page 796, “Deck” on page 797, “Discrete ValuesSlider” on page 798, “Drop-Down List” on page 799, “Gauge Chart” on page 800,“Gauge Chart” on page 801, “Iterator” on page 804, “List” on page 808, “List Box”on page 809, “Map” on page 814, “Marimekko Chart” on page 815, “Metrics RangeChart” on page 818, “Pareto Chart” on page 822, “Pareto Chart” on page 823, “PieChart” on page 823, “Pie Chart” on page 824, “Polar Chart” on page 825,“Progressive Chart” on page 826, “Progressive Chart” on page 827, “Radar Chart”on page 828, “Radio Button Group” on page 829, “Repeater Table” on page 831,“Scatter Chart” on page 833, “Scatter Chart” on page 833, “Static Repeater Table”on page 835, “Tab Control” on page 836, “Toggle Button Bar” on page 840
Contents HeightSpecifies the relative height of list rows. This property is used only when a list hasa height defined in the Size and Overflow property.
Stretched means that the rows will be evenly sized to fit in the list's height. This isdefault HTML behavior.
Minimal means that rows will take up only as much space as they need, and becompressed at the top of the list. You can position a footer at the bottom of the listby setting the Push To Bottom property to Yes on a footer object inside the list.
Applies to
“List” on page 808
Control Data Item ValueSpecifies the data item used to populate the text item in the control.
Applies to
“Chart Text Item” on page 782, “Chart Text Item” on page 783, “Cumulation LineLabel” on page 792, “Hyperlink” on page 802, “Hyperlink Button” on page 803,“Text Item” on page 839
Control Data Item ValueSpecifies the data item used to populate the HTML item in the control.
Applies to
“HTML Item” on page 802, “Rich Text Item” on page 832
Control Data Item ValueSpecifies the data item used to populate the image in the control.
Appendix G. Report Studio Object and Property Reference 871

Applies to
“Hyperlink” on page 802, “Hyperlink Button” on page 803, “Image” on page 803
Control EnableEnables the control or container based on the value of a variable.
Applies to
“Button” on page 778, “Button Bar” on page 778, “Check Box Group” on page 784,“Continuous Values Slider” on page 787, “Data Button Bar” on page 793, “DataCheck Box Group” on page 793, “Data Discrete Values Slider” on page 794, “DataDrop-Down List” on page 794, “Data Iterator” on page 795, “Data List Box” onpage 795, “Data Radio Button Group” on page 795, “Data Toggle Button Bar” onpage 796, “Discrete Values Slider” on page 798, “Drop-Down List” on page 799,“Iterator” on page 804, “List Box” on page 809, “Radio Button Group” on page829, “Toggle Button Bar” on page 840
Cross Product AllowedSpecifies whether the query will be allowed to run if there is a cross join betweendatabase tables. This type of query generates a result set that includes all possibleunique combinations of values from the first and second table. The default value isDeny.
Applies to
“Query” on page 828
Cumulation AxisSpecifies whether the axis for the cumulation line is rendered.
Applies to
“Cumulation Line” on page 792
Cumulation LabelSpecifies whether a label for the cumulation line is rendered in the legend.
Applies to
“Cumulation Line” on page 792
Cumulation LabelSpecifies the label that is shown with the cumulation line on a Pareto chart.
Applies to
“Cumulation Line” on page 792
Cumulative LineSpecifies whether the cumulation line is rendered.
872 IBM Cognos Report Studio Version 10.2.1: User Guide

Applies to
“Pareto Chart” on page 823
Cumulative LineSpecifies whether the cumulation line is rendered in a Pareto chart.
Applies to
“Pareto Chart” on page 822
Current BlockSpecifies which block is currently being authored.
Applies to
“Conditional Block” on page 787, “Conditional Block” on page 787
Current CardSpecifies which card to show in the report.
Applies to
“Card” on page 780, “Deck” on page 797
Current TabSpecifies which tab to show in the report.
Applies to
“Tab Control” on page 836
Custom LabelOverrides the default label for the data item.
Applies to
“Angular Measure” on page 773, “Bubble Measure” on page 777, “Chart NodeMember” on page 782, “Default Measure” on page 797, “Point Measure” on page825, “Point Size Measure” on page 825, “Radial Measure” on page 829, “RegionMeasure” on page 830, “Target Measure” on page 838, “Tolerance Measure” onpage 840, “Win-Loss Measure” on page 843, “X Axis Measure” on page 844, “YAxis Measure” on page 845, “Z Axis Measure” on page 845
Custom LabelSpecifies the data source and format for a text item, such as a legend item, legendtitle, axis label, or axis title.
Applies to
“Bubble Measure” on page 777, “Bullet Measure” on page 778, “Chart Measure” onpage 782, “Color by Value Measure” on page 785, “Default Measure” on page 797,“Target Measure” on page 838
Appendix G. Report Studio Object and Property Reference 873

Data FormatSpecifies the data format of the object.
Applies to
“Angular Axis” on page 773, “Angular Measure” on page 773, “Axis Labels” onpage 774, “Bubble Measure” on page 777, “Bubble Measure” on page 777, “BulletMeasure” on page 778, “Chart Measure” on page 782, “Chart Node Member” onpage 782, “Chart Text Item” on page 782, “Chart Text Item” on page 783, “Color byValue Measure” on page 785, “Crosstab Columns” on page 788, “CrosstabColumns” on page 788, “Crosstab Corner” on page 789, “Crosstab Fact Cells” onpage 789, “Crosstab Intersection” on page 789, “Crosstab Member Fact Cells” onpage 790, “Crosstab Node Member” on page 790, “Crosstab Rows” on page 790,“Crosstab Rows” on page 791, “Crosstab Space” on page 791, “Crosstab Summary”on page 791, “Cumulation Label” on page 792, “Cumulation Line Axis” on page792, “Date” on page 796, “Default Measure” on page 797, “Default Measure” onpage 797, “Equation Label” on page 799, “Gauge Numerical Axis” on page 801,“Label” on page 806, “List Cell” on page 809, “List Column” on page 809, “ListColumn Body” on page 810, “List Columns” on page 810, “List Columns” on page810, “List Columns Body Style” on page 811, “List Columns Title Style” on page811, “List Column Title” on page 811, “List Footer” on page 811, “List Header” onpage 812, “List Row” on page 813, “List Row Cells Style” on page 813, “ListSummary” on page 814, “Node” on page 819, “Numerical Axis” on page 820,“Numerical Axis” on page 820, “Point Measure” on page 825, “Point SizeMeasure” on page 825, “Radial Axis” on page 829, “Radial Measure” on page 829,“Region Measure” on page 830, “Row Number” on page 832, “Row Number” onpage 832, “Select & Search Prompt” on page 834, “Target Measure” on page 838,“Target Measure” on page 838, “Text Item” on page 839, “Time” on page 839,“Tolerance Measure” on page 840, “Total Column” on page 840, “Trendline Label”on page 841, “Value” on page 841, “Value Prompt” on page 841, “Variable TextItem” on page 842, “Visualization” on page 842, “Win-Loss Measure” on page 843,“X Axis” on page 843, “X Axis Measure” on page 844, “Y1 Axis” on page 844, “Y2Axis” on page 844, “Y Axis” on page 844, “Y Axis Measure” on page 845, “Z Axis”on page 845, “Z Axis” on page 845, “Z Axis Measure” on page 845
Data FormatSpecifies the data format of the slider values.
Applies to
“Continuous Values Slider” on page 787, “Data Discrete Values Slider” on page794, “Discrete Values Slider” on page 798
Data ItemSpecifies a reference to a data item. You cannot modify this value.
Applies to
“Button Extra Item” on page 779, “Button Icon” on page 779, “Button Label” onpage 779, “Card Extra Item” on page 780, “Card Label” on page 780, “Check BoxExtra Item” on page 784, “Check Box Icon” on page 784, “Check Box Label” onpage 784, “Crosstab Node Member” on page 790, “Crosstab Summary” on page791, “Iterator Extra Item” on page 804, “Iterator Value Icon” on page 805, “IteratorValue Label” on page 805, “List Item Extra Item” on page 812, “List Item Icon” onpage 812
874 IBM Cognos Report Studio Version 10.2.1: User Guide

page 812, “List Item Label” on page 812, “List Summary” on page 814, “MemberSet” on page 818, “Radio Button Extra Item” on page 829, “Radio Button Icon” onpage 830, “Radio Button Label” on page 830, “Tab Extra Item” on page 836, “TabIcon” on page 837, “Tab Label” on page 837
Data ItemSpecifies a reference to a data item.
Applies to
“Calculated Member” on page 779, “Fact” on page 800, “Key” on page 806,“Member Property” on page 817
Data Item LabelSpecifies the data item label that defines the text to render.
Applies to
“Chart Text Item” on page 782, “Chart Text Item” on page 783, “Cumulation LineLabel” on page 792, “Hyperlink” on page 802, “Hyperlink Button” on page 803,“Text Item” on page 839
Data Item LabelSpecifies the data item label that defines the HTML to render.
Applies to
“HTML Item” on page 802, “Rich Text Item” on page 832
Data Item LabelSpecifies the data item label that defines the URL.
Applies to
“Hyperlink” on page 802, “Hyperlink Button” on page 803, “Image” on page 803
Data Item LabelSpecifies the data item label that defines the bookmark. The value used as thebookmark reference must match this value.
Applies to
“Bookmark” on page 776
Data Item ValueSpecifies the data item value that defines the text to render.
Applies to
“Chart Text Item” on page 782, “Chart Text Item” on page 783, “Cumulation LineLabel” on page 792, “Hyperlink” on page 802, “Hyperlink Button” on page 803,“Text Item” on page 839, “Total Column” on page 840
Appendix G. Report Studio Object and Property Reference 875

Data Item ValueSpecifies the data item value that defines the HTML to render.
Applies to
“HTML Item” on page 802, “Rich Text Item” on page 832
Data Item ValueSpecifies the data item value that defines the URL.
Applies to
“Hyperlink” on page 802, “Hyperlink Button” on page 803, “Image” on page 803
Data Item ValueSpecifies the data item value that defines the bookmark. The value used as thebookmark reference must match this value.
Applies to
“Bookmark” on page 776
Data Item ValueSpecifies the numeric position by using a data item value.
Applies to
“Baseline” on page 775, “Baseline” on page 775, “Baseline” on page 775, “Baseline”on page 775, “Marker” on page 816
Data Item ValueIf the marker or baseline is based on a query calculation, allows you to switch to adifferent data item.
Applies to
“Marker” on page 816, “Numeric Baseline” on page 820
Data Item ValueSpecifies the numeric position of a data item.
Applies to
“Marker” on page 816
Data Item ValueSpecifies the numeric position of a data item.
Applies to
“Marker” on page 816
876 IBM Cognos Report Studio Version 10.2.1: User Guide

Data LanguageSpecifies the language of the data.
Applies to
“Map” on page 814
Data PointsSpecifies whether to show data points on the chart and how they are formatted.
Applies to
“Cumulation Line” on page 792
Data SourceSpecifies the query data source.
Applies to
“MDX” on page 817, “SQL” on page 835
Days TextSpecifies the title that appears above the days box in interval prompts. The defaulttitle text is Days.
Applies to
“Interval Prompt” on page 804
Deck Cards DefinitionThe cards in the deck. Each card must have a corresponding row in the static datatable.
Applies to
“Deck” on page 797
Default CardCard to display when no other card matches the current variable state.
Applies to
“Data Deck” on page 794
Default CardCard to display when no other card matches the current variable state.
Applies to
“Deck” on page 797
Appendix G. Report Studio Object and Property Reference 877

Default MeasureSpecifies the default measure to use for a crosstab or chart. If the measures of thecrosstab or chart cannot be determined by what is being rendered on the edges,then the default measure will be rendered.
Applies to
“Crosstab” on page 788
Default SelectionsSpecifies the collection of default selections for a prompt control.
Applies to
“Date & Time Prompt” on page 796, “Date Prompt” on page 797, “IntervalPrompt” on page 804, “Text Box Prompt” on page 838, “Time Prompt” on page839, “Tree Prompt” on page 840, “Value Prompt” on page 841
Default TitleSpecifies whether the default title is generated.
Applies to
“Axis Title” on page 774, “Legend Title” on page 807
Default TitleSpecifies whether the default title may be generated.
Applies to
“Axis Title” on page 774, “Legend Title” on page 807
Define ContentsOverrides the content of the selected crosstab intersection. Use this property tohide measure values for individual cells or to define custom content.
Applies to
“Crosstab Intersection” on page 789, “Crosstab Member Fact Cells” on page 790
Define Custom GroupingSpecifies the details of the data items in custom groups. Custom groups creategroups of data items that are meaningful to you.
Applies to
“Custom Groups” on page 793
Define Member SetsSpecifies the set structure of a query. If it is not defined, it is assumed that eachdata item defines an unrelated set.
878 IBM Cognos Report Studio Version 10.2.1: User Guide

Applies to
“Query” on page 828
DefinitionSpecifies the expression to evaluate when filtering the data.
Applies to
“Detail Filter” on page 798, “Summary Filter” on page 836
DepthSpecifies the three-dimensional depth effect of the chart. A value of zero indicates aflat chart.
Applies to
“Combination Chart” on page 785, “Combination Chart” on page 786, “MarimekkoChart” on page 815, “Metrics Range Chart” on page 818, “Pareto Chart” on page822, “Pareto Chart” on page 823, “Pie Chart” on page 823, “Pie Chart” on page824, “Progressive Chart” on page 826, “Progressive Chart” on page 827
DescriptionSpecifies a description for the object, that is used to assist authoring.
Applies to
“Class” on page 784, “HTML Item” on page 802, “Metric Studio Diagram” on page818, “Rich Text Item” on page 832
Deselect TextSpecifies the text for the link that deselects the items when the selection is optional.This property applies to the following prompt types: text box, date, date & time,time, interval, value, select & search, and tree. The default link text is Deselect.
Applies to
“Date & Time Prompt” on page 796, “Date Prompt” on page 797, “IntervalPrompt” on page 804, “Select & Search Prompt” on page 834, “Text Box Prompt”on page 838, “Time Prompt” on page 839, “Tree Prompt” on page 840, “ValuePrompt” on page 841
DetailSpecifies whether the data item is to be used for calculating aggregates or not.When set to Yes, the data item is used to aggregate the lowest level details.
Applies to
“Calculated Member” on page 779, “Data Item” on page 795, “Explicit MemberSet” on page 799, “Hierarchy Set” on page 802, “Level Set” on page 808,“Member” on page 817, “Member Children Set” on page 817, “Named Set” onpage 819, “Set Expression” on page 835
Appendix G. Report Studio Object and Property Reference 879

Diagram IdentifierIdentifies an impact or custom diagram in IBM® Cognos® Metric Studio. Copy theidentifier from Metric Studio (Diagrams tab, View the Diagram Identifier button inthe Actions column) and paste it in this property. IBM® Cognos® Report Studiodecodes the identifier into an image URL. The diagram is imported as a staticimage.
Applies to
“Metric Studio Diagram” on page 818
Dial Face FillSpecifies the fill color and effects for the dial face of a gauge chart.
Applies to
“Gauge Chart” on page 800
Dial Outline ColorSpecifies the dial outline color in a gauge chart.
Applies to
“Gauge Chart” on page 801
DictionarySpecifies the aliases to use when matching data values to feature names in themap.
Applies to
“Map” on page 814
DimensionSpecifies a reference to a dimension. You cannot modify this value.
Applies to
“Calculated Measure” on page 779, “Calculated Member” on page 779,“Dimensional Edge Summary” on page 798, “Explicit Member Set” on page 799,“Hierarchy Set” on page 802, “Intersection (Tuple)” on page 804, “Level Set” onpage 808, “Measure” on page 817, “Member” on page 817, “Member Children Set”on page 817, “Member Property” on page 818, “Named Set” on page 819,“Percentaged Measure” on page 823, “Set Expression” on page 835
Direction & JustificationSpecifies text flow properties, such as direction, writing mode, and justification.
Applies to
“Block” on page 776, “Bubble Chart” on page 777, “Bullet Chart” on page 777,“Button” on page 778, “Button Bar” on page 778, “Check Box Group” on page 784,“Combination Chart” on page 786, “Conditional Block” on page 787, “Conditional
880 IBM Cognos Report Studio Version 10.2.1: User Guide

Block” on page 787, “Context Item Text” on page 787, “Continuous Values Slider”on page 787, “Crosstab” on page 788, “Crosstab Columns” on page 788, “CrosstabColumns” on page 788, “Crosstab Corner” on page 789, “Crosstab Fact Cells” onpage 789, “Crosstab Intersection” on page 789, “Crosstab Member Fact Cells” onpage 790, “Crosstab Node Member” on page 790, “Crosstab Rows” on page 790,“Crosstab Rows” on page 791, “Crosstab Space” on page 791, “Crosstab Summary”on page 791, “Data Button Bar” on page 793, “Data Check Box Group” on page793, “Data Deck” on page 794, “Data Discrete Values Slider” on page 794, “DataDrop-Down List” on page 794, “Data Iterator” on page 795, “Data List Box” onpage 795, “Data Radio Button Group” on page 795, “Data Tab Control” on page796, “Data Toggle Button Bar” on page 796, “Date & Time Prompt” on page 796,“Date Prompt” on page 797, “Deck” on page 797, “Discrete Values Slider” on page798, “Drop-Down List” on page 799, “Gauge Chart” on page 800, “Hyperlink” onpage 802, “Interval Prompt” on page 804, “Iterator” on page 804, “List” on page808, “List Box” on page 809, “List Cell” on page 809, “List Column” on page 809,“List Column Body” on page 810, “List Columns” on page 810, “List Columns” onpage 810, “List Columns Body Style” on page 811, “List Columns Title Style” onpage 811, “List Column Title” on page 811, “List Footer” on page 811, “ListHeader” on page 812, “List Row” on page 813, “List Row Cells Style” on page 813,“List Summary” on page 814, “Map” on page 814, “Page” on page 821, “PageBreak Text” on page 821, “Pareto Chart” on page 822, “Pie Chart” on page 824,“Progressive Chart” on page 826, “Radio Button Group” on page 829, “RepeaterTable” on page 831, “Repeater Table Cell” on page 831, “Repeater Table Cell” onpage 832, “Row Number” on page 832, “Scatter Chart” on page 833, “Select &Search Prompt” on page 834, “Static Repeater Table” on page 835, “Tab Control”on page 836, “Table” on page 837, “Table Cell” on page 837, “Table of Contents”on page 837, “Table of Contents Entry” on page 838, “Text Box Prompt” on page838, “Text Item” on page 839, “Time Prompt” on page 839, “Toggle Button Bar” onpage 840, “Tree Prompt” on page 840, “Value Prompt” on page 841, “Variable TextItem” on page 842
Display After Overall HeaderSpecifies whether the list page header is to be rendered after the overall header.
Applies to
“List Page Header” on page 813
Display for OrientationSpecifies the orientation of the mobile device required to display the object whenthe active report is viewed. For example, if Landscape is selected, the object isdisplayed only when the mobile device is held in a landscape orientation. Theobject is not displayed when the mobile device is rotated into a portraitorientation.
Applies to
“3-D Combination Chart” on page 772, “3-D Scatter Chart” on page 772, “Block”on page 776, “Bubble Chart” on page 776, “Bubble Chart” on page 777, “BulletChart” on page 777, “Button” on page 778, “Button Bar” on page 778, “Check BoxGroup” on page 784, “Combination Chart” on page 785, “Combination Chart” onpage 786, “Conditional Block” on page 787, “Conditional Block” on page 787,“Context Item Text” on page 787, “Continuous Values Slider” on page 787,“Crosstab” on page 788, “Data Button Bar” on page 793, “Data Check Box Group”on page 793, “Data Deck” on page 794, “Data Discrete Values Slider” on page 794,
Appendix G. Report Studio Object and Property Reference 881
“Data Drop-Down List” on page 794, “Data Iterator” on page 795, “Data List Box”on page 795, “Data Radio Button Group” on page 795, “Data Tab Control” on page796, “Data Toggle Button Bar” on page 796, “Date” on page 796, “Deck” on page797, “Discrete Values Slider” on page 798, “Drop-Down List” on page 799, “FieldSet” on page 800, “Gauge Chart” on page 800, “Gauge Chart” on page 801,“Hyperlink” on page 802, “Hyperlink Button” on page 803, “Image” on page 803,“Iterator” on page 804, “List” on page 808, “List Box” on page 809, “ListSummary” on page 814, “Map” on page 814, “Marimekko Chart” on page 815,“Metrics Range Chart” on page 818, “Page Break Text” on page 821, “PageNumber” on page 821, “Pareto Chart” on page 822, “Pareto Chart” on page 823,“Pie Chart” on page 823, “Pie Chart” on page 824, “Polar Chart” on page 825,“Progressive Chart” on page 826, “Progressive Chart” on page 827, “Radar Chart”on page 828, “Radio Button Group” on page 829, “Repeater Table” on page 831,“Row Number” on page 832, “Row Number” on page 832, “Scatter Chart” on page833, “Scatter Chart” on page 833, “Static Repeater Table” on page 835, “TabControl” on page 836, “Table” on page 837, “Text Item” on page 839, “Time” onpage 839, “Toggle Button Bar” on page 840, “Variable Text Item” on page 842,“Visualization” on page 842
Display FrequencySpecifies the frequency for which chart labels are to be rendered. If set to 3, forexample, every third label will be rendered. This property applies only to legacycharts.
Applies to
“Category Axis” on page 780, “X Axis” on page 843, “Y Axis” on page 845
Display MillisecondsSpecifies whether to show the milliseconds. The format of the milliseconds can becontrolled by selecting a specific format. This property is ignored if seconds are notrendered. The default value is inherited from the user's content language.
Applies to
“Date & Time Prompt” on page 796, “Interval Prompt” on page 804, “TimePrompt” on page 839
Display SecondsSpecifies whether to show the seconds. The format of the seconds can be controlledby selecting a specific format. The default value is inherited from the user's contentlanguage.
Applies to
“Date & Time Prompt” on page 796, “Interval Prompt” on page 804, “TimePrompt” on page 839
Display ValueSpecifies the values rendered to the report user when the prompt is used. Thesevalues can be different than the ones that are actually used by the report.
882 IBM Cognos Report Studio Version 10.2.1: User Guide

Applies to
“Select & Search Prompt” on page 834, “Value Prompt” on page 841
Display ValuesSpecifies which value of the variable to show. If the variable returns multiplevalues, List shows the values separated by commas.
Applies to
“Variable Text Item” on page 842
Dot ColorSpecifies the color of the dots of the values that are not selected in the iterator.
Applies to
“Iterator Label Area” on page 805
DownSpecifies the number of times down, or rows, that the frame contents may berendered.
The default value depends on the setting of the Repeater Direction property. If itis set to Left to right, top to bottom, the default is 20. If it is set to Top to bottom,left to right, the default is one.
Applies to
“Repeater Table” on page 831, “Static Repeater Table” on page 835
Drill-Through DefinitionsSpecifies report-to-report drill-through definitions, bookmarks, and drill-throughtext for the object.
Applies to
“3-D Combination Chart” on page 772, “3-D Scatter Chart” on page 772, “AxisLabels” on page 774, “Bubble Chart” on page 776, “Bubble Chart” on page 777,“Bullet Chart” on page 777, “Category Axis” on page 780, “Combination Chart” onpage 785, “Combination Chart” on page 786, “Crosstab Fact Cells” on page 789,“Crosstab Intersection” on page 789, “Crosstab Member Fact Cells” on page 790,“Crosstab Node Member” on page 790, “Crosstab Space” on page 791, “DataContainer” on page 793, “Gauge Chart” on page 800, “Gauge Chart” on page 801,“Gauge Labels” on page 801, “Image” on page 803, “Legend” on page 806,“Legend” on page 807, “List Column Body” on page 810, “List Column Title” onpage 811, “Map” on page 814, “Marimekko Chart” on page 815, “Metrics RangeChart” on page 818, “Pareto Chart” on page 822, “Pareto Chart” on page 823, “PieChart” on page 823, “Pie Chart” on page 824, “Pie Labels” on page 824, “PolarChart” on page 825, “Progressive Chart” on page 826, “Progressive Chart” on page827, “Radar Chart” on page 828, “Scatter Chart” on page 833, “Scatter Chart” onpage 833, “Text Item” on page 839, “Win-Loss Chart” on page 842, “X Axis” onpage 843, “Y Axis” on page 845
Appendix G. Report Studio Object and Property Reference 883

Drop-Down WidthSpecifies the width of the drop-down list box.
Applies to
“Iterator Label Area” on page 805
Drop ShadowDefines a drop shadow that is rendered around a container.
Applies to
“Crosstab” on page 788, “List” on page 808, “Repeater Table” on page 831, “Table”on page 837
Drop ShadowSpecifies whether a drop shadow appears on a chart and how it appears.
Applies to
“Bubble Chart” on page 777, “Bullet Chart” on page 777, “Combination Chart” onpage 786, “Gauge Chart” on page 800, “Pareto Chart” on page 822, “Pie Chart” onpage 824, “Progressive Chart” on page 826, “Scatter Chart” on page 833
DuplicatesSpecifies whether duplicate rows will be preserved or removed.
Applies to
“Query Operation” on page 828
EmbedSpecifies how to embed the reference object. A reference, or pointer, to the object isstored, by default. Alternatively, a copy of the external object can be stored in thereport.
Applies to
“Layout Component Reference” on page 806
End PositionSpecifies the position of one edge of the colored region along the numeric axis. Theregion extends from the position defined in the Start Position to the positiondefined in this property. The value specified in this property must be greater thanthe value specified in the Start Position property.
Applies to
“Colored Region” on page 785
884 IBM Cognos Report Studio Version 10.2.1: User Guide

Execution MethodSpecifies whether the query is a candidate to run concurrently. If set to Concurrent,the query may still execute sequentially based on other factors. If not explicitly set,the query will execute sequentially. Concurrent query execution may improveperformance in some cases.
Applies to
“Query” on page 828
Execution OptimizationSpecifies how much of the query processing is performed by the client and howmuch is performed by the database server. If the database server can perform allthe query processing, it does.
If All Rows is selected, the optimizer adopts a plan that retrieves all rows of theresult set in the least amount of time. This value is generally used in a batchenvironment.
If First Rows is selected, the optimizer adopts a plan that retrieves the first row asquickly as possible. This value is generally used in an interactive environment.
If Incremental is selected, the optimizer retrieves the first N rows, and thenretrieves the next N rows.
Applies to
“Query” on page 828
Expand FeaturesSpecifies whether to center and expand the feature in the map chart. When set toYes, the map feature is centered and expanded to take up all available space in thechart. When set to No, the map feature is not expanded.
Applies to
“Map” on page 814
Exploded SlicesSpecifies the slices that appear pulled out of a pie chart and their appearance.
Applies to
“Pie Chart” on page 824
ExpressionSpecifies the expression that defines the slicer member set.
Applies to
“Slicer Member Set” on page 835
Appendix G. Report Studio Object and Property Reference 885

ExpressionSpecifies the numeric position for a data marker in a scatter chart.
Applies to
“Marker” on page 816
ExpressionSpecifies the numeric position for a data marker in a scatter chart.
Applies to
“Marker” on page 816
ExpressionSpecifies the expression used to populate the data item.
Applies to
“Area” on page 773, “Bar” on page 774, “Calculated Measure” on page 779,“Calculated Member” on page 779, “Category Baseline” on page 781, “Chart NodeMember” on page 782, “Chart Text Item” on page 782, “Chart Text Item” on page783, “Colored Region” on page 785, “Colored Region” on page 785, “CrosstabCorner” on page 789, “Crosstab Fact Cells” on page 789, “Crosstab Intersection” onpage 789, “Crosstab Member Fact Cells” on page 790, “Crosstab Node Member” onpage 790, “Cumulation Line Label” on page 792, “Data Item” on page 795, “GaugeAxis” on page 800, “HTML Item” on page 802, “Image” on page 803, “Line” onpage 808, “List Cell” on page 809, “List Column Body” on page 810, “List ColumnTitle” on page 811, “Map Location” on page 814, “Map Location” on page 815,“Map Refinement Location” on page 815, “Map Refinement Location” on page 815,“Marker” on page 816, “Numeric Baseline” on page 820, “Rich Text Item” on page832, “Scatter Marker” on page 834, “Set Expression” on page 835, “Text Item” onpage 839, “Total Column” on page 840, “Win-Loss Measure” on page 843
Extend WidthSpecifies whether the area extends to the width of the chart. This property appliesonly to defined areas of area charts. When the area chart is converted to a matrixof charts, this property is not supported.
Applies to
“Area” on page 773
Face ColorSpecifies the color to show on the face of each gauge in a gauge chart.
Applies to
“Gauge Chart” on page 801
Fact Cell Data FormatSpecifies the data format of the object.
886 IBM Cognos Report Studio Version 10.2.1: User Guide

Applies to
“Node” on page 819
Fact Cells PrecedenceSpecifies which style property will override the other style property for intersectingcells in a crosstab, the row's properties, or the column's properties.
This property only applies to style properties that are both set, but to differentvalues. For example, if the row's background color is set to yellow and thecolumn's background color is set to red, you can select which of these propertieswill override the other. If only the row or the column has a set background color,then that color will be used on the intersecting cell, regardless of this setting.
Applies to
“Crosstab” on page 788
Fill EffectsSpecifies the fill effects for the object.
Applies to
“Chart Body” on page 781, “Display Layer” on page 798, “Legend” on page 806,“Point Layer” on page 825, “Region Layer” on page 830
First Column ColorSpecifies the color, gradient, or pattern to be used for the first column in theprogressive chart.
Applies to
“Progressive Chart” on page 827
First DateSpecifies the earliest date to render in the control, and the earliest date that can beselected.
Applies to
“Date & Time Prompt” on page 796, “Date Prompt” on page 797
First Label IndexSpecifies which label will be rendered first. If set to 5, for example, the fifth labelwill be the first label rendered. Subsequent labels will be rendered as defined inthe Display Frequency property. This property applies only to legacy charts.
Applies to
“Category Axis” on page 780, “X Axis” on page 843, “Y Axis” on page 845
First Slice AngleSpecifies the angle at which the first pie slice begins in a pie chart.
Appendix G. Report Studio Object and Property Reference 887

Applies to
“Pie Chart” on page 824
FloatingSpecifies how objects flow around an object.
Float controls the way the content that follows the selected object will flow aroundor below it.
Clear controls where the selected object is positioned, relative to other floatingobjects.
Applies to
“3-D Combination Chart” on page 772, “3-D Scatter Chart” on page 772, “Block”on page 776, “Bubble Chart” on page 776, “Bubble Chart” on page 777, “BulletChart” on page 777, “Combination Chart” on page 785, “Combination Chart” onpage 786, “Conditional Block” on page 787, “Conditional Block” on page 787,“Context Item Text” on page 787, “Crosstab” on page 788, “Date & Time Prompt”on page 796, “Date Prompt” on page 797, “Field Set” on page 800, “Gauge Chart”on page 800, “Gauge Chart” on page 801, “Hyperlink” on page 802, “HyperlinkButton” on page 803, “Image” on page 803, “Interval Prompt” on page 804, “List”on page 808, “List Summary” on page 814, “Map” on page 814, “MarimekkoChart” on page 815, “Metrics Range Chart” on page 818, “Page Break Text” onpage 821, “Pareto Chart” on page 822, “Pareto Chart” on page 823, “Pie Chart” onpage 823, “Pie Chart” on page 824, “Polar Chart” on page 825, “Progressive Chart”on page 826, “Progressive Chart” on page 827, “Prompt Button” on page 827,“Radar Chart” on page 828, “Repeater Table” on page 831, “Scatter Chart” on page833, “Scatter Chart” on page 833, “Select & Search Prompt” on page 834, “StaticRepeater Table” on page 835, “Table” on page 837, “Table of Contents” on page837, “Table of Contents Entry” on page 838, “Text Box Prompt” on page 838, “TextItem” on page 839, “Time Prompt” on page 839, “Tree Prompt” on page 840,“Value Prompt” on page 841, “Variable Text Item” on page 842, “Win-Loss Chart”on page 842
FontSpecifies the font family, size, weight, style, and effects used to display the object'stext.
Applies to
“Axis Labels” on page 774, “Block” on page 776, “Caption” on page 779, “ChartBody” on page 781, “Chart Body” on page 781, “Conditional Block” on page 787,“Conditional Block” on page 787, “Context Item Text” on page 787, “Crosstab” onpage 788, “Crosstab Columns” on page 788, “Crosstab Columns” on page 788,“Crosstab Corner” on page 789, “Crosstab Fact Cells” on page 789, “CrosstabIntersection” on page 789, “Crosstab Member Fact Cells” on page 790, “CrosstabNode Member” on page 790, “Crosstab Rows” on page 790, “Crosstab Rows” onpage 791, “Crosstab Space” on page 791, “Crosstab Summary” on page 791,“Cumulation Line Axis” on page 792, “Date” on page 796, “Equation Label” onpage 799, “Field Set” on page 800, “Gauge Labels” on page 801, “Gauge NumericalAxis” on page 801, “Hyperlink” on page 802, “Legend” on page 806, “Legend” onpage 807, “List” on page 808, “List Cell” on page 809, “List Column” on page 809,“List Column Body” on page 810, “List Columns” on page 810, “List Columns” onpage 810
888 IBM Cognos Report Studio Version 10.2.1: User Guide
page 810, “List Columns Body Style” on page 811, “List Columns Title Style” onpage 811, “List Column Title” on page 811, “List Footer” on page 811, “ListHeader” on page 812, “List Row” on page 813, “List Row Cells Style” on page 813,“List Summary” on page 814, “Note” on page 819, “Page” on page 821, “PageBreak Text” on page 821, “Page Number” on page 821, “Pie Labels” on page 824,“Prompt Button” on page 827, “Repeater Table” on page 831, “Repeater Table Cell”on page 831, “Repeater Table Cell” on page 832, “Row Number” on page 832,“Row Number” on page 832, “Static Repeater Table” on page 835, “Table” on page837, “Table Cell” on page 837, “Table of Contents” on page 837, “Table of ContentsEntry” on page 838, “Table Row” on page 838, “Text Box Prompt” on page 838,“Text Item” on page 839, “Time” on page 839, “Value Prompt” on page 841,“Variable Text Item” on page 842, “Win-Loss Chart” on page 842
Font Auto-SizingSpecifies whether to allow automatic resizing of the font.
Applies to
“Legend” on page 806
FooterSpecifies whether a chart footer is rendered. This property applies only to legacycharts.
Applies to
“Win-Loss Chart” on page 842
FooterSpecifies whether a chart footer is rendered.
Applies to
Foreground ColorSpecifies the color of the object's text.
Applies to
“Axis Labels” on page 774, “Block” on page 776, “Caption” on page 779, “ChartBody” on page 781, “Chart Body” on page 781, “Conditional Block” on page 787,“Conditional Block” on page 787, “Context Item Text” on page 787, “Crosstab” onpage 788, “Crosstab Columns” on page 788, “Crosstab Columns” on page 788,“Crosstab Corner” on page 789, “Crosstab Fact Cells” on page 789, “CrosstabIntersection” on page 789, “Crosstab Member Fact Cells” on page 790, “CrosstabNode Member” on page 790, “Crosstab Rows” on page 790, “Crosstab Rows” onpage 791, “Crosstab Space” on page 791, “Crosstab Summary” on page 791,“Cumulation Line Axis” on page 792, “Date” on page 796, “Equation Label” onpage 799, “Field Set” on page 800, “Gauge Labels” on page 801, “Gauge NumericalAxis” on page 801, “Hyperlink” on page 802, “Hyperlink Button” on page 803,“Legend” on page 806, “Legend” on page 807, “List” on page 808, “List Cell” onpage 809, “List Column” on page 809, “List Column Body” on page 810, “ListColumns” on page 810, “List Columns” on page 810, “List Columns Body Style”on page 811, “List Columns Title Style” on page 811, “List Column Title” on page811, “List Footer” on page 811, “List Header” on page 812, “List Row” on page 813
Appendix G. Report Studio Object and Property Reference 889
813, “List Row Cells Style” on page 813, “List Summary” on page 814, “Note” onpage 819, “Page” on page 821, “Page Break Text” on page 821, “Page Number” onpage 821, “Pie Labels” on page 824, “Prompt Button” on page 827, “RepeaterTable” on page 831, “Repeater Table Cell” on page 831, “Repeater Table Cell” onpage 832, “Row Number” on page 832, “Row Number” on page 832, “StaticRepeater Table” on page 835, “Table” on page 837, “Table Cell” on page 837, “Tableof Contents” on page 837, “Table of Contents Entry” on page 838, “Table Row” onpage 838, “Text Box Prompt” on page 838, “Text Item” on page 839, “Time” onpage 839, “Value Prompt” on page 841, “Variable Text Item” on page 842,“Win-Loss Chart” on page 842
From TextSpecifies the label that appears beside the beginning of a range. This propertyapplies to the following prompt types: date, date & time, time, and interval. Thedefault label text is From.
Applies to
“Date & Time Prompt” on page 796, “Date Prompt” on page 797, “IntervalPrompt” on page 804, “Text Box Prompt” on page 838, “Time Prompt” on page839, “Value Prompt” on page 841
Gauge AxesSpecifies the start and end angles for the gauge axes.
Applies to
“Gauge Chart” on page 800
Gauge Axis ColorsSpecifies the colors of the gauge axis.
Applies to
“Gauge Axis” on page 800
Gauge Axis Inner RadiusSpecifies the inner radius of the gauge axis as a percentage of the maximumallowed.
Applies to
“Gauge Axis” on page 800
Gauge Axis Outer RadiusSpecifies the outer radius of the gauge axis as a percentage of the maximumallowed.
Applies to
“Gauge Axis” on page 800
890 IBM Cognos Report Studio Version 10.2.1: User Guide

Gauge BorderSpecifies whether borders appear around the chart body in a gauge chart.
Applies to
“Gauge Chart” on page 800
Gauge LabelsSpecifies whether gauge labels are rendered.
Applies to
“Gauge Chart” on page 801
Gauge NeedleSpecifies the size and style of the gauge needle. The chart contains one needle foreach row in the data series. All needles on a gauge axis use the same specifiedstyles.
Applies to
“Gauge Axis” on page 800
Gauge PaletteSpecifies the palette that controls the look of the dial portion of a gauge.
Applies to
“Gauge Chart” on page 801
Gauge PivotSpecifies whether to show the center pivot point and its color, size, and style.
Applies to
“Gauge Chart” on page 800
Generated SQLShows the generated SQL or MDX.
Applies to
“Query” on page 828
GradientSpecifies a color gradient for the page.
Applies to
“Page” on page 821
Appendix G. Report Studio Object and Property Reference 891

GridlinesSpecifies the properties of the major gridlines in the gauge axis of a gauge chart.
Applies to
“Gauge Axis” on page 800
GridlinesSpecifies the properties of the gridlines in a chart.
Applies to
“Angular Axis” on page 773, “Category Axis” on page 780, “Cumulation LineAxis” on page 792, “Gauge Numerical Axis” on page 801, “Numerical Axis” onpage 820, “Numerical Axis” on page 820, “Radial Axis” on page 829, “X Axis” onpage 843, “X Axis” on page 843, “Y1 Axis” on page 844, “Y2 Axis” on page 844, “YAxis” on page 844, “Y Axis” on page 845, “Z Axis” on page 845, “Z Axis” on page845
GridlinesSpecifies the properties of the major gridlines in a chart.
Applies to
“Category axis” on page 780, “Cumulation Line” on page 792, “Numeric Axis” onpage 820, “Pareto Bars” on page 822, “Primary Axis” on page 826, “PrimaryBottom Axis” on page 826, “Secondary Axis” on page 834, “Secondary BottomAxis” on page 834, “X Axis” on page 843, “Y Axis” on page 844
Grouping & SortingSpecifies the grouping and sorting structure.
Applies to
“List” on page 808, “Page Set” on page 822, “Repeater” on page 831, “RepeaterTable” on page 831
Grouping TypeSpecifies whether the absolute, stacked, or 100 percent stacked data may be drawn.
Applies to
“Area” on page 773, “Bar” on page 774, “Line” on page 808
Group SpanSpecifies the group that this cell should visually span.
Applies to
“List Column Body” on page 810
892 IBM Cognos Report Studio Version 10.2.1: User Guide

Has Fact CellsSpecifies the contents of the fact cells of the crosstab. There is only one fact celldefinition for the crosstab, regardless of the number of measures.
Applies to
“Crosstab” on page 788
Header TextSpecifies the title that appears above the list of choices in a value prompt. Thedefault title text is the name of the level above the data items that are listed aschoices; for example, Regions.
Applies to
“Value Prompt” on page 841
Heading LevelSpecifies the heading level of the table of contents entry.
Applies to
“Table of Contents Entry” on page 838
HeightSpecifies the height of the visualization, in pixels.
Applies to
“Visualization” on page 842
Height (px)Specifies the height of the note, in pixels.
Applies to
“Note” on page 819
Hide AdornmentsSpecifies whether to hide the asterisk (*) on required prompts and arrow (->) ontype-in prompts that are in an error state.
Applies to
“Date & Time Prompt” on page 796, “Date Prompt” on page 797, “GeneratedPrompt” on page 802, “Interval Prompt” on page 804, “Select & Search Prompt” onpage 834, “Text Box Prompt” on page 838, “Time Prompt” on page 839, “TreePrompt” on page 840, “Value Prompt” on page 841
Hide TextSpecifies whether to replace characters entered in the prompt control with asterisk(*) characters.
Appendix G. Report Studio Object and Property Reference 893

Applies to
“Text Box Prompt” on page 838
HierarchySpecifies a reference to a hierarchy. You cannot modify this value.
Applies to
“Area” on page 773, “Bar” on page 774, “Calculated Member” on page 779,“Category Baseline” on page 781, “Chart Node Member” on page 782, “Chart TextItem” on page 782, “Chart Text Item” on page 783, “Colored Region” on page 785,“Colored Region” on page 785, “Crosstab Corner” on page 789, “Crosstab FactCells” on page 789, “Crosstab Intersection” on page 789, “Crosstab Member FactCells” on page 790, “Crosstab Node Member” on page 790, “Cumulation LineLabel” on page 792, “Dimensional Edge Summary” on page 798, “Explicit MemberSet” on page 799, “Gauge Axis” on page 800, “Hierarchy Set” on page 802, “HTMLItem” on page 802, “Image” on page 803, “Intersection (Tuple)” on page 804,“Level Set” on page 808, “Line” on page 808, “List Cell” on page 809, “ListColumn Body” on page 810, “List Column Title” on page 811, “Map Location” onpage 814, “Map Location” on page 815, “Map Refinement Location” on page 815,“Map Refinement Location” on page 815, “Marker” on page 816, “Member” onpage 817, “Member Children Set” on page 817, “Member Property” on page 818,“Named Set” on page 819, “Numeric Baseline” on page 820, “Rich Text Item” onpage 832, “Scatter Marker” on page 834, “Set Expression” on page 835, “Text Item”on page 839, “Total Column” on page 840, “Win-Loss Measure” on page 843
Hierarchy Unique NameSpecifies the Hierarchy Unique Name (HUN) of the hierarchy to which the dataitem belongs.
Applies to
“Area” on page 773, “Bar” on page 774, “Category Baseline” on page 781, “ChartNode Member” on page 782, “Chart Text Item” on page 782, “Chart Text Item” onpage 783, “Colored Region” on page 785, “Colored Region” on page 785, “CrosstabCorner” on page 789, “Crosstab Fact Cells” on page 789, “Crosstab Intersection” onpage 789, “Crosstab Member Fact Cells” on page 790, “Crosstab Node Member” onpage 790, “Cumulation Line Label” on page 792, “Gauge Axis” on page 800,“Hierarchy Set” on page 802, “HTML Item” on page 802, “Image” on page 803,“Line” on page 808, “List Cell” on page 809, “List Column Body” on page 810,“List Column Title” on page 811, “Map Location” on page 814, “Map Location” onpage 815, “Map Refinement Location” on page 815, “Map Refinement Location” onpage 815, “Marker” on page 816, “Numeric Baseline” on page 820, “Rich TextItem” on page 832, “Scatter Marker” on page 834, “Text Item” on page 839, “TotalColumn” on page 840, “Win-Loss Measure” on page 843
Highest Value TextSpecifies the label that appears beside the highest value option when ranges areenabled. This property applies to the following prompt types: date, date & time,time, value, text box, and interval. The default label text is Latest date, Latest time,or Highest interval.
894 IBM Cognos Report Studio Version 10.2.1: User Guide

Applies to
“Date & Time Prompt” on page 796, “Date Prompt” on page 797, “IntervalPrompt” on page 804, “Text Box Prompt” on page 838, “Time Prompt” on page839, “Value Prompt” on page 841
Hole Size (%)Specifies the size of the hole in a donut chart. A value of zero indicates a pie chart.
Applies to
“Pie Chart” on page 823, “Pie Chart” on page 824
Horizontal AlignmentSpecifies how the contents of the selected object are aligned horizontally.
Applies to
“Block” on page 776, “Chart Body” on page 781, “Chart Body” on page 781,“Chart Footer” on page 781, “Chart Footer” on page 781, “Chart Subtitle” on page782, “Chart Subtitle” on page 782, “Chart Title” on page 783, “Chart Title” on page783, “Conditional Block” on page 787, “Conditional Block” on page 787, “Crosstab”on page 788, “Crosstab Columns” on page 788, “Crosstab Columns” on page 788,“Crosstab Corner” on page 789, “Crosstab Fact Cells” on page 789, “CrosstabIntersection” on page 789, “Crosstab Member Fact Cells” on page 790, “CrosstabNode Member” on page 790, “Crosstab Rows” on page 790, “Crosstab Rows” onpage 791, “Crosstab Space” on page 791, “Crosstab Summary” on page 791,“Equation Label” on page 799, “Field Set” on page 800, “Gauge Labels” on page801, “Legend” on page 806, “Legend” on page 807, “Legend Title” on page 807,“Legend Title” on page 807, “List” on page 808, “List Cell” on page 809, “ListColumn” on page 809, “List Column Body” on page 810, “List Columns” on page810, “List Columns” on page 810, “List Columns Body Style” on page 811, “ListColumns Title Style” on page 811, “List Column Title” on page 811, “List Footer”on page 811, “List Header” on page 812, “List Row” on page 813, “List Row CellsStyle” on page 813, “Note” on page 819, “Note Content” on page 819, “Page” onpage 821, “Pie Labels” on page 824, “Repeater Table” on page 831, “Repeater TableCell” on page 831, “Repeater Table Cell” on page 832, “Static Repeater Table” onpage 835, “Table” on page 837, “Table Cell” on page 837, “Table of Contents” onpage 837, “Table of Contents Entry” on page 838, “Table Row” on page 838
Hours TextSpecifies the title that appears above the hours box in interval prompts. Thedefault title text is Hrs.
Applies to
“Interval Prompt” on page 804
HTMLSpecifies the static text used as HTML.
Applies to
“HTML Item” on page 802, “Rich Text Item” on page 832
Appendix G. Report Studio Object and Property Reference 895

HTML Source VariableSpecifies a variable based on which the HTML source is chosen.
Applies to
“HTML Item” on page 802, “Rich Text Item” on page 832
IconSpecifies the image used to identify the object in the control.
Applies to
“Button” on page 778, “Button” on page 778, “Check Box” on page 783, “ListItem” on page 812, “Radio Button” on page 829, “Tab” on page 836
Ignore Data with No FeaturesSpecifies whether to allow data that has no corresponding features. When set toYes, data with no corresponding features will be ignored. When set to No, the mapwill not run if it contains data with no corresponding features.
Applies to
“Map” on page 814
Include Zero For Auto ScaleSpecifies whether the value zero is included in the automatic calculation of thenumeric scale. This property applies only to legacy charts.
Applies to
“Angular Axis” on page 773, “Gauge Numerical Axis” on page 801, “NumericalAxis” on page 820, “Numerical Axis” on page 820, “Radial Axis” on page 829, “XAxis” on page 843, “Y1 Axis” on page 844, “Y2 Axis” on page 844, “Y Axis” onpage 844, “Z Axis” on page 845, “Z Axis” on page 845
Insert TextSpecifies the label that appears on the button that is used to add items to theselected items box in all multiple selection prompts. The default label text is Insert.
Applies to
“Date & Time Prompt” on page 796, “Date Prompt” on page 797, “IntervalPrompt” on page 804, “Select & Search Prompt” on page 834, “Text Box Prompt”on page 838, “Time Prompt” on page 839, “Value Prompt” on page 841
Iterator FirstSpecifies whether to show or hide the First button in the iterator.
Applies to
“Data Iterator” on page 795, “Iterator” on page 804
896 IBM Cognos Report Studio Version 10.2.1: User Guide

Iterator Label AreaSpecifies whether to show or hide the labels of iterator values.
Applies to
“Data Iterator” on page 795, “Iterator” on page 804
Iterator LastSpecifies whether to show or hide the Last button in the iterator.
Applies to
“Data Iterator” on page 795, “Iterator” on page 804
Iterator NextSpecifies whether to show or hide the Next button in the iterator.
Applies to
“Data Iterator” on page 795, “Iterator” on page 804
Iterator PreviousSpecifies whether to show or hide the Previous button in the iterator.
Applies to
“Data Iterator” on page 795, “Iterator” on page 804
Iterator Values DefinitionDefines the values of the iterator.
Applies to
“Iterator” on page 804
Join RelationshipsSpecifies how to join the two queries.
Applies to
“Join” on page 806
Keywords TextSpecifies the title that appears above the keyword search box in select & searchprompts. The default title text is Keywords.
Applies to
“Select & Search Prompt” on page 834
Appendix G. Report Studio Object and Property Reference 897

LabelSpecifies the static text that defines the bookmark. The value used as the bookmarkreference must match this value.
Applies to
“Bookmark” on page 776
LabelSpecifies the class label for a local class.
Applies to
“Class” on page 784
LabelSpecifies the class label for a global class. You cannot modify this label.
Applies to
“Class” on page 784
LabelSpecifies the name of the no value list item.
Applies to
“No Value List Item” on page 819
LabelSpecifies the name of the object in the control.
Applies to
“Button” on page 778, “Button” on page 778, “Check Box” on page 783, “ListItem” on page 812, “Radio Button” on page 829, “Tab” on page 836
LabelSpecifies whether a label is rendered for the baseline.
Applies to
“Baseline” on page 775, “Baseline” on page 775
LabelSpecifies whether a label is rendered for the marker.
Applies to
“Marker” on page 816, “Marker” on page 816
898 IBM Cognos Report Studio Version 10.2.1: User Guide

LabelThe label for the data item. Automatic text uses the data item name as the label.Specified text uses text that you specify as the label. With specified text, you canadd translations for the label to support users in multiple languages.
Applies to
“Category” on page 780, “Value” on page 841
LabelDefines the button label in the iterator.
Applies to
“Iterator First” on page 805, “Iterator Last” on page 805, “Iterator Next” on page805, “Iterator Previous” on page 805
LabelSpecifies the label of the object.
Applies to
“Calculated Measure” on page 779, “Calculated Member” on page 779, “CustomGroups” on page 793, “Dimensional Edge Summary” on page 798, “EdgeSummary” on page 799, “Explicit Member Set” on page 799, “Hierarchy Set” onpage 802, “Intersection (Tuple)” on page 804, “Level Set” on page 808, “ListSummary” on page 813, “Measure” on page 817, “Member” on page 817, “MemberChildren Set” on page 817, “Member Property” on page 818, “Named Set” on page819, “Percentaged Measure” on page 823, “Set Expression” on page 835
Label ColorSpecifies the color of labels in the slider.
Applies to
“Continuous Values Slider” on page 787, “Data Discrete Values Slider” on page794, “Discrete Values Slider” on page 798
Label ControlControls how the labels in a chart are rendered.
Applies to
“Category Axis” on page 780, “X Axis” on page 843, “Y Axis” on page 845
Label ForSpecifies the name of the prompt control to associate to the text item. This propertyis used to make a prompt control accessible by defining a label for the control.
Applies to
“Text Item” on page 839
Appendix G. Report Studio Object and Property Reference 899

Label LocationSpecifies whether to show the label in the legend or in the chart.
Applies to
“Marker” on page 816, “Scatter Marker” on page 834
LabelsSpecifies whether labels are rendered.
Applies to
“Pie Chart” on page 823
Last DateSpecifies the latest date rendered in the control, and the last date that can beselected.
Applies to
“Date & Time Prompt” on page 796, “Date Prompt” on page 797
Left PositionSpecifies the position of the left edge of the colored region.
Applies to
“Colored Region” on page 785
Left Position (px)Specifies the pixel position of the bottom edge of the note measured from the leftedge of the chart.
Applies to
“Note” on page 819
Left Position (px)Specifies the pixel position of the left edge of the legend measured from the leftedge of the chart.
Applies to
“Legend” on page 806
LegendSpecifies whether the legend is rendered.
Applies to
“3-D Scatter Chart” on page 772, “Bubble Chart” on page 776, “CombinationChart” on page 785, “Gauge Chart” on page 801, “Map” on page 814, “Marimekko
900 IBM Cognos Report Studio Version 10.2.1: User Guide

Chart” on page 815, “Metrics Range Chart” on page 818, “Pareto Chart” on page823, “Pie Chart” on page 823, “Polar Chart” on page 825, “Radar Chart” on page828, “Scatter Chart” on page 833
LegendSpecifies whether a legend is rendered and where the legend is positioned in achart.
Applies to
“Bubble Chart” on page 777, “Bullet Chart” on page 777, “Combination Chart” onpage 786, “Gauge Chart” on page 800, “Pareto Chart” on page 822, “Pie Chart” onpage 824, “Progressive Chart” on page 826, “Scatter Chart” on page 833
Legend LabelSpecifies whether to render the baseline in the legend.
Applies to
“Baseline” on page 775, “Baseline” on page 775
Legend SeparatorSpecifies the separator to use between the legend entry and the value when youshow values in the legend. The default is a comma (,) followed by a space.
Applies to
“Legend” on page 807
Legend TitleSpecifies whether a legend title is rendered. This property applies only to legacycharts.
Applies to
“Legend” on page 806
Legend TitleSpecifies whether a legend title is rendered in a chart.
Applies to
“Legend” on page 807
Legend TitleSpecifies whether a legend title is rendered in a chart.
Applies to
“Legend” on page 806, “Legend” on page 807
Appendix G. Report Studio Object and Property Reference 901

LevelSpecifies a reference to a level. You cannot modify this value.
Applies to
“Area” on page 773, “Bar” on page 774, “Category Baseline” on page 781, “ChartNode Member” on page 782, “Chart Text Item” on page 782, “Chart Text Item” onpage 783, “Colored Region” on page 785, “Colored Region” on page 785, “CrosstabCorner” on page 789, “Crosstab Fact Cells” on page 789, “Crosstab Intersection” onpage 789, “Crosstab Member Fact Cells” on page 790, “Crosstab Node Member” onpage 790, “Cumulation Line Label” on page 792, “Gauge Axis” on page 800,“HTML Item” on page 802, “Image” on page 803, “Level Set” on page 808, “Line”on page 808, “List Cell” on page 809, “List Column Body” on page 810, “ListColumn Title” on page 811, “Map Location” on page 814, “Map Location” on page815, “Map Refinement Location” on page 815, “Map Refinement Location” on page815, “Marker” on page 816, “Member Property” on page 818, “Numeric Baseline”on page 820, “Rich Text Item” on page 832, “Scatter Marker” on page 834, “TextItem” on page 839, “Total Column” on page 840, “Win-Loss Measure” on page 843
Level IndentationControls the indentation of the contents of node members in a crosstab.
Applies to
“Crosstab Node Member” on page 790
Level Unique NameSpecifies the Level Unique Name (LUN) of the level to which the data itembelongs.
Applies to
“Area” on page 773, “Bar” on page 774, “Category Baseline” on page 781, “ChartNode Member” on page 782, “Chart Text Item” on page 782, “Chart Text Item” onpage 783, “Colored Region” on page 785, “Colored Region” on page 785, “CrosstabCorner” on page 789, “Crosstab Fact Cells” on page 789, “Crosstab Intersection” onpage 789, “Crosstab Member Fact Cells” on page 790, “Crosstab Node Member” onpage 790, “Cumulation Line Label” on page 792, “Gauge Axis” on page 800,“HTML Item” on page 802, “Image” on page 803, “Level Set” on page 808, “Line”on page 808, “List Cell” on page 809, “List Column Body” on page 810, “ListColumn Title” on page 811, “Map Location” on page 814, “Map Location” on page815, “Map Refinement Location” on page 815, “Map Refinement Location” on page815, “Marker” on page 816, “Numeric Baseline” on page 820, “Rich Text Item” onpage 832, “Scatter Marker” on page 834, “Text Item” on page 839, “Total Column”on page 840, “Win-Loss Measure” on page 843
Line and MarkersSpecifies whether to display a line and whether to display markers.
Applies to
“Line” on page 808
902 IBM Cognos Report Studio Version 10.2.1: User Guide

Line ShapeSpecifies the shape of a line in a line chart.
Applies to
“Line” on page 808
Line StyleSpecifies the style, color, and weight of the line in a Pareto chart.
Applies to
“Cumulation Line” on page 792
Line StyleSpecifies the style, color, and weight of the line.
Applies to
“Category Baseline” on page 781, “Numeric Baseline” on page 820, “Trendline” onpage 841
Line StyleSpecifies the style, color, and weight of the line. This property applies only tolegacy charts.
Applies to
“Line” on page 808
Line StylesSpecifies the style, color, and weight of the line.
Applies to
“Baseline” on page 775, “Baseline” on page 775, “Baseline” on page 775, “Baseline”on page 775, “Cumulation Line” on page 792, “Regression Line” on page 831
Line TypeSpecifies the type of line used to connect data values.
Applies to
“Line” on page 808
Line Weight (pt)Specifies the line thickness in points. A value of zero indicates the thinnest possibleline.
Applies to
“Line” on page 808
Appendix G. Report Studio Object and Property Reference 903

List Items DefinitionDefines the list items in the control.
Applies to
“Drop-Down List” on page 799, “List Box” on page 809
Loss ColorSpecifies a color, color gradient, or pattern to apply to the loss values.
Applies to
“Win-Loss Chart” on page 842
Lowest Value TextSpecifies the label that appears beside the lowest value option when ranges areenabled. This property applies to the following prompt types: date, date & time,time, value, text box, and interval. The default label text is Earliest date, Earliesttime, or Lowest interval.
Applies to
“Date & Time Prompt” on page 796, “Date Prompt” on page 797, “IntervalPrompt” on page 804, “Text Box Prompt” on page 838, “Time Prompt” on page839, “Value Prompt” on page 841
Map & LayersSets the map and layers for a map chart.
Applies to
“Map” on page 814
Map DrillsControls the drill definitions in a map. It is possible to define different drill targetsfor each region or point.
Applies to
“Point Layer” on page 825, “Region Layer” on page 830
MarginSpecifies the margin properties for the object.
Applies to
“3-D Combination Chart” on page 772, “3-D Scatter Chart” on page 772, “Block”on page 776, “Bubble Chart” on page 776, “Bubble Chart” on page 777, “BulletChart” on page 777, “Caption” on page 779, “Combination Chart” on page 785,“Combination Chart” on page 786, “Conditional Block” on page 787, “ConditionalBlock” on page 787, “Context Item Text” on page 787, “Crosstab” on page 788,“Date” on page 796, “Field Set” on page 800, “Gauge Chart” on page 800, “GaugeChart” on page 801, “Hyperlink” on page 802, “Hyperlink Button” on page 803,
904 IBM Cognos Report Studio Version 10.2.1: User Guide

“Image” on page 803, “List” on page 808, “List Summary” on page 814, “Map” onpage 814, “Marimekko Chart” on page 815, “Metrics Range Chart” on page 818,“Page” on page 821, “Page Break Text” on page 821, “Page Number” on page 821,“Pareto Chart” on page 822, “Pareto Chart” on page 823, “Pie Chart” on page 823,“Pie Chart” on page 824, “Polar Chart” on page 825, “Progressive Chart” on page826, “Progressive Chart” on page 827, “Prompt Button” on page 827, “RadarChart” on page 828, “Repeater Table” on page 831, “Row Number” on page 832,“Row Number” on page 832, “Scatter Chart” on page 833, “Scatter Chart” on page833, “Static Repeater Table” on page 835, “Table” on page 837, “Table of Contents”on page 837, “Table of Contents Entry” on page 838, “Text Item” on page 839,“Time” on page 839, “Variable Text Item” on page 842, “Win-Loss Chart” on page842
Marimekko TotalsSpecifies whether to show totals for each column at the top of the chart.
Applies to
“Marimekko Chart” on page 815
Marker ColorSpecifies a color for the target value markers in a metrics chart.
Applies to
“Metrics Range Chart” on page 818
Marker ColorSpecifies the color of the markers.
Applies to
“Marker” on page 816, “Marker” on page 816
Marker LabelSpecifies whether the label for the Target Marker will appear in the legend.
Applies to
“Metrics Range Chart” on page 818
MarkersAdds reference points to a chart based on numeric or statistical values,calculations, or layout calculations. This property applies only to legacy charts.
Applies to
“Bubble Chart” on page 776, “Combination Chart” on page 785, “MarimekkoChart” on page 815, “Metrics Range Chart” on page 818, “Pareto Chart” on page823, “Polar Chart” on page 825, “Progressive Chart” on page 827, “Radar Chart”on page 828, “Scatter Chart” on page 833
Appendix G. Report Studio Object and Property Reference 905

MarkersAdds reference points to a chart based on numeric or statistical values,calculations, or layout calculations.
Applies to
“Bubble Chart” on page 777, “Combination Chart” on page 786, “Pareto Chart” onpage 822, “Progressive Chart” on page 826, “Scatter Chart” on page 833
Marker ShapeSpecifies the shape of the markers.
Applies to
“Cumulation Line” on page 792, “Marker” on page 816, “Marker” on page 816
Marker ShapeSpecifies the shape of the marker symbol.
Applies to
“Marker” on page 816, “Scatter Marker” on page 834
Marker Size (pt)Specifies the size of markers in points. A value of zero means do not showmarkers.
Applies to
“3-D Scatter Chart” on page 772, “Cumulation Line” on page 792, “Marker” onpage 816, “Marker” on page 816, “Polar Chart” on page 825, “Radar Chart” onpage 828, “Scatter Chart” on page 833
Marker Size (pt)Specifies the size of markers in points. A value of zero means do not showmarkers.
Applies to
“Marker” on page 816, “Scatter Marker” on page 834
Marker StyleSpecifies the shape, fill type, and color of the markers in the chart.
Applies to
“Marker” on page 816, “Scatter Marker” on page 834
Marker Text LocationSpecifies where the text of the marker is rendered.
906 IBM Cognos Report Studio Version 10.2.1: User Guide

Applies to
“Bubble Chart” on page 776, “Combination Chart” on page 785, “MarimekkoChart” on page 815, “Metrics Range Chart” on page 818, “Pareto Chart” on page823, “Polar Chart” on page 825, “Progressive Chart” on page 827, “Radar Chart”on page 828, “Scatter Chart” on page 833
Master Detail RelationshipsSpecifies relationships between the master data container and the detail datacontainer. Specifically, specifies how query items in the master query are linked toquery items or parameters in the detail query.
Applies to
“3-D Combination Chart” on page 772, “3-D Scatter Chart” on page 772, “AxisTitle” on page 774, “Axis Title” on page 774, “Baseline” on page 775, “Baseline” onpage 775, “Baseline” on page 775, “Baseline” on page 775, “Bubble Chart” on page776, “Bubble Chart” on page 777, “Bullet Chart” on page 777, “Category Baseline”on page 781, “Chart Footer” on page 781, “Chart Footer” on page 781, “ChartSubtitle” on page 782, “Chart Subtitle” on page 782, “Chart Title” on page 783,“Chart Title” on page 783, “Colored Region” on page 785, “Colored Region” onpage 785, “Combination Chart” on page 785, “Combination Chart” on page 786,“Crosstab” on page 788, “Data Button Bar” on page 793, “Data Check Box Group”on page 793, “Data Container” on page 793, “Data Deck” on page 794, “DataDiscrete Values Slider” on page 794, “Data Drop-Down List” on page 794, “DataIterator” on page 795, “Data List Box” on page 795, “Data Radio Button Group” onpage 795, “Data Tab Control” on page 796, “Data Toggle Button Bar” on page 796,“Gauge Chart” on page 800, “Gauge Chart” on page 801, “Label” on page 806,“Legend Title” on page 807, “Legend Title” on page 807, “List” on page 808,“Map” on page 814, “Marimekko Chart” on page 815, “Marker” on page 816,“Marker” on page 816, “Marker” on page 816, “Metrics Range Chart” on page 818,“Note” on page 819, “Note Content” on page 819, “Numeric Baseline” on page820, “Page” on page 821, “Page Set” on page 822, “Pareto Chart” on page 822,“Pareto Chart” on page 823, “Pie Chart” on page 823, “Pie Chart” on page 824,“Point Color Legend Title” on page 824, “Point Size Legend Title” on page 825,“Polar Chart” on page 825, “Progressive Chart” on page 826, “Progressive Chart”on page 827, “Radar Chart” on page 828, “Region Color Legend Title” on page 830,“Repeater” on page 831, “Repeater Table” on page 831, “Scatter Chart” on page833, “Scatter Chart” on page 833, “Scatter Marker” on page 834, “Win-Loss Chart”on page 842
Material EffectsSpecifies a material effect, such as plastic or metallic.
Applies to
“Bubble Chart” on page 777, “Combination Chart” on page 786, “Pareto Chart” onpage 822, “Progressive Chart” on page 826, “Scatter Chart” on page 833
Material EffectsSpecifies a material effect, such as plastic or metallic, in a pie chart.
Appendix G. Report Studio Object and Property Reference 907

Applies to
“Pie Chart” on page 824
Matrix Rows and ColumnsSpecifies whether to render a matrix of charts in rows and columns.
Applies to
“Bubble Chart” on page 777, “Bullet Chart” on page 777, “Combination Chart” onpage 786, “Gauge Chart” on page 800, “Pareto Chart” on page 822, “Pie Chart” onpage 824, “Progressive Chart” on page 826, “Scatter Chart” on page 833
Maximum CharactersSpecifies the maximum number of characters to show before the text is truncated.
Applies to
“Legend” on page 806, “Text Item” on page 839
Maximum Execution TimeSpecifies the maximum period, in seconds, that the query can spend to open thedatabase cursor and to retrieve the first row of data. An error is returned if thespecified time is exceeded. Note that this property is not for the total time requiredto execute the query. If no value is specified, no error is returned and the queryruns until complete.
Applies to
“Query” on page 828
Maximum HotspotsSpecifies the maximum number of hotspots generated in a chart. A hotspot in achart appears when you pause a pointer over it. For example, a hotspot on adrill-down symbol or a tooltip gives details about the column, line, or pie slice. Ifspecified, this value overrides the hotspot configuration settings in IBM® Cognos®
Administration.
For more information, see the topic Changing the number of hotspots in a chart.
Applies to
“3-D Combination Chart” on page 772, “3-D Scatter Chart” on page 772, “BubbleChart” on page 776, “Bubble Chart” on page 777, “Bullet Chart” on page 777,“Combination Chart” on page 785, “Combination Chart” on page 786, “GaugeChart” on page 800, “Gauge Chart” on page 801, “Map” on page 814, “MarimekkoChart” on page 815, “Metrics Range Chart” on page 818, “Pareto Chart” on page822, “Pareto Chart” on page 823, “Pie Chart” on page 823, “Pie Chart” on page824, “Polar Chart” on page 825, “Progressive Chart” on page 826, “ProgressiveChart” on page 827, “Radar Chart” on page 828, “Scatter Chart” on page 833,“Scatter Chart” on page 833, “Win-Loss Chart” on page 842
908 IBM Cognos Report Studio Version 10.2.1: User Guide

Maximum Rows RetrievedSpecifies the maximum number of database rows that the query can retrieve. Anerror is returned if the number of database rows returned exceeds the specifiedvalue. If no value is specified, no error is returned and the query returns all rows.
Applies to
“Query” on page 828
Maximum Size (pt)Specifies the maximum size used for map point features that have correspondingdata. For example, if the minimum size is 2pt and the maximum size is 12pt, thesize of each point is calculated using linear interpolation that is based on itsmeasure value.
Applies to
“Point Size Measure” on page 825
Maximum TablesSpecifies the maximum number of tables that the query can retrieve. An error isreturned if the number of tables in the generated IBM® Cognos® SQL exceeds thespecified value. If no value is specified, no error is returned and there is norestriction on the number of tables that can be queried.
Applies to
“Query” on page 828
Maximum Text Blob CharactersSpecifies the maximum number of characters that the query is allowed to retrievefor each text BLOB. An error is returned if the number of characters retrievedexceeds the specified value. If no value is specified, no error is returned and textBLOBs can be of any size.
Applies to
“Query” on page 828
Maximum Truncation CharactersSpecifies the maximum number of characters to show before the label is truncated.
If the Allow Truncation property is set to Yes and no value is specified in theMaximum Characters property, the application automatically determines theoptimum number of characters after which to truncate. Use this property only ifyou want explicit control over the truncation level. Note that regardless of thisproperty's setting, no truncation will occur if there is sufficient space.
Applies to
“Category Axis” on page 780, “Gauge Labels” on page 801, “Pie Labels” on page824, “X Axis” on page 843, “Y Axis” on page 845
Appendix G. Report Studio Object and Property Reference 909

Maximum ValueSpecifies the maximum value for the numeric scale. If no value is specified, onewill be calculated based on the data.
Applies to
“Angular Axis” on page 773, “Gauge Numerical Axis” on page 801, “NumericalAxis” on page 820, “Numerical Axis” on page 820, “Radial Axis” on page 829, “XAxis” on page 843, “Y1 Axis” on page 844, “Y2 Axis” on page 844, “Y Axis” onpage 844, “Z Axis” on page 845, “Z Axis” on page 845
Maximum ValueSpecifies the maximum value for the slider.
Applies to
“Continuous Values Slider” on page 787
MDXThe text of the typed-in MDX. It is assumed to be appropriate for the type anddata source. If it is not the query may fail or produce unexpected results.
Applies to
“MDX” on page 817
MemberSpecifies a reference to a member. You cannot modify this value.
Applies to
“Area” on page 773, “Bar” on page 774, “Category Baseline” on page 781, “ChartNode Member” on page 782, “Chart Text Item” on page 782, “Chart Text Item” onpage 783, “Colored Region” on page 785, “Colored Region” on page 785, “CrosstabCorner” on page 789, “Crosstab Fact Cells” on page 789, “Crosstab Intersection” onpage 789, “Crosstab Member Fact Cells” on page 790, “Crosstab Node Member” onpage 790, “Cumulation Line Label” on page 792, “Gauge Axis” on page 800,“HTML Item” on page 802, “Image” on page 803, “Line” on page 808, “List Cell”on page 809, “List Column Body” on page 810, “List Column Title” on page 811,“Map Location” on page 814, “Map Location” on page 815, “Map RefinementLocation” on page 815, “Map Refinement Location” on page 815, “Marker” onpage 816, “Measure” on page 817, “Member” on page 817, “Member Children Set”on page 817, “Numeric Baseline” on page 820, “Rich Text Item” on page 832,“Scatter Marker” on page 834, “Text Item” on page 839, “Total Column” on page840, “Win-Loss Measure” on page 843
Member Offset (%)Specifies a position relative to the next item in the chart. This is a percentagevalue. Negative values indicate before the member and positive values indicateafter the member.
910 IBM Cognos Report Studio Version 10.2.1: User Guide

Applies to
“Baseline” on page 775, “Category Baseline” on page 781, “Marker” on page 816
MembersSpecifies the members of the intersection (tuple).
Applies to
“Intersection (Tuple)” on page 804
MembersSpecifies the members in the member set.
Applies to
“Explicit Member Set” on page 799
Member Unique NameSpecifies the Member Unique Name (MUN) of the member.
Applies to
“Area” on page 773, “Bar” on page 774, “Category Baseline” on page 781, “ChartNode Member” on page 782, “Chart Text Item” on page 782, “Chart Text Item” onpage 783, “Colored Region” on page 785, “Colored Region” on page 785, “CrosstabCorner” on page 789, “Crosstab Fact Cells” on page 789, “Crosstab Intersection” onpage 789, “Crosstab Member Fact Cells” on page 790, “Crosstab Node Member” onpage 790, “Cumulation Line Label” on page 792, “Gauge Axis” on page 800,“HTML Item” on page 802, “Image” on page 803, “Line” on page 808, “List Cell”on page 809, “List Column Body” on page 810, “List Column Title” on page 811,“Map Location” on page 814, “Map Location” on page 815, “Map RefinementLocation” on page 815, “Map Refinement Location” on page 815, “Marker” onpage 816, “Measure” on page 817, “Member” on page 817, “Member Children Set”on page 817, “Numeric Baseline” on page 820, “Rich Text Item” on page 832,“Scatter Marker” on page 834, “Text Item” on page 839, “Total Column” on page840, “Win-Loss Measure” on page 843
Milliseconds TextSpecifies the title that appears above the milliseconds box in interval prompts. Thedefault title text is ms.
Applies to
“Interval Prompt” on page 804
Minimum Size (pt)Specifies the minimum size used for map point features that have correspondingdata. For example, if the minimum size is 2pt and the maximum size is 12pt, thesize of each point is calculated using linear interpolation that is based on itsmeasure value.
Appendix G. Report Studio Object and Property Reference 911
Applies to
“Point Size Measure” on page 825
Minimum ValueSpecifies the minimum value for the numeric scale. If no value is specified, onewill be calculated based on the data.
Applies to
“Angular Axis” on page 773, “Gauge Numerical Axis” on page 801, “NumericalAxis” on page 820, “Numerical Axis” on page 820, “Radial Axis” on page 829, “XAxis” on page 843, “Y1 Axis” on page 844, “Y2 Axis” on page 844, “Y Axis” onpage 844, “Z Axis” on page 845, “Z Axis” on page 845
Minimum ValueSpecifies the minimum value for the slider.
Applies to
“Continuous Values Slider” on page 787
Minor GridlinesSpecifies the properties of the minor gridlines in the gauge axis of a gauge chart.
Applies to
“Gauge Axis” on page 800
Minor GridlinesSpecifies the properties of the minor gridlines in a chart. This property applies onlyto legacy charts.
Applies to
“Angular Axis” on page 773, “Category Axis” on page 780, “Cumulation LineAxis” on page 792, “Gauge Numerical Axis” on page 801, “Numerical Axis” onpage 820, “Numerical Axis” on page 820, “Radial Axis” on page 829, “X Axis” onpage 843, “X Axis” on page 843, “Y1 Axis” on page 844, “Y2 Axis” on page 844, “YAxis” on page 844, “Y Axis” on page 845, “Z Axis” on page 845, “Z Axis” on page845
Minor GridlinesSpecifies the properties of the minor gridlines in a chart.
Applies to
“Category axis” on page 780, “Cumulation Line” on page 792, “Numeric Axis” onpage 820, “Pareto Bars” on page 822, “Primary Axis” on page 826, “PrimaryBottom Axis” on page 826, “Secondary Axis” on page 834, “Secondary BottomAxis” on page 834, “X Axis” on page 843, “Y Axis” on page 844
912 IBM Cognos Report Studio Version 10.2.1: User Guide

Minutes TextSpecifies the title that appears above the minutes box in interval prompts. Thedefault title text is Mins.
Applies to
“Interval Prompt” on page 804
Multi-LineSpecifies whether to allow multi-line editing in the text control
Applies to
“Text Box Prompt” on page 838
Multi-SelectSpecifies whether the control allows the selection of multiple values. Note that anassociated parameterized filter expression will override this object's setting. If youedit this property but do not get the expected results, check the associatedexpression for the presence of an operator that specifies how many items can beselected. Examples of multiple selection operators are "in" and "not in"; examplesof single selection operators are equal (=), less than (<) and greater than (>).
For example, if you used the prompt wizard to create a parameterized filterexpression and selected one of the operators that specify selection rules, changingthe value of this property is not sufficient to change this restriction. You must alsoedit the filter's expression to remove the offending operator.
To edit a filter expression, you must select the filter, which is accessible from theQuery view, using the Explorer bar.
Applies to
“Data List Box” on page 795, “Date & Time Prompt” on page 796, “Date Prompt”on page 797, “Interval Prompt” on page 804, “List Box” on page 809, “Select &Search Prompt” on page 834, “Text Box Prompt” on page 838, “Time Prompt” onpage 839, “Tree Prompt” on page 840, “Value Prompt” on page 841
NameSpecifies the name of the object.
Applies to
“Calculated Measure” on page 779, “Calculated Member” on page 779, “CustomGroups” on page 793, “Dimensional Edge Summary” on page 798, “EdgeSummary” on page 799, “Explicit Member Set” on page 799, “Hierarchy Set” onpage 802, “Intersection (Tuple)” on page 804, “Level Set” on page 808, “ListSummary” on page 813, “Measure” on page 817, “Member” on page 817, “MemberChildren Set” on page 817, “Member Property” on page 818, “Named Set” on page819, “Percentaged Measure” on page 823, “Set Expression” on page 835
NameSpecifies the name of the object.
Appendix G. Report Studio Object and Property Reference 913

Applies to
“Page Set” on page 822
NameSpecifies the name of the object.
Applies to
“Page” on page 821
NameSpecifies a unique name that allows layout objects to be reused, usually to takeadvantage of any applied styling.
Applies to
“3-D Combination Chart” on page 772, “3-D Scatter Chart” on page 772, “Block”on page 776, “Bubble Chart” on page 776, “Bubble Chart” on page 777, “BulletChart” on page 777, “Button” on page 778, “Button Bar” on page 778, “Check BoxGroup” on page 784, “Combination Chart” on page 785, “Combination Chart” onpage 786, “Continuous Values Slider” on page 787, “Crosstab” on page 788, “DataButton Bar” on page 793, “Data Check Box Group” on page 793, “Data Container”on page 793, “Data Deck” on page 794, “Data Discrete Values Slider” on page 794,“Data Drop-Down List” on page 794, “Data Iterator” on page 795, “Data List Box”on page 795, “Data Radio Button Group” on page 795, “Data Tab Control” on page796, “Data Toggle Button Bar” on page 796, “Date & Time Prompt” on page 796,“Date Prompt” on page 797, “Deck” on page 797, “Discrete Values Slider” on page798, “Drop-Down List” on page 799, “Field Set” on page 800, “Gauge Chart” onpage 800, “Gauge Chart” on page 801, “Generated Prompt” on page 802, “HTMLItem” on page 802, “Hyperlink” on page 802, “Hyperlink Button” on page 803,“Image” on page 803, “Interval Prompt” on page 804, “Iterator” on page 804,“List” on page 808, “List Box” on page 809, “Map” on page 814, “MarimekkoChart” on page 815, “Metrics Range Chart” on page 818, “Pareto Chart” on page822, “Pareto Chart” on page 823, “Pie Chart” on page 823, “Pie Chart” on page824, “Polar Chart” on page 825, “Progressive Chart” on page 826, “ProgressiveChart” on page 827, “Prompt Button” on page 827, “Radar Chart” on page 828,“Radio Button Group” on page 829, “Repeater” on page 831, “Repeater Table” onpage 831, “Rich Text Item” on page 832, “Scatter Chart” on page 833, “ScatterChart” on page 833, “Select & Search Prompt” on page 834, “Singleton” on page835, “Static Repeater Table” on page 835, “Tab Control” on page 836, “Table” onpage 837, “Text Box Prompt” on page 838, “Text Item” on page 839, “TimePrompt” on page 839, “Toggle Button Bar” on page 840, “Tree Prompt” on page840, “Value Prompt” on page 841, “Visualization” on page 842, “Win-Loss Chart”on page 842
NameSpecifies the name of the object.
Applies to
“Query” on page 828
914 IBM Cognos Report Studio Version 10.2.1: User Guide

NameSpecifies the unique name identifier for a query operation.
Applies to
“Query Operation” on page 828
NameSpecifies the unique name identifier for an SQL object.
Applies to
“SQL” on page 835
NameSpecifies the unique name identifier for an MDX object.
Applies to
“MDX” on page 817
NameSpecifies the name of the object.
Applies to
“Dimension” on page 798
NameSpecifies the name of the object.
Applies to
“Level” on page 807
NameSpecifies the name of the object.
Applies to
“Fact” on page 800
NameSpecifies the name of the object.
Applies to
“Member Set” on page 818
NameSpecifies the name of the object.
Appendix G. Report Studio Object and Property Reference 915

Applies to
“Variable” on page 842
NameSpecifies a unique name that allows layout objects to be reused, usually to takeadvantage of any applied formatting.
Applies to
“Calculated Member” on page 779, “Key” on page 806, “Level Hierarchy” on page807, “Member Hierarchy” on page 817, “Member Property” on page 817
Negative Column ColorSpecifies the color, gradient, or pattern to be used for columns in the progressivechart that represent negative values.
Applies to
“Progressive Chart” on page 827
Nested Label DisplaySpecifies how to display the axis labels for nested categories. Concatenatedseparates the labels with a comma.
Applies to
“Axis Labels” on page 774
Nesting OrderSpecifies the nesting order of extra categories in the query. Change the nestingorder of extra categories when items are from the same dimension. For example, avisualization has Year as categories, and Month and Quarter as extra categories.The order of categories must be Year, Quarter, and Month for the query to run.
Applies to
“Data Container” on page 793
No Data ContentsSpecifies what appears in a data container when there is no data available from thedatabase. When set to No Content, shows an empty data container, such as a blanklist. When set to Content specified in the No data tab, shows the content that youspecified in the No data tab. You can insert any object from the Toolbox tab. Whenset to Specified text (the default), shows the text that you specify.
Applies to
“3-D Combination Chart” on page 772, “3-D Scatter Chart” on page 772, “BubbleChart” on page 776, “Bubble Chart” on page 777, “Bullet Chart” on page 777,“Combination Chart” on page 785, “Combination Chart” on page 786, “Crosstab”on page 788, “Gauge Chart” on page 800, “Gauge Chart” on page 801, “List” onpage 808, “Map” on page 814, “Marimekko Chart” on page 815, “Metrics Range
916 IBM Cognos Report Studio Version 10.2.1: User Guide

Chart” on page 818, “Pareto Chart” on page 822, “Pareto Chart” on page 823, “PieChart” on page 823, “Pie Chart” on page 824, “Polar Chart” on page 825,“Progressive Chart” on page 826, “Progressive Chart” on page 827, “Radar Chart”on page 828, “Repeater” on page 831, “Repeater Table” on page 831, “ScatterChart” on page 833, “Scatter Chart” on page 833, “Table of Contents” on page 837,“Win-Loss Chart” on page 842
No Data Features Size (pt)Specifies the point size used for map point features that do not have correspondingdata.
Applies to
“Map” on page 814
Node CoordinateUniquely identifies a node member or spacer on an edge of a crosstab. Used by theCrosstab Intersection object to uniquely identify the intersection of elements fromeach edge. You cannot modify this value.
Applies to
“Crosstab Node Member” on page 790, “Crosstab Space” on page 791, “CrosstabSummary” on page 791
Note BorderSpecifies the properties for the border of a note.
Applies to
“Note” on page 819
NotesSpecifies a block of text that you can position on a chart.
Applies to
“3-D Combination Chart” on page 772, “3-D Scatter Chart” on page 772, “BubbleChart” on page 776, “Combination Chart” on page 785, “Gauge Chart” on page801, “Map” on page 814, “Marimekko Chart” on page 815, “Metrics Range Chart”on page 818, “Pareto Chart” on page 823, “Pie Chart” on page 823, “Polar Chart”on page 825, “Progressive Chart” on page 827, “Radar Chart” on page 828, “ScatterChart” on page 833
NotesSpecifies whether a note is rendered in a chart.
Applies to
“Bubble Chart” on page 777, “Bullet Chart” on page 777, “Combination Chart” onpage 786, “Gauge Chart” on page 800, “Pareto Chart” on page 822, “Pie Chart” onpage 824, “Progressive Chart” on page 826, “Scatter Chart” on page 833
Appendix G. Report Studio Object and Property Reference 917

Note TextSpecifies the text that appears in a note within a chart. To edit the note text, youmust switch to Page Design view (View > Page Design)
Applies to
“Note” on page 819, “Note” on page 819
No Value List ItemSpecifies whether to define a default list item. When the default item is selected,sets the value of the data item in the control to null. By default, the no value itemis the first item in the list.
Applies to
“Data Drop-Down List” on page 794, “Data List Box” on page 795, “Drop-DownList” on page 799, “List Box” on page 809
Number of Minor IntervalsWhen minor gridlines are defined for the chart axis, specifies by how many minorintervals to divide the major intervals. The default value is 2, which shows oneminor gridline between each major gridline.
Applies to
“Category axis” on page 780, “Gauge Axis” on page 800, “Numeric Axis” on page820, “X Axis” on page 843, “Y Axis” on page 844
Number of Minor IntervalsWhen minor gridlines are defined for the chart axis, specifies by how many minorintervals to divide the major intervals. The default value is 2, which shows oneminor gridline between each major gridline.
Applies to
“Cumulation Line” on page 792, “Pareto Bars” on page 822, “Primary Axis” onpage 826, “Primary Bottom Axis” on page 826, “Secondary Axis” on page 834,“Secondary Bottom Axis” on page 834
Number of Regression LinesSpecifies whether there will be one regression line for all the data or one for eachseries.
Applies to
“Regression Line” on page 831
Numbers OnlySpecifies whether the Text Box Prompt allows numbers only.
Applies to
“Text Box Prompt” on page 838
918 IBM Cognos Report Studio Version 10.2.1: User Guide

Number StyleSpecifies the style to use for page numbers.
Applies to
“Page Number” on page 821
Number StyleSpecifies the number style to use for the iterator number.
Applies to
“Iterator Label Area” on page 805
Numerical AxisSpecifies whether the axis is rendered.
Applies to
“3-D Combination Chart” on page 772
Numerical AxisSpecifies whether the numeric axis of a gauge chart is rendered.
Applies to
“Gauge Chart” on page 801
Numeric BaselinesAdds reference lines on the numeric axis of a chart based on numeric or statisticalvalues, calculations, or layout calculations.
Applies to
“Bubble Chart” on page 777, “Combination Chart” on page 786, “NumericBaseline” on page 820, “Pareto Chart” on page 822, “Progressive Chart” on page826, “Scatter Chart” on page 833
Numeric ValueSpecifies the numeric position by using a number.
Applies to
“Baseline” on page 775, “Baseline” on page 775, “Baseline” on page 775, “Baseline”on page 775, “Marker” on page 816
Numeric ValueSpecifies the value of the numeric position.
Applies to
“Marker” on page 816
Appendix G. Report Studio Object and Property Reference 919

Numeric ValueSpecifies the value of the numeric position.
Applies to
“Marker” on page 816
Options TextSpecifies the text for the additional prompt options link in select & search prompts.The default label text is Options.
Applies to
“Select & Search Prompt” on page 834
OrientationSpecifies the orientation of the control.
Applies to
“Button Bar” on page 778, “Check Box Group” on page 784, “Continuous ValuesSlider” on page 787, “Data Button Bar” on page 793, “Data Check Box Group” onpage 793, “Data Discrete Values Slider” on page 794, “Data Iterator” on page 795,“Data Radio Button Group” on page 795, “Data Toggle Button Bar” on page 796,“Discrete Values Slider” on page 798, “Iterator” on page 804, “Radio ButtonGroup” on page 829, “Toggle Button Bar” on page 840
Outer Join AllowedSpecifies whether outer joins are allowed on the object. This property applies to asingle query and overrides the setting in IBM® Cognos® Framework Manager, themodeling tool.
Applies to
“Query” on page 828
Output Aggregation MethodSpecifies the aggregation method.
Applies to
“Crosstab Summary” on page 791, “List Summary” on page 814
Output Aggregation MethodSpecifies the aggregation method.
Applies to
“List Cell” on page 809
920 IBM Cognos Report Studio Version 10.2.1: User Guide

Override Dimension InfoSpecifies dimension information for a query. Add dimension information when thedata source has no dimension information available or when you want to override,extend, or restrict the information.
For more information, see the topic Add Dimension Information to a Query.
Applies to
“Query” on page 828
OverridesSpecifies whether to override child objects. Before you can override child objects,they must have a name.
Applies to
“Layout Component Reference” on page 806
PaddingSpecifies the space between the object and the margin. If there is a border then itspecifies the space between the object and the border.
Applies to
“3-D Combination Chart” on page 772, “3-D Scatter Chart” on page 772, “Block”on page 776, “Bubble Chart” on page 776, “Bubble Chart” on page 777, “BulletChart” on page 777, “Caption” on page 779, “Combination Chart” on page 785,“Combination Chart” on page 786, “Conditional Block” on page 787, “ConditionalBlock” on page 787, “Context Item Text” on page 787, “Crosstab Columns” onpage 788, “Crosstab Columns” on page 788, “Crosstab Corner” on page 789,“Crosstab Fact Cells” on page 789, “Crosstab Intersection” on page 789, “CrosstabMember Fact Cells” on page 790, “Crosstab Node Member” on page 790, “CrosstabRows” on page 790, “Crosstab Rows” on page 791, “Crosstab Space” on page 791,“Crosstab Summary” on page 791, “Gauge Chart” on page 800, “Gauge Chart” onpage 801, “Hyperlink” on page 802, “Hyperlink Button” on page 803, “List Cell”on page 809, “List Column” on page 809, “List Column Body” on page 810, “ListColumns” on page 810, “List Columns” on page 810, “List Columns Body Style”on page 811, “List Columns Title Style” on page 811, “List Column Title” on page811, “List Footer” on page 811, “List Header” on page 812, “List Row” on page813, “List Row Cells Style” on page 813, “List Summary” on page 814, “Map” onpage 814, “Marimekko Chart” on page 815, “Metrics Range Chart” on page 818,“Page Break Text” on page 821, “Pareto Chart” on page 822, “Pareto Chart” onpage 823, “Pie Chart” on page 823, “Pie Chart” on page 824, “Polar Chart” on page825, “Progressive Chart” on page 826, “Progressive Chart” on page 827, “PromptButton” on page 827, “Radar Chart” on page 828, “Repeater Table Cell” on page831, “Repeater Table Cell” on page 832, “Scatter Chart” on page 833, “ScatterChart” on page 833, “Table Cell” on page 837, “Table of Contents” on page 837,“Table of Contents Entry” on page 838, “Text Item” on page 839, “Variable TextItem” on page 842, “Win-Loss Chart” on page 842
PaginationSpecifies pagination rules, such as page breaks, keep-with properties, page counts,and numbering.
Appendix G. Report Studio Object and Property Reference 921

Applies to
“3-D Combination Chart” on page 772, “3-D Scatter Chart” on page 772, “BubbleChart” on page 776, “Bubble Chart” on page 777, “Bullet Chart” on page 777,“Combination Chart” on page 785, “Combination Chart” on page 786, “Crosstab”on page 788, “Crosstab Node Member” on page 790, “Crosstab Space” on page791, “Gauge Chart” on page 800, “Gauge Chart” on page 801, “List” on page 808,“List Column” on page 809, “List Header” on page 812, “Map” on page 814,“Marimekko Chart” on page 815, “Metrics Range Chart” on page 818, “Page” onpage 821, “Page Set” on page 822, “Pareto Chart” on page 822, “Pareto Chart” onpage 823, “Pie Chart” on page 823, “Pie Chart” on page 824, “Polar Chart” on page825, “Progressive Chart” on page 826, “Progressive Chart” on page 827, “RadarChart” on page 828, “Repeater” on page 831, “Repeater Table” on page 831,“Scatter Chart” on page 833, “Scatter Chart” on page 833, “Table” on page 837,“Win-Loss Chart” on page 842
PaletteSpecifies the palette to use for the chart. This property applies only to legacycharts.
Applies to
“3-D Combination Chart” on page 772, “3-D Scatter Chart” on page 772, “BubbleChart” on page 776, “Combination Chart” on page 785, “Gauge Chart” on page801, “Marimekko Chart” on page 815, “Metrics Range Chart” on page 818, “ParetoChart” on page 823, “Pie Chart” on page 823, “Polar Chart” on page 825,“Progressive Chart” on page 827, “Radar Chart” on page 828, “Scatter Chart” onpage 833
PaletteSpecifies the color palette for a chart.
Applies to
“Area” on page 773, “Bar” on page 774, “Bubble Chart” on page 777, “GaugeAxis” on page 800, “Line” on page 808, “Pareto Chart” on page 822, “Pie Chart”on page 824, “Scatter Chart” on page 833
PaletteMap layers use the numeric palette, in which the color of a region or point isbased on its numeric value.
Applies to
“Point Layer” on page 825, “Region Layer” on page 830
ParameterSpecifies the parameter that is satisfied by values chosen in the prompt control.
Applies to
“Date & Time Prompt” on page 796, “Date Prompt” on page 797, “GeneratedPrompt” on page 802, “Interval Prompt” on page 804, “Select & Search Prompt” onpage 834, “Text Box Prompt” on page 838, “Time Prompt” on page 839, “Tree
922 IBM Cognos Report Studio Version 10.2.1: User Guide

Prompt” on page 840, “Value Prompt” on page 841
Pareto AxisSpecifies whether the axis is rendered.
Applies to
“Pareto Chart” on page 823
PDF Page SetupSpecifies the orientation and paper size for PDF documents.
Applies to
“Page” on page 821
Percentage Based OnSpecifies the information that is used to calculate the percentage values.
Applies to
“Percentaged Measure” on page 823
PercentileSpecifies a position based on a data percentile value. This value must be greaterthan zero.
Applies to
“Baseline” on page 775, “Baseline” on page 775, “Baseline” on page 775, “Baseline”on page 775, “Marker” on page 816
PercentileSpecifies a position based on a data percentile value. This value must be greaterthan zero.
Applies to
“Marker” on page 816
PercentileSpecifies a position based on a data percentile value. This value must be greaterthan zero.
Applies to
“Marker” on page 816
Percent of AxisSpecifies a position based on a percentage along the numeric axis. This value mustbe greater than zero.
Appendix G. Report Studio Object and Property Reference 923

Applies to
“Baseline” on page 775, “Baseline” on page 775, “Baseline” on page 775, “Baseline”on page 775, “Marker” on page 816
Percent of AxisSpecifies a position based on a percentage along the numeric axis. This value mustbe greater than zero.
Applies to
“Marker” on page 816
Percent of AxisSpecifies a position based on a percentage along the numeric axis. This value mustbe greater than zero.
Applies to
“Marker” on page 816
Performance PatternControls what portions of the range markers for tolerance and target ranges arerendered on a metrics chart.
Applies to
“Metrics Range Chart” on page 818
Pie LabelsSpecifies whether pie labels are rendered.
Applies to
“Pie Chart” on page 823
Plot Area FillSpecifies the fill color and effects for the plot area of a chart.
Applies to
“Bubble Chart” on page 777, “Combination Chart” on page 786, “Pareto Chart” onpage 822, “Progressive Chart” on page 826, “Scatter Chart” on page 833
Point ShapeSpecifies the shape of the markers. If you choose a value of series or category, themarker shape varies accordingly.
Applies to
“3-D Scatter Chart” on page 772, “Bubble Chart” on page 776, “Polar Chart” onpage 825, “Radar Chart” on page 828, “Scatter Chart” on page 833
924 IBM Cognos Report Studio Version 10.2.1: User Guide

Polynomial ExponentSpecifies the highest exponential value to use in the regression calculation.
Applies to
“Regression Line” on page 831
PositionSpecifies where to position the legend.
Applies to
“Legend” on page 806
PositionSpecifies the position of a note in a chart.
Applies to
“Equation Label” on page 799, “Note” on page 819
Position in ListSpecifies the position of the no list value item in the list.
Applies to
“No Value List Item” on page 819
Position typeSpecifies the source type for the numeric position.
Applies to
“Baseline” on page 775, “Baseline” on page 775, “Baseline” on page 775, “Baseline”on page 775, “Marker” on page 816
Position typeSpecifies the type of numeric position on the X-axis. This property applies only tolegacy charts.
Applies to
“Marker” on page 816
Position typeSpecifies a type of numeric position.
Applies to
“Marker” on page 816
Appendix G. Report Studio Object and Property Reference 925

Positive Column ColorSpecifies the color, gradient, or pattern to be used for columns in the progressivechart that represent positive values.
Applies to
“Progressive Chart” on page 827
Pre-populateSpecifies whether to pre-populate the control with values, but only if the parent ofthis prompt control is optional. This only applies to prompt controls that have aparent in a cascade.
Applies to
“Tree Prompt” on page 840, “Value Prompt” on page 841
Pre-populate LevelsSpecifies the number of levels to pre-populate the prompt with. The default valueis 1, which will pre-populate the prompt with only the root members.
Applies to
“Tree Prompt” on page 840
Pre-SortSorts the data that is used by the query to produce a temporary cube whenneeded, such as for a crosstab against a relational data source. This property affectsthe default order of members of a level populated from the data item.
Applies to
“Data Item” on page 795
ProcessingSpecifies whether the query engine will pick up a minimal amount of processing.Local processing only occurs if the database cannot handle the load. This propertyapplies only to dimensional, or OLAP, data sources.
Specifies whether the IBM® Cognos® report server picks up a minimal amount ofprocessing. This property overrides the corresponding governor in the model. Ifunspecified, the value of the governor in the model is used. This property appliesonly to relational data sources, unless you use the dynamic query mode.
Database only specifies that all query processing is performed on the database, andnone is performed and cached by the IBM Cognos report server. The queryexecutes successfully only if all query operations can be performed by thedatabase.
Limited Local specifies that little, or possibly none, of the query processing isperformed by the Cognos report server. Local processing only occurs if thedatabase cannot handle the query.
926 IBM Cognos Report Studio Version 10.2.1: User Guide

When using the dynamic query mode, this property applies only to SAP BW datasources and the Limited Local option is not supported. Database Only specifiesthat little, or possibly none, of the query processing is performed and cached bythe Cognos report server. Local processing only occurs if the database cannothandle the query. Consider using this option only if your report performance isunacceptable with the default setting, and becomes usable with this setting. Beaware that results may change with this setting; test carefully to confirm that theresults are still correct.
Applies to
“Query” on page 828
Progressive AxisSpecifies whether the axis is rendered.
Applies to
“Progressive Chart” on page 827
Progressive PaletteSpecifies the color palette in a progressive chart.
Applies to
“Progressive Chart” on page 826
Projection ListShows the list of projected data items for the set operation. You can automaticallygenerate the list or manually add data items.
Applies to
“Query Operation” on page 828
PropertiesSpecifies a list of data items from the query in scope to associate to the selectedobject. This is necessary when you want to reference a data item that is in theassociated query, but not used in the layout.
Applies to
“Axis Title” on page 774, “Axis Title” on page 774, “Baseline” on page 775,“Baseline” on page 775, “Baseline” on page 775, “Baseline” on page 775, “CategoryBaseline” on page 781, “Chart Footer” on page 781, “Chart Footer” on page 781,“Chart Node Member” on page 782, “Chart Subtitle” on page 782, “Chart Subtitle”on page 782, “Chart Title” on page 783, “Chart Title” on page 783, “ColoredRegion” on page 785, “Colored Region” on page 785, “Crosstab Node Member” onpage 790, “Cumulation Label” on page 792, “Cumulation Line” on page 792,“Label” on page 806, “Legend Title” on page 807, “Legend Title” on page 807,“List” on page 808, “List Footer” on page 811, “List Header” on page 812,“Marker” on page 816, “Marker” on page 816, “Marker” on page 816, “Note” onpage 819, “Note Content” on page 819, “Numeric Baseline” on page 820, “Page”on page 821, “Page Set” on page 822, “Point Color Legend Title” on page 824,
Appendix G. Report Studio Object and Property Reference 927

“Point Size Legend Title” on page 825, “Region Color Legend Title” on page 830,“Regression Line” on page 831, “Repeater” on page 831, “Repeater Table” on page831, “Scatter Marker” on page 834, “Select & Search Prompt” on page 834,“Singleton” on page 835, “Total Column” on page 840, “Total Column Label” onpage 840, “Trendline Label” on page 841, “Value Prompt” on page 841
PropertySpecifies a reference to a member property. You cannot modify this value.
Applies to
“Member Property” on page 818
Property Unique NameSpecifies the Member Property Unique Name (MPUN) of the member property.
Applies to
“Area” on page 773, “Bar” on page 774, “Category Baseline” on page 781, “ChartNode Member” on page 782, “Chart Text Item” on page 782, “Chart Text Item” onpage 783, “Colored Region” on page 785, “Colored Region” on page 785, “CrosstabCorner” on page 789, “Crosstab Fact Cells” on page 789, “Crosstab Intersection” onpage 789, “Crosstab Member Fact Cells” on page 790, “Crosstab Node Member” onpage 790, “Cumulation Line Label” on page 792, “Gauge Axis” on page 800,“HTML Item” on page 802, “Image” on page 803, “Line” on page 808, “List Cell”on page 809, “List Column Body” on page 810, “List Column Title” on page 811,“Map Location” on page 814, “Map Location” on page 815, “Map RefinementLocation” on page 815, “Map Refinement Location” on page 815, “Marker” onpage 816, “Member Property” on page 818, “Numeric Baseline” on page 820, “RichText Item” on page 832, “Scatter Marker” on page 834, “Text Item” on page 839,“Total Column” on page 840, “Win-Loss Measure” on page 843
Push To BottomSpecifies whether to position the footer as low as possible inside the parent object.
Applies to
“List Footer” on page 811, “List Page Footer” on page 813
QuerySpecifies a reference to a query.
Applies to
“3-D Combination Chart” on page 772, “3-D Scatter Chart” on page 772, “AxisTitle” on page 774, “Axis Title” on page 774, “Baseline” on page 775, “Baseline” onpage 775, “Baseline” on page 775, “Baseline” on page 775, “Bubble Chart” on page776, “Bubble Chart” on page 777, “Bullet Chart” on page 777, “Category Baseline”on page 781, “Chart Footer” on page 781, “Chart Footer” on page 781, “ChartSubtitle” on page 782, “Chart Subtitle” on page 782, “Chart Title” on page 783,“Chart Title” on page 783, “Colored Region” on page 785, “Colored Region” onpage 785, “Combination Chart” on page 785, “Combination Chart” on page 786,“Crosstab” on page 788, “Cumulation Label” on page 792, “Data Button Bar” onpage 793, “Data Check Box Group” on page 793, “Data Container” on page 793,
928 IBM Cognos Report Studio Version 10.2.1: User Guide

“Data Deck” on page 794, “Data Discrete Values Slider” on page 794, “DataDrop-Down List” on page 794, “Data Iterator” on page 795, “Data List Box” onpage 795, “Data Radio Button Group” on page 795, “Data Tab Control” on page796, “Data Toggle Button Bar” on page 796, “Gauge Chart” on page 800, “GaugeChart” on page 801, “Label” on page 806, “Legend Title” on page 807, “LegendTitle” on page 807, “List” on page 808, “Map” on page 814, “Marimekko Chart” onpage 815, “Marker” on page 816, “Marker” on page 816, “Marker” on page 816,“Metrics Range Chart” on page 818, “Note Content” on page 819, “NumericBaseline” on page 820, “Page Set” on page 822, “Pareto Chart” on page 822,“Pareto Chart” on page 823, “Pie Chart” on page 823, “Pie Chart” on page 824,“Point Color Legend Title” on page 824, “Point Size Legend Title” on page 825,“Polar Chart” on page 825, “Progressive Chart” on page 826, “Progressive Chart”on page 827, “Radar Chart” on page 828, “Region Color Legend Title” on page 830,“Repeater” on page 831, “Repeater Table” on page 831, “Scatter Chart” on page833, “Scatter Chart” on page 833, “Scatter Marker” on page 834, “Singleton” onpage 835, “Trendline Label” on page 841, “Win-Loss Chart” on page 842
QuerySpecifies a reference to a query.
Applies to
“Page” on page 821, “Select & Search Prompt” on page 834, “Tree Prompt” onpage 840, “Value Prompt” on page 841
Radar TypeSpecifies how the radar chart is rendered.
Applies to
“Radar Chart” on page 828
Radial AxisSpecifies whether the axis is rendered.
Applies to
“Polar Chart” on page 825, “Radar Chart” on page 828
Radio Buttons DefinitionDefines the buttons in the radio button group.
Applies to
“Radio Button Group” on page 829
RangeSpecifies whether this control accepts ranges. The setting of the associatedparameterized expression for this property will override the setting of this object. Ifyou edit this property but do not get the expected results, check the associatedexpression for the presence or absence of an in_range operator.
Appendix G. Report Studio Object and Property Reference 929

For example, if you created this prompt control with the prompt wizard and set upan associated parameterized filter that accepts ranges, changing the value of thisproperty is not sufficient to change this restriction. You must also edit the filter'sexpression and remove the in_range operator.
To edit a filter expression, you must select the filter, which is accessible from theQuery view, using the Explorer bar.
Applies to
“Date & Time Prompt” on page 796, “Date Prompt” on page 797, “IntervalPrompt” on page 804, “Text Box Prompt” on page 838, “Time Prompt” on page839, “Value Prompt” on page 841
Range LabelSpecifies whether the label for the Target Range will appear in the legend.
Applies to
“Metrics Range Chart” on page 818
Range TypeSpecifies whether to show one or two thumbs and what region of the track tohighlight.
Applies to
“Continuous Values Slider” on page 787, “Data Discrete Values Slider” on page794, “Discrete Values Slider” on page 798
Regression LineSpecifies whether a regression line is rendered. A regression line is a straight orcurved line that best approximates the data points in the series.
Applies to
“Bubble Chart” on page 776, “Scatter Chart” on page 833
Regression TypeSpecifies the type of regression used.
Applies to
“Regression Line” on page 831
Relative AlignmentSpecifies how to vertically align this object, relative to its siblings.
Applies to
“3-D Combination Chart” on page 772, “3-D Scatter Chart” on page 772, “BubbleChart” on page 776, “Bubble Chart” on page 777, “Bullet Chart” on page 777,“Combination Chart” on page 785, “Combination Chart” on page 786, “Context
930 IBM Cognos Report Studio Version 10.2.1: User Guide

Item Text” on page 787, “Crosstab” on page 788, “Date” on page 796, “DatePrompt” on page 797, “Field Set” on page 800, “Gauge Chart” on page 800,“Gauge Chart” on page 801, “Hyperlink” on page 802, “Hyperlink Button” onpage 803, “Image” on page 803, “List” on page 808, “List Summary” on page 814,“Map” on page 814, “Marimekko Chart” on page 815, “Metrics Range Chart” onpage 818, “Page Break Text” on page 821, “Page Number” on page 821, “ParetoChart” on page 822, “Pareto Chart” on page 823, “Pie Chart” on page 823, “PieChart” on page 824, “Polar Chart” on page 825, “Progressive Chart” on page 826,“Progressive Chart” on page 827, “Prompt Button” on page 827, “Radar Chart” onpage 828, “Repeater Table” on page 831, “Row Number” on page 832, “RowNumber” on page 832, “Scatter Chart” on page 833, “Scatter Chart” on page 833,“Static Repeater Table” on page 835, “Table” on page 837, “Text Box Prompt” onpage 838, “Text Item” on page 839, “Time” on page 839, “Value Prompt” on page841, “Variable Text Item” on page 842, “Win-Loss Chart” on page 842
Remove TextSpecifies the label that appears on the button that is used to remove items from theselected items box in all multiple selection prompts. The default label text isRemove.
Applies to
“Date & Time Prompt” on page 796, “Date Prompt” on page 797, “IntervalPrompt” on page 804, “Select & Search Prompt” on page 834, “Text Box Prompt”on page 838, “Time Prompt” on page 839, “Value Prompt” on page 841
RenderFor list reports, specifies whether to render the column in the report output.Whether set to Yes or No, the query for the column is always executed.
Applies to
“List Column” on page 809
Render Fact CellsSpecifies whether to render values in the fact cells of the spacer on an edge of thecrosstab.
Applies to
“Crosstab Space” on page 791
Render Page when EmptySpecifies whether to render a page when data containers on a page contain nodata. If all data containers on a page have this property set to No and do not haveany data to render, the page is not rendered. If any data container on a page hasdata or has this property set to Yes, the page is rendered.
Applies to
“3-D Combination Chart” on page 772, “3-D Scatter Chart” on page 772, “BubbleChart” on page 776, “Bubble Chart” on page 777, “Bullet Chart” on page 777,“Combination Chart” on page 785, “Combination Chart” on page 786, “Crosstab”on page 788, “Gauge Chart” on page 800, “Gauge Chart” on page 801, “List” onpage 808
Appendix G. Report Studio Object and Property Reference 931

page 808, “Map” on page 814, “Marimekko Chart” on page 815, “Metrics RangeChart” on page 818, “Pareto Chart” on page 822, “Pareto Chart” on page 823, “PieChart” on page 823, “Pie Chart” on page 824, “Polar Chart” on page 825,“Progressive Chart” on page 826, “Progressive Chart” on page 827, “Radar Chart”on page 828, “Repeater” on page 831, “Repeater Table” on page 831, “ScatterChart” on page 833, “Scatter Chart” on page 833, “Table of Contents” on page 837,“Win-Loss Chart” on page 842
Render VariableSpecifies a variable based on which the object can be conditionally rendered.
Applies to
“3-D Combination Chart” on page 772, “3-D Scatter Chart” on page 772, “AxisLabels” on page 774, “Axis Title” on page 774, “Block” on page 776, “BubbleChart” on page 776, “Bubble Chart” on page 777, “Bullet Chart” on page 777,“Button” on page 778, “Button Bar” on page 778, “Category Baseline” on page 781,“Chart Footer” on page 781, “Chart Subtitle” on page 782, “Chart Text Item” onpage 783, “Chart Title” on page 783, “Check Box Group” on page 784, “ColoredRegion” on page 785, “Colored Region” on page 785, “Combination Chart” onpage 785, “Combination Chart” on page 786, “Context Item Text” on page 787,“Continuous Values Slider” on page 787, “Crosstab” on page 788, “Data ButtonBar” on page 793, “Data Check Box Group” on page 793, “Data Deck” on page794, “Data Discrete Values Slider” on page 794, “Data Drop-Down List” on page794, “Data Iterator” on page 795, “Data List Box” on page 795, “Data Radio ButtonGroup” on page 795, “Data Tab Control” on page 796, “Data Toggle Button Bar”on page 796, “Date & Time Prompt” on page 796, “Date Prompt” on page 797,“Deck” on page 797, “Discrete Values Slider” on page 798, “Drop-Down List” onpage 799, “Field Set” on page 800, “Gauge Chart” on page 800, “Gauge Chart” onpage 801, “Generated Prompt” on page 802, “HTML Item” on page 802,“Hyperlink” on page 802, “Hyperlink Button” on page 803, “Image” on page 803,“Interval Prompt” on page 804, “Iterator” on page 804, “Label” on page 806,“Legend” on page 807, “Legend Title” on page 807, “List” on page 808, “List Box”on page 809, “List Column” on page 809, “List Summary” on page 814, “Map” onpage 814, “Marimekko Chart” on page 815, “Marker” on page 816, “Metrics RangeChart” on page 818, “Note” on page 819, “Numeric Baseline” on page 820, “Page”on page 821, “Page Break Text” on page 821, “Pareto Chart” on page 822, “ParetoChart” on page 823, “Pie Chart” on page 823, “Pie Chart” on page 824, “PolarChart” on page 825, “Progressive Chart” on page 826, “Progressive Chart” on page827, “Radar Chart” on page 828, “Radio Button Group” on page 829, “Repeater”on page 831, “Repeater Table” on page 831, “Repeater Table Cell” on page 831,“Rich Text Item” on page 832, “Scatter Chart” on page 833, “Scatter Chart” onpage 833, “Scatter Marker” on page 834, “Select & Search Prompt” on page 834,“Singleton” on page 835, “Static Repeater Table” on page 835, “Tab Control” onpage 836, “Table” on page 837, “Table of Contents” on page 837, “Table ofContents Entry” on page 838, “Text Box Prompt” on page 838, “Text Item” on page839, “Time Prompt” on page 839, “Toggle Button Bar” on page 840, “Tree Prompt”on page 840, “Trendline” on page 841, “Value Prompt” on page 841, “Variable TextItem” on page 842, “Visualization” on page 842, “Win-Loss Chart” on page 842
Repeater DirectionSpecifies the direction in which to populate the rendered repeater cells.
932 IBM Cognos Report Studio Version 10.2.1: User Guide

Applies to
“Repeater Table” on page 831, “Static Repeater Table” on page 835
Repeater Table Values DefinitionDefines the data values that can appear in the repeater table. Values are organizedby data item. In addition to the default data item (Label) and values provided, youcan create your own data items and values.
Applies to
“Static Repeater Table” on page 835
Report ExpressionSpecifies the report expression that defines the text to render.
Applies to
“Chart Text Item” on page 782, “Chart Text Item” on page 783, “Cumulation LineLabel” on page 792, “Hyperlink” on page 802, “Hyperlink Button” on page 803,“Text Item” on page 839, “Total Column” on page 840
Report ExpressionSpecifies the report expression used to define the HTML to render.
Applies to
“HTML Item” on page 802, “Rich Text Item” on page 832
Report ExpressionSpecifies the report expression that defines the URL.
Applies to
“Hyperlink” on page 802, “Hyperlink Button” on page 803, “Image” on page 803
Report ExpressionSpecifies the report expression that defines the bookmark. The value used as thebookmark reference must match this value.
Applies to
“Bookmark” on page 776
Report ExpressionSpecifies the numeric position by using a report expression.
Applies to
“Baseline” on page 775, “Baseline” on page 775, “Baseline” on page 775, “Baseline”on page 775, “Marker” on page 816
Appendix G. Report Studio Object and Property Reference 933

Report ExpressionSpecifies the report expression for the member position.
Applies to
“Baseline” on page 775, “Marker” on page 816
Report ExpressionSpecifies a report expression.
Applies to
“As of Time Expression” on page 773
Report ExpressionSpecifies the expression to evaluate when determining the value for this variable.
Applies to
“Variable” on page 842
Report ExpressionSpecifies the numeric position from a report expression.
Applies to
“Marker” on page 816
Report ExpressionSpecifies the numeric position from a report expression.
Applies to
“Marker” on page 816
RequiredSpecifies whether the prompt is required or optional. If this property is set torequired, the prompt must have a value entered before the report can be run. TheUsage setting of the associated parameterized filter for this property will overridethe setting of this object. If you edit this property, but do not get the expectedresults, verify the Usage setting of the associated filter.
For example, if you created this prompt control with the prompt wizard and setthe associated parameterized filter to be optional, changing the value of thisproperty is not sufficient to change this setting. You must also edit the filter'sRequired property to match the setting for this object's Required property.
To edit a filter expression, you must select the filter, which is accessible from theQuery view, using the Explorer bar
934 IBM Cognos Report Studio Version 10.2.1: User Guide

Applies to
“Date & Time Prompt” on page 796, “Date Prompt” on page 797, “GeneratedPrompt” on page 802, “Interval Prompt” on page 804, “Select & Search Prompt” onpage 834, “Text Box Prompt” on page 838, “Time Prompt” on page 839, “TreePrompt” on page 840, “Value Prompt” on page 841
Results Deselect All TextSpecifies the text for the link below the results box that deselects all the items inthe box. This property applies to all prompts with multiple selections and search,tree prompts, and value prompts. The default link text is Deselect All.
Applies to
“Select & Search Prompt” on page 834, “Tree Prompt” on page 840, “ValuePrompt” on page 841
Results Select All TextSpecifies the text for the link below the results box that selects all the items in thebox. This property applies to all prompts with multiple selections and search, treeprompts, and value prompts. The default link text is Select All.
Applies to
“Select & Search Prompt” on page 834, “Tree Prompt” on page 840, “ValuePrompt” on page 841
Results TextSpecifies the title that appears above the results box in select & search prompts.The default title text is Results.
Applies to
“Select & Search Prompt” on page 834
Reverse Category OrderSpecifies whether to change the order of the categories, such as the bars in a barchart. The default is No, which means that for a horizontal bar chart, bars startfrom the bottom to the top.
Applies to
“Category axis” on page 780
Right PositionSpecifies the position of the right edge of the colored region.
Applies to
“Colored Region” on page 785
Appendix G. Report Studio Object and Property Reference 935

Right Position (px)Specifies the pixel position of the right edge of the legend measured from the leftedge of the chart.
Applies to
“Legend” on page 806
Rollup Aggregate FunctionSpecifies the type of aggregation to apply to summarized values. These valuesappear at the higher levels of lists and crosstabs. For OLAP data sources, a rollupaggregate function of Count Distinct is supported for only levels and member sets.
Applies to
“Area” on page 773, “Bar” on page 774, “Category Baseline” on page 781, “ChartNode Member” on page 782, “Chart Text Item” on page 782, “Chart Text Item” onpage 783, “Colored Region” on page 785, “Colored Region” on page 785, “CrosstabCorner” on page 789, “Crosstab Fact Cells” on page 789, “Crosstab Intersection” onpage 789, “Crosstab Member Fact Cells” on page 790, “Crosstab Node Member” onpage 790, “Cumulation Line Label” on page 792, “Data Item” on page 795, “GaugeAxis” on page 800, “HTML Item” on page 802, “Image” on page 803, “Line” onpage 808, “List Cell” on page 809, “List Column Body” on page 810, “List ColumnTitle” on page 811, “Map Location” on page 814, “Map Location” on page 815,“Map Refinement Location” on page 815, “Map Refinement Location” on page 815,“Marker” on page 816, “Numeric Baseline” on page 820, “Rich Text Item” on page832, “Scatter Marker” on page 834, “Text Item” on page 839, “Total Column” onpage 840, “Win-Loss Measure” on page 843
Rollup MethodSpecifies the aggregation method to use to summarize data in the visualizationwhen users select multiple values in an Active Report control, such as a check boxcontrol.
Applies to
“Value” on page 841
Rollup ProcessingSpecifies where to compute aggregates. The Extended setting means thataggregates are computed using an extended aggregate operation. The Databasesetting means that aggregates are computed by the database software. The Localsetting means that aggregates are computed by the data retrieval software in thereport server, using a running aggregate.
Applies to
“Query” on page 828
Root Members OnlySpecifies whether the set contains the root members or all of the members of thehierarchy.
936 IBM Cognos Report Studio Version 10.2.1: User Guide

Applies to
“Area” on page 773, “Bar” on page 774, “Category Baseline” on page 781, “ChartNode Member” on page 782, “Chart Text Item” on page 782, “Chart Text Item” onpage 783, “Colored Region” on page 785, “Colored Region” on page 785, “CrosstabCorner” on page 789, “Crosstab Fact Cells” on page 789, “Crosstab Intersection” onpage 789, “Crosstab Member Fact Cells” on page 790, “Crosstab Node Member” onpage 790, “Cumulation Line Label” on page 792, “Gauge Axis” on page 800,“Hierarchy Set” on page 802, “HTML Item” on page 802, “Image” on page 803,“Line” on page 808, “List Cell” on page 809, “List Column Body” on page 810,“List Column Title” on page 811, “Map Location” on page 814, “Map Location” onpage 815, “Map Refinement Location” on page 815, “Map Refinement Location” onpage 815, “Marker” on page 816, “Numeric Baseline” on page 820, “Rich TextItem” on page 832, “Scatter Marker” on page 834, “Text Item” on page 839, “TotalColumn” on page 840, “Win-Loss Measure” on page 843
Rotate ValuesControls whether or not the values displayed on the chart are rotated when theChart Orientation property is set to Horizontal. May help make values easier toread on horizontal charts. This property applies only to legacy charts.
Applies to
“Combination Chart” on page 785, “Pareto Chart” on page 823, “ProgressiveChart” on page 827
Row CoordinateUniquely identifies the row of a node member or spacer on an edge of thecrosstab. You cannot modify this value.
Applies to
“Crosstab Intersection” on page 789
Rows Per PageSpecifies the maximum number of rows to show at one time. For Value and Select& Search prompts, allows you to extend or reduce the maximum number of rowsbeyond the default of 5000.
Applies to
“Crosstab” on page 788, “List” on page 808, “Repeater” on page 831, “Select &Search Prompt” on page 834, “Tree Prompt” on page 840, “Value Prompt” on page841
ScaleSpecifies whether the numeric scale is logarithmic or linear.
Applies to
“Angular Axis” on page 773, “Gauge Numerical Axis” on page 801, “NumericalAxis” on page 820, “Numerical Axis” on page 820, “Radial Axis” on page 829, “XAxis” on page 843, “Y1 Axis” on page 844, “Y2 Axis” on page 844, “Y Axis” onpage 844, “Z Axis” on page 845, “Z Axis” on page 845
Appendix G. Report Studio Object and Property Reference 937

Scale IntervalSpecifies the interval between ticks on the numeric scale. If no value is specified,one will be calculated based on the data.
Applies to
“Angular Axis” on page 773, “Cumulation Line Axis” on page 792, “GaugeNumerical Axis” on page 801, “Numerical Axis” on page 820, “Numerical Axis” onpage 820, “Radial Axis” on page 829, “X Axis” on page 843, “Y1 Axis” on page844, “Y2 Axis” on page 844, “Y Axis” on page 844, “Z Axis” on page 845, “Z Axis”on page 845
ScopeSpecifies the scope of the filter in terms of the number of levels.
Applies to
“Summary Filter” on page 836
Search Instructions TextSpecifies the instructions that appear above the keyword search box in select &search prompts. The default text is as follows: Type one or more keywordsseparated by spaces.
Applies to
“Select & Search Prompt” on page 834
Search TextSpecifies the label that appears on the Search button in select & search prompts.The default label text is Search.
Applies to
“Select & Search Prompt” on page 834
Seconds TextSpecifies the title that appears above the seconds box in interval prompts. Thedefault title text is s.
Applies to
“Interval Prompt” on page 804
Select UISpecifies the user interface to use for the button in the iterator.
Applies to
“Iterator First” on page 805, “Iterator Last” on page 805, “Iterator Next” on page805, “Iterator Previous” on page 805
938 IBM Cognos Report Studio Version 10.2.1: User Guide

Select UISpecifies the user interface to use for the labels of iterator values.
Applies to
“Iterator Label Area” on page 805
Select UISpecifies which interface the prompt control renders.
Applies to
“Value Prompt” on page 841
Select UISpecifies which interface the prompt control renders.
Applies to
“Date Prompt” on page 797
Select UISpecifies which interface the prompt control renders.
Applies to
“Time Prompt” on page 839
Select UISpecifies which interface the prompt control renders.
Applies to
“Date & Time Prompt” on page 796
SeparatorSpecifies the separator to use when showing multiple values.
Applies to
“Context Item Text” on page 787, “Legend” on page 806
Series ColorSpecifies whether data marker colors are synchronized between charts when youuse the same data series for multiple charts within a combination chart. Forexample, if you create a line chart and a bar chart using the years data series, andyou set this property to Yes, the data marker for 2010 is the same color in bothcharts. Use this property to eliminate redundant legend entries and help youinterpret the data.
Appendix G. Report Studio Object and Property Reference 939

Applies to
“3-D Combination Chart” on page 772, “Combination Chart” on page 785,“Combination Chart” on page 786
Series TypeSpecifies how the series will be rendered; for example, absolute, stacked, or stacked100%.
Applies to
“Area” on page 773, “Bar” on page 774, “Line” on page 808
Set DefinitionSpecifies a set of members.
Applies to
“Area” on page 773, “Bar” on page 774, “Category Baseline” on page 781, “ChartNode Member” on page 782, “Chart Text Item” on page 782, “Chart Text Item” onpage 783, “Colored Region” on page 785, “Colored Region” on page 785, “CrosstabCorner” on page 789, “Crosstab Fact Cells” on page 789, “Crosstab Intersection” onpage 789, “Crosstab Member Fact Cells” on page 790, “Crosstab Node Member” onpage 790, “Cumulation Line Label” on page 792, “Gauge Axis” on page 800,“HTML Item” on page 802, “Image” on page 803, “Line” on page 808, “List Cell”on page 809, “List Column Body” on page 810, “List Column Title” on page 811,“Map Location” on page 814, “Map Location” on page 815, “Map RefinementLocation” on page 815, “Map Refinement Location” on page 815, “Marker” onpage 816, “Numeric Baseline” on page 820, “Rich Text Item” on page 832, “ScatterMarker” on page 834, “Text Item” on page 839, “Total Column” on page 840,“Win-Loss Measure” on page 843
Set OperationSpecifies the set operation to apply to one or more queries, that results in aprojection list on which other queries can be based.
Applies to
“Query Operation” on page 828
Set SortingSpecifies how the set is sorted. By default, the set is not sorted.
Applies to
“Area” on page 773, “Bar” on page 774, “Category Baseline” on page 781, “ChartNode Member” on page 782, “Chart Text Item” on page 782, “Chart Text Item” onpage 783, “Colored Region” on page 785, “Colored Region” on page 785, “CrosstabCorner” on page 789, “Crosstab Fact Cells” on page 789, “Crosstab Intersection” onpage 789, “Crosstab Member Fact Cells” on page 790, “Crosstab Node Member” onpage 790, “Cumulation Line Label” on page 792, “Explicit Member Set” on page799, “Gauge Axis” on page 800, “Hierarchy Set” on page 802, “HTML Item” onpage 802, “Image” on page 803, “Level Set” on page 808, “Line” on page 808, “ListCell” on page 809, “List Column Body” on page 810, “List Column Title” on page811
940 IBM Cognos Report Studio Version 10.2.1: User Guide

811, “Map Location” on page 814, “Map Location” on page 815, “Map RefinementLocation” on page 815, “Map Refinement Location” on page 815, “Marker” onpage 816, “Member Children Set” on page 817, “Named Set” on page 819,“Numeric Baseline” on page 820, “Rich Text Item” on page 832, “Scatter Marker”on page 834, “Set Expression” on page 835, “Text Item” on page 839, “TotalColumn” on page 840, “Win-Loss Measure” on page 843
Set Variable ValuesSets the value of variables when the control or an item in the control is selected.
Applies to
“3-D Combination Chart” on page 772, “3-D Scatter Chart” on page 772, “BubbleChart” on page 776, “Bubble Chart” on page 777, “Bullet Chart” on page 777,“Button” on page 778, “Button Bar” on page 778, “Check Box Group” on page 784,“Combination Chart” on page 785, “Combination Chart” on page 786, “ContinuousValues Slider” on page 787, “Crosstab” on page 788, “Data Button Bar” on page793, “Data Check Box Group” on page 793, “Data Container” on page 793, “DataDeck” on page 794, “Data Discrete Values Slider” on page 794, “Data Drop-DownList” on page 794, “Data Iterator” on page 795, “Data List Box” on page 795, “DataRadio Button Group” on page 795, “Data Tab Control” on page 796, “Data ToggleButton Bar” on page 796, “Deck” on page 797, “Discrete Values Slider” on page798, “Drop-Down List” on page 799, “Gauge Chart” on page 800, “Gauge Chart”on page 801, “Iterator” on page 804, “List” on page 808, “List Box” on page 809,“Map” on page 814, “Marimekko Chart” on page 815, “Metrics Range Chart” onpage 818, “Pareto Chart” on page 822, “Pareto Chart” on page 823, “Pie Chart” onpage 823, “Pie Chart” on page 824, “Polar Chart” on page 825, “Progressive Chart”on page 826, “Progressive Chart” on page 827, “Radar Chart” on page 828, “RadioButton Group” on page 829, “Repeater Table” on page 831, “Scatter Chart” on page833, “Scatter Chart” on page 833, “Static Repeater Table” on page 835, “TabControl” on page 836, “Toggle Button Bar” on page 840
Share Result SetSpecifies whether to share an identical query between data containers that use it.To share a query, data containers must be lists, repeaters, or repeater tables andmust use the same grouping structure and list of properties. The data containerscannot be part of a master detail relationship. When set to Yes, the query sendsonly one request to the database and shares the result. When set to No, the queryis not shared.
Applies to
“List” on page 808, “Repeater” on page 831, “Repeater Table” on page 831
SharingThe properties that enable the set to be shared.
Applies to
Show CaptionSpecifies whether, or where, to show the caption.
Appendix G. Report Studio Object and Property Reference 941

Applies to
“Field Set” on page 800
Show Data PointsSpecifies whether to show value markers and how they are formatted.
Applies to
“Line” on page 808
Show Data Range in LegendSpecifies whether to show the full range of data in the legend. If set to No, onlythe values from the palette will be shown.
Applies to
“Point Layer” on page 825, “Region Layer” on page 830
Show Features with No DataIndicates whether to show the features of a map that do not have correspondingdata.
Applies to
“Point Layer” on page 825, “Region Layer” on page 830
Show FeelersSpecifies whether feeler lines are rendered for each marker.
Applies to
“3-D Scatter Chart” on page 772
Show HoverSpecifies whether to highlight areas in the data container that are clickable.
Applies to
“3-D Combination Chart” on page 772, “3-D Scatter Chart” on page 772, “BubbleChart” on page 776, “Bubble Chart” on page 777, “Bullet Chart” on page 777,“Combination Chart” on page 785, “Combination Chart” on page 786, “Crosstab”on page 788, “Data Container” on page 793, “Gauge Chart” on page 800, “GaugeChart” on page 801, “List” on page 808, “Map” on page 814, “Marimekko Chart”on page 815, “Metrics Range Chart” on page 818, “Pareto Chart” on page 822,“Pareto Chart” on page 823, “Pie Chart” on page 823, “Pie Chart” on page 824,“Polar Chart” on page 825, “Progressive Chart” on page 826, “Progressive Chart”on page 827, “Radar Chart” on page 828, “Repeater Table” on page 831, “ScatterChart” on page 833, “Scatter Chart” on page 833, “Static Repeater Table” on page835
942 IBM Cognos Report Studio Version 10.2.1: User Guide

Show IconWhen defined, specifies whether to show the icon for each list item in thedrop-down list.
Applies to
“Data Drop-Down List” on page 794, “Drop-Down List” on page 799
Show IconSpecifies whether to show the icon for the current label.
Applies to
“Iterator Label Area” on page 805
Show LabelsSpecifies whether labels are rendered for the display layer in a map.
Applies to
“Display Layer” on page 798
Show Legend ValuesSpecifies whether and how to show legend values.
Applies to
“Legend” on page 806
Show lineSpecifies whether a line may be rendered. This allows you to show markerswithout lines.
Applies to
“Line” on page 808
Show Pointer CursorSpecifies whether to show the pointer cursor as a hand when hovering over anarea that is clickable. You can set the value of this property for multiple objectssimultaneously by first control+clicking the items in the report.
Applies to
“3-D Combination Chart” on page 772, “3-D Scatter Chart” on page 772, “BubbleChart” on page 776, “Bubble Chart” on page 777, “Bullet Chart” on page 777,“Combination Chart” on page 785, “Combination Chart” on page 786, “Crosstab”on page 788, “Gauge Chart” on page 800, “Gauge Chart” on page 801, “List” onpage 808, “Map” on page 814, “Marimekko Chart” on page 815, “Metrics RangeChart” on page 818, “Pareto Chart” on page 822, “Pareto Chart” on page 823, “PieChart” on page 823, “Pie Chart” on page 824, “Polar Chart” on page 825,“Progressive Chart” on page 826, “Progressive Chart” on page 827, “Radar Chart”on page 828, “Repeater Table” on page 831, “Scatter Chart” on page 833, “Scatter
Appendix G. Report Studio Object and Property Reference 943

Chart” on page 833, “Static Repeater Table” on page 835
Show TooltipSpecifies whether to show tooltips of the slider values when the thumb is clickedor moved.
Applies to
“Continuous Values Slider” on page 787, “Data Discrete Values Slider” on page794, “Discrete Values Slider” on page 798
Show ValuesSpecifies which values to show in a chart legend.
Applies to
“Legend” on page 807
Show ValuesSpecifies whether values and labels are rendered for the region or point layer in amap.
Applies to
“Point Layer” on page 825, “Region Layer” on page 830
Show ValuesSpecifies the appearance of data labels in area, bar, line, Pareto, and progressivecharts.
Applies to
“Area” on page 773, “Bar” on page 774, “Line” on page 808, “Pareto Chart” onpage 822, “Progressive Chart” on page 826
Show ValuesSpecifies whether to show the labels for the data markers on the cumulation line ina Pareto chart.
Applies to
“Cumulation Line” on page 792
Show ValuesSpecifies the appearance of data labels in a pie chart.
Applies to
“Pie Chart” on page 824
Show ValuesSpecifies the appearance of data labels in a scatter chart.
944 IBM Cognos Report Studio Version 10.2.1: User Guide
Applies to
“Scatter Chart” on page 833
Show ValuesSpecifies the appearance of data labels in a bubble chart.
Applies to
“Bubble Chart” on page 777
SizeSpecifies the height and width of the control.
Applies to
“Button” on page 778, “Data Deck” on page 794, “Data Drop-Down List” on page794, “Data List Box” on page 795, “Data Tab Control” on page 796, “Deck” on page797, “Drop-Down List” on page 799, “List Box” on page 809, “Tab Control” onpage 836
Size & OverflowSpecifies the height and width of the object, as well as how overflow contentshould be treated, using scroll bars and clipping.
Applies to
“Block” on page 776, “Conditional Block” on page 787, “Conditional Block” onpage 787, “Context Item Text” on page 787, “Crosstab” on page 788, “CrosstabColumns” on page 788, “Crosstab Columns” on page 788, “Crosstab Corner” onpage 789, “Crosstab Fact Cells” on page 789, “Crosstab Intersection” on page 789,“Crosstab Member Fact Cells” on page 790, “Crosstab Node Member” on page 790,“Crosstab Rows” on page 790, “Crosstab Rows” on page 791, “Crosstab Space” onpage 791, “Crosstab Summary” on page 791, “Field Set” on page 800, “Hyperlink”on page 802, “Hyperlink Button” on page 803, “Image” on page 803, “List” onpage 808, “List Cell” on page 809, “List Column” on page 809, “List ColumnBody” on page 810, “List Columns” on page 810, “List Columns” on page 810,“List Columns Body Style” on page 811, “List Columns Title Style” on page 811,“List Column Title” on page 811, “List Footer” on page 811, “List Header” on page812, “List Row” on page 813, “List Row Cells Style” on page 813, “List Summary”on page 814, “Note” on page 819, “Page” on page 821, “Page Body” on page 821,“Page Break Text” on page 821, “Page Footer” on page 821, “Page Header” onpage 821, “Prompt Button” on page 827, “Repeater Table” on page 831, “RepeaterTable Cell” on page 831, “Repeater Table Cell” on page 832, “Static Repeater Table”on page 835, “Table” on page 837, “Table Cell” on page 837, “Table of Contents”on page 837, “Table of Contents Entry” on page 838, “Text Box Prompt” on page838, “Text Item” on page 839, “Tree Prompt” on page 840, “Value Prompt” on page841, “Variable Text Item” on page 842, “Win-Loss Chart” on page 842
Size & OverflowSpecifies the absolute height and width of the object, as well as how overflowcontent should be treated, using scroll bars and clipping.
Appendix G. Report Studio Object and Property Reference 945

Applies to
“3-D Combination Chart” on page 772, “3-D Scatter Chart” on page 772, “BubbleChart” on page 776, “Bubble Chart” on page 777, “Bullet Chart” on page 777,“Combination Chart” on page 785, “Combination Chart” on page 786, “GaugeChart” on page 800, “Gauge Chart” on page 801, “Map” on page 814, “MarimekkoChart” on page 815, “Metrics Range Chart” on page 818, “Pareto Chart” on page822, “Pareto Chart” on page 823, “Pie Chart” on page 823, “Pie Chart” on page824, “Polar Chart” on page 825, “Progressive Chart” on page 826, “ProgressiveChart” on page 827, “Radar Chart” on page 828, “Scatter Chart” on page 833,“Scatter Chart” on page 833
Size Legend TitleSpecifies a title within the legend above the palette for the point size. If this objectis not defined, no additional title is drawn. If no legend is drawn, this object isignored. Styling for this object is inherited from the legend title.
Applies to
“Point Layer” on page 825
Slice DirectionSpecifies the direction in which slices appear in a pie chart.
Applies to
“Pie Chart” on page 824
Slide Animation DirectionSpecifies the direction from which a new card appears. Select Auto Horizontal orAuto Vertical to automatically set the direction based on the order of cards in thedeck. For example, when Auto Horizontal is specified, if you view the first card ina deck and you select to view the fourth card, the fourth card appears from theright. If you then select to view the first card, the first card appears from the left.
Applies to
“Data Deck” on page 794, “Deck” on page 797
Slider Values DefinitionDefines the values of the slider.
Applies to
“Discrete Values Slider” on page 798
Solve OrderSpecifies the solve order in the crosstab. The item with the lowest solve ordervalue is calculated first, followed by the next lowest value, and so on. For identicalvalues, column items are calculated first, then row items, and then the measure.
946 IBM Cognos Report Studio Version 10.2.1: User Guide

Applies to
“Crosstab Summary” on page 791
Solve OrderSpecifies the solve order in crosstabs and charts. The item with the lowest solveorder value is calculated first, followed by the next lowest value, and so on. Foridentical values, in crosstabs, column items are calculated first, then row items, andthen the measure. In charts, x-axis items are calculated first and then legend items.
Applies to
“Calculated Measure” on page 779, “Calculated Member” on page 779, “DataItem” on page 795, “Dimensional Edge Summary” on page 798, “Edge Summary”on page 799
SortingSpecifies the desired sort sequence.
Applies to
“Chart Node Member” on page 782, “Crosstab Node Member” on page 790, “DataButton Bar” on page 793, “Data Check Box Group” on page 793, “Data Deck” onpage 794, “Data Discrete Values Slider” on page 794, “Data Drop-Down List” onpage 794, “Data Iterator” on page 795, “Data List Box” on page 795, “Data RadioButton Group” on page 795, “Data Tab Control” on page 796, “Data Toggle ButtonBar” on page 796, “Level” on page 807, “Node” on page 819, “Select & SearchPrompt” on page 834, “Tree Prompt” on page 840, “Value Prompt” on page 841
Source TypeSpecifies the source type of the text.
Applies to
“Chart Text Item” on page 782, “Chart Text Item” on page 783, “Cumulation LineLabel” on page 792, “Hyperlink” on page 802, “Hyperlink Button” on page 803,“Text Item” on page 839
Source TypeSpecifies the source type of the HTML text.
Applies to
“HTML Item” on page 802, “Rich Text Item” on page 832
Source TypeSpecifies the source type of the URL.
Applies to
“Hyperlink” on page 802, “Hyperlink Button” on page 803, “Image” on page 803
Appendix G. Report Studio Object and Property Reference 947

Source TypeSpecifies the source type of the bookmark.
Applies to
“Bookmark” on page 776
Spacing & BreakingSpecifies text properties such as line height, letter spacing, and word breaking.
Applies to
“Block” on page 776, “Conditional Block” on page 787, “Conditional Block” onpage 787, “Context Item Text” on page 787, “Crosstab Columns” on page 788,“Crosstab Columns” on page 788, “Crosstab Corner” on page 789, “Crosstab FactCells” on page 789, “Crosstab Intersection” on page 789, “Crosstab Member FactCells” on page 790, “Crosstab Node Member” on page 790, “Crosstab Rows” onpage 790, “Crosstab Rows” on page 791, “Crosstab Space” on page 791, “CrosstabSummary” on page 791, “Hyperlink” on page 802, “List Cell” on page 809, “ListColumn” on page 809, “List Column Body” on page 810, “List Columns” on page810, “List Columns” on page 810, “List Columns Body Style” on page 811, “ListColumns Title Style” on page 811, “List Column Title” on page 811, “List Footer”on page 811, “List Header” on page 812, “List Row” on page 813, “List Row CellsStyle” on page 813, “List Summary” on page 814, “Page Break Text” on page 821,“Repeater Table Cell” on page 831, “Repeater Table Cell” on page 832, “Table Cell”on page 837, “Table of Contents” on page 837, “Table of Contents Entry” on page838, “Text Item” on page 839, “Variable Text Item” on page 842
Spider EffectsSpecifies whether the chart is rendered with web-like flat concentric circles. TheRadial Axis property must be set to Show for this property to take effect.
Applies to
“Polar Chart” on page 825, “Radar Chart” on page 828
SQLThe text of the typed-in SQL. It is assumed to be appropriate for the type and datasource. If it is not the query may fail, or produce unexpected results.
Applies to
“SQL” on page 835
SQL Join SyntaxControls the syntax to generate for joins. Click Implicit to generate joins in theWHERE clause. Click Explicit to generate INNER JOIN syntax. If unspecified, thevalue of the corresponding governor in the model is used.
Applies to
“Query” on page 828
948 IBM Cognos Report Studio Version 10.2.1: User Guide

SQL SyntaxSpecifies the syntax of the SQL in the query. A value of Cognos SQL indicates thatIBM® Cognos® extended SQL-92 syntax is used. A value of Native SQL indicatesthat native database SQL is used. You cannot use IBM Cognos SQL if theProcessing property for the query is set to Database Only; it must have a value ofLimited Local. A value of Pass-Through indicates that a standalone query textsyntax is used. The default value is Native SQL.
Applies to
“SQL” on page 835
Standard DeviationsSpecifies a distance from the mean in standard deviations. This value can bepositive or negative. A value of zero indicates the mean value.
Applies to
“Baseline” on page 775, “Baseline” on page 775, “Baseline” on page 775, “Baseline”on page 775, “Marker” on page 816
Standard DeviationsSpecifies a distance from the mean in standard deviations. This value can bepositive or negative. A value of zero indicates the mean value.
Applies to
“Marker” on page 816
Standard DeviationsSpecifies a distance from the mean in standard deviations. This value can bepositive or negative. A value of zero indicates the mean value.
Applies to
“Marker” on page 816
Start PositionSpecifies the position of one edge of the colored region along the numeric axis. Theregion extends from the position defined in this property to the position defined inthe End Position property. The value that you specify in this property must be lessthan the value that is specified in the End Position property.
Applies to
“Colored Region” on page 785
Static ChoicesRepresents a collection of static choices used by the prompt object.
Applies to
“Select & Search Prompt” on page 834, “Value Prompt” on page 841
Appendix G. Report Studio Object and Property Reference 949

StepSpecifies at which intervals the thumb can come to a rest.
Applies to
“Continuous Values Slider” on page 787
Style VariableSpecifies a variable based on which the object can be conditionally styled.
Applies to
“Angular Measure” on page 773, “Axis Title” on page 774, “Block” on page 776,“Bubble Measure” on page 777, “Caption” on page 779, “Chart Body” on page 781,“Chart Footer” on page 781, “Chart Subtitle” on page 782, “Chart Text Item” onpage 782, “Chart Title” on page 783, “Conditional Block” on page 787,“Conditional Block” on page 787, “Context Item Text” on page 787, “Crosstab” onpage 788, “Crosstab Columns” on page 788, “Crosstab Columns” on page 788,“Crosstab Corner” on page 789, “Crosstab Fact Cells” on page 789, “CrosstabIntersection” on page 789, “Crosstab Member Fact Cells” on page 790, “CrosstabNode Member” on page 790, “Crosstab Rows” on page 790, “Crosstab Rows” onpage 791, “Crosstab Space” on page 791, “Crosstab Summary” on page 791,“Cumulation Line Axis” on page 792, “Date & Time Prompt” on page 796, “DatePrompt” on page 797, “Default Measure” on page 797, “Display Layer” on page798, “Field Set” on page 800, “Gauge Labels” on page 801, “Gauge NumericalAxis” on page 801, “Hyperlink” on page 802, “Hyperlink Button” on page 803,“Image” on page 803, “Interval Prompt” on page 804, “Legend” on page 806,“Legend Title” on page 807, “List” on page 808, “List Cell” on page 809, “ListColumn” on page 809, “List Column Body” on page 810, “List Columns” on page810, “List Columns” on page 810, “List Columns Body Style” on page 811, “ListColumns Title Style” on page 811, “List Column Title” on page 811, “List Footer”on page 811, “List Header” on page 812, “List Row” on page 813, “List Row CellsStyle” on page 813, “List Summary” on page 814, “Note Content” on page 819,“Page” on page 821, “Page Break Text” on page 821, “Pie Labels” on page 824,“Point Layer” on page 825, “Point Measure” on page 825, “Point Size Measure” onpage 825, “Prompt Button” on page 827, “Radial Measure” on page 829, “RegionLayer” on page 830, “Region Measure” on page 830, “Repeater Table” on page 831,“Repeater Table Cell” on page 831, “Repeater Table Cell” on page 832, “Select &Search Prompt” on page 834, “Static Repeater Table” on page 835, “Table” on page837, “Table Cell” on page 837, “Table of Contents” on page 837, “Table of ContentsEntry” on page 838, “Table Row” on page 838, “Target Measure” on page 838,“Text Box Prompt” on page 838, “Text Item” on page 839, “Time Prompt” on page839, “Tolerance Measure” on page 840, “Tree Prompt” on page 840, “ValuePrompt” on page 841, “Win-Loss Chart” on page 842, “X Axis Measure” on page844, “Y Axis Measure” on page 845, “Z Axis Measure” on page 845
SubtitleSpecifies whether a chart subtitle is rendered. This property applies only to legacycharts.
Applies to
“Win-Loss Chart” on page 842
950 IBM Cognos Report Studio Version 10.2.1: User Guide

SubtitleSpecifies whether a chart subtitle is rendered.
Applies to
Summarize Small ItemsSpecifies whether to summarize small items, such as slices, lines, areas, bars, orcolumns, in the chart and how they are summarized. You cannot summarize smallitems in charts that have matrix edges or in charts that have multiple numericaxes.
Applies to
“Combination Chart” on page 786, “Pareto Chart” on page 822
Summarize Small SlicesSpecifies whether to summarize small items, such as slices, lines, areas, bars, orcolumns, in the chart and how they are summarized. You cannot summarize smallitems in charts that have matrix edges or in charts that have multiple numericaxes.
Applies to
“Pie Chart” on page 824
Summary TextSpecifies summary text for table-like objects. Use to make your reports accessiblefor people who use screen readers. The summary text is never displayed in visualWeb browsers. Summary text is used only for screen readers and speech browsers.Set this property only on tables that are used to display data, and not on tablesthat are used for layout purposes. To have a table object function as a data table,ensure that one or more of its cells have the Table Header property set to Yes.
Applies to
“Crosstab” on page 788, “List” on page 808, “Repeater Table” on page 831, “Table”on page 837
SuppressSpecifies the type of suppression to apply to the query results. This propertyoverrides the corresponding SAP BW governor in the model. If unspecified, thevalue of the governor in the model is used.
When using compatible query mode, this property applies to Essbase, SAP BW,and MSAS data sources. When using dynamic query mode, this property appliesto all OLAP data sources, including OLAP over relational (DMR).
Applies to
“Query” on page 828
SuppressionSpecifies zero suppression options for the object.
Appendix G. Report Studio Object and Property Reference 951

Applies to
“3-D Combination Chart” on page 772, “3-D Scatter Chart” on page 772, “BubbleChart” on page 776, “Bubble Chart” on page 777, “Bullet Chart” on page 777,“Combination Chart” on page 785, “Combination Chart” on page 786, “Crosstab”on page 788, “Data Button Bar” on page 793, “Data Check Box Group” on page793, “Data Deck” on page 794, “Data Discrete Values Slider” on page 794, “DataDrop-Down List” on page 794, “Data Iterator” on page 795, “Data List Box” onpage 795, “Data Radio Button Group” on page 795, “Data Tab Control” on page796, “Data Toggle Button Bar” on page 796, “Gauge Chart” on page 800, “GaugeChart” on page 801, “List” on page 808, “Map” on page 814, “Marimekko Chart”on page 815, “Metrics Range Chart” on page 818, “Pareto Chart” on page 822,“Pareto Chart” on page 823, “Pie Chart” on page 823, “Pie Chart” on page 824,“Polar Chart” on page 825, “Progressive Chart” on page 826, “Progressive Chart”on page 827, “Radar Chart” on page 828, “Repeater” on page 831, “Repeater Table”on page 831, “Scatter Chart” on page 833, “Scatter Chart” on page 833, “Win-LossChart” on page 842
Table HeaderSpecifies whether the cell is a table header. Use to make reports accessible forpeople who use screen readers. When set to Yes, screen readers and speechbrowsers programmatically create relationships between the table header and tablecells.
Applies to
“List Cell” on page 809, “Table Cell” on page 837
Table of ContentsSpecifies the name of the table of contents to which the entry belongs.
Applies to
“Table of Contents Entry” on page 838
Table of Contents NameSpecifies the name that uniquely identifies the table of contents.
Applies to
“Table of Contents” on page 837
Table PropertiesSpecifies the properties for the table object.
Applies to
“Crosstab” on page 788, “List” on page 808, “Repeater Table” on page 831, “StaticRepeater Table” on page 835, “Table” on page 837
Tab OrientationSpecifies the orientation of the tabs in the tab control.
952 IBM Cognos Report Studio Version 10.2.1: User Guide

Applies to
“Data Tab Control” on page 796, “Tab Control” on page 836
Tabs DefinitionDefines the tabs in the tab control.
Applies to
“Tab Control” on page 836
Tab WidthSpecifies the width of tabs in the tab control.
Applies to
“Data Tab Control” on page 796, “Tab Control” on page 836
Target ColorSpecifies a color for the vertical lines that mark the target ranges for target measurevalues in a metrics chart.
Applies to
“Metrics Range Chart” on page 818
Target MarkerSpecifies whether the status indicators will appear in the legend.
Applies to
“Metrics Range Chart” on page 818
Target Marker Border ColorSpecifies a color for the borders around target value markers in a metrics chart.
Applies to
“Metrics Range Chart” on page 818
Target Marker PositionSpecifies whether the status indicators will be rendered over the first bar in thecluster or the middle of the cluster. Does not apply to stacked charts.
Applies to
“Metrics Range Chart” on page 818
Target Range (%)Specifies target ranges centered around target measure values.
Appendix G. Report Studio Object and Property Reference 953

Applies to
“Metrics Range Chart” on page 818
TextSpecifies the static text to render.
Applies to
“Chart Text Item” on page 782, “Chart Text Item” on page 783, “Cumulation LineLabel” on page 792, “Hyperlink” on page 802, “Hyperlink Button” on page 803,“Text Item” on page 839, “Total Column” on page 840
Text ColorSpecifies the color of the text of each label.
Applies to
“Check Box Group” on page 784, “Data Check Box Group” on page 793, “DataRadio Button Group” on page 795, “Radio Button Group” on page 829
Text ColorSpecifies the text color of the button label.
Applies to
“Iterator First” on page 805, “Iterator Label Area” on page 805, “Iterator Last” onpage 805, “Iterator Next” on page 805, “Iterator Previous” on page 805
Text OrientationSpecifies the orientation of the text on the gauge axis.
Applies to
“Gauge Axis” on page 800
Text Source VariableSpecifies a variable based on which the text source can be chosen.
Applies to
“Chart Text Item” on page 782, “Chart Text Item” on page 783, “Cumulation LineLabel” on page 792, “Hyperlink” on page 802, “Hyperlink Button” on page 803,“Text Item” on page 839
Text TruncationSpecifies whether and how legend items are truncated.
Applies to
“Axis Labels” on page 774, “Legend” on page 807
954 IBM Cognos Report Studio Version 10.2.1: User Guide

Tick IntervalSpecifies the interval, in slider values, between the appearance of ticks. Forexample, if you enter 3, a tick will appear for every third value in the slider. Toapply this property, a value other than None or No Labels must be specified forthe Tick Type property.
Applies to
“Data Discrete Values Slider” on page 794, “Discrete Values Slider” on page 798
Tick IntervalSpecifies the interval, in slider values, between the appearance of ticks. Forexample, if you enter 20 in a slider that contains values between 0 and 100, a tickappears at 20, 40, 60, 80, and 100. To apply this property, a value other than Noneor No Labels must be specified for the Tick Type property.
Applies to
“Continuous Values Slider” on page 787
Tick Label Skip IntervalSpecifies the interval, in ticks, between labels. This helps to avoid label collisions inthe slider. If there is a collision between two labels, the second label is not shown.
Applies to
“Continuous Values Slider” on page 787, “Data Discrete Values Slider” on page794, “Discrete Values Slider” on page 798
Tick TypeSpecifies the type of label to show for the ticks in the slider.
Applies to
“Continuous Values Slider” on page 787, “Data Discrete Values Slider” on page794, “Discrete Values Slider” on page 798
TitleSpecifies whether a chart title is rendered. This property applies only to legacycharts.
Applies to
“Win-Loss Chart” on page 842
TitleSpecifies whether a chart title is rendered.
Applies to
TitleSpecifies whether a chart title is rendered.
Appendix G. Report Studio Object and Property Reference 955

Applies to
“3-D Combination Chart” on page 772, “3-D Scatter Chart” on page 772, “BubbleChart” on page 776, “Bubble Chart” on page 777, “Bullet Chart” on page 777,“Combination Chart” on page 785, “Combination Chart” on page 786, “GaugeChart” on page 800, “Gauge Chart” on page 801, “Map” on page 814, “MarimekkoChart” on page 815, “Metrics Range Chart” on page 818, “Pareto Chart” on page822, “Pareto Chart” on page 823, “Pie Chart” on page 823, “Pie Chart” on page824, “Polar Chart” on page 825, “Progressive Chart” on page 826, “ProgressiveChart” on page 827, “Radar Chart” on page 828, “Scatter Chart” on page 833,“Scatter Chart” on page 833
Tolerance ColorSpecifies a color for the vertical lines that mark the tolerance ranges for targetmeasure values in a metrics chart.
Applies to
“Metrics Range Chart” on page 818
Tolerance LabelSpecifies whether the label for the Target Tolerance will appear in the legend.
Applies to
“Metrics Range Chart” on page 818
TooltipsSpecifies whether tooltips are shown in a chart when you hover over dataelements. Tooltips are not supported in PDF documents.
Applies to
“Combination Chart” on page 786, “Pareto Chart” on page 822, “ProgressiveChart” on page 826
TooltipsSpecifies whether tooltips are shown in a pie chart when you hover over dataelements. Tooltips are not supported in PDF documents.
Applies to
“Pie Chart” on page 824
TooltipsSpecifies whether tooltips are shown in a chart when you hover over dataelements. Tooltips are not supported in PDF documents.
Applies to
“Bubble Chart” on page 777, “Bullet Chart” on page 777, “Gauge Chart” on page800, “Scatter Chart” on page 833
956 IBM Cognos Report Studio Version 10.2.1: User Guide
TooltipsSpecifies whether tooltips are shown in a visualization when you hover over dataelements. Tooltips are not supported in PDF documents.
Applies to
“Data Container” on page 793
TooltipsSpecifies whether tooltips are shown in the chart when you hover over dataelements. Tooltips are not supported in PDF documents. This property applies onlyto legacy charts.
Applies to
“3-D Combination Chart” on page 772, “3-D Scatter Chart” on page 772, “BubbleChart” on page 776, “Combination Chart” on page 785, “Gauge Chart” on page801, “Map” on page 814, “Marimekko Chart” on page 815, “Metrics Range Chart”on page 818, “Pareto Chart” on page 823, “Pie Chart” on page 823, “Polar Chart”on page 825, “Progressive Chart” on page 827, “Radar Chart” on page 828, “ScatterChart” on page 833, “Win-Loss Chart” on page 842
Top PositionSpecifies the position of the top edge of the colored region.
Applies to
“Colored Region” on page 785
Top Position (px)Specifies the pixel position of the top edge of the legend measured from thebottom of the chart.
Applies to
“Legend” on page 806
Total ColumnSpecifies whether a total column is rendered. This property applies only to legacycharts.
Applies to
“Progressive Chart” on page 827
Total ColumnSpecifies whether a bar that shows the total cumulative value is rendered.
Applies to
“Progressive Chart” on page 826
Appendix G. Report Studio Object and Property Reference 957

Total Column ColorSpecifies the color, gradient, or pattern of the total column on the progressivechart.
Applies to
“Total Column” on page 840
To TextSpecifies the label that appears beside the end of a range. This property applies tothe following prompt types: date, date & time, time, and interval. The default labeltext is To.
Applies to
“Date & Time Prompt” on page 796, “Date Prompt” on page 797, “IntervalPrompt” on page 804, “Text Box Prompt” on page 838, “Time Prompt” on page839, “Value Prompt” on page 841
Track LengthSpecifies the track length of the slider.
Applies to
“Continuous Values Slider” on page 787, “Data Discrete Values Slider” on page794, “Discrete Values Slider” on page 798
Trendline LabelSpecifies whether to show the default label for the trend line. When set to No, youcan type your own label text.
Applies to
“Trendline” on page 841
TrendlinesAdds a trend line or curve that indicates the general direction of the data overtime.
Applies to
“Bubble Chart” on page 777, “Combination Chart” on page 786, “Scatter Chart” onpage 833
TruncationSpecifies whether labels can be truncated.
Applies to
“Category Axis” on page 780, “Gauge Labels” on page 801, “Pie Labels” on page824, “X Axis” on page 843, “Y Axis” on page 845
958 IBM Cognos Report Studio Version 10.2.1: User Guide

Truncation TextSpecifies the text to append when a label is truncated.
Applies to
“Category Axis” on page 780, “Gauge Labels” on page 801, “Legend” on page 806,“Pie Labels” on page 824, “X Axis” on page 843, “Y Axis” on page 845
TypeSpecifies the type of variable.
Applies to
“Variable” on page 842
TypeSpecifies the type of trend line.
Applies to
“Trendline” on page 841
TypeSpecifies the behavior of the prompt button.
Applies to
“Prompt Button” on page 827
TypeSpecifies the type of object.
Applies to
“Calculated Measure” on page 779, “Calculated Member” on page 779, “CustomGroups” on page 793, “Dimensional Edge Summary” on page 798, “EdgeSummary” on page 799, “Explicit Member Set” on page 799, “Hierarchy Set” onpage 802, “Intersection (Tuple)” on page 804, “Level Set” on page 808, “ListSummary” on page 813, “Measure” on page 817, “Member” on page 817, “MemberChildren Set” on page 817, “Member Property” on page 818, “Named Set” on page819, “Percentaged Measure” on page 823, “Set Expression” on page 835
Update Variables LiveSpecifies whether to update variables as the thumb is moved. When set to Yes, thereport is updated live when the thumb is moved. When set to No, the report isupdated only when the thumb is stopped and released.
Applies to
“Continuous Values Slider” on page 787, “Data Discrete Values Slider” on page794, “Discrete Values Slider” on page 798
Appendix G. Report Studio Object and Property Reference 959

Upper Range Skew (%)Specifies a percentage that affects the positioning of tolerance bar and range withrespect to the target value.
Applies to
“Metrics Range Chart” on page 818
URLSpecifies the URL, using static text.
Applies to
“Hyperlink” on page 802, “Hyperlink Button” on page 803
URLSpecifies the URL, using static text.
Applies to
“Image” on page 803
URL Source VariableSpecifies a variable based on which the URL source can be chosen.
Applies to
“Hyperlink” on page 802, “Hyperlink Button” on page 803, “Image” on page 803
UsageSpecifies whether the usage of this object is Optional, Required, or Disabled. WhenOptional, this condition applies if all parameters referenced by the expression areprovided with values. If the expression does not refer to any parameters, then thiscondition is always applied. When Disabled, this condition is never applied, whichis useful for authoring and testing purposes.
Applies to
“Detail Filter” on page 798, “Summary Filter” on page 836
Use 1.x BehaviorSpecifies that IBM® Cognos® ReportNet® query semantics are used if they differfrom IBM Cognos Business Intelligence query rules.
Applies to
“Query” on page 828
Use Aggregate CacheFor SAP BW data sources, specifies whether to use the aggregation cache. Werecommend that you use the default value.
960 IBM Cognos Report Studio Version 10.2.1: User Guide
Applies to
“Query” on page 828
Use Detail Value on PageSpecifies whether to render a detail value or an aggregate value for a text item thatuses a data item as its source. Use this property only when you want to render thevalue that appears in the first or last detail row of a list, repeater or repeater tableon the same page as the text item.
Applies to
“Text Item” on page 839
Use Embedded DataSpecifies whether to use data that is defined in the visualization definition insteadof data that you insert from the package.
Applies to
“Visualization” on page 842
Use for Parameter InfoSpecifies whether the query should be given priority when determining parameterinformation. Queries with this property set to Yes are checked for parameterinformation first, followed by queries with this property set to Default. Querieswith this property set to No will not be checked for parameter information unlessit is referenced in a query that will be checked. Setting this property to Yes onparameterized queries can improve performance in displaying prompt pages.
Applies to
“Query” on page 828
Use Local CacheSpecifies whether a query is a candidate for reusing the query results set. If set toYes, the query engine can reuse the existing SQL results from the cache. If set toNo, the query is executed rather than using cached results. This property appliesonly to relational and dimensionally-modeled relational (DMR) data sources.
Applies to
“Query” on page 828
User SAP Member CacheSignals to the SAP BW provider whether the query associated with this property iscached to the IBM® Cognos® Business Intelligence member cache. When set to Yes,the member cache is populated with the dimensions in the query, encrypted, andsaved for later use.
Applies to
“Query” on page 828
Appendix G. Report Studio Object and Property Reference 961

Use Same Range For All InstancesSpecifies that all instances of the chart use the same maximum value. When set toNo, the axis maximum value is recalculated for each chart instance. It is onlyrelevant if the chart is involved in a master detail relationship.
Applies to
“Angular Axis” on page 773, “Gauge Numerical Axis” on page 801, “NumericalAxis” on page 820, “Numerical Axis” on page 820, “Radial Axis” on page 829, “XAxis” on page 843, “Y1 Axis” on page 844, “Y2 Axis” on page 844, “Y Axis” onpage 844, “Z Axis” on page 845, “Z Axis” on page 845
Use SAP MUN as Business KeySpecifies whether to return the full SAP MUN as the value for the business key.Use this query hint to allow a drill-down on a business key for a non-leaf memberof an external hierarchy. When set to Yes, the full MUN appears in the reportoutput.
Applies to
“Query” on page 828
Use Set AggregationSpecifies which aggregation clause is used to calculate the summary. When set toYes, the aggregation clause within set is used. When set to No, the aggregationclause within detail is used.
For more information, see the topic Summarizing Values in Crosstabs.
Applies to
“Dimensional Edge Summary” on page 798, “Edge Summary” on page 799
Use SQL ParametersSpecifies whether the generated SQL uses parameter markers or literal values.When set to Marker, specifies that the generated SQL uses markers to denote thatthe value will be provided later. When set to Literal, uses literal values in thegenerated SQL. If not specified, the server determines the behavior.
Dynamic SQL applications have the ability to prepare statements which includemarkers in the text which denote that the value will be provided later. This is mostefficient when the same query is used many times with different values. Thetechnique reduces the number of times a database has to hard parse an SQLstatement and it increases the re-use of cached statements. However, when queriesnavigate larger amounts of data with more complex statements, they have a lowerchance of matching other queries. In this case, the use of literal values instead ofmarkers may result in improved performance.
Applies to
“Query” on page 828
962 IBM Cognos Report Studio Version 10.2.1: User Guide

Use SQL With ClauseSpecifies whether to send a request to the database using an SQL WITH clause.When set to Yes, and if the database supports WITH clauses, a WITH clauserequest is generated. When set to No, or if the database does not support WITHclauses, a request using derived tables is generated.
Applies to
“Query” on page 828
Use Thousands SeparatorSpecifies whether to delimit digit groups with the thousands separator.
Applies to
“Text Box Prompt” on page 838
Use ValueSpecifies the values used by the prompt object.
Applies to
“Tree Prompt” on page 840
Use ValueSpecifies the values used by the prompt object. These values can be different thanthe ones that are rendered to the user.
Applies to
“Select & Search Prompt” on page 834, “Value Prompt” on page 841
Value Location:Specifies where values and labels are to be rendered in the chart.
Applies to
“Area” on page 773, “Bar” on page 774, “Bubble Chart” on page 776,“Combination Chart” on page 785, “Cumulation Line” on page 792, “Line” onpage 808, “Metrics Range Chart” on page 818, “Pareto Chart” on page 823, “PolarChart” on page 825, “Progressive Chart” on page 827, “Radar Chart” on page 828,“Scatter Chart” on page 833
Value MarkersSpecifies whether to show special value markers and how they are formatted.
Applies to
“Line” on page 808
Appendix G. Report Studio Object and Property Reference 963

Value RangeControls how the minimum and maximum are calculated for the visualization.When all data is selected, the minimum and maximum are calculated to span allassociated Active Report control filters. When filtered data is selected, theminimum and maximum are calculated based on any filter choices that users makein associated Active Report controls. When specified values is selected, youexplicitly specify the minimum and maximum.
Applies to
“Value” on page 841
Value RepresentationSpecifies whether values are rendered as percentages.
Applies to
“Pie Chart” on page 823
ValuesSpecifies what values to show in the chart and whether to show the correspondingmeasure, series, or category label.
Applies to
“3-D Scatter Chart” on page 772, “Bubble Chart” on page 776, “Polar Chart” onpage 825, “Scatter Chart” on page 833
ValuesSpecifies whether values are rendered in the chart.
Applies to
“3-D Area” on page 771, “3-D Bar” on page 771, “3-D Line” on page 772, “Area”on page 773, “Bar” on page 774, “Cumulation Line” on page 792, “Line” on page808, “Pareto Chart” on page 823, “Progressive Chart” on page 827, “Radar Chart”on page 828
ValuesSpecifies whether values are rendered.
Applies to
“Pie Chart” on page 823
ValuesSpecifies whether values are rendered in the chart.
Applies to
“Marimekko Chart” on page 815
964 IBM Cognos Report Studio Version 10.2.1: User Guide

Value TypeSpecifies whether absolute values are rendered rather than cumulative values.
Applies to
“Area” on page 773, “Bar” on page 774, “Line” on page 808
VariableSpecifies the variable associated to the slider.
Applies to
“Continuous Values Slider” on page 787
Variable for MaximumSpecifies the variable to use for the maximum value when the slider range type isRange.
Applies to
“Continuous Values Slider” on page 787
Variable for MinimumSpecifies the variable to use for the minimum value when the slider range type isRange.
Applies to
“Continuous Values Slider” on page 787
Vertical AlignmentSpecifies how objects contained in this object are vertically aligned.
Applies to
“Crosstab Columns” on page 788, “Crosstab Columns” on page 788, “CrosstabCorner” on page 789, “Crosstab Fact Cells” on page 789, “Crosstab Intersection” onpage 789, “Crosstab Member Fact Cells” on page 790, “Crosstab Node Member” onpage 790, “Crosstab Rows” on page 790, “Crosstab Rows” on page 791, “CrosstabSpace” on page 791, “Crosstab Summary” on page 791, “List Cell” on page 809,“List Column” on page 809, “List Column Body” on page 810, “List Columns” onpage 810, “List Columns” on page 810, “List Columns Body Style” on page 811,“List Columns Title Style” on page 811, “List Column Title” on page 811, “ListFooter” on page 811, “List Header” on page 812, “List Row” on page 813, “ListRow Cells Style” on page 813, “Repeater Table Cell” on page 831, “Repeater TableCell” on page 832, “Table Cell” on page 837, “Table Row” on page 838
VisibleSpecifies whether a column or row is visible when the active report is executed.You can set the value of this property for multiple objects simultaneously by firstcontrol+clicking the items in the report.
Appendix G. Report Studio Object and Property Reference 965

Applies to
“Crosstab Node Member” on page 790, “Crosstab Space” on page 791, “CrosstabSummary” on page 791
VisibleSpecifies whether to display the object. When set to No, the object is hidden but afixed space is reserved in the report.
Applies to
“3-D Combination Chart” on page 772, “3-D Scatter Chart” on page 772, “Block”on page 776, “Bubble Chart” on page 776, “Bubble Chart” on page 777, “BulletChart” on page 777, “Combination Chart” on page 785, “Combination Chart” onpage 786, “Conditional Block” on page 787, “Conditional Block” on page 787,“Context Item Text” on page 787, “Crosstab” on page 788, “Cumulation Line Axis”on page 792, “Date & Time Prompt” on page 796, “Date Prompt” on page 797,“Field Set” on page 800, “Gauge Chart” on page 800, “Gauge Chart” on page 801,“Gauge Labels” on page 801, “Gauge Numerical Axis” on page 801, “Hyperlink”on page 802, “Image” on page 803, “Interval Prompt” on page 804, “Legend” onpage 806, “List” on page 808, “List Summary” on page 814, “Map” on page 814,“Marimekko Chart” on page 815, “Metrics Range Chart” on page 818, “Page BreakText” on page 821, “Pareto Chart” on page 822, “Pareto Chart” on page 823, “PieChart” on page 823, “Pie Chart” on page 824, “Pie Labels” on page 824, “PolarChart” on page 825, “Progressive Chart” on page 826, “Progressive Chart” on page827, “Radar Chart” on page 828, “Repeater Table” on page 831, “Scatter Chart” onpage 833, “Scatter Chart” on page 833, “Select & Search Prompt” on page 834,“Static Repeater Table” on page 835, “Table” on page 837, “Table of Contents” onpage 837, “Table of Contents Entry” on page 838, “Text Box Prompt” on page 838,“Text Item” on page 839, “Time Prompt” on page 839, “Tree Prompt” on page 840,“Value Prompt” on page 841, “Variable Text Item” on page 842, “Win-Loss Chart”on page 842
Visual AngleSpecifies the angle, in degrees, in which the chart objects will be displayed whenthe chart has 3-D effects. This property applies only to legacy charts.
Applies to
“Combination Chart” on page 785, “Marimekko Chart” on page 815, “MetricsRange Chart” on page 818, “Pareto Chart” on page 823, “Progressive Chart” onpage 827
White SpaceSpecifies how to handle the white space inside the object and whether text in theobject is wrapped or appears all on one line. The term white space refers to thespaces between words, where text can be wrapped.
When set to Normal, the default, text will wrap when necessary, such as whenspace is limited.
When set to No Wrap, the text will never wrap to the next line in all reportoutputs, even if space is limited.
966 IBM Cognos Report Studio Version 10.2.1: User Guide

Applies to
“Block” on page 776, “Conditional Block” on page 787, “Conditional Block” onpage 787, “Crosstab Columns” on page 788, “Crosstab Columns” on page 788,“Crosstab Corner” on page 789, “Crosstab Fact Cells” on page 789, “CrosstabIntersection” on page 789, “Crosstab Member Fact Cells” on page 790, “CrosstabNode Member” on page 790, “Crosstab Rows” on page 790, “Crosstab Rows” onpage 791, “Crosstab Space” on page 791, “Crosstab Summary” on page 791, “ListCell” on page 809, “List Column” on page 809, “List Column Body” on page 810,“List Columns” on page 810, “List Columns” on page 810, “List Columns BodyStyle” on page 811, “List Columns Title Style” on page 811, “List Column Title” onpage 811, “List Footer” on page 811, “List Header” on page 812, “List Row” onpage 813, “List Row Cells Style” on page 813, “Repeater Table Cell” on page 831,“Repeater Table Cell” on page 832, “Table Cell” on page 837, “Table of Contents”on page 837, “Table of Contents Entry” on page 838
WidthSpecifies the width of the visualization, in pixels.
Applies to
“Visualization” on page 842
Width (px)Specifies the width of the note, in pixels.
Applies to
“Note” on page 819
Win ColorSpecifies a color, color gradient, or pattern to apply to the win values.
Applies to
“Win-Loss Chart” on page 842
Win-Loss ThresholdSpecifies the win-loss value in a win-loss chart. It represents values that are ties,which are mapped on the zero line.
Applies to
“Win-Loss Chart” on page 842
X AxisSpecifies whether the axis is rendered.
Applies to
“3-D Combination Chart” on page 772
Appendix G. Report Studio Object and Property Reference 967

X AxisSpecifies whether the axis is rendered.
Applies to
“Bubble Chart” on page 776, “Scatter Chart” on page 833
X-Axis Data Item ValueSpecifies the scatter marker position on the X-axis.
Applies to
“Scatter Marker” on page 834
Y1 AxisSpecifies whether the axis is rendered.
Applies to
“Combination Chart” on page 785, “Metrics Range Chart” on page 818
Y2 AxisSpecifies whether the axis is rendered.
Applies to
“Combination Chart” on page 785
Y2 Axis PositionSpecifies how the second Y axis is rendered. When Y2 Axis Position is set to Dual,the Y2 axis appears across from the Y1 numeric axis. When Y2 Axis Position is setto Bipolar, the Y2 axis appears below the Y1 axis. For example, in a combinationchart showing Revenue and Quantity sold by Retailer type, with the Y2 AxisPosition set to Dual, the Revenue columns and the Quantity sold line overlapbecause the Revenue axis (Y1) and the Quantity sold axis (Y2) are across from eachother. However, with the Y2 Axis Position set to Bipolar, the Revenue columnsappear above the Quantity sold line, and the data does not overlap. This propertyapplies only to legacy charts.
Applies to
“Combination Chart” on page 785
Y AxisSpecifies whether the axis is rendered.
Applies to
“3-D Combination Chart” on page 772
Y AxisSpecifies whether the axis is rendered.
968 IBM Cognos Report Studio Version 10.2.1: User Guide

Applies to
“Bubble Chart” on page 776, “Marimekko Chart” on page 815, “Scatter Chart” onpage 833
Y-Axis Data Item ValueSpecifies the scatter marker position on the Y-axis.
Applies to
“Scatter Marker” on page 834
Data Formatting PropertiesThe following is a list of properties available in the data formatting dialog.
"Not Applicable" CharactersSpecifies the characters to be displayed when the value to be formatted was notapplicable. The default value is two dashes (--). Note that the format will beapplied only if the data source supports this error condition.
Any Error CharactersSpecifies the characters to be displayed when the value to be formatted was notavailable because of an error. This property is overridden by the more specificformatting error conditions, such as Security Error Characters. The default value istwo dashes (--). Note that the format will be applied only if the data sourcesupports this error condition.
Calendar TypeSpecifies the type of calendar to be displayed. The date values will be mapped tothe selected calendar before being formatted. The default value is inherited fromthe user's content language. Note that the Japanese Imperial setting is onlyapplicable for Japanese languages.
ClockSpecifies whether to display the time in 12-hour or 24-hour format. The defaultvalue is inherited from the user's content language.
CurrencySpecifies the currency to be used. The default currency symbol will be displayedunless the values of the Currency Display and Currency Symbol properties arechanged. The default value is inherited from the model.
Currency DisplaySpecifies whether to display the international or local currency symbol. By default,the local currency symbol is displayed.
Currency SymbolSpecifies a character or characters to use as the symbol to identify the localcurrency. This symbol will precede the number and any sign, even if it is a leading
Appendix G. Report Studio Object and Property Reference 969

sign. A space between the symbol and the numeric value can be specified byentering it in this property, after the symbol. The default value is inherited fromthe user's content language.
Currency Symbol PositionSpecifies where the currency symbol will appear. If End is selected, any spaces thatfollow the character or characters in the Currency Symbol or InternationalCurrency Symbol properties will be rendered between the number and the symbol.The default value is inherited from the user's content language.
Date OrderingSpecifies the order in which to display the day, month, and year. The default valueis inherited from the user's content language.
Date SeparatorSpecifies the character to be displayed between the year, month, and day. Thedefault value is inherited from the user's content language.
Date StyleSpecifies the date style. The results rendered are determined by the language.Generally, Short uses only numbers, Medium uses some abbreviated words, Longuses complete words, and Full includes all available details.
Decimal SeparatorSpecifies the character that will separate non-decimal numbers from decimals. Thisproperty is ignored if no decimals are displayed. The default value is inheritedfrom the user's content language.
Digit ShapingSpecifies the digit shaping option to apply. When National is selected, digit shapesare determined from the user’s content language. When Contextual is selected,digit shapes are determined from adjoining characters in the value. For example, ifthe most recent strongly directional character before the numerical character isleft-to-right, the number is displayed as a European number. If the most recentstrongly directional character before the numerical character is right-to-left, thenumber is displayed in Arabic-Indic format. If there are no strongly directionalcharacters before the numerical character, the number is displayed according to thebase text direction of the field. When None is selected, no shaping is performed,and the value as it appears in the data source is shown. The default depends onthe type of value. When the value is a string, the default is None.
Digit ShapingSpecifies the digit shaping option to apply. When National is selected, digit shapesare determined from the user’s content language. When None is selected, noshaping is performed, and the value as it appears in the data source is shown. Thedefault depends on the type of value. When the value is a number, the default isthe ICU default for the language.
Display AM / PM SymbolsSpecifies whether to display the AM or PM symbols. The default value is inheritedfrom the user's content language.
970 IBM Cognos Report Studio Version 10.2.1: User Guide

Display As ExponentSpecifies whether to render values in scientific notation, using exponents. If thisproperty is set to No, scientific notation will not be used. If this property is notspecified, scientific notation will be used only when values exceed the maximumnumber of digits. The default value is inherited from the user's content language.
Display DaysSpecifies whether to display the day. The format of the day can be controlled byselecting one of the specific formats. Selecting Julian means that the 3-digit day ofthe year will be displayed. The default value is inherited from the user's contentlanguage.
Display ErasSpecifies whether to display the era. The default value is inherited from the user'scontent language.
Display HoursSpecifies whether to display the hours. The default value is inherited from theuser's content language.
Display MillisecondsSpecifies whether to display the milliseconds. The format of the milliseconds canbe controlled by selecting one of the specific formats. This property is ignored ifseconds are not displayed. The default value is inherited from the user's contentlanguage.
Display MinutesSpecifies whether to display the minutes. The format of the minutes can becontrolled by selecting one of the specific formats. The default value is inheritedfrom the user's content language.
Display MonthsSpecifies whether to display the month. The format of the month can be controlledby selecting one of the specific formats. The default value is inherited from theuser's content language.
Display MonthsSpecifies whether to display the month.
Display SecondsSpecifies whether to display the seconds. The format of the seconds can becontrolled by selecting one of the specific formats. The default value is inheritedfrom the user's content language.
Display Time ZoneSpecifies whether to display the time zone. The default value is inherited from theuser's content language.
Appendix G. Report Studio Object and Property Reference 971

Display WeekdaysSpecifies whether to display the weekday. The format of the weekday can becontrolled by selecting one of the specific formats. The default value is inheritedfrom the user's content language.
Display YearsSpecifies whether to display the year. The first two digits of the year, whichindicate the century, can be controlled by selecting one of the associated propertyvalues. The default value is inherited from the user's content language.
Display YearsSpecifies whether to display the year.
Divide By Zero CharactersSpecifies the characters to be displayed when a numeric value is the result of adivision by zero. The default value is /0. Note that the format will be applied onlyif the data source supports this error condition.
Exponent SymbolSpecifies the character to be displayed to identify exponents if the scientificnotation is used. The symbol will be rendered after the number, separated by aspace. The default value is inherited from the user's content language.
Group Size (digits)Specifies the primary grouping size. If a value is specified it represents the numberof digits to the left of the decimal point to be grouped together and separated bythe thousands separator. The default value is inherited from the user's contentlanguage.
International Currency SymbolSpecifies a character or characters to use as a symbol to identify the internationalcurrency. This symbol will replace the currency symbol. A space between thesymbol and the numeric value can be specified by entering it in this property, afterthe symbol. The default value is inherited from the user's content language.
Mantissa (digits)Specifies the number of digits to be displayed following the exponent symbol if thescientific notation is used.
Maximum No. of DigitsSpecifies the maximum number of digits that can be displayed. If the maximumnumber of digits is not sufficient to display the value, a scientific notation will beused. The default value is inherited from the user's content language.
Minimum No. of DigitsSpecifies the minimum number of digits that can be displayed. If the minimumnumber of digits is too high to display a value, the padding character will be used.The default value is inherited from the user's content language.
972 IBM Cognos Report Studio Version 10.2.1: User Guide

Missing Value CharactersSpecifies the character or characters to be displayed when the value is missing. Ifno value is entered for this property, an empty string will be displayed.
Negative PatternSpecifies a presentation format, based on patterns, for negative numbers. Somerestrictions exist. The numerical part of the negative pattern is ignored. Only thesuffix and the prefix are used. For example, in the pattern ABC#,##0.#EFG, ABC isthe prefix, EFG is the suffix and #,##0.# is the numerical part of the pattern.
Negative Sign PositionSpecifies where the negative sign will appear. The default value is inherited fromthe user's content language.
Negative Sign SymbolSpecifies how to display negative numbers. The default value is inherited from theuser's content language.
No. of Decimal PlacesSpecifies the number of digits to be displayed to the right of the decimal point. Ifthis property is not set, the number of decimal places will vary depending on thenumber rendered.
Numeric Overflow CharactersSpecifies the characters to be displayed when a numeric value is the result of anumeric overflow. The default value is two dashes (--). Note that the format will beapplied only if the data source supports this error condition.
Padding CharacterSpecifies the character that will be used to pad values that have fewer digits thanthe minimum number of digits. The default value is inherited from the user'scontent language.
PatternSpecifies a presentation format that is based on patterns. The pattern formatoverrides formats specified in other properties. For example, to format the date as2009/12/31 23:59:59 PM, use the pattern yyyy/MM/dd hh:mm:ss aa. For example,to format thousands using the letter K, set the Format Type to Number, set theScale to -3 (to remove 000), and then use the pattern to ####K.
Percentage SymbolSpecifies whether to display the values per hundred (percent) or per thousand. Thesymbol will be appended to the number and any trailing sign. A space between thenumeric value and the symbol can be specified by entering it in this property, afterthe symbol. The default value is inherited from the user's content language.
Percent Scale (integer)Scale to be applied to value after formatting. If omitted, no percent scale will beapplied and the value will formatted according the normal decimal positioningassociated with the percent (or per mille) symbol.
Appendix G. Report Studio Object and Property Reference 973

ScaleSpecifies how many digits to move the decimal delimiter for formatting purposes.For example, move the decimal three spaces to present values in thousands. Thedefault value is inherited from the database field.
Secondary Group Size (digits)Specifies the secondary grouping size. If a value is specified it represents thenumber of digits to the left of the primary group that will be grouped together andseparated by the thousands separator. If this property is left blank, the secondarygrouping of digits is the same number as the primary group size, as specified bythe Group Size (digits) property. The default value is inherited from the user'scontent language.
Security Error CharactersSpecifies the characters to be displayed when the value to be formatted was notavailable for security reasons. The default value is #!Security. Note that the formatwill be applied only if the data source supports this error condition.
Thousands SeparatorSpecifies how to delimit digit groups, such as thousands. This property is onlyused if the Use Thousands Separator property is set to Yes. The default value isinherited from the user's content language.
Time SeparatorSpecifies the character to be displayed between the hour, minute, and second. Thedefault value is inherited from the user's content language.
Time StyleSpecifies the time style to be displayed. The exact results that will be rendered aredetermined by the language. Generally, Short means that the minimum details willbe displayed, Long adds seconds, and Full means that all details are displayed,including the time zone. The default value is inherited from the user's contentlanguage.
Time UnitSpecifies the unit of measure of the value. This property will be ignored if any dayor time components are shown. The default value is inherited from the user'scontent language.
Use Thousands SeparatorSpecifies whether the grouping delimiter will be applied as defined by the GroupSize property. The default value is inherited from the user's content language.
Zero Value CharactersSpecifies the character or characters to be displayed when the value is zero (0). Ifno value is entered for this property, the Maximum No. of Digits propertydetermines how many zero digits are displayed.
974 IBM Cognos Report Studio Version 10.2.1: User Guide

Appendix H. Prompt API for IBM Cognos BI
The JavaScript Prompt API provides report authors with a method of customizingprompt interaction in the reports they author.
With the prompt API, JavaScript applications can interact with IBM CognosBusiness Intelligence report prompts for the purposes of validation or custominteraction. The prompt API can query and set user selections, validate typed-invalues using patterns, set default values using expressions or query data, andmore. Examples are provided to show various usage scenarios of the prompt API.Related concepts:“Prompt API samples” on page 528The following reports are some of the reports found in the Samples_Prompt_APIfolder.
cognos.Prompt objectDefines the class that contains a prompt object from a report.
This object should only be accessed through an instance of cognos.Report.
cognos.Prompt.getControlByName methodReturns the control object associated with a name.
Syntax(cognos.Prompt.Control) getControlByName(String sName)
Parameters
{String} sName
Specifies the prompt name property set for the control in IBM Cognos ReportStudio.
Returns
{cognos.Prompt.Control}
Object associated to the specified sName control. Returns null if the controldoes not exist.
Example
The following is an example of the clearMyPrompt() function.<script type="text/javascript">function clearMyPrompt() {var oCR = cognos.Report.getReport("_THIS_");var myPrompt = oCR.prompt.getControlByName("myPrompt");myPrompt.clearValues();}</script>
cognos.Prompt.getControls methodReturns an array of all controls associated with the report.
© Copyright IBM Corp. 2005, 2013 975

Syntax(cognos.Prompt.Control[]) getControls()
Parameters
None.
Returns
{cognos.Prompt.Control[]}
An array of controls associated with the report.
Example
This example implements a function, clearAllValues(), that resets (clears theselection of) all prompt controls for a page.<script type="text/javascript">function clearAllValues() {var oCR = cognos.Report.getReport("_THIS_");var aControls = oCR.prompt.getControls();for (var i = 0; i < aControls.length; i++) {
aControls[i].clearValues();}}</script>
cognos.Prompt.Control objectA control is a visual element in the prompt page, such as a text prompt or a valueprompt.
cognos.Prompt.Control.addValues methodAdd an array of values to a control.
If the control does not support multiple values, only the first one provided is used.
Syntax{void} addValues(aValues)
Parameters
{cognos.Value[]} aValues
The new values to use for this control.
Returns
{void}
Example
This example adds an array of two values (use and display) to a prompt.var oCR = cognos.Report.getReport(“_THIS_”);function setPromptValue( promptName, useValue, displayValue ) {var oP = oCR.prompt. getControlByName( promptName );var oValue = {'use': useValue, 'display': displayValue };
976 IBM Cognos Report Studio Version 10.2.1: User Guide

oP.addValues( [oValues] );}setPromptValue ( 'country', 'ca', 'Canada');
cognos.Prompt.Control.clearValues methodClear (or deselect) all values for this control.
Syntax
For a text prompt, the text is set to empty. For a value prompt, all the selectionsare removed.{void} clearValues()
Parameters
None.
Returns
{void}
Example
This example resets all the controls of a page.function clearAllValues() {var oCR = cognos.Report.getReport("_THIS_");var aControls = oCR.prompt.getControls();for (var i = 0; i < aControls.length; i++) {aControls[i].clearValues();}}
cognos.Prompt.Control.getName methodReturns the name of the control.
The name is set in IBM Cognos Report Studio in the name property set for thecontrol.
Syntax{String} getName()
Parameters
None.
Returns
{String}The value specified by the name property set for the control.
cognos.Prompt.Control.getValues methodReturns the current value for the control.
This method always returns an array, even if there is only one value selected.v The following is an example for a text box prompt (single):
Appendix H. Prompt API for IBM Cognos BI 977

[ {use: "Smith", display: "Smith"} ]
v The following is an example for a select prompt (multiple):[ {use: "CAN", display: "Canada"}, {use: "JPN", display: "Japan"} ]
v The following are examples of range prompts:A range is an array of two elements, with the mandatory names start and end.The value of each element is a regular array as in earlier examples. When therange values are equal, this method returns a normal value instead of a range:[ {use: useValue, display:displayValue} ]
When the range values are different, this method returns a range:[ start:{use: useValue, display:displayValue}, end:{use: useValue, display:displayValue} ]
Syntax{cognos.Value[]} getValues(boolean v_allOptions)
Parameters
{Boolean} v_allOptions
This optional parameter is applicable only to value prompts. The parameterspecifies whether to retrieve all values or only selected values.
If the parameter is true, then all options are returned. If the parameter is falseor missing, then only the selected options are returned.
The default value of this parameter is false.
Returns
{cognos.Value[]}An array of values for the control.
Example
This example demonstrates how to adjust your code based on whether the result isa single value or a range.function isRangeOutOfLimits(datePrompt, rangeLimit) {var result = false;var v = datePrompt.getValues();var rangeValue = v[0];var rangeDaysDiff = 0;if (rangeValue.start) {rangeDaysDiff = 0;var startDate = rangeValue.start.use;var endDate = rangeValue.end.use;rangeDaysDiff = dateUtils.substractDate(endDate,startDate);}if (rangeDaysDiff > 0 && rangeDaysDiff <= rangeLimit) {result = true;}return result;}
This example demonstrates the use of the parameter v_allOptions.var allValues = valueControl.getValues(true);var selectedValues = valueControl.getValues();
cognos.Prompt.Control.setValidator methodChanges the default validation function for a control to one defined by the user.
978 IBM Cognos Report Studio Version 10.2.1: User Guide

When the specified function returns false, the UI element associated with thecontrol indicates that a validation error occurred. When used in a multi-selectcontrol, the Insert button is disabled.
Syntax{void} setValidator(oFct)
Parameters
{function} oFctA user-defined function that takes the user input as a parameter and returns aBoolean value.
Returns
{void}
Example
This example demonstrates how to ensure that a valid postal code is provided inthe form A1A 1A1.textBox.setValidator(function (values) {var result = false;if (values && values.length > 0) {var sValue = values[0][’use’];var rePostalCodeFormat = new RegExp( "[a-z][0-9][a-z] ?[0-9][a-z][0-9]", "gi" );if ( rePostalCodeFormat.test(sValue ) ) {result=true;}}return result;});
cognos.Prompt.Control.setValues methodResets the control and adds an array of values to a control.
If the control doesn't support multiple values, only the first value provided is used.This is a convenience method that issues consecutive calls to clearValues() andaddValues().
Syntax{cognos.Value[]} aValues
Parameters
{cognos.Value[]} aValues
New values to use for this control.
Returns
{void}
Examplefunction setPromptValue( promptName, value ) {var oCR = cognos.Report.getReport(“_THIS_”);var oP = oCR.prompt. getControlByName( promptName );
Appendix H. Prompt API for IBM Cognos BI 979

oP.setValues( oValues );}oValues = [{'use': 'ca', 'display': 'Canada'},{'use': 'us', 'display': 'USA'}];setPromptValue( 'countries', oValues );
cognos.Report objectRepresents a report object in the content store.
Properties
prompt
References a cognos.Prompt object for this instance.
Example
This example creates a new cognos.Report object from the current instance.var ocr= cognos.Report.getReport("_THIS_");
The new ocr object is specific to the cognos.Report namespace and avoidscollisions with other objects in your scripts. The keyword _THIS_ should always beused. The Report Server will replace it with a unique namespace during reportexecution.
cognos.Report.getReport methodGetter method for a cognos.Report object.
Namespaces are used to support HTML fragments. Always use a propernamespace when using this method to retrieve a cognos.Report object.
Syntax<static> {cognos.Report} cognos.Report.getReport(sNamespace)
Parameters
{String} sNamespace Optional
Returns
{cognos.Report}The cognos.Report instance for this namespace.
Examplevar oCR = cognos.Report.getReport( "_THIS_" );
cognos.Report.sendRequest methodSends a requests with the current parameters and values.
Syntax{void} sendRequest(eAction)
980 IBM Cognos Report Studio Version 10.2.1: User Guide
Parameters
{cognos.Report.Action} eActionSpecifies one of the cognos.Report.Action enumeration values. No othervalues are allowed.
Returns
{void}
Examplefunction customButton( eAction ){var oCR = cognos.Report.getReport("_THIS_");oCR.sendRequest( eAction );}
cognos.Report.Action objectDefines constants for report navigation.
cognos.Report.Action.BACKGo back one prompt page.
Syntax<static> <constant> cognos.Report.Action.BACK
cognos.Report.Action.CANCELCancel report execution and navigate to the previous page.
Syntax<static> <constant> cognos.Report.Action.CANCEL
cognos.Report.Action.FINISHSubmit parameter values and skip all remaining optional prompts and promptpages.
Syntax<static> <constant> cognos.Report.Action.FINISH
cognos.Report.Action.NEXTSubmit parameter values and go to the next prompt page.
Syntax<static> <constant> cognos.Report.Action.NEXT
cognos.Report.Action.REPROMPTIf the report contains prompt pages, the first prompt page is displayed. Otherwise,if the report doesn't contain prompt pages, this constant will re-prompt for values.
Syntax<static> <constant> cognos.Report.Action.REPROMPT
Appendix H. Prompt API for IBM Cognos BI 981

cognos.Value classJSON structure to represent parameter values.
This object includes the following valid attributes:v display
v end
v start
v use
Simple values{ ’use’: ’[a].[b].[c]’, ’display’: ’Canada’ }
Range values{
’start’: {’use’: ’2007-01-01’, ’display’: ’January 1, 2007’}’end’: {’use’: ’2007-12-31’, ’display’: ’December 31, 2007’}
}
Multiple values[
{ ’use’: ’12’, ’display’: ’Canada’ },{ ’use’: ’41’, ’display’: ’Germany’ },{ ’use’: ’76’, ’display’: ’Japan’ }
]
982 IBM Cognos Report Studio Version 10.2.1: User Guide
Notices
This information was developed for products and services offered worldwide.
IBM may not offer the products, services, or features discussed in this document inother countries. Consult your local IBM representative for information on theproducts and services currently available in your area. Any reference to an IBMproduct, program, or service is not intended to state or imply that only that IBMproduct, program, or service may be used. Any functionally equivalent product,program, or service that does not infringe any IBM intellectual property right maybe used instead. However, it is the user's responsibility to evaluate and verify theoperation of any non-IBM product, program, or service. This document maydescribe products, services, or features that are not included in the Program orlicense entitlement that you have purchased.
IBM may have patents or pending patent applications covering subject matterdescribed in this document. The furnishing of this document does not grant youany license to these patents. You can send license inquiries, in writing, to:
IBM Director of LicensingIBM CorporationNorth Castle DriveArmonk, NY 10504-1785U.S.A.
For license inquiries regarding double-byte (DBCS) information, contact the IBMIntellectual Property Department in your country or send inquiries, in writing, to:
Intellectual Property LicensingLegal and Intellectual Property LawIBM Japan Ltd.19-21, Nihonbashi-Hakozakicho, Chuo-kuTokyo 103-8510, Japan
The following paragraph does not apply to the United Kingdom or any othercountry where such provisions are inconsistent with local law: INTERNATIONALBUSINESS MACHINES CORPORATION PROVIDES THIS PUBLICATION "AS IS"WITHOUT WARRANTY OF ANY KIND, EITHER EXPRESS OR IMPLIED,INCLUDING, BUT NOT LIMITED TO, THE IMPLIED WARRANTIES OFNON-INFRINGEMENT, MERCHANTABILITY OR FITNESS FOR A PARTICULARPURPOSE. Some states do not allow disclaimer of express or implied warranties incertain transactions, therefore, this statement may not apply to you.
This information could include technical inaccuracies or typographical errors.Changes are periodically made to the information herein; these changes will beincorporated in new editions of the publication. IBM may make improvementsand/or changes in the product(s) and/or the program(s) described in thispublication at any time without notice.
Any references in this information to non-IBM Web sites are provided forconvenience only and do not in any manner serve as an endorsement of those Websites. The materials at those Web sites are not part of the materials for this IBMproduct and use of those Web sites is at your own risk.
© Copyright IBM Corp. 2005, 2013 983

IBM may use or distribute any of the information you supply in any way itbelieves appropriate without incurring any obligation to you.
Licensees of this program who wish to have information about it for the purposeof enabling: (i) the exchange of information between independently createdprograms and other programs (including this one) and (ii) the mutual use of theinformation which has been exchanged, should contact:
IBM Software GroupAttention: Licensing3755 Riverside DrOttawa, ON K1V 1B7Canada
Such information may be available, subject to appropriate terms and conditions,including in some cases, payment of a fee.
The licensed program described in this document and all licensed materialavailable for it are provided by IBM under terms of the IBM Customer Agreement,IBM International Program License Agreement or any equivalent agreementbetween us.
Any performance data contained herein was determined in a controlledenvironment. Therefore, the results obtained in other operating environments mayvary significantly. Some measurements may have been made on development-levelsystems and there is no guarantee that these measurements will be the same ongenerally available systems. Furthermore, some measurements may have beenestimated through extrapolation. Actual results may vary. Users of this documentshould verify the applicable data for their specific environment.
Information concerning non-IBM products was obtained from the suppliers ofthose products, their published announcements or other publicly available sources.IBM has not tested those products and cannot confirm the accuracy ofperformance, compatibility or any other claims related to non-IBM products.Questions on the capabilities of non-IBM products should be addressed to thesuppliers of those products.
All statements regarding IBM's future direction or intent are subject to change orwithdrawal without notice, and represent goals and objectives only.
This information contains examples of data and reports used in daily businessoperations. To illustrate them as completely as possible, the examples include thenames of individuals, companies, brands, and products. All of these names arefictitious and any similarity to the names and addresses used by an actual businessenterprise is entirely coincidental.
If you are viewing this information softcopy, the photographs and colorillustrations may not appear.
984 IBM Cognos Report Studio Version 10.2.1: User Guide

Trademarks
IBM, the IBM logo and ibm.com are trademarks or registered trademarks ofInternational Business Machines Corp., registered in many jurisdictions worldwide.Other product and service names might be trademarks of IBM or other companies.A current list of IBM trademarks is available on the Web at “ Copyright andtrademark information ” at www.ibm.com/legal/copytrade.shtml.
The following terms are trademarks or registered trademarks of other companies:v Adobe, the Adobe logo, PostScript, and the PostScript logo are either registered
trademarks or trademarks of Adobe Systems Incorporated in the United States,and/or other countries.
v Microsoft, Windows, Windows NT, and the Windows logo are trademarks ofMicrosoft Corporation in the United States, other countries, or both.
v Linux is a registered trademark of Linus Torvalds in the United States, othercountries, or both.
v Java and all Java-based trademarks and logos are trademarks or registeredtrademarks of Oracle and/or its affiliates.
Notices 985

986 IBM Cognos Report Studio Version 10.2.1: User Guide

Glossary
This glossary includes terms and definitions forIBM Cognos Business Intelligence and IBMCognos Framework Manager.
The following cross-references are used in thisglossary:v See refers you from a term to a preferred
synonym, or from an acronym or abbreviationto the defined full form.
v See also refers you to a related or contrastingterm.
To view glossaries for other IBM products, go towww.ibm.com/software/globalization/terminology (opens in new window).
“A” “B” “C” on page 988 “D” on page 989 “E” onpage 989 “F” on page 990 “G” on page 990 “H”on page 990 “I” on page 990 “J” on page 990 “L”on page 990 “M” on page 990 “N” on page 991“O” on page 991 “P” on page 992 “Q” on page992 “R” on page 992 “S” on page 993 “T” on page993 “U” on page 994 “W” on page 994
Aaccess permission
A privilege that permits the access or useof an object.
accountability scorecardA scorecard that Metric Studioautomatically builds for each user whichcontains the metrics and projects theyown.
agent A process that performs an action onbehalf of a user or other program withoutuser intervention or on a regularschedule, and reports the results back tothe user or program.
alias An alternative name used instead of aprimary name.
anonymous accessA type of access that allows users andservers to access a server without firstauthenticating with it.
application tier componentFor installation, the set of processors thataccess the query databases to gather
information and then render the results asPDF and HTML reports and metrics.Application tier components also passrequests to Content Manager and renderthe results that Content Manager retrievesfrom the content store.
attribute
1. In dimensional models, a propertythat provides qualitative informationabout members of a level in adimension. For example, the Storelevel within the Retailer dimensionmight have properties such as addressor retail space. In general, dimensionalattributes do not have measure valuesor rollups associated with them, butare used to locate or filter members.
2. In relational models, a query item thatis not a measure or identifier. When aquery item is an attribute, it is notintended to be aggregated, or used forgrouping or generating prompt picklists.
3. In BI Modeling, a characteristic of anentity which is descriptive rather thana unique identifier or an aggregativemeasure.
authenticationThe process of validating the identity of auser or server.
authentication providerThe communication mechanism to anexternal authentication source.Functionalities, such as userauthentication, group membership, andnamespace searches, are made availablethrough authentication providers.
Bburst To create several report results by running
a single report once. For example, theuser can create a report that shows salesfor each employee, and run it once,sending different results to regionalmanagers by bursting on region.
burst keyThe dimension or level of a query in the
© Copyright IBM Corp. 2005, 2013 987
report specification that is used to create,or burst, a set of report results.
CCA See certificate authority.
calculated memberA member of a dimension whose measurevalues are not stored but are calculated atrun time using an expression.
canvasAn area within a dashboard or workspacethat users interact with to create, view,and manipulate content and data.
capabilityA group of functions and features thatcan be hidden or revealed to simplify theuser interface. Capabilities can be enabledor disabled by changing preferencesettings, or they can be controlled throughan administration interface.
cardinality
1. For relational data sources, anumerical indication of therelationship between two querysubjects, query items, or other modelobjects.
2. For OLAP data sources, the number ofmembers in a hierarchy. Thecardinality property for a hierarchy isused to assign solve orders toexpressions.
cascading promptA prompt that uses values from aprevious prompt to filter the values in thecurrent prompt or pick list.
certificateIn computer security, a digital documentthat binds a public key to the identity ofthe certificate owner, thereby enabling thecertificate owner to be authenticated. Acertificate is issued by a certificateauthority and is digitally signed by thatauthority. See also certificate authority.
certificate authority (CA)A component that issues certificates toeach computer on which components areinstalled.
CGI See Common Gateway Interface.
cipher suiteThe combination of authentication, key
exchange algorithm, and the SecureSockets Layer (SSL) cipher specificationused for the secure exchange of data.
class styleA combination of formattingcharacteristics, such as font, font size, andborder, that the user names and stores asa set.
CM See Content Manager.
Common Gateway Interface (CGI)An Internet standard for defining scriptsthat pass information from a web serverto an application program, through anHTTP request, and vice versa.
conditionAn expression that can be evaluated astrue, false, or unknown. It can beexpressed in natural language text, inmathematically formal notation, or in amachine-readable language.
conformed dimensionA dimension with a single definition thatcan be reused or shared across multiplecoordinated data marts.
constraint
1. A security specification that deniesone or more users the ability to accessa model component or to perform amodeling or authoring task.
2. A restriction on the possible valuesthat users can enter in a field.
contactA named email address to which reportsand agent e-mails can be sent. Contactsare never authenticated.
content localeA code that is used to set the language ordialect used for browsers and report text,and the regional preferences, such asformats for time, date, money, moneyexpressions, and time of day.
Content Manager (CM)The service that retrieves informationfrom the content store, and savesinformation to the content store.
content storeThe database that contains the dataneeded to operate, such as reportspecifications, published models, andsecurity rights.
988 IBM Cognos Report Studio Version 10.2.1: User Guide

credentialA set of information that grants a user orprocess certain access rights.
cube A multidimensional representation of dataneeded for online analytical processing,multidimensional reporting, ormultidimensional planning applications.
custom setIn Analysis Studio, a named object whichcan include filter rules, calculations, andsort rules. Custom sets can define a set ofmembers that is different from any setoriginally defined in the cube model. Seealso predefined set, set.
Ddashboard
A web page that can contain one or morewidgets that graphically representbusiness data.
data sourceThe source of data itself, such as adatabase or XML file, and the connectioninformation necessary for accessing thedata.
data source connectionThe named information that defines thetype of data source, its physical location,and any sign-on requirements. A datasource can have more than oneconnection.
data treeWithin a studio, a structure that containsobjects such as query subjects, queryitems, dimensions, levels, and members.A data tree is used as a palette of theavailable data that can be inserted intocalculations, filters, display areas, andother authoring gestures.
deploymentThe process of moving an application(such as a report or model) to a differentinstance. For example, reports are oftencreated in a test environment and thendeployed to production. When anapplication is deployed, it is exported,transferred, and imported.
deployment archiveA file used for deployment. A deploymentarchive contains the data from the contentstore that is being moved.
deployment specificationA definition of what packages to move(deploy) between source and targetenvironments, the deploymentpreferences, and the archive name.Deployment specifications are used forimport and export.
derived indexA calculated metric that provides a statusand a score based on other metrics.
details-based setA set based on an item and its immediatedetails. See also set.
dimensionA broad grouping of descriptive dataabout a major aspect of a business, suchas products, dates, or locations. Eachdimension includes different levels ofmembers in one or more hierarchies andan optional set of calculated members orspecial categories.
dimensional data sourceA data source containing data modeledusing OLAP concepts, includingdimensions, hierarchies, and measures.
drill downIn a multidimensional representation ofdata, to access information by startingwith a general category and movingdownwards through the hierarchy ofinformation, for example from Years toQuarters to Months.
Eevent A change to a state, such as the
completion or failure of an operation,business process, or human task, that cantrigger a subsequent action, such aspersisting the event data to a datarepository or invoking another businessprocess.
event keyA combination of data items that uniquelydefines an event instance. Identifying anevent instance enables the agent todetermine if it is new, ongoing orstopped.
event listThe set of detected event instances
Glossary 989

evaluated by the task execution rules todetermine which agent tasks should beperformed.
Ffact See measure.
Ggateway
An extension of a web server programthat transfers information from the webserver to another server. Gateways areoften CGI programs, but may follow otherstandards such as ISAPI and Apachemodules.
glyph The actual shape (bit pattern, outline) of acharacter image. For example, italic A androman A are two different glyphsrepresenting the same underlyingcharacter. Strictly speaking, any twoimages which differ in shape constitutedifferent glyphs. In this usage, glyph is asynonym for character image, or simplyimage (The Unicode Standard – Version1.0).
governorA set of rules to limit user activities, suchas the execution of reports, that eithertake too long or consume too manyresources.
group A collection of users who can share accessauthorities for protected resources.
groupingIn reporting, the process of organizingcommon values of query items togetherand only displaying the value once.
Hhierarchy
The organization of a set of entities into atree structure, with each entity (except theroot) having one or more parent entitiesand an arbitrary number of child entities.
Iinformation card
A display of high-level information aboutdashboard, workspace, or report content,such as owner, contact information, date
modified, and an optional thumbnail viewof the dashboard, workspace, or report.
information paneIn Analysis Studio, a pane that helps theuser to confirm their selection in the datatree by displaying related information,such as the level and attributes.
initiativeA task developed to achieve objectives orclose the gap between performance andtargets. Initiatives are associated withindividual objectives and often known asprojects, actions, or activities.
item See member.
Jjob A group of runnable objects, such as
reports, agents, and other jobs that theuser runs and schedules as a batch.
job stepThe smallest part of a job that can be runseparately. A job step can be a report or itcan be another job.
Llayout The arrangement of printed matter on a
screen or page, including margins, linespacing, type specification, header andfooter information, indents, and more.
level A set of entities or members that formone section of a hierarchy in a dimensionand represent the same type of object. Forexample, a geographical dimension mightcontain levels for region, state, and city.
locale A setting that identifies language orgeography and determines formattingconventions such as collation, caseconversion, character classification, thelanguage of messages, date and timerepresentation, and numericrepresentation.
MMDX See Multidimensional Expression
Language.
measureA performance indicator that isquantifiable and used to determine howwell a business is operating. For example,
990 IBM Cognos Report Studio Version 10.2.1: User Guide

measures can be Revenue,Revenue/Employee, and Profit Marginpercent.
memberA unique item within a hierarchy. Forexample, Camping Equipment and 4 Mantent are members of the Productshierarchy.
metric A measure to assess performance in a keyarea of a business.
metric extractA set of mappings between an existingCognos data source and a Metric Studioobject or value. For example, a cubemeasure named Revenue is mapped to aMetric Studio metric named RevenueActual Value.
metric packageIn Cognos Connection, a representation ofa Metric Studio application. A metricpackage contains connection information,reports, and metric management tasks forthat application. See also package.
metric storeA database that contains content formetric packages. A metric store alsocontains Metric Studio settings, such asuser preferences.
metric typeA category of metrics that defines thebusiness rules such as performancepattern, units, and meaning of a group ofmetrics. For example, Revenue can be ametric type, and European Revenue andNorth American Revenue would bemetrics of this type.
model A physical or business representation ofthe structure of the data from one or moredata sources. A model describes dataobjects, structure, and grouping, as wellas relationships and security. In CognosBI, a model is created and maintained inFramework Manager. The model or asubset of the model must be published tothe Cognos server as a package for usersto create and run reports.
model segmentA part of a Framework Manager project,such as a parameter map, a data source, anamespace, or a folder, that is a shortcutto a second project. Segments are used to
simplify model maintenance or tofacilitate multi-user modeling.
multidimensional data sourceSee dimensional data source.
Multidimensional Expression Language (MDX)The multidimensional equivalent ofStructured Query Language (SQL).
Nnamed set
See predefined set.
namespaceA part of the model in which the namesmay be defined and used. Within anamespace, each name has a uniquemeaning.
news itemA single entry in a Really SimpleSyndication (RSS) compatible format. Itcan include a headline, text, and a link tomore information. A news item task in anagent can be used to create news itemsfor display in a Cognos Connectionportlet.
normalizationThe process of restructuring a data modelby reducing its relations to their simplestforms. It is a key step in the task ofbuilding a logical relational databasedesign. Normalization helps avoidredundancies and inconsistencies in data.An entity is normalized if it meets a set ofconstraints for a particular normal form(first normal form, second normal form,and so on).
Oobject In Report Studio, an empty information
container that can be dragged to a reportfrom the Toolbox tab and then filled withdata. Reports are made up of objects,which include crosstabs, text items,calculations, graphics, and tables.
object extractAn extract that defines the metadata for aMetric Studio object, such as a userdefined column, a scorecard, or a datasource.
Glossary 991

Ppackage
A subset of a model, which can be thewhole model, to be made available to theCognos server. See also metric package.
page setIn Report Studio, a set of one or moredesigned pages which repeat in the reportoutput for each instance of a chosenquery item. See also set.
passportSession-based information, stored andencrypted in Content Manager memory,regarding authenticated users. A passportis created the first time a user accessesCognos 8, and it is retained until asession ends, either when the user logs offor after a specified period of inactivity.
portletA reusable component that is part of aweb application that provides specificinformation or services to be presented inthe context of a portal.
predefined setA set of members defined inside an OLAPdata source as a list or by an expression.Predefined sets can be used in analysisand report authoring. See also custom set,set.
product localeThe code or setting that specifies whichlanguage, regional settings, or both to usefor parts of the product interface, such asmenu commands.
project
1. In Metric Studio, a task or set of tasksundertaken by a team and monitoredon a scorecard. A project tracks dates,resources, and status.
2. In Framework Manager, a set ofmodels, packages, and relatedinformation for administration, andfor sharing model information.
3. In Metric Designer, a group ofextracts. Each extract contains themetadata that is used to populate theMetric Studio data store or to createapplications.
promptA report element that asks for parametervalues before the report is run.
properties paneWithin a studio, a pane that provides anoverview of the properties for selecteddata. The properties pane can also beused to make several changes and applythem at the same time, instead ofrepeating several different commands.
publishIn Cognos BI, to expose all or part of aFramework Manager model orTransformer PowerCube, through apackage, to the Cognos server, so that thedata can be used to create reports andother content.
Qquery The simple report specifications created
and edited by Query Studio.
query itemA representation of a column of data in adata source. Query items may appear in amodel or in a report and contain areference to a database column, areference to another query item, or acalculation.
query subjectA named collection of query items thatare closely functionally related. Querysubjects are defined using FrameworkManager to represent relational data andform the set of available data forauthoring reports in Query Studio andReport Studio. A query subject is similarto a relational view in that it can betreated as a table but does not necessarilyreflect the data storage.
RReally Simple Syndication (RSS)
An XML file format for syndicated webcontent that is based on the Really SimpleSyndication specification (RSS 2.0). TheRSS XML file formats are used by Internetusers to subscribe to websites that haveprovided RSS feeds. See also Rich SiteSummary.
repeaterIn Report Studio, a cell container thatrepeats values within itself with nopredefined internal structure.
992 IBM Cognos Report Studio Version 10.2.1: User Guide

repeater tableIn Report Studio, a table-like containerthat repeats cells across and down thepage or row in the associated query.
report A set of data deliberately laid out tocommunicate business information.
report outputThe output produced as a result ofexecuting a report specification against adata set.
report specificationAn executable definition of a report,including query and layout rules, whichcan be combined with data to produce areport output.
report viewA reference to another report that has itsown properties, such as prompt values,schedules, and results. Report views canbe used to share a report specificationinstead of making copies of it.
response fileAn ASCII file that can be customized withthe setup and configuration data thatautomates an installation. During aninteractive installation, the setup andconfiguration data must be entered, butwith a response file, the installation canproceed without any intervention.
Rich Site Summary (RSS)An XML-based format for syndicated webcontent that is based on the RSS 0.91specification. The RSS XML file formatsare used by Internet users to subscribe towebsites that have provided RSS feeds.See also Really Simple Syndication.
RSS
1. See Really Simple Syndication.2. See Rich Site Summary.
Sscore A number or ranking that expresses
applicability in relation to a standard.
scorecardA collection of metrics representing theperformance of one unit or aspect of anorganization.
scorecard structureThe hierarchy of scorecards that reflectshow an enterprise organizes its metrics.
security providerSee authentication provider.
selection-based setA collection of individual items that theuser has explicitly selected. The items ormembers may be selected from one ormore levels of the same hierarchy. Seealso set.
sessionThe time during which an authenticateduser is logged on.
set A collection of related items or members.Members in a set may be specificallychosen, or selected by one or more filterrules. See also custom set, details-basedset, page set, predefined set,selection-based set, stacked set.
stacked setTwo or more sets arranged one aboveanother in rows or side-by-side incolumns. See also set.
strategyThe overall plan of action (such as for abrand unit, business unit, channel, orcompany) to achieve a stated goal.Strategies normally cover a period ofmore than one year.
strategy mapIn Metric Studio, a visual representationof the strategy and the objectives of thatstrategy for an organization. For example,a strategy map may show employees howtheir jobs are aligned to the overallobjectives of the organization.
summaryIn reporting and analysis, an aggregatevalue that is calculated for all the valuesof a particular level or dimension.Examples of summaries include total,minimum, maximum, average, and count.
Ttask An action performed by an agent if the
event status meets the task executionrules. For example, an agent can send anemail, publish a news item, or run areport.
task execution ruleA user-specified option within an agentthat determines which statuses and values
Glossary 993

cause a task to be run. It determineswhich tasks to execute for each eventinstance.
templateIn report authoring, a reusable reportlayout or style that can be used to set thepresentation of a query or report.
thumbnailAn icon-sized rendering of a largergraphic image that permits a user topreview the image without opening aview or graphical editor.
tuple An ordered collection of two or moremembers from different dimensions. Forexample, the tuple (2007, CampingEquipment, Japan) returns the value forthe intersection of the three members:2007, Camping Equipment, and Japan.Tuples can be used to filter and sort data,and to create calculations.
Uunion set
See stacked set.
user Any individual, organization, process,device, program, protocol, or system thatuses the services of a computing system.
user-defined columnIn metric management, a column used torepresent a value other than the actual ortarget. It may be an industry benchmarkor any other useful additional numericalinformation for a period, including acalculation based on the other values ofthe metric. User-defined columns may bedifferent for each metric type.
Wwatch list
A list of metrics that each user has chosento monitor closely. If notification isenabled in Metric Studio, the user willreceive email notification of changes tothese metrics. Users can also choose todisplay their watch list as a portlet withinCognos Connection.
watch ruleA user-defined condition that determineswhether a report is delivered to the user.When the rule is run, the output isevaluated and, if it satisfies the condition
or rule, the report is delivered by email ornews item. Watch rules limit reportdelivery to those reports containing dataof significance to the user.
Web Services for Remote PortletsA standard for creatingpresentation-oriented web services so thatthey can be easily integrated within otherapplications, such as web portals.
widgetA portable, reusable application or pieceof dynamic content that can be placedinto a web page, receive input, andcommunicate with an application or withanother widget.
work areaThe area within a studio that contains thereport, analysis, query, or agent currentlybeing used.
workspaceSee dashboard.
994 IBM Cognos Report Studio Version 10.2.1: User Guide

Index
Special characters-- characters
errors when filtering 535marking special cells 387troubleshooting in reports 481
! characters 533* characters 387% calculations
in dimensional reporting 303in relational reporting 250
Numerics100% stacked charts 1013-D charts 102
Aabsolute charts 100access code
setting for active report 173accessibility features 467
keyboard shortcuts 467accessible reports 468
adding alternate text 470adding summary text 471associating labels to prompt controls 472conditional blocks 473emphasizing text 471headings 471report output options 469specifying cell headers in tables 471
active reports 171adding controls 186adding interactivity 184controls 171converting existing reports 172creating and managing active report variables 184defining connections between controls 192drill-through links do not work 506example 199, 203in workspaces in IBM Cognos Workspace 4integrating with IBM Cognos Workspace 184running 199saving in MHT format 199setting access code 173setting properties 173specifying maximum number of rows that can appear 173specifying reaction behavior of controls 195specifying selection behavior of controls 194summarizing data 198unable to add to Cognos Workspace 498unable to view in Firefox 498unable to view in Firefox 8 or later 498using master detail relationships when authoring
decks 197variables 172
addingdata 41
aggregatinglimitations with measures 534mapping functions from data sources 228member sets 272samples and time dimensions 509specifying aggregation properties in models 222troubleshooting running totals 496using a simple summary in dimensional reporting 268using simple summaries in relational reporting 221values in crosstabs and charts 269
aliases in maps 166aligning objects 339alternate text
accessibility 470Analysis Studio
creating templates in Report Studio 451annotations
chart baselines 128notes in charts 127
area charts 88arithmetic overflow errors 497Auto Group & Summarize 221automating IBM Cognos BI using the IBM Cognos Software
Development Kit 37averages
moving and rolling 272axes 14
in charts 80titles in maps 164
axis scales 122
Bbackgrounds
adding background effects to charts 334adding colors to objects 353changing in current default charts 115changing in legacy charts 115colors not appearing in templates 478inserting background images 334troubleshooting in charts 479
bar charts 87base text direction 56baselines
adding to charts 128bevels
adding to legacy charts 116bidirectional support 56
digit shaping 389enabling 45reports 5
binary round-off errors 486BlackBerry devices
creating mobile reports for 61block objects 31blocks
inserting 336resizing 349
bookmarksadding 442creating for drill-through access 418
© Copyright IBM Corp. 2005, 2013 995

bordersadding to charts 334adding to legacy charts 116adding to objects 332
bottom filtering 262broadcasting same report to different users
See burst reportsbubble charts 91
specifying bubble size in current default charts 148bubble size 15Build Prompt Page tool 314bullet charts 13, 93
customizing current default charts 152burst reports 379
creating against cubes 384creating against dimensional data sources 384creating calculated fields to define recipients 379defining groups 381defining recipients 379denial of service errors in dimensional reporting 499denial of service errors in relational reporting 245enabling in IBM Cognos Connection 383Microsoft Excel format 553setting options 382troubleshooting 495
business keysusing for drill-through 421
button bars 187
Ccalculated fields in burst reports 379Calculation Intersection 542calculations
adding in dimensional reporting 302adding in relational reporting 248building in dimensional reporting 304building query calculations in relational reporting 251creating simple in dimensional reporting 303creating simple in relational reporting 250function quality of service indicators in dimensional
reporting 537function quality of service indicators in relational
reporting 251intersecting in crosstabs and charts 539limitations in dimensional reporting 538limitations in relational reporting 249limitations with units of measure in dimensional
reporting 538limitations with units of measure in relational
reporting 248null values 542resolving in dimensional data sources 542solve order in dimensional reporting 537solve order in relational reporting 248unexplained number discrepancies 486using quotation marks in dimensional reporting 538using quotation marks in relational reporting 251
calculations do not appear in target reporttroubleshooting drilling through 505
CAMID,See IBM Cognos Access Manager ID
cascading promptsadding 325
cascading style sheets 351cast_Date functions
troubleshooting 493
changed featuresversion 10.1.1 10version 10.2.0 7
chart configurations100% stacked 1013-D 102stacked 100standard 100
chart propertiesspecifying 81
chart types 83area charts 88bar charts 87bubble charts 91bullet charts 93column charts 84combination charts 90gauge charts 94line charts 85Marimekko charts 97metrics range charts 99microcharts 96Pareto charts 95pie charts 86point charts 89polar charts 98progressive column charts 96quadrant charts 92radar charts 98scatter charts 90win-loss charts 96
charts 12, 79accessible reports 473adding alternate text 470aggregating values 269axes 14background effects 334background effects in legacy charts 116backgrounds in current default charts 115backgrounds in legacy charts 115bands of color in the background 123baselines 128borders 334bubble size 15bullet 13changing backgrounds in current default charts 115changing backgrounds in legacy charts 115changing colors 108changing lines 119changing scales 119color by value 15colored regions in current default charts 118configurations 83converting current default charts to a matrix 143converting types 103creating 79cumulation line in current default Pareto charts 151cumulation line in legacy Pareto charts 151current default 79current default in Report Studio 12customizing current default combination charts 141customizing labels 119customizing legend items in current default charts 125customizing legend items in legacy charts 126customizing palettes 108defining colors by values in current default charts 147defining query contexts 138
996 IBM Cognos Report Studio Version 10.2.1: User Guide

charts (continued)displaying every second label 479drilling through 155drilling up and down 154drop shadows 334elements 80enhanced styles 14fills 334gridlines 123inserting microcharts into crosstabs 152legacy 79legacy and current default 462legacy in Report Studio 12limitations 501markers 131matrices 13metrics range 156notes 15, 127pie 14positioning legends in current default charts 124properties not supported in Microsoft Excel 553regression lines in current default charts 135regression lines in legacy charts 136resizing 349resizing current default 108resizing legacy 108resolving multiple calculations 539series colors in current default combination charts 141setting properties 104showing data labels 136showing data labels in current default charts 138showing data labels in current default pie and donut
charts 137showing data points 140showing value markers 140specifying bubble size in current default bubble
charts 148specifying default measures 74summarizing small slices or items in current default
charts 139tooltips 104troubleshooting axis labels 478troubleshooting differences in appearance when run in
different formats or on different operating systems 499troubleshooting gray gradient backgrounds 479types 83types not supported in Microsoft Excel 553
checkbox groups 188classes
changing the default for a report 351clipboards
copying reports 453opening reports 454
Cognos Business Insightchanged name 7
Cognos Business Insight Advancedchanged name 7
Cognos SQLin dimensional reporting 295in relational reporting 246
Cognos Statisticsobject missing from a report 502removal in version 10.2.1 3
Cognos Workspacecreating reports for workspaces 57filters in workspaces 59
color by value 15
colored regionsadding to current default charts 118
colorsadding to current default charts 147adding to objects 353changing in charts 108not appearing in templates 478
column charts 84columns 41
adding multiple items in a single column 342calculated in dimensional reporting 302calculated in relational reporting 248grouping in relational reporting 214hiding or showing in list controls 197setting the group span 216sorting in dimensional reporting 283sorting in relational reporting 235swapping with rows 74width limitations in Microsoft Excel 551
combination charts 90concatenating strings 539Condition Explorer 26conditional block lists
inserting 337conditional blocks
accessible reports 473conditional palettes
creating 111conditional rendering 370
adding multiple layouts 375adding variables 370, 371example 373hiding and showing objects 372
conditional stylescreating 365using variables 369
container direction 56context filters
creating 279prompting with 281
continuous values sliders 189control data items
referencing 192controls
active reports 171adding data 190adding to an active report 186button bars 187buttons 189checkbox groups 188continuous values sliders 189data button bars 187data checkbox groups 188data decks 186data discrete values sliders 189data drop down lists 188data iterators 189data list boxes 188data radio button groups 188data repeater tables 186data tab controls 187data toggle button bars 187decks 186defining connections 192discrete values sliders 189drop down lists 188iterators 189
Index 997

controls (continued)list boxes 188radio button groups 188referencing data items defined in static controls 192repeater tables 186row numbers 186specifying reaction behavior 195specifying selection behavior 194tab 187toggle button bars 187variable text items 186
convertinglists to crosstabs 75lists to repeaters 65reports to templates 451to MDX in dimensional reporting 297to SQL in dimensional reporting 297to SQL in relational reporting 247
copyingreports to the clipboard 453
copying reports 454Count
changes between IBM Cognos ReportNet and IBM CognosBI 465
Count Distinct 465crosstab node members 67crosstab nodes 67crosstabs 67
aggregating values 269allow sorting 197applying table styles 340creating single-edge 70crosstab node members 67crosstab nodes 67default measures 74defining independent drill-through definitions 427discontinuous 76formatting 69indenting data 74inherited table styles 5intersections 69nesting data 71order of styles 69overflow errors 493resolving multiple calculations 539showing values as percentages 72
CRX-API-0018 errors 537CSV format
importing your own files 355producing reports in 48
cubestroubleshooting drilling through to relational data 503
cumulation linesin current default charts 151in legacy charts 151
currenciesdata format limitations in Microsoft Excel output 552formatting 387formatting disappearing in SSAS 2005 495
current default charts 79, 462custom groups
creating 215, 265
Ddashboards
creating 311
dashboards (continued)using bullet charts 93using gauge charts 94using global filters 313
dataadding 41
data button bars 187data checkbox groups 188data containers
inserting from the Toolbox tab 41data decks 186data discrete values sliders 189data does not appear in target report
troubleshooting drilling through 496data drop down lists 188data formats 387
date and time symbols 394decimal format symbols 401locale-sensitive 390Microsoft Excel limitations 552specifying default 387specifying for objects 388using patterns 393
data is not filtered in target reporttroubleshooting drilling through 505
data items tab 25data iterators 189data list boxes 188data packages
refreshing 40specifying 39
data pointsshowing in charts 140
data radio button groups 188data repeater tables 186data series in charts 80data sources 253data stores
conformed dimensions 420data tab controls 187data toggle button bars 187data trees
customizing 255date & time prompts 316date prompts 316dates
filtering 234using for drill-through access 423
decimalsrounding 388
decks 186using master detail relationships 197
denial of service errorsin dimensional reporting 499in relational reporting 245
depthcharts 104
derived columns 234detail filters 229diagrams
Metric Studio 158dial charts 94dictionary properties in maps 166digit shaping 56
in charts and maps 389dimensional 265dimensional coercion rules 544
998 IBM Cognos Report Studio Version 10.2.1: User Guide

dimensional data sourcescreating burst reports 384creating master detail relationships 295report limitations 531resolving calculations 542running reports against 531using with queries 285
dimensional reporting 253adding data 253best practices 22drilling up and down 307filtering data 278sorting data 281summarizing data 266using calculations 302working with queries 283
dimensionally-modeled relational data sourcesadding dimensional data 253limitations when aggregating measures 534
dimensions 41, 253conformed 285conformed for drill-through access 420non-conformed 285overlapping named set levels 479searching 256
discontinuous crosstabscreating 76
discrete values sliders 189distributing reports,
See burst reportsdividing by zero
troubleshooting 477Don't Print class 352double counting 465drilling down 307
creating drill-up/drill-down reports 308in charts 154using member sets 307
drilling through 415business keys 421calculations do not appear in target report 505charts 155concepts 416creating drill-through reports 423cubes to relational data 503data does not appear in target report 496data is not filtered in target report 505defining different drill-through definitions for
crosstabs 427IBM Cognos Visualizer reports 434in maps 169links not active in Safari Web browsers 496members and values 418Microsoft Excel limitations 552model-based access 416multiple values 425nested crosstab only filters on some items 505packages 418paths 416PowerCubes and packages 423PowerPlay reports 434problems with active reports 506relational data to cubes 504report formats 417report-based access 416selection contexts 417specifying drill-through text 428
drilling through (continued)troubleshooting PowerCubes 503using bookmarks 418using dates 423using member unique names 419using scope in model-based reporting 422using URLs 418with conformed dimensions 420wrong data appears in target report 496
drilling up 307creating drill-up/drill-down reports 308in charts 154using member sets 307
drop down lists 188defining no list value item 196
drop shadowsadding to legacy chart elements 116
drop shadows in charts 334Dynamic Query Migration validation option 43
Eemailing reports,
See burst reportsempty cells
specifying what appears for empty data containers 393suppressing 391
error messagesCRX-API-0018 537denial of service in dimensional reporting 499denial of service in relational reporting 245HRESULT 488missing items 494MSR-PD-0001 359MSR-PD-0012 483MSR-PD-0013 483OP-ERR-0199 214, 478OP-ERR-0201 479OP-ERR-0209 535OP-ERR-0210 535OP-ERR-0212 535OP-ERR-0213 535ORA-00907 494overflow errors in crosstabs 493PCA-ERR-0057 497PCA-ERR-0087 499QE-DEF-0288 493QE-DEF-0478 544ReferenceError: HTMLIsIndexElement is not defined 498RQP-DEF-0177 497RSV-SRV-0025 488RSV-SRV-0040 477TypeError: _IS1 is undefined 498UDA-SQL-0114 488, 497UDA-SQL-0206 488UDA-SQL-0564 497
errorsapplication errors upgrading a report 477filtering results in error characters 535null values in count summaries 480out of memory 310, 500parse errors with upgraded reports 493recursive evaluation 497troubleshooting error cells in reports 534
escape charactersin calculations in dimensional reporting 538in calculations in relational reporting 251
Index 999

examples for relational metadataprompts 408
Excel 2000 formatdeprecation notices 21
Explorer Bar 26expression editor
Aster Data 593Aster Data Data Type Formatting 595Aster Data Math 595Aster Data String 593Aster Data Trigonometry 596Block Functions 592browsing data 233Business Date/Time Functions 587Common Functions 713Constants 584Constructs 586creating filters in dimensional reporting 278creating filters in relational reporting 228creating parameters to create prompts 319Date Functions 667DB2 598DB2 Math 598DB2 Trigonometry 598dimensional coercion rules 544Dimensional Functions 725Greenplum 616Greenplum Data type formatting 617Greenplum Math 618Greenplum String 616Greenplum Trigonometry 618Informix 621Informix Math 621Informix Trigonometry 621Macro Functions 699Member Summaries 581MS Access 626MS Access Cast 626MS Access Math 627MS Access Trigonometry 628MySQL 634MySQL Math 635MySQL String 634MySQL Trigonometry 636Netezza 638Netezza Fuzzy 639Netezza Math 638Netezza Phonetic 640Netezza Trigonometry 638Operators 555Oracle 644Oracle Math 644Oracle Trigonometry 644Paraccel 653Paraccel Data type formatting 654Paraccel Math 654Paraccel String 653Postgres 655Postgres Data type formatting 657Postgres Math 657Postgres String 655Postgres Trigonometry 658Red Brick 660Report Functions 751Salesforce.com 667SAP BW 666SAP BW Math 667
expression editor (continued)SAP BW Trigonometry 666searching for values 482SQL Server 671SQL Server Math 671SQL Server Trigonometry 671Statistical functions 563Summaries 563Sybase 678Sybase Math 678Sybase Trigonometry 679Teradata 686Teradata Trigonometry 686Trigonometric functions 723Vectorwise 692Vectorwise Math 693Vectorwise String 692Vectorwise Trigonometry 693Vertica 694Vertica Data type formatting 696Vertica Math 696Vertica String 694Vertica Trigonometry 697
expressionslength 537using summary functions in relational reporting 224
extended data items 264enabling for new reports 350report option 34
extensible visualizations 174external data
MSR-PD-0012 error when importing 483MSR-PD-0013 error when importing 483supported data sources 10
Ffacts 41field sets
inserting 336fills
adding to charts 334adding to legacy charts 116
filtering-- error characters 535creating detail filters 229creating global prompts in dashboards 313creating summary filters 229data from SAP BW data sources 536data in dimensional reporting 278data in relational reporting 228date columns 234drilling through from IBM Cognos Series 7 to IBM Cognos
BI 435limitations when specifying the scope 535limitations with dimensional data sources 534members in a set 263multiple-fact queries 285removing or editing 233removing or editing detail filters 233removing or editing summary filters 233suppressing null values 391to top or bottom values 262troubleshooting _make_timestamp columns 488using context filters 279using slicers 279workspaces in Cognos Workspace 59
1000 IBM Cognos Report Studio Version 10.2.1: User Guide

filtersin_range 326
first-rows optimizationin dimensional reporting 297in relational reporting 248
floating objects 349fonts
setting in maps 164specifying colors 353specifying for reports 333
footersadding to maps 164adding to reports and lists 331
for clauses 224FOR clauses
incorrect results for OLAP 485limitations when using in summary functions 533
foregroundsadding colors to objects 353
formattingdisappearing in SSAS 2005 495
functionsquality of service indicators in dimensional reporting 537quality of service indicators in relational reporting 251
Ggauge charts 94generated prompts 316global filters in dashboards 313glossaries
accessing the IBM WebSphere Business Glossary 55glossary 987gridlines
adding to charts 123in charts 80major and minor 119
groupingdata in relational reporting 214setting group spans 216troubleshooting incorrect running totals 496troubleshooting nested list reports 478troubleshooting subtotals in grouped lists 478
groupscustom 215, 265
Hheaders
adding to reports and lists 331creating for sets 72
heatmap visualizations 177heights
specifying for objects 349hiding columns
list reports 64hiding objects 372hierarchies 41
inserting 258highlighting
adding colors to objects 353using conditional styles 365
horizontal pagination 449hotspots 153HRESULT errors 488
HTML formatproducing reports in 45
HTML itemsinserting 337
hyperlinksbuttons are not supported for Microsoft Excel 553inserting 337
IIBM Cognos for Microsoft Office
creating reports for 59IBM Cognos Software Development Kit 37IBM Cognos Visualizer reports
setting up drill-through access to IBM Cognos BI 434IBM WebSphere Business Glossary 55icons 41images
adding alternate text 470adding to chart backgrounds 334inserting in backgrounds 334inserting in reports 333Microsoft Excel limitations 549
in_range filters 326indenting
data in crosstabs 74objects 341
inline objects 31Insertable Objects pane 25, 27intersections of members
in dimensional reporting 306interval prompts 316iPhone devices
creating mobile reports for 61iterators 189
JJapanese
Microsoft Excel limitations 552join relationships
creating in relational reporting 242justification
setting for objects 347
Llabels
customizing in charts 119gauge charts
customizing 144specifying in current default gauge charts 144specifying in legacy gauge charts 145
layoutusing tables 340
layout component caches 346layout component references
inserting 338layouts 29
adding 375choosing 40pages 29relating to queries in dimensional reporting 284relating to queries in relational reporting 237report objects 30report recommendations 329
Index 1001

layouts (continued)using the page structure view 329
legacy charts 79, 462legends 13
adding titles in maps 168hiding or showing in maps 164in charts 80in maps 167positioning in current default charts 124
level hierarchies 253levels 41, 253
member unique names 419limitations
aggregating measures in dimensionally-modeled relationalor relational data sources 534
line breaks 348line charts 85line spacing 348lineage information 54linear scales
showing 119lines
adding regression lines to charts 135adding regression lines to legacy charts 136changing in charts 119
linking data items for drilling 308list boxes 188list reports
hiding columns 64lists 63
adding headers and footers 331allow sorting 197applying table styles 340converting to crosstabs 75converting to repeaters 65formatting 64grouping data 214hiding or showing columns 197inherited table styles 5limitations 532single-edge crosstabs 70subtotals in grouped lists 478
literal stringsin calculations in dimensional reporting 538in calculations in relational reporting 251
localeslocale-sensitive properties 390
location-aware reportscreating 61
locking objects 31logarithmic scales 122
showing 119
Mmacros
adding to expressions 5mailing labels
creating 65maps 161
aliases 166creating 162customizing 165dictionary property 166drilling through 169ignoring data with no features 164legends 167
maps (continued)matching data values 166Microsoft Excel limitations 552notes 168parts of a map report 162point layers 167region layers 165resizing 349showing or hiding properties 165updated 4, 9using from previous versions 9
marginssetting for objects 342
Marimekko charts 97markers
adding to charts 131master detail relationships
creating in dimensional reporting 293creating in relational reporting 244creating when authoring active reports 197denial of service errors in dimensional reporting 499denial of service errors in relational reporting 245linking members from two dimensional data sources 295using to join page sets 439
matrices 13matrix
charts 143matrix reports 67MDX
adding your own in dimensional reporting 296converting to in dimensional reporting 297working with in dimensional reporting 295
measures 41specifying defaults 74
member properties 253inserting 258
member setsaggregating 272creating 258, 307
member unique names 547relational metadata 419troubleshooting running reports with 548
members 41drill-through access 418excluding 261expanding and collapsing 263folder 253inserting properties 258intersections in dimensional reporting 306moving 261
Metric Studio diagrams 158metrics range charts 99
examples 156MHT
saving active reports 199microcharts 96
inserting 152Microsoft Excel
grouping and ungrouping repeating cells 50limitations of nested report objects 552producing reports in 49report limitations 549
missing itemstroubleshooting 494
missing values 542suppressing 391
1002 IBM Cognos Report Studio Version 10.2.1: User Guide

mobile devicescreating reports for 61inline prompts 7
models 41aggregation properties 222sample models and packages 510using design filters 45
moving averages 272MSR-PD-0001 errors 359MSR-PD-0012 errors 483MSR-PD-0013 errors 483multilingual reports 376MUNs,
See member unique names
Nnamed sets
limitations when summarizing 268nested or parallel sets overlapping 479
namesupdating references 459
native SQLin dimensional reporting 295in relational reporting 246
nested crosstab only filters on some itemstroubleshooting drilling through 505
nested list reportsnot running after upgrading 478
nested report objectsMicrosoft Excel limitations 552
nested setsunexpected summary values 483
nestingdata in crosstabs 71
new featuresversion 10.1.0 11version 10.1.1 8version 10.2.0 4version 10.2.1 1
no dataspecify not to render pages 47specifying what appears 393
No Data Contents 393notes 15
adding to charts 127adding to maps 168
null values 542calculations with SAP BW data sources 484suppressing 391suppressing with filters 391troubleshooting in count summaries 480
number data formatsMicrosoft Excel limitations 552
numeric shapingSee digit shaping
Oobjects 31
adding 30aligning 339as containers 31finding in reports 32hiding and showing 372hierarchies 32
objects (continued)indenting 341inheriting formatting from parents 32inline or block 31inserting formatting objects 338locking and unlocking 31reusing for layouts 344specifying data format 388updating reused 346
OLAP data sourcesinserting data 253limitations with relational functions 533
OP-ERR-0199 errors 214, 478OP-ERR-0201 errors 479OP-ERR-0209 errors 535OP-ERR-0210 errors 535OP-ERR-0212 errors 535OP-ERR-0213 errors 535opening reports
from other studios 454ORA-00907 errors 494Oracle data sources
troubleshooting 494Oracle Essbase
changes 479out of memory errors 310overflow errors in crosstabs 493
Ppackages 41, 253
changing 459drilling through 418referencing items in child queries 243refreshing 40selecting for your report 39
packed bubble visualizations 179padding
applying to objects 341page breaks 449
controlling 350creating 437creating with page layers 449
Page Explorer 26page layers 449page numbers
adding 446modifying with options 449
page setscreating 437joining nested page sets 439
pages 29adding 437associating queries with 437not rendering when there is no data 47
paginationhorizontal in PDF output 449specifying for HTML output 350
palettes 14conditional 111customizing in charts 108
parameter valuesclearing 45
parametersfor prompts 319using in master detail relationships in dimensional
reporting 293
Index 1003

parameters (continued)using in master detail relationships in relational
reporting 244Pareto charts 95
cumulation lines in current default charts 151cumulation lines in legacy charts 151
PCA-ERR-0057 errors 497PCA-ERR-0087 499PDF format
producing reports 45setting page options 53
PDF problemscharts 501
percent calculationsin dimensional reporting 303in relational reporting 250
personal dataimporting your own files 355
pie charts 14, 86converting to current default donut charts 149exploding slices in current default charts 150limitations for Microsoft Excel outputs 550setting the first slice angle in current default charts 149
point charts 89point layers 167polar charts 98PowerCubes
incorrect results 485troubleshooting drilling through 503
PowerPlay reportssetting up drill-through access to IBM Cognos BI 434
printingnot printing objects 352
progressive column charts 96prompt pages
creating your own 315prompt texts
customizing 323prompts 313
adding prompt buttons 325associating labels to create accessible prompts 472associating text items 472changing prompt control interfaces 321creating cascading 325creating in a report page 321creating using query macros 406date 316date & time 316examples 408generated 316in_range 326inline 7interval 316modifying 321pages 314parameters 319requiring user input 322select & search 315selecting multiple values 322showing and hiding 323showing values in generated SQL or MDX 326specifying default selections 323specifying default values 324text box 315time 316tree 326upgrading SAP BW variables 462
prompts (continued)using context filters 281using slicer filters 281using the Build Prompt Page tool 314using the expression editor 319value 315workspaces in Cognos Workspace 58
Properties 237Properties pane 26public variables
defining in active reports 4, 184
QQE-DEF-0288 errors 493QE-DEF-0478 errors 544quadrant charts 92quadrants
adding to current default charts 118queries 31
associating with pages 437connecting between data sources in dimensional
reporting 285connecting between data sources in relational
reporting 237in dimensional reporting 283in relational reporting 236multiple-fact 285referencing data items in relational reporting 237, 284referencing package items in child queries 243relating to layouts in dimensional reporting 284relating to layouts in relational reporting 237result set of multi-fact query contains blanks 501using with dimensional data sources 285working with MDX in dimensional reporting 295working with SQL in dimensional reporting 295working with SQL in relational reporting 246
query calculationscreating in dimensional reporting 304creating in relational reporting 251null values in count summaries 480
query contextdefining in charts 138
Query Explorer 26using in dimensional reporting 283using in relational reporting 236
query macros 403adding 405using to create prompts 406
Query Studiocreating templates in Report Studio 451
quotation marksin calculations in dimensional reporting 538in calculations in relational reporting 251
Rradar charts 98radio button groups 188ragged hierarchies 264referenced objects
changing 345updating 346
refreshing packages 40region layers 165regression lines 119
1004 IBM Cognos Report Studio Version 10.2.1: User Guide

regression lines (continued)in current default charts 135in legacy charts 136
relational functionslimitations when used with OLAP data sources 533
relational reporting 213adding data 213best practices 22filtering data 228grouping data 214sorting data 235summarizing data 219troubleshooting drilling through to cubes 504using calculations 248working with queries 236
Render Page when Empty 47repeater tables 186
adding interactive behavior 4repeaters
converting from lists 65formatting 340
repeating cellsgrouping and ungrouping in Excel 2007 output 50
report formatsCSV 48Excel 49HTML 45PDF 45specifying 45XML 52
report outputsaccessibility options 469Microsoft Excel 2007 10
report properties 350report samples 507report specifications 37Report Studio
bubble charts 15bullet charts 13chart axes 14chart enhancements 12chart formatting 14chart legends 13color by value 15matrix charts 13new chart technology 12notes 15pie charts 14setting options 33
ReportNet reportsformatting changes when upgrading 495
reportsactive 171adding interactivity 184changing the maximum number of tuples allowed 499converting to active reports 172multilingual 376out of memory errors in interactive HTML output 500supporting bidirectional languages 56validating 43validation options 43
resizingcurrent default charts 108legacy charts 108objects 349
reusingstyles 330
rich text itemsinserting 337supported elements 338
rolling averages 272rollup calculations
in dimensional reporting 303in relational reporting 250
round-off errors 486rounding numbers 388row numbers 186
inserting 338rows
swapping with columns 74rows per page
controlling for multiple containers in HTML and PDF 48setting 45
RQP-DEF-0177 errors 464, 497RSV-SRV-0025 errors 488RSV-SRV-0040 errors 477run options
accessibility options 469running and moving summaries
limitations with dimensional functions 538running reports 45
against dimensional data sources 531against SAP BW 531cannot find database errors 493ORA-00907 errors 494Report Studio is slow 488
running totalsdimensional functions 302troubleshooting 496
SSafari Web browsers
drill-through links not active 496Sample Outdoors Company 508
databases, models, and packages 510samples 507
Sample Outdoors Company samples 507samples 507
cubes 511database, models, and packages 510employees 509GO data warehouse 510GO Data Warehouse (analysis) package 514GO Data Warehouse (query) package 522GO Sales (analysis) package 523GO Sales (query) package 524GO Sales transactional database 511interactive 526packages 512Prompt API folder 528Sales and Marketing (Cube) package 512sales and marketing data 509Sample Outdoors Sales (cube) package 512The Sample Outdoors Company 508
SAP BW data sourcescreating burst reports 384creating expression 539large queries 498limitations when calculating data 248limitations when sorting data 281null results 484query calculations 480running reports against 531
Index 1005

SAP BW data sources (continued)sectioning reports 480units of measure notation 531
SAP variable propertiesunsupported 531
scaleschanging for chart axes 122changing intervals 119linear 119logarithmic 119
scatter charts 90scope
filtering 229using in drill-through access 422
screen resolution requirements 25scrollbars
adding to block objects 349search tab 25searching
dimensions 256section headings 219sections
creating for dimensional data 449creating on reports with SAP BW data sources 480removing 219
Secure Socket LayerMicrosoft Excel limitations 552
select & search prompts 315set definitions 261set expressions
building in dimensional reporting 304limitations in list reports 532
setsediting 261filtering 263reusing 259, 260sharing 2, 259, 260
sets of memberscreating 258nested or parallel sets overlapping 479
shared setscopying 260creating 259managing 260
sharingsets 259, 260
showing objects 372single-edge crosstabs 70singletons 43sizes
specifying for objects 349slicer filters
prompting with 281slicers
creating 279solve order 539
combined with calculated rollup aggregate function 541dimensional data sources 542
sortingcrosstabs 197data in dimensional reporting 281data in relational reporting 235limitations with SAP BW data sources 281lists 197multiple columns in dimensional reporting 283multiple columns in relational reporting 235
source tab 25
source treescustomizing 255
spacesadding around objects 341
Specifying chart properties 81spider charts 98SQL
adding your own in dimensional reporting 296adding your own in relational reporting 247Cognos in dimensional reporting 295Cognos in relational reporting 246converting to in dimensional reporting 297converting to in relational reporting 247first-rows optimization in dimensional reporting 297first-rows optimization in relational reporting 248native in dimensional reporting 295native in relational reporting 246working with in dimensional reporting 295working with in relational reporting 246
SSAS 2005 cubestroubleshooting 481
SSAS 2005 data sourcescreating expression 539disappearing data formats 495
SSAS cubesproblems when very large 310
stacked charts 100standard charts 100star charts 98strings
concatenating 539studios
Oracle Essbase changes 479styles
conditional 365reusing 330
subtotalstroubleshooting in grouped lists 478
summariesadding simple in dimensional reporting 268adding simple in relational reporting 221adding to active reports 198aggregate in dimensional reporting 273aggregate in relational reporting 224automatic in dimensional reporting 273automatic in relational reporting 224average in dimensional reporting 274average in relational reporting 225calculated 541calculated in dimensional reporting 274calculated in relational reporting 225count distinct in dimensional reporting 275count distinct in relational reporting 226count in dimensional reporting 274count in relational reporting 225custom in dimensional reporting 275custom in relational reporting 226FOR clauses 485maximum in dimensional reporting 275maximum in relational reporting 226median in dimensional reporting 276median in relational reporting 226minimum in dimensional reporting 276minimum in relational reporting 226none in dimensional reporting 276none in relational reporting 226not applicable in dimensional reporting 276
1006 IBM Cognos Report Studio Version 10.2.1: User Guide

summaries (continued)not applicable in relational reporting 226null values 542rolling and moving averages 272standard deviation in dimensional reporting 276standard deviation in relational reporting 227summarize in dimensional reporting 276summarize in relational reporting 227total in dimensional reporting 277total in relational reporting 227troubleshooting 490variance in dimensional reporting 277variance in relational reporting 227
summarizing datain dimensional reporting 266in relational reporting 219
summary filters 229summary functions
in dimensional reporting 273in relational reporting 224limitations when using FOR clauses 533using in expressions in relational reporting 224
summary textadding to tables 471
summary valuesunexpected when using nested sets 483
supporting bidirectional languages 5suppressing
data 391Symbian devices
creating mobile reports for 61
Ttab controls 187table styles
inherited 5tables
adding summary text 471applying styles 340inserting 340Microsoft Excel width limitations 551specifying cell headers 471using for layout 340
tables of contentscreating 443
tabular dataviewing 45
target reportscreating for drilling through from IBM Cognos Series
7 435templates
background colors not appearing 478converting from reports 451creating 451
textadding to reports 333creating labels for prompts 472specifying flow in objects 347
text box prompts 315textures
adding to legacy charts 116time periods
showing data only for specific 273time prompts 316TM1 data sources
order of metadata tree 483
TM1 data sources (continued)report differences 482
toggle button bars 187toolbox tab 25tooltips
adding to charts 104hiding or showing in maps 164
top filtering 262totals
troubleshooting running totals 496tree prompts
adding 316controlling the data that appears 326
treemap visualizations 176trend lines 119
in current default charts 135in legacy charts 136
troubleshootingdifferences in the appearance of charts run in different
formats or on different operating systems 499out of memory errors with reports run in interactive
HTML 500result set of multi-fact query contains blanks 501unable to open saved Active Report output in Firefox 8 or
later 498tuples
changing the maximum allowed in reports 499in dimensional reporting 306
TXT dataimporting your own files 355
UUDA-SQL-0043 errors 497UDA-SQL-0114 errors 488, 497UDA-SQL-0206 errors 488UDA-SQL-0458 errors 464UDA-SQL-0564 errors 497unbalanced hierarchies 264unexplained number calculations 486union query
creating 239units of measure 387
notation for SAP BW data sources 531unlocking objects 31upgrading
SAP BW prompt variables 462upgrading reports
applications errors 477errors 464formatting not retained 495members not suppressed for SAP BW 463overview 461reports will not open 493thousands separators missing 463
user interface 25
Vvalidating reports 43value markers
showing in charts 140value prompts 315values
showing crosstab values as percentages 72specifying defaults in prompts 324
Index 1007

variable text items 186variables
active reports 4, 172, 184adding 370, 371conditional styles 369
viewing reportstroubleshooting 495
viewspage design view 28page structure view 28
visual aids 27visualizations
adding 174changing the nesting order 182example 209extensible 174resizing 181specifying the categorical data to display 182specifying the range of values to display 182updating 183using embedded data 182
Wwaterfall charts 96Web browser settings 36Web-safe color palettes 353white spaces
adding padding to objects 341margins 342
widthsMicrosoft Excel limitations 551specifying for objects 349
win-loss charts 96Windows Mobile devices
creating mobile reports for 61word breaks 348workspaces
Cognos Workspace 57prompts in Cognos Workspace 58
wrong data appears in target reporttroubleshooting drilling through 496
XXLS format
importing your own files 355limitations 549
XMLimporting your own files 355producing a report 52report specifications 37
XQE-CON-0007 errors 498
Zzeros
suppressing 391
1008 IBM Cognos Report Studio Version 10.2.1: User Guide