Analyzing the Requirements of a Reporting Tool with Cognos ...
Upload
khangminh22Category
view
1download
0
IBM Cognos Analytics - ReportingVersion 11.0
User Guide
IBM

©
Product Information
This document applies to IBM Cognos Analytics version 11.0.0 and may also apply to subsequent releases.
Copyright
Licensed Materials - Property of IBM© Copyright IBM Corp. 2005, 2018.
US Government Users Restricted Rights – Use, duplication or disclosure restricted by GSA ADP Schedule Contract withIBM Corp.
IBM, the IBM logo and ibm.com are trademarks or registered trademarks of International Business Machines Corp.,registered in many jurisdictions worldwide. Other product and service names might be trademarks of IBM or othercompanies. A current list of IBM trademarks is available on the Web at " Copyright and trademark information " atwww.ibm.com/legal/copytrade.shtml.
The following terms are trademarks or registered trademarks of other companies:
• Adobe, the Adobe logo, PostScript, and the PostScript logo are either registered trademarks or trademarks of AdobeSystems Incorporated in the United States, and/or other countries.
• Microsoft, Windows, Windows NT, and the Windows logo are trademarks of Microsoft Corporation in the United States,other countries, or both.
• Intel, Intel logo, Intel Inside, Intel Inside logo, Intel Centrino, Intel Centrino logo, Celeron, Intel Xeon, IntelSpeedStep, Itanium, and Pentium are trademarks or registered trademarks of Intel Corporation or its subsidiaries inthe United States and other countries.
• Linux is a registered trademark of Linus Torvalds in the United States, other countries, or both.• UNIX is a registered trademark of The Open Group in the United States and other countries.• Java and all Java-based trademarks and logos are trademarks or registered trademarks of Oracle and/or its affiliates.
Microsoft product screen shot(s) used with permission from Microsoft.© Copyright International Business Machines Corporation .US Government Users Restricted Rights – Use, duplication or disclosure restricted by GSA ADP Schedule Contract withIBM Corp.
Contents
Chapter 1. Getting started in IBM Cognos Analytics - Reporting.............................. 1The user interface........................................................................................................................................ 1Work in design, structure, or preview view................................................................................................. 6Report layout and queries............................................................................................................................7
Layout..................................................................................................................................................... 7Queries....................................................................................................................................................8
Report objects..............................................................................................................................................8Find objects in a report...........................................................................................................................9
Relational and dimensional reporting styles............................................................................................ 10Options....................................................................................................................................................... 12Web browser settings................................................................................................................................ 16
Chapter 2. Creating a report.................................................................................19Templates and themes.............................................................................................................................. 19Adding data................................................................................................................................................ 19Inserting a single data item.......................................................................................................................20Validating a report......................................................................................................................................21Running a report........................................................................................................................................ 22
Limited and fully interactive reports....................................................................................................24Specify Not to Render a Page If It Does Not Contain Data................................................................. 25Controlling the Rows Per Page for Multiple Containers in HTML and PDF......................................... 25Producing a Report in CSV Format.......................................................................................................26Producing a Report in Microsoft Excel Format.................................................................................... 26Producing a Report in XML Format...................................................................................................... 27Viewing performance details............................................................................................................... 28
View Lineage Information for a Data Item................................................................................................28The IBM Cognos Analytics lineage tool............................................................................................... 29
Access the IBM InfoSphere Information Governance Catalog................................................................ 30Support for bidirectional languages.......................................................................................................... 31Reports for workspaces in Cognos Workspace.........................................................................................32
Prompts in workspaces in Cognos Workspace....................................................................................33Enable filters in workspaces in Cognos Workspace............................................................................34
Creating Reports for IBM Cognos for Microsoft Office............................................................................. 34Creating Reports for Mobile Devices......................................................................................................... 35The IBM Cognos Software Development Kit.............................................................................................35
Chapter 3. Lists................................................................................................... 37Set list properties.......................................................................................................................................37Hide columns in list reports.......................................................................................................................38Creating a scrollable list............................................................................................................................ 38Using Repeaters.........................................................................................................................................38
Chapter 4. Crosstabs........................................................................................... 41Crosstab Nodes and Crosstab Node Members......................................................................................... 41Set Crosstab Properties.............................................................................................................................43Create a Single-Edge Crosstab..................................................................................................................44Create a Nested Crosstab..........................................................................................................................44Creating headers automatically for sets in crosstabs.............................................................................. 45Showing crosstab values as percentages................................................................................................. 46Specify the Default Measure......................................................................................................................47
iii

Swap Columns and Rows.......................................................................................................................... 47Indent Data................................................................................................................................................ 47Change a List into a Crosstab.................................................................................................................... 48
Chapter 5. Charts................................................................................................ 49Current Default Charts and Legacy Charts................................................................................................49Creating Charts.......................................................................................................................................... 49
Chart Objects........................................................................................................................................49Chart Types................................................................................................................................................ 53
Choosing a Chart Type and Configuration........................................................................................... 53Column Charts...................................................................................................................................... 54Line Charts............................................................................................................................................54Pie Charts..............................................................................................................................................55Bar Charts............................................................................................................................................. 56Area Charts........................................................................................................................................... 56Point Charts.......................................................................................................................................... 57Combination Charts..............................................................................................................................57Scatter Charts.......................................................................................................................................58Bubble Charts.......................................................................................................................................59Quadrant Charts................................................................................................................................... 60Bullet Charts.........................................................................................................................................60Gauge Charts........................................................................................................................................ 61Pareto Charts........................................................................................................................................62Progressive Column Charts..................................................................................................................62Microcharts...........................................................................................................................................63Marimekko Charts................................................................................................................................ 64Radar Charts.........................................................................................................................................64Polar Charts.......................................................................................................................................... 64Range Indicator Charts........................................................................................................................ 65Chart Configurations............................................................................................................................ 65
Convert Charts From One Type to Another............................................................................................... 68Convert Legacy Charts to Current Default Charts..................................................................................... 69
Limitations When Converting Legacy Charts....................................................................................... 69Customizing chart properties.................................................................................................................... 70
Resize a Current Default Chart.............................................................................................................73Resize a Legacy Chart...........................................................................................................................74Customizing the Color Palette of a Chart.............................................................................................74Creating a Conditional Color Palette in a Chart................................................................................... 76Change a Chart Background in a Current Default Chart......................................................................79Change a Chart Background in a Legacy Chart....................................................................................80Add background effects to a chart object in a legacy chart................................................................80Add Colored Regions in a Current Default Chart................................................................................. 81Specify Custom Label Text...................................................................................................................82Customizing the Axes of a Chart.......................................................................................................... 83Showing Gridlines in a Chart................................................................................................................ 86Customize the Legend in a Current Default Chart............................................................................... 87Customize the Items in the Legend of a Legacy Chart........................................................................88Adding a note to a chart....................................................................................................................... 89Adding a baseline to a chart.................................................................................................................90Adding markers to charts.....................................................................................................................92Display Trendlines in Current Default Charts...................................................................................... 95Display Regression Lines in Legacy Scatter or Bubble Charts............................................................ 96Showing data labels or values in current default charts..................................................................... 97Showing data values in current default pie and donut charts.............................................................98Define Query Context When Customizing Legend Entries, Legend Titles, or Axis Labels..................98Summarize Small Slices, Bars, or Columns in Current Default Charts............................................... 98Customizing lines and data points in a line chart................................................................................99
iv
Customize a Current Default Combination Chart.............................................................................. 100Create a Matrix of Current Default Charts......................................................................................... 101Customize a Current Default Gauge Chart........................................................................................ 103Customize a Legacy Gauge Chart...................................................................................................... 104Defining color by value in current default scatter or bubble charts................................................. 104Specify the Bubble Size in a Current Default Bubble Chart.............................................................. 105Set the Position of the First Slice in a Current Default Pie Chart...................................................... 106Creating a Donut Chart from a Current Default Pie Chart................................................................. 106Pull Out Pie Slices in a Current Default Pie Chart..............................................................................107Define the Cumulation Line in a Current Default Pareto Chart......................................................... 108Define the Cumulation Line in a Legacy Pareto Chart....................................................................... 109Insert a Microchart into a Crosstab................................................................................................... 109Customize a Current Default Bullet Chart......................................................................................... 109
Changing the number of hotspots in a chart...........................................................................................110Create a drill-up and drill-down chart.....................................................................................................110
Chapter 6. Extensible visualizations...................................................................113Adding a visualization to a report............................................................................................................113
Example - Adding a treemap visualization ....................................................................................... 114Example - Adding a heatmap visualization ...................................................................................... 115Example - Adding a packed bubble visualization .............................................................................117Example - Adding a network diagram............................................................................................... 118
Visualization properties...........................................................................................................................119Choosing where visualizations are rendered..........................................................................................119Resizing a visualization............................................................................................................................120Changing the nesting order .................................................................................................................... 120Specifying the range values that are displayed...................................................................................... 121Summarizing data in a visualization........................................................................................................122Populating a visualization with data from the visualization definition...................................................123Updating visualizations............................................................................................................................123Converting visualizations from one type to another...............................................................................123Sorting a category field by a measure in visualizations..........................................................................124
Chapter 7. Maps................................................................................................127Adding a map to a report......................................................................................................................... 127Using latitude and longitude location information in a map.................................................................. 128Setting up Mapbox to work with IBM Cognos Analytics.........................................................................129Using custom point or region information from Mapbox in a map visualization in a report..................130Geospatial data........................................................................................................................................133Ambiguous data.......................................................................................................................................133
Chapter 8. Active Reports.................................................................................. 135Active Report Controls.............................................................................................................................135Active Report Variables........................................................................................................................... 136Convert an Existing Report to an Active Report......................................................................................136Specify Active Report Properties............................................................................................................ 136Adding Interactivity to a Report.............................................................................................................. 137
Create and Manage Active Report Variables..................................................................................... 137Adding Controls to a Report...............................................................................................................139Add Data to a Control.........................................................................................................................143Define a Connection Between Controls.............................................................................................145Specify the Selection Behavior of a Control...................................................................................... 146Specify the Reaction Behavior of a Control....................................................................................... 146Set the No Value List Item................................................................................................................. 148Show or Hide a Column or Row......................................................................................................... 148Sort Data in a List............................................................................................................................... 149Recommendation - use master detail relationships when authoring decks....................................149
v

Creating a data list...................................................................................................................................150Formatting an active report in the preview view.................................................................................... 151Summarizing Data in the Active Report Output......................................................................................151Creating application links to other reports or external web pages........................................................ 152Run or Save an Active Report.................................................................................................................. 153
Chapter 9. Relational Reporting Style.................................................................155Add Relational Data to a Report..............................................................................................................155Group Relational Data............................................................................................................................. 156
Perform Advanced Grouping..............................................................................................................156Creating relational custom groups.................................................................................................... 157Set the Group Span for a Column...................................................................................................... 157Divide data into sections....................................................................................................................158
Summarizing Data Relationally............................................................................................................... 159Add a Simple Summary......................................................................................................................160Set the Auto Group & Summarize Property.......................................................................................160Specify Detail or Summary Aggregation in the Model.......................................................................161Specify Aggregation Properties for a Data Item................................................................................161Use Summary Functions in Data Item Expressions.......................................................................... 161Summary Functions........................................................................................................................... 163
Focusing Relational Data.........................................................................................................................167Create a detail or summary filter....................................................................................................... 167Edit or remove a filter.........................................................................................................................171Browse or Search the Values of a Data Item.....................................................................................171Ignoring the Time Component in Date Columns...............................................................................172
Sorting Relational Data............................................................................................................................172Perform Advanced Layout Sorting..................................................................................................... 173
Working with Relational Queries.............................................................................................................173Specify a List of Data Items for an Object......................................................................................... 174Relate a Query to a Layout.................................................................................................................174Connecting Queries Between Different Data Sources...................................................................... 174Add a Query to a Relational Report................................................................................................... 175Create a Union Query......................................................................................................................... 176Create a Join Relationship................................................................................................................. 177Reference a Package Item in a Child Query...................................................................................... 177Create a Master Detail Relationship.................................................................................................. 178Working with Queries in SQL..............................................................................................................179
Using relational calculations................................................................................................................... 182Create a simple calculation............................................................................................................... 183Insert a Query Calculation................................................................................................................. 184Create a Layout Calculation............................................................................................................... 185
Chapter 10. Dimensional Reporting Style........................................................... 187Add dimensional data to a report............................................................................................................187
Customize the Source Tree................................................................................................................188Insert a member................................................................................................................................ 188Search for a Member..........................................................................................................................189Nest Members.................................................................................................................................... 190Insert a Hierarchy.............................................................................................................................. 190Insert a Member Property..................................................................................................................191Create a Set of Members....................................................................................................................191Sharing sets between reports............................................................................................................191Edit a Set............................................................................................................................................ 193Extended Data Items......................................................................................................................... 196Tips for working with ragged or unbalanced hierarchies..................................................................196
Creating dimensional custom groups..................................................................................................... 197Summarizing data dimensionally............................................................................................................ 198
vi

Add a Simple Summary......................................................................................................................200Summarizing values in crosstabs...................................................................................................... 200Summarizing Member Sets................................................................................................................202Rolling and Moving Averages............................................................................................................. 203Show Data for Specific Time Periods.................................................................................................203Summary Functions........................................................................................................................... 204
Focusing Dimensional Data..................................................................................................................... 208Create a context filter........................................................................................................................ 209
Sorting Dimensional Data........................................................................................................................211Sort Sets by Label...............................................................................................................................211Sort Sets in the Opposite Axis by Value.............................................................................................212Perform Advanced Set Sorting...........................................................................................................212
Working with Dimensional Queries......................................................................................................... 213Specify a List of Data Items for an Object......................................................................................... 213Relate a Query to a Layout.................................................................................................................213Using Dimensional Data Sources with Queries................................................................................. 214Connecting Queries Between Different Data Sources...................................................................... 214Multiple-fact Queries......................................................................................................................... 214Add a Query to a Dimensional Report............................................................................................... 218Add Dimension Information to a Query.............................................................................................219Create a Master Detail Relationship.................................................................................................. 220Working with Queries in SQL or MDX.................................................................................................223
Using Dimensional Calculations..............................................................................................................227Create a Simple Member Calculation................................................................................................ 227Insert a Query Calculation................................................................................................................. 228Create a Layout Calculation............................................................................................................... 230Create an Intersection (Tuple).......................................................................................................... 231Assigning a Hierarchy or Dimension..................................................................................................231
Drilling Up and Drilling Down in Dimensional Reports........................................................................... 231Member Sets...................................................................................................................................... 231Create a drill-up and drill-down report............................................................................................. 232
Chapter 11. Adding Prompts to Filter Data......................................................... 237Using customized parameters.................................................................................................................238Use the Build prompt page tool.............................................................................................................. 239Build Your Own Prompt and Prompt Page..............................................................................................239Create a parameter to produce a prompt............................................................................................... 242Create a Prompt Directly in a Report Page............................................................................................. 243Modifying prompts...................................................................................................................................244
Change the Prompt Control Interface............................................................................................... 244Specify that a prompt requires user input.........................................................................................244Allow Users to Select Multiple Values in a Prompt........................................................................... 245Show or Hide Prompt Status..............................................................................................................245Specify a Default Selection for a Prompt...........................................................................................245Customize Prompt Text......................................................................................................................246Specify Prompt Values....................................................................................................................... 246Add a Prompt Button......................................................................................................................... 247Create a Cascading Prompt............................................................................................................... 247
Control the Data That Appears in a Tree Prompt....................................................................................248Using in_range Filters with Character Data............................................................................................ 248Showing prompt values in generated SQL or MDX................................................................................. 249
Chapter 12. Laying Out a Report.........................................................................251Report layout........................................................................................................................................... 251The Page Structure View......................................................................................................................... 251Copy object formatting............................................................................................................................ 252Add a header or footer to a report or list................................................................................................ 253
vii

Add borders to an object......................................................................................................................... 254Add a Text Item to a Report.................................................................................................................... 254Specify the font for a report.................................................................................................................... 254Insert an Image in a Report.................................................................................................................... 255
Insert a Background Image in an Object...........................................................................................256Add background effects.......................................................................................................................... 256
Add background effects to a chart.................................................................................................... 257Add a background gradient to a page................................................................................................257Add a drop shadow to a container.....................................................................................................257
Insert a Formatting Object in a Report................................................................................................... 258Elements supported in rich text items.............................................................................................. 260
Adding JavaScript to a report..................................................................................................................261Align an Object in a Report...................................................................................................................... 262Using a table to control where objects appear....................................................................................... 262
Apply a Table Style.............................................................................................................................263Apply Padding to an Object..................................................................................................................... 264Set Margins for an Object........................................................................................................................ 264Add multiple items to a single column....................................................................................................264Reuse a Layout Object.............................................................................................................................265
Change a Reused Object.................................................................................................................... 265Update Reused Objects..................................................................................................................... 266
Specify text and container direction....................................................................................................... 266Specify line spacing and breaking...........................................................................................................268Specify the Height and Width of an Object............................................................................................. 269Control how other objects flow around an object...................................................................................269Specify Report Properties....................................................................................................................... 270Create and modify report and object styles............................................................................................271
Modify the report style.......................................................................................................................271Modify object styles........................................................................................................................... 271Reusing styles from another report...................................................................................................272(Don't Print) class...............................................................................................................................273Modify classes to format Query Studio reports.................................................................................273Modifying the default layout style sheet........................................................................................... 274
Add color to an object..............................................................................................................................274
Chapter 13. Working with your external data......................................................277Manage external data.............................................................................................................................. 277
Preparing to work with your external data........................................................................................ 279Import data........................................................................................................................................ 280Map data.............................................................................................................................................281Finish importing data......................................................................................................................... 282Publish the package...........................................................................................................................282Edit your external data.......................................................................................................................283Delete your external data.................................................................................................................. 283Running a report that contains external data....................................................................................284Making your reports public................................................................................................................ 284
Chapter 14. Using conditions............................................................................. 285Highlight data using a conditional style.................................................................................................. 285
Create a new conditional style...........................................................................................................286Reuse an existing conditional style................................................................................................... 287Create an advanced conditional style............................................................................................... 287Manage conditional styles................................................................................................................. 287
Highlight data using a style variable....................................................................................................... 288Adding conditional rendering to a report................................................................................................ 288
Add a variable from the condition explorer.......................................................................................289Add a variable from the properties pane...........................................................................................289
viii
Hide or show an object...................................................................................................................... 290Add conditional rendering................................................................................................................. 291Add multiple layouts.......................................................................................................................... 291Setting up a multilingual reporting environment.............................................................................. 291Create a multilingual report in Reporting.......................................................................................... 292
Chapter 15. Bursting Reports............................................................................. 295Defining Burst Recipients........................................................................................................................ 295
Create a Calculated Field...................................................................................................................295Creating the Burst Table in the Source Database............................................................................. 296Importing the Table into a Package...................................................................................................296
Specify a Burst Group..............................................................................................................................297Set Burst Options.....................................................................................................................................297Enable Bursting........................................................................................................................................298Creating Burst Reports Using Dimensional Data Sources......................................................................299
Chapter 16. Format data.................................................................................... 301Set the default data formats................................................................................................................... 301Specify the data format for an object......................................................................................................302
Specifying the number of decimals in numbers................................................................................302Digit shaping in charts and maps.......................................................................................................302
Locale-sensitive properties.....................................................................................................................304Suppress empty cells.............................................................................................................................. 304
Suppressing null cells by using filters............................................................................................... 305Specify what appears for data containers that contain no data............................................................ 305Using patterns to format data................................................................................................................. 306
Pattern guidelines.............................................................................................................................. 306Date and time symbols...................................................................................................................... 307Decimal format symbols.................................................................................................................... 313
Chapter 17. Using query macros.........................................................................315Syntax...................................................................................................................................................... 315Add a query macro...................................................................................................................................317Creating prompts using query macros....................................................................................................318
Examples - selecting country or region prompts.............................................................................. 320Examples - creating prompts that use parameter maps.................................................................. 322Examples - creating a multiple value prompt................................................................................... 323
Chapter 18. Using drill-through access............................................................... 325Understanding drill-through concepts....................................................................................................326
Drill-through paths.............................................................................................................................326Selection contexts..............................................................................................................................326Drilling through to different report formats.......................................................................................326Drilling through between packages................................................................................................... 327Bookmark references.........................................................................................................................327Members and values.......................................................................................................................... 328Member unique names...................................................................................................................... 328Conformed dimensions......................................................................................................................329Business keys.....................................................................................................................................330Scope..................................................................................................................................................330Mapped parameters...........................................................................................................................330Drilling through on dates between PowerCubes and relational packages.......................................331
Set up drill-through access in a report....................................................................................................331Create a parameter in the target.............................................................................................................332Create a drill-through definition..............................................................................................................333
Defining independent drill-through definitions for crosstabs.......................................................... 335Specify the drill-through text.................................................................................................................. 335
ix

Chapter 19. Working with multiple pages........................................................... 337Add a page to a report............................................................................................................................. 337Page breaks, page sets, and page layers................................................................................................ 337
Creating page breaks......................................................................................................................... 338Join nested page sets........................................................................................................................ 339Create page layers............................................................................................................................. 340
Add a bookmark.......................................................................................................................................340Create a table of contents....................................................................................................................... 342Insert page numbers in a report............................................................................................................. 343Control page breaks and page numbering..............................................................................................343Creating a report booklet.........................................................................................................................345Producing tabbed reports........................................................................................................................346
Chapter 20. Managing existing reports............................................................... 349Copy a report to the clipboard.................................................................................................................349
Copy a report to the clipboard in Internet Explorer..........................................................................349Copy a report to the clipboard in Firefox...........................................................................................349
Open a report from the Clipboard........................................................................................................... 349Open a file from another studio.............................................................................................................. 350
Analysis Studio query specification...................................................................................................350Managing changes in the package.......................................................................................................... 354
Update a name reference.................................................................................................................. 354Changing the package........................................................................................................................355
Appendix A. Troubleshooting............................................................................. 357Problems Creating Reports..................................................................................................................... 357
Division by Zero Operation Appears Differently in Lists and Crosstabs........................................... 357Application error appears when upgrading a report......................................................................... 357Nested List Report Containing a Data Item That is Grouped More Than Once Does Not Run
After Upgrade................................................................................................................................357Background Color in Template Does not Appear..............................................................................358Subtotals in Grouped Lists.................................................................................................................358Chart Labels Overwrite One Another.................................................................................................358Chart Shows Only Every Second Label.............................................................................................. 358Chart Gradient Backgrounds Appear Gray in Internet Explorer....................................................... 358Metadata Change in Oracle Essbase Not Reflected in Reports and in the Studios......................... 359Relationships Not Maintained in a Report With Overlapping Set Levels.......................................... 359Summaries in Query Calculations Include Nulls with SAP BW Data Sources.................................. 359Creating Sections on Reports That Access SAP BW Data Sources...................................................360Error Characters (--) Appear in Reports............................................................................................ 360Columns, Rows, or Data Disappear With SSAS 2005 Cubes............................................................ 360Function Unreliable with Sets............................................................................................................361Searching for values might return unexpected results.....................................................................361Report Differences Between TM1 Executive Viewer and IBM Cognos Analytics with TM1 Data
Sources..........................................................................................................................................361Order of Metadata Tree Differs for TM1 Data Sources......................................................................361MSR-PD-0012 error when importing external data..........................................................................362MSR-PD-0013 error when importing external data..........................................................................362
Problems Calculating Data...................................................................................................................... 362Unexpected Summary Values in Nested Sets................................................................................... 362Null Results for Calculations Using SAP BW Data Sources...............................................................363Incorrect Results with IBM Cognos PowerCubes and Time Measures............................................ 363Incorrect Results in Summaries When Using OLAP Data Sources................................................... 363
Problems Filtering Data...........................................................................................................................365Unexplained Discrepancies in Number Calculations........................................................................ 365Error when filtering on a _make_timestamp column........................................................................367
x
Problems Running Reports......................................................................................................................367Report runs slowly............................................................................................................................. 367Summaries in a report do not correspond to the visible members.................................................. 369QE-DEF-0288 Cannot Find the Database in the Content Store........................................................371Parse Errors When Opening or Running an Upgraded Report.......................................................... 371Overflow Error Occurs When a Value in a Crosstab Is More Than 19 Characters............................371The ORA-00907 Error Appears When Running a Report..................................................................371A Report or Analysis Does Not Run Because of Missing Items........................................................ 371Cannot View Burst Report..................................................................................................................371An upgraded report does not retain its original look........................................................................ 372Measure Format Disappears in SSAS 2005.......................................................................................372Drill-through Links are Not Active in the Safari Browser.................................................................. 373Data Does Not Appear in a Target Report or the Wrong Data Appears............................................ 373A Running Total in Grouped Reports Gives Unexpected Results..................................................... 373Recursive evaluation error.................................................................................................................374Arithmetic Overflow Error When Running a Report in PDF Format.................................................. 374RQP-DEF-0177 An error occurred while performing operation 'sqlPrepareWithOptions'
status='-69' UDA-SQL-0043 Error............................................................................................... 374Problems with viewing saved Active Report output in Mozilla Firefox 8 or later versions.............. 374Problems with large SAP BW queries................................................................................................375Master Detail or Burst Reports with Charts or Crosstabs May Result in Denial of Service..............375PCA-ERR-0087 error when you run a large report........................................................................... 375Differences in the appearance of charts that are run in different formats or on different
operating systems.........................................................................................................................375Out-of-memory errors with reports that are run in interactive HTML format.................................. 376Charts in PDF Output Show Unexpected Results..............................................................................376Result set of a multi-fact query contains blanks...............................................................................376Cognos Statistics object is not displayed in a report........................................................................ 377
Problems When Drilling Through............................................................................................................ 377Cannot Drill Through Between PowerCubes Because MUNs Do Not Match.................................... 377Unexpected or Empty Results When Drilling Through......................................................................378Cannot Drill Through From a Relational Source to a Cube................................................................379Calculations Do Not Appear in the Target Report............................................................................. 380Nested Crosstab Only Filters on Some Items................................................................................... 380Data is Not Filtered in the Target Report After Drill-Through...........................................................380Drill-through links in active reports do not work...............................................................................380
Appendix B. Limitations when using dimensional data sources........................... 383Running a Report Against a Dimensional Data Source...........................................................................383Limitations When Using Set Expressions in List Reports....................................................................... 383Limitations When Using Clauses in Summary Functions........................................................................384Limited Support for Relational Functions When Used with OLAP Data Sources................................... 385Limitations When Summarizing Measures in DMR Data Sources.......................................................... 385Limitations when filtering dimensional data sources.............................................................................386
Error Characters (--) When Filtering.................................................................................................. 386Limitations When Specifying the Scope of Summary Filters with Dimensional Data Sources........ 387Limitations When Filtering Data Using an SAP BW Data Source...................................................... 387
Considerations when Creating Calculations........................................................................................... 388Calculation Solve Order..................................................................................................................... 388Length of Expressions........................................................................................................................388Quality of Service Indicators..............................................................................................................388Using Quotation Marks in Literal Strings........................................................................................... 389Limitations of calculations in dimensional reporting........................................................................ 389Creating Expressions Using SAP BW Data Sources...........................................................................389Using Microsoft Excel Functions with SSAS 2005 Data Sources......................................................390Concatenating Strings........................................................................................................................390Intersecting Calculations in Crosstabs and Charts........................................................................... 390
xi

Null (Missing) Values in Calculations and Summaries...................................................................... 392Dimensional coercion rules............................................................................................................... 394Recommendation - Use Member Unique Name (MUN) Aliases....................................................... 397
Limitations When Formatting Empty Cells in SAP BW Data Sources.....................................................398
Appendix C. Limitations When Producing Reports in Microsoft Excel Format....... 399Unable to Load Images from the IBM Cognos Analytics Content Store in a Report............................. 399Blank Worksheet Appears....................................................................................................................... 399Warning Message Appears When Excel Opens an IBM Cognos Analytics Report.................................399Spreadsheet Content Not Saved for Reports Saved in XLS Format....................................................... 399Unable to Nest Labels in Charts.............................................................................................................. 399Data Series Are Truncated.......................................................................................................................400Colors Different From Those in HTML or PDF......................................................................................... 400Repeating Pie Charts............................................................................................................................... 400Unable to Skip Discrete Axis Labels........................................................................................................400Unsupported IBM Cognos Analytics Formatting.................................................................................... 400Cells Contain Series of #......................................................................................................................... 401Table and Column Widths....................................................................................................................... 401Secure Socket Layer (SSL) Is Not Supported in Some Excel Formats and Versions............................. 401Number Formats Become Currency Formats in Japanese Excel...........................................................401Reports Show Data in Wrong Columns................................................................................................... 402Unable to Access Reports on Remote Servers....................................................................................... 402Drill-through Reports Are Not Supported in Excel................................................................................. 402Map Reports Are Not Supported in Excel................................................................................................402Unsupported Excel Formatting............................................................................................................... 402Hyperlink Buttons Are Not Supported in Excel.......................................................................................402Unable to View Reports in Excel Format Sent as Email Attachments................................................... 403Many items on axis produces empty chart in Excel................................................................................403Chart legend titles are not supported in Excel....................................................................................... 403Unsupported Chart Properties in Excel...................................................................................................403Unsupported chart types in Excel........................................................................................................... 404Cell Height and Width Are Incorrect....................................................................................................... 405
Appendix D. Prompt API for IBM Cognos Analytics............................................. 407cognos.Prompt object..........................................................................................................................407
cognos.Prompt.getControlByName method............................................................................ 407cognos.Prompt.getControls method....................................................................................... 407
cognos.Prompt.Control object........................................................................................................ 408cognos.Prompt.Control.addValues method.......................................................................... 408cognos.Prompt.Control.clearValues method......................................................................409cognos.Prompt.Control.getName method.............................................................................. 409cognos.Prompt.Control.getValues method.......................................................................... 409cognos.Prompt.Control.setValidator method................................................................... 410cognos.Prompt.Control.setValues method.......................................................................... 411
cognos.Report object...............................................................................................................................412cognos.Report.getReport method............................................................................................412cognos.Report.sendRequest method....................................................................................... 412
cognos.Report.Action object.......................................................................................................... 413cognos.Report.Action.BACK..................................................................................................... 413cognos.Report.Action.CANCEL.................................................................................................413cognos.Report.Action.FINISH.................................................................................................413cognos.Report.Action.NEXT..................................................................................................... 413cognos.Report.Action.REPROMPT............................................................................................ 413
cognos.Value class..............................................................................................................................413
Appendix E. Legacy Map Manager maps............................................................. 415The Reporting map object....................................................................................................................... 415
xii

Creating a map report..............................................................................................................................416Set Map Properties.................................................................................................................................. 416Defining Data Values for the Region Layer..............................................................................................418Match Data Values to Names in the Map File......................................................................................... 418Define Data Values for the Point Layer....................................................................................................419Add Colors to the Region or Point Layer................................................................................................. 419Add a Legend Title to a Map.................................................................................................................... 420Add a Note to a Map................................................................................................................................ 420Drill Through to Another Report From a Map..........................................................................................420Edit a Map................................................................................................................................................ 421Additional Maps....................................................................................................................................... 422Location intelligence................................................................................................................................422
About this guide................................................................................................ 423
Index................................................................................................................ 425
xiii

xiv

Chapter 1. Getting started in IBM Cognos Analytics -Reporting
IBM® Cognos® Analytics - Reporting is a Web-based report authoring tool that professional report authorsand developers use to build sophisticated, multiple-page, multiple-query reports against multipledatabases. With Cognos Analytics - Reporting, you can create any reports that your organization requires,such as invoices, statements, and weekly sales and inventory reports.
The user interfaceYou enter the IBM Cognos Analytics - Reporting user interface by creating a new report or by opening anexisting report in the Cognos Analytics portal.
Many Cognos Analytics user interfaces use standard HTML, including the Cognos Analytics portal, CognosAnalytics - Reporting, and HTML viewers and reports. As reports have moved from quirks to standardHTML, there might be small differences in item sizes. These differences do not have an impact on themajority of reports that were created in previous Cognos versions. However, minor changes might berequired in a small number of existing reports, such as reports that are printed on forms. For moreinformation, see the technote Cognos Analytics conversion to Standards Mode (http://www.ibm.com/support/docview.wss?uid=swg21982010).
The following table describes where you can find features and functions in the Cognos Analytics -Reporting user interface.
Table 1. Cognos Analytics - Reporting function mapping
Cognos Analytics - Reporting interface Function
Save as
Convert to Template
Convert to Active Report
Toggles between editing the report (edit mode)and viewing the report (view mode)
Switch between the IBM Cognos Analytics portaland new or opened reports
Page design view
Page preview view
Page structure view
Properties for the selected object. The propertiesthat are available are different for each type ofobject.
Locked
Options
Layout components
Conditional styles
Clear all parameters
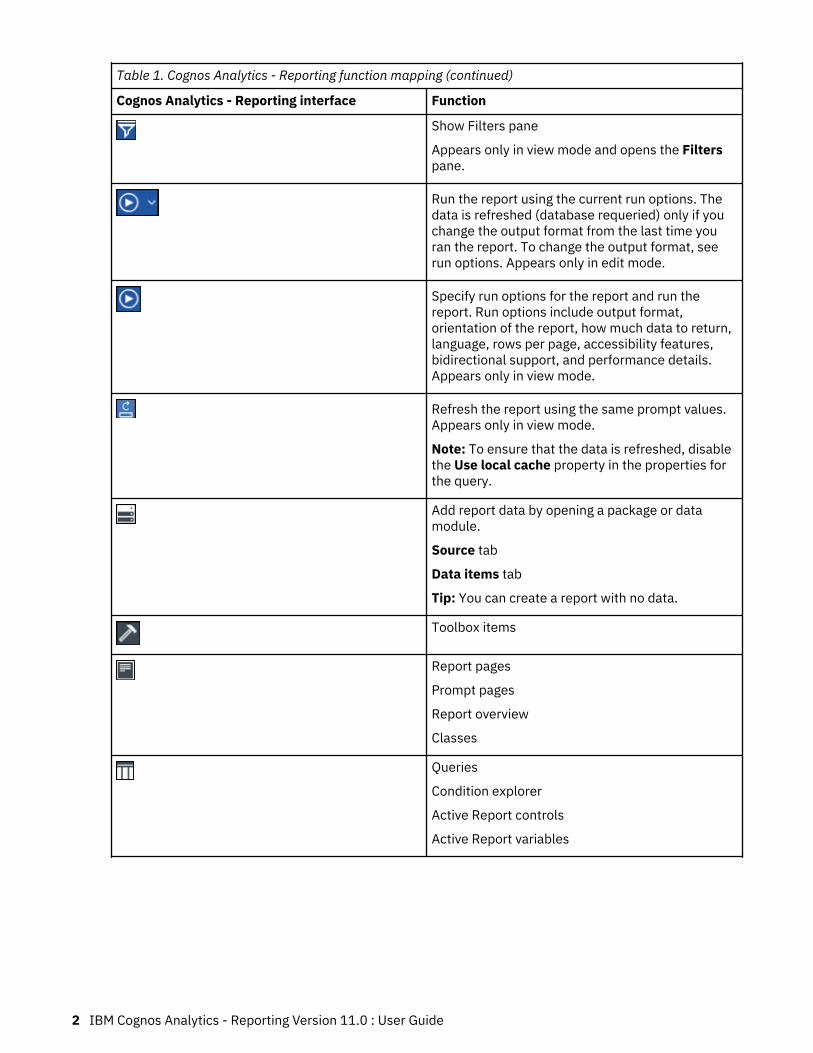
Table 1. Cognos Analytics - Reporting function mapping (continued)
Cognos Analytics - Reporting interface Function
Show Filters pane
Appears only in view mode and opens the Filterspane.
Run the report using the current run options. Thedata is refreshed (database requeried) only if youchange the output format from the last time youran the report. To change the output format, seerun options. Appears only in edit mode.
Specify run options for the report and run thereport. Run options include output format,orientation of the report, how much data to return,language, rows per page, accessibility features,bidirectional support, and performance details.Appears only in view mode.
Refresh the report using the same prompt values.Appears only in view mode.
Note: To ensure that the data is refreshed, disablethe Use local cache property in the properties forthe query.
Add report data by opening a package or datamodule.
Source tab
Data items tab
Tip: You can create a report with no data.
Toolbox items
Report pages
Prompt pages
Report overview
Classes
Queries
Condition explorer
Active Report controls
Active Report variables
2 IBM Cognos Analytics - Reporting Version 11.0 : User Guide
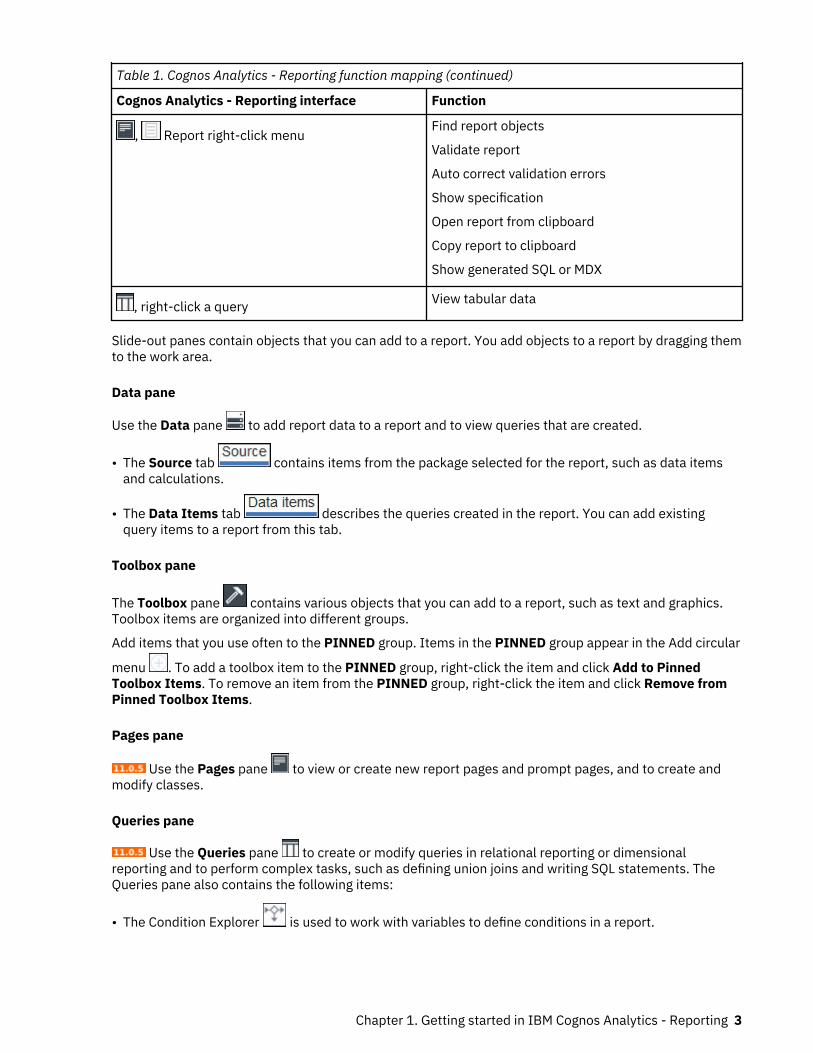
Table 1. Cognos Analytics - Reporting function mapping (continued)
Cognos Analytics - Reporting interface Function
, Report right-click menuFind report objects
Validate report
Auto correct validation errors
Show specification
Open report from clipboard
Copy report to clipboard
Show generated SQL or MDX
, right-click a query View tabular data
Slide-out panes contain objects that you can add to a report. You add objects to a report by dragging themto the work area.
Data pane
Use the Data pane to add report data to a report and to view queries that are created.
• The Source tab contains items from the package selected for the report, such as data itemsand calculations.
• The Data Items tab describes the queries created in the report. You can add existingquery items to a report from this tab.
Toolbox pane
The Toolbox pane contains various objects that you can add to a report, such as text and graphics.Toolbox items are organized into different groups.
Add items that you use often to the PINNED group. Items in the PINNED group appear in the Add circular
menu . To add a toolbox item to the PINNED group, right-click the item and click Add to PinnedToolbox Items. To remove an item from the PINNED group, right-click the item and click Remove fromPinned Toolbox Items.
Pages pane
Use the Pages pane to view or create new report pages and prompt pages, and to create andmodify classes.
Queries pane
Use the Queries pane to create or modify queries in relational reporting or dimensionalreporting and to perform complex tasks, such as defining union joins and writing SQL statements. TheQueries pane also contains the following items:
• The Condition Explorer is used to work with variables to define conditions in a report.
Chapter 1. Getting started in IBM Cognos Analytics - Reporting 3

• If you are authoring an active report, the Active Report controls icon shows the controls and activereport variables inserted in a report and their relationships to one another. You can click a control in thistab to quickly locate the control in the report and set default values for variables.
• If you are authoring an active report, the Active Report variables icon shows the active reportvariables defined in a report. Use this tab to create new variables and set default values.
Properties pane
The Properties pane lists the properties that you can set for an object in a report or for the entirereport.
When you specify a value for a property, press Enter, click another property, or save the report to ensurethat the value is saved.
Tip: You can view a description of the currently selected property in the information pane.
Filters pane
In view mode, use the Filters pane to view all filters that are created by the report consumer onthe report output. When you click a filter in this pane, all data containers that use the selected filter areautomatically highlighted in the report. When a data container is selected, the filter pane is updatedinstantly to display only filters that are applied to the selected data container. You can edit or delete thefilter directly in the pane.
You can resize the filter pane, and pin or unpin the pane depending on the screen resolution. Reportauthors also have the option to make an authored filter visible to report consumers so that they caninteract with it in this pane.
The pane cannot be used to create or view low-level filter expressions that are manually created in theexpression editor. All filters that were created in earlier versions of Cognos Analytics have the interactivefiltering feature disabled by default.
This feature is not available for active reports.
Report object toolbar
In addition to the Properties pane, you can modify an object in a report by clicking icons in the toolbarthat appears when the object is selected. The icons that are available depend on the object type.
Tip: The appearance of report object toolbars is controlled by the option Show on-demand UI on right
click (More icon , Options, View tab).
Page Layers area
When you are working with dimensional data, use the Page layers area to create sections, or pagebreaks, in a report to show values for each member on a separate page. For example, you can drag
Northern Europe sales territory from the Source tab to the Page layers area. The report isbroken into a separate page for each territory within northern Europe. Each page's context appears in thereport header.
For more information, see “Create page layers” on page 340.
4 IBM Cognos Analytics - Reporting Version 11.0 : User Guide

Context Filter area
When you work with dimensional data, use the Context filter area to filter your report to show values, orcontext, for only a specific data item. This technique is also known as a slicer filter. For example, you can
drag Sales Territory from the Source tab to the Context filter area. When you click a specificterritory from the list, the values in the crosstab change to represent data for that territory.
For more information, see “Create a context filter” on page 209.
Visual Aids icon
The visual aids icon provides the following options to help you when you are designing reports in thelayout. The visual aids icon is found in the toolbar that appears when you select the page body in thereport.
Option Description
Show Boundary Lines Shows all boundary lines around objects.
Force Boundary Lines Overrides boundary lines around objects.
Show Repeating Repeats objects when you insert them. For example, when you insert adata item in a crosstab, the data item appears in each row or in eachcolumn of the crosstab.
Show Page Header &Footer
Shows the page header and page footer.
Show Drag & Drop Padding Shows drag-and-drop zone when the Padding property for an object isset to 0. If the Padding property is set to a value that is greater than theminimum padding that IBM Cognos Analytics - Reporting uses to showdrag-and-drop zones, only the minimum padding is shown.
Show Hidden Objects Shows objects for which the Box Type property was set to None or forwhich the Visible property was set to No.
Show Sorting Shows the sorting icon for data items for which a sort order was specified.For more information about sorting data, see “Sorting Relational Data” onpage 172 or “Sorting Dimensional Data” on page 211.
Show Grouping Shows the grouping icon for grouped data items.
Show Source Type Shows the icon for the source type of objects, such as layout calculation.
Show Data Item Type Shows the icon for the type of data item, such as query item, member, ormeasure.
Show Drill-throughDefinitions
Shows data items for which the drill-through definition was defined as ahyperlink.
Show Table of ContentsEntries
Shows table of contents entries inserted in the report.
Show Bookmarks Shows bookmarks inserted in the report.
Chapter 1. Getting started in IBM Cognos Analytics - Reporting 5

Option Description
Show Master DetailRelationships
Shows master detail relationships defined in the report.
Tip: Pausing the pointer over the master detail relationship icon showsthe relationship.
Show No Data ContentsTab Control
Shows tabs if the data container's No Data Contents property is set toYes.
Show Repeater andSingleton Containers
Shows repeater and singleton containers inserted in the report.
Show Interactive ObjectControls
Shows controls for active report application objects. For more informationabout active reports, see Chapter 8, “Active Reports,” on page 135.
Show Container Selectors Shows a small selector (three orange dots) for the following containerobjects, which you can click to select all the objects within them: list,crosstab, repeater table, table of contents, table, and active reportapplication objects.
Show Empty Text Shows empty text item objects that were inserted in the report.
Show Insertion Icons Shows the Add circular menu .
Work in design, structure, or preview viewIBM Cognos Analytics - Reporting has three views in which you can author reports: Page design view,Page structure view, and Page preview view.
You choose a report authoring view by clicking the Page views icon . Different options are available ineach view, so you often need to use all views. For example, you must use the Page design and Pagestructure views to remove sections in relational reporting.
Page design view
The default view in Cognos Analytics - Reporting. In this view, you can see what your report will look likeafter you run it.
Page structure view
Displays an overview of all of the report objects in your report in a tree structure, which is organized bypage.
Page preview view
Shows you the current report page with live data. In this view, you can edit the report, such as insertingdata items into empty data containers.
When you are authoring an IBM Cognos Active Report, the page preview view shows you live data as youformat the report.
Related conceptsThe Page Structure ViewRelated tasksFormatting an active report in the preview view
6 IBM Cognos Analytics - Reporting Version 11.0 : User Guide
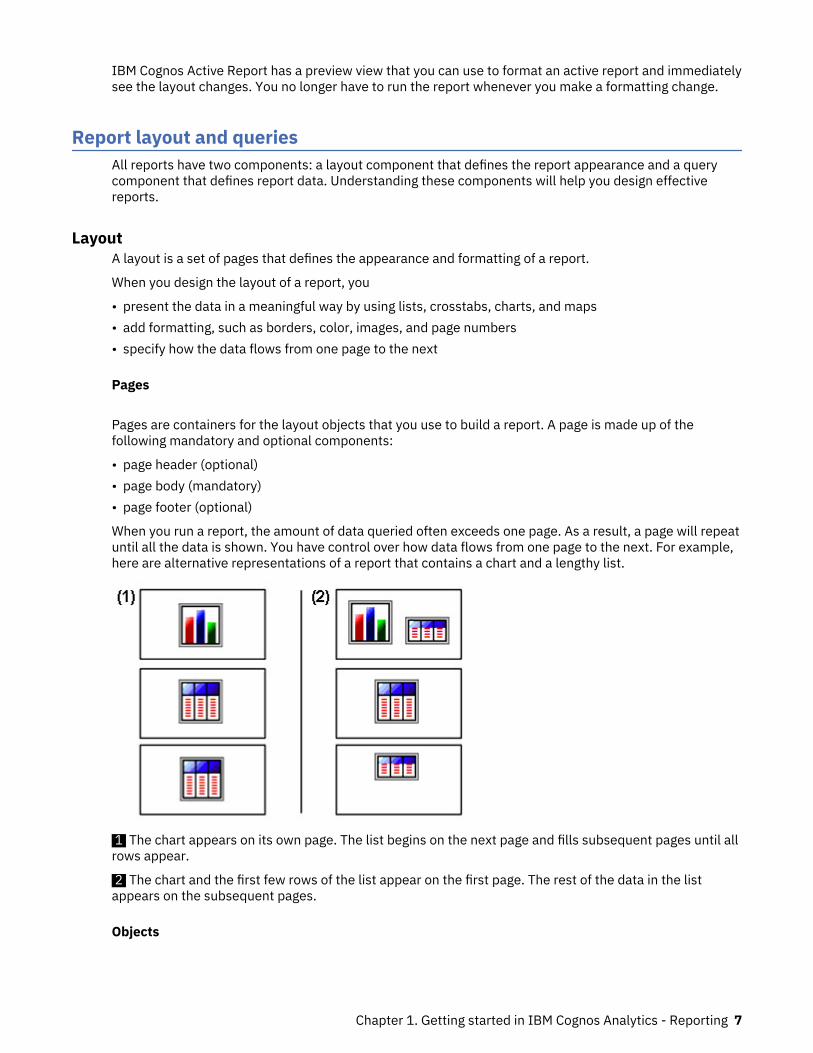
IBM Cognos Active Report has a preview view that you can use to format an active report and immediatelysee the layout changes. You no longer have to run the report whenever you make a formatting change.
Report layout and queriesAll reports have two components: a layout component that defines the report appearance and a querycomponent that defines report data. Understanding these components will help you design effectivereports.
LayoutA layout is a set of pages that defines the appearance and formatting of a report.
When you design the layout of a report, you
• present the data in a meaningful way by using lists, crosstabs, charts, and maps• add formatting, such as borders, color, images, and page numbers• specify how the data flows from one page to the next
Pages
Pages are containers for the layout objects that you use to build a report. A page is made up of thefollowing mandatory and optional components:
• page header (optional)• page body (mandatory)• page footer (optional)
When you run a report, the amount of data queried often exceeds one page. As a result, a page will repeatuntil all the data is shown. You have control over how data flows from one page to the next. For example,here are alternative representations of a report that contains a chart and a lengthy list.
1 The chart appears on its own page. The list begins on the next page and fills subsequent pages until allrows appear.
2 The chart and the first few rows of the list appear on the first page. The rest of the data in the listappears on the subsequent pages.
Objects
Chapter 1. Getting started in IBM Cognos Analytics - Reporting 7
You add layout objects to a page when you create a report. Below are objects that you will use often whenbuilding reports in IBM Cognos Analytics - Reporting:
• list
Add a list to show data in rows and columns.• crosstab
Add a crosstab to show data in a grid with dimensions along the rows and columns and measures in thecells or intersection points.
• chart• map• repeater
Add a repeater to show each instance of a certain column or data item in a separate frame.• text• block
Add a block to hold text or other information. Blocks are often used to lay out horizontal bands ofinformation.
• table
Related tasksInsert a Formatting Object in a Report
QueriesQueries determine what data items appear in the report. Sometimes you want detailed rows of data,which you obtain by using a simple SELECT statement. Other times you must calculate totals or averagesusing summary functions and grouped columns or must apply filters to show only the data you want.
IBM Cognos Analytics - Reporting automatically creates the queries you need as you build reports.However, you can modify these queries or create your own custom queries to get the results you want.
Related conceptsWorking with Relational QueriesWorking with Dimensional Queries
Report objectsYou build reports by adding objects and manipulating them to obtain the results you want. To understandhow to work with objects in IBM Cognos Analytics - Reporting, you must be familiar with the followingconcepts:
• object types• objects as containers• locking and unlocking objects• hierarchy of objects
Object types
In IBM Cognos Analytics - Reporting, layout objects are either inline or block. You can insert other objectson the same line as an inline object, but not on the same line as a block object. When you insert an objecthorizontally before or after a block object, the object appears on the line vertically before or after theblock object. Examples of inline objects include graphics and text items. Examples of block objectsinclude any report type (list, crosstab, chart, map, or repeater) and tables.
8 IBM Cognos Analytics - Reporting Version 11.0 : User Guide
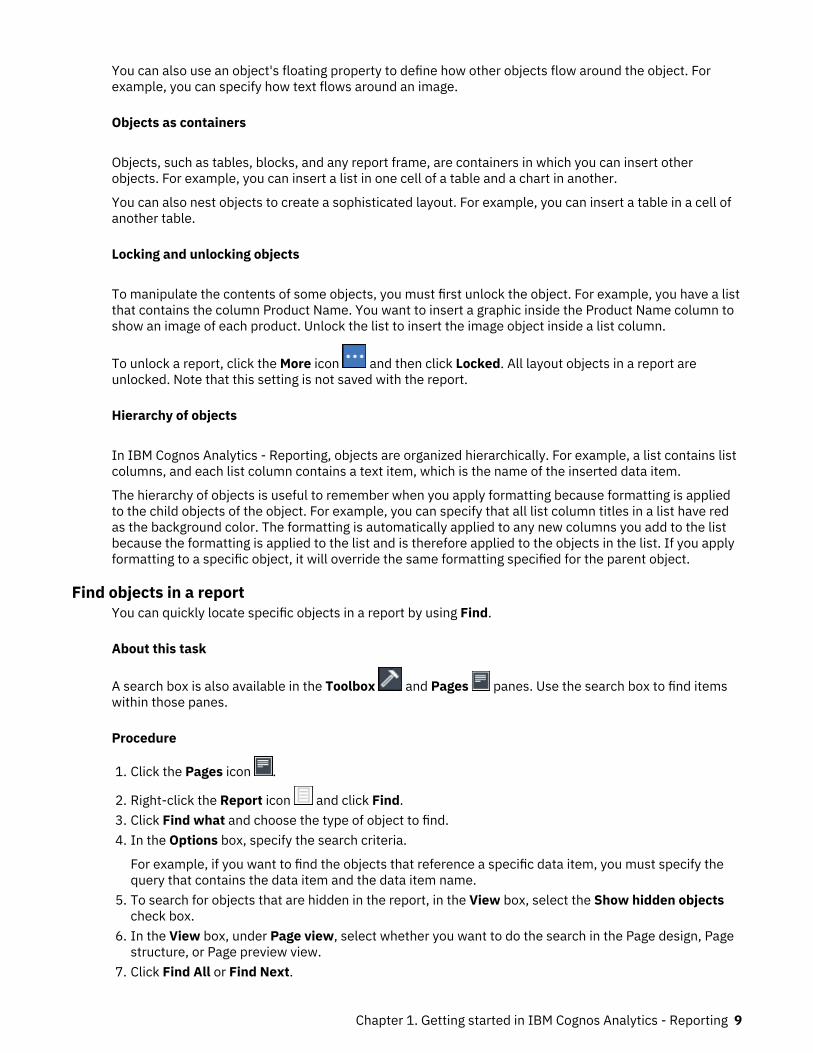
You can also use an object's floating property to define how other objects flow around the object. Forexample, you can specify how text flows around an image.
Objects as containers
Objects, such as tables, blocks, and any report frame, are containers in which you can insert otherobjects. For example, you can insert a list in one cell of a table and a chart in another.
You can also nest objects to create a sophisticated layout. For example, you can insert a table in a cell ofanother table.
Locking and unlocking objects
To manipulate the contents of some objects, you must first unlock the object. For example, you have a listthat contains the column Product Name. You want to insert a graphic inside the Product Name column toshow an image of each product. Unlock the list to insert the image object inside a list column.
To unlock a report, click the More icon and then click Locked. All layout objects in a report areunlocked. Note that this setting is not saved with the report.
Hierarchy of objects
In IBM Cognos Analytics - Reporting, objects are organized hierarchically. For example, a list contains listcolumns, and each list column contains a text item, which is the name of the inserted data item.
The hierarchy of objects is useful to remember when you apply formatting because formatting is appliedto the child objects of the object. For example, you can specify that all list column titles in a list have redas the background color. The formatting is automatically applied to any new columns you add to the listbecause the formatting is applied to the list and is therefore applied to the objects in the list. If you applyformatting to a specific object, it will override the same formatting specified for the parent object.
Find objects in a reportYou can quickly locate specific objects in a report by using Find.
About this task
A search box is also available in the Toolbox and Pages panes. Use the search box to find itemswithin those panes.
Procedure
1. Click the Pages icon .
2. Right-click the Report icon and click Find.3. Click Find what and choose the type of object to find.4. In the Options box, specify the search criteria.
For example, if you want to find the objects that reference a specific data item, you must specify thequery that contains the data item and the data item name.
5. To search for objects that are hidden in the report, in the View box, select the Show hidden objectscheck box.
6. In the View box, under Page view, select whether you want to do the search in the Page design, Pagestructure, or Page preview view.
7. Click Find All or Find Next.
Chapter 1. Getting started in IBM Cognos Analytics - Reporting 9

ResultsThe first object that meets the search criteria is selected in the report. Continue clicking Find Next toshow all other objects that meet the search criteria.
Note: In some cases, such as searching for a data item that is used to define a conditional style, IBMCognos Analytics - Reporting cannot directly select the object in the report. Instead, Reporting selects theobject that uses the object for which you are searching.
Related conceptsWork in design, structure, or preview view
Relational and dimensional reporting stylesYou can create reports in IBM Cognos Analytics - Reporting using either a relational reporting style or adimensional reporting style.
The Reporting tools and query language are the same for both styles. However, it is important to choose areporting style to ensure that you are making the most of your data and to avoid mixing dimensional andrelational concepts.
How to choose a reporting style
When authoring a report, first choose your preferred reporting style for working with data: relational ordimensional. You can choose a reporting style from your viewpoint:
• If you think about your data as tables and columns, you have a relational viewpoint and should use arelational reporting style.
• If you think about your data as a number of dimensions intersecting at cells, you have a dimensionalviewpoint and should use a dimensional reporting style.
Relational reporting style
The relational reporting style consists of lists. You focus the data with filters and summarize with headerand footer summaries.
• If your data is purely relational, then only query subjects and query items appear in the Source tab
, and you must use the relational reporting style.
• If your data is dimensional, then dimensions appear in the Source tab , and you can still use arelational reporting style, but instead of query items (columns) and query subjects (tables), you usemeasures, levels, and level properties.
To see an example of relational style reporting with dimensional data, see the Manager Profile samplereport in the GO Data Warehouse (analysis) package.
The relational reporting style is similar to report authoring in IBM Cognos Query Studio.
Dimensional reporting style
The dimensional reporting style consists of measures and members from different hierarchies arranged ina crosstab with cell values at the intersections. You focus the data with set expressions that navigate fromspecific members in the hierarchy and summarize with set summaries.
To see an example of dimensional style reporting with dimensional data, see the GO Balance Sheet as atDec 31, 2012 sample report in the GO Data Warehouse (analysis) package.
The dimensional reporting style is similar to report authoring in IBM Cognos Analysis Studio.
10 IBM Cognos Analytics - Reporting Version 11.0 : User Guide

Guidelines for each reporting style
This user guide is divided into relational and dimensional reporting sections so that you can follow thebest practices for using this product with the reporting style that you have chosen. The following tableoutlines the best practices for both reporting styles.
Item Relational reporting Dimensional reporting
Report type Lists
Crosstabs pivoted from lists
Charts created from lists
Maps created from scratch or fromlists
Crosstabs
Charts created from scratch or fromcrosstabs
Maps created from scratch or fromcrosstabs
Package treeIn the Source tab , click the
Options icon , and then click Viewmembers tree.
If you are using dimensional data,hide members in the source tree byright-clicking the tree, clickingPackage Tree Settings, and clearingthe check boxes for Members andMembers for each level.
The view will include the following:
package
folder
namespace
query subject
query item
measure
level
In the Source tab, click the Optionsicon, and then click View memberstree.
Ensure that the option Create sets isselected.
The view will include the following:
package
folder
measure
member
named set
Inserting data From the package tree, add queryitems or levels to the report.
Avoid using hierarchies directly in thereport.
Avoid using named sets.
From the package tree, add sets ofmembers to the report.
You can also choose to insert just themember, just the children of themember, or the member and itschildren.
Calculating data Add query calculations using onlyrelational and common constructs.
Choose only Other expression.
Add query calculations using onlydimensional and common constructs.
Use Other expression only for valuecalculations.
Avoid Common functions that aremarked with an exclamation mark (!)because they have limited support.
Chapter 1. Getting started in IBM Cognos Analytics - Reporting 11
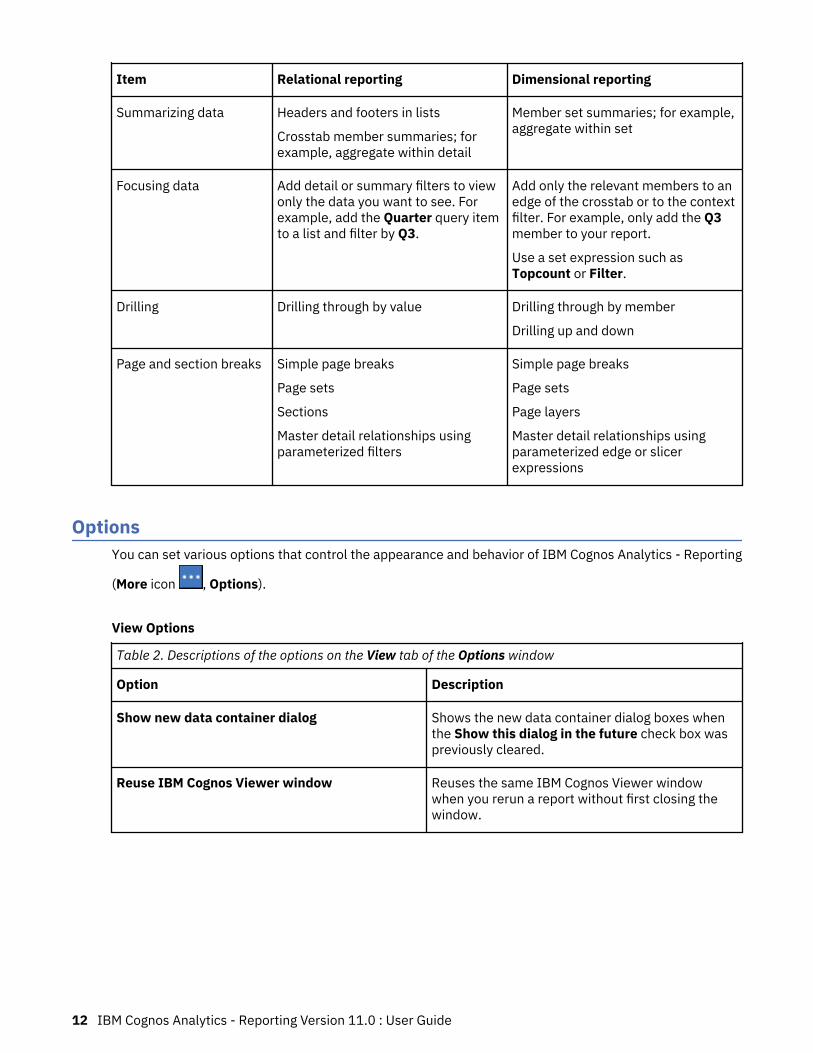
Item Relational reporting Dimensional reporting
Summarizing data Headers and footers in lists
Crosstab member summaries; forexample, aggregate within detail
Member set summaries; for example,aggregate within set
Focusing data Add detail or summary filters to viewonly the data you want to see. Forexample, add the Quarter query itemto a list and filter by Q3.
Add only the relevant members to anedge of the crosstab or to the contextfilter. For example, only add the Q3member to your report.
Use a set expression such asTopcount or Filter.
Drilling Drilling through by value Drilling through by member
Drilling up and down
Page and section breaks Simple page breaks
Page sets
Sections
Master detail relationships usingparameterized filters
Simple page breaks
Page sets
Page layers
Master detail relationships usingparameterized edge or slicerexpressions
OptionsYou can set various options that control the appearance and behavior of IBM Cognos Analytics - Reporting
(More icon , Options).
View Options
Table 2. Descriptions of the options on the View tab of the Options window
Option Description
Show new data container dialog Shows the new data container dialog boxes whenthe Show this dialog in the future check box waspreviously cleared.
Reuse IBM Cognos Viewer window Reuses the same IBM Cognos Viewer windowwhen you rerun a report without first closing thewindow.
12 IBM Cognos Analytics - Reporting Version 11.0 : User Guide

Table 2. Descriptions of the options on the View tab of the Options window (continued)
Option Description
Show on demand toolbar on right-click Show the report object toolbar only when youright-click the object. The default setting is to showreport object toolbars when you highlight anobject. You can control when you want to see thesetoolbars by enabling this feature, which is alsoused for accessibility. When you author reportswith accessibility features enabled, the Show on-demand UI on right click option is automaticallyselected. As a result, report object toolbars do notappear. To show an object's toolbar, navigate tothe object and press the Enter key.
Start page view Enables you to start Reporting in Design,Structure, or Peview view. For the change to takeeffect, you must close and then restart Reporting.
Edit Options
Table 3. Descriptions of the options on the Edit tab of the Options window
Option Description
Wrap text in editors Automatically wraps text in all editors where youcan define expressions.
Automatically populate values list When building expressions in the expressioneditor, automatically shows values when youbrowse the data of a data item.
Automatically validate expressions Automatically validates calculations, such asfilters, created in the expression editor. For moreinformation, see “Using relational calculations” onpage 182 or “Using Dimensional Calculations” onpage 227.
In-place edit Enables the editing of text in place when double-clicking.
Allow crosstab nesting beside individual items Specifies to create a crosstab node when a dataitem is inserted in a crosstab. This option allowsnesting under individual items instead of only onthe entire crosstab edge.
Enable drill-up or drill-down links For data items where drill-up or drill-down ispossible, enables drill-up or drill-down links. Whenyou select a data item, it becomes a link that youcan click to drill up or down. Also, you can stilldouble-click data items to drill up and down. Bydefault, this option is enabled. You can also controldrill options in the Properties pane. At the reportlevel, in the Data section.
Chapter 1. Getting started in IBM Cognos Analytics - Reporting 13

Table 3. Descriptions of the options on the Edit tab of the Options window (continued)
Option Description
Drop replace on crosstab and chart nodes When you use drag-and-drop techniques, thissetting determines the behavior for replacing anitem.
Double-click on member action When working with dimensional data, specifieswhat happens when you double-click a memberdata item.
By default, you drill down or up on the item thatyou double-click.
Layout dimensions Specifies the width and height of the area whereyou will create reports.
Report Options
Table 4. Descriptions of the options on the Report tab of the Options window
Option Description
Alias member unique names When working with a dimensional data source,creates an alias when you add a member to thereport or to an expression.
Delete unreferenced query objects Automatically deletes query objects linked toanother object. For example, if you delete a list, thequery linked to the list is deleted as well.
Delete unreferenced conditional styles andpalettes
Automatically deletes conditional styles or paletteswhen the last data item that refers to theconditional style or palette is also deleted.
Table Style inheritance When a table style is applied to a list or crosstab,specifies whether new objects inserted in the listor crosstab should inherit the style. For moreinformation, see “Apply a Table Style” on page263.
Automatic group and summary behavior for lists When working with lists, automatically adds anoverall aggregate summary in the list footer and asummary for any groups in the list. When groupinga column, automatically makes it the first columnin the list.
Automatically create crosstab headers for sets When adding sets in a crosstab that uses adimensional data source, automatically addsheader labels on new columns and rows. Theheaders help consumers of the report tounderstand where the data is in the hierarchy.
14 IBM Cognos Analytics - Reporting Version 11.0 : User Guide

Table 4. Descriptions of the options on the Report tab of the Options window (continued)
Option Description
Limit on inserted individual members When working with a dimensional data source,limits the number of child members that areinserted. For example, you specify 3 for this optionand, in the toolbar, you specify the option to insertchildren when you drag a member to a datacontainer. You then drag the Camping Equipmentmember to the rows of a crosstab. What you see asrows are the child members Cooking Gear, Tents,and Sleeping Bags and a row named Others(Camping Equipment) for the remaining childmembers of Camping Equipment.
Advanced Options
Table 5. Descriptions of the options on the Advanced tab of the Options window
Option Description
Use operating system clipboard Uses the Microsoft Windows (or other operatingsystem) clipboard instead of the internal Reportingclipboard.
Use legacy chart authoring Enables you to create new reports using the legacycharts instead of the default charts and disablesthe automatic upgrade of charts in existing reportsto the current default charts. Select this check boxif you do not want to upgrade the charts in yourexisting reports.
Disable previews When editing properties such as date and numberformatting, does not display a sample of theformatting that is applied to data. When this optionis not enabled, either sample data or data fromyour data source is displayed with formattingoptions applied.
Additionally, when in Page Design view, displays astatic image for a chart instead of updating thechart with a preview of your chart, using simulateddata.
Active Report validation of visualization Specifies whether to validate visualizations in anactive report when the report is run fromReporting.
Report styles used for new reports Specifies which report styles to use by defaultwhen creating new reports.
For more information about report styles, see“Create and modify report and object styles” onpage 271.
Chapter 1. Getting started in IBM Cognos Analytics - Reporting 15
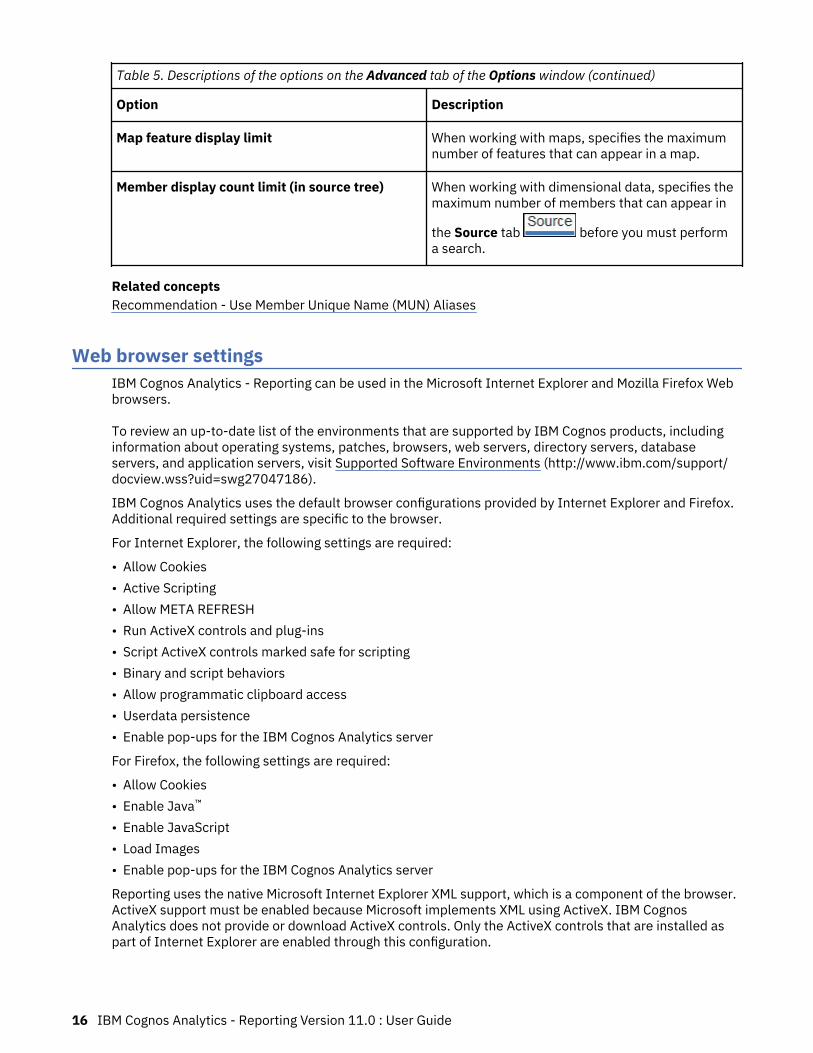
Table 5. Descriptions of the options on the Advanced tab of the Options window (continued)
Option Description
Map feature display limit When working with maps, specifies the maximumnumber of features that can appear in a map.
Member display count limit (in source tree) When working with dimensional data, specifies themaximum number of members that can appear in
the Source tab before you must performa search.
Related conceptsRecommendation - Use Member Unique Name (MUN) Aliases
Web browser settingsIBM Cognos Analytics - Reporting can be used in the Microsoft Internet Explorer and Mozilla Firefox Webbrowsers.
To review an up-to-date list of the environments that are supported by IBM Cognos products, includinginformation about operating systems, patches, browsers, web servers, directory servers, databaseservers, and application servers, visit Supported Software Environments (http://www.ibm.com/support/docview.wss?uid=swg27047186).
IBM Cognos Analytics uses the default browser configurations provided by Internet Explorer and Firefox.Additional required settings are specific to the browser.
For Internet Explorer, the following settings are required:
• Allow Cookies• Active Scripting• Allow META REFRESH• Run ActiveX controls and plug-ins• Script ActiveX controls marked safe for scripting• Binary and script behaviors• Allow programmatic clipboard access• Userdata persistence• Enable pop-ups for the IBM Cognos Analytics server
For Firefox, the following settings are required:
• Allow Cookies• Enable Java™
• Enable JavaScript• Load Images• Enable pop-ups for the IBM Cognos Analytics server
Reporting uses the native Microsoft Internet Explorer XML support, which is a component of the browser.ActiveX support must be enabled because Microsoft implements XML using ActiveX. IBM CognosAnalytics does not provide or download ActiveX controls. Only the ActiveX controls that are installed aspart of Internet Explorer are enabled through this configuration.
16 IBM Cognos Analytics - Reporting Version 11.0 : User Guide

For more information about the Web browser configuration and cookies used by IBM Cognos Analytics,see the IBM Cognos Analytics Installation and Configuration Guide.
Chapter 1. Getting started in IBM Cognos Analytics - Reporting 17

18 IBM Cognos Analytics - Reporting Version 11.0 : User Guide

Chapter 2. Creating a report
Create a report by clicking the New icon in the IBM Cognos Analytics portal and then clicking Report.
When you create a report, you are actually creating a report specification. The report specification definesthe queries and prompts that are used to retrieve data and the layouts and styles used to present thedata. For simplicity, the report specification is named by the same name as the report.
Templates and themesIBM Cognos Analytics includes several basic report templates and color themes that you can choose fromwhen you create a new report.
The templates and themes are stored in the Templates.zip deployment file. If you do not see the list oftemplates and themes when you create a new report, ask your administrator to import the deploymentfile into Cognos Administration. After the deployment file is imported, the templates appear in theTemplates folder in Team content.
You can also create your own report templates and themes, and make them available to other users. Savethe templates in the Templates folder in Team content, and save themes in the Style Reference Reportsfolder in the Templates folder. When saving your own template or theme, do not use the name of anexisting Cognos Analytics template or theme. Otherwise, your template or theme might be overwrittenwhen Cognos Analytics is upgraded to a later version. Any report or theme that is saved in the Templatesfolder appears in the list of templates or themes when you create a new report.
Note: When you select a template in the Templates and themes window, you can see a preview of thetemplate in the right pane. The preview applies only for the Style Reference Reports in the templatefolder. Any styles you apply to a custom template do not display in the preview pane.
You can also convert a report to a template by clicking Save > Convert to Template.
Tip: By default, templates or themes that you create are identified by a blank icon in the list of availabletemplates and themes. You can associate your own icon to a template or theme. Save the icon as an SVGwith the same name as the template or theme, replacing any blank spaces in the name with theunderscore (_) character. For example, if you create a template that is named My template, save the iconas My_template.svg. Then, ask your administrator to add the icon to the folder install_location\webcontent\bi\pat\images\templateReports for templates or install_location\webcontent\bi\pat\images\themeReports for themes.
Related tasksReusing styles from another reportYou can apply local and global styles or themes from one report in another report.
Adding dataAdd data to a report by loading packages or data modules in IBM Cognos Analytics - Reporting.
About this task
You can add data from multiple packages that use the dynamic query mode, from a single packagethat uses the compatible query mode, or from a single data module.
The following list provides information about authoring reports that reference multiple packages.
• You must set one of the packages as the default package.
When a report is run, Cognos Analytics checks the package capabilities of the package that is used bythe report. In a report that references multiple packages, package capabilities are checked only for thedefault package.
Tip: The first package that you add to a report is set as the default package.• A query can reference only one package.• Query set operations (join, union, intercept, except), master detail relationships, and the Build prompt
page tool are not supported.• Drill through and external data are supported only for the default package.
Procedure
1. Click the Data icon .
2. Click the Add report data icon .3. Open the packages that you want, or open a single data module.4. If you opened multiple packages, to specify a package as the default package, right-click an item in
the package and select Set default package.5. To delete a package, right-click an item in the package and select Delete package.6. To replace a package by another package, right-click an item in the package and select Replace
package.If queries exist that use the package that you are replacing, model paths in the queries are updated tothe new package.
Tip: You can also change the package that is used by a query by modifying the Data model queryproperty.
Related tasksChanging the package
Inserting a single data itemYou can insert a single data item anywhere in your report using the singleton object. The singleton objectretrieves only the first row value for that query. Inserting a single data item is useful when you want toshow a value that is independent from the rest of the values in the report or when you want to insert someboilerplate text, such as a company name and address. For example, you can add the total revenue valuein the header of each page in a report.
You can associate multiple singleton objects with a single query in relational reporting and dimensionalreporting to optimize performance, such as when all the data items in the singleton are from the samedatabase table. In addition, two or more singletons can reference data items from the same query. This isuseful when using a single query is more efficient to display a set of single values than using multiplequeries.
You can also filter the data item in the singleton. For example, you can show the total revenue for only theyear 2012.
Queries that are associated to a singleton object are not supported when producing report output indelimited text (CSV) format.
Tip: The Returns by Damage, Failed Orders and Complaints in 2012 sample report in the GO DataWarehouse (analysis) package includes a singleton.
Procedure
1. Click the Toolbox icon and drag Singleton to the report.
20 IBM Cognos Analytics - Reporting Version 11.0 : User Guide

An empty data container is created.
2. Click the Data icon , and from the Source tab , drag a data item into the Singletoncontainer.
Tip: To create a singleton, you can also drag a data item anywhere in your report layout.3. To change the query associated to the singleton object, select the singleton, click the Show properties
icon , and in the Properties pane, double-click the Query property and make changes.
ResultsWhen the report is run, the first row value for the data item is retrieved.
Validating a reportValidate your report to ensure that it contains no errors.
When you open a report created in a previous version, it is automatically upgraded and validated.
Procedure
1. Click the Pages icon or the Queries icon , right-click the Report icon , and click Validate
Report .
A message box appears indicating whether any errors were found in the report.
2. If you require more detail from the validation process, click the Show properties icon , navigate tothe report level, click the Validate options property, and do the following:
• Click one of the following validation levels.
Validation level Description
Error Retrieves all errors returned from the query.
Warning Retrieves all errors and warnings returned fromthe query. This is the default validation level.
Key Transformation In addition to errors and warnings, retrievesinformational messages describing importanttransformation steps from the reportspecification to the native query sent to the datasource.
These messages can show the cause of errorsand warnings returned from the query.
Information Retrieves errors, warnings, key transformations,and other information related to query planningand execution.
Tip: Your administrator can change the default validation level. For more information, see the IBMCognos Analytics Administration and Security Guide.
• Select the Interactive data check box to specify that no query optimization is to be used.
The Interactive data check box controls how queries will be processed during validation.
Chapter 2. Creating a report 21
Clear the Interactive data check box to set the query property Execution optimization property toAll Rows.
A message box appears indicating whether any errors were found in the report.• To view messages that result from the conversion of your report to use the dynamic query mode
instead of the compatible query mode, select the Dynamic Query Migration check box.
For more information about using the dynamic query mode, see the IBM Cognos AnalyticsAdministration and Security Guide. For more information about managing the migration from thecompatible query mode to the dynamic query mode, see the IBM Cognos Lifecycle ManagerInstallation and User Guide.
• Revalidate your report.3. If you encounter validation errors and want Cognos Analytics - Reporting to identify incorrect objects
in your report, right-click the Report icon and click Auto Correct.
Cognos Analytics - Reporting provides a list of such objects that you can remove individually tosuccessfully run your report.
In some cases, the information or error message is linked to the location of the issue in your report. Togo to the location of the issue, click the message, and then click Select. If only warnings andinformation appear in the dialog box, these will disappear when you click OK.
Running a reportRun your report to see the data that is retrieved. Save time by validating it first to check for errors.
You can also run a report or a group of reports in the IBM Cognos Analytics portal.
You can specify not to render a report page if it does not contain any data.
When you run a report in an export format such as PDF, delimited text (CSV), Microsoft Excel spreadsheetsoftware (XLS), the IBM Cognos report name is used as the exported file name.
If you run a report that uses functions or features not supported by the data source, an error messageappears. We recommend that you periodically test your reports while you author them in IBM CognosAnalytics - Reporting to ensure that you do not encounter multiple error messages when you run thereport.
Procedure
1. Open a report.2. If you want to clear parameter values stored on the IBM Cognos Analytics server, click the More icon
and click Clear all parameters.
Parameter values stored by the IBM Cognos Analytics server include signon, validation, and promptinformation. For example, if you define two data source connections in the Cognos Analytics portalthat point to the same data source, you are prompted to choose one when you run a report. Thisinformation is stored so that you are not prompted each time you run the report.
3. If you want to view only the tabular data for a query, do the following:
a) Click the Queries icon .b) Right-click the query.c) Click View tabular data.
Use this command to ensure that the right results appear. For example, you create a calculation andyou want to ensure it is giving you the results you want.
4. If you want to set run options, click the Run options icon and click Show run options property.
22 IBM Cognos Analytics - Reporting Version 11.0 : User Guide

Note: The run options that you set apply only to the current session. When you close Cognos Analytics- Reporting, the options return to the default settings.
5. Change any values for the current session.
Option Description
Paper size Specify only if the output format is PDF.
Paper orientation Specify only if the output format is PDF.
Data mode Specify how much data is returned:
• All Data returns all data.• Limited Data limits the amount of data returned based on design
mode filters defined in the package.• No Data returns artificial data instead of actual data from the data
source.
For more information about design mode filters, see the IBM CognosFramework Manager User Guide.
Language The content language sets the preferred language for the data, IBMCognos Viewer, dates, and so on.
Rows per page Specifies the number of rows to appear on each page.
A Rows Per Page property exists in the Properties pane for lists andcrosstabs. If you set this property, the setting overrides the same-named run option. This property applies to both HTML and PDFoutputs. For more information about this property, see “Controllingthe Rows Per Page for Multiple Containers in HTML and PDF” on page25.
Prompt Select to be prompted for each prompt defined unless the prompt isdefined in a report page.
If you clear the Prompt check box, you are prompted only if the reportcannot run without user intervention. For example, if a report has asingle parameterized filter that is optional, you are not promptedwhen you run the report.
Include accessibilityfeatures
Specifies whether accessibility features, such as alternate text onimages and charts and summary text in tables, are included in thereport output.
This option is also used for conditional layouts in Reporting. When theoption is selected, you can specify that a crosstab is rendered as anaccessible alternate to a chart.
Enable bidirectionalsupport
Specifies whether to enable bidirectional support in the report output.
Tip: You can also enable bidirectional support in Cognos Analyticsportal by modifying your user preferences (My Preferences link). Ifyou enable bidirectional support in Cognos Analytics portal, this runoption will be automatically selected.
Chapter 2. Creating a report 23
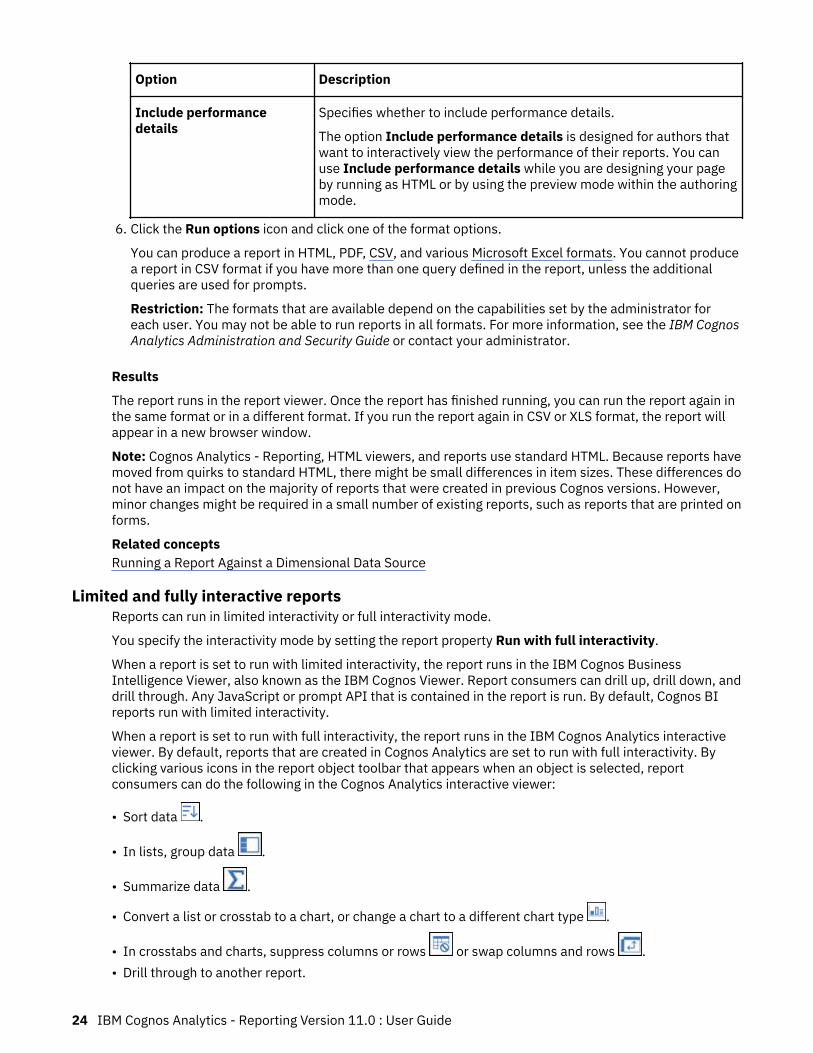
Option Description
Include performancedetails
Specifies whether to include performance details.
The option Include performance details is designed for authors thatwant to interactively view the performance of their reports. You canuse Include performance details while you are designing your pageby running as HTML or by using the preview mode within the authoringmode.
6. Click the Run options icon and click one of the format options.
You can produce a report in HTML, PDF, CSV, and various Microsoft Excel formats. You cannot producea report in CSV format if you have more than one query defined in the report, unless the additionalqueries are used for prompts.
Restriction: The formats that are available depend on the capabilities set by the administrator foreach user. You may not be able to run reports in all formats. For more information, see the IBM CognosAnalytics Administration and Security Guide or contact your administrator.
Results
The report runs in the report viewer. Once the report has finished running, you can run the report again inthe same format or in a different format. If you run the report again in CSV or XLS format, the report willappear in a new browser window.
Note: Cognos Analytics - Reporting, HTML viewers, and reports use standard HTML. Because reports havemoved from quirks to standard HTML, there might be small differences in item sizes. These differences donot have an impact on the majority of reports that were created in previous Cognos versions. However,minor changes might be required in a small number of existing reports, such as reports that are printed onforms.
Related conceptsRunning a Report Against a Dimensional Data Source
Limited and fully interactive reportsReports can run in limited interactivity or full interactivity mode.
You specify the interactivity mode by setting the report property Run with full interactivity.
When a report is set to run with limited interactivity, the report runs in the IBM Cognos BusinessIntelligence Viewer, also known as the IBM Cognos Viewer. Report consumers can drill up, drill down, anddrill through. Any JavaScript or prompt API that is contained in the report is run. By default, Cognos BIreports run with limited interactivity.
When a report is set to run with full interactivity, the report runs in the IBM Cognos Analytics interactiveviewer. By default, reports that are created in Cognos Analytics are set to run with full interactivity. Byclicking various icons in the report object toolbar that appears when an object is selected, reportconsumers can do the following in the Cognos Analytics interactive viewer:
• Sort data .
• In lists, group data .
• Summarize data .
• Convert a list or crosstab to a chart, or change a chart to a different chart type .
• In crosstabs and charts, suppress columns or rows or swap columns and rows .• Drill through to another report.
24 IBM Cognos Analytics - Reporting Version 11.0 : User Guide

• Add calculated members .
• Drill up, drill down, and perform dimensional operations, such as top/bottom filtering .• Run the report as Excel or CSV output.• Select and interact with the elements of a chart, such as the bars in a bar chart.
• View lineage information for a data item .• Access a business glossary, such as the IBM InfoSphere® Information Governance Catalog, for a
data item .
• Create, edit or remove filters .• Share or embed report output, preserving the context of the current view of the report, such as
prompt values.
To share or embed report output, click the More icon and then click Share or Embed.• Run a report as the report owner or with the capabilities granted to the owner.
In the Cognos Analytics portal, access the Properties slideout of the report, click the Report tab, andthen open the Advanced section.
Report consumers can also save changes that are made to a report as a new report.
You can also start the Cognos Analytics interactive viewer by using URLs. You can open reports andpass parameters to a report. For more information, see the Getting Started Guide.
Note: JavaScript in HTML items is removed when the report is run with full interactivity. Instead, you canuse the Custom control tool to add JavaScript.
Related tasksAdding JavaScript to a report
Specify Not to Render a Page If It Does Not Contain DataYou can specify not to render a report page if the page does not contain any data when the report is run.
Procedure
1. In the report page, click a data container.
2. Click the Show properties icon , click the Select ancestor icon , and click the data containertype.
For example, if the data container is a list, click List.
Tip: You can also click the container selector (three orange dots) of the container to select it.3. Set the Render Page when Empty property to No.4. Repeat steps 1 to 3 for all other data containers in the page and any table of contents objects.
ResultsWhen you run the report, if no data is produced in all data containers and table of contents objects in apage, the page is not rendered. The page is not rendered even if the page contains other objects, such astext items or images.
Controlling the Rows Per Page for Multiple Containers in HTML and PDFIf you have more than one data container in a report, such as a list and a crosstab, you can control howthe report is rendered in HTML and PDF by setting the Rows Per Page property for each container.
Chapter 2. Creating a report 25

For HTML output, the report property option Page break by data container for interactive HTML controlswhether the default number of rows is rendered for each data container on each page.
IBM Cognos Analytics uses the following rules when rendering reports in HTML and PDF:
• If the Rows Per Page property is not set for any of the data containers, 20 rows per page are renderedin HTML and each page is completely filled in PDF. The first data container is rendered until there is nomore data, followed by the next container, and so on.
Tip: The number of rows that appear on a PDF page depends on the font size set in the report.• If the Rows Per Page property is set for each data container, the specified numbers of rows are
rendered in HTML and PDF on each page until there is no more data.• If the property is set for only some of the containers, the specified numbers of rows are rendered in
HTML and PDF on each page until there is no more data. For the remaining containers, 20 rows per pageare rendered on each page in HTML and each page is completely filled in PDF.
For example, you have two lists, List1 and List2. You set the Rows Per Page property to 5 for List1.When you run the report in HTML, the first page contains the first 5 rows from List1 followed by the first15 rows of List2.
• If no data is returned for a data container, an empty container is rendered.
Producing a Report in CSV FormatIBM Cognos Analytics can produce reports in CSV format so you can open them in other applications,such as Microsoft Excel spreadsheet software.
Reports saved in CSV format
• support Unicode data across many client operating systems• are UTF-16 Little Endian data encoded• include a BOM (Byte Order Mark) at the beginning of the file• are tab-delimited• do not enclose strings in quotation marks• use a new line character to delimit rows
You can open reports saved in CSV format using a variety of spreadsheet software applications. Bydefault, reports produced in CSV format will appear in the application associated with the .csv file type.
You cannot produce the following in CSV format:
• maps• charts that do not have at least one category or series• reports that have more than one query defined in the report, unless the additional queries are used for
prompts
In the IBM Cognos Analytics portal, you can configure the CSV output to suit your environment. Forexample, you can specify the character used to delimit fields. For more information, see the IBM CognosAnalytics Administration and Security Guide.
Producing a Report in Microsoft Excel FormatYou can export your report output to several different Microsoft Excel spreadsheet software formats.
Excel and Excel data formats render report output in native Excel XML format, also known as XLSX. Thisformat provides a fast way to deliver native Excel spreadsheets to Microsoft Excel 2002, Microsoft Excel2003, and Microsoft Excel 2007. Users of Microsoft Excel 2002 and Microsoft Excel 2003 must install theMicrosoft Office Compatibility Pack, which provides file open and save capabilities for the new format.
Excel provides fully formatted reports for use in Microsoft Excel version 2007.
The output is similar to other Excel formats, with the following exceptions:
26 IBM Cognos Analytics - Reporting Version 11.0 : User Guide

• Charts are rendered as static images.• Row height can change in the rendered report to achieve greater fidelity.• Column widths that are explicitly specified in reports are ignored in Microsoft Excel 2007.• Merged cells are used to improve the appearance of reports.• The default size of worksheets is 65 536 rows by 256 columns.
Your IBM Cognos administrator can enable larger worksheets and change the maximum number ofrows in a worksheet, up to a maximum of 16,384 columns by 1,048,576 rows, by using advanced serverproperties. For more information, see the IBM Cognos Analytics Administration and Security Guide.
Excel data provides data for use in Microsoft Excel version 2007. These reports only contain minimalformatting. Default data formatting is applied to the data based on data type and assumes that eachcolumn has a single data type.
The output is similar to other Excel formats, with the following exceptions:
• The generated output includes only the first list query in the report. Other queries are ignored. If areport contains only multi-dimensional queries for crosstabs or charts, an error message is displayedwhen the report runs.
• Nested frames and master-detail links are not supported.• Cells in the Microsoft Excel file have a default width and height. You must adjust the column width and
height if the data is larger than the default size.• Style specifications are not rendered, including color, background color, and fonts.• Borders are not rendered.• User-specified data formatting in the report specification are not applied, including exception
highlighting and color rules for negative numbers.
Related conceptsLimitations When Producing Reports in Microsoft Excel Format
Producing a Report in XML FormatXML report outputs save the report data in a format that conforms to an internal schema, xmldata.xsd.
You can find this schema file in installation_location\bin.
This format consists of a dataset element, which contains a metadata element and a data element. Themetadata element contains the data item information in item elements. The data element contains all therow and value elements.
You can create models from reports and other data that conform to the xmldata.xsd schema. This isuseful if you want to use a report as a data source for another report, or if you use a database that cannotbe read by IBM Cognos Framework Manager. In this case, export the data from the data source to an XMLfile, in conformance with the xmldata schema, and then open the XML file in Framework Manager.
For more information, see the Framework Manager User Guide.
You cannot produce the following in XML format:
• maps• charts that do not have at least one category or series• reports that have more than one query defined in the report, unless the additional queries are used for
prompts
If a report contains more than one data container, such as a crosstab and a list, and both containers usethe same query, only the output for the list is produced. If a report contains multiple lists, only theoutput for the first list is produced. If a report contains multiple crosstabs and multiple lists, only theoutput for the first list is produced.
Chapter 2. Creating a report 27

Viewing performance detailsWith the option Include performance details, you can view query and rendering performance on reportobjects in IBM Cognos Analytics.
The option Include performance details is designed for authors that want to interactively view theperformance of their reports. You can use this option while you are designing your page by running asHTML or by using the preview mode within the authoring mode.
The following illustration shows the performance details for a crosstab.
The Execution Time in milliseconds is displayed for each data container, including prompt controls, in the
report. When you hover over the information icon a flyout shows the following information:
• Render: The amount of time to generate the query, process any data that is returned from the databaseand generate the data container report objects. It does not include query time.
• Query: The amount of time that is required to plan the query, run it and retrieve the data.
The Total Execution Time is displayed at the end of the report. The total execution time is the time to
render logic layout of the report, excluding the device time. When you hover over the information icon a flyout shows the following information:
• Host: The name of the server where the report ran.• Process ID: The process ID of the BIBusTKServerMain that rendered the report.• Session ID: The client’s unique identifier for his IBM Cognos session, from login to logout.• Request ID: The report session’s unique identifier through the duration of the report execution.• Hop Count: The number of service nodes that the request communicated with during the report
execution.
Note: To get additional information on why the report object is working the way that it is, your CognosAdministrator can use the Request ID as a search parameter within the logs.
Objects that use the same query show different execution times. The last run of performance details onan object uses cached information and does not have to rerun a query.
IBM Cognos Analytics retrieves rows as they are required in the interactively run HTML reports. Becauseof this, you will not see an accurate representation of the runtime of the report, when you scroll to thebottom of a long report, as you would see when you schedule it.
If you want to see the actual runtime by using performance details, then set the rows per page for yourreport object to a high enough number to retrieve all rows for the object. Click the object, such as a list,and then click Show Properties. The Rows per page option is in the DATA section.
Performance details are not available for the following output formats:
• XLS• PDF• Scheduled reports• Active reports
View Lineage Information for a Data ItemView lineage information of a data item to see what the item represents.
28 IBM Cognos Analytics - Reporting Version 11.0 : User Guide

Before you begin
Before you can access lineage information for a report, your administrator must configure lineage in IBMCognos Administration. Also, the administrator must enable the lineage capability and grant readpermission for you on the report.
Note: The IBM Cognos Analytics lineage tool shows lineage on a report at its highest level. The lineagedoes not change after you drill down on a report. Because the selection context used to launch lineagecan be affected by drill-down operations, we recommend that you always launch lineage at the highestreport level before drilling down on the report. Otherwise, the lineage may not start properly.
About this task
Lineage information traces the metadata of an item back through the package and the data sources usedby the package. Lineage also displays any data item filters that were added by the report author or thatwere defined in the data model. Viewing lineage information ensures that you add the correct data itemsto a report. For example, you can view the lineage information of a model calculation to see how it wascreated.
Note: Lineage is available only after your administrator has configured it. In addition, lineage is notsupported in reports that are not linked to packages.
You can use the lineage tool that comes with IBM Cognos Analytics, or you can use another lineage toolby specifying the URL to the tool in IBM Cognos Administration. Note that if the URL source is secured, thesource must be able to prompt users for a password because IBM Cognos Analytics does not passsecurity information. IBM Cognos Analytics also supports the IBM Metadata Workbench as a lineage tool.
You cannot use lineage information to troubleshoot queries. For example, lineage information will notexplain why a data item is double counted. Also, you cannot view lineage information when running areport from a mobile device.
There are several ways in which you can view lineage information.
• You can view lineage information for a data item before you add it to a report.• You can view lineage information in IBM Cognos Viewer after you run a report.
For example, you can click a cell in a crosstab to see how the cell value was calculated.• You can view lineage information in the Cognos Analytics interactive viewer after you run a report.• In the page preview view, you can view lineage information for a data item that was added to a
report.
Procedure
1. To view lineage information for a data item before you add it to a report:
a) Click the Data icon .
b) From the Source tab , right-click the data item and click Lineage.2. To view lineage information in IBM Cognos Viewer, right-click an item in the report and then click
Lineage.3. To view lineage information in the Cognos Analytics interactive viewer or in the page preview view,
select an item in the report, and in the report object toolbar, click the Explore icon and then clickLineage.
Results
The lineage tool opens showing the lineage information of the selected data item.
The IBM Cognos Analytics lineage toolThe IBM Cognos Analytics lineage tool includes two views: the business view and the technical view.
Chapter 2. Creating a report 29

The business view displays high-level textual information that describes the data item and the packagefrom which it comes. This information is taken from IBM Cognos Analytics portal and the IBM CognosFramework Manager model.
The technical view is a graphical representation of the lineage of the selected data item. The lineagetraces the data item from the package to the data sources used by the package.
When you click an item, its properties appear below it. If you click an item in the Package area, you seethe model properties of the item. If you click an item in the Data Sources area, you see the data sourceproperties of the item.
Figure 1. The technical view in the IBM Cognos Analytics lineage tool
If you or an administrator runs a saved report with the IBM Cognos Analytics lineage tool, both thebusiness view and the technical view are visible. Report consumers can see only the business view. Inaddition to the Package and Data Sources areas, a Report area exists when looking at the technical view.
Access the IBM InfoSphere Information Governance CatalogIf you use the IBM InfoSphere Information Governance Catalog, you can access the catalog from variousdata objects in a report.
Before you begin
To access the IBM InfoSphere Information Governance Catalog, your Cognos administrator must specifythe URI of the Catalog web page in Cognos Administration. For more information, see the IBM CognosAnalytics Administration and Security Guide.
About this task
Business glossaries help you manage and share an enterprise vocabulary and classification system.
If you use the IBM InfoSphere Information Governance Catalog, you can access the catalog from any ofthe following data objects:
• Query subject
30 IBM Cognos Analytics - Reporting Version 11.0 : User Guide

• Query item• Measure• Dimension• Hierarchy• Level• Property or attribute• Top node member• Member• Level item
Procedure
1. Open an HTML report or report view in the IBM Cognos Viewer or in the Cognos Analytics interactiveviewer.
2. If you are in the IBM Cognos Viewer, right-click the data item and click Glossary.3. If you are in the Cognos Analytics interactive viewer, select the data item, and in the report
object toolbar, click the Explore icon and then click Glossary.
Results
The IBM InfoSphere Information Governance Catalog appears.
Related conceptsLimited and fully interactive reportsReports can run in limited interactivity or full interactivity mode.
Support for bidirectional languagesYou can author reports that support bidirectional languages. You can specify base text direction, digitshaping, and container direction.
Arabic, Hebrew, Urdu, and Farsi are languages written from right to left, using the Arabic or Hebrewscripts. However, numbers in those languages, as well as embedded segments of Latin, Cyrillic, or Greektext, are written from left to right. Using the bidirectional settings in IBM Cognos Analytics - Reporting,you can control the direction in this type of text in reports.
Report formats
Bidirectional languages are supported for reports produced in HTML, PDF, and Microsoft Excel. IBMCognos Active Report also supports bidirectional languages.
Enabling bidirectional support
To enable support for bidirectional languages when a report is run, in the IBM Cognos Analytics portal,users must open their My Preferences page and select the Bidirectional language support check box.
To enable support for bidirectional languages when a report is run from Cognos Analytics - Reporting,select the Enable bidirectional support check box in the Run options window.
Tip: If you enable bidirectional support in the Cognos Analytics portal and you then start Cognos Analytics- Reporting, the bidirectional support run option in Cognos Analytics - Reporting is selected. If you disablebidirectional support in the Cognos Analytics portal and you then start Cognos Analytics - Reporting, therun option in Cognos Analytics - Reporting is cleared.
Chapter 2. Creating a report 31

Base text direction
Base text direction sets the text direction as left-to-right or right-to-left. You can specify the base textdirection for any text object in a report. You specify the base text direction for text by clicking theDirection & justification property for the text or for the object that contains the text, such as a listcolumn.
A contextual option also exists in the Direction & justification property that sets the text direction basedon the first letter in the text.
For compound objects that contain text, you specify the base text direction of the text contained in theobject by clicking the Contained text direction property for the object. Examples of compound objectsare charts, prompts, and active reports.
Digit shaping
Digit shaping allows users to consume reports with numbers that they can read after they select thecontent language in the Cognos Analytics portal. You can specify digit shaping at the following levels:
• Report• Container (except for charts and maps)• Text• Number
You specify digit shaping for an object by clicking the Data format property for the object. To specify digitshaping at the report level, click the report property Data formats.
Tip: Digit shaping has no impact on reports produced in Excel format, since the shaping of digits in Exceldepends on Windows regional settings.
Container direction
Container direction sets the direction of container objects in a report as left to right or right to left. Youspecify container direction for an object by clicking the Direction & justification property for the object.
Tip: Container direction is not supported in reports produced in Excel format. Excel spreadsheets do notnatively support mirroring at the container level.
Related conceptsDigit shaping in charts and mapsRelated tasksRunning a reportSpecify text and container directionSet the default data formatsSpecify the data format for an object
Reports for workspaces in Cognos WorkspaceWhen building a workspace in IBM Cognos Workspace, business users can insert an entire IBM CognosAnalytics - Reporting report or insert only individual objects from within a report.
To create effective reports for use in workspaces in Cognos Workspace:
• Ensure that all the objects and pages within the report have meaningful names.
For some objects, such as data containers, Reporting gives the object in a report a default name such asList 1, List2, and so on. In Cognos Workspace, these names appear in the Content tree. To helpbusiness users recognize the report objects, rename them to something more meaningful (Propertiespane, Name property).
32 IBM Cognos Analytics - Reporting Version 11.0 : User Guide
If you do not want an object to be added in a workspace, clear the Name property for that object. Theobject will not appear in the Content tree. However, you cannot clear the name of data containers.Reporting requires that data containers have names.
Note: Cognos Workspace does not support tables and blocks. Unsupported objects do not appear in theContent tree in Cognos Workspace, even if you specify a name for the object.
• Create a container report that includes all the report objects that workspace users might want to add ina report. Such a report is not meant to be run and does not need to show report objects in a properlayout. It is only used as a container for the various report parts. Each page of a report appears as afolder within the Cognos Workspace Content pane.
For example, on one page named Prompts you can insert all the possible prompts that users might wantto add to a workspace, and give each prompt a useful business name, such as Value Prompt for Region.On a second page named Charts, you can insert a number of charts useful for workspaces.
• Ensure that the titles and labels used in your report are understandable by business users.• Ensure that you use report objects that are well suited for dashboards. They convey the most
information in as little space as possible. For example, if you include a chart, use bullet charts,microcharts, line charts, or column and bar charts. Use conditional blocks to show business indicators.
• If your report includes charts, customize the font sizes so that the charts appear correctly in adashboard. You may need to reduce the font sizes.
• If your report includes embedded objects, such as a list with an embedded chart and crosstab, theembedded objects do not appear in the Cognos Workspace Content pane, unless the embeddedobjects are in a table object. When you insert an object that contains embedded objects, the embeddedobjects will be inserted in the workspace.
When embedded objects are in a table object, the embedded objects appear in the Content pane. Tableobjects do not appear in the Content pane because Cognos Workspace does not support CognosAnalytics - Reporting table objects. Consequently, you can insert the embedded objects in a workspace,but not the table.
• If your report includes a map, customize the colors of the map in Reporting so that they match the colorpalette of the dashboard. You cannot edit the color palette of a map from within a workspace in CognosWorkspace.
• If your report is using a dimensional data source and you enable drill-up and drill-down, in the DrillBehavior window, specify that the column title uses member caption values.
Cognos Workspace does not support drill up and drill down with level label values as the column titles.Cognos Workspace always uses member captions.
Related tasksCreate a drill-up and drill-down report
Prompts in workspaces in Cognos WorkspaceA prompt control, when assigned a Name property in IBM Cognos Analytics - Reporting, appears as anobject that you can insert from the Content pane in a workspace in IBM Cognos Workspace.
If a workspace includes reports and report parts from the same model, prompts automatically filter theappropriate data item in all the widgets in the dashboard. For example, a prompt filters on Product Line.Any widget in the dashboard that includes the Product Line data item is filtered when you select a valuefrom this prompt control. If you do not want a prompt to control a widget in the dashboard, you candisable communication between the two widgets.
If a dashboard includes prompted reports or report parts from different models, ensure that the promptsuse the same parameter names. For example, a year prompt should use the same parameter p_Years inreports from both models. Otherwise, the prompt control is unable to control reports from anotherpackage.
Chapter 2. Creating a report 33

Enable filters in workspaces in Cognos WorkspaceYou can include a data item in the query of the report, but not show that data item in the actual report.This is useful for creating calculations and filters. If you want IBM Cognos Workspace users to filtercontent in a workspace based on a data item that is not visible in the report, you must include this dataitem in its own query and name it _BusinessInsight_ within the IBM Cognos Analytics - Reporting report.Therefore, the data item must exist in both the query used for the data container (such as the list,crosstab, or chart) and in this separate query.
For example, a chart shows the revenue for the product lines for each region. You want to filter the chartto show only data for the year 2012. When you author the report, in addition to including Year in theQuery1 used for the chart data container, you create a new query named _BusinessInsight_ thatincludes Year.
Procedure
1. Click the Queries icon , and then click Queries.
2. Click the Toolbox icon , and drag a Query object to the work area.
3. Click the Query object, click the Show properties icon , and in the Properties pane, in the Namebox, type _BusinessInsight_.
4. Double-click the Query object, click the Data icon , and from the Source tab , add the dataitem to use as a filter.
Ensure that the same data item also exists in the query used for the data container.
Creating Reports for IBM Cognos for Microsoft OfficeIBM Cognos for Microsoft Office provides an integrated environment for IBM Cognos products andMicrosoft Office. You can use IBM Cognos for Microsoft Office to select pieces of reports to embed inMicrosoft Excel workbooks, Microsoft Word documents, or Microsoft PowerPoint presentations, includingdata, metadata, headers, footers, and charts. You can use predefined reports or you can create newcontent using IBM Cognos PowerPlay® Web, IBM Cognos Query Studio, or IBM Cognos Analytics -Reporting.
Note: Note that to access PowerPlay content, your administrator must configure PowerPlay to work withIBM Cognos Analytics. PowerPlay content that is published only to Upfront is not available to IBM Cognosfor Microsoft Office.
Because IBM Cognos for Microsoft Office cannot fully convert highly formatted reports into Excel or otherMicrosoft document output types, you may not get the results that you want.
To create effective reports for IBM Cognos for Microsoft Office, follow these recommendations:
• Create content to meet specific Microsoft Office integration needs.
For example, in IBM Cognos Analytics, many options are available to format data. Use less formatting tomake data more accessible to Office applications.
• Organize reports.
You can publish workbooks to the Cognos Analytics portal and organize them with your reports in Teamcontent or My content. For more information, see the IBM Cognos Analytics Getting Started Guide. Byorganizing your content, you can quickly retrieve the information that you want.
Tip: Workbooks, documents, and presentations that are enabled for IBM Cognos for Microsoft Office areidentified by their own unique icons, helping you to distinguish them from other types of files.
• Optimize report templates for Microsoft Office.
34 IBM Cognos Analytics - Reporting Version 11.0 : User Guide

If you rely on IT personnel or other report authors to create content, request report templates that areoptimized for your Microsoft Office integration needs. You may want to request only the data elementsor queries that you need and request minimal formatting so that you can more easily use MicrosoftOffice formatting capabilities with the IBM Cognos content. For example, reports authored in CognosAnalytics - Reporting can contain list objects embedded within list objects with specific formattingapplied. When converted to the tabular representation available in Excel, these reports may not berendered in the same way in which they appear in IBM Cognos Analytics.
• Format elements in the Office application.
Instead of formatting objects in IBM Cognos Analytics, add the formatting in the Office application. Byapplying less formatting in IBM Cognos Analytics, you can import more data into the desired locations.
• Label report elements using descriptive names.
This practice makes them more easier to find after you import them. Examples of report elementsinclude lists, crosstabs, and charts.
• Do not nest report objects.
If you nested report objects, some objects may not appear in the correct location, or they may notappear at all. In addition, nesting report objects may cause the following error message to appear:
RDS-ERR-1000 Report Data Service could not process from the content provider.
For example, this error occurs if a repeater or repeater table is inside a block or table. It also appearswhen layout objects, such as lists, crosstabs, and charts, are in a conditional block that is inside anotherblock or table.
• Keep table sizes small.
For example, because of the size of slides, the maximum number of rows and columns that you canhave in Microsoft PowerPoint tables is 25. Although Word and Excel permit larger tables, it takes moretime to download and render them.
• Use images with transparent backgrounds.
The background will show through the image in the Office application, making the image look like partof the presentation. If you want, you can then supply your own background color.
• Specify the height and width of images in a list.
This practice ensures that the image appears in the correct size in the Office application.• Remember that graphs and charts are imported as images.
Images in IBM Cognos Analytics have image maps associated with them to enable tooltips andhotspots. IBM Cognos Analytics for Microsoft Office cannot import tooltips and hotspots into Officeapplications.
• Consider the additional limitations that exist when producing reports in Excel format.
Creating Reports for Mobile DevicesYou can send IBM Cognos Analytics - Reporting reports to mobile devices that have IBM Cognos Mobileinstalled, or that are using the IBM Cognos Mobile Web portal.
The IBM Cognos Software Development KitWhen you create a report, you are creating a report specification.
A report specification is an XML file that you can view (Pages icon or the Queries icon , right-click
the Report icon , and click Show Specification ).
Chapter 2. Creating a report 35

You can also programmatically create or modify reports by using an editing tool to work with reportspecifications. You then use the IBM Cognos Software Development Kit to implement the reports in yourIBM Cognos Analytics environment. This is useful if, for example, you must make the same modification inmany reports. Rather than opening each report and making the change, you can automate the processusing the Software Development Kit, thereby saving you time. For more information about the SoftwareDevelopment Kit, contact your local sales office.
Tips
• When you are viewing the report specification, you cannot modify or copy parts of it.• You can also modify the XML code in a report specification by saving the report specification on your
computer.
36 IBM Cognos Analytics - Reporting Version 11.0 : User Guide

Chapter 3. ListsUse lists to show detailed information from your database, such as product lists and customer lists.
A list shows data in rows and columns. Each column shows all the values for a data item in the databaseor a calculation based on data items in the database.
You can specify whether to automatically add an overall aggregate summary in the list footer and asummary for any groups in the list by selecting Automatic group and summary behavior for lists in theIBM Cognos Analytics - Reporting options. The default aggregation as specified in your enterprise datasource is used.
Tip: The Order Invoices - Donald Chow, Sales Person sample report in the GO Sales (query) packageincludes a list.
Related tasksChange a List into a Crosstab
Set list propertiesFormat lists to give them the appearance you want. You can specify formatting for individual column titlesor bodies or for all columns in a list. When you specify formatting for all columns in a list, the formatting isautomatically applied to new columns you subsequently add.
You can also quickly format lists by applying table styles.
Formatting for specific columns overrides formatting for entire columns. For example, you specify red asthe background color for a specific column body and green as the background color for all columns. Whenyou run the report, the specific column body is red and the remaining columns in the list are green. Newcolumns added to the list will be green.
Procedure
1. To format an individual column, do the following:a) Click the column title or column body.
b) To format the text in the column title or the data in the column body, click the More icon , click
the Locked icon and then click the title or body.
c) To format the whole column, click the Select ancestor icon in the title bar of the Propertiespane and click List column.
d) In the Properties pane, set the property value.
For example, to specify a background color, click Background color and choose the color.2. To format all columns, do the following:

a) Click a column in the list.b) To format list column bodies, click the Select ancestor icon in the title bar of the Properties pane
and click List columns body style.c) To format list column titles, click the Select ancestor icon in the title bar of the Properties pane
and click List columns title style.d) To format entire columns, click the Select ancestor icon in the title bar of the Properties pane and
click List columns.e) To format the entire list, click the select ancestor button in the title bar of the Properties pane and
click List.
Tip: You can also click the container selector (three orange dots) of the list to select it.f) In the Properties pane, set the property value.
For example, to specify a background color, click Background color and choose the color.
Related conceptsLaying Out a Report
Hide columns in list reportsYou can hide columns from the output of list reports. If you select to hide a column, the query for thatcolumn is still executed.
Procedure
1. Select the column that you want to hide.
2. Click the Select ancestor icon in the title bar of the Properties pane and click List column.3. Set the Render property to No.
ResultsWhen you run your report, the column is hidden in the report output.
Creating a scrollable list
Create a scrollable list so that column headings remain visible when the list contains many rows of data.
Procedure
1. Select the entire list by clicking the container selector (three orange dots) of the list.
2. In the IBM Cognos Analytics toolbar, click the Show properties icon .3. In the properties sheet of the list, specify the height of the scrollable area, in pixels, that you want by
typing a value in the Scrollable area height property.
Using RepeatersUse repeaters to repeat items when you run the report. For example, you can use repeaters to createmailing labels, including customer names and addresses.
To build a repeater, drag the Repeater or Repeater table object from the Toolbox tab to the work area.Use repeaters to repeat items across a single row without a particular structure. For example, you want tocreate a list that contains Year, and Product line. For each year, you want all product lines to appear in a
38 IBM Cognos Analytics - Reporting Version 11.0 : User Guide

single row. To do this, create a list with Year as a column and with a repeater as a second column. Theninsert Product line into the repeater. Use repeater tables to repeat items in a table structure. Drop theitems in the repeater, and modify the properties of the repeater to obtain the results you want. Forexample, you can specify how many frames appear per page in a repeater table by typing values in theAcross and Down properties.
Horizontal pagination is not supported for data containers, such as lists or crosstabs, that are nested inrepeater tables.
Chapter 3. Lists 39

40 IBM Cognos Analytics - Reporting Version 11.0 : User Guide

Chapter 4. CrosstabsUse crosstab reports, also known as matrix reports, to show the relationships between three or morequery items. Crosstab reports show data in rows and columns with information summarized at theintersection points.
For example, the following crosstab shows the gross profit and revenue by product line for each year.
Tip: The Same Month Prior Year sample report in the Sales and Marketing (cube) package includes acrosstab.
Related tasksInsert a Microchart into a Crosstab
Crosstab Nodes and Crosstab Node MembersWhen you add data items to crosstabs, you create crosstab nodes and crosstab node members. Theseobjects allow you to easily create crosstabs, by dragging data items to crosstabs.
Crosstabs are dimensional objects that have row edges and column edges. Each edge is composed of aset of crosstab nodes. Each crosstab node contains the following:
• One or more crosstab node members.• Zero or one nested crosstab node, which contains one or more crosstab node members or nested
crosstab nodes.
Each crosstab node member refers to a data item that contains an expression to define the members inthe crosstab.
The following crosstab contains four crosstab nodes.
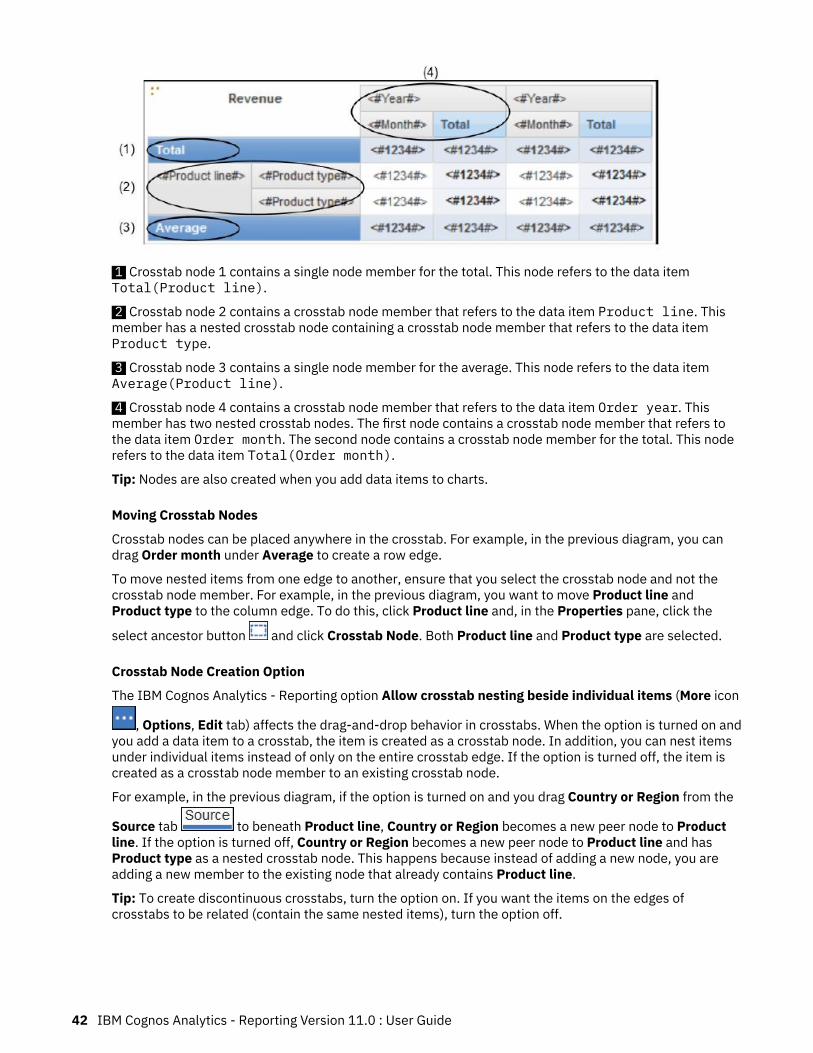
1 Crosstab node 1 contains a single node member for the total. This node refers to the data itemTotal(Product line).
2 Crosstab node 2 contains a crosstab node member that refers to the data item Product line. Thismember has a nested crosstab node containing a crosstab node member that refers to the data itemProduct type.
3 Crosstab node 3 contains a single node member for the average. This node refers to the data itemAverage(Product line).
4 Crosstab node 4 contains a crosstab node member that refers to the data item Order year. Thismember has two nested crosstab nodes. The first node contains a crosstab node member that refers tothe data item Order month. The second node contains a crosstab node member for the total. This noderefers to the data item Total(Order month).
Tip: Nodes are also created when you add data items to charts.
Moving Crosstab Nodes
Crosstab nodes can be placed anywhere in the crosstab. For example, in the previous diagram, you candrag Order month under Average to create a row edge.
To move nested items from one edge to another, ensure that you select the crosstab node and not thecrosstab node member. For example, in the previous diagram, you want to move Product line andProduct type to the column edge. To do this, click Product line and, in the Properties pane, click the
select ancestor button and click Crosstab Node. Both Product line and Product type are selected.
Crosstab Node Creation Option
The IBM Cognos Analytics - Reporting option Allow crosstab nesting beside individual items (More icon
, Options, Edit tab) affects the drag-and-drop behavior in crosstabs. When the option is turned on andyou add a data item to a crosstab, the item is created as a crosstab node. In addition, you can nest itemsunder individual items instead of only on the entire crosstab edge. If the option is turned off, the item iscreated as a crosstab node member to an existing crosstab node.
For example, in the previous diagram, if the option is turned on and you drag Country or Region from the
Source tab to beneath Product line, Country or Region becomes a new peer node to Productline. If the option is turned off, Country or Region becomes a new peer node to Product line and hasProduct type as a nested crosstab node. This happens because instead of adding a new node, you areadding a new member to the existing node that already contains Product line.
Tip: To create discontinuous crosstabs, turn the option on. If you want the items on the edges ofcrosstabs to be related (contain the same nested items), turn the option off.
42 IBM Cognos Analytics - Reporting Version 11.0 : User Guide
Set Crosstab PropertiesFormat crosstabs to give them the appearance you want. You can specify formatting for rows, columns,and fact cells in a crosstab or for the entire crosstab. When you specify formatting for all rows, columns,fact cells, or the crosstab, the formatting is automatically applied to any new items you add.
If you apply the same styles, such as font color, to crosstab rows, columns, and crosstab intersections,the styles are applied in the following order:
1. crosstab fact cells2. fact cells in the outermost rows3. fact cells in the innermost rows4. fact cells in the outermost columns5. fact cells in the innermost columns6. crosstab intersections
The style applied to the last object in the list overrides styles applied to previous objects. In addition,class styles are applied before styles that you apply manually.
You can also quickly format crosstabs by applying table styles and add white space to a crosstab byinserting crosstab space objects.
Tip: In cases where fact cell formatting applied to rows conflicts with fact cell formatting applied tocolumns, you can set the Fact Cells Precedence property in the Properties pane to determine whetherthe row formatting or the column formatting has precedence. To set this property, click anywhere in thecrosstab, click the Select ancestor icon in the title bar of the Properties pane, and click Crosstab. Or youcan click the container selector (three orange dots) of the crosstab to select it.
Procedure
1. To format the entire crosstab, do the following:a) Click anywhere in the crosstab.
b) Click the Select ancestor icon in the title bar of the Properties pane and click Crosstab.c) In the Properties pane, set the property value.
For example, to specify a background color, click Background Color and choose a color.2. To format all rows, columns, or fact cells, click a row, column, or fact cell in the crosstab and then do
the following:a) If you clicked a row, click the Select ancestor icon in the title bar of the Properties pane and click
Crosstab Rows.b) If you clicked a column, click the Select ancestor icon in the title bar of the Properties pane and
click Crosstab Columns.c) If you clicked a fact cell, click the select ancestor button in the title bar of the Properties pane and
click Crosstab Fact Cells.d) In the Properties pane, set the property value.
For example, to specify a background color, click Background Color and choose the color.
Tip: You can also right-click the row or column and click Select Fact Cells.3. To format all crosstab cells for a specific row or column, do the following:
a) Click the row or column.b) Click the Select ancestor icon in the title bar of the Properties pane and click Crosstab Member
Fact Cells.
Tip: You can also right-click the row or column and click Select Member Fact Cells.c) In the Properties pane, set the property value.
Chapter 4. Crosstabs 43

For example, to specify a background color, click Background Color and choose the color.4. To format all row or column titles, do the following:
a) Click a row or column title.b) Click the Select ancestor icon in the title bar of the Properties pane and click Crosstab Rows or
Crosstab Columns.c) In the Properties pane, set the property value.
For example, to specify a background color, click Background Color and choose the color.5. To format an individual row, column, or intersection, do the following:
a) Click the row, column, or intersection.
Tip: To format the data in a row, column, or intersection, click the More icon , click the Locked
icon , and then click the text item to format.b) In the Properties pane, set the property value.
For example, to specify a background color, click Background Color and choose the color.
Related conceptsLaying Out a Report
Create a Single-Edge CrosstabCreate a single-edge crosstab report to show data in a list-like form. For example, to show the quantity ofproducts sold for each year and for each order method, you could create a crosstab with Order Year andOrder Method as rows and Quantity as the measure.
Procedure
1. Click the Toolbox icon , and drag a crosstab object to the work area.
2. From the Source tab , drag data items to the Rows or Columns drop zone.
A black bar indicates where you can drop the data item.3. Repeat step 2 to insert additional data items:
• If you dragged the data item in step 2 to the Rows drop zone, drag the additional items above orbelow the first item.
• If you dragged the data item in step 2 to the Columns drop zone, drag the additional items to the leftor right of the first item.
4. To add measures to the crosstab, drag the measures to the Measures drop zone.
ResultsWhen you run the report, a crosstab is produced that has only one edge.
Create a Nested CrosstabNest data in a crosstab report to compare information by using more than one data item in a column orrow. For example, a report shows the number of sales by product line for the past fiscal year. You decideto add a data item to further break down the number of sales by quarter.
When nesting columns in a crosstab report, there are four distinct drop zones where you can insert a newdata item. The drop zone you choose will define the relationship between the data item and the column.
The following relationships are created when you insert a data item as a row:
44 IBM Cognos Analytics - Reporting Version 11.0 : User Guide
• Inserting a data item to the left or right of a column creates a parent-child relationship between them.
When you insert a data item to the left of a column, the data item becomes a parent to the column.When you insert a data item to the right of a column, the data item becomes a child of the column.
• Inserting a data item above or below a column creates a union relationship between them.
The following relationships are created when you insert a data item as a column:
• Inserting a data item to the left or right of a column creates a union relationship between them.• Inserting a data item above or below a column creates a parent-child relationship between them.
When you insert a data item above a column, the data item becomes a parent to the column. When youinsert a data item below a column, the data item becomes a child of the column.
For example, you have a crosstab with Product line as rows and Quantity and Revenue as nested rows.For columns, you have Order method with Country or Region as a nested column. In this crosstab,
• Product line is a parent to Quantity and Revenue.• Quantity and Revenue are peers.• Order method is a parent to Country or Region.
Procedure
1. From the Source tab , click the data item to add.2. Drag the data item to the report as a nested column or nested row.
A black bar indicates where you can drop the data item.3. Repeat steps 1 to 2 to add other nested columns or rows.
Tip: If you add more than one measure to a crosstab, all measures appear as columns. You cannothave one measure appear as a row and another as a column. To make all measures appear as rows,swap columns and rows.
Creating headers automatically for sets in crosstabsYou can automatically add header labels on columns and rows when working with sets in a crosstab thatuses a dimensional data source. The headers help consumers of the report to understand where the datais in the hierarchy.
Header labels are added only when you add new sets to your crosstab. The labels are not added toexisting sets. After you enable this option, it remains on until you disable it, and applies to any newcrosstabs that you create.
Procedure
1. Click the More icon , click Options, then click the Report tab.2. Select Automatically create crosstab headers for sets.3. Click OK.
Results
Header labels are created in the rows and columns in a crosstab.
Chapter 4. Crosstabs 45

Showing crosstab values as percentagesWhen you work with dimensional data sources, you can show crosstab values as a percentage of asummary instead of the actual values. When you show values as a percentage, you can compare thecontribution of an item to the whole.
About this task
You can show crosstab values as a percentage of a summary on the rows, the columns, or the rows andcolumns. For example, a crosstab has Product line as rows, Year as columns, and Revenue as themeasure. You can show the following crosstab values:
• The actual values of Revenue• A percentage of a summary on Product line• A percentage of a summary on Year• A percentage of a summary on Product line, Year
By default, the summary type that is used to calculate the percentages is Automatic summary.
When you show values as a percentage, a percentage measure data item is created.
You can also create a custom percentage calculation. For example, you can show values as a percentageof an intersection (tuple). Or you can show values as a percentage of a different summary type, such asMaximum.
When you show values as a percentage, the fact cells are formatted with the percent data format. Whenyou show the actual values, the fact cells are formatted with the number format. If you modify the dataformat of the actual values, the change is lost when you switch between showing the actual values andpercentage values.
You can show values as a percentage only in crosstabs. If you insert a chart, you cannot fill the chart withdata from a crosstab that shows values as a percentage. If you create a chart from a crosstab that showsvalues as percentages, an empty chart is created in the report.
Procedure
1. Select the measure for which you want to show values as a percentage.
If there is only one measure in the crosstab, click the crosstab corner.
2. From the report object toolbar, click the More icon , click Show Value As, and click the percentagevalues that you want to show.
3. If you click Custom, provide the information that is required to calculate the percentage values.a) To change the default name of the percentage data item that you are creating, type the new name
in the Name field.b) In the Percentage based on box, choose to build the percentage data item based on a summary of
sets in the crosstab or based on an intersection (tuple).c) If you choose to build the percentage data item based on a summary of sets, in the Choose sets
box, click the sets that you want to use. Then, click Summary type and select the summary thatyou want to use to calculate the percentage values.
If there is more than one data item on the crosstab edge that you chose for the sets, select whichdata item that you want to use.
d) If you choose to build the percentage data item based on an intersection (tuple), click the ellipsisand select the items that you want to use to create the intersection.
e) Click OK.4. To edit a measure percentage data item, follow these steps.
a) Select the measure.
46 IBM Cognos Analytics - Reporting Version 11.0 : User Guide
b) From the report object toolbar, click the More icon, click Show Value As > Edit.c) Modify the information for the data item as described in step 3.d) If you replaced a set in the crosstab with a different set, in the Choose sets box, click Existing sets
when you want to base the percentage values on the set that you replaced.
Related tasksCreate an Intersection (Tuple)
Specify the Default MeasureYou can specify the default measure for crosstabs and certain chart types. Specify the default measure tobe used when the measures cannot be determined by what is on the edges. For example, you create acrosstab with Order method as rows and Product line as columns. You add Quantity and Revenue asnested rows, making Order method their parent. You then add Country or Region under Order method.Since there is no measure specified for Country or Region, you specify the default measure so that data isreturned for each country or region.
Note: In crosstabs, IBM Cognos Analytics - Reporting automatically sets the default measure when youinsert a measure into the crosstab cells.
Procedure
1. To specify the default measure for a crosstab, do the following:
• Click any part of the crosstab, and then click the Select ancestor icon in the title bar of theProperties pane.
• Click Crosstab.
Tip: You can also click the container selector (three orange dots) of the crosstab to select it.• Set the Default Measure property to the default measure.
2. To specify the default measure for a chart, drag the measure to the Default measure box in the chart.
Swap Columns and RowsSwap columns and rows to look at information from a different perspective. This may help you discoverhigh and low points in the data that you hadn't previously noted.
You can only swap columns and rows in a crosstab or chart. In a chart, you swap the x- and y-axes.
Procedure
From the toolbar, click the swap rows and columns button .
ResultsIn the report, the rows become the columns and the columns become the rows.
Indent DataYou can indent crosstab node members to set them apart from surrounding data.
When you insert a hierarchy in rows, all members are automatically indented according to their level. Bydefault, the first member in a set is not indented. If you insert a hierarchy in columns, the members arenot automatically indented. You can change the indentation properties of members in the report.
Chapter 4. Crosstabs 47

Relative indentation means that the member will shift by one tab when the member's level increasesrelative to the previous member in the hierarchy.
Indenting based on the level in the hierarchy means that the member will shift the number of tabsequivalent to the level in the hierarchy.
You can also indent objects by applying padding.
Procedure
1. Click the crosstab node member to indent.2. In the Properties pane, set the Level Indentation property to your indentation type, length, and
direction.
Change a List into a CrosstabChange a list into a crosstab to view your data from a different perspective.
Procedure
1. Click the columns to appear as columns or nested columns in the crosstab.2. From the report object toolbar, click the Pivot List to Crosstab icon.
ResultsThe list becomes a crosstab with the columns you selected in step 2 appearing as columns and nestedcolumns. The unselected columns, except for measures, appear as rows and nested rows. If you have onemeasure, it becomes the cells of the crosstab. If you have more than one measure, they appear ascolumns.
Tip: To make all measures appear as rows, swap columns and rows.
48 IBM Cognos Analytics - Reporting Version 11.0 : User Guide

Chapter 5. ChartsYou can use IBM Cognos Analytics - Reporting to create many chart types, such as column, bar, area, andline charts.
Current Default Charts and Legacy ChartsIBM Cognos Analytics - Reporting has a new default chart technology as of version 10.1.0.
You will find procedures in this chapter for using both the legacy charts and the current default charts. Touse the legacy chart type, set the Use legacy chart authoring option (More > Options > Advanced tab).
Related conceptsLimitations When Converting Legacy ChartsRelated tasksConvert Legacy Charts to Current Default Charts
Creating ChartsBefore creating charts, review the available chart types to select the best chart for your needs. Alsoreview the chart objects that make up charts.
Tip: To view the available chart types, add a Visualization object from the Toolbox pane to an
existing report. In the Visualization gallery window, click the Filter icon , and select Charts.
To create charts, drag data items from the Source tab to the measures, data series andcategories drop zones.
Note: When you are working with dimensional data sources, do not insert member properties in the seriesor categories of a chart. By default, IBM Cognos Analytics - Reporting groups items that are inserted inthese areas. Grouping member properties produces a warning when you validate the report.
To help you when creating charts, you can do the following:
• Preview your chart style changes.
As you author your chart and edit the chart properties, IBM Cognos Analytics - Reporting provides youwith a preview of your chart, using simulated data. This allows you to view your style changes withoutrunning your report. You need to run your report to see the chart with your actual data. You can disablethe chart preview in the options.
• Resize your charts.• Move the chart drop zones into flyouts so that they appear only when you pause your pointer over the
chart.
After you create a basic chart, modify the various chart objects to customize your chart.
Chart ObjectsThe following shows the most common chart objects as they appear in your report output in IBM CognosViewer.

y-axis title
gridlines
x-axislabels
footer
titlesubtitle data series
categories
x-axis title
The following shows the same chart as it appears in the IBM Cognos Analytics - Reporting user interface.The Y-axis is selected, and the axis titles are displayed.
50 IBM Cognos Analytics - Reporting Version 11.0 : User Guide

chart typeicony-axis
plot area
x-axisaxis titles
legend icon
chart object(anywhere
within frame)
axis labels
Click chart objects to specify properties
The default charts have more properties that allow you to customize more aspects of the chart than inearlier versions. You can click in different areas of the chart to get access to different properties.
For example, by clicking the axis, you can customize the color, style, weight, and transparency of chartaxis lines and specify where to display major and minor gridlines on the chart.
Chapter 5. Charts 51

x-axis
Click to specify the default measure properties
Click to specify the axis label properties
Click to specify the axis properties - one axis is shown selected
Click to specify the axis title properties
Click to specify the chart node member properties
Click to specify the chart node member properties
Click to specify the properties for the columns, lines, or areas, such as size, shape, palette, and more
Click to specify thelegend and legend title properties
Click to specify the color & background properties, such as background effects, shadows, and plot area fills
Click to specify chart annotation properties, such as positioning the legend and adding notes, baselines, and trendlines
Data SeriesA data series is a group of related data points that are plotted in a chart. Each series has a unique color orpattern and is described in the legend. You can plot one or more data series in a chart; pie charts haveonly one data series.
In the example chart, the data series are order years 2010, 2011, 2012, and 2013.
CategoriesCategories are groups of related data from the data series that are plotted on the X-axis. Categories ofmultiple data series are shown together using clustered and stacked data markers.
In the example chart, the categories are the product lines of The Sample Outdoors Company in clusteredcolumns.
AxesAxes are lines that provide references for measurement or comparison.
The primary axis (or Y-axis) refers to measures of quantitative data, such as sales figures or quantities.Charts can have more than one primary axis.
The category axis (X-axis or ordinal axis) plots qualitative data, such as products or regions. It runshorizontally, except in bar charts.
The z-axis is the vertical axis in a 3-D chart.
Major gridlines extend from the tick marks on an axis and run behind the data markers.
Related conceptsCustomizing the Axes of a Chart
52 IBM Cognos Analytics - Reporting Version 11.0 : User Guide

LegendA legend is a key to the patterns or colors assigned to the data series or categories in a chart.
Columns, Lines, and AreasCharts use graphical elements such as columns, horizontal bars, points, bubbles, lines, and areas asvisual representations of data points.
Chart TypesIBM Cognos Analytics - Reporting provides many types of charts for presenting your data in a way that ismeaningful for your users.
You can select from a variety of chart types (such as pie, bar, line, gauge, scatter, and so on) and you canselect from a variety of chart configurations (such as stacked columns, 3-D pies). Combination chartsallow you to use more than one chart type within your chart.
Some chart types are not supported for Microsoft Excel output or appear differently in Excel. For moreinformation, see Appendix C, “Limitations When Producing Reports in Microsoft Excel Format,” on page399.
Choosing a Chart Type and ConfigurationTo choose a chart type, consider what you want the chart to illustrate. Different chart types andconfigurations emphasize different things.
Purpose Chart type or configuration
Show contributions of parts to a whole Bar Charts
Pie Charts
Stacked Charts, when you want to displaymeasures of the whole, as well as the parts
100 Percent Stacked Charts
Show trends in time or contrast values acrossdifferent categories
Line Charts
Area Charts
Bar Charts
Column Charts
Always place time in the horizontal axis.
Compare groups of related information againstactual values
Bar Charts
Radar Charts
Compare different kinds of quantitative information Combination Charts
Rank values in descending or ascending order Bar Charts
Column Charts
Show correlation between two sets of measures Point Charts
Show key performance indicators in an executivedashboard report
Gauge Charts
Bullet Charts
Chapter 5. Charts 53

Column ChartsColumn charts are useful for comparing discrete data or showing trends over time.
Column charts use vertical data markers to compare individual values.
Note: The Sales Growth Year Over Year sample report in the GO Data Warehouse (analysis) packageincludes a column chart.
The following example shows the revenue for each product line.
Column charts can plot data using standard, stacked, 100 percent stacked, and three-dimensionalconfigurations.
Line ChartsLine charts are useful for showing trends over time and comparing many data series.
Line charts plot data at regular points that are connected by lines.
Line charts can plot data by using standard, stacked, 100 percent stacked, and three-dimensionalconfigurations. It is best not to use stacked line charts because they are difficult to distinguish fromunstacked line charts with multiple data series.
Note: Line charts support a maximum of 32767 data points.
The following example shows a revenue trend that peaked in 2012 in every territory.
54 IBM Cognos Analytics - Reporting Version 11.0 : User Guide

Note: The Top Retailers by Country or Region sample report in the Sales and Marketing (cube) packageincludes a line chart.
Pie ChartsPie charts are useful for highlighting proportions.
They use segments of a circle to show the relationship of parts to the whole. To highlight actual values,use another chart type, such as a stacked chart.
Pie charts plot a single data series. If you need to plot multiple data series, use a 100 percent stackedchart.
Reports in PDF or HTML format show a maximum of 16 pies or gauges per chart.
Note: The Returns by Failed Orders in 2012 sample report in the GO Data Warehouse (analysis) packageincludes a pie chart.
The following example shows that the largest proportion of revenue comes from the Americas, followedby the Asia Pacific region.
Chapter 5. Charts 55

Pie charts can plot data using standard, 100 percent, and three-dimensional configurations.
Related tasksSet the Position of the First Slice in a Current Default Pie ChartCreating a Donut Chart from a Current Default Pie ChartPull Out Pie Slices in a Current Default Pie Chart
Bar ChartsBar charts are useful for showing trends over time and plotting many data series.
Bar charts use horizontal data markers to compare individual values.
Note: The Manager Profile sample report in the GO Data Warehouse (analysis) package includes a barchart.
The following example shows revenue for every country or region.
Figure 2. Bar chart
Bar charts can plot data using standard, stacked, and 100 percent stacked configurations.
Area ChartsArea charts are useful for emphasizing the magnitude of change over time. Stacked area charts are alsoused to show the relationship of parts to the whole.
Area charts are like line charts, but the areas below the lines are filled with colors or patterns.
Do not use standard area charts to show multiple data series because it is possible for areas with lowervalues to be covered by others. For multiple data series, use a stacked area chart.
The following example is a stacked area chart that shows the quantity of products that were sold over afour-year period in multiple territories.
56 IBM Cognos Analytics - Reporting Version 11.0 : User Guide

Figure 3. An example area chart
Area charts can plot data using standard, stacked, 100 percent stacked, and three-dimensionalconfigurations.
Point ChartsPoint charts are useful for showing quantitative data in an uncluttered fashion.
Point charts use multiple points to plot data along an ordinal axis. A point chart the same as a line chartwithout the lines. Only the data points are shown.
The following example shows the revenue for each product line.
Figure 4. An example point chart
Combination ChartsCombination charts plot multiple data series by using combinations of columns, areas, and lines withinone chart. They are useful for highlighting relationships between the various data series.
Chapter 5. Charts 57

Note: The Quantity Sold vs. Shipped and Inventory sample report in the GO Data Warehouse (analysis)package includes a combination chart.
The following example shows a combination chart that includes planned revenue as a line chart andactual revenue as a column chart.
Combination charts can plot data using standard, stacked, 100 percent stacked, and three-dimensionalconfigurations.
Scatter ChartsScatter charts use data points to plot two measures anywhere along a scale, not only at regular tickmarks.
You can also specify a default measure. For example, you might need to specify a default measure to givecontext to a calculated measure in the chart. For more information about the default measure, see“Specify the Default Measure” on page 47.
Scatter charts are useful for exploring correlations between different sets of data.
Note: The Employee Satisfaction 2012 sample report in the GO Data Warehouse (analysis) packageincludes a scatter chart.
The following example shows the correlation between production cost and gross profit for each productline.
58 IBM Cognos Analytics - Reporting Version 11.0 : User Guide

Related tasksDefining color by value in current default scatter or bubble charts
Bubble ChartsBubble charts, like scatter charts, use data points and bubbles to plot measures anywhere along a scale.The size of the bubble represents a third measure.
You can also specify a default measure. For example, you might need to specify a default measure to givecontext to a calculated measure in the chart. For more information about the default measure, see“Specify the Default Measure” on page 47.
Bubble charts are useful for representing financial data. These charts are not supported for MicrosoftExcel output.
The following example plots quantity and revenue by product line. The size of the bubble represents theamount of gross profit.
Figure 5. Bubble chart
Related tasksDefining color by value in current default scatter or bubble charts
Chapter 5. Charts 59
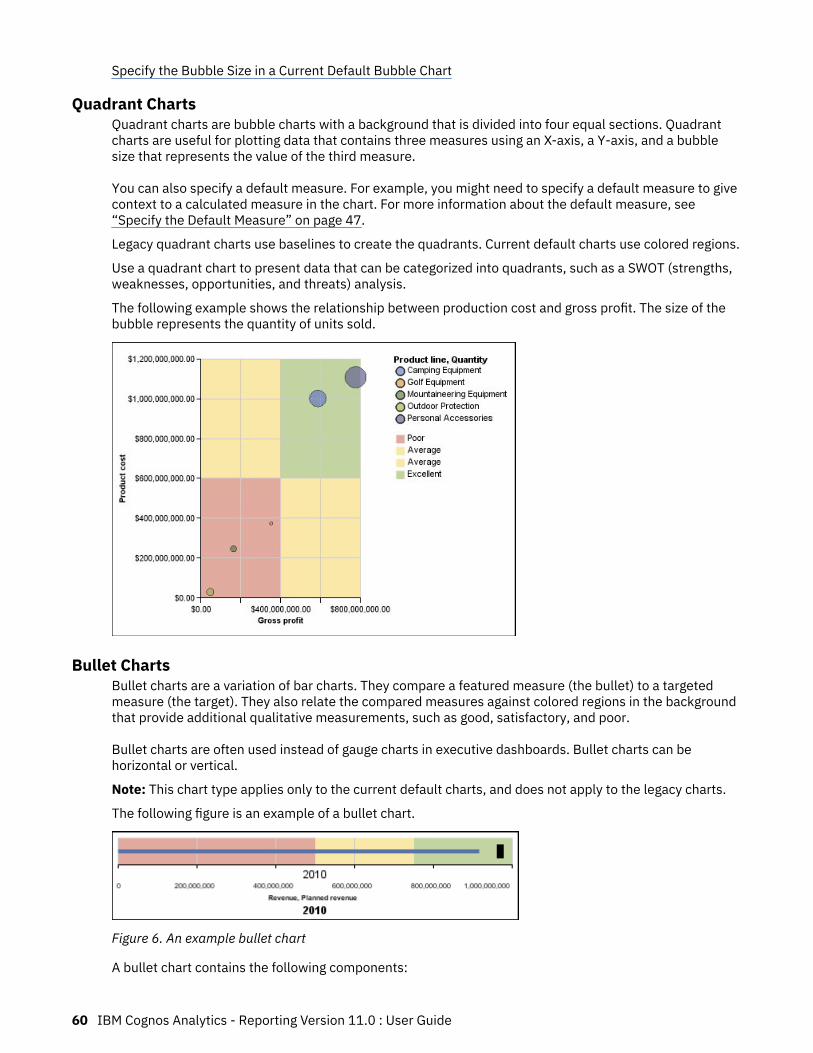
Specify the Bubble Size in a Current Default Bubble Chart
Quadrant ChartsQuadrant charts are bubble charts with a background that is divided into four equal sections. Quadrantcharts are useful for plotting data that contains three measures using an X-axis, a Y-axis, and a bubblesize that represents the value of the third measure.
You can also specify a default measure. For example, you might need to specify a default measure to givecontext to a calculated measure in the chart. For more information about the default measure, see“Specify the Default Measure” on page 47.
Legacy quadrant charts use baselines to create the quadrants. Current default charts use colored regions.
Use a quadrant chart to present data that can be categorized into quadrants, such as a SWOT (strengths,weaknesses, opportunities, and threats) analysis.
The following example shows the relationship between production cost and gross profit. The size of thebubble represents the quantity of units sold.
Bullet ChartsBullet charts are a variation of bar charts. They compare a featured measure (the bullet) to a targetedmeasure (the target). They also relate the compared measures against colored regions in the backgroundthat provide additional qualitative measurements, such as good, satisfactory, and poor.
Bullet charts are often used instead of gauge charts in executive dashboards. Bullet charts can behorizontal or vertical.
Note: This chart type applies only to the current default charts, and does not apply to the legacy charts.
The following figure is an example of a bullet chart.
Figure 6. An example bullet chart
A bullet chart contains the following components:
60 IBM Cognos Analytics - Reporting Version 11.0 : User Guide

• A bullet measure.
The bullet measure, Revenue, appears as the blue bar in the example.• A target measure.
The target measure, Planned revenue, appears as the black indicator in the example.• From zero to five colored regions along the numeric scale to provide information about the featured
measures' qualitative state.
The example contains three colored regions, 0-50%, 50-75%, and 75-100%.• A label that identifies the measures.• A numeric scale.
Related tasksCustomize a Current Default Bullet Chart
Gauge ChartsGauge charts, also known as dial charts or speedometer charts, use needles to show information as areading on a dial.
On a gauge chart, the value for each needle is read against the colored data range or chart axis. This charttype is often used in executive dashboard reports to show key business indicators.
Gauge charts are useful for comparing values between a small number of variables either by usingmultiple needles on the same gauge or by using multiple gauges.
Reports in PDF or HTML format are limited to show a maximum of 16 pies or gauges per chart. Thesecharts are not supported for Microsoft Excel output.
A gauge chart consists of a gauge axis (which contains the data range, color ranges, and intervalsmarkers), needles, and a center pivot point. The following example shows a basic gauge chart with defaultattributes. It is a degree dial chart with two axes.
Figure 7. An example gauge chart
Related tasksCustomize a Current Default Gauge ChartCustomize a Legacy Gauge Chart
Chapter 5. Charts 61
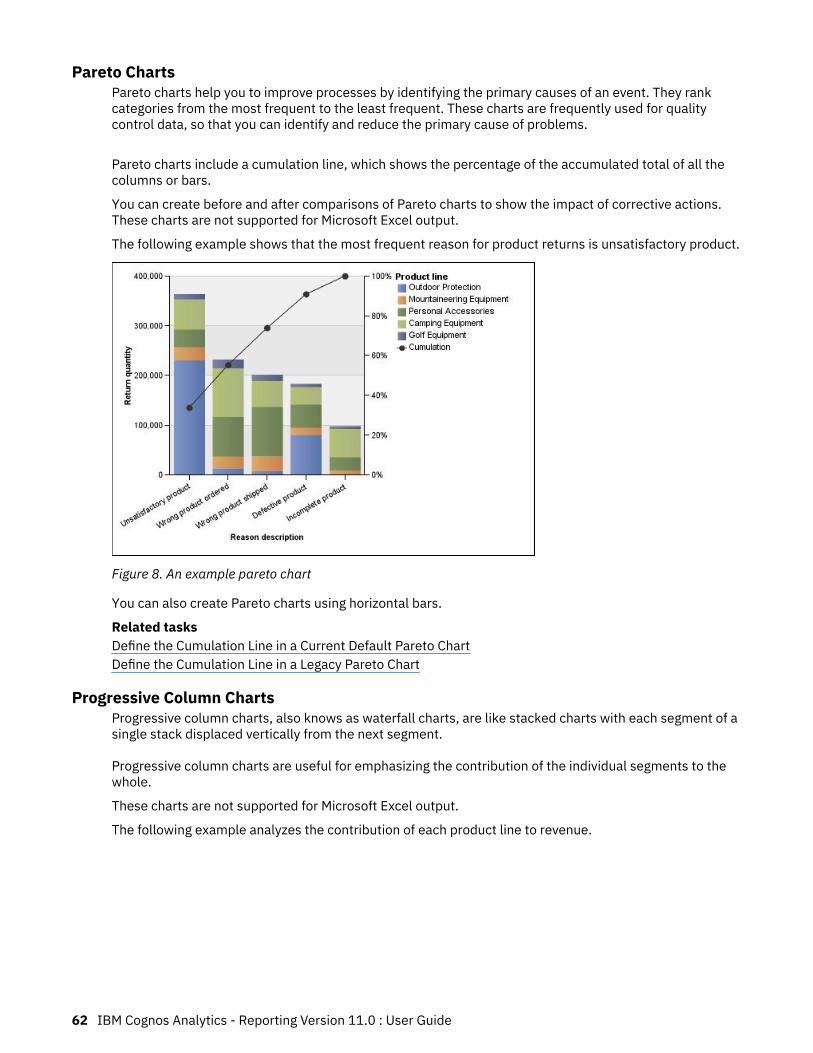
Pareto ChartsPareto charts help you to improve processes by identifying the primary causes of an event. They rankcategories from the most frequent to the least frequent. These charts are frequently used for qualitycontrol data, so that you can identify and reduce the primary cause of problems.
Pareto charts include a cumulation line, which shows the percentage of the accumulated total of all thecolumns or bars.
You can create before and after comparisons of Pareto charts to show the impact of corrective actions.These charts are not supported for Microsoft Excel output.
The following example shows that the most frequent reason for product returns is unsatisfactory product.
Figure 8. An example pareto chart
You can also create Pareto charts using horizontal bars.
Related tasksDefine the Cumulation Line in a Current Default Pareto ChartDefine the Cumulation Line in a Legacy Pareto Chart
Progressive Column ChartsProgressive column charts, also knows as waterfall charts, are like stacked charts with each segment of asingle stack displaced vertically from the next segment.
Progressive column charts are useful for emphasizing the contribution of the individual segments to thewhole.
These charts are not supported for Microsoft Excel output.
The following example analyzes the contribution of each product line to revenue.
62 IBM Cognos Analytics - Reporting Version 11.0 : User Guide

Figure 9. An example progressive column chart
Progressive column charts can plot data using standard and three-dimensional configurations. You canalso create progressive charts using horizontal bars.
MicrochartsMicrocharts are smaller versions of column charts, bar charts, and line charts that you can use incrosstabs and dashboards. Microcharts include column microcharts and bar microcharts, which areavailable in stacked and 100 percent stacked configurations, and win-loss charts and modified line chartsthat contain the following:
• A closing value marker.• Opening, closing, high, and low value markers.• A reference line.
Note: If you specify custom labels for a microchart, the custom labels appear in the tooltips, not on thechart itself. For more information about custom labels, see “Specify Custom Label Text” on page 82.
Win-loss charts are microcharts in which the value of each column is either 1 or -1, often denoting a winor loss.
Win-loss charts use two measures (the default and the win-loss measure) and no series. The win-lossmeasure is the measure or calculation that you define. You can also specify a default measure. Forexample, you might need to specify a default measure to give context to a calculated measure in thechart. For more information about the default measure, see “Specify the Default Measure” on page 47.
The following example shows the quarters that have a margin of less than 10,000 in red.
Chapter 5. Charts 63

Marimekko ChartsMarimekko charts are 100 percent stacked charts in which the width of a column is proportional to thetotal of the column's values. Individual segment height is a percentage of the respective column totalvalue.
The following example shows the contribution of revenues for product lines in different regions.
Figure 10. An example Marimekko chart
Radar ChartsRadar charts integrate multiple axes into a single radial figure. For each figure, data is plotted along aseparate axis that starts at the center of the chart.
The following example shows the revenue from multiple retailer types in multiple territories.
Figure 11. An example radar chart
Radar charts can plot data using standard and stacked configurations.
Polar ChartsPolar charts are useful for showing scientific data.
They are circular charts that use values and angles to show information as polar coordinates.
64 IBM Cognos Analytics - Reporting Version 11.0 : User Guide

You can specify a default measure. For example, you might need to specify a default measure to givecontext to a calculated measure in the chart. For more information about the default measure, see“Specify the Default Measure” on page 47.
The following example shows the revenue and quantity for each product line. The distance along theradial axis represents quantity, and the angle around the polar axis represents revenue.
Range Indicator ChartsRange indicator, or metrics range, charts are useful for showing a target range and a tolerance range.
A range indicator chart adds a target and range marker to a column, line, or area chart.
The following example shows actual revenue versus planned revenue. The markers indicate the plannedrevenue, and the range and tolerance lines are defined by the chart author.
Chart ConfigurationsChart configurations specify the grouping type of the columns, bars, lines, and areas in a chart. Someexamples are standard, stacked, and 100 percent stacked charts.
Standard ChartsStandard or absolute charts are useful for comparing specific values and for representing discrete data,such as data for different regions or individual employees. For example, a standard column chart thatplots regional sales emphasizes the actual value that each region achieves in sales.
Chapter 5. Charts 65
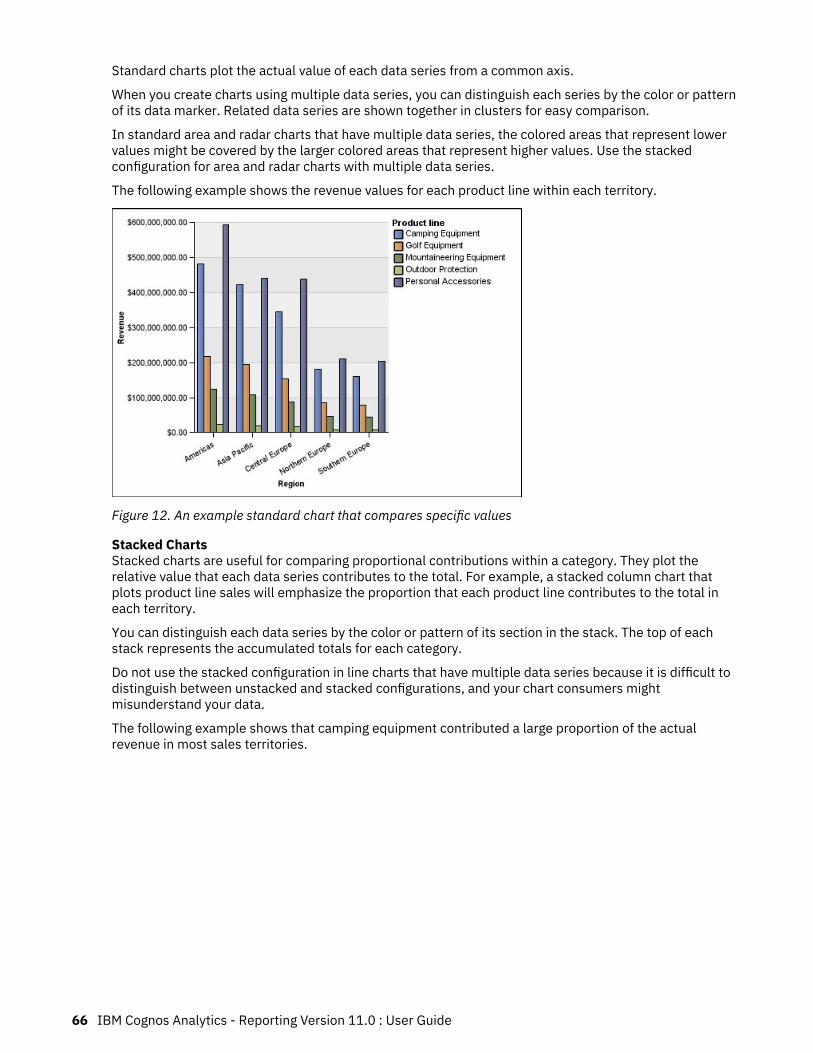
Standard charts plot the actual value of each data series from a common axis.
When you create charts using multiple data series, you can distinguish each series by the color or patternof its data marker. Related data series are shown together in clusters for easy comparison.
In standard area and radar charts that have multiple data series, the colored areas that represent lowervalues might be covered by the larger colored areas that represent higher values. Use the stackedconfiguration for area and radar charts with multiple data series.
The following example shows the revenue values for each product line within each territory.
Figure 12. An example standard chart that compares specific values
Stacked ChartsStacked charts are useful for comparing proportional contributions within a category. They plot therelative value that each data series contributes to the total. For example, a stacked column chart thatplots product line sales will emphasize the proportion that each product line contributes to the total ineach territory.
You can distinguish each data series by the color or pattern of its section in the stack. The top of eachstack represents the accumulated totals for each category.
Do not use the stacked configuration in line charts that have multiple data series because it is difficult todistinguish between unstacked and stacked configurations, and your chart consumers mightmisunderstand your data.
The following example shows that camping equipment contributed a large proportion of the actualrevenue in most sales territories.
66 IBM Cognos Analytics - Reporting Version 11.0 : User Guide

Figure 13. An example stacked chart
100 Percent Stacked Charts100 percent stacked charts are useful for comparing proportional contributions across all categories.They plot the relative contribution of each data series to the total as a percentage. For example, a 100percent stacked column chart that plots product line sales emphasizes the percentage within each regionwithout referring to actual values.
You can distinguish each data series by the color or pattern of its section in the stack. Each stackrepresents 100 percent.
100 percent stacked charts highlight proportions. When actual values are important, use another chartconfiguration.
The following example shows the percentage of sales for each product line in each region.
Figure 14. An example 100 percent stacked chart
Chapter 5. Charts 67
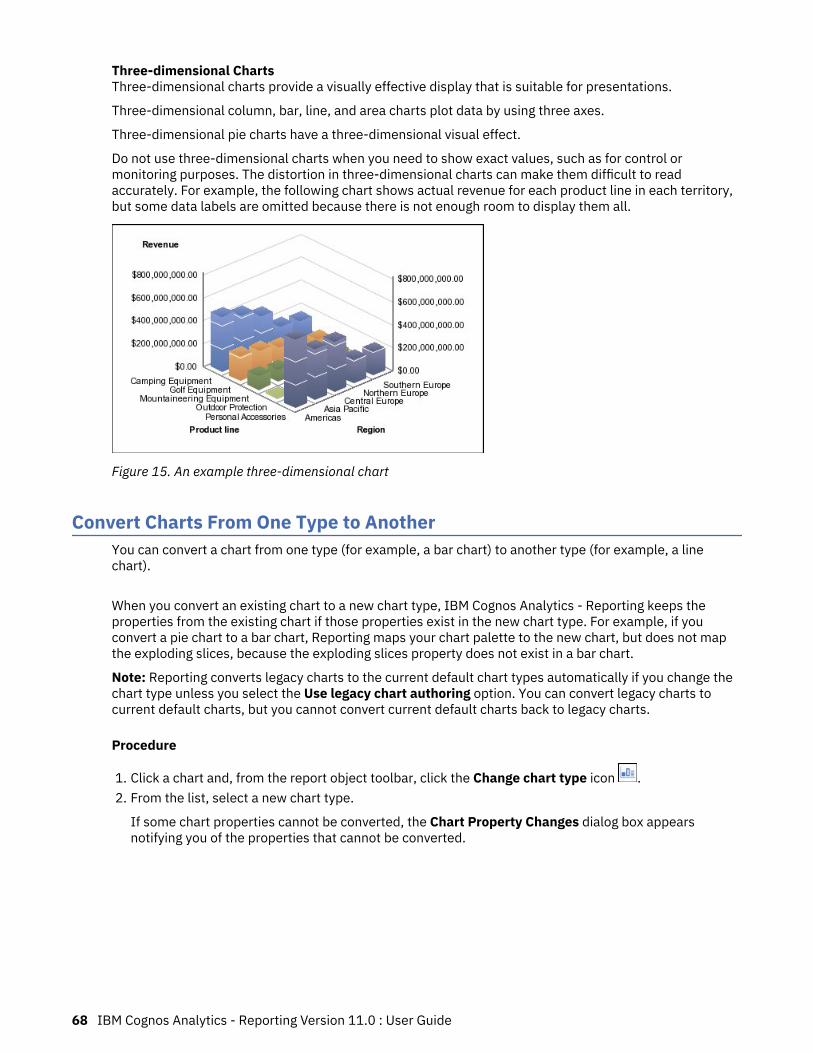
Three-dimensional ChartsThree-dimensional charts provide a visually effective display that is suitable for presentations.
Three-dimensional column, bar, line, and area charts plot data by using three axes.
Three-dimensional pie charts have a three-dimensional visual effect.
Do not use three-dimensional charts when you need to show exact values, such as for control ormonitoring purposes. The distortion in three-dimensional charts can make them difficult to readaccurately. For example, the following chart shows actual revenue for each product line in each territory,but some data labels are omitted because there is not enough room to display them all.
Figure 15. An example three-dimensional chart
Convert Charts From One Type to AnotherYou can convert a chart from one type (for example, a bar chart) to another type (for example, a linechart).
When you convert an existing chart to a new chart type, IBM Cognos Analytics - Reporting keeps theproperties from the existing chart if those properties exist in the new chart type. For example, if youconvert a pie chart to a bar chart, Reporting maps your chart palette to the new chart, but does not mapthe exploding slices, because the exploding slices property does not exist in a bar chart.
Note: Reporting converts legacy charts to the current default chart types automatically if you change thechart type unless you select the Use legacy chart authoring option. You can convert legacy charts tocurrent default charts, but you cannot convert current default charts back to legacy charts.
Procedure
1. Click a chart and, from the report object toolbar, click the Change chart type icon .2. From the list, select a new chart type.
If some chart properties cannot be converted, the Chart Property Changes dialog box appearsnotifying you of the properties that cannot be converted.
68 IBM Cognos Analytics - Reporting Version 11.0 : User Guide

Convert Legacy Charts to Current Default ChartsYou can convert charts from the legacy charts to the current default charts. When you convert a legacychart, select the template that most closely matches your legacy chart in order to preserve as manysettings as possible.
Note: You can convert legacy charts to current default charts, but you cannot convert current defaultcharts back to legacy charts.
Procedure
1. Click the More icon , click Options.2. From the Advanced tab, clear the Use legacy chart authoring check box.
3. Click the legacy chart, and in the report object toolbar, click the Change chart type icon .4. From the list, select a new chart type.
If some chart properties cannot be converted, the Chart Property Changes dialog box appearsnotifying you of the properties that cannot be converted.
Related conceptsCurrent Default Charts and Legacy Charts
Limitations When Converting Legacy ChartsWhen you convert a legacy chart to the current default chart, some chart types or chart properties mightnot be migrated properly. For example, clustered area charts and 100% stacked line charts are notavailable in the current default charts. If your exact chart configuration is not available, select the closestmatching template.
The following legacy chart properties are not migrated to the current default charts:
• Conditional Palette• Style Variable• Visual Angle• Rotate Values• Conditional Style, Style Variable, and Drill-Through Definitions on pie labels and gauge labels• Connecting Lines on combination charts• line styles; only four line styles are supported in the current default charts
The following table outlines some behavior differences between legacy charts and the current defaultcharts.
Legacy Charts Current Default Charts
Combination charts are always ordered from backto front - area, bar, and line.
Combination charts support any order.
In bar charts, multiple bar definitions for the Y1-axis are placed side-by-side.
In bar charts, multiple bars are placed on top ofone another and you can control the width of thebars.
In combination charts, the color palette iscontinued over multiple bars, lines, and areas.
In combination charts, color palettes are restartedfor each bar, line, and area.
Chapter 5. Charts 69
Legacy Charts Current Default Charts
The legend order respects the order in which bars,lines, and areas are specified. For example, barscan appear before areas in the legend.
The legend order is the same as the order specifiedin the chart.
The following chart types continue to use the legacy chart technology and therefore cannot be upgradedto the current default chart technology. If you want to convert these chart types to the current defaultcharts, upgrade them to a different chart type, such as a column or line chart.
• Win loss• Radar• Polar• 3-D Bar, 3-D Line, 3-D Area, and 3-D Combination• 3-D Scatter• Metrics range• Marimekko
Related conceptsCurrent Default Charts and Legacy Charts
Customizing chart propertiesAfter you create a chart, you can customize it by changing its properties.
You select the chart object in IBM Cognos Analytics - Reporting to view its properties. Some propertiesare dependent on the existence of other properties.
If you are familiar with using conditional variables, you can customize the chart to change its appearanceor provide information in response to expressions or conditions.
As you edit the chart properties, Reporting provides you with a preview of your chart, using simulateddata. This allows you to view your style changes without running the report. You can disable the chartpreview in the options.
The following table shows some of the properties you can change in charts. These properties are availablewhen you select the chart object unless specified otherwise in the Action to perform in the Propertiespane column.
Goal Action to perform in the Properties pane
Hide or show the title, subtitle, or footer Select the chart. Under Chart Titles, set the Title,Subtitle, or Footer property.
Hide or show the legend Select the chart. Under Chart Annotations, set theLegend property.
For more information, see “Customize the Legendin a Current Default Chart” on page 87.
Hide or show baselines Select the chart. Under Chart Annotations, set theBaselines property.
For more information, see “Add a Baseline to aCurrent Default Chart” on page 92.
70 IBM Cognos Analytics - Reporting Version 11.0 : User Guide

Goal Action to perform in the Properties pane
Increase the contrast of the labels Select the chart. In the Properties pane, underLabel, select Contrast label color.
Add a shadow to the labels to increase thevisibility.
Select the chart. In the Properties pane, underLabel, select Label shadow.
Hide or show trendlines or regression lines Select the chart. Under Chart Annotations, set theTrendlines or Regression Line property.
For more information, see “Display Trendlines inCurrent Default Charts” on page 95 or “DisplayRegression Lines in Legacy Scatter or BubbleCharts” on page 96.
Hide or show markers Select the chart. Under Chart Annotations, set theMarkers property.
For more information, see “Add a Marker to aCurrent Default Chart” on page 94.
Hide or show notes Select the chart. Under Chart Annotations, set theNotes property.
For more information, see “Add a Note to a CurrentDefault Chart” on page 89.
Hide or show the axes Select the chart. Under Axes, set the Y1 Axis, Y2Axis, or Category Axis property.
For more information, see “Customize the Axes ofa Current Default Chart” on page 83.
Hide or show the axis title or axis line Select the axis. Under General, set the Axis Line orAxis Title property.
For more information, see “Customize the Axes ofa Current Default Chart” on page 83.
Change an axis title Select the axis title. Under General, set theDefault Title property to No, and then double-clickthe axis title and type a new title.
Tip: You can use the Properties pane to changethe axis title properties, such as font, positioning,color, and so on.
For more information, see “Customize the Axes ofa Current Default Chart” on page 83.
Change axis properties, such as range, scaleinterval, and so on
Select the numeric axis. Under General, set theMinimum Value, Maximum Value, Scale Interval,or Scale property.
For more information, see “Change the axis scaleof a current default chart” on page 84.
Chapter 5. Charts 71

Goal Action to perform in the Properties pane
Hide or show the tooltips Select the chart. Under Chart Labels, set theTooltips property.
When you pause your pointer over a data marker inthe report output, the corresponding absolute orcumulative value appears in a tooltip.
Tooltips are not supported in PDF output.
Change the data format Select the numeric axis. Under Data, set the DataFormat property.
Change the white space around the chart Select the chart. Under Box, set the Padding orMargin property.
For more information, see “Apply Padding to anObject” on page 264 and “Set Margins for anObject” on page 264.
Change the color or pattern in the palette forcolumns, lines, and areas
Select the chart object. Under Color &Background, set the Palette or ConditionalPalette property.
For more information, see “Customizing the ColorPalette of a Chart” on page 74 and “Create aSimple Conditional Palette for a Current DefaultChart” on page 77.
Change the chart orientation Select the chart. In the Properties pane, underChart Orientation, select Vertical or Horizontal.
Change the default color or font for all chartobjects
Select the chart. Under Color & Background, setthe Background Color, Foreground Color, or FillEffects property.
For more information, see “Change a ChartBackground in a Legacy Chart” on page 80.
Under Font & Text, set the Font or RelativeAlignment property.
Tip: The 2011 Quarterly Sales Forecast samplereport in the GO Sales (analysis) package includestext alignment.
Override the default font or color for axes and chartvalues Click the More icon , click the Locked icon
to unlock the chart object, select the chart body byclicking between the axes, and set the Font,Background Color, Foreground Color, or FillEffects property.
72 IBM Cognos Analytics - Reporting Version 11.0 : User Guide

Goal Action to perform in the Properties pane
Change the three-dimensional appearance of achart
Select the chart. Under General, set the Depth orVisual Angle property.
For example, for a pie chart, a Depth value of 0(zero) leaves the pie flat, or two-dimensional. Avalue of 100 raises the pie almost to a sphere.
Tip: You can select a value from the Depth list ortype a value that is not listed.
Insert a background image or watermark in thechart body.
Click the lock button in the toolbar to unlock thechart object, select the chart body by clickingbetween the axes.
Under Color & Background, set the BackgroundImage property.
For more information, see “Change a ChartBackground in a Legacy Chart” on page 80.
Go to another report Select the chart. Under Data, set the Drill-ThroughDefinitions property.
For more information, see Chapter 18, “Using drill-through access,” on page 325.
Specify which labels and values to use whengenerating the text shown on the chart
Select the chart. Under Chart Labels, set theValues property.
Note: When you show all the labels and values onsome chart types, such as scatter charts, bubblecharts, and polar charts, the text shown might betoo long.
Resize a Current Default ChartYou can change the size of a current default chart by dragging the resize handle in the lower right cornerof the chart.
Procedure
1. Select the chart object.
2. Click the resize handle in the lower right corner of the chart .
Use Shift+drag to maintain the aspect ratio of the chart.3. To see the actual size of the chart as it will appear in the report output, collapse the chart objects with
the minus (-) button in the upper left corner of the chart.
ResultsThe new chart size appears in the Size & Overflow property. You can also edit the chart size with thisproperty.Related conceptsCurrent Default Charts and Legacy Charts
Chapter 5. Charts 73

Resize a Legacy ChartYou can resize a legacy chart by defining the height and width in the Size & Overflow property.
The options available with this property are detailed in “Specify the Height and Width of an Object” onpage 269.
Procedure
1. Select the chart object.2. In the Properties pane, double-click the Size & Overflow property and specify the height and width.
Related conceptsCurrent Default Charts and Legacy Charts
Customizing the Color Palette of a ChartYou can use the chart palette to control the colors or patterns used in the columns, lines, data markers orareas in a chart. For example, if "Telephone" is the first in a data series of order methods, and you want itto appear in blue, use the palette to make the first item in the series blue.
You can customize the color palette for area, bar, bubble, gauge, Pareto, pie, and scatter charts.
You can also apply background effects to chart objects or change the colors of specific chart elements.
Note: Your administrator can create custom palettes. For more information, see Create Custom Palettesin IBM Cognos 10 Report Studio. Although this document refers to Cognos BI 10.2.2, the information alsoapplies to Cognos Analytics 11. The only difference is that, in Cognos 11, the location installlocation\webcontent\pat has changed to install location\webcontent\bi\pat.
Related tasksAdd background effects to a chart object in a legacy chart
Customize the Color Palette of a Current Default ChartYou can use the chart palette to control the colors or patterns used in the columns, lines, data markers orareas in a chart.
Progressive charts and legacy charts have different steps.
If specified, the default color is used for outputs that do not support the palette definition. For example, ifthe palette is defined to use a radial rectangle gradient and you run the report as PDF output, the defaultcolor is used because radial rectangle gradients are not supported in PDF output.
Procedure
1. Select the chart object. For combination charts, select the bar, line, or area objects.
2. To choose a preset color palette, click the chart palette presets button on the style toolbar, andthen click a palette.
3. To change the existing color palette:
• In the Properties pane, under Color & Background, double-click the Palette property.• On the Entries tab, click the palette entry that you want to change.• Under Fill, select fill type, color, transparency, and other fill settings. The options in the Fill type list
depend on the chart type you are using.
Linear Gradient displays a gradient that changes color horizontally. You can specify the position ofeach color in the gradient and add or remove colors from the gradient.
Radial Line Gradient displays a gradient that changes color outwards from a central point, or focus.You can specify the position of each color in the gradient and the size and position of the focus. Youcan also add or remove colors from the gradient.
74 IBM Cognos Analytics - Reporting Version 11.0 : User Guide
Radial Rectangle Gradient displays a gradient that changes color outwards from a rectangle. Youcan specify the position of each color in the gradient and the size of the rectangle. You can also addor remove colors from the gradient.
Pattern displays a colored pattern that you choose from a preset list. You can specify the foregroundand background colors.
Color displays a solid color. You can specify the transparency.
Image displays an image. You can specify the image to use.• To change the color of this palette definition, click the color in the Colors list, click Color, specify the
color properties, and click OK.4. Under Style, depending on the chart type you are customizing and the fill type you chose in step 2, you
can change the marker shape, line style, default color, and line weight.
5. To add a new palette entry, click the New icon and specify the new palette settings.6. To change the order in which the colors, gradients, or patterns appear in the chart, use the arrow
buttons under the Palette box to change their position.7. To copy and paste a palette, open the palette dialog box and press Ctrl+C to copy the palette to the
clipboard. Close the palette dialog box. Select another chart, open the palette dialog box, and pressCtrl+V to paste the palette from the clipboard.
8. To customize the data markers, on the Properties tab, depending on the chart type you arecustomizing and the fill type you chose in step 2, you can specify whether data markers are shown andchange their color and size.
Related conceptsCurrent Default Charts and Legacy Charts
Customize the Color Palette of a Current Default Progressive ChartYou can use the chart palette to control the colors or patterns used in the columns, lines, data markers orareas in a chart.
Legacy charts and other types of current default charts have different steps.
If specified, the default color is used for outputs that do not support the palette definition. For example, ifthe palette is defined to use a radial rectangle gradient and you run the report as PDF output, the defaultcolor is used because radial rectangle gradients are not supported in PDF output.
Procedure
1. Select the progressive chart object.2. In the Properties pane, double-click the Progressive Palette property.
You can specify the following:
• Positive value fill defines the appearance of the positive bars or columns on the chart.• Negative value fill defines the appearance of the negative bars or columns on the chart.• First value fill defines the appearance of the first bar or column on the chart.• Total value fill defines the appearance of the total bar or column on the chart, if a total bar or
column is present.3. To change the appearance of a fill:
• Click the colored box beside the fill name.• Click a fill type from the Fill type list.
Linear Gradient displays a gradient that changes color horizontally. You can specify the position ofeach color in the gradient and add or remove colors from the gradient.
Chapter 5. Charts 75

Radial Line Gradient displays a gradient that changes color outwards from a central point, or focus.You can specify the position of each color in the gradient and the size and position of the focus. Youcan also add or remove colors from the gradient.
Radial Rectangle Gradient displays a gradient that changes color outwards from a rectangle. Youcan specify the position of each color in the gradient and the size of the rectangle. You can also addor remove colors from the gradient.
Pattern displays a colored pattern that you choose from a preset list. You can specify the foregroundand background colors.
Color displays a solid color. You can specify the transparency.
Image displays an image. You can specify the image to use.• To change the color of this fill, click the color in the Colors list, click Color, specify the color
properties, and click OK.4. To change the text of the label that appears next to a bar, double-click the text box beside the fill
name and specify the text.
Related conceptsCurrent Default Charts and Legacy Charts
Customize the Color Palette of a Legacy ChartYou can use the chart palette to control the colors or patterns used in the columns, lines, data markers orareas in a chart.
Current default charts have different steps.
Procedure
1. Select the chart object.2. In the Color & Background section of the Properties pane, double-click the Palette property.3. In the Palette dialog box, click the new palette entry button to define a new palette entry:
• To apply color, click Color, specify the color properties, and click OK.• To apply a gradient, click Gradient, specify the Direction, From color, and To color properties, and
click OK.• To apply a pattern, click Pattern, specify the Pattern, Foreground color, and Background color
properties, and click OK.
Tip: You can also select a predefined palette from the Palettes box.4. To change the order in which the colors, gradients, or patterns appear in the chart, use the arrow
buttons under the Palette box to change their position.5. To copy and paste a palette, open the palette dialog box and press Ctrl+C to copy the palette to the
clipboard. Close the palette dialog box. Select another chart, open the palette dialog box, and pressCtrl+V to paste the palette from the clipboard.
6. Repeat step 3 for each chart series.
Related conceptsCurrent Default Charts and Legacy Charts
Creating a Conditional Color Palette in a ChartYou can create a conditional palette to color data items in your chart in different ways depending on acondition. For example, in a column chart that shows revenue per month, you want to make the columnsfor the months that have a revenue greater than $1000000 green.
You can also use conditional styles to highlight exceptional data and use conditions to control the layoutof your report.
76 IBM Cognos Analytics - Reporting Version 11.0 : User Guide
Related conceptsUsing conditions
Create a Simple Conditional Palette for a Current Default ChartYou can create a simple conditional palette based on a string data item or a numeric data item. Forexample, if you want to create a condition to display only Revenues over one million dollars, you cancreate a numeric condition; whereas, if you want to create a condition to display only product codes withthe letter A in them, you can create a string condition.
Procedure
1. Select the chart series to which you want to apply the conditional palette.2. In the Properties pane, under Color & Background, double-click the Conditional Palette property.
3. Click the New icon and click New Condition.4. If you want to create a conditional palette based on a string, do the following:
a) Select the string data item to determine the condition.b) In the Type of conditional style list, click String, and click OK.c) Click the new button and select how to define the condition:
• To select more than one individual value, click Select Multiple Values and click the values.• To type specific values, click Enter Values and type the values.• To specify your own criteria, such as values that begin with the letter A, click Enter String
Criteria and specify the condition.
d) Under Palette Entry, beside the new condition, click the edit button .e) Define the palette entry fill type, colors, and angle, and click OK.
5. If you want to create a conditional palette based on a numeric range, date/time range, interval range,date range, or time range, do the following:a) Select a numeric data item to determine the condition.b) In the Type of conditional style list, click the type of condition you want to create, and click OK.c) Click the new button and type a value to define a threshold.
The value appears in the Range column, and two ranges are created.d) For each range, under Style, click the edit button to define the palette entry fill type, colors, and
angle, and then click OK.e) Repeat the previous substeps to add other conditions.
Tip: Under Style, pause the pointer over each range to see the condition produced for thatrange.
f) If you want to use the default palette for the lowest range instead of specifying a conditionalpalette select the Use default palette for lowest range check box.
g) To move a value above or below a threshold, click the arrow button next to the value.
For example, you insert a threshold value of five million. By default, the ranges are less than orequal to five million and greater than five million. Moving the five million value above the thresholdchanges the ranges to less than five million and greater than or equal to five million.
6. To customize the label for a conditional palette, do the following:a) Click Label beside the palette entry.b) In the Conditional Palette Entry Label dialog box, click Specified text and click the ellipsis button.c) Type the default label text in the Label text box.
Chapter 5. Charts 77

d) To add customized labels for other languages, click the Add icon , select the other languages,and click the language to define the customized label for that language.
7. Specify the order in which to evaluate the conditions by clicking a condition and then clicking the moveup or move down arrow.
Conditions are evaluated from top to bottom, and the first condition that is met is applied.
Related conceptsCurrent Default Charts and Legacy Charts
Create an Advanced Conditional Palette for Current Default ChartsAdvanced conditions allow you to use a calculations or expression to evaluate the condition. If multipleadvanced conditions are met, only the first conditional style is applied.
Procedure
1. Select the chart series to which you want to apply the conditional palette.2. In the Properties pane, under Color & Background, double-click the Conditional Palette property.
3. Click the Add icon and click Advanced Condition.
4. Click the new advanced condition icon and specify the expression that defines the condition.
The new advanced condition appears in the Conditional Palette - Advanced dialog box.
5. Under Palette Entry, beside the new advanced condition, click the edit button .6. Define the palette entry fill type, colors, and angle, and click OK.7. Specify the order in which to evaluate the conditions by clicking a condition and then clicking the move
up or move down arrow.
Conditions are evaluated from top to bottom, and the first condition that is met is applied.
Related conceptsCurrent Default Charts and Legacy Charts
Create a Conditional Color Palette for a Legacy ChartYou can create a color palette that appears differently depending on a yes or no answer, an expression orcalculation, or the report language.
Procedure
1. Click the chart object.2. In the Properties pane, under Color & Background, double-click the Conditional Palette property.3. If you want to create a variable that has only two possible values, Yes and No, do the following:
a) Under Variable, click New boolean variable.b) In the New Variable dialog box, type a name for the variable.c) In the Expression Definition box, define the condition and click OK.
For example, the following expression returns the value Yes if revenue is less than one million andthe value No if revenue is greater than or equal to one million:
[Revenue]<1000000d) In the Value box, select whether the expression evaluates to Yes or No.e) Under Effects, specify the color palette to use for the condition.
4. If you want to create a variable whose values are string-based, do the following:a) Under Variable, select New string variable.
78 IBM Cognos Analytics - Reporting Version 11.0 : User Guide
b) In the Expression Definition box, define the condition and click OK.
For example, the following expression returns the value high if revenue is greater than one millionand the value low if revenue is less than or equal to one million:
if ([Revenue]>1000000) then ('high') else ('low')
For information about creating expressions, see “Using relational calculations” on page 182 or“Using Dimensional Calculations” on page 227.
c) Click the Add icon in the Values pane.d) For each value that the variable can assume, type the name of the value that corresponds with the
possible outcomes defined in the expression.
For example, in the previous expression, you must create two values for the variable, high and low.
Tip: You can create a group by clicking two or more values and then clicking the group values
button . For example, you can create a group that includes the available French languages.5. If you want to create a variable whose values are different languages, do the following:
a) Under Variable, select Report Language Variable.b) In the Languages dialog box, select the languages to support.
6. Click OK to close the expression editor and leave the Conditional Palette dialog box open.7. Under Effect, click Pattern.8. Under Pattern, select a pattern and click OK.9. In the Box section of the Properties pane, set the Borders property to Show.
Related conceptsCurrent Default Charts and Legacy Charts
Change a Chart Background in a Current Default ChartYou can use a gradient, pattern, color, or image to customize the chart background.
Procedure
1. Click the chart object.
2. Click the More icon , click the Locked icon , select the chart body by clicking between the axes,and, in the Properties pane, under Color & Background, double-click the Plot Area Fill property.
3. Click a fill type from the Fill type list.
• Linear Gradient displays a gradient that changes color horizontally. You can specify the position ofeach color in the gradient and add or remove colors from the gradient.
• Radial Line Gradient displays a gradient that changes color outwards from a central point, orfocus. You can specify the position of each color in the gradient and the size and position of thefocus. You can also add or remove colors from the gradient.
• Radial Rectangle Gradient displays a gradient that changes color outwards from a rectangle. Youcan specify the position of each color in the gradient and the size of the rectangle. You can also addor remove colors from the gradient.
• Pattern displays a colored pattern that you choose from a preset list. You can specify theforeground and background colors.
• Color displays a solid color. You can specify the transparency.• Image displays an image. You can specify the image to use.
Related conceptsCurrent Default Charts and Legacy Charts
Chapter 5. Charts 79

Change a Chart Background in a Legacy ChartYou can use a solid color, a pattern, or a gradient fill effect to customize the chart background.
You can also use an image as a background for a chart.
Procedure
1. Click the chart object.
2. Click the More icon , click the Locked icon , select the chart body by clicking between the axes,and, in the Properties pane, under Color & Background, double-click the Fill Effects property.
3. In the Effect box, choose a color, a gradient fill effect, or a pattern:
• To apply a color, click Color and specify the color properties.• To apply a gradient fill effect, click Gradient and then specify the Direction, From color, and To
color properties.• To apply a pattern effect, click Pattern and specify the Pattern, Foreground Color, and
Background Color properties.
The foreground color is the color of the selected pattern. The background color is the color of thearea behind the pattern.
4. To remove a background fill effect, click None.
Related conceptsCurrent Default Charts and Legacy ChartsRelated tasksInsert a Background Image in an Object
Add background effects to a chart object in a legacy chartYou can change the look of certain charts and chart objects by applying visual effects such as dropshadows, borders, and fills.
Procedure
1. Select the chart object.2. To apply a preset background fill effect, from the report object toolbar, click the Background effects
presets icon .3. To add a custom fill effect and border do the following:
a) In the Properties pane, under Color & Background, double-click the Background effects property.b) Click Border and specify settings for border style, width, color, corner radius for rounded
rectangles, and transparency.
If the object also includes a fill with a transparency setting, select the Allow transparent bleedcheck box to apply the same transparency to the border.
c) Click Fill and specify the settings.
The fill effect can either be a solid color, a gradient, or a pattern.4. To add a drop shadow, do the following:
a) In the Properties pane, under Color & Background, double-click the Background effects property.b) Select the Drop shadow check box.c) From the Shadow color list, click a color.d) Under Blur, click an intensity to set the drop shadow's blur.e) Under Offset, enter a value and a unit to define the width and height of the drop shadow.
80 IBM Cognos Analytics - Reporting Version 11.0 : User Guide
f) Under Transparency, type a percentage to determine the transparency of the shadow.
Related conceptsCurrent Default Charts and Legacy ChartsCustomizing the Color Palette of a ChartRelated tasksAdd color to an object
Add Colored Regions in a Current Default ChartYou can define colored regions in the body of a chart. For example, you can divide the background of ascatter chart into quadrants and color each quadrant.
You can add colored regions to bubble, bullet, combination, Pareto, progressive column, and scattercharts.
In bullet charts, colored regions are automatically added.
You can use the following criteria to position the colored regions.
Option Position
Percent on Axis (%) Uses a percentage of the full range of the axis.
For example, if the axis range is -500 to 1100, aPercent on Axis value of 25% puts the baseline at-100 (25% of the range, 1600).
Numeric Value Uses a static numeric value.
Mean Uses the statistical mean plus or minus a numberof standard deviations based on all charted datavalues on the specified axis.
Percentile (%) Uses a specified percentile.
Statistical Maximum Uses the following expression:
25th percentile value - 1.5 * (75th percentile value -25th percentile value)
For example, if 2.5 is the 25th percentile and 7.5 isthe 75th percentile, the statistical minimum is -5[2.5 -1.5(5) = -5].
Statistical Minimum Uses the following expression:
75th percentile value + 1.5 * (75th percentile value- 25th percentile value)
For example, if 2.5 is the 25th percentile and 7.5 isthe 75th percentile, the statistical maximum is 15[7.5 +1.5(5) = 15].
Query Calculation Uses a query calculation from the same query orfrom a different query. For more information, see“Using relational calculations” on page 182.
Layout Calculation Uses a layout calculation. For more information,see “Using relational calculations” on page 182.
Chapter 5. Charts 81

Option Position
Category Index Specifies a position based on the index value of thedata item in the categories axis. The value must bebetween 0 and 100.
For example, a Category index value of 1 indicatesthat the position is located at the first data item.This is the default.
You can also combine colored regions with gridlines.
Procedure
1. Click the chart object.2. In the Properties pane, under Color & Background, double-click the Colored Regions property.
3. Click the New icon .4. Under Region label, type a name for the region.5. Under Label location, specify whether the label should appear in the legend or in the chart.6. If your chart includes multiple charts, such as in a combination chart, under Based on, select the
chart to which the colored regions apply.7. Under Region fill, click the color box to specify the color and fill effects.8. Specify the start and end of the category and numeric positions.9. If you want to add more colored regions, repeat steps 3 to 5.
10. If you add more than one colored region, specify their order using the up and down arrows.
The regions are drawn in the same order that they appear in this list. The first region is drawn first, onthe bottom, and the last region is drawn on top of the other regions.
Tip: To delete a colored region, click the colored region icon and text and click the delete button .
ResultsThe new region appears in the Colored regions box.Related conceptsCurrent Default Charts and Legacy Charts
Specify Custom Label TextBy default, chart labels use the name of the underlying data item label. You can change the label text tomake it more meaningful. For example, you can rename a chart item labeled ISO_3_Letter_Code toCountry or Region.
If you specify custom labels for a microchart or win-loss charts, the custom labels appear in the tooltips,not on the chart itself.
Procedure
1. Click the chart node member or measure.2. In the Properties pane, under the Chart Labels, set the Custom Label property to Show.
A new chart text item appears above the default measure or below the chart node member.3. Do one of the following:
• To change the text of the label, double-click the chart text item and type the text.
82 IBM Cognos Analytics - Reporting Version 11.0 : User Guide
• To change the source of the label text, select the new chart text item. In the Text Source section ofthe Properties pane, set the Source Type property.
If nothing is specified in the new chart text item, the label appears blank.
Tip: To remove a custom label, set the Custom Label property to Hide.
Customizing the Axes of a ChartChart axes are lines that border the chart area and provide a reference for measurements. They act as avehicle for tick marks and scales and form a frame around the chart. The Y-axis is usually the vertical axisand contains data. The X-axis is usually the horizontal axis and contains categories.
To make your chart data easier to understand, you can do the following to customize each axis:
• show or hide the axis labels (data values)• show or hide the axis line• change the color, style, and weight of the axis line• show or hide major and minor tick marks and specify where to display them
In HTML/PDF, if you have a report with a line chart, you can use the Include Zero For Auto Scale propertyto adjust the scale of the Y-axis of the chart. If the difference between your measure's maximum/minimum values is much less than the difference between your measure's minimum value and zero, usingthis property will make the chart Y-axis begin at something closer to your measure's minimum value,making the line utilize all of the chart's vertical space. In some cases this is significant in improving thereadability of the chart.
Related conceptsAxes
Customize the Axes of a Current Default ChartYou can customize the axis labels, axis lines, and minor and major tick marks.
You can change the scale for the major and minor tick mark using the Axis Range property.
Procedure
1. Select the Y-axis or the X-axis of the chart.2. To show or hide the axis labels, in the Properties pane, set the Axis Label property.3. If your chart includes nested categories, to change how the category axis labels are displayed, set the
Nested Label Display property.4. To show or hide axis lines, in the Properties pane, double-click the Axis Line property, and select or
clear the Axis line check box.5. To change the color, style, and weight of the axis line, in the Properties pane, set the Axis Line
property.6. To show or hide minor and major tick marks and specify their location, in the Properties pane, set the
Axis Line property.
Related conceptsCurrent Default Charts and Legacy ChartsRelated tasksChange the axis scale of a current default chart
Customize the Axes of a Legacy ChartYou can customize the axis labels and axis line.
Procedure
1. Select the Y-axis or the X-axis of the chart.
Chapter 5. Charts 83

2. To show or hide the axis labels, in the Properties pane, set the Axis Label property.3. Select the Axis line check box.4. Click Line color and choose a color for this axis line.5. To show or hide axis lines, in the Properties pane, double-click the Axis Line property, and select or
clear the Axis line check box.6. To change the color, style, and weight of the axis line, in the Properties pane, double-click the Axis
Line property.
Change the axis scale of a current default chartBy default, IBM Cognos Analytics - Reporting automatically determines the minimum and maximum scalevalues for the numeric axes in a chart. For example, a Y-axis showing revenue values might have an axisrange of zero dollars to one million dollars. You can customize the axis scale, or range, to make your charteasier to understand.
You can specify the following for each numeric axis:
• the maximum and minimum values of the range• whether to include zero in an automatic axis range• whether to use a logarithmic scale, if the values in the chart cover a very large range• how often major and minor gridlines appear
Logarithmic scales can be useful when some of the data you are displaying is much less or much morethan the rest of the data or when the percentage or ratio differences between values are important.
A logarithmic scale in Reporting shows the base value of 10 raised to the power of a value. For example,10 has a logarithm of 1 because 10 raised to the power of 1 is 10, 100 has a logarithm of 2 because 10raised to the power of 2 is 100, and so on.
For example, the following chart is using a normal scale:
Figure 16. Chart with a normal axis range
In this chart, the Y-axis shows values up to 2,000,000,000 with evenly spaced intervals of 400,000,000.However, the Outdoor Protection column is so much less than the other columns that it is difficult tocompare them.
The following is the same chart using a logarithmic scale:
84 IBM Cognos Analytics - Reporting Version 11.0 : User Guide

Figure 17. Chart with a logarithmic axis range
In this chart, the Y-axis still shows the same revenue values, but the intervals reflect a logarithmic scale,which increases exponentially. You can now compare all the product lines because none of the productlines have much higher or much lower values than the others.
Logarithmic scales can also be useful when the percentage or ratio differences between values areimportant. For example, if the logarithmic scale chart above represents data from 2011, and you add datafrom 2012 as a second set of colored bars, you could see the differences between the 2011 revenue and2012 revenue. In a logarithmic scale, differences between values on the Y-axis represent the samepercentage for each bar. So if the 2011 and 2012 data differs by the same distance for each product line,you could deduce that your revenue went up by the same percentage for each product line. This wouldnot be clear on a normal scale.
Procedure
1. Select the Y-axis or the X-axis of the chart.2. In the Properties pane, under General, double-click the Axis Range property.3. To set a maximum value for this axis, under Maximum, click Manual, and then type a maximum value
in the Manual box.
Note: You can use either a positive or negative value as the maximum value.4. To set a minimum value for this axis, under Minimum, click Manual, and then type a minimum value in
the Manual box.
Note: You can use either a positive or negative value as the minimum value.5. To include zero on this axis, select the Include zero check box.6. To use a logarithmic scale for this axis, select the Logarithmic scale check box.
Note: If you choose to use a logarithmic scale, ensure that your chart consumers know that the scaleis logarithmic by including that information in the axis title or in a note on the chart.
7. To set the position of major gridlines and tick marks, under Major interval, click Manual, and then typethe distance between major gridlines and tick marks in the Manual box.
The distance between major gridlines and tick marks is measured in the units of that axis. Forexample, if the axis is revenue in dollars, type the dollar value in the Manual box.
8. To add minor gridlines, type the number of minor gridlines that you want to see between each majorgridline in the Number of minor intervals box.
Related conceptsCurrent Default Charts and Legacy Charts
Chapter 5. Charts 85

Showing Gridlines in a ChartTo make the data in a chart that includes axes easier to read, you can show horizontal and verticalgridlines. You can show gridlines for the major or minor intervals on the axes.
You cannot show gridlines for chart types that do not display axes, such as pie and donut charts.
Show Gridlines in a Current Default ChartYou can also show alternating bands of color in the chart background that correspond to your axisgridlines.
You can change the scale for the major and minor gridlines using the Axis Range property.
Procedure
1. Select the Y-axis or the X-axis of the chart.2. To show alternating bands of color as your chart background, do the following:
a) In the Properties pane, double-click the Gridlines property.b) Select the Show alternating color bands check box.c) Set the color and transparency of the first and second colors.
3. To show major gridlines as your chart background, do the following:a) In the Properties pane, double-click the Gridlines property.b) Select the Show major gridlines check box.c) Set the color, style, and weight of the major gridlines.d) If you are working with a gauge chart, specify the length of the gridline.
4. To show minor gridlines as your chart background, do the following:a) In the Properties pane, double-click the Minor gridlines property.b) Select the Show minor gridlines check box.c) Set the color, style, and weight of the minor gridlines.d) If you are working with a gauge chart, specify the length of the gridline.e) To specify by how many minor intervals to divide the major intervals, in the Properties pane, type a
number in the Number of Minor Intervals property.
Related conceptsCurrent Default Charts and Legacy ChartsRelated tasksChange the axis scale of a current default chart
Show Gridlines in a Legacy ChartGridlines are the lines on a chart that show the intervals along the axes.
Procedure
1. Select the Y-axis or the X-axis of the chart.2. In the Properties pane, under General, double-click the Gridlines property.3. To specify the color, style, and weight of major gridlines do the following:
a) Select the Show major gridlines check box.b) Click Line color and choose a color for the major gridlines.c) To specify the thickness of the gridlines, click Point size and select a line weight from the list.d) Click a line style in the Line style list.
4. To specify the color, style, and weight of minor gridlines:a) In the Properties pane, under General, double-click the Minor Gridlines property.
86 IBM Cognos Analytics - Reporting Version 11.0 : User Guide

b) Select the Show minor gridlines check box.c) Click Line color and choose a color for the minor gridlines.d) To specify the thickness of the gridlines, click Point size and select a line weight from the list.e) Click a line style in the Line style list.f) To change the transparency of the gridlines, type a percentage in the Transparency box.
Related conceptsCurrent Default Charts and Legacy Charts
Customize the Legend in a Current Default ChartYou can hide or show the legend and change its position relative to the chart area, chart body, or a dataitem. For example, in a bar chart showing revenue for each product line by country or region, you coulduse the expression [Country or Region] = 'Canada' to position the legend relative to the Canada bar.
Note: When you choose a preset legend position, that position appears inside any padding that you haveadded to the chart object. Customized legend positions do not include any chart padding.
Procedure
1. Select the chart object.2. In the Properties pane, under Chart Annotations, double-click the Legend property.3. To show the legend on the chart, select the Show Legend check box.4. To choose a preset legend position, click Preset and click a position from the diagram.5. To choose a customized legend position, do the following:
a) Click Advanced and click the ellipsis button.b) To display the legend at a set distance from the sides of the chart area, from the Anchor list, click
Relative to Chart.c) To display the legend at a set distance from the sides of the chart body, from the Anchor list, click
Relative to Chart Body.d) To display the legend at a set distance from a data item, such as a specific pie slice in a pie chart,
from the Anchor list, click Report Expression, click the ellipsis button beside Expression, andenter an expression in the Report Expression dialog box.
e) Set the horizontal and vertical distances from the anchor.
Related conceptsCurrent Default Charts and Legacy Charts
Customize the Items in the Legend of a Current Default ChartIf your legend includes items that are too long, you can truncate long legend items at a specific number ofcharacters.
For example, if you want an ellipsis to appear at the end of each truncated legend item, type ... in theTruncation text box.
You can also show the values of the data items in your legend.
Procedure
1. Select the legend.2. To truncate the legend
a) In the Properties pane, under General, double-click the Text Truncation property.b) To specify the number of characters at which the legend items are truncated, click Manual and type
the number of characters in the Maximum characters box.
Chapter 5. Charts 87
c) To shrink the font of the legend item text until all the text fits in the legend, select the Shrink fontas needed check box.
d) To specify some text to appear at the end of truncated legend items, in the Truncation text box,type the text that you want to appear at the end of truncated items.
3. To show the values of legend items within the legenda) In the Properties pane, under General, set the Show Values property.
First Value and Last Value refer to the first and last item in the child set under the legend dataitem. Minimum Value and Maximum Value refer to the lowest and highest value in the child setunder the legend data item.
b) If you want to change the separator between the legend item and value, type a new separator inthe Legend Separator property.
4. To customize the title of the legenda) Click the default legend title area in the work area.b) In the Properties pane, under General, set the Default Title property to No.c) Double-click the default legend title area in the work area and type the new title.
Related conceptsCurrent Default Charts and Legacy Charts
Customize the Items in the Legend of a Legacy ChartIf your legend includes items that are too long, you can truncate long legend items at a specific number ofcharacters. For example, if you want an ellipsis to appear at the end of each truncated legend item,type ... in the Truncation text box.
You can also show the values of the data items in your legend and customize the legend title.
Procedure
1. Select the legend.2. To truncate the legend text, do the following:
a) In the Properties pane, under General, set the Auto Truncation property to Yes.b) In the Properties pane, under General, set the Auto Truncation property to Yes.c) In the Maximum Characters property, type the number of characters to appear before the text is
truncated.d) In the Truncation Text property, type the characters to append when the text is truncated.e) To shrink the font of the legend item text until all the text fits in the legend, select the Shrink font
as needed check box.f) To specify text to appear at the end of truncated legend items, type it in the Truncation text box.
3. To show the values of legend items within the legend, do the following:a) In the Properties pane, under General, set the Show Legend Values property.
First Value and Last Value refer to the first and last item in the child set under the legend dataitem. Minimum Value and Maximum Value refer to the lowest and highest value in the child setunder the legend data item.
b) If you show multiple values and want to change the separator between the values, type a newseparator in the Separator property.
4. To customize the title of the legend, do the following:a) Click the default legend title area in the work area.b) In the Properties pane, under General, set the Default Title property to No.c) Double-click the default legend title area in the work area and type the new title.
88 IBM Cognos Analytics - Reporting Version 11.0 : User Guide

Related conceptsCurrent Default Charts and Legacy Charts
Adding a note to a chartAdd a note to a chart to provide additional detail. Notes appear as text in a chart.
By default, notes are aligned in the first part of the chart object. When you add a note to a chart, you canset the note's position relative to the sides of the chart area or chart body. You can also use a reportexpression to position the note next to a data item within the chart. For example, in a bar chart showingrevenue for each product line by country or region, you could type [Country or Region]='Canada' toposition the note relative to the Canada bar.
Notes overwrite whatever is under them so you must position them properly.
If you apply more than one note, ensure that each note has a different position in the report so that theydo not overwrite each other. You can also specify the order that they should be drawn in when the reportruns. If you have two notes with the same coordinates, the first one in the list is drawn first and the nextone is drawn before the first.
Tip: The Top 10 Retailers for 2011 sample report in the GO Data Warehouse (analysis) package includes anote.
Add a Note to a Current Default ChartYou can add and position multiple notes on your chart.
Procedure
1. Select the chart object.2. In the Properties pane, under Chart Annotations, double-click the Notes property.
3. Click the New icon .4. Type the note text in the Text box and click OK.
Tips: To delete a note, click the note and click the delete button . To move a note up or down in thelist, click the up or down arrows.
5. In the Notes dialog box, click OK.6. To position the note, do the following:
a) Click the note icon in the list of notes.b) In the Properties pane, under Positioning, double-click the Position property.c) To align the note horizontally, click the left, center, or right alignment button.d) To align the note vertically, click the top, middle, or bottom alignment button.e) To set the margins around the chart body, type margin values and choose margin units.f) To display the note at a set distance from the sides of the chart area, from the Anchor list, click
Relative to Chart.g) To display the note at a set distance from the sides of the chart body, from the Anchor list, click
Relative to Chart Body.h) To display the note at a set distance from a data item, from the Anchor list, click Report
Expression, click the ellipsis button beside Expression, and enter an expression in the ReportExpression dialog box.
7. To edit the text, double-click the text next to the note object in the chart.
Related conceptsCurrent Default Charts and Legacy Charts
Chapter 5. Charts 89
Add a Note to a Legacy ChartYou can add and position multiple notes on your chart.
Procedure
1. Click the chart object.2. In the Properties pane, under Chart Annotations, double-click the Notes property.
3. Click the New icon .4. Type the note text in the Text box and click OK.
Tip: To delete a note, click the note and click the delete button . To move a note up or down in thelist, click the up or down arrows.
5. In the Notes dialog box, click OK.
6. Click the note icon and set the note position, size, and border in the Properties pane.
You set the location of the note by defining number of pixels from the bottom left corner of the chartarea.
Related conceptsCurrent Default Charts and Legacy Charts
Adding a baseline to a chartBaselines are horizontal or vertical lines that cut through the chart to indicate major divisions in the data.For example, you can add a baseline to show a sales quota or break-even point.
Each baseline represents a value on an axis.
Depending on the type of chart, you can use the following options to position the baseline.
Option Description
Numeric Value Uses a static numeric value.
Query Calculation Uses a query calculation from the chart query orfrom a different query. For more information, see“Using relational calculations” on page 182.
Layout Calculation Uses a layout calculation. For more information,see “Using relational calculations” on page 182.
Category Index Uses the index value of the data item in thecategories axis.
For example, a Category index value of 1 indicatesthat the baseline is located at the first data item.This is the default.
Note: This option applies only to the currentdefault charts, and does not apply to the legacycharts.
90 IBM Cognos Analytics - Reporting Version 11.0 : User Guide
Option Description
Member Value When working with dimensional data sources, usesa position relative to a member. For example, amember calculation that uses an expressionsimilar to [Query1].[Current year]=2011 places thebaseline in the middle of the chart object thatrepresents 2011. To place the baseline between2011 and 2012 on the chart, a half member widthafter, set the Member Offset property to 50%. Toplace the baseline between 2010 and 2011, setthe Member Offset property to -50%. You can alsotype in 100, -200, and so on to place the baselineon the chart.
Statistical Limit Statistical maximum uses the followingexpression:
25th percentile value - 1.5 * (75th percentile value -25th percentile value)
For example, if 2.5 is the 25th percentile and 7.5 isthe 75th percentile, the statistical minimum is -5[2.5 -1.5(5) = -5].
Statistical minimum uses the followingexpression:
75th percentile value + 1.5 * (75th percentile value- 25th percentile value)
For example, if 2.5 is the 25th percentile and 7.5 isthe 75th percentile, the statistical maximum is 15[7.5 +1.5(5) = 15].
Statistical minimum and Statistical maximumuse percentiles to determine values, so thebaseline might not appear on the chart if its valueis off the axis.
Mean Uses the statistical mean plus or minus a numberof standard deviations based on all charted datavalues on the specified axis.
Percentile (%) Uses a specified percentile.
Percent on Axis (%) Uses a percentage of the full range of the axis.
For example, if the axis range is -500 to 1100, aPercent on Axis value of 25% puts the baseline at-100 (25% of the range, 1600).
If you apply more than one baseline, you can specify the order in which they should be drawn when thereport runs. If you have two baselines with the same coordinates, the first one in the list is drawn first andthe next one is drawn before the first one.
By default, the baseline and its label appear in the legend.
Baselines do not support color transparency.
Tip: The Positions to Fill sample report in the GO Data Warehouse (analysis) package includes a baseline.
Chapter 5. Charts 91
Add a Baseline to a Current Default ChartWhen working with current default charts, you can define baselines by values on the numeric axis or thecategory axis.
Procedure
1. Click the chart object.2. Depending on your chart and the type of baseline you want to add, in the Properties pane, under
Chart Annotations, double-click the Numeric Baselines or Category Baselines property.
3. Click the New icon and choose the type of baseline from the list.4. Specify the necessary criteria for the baseline position5. Under Baseline Properties, type a label for the baseline and specify the line style.
Tip: To remove the baseline from the legend, delete the label.6. If you add more than one baseline, specify their order using the up and down arrows.
The new baselines appear in the Markers, notes, baselines, and trendlines box.7. To change the label that appears next to the baseline, under the Markers, notes, baselines, and
trendlines box, double-click the placeholder text next to the baseline icon and type your text.8. To change the line style, select the chart and in the Properties pane, under Chart Annotations,
double-click the Baselines, Numeric Baselines, or Category Baselines property.
9. To delete a baseline, select the baseline icon and click the delete button .
Related conceptsCurrent Default Charts and Legacy Charts
Add a Baseline to a Legacy ChartWhen working with legacy charts, you can define baselines by the values on the numeric axis.
Procedure
1. Click the chart object.2. In the Properties pane, under Chart Annotations, double-click the Baselines property.
3. Click the New icon and choose the type of baseline from the list.4. Specify the necessary criteria for the baseline position.
If you use a calculation to determine the baseline, define an expression.5. If you add more than one baseline, specify their order using the up and down arrows.6. Click OK.
A baseline icon appears in the Markers, notes, and baselines box.
7. To define the line style, click the baseline icon and set the Line Styles property.8. To define the text style, click the baseline text and make changes in the Properties pane.
9. To delete a baseline, click its baseline icon and click the delete button .
Related conceptsCurrent Default Charts and Legacy Charts
Adding markers to chartsMarkers are symbols that you add to a chart to designate points of significance that can help you analyzeor understand the data.
92 IBM Cognos Analytics - Reporting Version 11.0 : User Guide

For example, you might want to add a marker to designate the time when a significant event happened,such as the date when a new product was launched.
You can add a marker to combination, progressive column, Pareto, scatter, and bubble charts.
When you define the position of the marker, you define the X- and Y-axes coordinates for the placementof the symbol. You can position the marker in the chart using the following options.
Option Position
Numeric Value Uses a static numeric value.
Query Calculation Uses a query calculation from the same query orfrom a different query. For more information, see“Using relational calculations” on page 182.
Layout Calculation Uses a layout calculation. For more information,see “Using relational calculations” on page 182.
Statistical Minimum Uses the following expression:
25th percentile value - 1.5 * (75th percentile value -25th percentile value)
For example, if 2.5 is the 25th percentile and 7.5 isthe 75th percentile, the statistical minimum is -5[2.5 -1.5(5) = -5].
Statistical minimum uses percentiles to determinevalues, and might not always appear in the chart ifthe values are off the axis.
Statistical Maximum Uses the following expression:
75th percentile value + 1.5 * (75th percentile value- 25th percentile value)
For example, if 2.5 is the 25th percentile and 7.5 isthe 75th percentile, the statistical maximum is 15[7.5 +1.5(5) = 15]. Statistical maximum usespercentiles to determine values, so the markermight not always appear on the chart if its value isoff the axis.
Mean Uses the statistical mean plus or minus a numberof standard deviations based on all charted datavalues on the specified axis.
Percentile Uses a specified percentile.
Percent on Axis Uses a percentage of the maximum axis value.
If you apply more than one marker, you can specify the order in which they should be drawn when thereport runs. If you have two markers with the same coordinates, the first one in the list is drawn first andthe next one is drawn after the first.
Chapter 5. Charts 93

Add a Marker to a Current Default ChartMarkers are symbols that you add to a chart to designate points of significance that can help you analyzeor understand the data.
Note: Current default scatter charts have a different set of steps.
Procedure
1. Select the chart object.2. In the Properties pane, under Chart Annotations, double-click the Markers property.
3. Click the New icon , and then set the marker properties4. In the Based on box, select the chart object that will determine the marker position.5. In the Numeric position box, specify how you want to define the position on the numeric (Y) axis.6. In the Category position box, specify how you want to define the position on the category (X) axis.7. In the Marker label box, type the label that you want to give to the marker.8. In the Marker size box, specify the size of the marker symbol.9. To specify the color, fill, and shape of the marker symbol, click the Color and style box.
10. If you add more than one marker, specify their order by using the up and down arrows.
The new markers appear in the Markers, notes, and baselines box.
Tip: To delete a marker, click the marker icon and text and click the delete button .11. Run the report.
Related conceptsCurrent Default Charts and Legacy Charts
Add a Marker to a Current Default Scatter ChartMarkers are symbols that you add to a chart to designate points of significance that can help you analyzeor understand the data.
Procedure
1. Select the scatter chart object.2. In the Properties pane, under Chart Annotations, double-click the Markers property.
3. Click the New icon , and then set the marker properties.4. In the X-axis position box, specify how you want to define the position on the X-axis.5. In the Y-axis position box, specify how you want to define the position on the Y-axis.6. In the Marker label box, type the label that you want to give to the marker.7. In the Marker size box, specify the size of the marker symbol8. To specify the color, fill, and shape of the marker symbol, click the Marker color and style box.9. If you add more than one marker, specify their order using the up and down arrows.
The new markers appear in the Markers, notes, and baselines box.
Tip: To delete a marker, click the marker icon and text and click the delete button .
Related conceptsCurrent Default Charts and Legacy Charts
Add a Marker to a Legacy ChartMarkers are symbols that you add to a chart to designate points of significance that can help you analyzeor understand the data.
94 IBM Cognos Analytics - Reporting Version 11.0 : User Guide
Procedure
1. Select the chart object.2. In the Properties pane, under Chart Annotations, double-click the Markers property.
3. Click the New icon , and then set the Numeric position type, Marker label, Marker shape,Numeric value, and Color properties.
4. If you add more than one marker, specify their order by using the up and down arrows.
The new markers appear in the Markers, notes, and baselines box.
Tip: To delete a marker, click the marker icon or marker label and click the delete button .
Related conceptsCurrent Default Charts and Legacy Charts
Display Trendlines in Current Default ChartsYou can display or hide trendlines in the current default bar, line, area, bubble, or scatter charts.
Trendlines, also known as lines of best fit or regression lines, graphically illustrate trends in data seriesand are commonly used when charting predictions. A trendline is typically a line or curve that connects orpasses through two or more points in the series, showing a trend.
You can specify the following types of trendlines:
• Linear
Use a linear trendline when your data increases or decreases along a straight line at a constant rate. Forexample, if your chart displays a steady increase in revenue by product line over time, you could use alinear trendline.
• Exponential
Use an exponential trendline when your data values increase or decrease exponentially, or at anincreasingly higher or lower rate. For example, if your chart displays an exponential increase in revenueby product line over time, you could use an exponential trendline.
• Polynomial
Use a polynomial trendline when your data values both increase and decrease. For example, if yourchart displays both increases and decreases in revenue by product line over time, you could use apolynomial trendline.
• Logarithm or Natural Logarithm
Use a logarithmic trendline when your data values increase or decrease rapidly and then level out. Forexample, if your chart displays a rapid decrease in revenue by product line over time and then a plateau,you could use a logarithmic trendline.
• Power
Use a power trendline when your data values increase or decrease in a curve at a steady rate. Forexample, if your chart displays a steady increase in revenue by product line over time and your datapoints will fit a curved line, you could use a power trendline.
• Moving Average
Use a moving average trendline when your data values fluctuate and you want to smooth out theexceptions to see trends. For example, if your chart displays wild fluctuations in revenue by product lineover time, but you know that some data points are exceptions, you could use a moving averagetrendline.
If you are not sure which trendline type to use, try each type to see which one best fits most of your datapoints. For example, a linear trendline will not fit most points on a scatter chart with widely spread datapoints.
Chapter 5. Charts 95

Trendlines do not support color transparency.
Procedure
1. Select the chart object.2. In the Properties pane, under Chart Annotations, double-click the Trendlines property.
3. Click the New icon and click a trendline type.4. Define the trendline by specifying the following options. The options that are available depend on the
type of trendline you chose.
• To set the order, or degree, of a polynomial trendline, in the Order box, type a value between 2 and6.
• To set the number of periods to go back in a moving average trendline, in the Periods box, type avalue.
• If you have more than one series on your chart, in the Based on list, click the data you want to usefor the trendline.
• Click either One trendline for all series items or A trendline for each series item.• To customize the style of the trendlines, click Line Styles and customize the line color, weight, and
style.• To customize the trendline labels in the legend, click Label and choose None, Automatic, or
Custom.• To display the trendline equation, click Show equation, and then click Show in legend or Show on
chart, and then click Position to define the equation's position on the chart.• To display the R-squared value of the trendline, click Show R-squared value, and then click Show
in legend or click Show on chart and then click Position to define the position of the value on thechart.
Related conceptsCurrent Default Charts and Legacy Charts
Display Regression Lines in Legacy Scatter or Bubble ChartsWhen using legacy charts, you can display or hide regression lines on scatter charts and bubble charts.Regression lines, also known as lines of best fit or trend lines, graphically illustrate trends in data series.Regression lines are commonly used when charting predictions. A regression line is typically a line orcurve that connects or passes through two or more points in the series, showing a trend. Legacy scatterand bubble regression lines are calculated using a numerical algorithm that isn't guaranteed to beoptimal. Regressions may or may not match current default chart regressions.
You can specify the following types of regression lines to determine the position and slope of the line:
• Linear
Use a linear regression line when your data increases or decreases at a consistent rate. For example, ifyour chart displays a steady increase in revenue by product line over time, you could use a linearregression line.
• Common Log or Natural Log
Use a logarithmic regression line when your data increases or decreases rapidly and then levels out. Forexample, if your chart displays a rapid decrease in revenue by product line over time and then a plateau,you could use a logarithmic regression line.
• Exponential
Use an exponential regression line when your data increases or decreases exponentially, or at steadilyincreasing or decreasing rate. For example, if your chart displays an exponential increase in revenue byproduct line over time, you could use an exponential regression line.
96 IBM Cognos Analytics - Reporting Version 11.0 : User Guide

• Polynomial Fit
Use a polynomial fit regression line when your data both increases and decreases. For example, if yourchart displays both increases and decreases in revenue by product line over time, you could use apolynomial fit regression line.
If you are not sure which regression line type to use, try each type to see which one best fits most of yourdata points. For example, a linear regression line is not going to fit most points on a scatter chart withwidely spread data points.
Procedure
1. Select the scatter or bubble chart.2. In the Properties pane, under Chart Annotations, set the Regression Line property to Show.
3. Click the regression line icon in the report layout.4. In the Properties pane, under General, set the Line Styles, Regression Type, and Number of
Regression Lines properties.
Related conceptsCurrent Default Charts and Legacy Charts
Showing data labels or values in current default chartsYou can show the data labels or data values within the chart so that the data values are clearer.
For example, you can display the data values above each column in a column chart to show the exactheight of each column.
Procedure
1. For a bar, column, line, or area chart, under Series, select the chart type icon.2. For a bubble, scatter, Pareto, or progressive chart, click the chart.3. In the Properties pane, under Chart Labels, double-click the Show Values property.4. For bar, column, line, area, Pareto, or progressive charts, to specify the data label format, in the Values
list, select what values to display.
• None does not display data values.• Values displays the non-cumulative value of the data.• Cumulative values displays the cumulative value of the data.
5. For bubble or scatter charts, to specify the data label format, in the Show box, select whether to showvalues or values and labels for the category, series, and measure.
6. For bar, column, line, area, Pareto, or progressive charts, to show lines that point from data labels todata marker they apply to, select the Show leader lines check box.
7. For bubble or scatter charts, to show lines that point from data labels to data marker they apply to,select the Leader lines check box.
8. To specify where values and labels are to be rendered in the chart, click the Value Location list andchoose the location that you want.
9. To specify how to display the labels if their positions on the chart overlap, in the Collision Mode list,click one of the following modes:
• None specifies that labels appear in default positions and might overlap.• Normal (for pie and donut charts) specifies that labels are placed just above their corresponding
data markers or chart objects. There is no collision detection, so labels can overlap.• Coarse Stagger specifies that labels are placed close to their data markers and staggered so that
they do not overlap. This collision mode takes less time to render than Fine Stagger but mightresult in labels that are farther away from their corresponding data markers.
Chapter 5. Charts 97

• Fine Stagger specifies that labels are staggered so that they do not overlap. The labels are as closeto the data markers as possible without overlapping. This collision mode takes more time to renderthan Coarse Stagger but might result in labels that are closer to their corresponding data markers.
Showing data values in current default pie and donut chartsYou can show the data labels or data values within the chart so that the data values are more clear.
For example, in a pie chart, show the data values within each pie slice, so that you know the exact size ofeach pie slice.
Procedure
1. Select the chart object.2. In the Properties pane, double-click the Show values property.3. To display data labels for each slice of the pie, under Show, select the Slice names check box.4. To show lines pointing from data labels to the slices they apply to, select the Show leader lines check
box.5. To specify the data label format, in the Values list, select what values to display.
• Hide does not display data values.• Absolute displays the absolute value of the data.• Percentage displays the slice's percentage of the whole pie.• Absolute and Percentage displays the slice's percentage of the whole pie as an absolute value.
6. In the Position list, select the placement of data labels.
Define Query Context When Customizing Legend Entries, Legend Titles, or Axis LabelsYou want to use a revenue expression as a chart legend title. If you get an error message saying that thequery context of a layout object cannot be determined, you must define the property list for the item towhich it refers. You must first add the desired data item to the query before you can define its propertylist.
Procedure
1. Open the chart to customize.
2. Click the Queries icon and click the query.
3. Click the Data icon , and from the Source tab, drag the desired item to the Data Items window toadd it to the query.
4. Click the Pages icon , and click the chart page.
5. Click the Data icon , and from the Data items tab, drag the desired item to the layout object.6. In the Properties pane, under Data, double-click the Properties property.7. Select the check box for the data item to define.
Related tasksSpecify a List of Data Items for an Object
Summarize Small Slices, Bars, or Columns in Current Default ChartsYou can summarize the smaller slices or bars in charts to avoid having many tiny slices or bars. Forexample, if your pie chart shows revenue by product and 10 of your products have less than 1% of thepie, you can summarize these 10 slices into one larger slice and name that slice Other.
Similarly, you can summarize small items in a column, bar, area, and line chart.
98 IBM Cognos Analytics - Reporting Version 11.0 : User Guide
You cannot summarize small slices or items in charts that have matrix edges or in charts that havemultiple numeric axes.
Procedure
1. Select the chart object.2. In the Properties pane, under General, double-click the Summarize Small Slices or Summarize
Small Items property.3. To summarize small slices or items up to a maximum number, select the Maximum number of slices
or Maximum number of items check box and type the maximum number.4. To summarize all the slices or bars that are smaller than a specific value, select the Summarize slices
smaller than a value or Summarize items smaller than a value check box, type a value thatrepresents the upper size limit, and choose whether the value is a percentage or absolute.
5. Under Small slice summarization type or Small item summarization type, choose whether tosummarize the slices or items as a Total or Average.
Note: Averages are calculated using only the summarized items in the report.6. Under Slice label or Item label, type a label for the one large slice, bar, area, or line that summarizes
the smaller ones.
Related conceptsCurrent Default Charts and Legacy Charts
Customizing lines and data points in a line chartYou can customize the lines in a line chart to show only lines, only data points, or both. Data pointsrepresent series values for each category on the Y-axis. You can show special data markers thatrepresent statistically significant values, such as open, high, low, and close values.
You can also add markers at other positions on the chart. For more information, see “Add a Marker to aCurrent Default Chart” on page 94.
You can also change the path of the line that connects the data points to one of the following:
• Point to Point shows data points connected by straight lines.• Step at Point shows data points connected by steps that start and end at the data points.• Step Between Points shows data points connected by steps that start and end between the data
points.• Smooth shows data points connected by smooth curves.
Related tasksAdd a Marker to a Current Default Chart
Customize Lines and Data Points in a Current Default Line ChartYou can change the color and shape or the line or data markers in a line chart. You can also show or hidedata labels, the line, and data markers.
You cannot show value markers when the Data points option is selected or when the configuration of theline chart is stacked or 100 percent stacked.
Procedure
1. Select the chart object.2. In the chart area, under Series, click the line chart icon to view the line properties.3. To select whether to show only the line, the line and data markers, or only the data markers, in the
Properties pane, select an option from the Line and Markers list.4. To show special data markers, double-click the Value Markers property. Select the check box for the
special data markers that you want to add and for each marker, specify the color and shape.
Chapter 5. Charts 99

The options you specify in Value Markers overwrite the options for Line and Markers.5. To change the shape of the line that connects data markers, select an option from the Line Shape list.6. To show data labels for the data points, double-click the Data Labels property.7. To change the color of the lines, double-click the Palette property.
Related conceptsCurrent Default Charts and Legacy ChartsCustomizing the Color Palette of a Chart
Customize Lines and Data Points in a Legacy Line ChartYou can change the color and shape or the line or data markers in a line chart. You can also show or hidedata labels, the line, and data markers.
You cannot show value markers under the following conditions:
• The Data points option is selected.• The configuration of the line chart is stacked or 100 percent stacked.• The Show line property is set to No, creating a point chart.
Procedure
1. Select the chart object.2. In the chart area, under Series, click the line chart icon to view the line properties.3. To select whether to show only the line, the line and data markers, or only the data markers, in the
Properties pane, under General, select an option from the Line Type list.4. To show or hide the line, select an option from the Show line list.5. To show data points or value markers, double-click the Show Data Points property:
• To show or format data points, click Data points and specify the point shape and point size.
The point color is defined by the chart palette.• To show or format value markers, click Value markers and specify the markers to show. For each
marker, specify the shape and marker size. Click Color to change the marker color.
Tip: To remove all data points and value markers, in the Show Data Points dialog box, select None.
Related conceptsCurrent Default Charts and Legacy ChartsCustomizing the Color Palette of a Chart
Customize a Current Default Combination ChartCombination charts show data series using two or more types of charts - area, bar, and line. The differentcharts are overlaid on top of each other. You can customize the order in which the charts appear alongwith the type of charts and their configurations.
You can also customize which numeric axes to show and which chart to show on each axes.
Procedure
1. Select the combination chart object.2. In the Properties pane, under General, double-click the Combinations property.3. Under Numeric axes, select which axes to show.
4. Under Combinations, add or remove data series.5. If you want to change the order in which the series appear, use the up and down arrows.
The series appear in the order they are listed. Each chart appears in the foreground of any previouscharts.
100 IBM Cognos Analytics - Reporting Version 11.0 : User Guide

6. If you want to change the configuration type of the series, such as changing clustered bars to stacked
bars, under Combinations, select the series, click the edit button and select the type.7. If you use the same data series for multiple charts and want to synchronize the data marker colors,
under Color & Background, set the Series Color property to Match.
Related conceptsCurrent Default Charts and Legacy Charts
Create a Matrix of Current Default ChartsYou can view a complex chart that includes nested series or categories into a matrix, or crosstab, thatshows multiple small charts arranged in rows and columns.
The charts in the rows represent the outer nested levels of the series and categories and, the charts in thecolumns represent the categories. Each data item in the outer nested levels of the series and categoriesbecomes a separate chart. The numeric scale of all the charts is the same so that you can easily compare.
When working with pie, gauge, and bullet charts, if you include a data item in the categories, youautomatically create a matrix of charts. One chart appears for each data item in the category. Whenworking with progressive and bullet charts, if you include a data item in the series, you also automaticallycreate a matrix of charts.
For example, the following column chart shows the revenue for each year (in the categories or X-axis) forall the regions and product lines (in the series or Y-axis). This chart is very complex and difficult tounderstand.
Figure 18. Complex column chart
The following chart contains the same series and categories. However, when converted to a matrix ofcharts, the information is much easier to analyze. The columns show charts for each year and the rowsshow charts for each the product lines. The bars represent the revenue for each region.
Chapter 5. Charts 101

Figure 19. Matrix chart
Procedure
1. Select the chart object.2. In the Properties pane, under General, double-click the Matrix rows and columns property.3. Select the Show outer nested series as matrix rows or Show outer nested categories as matrix
columns check boxes (or both).4. In the Matrix levels box, select the number of nested levels to include in the matrix columns or rows.
The remaining nested levels are represented in the chart bodies in the matrix if the chart supportsadditional categories. The pie, gauge, and bullet charts do not support additional categories. Thebullet and progressive column charts do not support additional series.
For example, in the above chart, Regions are nested under Product Line. In the matrix chart, a Matrixlevel of 1 is specified. Therefore, Product Line appears as the matrix rows (series) and Regionsappear within the chart bodies.
5. If you want labels for the matrix rows and columns to appear on each chart, select the Show rowlabels or Show column labels check box.
6. In the Labels location list, select where the nested labels should appear on each chart.
The default position is on the left for rows and on the bottom for columns.7. If the labels are too long, click Truncation and specify where to truncate text or select the Size fonts
automatically check box to resize the text to fit.8. To change the font, color, and data format of the labels, click Style.9. To show the title in the row or column axis, select the Show row title or Show column title check
box.10. If you want to hide or show the axes, select the axis object, and in the Properties pane, under
Miscellaneous, set the Show in Matrix property.
102 IBM Cognos Analytics - Reporting Version 11.0 : User Guide

11. If your matrix chart includes only rows or columns, and you want them to wrap, select the Wrap rowsor columns if possible check box.
12. If you want to show the axes and axis labels for each small chart in the matrix, select the Repeat rowand column axis labels check box.
When this option is cleared, axes and axis labels appears only along the outer edge of the matrix.
Related conceptsCurrent Default Charts and Legacy Charts
Customize a Current Default Gauge ChartWhen you create a gauge chart, you can choose from a variety of chart templates, which offer differentshape, axis, and border options.
You can customize the following aspects of your gauge chart. As you modify properties, the chart previewshows you what your chart will look like.
Gauge pivot
Gauge border
Gauge axis
Gauge needle
Axis line
Gridline
Unless indicated in the user interface, all sizes are a percentage of the maximum allowed.
If your gauge chart includes a border, long axis labels, such as 250,000,000, may overlap the gaugeborder and be difficult to read. To avoid this problem, customize the data format of your gauge chartmeasure and reduce the scale so that less zeros are displayed. Or change the gauge border color or sizeor remove the border.
Procedure
1. Click the gauge chart object.2. If you want to change the shape of the gauge, modify the start and end angles of the gauge axes and
border, as follows:a) In the Properties pane, under General, double-click the Gauge Axes property and specify the start
and end angles and the direction of the axes.b) Double-click the Gauge Border property and specify the style and the start and end angles of the
border.
For example, a border start angle of 0 degrees and end angle of 180 degrees produces a semi-circular gauge.
3. If you want to add an additional axes to a gauge chart, do the following:a) In the Properties pane, under General, double-click the Gauge Axes property.
b) Click the new icon and specify the start and end angles and the direction of the new axis.4. If you want to change the size, shape, and color of the center pivot point, double-click the Gauge Pivot
property and specify the style.
Chapter 5. Charts 103

5. If you want to change the indicators in the gauge axis, click the Gauge Axis object in the chart and dothe following:a) To change the needle, under Axes, double-click the Gauge Needle property and specify the style.b) To change, add, or remove color bands that indicate the data range positions, under Color &
Background, double-click the Gauge Axis Colors property and specify the color palette.c) If you want to change the size or thickness of the gauge axis and color bands, under Axes, specify a
percentage size for the Gauge Axis Inner Radius and Gauge Axis Outer Radius properties.d) If you want to change the gridlines, under General, double-click the Gridlines or Minor Gridlines
properties and specify the style.e) If you want to change the appearance of the gauge axis line, under General, double-click Axis Line.
Related conceptsCurrent Default Charts and Legacy ChartsGauge Charts
Customize a Legacy Gauge ChartYou can customize the colors and threshold boundaries of the gauge axis areas and whether they usenumbers instead of percentages. You can also change the colors of the gauge face and outline and hidegauge labels. By default, the legacy gauge chart uses a band divided into thirds that runs from green tored.
Procedure
1. Click the gauge chart object.2. If you want to customize the color of the gauge face or outline, in the General section of the
Properties pane, double-click the Face Color or Dial Outline Color property.3. If you want to hide the gauge labels, in the Chart Labels section of the Properties pane, set the Gauge
Labels property to Hide.4. If you want to customize the colors and boundaries of the gauge areas, do the following:
a) In the Color & Background section of the Properties pane, double-click the Gauge Paletteproperty.
b) To change the color of a boundary area, under Palette, select the color, click Color, specify thecolor properties, and click OK.
c) To change the value of a boundary area, under Palette, select the boundary value, and type a newvalue.
d) To add a new boundary area, click the new icon .e) To choose a pre-defined threshold style, click the Palette drop-down menu.
You can choose whether to use discrete colors or continuous colors.
To use a number instead of a percentage as a boundary, clear the Percentage check box, and thentype a number in the Numeric boundary box.
Related conceptsCurrent Default Charts and Legacy ChartsGauge Charts
Defining color by value in current default scatter or bubble chartsIn a scatter or bubble chart you can specify that data points or bubbles appear in different colors that arebased on an additional measure or fact. The color of the points or bubbles helps you to see relationshipsin large amounts of data.
104 IBM Cognos Analytics - Reporting Version 11.0 : User Guide
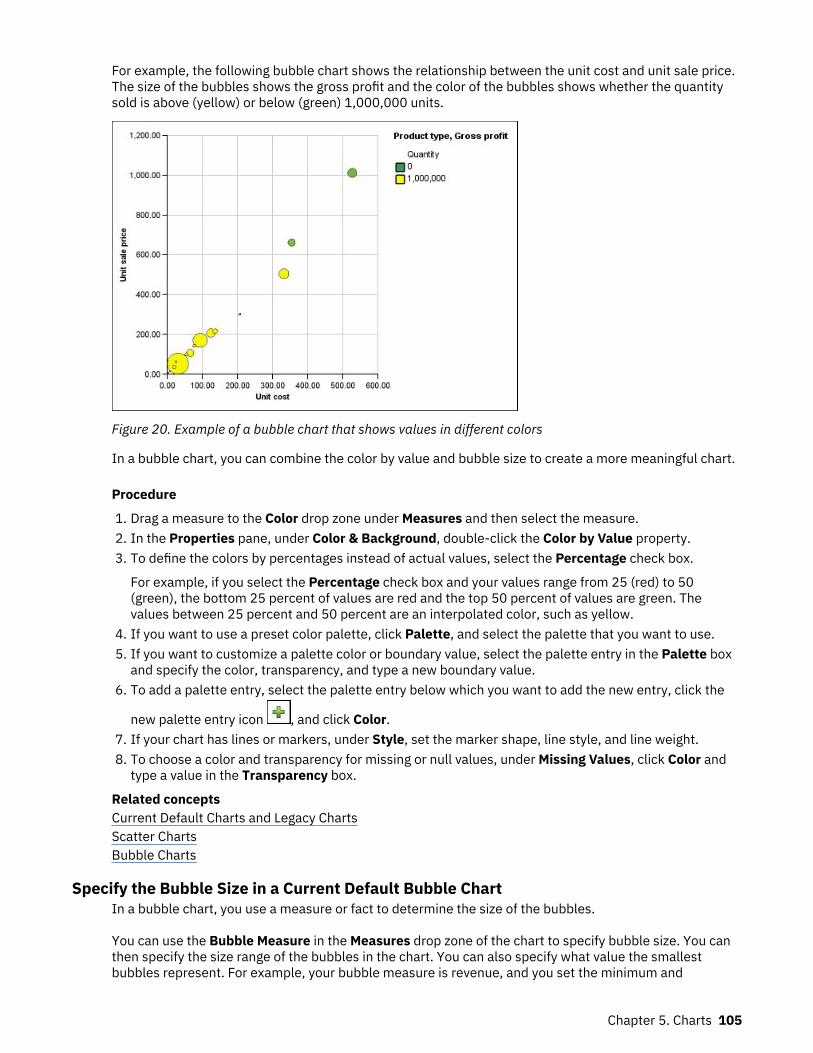
For example, the following bubble chart shows the relationship between the unit cost and unit sale price.The size of the bubbles shows the gross profit and the color of the bubbles shows whether the quantitysold is above (yellow) or below (green) 1,000,000 units.
Figure 20. Example of a bubble chart that shows values in different colors
In a bubble chart, you can combine the color by value and bubble size to create a more meaningful chart.
Procedure
1. Drag a measure to the Color drop zone under Measures and then select the measure.2. In the Properties pane, under Color & Background, double-click the Color by Value property.3. To define the colors by percentages instead of actual values, select the Percentage check box.
For example, if you select the Percentage check box and your values range from 25 (red) to 50(green), the bottom 25 percent of values are red and the top 50 percent of values are green. Thevalues between 25 percent and 50 percent are an interpolated color, such as yellow.
4. If you want to use a preset color palette, click Palette, and select the palette that you want to use.5. If you want to customize a palette color or boundary value, select the palette entry in the Palette box
and specify the color, transparency, and type a new boundary value.6. To add a palette entry, select the palette entry below which you want to add the new entry, click the
new palette entry icon , and click Color.7. If your chart has lines or markers, under Style, set the marker shape, line style, and line weight.8. To choose a color and transparency for missing or null values, under Missing Values, click Color and
type a value in the Transparency box.
Related conceptsCurrent Default Charts and Legacy ChartsScatter ChartsBubble Charts
Specify the Bubble Size in a Current Default Bubble ChartIn a bubble chart, you use a measure or fact to determine the size of the bubbles.
You can use the Bubble Measure in the Measures drop zone of the chart to specify bubble size. You canthen specify the size range of the bubbles in the chart. You can also specify what value the smallestbubbles represent. For example, your bubble measure is revenue, and you set the minimum and
Chapter 5. Charts 105

maximum bubble size to 5 pt and 20 pt, respectively. You set the smallest bubble to represent the valuezero. All the bubbles on your chart will be between 5 and 20 pts and any bubbles between 0 and 5 pts onthis scale will appear at 5 pt.
You can combine bubble size with colors by value to create a chart that shows multiple dimensions.
Procedure
1. Select the chart object.2. In Properties pane, under General, double-click the Bubble Size property.3. Under Smallest bubble, select what value the smallest bubbles represent:
• To show data items with a value of zero at the minimum bubble size, click Zero.
Tip: This setting is consistent with Microsoft Excel 2003.• To show data items with a value of zero at the minimum bubble size and show negative bubbles as
hollow, select the Zero. Negatives shown as hollow check box.
Tip: This setting is consistent with Microsoft Excel 2007.• To set the minimum bubble size to the minimum data value, click Minimum data value, and type a
size for the minimum and maximum bubble size.
Note: The minimum data value can be positive or negative.
Related conceptsCurrent Default Charts and Legacy ChartsBubble Charts
Set the Position of the First Slice in a Current Default Pie ChartYou can specify the angle in a pie chart where the first pie slice starts. You can also change the directionof the slices so they appear clockwise or counter-clockwise.
The default starting position of the first slice is 90, which displays the first slice beginning at the 12o'clock position. By default, the slices appear clockwise around the pie, so a starting position of 90displays the first slice at the 12 o'clock position, a starting position of 180 displays the first slice at the 9o'clock position, and so on.
Procedure
1. Select the pie chart object.2. In the Properties pane, under General, beside the First Slice Angle property, enter the angle at which
you want the first slice to appear.3. To change the directions in which slices appear, change the Slice Direction property.
Related conceptsCurrent Default Charts and Legacy ChartsPie Charts
Creating a Donut Chart from a Current Default Pie ChartYou can add a hole to the middle of your pie chart to create a donut chart.
About this task
You can display something in the hole of donut charts, such as a company logo or the legend.
Procedure
1. Select the pie chart object.
106 IBM Cognos Analytics - Reporting Version 11.0 : User Guide

2. In the Properties pane, under General, set the Hole size (%) property to the percentage of the piethat you want the hole to take up.
Tip: You can select a value from the Hole size (%) list or type a value that is not listed.3. To display the legend in the donut hole, do the following steps:
a) Select the chart.b) In the Properties window, double-click the Legend property.c) In the Position box, click the Advanced radio button and then click the ellipsis button.d) In the Position box, click the Center and Middle icons.e) In the Anchor box, click the menu and select Relative to Chart Body.f) Click OK twice.
4. To display an image in the donut hole, do the following steps:
a) To unlock the report, click the More icon , click the Locked icon .b) Click the chart body.
In the Properties window, Properties - Chart Body appears.c) Double-click the Background Effects property.d) Select the Images check box.e) Under URL, click Browse and select the image that you want to display in the donut hole.f) Under Position, click the Align Middle Center icon.g) Click OK.
Related conceptsCurrent Default Charts and Legacy ChartsPie Charts
Pull Out Pie Slices in a Current Default Pie ChartYou can highlight pie slices by pulling them out from the rest of the pie. For example, the following chartshows revenue by product line with slices of less than 1,000,000,000 in revenue pulled out by 25%.
Figure 21. Exploding slices in a pie chart
Chapter 5. Charts 107

Procedure
1. Select the pie chart object.2. In the Properties pane, under General, double-click the Exploded Slices property.
3. In the Exploded Slice dialog box, click the new button .4. In the Exploded amount box, type the percentage by which the slice should appear away from the
rest of the pie.
0% displays the pie slice in the pie; 100% displays the pie slice as far out from the rest of the pie aspossible.
5. Define which slice to pull out:
• To select a slice to pull out using its slice index, under Exploded slice, click Slice number and typethe slice number.
The slice number refers to the order of the slice in the legend. In the previous example, CampingEquipment has a slice number of 1 and Personal Accessories has a slice number of 5.
• To select a slice to pull out using a calculation, under Exploded slice, click Expression and clickthe ellipsis beside the Expression box to define an expression.
In the previous example, the expression that defines which slices to pull out is as follows:[Query1].[Revenue] < 100000000.
The slice definitions appear in the Exploded Slices list.6. To pull out other slices, repeat steps 3 to 5.
Related conceptsCurrent Default Charts and Legacy ChartsPie Charts
Define the Cumulation Line in a Current Default Pareto ChartThe cumulation line on a Pareto chart displays the percentage of the accumulated total of all the columnsor bars. For example, if your chart displays revenue by product line by year, the cumulation line at thesecond year's column would be the total revenue of the first and second years.
You can customize the appearance of the cumulation line and its data points.
Procedure
1. Select the Pareto chart.2. To hide or show the cumulation line, in the Properties pane, under Chart Annotations, set the
Cumulation Line property.
3. To customize the cumulation line, click the cumulation line icon , and in the Properties pane,under General, set the following properties:
• Line Styles defines the cumulation line color, style, and weight.• Cumulation Label defines the label in the legend for the cumulation line. You can use the default
label from the data source or type a custom label. The color and marker shape of the cumulation linestill appears in the legend when this property is set to None.
• Data Points defines whether to show or hide data points along the cumulation line, whether to showor hide data point borders, the color of data point borders, and the data point size and shape.
• Data Labels specifies whether to show or hide the labels for the data points along the cumulationline.
Related conceptsCurrent Default Charts and Legacy Charts
108 IBM Cognos Analytics - Reporting Version 11.0 : User Guide

Pareto Charts
Define the Cumulation Line in a Legacy Pareto ChartThe cumulation line on a Pareto chart displays the percentage of the accumulated total of all the columnsor bars. For example, if your chart displays revenue by product line by year, the cumulation line at thesecond year's column would be the total revenue of the first and second years.
You can customize the appearance of the cumulation line and its data points.
Procedure
1. Select the Pareto chart.2. To hide or show the cumulation line, in the Properties pane, under Chart Annotations, set the
Cumulative Line property to Show.
3. To customize the cumulation line, click the cumulation line icon and in the Properties pane, underGeneral, set the following properties:
• Cumulation Axis displays or hides the cumulation line's axis on the right of the Pareto chart.• Cumulation Label displays or hides the cumulation line label in the legend. The color and marker
shape of the cumulation line still appears in the legend when this property is set to No.• Line Styles defines the cumulation line color, style, and weight.• Marker Size (pt) defines the size of the markers along the cumulation line in points.• Marker Shape defines the shape of the markers along the cumulation line.• Values specifies whether to show or hide the values for the markers along the cumulation line.• Value Location defines the location of the marker values.
Related conceptsCurrent Default Charts and Legacy ChartsPareto Charts
Insert a Microchart into a CrosstabYou can use microcharts to improve the visualization of data in crosstabs.
Procedure
1. Select a crosstab row or column.2. From the right-click menu, click Insert Chart for Row Data or Insert Chart for Column Data.3. From the Insert Chart dialog box, select a chart and click OK.4. Specify the data to plot in the microchart.
The chart automatically plots the data in the specified rows or columns. You can change this ifnecessary.
Customize a Current Default Bullet ChartAfter you create a bullet chart, you can customize the shape, color, and size of the bullet and targetindicators.
By default, the bullet chart includes three gray colored regions in the background. You can edit thecolored regions (Properties pane, Colored Regions).
Procedure
1. Select the bullet chart object.2. To change the shape, color, and size of the bullet or target, do the following:
Chapter 5. Charts 109
a) In the Properties pane, under General, double-click the Bullet Indicators property.b) Under Bullet, specify how to show the bullet.
The Bar width setting specifies the width of the bullet bar as a percentage of the space available.For example, if you specify 50 percent, the bar uses half of the space available. If you specify 100percent, the bar uses all the available space.
c) Under Target, specify how to show the target.3. To change the chart orientation, in the Properties pane, under General, set the Chart Orientation
property.
Related conceptsCurrent Default Charts and Legacy ChartsBullet ChartsRelated tasksAdd Colored Regions in a Current Default Chart
Changing the number of hotspots in a chartTo improve performance, you can limit the number of hotspots that are generated for Reporting charts.
About this task
A hotspot in a chart appears when you pause a pointer over it. For example, a hotspot on a drill-downsymbol or a tooltip gives details about the column, line, or pie slice. The browser response time increaseswith the number of hotspots. When charts with many members are generated, the hotspots can becomean additional burden for the system resources, which can freeze the browser.
When you limit the number of hotspots, priority is given to items such as axis labels and legend labelsbefore individual graphical elements such as bars, pie slices, and so on. Depending on the number ofitems in a chart and the setting for maximum number of hotspots, some axis items may have hotspotswhile other axis items and all graphical elements do not, or all axis items and some graphical elementsmay have hotspots while other graphical elements do not.
The maximum hotspot setting in Reporting overrides the default set by the administrator. For moreinformation, see the IBM Cognos Analytics Administration and Security Guide.
Procedure
1. Select the chart object.2. In the Properties pane, under Miscellaneous, specify a number for the Maximum Hotspots property.
Create a drill-up and drill-down chartIf you use a dimensionally-modeled data source, you can create a chart that allows you to drill down tolower-level data or drill up to higher-level data.
Drilling up and down allows you to view more general or more detailed information on your data within apredefined dimensional hierarchy.
This is an example of a dimensional hierarchy:
Years - Year - Quarter - Month
Before you begin
Before you begin, ensure that you are using a dimensionally-modeled data source.
110 IBM Cognos Analytics - Reporting Version 11.0 : User Guide

Procedure
1. Open a chart that uses a dimensionally-modeled data source.
2. Click the Show properties icon , click the select ancestor icon , click Report, and then, in theDATA section, double-click Advanced drill behavior.
3. On the Basic tab, in the Report output drill capabilities section, select the Allow drill-up and drill-down check box.
By default, the system determines which items can be drilled on based on the dimensional structure.
On the Basic tab, you can make drilling unavailable for any data item by selecting the item in either theDisable drill-up for box or the Disable drill-down for box.
On the Advanced tab, you can change the drill-up or drill-down behavior for any parameter byselecting the parameter and then choosing one of the desired behaviors.
ResultsThe chart generates links for any item that can be drilled down on.
You can drill down or drill up by right-clicking and choosing the action from the context menu. The menuitems are unavailable if an item cannot be drilled up or down on.
Related tasksCreate a drill-up and drill-down report
Chapter 5. Charts 111

112 IBM Cognos Analytics - Reporting Version 11.0 : User Guide

Chapter 6. Extensible visualizationsYou can use extensible visualizations in IBM Cognos reports to visualize data.
Visualizations are available from the IBM Cognos Analytics blog Custom visualizations used in thesamples (https://community.ibm.com/community/user/businessanalytics/blogs/steven-macko/2016/10/06/ibm-cognos-analytics-custom-visualizations-used-in-the-samples). For more informationabout administration and visualizations, see the IBM Cognos Analytics Administration and Security Guide.
Tip: IBM Cognos Analytics samples include visualizations.
Because visualizations are extensible, they can be customized by an author with the necessary skills. Youcan create client-side visualizations that report consumers can run when they are not connected to theweb. You can also use visualizations on mobile devices.
Some of the visualizations that you can add to your reports are treemaps, heatmaps, packed bubblevisualizations, and network diagrams.
You can set properties that are available for each visualization type. These properties are determined bythe visualization definition. Typically, you can set such properties as width, height, animation effect, andfixed-axis scaling.
Extensible visualizations support all Active Report interactivity. For example, you can use Active Reportcontrols to dynamically filter visualizations to view only the data that you want to analyze.
Adding a visualization to a reportYou can add a visualization to a report to efficiently represent your data.
About this task
You add data to a visualization by inserting data items in drop zones.
When you add a visualization to an IBM Cognos Active Report, you can choose to render visualizations onthe IBM Cognos server or on the client. When you choose to render visualizations on the client, additionaldrop zones appear for extra categories or values when all the required drop zones contain data items. Youcan use extra categories and extra values to filter data or set variables. Extra items are not visible in thevisualization.
When working with dimensional data sources, if the visualization does not contain a measure againstwhich to plot data, you must provide one. For example, if you add a single member to the values dropzone, such as '2012', the default measure drop zone appears in which you must insert a measure.
Attention: The supported properties for a visualization are determined by the visualizationdefinition.
Procedure
1. Create a new report or open an existing report.
2. Click the Toolbox icon , and drag a Visualization icon to the work area.
3. In the Visualization gallery window, click the Filter icon , and select one of the following choices:
• To choose one of the new visualizations that is included in IBM Cognos Analytics 11.0.5,select New Visualizations.
• To choose a visualization from previous Cognos Analytics releases, select Legacy Visualizations.4. Select a visualization and click OK.

5. From the Source tab , drag items to the appropriate location in the data container.6. Run the visualization.
Example - Adding a treemap visualizationYou can use a treemap visualization in reports to identify patterns and exceptions.
Treemaps show relationships among large numbers of components by using size and color coding in a setof nested rectangles.
A treemap that is colored by category identifies the level 1 category by color. The sizes of the rectanglesrepresent the values. In a treemap that is colored by value, the sizes of the rectangles represent one ofthe values and the color represents a second set of values.
Attention: The supported properties for a visualization are determined by the visualizationdefinition.
Figure 22. A treemap visualization
Before you begin
Your administrator must make the visualizations available in the Visualization Gallery.
If you use Microsoft Internet Explorer to view visualizations, you must have Microsoft Silverlight 5installed on your computer. Firefox or iPad users do not need Silverlight.
About this task
You add data to a visualization by inserting data items in drop zones.
When you add a visualization to an IBM Cognos Active Report, you can choose to render visualizations onthe IBM Cognos server or on the client. When you choose to render visualizations on the client, additionaldrop zones appear for extra categories or values when all the required drop zones contain data items. You
114 IBM Cognos Analytics - Reporting Version 11.0 : User Guide

can use extra categories and extra values to filter data or set variables. Extra items are not visible in thevisualization.
When working with dimensional data sources, if the visualization does not contain a measure againstwhich to plot data, you must provide one. For example, if you add a single member to the values dropzone, such as '2012', the default measure drop zone appears in which you must insert a measure.
Attention: The supported properties for a visualization are determined by the visualizationdefinition.
Procedure
1. Click the Toolbox icon , drag a Visualization icon to the work area.2. From the Visualization Gallery, select a Treemap icon:
• If you are plotting a single measure, select a treemap colored by category.• If you are plotting two measures, select a treemap colored by value.
3. Click OK.
4. From the Source tab , drag items to the appropriate location in the data container:a) Under Values, drag items to define the size and color of the rectangles to Size and Color.b) Under Categories, drag items to the different levels. Each level represents the category within
which the subsequent levels are nested.For example, the levels might be Year, Product Line, and Product Type.
Example - Adding a heatmap visualizationHeatmaps use colors to represent the individual values that are contained in a matrix.
Similar to treemaps, you can use heatmaps to identify patterns and exceptions. Unlike treemaps, thesizes of the rectangles are not proportionate to values.
Chapter 6. Extensible visualizations 115

Figure 23. A heatmap visualization
Before you begin
Your administrator must make the visualizations available in the Visualization Gallery.
If you use Microsoft Internet Explorer to view visualizations, you must have Microsoft Silverlight 5installed on your computer. Firefox or iPad users do not need Silverlight.
About this task
You add data to a visualization by inserting data items in drop zones.
When you add a visualization to an IBM Cognos Active Report, you can choose to render visualizations onthe IBM Cognos server or on the client. When you choose to render visualizations on the client, additionaldrop zones appear for extra categories or values when all the required drop zones contain data items. Youcan use extra categories and extra values to filter data or set variables. Extra items are not visible in thevisualization.
When working with dimensional data sources, if the visualization does not contain a measure againstwhich to plot data, you must provide one. For example, if you add a single member to the values dropzone, such as '2012', the default measure drop zone appears in which you must insert a measure.
Attention: The supported properties for a visualization are determined by the visualizationdefinition.
Procedure
1. Click the Toolbox icon , drag a Visualization icon to the work area.2. From the Visualization Gallery, select the Heatmap icon and click OK.
3. From the Source tab , drag items to the appropriate location in the data container:
116 IBM Cognos Analytics - Reporting Version 11.0 : User Guide

a) Under Values, drag a measure or a single value to define the color shading of the rectangles.b) Under Categories, drag items to the Y Category and X Category.
Tip: Ensure that the items in the Y Category and X Category come from different dimensions.
Example - Adding a packed bubble visualizationA packed bubble visualization is similar to a bubble chart in which the bubbles are tightly packed ratherthan spread over a grid. You can use a packed bubble visualization to display a large amount of data in asmall space.
Figure 24. A packed bubble visualization
Before you begin
Your administrator must make the visualizations available in the Visualization Gallery.
If you use Microsoft Internet Explorer to view visualizations, you must have Microsoft Silverlight 5installed on your computer. Firefox or iPad users do not need Silverlight.
About this task
You add data to a visualization by inserting data items in drop zones.
When you add a visualization to an IBM Cognos Active Report, you can choose to render visualizations onthe IBM Cognos server or on the client. When you choose to render visualizations on the client, additionaldrop zones appear for extra categories or values when all the required drop zones contain data items. Youcan use extra categories and extra values to filter data or set variables. Extra items are not visible in thevisualization.
When you work with dimensional data sources, if the visualization does not contain a measure againstwhich to plot data, you must provide one. For example, if you add a single member to the values dropzone, such as '2012', the default measure drop zone appears in which you must insert a measure.
Attention: The supported properties for a visualization are determined by the visualizationdefinition.
Chapter 6. Extensible visualizations 117
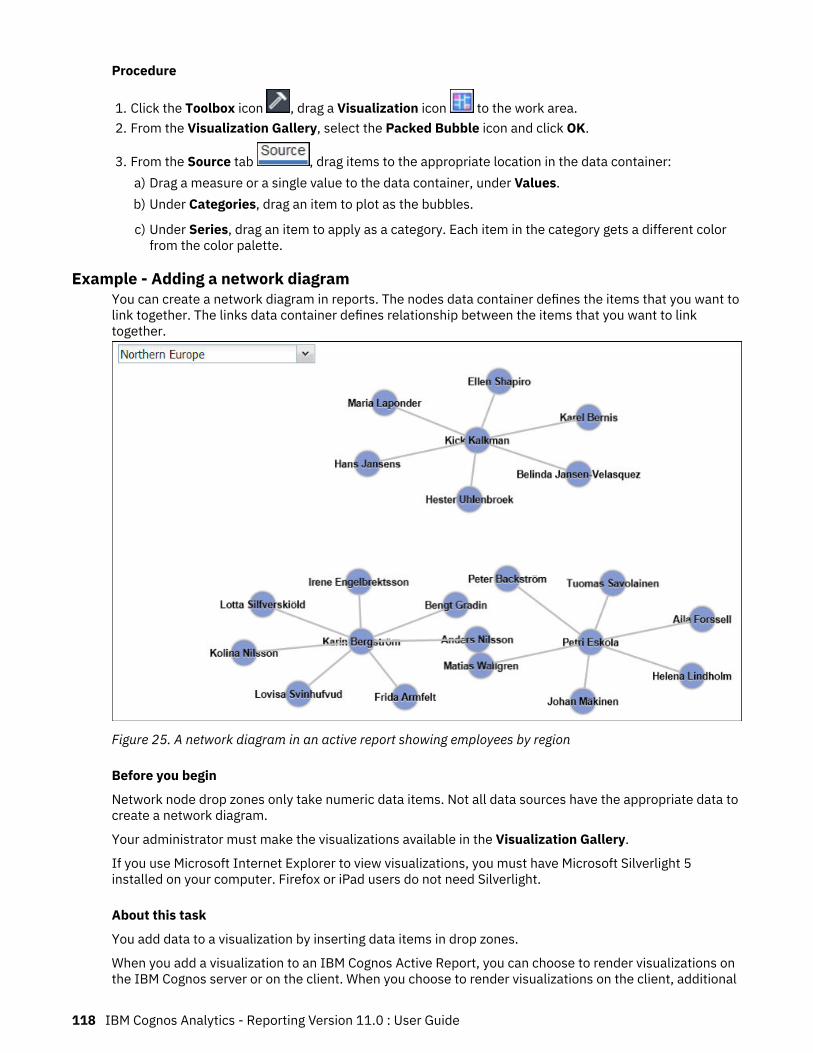
Procedure
1. Click the Toolbox icon , drag a Visualization icon to the work area.2. From the Visualization Gallery, select the Packed Bubble icon and click OK.
3. From the Source tab , drag items to the appropriate location in the data container:a) Drag a measure or a single value to the data container, under Values.b) Under Categories, drag an item to plot as the bubbles.
c) Under Series, drag an item to apply as a category. Each item in the category gets a different colorfrom the color palette.
Example - Adding a network diagramYou can create a network diagram in reports. The nodes data container defines the items that you want tolink together. The links data container defines relationship between the items that you want to linktogether.
Figure 25. A network diagram in an active report showing employees by region
Before you begin
Network node drop zones only take numeric data items. Not all data sources have the appropriate data tocreate a network diagram.
Your administrator must make the visualizations available in the Visualization Gallery.
If you use Microsoft Internet Explorer to view visualizations, you must have Microsoft Silverlight 5installed on your computer. Firefox or iPad users do not need Silverlight.
About this task
You add data to a visualization by inserting data items in drop zones.
When you add a visualization to an IBM Cognos Active Report, you can choose to render visualizations onthe IBM Cognos server or on the client. When you choose to render visualizations on the client, additional
118 IBM Cognos Analytics - Reporting Version 11.0 : User Guide
drop zones appear for extra categories or values when all the required drop zones contain data items. Youcan use extra categories and extra values to filter data or set variables. Extra items are not visible in thevisualization.
When working with dimensional data sources, if the visualization does not contain a measure againstwhich to plot data, you must provide one. For example, if you add a single member to the values dropzone, such as '2012', the default measure drop zone appears in which you must insert a measure.
Attention: The supported properties for a visualization are determined by the visualizationdefinition.
Procedure
1. Click the Toolbox icon , drag a Visualization icon to the work area.2. From the Visualization Gallery, select the Network diagram icon and click OK.
3. From the Source tab , drag items to the appropriate location in the data container:a) In the Nodes1 data container, drag items to Node (Numeric) and Name.
The nodes data container defines the items that you want to link together, such as Employees,defined by an employee code.
b) In the Links1 data container, drag items to From node (Numeric) and To node (Numeric).The links data container defines relationship between the items that you want to link together, suchas Employees and Managers.
Visualization propertiesThe properties that you can set for each visualization affect how you work with visualizations that areinserted in a report.
All extensible visualizations have properties in common and properties that are specific to eachvisualization. Properties that are specific to a visualization are defined by the visualization author in thevisualization definition. By default, properties that are defined by the visualization author appear in agroup that is named Custom in the Properties window, unless the author created property groups in thevisualization definition.
To set properties for multiple visualizations, press Ctrl while you click the visualizations in the report.When multiple visualizations are selected, only the common properties appear in the Properties window.
Choosing where visualizations are renderedWhen you add a visualization to an IBM Cognos Active Report, you can choose to render the visualizationon the IBM Cognos server or on the client.
About this task
Visualizations that are added to regular reports are always rendered on the Cognos server. Visualizationsthat are rendered on the Cognos server are rendered as static images. Client-side visualizations arerendered as JavaScript code. Report size and performance are affected by whether visualizations arerendered on the server or on the client. For example, static images might increase the report size whenthere are many of them, but performance might be better.
Some visualization properties are available for only one of the render methods, and other properties aremodified when you change the render method. For example, the Container Filter property, extra valuesdrop zones, and extra categories drop zones are not supported when you choose to render visualizationson the Cognos server.
Chapter 6. Extensible visualizations 119

If you want to enable client-side filtering in the visualization, you must choose to render the visualizationon the client.
Note: In the visualization definition, visualization authors can specify to render a visualization only asJavaScript or only as a static image. When a visualization supports only one output type, the visualizationproperty Render Method is not available. In addition, visualizations that can be rendered only inJavaScript do not appear in the Visualization Gallery when you author regular reports.
Procedure
1. In the active report, select the visualization.2. In the Properties window, click the Render Method property and choose the render method that you
want.
Resizing a visualizationYou can change the size of a visualization.
Procedure
1. Click and drag the lower right corner of the visualization.2. To maintain the aspect ratio, press the Shift key while you resize the visualization.
You can view the changing height and width of the resized visualization in the Properties pane, underPositioning.
Changing the nesting orderWhen you create a visualization in an IBM Cognos Active Report, you can change the nesting order so thatextra items are ordered properly in the query. If the items are not ordered properly in the query, thereport might not run.
About this task
Extra items are data items that are used for filtering or setting variables. These items are not visible in thevisualization. By default, extra categories are nested below other categories, so as not to affect sorting.However, if the extra categories are from the same dimension as a category, they must be in the correcthierarchical order: Years, Quarters, and Months. You can change the nesting order.
For example, you have Quarters and Months as categories. You then add Years as an extra category. Youadd an Active Report control and connect to Years as a filter. You might have to change the nesting orderof the data items for the report to run.
Note: Extra items are available only when you choose to render the visualization on the client. You cannotadd extra items to a visualization when you choose to render the visualization on the IBM Cognos server.
Procedure
1. Select the data container that contains the data set in which you want to change the nesting order.2. From the Properties pane, under General, click Change Nesting Order.3. In the Change Nesting Order window, select the extra category and use the arrow icon to reorder it.
Tip: You can click Show Data Container to view the new nesting order when the report is run.
Related tasksSorting a category field by a measure in visualizations
120 IBM Cognos Analytics - Reporting Version 11.0 : User Guide

You can sort a category field by a measure in visualizations that are inserted in IBM Cognos Active Report.
Specifying the range values that are displayedYou can specify the range of values that you want to display in a visualization.
About this task
You can specify the range of values and categorical data that is displayed in visualizations. Some of theoptions that are available depend on whether you choose to render the visualization on the IBM Cognosserver or on the client. When the visualization is rendered on the Cognos server, more choices areavailable when the visualization is in a master-detail relationship.
To control the range of values that is displayed, the following choices are available to calculate theminimum and maximum values of the range.
• All data
With this choice, minimum and maximum values are calculated to span the values of the insertedmeasure.
When the visualization is added to an active report, the values are calculated to span the values of allcontrols that are connected to the visualization.
Note: In visualizations that are added to active reports, the aggregation method that is specified in theRollup Method property also affects the range of values.
• All detail data
This choice is available only when the visualization is in a master-detail relationship and is rendered onthe Cognos server. With this choice, the range of data that is displayed is the same in each detailvisualization.
• Filtered data
This choice is available only when the visualization is rendered on the client. With this choice, minimumand maximum values are calculated from values that users select in Active Report controls that areconnected to the visualization.
• Specified values
With this choice, you specify the minimum and maximum values that you want to display in thevisualization.
Note: The minimum and maximum values that are displayed in the visualization might differ from thevalues that you specify. For example, if you specify a range of 0 to 195, IBM Cognos Analytics mightdisplay a range of 0 to 200.
To specify the categorical data that is displayed, the following choices are available.
• All data
This choice is available only when the visualization is rendered on the client. With this choice, allcategorical data that spans the values of all Active Report controls that are connected to thevisualization is displayed.
• Filtered data
This choice is available only when the visualization is rendered on the client. With this choice, only thefiltered data is shown in the legend and on axes.
The choice that you make for displaying categorical data can affect elements in the visualization, such asthe legend and axes. For example, when all data is selected, all legend items are always shown in thevisualization, and the color of each legend item stays the same in the visualization. When a category isinserted on an axis, space is reserved on the axis for all data. When filtered data is selected, the color ofeach legend item can change when users select different values in a control that is linked to the
Chapter 6. Extensible visualizations 121
visualization. When a category is inserted on an axis, the axis shows only the values that are selected inthe control.
Procedure
1. To specify the categorical data that is displayed, follow these steps.a) In the visualization data container, select the category that you want.b) In the Properties pane, click the Category Range property and select the choice that you want.
2. To specify the range of values that is displayed, follow these steps.a) In the visualization data container, click the data item in the Values section that represents the
values in the visualization.For example, in a packed bubble visualization, click the data item that is inserted in the Size box.
b) In the Properties pane, double-click the Value Range property.c) In the Range type box, click one of the available choices.d) If you clicked All data, Filtered data, or All detail data, and you want the range of values to
include zero, select the Range includes zero check box.e) If you clicked Specified, type the minimum and maximum values of the range in the Minimum and
Maximum boxes.
Related tasksChoosing where visualizations are renderedWhen you add a visualization to an IBM Cognos Active Report, you can choose to render the visualizationon the IBM Cognos server or on the client.Sorting a category field by a measure in visualizationsYou can sort a category field by a measure in visualizations that are inserted in IBM Cognos Active Report.
Summarizing data in a visualizationWhen a visualization is added to an IBM Cognos Active Report, you can specify how the data issummarized when users select multiple values in a control that filters the data in the visualization.
About this task
You can specify how data is summarized in a visualization only when you choose to render thevisualization on the client. The Rollup Method property is not available when you choose to render avisualization on the IBM Cognos server.
In addition to summarizing data, the aggregation method that you choose affects the range of values thatis displayed. For example, if the visualization is filtered by a single select control, Maximum is usually theappropriate aggregation method. With this choice, the range of values is based on the maximum of allvalues across the filtered items.
Set the aggregation method to the aggregation type of the data item. For example, if the data item isMargin, set the aggregation method to Average. When you are using an OLAP data source, IBM CognosAnalytics cannot retrieve the aggregation type of a measure. As a result, IBM Cognos Analytics sets theaggregation method to Total by default.
Procedure
1. In the visualization data container, in the Values section, click the box that represents the data valuesin the visualization.For example, in a heatmap, click the Color box.
2. In the Properties pane, click the Rollup Method property and select the aggregation method that youwant to use to summarize data in the visualization.
122 IBM Cognos Analytics - Reporting Version 11.0 : User Guide

Populating a visualization with data from the visualization definitionIn IBM Cognos Analytics - Reporting, you can populate a visualization with data that is specified in thevisualization definition instead of adding data items from a package.
About this task
You can use data that is specified in the visualization definition to test a visualization before you add yourown data. Using data from the visualization definition is also a way to bring external data into avisualization.
Procedure
1. Select the visualization.2. In the Properties pane, double-click the Use Embedded Data property.3. Select the check box of the data container for which you want to use data that is defined in the
visualization specification.
Tip: Some visualizations have more than one data container.
Results
The data container is removed from the visualization. The data container is not required when thevisualization is using data from the visualization definition.
Updating visualizationsUpdate visualizations when a change was made to the visualization definition.
About this task
You can update the visualizations in a report by opening the report in a new IBM Cognos Analytics -Reporting window.
If any part of a visualization is invalidated by changes that were made to the visualization definition, theinvalidated part is removed. For example, if a field is renamed, the data items in the field are removed.You must add the data items to the renamed field for the visualization to run.
For visualizations that are rendered on the client, if you do not update visualizations when thevisualization definition is changed, the old visualization definition is used when you run the report.Visualizations that are rendered on the IBM Cognos server always use the latest visualization definition.As a result, server-side visualizations might not run if they are not updated.
Procedure
Open the report that contains the visualizations that you want to update in a new Cognos Analytics -Reporting window.
Converting visualizations from one type to anotherYou can convert a visualization from one type to another type.
About this task
The following list describes the conversion process.
• Data items are mapped to fields with the same name.
Chapter 6. Extensible visualizations 123
• If no field with the same name exists, the first field of the same type is used. Value fields are mapped tovalue fields. Category fields are mapped to category fields. Category fields that are ID fields are onlymapped to other category fields that are also ID fields.
• In active reports, for visualizations that are rendered on the client, extra values and category items areused to fill any empty fields in the converted visualization.
If you convert to a visualization that has fewer fields than the original visualization, the extra data itemsare kept as extra values or category items.
• Common properties that are not specific to visualizations, such as Data format, are preserved.• No warnings appear for properties that are dropped during the conversion.
When you convert a visualization to a new visualization type, you can preserve properties that have thesame ID and the same type. Or you can choose to use only the default properties of the new visualization.
If you convert a visualization to a visualization type that has more fields than the original visualization, youmust populate the empty fields in the converted visualization. For example, if you convert a column chartto a combination chart that has columns and lines, there are empty fields for the line data container.
You cannot convert a visualization to a current default chart and vice versa.
Procedure
1. Select the visualization that you want to convert, and in the report object toolbar, click the More icon
and then click Convert Visualization.2. Select a new visualization type.3. To preserve properties that have the same ID and the same type, under Visualization properties, click
the Preserve existing visualization properties radio button.4. To use only the default properties of the visualization type that you are converting to, under
Visualization properties, click the Use new visualization default properties radio button.5. Click OK.
Sorting a category field by a measure in visualizationsYou can sort a category field by a measure in visualizations that are inserted in IBM Cognos Active Report.
About this task
In visualizations, you can sort a data item by the overall totals or by the totals in the context of an extracategory. While Cognos Active Report supports client-side filtering for visualizations, sorting alwaysoccurs on the Cognos server. As a result, you must construct the visualization so that the underlyingcrosstab reflects your filtering options and provides the correct sorting. As you construct the visualization,you can view the underlying crosstab by right-clicking the visualization data container and clicking ShowContainer Data.
This task describes how to maintain the sorting of a category by a measure when the visualization isfiltered by a single selection control. For example, an active report contains a data drop-down list controlwith Quarter as the data item, and a clustered bar visualization that shows quantity that is sold by retailertype. In the visualization, Retailer type appears as the series, Quantity appears as the measure, and nodata item is specified for the categories. You want to sort the visualization by quantity that is sold, andfilter by quarter. To have the sorting applied for each quarter, place Quarter on the same edge as Retailertype in the underlying crosstab, which is accomplished by inserting the Quarter data item as an extracategory for the series. In addition, Quarter must be nested outside of Retailer type in the underlyingcrosstab. Otherwise, Retailer type is sorted according to the quantity that is sold for all quarters.
This technique does not work when a visualization is filtered by multiple controls, or by a control thataccepts multiple selections, such as a check box group control.
124 IBM Cognos Analytics - Reporting Version 11.0 : User Guide
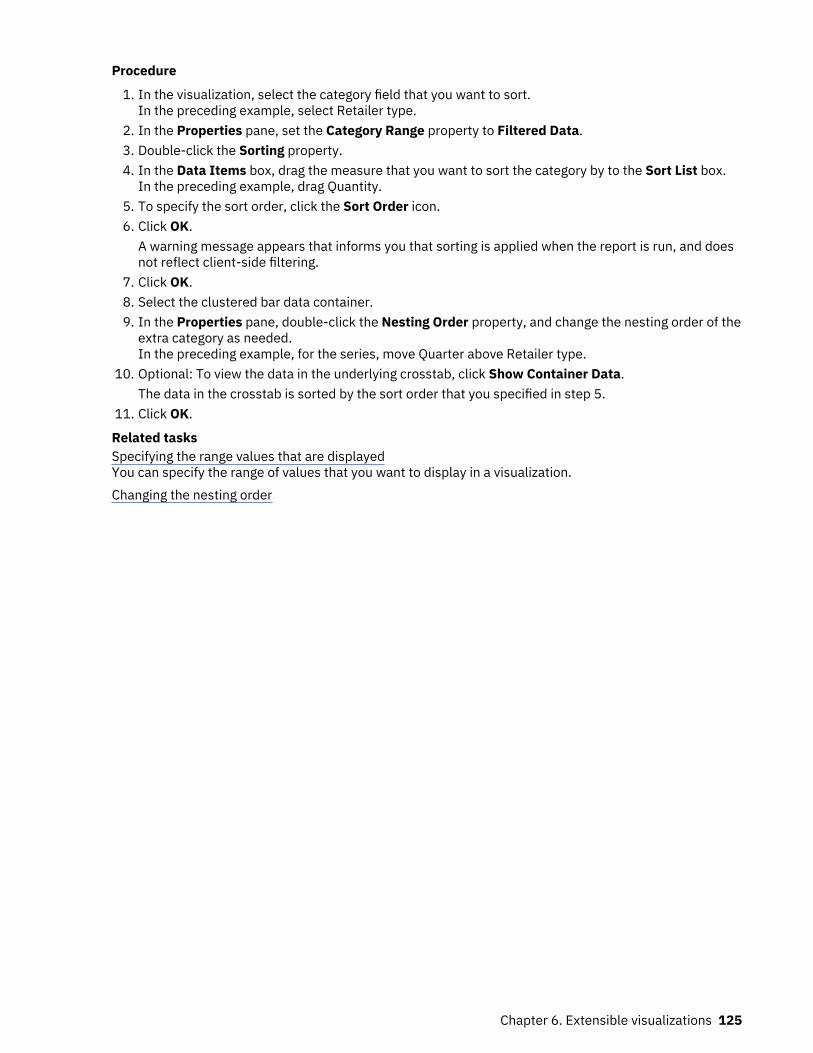
Procedure
1. In the visualization, select the category field that you want to sort.In the preceding example, select Retailer type.
2. In the Properties pane, set the Category Range property to Filtered Data.3. Double-click the Sorting property.4. In the Data Items box, drag the measure that you want to sort the category by to the Sort List box.
In the preceding example, drag Quantity.5. To specify the sort order, click the Sort Order icon.6. Click OK.
A warning message appears that informs you that sorting is applied when the report is run, and doesnot reflect client-side filtering.
7. Click OK.8. Select the clustered bar data container.9. In the Properties pane, double-click the Nesting Order property, and change the nesting order of the
extra category as needed.In the preceding example, for the series, move Quarter above Retailer type.
10. Optional: To view the data in the underlying crosstab, click Show Container Data.The data in the crosstab is sorted by the sort order that you specified in step 5.
11. Click OK.
Related tasksSpecifying the range values that are displayedYou can specify the range of values that you want to display in a visualization.Changing the nesting order
Chapter 6. Extensible visualizations 125

126 IBM Cognos Analytics - Reporting Version 11.0 : User Guide
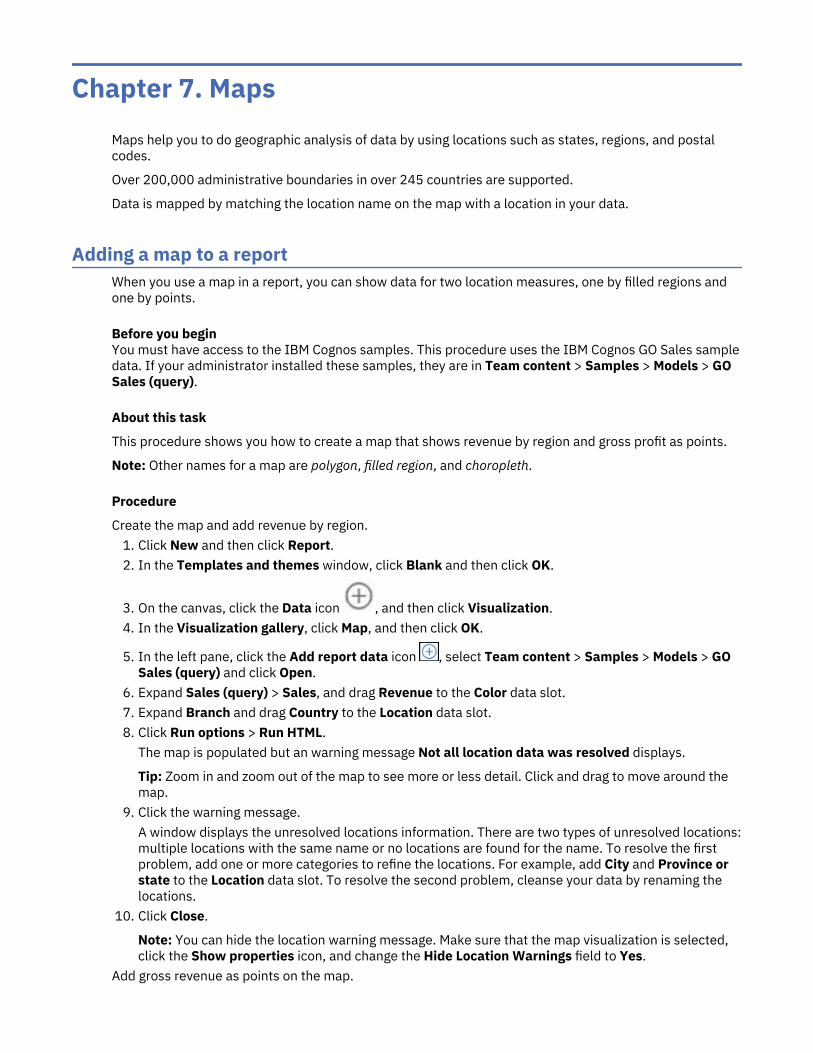
Chapter 7. MapsMaps help you to do geographic analysis of data by using locations such as states, regions, and postalcodes.
Over 200,000 administrative boundaries in over 245 countries are supported.
Data is mapped by matching the location name on the map with a location in your data.
Adding a map to a reportWhen you use a map in a report, you can show data for two location measures, one by filled regions andone by points.
Before you beginYou must have access to the IBM Cognos samples. This procedure uses the IBM Cognos GO Sales sampledata. If your administrator installed these samples, they are in Team content > Samples > Models > GOSales (query).
About this task
This procedure shows you how to create a map that shows revenue by region and gross profit as points.
Note: Other names for a map are polygon, filled region, and choropleth.
Procedure
Create the map and add revenue by region.1. Click New and then click Report.2. In the Templates and themes window, click Blank and then click OK.
3. On the canvas, click the Data icon , and then click Visualization.4. In the Visualization gallery, click Map, and then click OK.
5. In the left pane, click the Add report data icon , select Team content > Samples > Models > GOSales (query) and click Open.
6. Expand Sales (query) > Sales, and drag Revenue to the Color data slot.7. Expand Branch and drag Country to the Location data slot.8. Click Run options > Run HTML.
The map is populated but an warning message Not all location data was resolved displays.
Tip: Zoom in and zoom out of the map to see more or less detail. Click and drag to move around themap.
9. Click the warning message.A window displays the unresolved locations information. There are two types of unresolved locations:multiple locations with the same name or no locations are found for the name. To resolve the firstproblem, add one or more categories to refine the locations. For example, add City and Province orstate to the Location data slot. To resolve the second problem, cleanse your data by renaming thelocations.
10. Click Close.
Note: You can hide the location warning message. Make sure that the map visualization is selected,click the Show properties icon, and change the Hide Location Warnings field to Yes.
Add gross revenue as points on the map.

11. At the top of the data slot pane, click the down arrow and select Points.12. From Sales (query) > Sales, drag Gross profit to the Color data slot.13. Drag Revenue to the Color data slot.14. Drag Province or state to the Location data slot.15. Click Run > Run HTML.
Resolve the unresolved locations warning the same way you did for regions.16. Save the report when you're done.
Using latitude and longitude location information in a mapWhen you use a map in a report, you can show data for one location, either as a filled region, a point,latitude/longitude point, or a combination of these locations.
Before you begin
To use longitude/latitude as location measures in your map, use a data source that contains longitude andlatitude data. For example:
Table 6. Example table with latitude and longitude data
City Longitude Latitude Rating Surveys
Antwerp 4.402771 51.260197 7 30.000
Brussels 4.355607 50.878899 9 76.000
At the top of the data slot pane, click the down arrow and select Latitude/Longitude.
Note: The format of the longitude and latitude data must be as follows: Lat 51.260197 , Long4.402771. The format 51° 26' 01.97'' N , 4° 40' 2.771'' E is not supported.
Procedure
1. Click New and then click Report.2. In the Templates and themes window, click Blank and then click OK.
3. On the canvas, click the Data icon , and then click Visualization.4. In the Visualization gallery, click Map, and then click OK.
5. In the left pane, click the Add report data icon , select report data that contains latitude/longitude data.
6. At the top of the data slot pane , click the down arrow and select Longitude/Longitude.7. In the left pane, expand your data items and drag latitude and longitude to the Latitude and
Longitude data slots.8. Drag City to the Label data slot. The latitude, longitude, name of the city will appear when you hover
over the data points.9. Drag rating to the Size data slot and drag Surveys to the Color data slot.
10. Click Run options > Run HTML.11. Click Close.
128 IBM Cognos Analytics - Reporting Version 11.0 : User Guide

Setting up Mapbox to work with IBM Cognos AnalyticsIBM Cognos Analytics supports the use of custom polygons in partnership with Mapbox.
Create a free Mapbox account with 5 GB of space. When you have created your Mapbox account, uploadyour geoJSON custom polygon file to Mapbox as a tileset. A tileset is a compiled set of geoJSON that isoptimized to render fast on a browser. For more information, see https://www.mapbox.com/pricing/.
If your geoJSON is less than 5 MB, then you can edit the geoJSON directly as a data set in Mapbox. Afteryou edit the geoJSON files, export them into a tileset.
Make sure that each polygon has at least one uniquely identifying property as a string value.
Custom polygons in formats such as .shp and KML can be converted to geoJSON, by using for exampleQGIS.
Retrieving the necessary data from Mapbox
When you have your tileset that is created in Mapbox, copy the following three keys from the tileset page:
• MapID• Layer name• Unique identifier
You need these keys when you want to use Mapbox data in you map visualization.
For more information, see Using custom point or region information from Mapbox in a map visualization ina report in the IBM Cognos Analytics Dashboards and Stories user guide and Using custom point or regioninformation from Mapbox in a map visualization in a report.
Best practices
• For increased performance and to make sure that polygons appear at zoom level 0 (world view),compress geoJSON files to less than 10 MB. A tool that can compress geoJSON files is http://mapshaper.org/.
If your geoJSON files are larger than 10 MB, then Mapbox sets the default zoom to not start atworldview 0. If you want to manually change the zoom extents, there are few ways to do so:
– Tippecanoe APIs, which are available on Linux and Apple MacOs.– Download Mapbox studio classic on your Microsoft Windows computer and change the minimum and
maximum zoom levels.
For more information, see https://www.mapbox.com/help/adjust-tileset-zoom-extent/.• To ensure that auto-zoom works in IBM Cognos Analytics - Reporting set the unique polygon identifier
as a string value.• If you work with custom polygons in small areas, for example at postcode level, turning off auto zoom
after the initial data loads. This results in a better experience when you filter because the map does notreset zoom and zoom in multiple times.
• Keep the Mapbox keys confidential.
Example of custom regions
Chapter 7. Maps 129

Example of custom points
Using custom point or region information from Mapbox in a mapvisualization in a report
When you use a map in a report, you can use custom point or region information from Mapbox in a map.You can use an extra layer on a map to display additional information. For example, a time-zone layer.
Before you begin
To use the vector maps from Mapbox as location measures in your map visualization, use a data sourcethat contains region or point data. An example of a table with point or region data is the following table:
130 IBM Cognos Analytics - Reporting Version 11.0 : User Guide
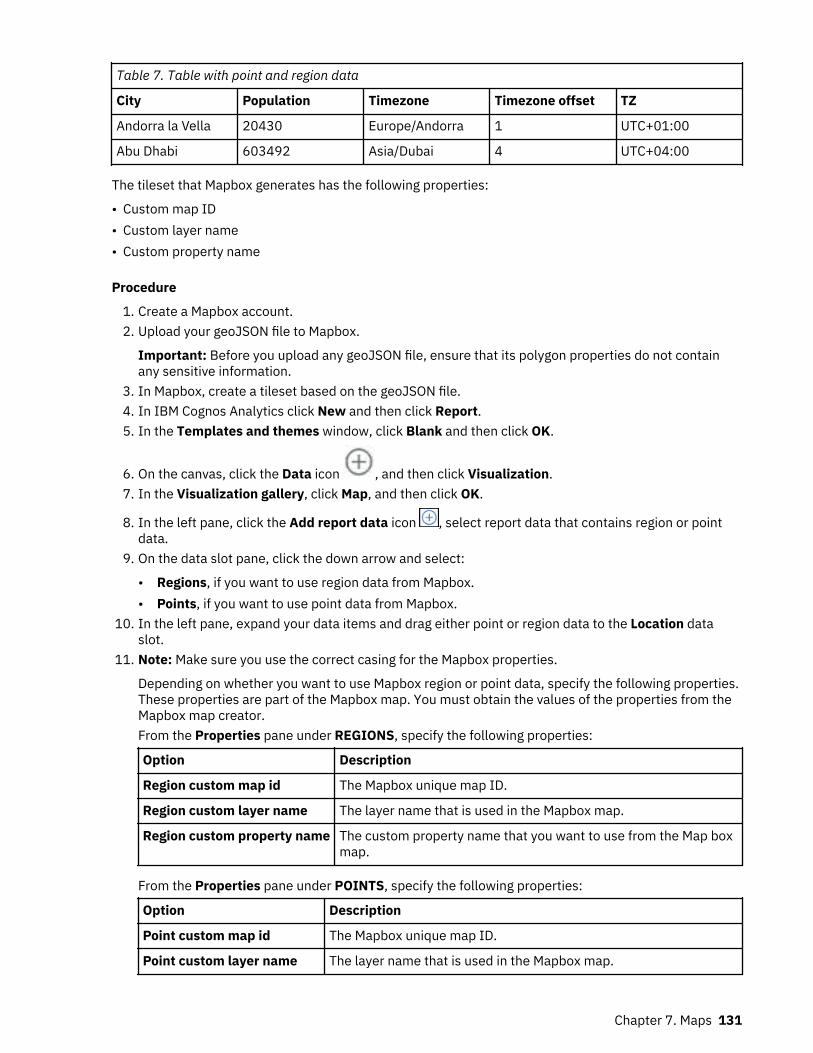
Table 7. Table with point and region data
City Population Timezone Timezone offset TZ
Andorra la Vella 20430 Europe/Andorra 1 UTC+01:00
Abu Dhabi 603492 Asia/Dubai 4 UTC+04:00
The tileset that Mapbox generates has the following properties:
• Custom map ID• Custom layer name• Custom property name
Procedure
1. Create a Mapbox account.2. Upload your geoJSON file to Mapbox.
Important: Before you upload any geoJSON file, ensure that its polygon properties do not containany sensitive information.
3. In Mapbox, create a tileset based on the geoJSON file.4. In IBM Cognos Analytics click New and then click Report.5. In the Templates and themes window, click Blank and then click OK.
6. On the canvas, click the Data icon , and then click Visualization.7. In the Visualization gallery, click Map, and then click OK.
8. In the left pane, click the Add report data icon , select report data that contains region or pointdata.
9. On the data slot pane, click the down arrow and select:
• Regions, if you want to use region data from Mapbox.• Points, if you want to use point data from Mapbox.
10. In the left pane, expand your data items and drag either point or region data to the Location dataslot.
11. Note: Make sure you use the correct casing for the Mapbox properties.
Depending on whether you want to use Mapbox region or point data, specify the following properties.These properties are part of the Mapbox map. You must obtain the values of the properties from theMapbox map creator.From the Properties pane under REGIONS, specify the following properties:
Option Description
Region custom map id The Mapbox unique map ID.
Region custom layer name The layer name that is used in the Mapbox map.
Region custom property name The custom property name that you want to use from the Map boxmap.
From the Properties pane under POINTS, specify the following properties:
Option Description
Point custom map id The Mapbox unique map ID.
Point custom layer name The layer name that is used in the Mapbox map.
Chapter 7. Maps 131

Option Description
Point custom property name The custom property name that you want to use from the Map boxmap.
12. Drag measurable data to the Color data slot.For example, use population.
13. Click Run options > Run HTML.14. Click Close.
ExampleAn example of a map visualization with a region layer that shows the population for each time-zone. Thelayout of the time-zones is defined in a Mapbox map.
132 IBM Cognos Analytics - Reporting Version 11.0 : User Guide

Geospatial dataTo use a map, your data set must contain geographical data, such as countries, states, or provinces.
To determine whether a column can be used in a map, Cognos Analytics analyzes a sample of 2000values in the location column, looking for recognizable place names. If 80% or more are recognized asmap values, Cognos Analytics produces a map.
For example, you have four countries in your location column and one country is misspelled: Brazil, China,Indiea, and Russia. The typo for India means that only 75% of the values are recognizable place namesand you cannot see a map as a starting point. However, if you have five countries and one has a typo in it,you see a map.
If you don't see a map as a recommended starting point for your data, look at your location column to seewhether it contains ambiguous data.
Ambiguous dataAmbiguous data in your data set can lead to misleading, inaccurate, or incomplete maps in yourdashboard or report.
Here are some tips for locating and correcting ambiguous data:
• If the column heading for the location column is misleading, such as a location column calledEmployee Name, it cannot be used for mapping your data.
• Look at the values in your data. Misspellings cause problems.• Check for and resolve ambiguous locations in your data file and then replace the data in the data set.
For example, Georgia is the name of a country and the name of a state in the United States.
– If Georgia appears in a column that contains American states, a map of the United States isdisplayed.
– If Georgia appears in a column that contains countries, a world map or a map of Asia is displayed,depending on the other values in the column.
– If Georgia is in a column that contains both states and countries, no map is displayed. To avoid thisproblem, split the column into two, one for countries and one for states. Make sure that the stateappears as US Georgia.
• Unmatched values occur when the location on your data cannot be matched by name to a supportedadmin boundary or postal code. For admin boundaries, if the location is under a different name, youmust correct your data.
– Cognos Analytics does not support U.S. of America, but it does support USA. Create a calculationto change the unsupported value to a supported one.
– Lakes or other bodies of water are not supported locations.• For postal codes, you must understand the postal code system for the country that is mapped. You
must include both the country and the postal code data items. If Cognos Analytics cannot map the data,there are several possible causes.
– You are trying to map a full or extended postal code. In Canada, the first 3 characters of the postalcode are supported (forward sortation area).
– For the United States of America, the 5-digit postal code is supported, not the extended postal code.– Many countries use a 5-digit postal code so your data must include the country.– Countries are constantly updating their postal codes. Cognos Analytics updates the list of supported
postal codes once a year.
A map is not displayed in the following cases:
Chapter 7. Maps 133

• The data contains both countries and provinces, countries and states, or regions and parts of a region.For example, US, Texas, Florida; UK, Scotland, England; Europe, France, Germany; Florida, Miami-Dade,Broward, Sarasota.
• The data contains abbreviations that can be both countries or states. For example, AL, AR, CA, DE canbe Alabama, Arkansas, California, Delaware, Albania, Argentina, Canada, or Germany.
134 IBM Cognos Analytics - Reporting Version 11.0 : User Guide

Chapter 8. Active ReportsYou can use IBM Cognos Analytics - Reporting to create active reports. IBM Cognos Active Report is areport output type that provides a highly interactive and easy-to-use managed report. Active reports arebuilt for business users, allowing them to explore their data and derive additional insight.
Active reports make business intelligence easier for the casual user. Report authors build reportstargeted at their users' needs, keeping the user experience simple and engaging. Active reports can beconsumed by users who are offline, making them an ideal solution for remote users such as the salesforce.
Active reports are an extension of the traditional IBM Cognos report. You can leverage existing reportsand convert them to active reports by adding interactive behavior, providing end users with an easy-to-consume interface.
Like existing IBM Cognos reports, you can execute active reports from the Cognos Analytics portal as wellas schedule and burst them to users.
You build active reports with the same objects that you use to build other report types. However, thereare objects that are specific to active reports. These objects fall into two categories:
• active report controls• active report variables
For tips about building active reports, see the Business analytics proven practices page (http://www.ibm.com/developerworks/analytics/practices.html).
Note: Cognos Active Report does not support JavaScript.
Active Report ControlsYou use active report controls to create the layout of an active report as well as filter, sort, and navigatethrough data in the report.
Layout
The following controls are used to build the layout of an active report:
• Tab controls, which are used for grouping similar report items.• Decks of cards, which are used for layering report items.• Hiding or showing list columns, which allows users to control the data they see by using check boxes.• Row numbers, which show the number of rows of data in a control.
Filtering and Sorting
To help report authors deliver the content in the most consumable way possible, IBM Cognos Analytics -Reporting provides several new filtering controls:
• List and drop-down list controls• Interactions with charts
For example, clicking a category in a chart filters the data in a list.• Radial buttons• Check boxes• Toggle buttons• Push button controls

Navigation
To help users navigate through data in a report, report authors can add the following controls:
• Iterators• Sliders
Data Containers
Data containers, such as lists, crosstabs, charts, visualizations, and repeater tables, are also consideredcontrols in an active report, as you can add interactive behavior to them.
Related conceptsAdding Controls to a Report
Active Report VariablesActive report variables work in conjunction with active report controls to add interactivity to a report.
Actions performed on a control, such as selecting an item in a control or selecting a control itself, can setthe value of a variable. In turn, controls can respond to changes in the value of a variable, such as filteringdata in a control.
Related tasksCreate and Manage Active Report Variables
Convert an Existing Report to an Active ReportYou can leverage existing reports by converting them to active reports.
Procedure
1. Open the report that you want to convert.
2. Click the Save icon and click Convert to Active Report.
ResultsIBM Cognos Active Report commands, objects, and properties become available in IBM Cognos Analytics- Reporting. Objects in the report that are not supported in active reports, such as prompt controls inreport pages, are removed.
Specify Active Report PropertiesYou can specify properties for active reports, such as the text that appears in the browser window titlebar, the maximum number of rows that a report can contain, and an access code that users must enter toview a report.
Procedure
1. Click the Show properties icon , click the Select ancestor icon , and then click Report.2. Double-click the Active reports property.3. To specify the title that will appear in the browser window title bar when the report is viewed, under
Window Title, type the title that you want.4. If you want to specify the window title in other languages, do the following:
• Under Window Title, click the ellipsis button.
136 IBM Cognos Analytics - Reporting Version 11.0 : User Guide

• Click the add button .• Select the languages that you want.• In the Language column, click one of the languages that you selected.
• Click the edit button and type the window title for that language.5. In the Window Startup Size box, choose among the available options to specify the size of the
browser window when an active report is viewed.6. In the Maximum query rows box, specify the maximum number of rows of data that the report can
contain.
If the number of rows of data returned when the report is run exceeds this value, an error messageappears, and users will not be able to view the report.
7. If you do not want to compress the MHT file that is produced when the active report is run, clear theCompress the active report output check box.
Compressing the output reduces the size of MHT files so that active reports can support more data andload faster in browsers and mobile devices.
8. If you made changes to the Window Startup Size, Maximum query rows, or Compress the activereport output properties and you want those changes to become the default values when you createnew active reports, click Change defaults.
9. To specify an access code that users will have to enter to view the report, enter the code in the Accesscode box.
You can use any Unicode character in the access code, and there is no limit to the number ofcharacters an access code can contain.
The access code will not be hidden or treated like a password when entered (* will not appear as thecode is entered). Users will have three attempts to enter the correct code, after which the active reportwill shut down. To try again, users have to reopen report.
Note: The access code is a tool to help prevent the unauthorized consumption of an active reportwithin an organization. It is not an enterprise grade security solution.
Adding Interactivity to a ReportYou create an active report by adding interactive behavior to controls in the report. Adding interactivebehavior links controls to each other, allowing an action performed on a control to change the state ofanother control.
Create and Manage Active Report VariablesCreate active report variables to allow controls in a report to interact with each other. Active reportvariables pass information from one control to another control.
About this task
You can also create active report variables when you define connections between controls. However, youmay want to modify these variables, such as changing the name or defining default values.
In addition, active report variables allow active reports inserted in a workspace in IBM Cognos Workspaceto interact with each other. For example, selecting a product line in one active report causes anotheractive report to show the data for the selected product line. In addition, variables allow check boxes andsliders in a workspace in Cognos Workspace to drive active reports in the workspace.
To work in Cognos Workspace, active report variables must meet the following criteria:
• The variables must be public.
When you make a public variable, the variable can be consumed in other IBM Cognos products.
Chapter 8. Active Reports 137

• For active reports to listen to each other in a workspace, each report must have a public variable withthe same name.
• For a Cognos Workspace slider to drive an active report, a range variable must be defined in the activereport.
The data item of the slider and the range variable in the active report must have the same name.
Two variables are used to define the minimum and maximum values of the range variable. The twovariables are used to define the minimum and maximum values of the slider.
Procedure
1. Click the Queries icon and then click the Active Report variables icon .2. Create a variable by following these steps:
a) Click Create a new variable.b) In the Name box, type the name of the variable.c) Click the Data Type drop-down menu and click the type of variable that you want to create.d) To make the variable public, select the Public (External) check box.e) If you want to specify a default value for the variable, click Set default values and define or specify
the values that you want.
If you have added a control to the active report, the Variable Values Source drop-down menubecomes active.
To define your own default values, in the Variable Values Source list, click Enter Value(s), and
then click the new icon .
To specify default values that come from a data item in a control, in the Variable Values Sourcelist, click Select Value(s). Specify the control and the data item from which you want to selectdefault values, and then select the values that you want from the Values box.
Tip: Define multiple default values when you want more than one item selected in a control thatallows multiple selections, such as a check box group.
3. To modify an existing variable, right-click the variable and click Edit variable.4. To add a default value, click Set default values.
To change a default value, click the name of the current default value specified for the variable.5. Create a range variable by following these steps:
a) Create the variables that will define the minimum and maximum values of the Cognos Workspaceslider.
The variables must have the number data type.
Tip: Range variables are automatically set as public variables. Do not make the variables that areused to define the minimum and maximum values of the slider public.
b) Click Manage ranges.
c) Click the new icon .d) In the Name box, type the name of the range variable.e) Click the Minimum Variable list and select the variable that will be used to set the minimum value
of the slider.f) Click the Maximum Variable list and select the variable that will be used to set the maximum value
of the slider, and then click OK twice.
Note: If you later delete the minimum or maximum variable, the range variable is also deleted.
138 IBM Cognos Analytics - Reporting Version 11.0 : User Guide

Related tasksDefine a Connection Between Controls
Adding Controls to a ReportIBM Cognos Active Report offers several active report controls. For many controls, two different versionsare available, a static version and a data-driven version.
Use the static version of a control when you want to manually define the values that the control cancontain. Use the data-driven version of a control when you want the values that the control can contain to
come from a data item. You can find active report controls by clicking the Toolbox icon .
When you add a control to an active report, you can convert the control to another type of control that is
compatible. Select the control, click the More icon , and click Convert Control. For example, you canconvert a data drop-down list control to a data iterator control.
Variable Text Items
Use variable text items to insert active report variables in a report. Variable text items are useful toshow the value of a variable when an item in another control is selected. For example, you can use avariable text item as a title for a list that is linked to a drop-down list control. When an item is selectedfrom the drop-down list, the item appears as the title of the list.
Row numbers
The active report row number tool adds row numbers that reflect the visible row number in the report.This is different from the report row number tool, which reflects the server calculated row number.
Static repeater tables
Use static repeater tables and data repeater tables to build a repeating structure of content. Repeatertable controls allow you to create button bars or grids of custom content to control the content thatappears in other controls. In data repeater table controls, the content that appears in the repeater table isdriven by a data item that you insert in the control.
The following image shows a static repeater table when it is inserted in an active report.
Figure 26. Static repeater table control
The data repeater table is the repeater table data container that is available for all report types. The staticrepeater table is available in the Toolbox tab only when you are authoring an active report.
Decks and Data Decks
Use decks and data decks to show different objects and different data respectively based on a selectionin another control. For example, in a deck, clicking a radio button in a radio button group control shows alist object while clicking a different radio button shows a chart object.
The following image shows a deck control when it is inserted in an active report.
Chapter 8. Active Reports 139

Figure 27. Deck control
Decks are composed of cards. In static decks, you define the number of cards in the deck and you insertthe objects that you want in each card. This allows you to create cards that can contain different objects,such as pie chart in one card and a crosstab in another card. In data decks, the cards are defined by adata container or data items inserted in the deck, and a data item determines which card appears.
Tab Controls and Data Tab Controls
Use tab controls and data tab controls to define multiple pages for the same area of a report. In data tabcontrols, the tabs are driven by a data item that you insert in the control.
The following image shows a tab control when it is inserted in an active report.
Figure 28. Tab control
Button Bars and Data Button Bars
Use button bars and data button bars to add a group of push buttons. In data button bars, the buttons aredriven by a data item that you insert in the control.
The following image shows a button bar control when it is inserted in an active report.
Figure 29. Button bar control
In reports, users can click only one button at a time.
Toggle Button Bars and Data Toggle Button Bars
Use toggle button bars and data toggle button bars to add a group of buttons that change appearancewhen pressed. In data toggle button bars, the buttons are driven by a data item that you insert in thecontrol.
The following image shows a toggle button bar control when it is inserted in an active report.
Figure 30. Toggle button bar control
In reports, users can click one or more buttons simultaneously.
Radio Button Groups and Data Radio Button Groups
Use radio button groups and data radio button groups to group a set of buttons that have a commonpurpose. In data radio button groups, the radio buttons are driven by a data item that you insert in thecontrol.
The following image shows a radio button group control when it is inserted in an active report.
140 IBM Cognos Analytics - Reporting Version 11.0 : User Guide
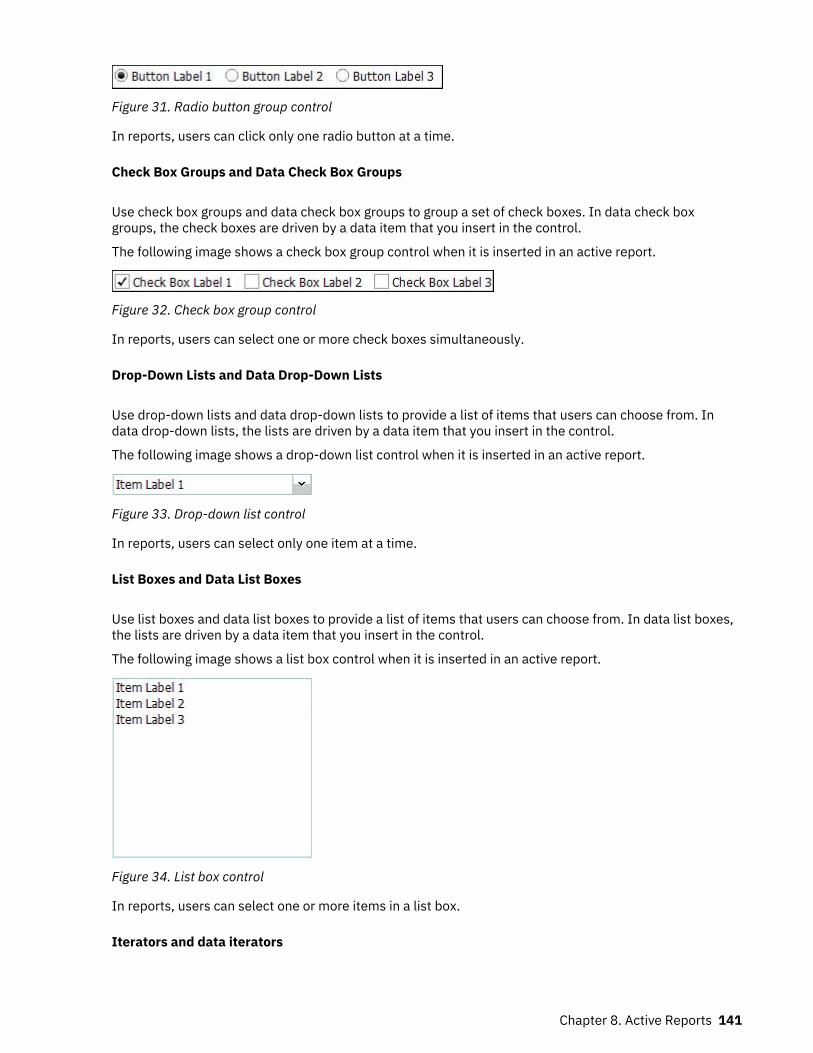
Figure 31. Radio button group control
In reports, users can click only one radio button at a time.
Check Box Groups and Data Check Box Groups
Use check box groups and data check box groups to group a set of check boxes. In data check boxgroups, the check boxes are driven by a data item that you insert in the control.
The following image shows a check box group control when it is inserted in an active report.
Figure 32. Check box group control
In reports, users can select one or more check boxes simultaneously.
Drop-Down Lists and Data Drop-Down Lists
Use drop-down lists and data drop-down lists to provide a list of items that users can choose from. Indata drop-down lists, the lists are driven by a data item that you insert in the control.
The following image shows a drop-down list control when it is inserted in an active report.
Figure 33. Drop-down list control
In reports, users can select only one item at a time.
List Boxes and Data List Boxes
Use list boxes and data list boxes to provide a list of items that users can choose from. In data list boxes,the lists are driven by a data item that you insert in the control.
The following image shows a list box control when it is inserted in an active report.
Figure 34. List box control
In reports, users can select one or more items in a list box.
Iterators and data iterators
Chapter 8. Active Reports 141

Use these controls to allow users to navigate or filter values in a control by clicking buttons such asprevious and next. In data iterators, the iterations are driven by a data item that you insert in the control.
The following image shows an iterator control when it is inserted in an active report.
Figure 35. Iterator control
Discrete values sliders, continuous values sliders, and data discrete values sliders
These controls allow users to navigate or filter data using a slider bar. Discrete and data discrete valuessliders allow users to slide between individual values, such as months. In data discrete values sliders, thevalues are driven by a data item that you insert in the control. With continuous values sliders, users slidethrough numeric values between minimum and maximum values that you define, such as 0 and 100.
The following image shows a discrete value slider control when it is inserted in an active report.
Figure 36. Discrete values slider control
Buttons
Use buttons to add individual push buttons to a report.
The following image shows a button control when it is inserted in an active report.
Figure 37. Button control
Report prompts and iFrames
With these tools, you can use an active report as a prompt to launch and filter target reports, or to launchexternal web pages. Similar to drill-through, links are created from the active report to other reports orexternal web pages. Target reports and external web pages can appear in an iFrame in the currentwindow, or in a separate window or browser tab.
The Report prompts tool opens a window where you specify the target report that you want to open. IBMCognos Analytics - Reporting creates the necessary controls and variables.
If you insert an iFrame tool, you must create the necessary controls and variables to launch a targetreport or external web page.
Data Containers
Lists, crosstabs, charts, maps, visualizations, and repeater tables are also controls in an active report, asyou can add interactive behavior to them.
In addition, a list container called a data list is available when you are authoring an active report. Datalists offer better performance than regular lists, because they are run on the client workstation or deviceinstead of on the Cognos server. Data lists are scrollable and have pinned headers. Other features includeapplying a sequence of colors to the list rows, and replacing column values with a microchart.
Related tasksCreating a data list
142 IBM Cognos Analytics - Reporting Version 11.0 : User Guide

Add Data to a ControlFor every control that you insert in a report, you must add the data that you want to appear in the control.
Add data to a data-driven controlFor data-driven controls, you insert data items from the package.
Procedure
1. Click the Data icon , and on the Source tab , drag query subjects or query items to thecontrol.
2. To add an image to the data in the control, drag the appropriate data item to the Icon box.3. If the data that will appear in the control depends on other data that you do not want to show, drag the
appropriate data item to the Extra Items box.
For example, you add Product type to a data list box control and you want to filter the product typesthat appear in the control based on a product line selected in another control. To filter the data, youmust drag Product line to the Extra Items box.
Tip: IBM Cognos Analytics - Reporting can automatically copy data items from other controls whenyou create connections between controls.
4. If the control is a data deck and you want to create a default card that will appear when no other card
matches the variable value passed to the deck, select the deck, click the Show properties icon ,and navigate to the properties of the deck. Click Yes for the Show Default Card property, and thenclick the Current Card property and select (Default). Insert the objects that you want to appear on thedefault card.
Related tasksDefine a Connection Between Controls
Add data to a static controlFor static value driven controls, you manually define the data in a data table.
Procedure
1. In the report, click the definition icon of the control.
Tip: The definition icon is visible only when the visual aid Show Interactive Object Controls isenabled.
2. To add a new object, such as a card in a deck or a button in a button bar, under Data Table, click thenew button.
3. In Data Table, define the values that you want to appear in the control.
Values are organized by data item. In addition to the default data item (Label) and values provided, youcan create your own data items and values. For example, to add an icon to each value, you must createa data item for the icons.
• To define a new data item, click the new button and type the name of the data item that youwant to create.
• Click inside each table row and type the name of the value.• To add translations for the values, to support users in multiple languages, click the ellipsis button,
choose the languages that you want to support by clicking the add button , and type thetranslated text for each language added.
• If you created new data items, in the Definition box, click the Label drop-down list and select thedata item that you want to use in the control.
Chapter 8. Active Reports 143

• To add an icon to each value, select the Icon check box, click the drop-down list, and select the dataitem that contains the icons that you want to use.
You cannot add an icon to values in static decks and discrete values sliders. To add an icon to values
in a static repeater table, insert the Image object from the Toolbox pane . Then specify the dataitem for the icons by referencing the data item in the Properties pane.
4. Optional: If you want to copy all data values to another static control, click the copy control definition
icon .
After you have copied the data values of the control, click the definition icon of another static control,
and then click the paste control definition icon to copy the data values.
Tip: You can also drag data items from one control and drop them in another control. This actionmoves the data item from one control to another control instead of copying the item. You can drag anddrop data items only to static controls that can contain objects, such as a deck, tab control, andrepeater table. In addition, the data table of the target control must contain a data item with the samename as the data item you are moving, such as Label.
5. If the control is a deck, click the arrows to navigate to each card of the deck and insert the objects thatyou want to appear on each card.
To create a default card that will appear when no other card matches the variable value passed to the
deck, click the Show properties icon , and navigate to the properties of the deck. Click Yes for theDefault Card property, and then click the Current Card property and select (Default). Insert theobjects that you want to appear on the default card.
Related tasksReferencing data items defined in a static control
Referencing data items defined in a static controlIf you insert an object in a static control, such as an image in a static repeater table, you can use a dataitem in the control to populate the object.
Before you begin
You must create the data item in the data table of the control before you can reference the item.
About this task
You can reference data items only for text items, images, hyperlinks, and HTML items inserted in decks,tab controls, and repeater tables.
Procedure
1. In the static control, click the object for which you want to reference a data item.
2. Click the Show properties icon , and in the Properties pane, click the Source type property andchoose Control data item value.The Control data item value property appears.
3. Click the Control data item value property and select the data item that you want to reference.
Tip: If the object is a hyperlink, you can specify the data item to be used to populate the hyperlink textas well as the data item to be used to populate the URL of each link.
Related tasksAdd data to a static control
144 IBM Cognos Analytics - Reporting Version 11.0 : User Guide
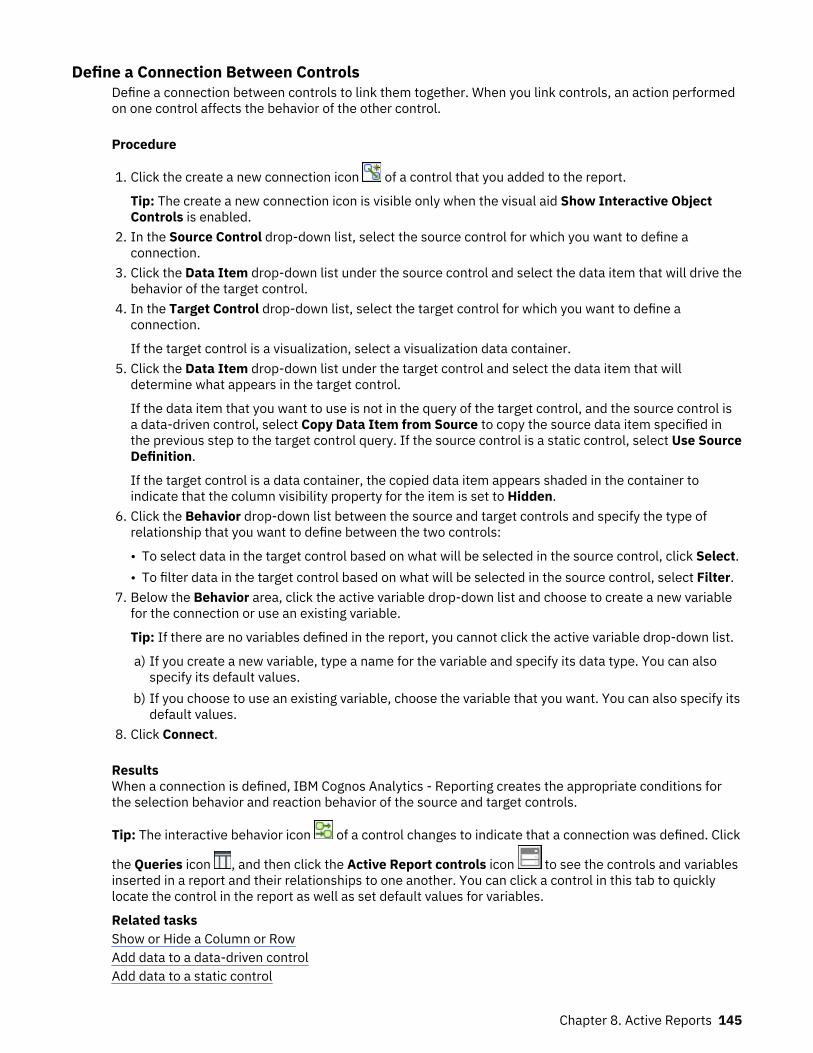
Define a Connection Between ControlsDefine a connection between controls to link them together. When you link controls, an action performedon one control affects the behavior of the other control.
Procedure
1. Click the create a new connection icon of a control that you added to the report.
Tip: The create a new connection icon is visible only when the visual aid Show Interactive ObjectControls is enabled.
2. In the Source Control drop-down list, select the source control for which you want to define aconnection.
3. Click the Data Item drop-down list under the source control and select the data item that will drive thebehavior of the target control.
4. In the Target Control drop-down list, select the target control for which you want to define aconnection.
If the target control is a visualization, select a visualization data container.5. Click the Data Item drop-down list under the target control and select the data item that will
determine what appears in the target control.
If the data item that you want to use is not in the query of the target control, and the source control isa data-driven control, select Copy Data Item from Source to copy the source data item specified inthe previous step to the target control query. If the source control is a static control, select Use SourceDefinition.
If the target control is a data container, the copied data item appears shaded in the container toindicate that the column visibility property for the item is set to Hidden.
6. Click the Behavior drop-down list between the source and target controls and specify the type ofrelationship that you want to define between the two controls:
• To select data in the target control based on what will be selected in the source control, click Select.• To filter data in the target control based on what will be selected in the source control, select Filter.
7. Below the Behavior area, click the active variable drop-down list and choose to create a new variablefor the connection or use an existing variable.
Tip: If there are no variables defined in the report, you cannot click the active variable drop-down list.
a) If you create a new variable, type a name for the variable and specify its data type. You can alsospecify its default values.
b) If you choose to use an existing variable, choose the variable that you want. You can also specify itsdefault values.
8. Click Connect.
ResultsWhen a connection is defined, IBM Cognos Analytics - Reporting creates the appropriate conditions forthe selection behavior and reaction behavior of the source and target controls.
Tip: The interactive behavior icon of a control changes to indicate that a connection was defined. Click
the Queries icon , and then click the Active Report controls icon to see the controls and variablesinserted in a report and their relationships to one another. You can click a control in this tab to quicklylocate the control in the report as well as set default values for variables.
Related tasksShow or Hide a Column or RowAdd data to a data-driven controlAdd data to a static control
Chapter 8. Active Reports 145

Specify the Selection Behavior of a ControlSpecify the selection behavior of a control to determine what interactive behavior should occur when thecontrol is clicked or when an object in the control, such as a button, check box, or data item, is selected.
Specifying the selection behavior of a control sets the value of active report variables defined in thereport. The active report variable values are then used to specify the reaction behavior of controls. Forexample, you add two drop-down list controls to a report and you create a connection between them. Thefirst drop-down list shows product lines and the second drop-down list shows product types. When aproduct line is selected in the first drop-down list box, you want to pass that information to the seconddrop-down list box so that it shows only the product types of the selected product line.
You can specify a selection behavior for any control, except for decks and data decks.
IBM Cognos Analytics - Reporting automatically sets active report variable values when you define aconnection between controls. However, you may need to set the value of other variables to specifyadditional interactive behavior.
Procedure
1. Click the interactive behavior icon of the source control.
Tip: The interactive behavior icon is visible only when the visual aid Show Interactive Object Controlsis enabled.
The Report behavior box shows the relationship between the source and target controls when youdefined a connection between the controls. You can specify default values for the variable associatedwith the control by clicking Set default values.
2. In the Behavior on select box, click inside the Set variable values box and then click the edit button
that appears.3. For each active report variable that you want to set as part of the selection behavior of the control,
click the Value drop-down list and select one of the following choices:
• If you want to clear the current value of the variable, click Set to empty.
Tip: Clearing the current value of a variable is useful when you have cascading controls. Forexample, if the parent control is reset to a default value, you want to reset the child control to adefault value as well.
• If you want to specify your own value, click Type in a value and type the value that you want to use.• If you want the variable values to be driven by a data item in the report, click the data item that you
want to use.• If you do not want the variable to be used for the control, click Do not set.
4. To create a new active report variable, click Create a new variable.
Related tasksSpecify the Reaction Behavior of a Control
Specify the Reaction Behavior of a ControlSpecify the reaction behavior of a control to determine how a control will react when another control, oran object in the control, is selected.
About this task
You can specify the following reaction behaviors:
• Select an item in a control.
You can specify this reaction behavior for any control, except for single button controls.
146 IBM Cognos Analytics - Reporting Version 11.0 : User Guide

For example, you specify a default value for a variable, and the variable drives a drop-down list control.When the report is run, you want the default value to appear in the control.
You can also specify to select the first or last item in a control by default. For example, an active reportcontains two data radio button groups that are connected to each other. The first data button group isdriven by Product line and the second data button group is driven by Product type. When a user clickson a product line, the product types that belong to the selected product line appear in the second radiobutton group, and you want the first or last radio button in the product type radio button group to beselected.
• Filter data in a control.
For example, you want to filter the product types in a drop-down list control based on the product lineselected in another drop-down list control.
You can specify this reaction behavior for drop-down lists, data drop-down lists, list boxes, data listboxes, radio button groups, data radio button groups, check box groups, data check box groups, lists,and crosstabs.
• Enable a control.
For example, you want to make a control interactive only when a selection is first made in anothercontrol.
You can specify this reaction behavior for any control, except for decks, data decks, tabs, data tabs,lists, crosstabs, charts, and maps.
In addition to these behaviors, you can specify the item to appear when nothing is selected in a listcontrol, hide or show a column, and whether to allow data to be sorted in a list.
IBM Cognos Analytics - Reporting automatically sets the reaction behavior when you define a connectionbetween controls. However, you may want to change the reaction behavior or specify additionalinteractive behavior.
Procedure
1. Click the interactive behavior icon of the control.2. If you want to specify the select an item in a control reaction behavior, and you want to specify to
select the first item or the last item in the control by default, click the Auto Select menu and chooseFirst Item or Last Item.
3. In the Reaction behavior box, click the reaction behavior box that you want, such as Container
selection, and click the edit button that appears.
If a condition is not yet defined, two dialog boxes appear. The second dialog box prompts you to definethe condition expression that you want to use to specify the reaction behavior.
Note: If the reaction behavior that you are setting is Container selection, and you previously clickedan option other than None in the Auto Select menu, defining a condition sets the Auto Select menu toNone. Similarly, if you define a condition in the Container selection box, and you then set the AutoSelect menu to an option other than None, the condition is deleted.
4. In the first Item box, define the left side of the condition expression.
• To use a data item, click the Data Item radio button and then click the item that you want to use.
The data items that are available in the drop-down list depend on the data items that you insertedinto the control.
• To use a static item, click the Value radio button, type the value that you want to use, and thenspecify the value's data type.
The value must be defined as a value of the selected active report variable in the next step.• If you want to set the value of an active report variable to null, click the Empty Variable radio button.
5. Click the Operator drop-down list and select the operator that you want to use.
Chapter 8. Active Reports 147

6. In the second Item box, define the right side of the condition expression.
• To use a value in an active report variable, click the Active Report Variable radio button and thenclick the variable that you want to use.
The variables that are available in the drop-down list depend on the variables that you defined in thereport.
• To use a static item, click the Value radio button, type the value that you want to use, and thenspecify the value's data type.
• To use null as the value, click the Empty Data Item radio button.
Use null as the value to specify the reaction behavior when no data exists for the value selected inthe source control.
7. If you want to apply the condition when no item is selected in the source control, clear the Drop thiscondition if the variable is empty check box.
Clearing the check box can improve performance and prompt users to perform an action. For example,a report contains a list with many rows of data, and the list is filtered by another control. When thecheck box is cleared, no data will appear in the list until an item is selected in the other control.
Related conceptsRecommendation - use master detail relationships when authoring decksRelated tasksSpecify the Selection Behavior of a ControlSet the No Value List ItemShow or Hide a Column or RowSort Data in a List
Set the No Value List ItemSet the no value list item to show a specific item in a control when no value is selected.
For example, a report contains a drop-down list control that contains product lines. You create a no valuelist item named (All) to show all product lines when the report is initially viewed.
Procedure
1. Select the control.
2. Click the Show properties icon , and for the No Value List Item property, click Show.
A text item representing the no value list item appears in the control.3. In the Properties pane for the no value list item, double-click the Label property.4. In the Default text box, type the name of the no value list item.5. To specify the text for other languages, do the following:
• Click the add button .• Select the languages that you want.• In the Language column, click one of the languages that you selected.
• Click the edit button and type the name of the no value list item for that language.• Repeat for all remaining languages.
6. In the Properties pane for the no value list item, click the Position in List property and specify whereyou want the no value list item to appear in the control.
Show or Hide a Column or RowYou can show or hide a column in a list or a column or row in a crosstab when the report is viewed.
148 IBM Cognos Analytics - Reporting Version 11.0 : User Guide

Procedure
1. Click the title of the column or row that you want to show or hide.
2. If the data container is a crosstab, click the Show properties icon , click the Visible property andclick Yes or No.
3. If the data container is a list, click the Show properties icon and double-click the ColumnVisibility property.
4. To make the list column visible when the report is viewed, click the Visible radio button.5. To hide the list column when the report is viewed, click the Hidden radio button.6. To make the list column visible based on a condition, click the Visible based on condition radio
button, click the edit condition button , and specify the condition.
• If you want to specify a value to use for the condition, click the Value radio button, type the value,and in the Data Type drop-down list, select the value’s data type.
• If you want to use null as the value for the condition, click the Empty Variable radio button instead.• Click the Operator drop-down list and select the operator that you want to use for the condition.• In the Active Report Variable drop-down list, select the active report variable that you want to use
for the condition.• If you want to apply the condition when no item is selected in a control that is connected to the list,
clear the Drop this condition if the variable is empty check box.
Sort Data in a ListYou can specify whether users can sort data in a list in the report output.
Procedure
1. Select the column that you want users to be able to sort.
2. Click the Show properties icon , and for the Allow Sorting property, click Yes.
Recommendation - use master detail relationships when authoring decksWhen authoring deck controls in active reports, use master detail relationships to improve performance.
Decks offer greater flexibility in active reports by allowing you to show different objects in each card of adeck. In data decks, the number of cards that are created depends on data items inserted in the deck. Asa result, a data deck can contain many cards, which may reduce performance when the report is run andviewed. For example, if a data deck contains Product line and Years, there can be up to 20 cards in thedeck (five different product lines multiplied by four different years). In addition, filtering data in a datadeck can affect performance when there are many rows of data in the deck.
To improve performance, use a master detail relationship to filter data in a data container inserted in adata deck control. A master detail relationship defined between a data deck and a data container insertedin the deck results in a specific number of cards generated for the deck, which serves as a way to filter thedata in the data container. For example, a data deck contains a list object that has many rows of data, andyou want to filter the list by product line. Creating a master detail relationship between the deck and thelist using Product line produces five cards in the deck, one for each product line. When you filter byproduct line, the appropriate card appears in the data deck.
In addition, specify Select as the behavior instead of Filter when defining the connection between thedata deck control and the control you want to use to filter the data in the deck.
Tip: If the data container in the data deck is a chart, you must use a master detail relationship if you wantto filter data in the chart.
Chapter 8. Active Reports 149

Creating a data list
Create a data list to provide better performance in active reports that contain a large data set that ispresented in a list format.
About this task
Data lists provide better performance than regular lists because they are rendered on the clientworkstation or device and not on the IBM Cognos server. Data lists include the following features:
• The list headers are pinned.• The list is scrollable.• You can apply a sequence of colors to the rows.• You can substitute numeric values in a column that are between -1 and 1 with a microchart.
You add or modify features by accessing the properties of the data list or a column in the list.
Procedure
1. Click the Toolbox icon , expand the Data Container group, and drag Data list to the report.
2. Click the Data icon and add the data items that you want to the list.The data items appear in the data list flyout, in the appropriate section (Categories, Values).
3. To add extra data items to the list, add the data items that you want to the Extra Categories or ExtraValues sections in the flyout.
Extra items are items that are used for filtering or setting variables. Extra items do not appear in thedata list.
Tip: You can move items from the data list flyout to the list. In the flyout, you can move items from onesection to another section. For example, you can move an item in the Categories section to the ExtraCategories section.
4. To modify data list properties, select the entire data list and click the Show properties icon .5. To change the order of extra data items in the data list query, click the Nesting order property.
You might have to change the nesting order so that extra items are ordered properly in the query. Ifthe items are not ordered properly, the report might not run.
a) Change the order of items as needed.b) If you want the order of items to correspond to the order of the list columns, select the Keep list
columns synchronized check box.6. To replace numeric values in a column with a microchart, select the column and click the Microchart
property.a) Click the Type menu and select the type of microchart that you want to add.
The Colored option produces a microchart that shows a different color for positive, negative, orzero values. The Sized option produces a microchart of different colors and sizes, based on thecolumn values. The HTML option shows HTML that you author.
Note: The HTML option is available only if you have the HTML Items in Report subcapabilityenabled. In IBM Cognos Administration, this subcapability is found within the Report Studiocapability.
b) If you selected the Colored or Sized option, select the check boxes of the values for which youwant to show a microchart, and then specify the type of microchart that you want to show and thecolor.
150 IBM Cognos Analytics - Reporting Version 11.0 : User Guide

c) If you selected the Sized option, select the Animate check box to produce an animation effectwhen users interact with the list.
7. To specify a different label for a column, select the column heading and set the Override Labelproperty to Yes, and then specify the label that you want in the Label property that appears.
Formatting an active report in the preview viewIBM Cognos Active Report has a preview view that you can use to format an active report and immediatelysee the layout changes. You no longer have to run the report whenever you make a formatting change.
About this task
In the Active Report preview view, you can toggle between two different modes. To format elements inthe report, you must enter the edit mode. When you are in the edit mode, a dotted blue square appearswhen you hover over a selectable element in the report. You click an element to select it, after which youcan format the element by modifying properties in the Properties pane. When you enter the Previewmode, you can test active report behavior by clicking elements in the report.
You can also make non-formatting changes to the report. When a non-formatting change is made, amessage appears that notifies you that you must refresh the report. The report is refreshed when you
click OK. You can also refresh the report by clicking the Refresh icon .
You can view the report in different screen sizes and orientation. Changing the screen size provides aguideline as to how the report will look on screens of various sizes. When you change the screen size, theActive Report preview view shows the report at the size that you specified. On a mobile device, the IBMCognos Mobile application zooms out the report to fit the width of the mobile device screen, eliminatingthe need for horizontal scrollbars.
Procedure
1. To enter the active report preview mode, click the Page views icon and then click Page preview.2. To enter the edit mode, in the toolbar, click the Edit icon.3. In the edit mode, format the elements in the report that you want.4. To enter the preview mode, in the toolbar, click the Preview icon.5. To view the report in different screen sizes, in the toolbar, click the Fit to screen menu and choose one
of the preset sizes, or click Add custom size to specify your own screen size.6. If you specified a screen size in the previous step, click the Orientation menu to change the report
orientation.
Related conceptsWork in design, structure, or preview view
Summarizing Data in the Active Report OutputYou can add an output summary to a list or crosstab control that reflects the data that appears in thecontrol when an active report is viewed.
About this task
You can add two types of summaries to an active report. The summaries that you can add to regularreports are also available in active reports. Output summaries are specific to active reports. Outputsummary values are calculated from the data that users see in the output. For example, an active reportcontains a check box group control and a list control. You add two summaries to the list. The firstsummary is the aggregation method Total that is available in all reports. The second summary is theoutput summary Total that is available only in active reports. The data that users see in the list is filtered
Chapter 8. Active Reports 151
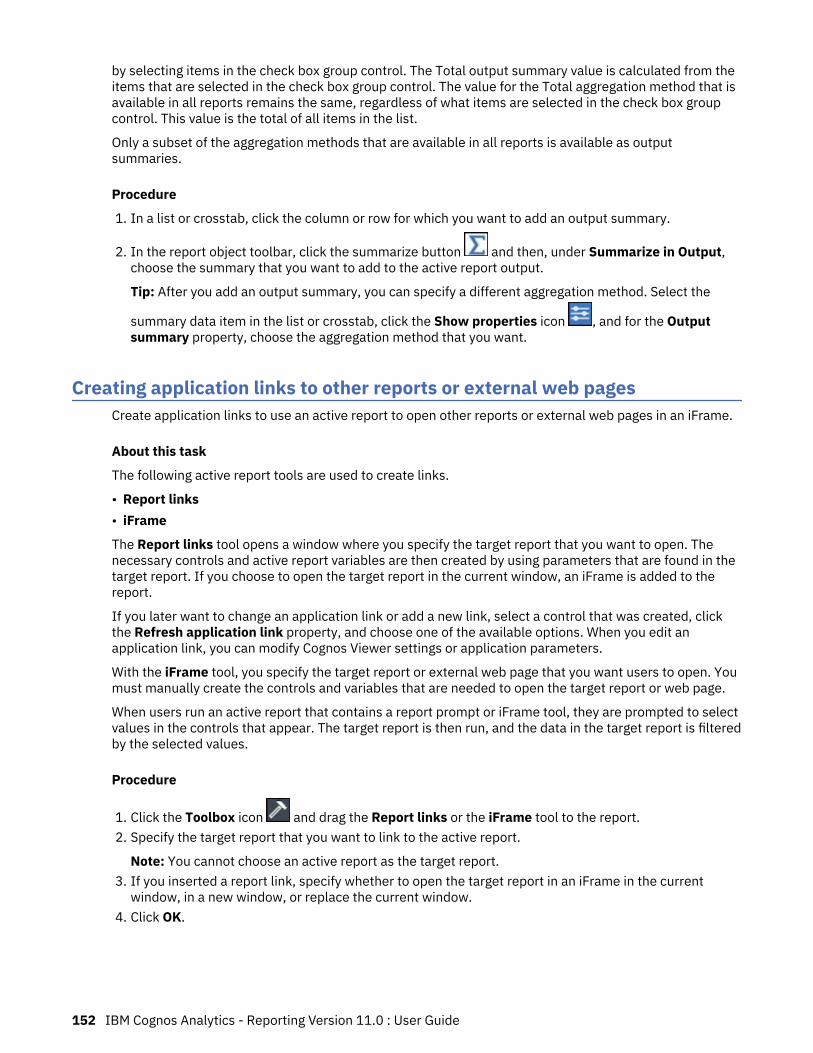
by selecting items in the check box group control. The Total output summary value is calculated from theitems that are selected in the check box group control. The value for the Total aggregation method that isavailable in all reports remains the same, regardless of what items are selected in the check box groupcontrol. This value is the total of all items in the list.
Only a subset of the aggregation methods that are available in all reports is available as outputsummaries.
Procedure
1. In a list or crosstab, click the column or row for which you want to add an output summary.
2. In the report object toolbar, click the summarize button and then, under Summarize in Output,choose the summary that you want to add to the active report output.
Tip: After you add an output summary, you can specify a different aggregation method. Select the
summary data item in the list or crosstab, click the Show properties icon , and for the Outputsummary property, choose the aggregation method that you want.
Creating application links to other reports or external web pagesCreate application links to use an active report to open other reports or external web pages in an iFrame.
About this task
The following active report tools are used to create links.
• Report links• iFrame
The Report links tool opens a window where you specify the target report that you want to open. Thenecessary controls and active report variables are then created by using parameters that are found in thetarget report. If you choose to open the target report in the current window, an iFrame is added to thereport.
If you later want to change an application link or add a new link, select a control that was created, clickthe Refresh application link property, and choose one of the available options. When you edit anapplication link, you can modify Cognos Viewer settings or application parameters.
With the iFrame tool, you specify the target report or external web page that you want users to open. Youmust manually create the controls and variables that are needed to open the target report or web page.
When users run an active report that contains a report prompt or iFrame tool, they are prompted to selectvalues in the controls that appear. The target report is then run, and the data in the target report is filteredby the selected values.
Procedure
1. Click the Toolbox icon and drag the Report links or the iFrame tool to the report.2. Specify the target report that you want to link to the active report.
Note: You cannot choose an active report as the target report.3. If you inserted a report link, specify whether to open the target report in an iFrame in the current
window, in a new window, or replace the current window.4. Click OK.
152 IBM Cognos Analytics - Reporting Version 11.0 : User Guide

Run or Save an Active ReportYou can run an active report in HTML format or save it as a MIME HTML (MHT) file so that you can sendthe report to your consumers. MHT files are viewable in the Microsoft Internet Explorer or Mozilla Firefoxbrowsers.
Before you begin
If you are using Microsoft Internet Explorer 6.0, you cannot open an active report in MHT format as a file.You can view the report only by using a URL.
If an active report contains an extensible visualization, and you are using Internet Explorer 9 or 10, youmust have Microsoft Silverlight 5 installed on your computer.
About this task
To assist you in resolving problems when you are authoring an active report, a run option that shows thestate of active report variables in the report as you click various controls is available. By default, thisoption is enabled.
Active reports require the same web browser settings as regular reports.
Procedure
1. To disable the run option that can show the state of active report variables when the report is viewed,
click the Run options icon , click Show run options, and clear the Enable right-click debug menucheck box.
2. To run a report, click the Run options icon and click Run Active Report.3. To save a report, click the Run options icon and click Download Active Report, and when prompted,
choose to save the report as an MHT file.
ResultsWhen running a report with the Enable right-click debug menu check box selected, right-clicking in thereport output window allows you to choose to view the active report variables in the report, resetvariables, or print the report.
Tip: The right-click debug menu is not available if you run the report from the IBM Cognos Analyticsportal.
Related conceptsWeb browser settingsRelated tasksDrill-through links in active reports do not work
Chapter 8. Active Reports 153

154 IBM Cognos Analytics - Reporting Version 11.0 : User Guide
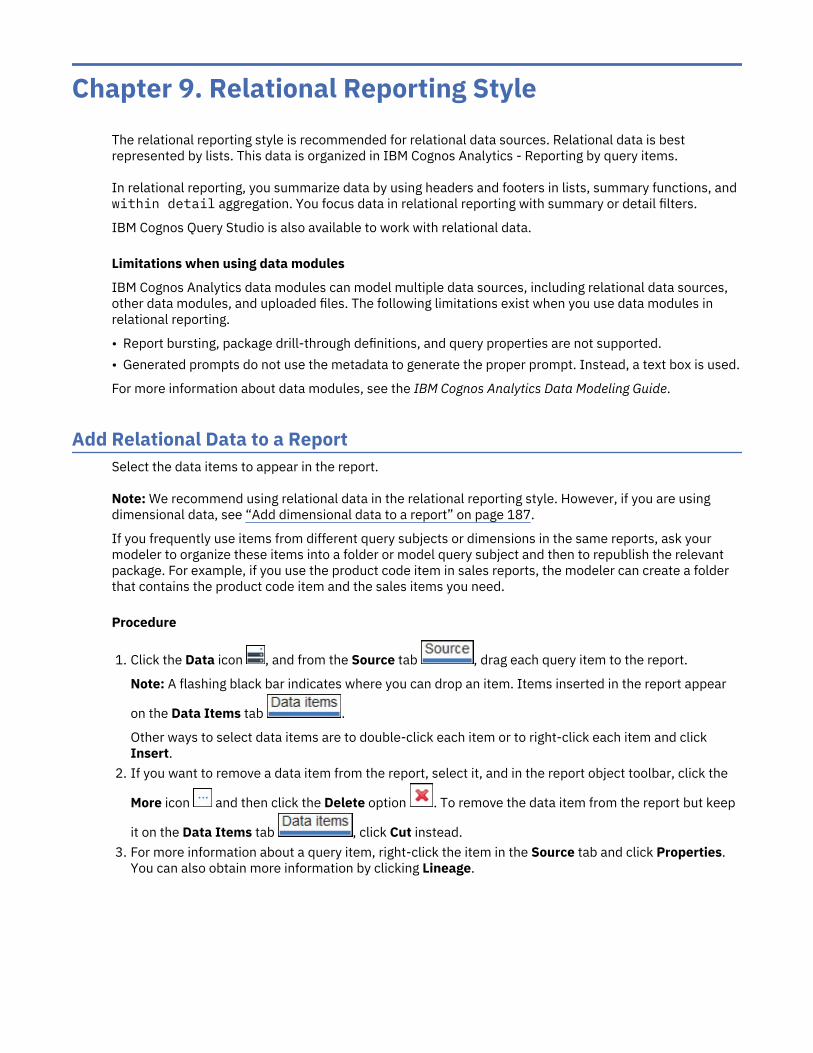
Chapter 9. Relational Reporting StyleThe relational reporting style is recommended for relational data sources. Relational data is bestrepresented by lists. This data is organized in IBM Cognos Analytics - Reporting by query items.
In relational reporting, you summarize data by using headers and footers in lists, summary functions, andwithin detail aggregation. You focus data in relational reporting with summary or detail filters.
IBM Cognos Query Studio is also available to work with relational data.
Limitations when using data modules
IBM Cognos Analytics data modules can model multiple data sources, including relational data sources,other data modules, and uploaded files. The following limitations exist when you use data modules inrelational reporting.
• Report bursting, package drill-through definitions, and query properties are not supported.• Generated prompts do not use the metadata to generate the proper prompt. Instead, a text box is used.
For more information about data modules, see the IBM Cognos Analytics Data Modeling Guide.
Add Relational Data to a ReportSelect the data items to appear in the report.
Note: We recommend using relational data in the relational reporting style. However, if you are usingdimensional data, see “Add dimensional data to a report” on page 187.
If you frequently use items from different query subjects or dimensions in the same reports, ask yourmodeler to organize these items into a folder or model query subject and then to republish the relevantpackage. For example, if you use the product code item in sales reports, the modeler can create a folderthat contains the product code item and the sales items you need.
Procedure
1. Click the Data icon , and from the Source tab , drag each query item to the report.
Note: A flashing black bar indicates where you can drop an item. Items inserted in the report appear
on the Data Items tab .
Other ways to select data items are to double-click each item or to right-click each item and clickInsert.
2. If you want to remove a data item from the report, select it, and in the report object toolbar, click the
More icon and then click the Delete option . To remove the data item from the report but keep
it on the Data Items tab , click Cut instead.3. For more information about a query item, right-click the item in the Source tab and click Properties.
You can also obtain more information by clicking Lineage.

Group Relational DataGroup data items in a list report to remove duplicate values. For example, you have a report that shows allthe products purchased and their product type. You group the Product type column so that each producttype cell spans the products purchased cells.
You can specify whether grouping a column automatically makes it the first column in the list by selectingthe Automatic group and summary behavior for lists check box in the IBM Cognos Analytics - Reportingoptions. With this option selected, if the list contains any fact or measure columns, footers that show thesummary values for the columns are automatically created for each group. Grouping a second columnmakes it the second column. When you ungroup a column, that column becomes the first column afterthe grouped column.
After a column is grouped, you can move it elsewhere in the report.
You can also group data items in repeaters and in page sets.
In addition to grouping, you can specify the sort order of data items. In lists, you can sort data itemswithin groups as well as ungrouped items. In crosstabs, you can sort row and column items. For moreinformation, see “Perform Advanced Layout Sorting” on page 173.
Tip: The Succession Report sample report in the GO Data Warehouse (analysis) package includesgrouping.
Procedure
1. Click the column on which to group.
You can click either the column title or one of the column cells.
Tip: To perform multiple groupings at once, use Ctrl+click or Shift+click.
2. In the report object toolbar, click Group/Ungroup .
ResultsA symbol appears indicating that the column is grouped. You can control when its values appear bysetting the group span, and the column appears in the list of headers and footers that you can add to thereport.
Note: Grouping all columns in a list is equivalent to creating a single-edge crosstab.
Perform Advanced GroupingYou can perform more advanced groupings in a list to get the results you want.
For example, you can
• view the entire grouping structure and make changes to the grouping order• group a data item that appears in a query but not in the layout• specify a list of properties for a group
You can also perform advanced sorting.
Procedure
1. Click a column in the list.
2. Click the Show properties icon , click the Select ancestor icon in the title bar of theProperties pane, and click List.
Tip: You can also click the container selector (three orange dots) of the list to select it.3. In the Properties pane, double-click the Grouping & Sorting property.
156 IBM Cognos Analytics - Reporting Version 11.0 : User Guide

4. To change the grouping order, in the Groups pane, click the grouped item in the Groups folder anddrag it to the grouping hierarchy.
5. To create a new grouping, in the Data items pane, click the data item and drag it to the Groups folderin the Groups pane.
6. To specify a list of data items for a group, do the following:
• Click the group.
Tip: Click Overall to specify a list of data items for the overall group. The overall group is thegrouping of all data into one group. You can specify a list of data items for the overall group to addoverall totals to the list.
• Click the properties button .• Select the appropriate check boxes.
Creating relational custom groupsCreate custom groups to classify existing data items into groups that are meaningful to you.
You can use custom groups to convert numeric values into broader categories. For example, you canbreak down sales results into low, medium, and high categories. Or you can reduce the number of valuesinto a smaller, more meaningful groups. For example, you can change a list of employees into separateteams or departments.
When you create custom groups in a list, a new column is added to the report, with the name data item(Custom). You can use this new column to group or sort the report. If you want to show only the newgroups, you can delete the original column.
Procedure
1. Click the column that you want to group on and, and in the report object toolbar, click the Insert
calculation icon and then click Define Custom Groups.
Tip: You can click either the column heading or one of the column cells.
2. Click the New Group Entry icon .3. To group by values that you select, click New Select Values Group, type a New group name, select
the required values from the Values box, and move the values to the Selected values box.4. To group by a range of values, click New Range Group, type a New group name, and enter the From
and To values.5. If you do not want a group name to appear for remaining values, select Do not show remaining
values. Clicking this option will produce empty cells for remaining values.6. If you want the group name for remaining values to match each value, select Use each remaining
value as a group name.7. If you want to specify your own group name for all remaining values, select Group remaining values
into a single group and type the name that you want.8. If you are adding custom groups in a list, under New data item name, select either the default data
item name or type a new data item name.
Set the Group Span for a ColumnWhen columns are grouped, you can choose how often to show column names by changing the groupspanning.
For example, when country or region and city are both grouped, you can choose to show the country orregion name each time
• the country or region changes, by spanning Country or Region by Country or Region• the city changes, by spanning Country or Region by City
Chapter 9. Relational Reporting Style 157

• there is a new record, by specifying no spanning
Spanning one grouped column by another column is helpful if the second column contains many items.
Procedure
1. Click the column that will span the other column(s).
2. Click the Show properties icon , and In the Properties pane, set the Group span property to thecolumn to span.
Divide data into sectionsCreate sections in a report to show a data item as the heading of a section. When you run the report,separate sections appear for each value.
Creating sections is similar to creating headers by grouping on a data item The difference is that sectionheaders appear outside the list, crosstab, chart, or repeater. In addition, you can group data items only inlists.
When working with dimensional data, you can also create page layers to show values on a separate pagefor each member.
Procedure
1. Click the column to make a section heading.
2. In the report object toolbar, click the Section/subsection icon .
If the column is in a list or repeater, sections are created without creating a master detail relationship.This can improve performance when running the report.
If the column is in a crosstab or chart, sections are created by using a master detail relationship.
Sections are created, and a section header appears. The data container that contains the column usedto create sections is embedded in a list.
3. To add or remove section headers and footers, from the report object toolbar, click the More icon ,click Headers & footers > List headers & footers, and then select or clear the appropriate checkboxes.
The section header and footer check boxes appear under Overall header.
Remove SectionsYou can remove sections and reinsert the data item that was used to create the sections in the datacontainer.
Procedure
1. Click the Page views icon and click Page structure.2. Expand the page containing the data container with the section.3. Expand Page body until you see the data container in which you added the section.
The data container is nested in the List column body object of the List object that is created when youadd a section.
4. Drag the data container to Page body.
The data container appears as a node of Page body.5. Delete the List object.6. Click the Page views icon and click Page design.
158 IBM Cognos Analytics - Reporting Version 11.0 : User Guide
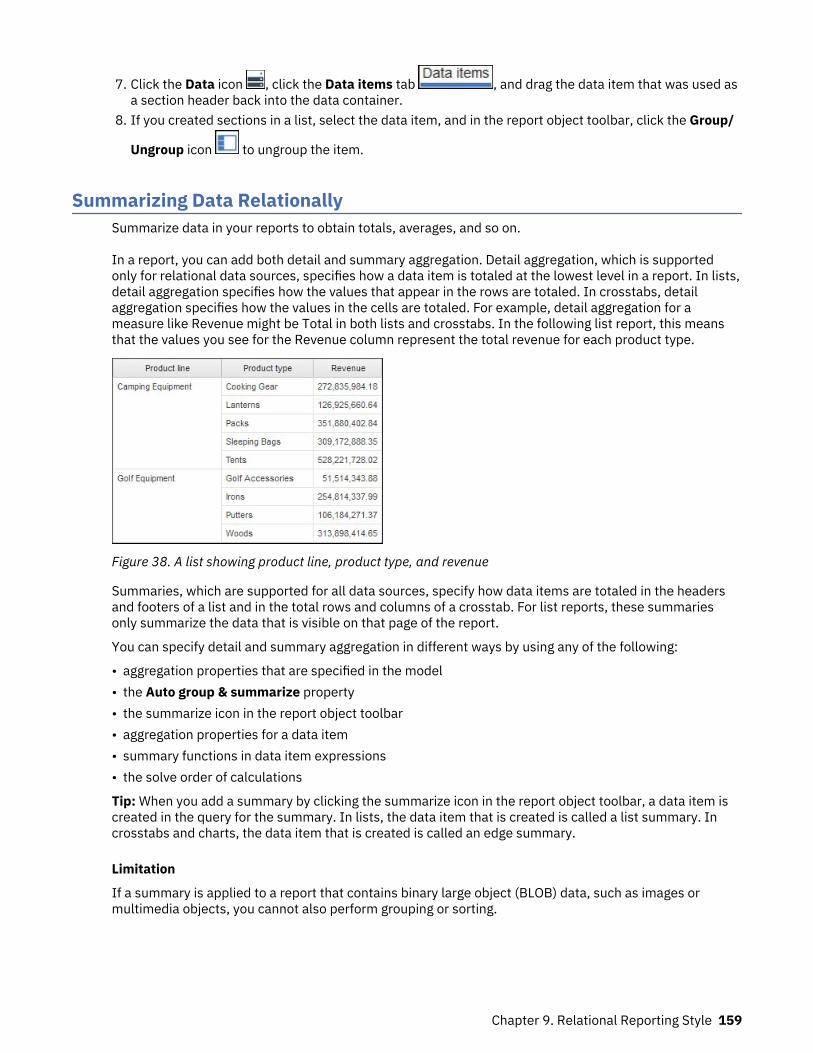
7. Click the Data icon , click the Data items tab , and drag the data item that was used asa section header back into the data container.
8. If you created sections in a list, select the data item, and in the report object toolbar, click the Group/
Ungroup icon to ungroup the item.
Summarizing Data RelationallySummarize data in your reports to obtain totals, averages, and so on.
In a report, you can add both detail and summary aggregation. Detail aggregation, which is supportedonly for relational data sources, specifies how a data item is totaled at the lowest level in a report. In lists,detail aggregation specifies how the values that appear in the rows are totaled. In crosstabs, detailaggregation specifies how the values in the cells are totaled. For example, detail aggregation for ameasure like Revenue might be Total in both lists and crosstabs. In the following list report, this meansthat the values you see for the Revenue column represent the total revenue for each product type.
Figure 38. A list showing product line, product type, and revenue
Summaries, which are supported for all data sources, specify how data items are totaled in the headersand footers of a list and in the total rows and columns of a crosstab. For list reports, these summariesonly summarize the data that is visible on that page of the report.
You can specify detail and summary aggregation in different ways by using any of the following:
• aggregation properties that are specified in the model• the Auto group & summarize property• the summarize icon in the report object toolbar• aggregation properties for a data item• summary functions in data item expressions• the solve order of calculations
Tip: When you add a summary by clicking the summarize icon in the report object toolbar, a data item iscreated in the query for the summary. In lists, the data item that is created is called a list summary. Incrosstabs and charts, the data item that is created is called an edge summary.
Limitation
If a summary is applied to a report that contains binary large object (BLOB) data, such as images ormultimedia objects, you cannot also perform grouping or sorting.
Chapter 9. Relational Reporting Style 159

The Type of Data
How data is aggregated also depends on the type of data that you are aggregating. Aggregation rules areapplied differently to facts, identifiers, and attributes. For example, if you aggregate a data item thatrepresents part numbers, the only aggregate rules that apply are count, count distinct, count non-zero,maximum, and minimum. For information about how to determine the type of data that a data itemrepresents, see “Add Relational Data to a Report” on page 155 and “Add dimensional data to a report” onpage 187.
Add a Simple SummaryYou can add simple summaries to the groups in a report by using the summarize icon in the report objecttoolbar. This icon provides a subset of the summary functions available in IBM Cognos Analytics -Reporting. For list reports, a Custom option is also available so that you can add your own summaryfunction in the expression of the data item.
The summarize icon sets the rollup aggregate property for the data item to the selected summary, andplaces the data item into an appropriate footer. A footer is created for each group as well as an overallfooter, unless they already exist.
In lists, the summary appears as a footer. If the column to which you added a summary is grouped, groupand overall summaries appear. In crosstabs and charts, the summary appears as a node.
To change a summary, select it, click the Show properties icon , and in the Properties pane, underData Item, click the Summary property and choose a different function.
In crosstabs, you can add multiple summaries at the same level. For example, you have a crosstab withProduct line as rows, Order year as columns, and Revenue as the measure. For Product line, you can addthe Total summary as a header, which will total all revenue for each order year. You can then add theAverage summary as a footer, which will give the average revenue of all product lines for each order year.
For information about adding a rolling or moving average, see “Rolling and Moving Averages” on page203.
Procedure
1. Click the column to which to add a summary.
2. In the report object toolbar, click the Summarize icon and click a summary type.3. To change the summary label, do the following:
• Click the label.• Click the Show properties icon, and In the Properties pane, under Text Source, set the Source type
property to the source type to define the label.
For example, set it as Data item value to produce a dynamic label for the summary based on dataitem values.
• Set the property under Source type to specify the label.
This property depends on the source type you chose. For example, if you chose Data item value asthe source type, set the Data item value property to the data item to use to define the label.
Set the Auto Group & Summarize PropertySet the Auto group & summarize query property to specify whether IBM Cognos Analytics - Reportingshould group non-fact data items (identifiers and attributes) and apply aggregate functions to aggregatefact data items in lists.
If you are using an OLAP data source, data is always summarized regardless of how this property is set.
160 IBM Cognos Analytics - Reporting Version 11.0 : User Guide
Procedure
1. Click the Queries icon , and click a query.
2. Click the Show properties icon , and in the Properties pane, set the Auto group & summarizeproperty:
• To group non-aggregate fact data items and apply aggregate functions to aggregate fact data itemsin lists, set this property to Yes.
• To render detail rows, set this property to No.
Specify Detail or Summary Aggregation in the ModelWhen working with relational or dimensionally-modeled relational (DMR) data sources, you can use theaggregation properties specified for the query item in the IBM Cognos Framework Manager model insteadof specifying detail or summary aggregation in the report. The model specifies the default summaryfunction for each query item.
Aggregation functions are mapped between data sources, Framework Manager, and IBM CognosAnalytics - Reporting. For more information about specifying aggregation properties in Cognos FrameworkManager, see Modifying how query items are aggregated in the Framework Manager User Guide.
Specify Aggregation Properties for a Data ItemWhen working with relational data sources and list reports, for each data item in a report, you can specifydetail and summary aggregation properties to manage summaries without having to create complex dataitem expressions.
Procedure
1. Click the data item for which to set detail or summary aggregation.
2. Click the Show properties icon , and in the Properties pane, set the Detail aggregation or theSummary aggregation property to a function.
Use Summary Functions in Data Item ExpressionsYou can use summary functions in data item expressions. The summary functions in the expression editorthat have the same name as the summary functions available through the Detail aggregation andSummary aggregation properties operate the same way. For example, in a relational report, setting theDetail aggregation property to Total is the same as changing the expression of the data item to total( [Revenue] ).
In general, report maintenance is easier if the Detail aggregation and Summary aggregation propertiesare used rather than adding summary functions to data item expressions. Use summary functions inexpressions if the required summary is not supported as an aggregate or rollup aggregate property or ifthe complexity of the expression cannot be managed using the data item properties. Add a summaryfunction to a data item expression if one of the following conditions applies:
• The underlying data source is relational, and you want to use database vendor-specific summaryfunctions.
• You want to use summary functions that require more than one parameter, such as percentile.• You require summary expressions that are not available in the aggregation properties, such as a for
clause. You should use for clauses only in relational style reports (list reports).
For example, your report uses Product line, Product type, and Quantity. You want to calculate thepercentage of the parent quantity that is represented by each product type. This requires you to comparethe total quantity for each product type to the total quantity for the parent product line. In other words,your expression requires summaries at different group levels. You use summary functions, such asaggregate, in the data item expression with a for clause to specify the group level as follows:
Chapter 9. Relational Reporting Style 161

[Quantity] / aggregate ([Quantity] for [Product line])
In some cases, you may need a summary that is different from the default. For example, if the defaultsummary for Quantity is total, you can calculate the average as follows:
[Quantity] / average ( aggregate ([Quantity]) for [Product line])
The inner summary gives you the expected Quantity values at the Product Type level, which are thenaveraged to the Product Line level. This two-stage aggregation is required for OLAP data sources andrecommended for relational data sources also.
Why is this necessary? Here's what would happen if you simply averaged Quantity, as follows:
[Quantity] / average([Quantity] for [Product line])
162 IBM Cognos Analytics - Reporting Version 11.0 : User Guide
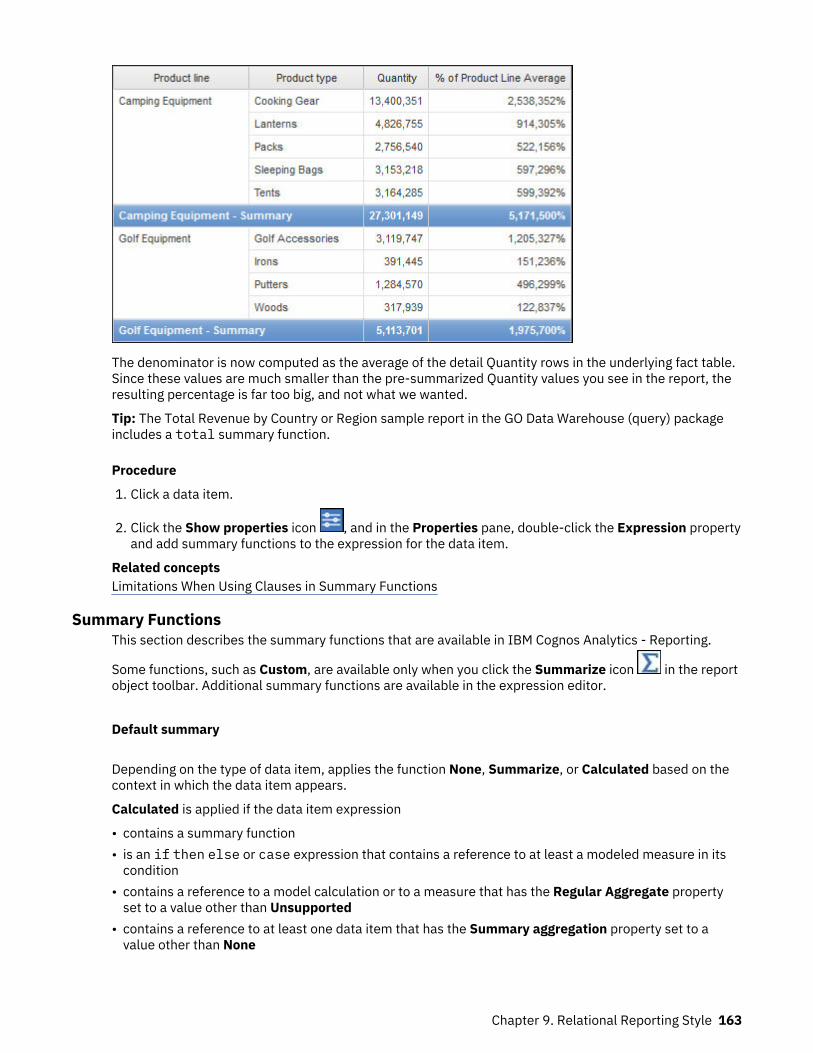
The denominator is now computed as the average of the detail Quantity rows in the underlying fact table.Since these values are much smaller than the pre-summarized Quantity values you see in the report, theresulting percentage is far too big, and not what we wanted.
Tip: The Total Revenue by Country or Region sample report in the GO Data Warehouse (query) packageincludes a total summary function.
Procedure
1. Click a data item.
2. Click the Show properties icon , and in the Properties pane, double-click the Expression propertyand add summary functions to the expression for the data item.
Related conceptsLimitations When Using Clauses in Summary Functions
Summary FunctionsThis section describes the summary functions that are available in IBM Cognos Analytics - Reporting.
Some functions, such as Custom, are available only when you click the Summarize icon in the reportobject toolbar. Additional summary functions are available in the expression editor.
Default summary
Depending on the type of data item, applies the function None, Summarize, or Calculated based on thecontext in which the data item appears.
Calculated is applied if the data item expression
• contains a summary function• is an if then else or case expression that contains a reference to at least a modeled measure in its
condition• contains a reference to a model calculation or to a measure that has the Regular Aggregate property
set to a value other than Unsupported• contains a reference to at least one data item that has the Summary aggregation property set to a
value other than None
Chapter 9. Relational Reporting Style 163

If the underlying data source is relational and if the data item expression contains no summary functionsand a reference to at least one fact that has the Regular Aggregate property set to a value other thanUnsupported, Summarize is applied.
In all other contexts, None is applied.
For relational and dimensionally modeled relational (DMR) data sources, if this function is applied to adata item expression that has the average function, weighted averages are computed based on thelowest level detail values in the data source.
Note: This is the default function.
Average
Adds all existing values and then divides by the count of existing values.
Calculated
Specifies that all the terms within the expression for a data item are aggregated according to their ownrollup rules, and then the results of those aggregations are computed within the overall expression.
For example, a list contains the data item Quantity with the Detail aggregation property set to Total. Youadd a query calculation named Quantity Calculated. You define its expression as Quantity + 100 and youset its Detail aggregation property to Calculated. When you run the report, the values for QuantityCalculated are computed by first adding all values for Quantity and then adding 100 to each value.
Note: In crosstabs, this function overrides any solve orders that are specified.
Count
Counts all existing values.
If the underlying data source is dimensionally modeled relational (DMR), Count behaves as follows if it isspecified in the Detail aggregation or Summary aggregation property for a data item.
Object Behavior
Level Count distinct is used. A warning appearswhen you validate the report.
Member set Count distinct is used. A warning appearswhen you validate the report.
Attribute Supported.
Measure Supported.
If you add the count summary to a non-fact column in a list and then group the column, the column willnot be grouped when you run the report. To resolve this issue, group the column first before adding thecount summary.
Count Distinct
Returns the total number of unique non-null records.
164 IBM Cognos Analytics - Reporting Version 11.0 : User Guide

If the underlying data source is dimensionally modeled relational (DMR), count distinct is supportedfor levels, member sets, attributes, and measures when it is specified in the Detail aggregation orSummary aggregation property for a data item.
Custom
Summarizes data based on an expression that you define.
Maximum
Selects the largest existing value.
Median
Returns the median value of the selected data item.
Minimum
Selects the smallest existing value.
None
Does not aggregate values.
If the underlying data source is relational, the data item is grouped when the query property Auto group& summarize is set to Yes.
Not applicable
This function is available only for the Detail aggregation property. It specifies that the aggregate attributeis ignored. For example, the calculation will be applied after the data is aggregated.
This function differs from the Calculated function, which applies aggregation to the rows and thenperforms the calculation.
For example, for the average ( [Quantity] ) + 5 expression, when the Detail aggregation property is setto Not applicable, five is added to the average of the single Quantity value. When the function is set toCalculated, five is added to the average of a set of numbers.
This setting should not be applied to a simple model reference.
This setting is relevant only for reports that are upgraded from IBM Cognos ReportNet 1.x.
Standard Deviation
Returns the standard deviation of the selected data item.
Note: From a mathematical perspective, this function is not useful for small numbers of items and is notsupported if the query property Auto group & summarize is set to Yes.
Summarize
Aggregates data based on model or data type information. This function can be thought of as a calculateand then aggregate rule. Data is aggregated using the following rules:
Chapter 9. Relational Reporting Style 165

If the underlying data source type is relational and the data item or calculation is a reference to a singlefact query item in the model that has the Regular Aggregate property set to Sum, Maximum, Minimum,Average, or Count, aggregate data using this function. Otherwise, data is aggregated according to thedata type of the data item as follows:
• Total is applied for numeric and interval values.• Maximum is applied for date, time, and date-time values.• Count is applied for everything else.
The underlying data source type can be dimensional and the data item or calculation a reference to asingle item in the model. In this case, if the Regular Aggregate property of the model item is notunknown, the summary function that corresponds to the Regular Aggregate property is applied. If theRegular Aggregate property is unknown, set the function to Calculated.
For example, a list contains the data item Quantity with the Detail aggregation property set to Average.You add a query calculation named Quantity Summarize. You define its expression as Quantity + 100 andyou set its Detail aggregation property to Summarize. When you run the report, the values for QuantitySummarize are computed by first adding 100 to each value for Quantity and then calculating the total.The total is calculated because Quantity contains numeric values and the expression for QuantitySummarize is not a simple data item reference. If Quantity Summarize is defined as Quantity, the functionAverage is applied to each value.
Total
Adds all existing values.
Variance
Returns the variance of the selected data item.
Note: From a mathematical perspective, this function is not useful for small numbers of items and is notsupported if the query property Auto group & summarize is set to Yes.
Mapping Aggregation Functions From Data Sources to Framework Manager and ReportingThe summary functions available in IBM Cognos Framework Manager and IBM Cognos Analytics -Reporting reflect summary functions supported by relational and dimensional data sources. The followingtable shows how summary functions in data sources are mapped to Framework Manager and Reporting.
Data source Framework Manager Reporting
None specified, or none Unsupported None
average (avg) Average Average
count Count Count
count distinct Count Distinct Count distinct
maximum (max) Maximum Maximum
minimum (min) Minimum Minimum
median Median Median
standard deviation (stddev) Standard Deviation Standard Deviation
166 IBM Cognos Analytics - Reporting Version 11.0 : User Guide
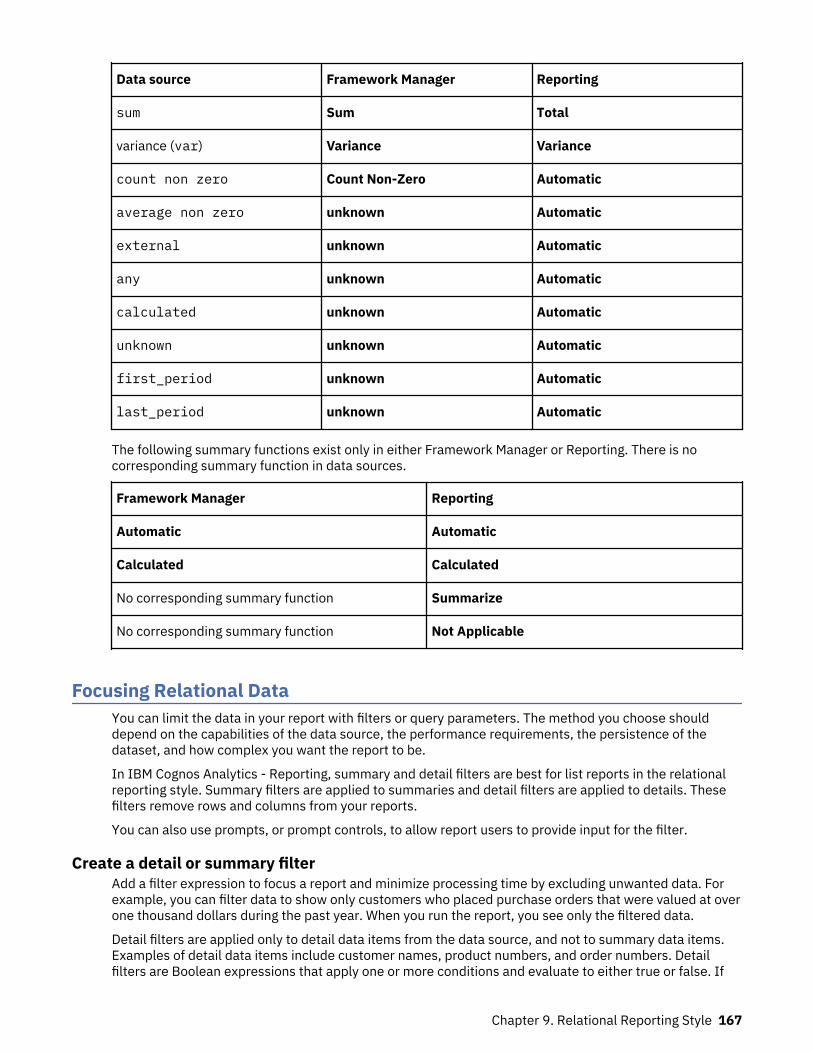
Data source Framework Manager Reporting
sum Sum Total
variance (var) Variance Variance
count non zero Count Non-Zero Automatic
average non zero unknown Automatic
external unknown Automatic
any unknown Automatic
calculated unknown Automatic
unknown unknown Automatic
first_period unknown Automatic
last_period unknown Automatic
The following summary functions exist only in either Framework Manager or Reporting. There is nocorresponding summary function in data sources.
Framework Manager Reporting
Automatic Automatic
Calculated Calculated
No corresponding summary function Summarize
No corresponding summary function Not Applicable
Focusing Relational DataYou can limit the data in your report with filters or query parameters. The method you choose shoulddepend on the capabilities of the data source, the performance requirements, the persistence of thedataset, and how complex you want the report to be.
In IBM Cognos Analytics - Reporting, summary and detail filters are best for list reports in the relationalreporting style. Summary filters are applied to summaries and detail filters are applied to details. Thesefilters remove rows and columns from your reports.
You can also use prompts, or prompt controls, to allow report users to provide input for the filter.
Create a detail or summary filterAdd a filter expression to focus a report and minimize processing time by excluding unwanted data. Forexample, you can filter data to show only customers who placed purchase orders that were valued at overone thousand dollars during the past year. When you run the report, you see only the filtered data.
Detail filters are applied only to detail data items from the data source, and not to summary data items.Examples of detail data items include customer names, product numbers, and order numbers. Detailfilters are Boolean expressions that apply one or more conditions and evaluate to either true or false. If
Chapter 9. Relational Reporting Style 167

the conditions are true for a row of data, the row is retrieved from the data source and appears in yourreport. If the conditions are false, the row is not retrieved and does not appear in your report. You canspecify whether detail filters are applied before or after summaries using the Application property.
Tip: The 2011 Sales Summary sample report in the GO Sales (analysis) package includes a detail filter.
Summary filters are applied to summary data items in a report. They are also Boolean expressions,however they are used to exclude specific groups of data items based on the group summaries. They arebased on summary calculations.
You can combine multiple conditions using AND, OR, and NOT operators. By default, multiple conditionsare combined with an AND operator, which means that all conditions must be met for the filter to takeeffect.
For relational data sources, if a filter expression is used in multiple reports or by different report authors,ask your modeler to create the filter as a standalone object in the model and include it in the relevantpackage. For information about creating filters in the package, see the IBM Cognos Framework ManagerUser Guide.
If you are filtering a multiple-fact query, you should understand the differences between using a detailfilter and summary filter.
If you filter values that are floating-point numbers, you may encounter imprecise filtering results due torounding or data truncation. Floating-point numbers may appear differently in the report than how thanhow they are stored in the data source. To ensure accurate results, your filter criteria should account forany rounding issues.
If you are working with a Microsoft SQL Server 2005 Analysis Services (SSAS) data source, werecommend that you not use OR filters in summaries. Doing so causes error characters (--) to appear insummaries instead of values.
Procedure
1. To add a filter that was already created in the package, click the Data icon , and from the Source
tab , drag the filter to the report.
You must drag the filter to a data container object that is linked to a query, such as a list, crosstab, orchart.
2. To create your own filter, select the item in the report that you want to filter on, and in the toolbar
that appears, click the Filters icon , and then click one of the following options.
• To create a simple filter condition based on only one data item, click Create Custom Filter, andthen go to step 6.
• To create a more complex filter, click Edit Filters.
If more than one query is defined in the report, you must first select a data container object that islinked to a query.
Tip: You can also define filters in Query explorer. Click the Queries icon , and click a query.3. In the Filters dialog box, decide what type of filter to create:
• To add a filter that will apply to detail values, click the Detail Filters tab.• To add a filter that will apply to summary values, click the Summary Filters tab.
4. Click the add button .5. In the Create filter dialog box, decide what conditions to include in the filter:
• To create a simple filter condition based on only one data item, click Custom based on data item,select a data item from the query, and click OK.
• To combine multiple filter conditions, click Combined, and click OK.
168 IBM Cognos Analytics - Reporting Version 11.0 : User Guide

• To create a filter condition that uses advanced calculations, click Advanced, and click OK.6. If you create a simple filter condition based on one data item, do the following:
a) In the Filter condition window, select whether you want to keep or exclude the values that youare going to select.
b) In the values box, choose the values that you want to filter on.
If you are filtering numeric values, click the Comparison tab to create a comparison filter, or clickthe Range tab to create a range filter.
c) If you want to allow report consumers to change the filter when the report is run, select the Canbe changed in the viewer check box.
Note: Report consumers can change the filter only if the report is fully interactive.d) To include missing values, select the Include missing values (NULL) check box.e) To apply the filter to individual records in the data source, select the Apply to individual values in
the data source check box.f) If you want to parameterize the filter so that users are prompted when they run the report, select
the Prompt for values when report is run in viewer check box.
Tip: If you leave the Prompt for values check box selected (the default) and run a report thatcontains the same parameter name that appears in your My parameters panel, you are notprompted to provide a value for the parameter. The system automatically uses the default valuesthat were set for the user’s role. Even if the parameter on the report is optional, the default valuefor the global parameter is passed.
g) Click OK.7. If you create a Combined filter, do the following:
a) In the Create filter dialog box, select the data item for the first filter condition and click OK.b) In the Filter condition dialog box, specify the details for the first condition and click OK.
c) Click the new condition button and, in the Create filter dialog box, select the data item for thesecond filter condition and click OK.
d) In the Filter condition dialog box, specify the details for the second condition and click OK.e) In the Combined filter dialog box, use the AND, OR, and NOT operators to combine the filter
conditions. Select the conditions that you want to combine, and click an operator. To change anoperator, double-click the operator to toggle among available ones or select the operator and thenselect a different one from the list.
f) Click OK.8. If you create an Advanced filter condition, in the Filter expression dialog box, define the filter
expression:
a) To add data items that are not shown in the report, on the Source tab , double-click dataitems.
b) To add data items that are in the report but not necessarily in the model (such as calculations), on
the Data items tab , double-click data items.
c) To add data items from a specific query in the report, on the Queries tab , double-click dataitems.
d) To add functions, summaries, and operators, on the Functions tab , double-click elements.You can insert only functions that return a Boolean value (true or false). For example, you cannotinsert the function topCount because it returns a set of data. Filter expressions must resolve to aBoolean in order to be valid.
Chapter 9. Relational Reporting Style 169

e) To add a value that is derived from a parameter, on the Parameters tab , double-click theparameter. Parameters define prompts, drill-through reports, and master detail relationships.
f) To add a macro, on the Macros tab , double-click the parameter maps, session parameters, ormacro functions you want to add to the macro expression.
Tip: Use Insert macro block to get you started with creating the macro expression. Insert macroblock inserts number signs in the expression. Make sure that the macro expression you create isbetween the number signs.
g) Click the Validate icon and click OK.h) Click OK.
Tip: You can also type the filter expression directly in the Expression Definition box. When typingdate values, use the YYYY-MM-DD format.
For more information about creating expressions, see “Using relational calculations” on page 182.9. In the Usage box, specify whether the filter is required, optional, or not to be used.
10. If you create a detail filter, under Application, click one of the following options:
• To apply the filter to individual records in the data source, click Before auto aggregation.
For example, for a specific product type within a product line, you want to filter out individualorders that generated less than one thousand dollars in revenue.
• To apply the filter to data after the query has grouped and summarized at the lowest level of detail,click After auto aggregation.
For example, you want to filter out the product types that generated less than ten thousand dollarsin revenue within a product line.
For example, you have a list that contains the data items Product line, Product type, and Revenue.The revenue values you see are aggregated to the product type level. If you create a detail filter onRevenue and you choose to filter values before auto aggregation, you are filtering non-aggregatedrevenue values. If you choose to filter values after auto aggregation, you are filtering revenue valuesaggregated to the product type level.
11. If you want to allow report consumers to change the detail filter when the report is run, select theCan be changed in the viewer check box.
12. If you create a summary filter, under Scope, click the ellipsis button and select the grouping level atwhich to apply the filter.
For example, a revenue report is grouped on product line and product type. You can choose to filtertotal revenue for either the product line or product type level.
If the query in which you are creating the summary filter is linked to more than one data container,the data item that you select as the grouping level must be grouped in all data containers linked tothe query. Otherwise, the report will not run successfully.
Tip: To filter at the overall level, do not click a level. For example, if a report has an overall footer thatshows the total revenue for all products, by not choosing a level you will apply the filter to the footer.In addition, if you are using a dimensional data source, excluding a parent level excludes its children,and excluding all children excludes the parent.
13. To show filter text in a report, click a data container to which you added a filter, and in the
toolbar that appears, click the Filters icon , and then click Insert Filter Text.a) Click the filter text block that appears.
b) Click the Show properties icon .c) To specify how to display filter text for detail filters, click the Display detail filter text property
and choose one of the available options.
170 IBM Cognos Analytics - Reporting Version 11.0 : User Guide

d) To specify how to display filter text for summary filters, click the Display summary filter textproperty and choose one of the available options.
14. Repeat step 12 to show filter text for other data containers that are linked to a different query.
Related conceptsLimited and fully interactive reportsReports can run in limited interactivity or full interactivity mode.
Edit or remove a filterAfter you created filters, you can edit or remove them.
Procedure
1. Click a data container object that contains a filter.
2. To remove all filters from the object, in the report object toolbar, click the Filters icon and clickRemove All Filters.
3. To edit a filter or remove a single filter, in the report object toolbar, click the Filters icon and clickEdit Filters.
Tip: You can also edit filters from the Query explorer. Click the Queries icon , and click the querythat contains your filter.
Browse or Search the Values of a Data ItemWhen building expressions in the expression editor, you can browse the data of a data item. This is usefulwhen you do not know how a particular value is stored in the database. For example, you want to filter areport so that it shows data for only New South Wales. The actual value in the database for New SouthWales is NSW, and this is what you must insert in the filter expression to obtain the correct results.
Procedure
1. In the source, data items, or query tab, right-click the data item you want to browse.
2. If you want to insert a single value, click Select Value .
3. If you want to insert multiple values, click Select Multiple Values .4. In the Values box, click the value you want to insert in the expression.
Tip: Use the Keywords box to search for specific values. If you select Use Tab as keyword delimiter,you can add a tab in the Keywords box only by copying and pasting a tab (or the string you want tosearch on with a tab in it), from another application, such as Notepad. If the data source is casesensitive and you want to perform a case insensitive search, click the Search arrow and then clickCase Insensitive.
5. If you clicked multiple values, click the right arrow button to add them to the Selected valuesbox.
6. Click Insert.
Tip: To control where values appear in the Expression Definition box, you can click the copy button
if you selected a single value or the copy all button if you selected multiple values instead. Thevalues are copied to the clipboard, and you can then paste them where you want.
Related conceptsSearching for values might return unexpected results
Chapter 9. Relational Reporting Style 171

Ignoring the Time Component in Date ColumnsDatabase systems use Date, Time, and Timestamp to represent date and time values. While a timestamptype holds a date and time component, an application may allow the RDBMS to default the timecomponent. When rows are inserted, updated, or queried, the application may specify only a date valueand leave the RDBMS to extend the value to include a default time (usually 00:00:00.000).
The challenge with a timestamp is when the application has no immediate interest in the timecomponent. For example, the business question How many orders were taken today? implies all orderstaken irrespective of what time the order was booked. If the application defaulted the time component asit stored rows, the query that was used to answer the question returns the count of orders taken today. Ifthe application stored the actual time component, the query likely returns no data, because the numberof orders entered at midnight is probably zero.
Relying on the time defaults can be dangerous if the application changes and starts to capture actualtimes. To avoid this problem, you can
• truncate the time by creating a derived column• convert the timestamp to a date• create a hi-low filter
Truncating the Time by Creating a Derived ColumnIn the IBM Cognos Framework Manager model, create a derived column using a calculated expressionthat truncates the time from a timestamp, and returns a timestamp containing the original date and adefault time. For example, if you use an Oracle data source, the following expression creates the derivedcolumn DATEONLY from COL1, where COL1 contains the values as stored by the application whileDATEONLY contains the dates with the default time of 12:00:00 AM:
Select COL1,trunc(COL1) as DATEONLY from [SCOTT_TIGER].DATES
Tip: You can change the data format of the column to show only the date value by setting the Date Styleproperty to Short.
You can then apply filters to the DATEONLY column that would return the correct results. If you create aparameter in IBM Cognos Analytics - Reporting that filters on this column, the default prompt will presenta date and time control because the data type is still a timestamp.
Converting the Timestamp to a DateIn the IBM Cognos Framework Manager model, define a calculation that uses the cast function toconvert the timestamp to a date. For example, the following expression converts the data type of thecolumn COL1 to date:
cast ([SCOTT_TIGER].[DATES].[COL1],DATE)
If you create a parameter in IBM Cognos Analytics - Reporting that filters on this calculation, the defaultprompt presents a date control.
Ignoring the Time by Creating a Hi-Low FilterYou can create a hi-low filter to ignore the time. In the IBM Cognos Framework Manager model, create afilter in the form date-column between date-lowtime and date-hightime. For example, the followingexpression returns all values between 00:00:00:000 and 23:59:59:000 for a given day:
[SCOTT_TIGER].[DATES].[COL1] between?p1? and cast(substring(?p1?,1,10),'23:59.59.000',timestamp)
Sorting Relational DataYou can sort items to view them in your preferred order. By default, IBM Cognos Analytics - Reportingretrieves items in the order defined in the data source. OLAP data sources always have a defined order.Relational and dimensionally-modeled relational data sources may not always have a defined order. Thedata modeler defines the sorting options in the model.
172 IBM Cognos Analytics - Reporting Version 11.0 : User Guide
For more information about data modeling, see the IBM Cognos Framework Manager User Guide. Sortingapplied in Reporting applies only to the layout within the report.
You can sort items in a list in ascending or descending order based on a value or a label, such as revenueor employee name. You can also perform advanced sorting to sort columns within groups or to sort a rowor column using another data item.
Tip: The Sales Growth Year Over Year sample report in the GO Data Warehouse (analysis) packageincludes sorting.
Procedure
1. Click the column or row on which to sort.
2. In the report object toolbar, click the Sort icon and click Ascending or Descending.
An arrow appears beside the data item to indicate that a sort order was set.
When you specify a sort order for more than one column, the columns are sorted in the order in whichthey were inserted in the report. For example, you add columns A, B, and C to a report and specify asort order for each. When you run the report, column A is sorted first, then column B, and then columnC. You can change the order in which the columns are sorted in the Edit Layout Sorting options.
Tip: To remove a sort order, click Don't Sort.
Perform Advanced Layout SortingIf you use relational data, in a list, you can sort columns within groups and change the sort order ofcolumns. In a crosstab, you can sort a row or column by another item, such as Order year by Revenue.
Procedure
1. Click a column.
In a crosstab, click the sorted row or column on which to perform advanced sorting.
2. In the report object toolbar, click the Sort icon and click Edit Layout Sorting.3. To sort a list column within a group, do the following:
• In the Groups pane, under the Groups folder, expand the folder of the grouped column.• In the Data items pane, drag the data items to sort to the Sort list folder.
Tip: You can also drag data items from the Detail Sort List folder.
• Click the Sort order icon to specify ascending or descending order.4. To change the sort order of columns, in the Groups pane, change the order of columns in the Sort list
folder of a group or in the Detail Sort List folder.
Tip: Add items to the Detail Sort List folder to sort items that are not groups.5. If you are sorting a crosstab, do the following:
• From the Data items pane, drag the item on which to sort to the Sort List pane.
For example, you have a crosstab with Product line as rows, Order year as columns, and Revenue asthe measure. To sort Order year by Revenue, drag Revenue to the Sort List pane.
• Click the Sort order icon to specify ascending or descending order.
Working with Relational QueriesQueries specify what data appears in the report. In IBM Cognos Analytics - Reporting, you create andmodify queries using Query Explorer.
Chapter 9. Relational Reporting Style 173

Query Explorer provides an alternative way to modify existing reports or to author new reports. You canuse Query Explorer to perform complex tasks and other tasks that are more difficult to do in the reportlayout. For example, use Query Explorer to
• improve performance by changing the order in which items are queried from the database, or bychanging query properties to allow the report server to execute queries concurrently where possible
Note: Only queries that are referenced in the report layout can be executed concurrently. If a query isdefined in Query Explorer by joining two or more existing queries, IBM Cognos Analytics cannot executethe source queries concurrently. By default, queries run sequentially. Your administrator must enablethe concurrent query execution feature. For more information, see the IBM Cognos AnalyticsAdministration and Security Guide.
• view or add filters and parameters and modify their properties• view or add dimensions, levels, and facts• incorporate SQL statements that come from other reports or reports that you write• create complex queries using set operations and joins
Related conceptsQueries
Specify a List of Data Items for an ObjectSpecify the list of data items for an object when you must reference a data item that is in a query but isnot in the layout.
For example, you want to add a layout calculation to a list that uses a data item that is in the querydefinition. If the data item does not appear in the list, you must reference it in order to make the layoutcalculation work. You must also specify the list of data items if you apply conditional formatting that usesa data item that is not in the query.
Procedure
1. Click a layout object.
2. Click the Show properties icon , and in the Properties pane, double-click the Properties propertyand select data items.
Relate a Query to a LayoutQueries and layouts work together. After you decide the type of data that you need, you must create alayout in which to show the results. Each column of data must be both selected for the query and shownin a layout unless there are some columns that you do not want to show. The query and layout portions ofa report must be linked to produce a valid report.
IBM Cognos Analytics - Reporting automatically links query and layout. For example, when you useReporting and the list report layout, query and layout are automatically linked.
Procedure
1. Select a data container.
2. Click the Show properties icon , and in the Properties pane, set the Query property to a query.
3. Click the Data icon , click the Data items tab , and drag data items from the query tothe data container.
Connecting Queries Between Different Data SourcesThis section lists the data sources between which you can and cannot connect queries.
174 IBM Cognos Analytics - Reporting Version 11.0 : User Guide
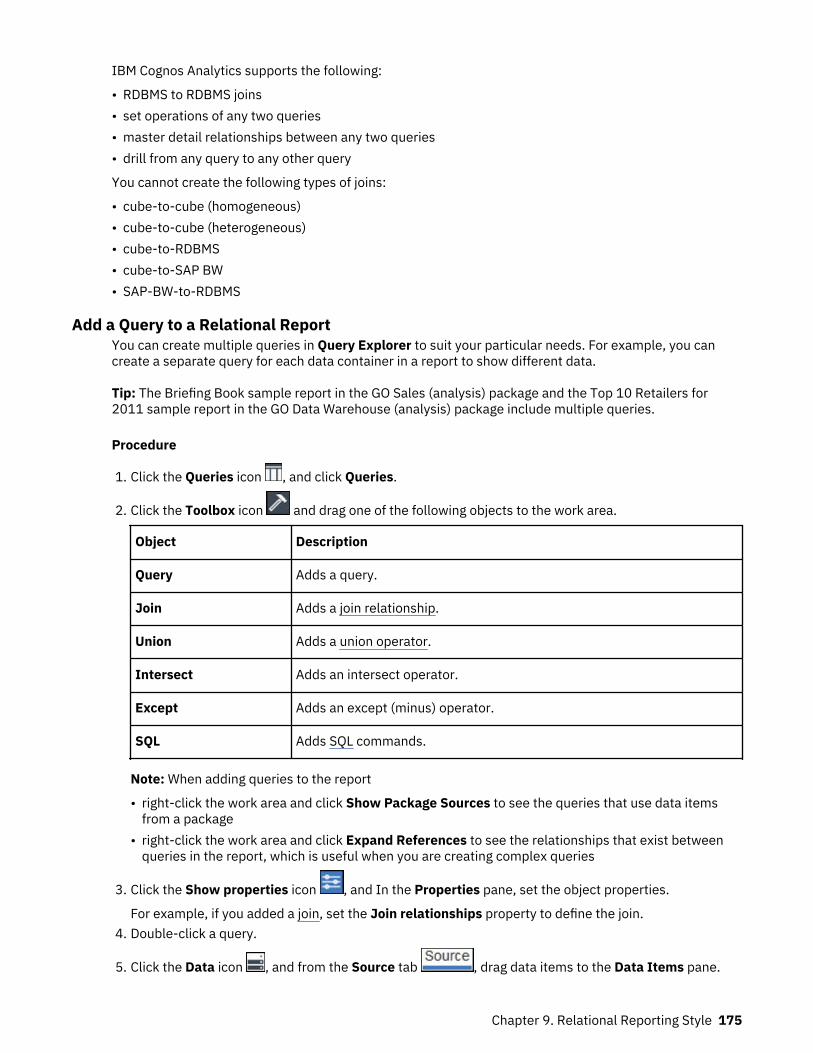
IBM Cognos Analytics supports the following:
• RDBMS to RDBMS joins• set operations of any two queries• master detail relationships between any two queries• drill from any query to any other query
You cannot create the following types of joins:
• cube-to-cube (homogeneous)• cube-to-cube (heterogeneous)• cube-to-RDBMS• cube-to-SAP BW• SAP-BW-to-RDBMS
Add a Query to a Relational ReportYou can create multiple queries in Query Explorer to suit your particular needs. For example, you cancreate a separate query for each data container in a report to show different data.
Tip: The Briefing Book sample report in the GO Sales (analysis) package and the Top 10 Retailers for2011 sample report in the GO Data Warehouse (analysis) package include multiple queries.
Procedure
1. Click the Queries icon , and click Queries.
2. Click the Toolbox icon and drag one of the following objects to the work area.
Object Description
Query Adds a query.
Join Adds a join relationship.
Union Adds a union operator.
Intersect Adds an intersect operator.
Except Adds an except (minus) operator.
SQL Adds SQL commands.
Note: When adding queries to the report
• right-click the work area and click Show Package Sources to see the queries that use data itemsfrom a package
• right-click the work area and click Expand References to see the relationships that exist betweenqueries in the report, which is useful when you are creating complex queries
3. Click the Show properties icon , and In the Properties pane, set the object properties.
For example, if you added a join, set the Join relationships property to define the join.4. Double-click a query.
5. Click the Data icon , and from the Source tab , drag data items to the Data Items pane.
Chapter 9. Relational Reporting Style 175

Tip: You can add data items to the query that you do not want to appear in the layout. For example, tofilter on Product line code and show Product line in the layout, you must add both data items to thequery.
6. To create a new data item, click the Toolbox icon and drag Data Item to the Data Items pane.7. To add a filter, click the Toolbox icon, drag Filter to the Detail Filters or Summary Filters pane and
define the filter expression.
Tip: You can also create a filter by clicking the Data icon, dragging a data item from the Source tab toone of the filters panes, and completing the filter expression.
Create a Union QueryCreate a union query to combine two or more queries into one result set.
You can combine queries that use different data sources. For example, you can combine a query thatreturns data from a dimensional data source with a query that returns data from a relational data source.
Before you begin
To combine two queries, the following conditions must be met:
• The two queries must have the same number of data items.• The data items must have compatible types and appear in the same order.
For numeric data types, integer, float, double, and decimal are compatible.
For string data types, char, varChar, and longVarChar are compatible.
For binary data types, binary and varBinary are compatible.
Date data types must match exactly.
Procedure
1. Click the Queries icon , and click Queries.
2. Click the Toolbox icon , and do the following:
• Drag Query to the work area.• Drag Union, Intersect, or Except to the right of the query.
Two drop zones appear to the right of the operator.• Drag a Query object to each drop zone.
Two queries are created in the work area, and a shortcut to each query appears in the drop zones.3. Double-click each query that makes up the union query and add data items to the query.4. Return to the Queries work area.5. Click the set operator that you added in step 2.
6. Click the Show properties icon , and In the Properties pane, set the Duplicates property toremove or preserve duplicate rows.
7. Double-click the Projection list property.
The projection list shows the list of projected data items for the set operation.8. To automatically produce the list of projected data items, click Automatically generated.
IBM Cognos Analytics - Reporting generates the projection list using only one of the two queries inthe union.
9. To add, delete, move, or rename data items in the projection list, click Manual and make thechanges.
176 IBM Cognos Analytics - Reporting Version 11.0 : User Guide

10. Double-click the union query.
11. Click the Data icon , and from the Source tab , drag data items to the Data Items pane.
ResultsThe union query is complete. You can now link the union query to a data container in the layout.
Create a Join RelationshipYou can create a join relationship to join two queries.
In general, join relationships should be created in the IBM Cognos Framework Manager model. Create ajoin relationship in IBM Cognos Analytics - Reporting if what you are trying to do cannot be modeled inFramework Manager.
Procedure
1. Click the Queries icon , and click Queries.
2. Click the Toolbox icon and do the following:
• Drag Query to the work area.• Drag Join to the right of the query.
Two drop zones appear to the right of the operator.• Drag a Query object to each drop zone.
Two queries are created in the work area, and a shortcut to each query appears in the drop zones.3. Double-click each query that makes up the join query and add data items to the query.4. Return to the Queries work area.5. Click Join.
6. Click the Show properties icon , and in the Properties pane, double-click the Join relationshipsproperty.
7. Click New Link.8. To create the link, click a data item in the left query, and then click a data item in the right query.9. For each query, click Cardinality and click a cardinality option.
10. Click Operator and click an operator.11. To convert the join relationship to an expression, click Convert to expression.
Convert the join relationship to an expression to make changes to the join definition.
Note: After you convert the relationship to an expression, you cannot change it back to a relationship.12. Double-click the join query.
13. Click the Data icon , and from the Source tab , drag data items to the Data Items pane.
ResultsThe join query is complete. You can now link the join query to a data container in the layout.
Reference a Package Item in a Child QueryWhen you create a child query in IBM Cognos Analytics - Reporting, you can only reference items from itsparent or from other queries. For example, if you add a filter to a child query, the only items that you caninsert into the expression are items that exist in other queries defined in the report. To add an item fromthe package, you must unlink the child query from its parent.
Chapter 9. Relational Reporting Style 177

Procedure
1. Click the Queries icon , and click Queries.2. Unlink the child query from its parent by selecting the parent query shortcut to the right of the child
query and pressing the Delete key.3. Double-click the child query.
Items are now available on the Source tab .4. Add items.
For example, to create a detail filter that references a package item, click the Toolbox icon dragthe filter object to the Detail Filters pane, and then add the items in the Expression Definition box.
5. Recreate the link between the child query and the parent query by dragging the parent query to theright of the child query.
6. If necessary, double-click the child query to complete it.
For example, if you created a filter, you may need to complete the filter expression.
Create a Master Detail RelationshipCreate a master detail relationship to deliver information that would otherwise require two or morereports. For example, you can combine a list with a chart. The list can contain product lines and the chartcan show details for each product line.
Master detail relationships must appear in nested frames to produce the correct results. You can create amaster detail relationship in two ways:
• Use a parent frame for the master query and a nested frame for the detail query.• Associate a report page with the master query and use a data container, such as a list or crosstab, for
the detail query.
You cannot display parent data in the child frame or child data in the parent frame. Also, you cannotperform calculations across master detail queries.
You can use a master detail relationship to show data from separate data sources in a single report.However, the data sources must be contained in the same package.
With the dynamic query mode, master detail reports with a crosstab report object are optimized to use asingle query whenever possible, rather than a separate query for each report object instance.
Procedure
1. To use a parent frame for the master query and a nested frame for the detail query:
• Click the Toolbox icon and drag a List, Repeater Table, or Repeater to the report.• Add a second data container to the object you inserted.
You can insert a list, crosstab, chart, repeater table, or repeater into a list. You can add a list to arepeater table or repeater.
• Add data items to both data containers.2. To associate a report page with the master query and use a data container for the detail query:
• Click anywhere in the report page.
• Click the Show properties icon , and In the Properties pane, click the Select ancestor icon and click Page.
• Set the Query property.
178 IBM Cognos Analytics - Reporting Version 11.0 : User Guide

• Click the Toolbox icon and drag a data container to the report.3. To link a data item in the master query to a parameter in the detail query instead of to another data
item, create the parameter in the detail query.
Use parameters to filter values at a lower level in the detail query.
• Click the Queries icon , and double-click the detail query.• Click the Toolbox icon and drag the Filter object to the Detail Filters box.• In the Expression Definition box, create the parameter.
4. Click Pages icon , and click the report page.5. Select the data container containing the details.
6. In the report object toolbar, click the More icon and click Master Detail Relationships.7. Click New Link.8. In the Master box, click the data item that will provide the primary information.9. To link the master query to a data item, in the Detail box, click the data item that will provide the
detailed information.10. To link the master query to a parameter, in the Parameters box, click the parameter that will provide
the detailed information.
Tip: To delete a link, select the link and press the Delete key.11. If your detail query object is a chart, you can disconnect a chart title from the master query.
• Click the chart title, and in the report object toolbar, click the More icon and click Master DetailRelationships.
• Clear the Use the master detail relationships from the chart check box.12. If your master detail relationship includes a chart as the detail and you are using automatic axis
ranges, you can set the same axis range for all the detail charts:
• Select the axis.• In the Properties pane, under General, double-click the Axis range property.• Under Maximum and Minimum, click Automatic.
The master detail report option is only available with automatic axis ranges.• Under Master detail reports, select the Same range for all instances of chart check box.
For more information about axis ranges, see “Change the axis scale of a current default chart” onpage 84.
Tip: To avoid seeing the same data item twice in the report, click the data item in the data containerdriven by the detail query, click the More icon and click Cut. This removes the item from the reportdisplay but keeps it in the query.
Master Detail or Burst Reports with Charts or Crosstabs May Result in Denial of ServiceWhen running a master detail or burst report that includes a chart or crosstab, disk space exhaustion maycause the report or other requests to fail. A large set of burst keys or master rows may produce one ormore charts per detail, resulting in many master detail executions. This may cause the temp folder toaccumulate many gigabytes of temporary files containing data required for successful chart rendering.
To avoid this issue, we recommend that you test large master detail or burst reports that include charts orcrosstabs to determine the potential peak disk requirements for the report.
Working with Queries in SQLFor each query in a report, you can work with the SQL that is executed when you run a report.
You can
Chapter 9. Relational Reporting Style 179

• view the SQL for an entire report or a query• build a report using your own SQL• convert a report to use SQL directly• edit the SQL
When working with a relational data source, the SQL that is produced by IBM Cognos Analytics -Reporting depends on the report output selected.
Note: MDX is not available with relational or DMR data sources.
View the SQL for an Entire Report or a QueryView the SQL to see what is passed to the database when you run a report.
Procedure
1. To view the SQL for the entire report, click the Queries icon , right-click the Report icon , andclick Show Generated SQL/MDX.
This option shows the SQL that will be executed in the data source. The SQL is organized by query andby query result. If a query is used in more than one data container, a query result is generated for eachdata container.
2. To view the SQL for a specific query, do the following:
• Click the Queries icon, and click the query.
• Click the Show properties icon , and In the Properties pane, double-click the Generated SQLproperty.
The Generated SQL property shows the SQL that is executed when you view tabular data (right-clickthe query and click View Tabular Data). Tabular data shows the data that is produced by the query inthe form of a list. You can use this property to help you build advanced queries.
ResultsThe SQL for the query appears in the Generated SQL dialog box. You can choose to view native SQL,which is the SQL that is passed to the database when you execute the query, or IBM Cognos SQL, which isa generic form of SQL that IBM Cognos Analytics - Reporting uses. Cognos SQL is converted to native SQLbefore the query is executed.
Build a Report Using Your Own SQLYou can build a report by adding SQL from an external source, such as another report.
If you edit the SQL of a query, you must change the Processing property for that query to Limited Local.
Procedure
1. Create a new report and choose the Blank template.
2. Click the Queries icon , and click Queries.
3. Click the Toolbox icon and drag Query to the work area.4. Click the Toolbox icon, and to build an SQL query, drag SQL to the right of the query.
Tip: You can drag SQL anywhere in the work area, and IBM Cognos Analytics - Reporting willautomatically create a query.
5. Click the Show properties icon , and in the Properties pane, double-click the Data sourceproperty and click a data source.
6. If required, set the Catalog property to the name of the catalog.
180 IBM Cognos Analytics - Reporting Version 11.0 : User Guide

7. Double-click the SQL property and type the SQL.8. Click Validate to check for errors.9. Select the query, and In the Properties pane, set the Processing property to Limited Local.
10. Double-click the query.
If the SQL is valid, the data items defined in the SQL appear in the Data Items pane.
11. Click the Pages icon , and click a report page.12. Click the Toolbox icon and drag an object to the work area.
For example, drag a list, crosstab, chart, or repeater.13. Click the data container.
14. In the Properties pane, click the select ancestor button and click the container you just created.
For example, if you created a list, click List.
Tip: You can also click the container selector (three orange dots) of the container to select it.15. Set the Query property to the query for the report type.
16. Click the Data icon , and from the Data items tab , drag the items from the query youchose in the previous step to the data container.
Convert a Query to SQLYou can convert a query to SQL to edit it. You may want to do this to improve performance or to use SQLfeatures that are not supported directly by IBM Cognos Analytics - Reporting.
Converting a query to SQL is an irreversible process.
Procedure
1. Click the Queries icon and click the query.
2. Click the Show properties icon , and in the Properties pane, double-click the Generated SQLproperty.
3. Click Convert.4. Click Validate to check for errors.5. Select the query, and In the Properties pane, set the Processing property to Limited Local.
Edit the SQLYou can edit the SQL for a query that has been created as an SQL query or that has been converted toSQL.
Procedure
1. Click the Queries icon , and double-click the SQL item under the query.2. Make changes in the SQL window.3. Click Validate to check for errors.
First-Rows OptimizationThe SQL produced by IBM Cognos Analytics - Reporting depends on the report format you choose. Forexample, if you specify HTML format, first-rows optimization is requested. All-rows is requested if youspecify PDF.
It is important for database administrators and programmers to remember that Reporting does notalways use first-rows optimization. If you assume first-rows optimization is always requested, this cancause the RDBMS optimizer to process the query differently than you expect.
Chapter 9. Relational Reporting Style 181

Using relational calculationsInsert a calculation to make your report more meaningful by deriving additional information from the datasource. For example, you create an invoice report, and you want to see the total sale amount for eachproduct ordered. Create a calculated column that multiplies the product price by the quantity ordered.
You build calculations in the expression editor using functions.
If a calculation is used in multiple reports, or by different report authors, ask your modeler to create thecalculation as a standalone object in the model and include it in the relevant package.
You can add calculations to lists, crosstabs, and all other data containers. You can also add calculationsdirectly to a page header, body, or footer. However, you must first associate a query to the page. For moreinformation, see “Add a page to a report” on page 337
Units of Measure
When creating calculations in IBM Cognos Analytics - Reporting and IBM Cognos Query Studio, you mayencounter problems with the units of measure. For example, the calculation Cost*Cost returns the unit ofmeasure * instead of a currency unit of measure. To avoid this problem, change the format of thecorresponding column to obtain the desired unit of measure.
Calculation Solve Order
When calculations in the rows and columns of a report intersect, calculations are performed in thefollowing order: addition or subtraction, multiplication or division, aggregation (rollup), and then theremaining arithmetic functions.
The remaining functions are as follows:
• absolute, round, round down, average, minimum, maximum, medium, count• percentage, % difference (growth) or % of total• rank, quartile, quantile, or percentile
If both calculations have the same precedence, for example, if they are both business functions, then therow calculation takes precedence.
Limitations of Calculations
You should use only the expressions and functions available in Reporting, and follow their syntax.
Minimal checking exists for calculations. If your calculation uses an invalid expression, your report resultsmay contain unexpected values.
In addition, you should define member summaries as follows:
summary_function (currentMeasure within set set_reference)
where set_reference is a level or set inserted from the Source tab .
Unless otherwise required, summary_function should be the aggregate function. If you use an explicitsummary function, you may encounter problems with measures and scenario or account dimensionmembers (such as profit margin, distinct count, and so on) that have complex rollup rules, or membersthat do not roll up.
Know your data, and confirm with the owner of the cube where overriding the automatic aggregation issafe.
182 IBM Cognos Analytics - Reporting Version 11.0 : User Guide

Because of these limitations, summaries of calculations may not provide reliable values. For convenience,you may have to build reports where row summaries and calculated member columns intersect. In suchreports, these intersections may contain unexpected values. In contrast, row calculations intersectingwith column aggregates using the aggregate function are safe because the calculation is performed onthe reliably summarized values.
Create a simple calculationYou can select items in your report and create simple calculations.
In addition to simple arithmetic calculations, you can perform the following calculations:
Calculation Description
Rollup Summarizes, or rolls up, all the values in ahierarchy.
% Calculates the value of a selected item as apercentage of another item.
% Growth Calculates the difference between two items as apercentage.
% Of Base This calculation is only available if you select twomembers from different hierarchies, each from adifferent edge.
This calculation takes the first selected memberfrom edge A and the second selected memberfrom edge B. The calculation result of a percent ofbase should be such that all the values for memberA will compare itself to the intersect value ofmember A and B.
Custom Allows you to specify your own value whenperforming a simple arithmetic calculation. Alsoallows you to change the order of operands or typea custom name for the new calculated row orcolumn.
Procedure
1. Select the items in your report to calculate.
2. From the report object toolbar, click the insert calculation button and select the calculation toperform.
Tip: Calculations that are not applicable to the items you selected are grayed out.3. To change the order of the operands, the name of the calculated item added to the report, or to create
a custom calculation, click Custom.
ResultsThe calculation appears as a new row or column in your report.
Chapter 9. Relational Reporting Style 183
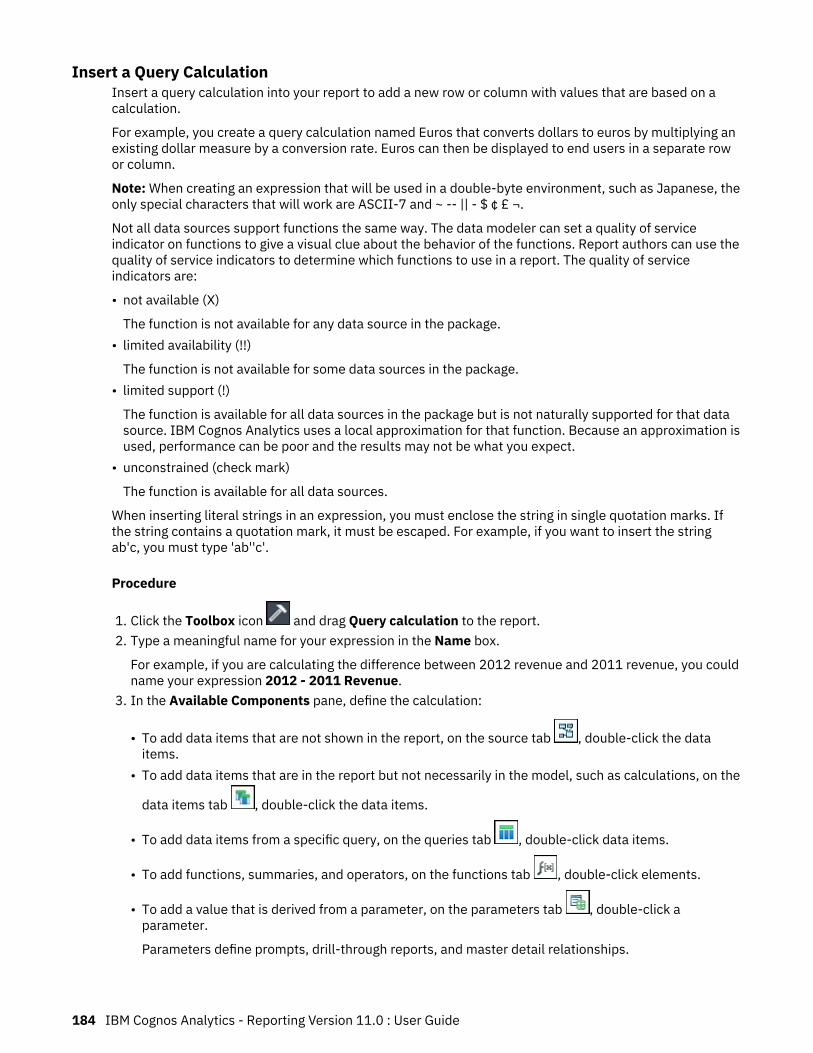
Insert a Query CalculationInsert a query calculation into your report to add a new row or column with values that are based on acalculation.
For example, you create a query calculation named Euros that converts dollars to euros by multiplying anexisting dollar measure by a conversion rate. Euros can then be displayed to end users in a separate rowor column.
Note: When creating an expression that will be used in a double-byte environment, such as Japanese, theonly special characters that will work are ASCII-7 and ~ -- || - $ ¢ £ ¬.
Not all data sources support functions the same way. The data modeler can set a quality of serviceindicator on functions to give a visual clue about the behavior of the functions. Report authors can use thequality of service indicators to determine which functions to use in a report. The quality of serviceindicators are:
• not available (X)
The function is not available for any data source in the package.• limited availability (!!)
The function is not available for some data sources in the package.• limited support (!)
The function is available for all data sources in the package but is not naturally supported for that datasource. IBM Cognos Analytics uses a local approximation for that function. Because an approximation isused, performance can be poor and the results may not be what you expect.
• unconstrained (check mark)
The function is available for all data sources.
When inserting literal strings in an expression, you must enclose the string in single quotation marks. Ifthe string contains a quotation mark, it must be escaped. For example, if you want to insert the stringab'c, you must type 'ab''c'.
Procedure
1. Click the Toolbox icon and drag Query calculation to the report.2. Type a meaningful name for your expression in the Name box.
For example, if you are calculating the difference between 2012 revenue and 2011 revenue, you couldname your expression 2012 - 2011 Revenue.
3. In the Available Components pane, define the calculation:
• To add data items that are not shown in the report, on the source tab , double-click the dataitems.
• To add data items that are in the report but not necessarily in the model, such as calculations, on the
data items tab , double-click the data items.
• To add data items from a specific query, on the queries tab , double-click data items.
• To add functions, summaries, and operators, on the functions tab , double-click elements.
• To add a value that is derived from a parameter, on the parameters tab , double-click aparameter.
Parameters define prompts, drill-through reports, and master detail relationships.
184 IBM Cognos Analytics - Reporting Version 11.0 : User Guide

• To add a macro, on the macros tab , double-click the parameter maps, session parameters, ormacro functions you want to add to the macro expression.
Tip: Use Insert macro block to get you started with creating the macro expression. Insert macroblock inserts number signs in the expression. Make sure that the macro expression you create isbetween the number signs.
You can also type the calculation directly in the Expression Definition box.
When typing date values, ensure that the date format is correct for your database type.
To copy and paste expression components in the Expression Definition pane, you can use the copy
button and the paste button .
4. Click the validate button .
Any validation errors appear on the Errors tab of the Information pane.
Related conceptsUsing query macros
Create a Layout CalculationCreate a layout calculation to add run-time information to your report, such as current date, current time,and user name.
When creating layout calculations, only report functions are available to you in the expression editor.These functions are executed in the report layout, as opposed to the other functions which are executedin the query.
Procedure
1. Click the Toolbox icon and drag Layout calculation to the report.2. In the Available Components box, define the calculation:
• To add data items from a specific query, on the queries tab , double-click data items.
• To add functions, summaries, and operators, on the functions tab , double-click elements.
• To add a value that is derived from a parameter, on the parameters tab , double-click aparameter.
Parameters define prompts, drill-through reports, and master detail relationships.
Tip: You can also type the expression directly in the Expression Definition box.
3. Click the validate button .
Chapter 9. Relational Reporting Style 185

186 IBM Cognos Analytics - Reporting Version 11.0 : User Guide
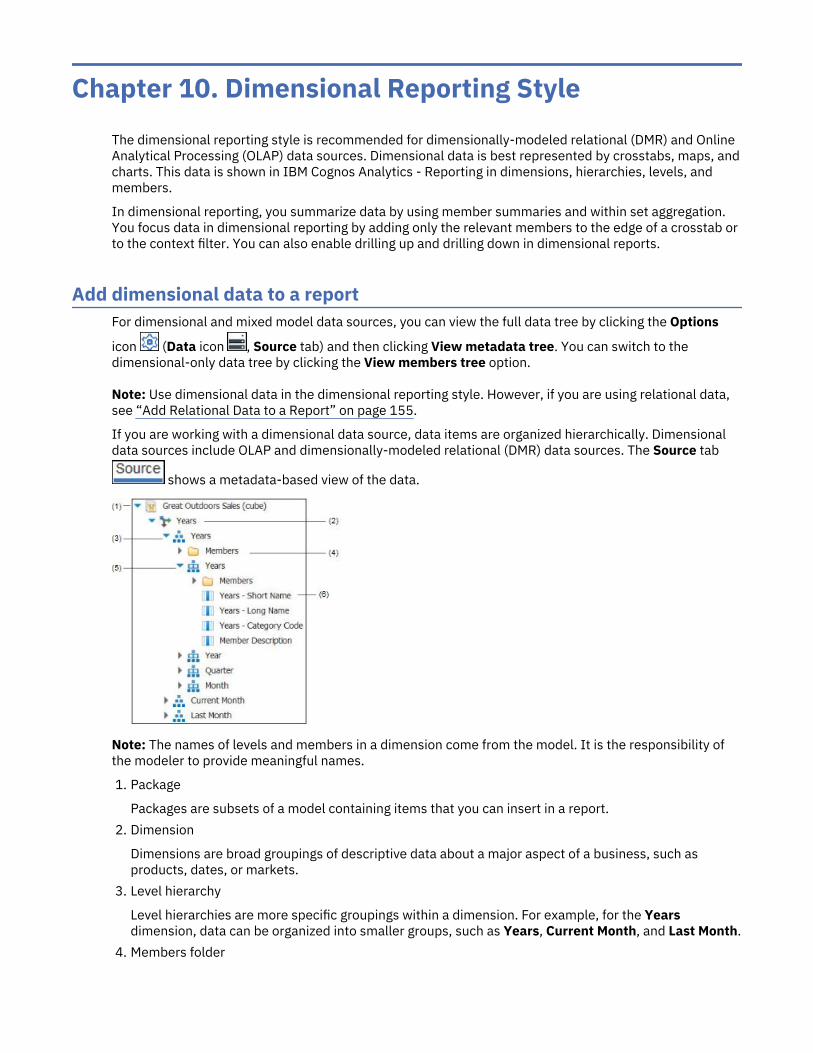
Chapter 10. Dimensional Reporting StyleThe dimensional reporting style is recommended for dimensionally-modeled relational (DMR) and OnlineAnalytical Processing (OLAP) data sources. Dimensional data is best represented by crosstabs, maps, andcharts. This data is shown in IBM Cognos Analytics - Reporting in dimensions, hierarchies, levels, andmembers.
In dimensional reporting, you summarize data by using member summaries and within set aggregation.You focus data in dimensional reporting by adding only the relevant members to the edge of a crosstab orto the context filter. You can also enable drilling up and drilling down in dimensional reports.
Add dimensional data to a reportFor dimensional and mixed model data sources, you can view the full data tree by clicking the Options
icon (Data icon , Source tab) and then clicking View metadata tree. You can switch to thedimensional-only data tree by clicking the View members tree option.
Note: Use dimensional data in the dimensional reporting style. However, if you are using relational data,see “Add Relational Data to a Report” on page 155.
If you are working with a dimensional data source, data items are organized hierarchically. Dimensionaldata sources include OLAP and dimensionally-modeled relational (DMR) data sources. The Source tab
shows a metadata-based view of the data.
Note: The names of levels and members in a dimension come from the model. It is the responsibility ofthe modeler to provide meaningful names.
1. Package
Packages are subsets of a model containing items that you can insert in a report.2. Dimension
Dimensions are broad groupings of descriptive data about a major aspect of a business, such asproducts, dates, or markets.
3. Level hierarchy
Level hierarchies are more specific groupings within a dimension. For example, for the Yearsdimension, data can be organized into smaller groups, such as Years, Current Month, and Last Month.
4. Members folder

Members folders contain the available members for a hierarchy or level. For example, the Membersfolder for the Years level hierarchy contains everything found in the Year, Quarter, and Month levels.
5. Level
Levels are positions within the dimensional hierarchy that contain information at the same order ofdetail and have attributes in common. Multiple levels can exist within a level hierarchy, beginning witha root level. For example, the Years level hierarchy has the following related levels.
Level Level name Description
Root Years The root level.
First Year Years in the Years root level. Forexample, 2013, 2012, and2011.
Second Quarter Quarters for each year in theYear level. For example, 2013Q1, 2013 Q2, and 2013 Q3.
Third Month Months for each quarter in theQuarter level. For example,Jan., Feb., and Mar.
Tip: The Measures dimension contains the measures available in the data source.6. Member property
Member properties are attributes that each member possesses. For example, gender could be aproperty for all employee members. For more information about member properties, see “Insert aMember Property” on page 191.
Related conceptsLimited Support for Relational Functions When Used with OLAP Data Sources
Customize the Source TreeWhen using dimensional data, you can customize how you see data in the source tree. You can select afull package tree view that shows dimensions, hierarchies, levels, an optional members folder, andmember properties.
Or you can select a members-only tree view, such as the one in IBM Cognos Analysis Studio. This viewallows you to add only members in your report.
Procedure
1. Click the Data icon , click the Source tab , and then click the Options icon .2. To view the members-only tree view, click View members tree.3. To view the full package tree, click View package tree.4. To change what is included in the tree, right-click a data item and click Package Tree Settings.
Use the Preview pane to choose the appropriate settings.
Insert a memberBy default, when you insert members from the source tree into your report with IBM Cognos Analytics -Reporting, single members are inserted without any details or children. You can change how members areinserted. For example, you may want to insert a member along with all its children or insert only themember's children. Or you may want to insert members as a set.
188 IBM Cognos Analytics - Reporting Version 11.0 : User Guide

When you double-click a member that you have already inserted in your report, by default, its children areinserted after the parent member. You can control whether the children are inserted before or after,
nested, or not inserted at all: click the More icon , Options, and in the Edit tab, click a setting underDouble-click on member action.
When inserting members into a crosstab, ensure that you insert members from the same hierarchy ononly one of the crosstab edges. If you insert members from the same hierarchy on both edges of thecrosstab, you may encounter unexpected results. For example, a report that uses members from years inthe rows and Quarters in the columns is very difficult to read because the useful numbers are distributedover a large area of mostly blank cells.
Calculated members from the data source also appear in the source tree. However, calculated membersin Microsoft SQL Server Analysis Services (SSAS) cubes do not appear in the list of descendants in thequery. If you want these calculated members to appear in a report or a prompt, you must insert themexplicitly.
Procedure
1. Click the Data icon , click the Source tab , and then click the Options icon .2. Under Insert, click Individual Members.3. Under Member Insert Options, select how you want to insert members.4. If you want to insert members within a set instead of inserting individual members, under Insert, click
Create sets.5. Do one of the following:
• To insert a member above or below another member, drag the new member above or below a cell.
A flashing black bar appears where you can drop the new member.• To replace a member, drag the new member to the cell with the member to replace.
A flashing black box appears where you can drop the new member.
Search for a MemberYou can perform a member search to quickly find data.
You can control the number of members that are returned in a search by specifying a value for the
Member display count limit (in source tree) option (More icon , Options, Advanced tab).
Procedure
1. Click the Data icon , and from the Source tab , select and then right-click a hierarchy
or level and click Search.2. In the Keywords box, type the words or characters for which to search.3. Click the search parameter to use.4. To search all descendants instead of just the immediate children, select the Search all descendants
check box.
For example, when performing a search in a hierarchy, selecting this check box returns membersfound in all the levels of the hierarchy.
5. Click Search.
Chapter 10. Dimensional Reporting Style 189

Results
The search results appear in a hierarchical structure on the Search tab . You can browse thehierarchy to explore members at lower levels.
Tip: You can insert members directly from the Search tab into a report. This can save you time, becauseyou do not have to define a filter. For example, instead of inserting Product line from the Source tab andadding a filter for Camping Equipment, you can insert Camping Equipment from the Search tab.
Nest MembersWhen you insert members in your report, you may want to nest them in another row or column to makeyour report easier to use. You can nest members from different dimensions. You can also nest sets.
For example, in the following report, the quarters (Q1 to Q4) were selected from the Time dimension andnested only for the GO Americas member, which is from a different dimension.
Figure 39. Crosstab showing the year to date amount for all four quarters nested beside GO Americas
When you filter out children from nested sets, the parent set still appears in your report. To avoid this,filter only the top level set and nest only the complete set of descendants at the desired levels.
Procedure
Click the Data icon , and from the Source tab , drag the members to the work area.
A flashing black bar indicates where you can drop an item.
Insert a HierarchyYou can quickly insert entire hierarchies in a report.
When using an IBM Cognos PowerCube, a SSAS cube, or a dimensionally-modeled relational data source,you can insert multiple hierarchies from the same dimension in a crosstab. For example, you can placeone hierarchy from a dimension on an edge of the crosstab and nest another hierarchy from the samedimension on the same edge, on another edge, or in the Context filter area.
You can also perform arithmetic, percentage, and ranking calculations using multiple hierarchies.
Summary or analytic calculations that refer to different hierarchies from the same dimension, such astotal, count, average, minimum, and maximum, are not supported. These calculations cause an OP-ERR-0250 error.
Procedure
1. Click the Data icon , and from the Source tab , drag the hierarchy to the report.2. In the Insert hierarchy dialog box, choose which members to insert:
• To insert only the root members of the hierarchy, click Root members.
190 IBM Cognos Analytics - Reporting Version 11.0 : User Guide

• To insert all members of the hierarchy, click All members.
Tip: The default Level indentation property for all members is to show the hierarchical structurewhen the report is run.
Insert a Member PropertyYou can insert member properties, which are attributes of a member, in your report. Member propertiesprovide additional information about the member. For example, an employee level may have a propertynamed gender.
About this task
In the data tree of the Source tab , member properties are identified by the icon .
You can only insert properties. You cannot group them. Do not insert member properties in the series orcategories of a chart because by default, IBM Cognos Analytics - Reporting groups items that are insertedin these areas. Grouping member properties produces a warning when you validate the report.
Procedure
Click the Data icon , and from the Source tab , drag the member property to the report.
Create a Set of MembersUse sets to group members that are logically related for various actions, such as formatting, nesting, andsorting. Creating sets is also useful when members may be dynamic over time. For example, the childaccounts of a total assets account may change from year to year. By creating a set, you do not have tomodify the report each time accounts are added or removed.
After you create a set of members, you can add or remove members within the set.
You can perform operations on the set such as excluding specific members, moving members within theset, showing only the top or bottom members, filtering the set, and expanding or collapsing the memberswithin a set. You can view the set definition to see and edit operations that are performed on the set.
Procedure
1. Click the Data icon , click the Source tab , and then click the Options icon .2. Under Insert, click Create sets.3. From the Source tab, select the items to include in the set and drag them to the work area.
4. To add or remove members, select the set, click the More icon , and click Edit Members.
Tip: You can also select the set, click the Show properties icon , and in the Properties pane,double-click the Members property.
Sharing sets between reportsWhen you are working with dimensional data, you can share a set to make it available for inclusion inmultiple reports.
You must first create a set in a source crosstab report, create a shared set definition, then refer to it in atarget report.
A shared set definition is copied from one report to another. As a result, the set definition must notdepend on any context from the source report. For example, it must meet the following criteria:
• It cannot reference other shared sets.• It cannot reference other data items.
Chapter 10. Dimensional Reporting Style 191

• It cannot contain calculated members.
You cannot change the definition of a shared set from within the target report. However, you can carry outother set operations on it, such as excluding a member or creating a top 10 list.
Procedure
1. In the source crosstab report, create a set that you want to share.
2. Select the set, click the Show properties icon , and in the Properties pane, in the Sharingproperty, enter a name and description for the set.
3. Save the report.
4. Click the Data icon , and in the Source tab , right-click the model. Click Add shared setreport.
5. In the Open box, select the source report that contains the shared set definition.If it does not exist, a new folder that is called Shared Sets is created. It is displayed at the bottom ofthe source tree.
6. Optional: To add, delete, or change the order of reports in the Shared Sets folder, right-click thefolder and click Manage Shared Set Reports.
7. Create or open a crosstab target report that you want to refer to the shared set definition.
8. In the Source tab , open the Shared Sets folder. Open the source report that contains theshared set definition that you want to use.
9. Add the shared set definition into your target report.
10. Select the shared set in the target report, click the More icon , and click Edit Set.11. In the Set definition box, select the shared set.
12. Click Edit .The Set Reference Properties window opens.
13. Set the Inclusion property.a) Select Run time to retrieve the latest shared set definition every time that the report runs.b) Select Design time to store the shared set definition in the target report.
This definition is used until you refresh it.14. Click OK, then save the report.
Managing shared set referencesAfter you share a set to make it available for inclusion in multiple reports, you can manage references toit. You can also copy it locally.
You can manage set references in the following ways:
• Create a copy of a shared set to be used in a report.
Converting a shared set reference into a copy replaces the reference with a set definition that is storedin the report. The report does not reference the shared set from the source report. Any changes that aremade to the shared set in the source report are not reflected in the target report. Instead of convertingthe reference to a copy, you can change the Inclusion property of the reference to Design time. Designtime references use a static stored version of the shared set definition. However, you can later changethe Inclusion property to be Run time to use the latest shared set definition.
• Modify the properties of a set reference in the target report, including its Inclusion property. You canalso modify a set reference in the target report by changing the set definition it refers to.
• Refresh an existing set reference after a set changed in a source report and you want to use theupdated set. To use the updated set if the Inclusion property is set to Design time, you must refresh itsreference.
192 IBM Cognos Analytics - Reporting Version 11.0 : User Guide
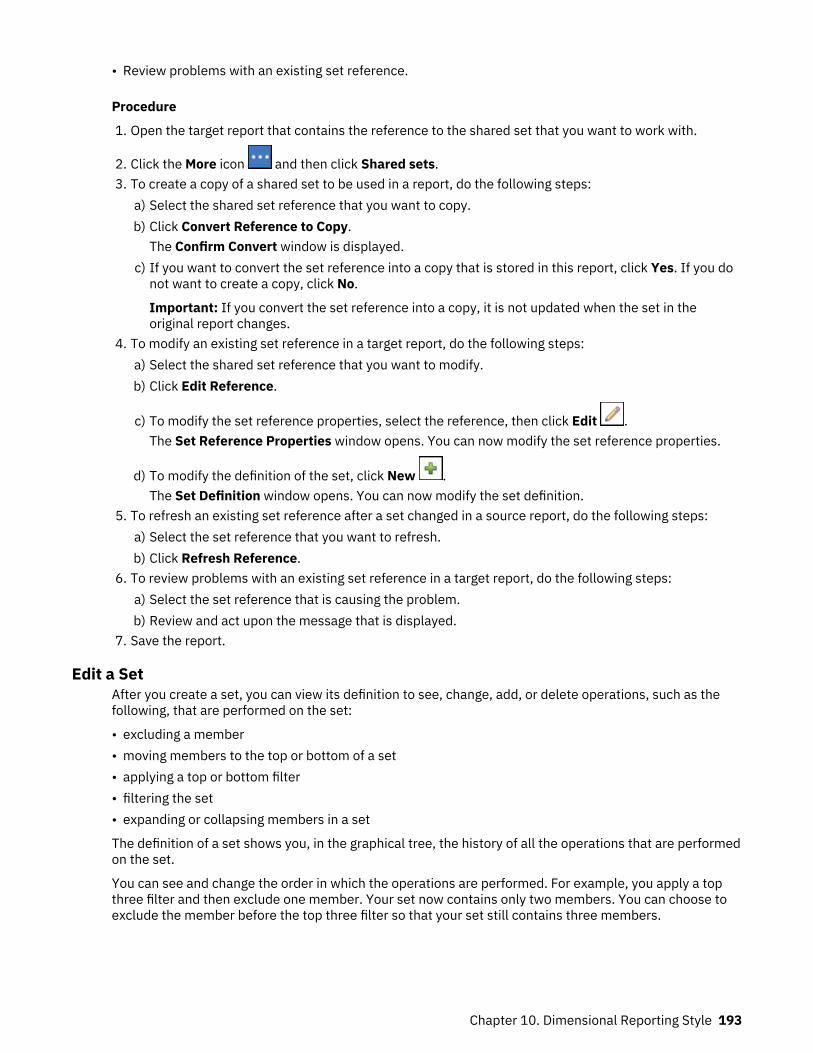
• Review problems with an existing set reference.
Procedure
1. Open the target report that contains the reference to the shared set that you want to work with.
2. Click the More icon and then click Shared sets.3. To create a copy of a shared set to be used in a report, do the following steps:
a) Select the shared set reference that you want to copy.b) Click Convert Reference to Copy.
The Confirm Convert window is displayed.c) If you want to convert the set reference into a copy that is stored in this report, click Yes. If you do
not want to create a copy, click No.
Important: If you convert the set reference into a copy, it is not updated when the set in theoriginal report changes.
4. To modify an existing set reference in a target report, do the following steps:a) Select the shared set reference that you want to modify.b) Click Edit Reference.
c) To modify the set reference properties, select the reference, then click Edit .The Set Reference Properties window opens. You can now modify the set reference properties.
d) To modify the definition of the set, click New .The Set Definition window opens. You can now modify the set definition.
5. To refresh an existing set reference after a set changed in a source report, do the following steps:a) Select the set reference that you want to refresh.b) Click Refresh Reference.
6. To review problems with an existing set reference in a target report, do the following steps:a) Select the set reference that is causing the problem.b) Review and act upon the message that is displayed.
7. Save the report.
Edit a SetAfter you create a set, you can view its definition to see, change, add, or delete operations, such as thefollowing, that are performed on the set:
• excluding a member• moving members to the top or bottom of a set• applying a top or bottom filter• filtering the set• expanding or collapsing members in a set
The definition of a set shows you, in the graphical tree, the history of all the operations that are performedon the set.
You can see and change the order in which the operations are performed. For example, you apply a topthree filter and then exclude one member. Your set now contains only two members. You can choose toexclude the member before the top three filter so that your set still contains three members.
Chapter 10. Dimensional Reporting Style 193

Procedure
1. Select a set, click the More icon , and click Edit Set.
A graphical tree shows all the operations that are performed on the set of members.2. To see the details of an operation, hover your mouse over an operation node.3. To change the order of an operation, click the operation node, and click the right or left arrow.
4. To edit an operation, click the operation node and click the edit button .
5. To add a new operation, click the new button .
Exclude Members from a SetYou can choose to remove individual items that are not needed in your analysis.
Procedure
1. Select a set, click the More icon , and click Edit Set.
2. Click the new button and click Exclude.3. In the Exclude box, choose the members to exclude and use the right arrow to move them to the
Members pane.
Move Members Within a SetYou can move one or more members to the top or bottom of a set.
Procedure
1. Select a set, click the More icon , and click Edit Set.
2. Click the new button and click Move to Top or Move to Bottom.3. In the Available members list, select the member to move to the top or bottom and click the right
arrow.
The members appear in the order shown in the Members list.
Limit Data to Top or Bottom ValuesYou want to focus your report on the items of greatest significance to your business question. Forexample, you want to identify your top 100 customers and what that group of customers is worth.
You can limit the data to the top or bottom values of a set. This keeps the amount of data shown in thework area small, even when using large data sources.
You can define a top or bottom rule by specifying
• a number, such as the 50 top or bottom performing sales people• a percentage, such as customers who contribute to the top 10% of overall revenue• a cumulative sum, such as customers who contribute to the first ten million dollars of overall revenue
If the selected set contains a user-defined filter, the top or bottom rule applies only to the includedvalues. For example, if you apply a filter to show only retailers with revenue greater than one milliondollars, the bottom rule applies to the lowest values within those results.
You can filter a set of members to show only those at the top or bottom and base the filter on the measureyou are using and the set of members on the opposite edge. You can also specify a custom filter.
194 IBM Cognos Analytics - Reporting Version 11.0 : User Guide

Procedure
1. Select a set, click the More icon , and click Edit Set.
2. Click the new button and click Top or Bottom.3. Under Type, select whether to filter the Top or Bottom values.4. To choose how and how much you want to filter, under Number of items, click Count, Percent, or
Sum and type the number of data items to show, the percent of data items to show, or the value tosum.
5. Choose the intersection on which to base your filter by clicking the ellipsis button and selecting the
members and measure for the intersection from either the Source tab or the Calculated
members and measures tab .
For more information, see “Create an Intersection (Tuple)” on page 231.
Filter the Members Within a SetYou can remove members from within a set by specifying filter conditions so that only the members thatyou require remain. You can filter a set based on
• member captions
For example, your set includes employee names and you want to keep only the employees with namesthat begin with a specific letter.
• properties that are numeric or strings
For example, your set includes employee names and you want to filter employees using the genderproperty.
• intersection of values (tuple)
For example, you want to keep only the employees who used less that ten sick days for the year 2012.
If you want to create a more complex filter, you can combine multiple conditions using AND, OR, and NOToperators. By default, multiple conditions are combined with an AND operator, which means that allconditions must be met for the filter to take effect.
Filtering the members in a set is not the same as relation detail or summary filters.
Procedure
1. Select a set, click the More icon , and click Edit Set.
2. Click the new button and click Set filter.3. Select how you want to filter.
• If you want to filter the set using a caption, click Caption.• If you want to filter the set using a member property, click Property and select from the drop-down
list.• If you want to filter the set using an intersection of members, or tuple, click Intersection (tuple) and
click the ellipsis button. Then, from Available members and measures, select the desired items andclick the right arrow to move them to the Intersection members and measures list.
4. Specify the Operator and Value to complete your condition and click OK.5. To add additional conditions, click the new button.6. If you include multiple conditions in your filter, use the AND, OR, and NOT operators to combine them.
• To add an operator, select the conditions that you want to combine, and click an operator.
Chapter 10. Dimensional Reporting Style 195

• To change an operator, double-click the operator to toggle among available ones or select theoperator and then select a different one from the list.
• To remove an operator, select it in the condition string, and then click the delete button .
7. To change a condition, click the edit button .
Expand and Collapse a Member Within a SetYou can expand a member to add its child members below it as new rows, and you can collapseexpanded members to remove the expanded member's child members.
Procedure
1. Select a set, click the More icon , and click Edit Set.
2. Click the new button and click Expand or Collapse.3. In the Available members list, select the member to expand or collapse and click the right arrow to
move it to the Members list.
Extended Data ItemsExtended data items differ from the traditional, expression-based text strings by enabling you to addchildren, view details, select sets, sort sets, and apply contextual calculations.
Extended data items are created when you insert data items from dimensional packages. Extended dataitems do not apply to relational packages or non-dimensionally modeled packages.
You can do the following with extended data items that are not available with traditional data items:
• Add an extended data item's child members
You can double-click an extended data item to insert its child members beside it in the report object.• View an extended data item's details
You can select an extended data item and see where the data item appears in the package in theProperties pane under Data Item.
• Select member sets
You can select a member in a set to highlight it as the primary selection and the other members assecondary selections.
• Sort sets
You can select an extended data item, click the sort button in the report object toolbar, and clickEdit set sorting to sort a set in ascending or descending order, to sort hierarchically, and to sort bycaption, by a property, or by an intersection (tuple).
• Apply contextual calculations
You can select an extended data item and then, from the report object toolbar, click the Insert
Calculatation icon to see a contextual list of calculations that are available for this extended dataitem.
Tips for working with ragged or unbalanced hierarchiesIn ragged or unbalanced hierarchies, some members that are not at the lowest level of the hierarchy mayhave no descendants at one or more lower levels. Support for these hierarchy gaps in relational datasources is limited. More complete support is provided for OLAP data sources, but some reports may stillresult in unexpected behavior.
196 IBM Cognos Analytics - Reporting Version 11.0 : User Guide

For example, the following may occur:
• Groups corresponding to missing members may appear or disappear when grouped list reports arepivoted to a crosstab. This happens with set expressions using the filter function, and detail filters onmembers.
• Ragged and unbalanced sections of the hierarchy are suppressed when set expressions in thathierarchy are used on an edge.
• When a crosstab is sectioned or is split into a master detail report, sections corresponding to missingmembers become empty.
• Cells that were suppressed may still appear in the report output for reports with ragged or unbalancedhierarchies.
Some of these behaviors may be corrected in a future release, while others may be codified as supportedbehavior. To avoid these behaviors, do not use levels from ragged or unbalanced hierarchies. Instead ofusing levels, use the descendants, children, or ancestors.
We consider the following scenarios to be safe:
• One or more nested level references on an edge with no modifying expression.• A hierarchy reference on only one level of one edge.• One or more explicit members or sets of explicit members as siblings on only one level of one edge.• Summaries of the previous three scenarios.
In all cases, you should test reports based on ragged and unbalanced hierarchies to confirm thathierarchy gaps are handled correctly.
For more information about ragged or unbalanced hierarchies, see the IBM Cognos Framework ManagerUser Guide.
Related conceptsCreating Sections on Reports That Access SAP BW Data Sources
Creating dimensional custom groupsCreate custom groups to classify existing data items into groups that are meaningful to you.
You can reduce the number of values into smaller, more meaningful groups. For example, you can changea list of employees into my team and others.
When you are working with dimensional data and crosstabs or charts, you can create custom groups onlyon sets of members. After you create a custom group in a set, the members in the set are replaced by thecustom groups.
When you create custom groups in a list, a new column is added to the report, with the name data_item(Custom). You can use this new column to group or sort the report. If you want to show only the newgroups, you can delete the original column.
When you are creating custom groups on sets of members, consider the following constraints:
• Members included in a custom group must be from the same level in a hierarchy.• If you insert a hierarchy that is used in a custom group elsewhere in the data container, it must be
inserted as a sibling of the custom group.• Automatic aggregation on a custom group might not work as expected. For example, you might
encounter error cells (- -).
Procedure
1. To add custom groups in a crosstab or chart that includes sets of members, do the following steps:
a) Select a set, click the More icon , and click Edit Set.
Chapter 10. Dimensional Reporting Style 197
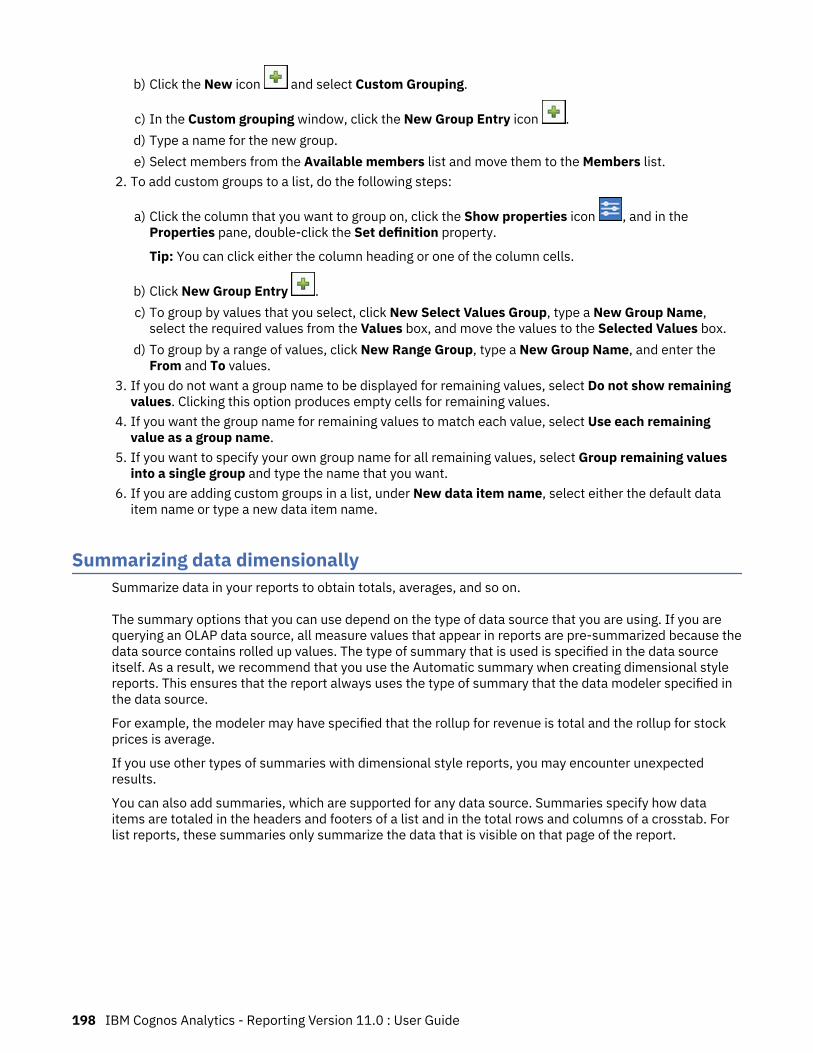
b) Click the New icon and select Custom Grouping.
c) In the Custom grouping window, click the New Group Entry icon .d) Type a name for the new group.e) Select members from the Available members list and move them to the Members list.
2. To add custom groups to a list, do the following steps:
a) Click the column that you want to group on, click the Show properties icon , and in theProperties pane, double-click the Set definition property.
Tip: You can click either the column heading or one of the column cells.
b) Click New Group Entry .c) To group by values that you select, click New Select Values Group, type a New Group Name,
select the required values from the Values box, and move the values to the Selected Values box.d) To group by a range of values, click New Range Group, type a New Group Name, and enter the
From and To values.3. If you do not want a group name to be displayed for remaining values, select Do not show remaining
values. Clicking this option produces empty cells for remaining values.4. If you want the group name for remaining values to match each value, select Use each remaining
value as a group name.5. If you want to specify your own group name for all remaining values, select Group remaining values
into a single group and type the name that you want.6. If you are adding custom groups in a list, under New data item name, select either the default data
item name or type a new data item name.
Summarizing data dimensionallySummarize data in your reports to obtain totals, averages, and so on.
The summary options that you can use depend on the type of data source that you are using. If you arequerying an OLAP data source, all measure values that appear in reports are pre-summarized because thedata source contains rolled up values. The type of summary that is used is specified in the data sourceitself. As a result, we recommend that you use the Automatic summary when creating dimensional stylereports. This ensures that the report always uses the type of summary that the data modeler specified inthe data source.
For example, the modeler may have specified that the rollup for revenue is total and the rollup for stockprices is average.
If you use other types of summaries with dimensional style reports, you may encounter unexpectedresults.
You can also add summaries, which are supported for any data source. Summaries specify how dataitems are totaled in the headers and footers of a list and in the total rows and columns of a crosstab. Forlist reports, these summaries only summarize the data that is visible on that page of the report.
198 IBM Cognos Analytics - Reporting Version 11.0 : User Guide

Figure 40. Crosstab showing automatic summaries for rows and columns
You can specify summary aggregation in different ways by using any of the following:
• aggregation properties that are specified in the model• the Auto group & summarize property• the summarize button in the toolbar• aggregation properties for a data item• the solve order of calculations
Tip: When you add a summary by clicking the summarize button in the toolbar, a data item is created inthe query for the summary. In lists, the data item that is created is called a list summary. In crosstabs andcharts, the data item that is created is called a dimensional edge summary.
Limitation
If a summary is applied to a report that contains binary large object (BLOB) data, such as images ormultimedia objects, you cannot also perform grouping or sorting.
The Type of Data
How data is summarized also depends on the type of data that you are summarizing. Summary rules areapplied differently to facts, identifiers, and attributes. For example, if you summarize a data item thatrepresents part numbers, the only summary rules that apply are count, count distinct, count non-zero,maximum, and minimum. For information about how to determine the type of data that a data itemrepresents, see “Add Relational Data to a Report” on page 155 and “Add dimensional data to a report” onpage 187.
For information about how null or missing values are handled in summaries, see “Null (Missing) Values inCalculations and Summaries” on page 392.
Limitations on Measure Rollups
For all OLAP data sources except IBM Cognos PowerCube and Microsoft SQL Server 2005 AnalysisServices (SSAS), aggregation and re-aggregation are supported only for calculations and measures thatuse the following rollups: Sum (Total), Maximum, Minimum, First, Last, and Count.
All other types of rollup either fail or return error cells, which typically appear as two dash characters (--).
This problem occurs in, but is not limited to, the following:
• footers• aggregate function• context filters that select more than one member of a hierarchy that is used elsewhere on the report
Summarizing Sets
Chapter 10. Dimensional Reporting Style 199
When working with Microsoft SQL Server Analysis Services (SSAS) data sources, we recommend that younot summarize values for sets which contain members that are descendants of other members in thesame set. If you do so, SSAS double-counts values for automatic summaries and all data sources double-counts values for explicit summaries.
Related conceptsLimitations When Summarizing Measures in DMR Data Sources
Add a Simple Summary
You can add simple summaries in a report by using the summarize button . This button provides asubset of the summary functions available in IBM Cognos Analytics - Reporting.
The summarize button sets the summary property for the data item to the selected summary, and placesthe data item into an appropriate footer. A footer is created for each set, hierarchy, or level.
In crosstabs and charts, the summary appears as a node.
In crosstabs, you can add multiple summaries at the same level. For example, you have a crosstab withProduct line as rows, Order year as columns, and Revenue as the measure. For Product line, you can addthe Total summary as a header, which will total all revenue for each order year. You can then add theAverage summary as a footer, which will give the average revenue of all product lines for each order year.
For information about adding a rolling or moving average, see “Rolling and Moving Averages” on page203.
Procedure
1. Select the item for which you want to add a summary.
2. In the report object toolbar, click the summarize button and click a summary type.3. To change the summary label, do the following:
• Click the label.
• Click the Show properties icon , and In the Properties pane, under Text Source, set the Sourcetype property to the source type to define the label.
For example, set it as Data item value to produce a dynamic label for the summary based on dataitem values.
• Set the property under Source type to specify the label.
This property depends on the source type you chose. For example, if you chose Data item value asthe source type, set the Data item value property to the data item to use to define the label.
4. To change a summary, select it and, in the Properties pane, under Data Item, click Summary andchoose a different function.
Summarizing values in crosstabsIn crosstabs, summaries are calculated using two summary expressions.
The expressions used to summarize data are:
• aggregate ([measure within set [data item]) summarizes the member values from the data sourcewithin the current content.
• aggregate ([measure within detail [data item]) summarizes the lowest level of details in thereport.
The expression that is used to calculate a summary is controlled by the summary’s Use set aggregationproperty. For example, in the following crosstab, if you specified Total as the summary, the followingaggregate expressions are produced when the Use set aggregation is set to Yes and No respectively:
200 IBM Cognos Analytics - Reporting Version 11.0 : User Guide

• Total ([Revenue] within set [Quarter])
This expression totals the quarter values from the data source at the intersecting product line. It totalsthe aggregate over all product lines for each quarter. The total appears after other values.
• Total ([Revenue] within detail [Quarter])
This expression totals the month values visible in the report at the intersecting product line. It totals allof the intersecting month - product line values visible in the report. The total appears after other values.
In simple cases, the members and values visible in the report and the aggregate rules in the report are thesame as those in the data source and all of these expressions produce the same results.
For example, for the quarter and month values, if you are totaling the values for all months in all quarters,it makes no difference whether the visible values, the values in the cube, or the month and quarter valuesare used. The result is the same.
Tip: The Total Revenue by Country or Region sample report in the GO Data Warehouse (query) packageincludes a totalsummary function.
Different results appear when you start filtering, changing aggregation types, or using set expressions orunions.
For example, the following crosstab shows the quantity of products sold across all product types for eachproduct line. The crosstab has two summary values that show the average quantity of products sold byproduct line.
Chapter 10. Dimensional Reporting Style 201
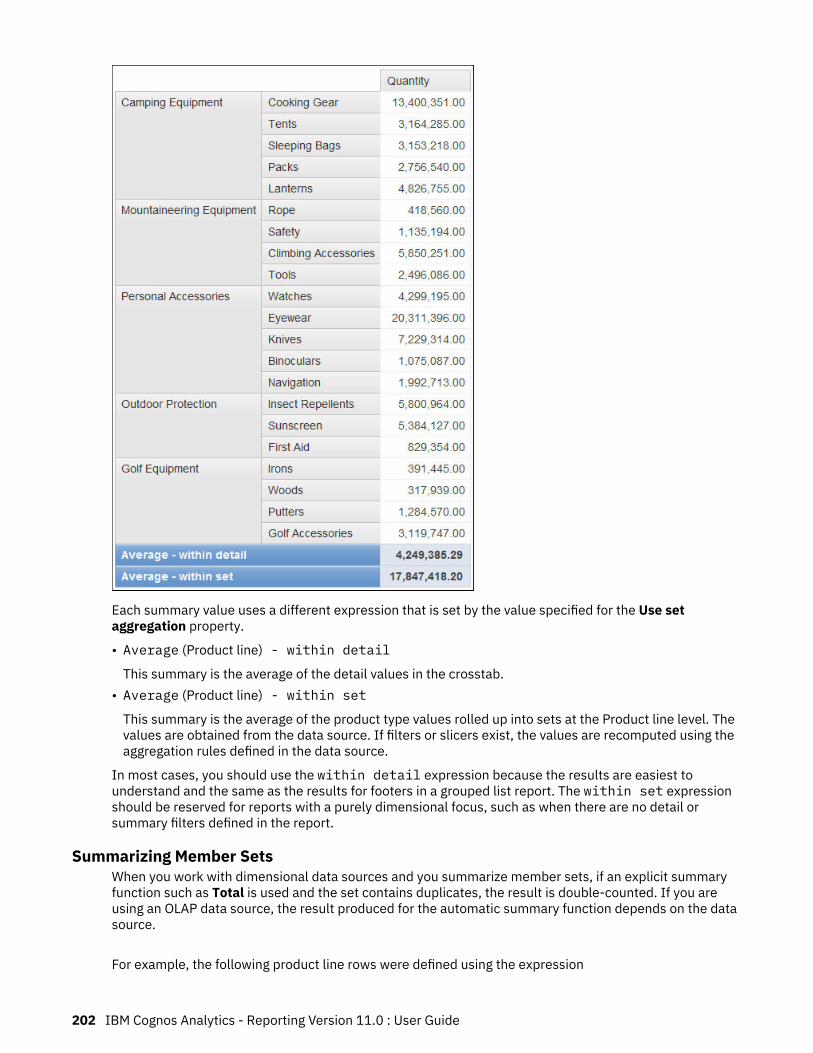
Each summary value uses a different expression that is set by the value specified for the Use setaggregation property.
• Average (Product line) - within detail
This summary is the average of the detail values in the crosstab.• Average (Product line) - within set
This summary is the average of the product type values rolled up into sets at the Product line level. Thevalues are obtained from the data source. If filters or slicers exist, the values are recomputed using theaggregation rules defined in the data source.
In most cases, you should use the within detail expression because the results are easiest tounderstand and the same as the results for footers in a grouped list report. The within set expressionshould be reserved for reports with a purely dimensional focus, such as when there are no detail orsummary filters defined in the report.
Summarizing Member SetsWhen you work with dimensional data sources and you summarize member sets, if an explicit summaryfunction such as Total is used and the set contains duplicates, the result is double-counted. If you areusing an OLAP data source, the result produced for the automatic summary function depends on the datasource.
For example, the following product line rows were defined using the expression
202 IBM Cognos Analytics - Reporting Version 11.0 : User Guide

union ([Product line], [Camping Equipment], ALL)
where [Product line] is the level that contains Camping Equipment.
Figure 41. Crosstab showing revenue by product line with an aggregate row and a total row
For PowerCubes, Aggregate (Product line) is the sum of the product lines excluding duplicates. For moreinformation about how the aggregate function is processed, see “Summary Functions” on page 204.
Rolling and Moving AveragesUse rolling and moving averages to analyze data for specific time series and to spot trends in that data.When viewing these averages on a line chart, use a longer period of time to reveal long-term trends.
In IBM Cognos Analytics - Reporting, to add a rolling or moving average, you must create summary andcustom calculations using layout expressions “Insert a Query Calculation” on page 228.
The Rolling and Moving Averages interactive sample report includes rolling and moving calculations.
Rolling Average
A rolling average continuously updates the average of a data set to include all the data in the set until thatpoint. For example, the rolling average of return quantities at March 2012 would be calculated by addingthe return quantities in January, February, and March, and then dividing that sum by three.
Tip: The Historical Revenue sample report in the Sales and Marketing (Cube) package also includes arolling average.
Moving Average
A moving average calculates the average of a data set for a specified period. For example, the movingaverage of return quantities at March 2012 with a specified period of two would be calculated by addingthe return quantities in February and March and then dividing that sum by two. In IBM Cognos Analytics -Reporting, you can use a prompt to specify the period.
Show Data for Specific Time PeriodsShow data for a specific time period to associate a report with a business time period rather than theexecution time. For example, you have a monthly report that you run at the beginning of each month, andyou want the last business day of the previous month to appear rather than the day on which you run thereport.
If the report functions AsOfDate and AsOfTime are added to the report, they will return a value basedon the results of the As of Time Expression object. If the As of Time Expression object is not added tothe report, these two functions return the date and time at which the report is run.
If the As of Time Expression object is added more than once in the report, the first occurrence of theobject in the layout that returns a valid value is used.
Chapter 10. Dimensional Reporting Style 203

Procedure
1. Click the Toolbox icon and drag As-of-time Expression to the report.2. Double-click As-of-time Expression.3. In the Expression Definition box, type the expression.
The expression must return a date-time value.
Tip: You can drag a function that returns a constant from the Constants folder in the Functions tab
. You can then change the constant to the value to use.
If you do not specify a time, the default time 12:00:00.000 AM is used.
Summary FunctionsThis section describes the summary functions that are available in IBM Cognos Analytics - Reporting.
Some functions, such as Custom, are available only when you click the summarize button on thereport object toolbar. Additional summary functions are available in the expression editor.
Automatic Summary
Depending on the type of data item, applies the function None, Summarize, or Calculated based on thecontext in which the data item appears.
Calculated is applied if the underlying data source is OLAP. It is also applied if the data item expression
• contains a summary function• is an if then else or case expression that contains a reference to at least a modeled measure in its
condition• contains a reference to a model calculation or to a measure that has the Regular Aggregate property
set to a value other than Unsupported• contains a reference to at least one data item that has the Summary aggregation property set to a
value other than None
If the underlying data source is relational and if the data item expression contains no summary functionsand a reference to at least one fact that has the Regular Aggregate property set to a value other thanUnsupported, Summarize is applied.
If the underlying data source is OLAP and if the data item expression contains no summary functions anda reference to at least one fact that has the Regular Aggregate property set to a value other thanUnsupported, Calculated is applied.
If the underlying data source is SAP BW, reports containing aggregations and summaries run moreefficiently if the aggregation applied to a query item matches the aggregation rule for the underlying keyfigure on the SAP BW server. In Cognos Analytics - Reporting, the easiest way to accomplish this is tochange the value of the Detail aggregation property to Automatic.
In all other contexts, None is applied.
For relational and dimensionally modeled relational (DMR) data sources, if this function is applied to adata item expression that has the average function, weighted averages are computed based on thelowest level detail values in the data source.
Note: This is the default function.
Average
Adds all existing values and then divides by the count of existing values.
204 IBM Cognos Analytics - Reporting Version 11.0 : User Guide

Calculated
Specifies that all the terms within the expression for a data item are aggregated according to their ownrollup rules, and then the results of those aggregations are computed within the overall expression.
For example, a list contains the data item Quantity with the Detail aggregation property set to Total. Youadd a query calculation named Quantity Calculated. You define its expression as Quantity + 100 and youset its Detail aggregation property to Calculated. When you run the report, the values for QuantityCalculated are computed by first adding all values for Quantity and then adding 100 to each value.
Note: In crosstabs, this function overrides any solve orders that are specified.
Count
Counts all existing values.
If the underlying data source is OLAP, Count behaves as follows if it is specified in the SummaryAggregation property for a data item.
Object Behavior
Level Count distinct is used. A warning appearswhen you validate the report.
Member set Count distinct is used. A warning appearswhen you validate the report.
Attribute Not supported. An error is returned when you runthe report.
Measure Supported.
If the underlying data source is dimensionally modeled relational (DMR), Count behaves as follows if it isspecified in the Detail aggregation or Summary aggregation property for a data item.
Object Behavior
Level Count distinct is used. A warning appearswhen you validate the report.
Member set Count distinct is used. A warning appearswhen you validate the report.
Attribute Supported.
Measure Supported.
If you add the count summary to a non-fact column in a list and then group the column, the column willnot be grouped when you run the report. To resolve this issue, group the column first before adding thecount summary.
Count Distinct
Returns the total number of unique non-null records.
Chapter 10. Dimensional Reporting Style 205

If the underlying data source is OLAP, count distinct behaves as follows if it is specified in theSummary aggregation property for a data item.
Object Behavior
Level Supported.
Member set Supported.
Attribute Not supported. An error is returned when you runthe report.
Measure Not supported. An error is returned when you runthe report.
If the underlying data source is dimensionally modeled relational (DMR), count distinct is supportedfor levels, member sets, attributes, and measures when it is specified in the Detail aggregation orSummary aggregation property for a data item.
Custom
Summarizes data based on an expression that you define.
Maximum
Selects the largest existing value.
Median
Returns the median value of the selected data item.
Minimum
Selects the smallest existing value.
None
Does not aggregate values.
If the underlying data source is relational, the data item is grouped when the query property Auto group& summarize is set to Yes.
Not Applicable
This function is available only for the Detail aggregation property. It specifies that the aggregate attributeis ignored. For example, the calculation will be applied after the data is aggregated.
This function differs from the Calculated function, which applies aggregation to the rows and thenperforms the calculation.
For example, for the average ( [Quantity] ) + 5 expression, when the Detail aggregation property is setto Not Applicable, five is added to the average of the single Quantity value. When the function is set toCalculated, five is added to the average of a set of numbers.
206 IBM Cognos Analytics - Reporting Version 11.0 : User Guide

This setting should not be applied to a simple model reference.
This setting is relevant only for reports that are upgraded from IBM Cognos ReportNet 1.x.
Standard Deviation
Returns the standard deviation of the selected data item.
Note: From a mathematical perspective, this function is not useful for small numbers of items and is notsupported if the query property Auto group & summarize is set to Yes.
Summarize
Aggregates data based on model or data type information. This function can be thought of as a calculateand then aggregate rule. Data is aggregated using the following rules:
If the underlying data source type is relational and the data item or calculation is a reference to a singlefact query item in the model that has the Regular Aggregate property set to Sum, Maximum, Minimum,Average, or Count, aggregate data using this function. Otherwise, data is aggregated according to thedata type of the data item as follows:
• Total is applied for numeric and interval values.• Maximum is applied for date, time, and date-time values.• Count is applied for everything else.
The underlying data source type can be dimensional and the data item or calculation a reference to asingle item in the model. In this case, if the Regular Aggregate property of the model item is notunknown, the summary function that corresponds to the Regular Aggregate property is applied. If theRegular Aggregate property is unknown, set the function to Calculated.
For example, a list contains the data item Quantity with the Detail aggregation property set to Average.You add a query calculation named Quantity Summarize. You define its expression as Quantity + 100 andyou set its Detail aggregation property to Summarize. When you run the report, the values for QuantitySummarize are computed by first adding 100 to each value for Quantity and then calculating the total.The total is calculated because Quantity contains numeric values and the expression for QuantitySummarize is not a simple data item reference. If Quantity Summarize is defined as Quantity, the functionAverage is applied to each value.
Total
Adds all existing values.
Variance
Returns the variance of the selected data item.
Note: From a mathematical perspective, this function is not useful for small numbers of items and is notsupported if the query property Auto group & summarize is set to Yes.
Mapping Summary Functions From Data Sources to Framework Manager and ReportingThe summary functions available in IBM Cognos Framework Manager and IBM Cognos Analytics -Reporting reflect summary functions supported by relational and dimensional data sources. The followingtable shows how summary functions in data sources are mapped to Framework Manager and Reporting.
Data source Framework Manager Reporting
None specified, or none Unsupported None
Chapter 10. Dimensional Reporting Style 207
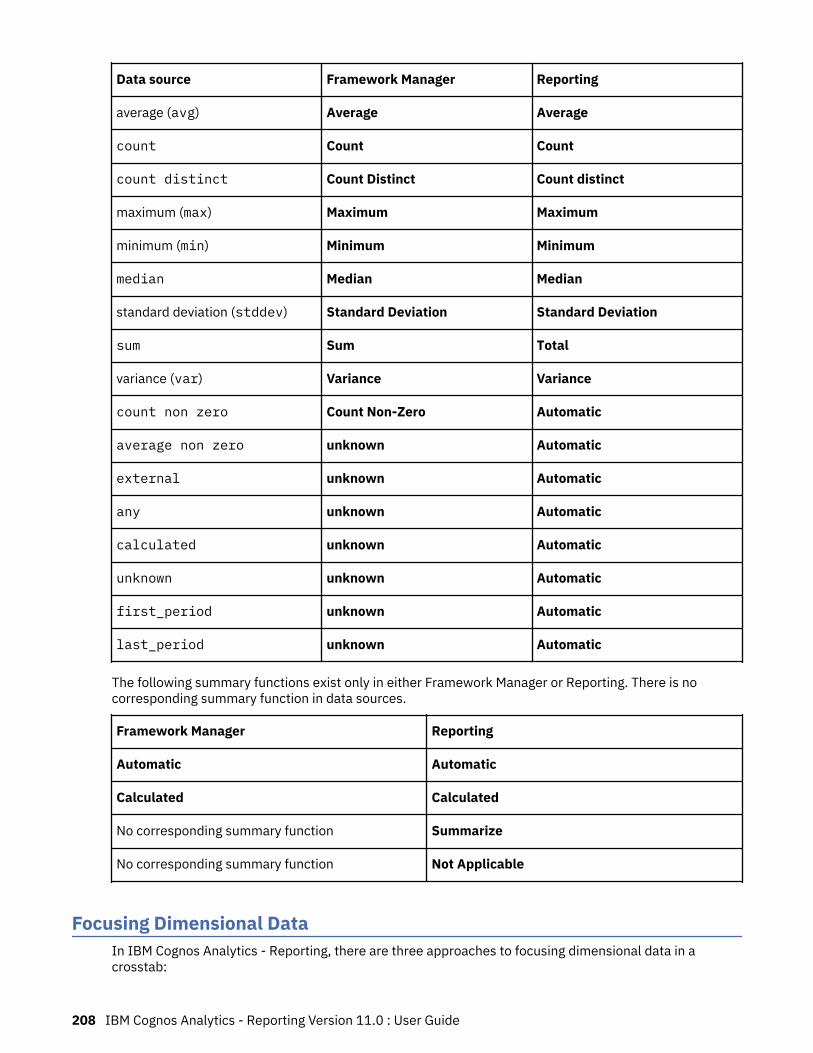
Data source Framework Manager Reporting
average (avg) Average Average
count Count Count
count distinct Count Distinct Count distinct
maximum (max) Maximum Maximum
minimum (min) Minimum Minimum
median Median Median
standard deviation (stddev) Standard Deviation Standard Deviation
sum Sum Total
variance (var) Variance Variance
count non zero Count Non-Zero Automatic
average non zero unknown Automatic
external unknown Automatic
any unknown Automatic
calculated unknown Automatic
unknown unknown Automatic
first_period unknown Automatic
last_period unknown Automatic
The following summary functions exist only in either Framework Manager or Reporting. There is nocorresponding summary function in data sources.
Framework Manager Reporting
Automatic Automatic
Calculated Calculated
No corresponding summary function Summarize
No corresponding summary function Not Applicable
Focusing Dimensional DataIn IBM Cognos Analytics - Reporting, there are three approaches to focusing dimensional data in acrosstab:
208 IBM Cognos Analytics - Reporting Version 11.0 : User Guide

• drag data items to the edges of your crosstab• drag data items to the context filter area• create set expressions on the edges of your crosstab that return members or sets of members, such as
the filter function
Note: Summary and detail filters are recommended only for focusing data in relational reporting.
The approach you choose should depend on the capabilities of the data source, the performancerequirements, the persistence of the dataset, and how complex you want the report to be.
If you filter values that are floating-point numbers, you may encounter imprecise filtering results due torounding or data truncation. Floating-point numbers may appear differently in the report than how thanhow they are stored in the data source. To ensure accurate results, your filter criteria should account forany rounding issues.
Consider the limitations when filtering dimensional data and when filtering data from SAP BW datasources.
You can also use prompts, or prompt controls, to allow users to provide input for the filter.
Related conceptsLimitations when filtering dimensional data sources
Create a context filterWhen working with dimensional data, you can use context filters, or slicer filters, to quickly focus yourreport on a particular view of the data.
For example, the following crosstab contains product lines in the rows, years in the columns, and revenueas the measure. We want to filter the values to show us the revenue for only Web orders from Asia Pacific.To change the context, you drag Asia Pacific and Web from the source tree to the Context filter section ofthe overview area. The crosstab then shows the revenue for only Asia Pacific and Web. Changing contextchanges only the values that appear. It does not limit or change the items in the rows or columns.
Figure 42. Crosstab showing revenue by product line by year filtered to show only Asia Pacific and weborders
The members that are used as the context filter appear in the report header when you run the report.
Any summary values in the report are recomputed to reflect the results returned by the context filter.
You can create multiple context filters to filter across two or more different hierarchies.
Tip: The Budget vs. Actual sample report in the Sales and Marketing (cube) package includes a contextfilter.
Note: There are limitations when using context filters:
• Calculated measures do not get suppressed by the filter. To avoid this, drag the desired members from
the Source tab directly onto the row or column edge instead of using the members in thecontext filter.
• Suppression can be slow on large cubes, because all of the data is retrieved and then filtered.
Chapter 10. Dimensional Reporting Style 209

If the desired data in the context filter is from a hierarchy that appears on the crosstab edge, drag thedesired members from the Source tab directly onto the crosstab edge.
If the desired data is from a hierarchy that does not appear on the crosstab edge, use a context filter inconjunction with other means to limit the data, such as a top or bottom filter.
To use a calculation or expression to define a context filter, create a slicer member set using the queryexplorer. A slicer member set is an expression that returns a set of members from the same dimension.For example, you can define a slicer member set that filters for the top five products with the greatestrevenue.
Context filters are different from other filters. When you filter data, members that do not meet the filtercriteria are removed from the report. A context filter does not remove members from a report. Instead,their values are filtered or you see blank cells.
You can also use context filters as prompts when the report is run.
When creating context filters,
• use only members from hierarchies that are not already projected on an edge of the crosstab• use only one member per hierarchy
Create a simple context filterWhen working with dimensional data, you can use context filters, or slicer filters, to quickly focus yourreport on a particular view of the data.
Procedure
1. Click the Data icon , and from the Source tab , select or search for one or more items onwhich to filter.
2. Drag the item on which to filter into the Context filter section of the overview area.3. To change context, select a new item from the Context filter box.
Create an advanced slicer filterTo use a calculation or expression to define a context filter, create a slicer member set using the queryexplorer. A slicer member set is an expression that returns a set of members from the same dimension.For example, you can define a slicer member set that filters for the top five products with the greatestrevenue.
Procedure
1. Click the Queries icon , and click the query for which you want to add a slicer.
2. Click the Toolbox icon and drag Slicer member set to the Slicer pane.3. Drag the members to the Expression Definition box.
You must join the members in the expression by using the set function. For example, the followingexpression contains the Fax and Telephone members from the Order Method dimension:
set ([Fax],[Telephone])4. To add members from another dimension, repeat step 2 to create a separate slicer member set.
Define a Prompt Using a Context FilterIf context filters (or slicers) are defined, you can use these filters to create prompts in the report.
Prompts provide questions that help users to customize the information in a report to suit their ownneeds. For example, you create a prompt so that users can select a region. Only data for the specifiedregion is retrieved and shown in the report.
210 IBM Cognos Analytics - Reporting Version 11.0 : User Guide

Before you begin
Before you define a prompt, you must create context filters.
Procedure
1. In the Context filter section of the overview area, click the down arrow next to the filter to use as aprompt.
2. Click Prompt and do one of the following:
• To remove the prompt, click No Prompt.• To allow users who run the report to select any member from the hierarchy, click Prompt on
Hierarchy.• To allow users who run the report to select from a list of members in the current level, click Prompt
on Level.
Sorting Dimensional DataYou can sort items to view them in your preferred order. By default, IBM Cognos Analytics - Reportingretrieves items in the order defined in the data source. OLAP data sources always have a defined order.The data modeler defines the sorting options in the model.
For more information about data modeling, see the IBM Cognos Framework Manager User Guide.
Tip: The Sales Growth Year Over Year sample report in the GO Data Warehouse (analysis) packageincludes sorting.
Limitations When Sorting SAP BW Data
If you use a SAP BW data source, each level in a hierarchy has an item with the same name as the leveland a role of _businessKey. Such items are known as level identifiers. You should use only the levelidentifier of all the time-related characteristics, such as 0CALDAY and 0CALMONTH, for sorting. All other(attribute) items in these hierarchies are formatted string representations of the characteristic values withwhich they are associated. These formatted values sort alphanumerically and not chronologically.
Tip: By level identifier, we are referring to a query item with the same name as the level that has the roleof _businessKey. Each level in a SAP BW hierarchy has a level identifier.
Sort Sets by LabelYou can sort sets of members based on their label (or caption). By default, when you select Sort by Label,Ascending or Descending, the members within the set are sorted only by their labels. You can alsoperform advanced sorting to sort sets using an intersection (tuple) or a member property.
For example, a set contains regions and you sort the regions within the set in descending alphabeticalorder. Only extended data items that represent sets support set sorting.
Before you can perform set sorting, you must create sets for the members in your report.
You cannot sort data items from different dimensions that are intermixed. For example, if you have yearsand products on the same edge and at the same level in your crosstab, you can sort the years, and youcan sort the product lines, but you cannot sort them as combined set because years and products comefrom different dimensions.
Procedure
1. In a crosstab, select a set to sort.
2. In the report object toolbar, click the sort button and under Sort by Label, click Ascending orDescending.
Chapter 10. Dimensional Reporting Style 211

Tip: To remove a sort order, click Don't Sort.
Sort Sets in the Opposite Axis by ValueYou can sort members in the sets on the opposite axis based on the value of a member or measure thatyou select.
For example, a crosstab contains years inserted as individual members in the columns, product linesinserted as a member set in the rows, and revenue as the measure. You select the 2012 column and thenselect Sort by Value, Descending. The values in the 2012 column are sorted.
Figure 43. Crosstab showing revenue by year by product line with the 2012 column sorted in descendingorder
Before you can perform this sorting, you must create sets for the members in your report.
In nested crosstabs, items are sorted based on the values of the innermost nested row or column of theopposite axis. For example, a crosstab contains years in the columns and retailers nested within productline in the rows. Select 2012, sort in descending order, and you see retailers listed from the largest valueto the smallest value for each product line.
Procedure
1. In a crosstab, select a member or measure to sort.
For example, to sort a set in the row axis, select a member or measure in the column axis.
2. In the report object toolbar, click the sort button and under Sort by Value, click Ascending orDescending.
Tip: To remove a sort order, click Don't Sort.
Perform Advanced Set SortingIf you use dimensional data, you can sort using the property of a member.
For example, your report includes employee names and you want to sort the employees using the genderproperty. You can also sort using an intersection of members, also known as a tuple. For example, youwant to sort the employees using the value of sick days taken for the year 2012.
Procedure
1. Select a set.
2. In the report object toolbar, click the sort button and under Other Sort Options, click Edit setsorting.
3. Specify the sorting options.4. If you are sorting members from different levels and want to preserve the hierarchy, select the
Hierarchized sorting check box.5. To sort items using a member property, under Sort by, click Property, navigate the tree, and select the
member property to use.6. To sort items using an intersection of members, or a tuple, under Sort by, click Intersection (tuple)
and click the ellipsis button. Then, from the Available members and measures box, select the items
212 IBM Cognos Analytics - Reporting Version 11.0 : User Guide
to use and click the right arrow to move them to the Intersection members and measures box. You
can also select items from the Calculated members and measures tab .
Working with Dimensional QueriesQueries specify what data appears in the report. In IBM Cognos Analytics - Reporting, you create andmodify queries using Query Explorer.
Query Explorer provides an alternative way to modify existing reports or to author new reports. You canuse Query Explorer to perform complex tasks and other tasks that are more difficult to do in the reportlayout. For example, use Query Explorer to
• improve performance by changing the order in which items are queried from the database, or bychanging query properties to allow the report server to execute queries concurrently where possible
Note: Only queries that are referenced in the report layout can be executed concurrently. If a query isdefined in Query Explorer by joining two or more existing queries, IBM Cognos Analytics cannot executethe source queries concurrently. By default, queries run sequentially. Your administrator must enablethe concurrent query execution feature. For more information, see the IBM Cognos AnalyticsAdministration and Security Guide.
• view or add filters and parameters and modify their properties• view or add dimensions, levels, and facts• incorporate SQL statements that come from other reports or reports that you write• create complex queries using set operations and joins
Related conceptsQueries
Specify a List of Data Items for an ObjectSpecify the list of data items for an object when you must reference a data item that is in a query but isnot in the layout.
For example, you want to add a layout calculation to a list that uses a data item that is in the querydefinition. If the data item does not appear in the list, you must reference it in order to make the layoutcalculation work. You must also specify the list of data items if you apply conditional formatting that usesa data item that is not in the query.
Procedure
1. Click a layout object.
2. Click the Show properties icon , and in the Properties pane, double-click the Properties propertyand select data items.
Relate a Query to a LayoutQueries and layouts work together. After you decide the type of data that you need, you must create alayout in which to show the results. Each column of data must be both selected for the query and shownin a layout unless there are some columns that you do not want to show. The query and layout portions ofa report must be linked to produce a valid report.
IBM Cognos Analytics - Reporting automatically links query and layout. For example, when you useReporting and the list report layout, query and layout are automatically linked.
Chapter 10. Dimensional Reporting Style 213

Procedure
1. Select a data container.
2. Click the Show properties icon , and in the Properties pane, set the Query property to a query.
3. Click the Data icon , and from the Data items tab , drag data items from the query tothe data container.
Using Dimensional Data Sources with QueriesWhen you are working with SAP BW data sources, you can use only a single hierarchy in a query.
Creating queries using a mix of OLAP and relational data is not supported. If you create queries using adatabase for which you do not know the type, consult your database administrator or modeler.
When performing multi-cube queries using dimensional data sources, the following restrictions apply:
• Only basic operators (+, *, /,-) are available for cross-cube calculations.• Inner joins are not supported.• All joins for multi-cube queries are outer joins.• Viewing MDX using the Generated SQL/MDX query property may not show you the actual MDX that is
executed. This is because when a multi-cube query is executed, a number of smaller queries areactually executed.
Related conceptsProblems with large SAP BW queries
Connecting Queries Between Different Data SourcesThis section lists the data sources between which you can and cannot connect queries.
IBM Cognos Analytics supports the following:
• RDBMS to RDBMS joins• set operations of any two queries• master detail relationships between any two queries• drill from any query to any other query
You cannot create the following types of joins:
• cube-to-cube (homogeneous)• cube-to-cube (heterogeneous)• cube-to-RDBMS• cube-to-SAP BW• SAP-BW-to-RDBMS
Multiple-fact QueriesYou must understand the result of a query on more than one fact table to achieve the results that youwant. The result of a multiple-fact query varies depending on whether you are working with conformed ornon-conformed dimensions, on the level of granularity, and on the additive nature of the data.
The GO Data Warehouse (analysis) package has characteristics that affect the results if you use amultiple-fact query with the Inventory and Sales namespaces. Granularity for time differs in thatinventory levels are recorded monthly and sales are recorded daily. Also, Sales includes a non-conformeddimension, Order method.
The following examples will help you interpret the results of a multiple-fact query and understand theoptions for changing a query to obtain the results that you want.
214 IBM Cognos Analytics - Reporting Version 11.0 : User Guide
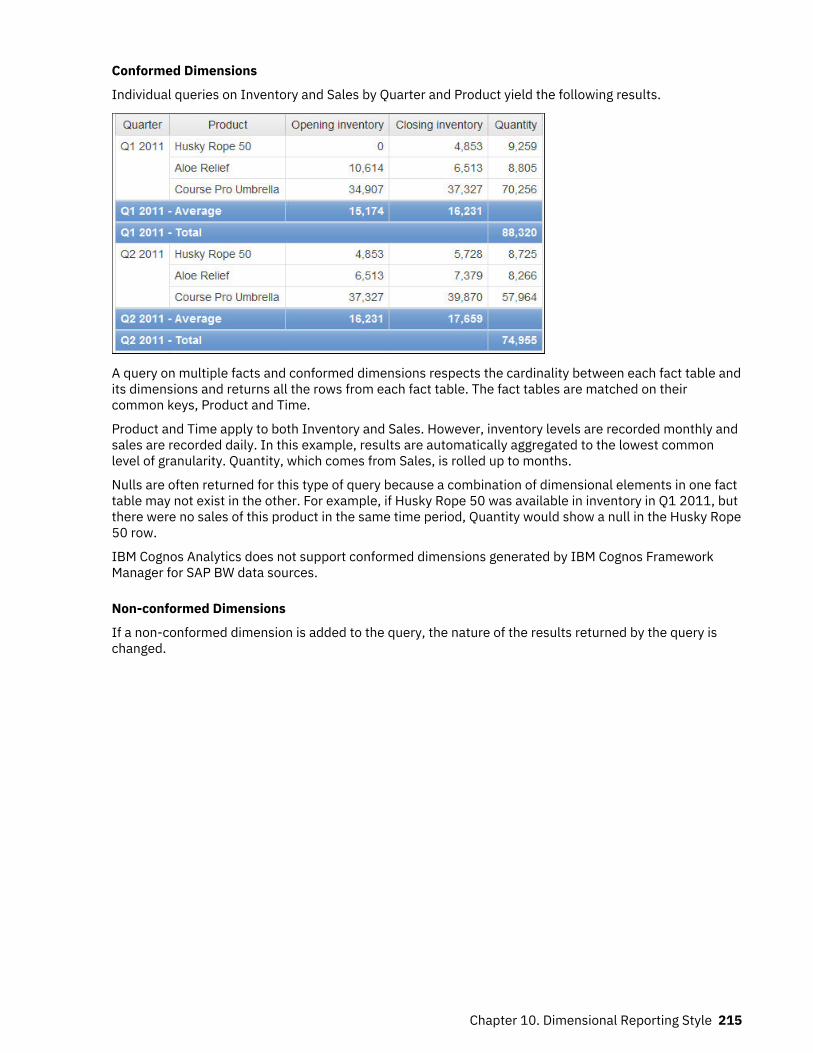
Conformed Dimensions
Individual queries on Inventory and Sales by Quarter and Product yield the following results.
A query on multiple facts and conformed dimensions respects the cardinality between each fact table andits dimensions and returns all the rows from each fact table. The fact tables are matched on theircommon keys, Product and Time.
Product and Time apply to both Inventory and Sales. However, inventory levels are recorded monthly andsales are recorded daily. In this example, results are automatically aggregated to the lowest commonlevel of granularity. Quantity, which comes from Sales, is rolled up to months.
Nulls are often returned for this type of query because a combination of dimensional elements in one facttable may not exist in the other. For example, if Husky Rope 50 was available in inventory in Q1 2011, butthere were no sales of this product in the same time period, Quantity would show a null in the Husky Rope50 row.
IBM Cognos Analytics does not support conformed dimensions generated by IBM Cognos FrameworkManager for SAP BW data sources.
Non-conformed Dimensions
If a non-conformed dimension is added to the query, the nature of the results returned by the query ischanged.
Chapter 10. Dimensional Reporting Style 215

Order method type exists only in Sales. Therefore, it is no longer possible to aggregate records to a lowestcommon level of granularity because one side of the query has dimensionality that is not common to theother side of the query. Opening inventory and Closing inventory results are repeated because it is nolonger possible to relate a single value from these columns to one value from Quantity.
Grouping on the Quarter key demonstrates that the result in this example is based on the same data setas the query on conformed dimensions. Summary values are the same. For example, the total quantity forQ1 2011 is 88,320 in both examples.
Filters on Non-conformed Dimensions
By default, to improve performance, filters are applied at the database level. The default behavior canresult in unexpected nulls when you add a filter to a multiple-fact query. If you create a filter on the Ordermethod dimension to show only the fax order method and apply the filter at the data source, the reportincludes nulls.
216 IBM Cognos Analytics - Reporting Version 11.0 : User Guide

The filter is applied only to one subject area, Sales. Because Order method type does not exist inInventory, all products still appear in the report. For example, Course Pro Umbrella was in inventory in Q22012. Because there were no sales using the fax order method for this product in Q2 2012, Order methodtype and Quantity are null.
To remove the nulls, change the filter so that it is applied to the result set instead of the data source. Byapplying the filter to the result set, you get the same results that you would get if you were working withconformed dimensions. Only the products that were ordered using the fax order method appear in thereport.
Chapter 10. Dimensional Reporting Style 217
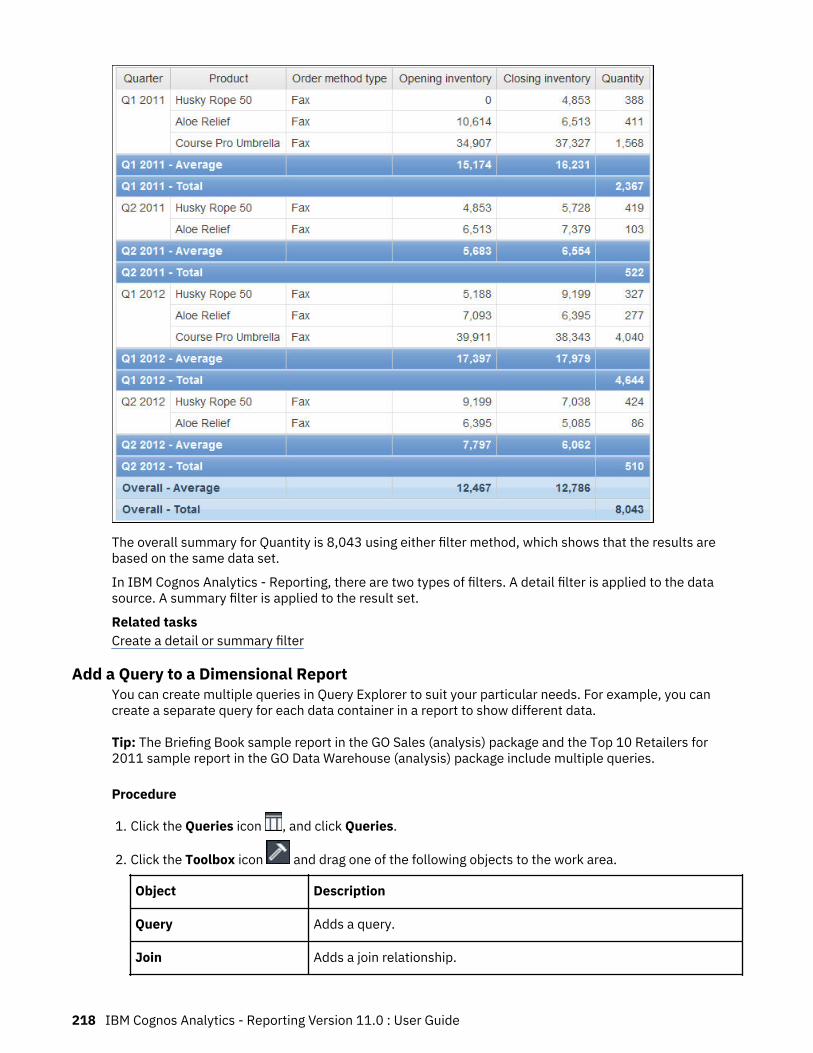
The overall summary for Quantity is 8,043 using either filter method, which shows that the results arebased on the same data set.
In IBM Cognos Analytics - Reporting, there are two types of filters. A detail filter is applied to the datasource. A summary filter is applied to the result set.
Related tasksCreate a detail or summary filter
Add a Query to a Dimensional ReportYou can create multiple queries in Query Explorer to suit your particular needs. For example, you cancreate a separate query for each data container in a report to show different data.
Tip: The Briefing Book sample report in the GO Sales (analysis) package and the Top 10 Retailers for2011 sample report in the GO Data Warehouse (analysis) package include multiple queries.
Procedure
1. Click the Queries icon , and click Queries.
2. Click the Toolbox icon and drag one of the following objects to the work area.
Object Description
Query Adds a query.
Join Adds a join relationship.
218 IBM Cognos Analytics - Reporting Version 11.0 : User Guide

Object Description
Union Adds a union operator.
Intersect Adds an intersect operator.
Except Adds an except (minus) operator.
SQL Adds SQL commands.
MDX Adds MDX commands.
Note: When adding queries to the report
• right-click the work area and click Show Package Sources to see the queries that use data itemsfrom a package
• right-click the work area and click Expand References to see the relationships that exist betweenqueries in the report, which is useful when you are creating complex queries
3. Select an object, click the Show properties icon , and In the Properties pane, set the objectproperties.
4. Double-click a query.
5. Click the Data icon , and from the Source tab , drag data items to the Data Items pane.
Tip: You can add data items to the query that you do not want to appear in the layout. For example, tofilter on Product line code and show Product line in the layout, you must add both data items to thequery.
6. To create a new data item, click the Toolbox icon and drag Data Item to the Data Items pane.7. To add a filter, click the Toolbox icon and drag Filter to the Detail Filters or Summary Filters pane
and define the filter expression.
Tip: You can also create a filter by dragging a data item from the Source tab to one of the filters panesand completing the filter expression. When working with a dimensional data source, you can quicklyfilter data by dragging a member to a filter pane instead of dragging the level to which the memberbelongs. For example, dragging the member 2012 from the Years level will filter data for the year2012. This method is quicker than dragging the Years level and specifying data only for the year 2012in the filter expression.
Add Dimension Information to a QueryAdd dimension information to a query when the data source has no dimension information available orwhen you want to override, extend, or restrict the information.
Add dimension information if any of the following apply:
• There is no dimension information available in the data source.
For example, the data source contains flat data that you want to model dimensionally.• You want to override the dimension information in the data source.• You want to extend or restrict dimension information in the data source.
If you do not add dimension information and the data source contains dimensions, then the dimensionstructure of the data source is used. If the data source contains no dimensions, IBM Cognos Analyticscreates a default dimension structure.
Chapter 10. Dimensional Reporting Style 219

Dimension information is not intended to define the presentation of information, but to help queryplanning. Dimension information can be considered as a form of query hint. In addition, users will not beable to drill down on dimensions that you add to a report.
Note: Adding dimension information is not supported in reports that use the dynamic query mode.
Procedure
1. Click the Queries icon , and click a query.
2. Click the Show properties icon , and in the Properties pane, set the Override dimension infoproperty to Yes.
3. Double-click the query.
The Dimension Info tab appears in the work area.4. Click the Dimension info tab.
5. To create a dimension from an existing data item, click the Data icon , and from the Source tab
, drag the data item to the Dimensions pane.
IBM Cognos Analytics - Reporting automatically generates the entire dimension.
6. To create a new dimension, click the Toolbox icon and drag Dimension to the Dimensions pane,and then build the new dimension by adding objects to the dimension:
• To create a level, drag Level.• To create a level hierarchy, drag Level hierarchy.• To create a member hierarchy, drag Member hierarchy.
For information about these objects, see “Add dimensional data to a report” on page 187.7. Click the Data icon, and from the Source tab, drag data items to the objects you added in the previous
step.
For example, if you created a level, define a key by dragging a data item to the Keys folder.8. To create a fact, from the Source tab, drag a data item to the Facts pane.
Create a Master Detail RelationshipCreate a master detail relationship to deliver information that would otherwise require two or morereports. For example, you can combine a list with a chart. The list can contain product lines and the chartcan show details for each product line.
Master detail relationships must appear in nested frames to produce the correct results. You can create amaster detail relationship in two ways:
• Use a parent frame for the master query and a nested frame for the detail query.• Associate a report page with the master query and use a data container, such as a list or crosstab, for
the detail query.
You cannot display parent data in the child frame or child data in the parent frame. Also, you cannotperform calculations across master detail queries.
When you are working with dimensional data, IBM Cognos Analytics - Reporting does not support masterdetail relationships that use a custom group.
You can use a master detail relationship to show data from separate data sources in a single report.However, the data sources must be contained in the same package.
With the dynamic query mode, master detail reports with a crosstab report object are optimized to use asingle query whenever possible, rather than a separate query for each report object instance.
220 IBM Cognos Analytics - Reporting Version 11.0 : User Guide

If you are working with an SAP BW data source, you cannot use a data item from the master query thatcontains non-ASCII values.
Before you begin
To create a master detail relationship using queries that reference two different dimensional datasources, you must first link the members by aliasing the levels that contain the members.
Procedure
1. To use a parent frame for the master query and a nested frame for the detail query:
• Click the Toolbox icon and drag a List, Repeater Table, or Repeater to the report.• Add a second data container to the object you inserted.
You can insert a list, crosstab, chart, repeater table, or repeater into a list. You can add a list to arepeater table or repeater.
• Add data items to both data containers.2. To associate a report page with the master query and use a data container for the detail query:
• Click anywhere in the report page.
• Click the Show properties icon , and In the Properties pane, click the Select ancestor icon and click Page.
• Set the Query property.• Click the Toolbox icon, drag a data container to the report.
3. To link a data item in the master query to a parameter in the detail query instead of to another dataitem, create the parameter in the detail query.
Use parameters to filter values at a lower level in the detail query.
• Click the Queries icon , and click the detail query.
• Click the Toolbox icon and drag the Filter object to the Detail Filters box.• In the Expression Definition box, create the parameter.
4. Click the Pages icon , and click the report page.5. Click anywhere in the report page.6. Click the Show properties icon, and In the Properties pane, click the Select ancestor icon and click
Page.7. Click the data container containing the details.8. In the Properties pane, click the Master detail relationships property.9. Click New Link.
10. In the Master box, click the data item that will provide the primary information.11. To link the master query to a data item, in the Detail box, click the data item that will provide the
detailed information.12. To link the master query to a parameter, in the Parameters box, click the parameter that will provide
the detailed information.
Tip: To delete a link, select the link and press the Delete key.13. If your detail query object is a chart, you can disconnect a chart title from the master query.
• Click the chart title, and from the Properties pane, click Master detail relationships.• Clear the Use the master detail relationships from the chart check box.
Chapter 10. Dimensional Reporting Style 221

14. If the master detail relationship includes a chart as the detail and you are using automatic axisranges, you can set the same axis range for all the detail charts:
• Select the axis.• In the Properties pane, under General, double-click the Axis range property.• Under Maximum and Minimum, click Automatic.
The master detail report option is only available with automatic axis ranges.• Under Master detail reports, select the Same range for all instances of chart check box.
For more information about axis ranges, see “Change the axis scale of a current default chart” onpage 84.
Tip: To avoid seeing the same data item twice in the report, click the data item in the data container
driven by the detail query. In the report object toolbar, click the More icon and click Cut. Thisremoves the item from the report display but keeps it in the query.
Related conceptsMaster Detail or Burst Reports with Charts or Crosstabs May Result in Denial of Service
Link Members from Two Data SourcesIf you create a master detail relationship using queries that reference two different dimensional datasources, you may need to create a relationship between levels with the same member captions butdifferent Member Unique Names (MUNs).
For more information about MUNs, see “Recommendation - Use Member Unique Name (MUN) Aliases” onpage 397.
For example, you may want to link the Americas member in the Sales territory level in the SampleOutdoors cube with Americas in the GO Subsidiary level in the Sample Outdoors Finance cube. To createthe relationship, you must alias the levels that contain the members to link.
Procedure
1. Select the parent frame or the report page, click the More icon , and click Go to query.2. Add a query calculation to the query.
a) Click the Toolbox icon and drag the Query calculation tool to the Data Items box.b) In the Create calculation window, click the Other expression radio button and click OK.c) In the Name box, type a name for the calculation.d) In the Expression Definition box, type the following expression:
caption (data item name)
For example, caption ( [great_outdoors_company].[Sales Territory].[SalesTerritory].[Sales territory] )
3. Replace the level that contains the member that will provide the primary information with thecalculation.
a) Click the Pages icon , and click the report page from step 1.
b) Click the Data icon and then click the Data items tab .c) From the query where you created the query calculation, drag the calculation to the parent frame or
the report page, beside the level that you are replacing.d) Delete the level.
4. Repeat steps 1 to 3 for the level in the data container that contains the details.
222 IBM Cognos Analytics - Reporting Version 11.0 : User Guide

A caption alias is created for each level. You can now use the caption alias for each level to create amaster detail relationship using member captions, which are the same, instead of MUNs, which aredifferent.
ResultsYou can now create the master detail relationship between the two levels.
Working with Queries in SQL or MDXFor each query in a report, you can work with the SQL or MDX that is executed when you run a report.
Note: MDX is not available with DMR data sources.
View the SQL or MDX for an Entire Report or a QueryView the SQL or MDX to see what is passed to the database when you run a report.
Only SQL is available when using DMR data sources because these data sources were relational.
Procedure
1. To view the SQL or MDX for the entire report, click the Queries icon , right-click the Report icon ,and click Show Generated SQL/MDX.
This option shows the SQL or MDX that will be executed in the data source. The SQL or MDX isorganized by query and by query result. If a query is used in more than one data container, a queryresult is generated for each data container.
2. To view the SQL or MDX for a specific query, do the following:
• Click the Queries icon, and click the query.
• Click the Show properties icon , and In the Properties pane, double-click the Generated SQLproperty.
The Generated SQL property shows the SQL or MDX that is executed when you view tabular data(right-click a query and click View Tabular Data). Tabular data shows the data that is produced by thequery in the form of a list. You can use this property to help you build advanced queries.
ResultsThe SQL or MDX for the query appears in the Generated SQL dialog box. For SQL, you can choose to viewnative SQL, which is the SQL that is passed to the database when you execute the query, or IBM CognosSQL, which is a generic form of SQL that IBM Cognos Analytics - Reporting uses. Cognos SQL is convertedto native SQL before the query is executed.Related tasksShowing prompt values in generated SQL or MDX
Build a Report Using Your Own SQL or MDXYou can build a report by adding SQL or MDX from an external source, such as another report.
If you are working with MDX, you must be aware of the MDX syntax that IBM Cognos Analytics - Reportingsupports.
If you edit the SQL of a query, you must change the Processing property for that query to Limited Local.
You cannot build a report by adding your own MDX if the data source is IBM Cognos TM1®. IBM CognosTM1 does not support custom MDX.
Procedure
1. Create a new report and choose the Blank template.
Chapter 10. Dimensional Reporting Style 223

2. Click the Queries icon , and click Queries.
3. Click the Toolbox icon and drag Query to the work area.4. From the Toolbox, do one of the following:
• To build an SQL query, drag SQL to the right of the query.• To build an MDX query, drag MDX to the right of the query.
Tip: You can drag SQL or MDX anywhere in the work area, and Cognos Analytics - Reporting willautomatically create a query.
5. Click the Show properties icon , and In the Properties pane, double-click the Data sourceproperty and click a data source.
6. If required, set the Catalog property to the name of the catalog.7. Double-click the SQL or MDX property and type the SQL or MDX.8. Click Validate to check for errors.9. If you are working with SQL, select the query, and in the Properties pane, set the Processing
property to Limited Local.10. Double-click the query.
If the SQL or MDX is valid, the data items defined in the SQL or MDX appear in the Data Items pane.
11. Click the Pages icon , and click a report page.12. Click the Toolbox icon and drag an object to the work area.
For example, drag a list, crosstab, chart, or repeater.13. Click the data container.
14. Click the Show properties icon, and In the Properties pane, click the Select ancestor icon andclick the container you just created.
For example, if you created a list, click List.
Tip: You can also click the container selector (three orange dots) of the container to select it.15. Set the Query property to the query for the report type.
16. Click the Data icon , and from the Data Items tab , drag the items from the query youchose in the previous step to the data container.
Convert a Query to SQLYou can convert a query to SQL to edit it. You may want to do this to improve performance or to use SQLfeatures that are not supported directly by IBM Cognos Analytics - Reporting.
Converting a query to SQL is an irreversible process.
Procedure
1. Click the Queries icon , and click the query.
2. Click the Show properties icon , and In the Properties pane, double-click the Generated SQLproperty.
3. Click OK and then click Convert.4. Click Validate to check for errors.5. Select the query, and In the Properties pane, set the Processing property to Limited Local.
224 IBM Cognos Analytics - Reporting Version 11.0 : User Guide

Edit the SQL or MDXYou can edit the SQL or MDX for a query that has been created as an SQL or MDX query or that has beenconverted to SQL.
Procedure
1. Click the Queries icon , expand the query, and click the SQL or MDX item under the query.2. In the work area, double-click the SQL or MDX item.3. Make changes in the text box.
If you are working with MDX, you must be aware of the MDX syntax that IBM Cognos Analytics -Reporting supports.
4. Click Validate to check for errors.
First-Rows OptimizationThe SQL produced by IBM Cognos Analytics - Reporting depends on the report format you choose. Forexample, if you specify HTML format, first-rows optimization is requested. All-rows is requested if youspecify PDF.
It is important for database administrators and programmers to remember that Cognos Analytics -Reporting does not always use first-rows optimization. If you assume first-rows optimization is alwaysrequested, this can cause the RDBMS optimizer to process the query differently than you expect.
Supported MDX SyntaxIf you are working with MDX, you must be aware of the syntax that IBM Cognos Analytics - Reportingsupports. Cognos Analytics - Reporting supports the MDX grammar as specified in Microsoft Data AccessSoftware Developer Kit version 2.8.
Cognos Analytics - Reporting supports the following MDX functions. This is a partial list and applies onlywhen you are working with the following data sources:
• cubes• SAP BW• IBM Cognos TM1• IBM Db2 OLAP• IBM Cognos Consolidation• IBM Cognos Contributor
For these data sources, IBM Cognos Analytics uses a variation of the Microsoft SQL Server AnalysisServices syntax.
• Acos• Aggregate• Ancestor• Ancestors• Asin• Atan• Avg• BottomCount• BottomPercent• BottomSum• Children• ClosingPeriod• CoalesceEmpty
Chapter 10. Dimensional Reporting Style 225

• Convert• Cos• Cosh• Count• Cousin• Crossjoin• CurrentMember• DefaultMember• Descendants• Dimension• Distinct• Except• Exp• Filter• FirstChild• FirstSibling• Generate• Head• Hierarchize• Hierarchy• IIf• Intersect• Is• IsAncestor• IsEmpty• Item• Lag• LastChild• LastPeriods• LastSibling• Lead• Level• Levels• LinkMember• Ln• Log10• Max• Median• Members• Min• Mtd• Name• NextMember
226 IBM Cognos Analytics - Reporting Version 11.0 : User Guide
• OpeningPeriod• Order• Ordinal• ParallelPeriod• Parent• PeriodsToDate• PrevMember• PreviousMember• Properties• Qtd• Rank• Siblings• Sin• Sinh• Stddev• Subset• Sum• Tail• Tan• Tanh• TopCount• TopPercent• TopSum• Union• Value• Var• Wtd• Ytd
Using Dimensional CalculationsInsert a calculation to make your report more meaningful by deriving additional information from the datasource. For example, you create an invoice report, and you want to see the total sale amount for eachproduct ordered. Create a calculated column that multiplies the product price by the quantity ordered.
You build calculations in the expression editor using functions.
If a calculation is used in multiple reports, or by different report authors, ask your modeler to create thecalculation as a standalone object in the model and include it in the relevant package.
Related conceptsConsiderations when Creating Calculations
Create a Simple Member CalculationWhen working with dimensional data sources, you can select members in your report and create simplecalculations.
In addition to simple arithmetic calculations, you can perform the following calculations:
Chapter 10. Dimensional Reporting Style 227

Calculation Description
Rollup Summarizes, or rolls up, all the values of theselected items in a hierarchy.
% Calculates the value of a selected item as apercentage of another item.
% Difference Calculates the difference between two items as apercentage.
% Of Base This calculation is only available if you select twomembers from different hierarchies, each from adifferent edge.
This calculation takes the first selected memberfrom edge A and the second selected memberfrom edge B. The calculation result of a percent ofbase should be such that all the values for memberA will compare itself to the intersect value ofmember A and B.
For example, you have a crosstab showing quantitysold by year by product line. You select 2012 andCamping Equipment, right-click the selection,click Calculate, and then click % of Base (2012,Camping Equipment). The calculated row showsthe percentage value of each product line for 2012as compared to Camping Equipment for 2012.
Custom Allows you to specify your own value whenperforming a simple arithmetic calculation. Alsoallows you to change the order of operands or typea custom name for the new calculated row orcolumn.
Procedure
1. Select the items in the report to calculate.
2. In the report object toolbar, click the insert calculation button and select the calculation toperform.
Tip: Calculations that are not applicable to the items you selected are grayed out.3. To change the order of the operands or the name of the calculated item added to the report, click
Custom.
ResultsThe calculation appears as a new row or column in the report.
Insert a Query CalculationWhen working with dimensional data, insert a query calculation into your report to add a new row orcolumn with values that are based on a calculation. For example, you create a query calculation namedEuros that converts dollars to euros by multiplying an existing dollar measure by a conversion rate. Euroscan then be displayed to end users in a separate row or column.
In IBM Cognos Analytics - Reporting you can create the following types of calculations:
228 IBM Cognos Analytics - Reporting Version 11.0 : User Guide
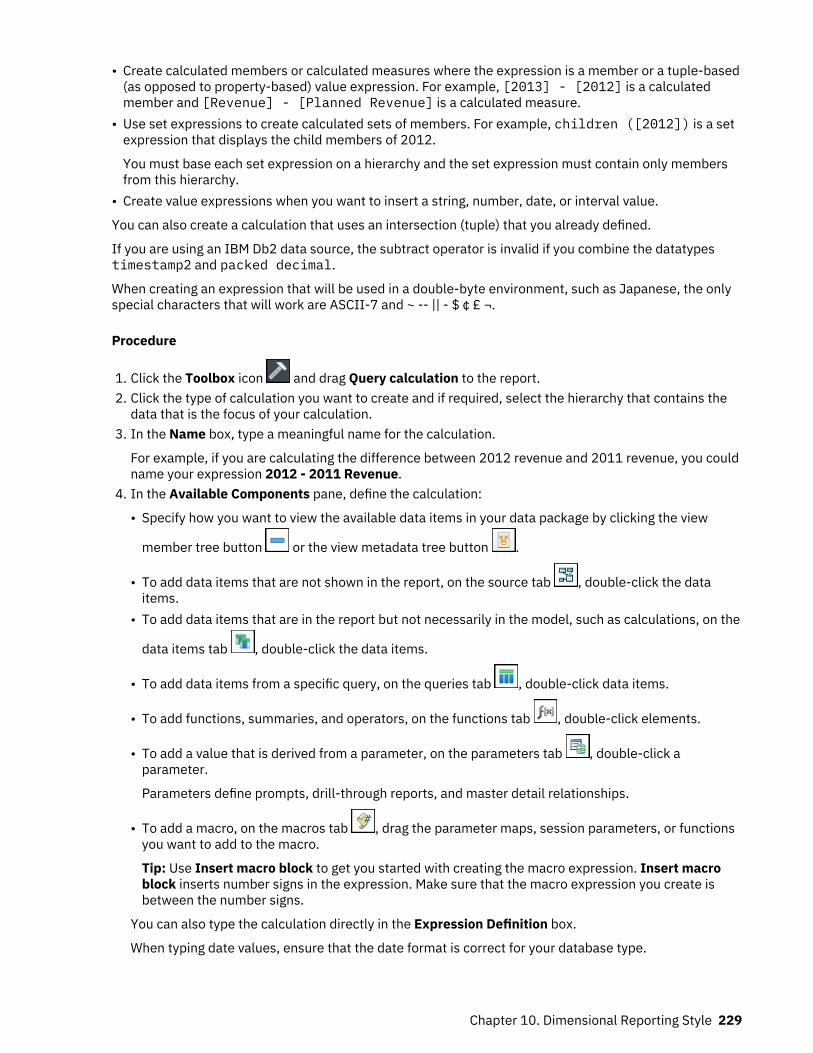
• Create calculated members or calculated measures where the expression is a member or a tuple-based(as opposed to property-based) value expression. For example, [2013] - [2012] is a calculatedmember and [Revenue] - [Planned Revenue] is a calculated measure.
• Use set expressions to create calculated sets of members. For example, children ([2012]) is a setexpression that displays the child members of 2012.
You must base each set expression on a hierarchy and the set expression must contain only membersfrom this hierarchy.
• Create value expressions when you want to insert a string, number, date, or interval value.
You can also create a calculation that uses an intersection (tuple) that you already defined.
If you are using an IBM Db2 data source, the subtract operator is invalid if you combine the datatypestimestamp2 and packed decimal.
When creating an expression that will be used in a double-byte environment, such as Japanese, the onlyspecial characters that will work are ASCII-7 and ~ -- || - $ ¢ £ ¬.
Procedure
1. Click the Toolbox icon and drag Query calculation to the report.2. Click the type of calculation you want to create and if required, select the hierarchy that contains the
data that is the focus of your calculation.3. In the Name box, type a meaningful name for the calculation.
For example, if you are calculating the difference between 2012 revenue and 2011 revenue, you couldname your expression 2012 - 2011 Revenue.
4. In the Available Components pane, define the calculation:
• Specify how you want to view the available data items in your data package by clicking the view
member tree button or the view metadata tree button .
• To add data items that are not shown in the report, on the source tab , double-click the dataitems.
• To add data items that are in the report but not necessarily in the model, such as calculations, on the
data items tab , double-click the data items.
• To add data items from a specific query, on the queries tab , double-click data items.
• To add functions, summaries, and operators, on the functions tab , double-click elements.
• To add a value that is derived from a parameter, on the parameters tab , double-click aparameter.
Parameters define prompts, drill-through reports, and master detail relationships.
• To add a macro, on the macros tab , drag the parameter maps, session parameters, or functionsyou want to add to the macro.
Tip: Use Insert macro block to get you started with creating the macro expression. Insert macroblock inserts number signs in the expression. Make sure that the macro expression you create isbetween the number signs.
You can also type the calculation directly in the Expression Definition box.
When typing date values, ensure that the date format is correct for your database type.
Chapter 10. Dimensional Reporting Style 229

To copy and paste expression components in the Expression Definition pane, you can use the copy
button and the paste button .
5. Click the validate button .
Any validation errors appear on the Errors tab of the Information pane.
Tip: To copy and paste expression components in the Expression Definition pane, you can use the
copy button and the paste button .
Related conceptsUsing query macros
Create a Layout CalculationCreate a layout calculation to add run-time information to your report, such as current date, current time,and user name.
When you create layout calculations, unsupported functions do not appear in the Functions tab of theexpression editor. Specifically, there is no Summaries folder, and some operators, constants, andconstructs are also unavailable. These functions are not available because only the database can performthem. Report expressions and calculations based on layout expressions are performed in IBM CognosAnalytics - Reporting.
To see the complete list of functions available in the expression editor, except for report functions, createa query calculation. All functions are available when you create a query calculation because thesecalculations are performed in the database and not in Cognos Analytics - Reporting.
Procedure
1. Click the Toolbox icon and drag Layout calculation to the report.2. In the Available Components box, define the calculation:
• To add data items that are not shown in the report, on the source tab , double-click data items.
• To add data items from a specific query, on the queries tab , double-click data items.
• To add functions, summaries, and operators, on the functions tab , double-click elements.
• To add a value that is derived from a parameter, on the parameters tab , double-click aparameter.
Parameters define prompts, drill-through reports, and master detail relationships.
Tips:
• You can also type the calculation directly in the Expression Definition box.• When typing date values, ensure that the date format is correct for your database type.• To copy and paste expression components in the Expression Definition pane, you can use the copy
button and the paste button .
3. Click the validate button .
230 IBM Cognos Analytics - Reporting Version 11.0 : User Guide
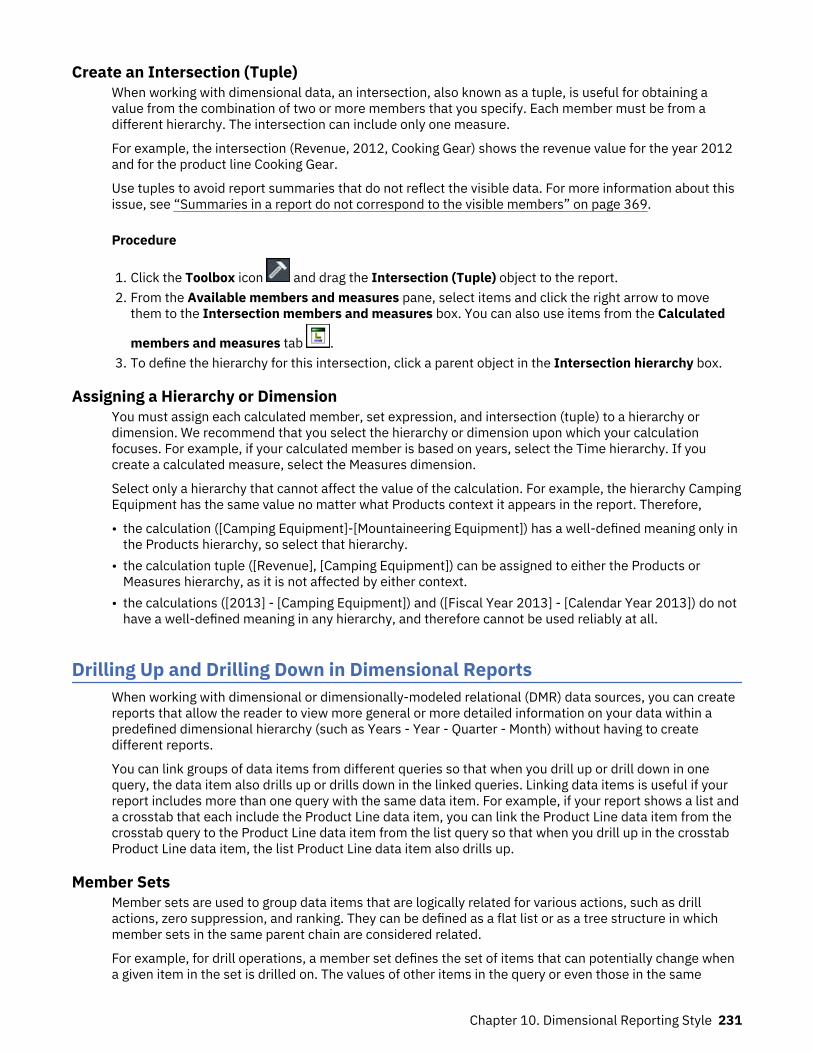
Create an Intersection (Tuple)When working with dimensional data, an intersection, also known as a tuple, is useful for obtaining avalue from the combination of two or more members that you specify. Each member must be from adifferent hierarchy. The intersection can include only one measure.
For example, the intersection (Revenue, 2012, Cooking Gear) shows the revenue value for the year 2012and for the product line Cooking Gear.
Use tuples to avoid report summaries that do not reflect the visible data. For more information about thisissue, see “Summaries in a report do not correspond to the visible members” on page 369.
Procedure
1. Click the Toolbox icon and drag the Intersection (Tuple) object to the report.2. From the Available members and measures pane, select items and click the right arrow to move
them to the Intersection members and measures box. You can also use items from the Calculated
members and measures tab .3. To define the hierarchy for this intersection, click a parent object in the Intersection hierarchy box.
Assigning a Hierarchy or DimensionYou must assign each calculated member, set expression, and intersection (tuple) to a hierarchy ordimension. We recommend that you select the hierarchy or dimension upon which your calculationfocuses. For example, if your calculated member is based on years, select the Time hierarchy. If youcreate a calculated measure, select the Measures dimension.
Select only a hierarchy that cannot affect the value of the calculation. For example, the hierarchy CampingEquipment has the same value no matter what Products context it appears in the report. Therefore,
• the calculation ([Camping Equipment]-[Mountaineering Equipment]) has a well-defined meaning only inthe Products hierarchy, so select that hierarchy.
• the calculation tuple ([Revenue], [Camping Equipment]) can be assigned to either the Products orMeasures hierarchy, as it is not affected by either context.
• the calculations ([2013] - [Camping Equipment]) and ([Fiscal Year 2013] - [Calendar Year 2013]) do nothave a well-defined meaning in any hierarchy, and therefore cannot be used reliably at all.
Drilling Up and Drilling Down in Dimensional ReportsWhen working with dimensional or dimensionally-modeled relational (DMR) data sources, you can createreports that allow the reader to view more general or more detailed information on your data within apredefined dimensional hierarchy (such as Years - Year - Quarter - Month) without having to createdifferent reports.
You can link groups of data items from different queries so that when you drill up or drill down in onequery, the data item also drills up or drills down in the linked queries. Linking data items is useful if yourreport includes more than one query with the same data item. For example, if your report shows a list anda crosstab that each include the Product Line data item, you can link the Product Line data item from thecrosstab query to the Product Line data item from the list query so that when you drill up in the crosstabProduct Line data item, the list Product Line data item also drills up.
Member SetsMember sets are used to group data items that are logically related for various actions, such as drillactions, zero suppression, and ranking. They can be defined as a flat list or as a tree structure in whichmember sets in the same parent chain are considered related.
For example, for drill operations, a member set defines the set of items that can potentially change whena given item in the set is drilled on. The values of other items in the query or even those in the same
Chapter 10. Dimensional Reporting Style 231

hierarchy are preserved when any item in this set is drilled on. Usually, a member set references itemsthat have logical roles in a drill action, such as a detail, a summary of the detail, or a parent of the detail. Asingle data item can belong to only one member set.
If you do not define member sets for items, the IBM Cognos Analytics server associates items into defaultmember sets and behaviors using simple dimension rules on item expressions. You can override thebehavior for a particular item while other items continue to use the default.
When you define a member set, you must explicitly define behaviors for each item in the set. Items in theset that have no behaviors have their values preserved.
Drill behaviors always act from a root member set. This means that when an item is drilled on, the rootmember of its member set is found and all items from the root down are processed. Although calculationsand aggregates are not directly related by hierarchy, they respond because of their dependence on theitems upon which they are based.
Create Member SetsCreate a member set when you want to define a non-default drill behavior. You specify what itemsrespond to a drill action by adding them to the member set.
Procedure
1. Click the Queries icon , and click the query in which to create a member set.
2. Click the Show properties icon , and In the Properties pane, set the Define member setsproperty to Yes.
3. Double-click the query and click the Member sets tab.
4. Click the Data icon , and from the Data items tab , drag items to the work area.
To define a member set as a tree structure, drag the item that will serve as the root item of the set tothe work area, and then drag other items over the root item to create the tree structure.
Note: You can also nest member sets.
Create a drill-up and drill-down reportYou can link groups of data items from different queries so that when you drill up or drill down in onequery, the data item also drills up or drills down in the linked queries.
When you drill down or up, you can specify whether the column title shows the member caption value orthe level label value. By default, titles use member captions. Using level labels may be more meaningful.For example, within the Country or Region column, you drill down on Australia. By default, the columntitle becomes Australia, the member caption. It may be more meaningful to use Country or Region, thelevel label, as the column title.
Tip: The Returned Items sample report in the GO Data Warehouse (analysis) package includes drilling.
Before you begin
Before you begin, ensure that you are using a dimensional data source.
Procedure
1. Click the Pages icon or the Queries icon , and click the Report icon .
2. Click the Show properties icon , and in the Properties pane, double-click the Advanced drillbehavior property.
3. On the Basic tab, in the Report output drill capabilities box, select the Allow drill-up and drill-downcheck box.
232 IBM Cognos Analytics - Reporting Version 11.0 : User Guide

By default, IBM Cognos Analytics - Reporting determines which items can be drilled on based on thedimensional structure.
4. To enable the report to be used as the source during a package drill-through, select the Allow thisreport to be a package-based drill-through source check box and click OK.
For more information about package drill-through, see the IBM Cognos Analytics Administration andSecurity Guide.
5. When the report is a drill-through target, to specify whether to apply additional filtering when namesfrom the context in the source report matches names of items in the target report, select the Acceptdynamic filters when this report is a drill-through target check box.
6. To disable drill-up or drill-down for a data item, select the data item in either the Disable drill-up forbox or the Disable drill-down for box.
7. From the Advanced tab, you can change the drill-up or drill-down behavior for any data item byselecting the data item and then choosing one of the following behaviors.
Behavior name Drill-up behavior Drill-down behavior
Preserve The data item's value willremain unchanged.
The data item's value willremain unchanged.
Empty Set The set of values associatedwith this data item is set to bethe empty set (novalues). Forcrosstabs, the data item willeffectively be removed from thereport.
The data item will be removedfrom the report.
Replace Item The data item's value willchange to become the parent (ifa lowest-level summary wasdrilled up on) or the grandparent(if a lowest-level detail of adimension was drilled up on) ofthe item that was drilled on.
The data item's value willchange to become the item thatwas drilled on.
Replace Expression The data item's value willchange to become the childrenof the parent (if a lowest-levelsummary was drilled up on) orthe children of the grandparent(if a lowest-level detail of adimension was drilled up on) ofthe item that was drilled on.
The data item's value willchange to become the childrenof the item that was drilled on.
Change Expression The data item's value willchange to become the value ofsome other data item in thequery.
The data item's value willchange to become the value ofsome other data item in thequery.
Chapter 10. Dimensional Reporting Style 233

Behavior name Drill-up behavior Drill-down behavior
Depth Based Expression The data item's value willchange to become all data itemsn generations higher in thedimensional hierarchy than theitem that was drilled on. Thenumber of generations or levelsis determined by the Depthvalue.
The data item's value willchange to become all data itemsn generations higher in thedimensional hierarchy than theitem that was drilled on. Thenumber of generations or levelsis determined by the Depthvalue.
Ancestor The data item's value willchange to become the datavalue of the ancestor ngenerations higher in thedimensional hierarchy than theitem that was drilled on. Thenumber of generations or levelsis determined by the Depthvalue.
The data item's value willchange to become the datavalue of the ancestor ngenerations higher in thedimensional hierarchy than theitem that was drilled on. Thenumber of generations or levelsis determined by the Depthvalue.
8. In the Column title drill behavior box, specify whether to use member captions or level labels as thecolumns titles for each data item.
9. From the Data items linking tab, you can link groups of data items:
• Click the New Group of Linked Data Items icon .• Type a name for this group of linked data items and click OK.
To rename a group of linked data items, click the group, click the Rename Group of Linked Data
Items icon , type a name, and click OK.• Use the arrows to move data items from the queries on the left to the groups on the right.
Note: You can only add a data item to one group.
ResultsThe report will generate links for any item that can be drilled up or down on.
When you run a report, you can drill down or drill up by right-clicking the data item and choosing theaction from the context menu. The menu items will be disabled if an item cannot be drilled up or down on.
Related tasksCreate a drill-up and drill-down chart
Recommendation - Drilling Down in Very Large Data SourcesWhen you drill down in a report that uses a very large data sources query results can be much larger thanwhat can be held in memory. For example, if you insert the lowest level of four hierarchies that eachcontain 1000 members, the report can contain 1,000,000,000,000 cells. At best, this query will take avery long time to run. While this large query executes, all other queries for the same server process willlikely be blocked. For most data sources, the query will likely fail due to insufficient memory or timing out.Then the memory is released and normal services resume.
However, when using a Microsoft SQL Server 2005 Analysis Services (SSAS) cube, the memory consumedby the SSAS client is not always released in a way that other queries can effectively re-use. The servercontinues to run with insufficient memory, causing new queries to either run very slowly or failcompletely. You may encounter an error, and, to continue, the system administrator must manually stopand restart the IBM Cognos Analytics service.
234 IBM Cognos Analytics - Reporting Version 11.0 : User Guide

To avoid these problems, consider the size of hierarchy levels and sets when creating reports and avoidcombining them in ways that create large queries. To determine the size of a set, create and run a verysmall report that includes only a count of the members within that set. You can also use filteringtechniques to focus your data.
Chapter 10. Dimensional Reporting Style 235

236 IBM Cognos Analytics - Reporting Version 11.0 : User Guide
Chapter 11. Adding Prompts to Filter DataYou can add prompts to a report to add interactivity for users. Prompts act as questions that help users tocustomize the information in a report to suit their own needs. For example, you create a prompt so thatusers can select a product type. Only products belonging to the selected product type are retrieved andshown in the report.
Prompts are composed of three interrelated components: parameters, prompt controls, and parametervalues. Parameters are based on parameterized filters and form the questions to ask users. Promptcontrols provide the user interface in which the questions are asked. Parameter values provide theanswers to the questions.
IBM Cognos Analytics - Reporting provides several ways to create prompts. You can
• use the My parameters panel to access parameters that were customized by your administrator• use the Build Prompt Page tool• build your own prompt and prompt page• create a parameter to produce a prompt• insert prompts directly into the report page• in dimensional reporting, you can also define prompts using context filters
If you include reports from different packages in an interactive dashboard that uses global filters, ensurethat you use the same parameter name for the prompt in all the reports. You can also create prompts inthe package. For more information, see topics on modeling. You can also use context filters, also knownas slicer filters, to focus the data in your report.
Syntax of Prompt Expressions
Prompt expressions use the following syntax, where p represents the parameter name.
You can also use these expressions to create parameterized data items that you can then use in masterdetail relationships.
The type of expression you use depends on whether you have chosen relational or dimensional reportingstyle. For more information about reporting styles, see “Relational and dimensional reporting styles” onpage 10.
Relational: Detail Filter Expressions Dimensional: Context (Slicer) or EdgeExpressions
[data item] = ?p?
for single-select prompts and master detailrelationships
[level or hierarchy]->?p?
For single-select member prompts and masterdetail relationships

Relational: Detail Filter Expressions Dimensional: Context (Slicer) or EdgeExpressions
[data item] in ?p?
for multi-select prompts
set([level or hierarchy]->?p?)
For multi-select member prompts
filter ([set], [property expression] = ?p? )
For single-select value prompts and master detailrelationships
A property expression is an expression that isassigned to a property to enable dynamic update ofthe property when the report runs.
filter ([set], [property expression] IN ?p? )
For multi-select value prompts
A property expression is an expression that isassigned to a property to enable dynamic update ofthe property when the report runs.
Related tasksCreating application links to other reports or external web pagesCreate application links to use an active report to open other reports or external web pages in an iFrame.View the SQL for an Entire Report or a Query
Using customized parametersYou can use the My parameters panel to tailor reports according to your role and to maintainconsistency across reports.
Your administrator may decide to adopt a set of standard parameter names that can be used by all reportauthors. These parameters are called global parameters. The administrator can specify default values forglobal parameters. These parameters can be customized to your role. It all depends on how often you usecertain data items in your own reports.
Global parameters allow you to avoid being prompted repeatedly for the same values. You can set yourown values which are then automatically applied to reports when they are run.
You can apply parameter values from the My parameters panel with or without prompts:
• If applied on a prompt page, the parameter defaults to your preferred value.• If applied in a filter expression, the report simply runs with the default values that you selected
previously.
About this task
You can take advantage of global parameters when you perform these tasks:
• creating a detail or summary filter• creating a drill-through definition• creating your own prompt and prompt page• creating a parameter to produce a prompt
Procedure
1. Click the My parameters icon .
238 IBM Cognos Analytics - Reporting Version 11.0 : User Guide

The My parameters panel appears. Parameters that were created by your administrator are listed. Foreach parameter, values appear. Check boxes are selected next to values that your administrator hasspecified as the default values.
2. If you want to use a different default value than the one assigned by your administrator, you can selecta different value.
Tip: You may want to check with your administrator before you change default parameter values.There could be a reason why the administrator is recommending a specific value.
3. If you changed one or more default values but then decide to revert to the values set by youradministrator, click Reset.
Use the Build prompt page toolUse the Build prompt page tool to quickly add filters and prompts to a report. This tool creates filters inthe query using the prompt information properties that are set in the IBM Cognos Framework Managermodel. For more information about the prompt information properties, see the Framework Manager UserGuide.
Note: The Promotion Success sample report in the GO Data Warehouse (analysis) package includes aprompt page. The Historical Revenue sample report in the Sales and Marketing (cube) package and theEyewear Revenue by Brand and Size sample report in the GO Data Warehouse (analysis) package includemultiple prompts.
Before you begin
Note: The Build prompt page tool creates a static report specification, so if the prompt informationproperties are updated in the Framework Manager model, those updates will not be reflected in yourreport.
Procedure
1. Click the column or row on which users will be prompted.
To create multiple prompts or a cascading prompt, click more than one column or row.
2. From the report object toolbar, click the More icon , and then click Build prompt page.
A prompt page is created that has the following items:
• a page header• a prompt control for each selected column• a page footer containing Cancel, Back, Next, and Finish buttons
Build Your Own Prompt and Prompt PageCreate your own prompt and prompt page to control how they appear in a report.
Note: The Promotion Success sample report in the GO Data Warehouse (analysis) package includes aprompt page.
Procedure
1. Click the Pages icon , and click Prompt pages.
2. Click the Toolbox icon , and drag Page to the Prompt pages box.3. Double-click the page you just created.
Chapter 11. Adding Prompts to Filter Data 239

4. Click the Toolbox icon , drag one of the following prompt controls to the prompt page.
Prompt control Description
Text box prompt
Retrieves data based on a value that users type.
Use this control when users know exactly whatvalue they want to enter, such as a name oraccount number.
Value prompt
Retrieves data based on values that users selectfrom a list.
Use this control to show a list of possible valuesfrom which users can choose.
Note: The maximum number of items that canappear in a list is 5000.
Select & search prompt
Retrieves values based on search criteria thatusers specify. Data is then retrieved based onvalues users select from the search results.
Use this control instead of a value prompt if thelist of values is very long, which can slow downperformance.
Tip: Users have the option of performing a casesensitive or case insensitive search. A casesensitive search is faster, while a case insensitivesearch usually returns more values.
You cannot use this control if you are workingwith SAP BW data sources.
Date prompt
Retrieves data based on a date that users select.
Use this control to filter a date column. Users canretrieve data for a specific day, a set of days, or arange of days.
Time prompt
Retrieves data based on a time that users select.
Use this control to restrict a report to a particulartime or time range. For example, users can seehow many orders are received after businesshours. Users can then use this information todetermine the number of staff needed to workafter hours.
Date & time prompt
Retrieves data based on a date and time thatusers select.
Use this control to filter a datetime or timestampcolumn. This control is useful for specifyingranges. For example, users can retrieve all ordersreceived from Monday at 12:00 a.m. to Friday at5:00 p.m.
240 IBM Cognos Analytics - Reporting Version 11.0 : User Guide

Prompt control Description
Interval prompt
Retrieves data based on a time interval that usersspecify.
Use this control to retrieve data that is related tothe passage of time. For example, users canretrieve a list of products that were returned 30or more days after they were purchased.
Tree prompt
Retrieves data based on values that users selectfrom a list. Values are organized hierarchically.
This control is useful when you are working withdimensional data sources. Data is shown fromthe top of a dimension hierarchy to the mostdetailed member, and users can choose the levelof detail they want to view in the report. For moreinformation about tree prompts, see “Control theData That Appears in a Tree Prompt” on page248.
Tree prompts let you page through large numbersof prompt values with a More link at the bottomof the tree.
Generated prompt
Selects a prompt control based on the data typeof the data item.
This control acts like a placeholder. When usersrun the report, the control is replaced by theappropriate prompt control. For example, if usersare prompted for date values, the control isreplaced by a date & time prompt.
The Prompt Wizard dialog box appears.5. If you are creating a text box, date, time, date and time, interval, or generated prompt, do the
following:
• Create a new parameter for the prompt or use an existing or global parameter.• Click Next.• If you created a new parameter, define the expression by selecting a data item from the package and
the operator to use.
Tip: Make the prompt optional by selecting the Make the filter optional check box.• Go to step 7.
6. If you are creating a value, select & search, or tree prompt, do the following:
• Create a new parameter for the prompt or use an existing or global parameter.• Click Next.• If you created a new parameter and you want to use the parameter to filter data, select the Create a
parameterized filter check box and define the expression by selecting a data item from the packageand the operator to use.
If you are creating a tree prompt, you must choose in in the Operator box.
You can also use a parameter to provide a value for a layout calculation, such as showing a user'sname in the report. When the report is run, you can use a parameter to prompt the user to type hisname and have it appear in the report.
Chapter 11. Adding Prompts to Filter Data 241

Tip: Make the prompt optional by selecting the Make the filter optional check box.• Click Next.• If you created a parameterized filter and you have more than one query defined in the report, select
the check box for the query on which to filter and click Next.• Select the Create new query check box to create the query that will be used to build the list of data
values shown when the report is run.
Tip: Do not create a new query if you want to link the prompt to an existing query or if you intend tocreate the query at a later time.
• Click the ellipsis button beside Values to use and click the data item on which to prompt.• To choose a data item that is different than what users will see when they are prompted, click the
ellipsis button beside Values to display and click the data item.• To create a cascading prompt, in the Cascading source box, click the parameter that represents the
cascade source.7. Click Finish.
ResultsThe prompt control is added to the prompt page. A prompt page is like a report page. You can insertgraphics and text and apply formatting.
You can also modify the properties of the prompt control by clicking it and making changes in theProperties pane.
Create a parameter to produce a promptIBM Cognos Analytics - Reporting can automatically generate prompted reports based on parameters youcreate. When you run the report, Reporting can generate a prompt page for each parameter notassociated to an existing prompt page depending on whether the prompt run option is selected or not.
Note: When Reporting automatically generates a prompt, it creates filters in the query using the promptinformation properties that are set in the IBM Cognos Framework Manager model. For more informationabout the prompt information properties, see the Framework Manager User Guide.
You can also define parameters when you want to create a drill-through report or define master detailrelationships.
Procedure
1. From the report object toolbar, click the Filters icon .
2. On the Detail Filters tab, click the add button .
The Detail Filter dialog box appears.
3. In the Available Components box, click the Source tab , the Data Items tab , or the
Parameters tab to select the data item to use for the prompt:
• To filter data based on data items not shown in the report, double-click a data item on the Sourcetab.
• To filter data that appears in the report but not necessarily in the model, such as calculations,double-click a data item on the Data Items tab.
• To filter data using standardized parameters that were created by your administrator, double-click adata item on the Parameters tab in the Global Parameters folder.
The data item appears in the Expression Definition box.
242 IBM Cognos Analytics - Reporting Version 11.0 : User Guide
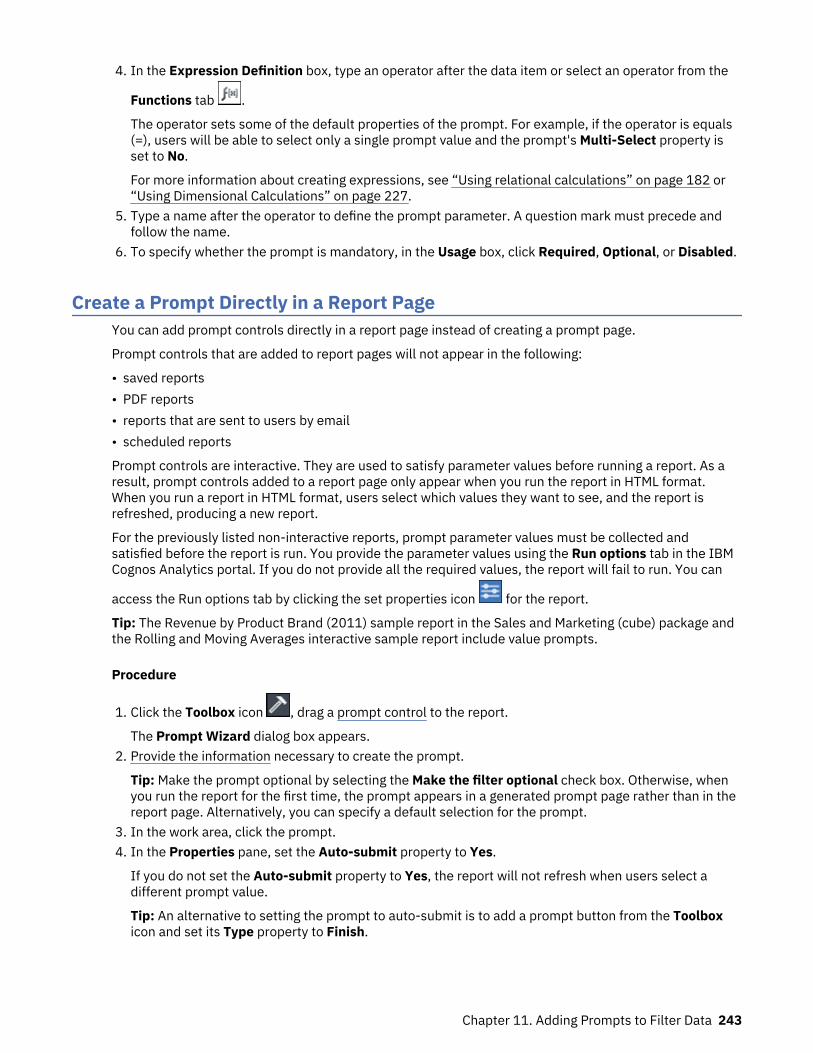
4. In the Expression Definition box, type an operator after the data item or select an operator from the
Functions tab .
The operator sets some of the default properties of the prompt. For example, if the operator is equals(=), users will be able to select only a single prompt value and the prompt's Multi-Select property isset to No.
For more information about creating expressions, see “Using relational calculations” on page 182 or“Using Dimensional Calculations” on page 227.
5. Type a name after the operator to define the prompt parameter. A question mark must precede andfollow the name.
6. To specify whether the prompt is mandatory, in the Usage box, click Required, Optional, or Disabled.
Create a Prompt Directly in a Report PageYou can add prompt controls directly in a report page instead of creating a prompt page.
Prompt controls that are added to report pages will not appear in the following:
• saved reports• PDF reports• reports that are sent to users by email• scheduled reports
Prompt controls are interactive. They are used to satisfy parameter values before running a report. As aresult, prompt controls added to a report page only appear when you run the report in HTML format.When you run a report in HTML format, users select which values they want to see, and the report isrefreshed, producing a new report.
For the previously listed non-interactive reports, prompt parameter values must be collected andsatisfied before the report is run. You provide the parameter values using the Run options tab in the IBMCognos Analytics portal. If you do not provide all the required values, the report will fail to run. You can
access the Run options tab by clicking the set properties icon for the report.
Tip: The Revenue by Product Brand (2011) sample report in the Sales and Marketing (cube) package andthe Rolling and Moving Averages interactive sample report include value prompts.
Procedure
1. Click the Toolbox icon , drag a prompt control to the report.
The Prompt Wizard dialog box appears.2. Provide the information necessary to create the prompt.
Tip: Make the prompt optional by selecting the Make the filter optional check box. Otherwise, whenyou run the report for the first time, the prompt appears in a generated prompt page rather than in thereport page. Alternatively, you can specify a default selection for the prompt.
3. In the work area, click the prompt.4. In the Properties pane, set the Auto-submit property to Yes.
If you do not set the Auto-submit property to Yes, the report will not refresh when users select adifferent prompt value.
Tip: An alternative to setting the prompt to auto-submit is to add a prompt button from the Toolboxicon and set its Type property to Finish.
Chapter 11. Adding Prompts to Filter Data 243

ResultsThe prompt control is added to the report page. You can modify its properties by clicking it and makingchanges in the Properties pane.
Modifying promptsFor each prompt you create, you can modify its properties by specifying values in the Properties pane.
For example, you can
• change the prompt control interface• require user input• enable multiple selections• show or hide prompt statuses• specify default selections• specify prompt values• add prompt buttons• create cascading prompts
Some properties you set for a prompt may be overridden under some conditions. For example, someproperties set for the filter associated with a prompt may override the corresponding prompt property.
Change the Prompt Control InterfaceBy default, when you create a prompt, IBM Cognos Analytics - Reporting selects the prompt controlinterface. You can change the prompt control interface depending on the type of prompt you created. Forexample, for a value prompt, you can choose a drop-down list, a list box, or a radio button group.
Procedure
1. Click the prompt control.2. In the Properties pane, set the Select UI property to the interface.
Specify that a prompt requires user inputYou can specify that a prompt requires user input before the report can run.
Procedure
1. Click the prompt control.2. In the Properties pane, set the Required property to Yes.
3. Click the Pages icon , and click a report page.
4. Click the report object associated with the prompt, from the report object toolbar, click Filters and then click Edit filters.
5. Click the filter associated with the prompt.6. In the Usage box, click Required.
ResultsWhen you run the report, a star appears next to the prompt indicating that the user must select or type avalue.
If you have a cascading prompt and the parent prompt control is required, the child prompt control isdisabled. This ensures that users choose at least one value in the parent prompt before they can choose avalue in the child prompt. Conversely, if the parent control is optional, then the child control is populated.
244 IBM Cognos Analytics - Reporting Version 11.0 : User Guide

This gives users the ability to choose values in the child prompt without having to choose a value in theparent prompt.
Allow Users to Select Multiple Values in a PromptYou can allow users to select more than one value in a prompt. For example, you have a prompt for whichusers must select a product line. You can modify the prompt so that users can select more than oneproduct line.
If you enable multiple selections, the Auto-submit property is always set to no.
Procedure
1. Click the prompt control.2. In the Properties pane, choose whether to allow users to specify more than one value or a range of
values:
• To allow users to specify more than one value, set the Multi-select property to Yes.• To allow users to specify a range of values, set the Range property to Yes.
3. Click the Pages icon , and click a report page.
4. Click the report object associated with the prompt, from the report object toolbar, click Filters and then click Edit filters.
5. Double-click the filter associated with the prompt.6. Change the operator to one of the following:
• If you are creating a multi-select prompt, change the operator to in.
For example, [Product_line] in ?Product line? where [Product_Line] is the name of the data itemallows users to select multiple product lines.
• If you are creating a range prompt, change the operator to in_range.
For example, [Margin] in_range ?Margin? where [Margin] is the name of the data item allows users tospecify a margin range.
Show or Hide Prompt StatusEach prompt you create in a report provides dynamic validation when the report is run. Validity checks areperformed to ensure that the data is correct and that required values are supplied. For example, a starappears next to each required prompt. An arrow appears next to a prompt if you must select or type avalue. If you type an incorrect value, a dotted line appears. You can choose whether to show the star andarrow for each prompt.
Procedure
1. Click the prompt control.2. In the Properties pane, set the Hide adornments property to Yes to hide the prompt characters or No
to show them.
Specify a Default Selection for a PromptYou can specify a default selection for a prompt so that users do not have to select or type a value whenthey run the report.
Procedure
1. Click the prompt control.2. To define a range of values, in the Properties pane, set the Range property to Yes.3. To specify more than one default selection, in the Properties pane, set the Multi-select property to
Yes.
Chapter 11. Adding Prompts to Filter Data 245

4. In the Properties pane, double-click the Default selections property.
5. Click the add button and do one of the following:
• If you chose to define a single value, type the value as the default selection.• If you chose to define a range of values, type the minimum and maximum values of the range in the
Minimum value and Maximum value boxes, respectively.6. Repeat step 4 to specify other default selections.
Customize Prompt TextYou can customize the instructional text that appears around prompts. For example, a value prompt withmultiple selections includes a Select all link below the choices that you can customize to text other thanSelect all. You can also specify translated text in many languages for international report users.
Procedure
1. Click the prompt control.2. To change the default prompt text, in the Properties pane, double-click any of the properties under
Prompt Text.
Note: When you select a property in the Properties pane, its description appears in the informationpane below the Properties pane.
3. Click Specified text, and then click the ellipsis button.4. In the Localized Text dialog box, type the text that you want to appear.5. To add customized text for other languages:
• Click Add.• Select the countries and regions for which you want to specify localized text and click OK.• To specify text for a country and region, select the country and region and click Edit, and then type
the localized text in the text box.
Specify Prompt ValuesYou can provide your own values in a prompt instead of the default values that come from the database.
You can specify your own prompt values to
• show something different from what is in the database• improve performance by not accessing the database• provide text for optional prompts, such as Select a value• restrict the number of values available
For example, you have a prompt in which users choose a country or region. For the database value UnitedStates, you want USA to appear in the prompt.
Tip: The Rolling and Moving Averages interactive sample report includes a value prompt.
Procedure
1. Click the prompt control.2. In the Properties pane, double-click the Static Choices property.
3. Click the add button .4. In the Use box, type the prompt value to add.5. In the Display box, type the value that will appear in the prompt.6. Repeat steps 3 to 5 to add other prompt values.7. To link a prompt value to a condition, do the following:
246 IBM Cognos Analytics - Reporting Version 11.0 : User Guide

• In the Variable box, choose the variable to use or create your own.
For information about creating variables, see “Add a variable from the condition explorer” on page289.
• In the Value box, click one of the possible values for the variable.
• Click the static value to link to the variable and click the edit button .• In the Display box, type the value to appear in the prompt.• Repeat this procedure for each additional value.
Add a Prompt ButtonAdd prompt buttons so that users can submit selected items, cancel reports, or navigate between pages.
When you are building prompts and prompt pages, you may have to add prompt buttons to submitselections. Some prompt controls, such as the value prompt, can be set to submit selectionsautomatically. Other prompt controls, such as the date prompt, require a prompt button.
Procedure
1. Click the Pages icon , and click the page to which to add a prompt button.
2. Click the Toolbox icon , drag Prompt button to the work area.3. Click the prompt button and, in the Properties pane, set the Type property to one of the following
actions.
Goal Action
Cancel the report Cancel
Go to the previous prompt page Back
Go to the next prompt page Next
Run the report Finish
Reprompt the user
Tip: Reprompting users is useful when you havecascading prompts.
Reprompt
Create a Cascading PromptCreate a cascading prompt to use values from one prompt to filter values in another prompt. For example,a report contains the columns Product line and Product type. You create prompts for these columns, andyou specify that the Product type prompt is a cascading prompt that uses Product line as the source.When users select a product line, they see only the product types related to the selected product line.
Tip: The Employee Training by Year sample report in the GO Data Warehouse (analysis) package includescascading prompts.
Procedure
1. To make the cascading source a required prompt, select it and, in the Properties pane, set theRequired property to Yes.
2. Click the prompt control to use as a cascading prompt.3. In the Properties pane, double-click the Cascade source property.4. Click the parameter that represents the cascade source.
Chapter 11. Adding Prompts to Filter Data 247
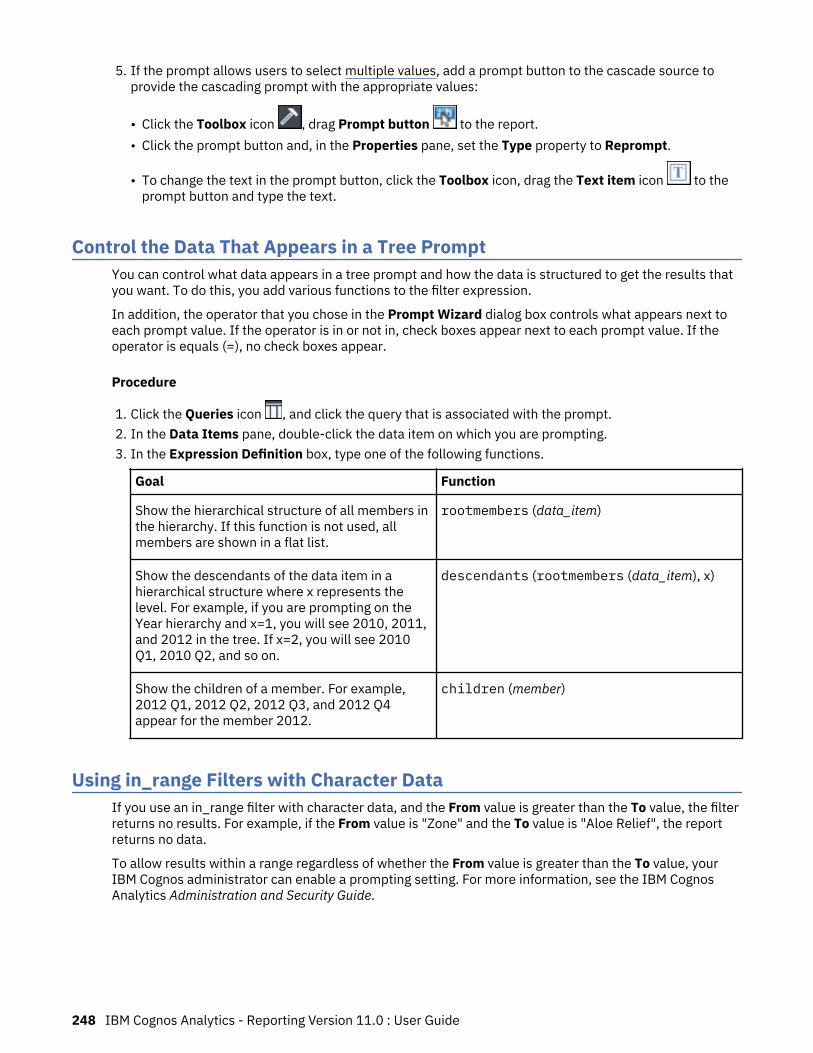
5. If the prompt allows users to select multiple values, add a prompt button to the cascade source toprovide the cascading prompt with the appropriate values:
• Click the Toolbox icon , drag Prompt button to the report.• Click the prompt button and, in the Properties pane, set the Type property to Reprompt.
• To change the text in the prompt button, click the Toolbox icon, drag the Text item icon to theprompt button and type the text.
Control the Data That Appears in a Tree PromptYou can control what data appears in a tree prompt and how the data is structured to get the results thatyou want. To do this, you add various functions to the filter expression.
In addition, the operator that you chose in the Prompt Wizard dialog box controls what appears next toeach prompt value. If the operator is in or not in, check boxes appear next to each prompt value. If theoperator is equals (=), no check boxes appear.
Procedure
1. Click the Queries icon , and click the query that is associated with the prompt.2. In the Data Items pane, double-click the data item on which you are prompting.3. In the Expression Definition box, type one of the following functions.
Goal Function
Show the hierarchical structure of all members inthe hierarchy. If this function is not used, allmembers are shown in a flat list.
rootmembers (data_item)
Show the descendants of the data item in ahierarchical structure where x represents thelevel. For example, if you are prompting on theYear hierarchy and x=1, you will see 2010, 2011,and 2012 in the tree. If x=2, you will see 2010Q1, 2010 Q2, and so on.
descendants (rootmembers (data_item), x)
Show the children of a member. For example,2012 Q1, 2012 Q2, 2012 Q3, and 2012 Q4appear for the member 2012.
children (member)
Using in_range Filters with Character DataIf you use an in_range filter with character data, and the From value is greater than the To value, the filterreturns no results. For example, if the From value is "Zone" and the To value is "Aloe Relief", the reportreturns no data.
To allow results within a range regardless of whether the From value is greater than the To value, yourIBM Cognos administrator can enable a prompting setting. For more information, see the IBM CognosAnalytics Administration and Security Guide.
248 IBM Cognos Analytics - Reporting Version 11.0 : User Guide

Showing prompt values in generated SQL or MDXYou can show prompt values when viewing the generated SQL or MDX of a query or report.
Procedure
1. Click the Queries icon , and click the query for which you want to view the generated SQL or MDX.2. In the Properties pane, set the Use SQL parameters property to Literal.
Related tasksView the SQL or MDX for an Entire Report or a Query
Chapter 11. Adding Prompts to Filter Data 249

250 IBM Cognos Analytics - Reporting Version 11.0 : User Guide
Chapter 12. Laying Out a ReportWhen creating a report, a good layout is essential to ensure that the information in the report is presentedin a clear and effective manner.
Report layoutWhen you create a report, consider the following structural elements:
• Define the page structure.
Determine what goes into the page header, body, and footer. The page header contains information thatappears at the top of each page. The page body contains information that starts on the first instance ofthe page. If there is too much data to fit on a single page, it continues across all instances of the page.The page footer contains information that appears at the bottom of each page.
• Identify horizontal bands of information.
Look for natural bands of information running across the page. Each of these bands typically translatesinto a block.
• Identify vertical bands of information.
In each horizontal band of information, look for bands that run up and down the page. Each of thesebands typically translates into table cells.
• Decide which data frames to use to lay out the data.
Choose a list, crosstab, chart, repeater, or text frame.• Set properties at the highest level item possible.
By setting properties at the highest level, you set them once instead of setting them for each childobject. For example, if you want all text items in a report to appear in a specific font, set the font for thepage.
Tip: When setting properties for an object, click the Select ancestor icon in the Properties pane titlebar to see the different levels available.
• Use padding and margins to create white space.
Do not use fixed object sizing unless it is absolutely necessary. When you specify that an object has afixed size, your layout becomes less flexible.
The Page Structure ViewWhen you add objects to a report, you usually work in the layout. An alternative view of the report isavailable.
To view the report in a different way, click the Page views icon , and then click Page structure.
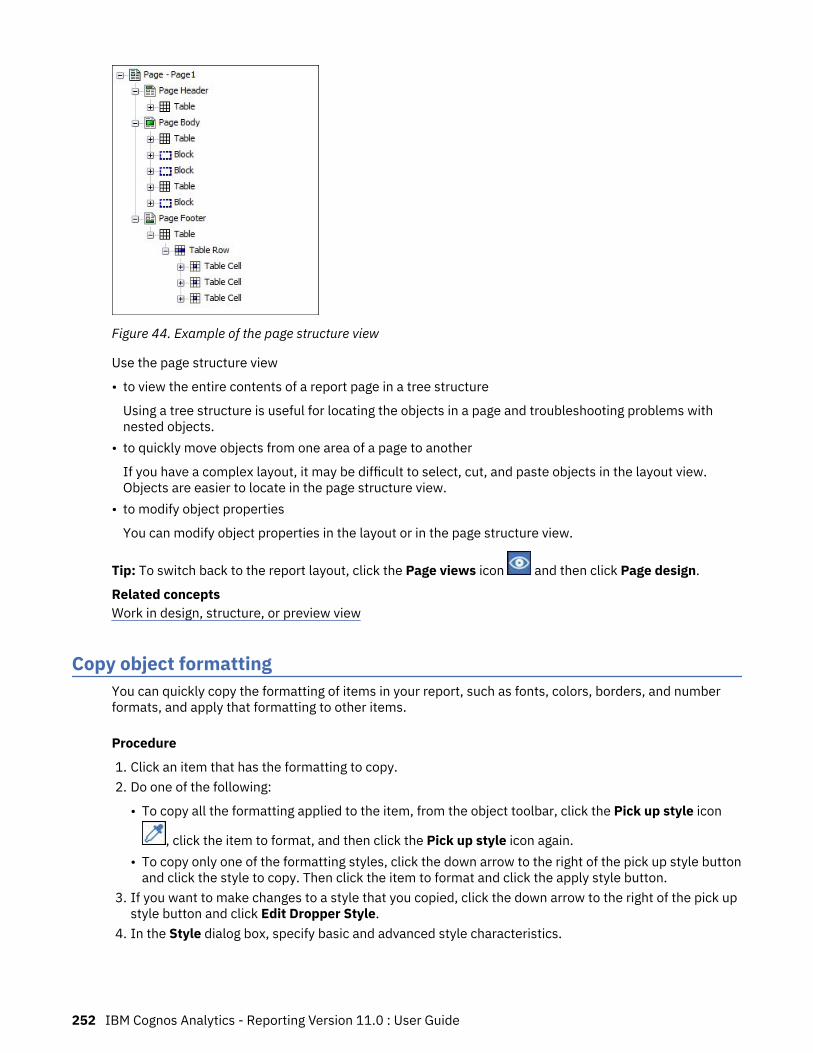
Figure 44. Example of the page structure view
Use the page structure view
• to view the entire contents of a report page in a tree structure
Using a tree structure is useful for locating the objects in a page and troubleshooting problems withnested objects.
• to quickly move objects from one area of a page to another
If you have a complex layout, it may be difficult to select, cut, and paste objects in the layout view.Objects are easier to locate in the page structure view.
• to modify object properties
You can modify object properties in the layout or in the page structure view.
Tip: To switch back to the report layout, click the Page views icon and then click Page design.
Related conceptsWork in design, structure, or preview view
Copy object formattingYou can quickly copy the formatting of items in your report, such as fonts, colors, borders, and numberformats, and apply that formatting to other items.
Procedure
1. Click an item that has the formatting to copy.2. Do one of the following:
• To copy all the formatting applied to the item, from the object toolbar, click the Pick up style icon
, click the item to format, and then click the Pick up style icon again.• To copy only one of the formatting styles, click the down arrow to the right of the pick up style button
and click the style to copy. Then click the item to format and click the apply style button.3. If you want to make changes to a style that you copied, click the down arrow to the right of the pick up
style button and click Edit Dropper Style.4. In the Style dialog box, specify basic and advanced style characteristics.
252 IBM Cognos Analytics - Reporting Version 11.0 : User Guide
Add a header or footer to a report or listAdd a header or footer to make a report easier to read. Headers and footers are containers in which youcan add objects like text, images, and report expressions such as the current date and page numbers. Youcan add headers and footers to pages and lists.
Tip: The Revenue by Product Brand (2011) sample report in the Sales and Marketing (cube) packageincludes a customized header and footer.
Add a page header or footer when you want information to appear on every page in the report, such as atitle or page numbers. You can use combinations of text, data items, and report expressions in titles.
You can add the following headers and footers to lists to organize data into logical sections or to identifyevery change in value of a column.
Type Description
List page header Adds a header that appears at the top of the list onevery page in which list data appears.
Overall header Adds a header that appears once at the top of thelist.
Group or section header Adds a header that appears for each group of agrouped column or each section.
Group or section footer Adds a footer that appears for each group of agrouped column or each section.
Overall footer Adds a footer that appears once at the bottom ofthe list.
List page footer Adds a footer that appears at the bottom of the liston every page in which list data appears. Note thatsummary calculations in list page footers onlysummarize the data that is visible on that page ofthe list report.
You can also add section footers by adding a summary.
Before you begin
To see the headers and footers, ensure that the visual aids are turned on.
Procedure
1. If you want to add a page header or footer, from the report object toolbar, click the More icon , clickHeaders & footers > Page header & footer, select the appropriate check boxes, and click OK.
2. If you want to add a list header or footer, from the report object toolbar, click the More icon , clickHeaders & footers > List headers & footers, select the appropriate check boxes, and click OK.
3. If you want to add objects to a header or footer, click the Toolbox icon and drag the objects to theappropriate location.
Chapter 12. Laying Out a Report 253
To add objects to a list header or footer, you must first unlock the report. Click the More icon , then
click the Locked icon .
Tip: To add data items to the page header or footer, you must associate a query to the page.4. To split a header or footer into multiple cells that span the list, select the cell to be split and then, from
the report object toolbar, click the Split cell icon .5. To merge multiple cells in a list header or footer, select the cells that you want to merge, and, from the
report object toolbar, click the Merge cells icon .
Add borders to an objectYou can add borders to objects in a report such as a column, a header, or a footer or to the whole report.
Tip: You can also add borders using the report object toolbar by clicking the Border icon .
Procedure
1. Click the object to which to add a border.
Tip: To quickly select the parent of an object, click the object, and then click the Select ancestor icon
in the title bar of the Properties pane.2. In the Properties pane, double-click the Border property and select values in the Color, Style, and
Width boxes.
Note: Specifying a width using % as the unit of measure is not supported when producing reports inPDF.
3. Apply the selected values to the top, bottom, left side, right side, or all sides of the object by clickingthe appropriate button in the Preview section.
Tip: To clear the border applied, click the clear borders button .
Add a Text Item to a ReportYou can add text to a report. You can insert text in other objects, such as a block or table cell, or directlyin the report page.
You can also add multilingual text to a report.
You can now format the text by changing the font, color, size, and so on. Select the text and make theappropriate changes in the Properties pane.
Procedure
1. Click the Toolbox icon , drag the Text Item object to the report.
The Text dialog box appears.2. Type the text and click OK.
Tip: You can also paste text from another part of the report.
Specify the font for a reportYou can specify the font for text in a report.
254 IBM Cognos Analytics - Reporting Version 11.0 : User Guide

Procedure
1. Click the object.
Tip: To specify the default font for the report, click the page.2. Do one of the following:
• From the report object toolbar, click the Font icon and then specify the font properties.• In the Properties pane, double-click the Font property and specify the font properties.
To specify the color of the text, from the report object toolbar, click the Font icon , and then clickForeground color. Alternatively, you can specify the color of the text by clicking the Foregroundcolor property for the object.
Tip: Type a list of fonts in the Family box if you are not sure whether a specific font is installed on auser's computer. For example, if you type Times New Roman, Arial, monospace, IBM CognosAnalytics - Reporting checks to see if Times New Roman is installed. If it is not, Reporting checks forArial. If Arial is not installed, the monospace font used by the computer is used.
ResultsIf you clicked (Default) for any of the font properties, the default value for the property is used. Defaultvalues are stored in a style sheet that is used across all IBM Cognos Analytics tools. You can modifydefault values by modifying classes.
Insert an Image in a ReportYou can insert an image in a report. You can insert images in other objects, such as blocks or table cells,directly in the report page or as the background image of another object.
Before you begin
The images that you insert must first be uploaded to the IBM Cognos Analytics server or another webserver and must be .gif or .jpg format.
About this task
The images that are included with Cognos Analytics are in a different location than in IBM CognosBusiness Intelligence releases. In Cognos Analytics, the images are located in install_location\webcontent\bi\images. If you have existing reports with hard coded links to IBM Cognos BusinessIntelligence images, you must copy the images to this folder, or update the image references to thefolder.
Procedure
1. Click the Toolbox icon , select Layout, drag the Image object to the report, and then double-click it.
2. From the Image Picker box, specify an image in one of these ways:
• Double-click an image in the Image Gallery.
Tip: The image gallery must first be created by your administrator. For more information, see theIBM Cognos Analytics Managing Guide.
• In the text box, type the URL of an image.• Click Browse to go to the location that contains the image.
Tip: To browse images on a web server, you must enable Web-based Distributed Authoring andVersioning (WebDAV) on your web server. For more information about configuring web servers, seethe IBM Cognos Analytics Installation and Configuration Guide.
Chapter 12. Laying Out a Report 255
Insert a Background Image in an ObjectYou can insert a background image for objects in a report. For example, use a background image to add awatermark to a page.
You can also create your own background visual effects, such as drop shadows and gradient fills. Formore information, see “Add background effects” on page 256.
Before you begin
The images that you insert must first be uploaded to the IBM Cognos Analytics server or another Webserver and must be .gif or .jpg format.
Procedure
1. Select the object.2. In the Properties pane, under Color & Background, double-click the Background Image property.3. To use the background from the default style for the object (Cascading Style Sheet (CSS) class), click
Default.4. To explicitly not insert a background image, click None.
This option overrides any default background images including background gradients on objects thatappear in the 10.x report styles.
5. To insert a specific image, click Specified, and then do one of the following:
• In the Image URL box, type the URL of an image.• Click Browse, and double-click an image in the Image Gallery.
Tip: The image gallery must first be created by your administrator. For more information, see theIBM Cognos Analytics Managing Guide.
• Click Browse, and go to the location on the web server that contains images.
Tip: To browse images on a web server, you must enable Web-based Distributed Authoring andVersioning (WebDAV) on your web server. For more information about configuring web servers, seethe IBM Cognos Analytics Installation and Configuration Guide.
6. In the Position box, choose how to align the image in the object.7. In the Tiling box, click a tiling option.
Related tasksChange a Chart Background in a Legacy Chart
Add background effectsYou can add background effects to enhance the appearance of your report. You can enhance objects,such as data containers (lists, crosstabs, and charts), headers, footers, page bodies, and so on withborders, gradient fill effects, drop shadows, and background images. You can also apply backgroundeffects as a class style.
The background effect is rendered within the area that bounds the object. To use a generated backgroundin a chart, the chart must have a fixed size.
If the background image is complex and large, the size of the report output may be affectedproportionately.
Background effects are rendered only if the data container has a fixed height and width; if a percentagesize is used, the effects are ignored.
Resizing or overflow behavior is ignored for generated images in HTML reports.
256 IBM Cognos Analytics - Reporting Version 11.0 : User Guide

Add background effects to a chartBackground effects include borders, fills, drop shadows, images, texture effects, and bevel effects.
Procedure
1. Click the chart object.2. To apply a preset background fill effect, from the report object toolbar, click the Background effects
presets icon .3. In the Properties pane, under Color & background, double-click the Background effects property.4. Select one or more of the following:
• To apply a border, click Border and specify settings for border style, width, color, corner radius forrounded rectangles, and transparency.
If the element also includes a fill with a transparency setting, select the Allow transparent bleedcheck box to apply the same transparency to the border.
• To apply a fill effect, click Fill and specify the settings. The fill effect can either be a solid color, agradient, or a pattern. You can define a gradient fill effect as a linear, radial line, or radial rectanglegradient.
• To apply a drop shadow effect, click Drop shadow and specify the shadow color, transparency value,color, and offset settings. The default horizontal and vertical offset is 5 pixels.
• To specify one or more images as a background, click Images. You can specify the transparencyvalue and the position for each defined image. You can also specify a custom position for eachimage.
Tip: To remove the effect, clear its check box.5. To add a texture effect, in the Properties pane, under Color & Background, select an option under
Material effects.6. To add a bevel, in the Properties pane, under Color & Background, double-click the Bevel property
and click a bevel effect.
Note: To see the Bevel property in a bar chart, you must first select the Series (primary axis) object inthe chart.
Add a background gradient to a pageA background gradient is a shading that goes from one color to another either horizontally or verticallyacross your page.
Procedure
1. Click anywhere in the report page.
2. In the Properties pane title bar, click the Select ancestor icon and click Page.3. Under Color & Background, double-click the Gradient property.4. Select the Gradient check box and then select the colors and direction for the gradient.
Background gradients and drop shadows do not appear in Microsoft Excel spreadsheet softwareoutput. They are also supported only for report outputs run in the Microsoft Internet Explorer Webbrowser.
Tip: To remove the effect, clear the Gradient check box.
Add a drop shadow to a containerA drop shadow is a border on the bottom and right of an object. You can specify the color andtransparency of this shadow.
Chapter 12. Laying Out a Report 257
Procedure
1. Click the crosstab, list, repeater table, or table in the report.
2. In the Properties pane title bar, click the Select ancestor icon and click Crosstab, List, Repeatertable, or Table.
Tip: You can also click the container selector (three orange dots) of the container to select it.3. Under Color & Background, double-click the Drop shadow property.4. Select the Drop shadow check box and then select the color, offset, and transparency values.
Background gradients and drop shadows do not appear in Excel output. They are also supported onlyfor report outputs run in the Internet Explorer Web browsers.
If you add a drop shadow, ensure that you also specify a background color for the object. Otherwise, ifyou keep the default transparent background, data values also have a drop shadow and are difficult toread.
Tip: To remove the effect, clear the Drop shadow check box.
Insert a Formatting Object in a Report
In addition to text and images, the Toolbox icon contains other objects that you can add to the reportlayout.
Object Description
BlockAdds an empty block, which is a container in which you can insertother objects. This is useful for controlling where objects appear.
Tip: You can use blocks to add space between objects. However,empty blocks are not rendered. You must insert an object orspecify the height and width.
Tip: The Revenue by GO Subsidiary 2011 sample report in the GOData Warehouse (analysis) package includes an empty block.
Table Adds a table, which is a container in which you can insert otherobjects. This is useful for controlling where objects appear.
Field setAdds an empty block that has a caption. This is similar to the Blockobject, but with a caption.
Intersection (tuple) Adds an intersection (tuple). For more information, see “Create anIntersection (Tuple)” on page 231.
Query calculation Adds a calculated column. For more information, see “Usingrelational calculations” on page 182 or “Using DimensionalCalculations” on page 227.
Layout calculation Adds run-time information to the report layout, such as the currentdate. For more information, see “Create a Layout Calculation” onpage 185 in the Relational Reporting Style chapter or “Create aLayout Calculation” on page 230 in the Dimensional ReportingStyle chapter.
258 IBM Cognos Analytics - Reporting Version 11.0 : User Guide
Object Description
Crosstab space Inserts an empty cell on a crosstab edge. Allows for the insertion ofnon-data cells on an edge. Blank cells appear for the edge whenthe report is run.
Insert this object when a crosstab edge does not produce usefuldata and you want blanks to appear in the cells instead.
Crosstab space (with fact cells) Inserts an empty cell on a crosstab edge. Allows for the insertion ofnon-data cells on an edge. The contents of the fact cells for theedge are rendered when a measure is added or the defaultmeasure is specified.
• If the crosstab space is nested, the scope of the fact cells is thescope of the item that is at the level before the space.
• If the crosstab space is not nested and there are no items nestedbelow it, the scope of the fact cells is the default measure.
Singleton Inserts a single data item. For more information, see “Inserting asingle data item” on page 20
Conditional blocksAdds an empty block that you can use for conditional formatting.
HTML itemAdds a container in which you can insert HTML code. HTML itemscan be anything that your browser will execute, including links,images, multimedia, tooltips, or JavaScript.
HTML items appear only when you run the report in HTML format.
Note: You cannot include <form> tags in HTML items.
Tip: The Table of Contents sample report in the GO Sales (analysis)package includes an HTML item.
Note: When you upgrade to the next version of IBM CognosAnalytics, the report upgrade processes do not account for the useof undocumented and unsupported mechanisms or features, suchas JavaScript, that refers to IBM Cognos HTML objects.
Rich text itemInserts an object that is used to render HTML in the layout. Thisobject is similar to the HTML Item, except that rich text items alsorender in PDF output. Using rich text items is useful when you wantto add annotations defined in a data source to a report.
Note: Rich text items support only a restricted set of well-formedXHTML.
HyperlinkAdds a hyperlink so that users can jump to another place, such as aWeb site.
Hyperlink button Adds a hyperlink in the form of a button.
As-of-time expression Adds an As of Time expression so that you can show data for aspecific time period.
Date Adds the current date.
Chapter 12. Laying Out a Report 259

Object Description
Time Adds the current time.
Page number Inserts page numbers that you can customize.
Row numberNumbers each row of data returned when the report is run.
Note: You can add row numbers only to lists and repeaters.
Layout component referenceAdds a reference to another object. Useful when you want to reusean object.
Table of contents Creates a table of contents that is rendered in the output of areport.
Table of contents entry Adds a table of contents marker.
Bookmark Inserts a bookmark so that users can move from one part of areport to another.
Custom control Adds a custom user interface in JavaScript. For more information,see “Adding JavaScript to a report” on page 261.
For information about each prompt control and prompt buttons, see Chapter 11, “Adding Prompts toFilter Data,” on page 237. The Toolbox contains other objects when you work in other areas such asQuery explorer and Condition explorer.
Before you begin
Before you can add a hyperlink, HTML item, or hyperlink button, you must have the HTML items in reportcapability. For more information, see the IBM Cognos Analytics Administration and Security Guide.
Procedure
To add an object, click the Toolbox icon and double-click it or drag it to the report.
Elements supported in rich text itemsRich text items support all XHTML character entities, such as (non-breaking space), and thefollowing elements: div, span, ul, ol, and li.
Each element only supports the style attribute, which must contain a valid CSS style. In addition, ul and olelements support list-style attributes. Specifically, the ol element supports decimal, and the ul elementsupports circle, disc, and square, as well as list-style-image. For example, the following code produces anunordered list entitled List: with three items. Each list item is in a different color, and the list-styleattribute used is circle:
<div style="font-size:14pt; text-decoration:underline">List:</div><ul style="list-style-type:circle"><li style="color:green">Item <span style="font-weight:bold">A</span></li><li style="color:red">Item B</li> <li style="color:blue">Item C</li></ul>
Tip:
If you want to render more elements than div, span, ul, ol, and li, try enclosing the rich text in <HTML>tags. When rich text is enclosed in <HTML> tags, IBM Cognos Analytics supports more element types. For
260 IBM Cognos Analytics - Reporting Version 11.0 : User Guide

example, the following code produces the output "The word text is bolded and the word italics isitalicized.".
<html>The word <strong>text</strong> is bolded and the word <em>italics</em> is italicized.<html>
Adding JavaScript to a report
Add JavaScript to a report to provide your own user interfaces when the report is run in HTML.
About this task
In IBM Cognos Analytics, you can add JavaScript in the following ways.
• As with IBM Cognos Business Intelligence releases, you can add JavaScript in HTML item objects.
In Cognos Analytics, JavaScript in HTML items is executed only when the report is run with limitedinteractivity (the report property Run with full interactivity is set to No).
Note: If you run a report with full interactivity, use HTML items to insert only static HTML or static CSSinto the report output.
• You can add JavaScript to reports by using two types of Asynchronous Module Definition (AMD)modules.
With this choice, JavaScript is executed when the report is run with full interactivity (the report propertyRun with full interactivity is set to Yes).
The JavaScript must exist in a separate file that your browser can access.
The two types of AMD modules that you can use are
1. A module that implements the CustomControl Module interface.2. A module that implements the Page Module interface.
You add a CustomControl Module interface to a report by referencing the interface in a custom controlobject. The reference is a file location that you specify in the Module path property of the custom control.Add a custom control to provide your own user interface for a prompt-like control that reads and setsparameters or for page navigation buttons.
You add a Page Module interface by referencing the interface in a report page or a prompt page. Thereference is a file location that you specify in the Module path property of the page. Add a page module toset the initial state of prompt controls, to set prompt control custom validation functions, or to readcurrent selections from a prompt control.
For information about the JavaScript that Cognos Analytics supports, see the technote Adding JavaScriptto a report (www.ibm.com/support/docview.wss?uid=swg21990557) and article describing the list ofJavaScript samples (https://community.ibm.com/community/user/businessanalytics/blogs/steven-macko/2018/03/22/updated-javascript-samples-for-ibm-cognos-analytics-11010?CommunityKey=6b10df83-0b3c-4f92-8b1f-1fd80d0e7e58&tab=recentcommunityblogsdashboard).
Procedure
1. To add a custom control, from the toolbox , drag the Custom control icon to the report.
2. Select the custom control and click the Show properties icon .a) To specify the location of the file that contains the JavaScript that you want to use for the control,
click the Module path property.b) To add JSON that configures the custom control, click the Configuration property.
Chapter 12. Laying Out a Report 261
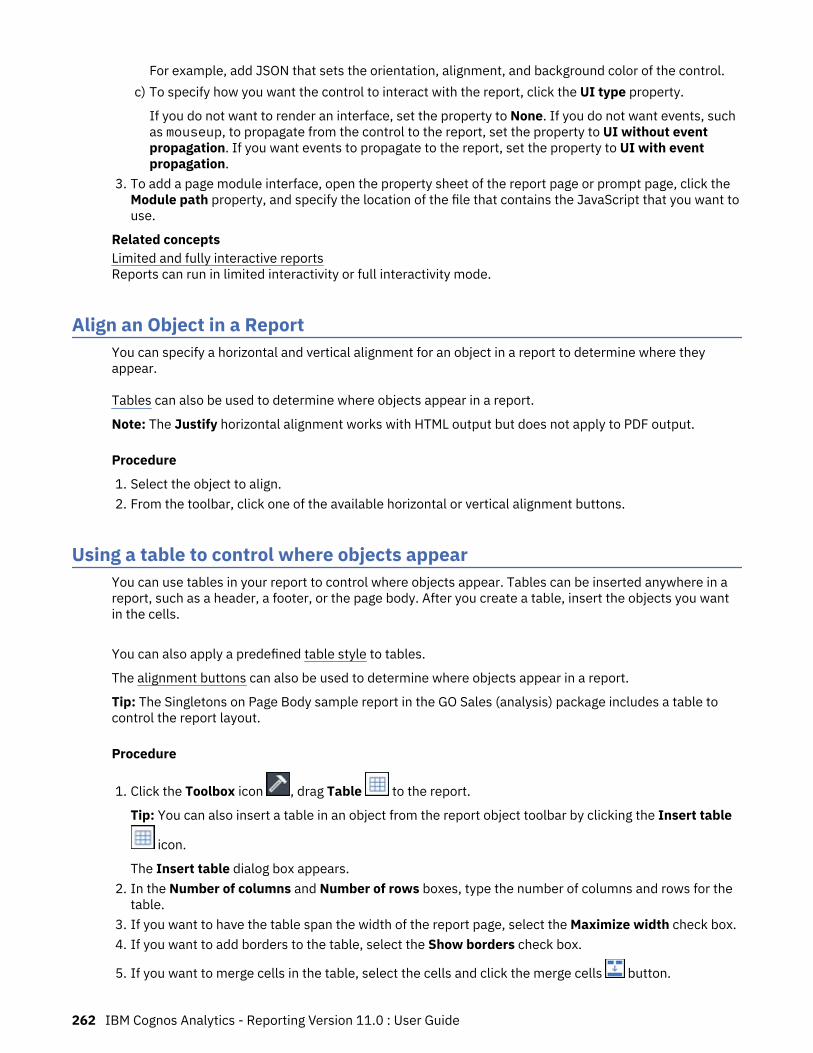
For example, add JSON that sets the orientation, alignment, and background color of the control.c) To specify how you want the control to interact with the report, click the UI type property.
If you do not want to render an interface, set the property to None. If you do not want events, suchas mouseup, to propagate from the control to the report, set the property to UI without eventpropagation. If you want events to propagate to the report, set the property to UI with eventpropagation.
3. To add a page module interface, open the property sheet of the report page or prompt page, click theModule path property, and specify the location of the file that contains the JavaScript that you want touse.
Related conceptsLimited and fully interactive reportsReports can run in limited interactivity or full interactivity mode.
Align an Object in a ReportYou can specify a horizontal and vertical alignment for an object in a report to determine where theyappear.
Tables can also be used to determine where objects appear in a report.
Note: The Justify horizontal alignment works with HTML output but does not apply to PDF output.
Procedure
1. Select the object to align.2. From the toolbar, click one of the available horizontal or vertical alignment buttons.
Using a table to control where objects appearYou can use tables in your report to control where objects appear. Tables can be inserted anywhere in areport, such as a header, a footer, or the page body. After you create a table, insert the objects you wantin the cells.
You can also apply a predefined table style to tables.
The alignment buttons can also be used to determine where objects appear in a report.
Tip: The Singletons on Page Body sample report in the GO Sales (analysis) package includes a table tocontrol the report layout.
Procedure
1. Click the Toolbox icon , drag Table to the report.
Tip: You can also insert a table in an object from the report object toolbar by clicking the Insert table
icon.
The Insert table dialog box appears.2. In the Number of columns and Number of rows boxes, type the number of columns and rows for the
table.3. If you want to have the table span the width of the report page, select the Maximize width check box.4. If you want to add borders to the table, select the Show borders check box.
5. If you want to merge cells in the table, select the cells and click the merge cells button.
262 IBM Cognos Analytics - Reporting Version 11.0 : User Guide
6. Select the table object.7. In the Properties pane, under Positioning, double-click the Table Properties property.8. To display both the inside and outside borders, do the following:
• Clear the Collapse borders check box.• Type a number in the Cell spacing text box to define how much space to add between the table
cells.• Select the Show empty cell borders check box to display the borders even for empty cells.
9. To fix the size of the columns in the table, check the Fixed size check box.
When this check box is cleared, the table columns expand to fit the text.
Apply a Table StyleApply a table style to quickly format tables. You can also apply a table style to lists, crosstabs, andrepeater tables.
About this task
By default, when a new object is inserted in a list or crosstab, the object inherits the style from an objectof the same type in the data container. For example, if you insert a measure in a list, the measure inheritsthe style of a measure that is already in the list, if there is one. If you do not want objects to inherit styles,clear the Table Style inheritance option in the More options (More, Options, Report tab).
The following rules explain how style inheritance is applied to lists and crosstabs.
• Styles are inherited in the following order: custom, client default, and server default.
A custom style is a style that you manually apply. A client default style is one of the styles available inthe Apply Table Style dialog box. The server default style is the style applied when Default is selectedin the Apply Table Style window.
• When a new column or row is inserted, it inherits the style from the sibling of the same type that is on itsright or below it.
• If there is no sibling of the same type, then the style of the nearest sibling that is on its left or above it isapplied.
• If there is no sibling of the same type in the container, then the client or server default table style isapplied.
• If a custom style is applied to a column or row and the object is then moved to another location, theobject retains the custom style.
Custom styles applied to part of an object, such as the header, body, or footer, may be lost. Forexample, if a container has a footer, the footer is recreated when a column is moved. The recreatedfooter is rendered using the style that was applied to the footer before you customized its style.
• Deleting a column or row has no impact on the styles of the other objects in the container.• Styles are preserved if a column is grouped or ungrouped. The same applies when creating or removing
sections.• When drilling up or down, the style of the parent item is applied.
Procedure
1. Click the table, list, crosstab, or repeater table.2. From the report object toolbar, click More > Style > Apply table style.3. In the Table styles box, click a table style.
Tip: Some styles are unique to tables, lists, or crosstabs.4. If you are applying a table style to a table or list, in the Apply special styles to section, select or clear
the various column and row check boxes based on how you want to treat the first and last columnsand rows.
Chapter 12. Laying Out a Report 263

Some check boxes may not be available for particular table styles, or to particular columns or rows.5. If you are applying a table style to a list or crosstab and you want the style to be applied to all lists or
crosstabs in the report, select the Set this style as the default for this object type check box.
For a list, you may need to clear the First column and Last column check boxes in the Apply specialstyles to section before you can select this check box. In addition, some table styles cannot be set asthe default.
Apply Padding to an ObjectApply padding to an object to add white space between the object and its margin or, if there is a border,between the object and its border.
Tip: You can quickly apply before or after padding by pressing Tab or Shift+Tab.
Tip: The GO Balance Sheet as at Dec 31 2012 sample report in the GO Data Warehouse (analysis)package includes padding.
Procedure
1. Select the object to which to apply padding.2. In the Properties pane, double-click the Padding property.3. Specify top, bottom, left, and right padding by typing values in the corresponding boxes and choosing
the unit of measure.
Note: Specifying padding using % as the unit of measure is not supported when producing reports inPDF.
Set Margins for an ObjectSet the margins for objects in a report to add white space around them.
For Date, Time, Row Number, and Page Number objects, you can only set the left and right margins. If youwant to set the top or bottom margins for these objects, place them in a table or a block. Then set themargin or padding properties on the table or block object.
Procedure
1. Select the object.2. In the Properties pane, double-click the Margin property.3. Specify the top, bottom, left, and right margins by typing values in the corresponding boxes and
choosing the unit of measure.
Note: Specifying margins using % as the unit of measure is not supported when producing reports inPDF.
Add multiple items to a single columnYou can add multiple items to a single column to condense a report. For example, you have a list reportthat contains many columns. You can reduce the number of columns in the list by putting relatedinformation in a single column.
Procedure
1. Click the More icon , and then click Locked to unlock the report.
264 IBM Cognos Analytics - Reporting Version 11.0 : User Guide

2. From the content pane, drag the items to the column.
For example, you can add data items from the Source tab or text items from the Toolbox tab
.
Reuse a Layout ObjectYou can save time by reusing layout objects that you add to a report instead of re-creating them. Forexample, you have a multiple-page report and you want to show the company logo in the page header ofeach page. Insert the logo once and reuse it on all other pages.
Procedure
1. Click the object to reuse.
Tip: To quickly select the parent of an object, click the object, and then click the Select ancestor icon
in the title bar of the Properties pane.2. In the Properties pane, set the Name property to a value beginning with a letter to uniquely identify
the object and press the Enter key.
IBM Cognos Analytics - Reporting may have already specified a name for the object.3. To reuse the object in another report, open that report.
4. Click the Toolbox icon , drag the Layout component reference object to the location in which itwill be reused.
5. In the Component Location box, do one of the following:
• To reference an object in the current report, click This report.• To reference an object in another report, click Another report, click the ellipsis button, and open the
report.
Note: In active reports, you cannot reference objects from another active report.6. In the Available components to reference box, click the object and click OK.7. If the referenced object is in another report, click the Layout component reference object and in the
Properties pane, set the Embed property to specify how to store the referenced object in the report:
• Click Copy to store a copy of the object.
The copy is not automatically updated if the source object is modified.
Note: In active reports, you can store referenced objects only by copying them to the report.• Click Reference to store a reference, or pointer, of the object.
The reference of the object is automatically updated if the source object is modified. For example, ifyou open or run the report, you see the modified object.
ResultsA copy or reference of the object appears where you placed the Layout component reference object. If asource object is changed, you can update reused objects.
Tip: You can also create a new report or template and add all the objects to share. All your shared objectsthen reside in a single location, like a library.
Change a Reused ObjectIf you reuse an object that contains other objects, you can change the child objects to somethingdifferent. For example, you have a block object containing a text item in the page header and you decide
Chapter 12. Laying Out a Report 265

to reuse the block in the page footer. However, you want the text item in the page footer block to showdifferent text from that in the page header.
About this task
If you reuse a visualization, you cannot change the data container of the visualization.
Procedure
1. In the parent object to reuse, click the child object to change.2. In the Properties pane, set the Name property to a value beginning with a letter to uniquely identify
the object.
IBM Cognos Analytics - Reporting may have already specified a name for the object.3. Select the copy of the parent object you created with the Layout component reference object.4. In the Properties pane, double-click the Overrides property.5. In the Overrides dialog box, select the child object to change and click OK.
The child object in the copy of the parent object is replaced by the following text:
Drop item to override component child.6. Drag an object to replace the child object.
You can replace the child object with any other object, not just an object of the same type. Forexample, if the child object is a text item, you can replace it with an image.
Update Reused ObjectsIf a report contains objects referenced in another report, you can quickly update the referenced objects ifthe source objects have changed. Shared objects are stored in the layout component cache.
Procedure
1. Open the report to update.
2. Click the More icon , click Layout components.
The Layout component cache dialog box appears, showing all reports that contain referenced objectsand the source reports where the objects exist.
3. To view which components are reused, click a source report.
The components that are reused appear in the Components used pane.4. Click Reload Components to refresh all referenced objects.
Although referenced objects are automatically refreshed when you open or run a report, clicking thisbutton updates components that were changed while the report is open.
5. Click Update All Component Copies to refresh all copied objects.6. Click Close.
Specify text and container directionYou can specify text and container direction by choosing any of these options.
266 IBM Cognos Analytics - Reporting Version 11.0 : User Guide
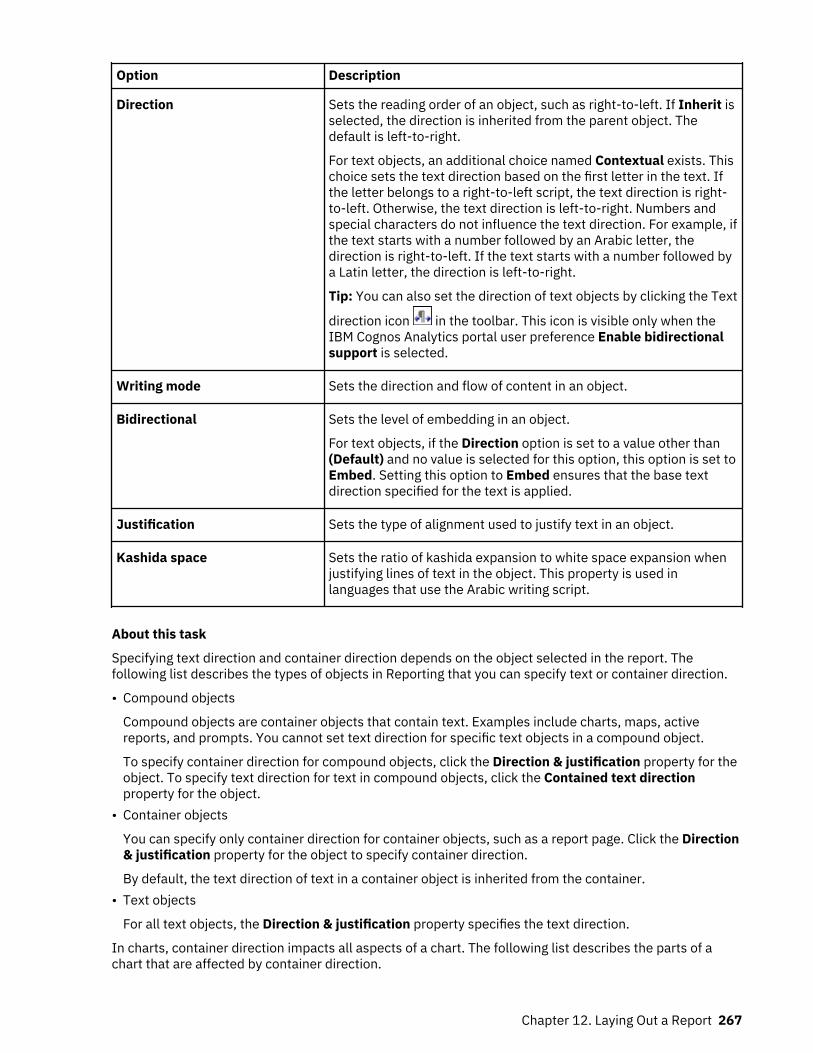
Option Description
Direction Sets the reading order of an object, such as right-to-left. If Inherit isselected, the direction is inherited from the parent object. Thedefault is left-to-right.
For text objects, an additional choice named Contextual exists. Thischoice sets the text direction based on the first letter in the text. Ifthe letter belongs to a right-to-left script, the text direction is right-to-left. Otherwise, the text direction is left-to-right. Numbers andspecial characters do not influence the text direction. For example, ifthe text starts with a number followed by an Arabic letter, thedirection is right-to-left. If the text starts with a number followed bya Latin letter, the direction is left-to-right.
Tip: You can also set the direction of text objects by clicking the Text
direction icon in the toolbar. This icon is visible only when theIBM Cognos Analytics portal user preference Enable bidirectionalsupport is selected.
Writing mode Sets the direction and flow of content in an object.
Bidirectional Sets the level of embedding in an object.
For text objects, if the Direction option is set to a value other than(Default) and no value is selected for this option, this option is set toEmbed. Setting this option to Embed ensures that the base textdirection specified for the text is applied.
Justification Sets the type of alignment used to justify text in an object.
Kashida space Sets the ratio of kashida expansion to white space expansion whenjustifying lines of text in the object. This property is used inlanguages that use the Arabic writing script.
About this task
Specifying text direction and container direction depends on the object selected in the report. Thefollowing list describes the types of objects in Reporting that you can specify text or container direction.
• Compound objects
Compound objects are container objects that contain text. Examples include charts, maps, activereports, and prompts. You cannot set text direction for specific text objects in a compound object.
To specify container direction for compound objects, click the Direction & justification property for theobject. To specify text direction for text in compound objects, click the Contained text directionproperty for the object.
• Container objects
You can specify only container direction for container objects, such as a report page. Click the Direction& justification property for the object to specify container direction.
By default, the text direction of text in a container object is inherited from the container.• Text objects
For all text objects, the Direction & justification property specifies the text direction.
In charts, container direction impacts all aspects of a chart. The following list describes the parts of achart that are affected by container direction.
Chapter 12. Laying Out a Report 267
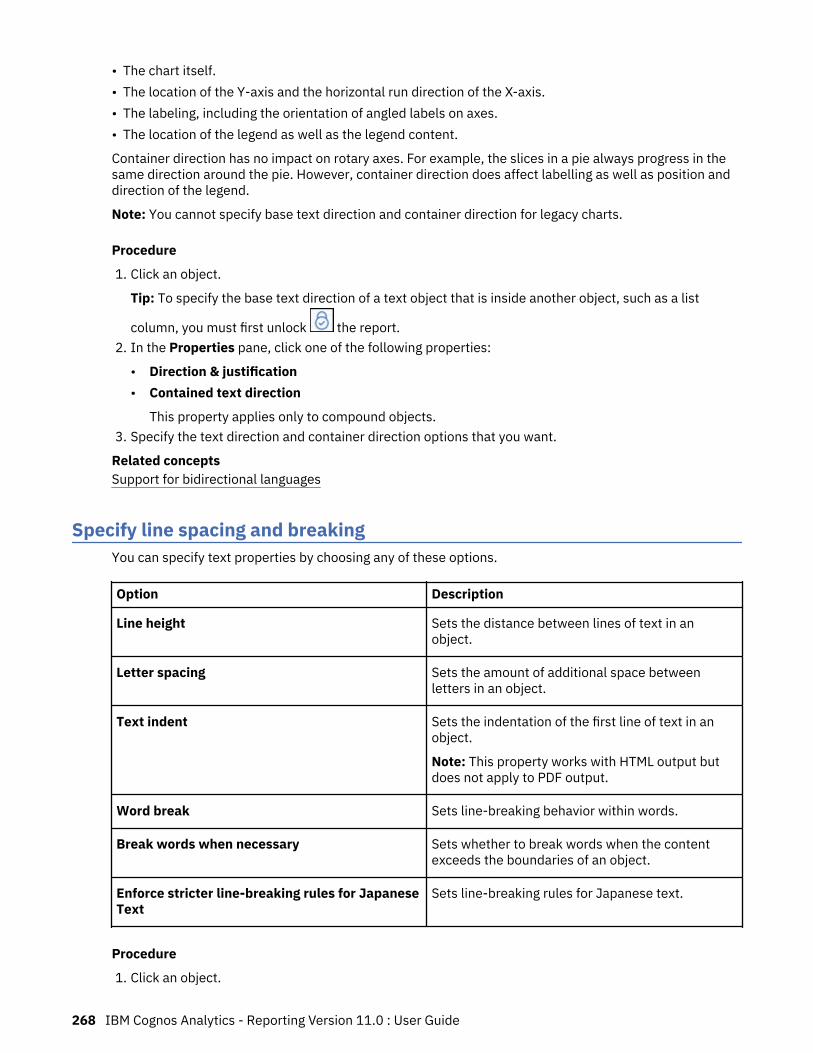
• The chart itself.• The location of the Y-axis and the horizontal run direction of the X-axis.• The labeling, including the orientation of angled labels on axes.• The location of the legend as well as the legend content.
Container direction has no impact on rotary axes. For example, the slices in a pie always progress in thesame direction around the pie. However, container direction does affect labelling as well as position anddirection of the legend.
Note: You cannot specify base text direction and container direction for legacy charts.
Procedure
1. Click an object.
Tip: To specify the base text direction of a text object that is inside another object, such as a list
column, you must first unlock the report.2. In the Properties pane, click one of the following properties:
• Direction & justification• Contained text direction
This property applies only to compound objects.3. Specify the text direction and container direction options that you want.
Related conceptsSupport for bidirectional languages
Specify line spacing and breakingYou can specify text properties by choosing any of these options.
Option Description
Line height Sets the distance between lines of text in anobject.
Letter spacing Sets the amount of additional space betweenletters in an object.
Text indent Sets the indentation of the first line of text in anobject.
Note: This property works with HTML output butdoes not apply to PDF output.
Word break Sets line-breaking behavior within words.
Break words when necessary Sets whether to break words when the contentexceeds the boundaries of an object.
Enforce stricter line-breaking rules for JapaneseText
Sets line-breaking rules for Japanese text.
Procedure
1. Click an object.
268 IBM Cognos Analytics - Reporting Version 11.0 : User Guide
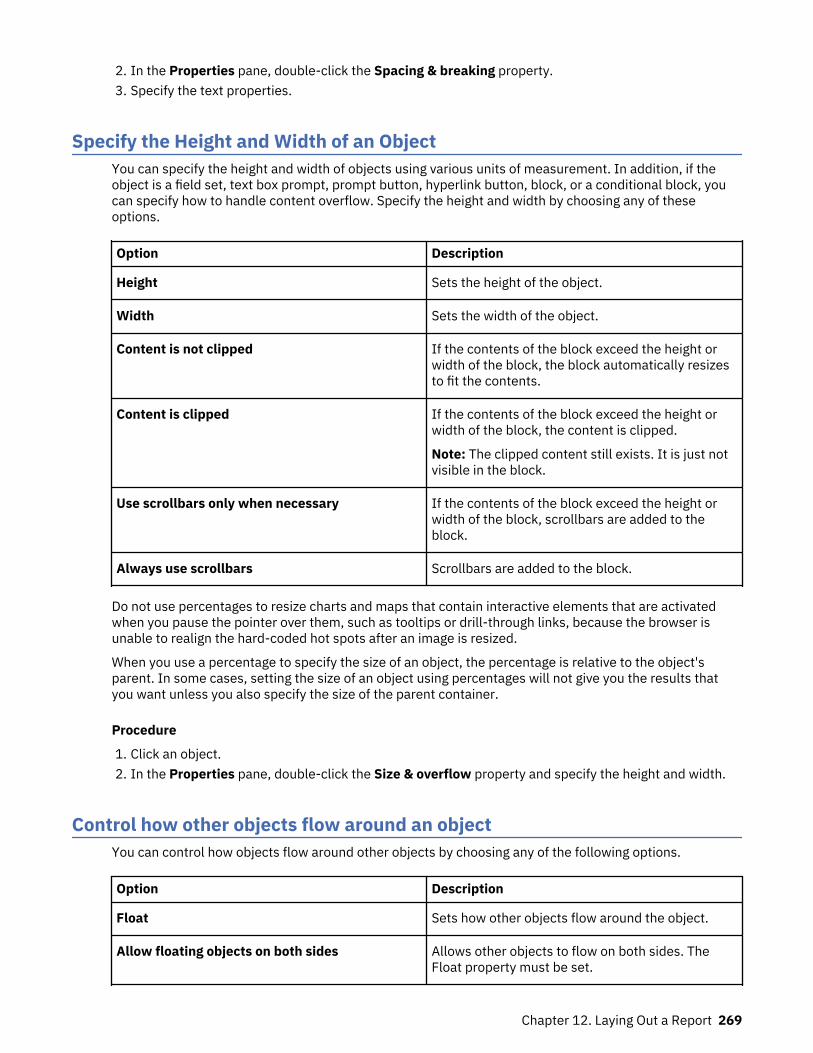
2. In the Properties pane, double-click the Spacing & breaking property.3. Specify the text properties.
Specify the Height and Width of an ObjectYou can specify the height and width of objects using various units of measurement. In addition, if theobject is a field set, text box prompt, prompt button, hyperlink button, block, or a conditional block, youcan specify how to handle content overflow. Specify the height and width by choosing any of theseoptions.
Option Description
Height Sets the height of the object.
Width Sets the width of the object.
Content is not clipped If the contents of the block exceed the height orwidth of the block, the block automatically resizesto fit the contents.
Content is clipped If the contents of the block exceed the height orwidth of the block, the content is clipped.
Note: The clipped content still exists. It is just notvisible in the block.
Use scrollbars only when necessary If the contents of the block exceed the height orwidth of the block, scrollbars are added to theblock.
Always use scrollbars Scrollbars are added to the block.
Do not use percentages to resize charts and maps that contain interactive elements that are activatedwhen you pause the pointer over them, such as tooltips or drill-through links, because the browser isunable to realign the hard-coded hot spots after an image is resized.
When you use a percentage to specify the size of an object, the percentage is relative to the object'sparent. In some cases, setting the size of an object using percentages will not give you the results thatyou want unless you also specify the size of the parent container.
Procedure
1. Click an object.2. In the Properties pane, double-click the Size & overflow property and specify the height and width.
Control how other objects flow around an objectYou can control how objects flow around other objects by choosing any of the following options.
Option Description
Float Sets how other objects flow around the object.
Allow floating objects on both sides Allows other objects to flow on both sides. TheFloat property must be set.
Chapter 12. Laying Out a Report 269
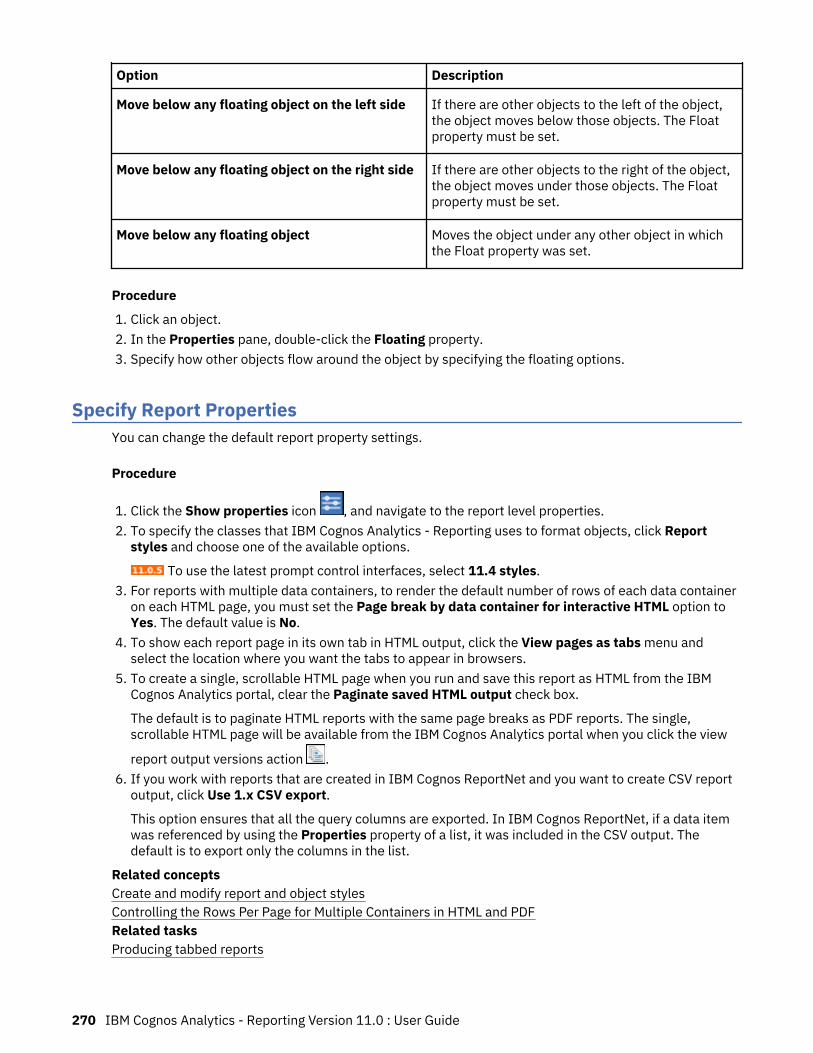
Option Description
Move below any floating object on the left side If there are other objects to the left of the object,the object moves below those objects. The Floatproperty must be set.
Move below any floating object on the right side If there are other objects to the right of the object,the object moves under those objects. The Floatproperty must be set.
Move below any floating object Moves the object under any other object in whichthe Float property was set.
Procedure
1. Click an object.2. In the Properties pane, double-click the Floating property.3. Specify how other objects flow around the object by specifying the floating options.
Specify Report PropertiesYou can change the default report property settings.
Procedure
1. Click the Show properties icon , and navigate to the report level properties.2. To specify the classes that IBM Cognos Analytics - Reporting uses to format objects, click Report
styles and choose one of the available options.
To use the latest prompt control interfaces, select 11.4 styles.3. For reports with multiple data containers, to render the default number of rows of each data container
on each HTML page, you must set the Page break by data container for interactive HTML option toYes. The default value is No.
4. To show each report page in its own tab in HTML output, click the View pages as tabs menu andselect the location where you want the tabs to appear in browsers.
5. To create a single, scrollable HTML page when you run and save this report as HTML from the IBMCognos Analytics portal, clear the Paginate saved HTML output check box.
The default is to paginate HTML reports with the same page breaks as PDF reports. The single,scrollable HTML page will be available from the IBM Cognos Analytics portal when you click the view
report output versions action .6. If you work with reports that are created in IBM Cognos ReportNet and you want to create CSV report
output, click Use 1.x CSV export.
This option ensures that all the query columns are exported. In IBM Cognos ReportNet, if a data itemwas referenced by using the Properties property of a list, it was included in the CSV output. Thedefault is to export only the columns in the list.
Related conceptsCreate and modify report and object stylesControlling the Rows Per Page for Multiple Containers in HTML and PDFRelated tasksProducing tabbed reports
270 IBM Cognos Analytics - Reporting Version 11.0 : User Guide

When you produce reports in HTML format, you can show each report page as a tab.
Create and modify report and object stylesCreate your own classes or modify existing classes in a report to format objects across a report accordingto your particular needs. In IBM Cognos Analytics - Reporting, objects in reports are assigned a CascadingStyle Sheet (CSS) class that provides a default style for the object. For example, when you create a newreport, the report title has the class property Report title text assigned to it. In addition, objects inheritthe classes set on their parent objects.
You can use classes to highlight data using conditional styles.
Classes you create or modify can be applied only to the current report. To create or modify classes for allreports, you must modify a layout style sheet. In addition, some classes can be used to format QueryStudio reports.
If you use the Microsoft Internet Explorer Web browser, version 6, some color gradients used in the 10.xdefault report styles are not supported.
Modify the report styleYou can define whether your report uses the default styles for this version or the styles from a previousversion.
Procedure
1. Click the Show properties icon .2. Click Report styles and select one of the following options:
• To work with classes in the default style sheet, click 10.x styles.• To work with classes that were used in IBM Cognos 8, click 8.x styles.
Use 8.x report styles when you are working with reports created in IBM Cognos 8 and you want topreserve their original appearance.
• To work with classes that were used in IBM Cognos ReportNet, click 1.x styles.
Use 1.x report styles when you are working with reports created in ReportNet and you want topreserve their original appearance.
• To work with classes that have minimal styling defined, click Simplified styles.
This option is useful when creating financial reports.
Modify object stylesYou can change global classes to modify the style of all objects in a report or you can modify local classesand apply them to specific objects.
Procedure
1. Click the Pages icon , and click Classes.
2. To create a new class, click the Toolbox icon , drag Class to the Local Classes pane.3. To modify an existing class, in the Local Classes or Global Class Extensions pane, click the class.
Modify a global class to apply a change to all objects that use that class. For example, if you modifiedthe style List column title cell, all column titles in lists will reflect your modifications.
Tip: Ctrl+click classes to make the same change to more than one class.4. In the Properties pane, modify the properties to specify your desired formatting.
Chapter 12. Laying Out a Report 271

Tip: Look at the Preview pane to preview your changes for different report objects, such as blocks,table cells, and text items.
If you modify a global class, a pencil symbol appears beside the global class icon to indicate that theclass was modified.
5. Apply the class to objects:
• Click the Pages icon, and click a report page.• Click an object to which to apply a class.• In the Properties pane, double-click the Class property.• Click the classes to apply from the Local classes and Global classes panes and click the right arrow
button .• If you applied more than one class, in the Selected classes pane, specify the order in which the
classes are applied using the up and down arrow buttons.
Classes in the Selected classes pane are applied from top to bottom. The style properties from allclasses are merged together when they are applied. However, if the classes have style properties incommon, the properties from the last class applied override those from previous classes.
Reusing styles from another reportYou can apply local and global styles or themes from one report in another report.
About this task
Local styling is kept when you reference styles from another report. However, you can remove some or alllocal styling from the target report.
If the referenced report is renamed or moved, the reference information in the target report isautomatically updated.
You can reference local classes only if local classes with the same name exist in the target report. You canreference styles from a report only if you have the permissions to access the report. If you referencedstyles from a report and the permissions for the report are changed so that you can no longer access it,the referenced styles are still applied when the target report is run.
You cannot use a report that contains referenced styles as the source report for style references for otherreports.
If the target report contains more than one page, the Preview pane in the Report Style Referenceswindow shows how the referenced styles are applied in the report page that you are currently viewing.
Tip: You can see which global classes contain inherited styles when you click Pages > Classes. Global
classes that reference styles from another report are identified by the referenced styles icon . You canalso modify classes that contain referenced styles. Such classes are identified by the modified referenced
styles icon .
Procedure
1. Click the Show properties icon , click the select ancestor icon , click Report, and then, in theSTYLE section, click Theme.
2. Select the Apply style from report check box.3. Click the ellipsis icon and open the report that contains the styles that you want to reuse.4. To remove local styles in the report, in the Remove custom styles from the current report section,
select the check boxes of the styles that you want to remove.5. To specify when to refresh styles when styles in the referenced report are modified, in the Refresh
report styles section, select one of the following options.
272 IBM Cognos Analytics - Reporting Version 11.0 : User Guide

• To refresh styles automatically, click the Run time radio button.• To control when styles are refreshed, click the Manually radio button.
When this choice is selected, styles are refreshed only when you click the Refresh now icon.
Related conceptsTemplates and themesIBM Cognos Analytics includes several basic report templates and color themes that you can choose fromwhen you create a new report.
(Don't Print) classThe (Don't Print) class allows HTML items to display in the Web browser but not to print.
The (Don't Print) class behaves as follows in the various report output formats:
• HTML
The Web browser defines the behavior. The HTML standard is that the item appears on the screen in theWeb browser but is excluded by the print operation of the Web browser.
The item is excluded from the output.• Microsoft Excel 2002 spreadsheet software
The class is specified in the HTML that IBM Cognos uses to render Microsoft Excel 2002 output.However, Microsoft Excel 2002 does not appear to honor it and displays the item as missing some or allother style definitions.
• Microsoft Excel 2007 spreadsheet software
The item is excluded from the output.• CSV
The item is included in the output.• XML
The item is included in the output.
An alternative way to consistently exclude a report object from HTML, PDF and Microsoft Excel output isto set the Box Type property for the object to None. CSV and XML report outputs will still contain theobject.
Modify classes to format Query Studio reportsSome global classes are specific to IBM Cognos Query Studio or can be applied to Query Studio reports.You can modify the following classes to format Query Studio reports.
To format a Query Studio report using the modified classes, the template must be applied to the report.For more information about applying a template to a Query Studio report, see the Query Studio UserGuide.
Class Description
List column body cell Style used to format list data.
List column title cell Style used to format list column titles.
To modify classes, you must
1. Create a Query Studio template.2. Modify the global classes.3. Save the template.
Chapter 12. Laying Out a Report 273
Modifying the default layout style sheetIn addition to creating or modifying classes in a report, you can create and modify classes that will applyto all reports. Default styles are stored in a style sheet named GlobalReportStyles.css.
For information about modifying the style sheet, see the following topics:
• Chapter 3 - Modify Global Style Sheet in How to Implement a Corporate-Wide Reporting Style Using IBMCognos BI
• Create Custom Palettes in IBM Cognos 10 Report Studio
Important: The documents How to Implement a Corporate-Wide Reporting Style Using IBM Cognos BI andCreate Custom Palettes in IBM Cognos 10 Report Studio refer to Cognos BI 10.2.2. However, theinformation also applies to Cognos Analytics 11. The only difference is that in Cognos 11, the locationinstall location\webcontent\pat has changed to install location\webcontent\bi\pat.
Add color to an objectYou can add background and foreground color to objects in the report. The foreground color applies to thetext within objects.
Tip: The TOC Report sample report in the GO Data Warehouse (query) package includes objects withcolor.
About this task
When you open one of the color windows, such as the Foreground Color window, you can save up to eightcolors as favorites. Saving colors as favorites is useful when you define a custom color. When you save acustom color as a favorite, you do not need to reenter the RGB color values when you want to use thecolor elsewhere in the report.
Favorite colors are stored in cookies. As a result, favorite colors are shared across all Reporting users.
Procedure
1. Select the object.
Tip: To quickly select the parent of an object, click the object, and then, from the title bar of the
Properties pane, click the Select ancestor icon . You can also find a version of the Select ancestoricon in the report object toolbar.
2. Do one of the following:
• From the report object toolbar, click the Background color icon or click the Font icon , andthen click Foreground color.
• In the Properties pane, double-click the Background color or Foreground color property.3. To apply an existing color, click the Basic colors tab or Color swatch tab and choose one of the
available colors.
Use a basic color to select a color from a small set of colors. Use the color swatch to select from 216available colors.
4. To apply a custom color, click the Custom color tab and type values in the Red, Green, and Blueboxes.
The values must be hexadecimal.5. If the object is an extensible visualization and you want to specify the transparency, under
Transparency (%), type a percentage value or use the slider to set the transparency to the value thatyou want.
6. To save a color as a favorite, click Set as favorite.
274 IBM Cognos Analytics - Reporting Version 11.0 : User Guide

If you save a color with a transparency value as a favorite, the transparency is applied only when youadd the favorite color to an extensible visualization.
Tip: You can modify or replace a color that was saved as a favorite. Click the favorite color, make thechanges that you want, and click Set as favorite.
Related tasksAdd background effects to a chart object in a legacy chart
Chapter 12. Laying Out a Report 275

276 IBM Cognos Analytics - Reporting Version 11.0 : User Guide
Chapter 13. Working with your external dataYou can supplement your enterprise data with your own external or personal data file.
You can create a report that uses an external file that contains data that is not part of your IBM CognosAnalytics enterprise data. For example, you are an analyst and you receive a spreadsheet that containswhat-if data about opening new branches of your retail store. You are asked to analyze the impact ofthese possible new branches on existing sales volumes. You link this scenario data with your enterprisedata and create a professional report in IBM Cognos Analytics.
You import your own data file and start reporting on it right away. After you import the file, it is protectedby the same IBM Cognos security as your enterprise data. As a result, you can report on your data in asecure and private environment.
You can import your external data in different tools.
Upload files tool
You can import the following types of files:
• Microsoft Excel (.xls and .xlsx) spreadsheet software files• Delimited text files, such as .csv files
After you import your data, it is saved in a database. You then publish a package that contains yourdata and you can then report on your data. You can grant other users access to your personal data bysharing the corresponding packages.
Manage External Data tool
You can import the following types of files:
• Microsoft Excel (.xls and .xlsx) spreadsheet software files• Tab-delimited text (.txt) files• Comma-separated (.csv) files• XML (*.xml) files
After you import your data, you then publish a package that contains your data in addition to the datacontained in an existing package. You can then report on your data.
To review an up-to-date list of the environments that are supported by IBM Cognos products, includinginformation about operating systems, patches, browsers, web servers, directory servers, databaseservers, and application servers, see Supported Software Environments (www.ibm.com/support/docview.wss?uid=swg27047186).
Manage external dataYou can supplement your enterprise data with your own external or personal data file by using the
Manage External Data tool in IBM Cognos Analytics - Reporting.
You import your own data file and start reporting on it right away. After you import the file, it is protectedby the same IBM Cognos security as your enterprise data. As a result, you can report on your data in asecure and private environment.
You can use the following types of files:
• Microsoft Excel (.xls) spreadsheet software files
The Manage External Data tool supports external data sources from Microsoft Excel up to versionMicrosoft Excel 2007.
To review an up-to-date list of the environments that are supported by IBM Cognos products, includinginformation about operating systems, patches, browsers, web servers, directory servers, databaseservers, and application servers, see Supported Software Environments (www.ibm.com/support/docview.wss?uid=swg27047186).
• Tab-delimited text (.txt) files• Comma-separated (.csv) files• XML (*.xml) files
Your XML files must adhere to the IBM Cognos schema specified at c10_location/bin/xmldata.xsd. For more information, contact your IBM Cognos administrator.
This schema consists of a dataset element, which contains a metadata element and a data element.The metadata element contains the data item information in item elements. The data element containsall the row and value elements.
For example, the following simple XML code produces a table with two columns (Product Number andColor) and two rows of data.
<?xml version="1.0" ?> <dataset xmlns="http://developer.cognos.com/schemas/xmldata/1/" xmlns:xs="http://www.w3.org/2001/XMLSchema-instance"> <metadata><item name="Product Number" type="xs:string" length="6" scale="0"precision="2" /> <item name="Color" type="xs:string" length="18" scale="0"precision="8" /> </metadata> <data> <row> <value>1</value> <value>Red</value></row> <row> <value>2</value> <value>Blue</value> </row> </data> </dataset>
To work with your external data by using the Manage External Data tool, you start with an existing IBMCognos package. You import data from your external file into the package and create links between dataitems in your file and data items in your enterprise data source. You then publish a new package that youcan use to create reports that use your data and your enterprise data, or reports that use only your data.You can link your external data with both dimensional and relational data sources.
Before you can import your own external data file, your IBM Cognos administrator must grant youpermission for the Allow External Data capability that is found within the Reporting capability. You mustalso have permissions to use IBM Cognos Analytics - Reporting.
Packages that contain external data
When you import external data into a package with the Manage External Data tool, you do not overwritethe original package. You create a new package that includes the original package, the new external data,and any links or relationships that you defined between the two. By default, the new package is saved inthe My content area of the IBM Cognos Analytics portal, with External Data appended to the originalpackage name. You can change where your package is published.
Note: The current content language is used to create the new package, and users cannot select thelanguage for the package. For example, the content language in the IBM Cognos Analytics portal is set toEnglish. External data is imported into the GO Sales (query) package, and a new package called GO Sales(query) External Data is created. If the content language is changed to a different language, the packagename is not translated, even though GO Sales (query) is a multilingual package.
IBM Cognos samples
Sample external data sources in Microsoft Excel (.xls) format are provided with IBM Cognos Analytics.You can import these sample files into the Sample Outdoors Company sample reports that are found inthe GO Data Warehouse (analysis) or GO Data Warehouse (query) package.
You can find sample external data source files on the server where IBM Cognos Analytics is installed.Locate the Team content > Samples > Models > Sample file_GO sales.xls file to explore how to workwith external data.
To obtain these files, contact your IBM Cognos administrator.
278 IBM Cognos Analytics - Reporting Version 11.0 : User Guide

Preparing to work with your external dataTo work with your external data, follow the process in this section.
There are four steps to preparing to work with your external data. The following diagram details thesesteps.
2 3 41
Prepare your external data
file forimport.
Import yourexternal data
and linkyour datawith yourenterprise
data.
Createreports
with yourexternal
data.
Determine whether toshare your
reports.
Figure 45. Process to prepare to work with external data
1. Prepare your external data file for import.
Ensure that your external data file matches your enterprise data for your reporting needs. Forexample, if your external data file contains sales values by month, ensure that the formatting ofmonths in your file matches the formatting used in your enterprise data source. Ensure that you canuniquely link at least one column from your external data file, such as product codes or years, withyour enterprise data source.
The maximum file size that you can import is 2.5 MB, with a maximum of 20000 rows. You can importa maximum of one external data file per package. Your IBM Cognos modeler can override thesegovernors in IBM Cognos Framework Manager.
2. Import your external data.
You import your external data file from your own computer or from a location on your network into anexisting IBM Cognos package.
A step-by-step wizard guides you through importing your data. If you want to create reports thatcontain data from both your external data file and your enterprise data source, you must link dataitems from the two data sources. You can import all or a subset of data columns from your externalfile.
By adding external data, you extend an existing IBM Cognos package definition with the new dataitems from your file and you create a new package.
3. Create reports with your external data file.
After you import and link your external data, it appears as a new namespace in the data tree of the
Source tab and is integrated with the IBM Cognos content.
You can then create reports with your data and perform any operation, such as filtering, sorting,grouping, or adding calculations. When you run the report, it uses data items from your external datafile.
You can save reports that contain your external data within the My content area of the IBM CognosAnalytics portal.
4. Determine whether you want to share your reports that use external data with other people in yourorganization. If you decide to share, take into account these considerations.
Chapter 13. Working with your external data 279
Working with Date Data
If the data that you import contains dates, ensure that the dates use the format yyyy-mm-dd.
Working with Dimensional Data Sources
If your enterprise data source is dimensional, such as OLAP or dimensionally-modeled relational, and youwant to link your external data with your enterprise data, you must first create a tabular or list report.Create and save a list report with your enterprise data that contains the data items that you want to use tolink with your external data. Ensure that you remove the aggregate rows that are automatically added inthe footer of the list. This list is a projection of your dimensional data source.
When you import your external data, use the list report that you created to link your external data with thequery subject from your enterprise data.
Data in your external file is relational by nature because it consists of tables and rows. If your enterprisedata source is dimensional, you can still import and work with your external data. However, you cannotmix relational data from your external data files, and dimensional data from your enterprise data sourcewithin the same query. For example, a data container, such as a list, crosstab, or chart, uses one queryand you cannot mix relational and dimensional data within the same list, crosstab, or chart. Doing so willcause an error.
If you want to use data from both the external data file and the original package within the same query,you must link the external data to a query subject within the current package instead of another report.
Working with External Data in an Unsecured IBM Cognos Application
If your IBM Cognos application is not secured, and users can log on anonymously, you may encounterissues if multiple people import external data in the same package.
For example, Robert imports his external data into package A and saves the package and reports hecreated in My content. Then, Valerie also imports her external data into the same package A and savesthe package in My content. Valerie has therefore overwritten Robert's external data in package A. Now, ifRobert tries to run one of his reports, he encounters errors because his external data is no longer inpackage A.
To avoid this problem,
• save packages that contain external data with a unique name.• apply security to your IBM Cognos applications so that users do not share the same My content area.
Import dataYou select the file to import from your own computer, or from your local area network.
You select which columns to import.
You then specify a namespace to use. The namespace provides a unique name to associate with the data
items that you import. The namespace appears in the data tree in the Source tab and is used toorganize the data items. By default, the namespace is the imported file name without the extension.
If you change the default name for the namespace, you are prompted to select the external data file eachtime that you run the report. To avoid this prompt, select the Allow server to automatically load filecheck box.
Procedure
1. Click the Data icon , click the Source tab , right-click the package for which you want toadd external data and then click Manage external data.
2. On the Select Data page of the wizard, under External data file, click Browse and select your externaldata file to import.
280 IBM Cognos Analytics - Reporting Version 11.0 : User Guide
If you want the server to load the file without prompting users when they run the report, select theAllow the server to automatically load the file check box.
If selected, you must use the Universal Naming Convention (UNC) path, such as \\servername\filename, and you must ensure that the IBM Cognos server has access to the file.
3. Under Data items, select the check box for the data items that you want to import.4. Type a name for the namespace and click Next.
The namespace appears in the Source tree, and identifies the external data within the package. Bydefault, the name is the name of your imported external data file.
5. If you do not want to link your data or change the data attributes, click Finish now.
Related tasksMSR-PD-0012 error when importing external dataMSR-PD-0013 error when importing external data
Map dataIf you want to create reports that contain data from both your external file and from your enterprise data,you must link at least one query subject from your package or from an existing report to a data item inyour external data. This mapping creates a relationship between your external data and your enterprisedata. For example, your external data contains information about employees, including an employeenumber. You map the employee number from your external data file to the employee number in yourenterprise data. This ensures that your data is integrated smoothly.
About this task
Mapping a data item in your external data to a query subject that references other query subjects is notsupported. For example, the query subject cannot contain a calculation that references a query item fromanother query subject. Such a mapping produces the following error message:
MSR-PD-0001 Failed to relate external data to objects in the underlying package. The item [query item]does not lead to a query subject.
Procedure
1. On the Data Mapping page, link existing query subjects in your enterprise data to data items in yourexternal data file.
2. Under Existing query subject / report, click the ellipsis button and do one of the following:
• If you want to select a query subject from the data tree, click Choose Query Subject and select aquery subject.
Note: This option is not available when working with dimensional packages.• If you want to select from the query subjects included in a report, click Choose Report and select a
report.3. Click the two data items that you want to link and click the New link button.
You cannot link a data item in your external data to a calculation in a query subject.
A link appears linking two data items.
Tip: You can create multiple links for multiple data items. To delete a link, select the link and clickDelete Link.
4. If your report is using the dynamic query mode, specify the type of filter to generate for the joinrelationship by clicking the Join filter type (DQM only) menu and choosing one of the available values.
A join relationship is created when you link data items. The filter type is used to optimize the joinrelationship. In generates an IN predicate of constant values. Between generates a BETWEENpredicate using the minimum and maximum values of the join keys. Table generates a table rowconstructor form of the IN predicate. The default value is In.
Chapter 13. Working with your external data 281

5. Click Next.
Finish importing dataYou can change how query items from your external data file appear after they are imported into IBMCognos Analytics. For example, you can change the number of decimal places or the default summary.
If you want to use numeric data from your external data source as a measure in a crosstab, you mustassign that data item a default summary other than Unsupported. A specified default summary makes
the data item appear as a measure in the data tree in the Source tab . Otherwise, if you add thedata item with an Unsupported default summary as the measure in a crosstab, no values appear.
Attribute Description
Data type Identifies whether data in the file is one of the following types:
Integer, which represents numeric values.
Decimal, which represents integer values that are scaled by a variable powerof 10.
Text, which represents values that contain letters and symbols.
Date or Date Time, which represent dates and times.
Default summary Identifies Sum, Average, Max, Min, Count or Unsupported as the default typeof summary for the data item.
Applies only to Integer and Decimal data types.
Decimal places Specifies the number of decimal places for the data item.
Applies only to the Decimal data type.
If you mapped links between data items in your external data and data items in your enterprise data,specify the options that define the relationships between the data items.
For each data item that you import and link, specify whether values are unique or exist more than once inboth your external data and in your enterprise data. You can also specify how to handle rows that containmissing values in the report results.
Procedure
1. On the Data Attributes page, specify the attributes for each data item after it is imported and clickNext.
For example, if you import numeric data items, you can change the default summary and number ofdecimal places.
2. On the Mapping Options page, specify the relationships between the linked data items and how toprocess the results in the report output.
3. Click Finish.
Publish the packageYou can change the name and location of the package with your external data to help you differentiatebetween data packages.
Procedure
1. If you want to rename the package that will be published or change the location where it is published,do the following:
• In the Manage external data dialog, under Package name, click the ellipsis button.
282 IBM Cognos Analytics - Reporting Version 11.0 : User Guide
• Type a new name for the package and select the location where to save it.• Click Save.
2. Click Publish.
ResultsIBM Cognos Analytics imports your external data into a new package. A namespace with the data items
from your external file appears in the data tree in the Source tab .
You can now create reports with your external data.
Edit your external dataAfter you import your data, you can change the data mappings and options that you originally specifiedand republish the package.
You can
• Rename the namespace, which renames the organizational folder that appears in the data tree in the
Source tab . If you change the namespace, you are prompted for the external data file whenyou run the report.
• Change which columns to import.• Change the data mapping links.• Change the data attributes.• Change the mapping options.
You can also import multiple external data files into the same package. To do this, your data modelermust modify governors in the model and republish the package that contains your enterprise data. Formore information, see the IBM Cognos Framework Manager User Guide.
Procedure
1. Click the Data icon , click the Source tab , right-click the package for which you want toadd external data and then click Manage external data.
2. In the Manage external data dialog box, select the external data to edit and click the Edit icon .3. In the left pane, select the options that you want to change.4. Click OK and then republish the package.
ResultsIBM Cognos Analytics reimports your external data and updates the data items that appears in the data
tree in the Source tab .
You can now create and update reports with your external data.
Delete your external dataYou can delete your external data from within the package that you created if you no longer need it.
Procedure
1. Click the Data icon , click the Source tab , right-click the package for which you want toadd external data and then click Manage external data.
Chapter 13. Working with your external data 283
2. In the Manage external data dialog box, select the external data package to delete and click the
delete button .3. Click Publish.
ResultsThe external data namespace is removed from the package.
If you also no longer require the external data package or any reports created with the package, you candelete it from within the IBM Cognos Analytics portal.
Running a report that contains external dataReports that contain external data run the same way as reports that contain only enterprise data. If youhave access to the report, you will also have access to the external data included within the report.
You may be prompted to select the location of the external data file when you run the report if either
• the report author did not specify to automatically load the file.• the IBM Cognos Analytics server cannot locate the file.
However, you are not re-prompted within the same Web browser session.
You can determine whether data in a report uses external data by tracing its lineage. For moreinformation, see “View Lineage Information for a Data Item” on page 28.
Making your reports publicAfter you create a report that uses your external data, you may want to make it public to share it withcoworkers. They can run your report using your external data file that you made available on a publicnetwork drive that the IBM Cognos server can access. They can also use their own version of the file. Ifthey use their own version, the file must contain the same columns as your original external data file thatyou used to import the data and create the report. In addition, you must clear the Allow server toautomatically load file check box in the Select Data page of the Manage external data wizard.
To make reports public, you must save them in the Team content area of the IBM Cognos Analyticsportal. To save content in Public Folders, you must have the appropriate permissions. Contact your IBMCognos administrator to obtain permissions and to inform him or her that you are sharing a package orfiles.
If you share your reports, ensure that you maintain the reports.
284 IBM Cognos Analytics - Reporting Version 11.0 : User Guide

Chapter 14. Using conditionsYou can define conditions to control what users see when they run a report. Conditions can apply tospecific items in a report. For example, you can define a conditional style to highlight exceptional data,such as product revenue that exceeds your target.
Conditions can also apply at the report layout level. Conditional layouts are useful for delivering reports toa multilingual audience. For example, you can have text items, such as titles and cover pages, appear inthe same language as the data in the report.
Related conceptsCreating a Conditional Color Palette in a Chart
Highlight data using a conditional styleAdd conditional styles to your report to better identify exceptional or unexpected results. A conditionalstyle is a format, such as cell shading or font color, that is applied to objects if a specified condition istrue.
For example, you want to automatically highlight in green the departments in your organization that meettheir budget quotas and highlight in red the departments that go over budget. Creating conditional stylescolor-codes information in your reports so that you can find areas that need attention.
You can apply multiple conditional styles to objects. For example, you can apply one style in specific cellsand another style for the overall report. If multiple styles set the same property, such as font color, thelast style in the list is applied.
You can apply conditional styles based on any data item in your report.
You can create the following types of conditional styles.
Type Description
Numeric Range Highlights straight numerical data, such asrevenues and losses.
Date/Time Range Highlights data from specific dates and times.
Date Range Highlights data from specific dates.
Time Range Highlights data from specific times.
Interval Highlights data falling between set intervals.
String Highlights specific alphanumeric items in a report.For example, you can highlight all instances of aspecific word or phrase, such as Equipment. Stringcriteria are case-sensitive.
If multiple string conditions are met, only the firstconditional style is applied.
Advanced Creates conditional styles that use calculations orexpressions.
If multiple advanced conditions are met, only thefirst conditional style is applied.

You can also apply a conditional color palette to a chart.
Note: Conditional styles and conditional data formatting do not work on chart axis labels. If you apply aconditional style or conditional data formatting to a chart axis, only the first style defined is applied.
You can perform a search to find objects in your report that use conditional styles. You can also view allthe conditional styles used in your report to delete or modify them.
You can also use variables to highlight data. If a report contains both conditional styles and stylevariables, the style variables are applied first and then the conditional styles are applied.
Tip: The Return Quantity by Order Method sample report in the GO Data Warehouse (analysis) packageincludes conditional highlighting.
Create a new conditional styleYou can apply conditional styles based on any data item in your report.
Procedure
1. Click the object for which you want to define a conditional style and click the Conditional styles icon
.
Tip: You can also click the object, and then, in the Properties pane, set the Conditional stylesproperty.
2. Click the add button and click New Conditional Style.3. Select the data item to determine the condition and click OK.
The type of conditional style that you can use depends on the type of data item you select.4. In the Name box, type a name for the conditional style.5. To define a numeric value, date/time, date, time, or interval condition:
• Click the new button and select a value to define a threshold.
The value appears in the Range column, and two ranges are created.• For each range, under Style, click one of the predefined styles to apply to the range or click the edit
button and create a new style.
Tip: You can also define a style for the cells in your report that have missing values.• Repeat these steps to add other conditions.
Tip: Under Style, pause the pointer over each range to see the condition produced for that range.
• To move a value above or below a threshold, click the arrow button next to the value.
For example, you insert a threshold value of five million. By default, the ranges are less than or equalto five million and greater than five million. Moving the five million value above the thresholdchanges the ranges to less than five million and greater than or equal to five million.
6. To define a string condition:
• Click the new button and select how to define the condition.• To select more than one individual value, click Select Multiple Values and click the values.• To type specific values, click Enter Values and type the values.• To specify your own criteria, such as values that begin with the letter A, click Enter String Criteria
and specify the condition.
286 IBM Cognos Analytics - Reporting Version 11.0 : User Guide

• For each condition, under Style, click one of the predefined styles to apply or click the edit stylebutton and create a new style. Specify the style to apply to remaining values by clicking one of thepredefined styles beside Remaining values (including future values).
• Specify the order in which to evaluate the conditions.
Conditions are evaluated from top to bottom, and the first condition that is met is applied.
Reuse an existing conditional styleYou can create a conditional style once and reuse it on multiple objects in your report. You can specify theorder in which conditional styles are applied. You can also use existing local classes as your conditionalstyles.
Procedure
1. Click the data item for which you want to define a conditional style, and then click the Conditional
styles icon .
Tip: You can also click the data item, and then, in the Properties pane, set the Conditional stylesproperty.
2. Click the add button , click Use Existing Conditional Style, and select the style.
Create an advanced conditional styleYou can create advanced conditional styles that use calculations or expressions.
If multiple advanced conditions are met, only the first conditional style is applied.
Procedure
1. Click the data item for which you want to define a conditional style, and then click the Conditional
styles icon .
Tip: You can also click the data item, and then, in the Properties pane, set the Conditional stylesproperty.
2. Click the add button and click Advanced Conditional Style.3. Type a name for the conditional style.4. Click the add button and specify the expression that defines the condition.
5. For each condition, under Style, click one of the predefined styles to apply or click the edit button and create a new style. Specify the style to apply to remaining values by clicking one of the predefinedstyles beside Remaining values (including future values).
6. Specify the order in which to evaluate the conditions by clicking a condition and then clicking the moveup or move down arrow.
Conditions are evaluated from top to bottom, and the first condition that is met is applied.
Manage conditional stylesYou can view, modify, or delete the conditional styles that are applied to your report. You can also definea new conditional style.
In the IBM Cognos Analytics - Reporting options, you can specify whether to automatically deleteconditional styles that are no longer used in a report.
Chapter 14. Using conditions 287

Procedure
Click the More icon , and then click Conditional styles.
Highlight data using a style variableHighlight data in your report to better identify exceptional results. For example, you want to identify salesrepresentatives who have exceeded their quota. You create a condition that checks whether eachrepresentative's sales for the year is greater than their quota for the year.
Style variables are useful if you are working with reports that were created in a previous version of IBMCognos Analytics or if you want to use language variables to specify conditional styles.
You can also use conditional styles to highlight data. If a report contains both conditional styles and stylevariables, the style variables are applied before the conditional styles.
Procedure
1. Create a variable and define the condition that determines if the data will be highlighted.2. In the work area, click the column to highlight based on the condition.3. In the Properties pane, double-click the Style variable property.4. Click Variable, click the variable to assign to the object, and click OK.5. If you assigned a string variable, in the Values box, select the values for the condition to support.
Tip: A default value exists for the variable, and it is always selected.6. If you assigned a language variable, in the Values box, select the languages for the condition to
support.
Tip: A default value exists for the variable, and it is always selected.7. Click OK.
8. Click the Condition explorer icon and click a value other than the default value.
Tip: When you select a value in the condition explorer, the Explorer bar becomes green to indicatethat conditional formatting is turned on and that any changes you make to the report apply only tothe variable value.
For example, if you created a Boolean variable, click Yes.9. In the Properties pane, specify the formatting with which to highlight the column when the condition
is satisfied.
For example, click the Border property to create a thicker border around the column.10. Repeat steps 8 to 9 for other possible values defined for the variable.
Tip: To view the report with no variables applied, click the Condition explorer icon and click (Novariable) or triple-click the Explorer bar.
ResultsWhen you run the report, the report objects to which you applied the variable are highlighted when thecondition is satisfied. For example, if you created a Boolean variable, the objects are highlighted when thecondition is met. If the condition is not satisfied for any object, no conditional formatting is applied.
Adding conditional rendering to a reportYou can specify which objects are rendered when a report is run.
Before you can add conditional formatting or conditional rendering to your report, you must add avariable. You can create a variable in the condition explorer or in the Properties pane.
288 IBM Cognos Analytics - Reporting Version 11.0 : User Guide

Add a variable from the condition explorerBefore you can add conditional formatting or conditional rendering to your report, you must add avariable. You can create a variable in the condition explorer or in the Properties pane.
Procedure
1. Click the Condition explorer icon and click Variables.
2. Click the Toolbox icon , drag one of the following variables to the Variables pane:
• To create a variable that has only two possible values, Yes and No, drag Boolean Variable.• To create a variable whose values are string-based, drag String Variable.• To create a variable whose values are different languages, drag Report Language Variable.
3. If you created a Boolean variable, in the Expression Definition box, define the condition and click OK.
For example, the following expression returns the value Yes if revenue is less than one million and thevalue No if revenue is greater than or equal to one million:
[Revenue]<1000000
For information about creating expressions, see “Using relational calculations” on page 182 or “UsingDimensional Calculations” on page 227.
4. If you created a string variable, do the following:
• In the Expression Definition box, define the condition and click OK.
For example, the following expression returns the value high if revenue is greater than one millionand the value low if revenue is less than or equal to one million:
if ([Revenue]>1000000) then ('high') else ('low')
For information about creating expressions, see “Using relational calculations” on page 182 or“Using Dimensional Calculations” on page 227.
• Click the add button in the Values pane.• For each value that the variable can assume, type the name of the value that corresponds with the
possible outcomes defined in the expression.
For example, in the previous expression, you must create two values for the variable, high and low.
Tip: You can create a group by clicking two or more values and then clicking the group values button
. For example, you can create a group that includes the available French languages.5. If you created a language-specific variable, in the Languages dialog box, select the languages to
support.
Add a variable from the properties paneBefore you can add conditional formatting or conditional rendering to your report, you must add avariable. You can create a variable in the condition explorer or in the Properties pane.
Procedure
1. Select the report object.2. In the Properties pane, under Conditional, double-click the conditional property to which to assign
the variable.
The following conditional properties are available:
Chapter 14. Using conditions 289

Goal Conditional Property
Specify a variable based on which text can beconditionally shown.
For example, you want different text to appearwhen a report is run in a different language.
Text source variable
Specify a variable based on which object can beconditionally rendered.
For example, you want to make a revenue reportsmaller by not rendering rows that are below athreshold.
Render variable
Specify a variable based on which object can beconditionally styled.
For example, you want data that meets somecriterion to appear in a different color.
Style variable
Specify a variable based on which objects in ablock can be conditionally rendered. Applies onlyto conditional block objects that you insert in areport.
Block variable
3. In the Variable box, click an existing variable or one of the following variable types:
• <New language variable>• <New string variable>• <New boolean variable>
4. In the New variable dialog box, in the Name box, type the name of the variable.
5. If you created a string variable, click the add button , type the string values to define, and click OK.6. If you created a language variable, select the languages to support and click OK.7. In the Expression Definition box, define the condition.
Hide or show an objectYou can hide and show objects in a report based on a condition you define.
You can also specify that an object should not be rendered based on a condition.
Tip: The Global Bonus Report sample report in the GO Data Warehouse (analysis) package includeshidden objects.
Procedure
1. Create a variable, and define the condition that determines if the object is shown or hidden.
Tip: Create a Boolean variable to show and hide objects, as this type of variable has only two possiblevalues.
2. Click the Toolbox icon , drag a Conditional blocks object to the work area.3. Select the conditional block.4. In the Properties pane, double-click the Block variable property.5. In the Variable box, click the variable you created and click OK.6. Set the Current block property to Yes.
290 IBM Cognos Analytics - Reporting Version 11.0 : User Guide

7. From the content pane, drag the object to show or hide to the conditional block.
For example, drag a data item from the Source tab or from the Data items tab.
You may need to link the report page to a query before you can add a data item to the block.
ResultsWhen you run the report, the report objects to which you applied the variable are visible when thecondition is satisfied and invisible when it is not.
Add conditional renderingAdd conditional rendering to specify which objects are rendered when a report is run. This is useful whenyour report contains sensitive data.
Conditional rendering is not the same as hiding objects. When you hide an object, the object exists but istransparent. If an object is not rendered, it is not in the report.
Procedure
1. Select the list column to be rendered conditionally.
Tip: You must select the list column, not the list column body or the list column title. If the body or
title is selected, as indicated in the Properties pane, click the Select ancestor icon and click thelist column.
2. In the Properties pane, double-click the Render variable property.3. Click Variable and click the variable that will determine if the column will be rendered.4. In the Render for box, select the values that the condition will support.
Tip: A default value exists for the variable, and it is always selected.
Add multiple layoutsAdd multiple layouts to show a report in different ways. For example, you can define a different layout foreach language in a multilingual report. This allows you to create a single report that can be viewed byreport consumers that use different regional settings.
Procedure
1. Create a variable and define the condition that will be used for each layout.
For example, create a report language variable that includes each language that requires a conditionallayout.
Note: Expressions used in a conditional layout cannot reference a query.
2. Click the Show properties icon , in the REPORT section, click Conditional layouts.3. Select a variable, and then select the values that require a separate layout.
Results
A layout is created for each value you selected. Use the Pages icon to navigate the different layouts.For each layout, click Report pages to create a report page or Prompt pages to create a prompt page andadd objects.
Tip: You can create new variables from the Conditional layouts dialog. The variables are added to thecondition explorer. For more information, see “Add a variable from the condition explorer” on page 289.
Setting up a multilingual reporting environmentYou can create reports that show data in more than one language and use different regional settings. Thismeans that you can create a single report that can be used by report consumers anywhere in the world.
Chapter 14. Using conditions 291

The samples databases provided with IBM Cognos store a selection of text fields, such as names anddescriptions, in more than 25 languages to demonstrate a multilingual reporting environment. Forinformation about how data is stored in the samples databases and how the samples databases are setup to use multilingual data, see the Administration and Security Guide.
Here is the process for creating a multilingual reporting environment:
• Use multilingual metadata.
The data source administrator can store multilingual data in either individual tables, rows, or columns.
For more information about configuring your database for multilingual reporting, see the Administrationand Security Guide.
• Create a multilingual model.
Modelers use the modeling capabilities of IBM Cognos Analytics or IBM Cognos Framework Manager toadd multilingual metadata to the model from any data source type except OLAP. They add multilingualmetadata by defining which languages the model supports, translating text strings in the model forthings such as object names and descriptions, and defining which languages are exported in eachpackage. If the data source contains multilingual data, modelers can define queries that retrieve data inthe default language for the report user.
For more information, see the Framework Manager User Guide.• Create multilingual maps.
Administrators and modelers use a Microsoft Windows operating system utility named Map Manager toimport maps and update labels for maps in IBM Cognos Analytics - Reporting. For map features such ascountry or region and city names, administrators and modelers can define alternative names to providemultilingual versions of text that appears on the map.
For more information, see the Map Manager Installation and User Guide.• Create a multilingual report.
The report author uses Reporting to create a report that can be viewed in different languages. Forexample, you can specify that text, such as the title, appears in German when the report is opened by aGerman user. You can also add translations for text objects, and create other language-dependentobjects.
• Specify the language in which a report is viewed.
You can use the IBM Cognos Analytics portal to do the following:
– Define multilingual properties, such as a name, screen tip, and description, for each entry in theportal.
– Specify the default language to be used when a report is run.
Tip: You can specify the default language on the run options page, in the report properties, or in yourpreferences.
– Specify a language, other than the default, to be used when a report is run.
For more information, see the IBM Cognos Analytics portal User Guide.
The data then appears in the language and with the regional settings specified in
• the user's Web browser options• the run options• the IBM Cognos Analytics portal preferences
Any text that users or authors add appears in the language in which they typed it.
Create a multilingual report in ReportingYou can create a report in IBM Cognos Analytics - Reporting that can be viewed in different languages. Forexample, you can specify that text such as the title appears in German when the report is opened by a
292 IBM Cognos Analytics - Reporting Version 11.0 : User Guide
German user. You can also add translations for text objects and create other language-dependentobjects.
Before you begin
If you want the report to show data in different languages, the model must also be multilingual.
Procedure
1. Create a report language variable.2. In the work area, select the object to modify based on a language.3. In the Properties pane, double-click the Style variable property.
If you are changing the language of a text string, click Text source variable instead.4. Click Variable and click the language variable you created.5. In the Values box, select the languages for the condition to support and click OK.
Tip: A default value exists for the variable, and it is always selected.
6. Click the Condition explorer icon and a language for the variable.
Tip: When you select a value in the condition explorer, the Explorer bar becomes green to indicate thatconditional formatting is turned on and that any changes you make to the report apply only to thevariable value.
7. In the Properties pane, specify the formatting for the language.
For example, to change the language of a text string, double-click the Text property and select thenew string.
8. Press Enter when you are done.9. Repeat steps 6 to 8 for all other languages specified for the variable.
Tip: To view the report with no variables applied, pause the pointer over the condition explorer buttonand click (No variable) or triple-click the Explorer bar.
ResultsWhen you run the report, the report objects to which you applied the variable are formatted according tothe browser's language.
Chapter 14. Using conditions 293

294 IBM Cognos Analytics - Reporting Version 11.0 : User Guide

Chapter 15. Bursting ReportsBurst a report to distribute its contents to various recipients. Bursting is the process of running a reportonce and then dividing the results for recipients who each view a subset of the data. For example,salespeople in different regions each need a report showing the sales target for their country or region.You use burst reports to send each salesperson only the information they need. Burst reports can bedistributed by email or saved to a folder for viewing in the IBM Cognos Analytics portal.
Tip: The Bursted Sales Performance Report sample report in the GO Data Warehouse (analysis) packageincludes bursting.
To burst a report against a dimensional data source, see “Creating Burst Reports Using Dimensional DataSources” on page 299.
You cannot burst crosstab or chart reports. However you can burst a report where a container includes acrosstab or chart that is part of a master detail relationship. In this situation, you can burst only HTML,PDF, and XLS output formats; you cannot burst CSV or XML output formats.
For information about avoiding disk space exhaustion when bursting charts or crosstabs, see “MasterDetail or Burst Reports with Charts or Crosstabs May Result in Denial of Service” on page 375.
Procedure
1. define burst recipients2. specify burst groups3. set burst options4. enable bursting
Defining Burst RecipientsDefine the recipients who will receive data when the report is run. You can distribute burst reports toindividual users, groups, roles, distribution lists, and contacts.
To define the recipients, you create a calculated field, create the burst table in the source database, andthen import the table into a package.
Create a Calculated FieldYou can use a calculated field to dynamically create burst report recipients.
Procedure
1. Click the Queries icon , and click the query that will produce the data to distribute.
2. Click the Toolbox icon and drag Data Item to the Data Items pane.3. To give the data item a more meaningful name, in the Name box, replace the default name.4. In the Expression Definition box, type the expression that will generate the list of recipients and click
OK.
For example, typing the following expression builds the list of the employees of The Samples OutdoorsCompany. The expression concatenates the first letter of each employee's first name with their lastname.
lower(substring([Employee summary (query)].[Employee by organization].[Firstname],1,1) + [Employee summary (query)].[Employee by organization].[Lastname])
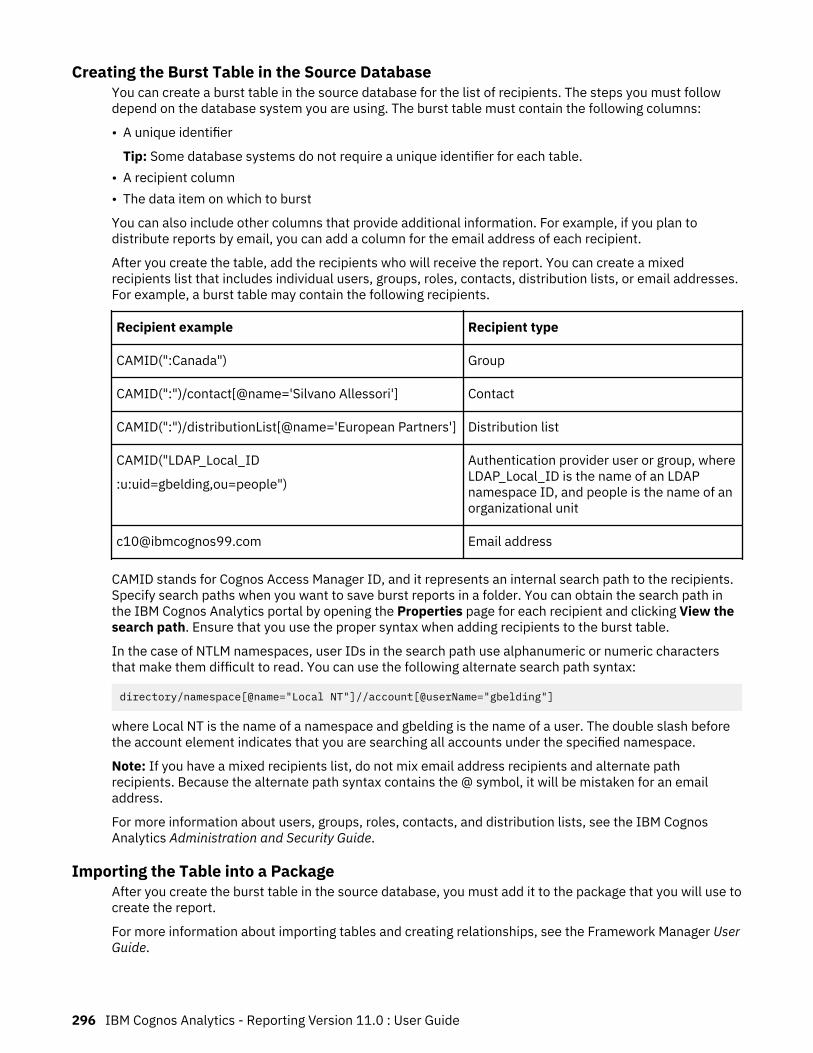
Creating the Burst Table in the Source DatabaseYou can create a burst table in the source database for the list of recipients. The steps you must followdepend on the database system you are using. The burst table must contain the following columns:
• A unique identifier
Tip: Some database systems do not require a unique identifier for each table.• A recipient column• The data item on which to burst
You can also include other columns that provide additional information. For example, if you plan todistribute reports by email, you can add a column for the email address of each recipient.
After you create the table, add the recipients who will receive the report. You can create a mixedrecipients list that includes individual users, groups, roles, contacts, distribution lists, or email addresses.For example, a burst table may contain the following recipients.
Recipient example Recipient type
CAMID(":Canada") Group
CAMID(":")/contact[@name='Silvano Allessori'] Contact
CAMID(":")/distributionList[@name='European Partners'] Distribution list
CAMID("LDAP_Local_ID
:u:uid=gbelding,ou=people")
Authentication provider user or group, whereLDAP_Local_ID is the name of an LDAPnamespace ID, and people is the name of anorganizational unit
[email protected] Email address
CAMID stands for Cognos Access Manager ID, and it represents an internal search path to the recipients.Specify search paths when you want to save burst reports in a folder. You can obtain the search path inthe IBM Cognos Analytics portal by opening the Properties page for each recipient and clicking View thesearch path. Ensure that you use the proper syntax when adding recipients to the burst table.
In the case of NTLM namespaces, user IDs in the search path use alphanumeric or numeric charactersthat make them difficult to read. You can use the following alternate search path syntax:
directory/namespace[@name="Local NT"]//account[@userName="gbelding"]
where Local NT is the name of a namespace and gbelding is the name of a user. The double slash beforethe account element indicates that you are searching all accounts under the specified namespace.
Note: If you have a mixed recipients list, do not mix email address recipients and alternate pathrecipients. Because the alternate path syntax contains the @ symbol, it will be mistaken for an emailaddress.
For more information about users, groups, roles, contacts, and distribution lists, see the IBM CognosAnalytics Administration and Security Guide.
Importing the Table into a PackageAfter you create the burst table in the source database, you must add it to the package that you will use tocreate the report.
For more information about importing tables and creating relationships, see the Framework Manager UserGuide.
296 IBM Cognos Analytics - Reporting Version 11.0 : User Guide
Procedure
1. Open the package.2. Import the table.3. Define the relationship between the burst table and the table containing the data item on which to
burst.
For example, you are bursting on country or region code. You define a relationship between country orregion code in the burst table and country or region code in the Country or Region table.
4. Save and publish the package.
Specify a Burst GroupSpecify burst groups to set how the report will be distributed. Burst groups are defined by a data item thatyou create in the report or that you add from the burst table.
Procedure
1. Click the Queries icon , and click the query that will produce the data to distribute.2. If you are creating a data item, do the following:
• Click the Toolbox icon and drag Data Item to the Data Items pane.• In the Expression Definition box, type the expression that defines the burst key.
For example, the following expression builds an email address for each sales representative in TheSample Outdoors Company. The expression incorporates the calculated field that was previouslycreated, which is named userID in the following expression, with ibmcognos99.com as thedomain name.
[userID]+'@ibmcognos99.com'
Tip: To give the data item a more meaningful name, replace the default name in the Name box.3. To specify a burst table column as the data item, do the following:
• Click the Data icon , and from the Source tab , expand the burst table.• Drag the data item to the Data Items pane.
For example, if you are bursting reports by email, drag the data item containing email addresses.
Set Burst OptionsSet burst options for the report to indicate the data item on which to burst and the recipients.
Before you begin
Before you set burst options, ensure that the data item on which you intend to burst is in the report and isgrouped. The grouped column will create the appropriate subsets of data. In addition, you must associatethe burst key with this level of grouping.
Procedure
1. Click the Pages icon or the Queries icon , and click the Report icon .
2. Click the Show properties icon , and in the Properties pane, click the Burst options property.3. Select the Make report available for bursting check box.
Chapter 15. Bursting Reports 297
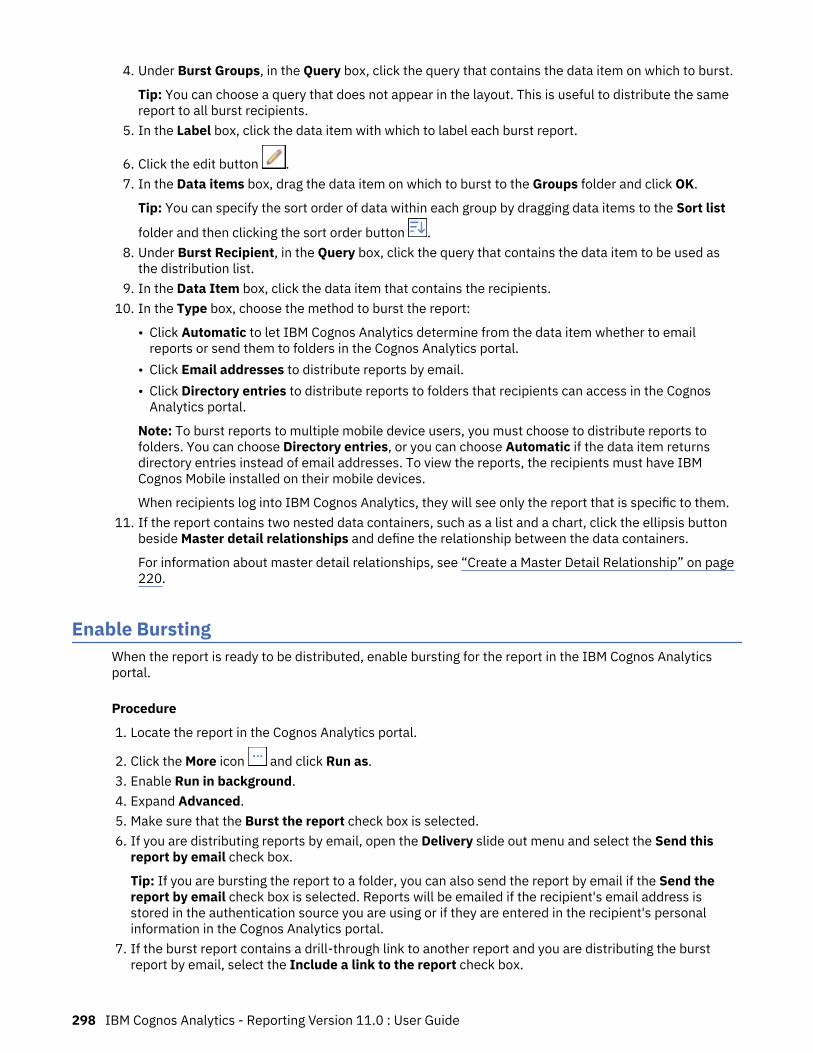
4. Under Burst Groups, in the Query box, click the query that contains the data item on which to burst.
Tip: You can choose a query that does not appear in the layout. This is useful to distribute the samereport to all burst recipients.
5. In the Label box, click the data item with which to label each burst report.
6. Click the edit button .7. In the Data items box, drag the data item on which to burst to the Groups folder and click OK.
Tip: You can specify the sort order of data within each group by dragging data items to the Sort list
folder and then clicking the sort order button .8. Under Burst Recipient, in the Query box, click the query that contains the data item to be used as
the distribution list.9. In the Data Item box, click the data item that contains the recipients.
10. In the Type box, choose the method to burst the report:
• Click Automatic to let IBM Cognos Analytics determine from the data item whether to emailreports or send them to folders in the Cognos Analytics portal.
• Click Email addresses to distribute reports by email.• Click Directory entries to distribute reports to folders that recipients can access in the Cognos
Analytics portal.
Note: To burst reports to multiple mobile device users, you must choose to distribute reports tofolders. You can choose Directory entries, or you can choose Automatic if the data item returnsdirectory entries instead of email addresses. To view the reports, the recipients must have IBMCognos Mobile installed on their mobile devices.
When recipients log into IBM Cognos Analytics, they will see only the report that is specific to them.11. If the report contains two nested data containers, such as a list and a chart, click the ellipsis button
beside Master detail relationships and define the relationship between the data containers.
For information about master detail relationships, see “Create a Master Detail Relationship” on page220.
Enable BurstingWhen the report is ready to be distributed, enable bursting for the report in the IBM Cognos Analyticsportal.
Procedure
1. Locate the report in the Cognos Analytics portal.
2. Click the More icon and click Run as.3. Enable Run in background.4. Expand Advanced.5. Make sure that the Burst the report check box is selected.6. If you are distributing reports by email, open the Delivery slide out menu and select the Send this
report by email check box.
Tip: If you are bursting the report to a folder, you can also send the report by email if the Send thereport by email check box is selected. Reports will be emailed if the recipient's email address isstored in the authentication source you are using or if they are entered in the recipient's personalinformation in the Cognos Analytics portal.
7. If the burst report contains a drill-through link to another report and you are distributing the burstreport by email, select the Include a link to the report check box.
298 IBM Cognos Analytics - Reporting Version 11.0 : User Guide

If you do not select the check box, the drill-through links in the burst report will not work.8. Run the report.
ResultsAllow a few moments for the report to run. If you are an administrator, you can view all outputs for the
report. Click the More icon and then click View versions. When burst recipients log into the CognosAnalytics portal or access their email accounts, they will see only the data that is meant for them.
Creating Burst Reports Using Dimensional Data SourcesYou can burst a report using a dimensional data source by using burst information that is stored in thedata source. Because you do not want to append bursting information to existing dimensional datasources, you can create a relational data source that contains the burst information.
Report bursting is limited when the underlying data source is a cube (MOLAP data source such as IBMCognos PowerCube, Microsoft Analysis Services, Oracle Essbase, or IBM Db2/OLAP). The burst reportmust be a grouped report, and the burst is restricted to the outermost grouping in the report. Forexample, if you have a report grouped on Country or Region and State, then you can burst the report onlyon Country or Region.
Procedure
1. In IBM Cognos Framework Manager, include both the dimensional data source that is the basis forreporting and the relational burst table in the model.
For more information about models, see the Framework Manager User Guide.2. In IBM Cognos Analytics - Reporting, create a master detail report in which the master query drives
the report and the detail query contains the burst information.
You must group the master query on the data item on which you are bursting. This data item musthave a corresponding data item in the relational burst table.
Author the detail query against the relational burst table. The burst table must contain two columns:the data item corresponding to the data item used in the master report for bursting and the data itemthat contains the recipient information. The recipient can be an email address or an expression thatresults in a search path to an object in IBM Content Manager, such as an account, group, role, contact,or distribution list.
For more information about master detail queries, see “Create a Master Detail Relationship” on page220.
3. Ensure that the detail query, which must be evaluated by IBM Cognos Analytics when the report isexecuted, is not visible:
• Place a list that is based on the detail query in a conditional block with a box type of None.• Link the master and detail queries using the following expression:
[Master Burst Key] = [Detail Burst Key]
ResultsWhen you set the burst options for the report, the master query provides the data items for the burst keyand the detail report provides the data items for the burst recipients.
Chapter 15. Bursting Reports 299

300 IBM Cognos Analytics - Reporting Version 11.0 : User Guide

Chapter 16. Format dataFormat data in a report to improve readability. For example, you can show all date values in the orderyear, month, and day. If you do not set Data Format properties here, data is formatted according to theproperties set in the model. If the properties were not set in the model, data is formatted according to theInternational Components for Unicode (ICU) formats.
Special cells, such as overflow or underflow, errors, or not applicable values, appear with two dash (--)characters unless you override them.
You can also format data based on a condition or specify the format for a particular object.
When you create a calculation that uses mixed currency values or other mixed units of measure, anasterisk character (*) might appear as the unit of measure. To avoid this problem, change the format ofthe column or row that contains the result of the calculation so that the wanted unit of measure appears.
Set the default data formatsSet the default data properties for each type of data, including text, number, currency, percent, date,time, date/time, and time interval.
Procedure
1. Click the Show properties icon , click the select ancestor icon , click Report, and then, in theDATA section, click Data formats.
2. In the Format type box, click a format type.
The properties that you can set for the selected format type appear in the Properties box.3. If you clicked the Currency format type and require different currencies in the report, click the add
button and select currency check boxes.
For example, you may have one column with values are in euros and another column whose values arein US dollars.
4. Set the properties.
If you added currencies in step 3, click each one and set the properties. If you did not add anycurrencies, any properties you set will apply to all currencies.
For properties in which you type meta-characters that represent certain types of information, such asYYYY-MM-DD for dates, the meta-characters that are required depend on the authoring languagespecified for the report. For more information, see “Using patterns to format data” on page 306.
If you set a value for the Pattern property, all other formatting properties are ignored with thefollowing exceptions:
• Missing value characters• Zero value characters• Negative pattern
Some properties are language-sensitive and should be changed only with caution.
ResultsThe data formatting properties you set are applied to objects only in the current layout. If a data itemcontains values in multiple currencies but only a subset of those currencies have defined formats, thedefault format for the locale in which you are working is applied to values with no specified format.

Specify the data format for an objectSpecify the format for a particular object if you are not getting the results you want.
For example, you add a measure to a report and you want to see two decimals when you run the report.You set the number of decimals to two for the Number format type for the current layout. However, whenyou run the report, you see more than two decimals for the measure. To get the results you want, youmust map the measure to the Number format type.
About this task
Data formats are not applied in delimited text (CSV) and XML report outputs.
The time interval data format assumes that input values are in milliseconds. As a result, when the timeinterval format is applied to an object, the values that appear in the report output are in milliseconds. Youcan apply the cast function to return the interval type that you want.
Procedure
1. Click the object.
2. In the report object toolbar, click the Data format icon .
Tip: You can also click the Show properties icon , and then double-click the Data formatproperty.
3. Under Format type, click the format type to apply to the object.4. To override any of the properties of the format type that were defined for the current layout, in the
Properties box, click the property and specify its value.
Specifying the number of decimals in numbersWhen specifying the number of decimals, IBM Cognos Analytics uses the IEEE 754 default rounding modeknown as half even. With half even rounding, numbers are rounded toward the nearest truncated value,unless both truncated values are equidistant, in which case the value ending in an even digit is chosen, asfollows:
• If the digit immediately after the precision to be shown is greater than 5, the number is rounded up.• If the digit immediately after the precision to be shown is less than 5, the number is rounded down.• If the digit immediately after the precision is a 5, the number is rounded down when the preceding digit
is even and rounded up when the preceding digit is odd.
For example, the number 78.5 is rounded to 78, while the number 73.5 is rounded to 74.
In addition, if the maximum number of decimals is less than the actual number of decimals in thenumber, the number is rounded to the maximum number of decimals.
Digit shaping in charts and mapsWhen working with bidirectional content, you cannot specify digit shaping at the chart or map level. Youcan specify digit shaping for the objects in charts and maps.
To understand how digit shaping is applied to charts and maps, you must know which chart and mapobjects are considered text and which objects are considered numeric values.
The following table describes the chart and map objects that are considered text.
302 IBM Cognos Analytics - Reporting Version 11.0 : User Guide

Table 8. Chart and map objects that are considered text
Container Object
Chart chart title, subtitle, footer, notes, legend item, legend title, regression label, markerlabel, background image label, axis titles, discrete axis label (for example, category axislabel, x-axis), baseline labels
Map map title, subtitle, footer, legend title, notes, axis labels
The following table describes the chart and map objects that are considered numeric values.
Table 9. Chart and map objects that are considered numeric values
Container Object
Chart numeric axis label (for example, measure axis label, y-axis), numeric values that appearin the legend (you can select to show the first, last, maximum, minimum value for eachitem in legends), numeric values that appear in the chart
Map legend items
The following list describes the different digit shaping options and how digit shaping is applied to chartsand maps.
• The digit shape options for text objects, which include titles, footers, and labels, are Default, None,National, and Contextual. Digit shape options for numeric values are Default, None, and National. Thereis no Contextual option for numeric values.
• By default, digit shaping is not applied to numbers that appear on an object that is considered text. Forexample, if a chart shows year data on the x-axis and the content language specified in the IBM CognosAnalytics portal is Arabic (Egypt), no digit shaping is applied because the x-axis label is considered astring.
The following list describes the default digit shaping behavior for charts and maps when the contentlanguage implies non-European digits, such as Arabic (Egypt).
• Numeric values that have a specific format, such as decimal or currency, are displayed as Arabic-Indic.• Except for matrix charts, numeric axis labels for charts and maps are displayed in European digits.
This is due to the way that charts and maps are rendered. The engine used to render charts and mapsdoes not perform any formatting for numeric axis labels. No locale information is passed, andconsequently the labels are displayed as European digits. To display the labels as Arabic-Indic, selectthe digit shaping option National.
Matrix charts are rendered using International Components for Unicode (ICU) to format numbers.Locale information is passed and the numbers are shaped accordingly. For example, when the contentlanguage is Arabic (Egypt), ICU displays numbers as Arabic-Indic.
• Numbers within text labels are displayed as is. That is, no digit shaping is applied.
The following list describes the default digit shaping behavior for charts and maps when the contentlanguage is Thai.
• Numeric values that have a specific format, such as decimal or currency, are displayed as Europeandigits.
• Numbers within text labels are displayed as is. That is, no digit shaping is applied.
Related conceptsSupport for bidirectional languages
Chapter 16. Format data 303
Locale-sensitive propertiesIBM Cognos Analytics - Reporting contains an extensive library of customized properties adapted to usersfrom different regions who speak different languages. For example, if a modeler specifies that a givendata item is a currency, only the proper currency symbol must be specified. When reports are created,Reporting automatically adapts the format of the currency numbers to each user according to the contentlanguage specified in the IBM Cognos Analytics portal.
When modelers or report authors specify properties, these properties override user preferences and riskcreating inconsistent formatting for users of other cultures. It is usually much easier and safer to letReporting take care of formatting. For example, for the date format type, different regions use differentcharacters to represent the date separator. If you specify a date separator, you may confuse users inother regions.
The following data formatting properties are locale-sensitive:
• Currency symbol position• Date separator• Date ordering• Calendar type• Time separator• Display AM/PM symbols• Clock• Decimal symbol• Negative sign position• Thousands separator• Group size (digits)• Secondary group size (digits)• Missing value characters• Zero value characters• Pattern• Negative pattern
Suppress empty cellsSparse data may result in crosstabs showing empty cells. For example, a crosstab that matchesemployees with products results in many rows of empty values for the revenue measure if the employeedoes not sell those products.
You can suppress rows, columns, or rows and columns based on divide by zero, missing, and overflowvalues. Suppressing rows or columns without data gives you a more concise view or your report.
Calculations are performed before suppression is applied. If you have multiple crosstabs or charts, youmust select one in order to access suppression options.
Within a list report, suppression applies only to rows and is based on non-grouped data items. If details ofa group are null, then the header and footer are also suppressed.
Suppression can also be applied to charts, repeaters, and repeater tables.
Access to the suppression feature depends on the settings in your modeling component, IBM CognosTransformer, IBM Cognos Framework Manager, and IBM Cognos Administration.
304 IBM Cognos Analytics - Reporting Version 11.0 : User Guide
Procedure
1. From the report object toolbar, click the Suppress icon and click Suppression options.2. Under Suppress, choose what sections to suppress.3. Under Suppress the following, choose which values to suppress.
Related conceptsLimitations When Formatting Empty Cells in SAP BW Data Sources
Suppressing null cells by using filtersYou can also use filters to suppress null cells in your reports. Using filters ensures that calculations takesuppression into account. You may also obtain better report performance because the filtering is done atthe data source.
If your report includes more than one measure or fact expression, it is best to base the filter on only oneunderlying fact or measure.
Relational-style Reports
In relational-style reports, you can use detail and summary filters.
Dimensional-style Reports
In dimensional-style reports, you can use the filter function.
For example, insert a set expression in your crosstab and use the expression filter ( descendants([Set]) is not null). If your crosstab includes three or more levels within the same dimension on anedge, use the expression filter ( descendants ( currentMember([Hierarchy] ) is not null).
If your crosstab includes nested sets, filter the sets using a cascading approach to improve performance.For example, first filter the outermost (or highest nested level) set, and then filter the remaining setsproceeding inward.
Specify what appears for data containers that contain no dataYou can specify what appears in a data container when no data is available from the database.
When no data is available, you can show one of the following options:
• An empty data container, such as a blank list.• Alternate content, such as another data container or an image. You can insert any object from the
Toolbox tab.• Text, such as There is no data available for this month. If you show text, you can format it. By default,
the text No Data Available appears.
You can specify what appears when no data is available for the following data containers: lists, crosstabs,charts, maps, repeaters, repeater tables, and tables of contents.
If your report includes multiple data containers, you can specify different no data contents for eachcontainer.
Tip: The No Data sample report in the GO Sales (query) package includes data containers that have nodata.
Procedure
1. Select a data container.
2. In the Properties pane, click the select ancestor icon and click the data container type.
Chapter 16. Format data 305
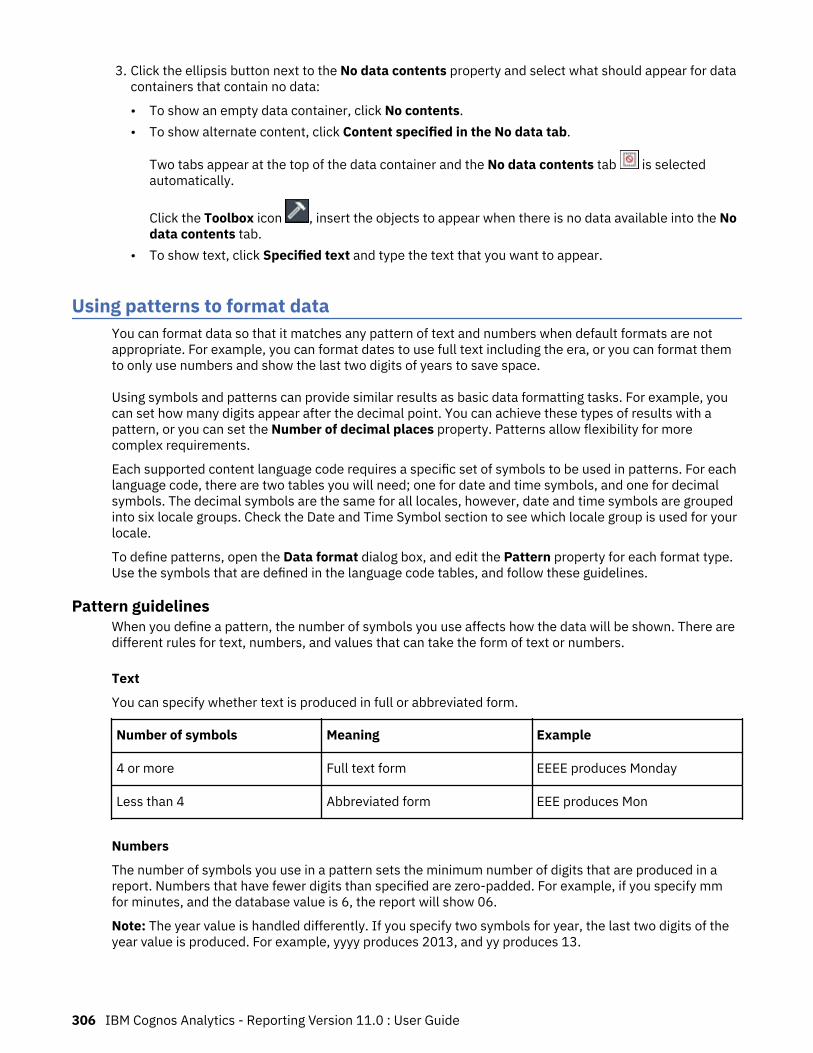
3. Click the ellipsis button next to the No data contents property and select what should appear for datacontainers that contain no data:
• To show an empty data container, click No contents.• To show alternate content, click Content specified in the No data tab.
Two tabs appear at the top of the data container and the No data contents tab is selectedautomatically.
Click the Toolbox icon , insert the objects to appear when there is no data available into the Nodata contents tab.
• To show text, click Specified text and type the text that you want to appear.
Using patterns to format dataYou can format data so that it matches any pattern of text and numbers when default formats are notappropriate. For example, you can format dates to use full text including the era, or you can format themto only use numbers and show the last two digits of years to save space.
Using symbols and patterns can provide similar results as basic data formatting tasks. For example, youcan set how many digits appear after the decimal point. You can achieve these types of results with apattern, or you can set the Number of decimal places property. Patterns allow flexibility for morecomplex requirements.
Each supported content language code requires a specific set of symbols to be used in patterns. For eachlanguage code, there are two tables you will need; one for date and time symbols, and one for decimalsymbols. The decimal symbols are the same for all locales, however, date and time symbols are groupedinto six locale groups. Check the Date and Time Symbol section to see which locale group is used for yourlocale.
To define patterns, open the Data format dialog box, and edit the Pattern property for each format type.Use the symbols that are defined in the language code tables, and follow these guidelines.
Pattern guidelinesWhen you define a pattern, the number of symbols you use affects how the data will be shown. There aredifferent rules for text, numbers, and values that can take the form of text or numbers.
Text
You can specify whether text is produced in full or abbreviated form.
Number of symbols Meaning Example
4 or more Full text form EEEE produces Monday
Less than 4 Abbreviated form EEE produces Mon
Numbers
The number of symbols you use in a pattern sets the minimum number of digits that are produced in areport. Numbers that have fewer digits than specified are zero-padded. For example, if you specify mmfor minutes, and the database value is 6, the report will show 06.
Note: The year value is handled differently. If you specify two symbols for year, the last two digits of theyear value is produced. For example, yyyy produces 2013, and yy produces 13.
306 IBM Cognos Analytics - Reporting Version 11.0 : User Guide

Text and Numbers
For values that can produce text or numbers, such as months, you can specify whether text or numbersare produced, and whether words are abbreviated.
Number of symbols Meaning Example
3 or more Text MMMM produces January
MMM produces Jan
Less than 3 Numbers MM produces 01
M produces 1
Date and time symbolsDate and time symbols are divided into locales, each of which is detailed in the following sections.
Locale Group A
Locales: af-za, en, en-au, en-be, en-bw, en-ca, en-gb, en-hk, en-ie, en-in, en-mt, en-nz, en-ph, en-sg, en-us, en-vi, en-za, fo-fo, gl-es, id, id-id, is, is-is, it, it-ch, it-it, kk-kz, ms, ms-bn, ms-my, nb-no, nl, nl-be, nl-nl, no, no-no, om-et, om-so, pl, pl-pl, pt, pt-br, pt-pt, so-dj, so-et, so-ke, so-so, sv, sv-fi, sv-se, sw-ke, sw-tz
Meaning Symbol Presentation Example
Era G Text AD
Year y Number 2013
Year (of 'Week of Year') Y Number 2013
Month in year M Text and number July and 07
Week in year w Number 27
Week in month W Number 2
Day in year D Number 189
Day in month d Number 10
Day of week in month F Number 2 (2nd Wed in July)
Day of Week (1=firstday)
e Number 2
Day in week E Text Tuesday
a.m. or p.m. marker a Text pm
Hour in day (1 to 24) k Number 24
Hour in a.m. or p.m. (0to 11)
K Number 0
Chapter 16. Format data 307

Meaning Symbol Presentation Example
Hour in a.m. or p.m. (1to 12)
h Number 12
Hour in day (0 to 23) H Number 0
Minute in hour m Number 30
Second in minute s Number 55
Millisecond S Number 978
Time zone z Text Pacific Standard Time
Escape used in text ' n/a n/a
Single quote '' n/a '
Locale Group B
Locales: be-by, bg-bg, el, el-gr, fi, fi-fi, hr, hr-hr, hu, hu-hu, ja, ja-jp, ko, ko-kr, ro, ro-ro, ru, ru-ua, ru-ru, sh-yu, sk, sk-sk, sl-si, sq-al, sr-sp, th, tr, tr-tr, uk-ua, zh, zh-cn, zh-hk, zh-mo, zh-sg, zh-tw
Meaning Symbol Presentation Example
Era G Text AD
Year a Number 2013
Year (of 'Week of Year') A Number 2013
Month in year n Text and number July and 07
Week in year w Number 27
Week in month W Number 2
Day in year D Number 189
Day in month j Number 10
Day of week in month F Number 2 (2nd Wed in July)
Day of Week (1=firstday)
e Number 2
Day in week E Text Tuesday
a.m. or p.m. marker x Text pm
Hour in day (1 to 24) h Number 24
308 IBM Cognos Analytics - Reporting Version 11.0 : User Guide

Meaning Symbol Presentation Example
Hour in a.m. or p.m. (0to 11)
K Number 0
Hour in a.m. or p.m. (1to 12)
k Number 12
Hour in day (0 to 23) H Number 0
Minute in hour m Number 30
Second in minute s Number 55
Millisecond S Number 978
Time zone z Text Pacific Standard Time
Escape used in text ' n/a n/a
Single quote '' n/a '
Locale Group C
Locales: ca-es, cs, cs-cz, da, da-dk, es, es-ar, es-bo, es-cl, es-co, es-cr, es-do, es-ec, es-es, es-gt, es-hn,es-mx, es-ni, es-pa, es-pe, es-pr, es-py, es-sv, es-us, es-uy, es-ve, eu-es, mk-mk
Meaning Symbol Presentation Example
Era G Text AD
Year u Number 2013
Year (of 'Week of Year') U Number 2013
Month in year M Text and number July and 07
Week in year w Number 27
Week in month W Number 2
Day in year D Number 189
Day in month t Number 10
Day of week in month F Number 2 (2nd Wed in July)
Day of Week (1=firstday)
e Number 2
Day in week E Text Tuesday
a.m. or p.m. marker a Text pm
Chapter 16. Format data 309

Meaning Symbol Presentation Example
Hour in day (1 to 24) h Number 24
Hour in a.m. or p.m. (0to 11)
K Number 0
Hour in a.m. or p.m. (1to 12)
k Number 12
Hour in day (0 to 23) H Number 0
Minute in hour m Number 30
Second in minute s Number 55
Millisecond S Number 978
Time zone z Text Pacific Standard Time
Escape used in text ' n/a n/a
Single quote '' n/a '
Locale Group D
Locales: de, de-at, de-be, de-ch, de-de, de-lu
Meaning Symbol Presentation Example
Era G Text AD
Year j Number 2013
Year (of 'Week of Year') J Number 2013
Month in year M Text and number July and 07
Week in year w Number 27
Week in month W Number 2
Day in year D Number 189
Day in month t Number 10
Day of week in month F Number 2 (2nd Wed in July)
Day of Week (1=firstday)
e Number 2
Day in week E Text Tuesday
a.m. or p.m. marker a Text pm
310 IBM Cognos Analytics - Reporting Version 11.0 : User Guide

Meaning Symbol Presentation Example
Hour in day (1 to 24) h Number 24
Hour in a.m. or p.m. (0to 11)
K Number 0
Hour in a.m. or p.m. (1to 12)
k Number 12
Hour in day (0 to 23) H Number 0
Minute in hour m Number 30
Second in minute s Number 55
Millisecond S Number 978
Time zone z Text Pacific Standard Time
Escape used in text ' n/a n/a
Single quote '' n/a '
Locale Group E
Locales: fr, fr-be, fr-ca, fr-ch, fr-fr, fr-lu
Meaning Symbol Presentation Example
Era G Text AD
Year a Number 2013
Year (of 'Week of Year') A Number 2013
Month in year M Text and number July and 07
Week in year w Number 27
Week in month W Number 2
Day in year D Number 189
Day in month j Number 10
Day of week in month F Number 2 (2nd Wed in July)
Day of Week (1=firstday)
e Number 2
Day in week E Text Tuesday
a.m. or p.m. marker x Text pm
Chapter 16. Format data 311

Meaning Symbol Presentation Example
Hour in day (1 to 24) h Number 24
Hour in a.m. or p.m. (0to 11)
K Number 0
Hour in a.m. or p.m. (1to 12)
k Number 12
Hour in day (0 to 23) H Number 0
Minute in hour m Number 30
Second in minute s Number 55
Millisecond S Number 978
Time zone z Text Pacific Standard Time
Escape used in text ' n/a n/a
Single quote '' n/a '
Locale Group F
Locales: ga-ie
Meaning Symbol Presentation Example
Era R Text AD
Year b Number 2013
Year (of 'Week of Year') B Number 2013
Month in year M Text and number July and 07
Week in year t Number 27
Week in month T Number 2
Day in year l Number 189
Day in month L Number 10
Day of week in month F Number 2 (2nd Wed in July)
Day of Week (1=firstday)
e Number 2
Day in week E Text Tuesday
a.m. or p.m. marker a Text pm
312 IBM Cognos Analytics - Reporting Version 11.0 : User Guide

Meaning Symbol Presentation Example
Hour in day (1 to 24) u Number 24
Hour in a.m. or p.m. (0to 11)
K Number 0
Hour in a.m. or p.m. (1to 12)
k Number 12
Hour in day (0 to 23) U Number 0
Minute in hour n Number 30
Second in minute s Number 55
Millisecond S Number 978
Time zone c Text Pacific Standard Time
Escape used in text ' n/a n/a
Single quote '' n/a '
Decimal format symbolsAll locales
Symbol Meaning
0 A digit that is shown even if the value is zero.
# A digit that is suppressed if the value is zero.
. A placeholder for decimal separator.
, A placeholder for thousands grouping separator.
E Separates mantissa and exponent for exponentialformats.
; Separates formats for positive numbers andformats for negative numbers.
- The default negative prefix.
% Multiplied by 100, as percentage.
Multiplied by 1000, as per mille.
The currency symbol. If this symbol is present in apattern, the monetary decimal separator is usedinstead of the decimal separator.
Chapter 16. Format data 313
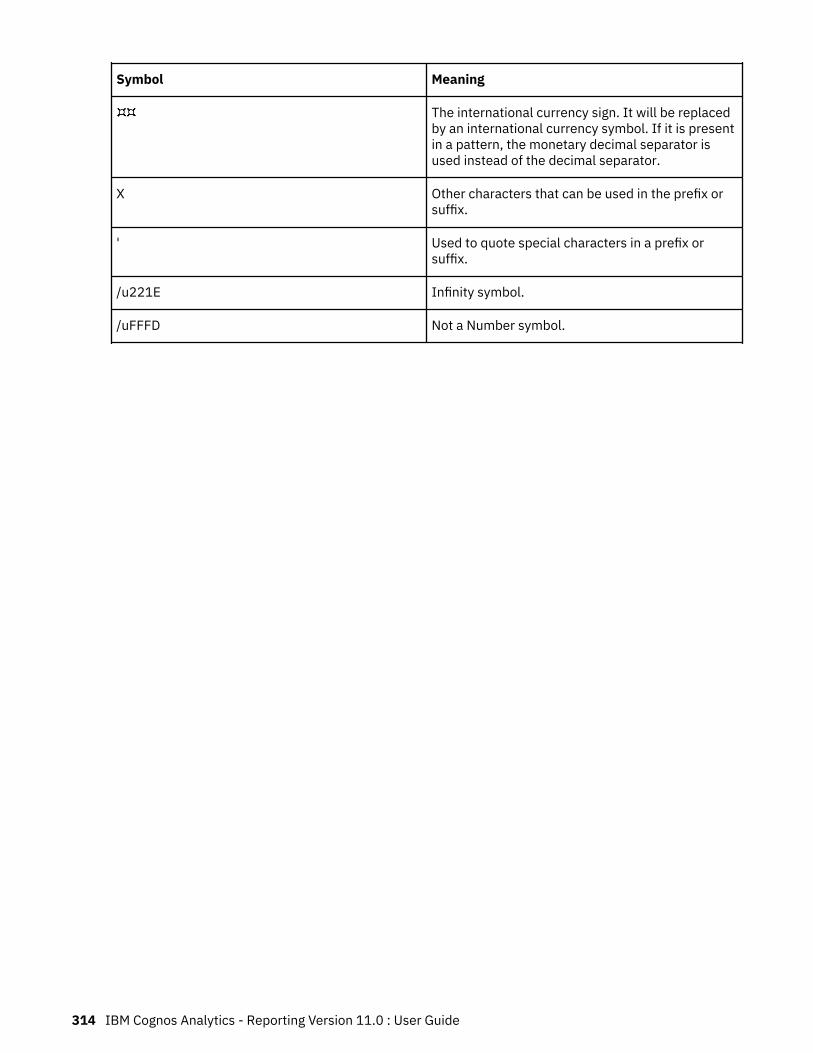
Symbol Meaning
The international currency sign. It will be replacedby an international currency symbol. If it is presentin a pattern, the monetary decimal separator isused instead of the decimal separator.
X Other characters that can be used in the prefix orsuffix.
' Used to quote special characters in a prefix orsuffix.
/u221E Infinity symbol.
/uFFFD Not a Number symbol.
314 IBM Cognos Analytics - Reporting Version 11.0 : User Guide

Chapter 17. Using query macrosA macro is a fragment of code that you can insert in the Select statement of a query or in an expression.For example, add a macro to insert a new data item containing the user's name.
You can include references to session parameters, parameter maps, and parameter map entries inmacros. Parameter values are set when you run the query. For example, you can use the language sessionparameter to show only the data that matches the language setting for the current user.
Macros can be used in these different ways:
• They can be inserted in the SQL.
An example is Select * from Country where Country.Name = #$myMap{$runLocale}#• They can supply an argument to a stored procedure query subject.
If a value is not hard-coded for the argument, the stored procedure query subject can be used to returndifferent data.
• They can be inserted in expressions, such as calculations and filters.
An example is a filter [gosales].[Sales staff].[Staff name] = #$UserLookUpMap{$UserId}#
• They can be used as a parameter wizard.
Parameters can reference other parameters. An example is Map1, Key = en-us, Value = #$myMap{$UserId}#
You can also add query macros to the IBM Cognos Framework Manager model. For more information, seethe Framework Manager User Guide.
Support for query macros in IBM Cognos Analytics - Reporting includes the same capabilities as macrosused in Framework Manager. However, Reporting query macros do not extend to the layout. Therefore,when making changes to the query using macros, you must bear in mind the side-effects on the layout.For example, if a macro removes a column from the query that the layout refers to, a run-time error willoccur.
SyntaxUse the following syntax to reference session parameter and parameter values.
Object Syntax Example
Session key $session_key #$my_account#
Parameter map key $map{<key>} #$map_one{'abc'}#
Parameter map entry whose keyis defined by a session parameter
$map{$session_key} #$map_one{$my_account}#
You can add the following elements to further define the macro expression.
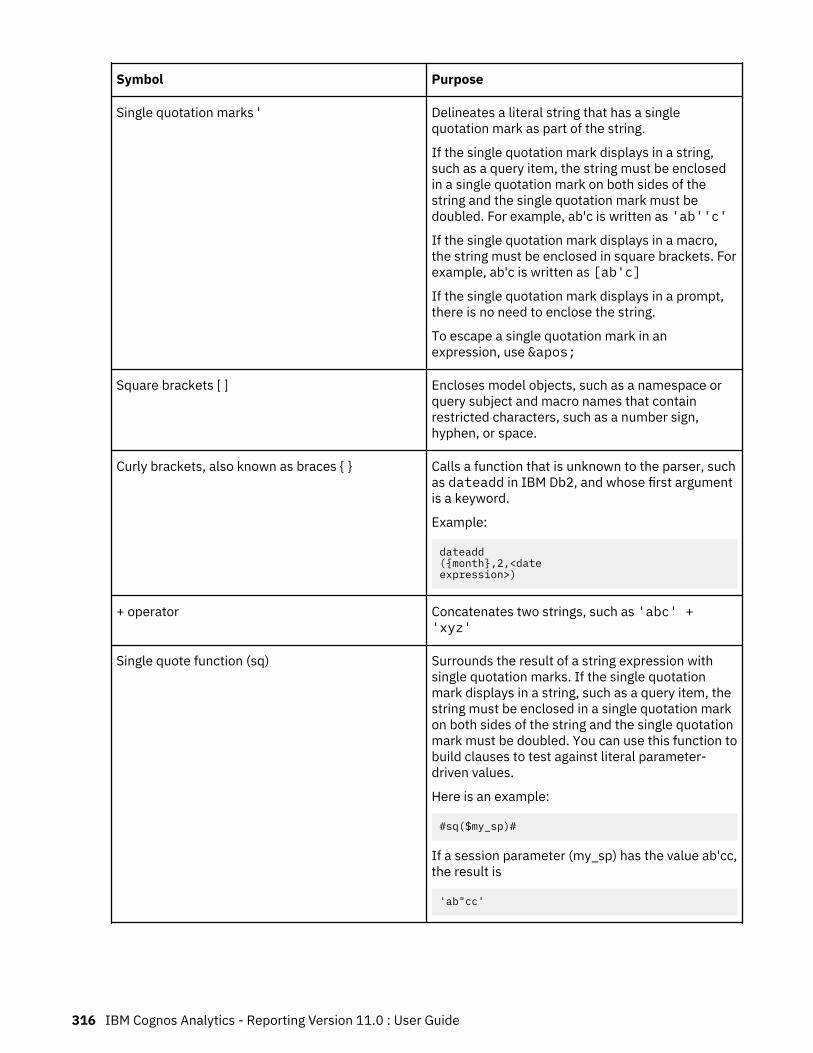
Symbol Purpose
Single quotation marks ' Delineates a literal string that has a singlequotation mark as part of the string.
If the single quotation mark displays in a string,such as a query item, the string must be enclosedin a single quotation mark on both sides of thestring and the single quotation mark must bedoubled. For example, ab'c is written as 'ab''c'
If the single quotation mark displays in a macro,the string must be enclosed in square brackets. Forexample, ab'c is written as [ab'c]
If the single quotation mark displays in a prompt,there is no need to enclose the string.
To escape a single quotation mark in anexpression, use '
Square brackets [ ] Encloses model objects, such as a namespace orquery subject and macro names that containrestricted characters, such as a number sign,hyphen, or space.
Curly brackets, also known as braces { } Calls a function that is unknown to the parser, suchas dateadd in IBM Db2, and whose first argumentis a keyword.
Example:
dateadd({month},2,<dateexpression>)
+ operator Concatenates two strings, such as 'abc' +'xyz'
Single quote function (sq) Surrounds the result of a string expression withsingle quotation marks. If the single quotationmark displays in a string, such as a query item, thestring must be enclosed in a single quotation markon both sides of the string and the single quotationmark must be doubled. You can use this function tobuild clauses to test against literal parameter-driven values.
Here is an example:
#sq($my_sp)#
If a session parameter (my_sp) has the value ab'cc,the result is
'ab"cc'
316 IBM Cognos Analytics - Reporting Version 11.0 : User Guide
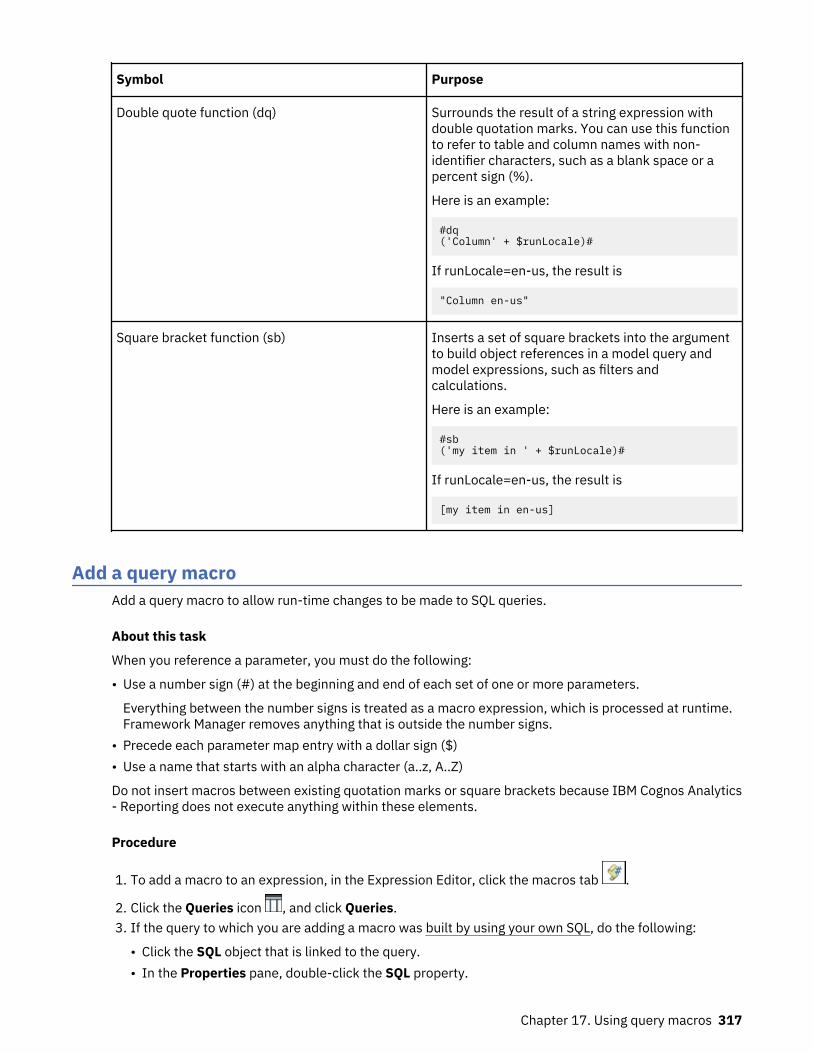
Symbol Purpose
Double quote function (dq) Surrounds the result of a string expression withdouble quotation marks. You can use this functionto refer to table and column names with non-identifier characters, such as a blank space or apercent sign (%).
Here is an example:
#dq('Column' + $runLocale)#
If runLocale=en-us, the result is
"Column en-us"
Square bracket function (sb) Inserts a set of square brackets into the argumentto build object references in a model query andmodel expressions, such as filters andcalculations.
Here is an example:
#sb('my item in ' + $runLocale)#
If runLocale=en-us, the result is
[my item in en-us]
Add a query macroAdd a query macro to allow run-time changes to be made to SQL queries.
About this task
When you reference a parameter, you must do the following:
• Use a number sign (#) at the beginning and end of each set of one or more parameters.
Everything between the number signs is treated as a macro expression, which is processed at runtime.Framework Manager removes anything that is outside the number signs.
• Precede each parameter map entry with a dollar sign ($)• Use a name that starts with an alpha character (a..z, A..Z)
Do not insert macros between existing quotation marks or square brackets because IBM Cognos Analytics- Reporting does not execute anything within these elements.
Procedure
1. To add a macro to an expression, in the Expression Editor, click the macros tab .
2. Click the Queries icon , and click Queries.3. If the query to which you are adding a macro was built by using your own SQL, do the following:
• Click the SQL object that is linked to the query.• In the Properties pane, double-click the SQL property.
Chapter 17. Using query macros 317
• In the SQL dialog box, type the macro.4. If the query to which you are adding a macro was not built by using your own SQL, do the following:
• Click the query.• In the Properties pane, double-click the Generated SQL/MDX property.• In the Generated SQL/MDX dialog box, click Convert.• In the SQL dialog box, type the macro.
Creating prompts using query macrosYou can create mandatory and optional prompts in reports using query macros.
Use the prompt macro functions prompt and promptmany to create single-value and multiple-valueprompts. You can use prompt macro functions when working with a relational data source or adimensionally-modeled relational (DMR) data source.
If you want to use a prompt macro in an expression such as a calculation, you must specify the data typewhen using an overloaded operator, such as a plus sign (+). You can use the plus sign to concatenate twoitems and to add two items.
If you want to define a filter on a dimension level and have the filter use the prompt or promptmanymacro, you must provide the data type as memberuniquename and a default value.
Here is an example:
members( [MS_gosales].[New Dimension].[PRODUCTLINE].[PRODUCTLINE])
in ( set( #promptmany('what', 'memberuniquename',
'[MS_gosales].[PROD1].[PRODUCTLINE].[PRODUCTLINE]
->[all].[1]')# ) )
Here is an example of a mandatory prompt:
select COUNTRY_MULTILINGUAL.COUNTRY_CODE as COUNTRY_CODE, COUNTRY_MULTILINGUAL.COUNTRY as COUNTRY, COUNTRY_MULTILINGUAL."LANGUAGE" as LANGUAGE1, COUNTRY_MULTILINGUAL.CURRENCY_NAME as CURRENCY_NAME from gosales.gosales.dbo.COUNTRY_MULTILINGUAL COUNTRY_MULTILINGUALwhere COUNTRY_MULTILINGUAL.COUNTRY = #prompt('CountryName')#
When default values are specified in the syntax of macro prompts, you may see an error. Use promptsyntax such as where Country = ?Enter Country?.
The prompt and promptmany functions have the following mandatory and optional parameters. Allargument values must be specified as strings.
Name
This mandatory parameter is the name of the prompt. Name can also refer to the name of a parameter ona user-created prompt page, in which case the user-created prompt page appears when the report is runinstead of the default prompt page that the macro would generate.
318 IBM Cognos Analytics - Reporting Version 11.0 : User Guide

Datatype
This optional parameter is the prompt value data type. The default value is string. Prompt values arevalidated. In the case of strings, the provided value is enclosed in single quotation marks and embeddedsingle quotation marks are doubled.
Values include the following:
• boolean• date• datetime• decimal• double• float• int
• integer• interval• long• memberuniquename
Memberuniquename is not an actual data type. This value must be used when the data type of theparameter is member unique name (MUN).
• numeric• real• short• string• time• timeinterval• timestamp• token
Token is not an actual data type. It is a way to pass SQL. A token does not pass values.• xsddate• xsddatetime• xsddecimal• xsddouble• xsdduration• xsdfloat• xsdint• xsdlong• xsdshort• xsdstring• xsdtime
DefaultText
This optional parameter is the text to be used by default. If a value is specified, the prompt is optional.
If you use a space and no values are provided in the Prompt Value dialog box, a Where clause is usuallynot generated.
Chapter 17. Using query macros 319

If you use text and no values are provided in the Prompt Value dialog box, a Where clause is usuallygenerated using the default value.
Ensure that the text you provide results in a valid SQL statement.
Note: If the data type is memberuniquename, a value for the DefaultText parameter must beprovided. For example:
(#prompt('WhichLevel', 'memberuniquename', '[goSalesAgain].[PRODUCT1].[PRODUCT].[PRODUCT(All)]->[all]')#)
Text
This optional parameter is text that precedes any user-provided values, such as 'and column1 = '.
QueryItem
This parameter is optional. The prompt engine can take advantage of the Prompt Info properties of thequery item. Descriptive information can be shown, although the prompt value is a code.
TextFollowing
This optional parameter is the closing parenthesis that is used most often for the promptmany function.This parameter is also useful when the prompt is optional and is followed by hardcoded filters in the SQLstatement.
Examples - selecting country or region promptsWhen a report is run, you want your users to be prompted to choose the country or region for which theywant to see data. The following code examples describe how you can use macros to create differentprompts.
Mandatory prompt with no data type specified
Note the following:
• The Datatype argument is not specified. Therefore, it is a string, which is correct in this case.• The DefaultText argument is not specified. Therefore, it is a mandatory prompt.
select COUNTRY_MULTILINGUAL.COUNTRY_CODE as COUNTRY_CODE, COUNTRY_MULTILINGUAL.COUNTRY as COUNTRY, COUNTRY_MULTILINGUAL."LANGUAGE" as LANGUAGE1, COUNTRY_MULTILINGUAL.CURRENCY_NAME as CURRENCY_NAME from gosales.gosales.dbo.COUNTRY_MULTILINGUAL COUNTRY_MULTILINGUALwhere COUNTRY_MULTILINGUAL.COUNTRY = #prompt('CountryName')#
Mandatory prompt with the data type specified
Note the following:
• This prompt requires a valid integer value as response.• The DefaultText argument is not specified. Therefore, it is a mandatory prompt.
select COUNTRY_MULTILINGUAL.COUNTRY_CODE as COUNTRY_CODE, COUNTRY_MULTILINGUAL.COUNTRY as COUNTRY, COUNTRY_MULTILINGUAL."LANGUAGE" as LANGUAGE1, COUNTRY_MULTILINGUAL.CURRENCY_NAME as CURRENCY_NAME from gosales.gosales.dbo.COUNTRY_MULTILINGUAL COUNTRY_MULTILINGUALwhere COUNTRY_MULTILINGUAL.COUNTRY_CODE > #prompt('Starting CountryCode', 'integer', '',
320 IBM Cognos Analytics - Reporting Version 11.0 : User Guide
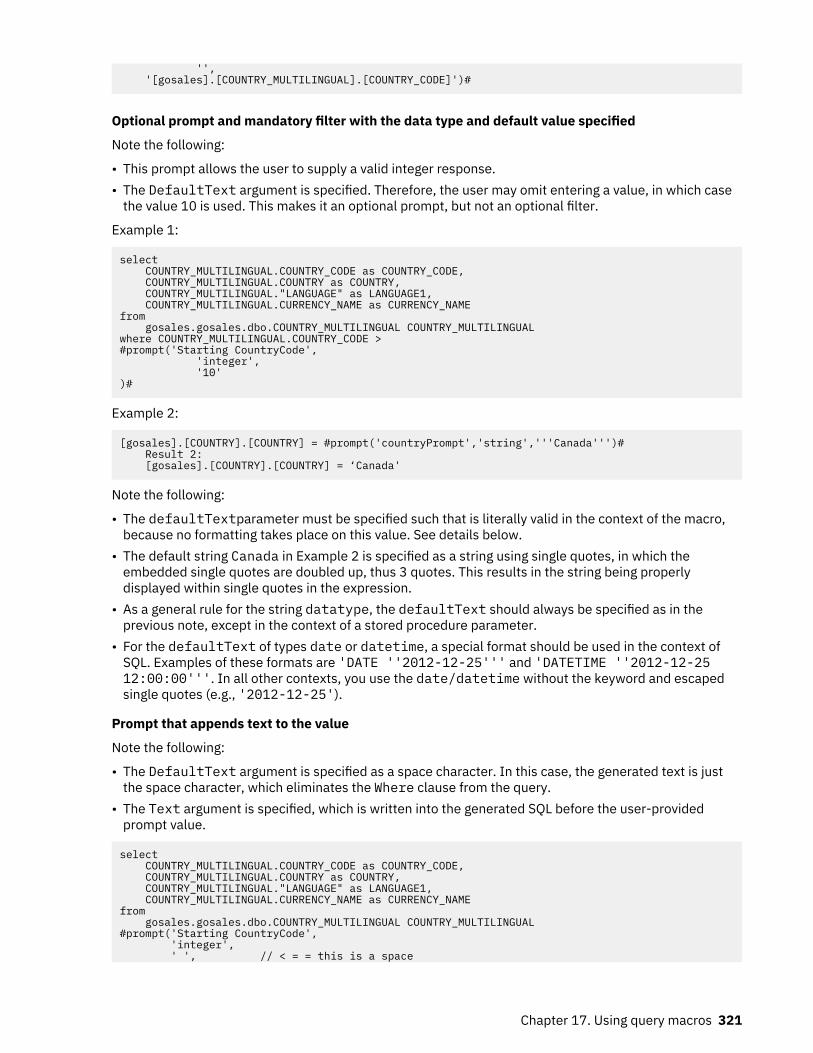
'', '[gosales].[COUNTRY_MULTILINGUAL].[COUNTRY_CODE]')#
Optional prompt and mandatory filter with the data type and default value specified
Note the following:
• This prompt allows the user to supply a valid integer response.• The DefaultText argument is specified. Therefore, the user may omit entering a value, in which case
the value 10 is used. This makes it an optional prompt, but not an optional filter.
Example 1:
select COUNTRY_MULTILINGUAL.COUNTRY_CODE as COUNTRY_CODE, COUNTRY_MULTILINGUAL.COUNTRY as COUNTRY, COUNTRY_MULTILINGUAL."LANGUAGE" as LANGUAGE1, COUNTRY_MULTILINGUAL.CURRENCY_NAME as CURRENCY_NAME from gosales.gosales.dbo.COUNTRY_MULTILINGUAL COUNTRY_MULTILINGUALwhere COUNTRY_MULTILINGUAL.COUNTRY_CODE > #prompt('Starting CountryCode', 'integer', '10')#
Example 2:
[gosales].[COUNTRY].[COUNTRY] = #prompt('countryPrompt','string','''Canada''')# Result 2: [gosales].[COUNTRY].[COUNTRY] = ‘Canada'
Note the following:
• The defaultTextparameter must be specified such that is literally valid in the context of the macro,because no formatting takes place on this value. See details below.
• The default string Canada in Example 2 is specified as a string using single quotes, in which theembedded single quotes are doubled up, thus 3 quotes. This results in the string being properlydisplayed within single quotes in the expression.
• As a general rule for the string datatype, the defaultText should always be specified as in theprevious note, except in the context of a stored procedure parameter.
• For the defaultText of types date or datetime, a special format should be used in the context ofSQL. Examples of these formats are 'DATE ''2012-12-25''' and 'DATETIME ''2012-12-2512:00:00'''. In all other contexts, you use the date/datetime without the keyword and escapedsingle quotes (e.g., '2012-12-25').
Prompt that appends text to the value
Note the following:
• The DefaultText argument is specified as a space character. In this case, the generated text is justthe space character, which eliminates the Where clause from the query.
• The Text argument is specified, which is written into the generated SQL before the user-providedprompt value.
select COUNTRY_MULTILINGUAL.COUNTRY_CODE as COUNTRY_CODE, COUNTRY_MULTILINGUAL.COUNTRY as COUNTRY, COUNTRY_MULTILINGUAL."LANGUAGE" as LANGUAGE1, COUNTRY_MULTILINGUAL.CURRENCY_NAME as CURRENCY_NAME from gosales.gosales.dbo.COUNTRY_MULTILINGUAL COUNTRY_MULTILINGUAL#prompt('Starting CountryCode', 'integer', ' ', // < = = this is a space
Chapter 17. Using query macros 321

'where COUNTRY_MULTILINGUAL.COUNTRY_CODE >')#
Syntax substitution
Note the following:
• The Datatype argument is set to token, which means that the user-provided value is entered withoutany checking on the provided value.
Because checking is not performed on the value, the expression editor may indicate that the expressionis not valid. When a valid user-provided value is supplied or if you provide a valid default value,expression editor will interpret the expression as valid.
• Token should be used only if there is a list of pick-values for the user.• The DefaultText argument is specified. Therefore, this is an optional prompt and group byCOUNTRY is used in the generated SQL.
Select COUNTRY_MULTILINGUAL.COUNTRY_CODE as COUNTRY_CODE, COUNTRY_MULTILINGUAL.COUNTRY as COUNTRY, COUNTRY_MULTILINGUAL."LANGUAGE" as LANGUAGE1, COUNTRY_MULTILINGUAL.CURRENCY_NAME as CURRENCY_NAME from gosales.gosales.dbo.COUNTRY_MULTILINGUAL COUNTRY_MULTILINGUAL #prompt('Sort column', 'token', 'group by COUNTRY', 'group by ')#
Examples - creating prompts that use parameter mapsWhen a report is run, you want your users to select a language for the data in the report. The followingexamples describe several ways you can do this.
Prompt that uses session variables
Note the following:
• The name of the prompt is specified using a lookup in the parameter map named PromptLabels. Thekey value is the session variable $language.
• The Where clause is using a parameterized column.
select ORDER_METHOD.ORDER_METHOD_CODE as ORDER_METHOD_CODE, ORDER_METHOD.ORDER_METHOD_#$language# as ORDER_METHOD_EN from gosales.gosales.dbo.ORDER_METHOD ORDER_METHOD#prompt($PromptLabels{$language}, '', ' ', 'where ORDER_METHOD.ORDER_METHOD_' + $language + '>')#
A parameter map that nests prompts
Note the following:
• In the model, there is a parameter map DynPromptLabels with #$PromptLabels{$language}#• Part of the prompt information is run from a parameter map instead of being coded directly inside the
SQL.
322 IBM Cognos Analytics - Reporting Version 11.0 : User Guide

• The whole macro containing the prompt can be a value in a parameter map.
select ORDER_METHOD.ORDER_METHOD_CODE as ORDER_METHOD_CODE, ORDER_METHOD.ORDER_METHOD_#$language# as ORDER_METHOD_EN from gosales.gosales.dbo.ORDER_METHOD ORDER_METHOD#prompt($DynPromptLabels{'ex9'}, '', ' ', 'where ORDER_METHOD.ORDER_METHOD_' + $language + '>')#
Examples - creating a multiple value promptWhen a report is run, you want your users to select one or more values. The following examples describeseveral ways you can do this.
Prompt with a required minimum
Note the following:
• The user must enter at least a single value.• This resembles the first example on prompting for a country or region “Mandatory prompt with no data
type specified” on page 320.
select COUNTRY_MULTILINGUAL.COUNTRY_CODE as COUNTRY_CODE, COUNTRY_MULTILINGUAL.COUNTRY as COUNTRY, COUNTRY_MULTILINGUAL."LANGUAGE" as LANGUAGE1, COUNTRY_MULTILINGUAL.CURRENCY_NAME as CURRENCY_NAME from gosales.gosales.dbo.COUNTRY_MULTILINGUAL COUNTRY_MULTILINGUALwhere COUNTRY_MULTILINGUAL.COUNTRY IN (#promptmany('CountryName')#)
Prompt with a required minimum with the data type specified
Note the following:
• This resembles the second example on prompting for a country or region “Mandatory prompt with thedata type specified” on page 320.
select COUNTRY_MULTILINGUAL.COUNTRY_CODE as COUNTRY_CODE, COUNTRY_MULTILINGUAL.COUNTRY as COUNTRY, COUNTRY_MULTILINGUAL."LANGUAGE" as LANGUAGE1, COUNTRY_MULTILINGUAL.CURRENCY_NAME as CURRENCY_NAMEfrom gosales.gosales.dbo.COUNTRY_MULTILINGUAL COUNTRY_MULTILINGUALwhere COUNTRY_MULTILINGUAL.COUNTRY_CODE IN ( #promptmany('Selected CountryCodes', 'integer', '', '', '[gosales].[COUNTRY_MULTILINGUAL].[COUNTRY_CODE]')#)
Optional prompt with the data type and default value specified
The In clause and both parentheses are part of the SQL statement.
select COUNTRY_MULTILINGUAL.COUNTRY_CODE as COUNTRY_CODE, COUNTRY_MULTILINGUAL.COUNTRY as COUNTRY, COUNTRY_MULTILINGUAL."LANGUAGE" as LANGUAGE1, COUNTRY_MULTILINGUAL.CURRENCY_NAME as CURRENCY_NAMEfrom gosales.gosales.dbo.COUNTRY_MULTILINGUAL COUNTRY_MULTILINGUAL
Chapter 17. Using query macros 323

where COUNTRY_MULTILINGUAL.COUNTRY_CODE IN ( #promptmany('Selected CountryCodes', 'integer', '10' )#)
Prompt that adds text before the syntax
Note the following:
• This example uses the TextFollowing argument.
select COUNTRY_MULTILINGUAL.COUNTRY_CODE as COUNTRY_CODE, COUNTRY_MULTILINGUAL.COUNTRY as COUNTRY, COUNTRY_MULTILINGUAL."LANGUAGE" as LANGUAGE1, COUNTRY_MULTILINGUAL.CURRENCY_NAME as CURRENCY_NAMEfrom gosales.gosales.dbo.COUNTRY_MULTILINGUAL COUNTRY_MULTILINGUAL#promptmany('Selected CountryCodes', 'integer', ' ', // < = = thisis a space 'where COUNTRY_MULTILINGUAL.COUNTRY_CODE IN( ', '', ')')#
Optional prompt that adds text before the syntax
Select COUNTRY_MULTILINGUAL.COUNTRY_CODE as COUNTRY_CODE, COUNTRY_MULTILINGUAL.COUNTRY as COUNTRY, COUNTRY_MULTILINGUAL."LANGUAGE" as LANGUAGE1, COUNTRY_MULTILINGUAL.CURRENCY_NAME as CURRENCY_NAME from gosales.gosales.dbo.COUNTRY_MULTILINGUAL COUNTRY_MULTILINGUAL, gosales.gosales.dbo.COUNTRY XXwhere COUNTRY_MULTILINGUAL.COUNTRY_CODE = XX.COUNTRY_CODE #promptmany('Selected CountryCodes', 'integer', ' ', ' and COUNTRY_MULTILINGUAL.COUNTRY_CODE IN (', '', ')' )#
324 IBM Cognos Analytics - Reporting Version 11.0 : User Guide
Chapter 18. Using drill-through accessUsing drill-through access, you can move from one report to another within a session while maintainingyour focus on the same piece of data. For example, you select a product in a sales report and move to aninventory report about that product.
Drill-through access helps you to build analytical applications that are bigger than a single report. Drill-through applications are a network of linked reports that users can navigate, retaining their context andfocus, to explore and analyze information.
Drill-through access works by defining the target report or object and then using information from thesource report to filter the target. IBM Cognos Analytics can match data from the source to metadata in thetarget report, or you can define parameters in the target for greater control.
Note: In the dimensional reporting style, you can also enable drilling up and drilling down. For moreinformation about drilling up and drilling down, see “Create a drill-up and drill-down report” on page 232.
What You Should Know
For a drill-through link to work, it is necessary to know
• the source• the target• how the data in the packages that contain these objects is related
Depending on the underlying data, you may create a drill-through definition and have IBM CognosAnalytics match the data (dynamic drill-through) or create parameters in the target (parameterizeddrill-through).
• whether to run the target report or to open it
The target of drill-through access is usually a saved report definition. The report can be created in IBMCognos Analytics - Reporting, IBM Cognos Query Studio, IBM Cognos PowerPlay Studio, or IBM CognosAnalysis Studio. The target of drill-through access can also be a package that contains an IBM CognosPowerCube, in which case a default view of the PowerCube is created.
• whether the users of the drill-through link in the source report have the appropriate permissions to viewor run the target report
• if the target is being run, in what format to run it, and what filters to use on the target
If you do not want to run the target report on demand, you may link to a bookmark in the saved outputinstead of running the report. For more information, see the IBM Cognos Analytics Administration andSecurity Guide.
Sources and Targets
In IBM Cognos Analytics, there are many different examples of source and target. For example, you candrill through
• between reports created in different packages against different data source types, such as from ananalysis against a package that contains a PowerCube to a detailed report against a package based on arelational data source
• from one existing report to another report using definitions created in Reporting• between IBM Cognos Viewer reports authored in Reporting, Query Studio, and Analysis Studio• to and from a package built on a PowerCube• from IBM Cognos Series 7 to IBM Cognos Analytics reports
Tip: In the GO Data Warehouse (analysis) package, the Positions to Fill sample report is a drill-throughtarget report and the Recruitment Report sample report is a drill-through source report.
Understanding drill-through conceptsBefore you set up drill-through access, you must understand the key concepts about drilling through.Knowing these concepts will help you to avoid errors so that report consumers drill through as efficientlyas possible.
Drill-through pathsYou can create a drill-through path in a source report, or using drill-through definitions. A drill-throughpath is the definition of the path that is taken when moving from one report to another, including how thedata values are passed between the reports.
Using Drill-Through Definitions, you can create a drill-through path from any report in the sourcepackage to any target report in any other package. This type of drill-through definition is stored in thesource package.
For any target report that contains parameters, you should map the target parameters to the correctmetadata in the drill-through path. This ensures that the values from the source report are passed to thecorrect parameter values, and that the target report is filtered correctly. If you do not map parameters,then the users may be prompted for values when the target report is run.
A report-based drill-through path refers to a path created and stored in a source report. This type of drill-through path is also called authored drill through. The path is associated with a specific data column,chart, or cross tab in the source report, and is available only when users select that area of the report. Ifan authored drill-through definition is available, a hyperlink appears in the source report when it is run.
Report-based drill-through is limited to reporting source reports and any target reports. Use this type ofdrill-through access when you want to pass data item values or parameter results from within a sourcereport to the target report, pass the results of a report expression to a target report, or a use URL link as apart of the drill-through definition.
Selection contextsThe selection context represents the structure of the values selected by the user in the source.
In IBM Cognos Analysis Studio, this includes the context area. When a package drill-through definition isused, the selection context is used to give values for mapped parameters (parameterized drill-through) oralso to map the appropriate data items and values.
Drill-through links can also be defined to open the target object at a bookmark. The content of thisbookmark may also specified by the selection context.
Drill-through access is possible between most combinations of the IBM Cognos Analytics studios. Eachstudio is optimized for the goals and skills of the audience that uses it, and in some cases for the type ofdata source it is designed for. Therefore, you may need to consider how the various studios manage theselection context when you drill through between objects created in different studios, and how the datasources are conformed. During testing or debugging, you can see how source values are being mapped indifferent contexts using the drill-through assistant.
Drilling through to different report formatsThe settings in the drill-through definition determine the format in which users see the report results.
For example, the users may see the reports in IBM Cognos Viewer as an HTML Web page, or the reportsmay open in IBM Cognos Query Studio, IBM Cognos PowerPlay Studio, or IBM Cognos Analysis Studio. Ifyour users have PowerPlay Studio, then they may also see the default view of a PowerCube.
Reports can be opened as HTML pages, or as PDF, XML, CSV, or Microsoft Excel spreadsheet softwareformats. When you define a drill-through path, you can choose the output format. This can be useful if theexpected use of the target report is something other than online viewing. If the report will be printed,output it as PDF; if it will be exported to Excel for further processing, output it as Excel or CSV, and so on.
326 IBM Cognos Analytics - Reporting Version 11.0 : User Guide
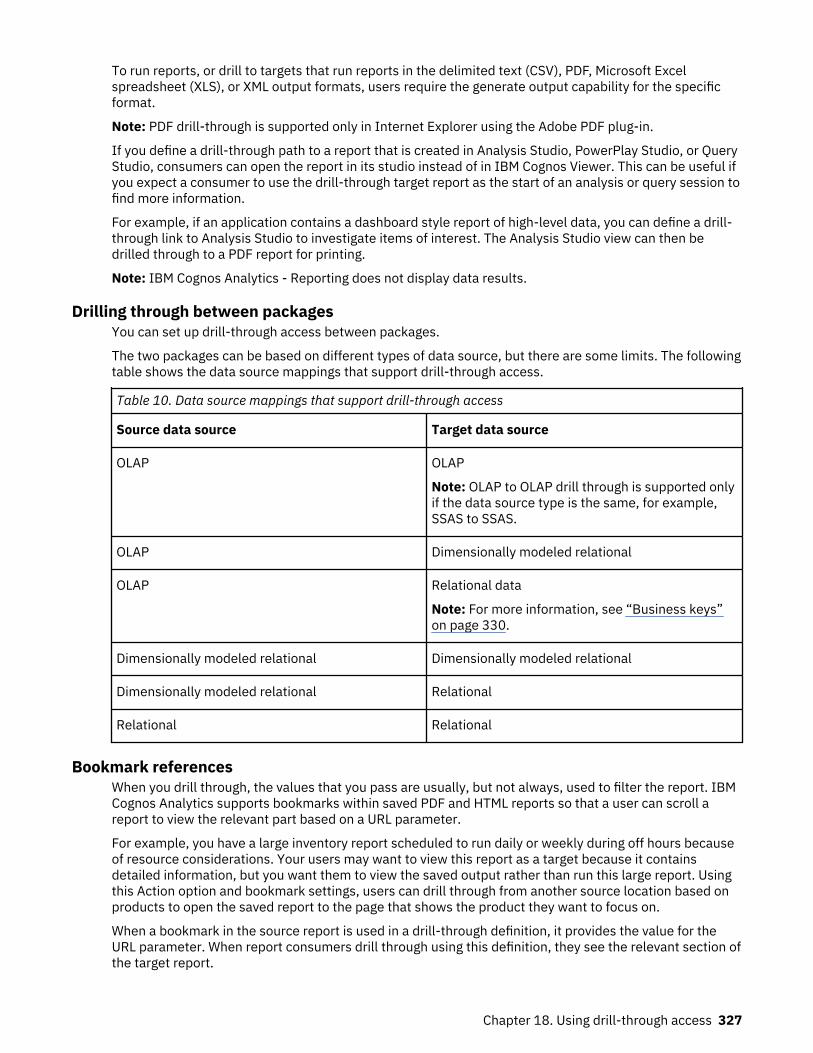
To run reports, or drill to targets that run reports in the delimited text (CSV), PDF, Microsoft Excelspreadsheet (XLS), or XML output formats, users require the generate output capability for the specificformat.
Note: PDF drill-through is supported only in Internet Explorer using the Adobe PDF plug-in.
If you define a drill-through path to a report that is created in Analysis Studio, PowerPlay Studio, or QueryStudio, consumers can open the report in its studio instead of in IBM Cognos Viewer. This can be useful ifyou expect a consumer to use the drill-through target report as the start of an analysis or query session tofind more information.
For example, if an application contains a dashboard style report of high-level data, you can define a drill-through link to Analysis Studio to investigate items of interest. The Analysis Studio view can then bedrilled through to a PDF report for printing.
Note: IBM Cognos Analytics - Reporting does not display data results.
Drilling through between packagesYou can set up drill-through access between packages.
The two packages can be based on different types of data source, but there are some limits. The followingtable shows the data source mappings that support drill-through access.
Table 10. Data source mappings that support drill-through access
Source data source Target data source
OLAP OLAP
Note: OLAP to OLAP drill through is supported onlyif the data source type is the same, for example,SSAS to SSAS.
OLAP Dimensionally modeled relational
OLAP Relational data
Note: For more information, see “Business keys”on page 330.
Dimensionally modeled relational Dimensionally modeled relational
Dimensionally modeled relational Relational
Relational Relational
Bookmark referencesWhen you drill through, the values that you pass are usually, but not always, used to filter the report. IBMCognos Analytics supports bookmarks within saved PDF and HTML reports so that a user can scroll areport to view the relevant part based on a URL parameter.
For example, you have a large inventory report scheduled to run daily or weekly during off hours becauseof resource considerations. Your users may want to view this report as a target because it containsdetailed information, but you want them to view the saved output rather than run this large report. Usingthis Action option and bookmark settings, users can drill through from another source location based onproducts to open the saved report to the page that shows the product they want to focus on.
When a bookmark in the source report is used in a drill-through definition, it provides the value for theURL parameter. When report consumers drill through using this definition, they see the relevant section ofthe target report.
Chapter 18. Using drill-through access 327
Bookmark references are limited to previously run reports that are output as PDF or HTML and containbookmark objects.
Members and valuesDimensionally modeled data, whether stored in cubes or stored as dimensionally modeled relational(DMR) data, organizes data into dimensions. These dimensions contain hierarchies. The hierarchiescontain levels. And the levels contain members.
An example of a dimension is Locations. A Locations dimension may contain two hierarchies: Locations byOrganization Structure and Locations by Geography. Either of these hierarchies may contain levels likeCountry or Region and City.
Members are the instances in a level. For example, New York and London are members in the City level. Amember may have multiple properties, such as Population, Latitude, and Longitude. Internally, a memberis identified by a Member Unique Name (MUN). The method by which a MUN is derived depends on thecube vendor.
Relational data models are made up of data subjects, such as Employees, which are made up of dataitems, such as Name or Extension. These data items have values, such as Peter Smith.
In IBM Cognos Analytics, the methods of drilling through available are
• Dimensional (member) to Dimensional (member)• Dimensional (member) to Relational (data item value)• Relational (data item value) to Relational (data item value)
If the target parameter is a member, the source must be a member. The source and target should usuallybe from a conformed dimension. However, if the data supports it, you may also choose to define amapping using different properties of the source metadata item.
If the target parameter is a value, the source can be either a value or a member. If the source is adimensional member, you must ensure that the level or dimension is mapped to the target data itemcorrectly in the drill-through definition. The business key from which the member is sourced shouldusually match the relational target value, which is most often the business key. However, if the datasupports it, you may also choose to define a mapping from the caption of the source metadata item.
Member unique namesThe member unique name (MUN) is a unique identifier for a member in IBM Cognos reports. It is stored inthe report specification when the member is referenced in the report directly.
The MUN is used in drill-through between OLAP data sources. The member keys in the MUN for thedifferent OLAP data sources must match.
The MUN is used to find the member in the data source, which is similar to how business keys are used tofind records in a table. For example, when you create OLAP dimension Products, you use the Product Linedatabase column as s label for the members in your Product Line level. However, you use the ProductLine Code business key from the database table to ensure that all the Product lines are unique in thatlevel. The source value that you used to create the members is used in combination with the data sourcename, hierarchy, and level information in the member unique name.
If the MUN changes, members that are directly referenced in expressions, filters, or reports are no longerfound. Changes to the MUN may be related to other changes. For example, changes to the hierarchy andlevel structures may change the level unique name, and changes to the business key values may changethe member key path. Other factors that can affect the MUN are application changes during the designstage or over time, IBM Cognos PowerCube category codes that are unpredictably unique, the productionenvironment that has more members than the test environment, or removing the member from the datasource.
To avoid potential problems, we recommend the following best practices when you build OLAP datasources:
• Use unique codes and keys within a dimension for the member keys.
328 IBM Cognos Analytics - Reporting Version 11.0 : User Guide
• Define your OLAP and relational packages using unique conformed values for the source values(business keys) within similar dimensions or data values where drill-through between applications maybe required.
• Ensure that the business keys and dimension metadata structure are the same in the production andtest environments.
• Do not change the business keys in IBM Cognos Framework Manager in the production environment.• Resolve the non-unique keys in a dimension in the data source before you build the cube.
Ensure that there are no duplicate source values in all levels of a dimension before you build aPowerCube. We do not recommend using the tilde character (~) in the category codes.
For more information, see the section about uniqueness in the IBM Cognos Series 7 Step-by-StepTransformer.
For information about PowerCubes migrated from IBM Cognos Series 7, see the IBM Cognos PowerPlayMigration and Administration Guide.
Conformed dimensionsIf you work with more than one dimensional data source, you may notice that some dimensions arestructured the same, and some are not.
The reason that dimensions can be structured differently is that the data sources may serve differentpurposes.
For example, a Customer dimension appears in a Revenue data store, but not in an Inventory data store.However, the Products dimension and the Time dimension appear in both data stores.
Dimensions that appear in multiple data stores are conformed if their structure is identical for all of thefollowing:
• hierarchy names• level names• level order• internal keys
Drilling through is possible between different dimensional data stores only if the dimensions areconformed, and if the dimension data store is of the same vendor type, such as IBM Cognos PowerCubeas the source and the target. For example, in two data stores for Revenue and Inventory that containProducts and Time dimensions, it is possible to define the Products and Time dimensions differently foreach data store. However, for drill-through between the Products and Time dimensions to work, theirstructures must be identical in each data store.
If you are not sure whether your dimensions are conformed, then you should check with the data modelerto ensure that the drilling through will produce meaningful results.
IBM Cognos Analytics does not support conformed dimensions generated by IBM Cognos FrameworkManager for SAP BW data sources.
Dimensionally modeled Relational Data Sources
Ensure that each level contains a business key that has values that match your PowerCube or other DMRmodels. Also, you must also ensure that the Root Business Key property is set and uses the business keyof the first level in the hierarchy. This helps to ensure that you have a conformed member unique namewhen attempting to drill through using members from this dimension.
Related conceptsData Does Not Appear in a Target Report or the Wrong Data AppearsRelated tasksUnexpected or Empty Results When Drilling Through
Chapter 18. Using drill-through access 329
Business keysWhen drill-through access is defined from a member to a relational value, the business key of themember is passed by default.
This means that your relational target parameter must be set up using the data item with a matchingvalue, which is most often the business key data item. You can also choose to pass the caption of thesource metadata item.
For example, employees are usually uniquely identified by an employee number, not by their name,because their name is not necessarily unique. When you drill through from a dimensional member to arelational data item, the value provided is the business key. Therefore, the parameter in the target reportmust be defined to accept a business key value. The exact logic used to define the business key valuesupplied depends on the cube vendor. For IBM Cognos PowerCubes, the business key value is the Sourceproperty defined for the level in IBM Cognos Transformer. IBM Cognos Series 7 Transformer PowerCubespass the source value if the drill-through flag was enabled before the cube was built. Otherwise, thecategory code is used.
In IBM Cognos Analytics - Reporting, you can determine what the member business key is using anexpression such as roleValue('_businessKey',[Camping Equipment]). This expression is case-sensitive.
SSAS 2005 multipart business keys are not supported in drill-through operations.
Tip: When other users run your drill-through report, you may not want them to be prompted for abusiness key. In Reporting, you can build a prompt page with a text that is familiar to the users, but filterson the business key. Your IBM Cognos Framework Manager modeler can also set the Display ItemReference option for the Prompt Info property to use the business key when the data item is used in aprompt.
Related conceptsData Does Not Appear in a Target Report or the Wrong Data AppearsRelated tasksUnexpected or Empty Results When Drilling Through
ScopeScope is specific to drill-through definitions created using drill-through definitions (package drill-throughdefinitions). The scope you set defines when the target report is shown to the users, based on the itemsthey have in the source report.
Usually, you define the scope of a drill-through path to match a parameter that it passes. For example, if atarget report contains a list of employees, typically you want to display the report as an available drill-through choice only when a user is viewing employee names in a source report. If employee names arenot in the source report and the scope was set on the employee name in the drill-through definition, theemployee report does not appear on the list of available drill-through target reports in the Go To page.You can set the scope to a measure or to an item in the report.
In report-based drill-through access, where the drill-through path is associated with a specific reportcolumn, the column serves as the scope.
Mapped parametersDrill-through targets may contain existing parameters or you can add parameters to the target for greatercontrol over the drill-through link.
You usually map all parameters in a drill-through target to items from the source.
When you map source items that are OLAP or DMR members to target parameters, you can select from aset of related member properties to satisfy the requirements of the target parameter. For a dimensionaltarget, a dimensional source item uses the member unique name by default. For a relational target, adimensional source item uses the business key by default.
330 IBM Cognos Analytics - Reporting Version 11.0 : User Guide

For example, you could change the source member property that is used for a mapping to the membercaption instead of the business key to match the parameter in a relational target. For a dimensionaltarget, you could define a parameter that accepts a particular property (such as business key or parentunique name), then pass the appropriate source property to satisfy that target.
Note: If you define drill through between non-conformed dimensions, you should test carefully to ensurethat the results behave as expected.
If you do not specify parameter mappings, then by default, you will be prompted for any parametersrequired in the target when you use the drill-through link. To customize this behavior, use the displayprompt pages setting.
When the action is set to Run the report using dynamic filtering, then additional filtering is applied ifnames from the context in the source report match names of items in the target. Use this action as wellwhen there are no parameters defined in the target.
If parameters are not mapped correctly, then you may receive an empty report, the wrong results, or anerror message.
The source and target cannot contain identical parameter names when they are from different packages,even if the data structure is conformed. If the source and target are from the same package, there is norestriction.
If you have the necessary permissions, you can use the drill-through assistant to look at what sourceparameters are passed, and what target parameters are mapped for a given drill-through link.
You can change the dynamic drill-through filter behavior if you want drill-through to generate a filter usingthe Member Business Key instead of the default Member Caption. For more information, see ChangingDrill-Through Filter Behavior in the IBM Cognos Administration and Security Guide.
Drilling through on dates between PowerCubes and relational packagesThe usual method of drilling through from OLAP to relational packages requires that the target reportparameter is set using the business key in the relational data, which does not work well for dates.
OLAP data sources typically view dates as members, such as Quarter 1 2012, while relational datasources view dates as ranges, such as 1/Jan/2012 to 31/March/2012.
A special feature exists for drilling through between PowerCubes and relational packages. Ensure that thetarget report parameter is set up using in_range. The parameter must be of type date-time, and notinteger.
An example follows:
[gosales_goretailers].[Orders].[Order date] in_range ?Date?
Also ensure that the drill-through definition maps the parameter at the dimension level and that thePowerCube date level is not set to suppress blank categories. Enabling the option to suppress blankcategories in the Transformer model before you build the cube may cause the drill-through on dates to beunsuccessful. This happens because there are missing values in the range.
Set up drill-through access in a reportSet up drill-through access in a source report to link two reports containing related information.
You can then access related or more detailed information in one report (the target) by selecting one ormore data item values from another report (the source). IBM Cognos passes values from the source to thetarget and uses the passed values to filter the target object. If the data in the source and target isconformed or if the data item names are the same, then the system may map the source values to filterthe target (dynamic drill-through). If you require greater control, you may define parameters in the targetobject (parameterized drill-through).
Chapter 18. Using drill-through access 331
For instructions about creating parameters in other kinds of targets, see the IBM Cognos AnalyticsAdministration and Security Guide.
When you define the drill-through path in IBM Cognos Analytics - Reporting, you can pass a value from adifferent data item that is hidden from the user for display purposes but still in the query. For example,users see the Product Name data item and can drill through on that item, but the drill-through definitionpasses the Product Number value for the product name the user chose. You can also define the targetparameter to accept multiple values or a range of values from the data item in the drill-through sourcereport or to accept a value from a parameter in the source report.
Drill-through definitions that have been authored inside a Reporting report appear in the source report asblue underlined links. Users click the hyperlink to select the value they want passed to the target and todrill through to the target report. If a user selects multiple items within a single column then when thedrill-through target report is run, the values from each selected row are passed to the target parameters.This occurs as an and condition.
You can also drill through within the same report by creating bookmarks. As well, you can create drill-through definitions in the source package instead of the Reporting report. Users can use package drill-through definitions to navigate to a target report from an IBM Cognos Analysis Studio analysis, an IBMCognos Query Studio report, an IBM Cognos PowerPlay Studio report or IBM Cognos PowerCube package,or a Reporting report. For more information, see the Administration and Security Guide.
If you have the IBM Cognos Software Development Kit, you can use URLs to set up drill-through access toand from third-party sources.
You can also drill through from a map.
Create a parameter in the targetSet up drill-through access in a source report to link two reports containing related information. You canthen access related or more detailed information in one report (the target) by selecting one or more dataitem values from another report (the source).
If you are using an SAP BW data source for the target report and the target report contains a variable for ahierarchy node, values from the source report can be values only of the data item representing the leaf-level identifier of the hierarchy.
Before you begin
Before you begin, ensure that you have a report that will serve as the source report and another reportthat will serve as the target report.
Procedure
1. In IBM Cognos Analytics - Reporting, open the target report.2. Create a parameter that will serve as the drill-through column or that will filter the report.
For example, to drill through or filter Product line, create the following parameter:
[Product line]=?prodline_p?
Tip: Use the operators in or in_range to enable the target report to accept multiple values or a rangeof values.
3. In the Usage box, specify what to do when a value for the target parameter is not passed as part of adrill through:
• To specify that users must select a value, click Required.
If a value for the target parameter is not passed, users are prompted to choose a value.• To specify that users do not need to select a value, click Optional.
Users are not prompted to choose a value and so the value is unfiltered.
332 IBM Cognos Analytics - Reporting Version 11.0 : User Guide

• To specify not to use the parameter, click Disabled.
The parameter is not used during the drill-through. It will also not be used in the report for any otherpurposes.
Tip: If the parameter is needed in the report for other reasons, then you can also specify not to use itin the drill-through definition (Parameters table, Method, Do not use parameter).
Create a drill-through definitionCreate a drill-through definition to link two reports containing related information (the source report andthe target report).
Drill-through definitions that have been authored inside an IBM Cognos Analytics - Reporting reportappear in the source report as blue underlined links. Users click the hyperlink to select the value theywant passed to the target and to drill through to the target report. If a user selects multiple items within asingle column then when the drill-through target report is run, the values from each selected row arepassed to the target parameters. This occurs as an and condition.
Before you begin
Before you begin, ensure that you have a report that will serve as the source report and another reportthat will serve as the target report.
Procedure
1. Check the drill-through target:
• Confirm that the drill-through users have access to the target.• If necessary, check what parameters exist in the target.
2. Open the source report.3. Click the element in the report that will serve as the starting point for the drill-through link.
You can select a data item that your report users are likely to choose to drill on for more detailedinformation, such as an Employee Name data item.
Tip: If you are passing only parameter values to the target report, you do not have to drill on a dataitem. Instead, you can drill on any object in the report, such as the report title. Therefore, you candrill from outside the context of a query.
4. Click the Show properties icon , in the DATA section, double-click the Drill-through definitionsproperty.
5. Click the Add icon .
A drill-through definition is created.
Tip: To change the drill-through name, click the rename button, type the new name, and click OK.6. On the Target report tab, click the ellipsis button next to the Report box and select the drill-through
target report.7. In the Action box, decide how users will view the target report when they click the drill-through link
in the parent report:
• To view the latest data in IBM Cognos Viewer, select Run the report.• To edit an IBM Cognos Query Studio, IBM Cognos Analysis Studio, or IBM Cognos PowerPlay Studio
target, select Edit the report.• To have IBM Cognos Analytics match values from the selection context with data in the target
(dynamic filtering), select Run the report using dynamic filtering.
Chapter 18. Using drill-through access 333

Note: If you chose this option, any parameters in the target report are still used for the drill-throughaccess.
• To view the most recently saved output version of the target report from the IBM Cognos Analyticsportal, select View the most recent report.
• To use the default action specified for the report in the IBM Cognos Analytics portal, select(Default).
8. If the target report contains parameters, then, under the Parameters box, click the edit button.
Each required and optional parameter defined in the target report appears in the Parameters dialogbox.
9. For each parameter, specify the Method of treatment:
• To specify not to pass any value, click (Default).• To specify not to use this parameter, click Do not use parameter.
The target report will not be filtered by this parameter.• To pass values from a data item, click Pass data item value, click Value, and then click the data
item.
Values for the selected data item are passed to the target report.• To pass values from a source report parameter, click Pass parameter value, click Value, and then
click the parameter.
Values for the selected parameter are passed to the target report.• If you choose to pass parameters, and the source report is based on a dimensional package, then
click an item from the drop-down list in the Source metadata item properties column. You canpass the default property of the source metadata item (business key) or another property, such asthe member caption.
10. Click OK.11. If you chose to run the target report, in the Format box, click the output format for your report.
Tip: Click (Default) to run the report using the default format specified for the report in the IBMCognos Analytics portal.
12. To open the target report in a new window, select the Open in new window check box.13. In the Display prompt pages box, choose how to display prompt pages:
• To always display prompt pages when the drill-through action occurs regardless of whether valueswere specified for the required parameter values, click Always.
• To use the prompt settings of the target report (specified by the Prompt for Values check box inthe IBM Cognos Analytics portal, Report Properties, Report tab) to determine whether to show theprompt pages, click Based on the default prompt settings of the target report.
Tip: If you leave the Prompt for values check box selected (the default) and run a report thatcontains the same parameter name that appears in your My parameters panel, you are notprompted to provide a value for the parameter. The system automatically uses the default valuesthat were set for the user’s role. Even if the parameter on the report is optional, the default valuefor the global parameter is passed.
• To not display prompt pages when the required parameter values are provided by the drill-throughdefinition, click Only when required parameter values are missing. This is the default setting.
ResultsThe drill-through text appears as a blue hyperlink in text items in the non-chart areas of the report. Reportconsumers can also start the drill-through action by clicking the Go To button or by right-clicking the itemand clicking Go To, Related links. If you have the necessary permissions, you can view which parameterswere passed from the source and how they are mapped in the target object from the Go To page using thedrill-through assistant.
For more information, see the Administration and Security Guide.
334 IBM Cognos Analytics - Reporting Version 11.0 : User Guide

Defining independent drill-through definitions for crosstabsBy default, you can create only one drill-through definition for fact cells in a crosstab, regardless of howmany facts there are. This topic describes how to define different drill-through definitions for differentmeasures in crosstab fact cells.
For example, a crosstab has Quantity and Revenue as measures. For the Quantity cells, you want todefine a drill-through definition to a target report that contains more information about quantities sold.For the Revenue cells, you want to define a drill-through definition to a different target report that showsdetails about revenue generated.
Procedure
1. Open the source report.
2. Click the More icon and then click the Locked icon .
3. In the crosstab, click the white space inside one of the fact cells of the measure for which you want todefine a drill-through definition.
Do not click the measure text. You want to select the crosstab intersection and not the text item. Inthe Properties pane title bar, ensure that Crosstab intersection appears.
4. In the Properties pane, set the Define contents property to Yes.The text item in the crosstab intersection disappears.
5. Click the Data icon and then click the Data items tab .6. From the crosstab query, drag the measure that disappeared in step 4 to the empty crosstab
intersection.7. Click the measure in the crosstab intersection and then, in the Properties pane, click Drill-through
definitions.8. Create the drill-through definition.
Results
A drill-through definition is defined for the selected measure. Repeat the steps to define different drill-through definitions for other measures in the crosstab. When users run the report, clicking values fromdifferent measures takes them to a different target report.
Specify the drill-through textYou can specify the drill-through text that appears when users can drill through to more than one target.
For example, if users from different regions view the report, you can show text in a different language foreach region.
Procedure
1. Click the drill-through object and then, from the Properties pane, click Drill-through definitions.2. If more than one drill-through definition exists for the object, in the Drill-through definitions box,
click a drill-through definition.3. Click the Label tab.4. To link the label to a condition, in the Condition box, do the following:
• Click Variable and click an existing variable or create a new one.• Click Value and click one of the possible values for the variable.
5. In the Source type box, click the source type to use.6. If the source type is Text, click the ellipsis button that corresponds to the Text box and type text.
Chapter 18. Using drill-through access 335

7. If the source type is Data item value or Data item label, click Data Item and click a data item.8. If the source type is Report expression, click the ellipsis button that corresponds to the Report
expression box and define the expression.9. If the label is linked to a condition, repeat steps 5 to 8 for the remaining possible values.
ResultsWhen users run the source report and click a drill-through link, the Go to page appears. The drill-throughtext you specified appears for each target. If you did not specify the drill-through text for a target, thedrill-through name is used.
336 IBM Cognos Analytics - Reporting Version 11.0 : User Guide

Chapter 19. Working with multiple pagesDivide a report into multiple pages and add navigation elements to make it easier to use.
Note: The pages that you see in the Pages icon differ from physical, printed pages. For example, if youcreate page breaks in a long report, the Pages icon could show only one page, but your report couldinclude several physical pages when you print it.
Add a page to a reportAdd pages to create a multiple-page report.
About this task
Reports may contain pages with a variety of content. For example, you are creating a sales report and youwant to include general information about the company. You decide to create an introduction page toshow this information. When you run the report, page 1 of the report is the introduction page and thefollowing pages contain data
Tip: The TOC Report sample report in the GO Data Warehouse (query) package includes multiple pages.
Procedure
1. Click the Pages icon and click Report pages.
Tip: Click Prompt pages to add a prompt page.
2. Click the Toolbox icon , drag Page to the work area.3. To change the order of pages, drag pages above or below other pages.4. To associate a query to the page, in the Properties pane, set the Query property to the query.
Associate the page to a query to add data-related objects directly to the page header, body, or footer,such as data items and filters.
5. Double-click the page to open it in page design view.6. Add objects to the page.
Page breaks, page sets, and page layersYou can create simple page breaks, advanced page sets, or page layers to associate pages with a querystructure to force page breaks.
For example, a query contains the data item Product line, which is grouped. Creating a page set that isassociated with this query adds page breaks for each product line. When working with dimensional data,you can use the Page layers area to show values on a separate page for each member.
When you are working with dimensional data, IBM Cognos Analytics - Reporting does not support pagebreaks or page sets that are based on custom groups.
Tip: The Global Bonus Report sample report in the GO Data Warehouse (analysis) package includes pagesets.
Reports in Excel 2007 format
When you produce reports in Excel 2007 format, you can configure IBM Cognos Analytics to dynamicallyname the Excel worksheet tabs, based on the data items that are used to break pages. For example, you
specify to break pages by Product line. In Excel 2007 output, the five worksheet tabs that are generatedare named Camping Equipment, Mountaineering Equipment, Personal Accessories, Outdoor Protection,and Golf Equipment. To dynamically name Excel worksheet tabs, ask your administrator to add theRSVP.EXCEL.PAGEGROUP_WSNAME_ITEMVALUE advanced setting to the report service. For moreinformation, see the IBM Cognos Analytics Administration and Security Guide.
If a report contains two page sets that use the same grouping data item, the suffix _<number> isappended to the Excel tabs. For example, a report contains two page sets that use Product line as thegrouping item. In the Excel output, worksheet tabs are named Camping Equipment, Golf Equipment,Camping Equipment_2, Golf Equipment_2, and so on. Similarly, page set header and footer pages arenamed Camping Equipment, Camping Equipment_2, Camping Equipment_3, and so on.
If a report contains nested page sets, worksheet tab names are a concatenation of the nested itemsseparated by commas. For example, a report contains a page set with Product line as the grouping item.The page set has a nested page set that uses Product type as the grouping item. Examples of worksheettab names that are generated are Camping Equipment,Cooking Gear and Camping Equipment,Lanterns.
Note: In Excel, tab names cannot exceed 30 characters. Tab names with more than 30 characters aretruncated. If truncated tab names produces duplicate names, the prefix s_<worksheet indexing> is addedto the names. For example, multiple pages are named Camping Equipment,Cooking Gear. The first tabname is Camping Equipment,Cooking Gea. The second tab name is s_22Camping Equipment,Cooking.
Creating page breaksCreate page breaks in a report by adding page sets.
About this task
Page sets define sets of pages within a report. You customize the grouping and sorting of each page set toproduce the results that you want.
You cannot create page sets if you set the option to show report pages as tabs in HTML output (Showproperties > View pages as tabs).
Procedure
1. Click the Pages icon , and click Report pages.2. Create the report pages.
3. Click the Toolbox icon and drag the Page set object to the Report pages pane.
4. Click the Show properties icon , and in the Properties pane, set the Query property to the querythat you want to associate with the page set.
Tip: You can also create a page set and associate it to a query by clicking the Data icon , right-clicking a query and clicking Insert.
5. Organize the pages in the report by dragging report pages to the page set.6. Insert the page containing details in the Detail Pages folder.
Detail pages are the pages that repeat based on the items by which you group in the following step.
Tip: You can insert multiple detail pages into the same page set and link them using a master detailrelationship.
7. Define the grouping structure for the page set:
• Click the page set.• In the Properties pane, double-click the Grouping & sorting property.• In the Data items pane, drag the data item by which to group data items to the Groups folder in the
Groups pane.
338 IBM Cognos Analytics - Reporting Version 11.0 : User Guide

• To sort the data within each group, in the Data items pane, drag the data item by which to sort to the
Detail Sort List folder, and then click the sort order button to specify the sort order. For moreinformation about sorting data, see “Sorting Relational Data” on page 172 or “Sorting DimensionalData” on page 211.
Note: Grouping an item for a page set is not the same as grouping a column in the layout. Grouping acolumn in the layout visually shows groups in a report. Grouping an item for a page set groups the itemin the query. If you want to use an item that is already grouped in the layout, you must still performstep 7.
8. Repeat steps 3 to 7 to create other page sets.
Tip: You can nest page sets and join them by defining a master detail relationship. Create nested pagesets to have pages occur within other pages. For example, you want pages containing product typeinformation to occur within pages containing product line information.
Join nested page setsIf you have nested page sets in your report, define a master detail relationship between them to see datain the nested page set that is related to the data in the parent page set.
For example, you have a page set that shows pages of product line information. The page set contains anested page set that shows pages of product type information. For each product line page, you want tosee the related product type pages, as shown in the following example:
Product line_1
• Product type_1• Product type_2• Product type_3
Product line_2
• Product type_4• Product type_5• Product type_6
For more information about master detail relationships, see “Create a Master Detail Relationship” on page220.
Procedure
1. Click the Pages icon and click Report pages.2. In the Report pages pane, click the nested page set.3. In the Properties pane, double-click the Master detail relationships property.4. Click the New Link button.5. In the Master Query box, click the data item that provides the primary information.6. Link the master data item to the details by doing one of the following:
• To link to another data item in the detail query, in the Detail Query box, click the data item thatprovides the detailed information.
• To link to a parameter, in the Parameters box, click the parameter that provides the detailedinformation.
7. Repeat steps 4 to 6 to create other links.
Tip: To delete a link, select it and press the Delete key.
Chapter 19. Working with multiple pages 339

Create page layersWhen working with dimensional data, you can create page layers in a report to show values for eachmember on a separate page. For example, your report contains payroll information for the entirecompany. You want to view values for each department on a separate page.
After you create page layers, a caption appears in the header to indicate the contents of each page. Youcan navigate between the different pages using links below the report.
Creating page layers is similar to filtering using context. However, with context filters, values are filteredaccording to the member you add to the Context filter area. With page layers, the report is split into aseparate page for each child of the member you add to the Page layers area.
To create more complex page layers in your reports, such as a report book with title and end pages,create page sets.
Procedure
1. In the source tree, select or search for one or more items on which to filter.2. Drag the item into the Page layers section of the overview area.
The crosstab shows the results for the children of the selected item on separate pages, and a listappears under Page layers.
Tip: To navigate between pages, click Page down and Page up below the report.3. To replace the page breaks with items from the same dimension, select an item from the list. To delete
the page breaks, from the list, click Delete. To delete all the page breaks, right-click the Page layersarea and click Delete All.
Add a bookmarkAdd a bookmark so that users can quickly move from one part of a report to another. For example, a listreport contains many rows of data. You add bookmarks so that users can move to specific rows.
You can also drill through to another report.
If you want to use page numbers to move from one part of a report to another, you can also create a tableof contents.
Bookmarks work for reports produced in HTML format or PDF. In HTML format, they work best whenviewing saved report outputs, as the entire report appears in a single HTML page. When reports are runinteractively, more than one HTML page may be generated, and a bookmark works only if the target existsin the page currently being viewed.
If you run a saved report using a URL, and you specify a bookmark within the URL, you always go to thefirst page of the report. The bookmark defined in the URL is not honored. For more information aboutusing URLs to run reports, see the Administration and Security Guide.
Tip: You can reduce the number of HTML pages generated when a report is run interactively by specifyinga value for the Rows per page property for a data container in the report.
Tip: The Briefing Book sample report in the GO Sales (analysis) package includes bookmarks.
Procedure
1. Click the Toolbox icon , drag a Bookmark object to the report.2. Click the bookmark and, in the Properties pane, set the Source type property to a source type.
340 IBM Cognos Analytics - Reporting Version 11.0 : User Guide

Source type Description
Text Creates a static bookmark using a text value.
For example, a list has sections and you wantusers to jump from each section to the top of thereport.
Report expression Creates a dynamic bookmark whose values arederived from an expression that you define.
Data item value Creates a dynamic bookmark that has data aspossible values. This is useful for creating acontext-based bookmark.
For example, a list has sections and you wantusers to jump from the top of the report to aspecific section.
Note: This source type appears only if thebookmark is inserted next to a data item.
Data item label Creates a bookmark that has the label of a dataitem as its value. Use this source type to jump tothe first occurrence of a data item label.
For example, a list is divided into sections usingProduct line. You want users to jump to the firstproduct line section that appears in the list ratherthan to a specific section, such as CampingEquipment.
Note: This source type appears only if thebookmark is inserted next to a data item.
Member caption In a crosstab, creates a dynamic bookmark thatuses member captions as possible values.
Cell value In a crosstab, creates a dynamic bookmark thatuses cell values as possible values.
3. Set the property that appears under the source type you chose to the bookmark value.
For example, if the source type is Data item value, set the Data item value property to the data item.
4. Click the object that will jump to the bookmark, from the report object toolbar, click the More icon ,and then click Drill-Through Definitions.
For example, click a data item, image, chart, or text item.
Tip: The object can exist in a different report, so you can jump from one report to another.
5. Click the New Drill-Through Definition icon .6. Click the Bookmark tab.7. Click Source type and click one of the source types described in step 3.
Click the source type to use to produce the value needed to jump to the bookmark. For example, clickData item value if you want the value to come from a data item such as Product line.
8. If you clicked one of the following source types, specify the value to use to jump to the bookmark.
• For Text, click the ellipsis button next to Text and type a text value.
Chapter 19. Working with multiple pages 341

• For Data item value or Data item label, in the Data item list, choose a data item.• For Report expression, click the ellipsis button next to Report expression and define the
expression.
Create a table of contentsYou can create a table of contents that appears in the rendered output of your report. A table of contentsis useful for reports that include sectioned items, grouped items, or multiple pages in the layout. Thereport output indicates page numbers and allows for easy navigation.
You can include multiple tables of contents in your report, which are useful if your report containsgrouped lists. You can also add section numbers in front of entries in the table of contents by modifyingthe heading level property.
Table of contents entries are logical markers placed anywhere in a report. For example, you can placeentries at the top of a page or in a list group header to mark each grouped data value. Although table ofcontents entries are visible in IBM Cognos Analytics - Reporting, they cannot be seen when a report isrun.
A table of contents works only for reports produced in PDF or non-interactive HTML format. In HTMLformat, they work best when viewing saved report outputs, as the entire report appears in a single HTMLpage. When reports are run interactively, more than one HTML page may be generated, and a table ofcontents works only if the target exists in the page currently being viewed.
Tip: You can reduce the number of HTML pages generated when a report is run interactively by specifyinga value for the Rows per page property for a data container in the report.
If you want to quickly move from one part of a report to another without using page numbers, you can addbookmarks.
Tip: The Briefing Book sample report in the GO Sales (analysis) package includes a table of contents.
Before you begin
You must first create a table of contents before adding entries in the report. All entries must be insertedafter the table of contents in the report layout.
Procedure
1. Click the Toolbox icon , drag the Table of contents object to the new location, which can beanywhere in the report.
A table of contents placeholder appears.2. Drag the Table of contents entry object to the location of your first table of contents marker.
The new entry appears in the table of contents.3. Double-click the Double-click to edit text box of the new marker.4. In the Text box, type the text to appear in the table of contents and click OK.5. To edit the heading level of a table of contents entry, click the entry and, in the Properties pane, set
the Heading level property to the level.
The heading level is used to insert section numbers in front of entries in the table of contents usinglayout calculations.
6. When you finish creating the table of contents, run the report. By clicking the arrow to the right of therun report button, you can specify whether to run the report as HTML or PDF.
342 IBM Cognos Analytics - Reporting Version 11.0 : User Guide

Insert page numbers in a reportYou can insert page numbers in a report and specify the number style to use.
You can select a predefined page numbering scheme or create a custom scheme. You can easily insertpage numbers using the Page number object.
You can also manually create an expression to insert page numbers by inserting a layout calculation andusing the different page report functions in the expression editor.
Procedure
1. Click the Toolbox icon , drag Page number to the report.
Tip: When you create a new report using one of the existing report layouts, Page number is alreadyinserted in the page footer.
2. Double-click the page number symbol and choose the style to use.
The first three choices apply only to vertical page numbers. The remaining choices specify how verticaland horizontal page values appear.
Note: The 1 of 3 number style works only for reports produced in PDF or non-interactive HTML format.In HTML format, the 1 of 3 number style works when viewing saved report outputs, as the entire reportappears in a single HTML page.
3. If you want to customize the choice that you made in the previous step, click the edit button ,make your changes, and click OK.
A custom number style is created. If you later choose a different number style, the custom style isremoved from the list.
Tip: In the Custom number style dialog box, when you pause the pointer over a box, a tooltipdescribes how that box affects page numbers. For example, the Separator box contains the text, suchas a hyphen, that separates page values for both vertical and horizontal pages.
Control page breaks and page numberingYou can control page breaks and page numbering in a list, crosstab, table, or report page by choosing anyof these options.
The options that are available depend on which object you have selected. All the options for all theobjects are described in the following table.
Option Description
Keep with header Keeps all headers on the same page with thenumber of detail rows specified.
Keep with footer Keeps all footers on the same page with thenumber of detail rows specified.
Keep with previous Keeps the object with the specified number ofpreceding objects on the same page, if spacepermits.
Keep with next Keeps the object with the specified number ofsubsequent objects on the same page, if spacepermits.
Chapter 19. Working with multiple pages 343

Option Description
Reset page count Resets the page count after a page break to thevalue specified.
Reset page number Resets the page number after a page break to thevalue specified.
Repeat every page If the report renders multiple pages, this object isrepeated on every page.
Allow contents to break across pages Allows contents to break across pages. In lists andcrosstabs, controls whether a cell is broken acrosspages, which is useful when there is a lot of text.
Allow horizontal pagination In PDF output, allows the columns of a list orcrosstab to break across horizontal pages if theydo not fit on a single page.
Tip: In lists, you can select the Repeat every pageoption for list columns that show on everyhorizontal page.
If the Allow horizontal pagination option is notselected, the size of the list or crosstab is scaleddown when necessary so that it fits on a singlepage.
Tip: The Horizontal Pagination sample report in theGO Sales (analysis) package includes horizontalpagination.
If your report includes nested data frames such asa list within a list, horizontal pagination issupported on either the parent or child frame, butnot both. If horizontal pagination is enabled onboth the parent and child frame, it will be ignoredon the child frame when the report runs. Werecommend that you do not enable horizontalpagination on both the parent and child frames.Horizontal pagination is not supported for datacontainers, such as a list or crosstab, that arenested in repeater tables.
You can also specify page number options that usecompound numbering schemes. For example, youcan use the numbering scheme 1-1, 1-2, 2-1, 2-2,and so on. For more information, see “Insert pagenumbers in a report” on page 343.
344 IBM Cognos Analytics - Reporting Version 11.0 : User Guide
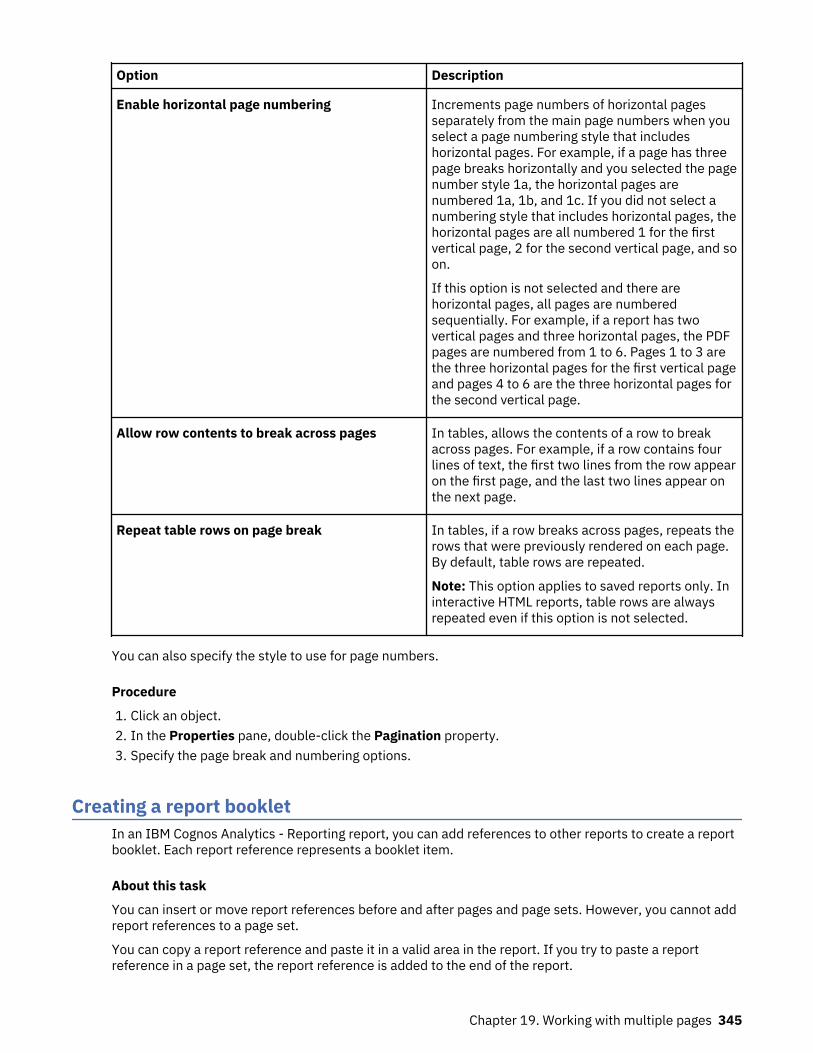
Option Description
Enable horizontal page numbering Increments page numbers of horizontal pagesseparately from the main page numbers when youselect a page numbering style that includeshorizontal pages. For example, if a page has threepage breaks horizontally and you selected the pagenumber style 1a, the horizontal pages arenumbered 1a, 1b, and 1c. If you did not select anumbering style that includes horizontal pages, thehorizontal pages are all numbered 1 for the firstvertical page, 2 for the second vertical page, and soon.
If this option is not selected and there arehorizontal pages, all pages are numberedsequentially. For example, if a report has twovertical pages and three horizontal pages, the PDFpages are numbered from 1 to 6. Pages 1 to 3 arethe three horizontal pages for the first vertical pageand pages 4 to 6 are the three horizontal pages forthe second vertical page.
Allow row contents to break across pages In tables, allows the contents of a row to breakacross pages. For example, if a row contains fourlines of text, the first two lines from the row appearon the first page, and the last two lines appear onthe next page.
Repeat table rows on page break In tables, if a row breaks across pages, repeats therows that were previously rendered on each page.By default, table rows are repeated.
Note: This option applies to saved reports only. Ininteractive HTML reports, table rows are alwaysrepeated even if this option is not selected.
You can also specify the style to use for page numbers.
Procedure
1. Click an object.2. In the Properties pane, double-click the Pagination property.3. Specify the page break and numbering options.
Creating a report bookletIn an IBM Cognos Analytics - Reporting report, you can add references to other reports to create a reportbooklet. Each report reference represents a booklet item.
About this task
You can insert or move report references before and after pages and page sets. However, you cannot addreport references to a page set.
You can copy a report reference and paste it in a valid area in the report. If you try to paste a reportreference in a page set, the report reference is added to the end of the report.
Chapter 19. Working with multiple pages 345

You can create a table of contents entry for a report reference. When the table of contents is generated,by default, the report name is used for the table of contents entry. You can edit the entry by selecting it inthe table of contents. If the report name is changed, you must manually update the table of contentsentry. If you change the order of pages in the report, the table of contents is automatically updated whenit is generated.
You cannot add references to other reports if you set the option to show report pages as tabs in HTMLoutput (Show properties > View pages as tabs).
Procedure
1. Click the Pages icon and click Report pages.
2. Click the Toolbox icon , drag Report reference to the Report pages pane.The Choose report window opens.
3. Locate the report that you want to add as a report reference and double-click it.
Tip: If you want to change the report reference, from the Properties pane, double-click theReferenced report property and choose a different report.
4. Optional: Create a table of contents entry for the booklet item by modifying properties in theProperties pane, in the Table of contents group.a) Set the Table of contents entry property to Yes.b) To roll up table of content entries for the booklet item into the report booklet, set the Roll up table
of contents property to Yes.c) Specify the starting heading level for the booklet item by typing a value in the Start heading level
property.For example, if you specify 2, all table of content entries for the booklet item have section numbersthat start at 2.
5. To render prompt pages that exist in the booklet item when the report is run, set the Show promptpages property to Yes.
6. Specify how to handle saved parameter values that come from the booklet item when the report is runby clicking one of the options in the Saved parameter values property.
Parameter values include signon, validation, and prompt information, and they are saved on the IBMCognos server.
• If you do not want to use saved parameter values from the booklet item, select Ignore.• If you want to use saved parameter values from the booklet item, select Merge.
When Merge is selected, parameter values that come from the booklet item are merged withparameter values that come from the report. If the same value exists for both the booklet item andthe report, the booklet item value is ignored.
Producing tabbed reportsWhen you produce reports in HTML format, you can show each report page as a tab.
About this task
Report page names are used to name each tab in the output.
The option to show pages as tabs is not supported when a report is used as a report reference in a reportbooklet. This option is also not supported when a report contains page sets. Page sets are created in areport when you add a page set object, page layers, and page breaks.
In Excel output, each tab becomes a single sheet within the same workbook.
346 IBM Cognos Analytics - Reporting Version 11.0 : User Guide

Procedure
1. Click the Show properties icon , and go to the Report properties.2. Click the View pages as tabs menu and select the location where you want the tabs to appear in
browsers.
Chapter 19. Working with multiple pages 347

348 IBM Cognos Analytics - Reporting Version 11.0 : User Guide

Chapter 20. Managing existing reportsAfter you have created a report, you can make changes or enhancements, such as setting up the reportfor bursting.
Before you modify an existing report, ensure that you have the proper security permissions. For moreinformation, see the IBM Cognos Analytics Administration and Security Guide.
Copy a report to the clipboardYou can copy a report specification to the clipboard so you can open it from the clipboard later.
This process is different for the Microsoft Internet Explorer and Mozilla Firefox Web browsers because theclipboard works differently in each Web browser.
Copy a report to the clipboard in Internet ExplorerThis process is different for the Microsoft Internet Explorer and Mozilla Firefox Web browsers because theclipboard works differently in each Web browser.
Procedure
Click the Pages icon or the Queries icon , right-click the Report icon , then click Copy Report toClipboard.
Copy a report to the clipboard in FirefoxThis process is different for the Microsoft Internet Explorer and Mozilla Firefox Web browsers because theclipboard works differently in each Web browser.
Procedure
1. Click the Pages icon or the Queries icon , right-click the Report icon , then click Copy Reportto Clipboard..
2. In the Copy Report to Clipboard dialog box, copy the entire report specification.3. Open a text editor and paste the report specification.4. Copy all the text from the text editor report specification.
Now the text is saved on your computer's clipboard.
Open a report from the ClipboardYou can open a report specification that was previously copied to the clipboard.
To copy a report to the clipboard, see “Copy a report to the clipboard” on page 349. This is useful forimporting an XML report specification from outside the IBM Cognos Analytics environment.
Although IBM Cognos Analytics - Reporting attempts to validate the report specification, it is yourresponsibility to ensure that it is correct. For more information, see the IBM Cognos Software DeveloperKit Developer Guide.

Procedure
Click the Pages icon or the Queries icon , right-click the Report icon , then click Open Reportfrom Clipboard.
Open a file from another studioYou can open reports, templates, or analyses that were created in IBM Cognos Query Studio or IBMCognos Analysis Studio in IBM Cognos Analytics - Reporting. All the capabilities of Reporting are availableto you so you can change formatting, layout, calculations, and queries.
Note: If you make and save changes to a Query Studio report or an Analysis Studio analysis in Reporting,the report or analysis can no longer be opened in Query Studio and Analysis Studio.
Procedure
1. To locate an item, from the Home page window, click Team content , My content, or to search for anitem by name, click Search and enter a name.
2. Double-click to open folders and then click the report, template, or analysis.
Analysis Studio query specificationIBM Cognos Analysis Studio defines each group of rows and columns as a set. When you import ananalysis into IBM Cognos Analytics - Reporting, the report will have one query that processes all the setsfound on the crosstab. Each set is defined by data items that segment and summarize the base setdefinition. To maintain reports converted from Cognos Analysis Studio, you must understand what each ofthese items represents and how they relate to each other.
Before you modify any of the data items in the Cognos Analysis Studio set definitions, we recommend thatyou fully understand each data item and its dependencies. Modifying the data items may causeunpredictable results and may slow the performance of your report.
The data items for a set specify the following:
• the set definition• set segments, including which members were excluded and hidden individually• filter rules for defining which members are to be retrieved• calculations for Subtotal (N items), More & Hidden, Subtotal (included), Subtotal (excluded), and the
total
For more information, see the IBM Cognos Analysis Studio User Guide.• which subtotals should appear• any user-defined calculations
The default measure identifies which measure is the default for the crosstab or chart. If no defaultmeasure is specified, the default measure may be empty.
Set Definitions
The following table shows the definitions and dependencies for the data items in the set definition.
350 IBM Cognos Analytics - Reporting Version 11.0 : User Guide
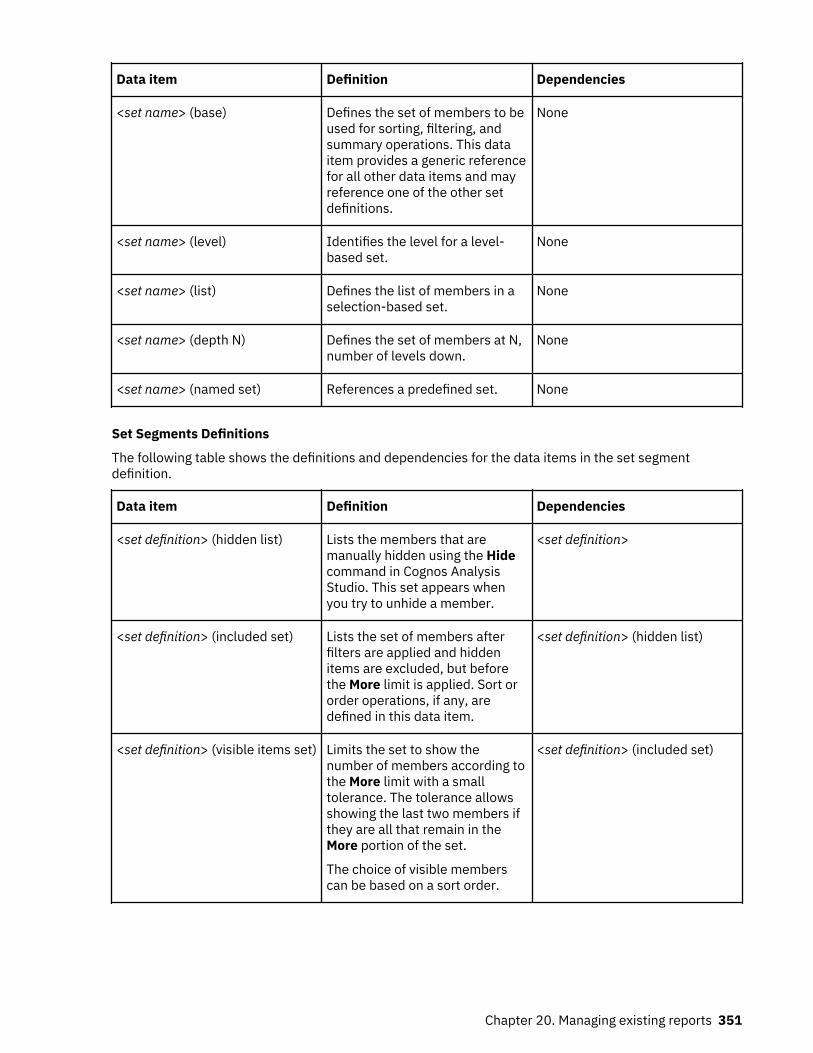
Data item Definition Dependencies
<set name> (base) Defines the set of members to beused for sorting, filtering, andsummary operations. This dataitem provides a generic referencefor all other data items and mayreference one of the other setdefinitions.
None
<set name> (level) Identifies the level for a level-based set.
None
<set name> (list) Defines the list of members in aselection-based set.
None
<set name> (depth N) Defines the set of members at N,number of levels down.
None
<set name> (named set) References a predefined set. None
Set Segments Definitions
The following table shows the definitions and dependencies for the data items in the set segmentdefinition.
Data item Definition Dependencies
<set definition> (hidden list) Lists the members that aremanually hidden using the Hidecommand in Cognos AnalysisStudio. This set appears whenyou try to unhide a member.
<set definition>
<set definition> (included set) Lists the set of members afterfilters are applied and hiddenitems are excluded, but beforethe More limit is applied. Sort ororder operations, if any, aredefined in this data item.
<set definition> (hidden list)
<set definition> (visible items set) Limits the set to show thenumber of members according tothe More limit with a smalltolerance. The tolerance allowsshowing the last two members ifthey are all that remain in theMore portion of the set.
The choice of visible memberscan be based on a sort order.
<set definition> (included set)
Chapter 20. Managing existing reports 351

Data item Definition Dependencies
<set definition> (excluded list) Identifies members that weremanually excluded from theanalysis. If no members weremanually excluded, theexpression defines an emptySet.This set appears when you try toremove a member from theExcluded items list in theProperties pane.
<set definition>
Filters
The following table shows the definitions and dependencies for the data items in the filter.
Data item Definition Dependencies
<set definition> (filter rules) Specifies the user-defined filterrules to reduce the set definitionusing operators such as greaterthan or less than based onmeasures, calculations, orattributes.
<set definition>
<set definition> (excluded filters) Removes members that weremanually excluded from theresults after applying the user-defined rules.
<set definition> (excluded list),<set definition> (filter rules)
<set definition> (filter topbottom)
Focuses on the members basedon top / bottom / first n where ncan be a count or a percentile.For more information about Top/Bottom filters, see the IBMCognos Analysis Studio UserGuide.
<set definition> (excluded filters)and totals for sets on theopposite axis
<set definition> (filter rules) Specifies the user-defined filterrules to reduce the set definitionusing operators such as greaterthan or less than based onmeasures, calculations, orattributes.
<set definition>
Subtotals and Related Conditions
The following table shows the definitions and dependencies for the data items in the subtotals andrelated conditions.
Data item Definition Dependencies
<set definition> (subtotal) Aggregates the visible items inthe set.
<set definition> (visible items set)
352 IBM Cognos Analytics - Reporting Version 11.0 : User Guide
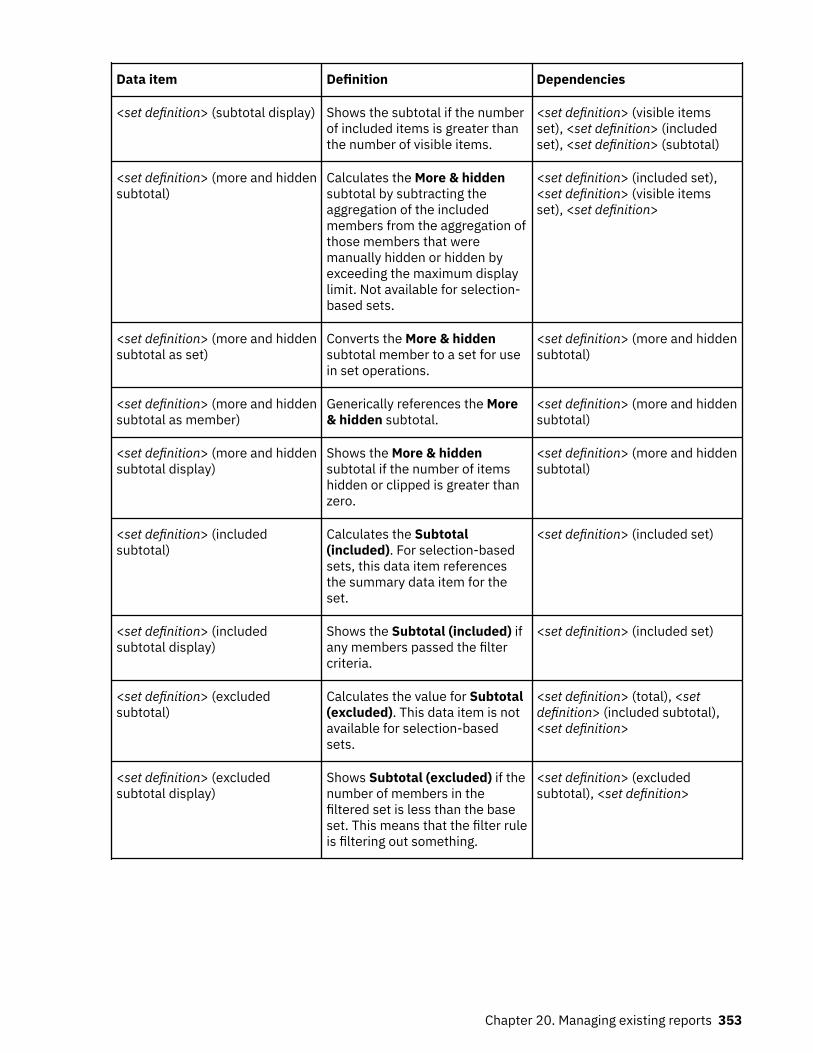
Data item Definition Dependencies
<set definition> (subtotal display) Shows the subtotal if the numberof included items is greater thanthe number of visible items.
<set definition> (visible itemsset), <set definition> (includedset), <set definition> (subtotal)
<set definition> (more and hiddensubtotal)
Calculates the More & hiddensubtotal by subtracting theaggregation of the includedmembers from the aggregation ofthose members that weremanually hidden or hidden byexceeding the maximum displaylimit. Not available for selection-based sets.
<set definition> (included set),<set definition> (visible itemsset), <set definition>
<set definition> (more and hiddensubtotal as set)
Converts the More & hiddensubtotal member to a set for usein set operations.
<set definition> (more and hiddensubtotal)
<set definition> (more and hiddensubtotal as member)
Generically references the More& hidden subtotal.
<set definition> (more and hiddensubtotal)
<set definition> (more and hiddensubtotal display)
Shows the More & hiddensubtotal if the number of itemshidden or clipped is greater thanzero.
<set definition> (more and hiddensubtotal)
<set definition> (includedsubtotal)
Calculates the Subtotal(included). For selection-basedsets, this data item referencesthe summary data item for theset.
<set definition> (included set)
<set definition> (includedsubtotal display)
Shows the Subtotal (included) ifany members passed the filtercriteria.
<set definition> (included set)
<set definition> (excludedsubtotal)
Calculates the value for Subtotal(excluded). This data item is notavailable for selection-basedsets.
<set definition> (total), <setdefinition> (included subtotal),<set definition>
<set definition> (excludedsubtotal display)
Shows Subtotal (excluded) if thenumber of members in thefiltered set is less than the baseset. This means that the filter ruleis filtering out something.
<set definition> (excludedsubtotal), <set definition>
Chapter 20. Managing existing reports 353
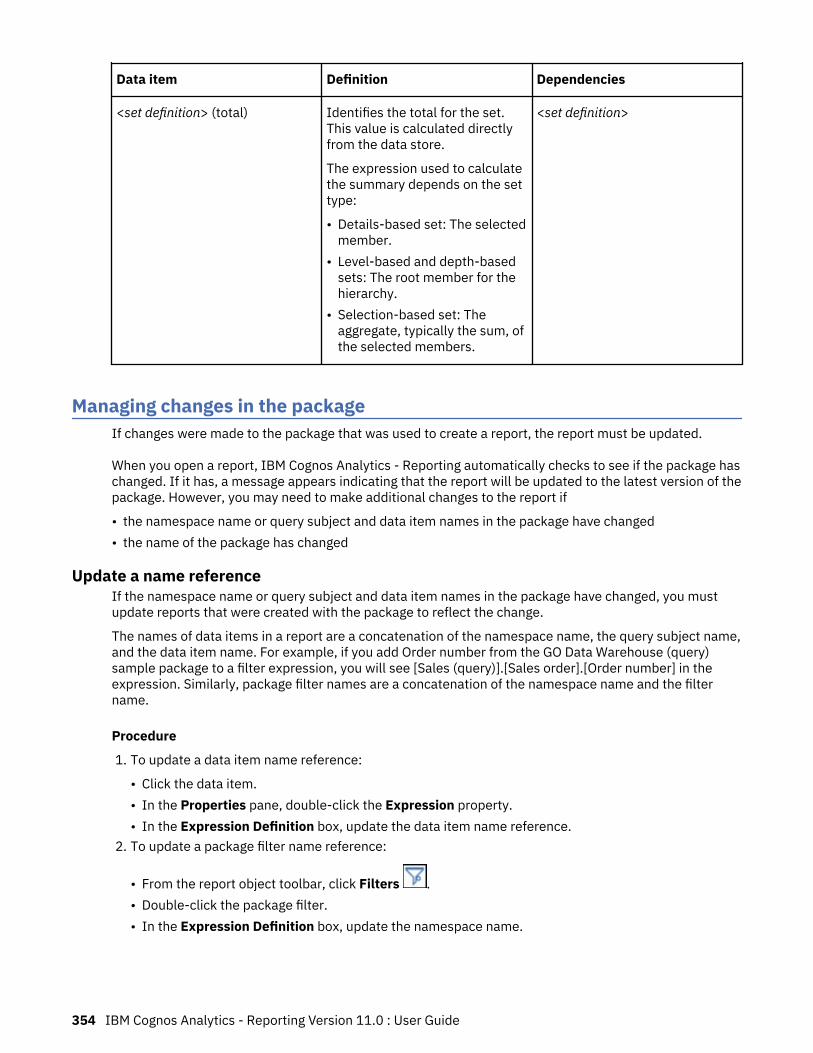
Data item Definition Dependencies
<set definition> (total) Identifies the total for the set.This value is calculated directlyfrom the data store.
The expression used to calculatethe summary depends on the settype:
• Details-based set: The selectedmember.
• Level-based and depth-basedsets: The root member for thehierarchy.
• Selection-based set: Theaggregate, typically the sum, ofthe selected members.
<set definition>
Managing changes in the packageIf changes were made to the package that was used to create a report, the report must be updated.
When you open a report, IBM Cognos Analytics - Reporting automatically checks to see if the package haschanged. If it has, a message appears indicating that the report will be updated to the latest version of thepackage. However, you may need to make additional changes to the report if
• the namespace name or query subject and data item names in the package have changed• the name of the package has changed
Update a name referenceIf the namespace name or query subject and data item names in the package have changed, you mustupdate reports that were created with the package to reflect the change.
The names of data items in a report are a concatenation of the namespace name, the query subject name,and the data item name. For example, if you add Order number from the GO Data Warehouse (query)sample package to a filter expression, you will see [Sales (query)].[Sales order].[Order number] in theexpression. Similarly, package filter names are a concatenation of the namespace name and the filtername.
Procedure
1. To update a data item name reference:
• Click the data item.• In the Properties pane, double-click the Expression property.• In the Expression Definition box, update the data item name reference.
2. To update a package filter name reference:
• From the report object toolbar, click Filters .• Double-click the package filter.• In the Expression Definition box, update the namespace name.
354 IBM Cognos Analytics - Reporting Version 11.0 : User Guide

Changing the packageIf the name of the package that was used to create a report has changed, you must change the packageconnection to update the report.
Procedure
1. Click the Data icon .
2. Click the Add report data icon .3. From the Open window, choose the new package.4. Click Open.
The new package is loaded and the report is validated. If errors are found, the Validation responsewindow appears, showing the elements that must be updated to reflect the package change.
5. Click Close.6. Make any required changes in the report to support the new package.
For example, you may need to link the data items in the report to the new package.
Tip: You can use Query explorer to make the changes.
Related tasksAdding dataAdd data to a report by loading packages or data modules in IBM Cognos Analytics - Reporting.
Chapter 20. Managing existing reports 355

356 IBM Cognos Analytics - Reporting Version 11.0 : User Guide

Appendix A. TroubleshootingThis appendix describes some common problems you may encounter.
For more solutions, see the troubleshooting topics on IBM Knowledge Center.
Problems Creating ReportsThe topics in this section document problems you may encounter when creating reports.
Division by Zero Operation Appears Differently in Lists and CrosstabsIf you have a list that accesses a relational data source, a calculation containing a division by zerooperation appears as a null value, such as an empty cell. In a crosstab, the division by zero operationappears as /0.
This happens when the query property Avoid division by zero is set to Yes, which is the default.
To have a consistent display of null values in lists and crosstabs, define an if-then-else statement in theexpression in the crosstab cell that changes the value /0 to the value null.
Application error appears when upgrading a reportWhen upgrading a report, the following error appears if the report contains data items in the page layoutthat are not in a data container:RSV-SRV-0040 An application error has occurred. Please contact your Administrator.
This error occurs when IBM Cognos Analytics cannot determine the query reference for a data item. Suchdata items are identified by a red circle with a white x icon.
To correct the error, drag the data items into a container. If the container is a list, we recommend that youdrag the data items into the list page header or footer, or the overall header or footer. If you want to seethe first row of the item on each page or in the overall report, drag the item to the list page header oroverall header. If you want to see the item's last row on each page or in the overall report, drag the itemto the list page footer or overall footer.
Tip: If a header or footer does not exist, create it.
Nested List Report Containing a Data Item That is Grouped More Than Once Does Not RunAfter Upgrade
When you upgrade a nested list report that contains a data item that is grouped in both lists, the reportdoes not run.
The following error occurs when the report is run against a dimensional data source and both lists areusing the same query. This error does not occur if the report is run against a relational data source.
OP-ERR-0199: The query is not supported. The dimensions on the edge are inconsistent. The dataItemsfrom dimension="[Product line]" must be adjacent.
For example, you have a list that contains the grouped items Product line and Product type and a nestedlist that contains the data items Year, Quarter, Product line, and Unit sale price. Year, Quarter, andProduct line are grouped items in the nested list.
To resolve the issue, delete the data item that is grouped in both lists from the inner list.
Procedure
1. Click anywhere in the report.
2. Click the Show properties icon , and In the Properties pane, click the Select ancestor icon andclick the List link that represents the inner list.
3. Double-click the Grouping & sorting property.4. In the Groups pane, select the data item that you want and press the Delete key.
Background Color in Template Does not AppearWhen creating a Query Studio template in IBM Cognos Analytics - Reporting, if you add a list object andchange its background color, the color change does not appear when you apply the template to a QueryStudio report.
To work around this issue, do one of the following:
• Edit the style sheet (CSS) classes for lists in Cognos Analytics - Reporting.• Do not add any objects to the page body when you are creating a Query Studio template.• Leave the page body blank.
Subtotals in Grouped ListsWhen using an IBM Cognos PowerCube that contains a ragged hierarchy, if you group on the first level inthe hierarchy, subtotals may appear in the wrong place or show wrong values.
To resolve the issue, group on the second level.
Chart Labels Overwrite One AnotherIn IBM Cognos Analytics - Reporting and Query Studio, if you define a chart and render it in HTML or PDFformat using the default sizes, the axis labels of the chart may overwrite each other.
To avoid this problem, make the chart wider or taller by modifying the height and width properties of thechart or enable the Allow skip property.
Chart Shows Only Every Second LabelYou create a report that includes a chart. The Allow skip property is set to false, but when you run thereport, labels are skipped.
This can occur if there is not enough room for all labels and the properties Allow 45° rotation, Allow 90°rotation, and Allow stagger are also set to false. IBM Cognos Analytics has no options for making thelabels fit, so it skips every second label.
The solution is to select either Allow 45° rotation, Allow 90° rotation, or Allow stagger.
Chart Gradient Backgrounds Appear Gray in Internet ExplorerIn IBM Cognos Analytics - Reporting, you can define a custom palette for a chart that includes a gradient.When the chart is rendered in HTML format in Microsoft Internet Explorer, the chart background appearsgray. This is an Internet Explorer issue.
To avoid this problem, select the chart and define the color white as the chart background.
For more information, see the Microsoft Knowledge Base article # 294714 at http://support.microsoft.com.
358 IBM Cognos Analytics - Reporting Version 11.0 : User Guide

Metadata Change in Oracle Essbase Not Reflected in Reports and in the StudiosWhen there is a metadata change on the Oracle Essbase server, the change is not immediately reflectedin the metadata tree in the studios. In addition, when a report is run, the report does not pick up therepublished changes.
To view the new structure, you must restart the IBM Cognos Content Manager server.
Relationships Not Maintained in a Report With Overlapping Set LevelsIn a report, the relationship between nested or parallel member sets at overlapping levels in the samedimension may not always be maintained.
For example, a named set in the data source that contains members from both a Year and Month memberis nested under Year, but is not properly grouped by year.
In another example, an error message such as this appears:
OP-ERR-0201 Values cannot be computed correctly in the presence of multiple hierarchies ([Product].[B1],[Product].[Product]) that each have a level based on the same attribute (Product).
This problem occurs in the following scenarios involving non-measure data items X and Y, which overlapin the same dimension:
• X and Y together as ungrouped report details• Y nested under X• Y appended as an attribute of a group based on X
When using named sets, or sets that cover more than one level of a hierarchy, do not use sets from thesame dimension in more than one place in the same report. They should appear on only one level of oneedge.
Summaries in Query Calculations Include Nulls with SAP BW Data SourcesWhen using an SAP BW data source in IBM Cognos Analytics - Reporting, null values in the database arereturned in the result set and the count summary function includes the empty cells in the followingscenarios:
• A query calculation includes an arithmetic calculation where one or more NULL operands and anaggregation is performed on the calculation.
• The result of a query calculation is a constant, such as current_time and current_date.
The count summary function should normally exclude null values.
To avoid this problem, for the first scenario, ensure that both operands do not return null values. Forexample, the original expression is [num1]+[num2]. Instead, use the following expression:
if ([num1] is null) then ( 0 ) else ([num1])
if ([num2] is null) then ( 0 ) else ([num2])
There is no workaround for the second scenario.
Appendix A. Troubleshooting 359

Creating Sections on Reports That Access SAP BW Data SourcesSAP BW data sources may have problems with sections in reports under different circumstances:
If a section in a report uses the lowest-level query item in a ragged hierarchy, such as the children of thenot assigned node, the following BAPI error may appear:
BAPI error occurred in function module BAPI_MDDATASET_SELECT_DATA. Value <valueName> forcharacteristic <cubeName> unknown
Lowest-level Query Item in a Ragged Hierarchy
The solution is to remove the section from the lowest-level query item.
Several Multicubes with SAP Variables
The solution is to use one SAP multicube when creating sections in reports.
Related conceptsTips for working with ragged or unbalanced hierarchies
Error Characters (--) Appear in ReportsWhen you run a report, you see two dash (--) characters in your report instead of values.
These characters may appear if you use an OLAP data sources other than PowerCube and Microsoft SQLServer 2005 Analysis Services (SSAS), and you apply aggregation to calculations and measures that userollups other than Sum (Total), Maximum, Minimum, First, Last, and Count.
All other types of rollup either fail or return error cells, which typically display as two dash characters (--).
This problem occurs in, but is not limited to, the following:
• footers• aggregate function• summary filters and detail filters that use a summary• detail, summary, and context filters that select more than one member of a hierarchy that is used
elsewhere on the report
If you are working with a SSAS 2005 data source, these characters may also appear in summary cells ifyou use an OR filter in the summary. To avoid this problem, do not use OR filters in summaries.
Columns, Rows, or Data Disappear With SSAS 2005 CubesMicrosoft SQL Server 2005 Analysis Services (SSAS) has a feature called AutoExists that removes tuplesthat have no facts at the intersection of two hierarchies of the same dimension.
Columns, rows, or data can disappear if you set the default member of a hierarchy to a member that doesnot exist with every other member in the dimension. To avoid this problem, change the default memberthat caused the disappearance to a member that exists with all other members in the dimension.
Columns, rows, or data can also disappear if members are specified that result in one or more non-existent tuples. There is currently no workaround for this scenario. For more information, see MicrosoftKnowledge Base article #944527 at http://support.microsoft.com.
You may also encounter unexpected results if the default member of a hierarchy is a member that doesn'talso exist in all other hierarchies in the dimension, and if you query members from different hierarchies inthe same dimension.
For example a crosstab includes the following (using the Adventure Works cube):
• Rows: Generate([Adventure_Works].[Account].[Accounts],set([Balance Sheet],[Units])) nested with
360 IBM Cognos Analytics - Reporting Version 11.0 : User Guide
children([Adventure_Works].[Department].[Departments]->:[YK].[[Department]].[Departments]].&[1]]])• Column: [Adventure_Works].[Account].[Account Number].[Account Number]• Measure: [Adventure_Works].[Measures].[Amount]
You run the report and notice that the query renders with some blanks cells. You then apply the simpledetail filter [Amount]>1 and run the report. Only row labels are displayed and all data and columns aremissing.
In the Adventure Works cube, the [Account].[Accounts] attribute has a default member set to [NetIncome]. When evaluating the GENERATE set expression, SSAS looks in the entire cube space and looksat all coordinates for the [Account] dimension. These coordinates include both [Account][AccountType].&[] and [Account].[Accounts].[Net Income]. Because these two coordinates don't exist within thesame hierarchy, SSAS returns an empty set.
To avoid this problem the SSAS administrator must set the default member in the cube to a member thatexists in all other hierarchies.
Function Unreliable with SetsIf you create an expression that uses the descendants function with sets, you may encounterunpredictable results. Some expected members may be missing or may have blank captions or labels.
This problem occurs if the descendants function uses a set as its first parameter instead of a singlemember and if the descendants function is nested under another data item from the same hierarchy.
To avoid this problem, replace the first parameter in the descendants function with the functioncurrentmember(H), where H is the hierarchy of the desired set and under which the expression isnested. For example, use descendants(currentmember(H).
Searching for values might return unexpected resultsIn the expression editor, when searching for values for a data item, the results you obtain might containunexpected results if the data item is not a string data type. Because you can edit the expression for adata item, IBM Cognos Analytics cannot determine with certainty what the data type is.
Therefore, IBM Cognos Analytics guesses the data type of the data item by looking at its aggregate androllup aggregate set.
Related tasksBrowse or Search the Values of a Data Item
Report Differences Between TM1 Executive Viewer and IBM Cognos Analytics with TM1Data Sources
When using an IBM Cognos TM1 data source, comparable reports created in IBM Cognos Analytics and inTM1 Executive Viewer may contain different cell values. This occurs because the TM1 Executive Viewerproduct uses an algorithm for selecting default members for non-projected dimensions that differsslightly from traditional OLAP clients.
To avoid this problem, when filtering your reports in IBM Cognos Analytics, use context filters that matchthe default selections shown in the Executive Viewer user interface. This ensures that the cell values inIBM Cognos Analytics match the values in Executive Viewer.
Order of Metadata Tree Differs for TM1 Data SourcesWhen using a an IBM Cognos TM1 data source, the order of members in the metadata tree of the Sourcetab in IBM Cognos Analytics may differ from the order shown in TM1 Architect.
Appendix A. Troubleshooting 361

By default, TM1 Architect renders members of hierarchies using a slightly different algorithm than doesIBM Cognos Analytics. IBM Cognos Analytics automatically renders member metadata from TM1 datasources in hierarchical order.
From within TM1 Architect, if you want to see how IBM Cognos Analytics will render a hierarchy, click theHierarchy Sort button.
MSR-PD-0012 error when importing external dataWhen you try to import an external data file, you receive an MSR-PD-0012 error.
MSR-PD-0012: Unable to upload the specified external data file. It exceeds the permitted file size of"0(KB)", as specified by your system administrator.
This error occurs when the size of the file you are trying to import is greater than the value specified forthe Maximum external data file size (KB) governor in the Framework Manager model.
To resolve the issue, the modeler must update the governor, save the model, and republish the package.
MSR-PD-0013 error when importing external dataWhen you try to import an external data file, you receive an MSR-PD-0013 error.
MSR-PD-0013: Unable to upload the specified external data file. It exceeds the permitted maximumnumber of rows "0", as specified by your system administrator.
This error occurs when the number of lines in the file you are trying to import is greater than the valuespecified for the Maximum external data row count governor in the Framework Manager model.
To resolve the issue, the modeler must update the governor, save the model, and republish the package.
Problems Calculating DataThe topics in this section document problems you may encounter when calculating or summarizing data.
Unexpected Summary Values in Nested SetsIf a report contains nested sets, summaries other than the inner set summaries may contain unexpectedvalues. For example, you insert a summary in a crosstab that contains a set with years in the rows.
Figure 46. Example of revenue numbers for the years 2012 and 2013
You then nest a product line set within years.
Figure 47. Example of revenue numbers for the listed products for the years 2012 and 2013
362 IBM Cognos Analytics - Reporting Version 11.0 : User Guide

Notice that the summary value does not change to represent the total of the new values. This occursbecause the within set aggregation used with dimensional packages does not take into account sets thatare nested below the set that is summarized.
To show the correct summary values, if the inner and outer sets do not belong to the same dimension,you can nest a copy of the inner summary item under the outer summary item, as follows.
Figure 48. Example of the combined aggregate set for the years 2012 and 2013
Null Results for Calculations Using SAP BW Data SourcesWhen using a SAP BW data source, the expression you use in your calculation is evaluated as a null valueif your expression contains a null item. For example, in the calculation some_expression = result, theresult is null if a row or column that the expression references includes a null value.
To avoid obtaining null values as the result of your calculations, suppress null values before you createthe calculation.
Incorrect Results with IBM Cognos PowerCubes and Time MeasuresIf a report uses an IBM Cognos PowerCube data source and a combination of data items, you willencounter incorrect results.
The following combination of data items in a report that uses an IBM Cognos PowerCube data source willgive incorrect results.
• a measure with a Time State Rollup set to Average or Weighted Average• an aggregate ( members from time dimension ) expression• an intersection with a member in a relative time hierarchy
To avoid incorrect results, do not use this combination in your reports.
Incorrect Results in Summaries When Using OLAP Data SourcesWhen using an OLAP data source, summaries that use for clauses give incorrect results.
This occurs because for clauses require access to the detail rows of the fact table. OLAP data sources donot have detail rows.
For example, this report uses a dimensionally-modeled relational (DMR) data source and contains thefollowing summaries:
• mx: maximum ([Revenue] for [Year (ship date)])• mx2: maximum (Aggregate([Revenue]) for [Year (ship date)])
Appendix A. Troubleshooting 363

Figure 49. Example list report that uses a dimensionally-modeled relational data source and revenue forfour years
Notice that the mx and mx2 values are different, where mx2 is based on visible data, but mx is not. Thisresult is correct.
The following report uses an OLAP data source and contains the same summaries.
364 IBM Cognos Analytics - Reporting Version 11.0 : User Guide

Figure 50. Example list report that uses a dimensional data source and revenue for four years
In the example report, mx and mx2 values are now the same. Both summaries are based on visible data.The mx value is incorrect.
Incorrect results also appear for footer summaries.
To avoid this problem, when using OLAP data sources, ensure that the parameter that precedes the forclause is an aggregate function.
Problems Filtering DataThe topics in this section document problems you may encounter when filtering data.
Unexplained Discrepancies in Number CalculationsYou might find unexplained discrepancies in number calculations due to round-off errors.
For example:
• You run regression tests and find differences in numbers. They are different only because of therounding off of decimal places.
• You choose not display zeros in reports, but the zeros are displayed anyway because there are decimalplaces (0.00000000000000426, for example) that are rounded off to zero in reports.
Round-off problems are not specific to IBM Cognos software. They can occur in any environment whererounding off occurs.
Appendix A. Troubleshooting 365
Binary Round-Off Errors
Discrepancies in calculations might occur due to binary round-off errors. For example, if the number 1.1 isrepresented as a binary floating point number and your report format includes a large number of decimalplaces, the number 1.1 might actually be something like 1.09999999999997.
If your report is formatted to use only one decimal point, decimal round-off takes place, compensating forthe binary round-off. So the number appears to be 1.1 when it is really 1.09999999999997. When thenumber is used in calculations, you might get round-off errors. For example, Microsoft Excel calculationsuse binary numbers (without rounding off decimal places) but formatting in reports shows rounded offdecimal places, which can create small discrepancies.
Division Round-Off Errors
Calculations that involve division typically incur round-off errors, regardless of how the numbers arerepresented. Examples of such calculations are Average and Percent of Base.
Design Guidelines to Minimize Round-Off Effect
The best solution is to change the underlying database schema or cube model but that may not always bepossible. Another solution is to minimize the round-off effect by following these guidelines whenauthoring reports and creating models in IBM Cognos Framework Manager and external OLAP cubes:
• Avoid storing data in floating point format whenever possible. This is especially true for currency values,which should be stored as either fixed-point decimals or as integers with a scale value such as 2.
For example, in a cube, the Revenue for Camping Equipment in 2012 is $20,471,328.88. If revenuedetails are stored as floating point numbers, round-off errors might occur when revenue is calculated.
The round up errors might have slight differences, depending on the order of calculation. If revenue forProducts is calculated first and revenue for Time is calculated second, you might get a different round-off error than if Time is calculated first and Products is calculated second.
Total revenue might be calculated as the number shown in the previous example. Or there might beslight discrepancies, for example, $20,471,328.8800001 as opposed to $20,471,328.88. The internalnumber might be slightly different than what is displayed. The number might even be for different runsof the same report, depending on the order that the OLAP engine uses for calculation.
• In reports, avoid division whenever possible. When division is unavoidable, try to do it as late aspossible in the calculation process. For example, instead of Total([Revenue]/1000), useTotal([Revenue])/1000.
• When doing comparisons, add a margin to allow for round-off. For example, you may want [Profit %] tobe a fractional value formatted as a percentage with no decimals. However, the filter [Profit %]<>0 (or[Profit %] NOT BETWEEN 0 and 0) rejects zero values and may still return values that appear to be 0%after formatting.
To avoid this, filter in one of these two ways:
– [Profit %] NOT BETWEEN -0.005 and 0.005– ([Profit %] <- 0.005) OR ([Profit %]> 0.005)
Note that 0.005 is equivalent to 0.5%, which displays as either 0% or 1%, depending on floating pointprecision losses.
In some cases, you may prefer control round-off errors by rounding values explicitly. For example,instead of [Profit %], use round([Profit %],2).
• Recalculate numbers every time instead of reusing calculations that might contain rounded offdecimals.
There might be additional considerations for Microsoft Analysis Services 2005/2008, especially whencomparing report results from different runs (as happens in Lifecycle Manager). Refer to Microsoftdocumentation for more information.
366 IBM Cognos Analytics - Reporting Version 11.0 : User Guide

Error when filtering on a _make_timestamp columnYou cannot filter on a _make_timestamp column. If you do that, the following error messages appear:
UDA-SQL-0114 The cursor supplied to the operation "sqlOpenResult" is inactive
UDA-SQL-0206 The OLEDB driver returned the following value:HRESULT= DB_E_CANTCONVERTVALUE
RSV-SRV-0025 Unable to execute this request
The solution is to apply the filter after aggregation, and not before.
Problems Running ReportsThe topics in this section document problems you may encounter when viewing or running reports.
Report runs slowlyThe following is a list of questions that will help you to troubleshoot a slow report.
• Does your IBM Cognos environment conform with the supported environments?• Has the report always been slow or did it recently become slow?
If it recently became slow, can you identify an event that occurred just before the report began to runslowly? Events could include changes to configuration settings, changes to tuning settings, a recentupgrade where your previous settings have not been applied, an introduction of firewalls or proxies,changes to existing firewalls or proxies, changes to virus scans on temp directories, or temporary tablespace restrictions on the database. This event could have caused the change in report performance.
• Is the performance slow for all reports or just one report?
If all reports are slow, the issue may be due to your environment or database. If all reports from aspecific package are slow, the issue may due to the model design. If just one report is slow, the issuemay be due to a specific report element.
• How many queries does your report contain?
The number of queries on the report will proportionally affect the report execution time.• Does the report run slowly for everyone, or just for one user?
If the report runs slowly for just one user, the issue may be due to something in that user'senvironment, such as virus scanning, page file size or location settings, or their location on the network.
• Is the report burst or run often by many people?
If many people are running the same report at the same time, you may need to scale your environmentor consider using dispatcher routing rules to direct all requests for a specific package or group of usersto a specific server or server group. For more information, see the IBM Cognos Analytics Administrationand Security Guide.
• Do your queries require local processing?
The following report elements require local processing: crosstabs and charts, master relationships,unions or joins, multiple fact queries, bursting, and non-vendor specific functions. Local processingrequires the IBM Cognos server to compute operations on the result set returned by the database,which can impact the SQL execution time.
• Does your environment use a Custom Authentication Provider?
Using a Custom Authentication Provider could cause a memory leak if the code is not destroying objectscorrectly.
• Have you reviewed the logs in the install_location/logs directory and the audit logs?
They may help you identify the source of the problem. Monitoring your processes, such as the Java andthe bus processes could also identify excessive memory use.
Appendix A. Troubleshooting 367

• Is your environment tuned correctly?• Have you recently upgraded?
Ensure that any tuning settings that were applied to your previous installation are applied to the newenvironment. Ensure that your models have been verified, upgraded, and republished. Verify that theIBM Cognos Framework Manager governor that allows enhanced model portability at runtime is notenabled. Depending on your upgrade method, you may also need to open and save the reports againafter upgrading.
The following tips may help you improve report performance.
• Change the order in which items are queried from the database. For more information, see “Workingwith Relational Queries” on page 173 or “Working with Dimensional Queries” on page 213.
• Create sections without creating master detail relationships. For more information, see “Divide data intosections” on page 158.
• Share queries between lists and repeaters.
You can share an identical query between data containers that use it. To share a query, data containersmust be lists, repeaters, or repeater tables and must use the same grouping structure and list ofproperties. The data containers cannot be part of a master detail relationship. Sharing queries improvesperformance by minimizing the number of queries executed against the database.
To share a query, set the Share result set property for the data container to Yes.• Convert queries to SQL. For more information, see “Convert a Query to SQL” on page 181 for relational
reporting or “Convert a Query to SQL” on page 224 for dimensional reporting.• Avoid using functions with limited support, as indicated by the quality of service indicators. For more
information, see “Insert a Query Calculation” on page 184 for relational reporting or “Quality of ServiceIndicators” on page 388 for dimensional reporting.
• Be aware of the limitations of creating expressions with SAP BW data sources. For more information,see “Using Microsoft Excel Functions with SSAS 2005 Data Sources” on page 390.
• Use Select & Search prompts instead of value prompts if your list of prompts is long. For moreinformation, see “Build Your Own Prompt and Prompt Page” on page 239.
• Provide your own prompt values in a prompt to avoid accessing the database. For more information, see“Specify Prompt Values” on page 246.
• Suppress null cells using filters. For more information, see “Suppressing null cells by using filters” onpage 305.
• Set page breaks without creating master detail relationships. For more information, see “Page breaks,page sets, and page layers” on page 337.
• Do not modify IBM Cognos Analysis Studio set definitions. For more information, see “Analysis Studioquery specification” on page 350.
• Do not put filters on non-identifiers.• Avoid combining large hierarchy levels and sets in a drill-through report in a way that creates large
queries. For more information, see “Recommendation - Drilling Down in Very Large Data Sources” onpage 234.
• Use database functions when possible.• Use fixed width objects in PDF reports by setting their Size & overflow properties. For more
information, see “Set list properties” on page 37, “Set Crosstab Properties” on page 43, “Customizingchart properties” on page 70, or “Set Map Properties” on page 416.
For more information, search for Performance and tuning (http://www.ibm.com/developerworks/analytics/practices.html) documents that may help you improve your report performance.
368 IBM Cognos Analytics - Reporting Version 11.0 : User Guide
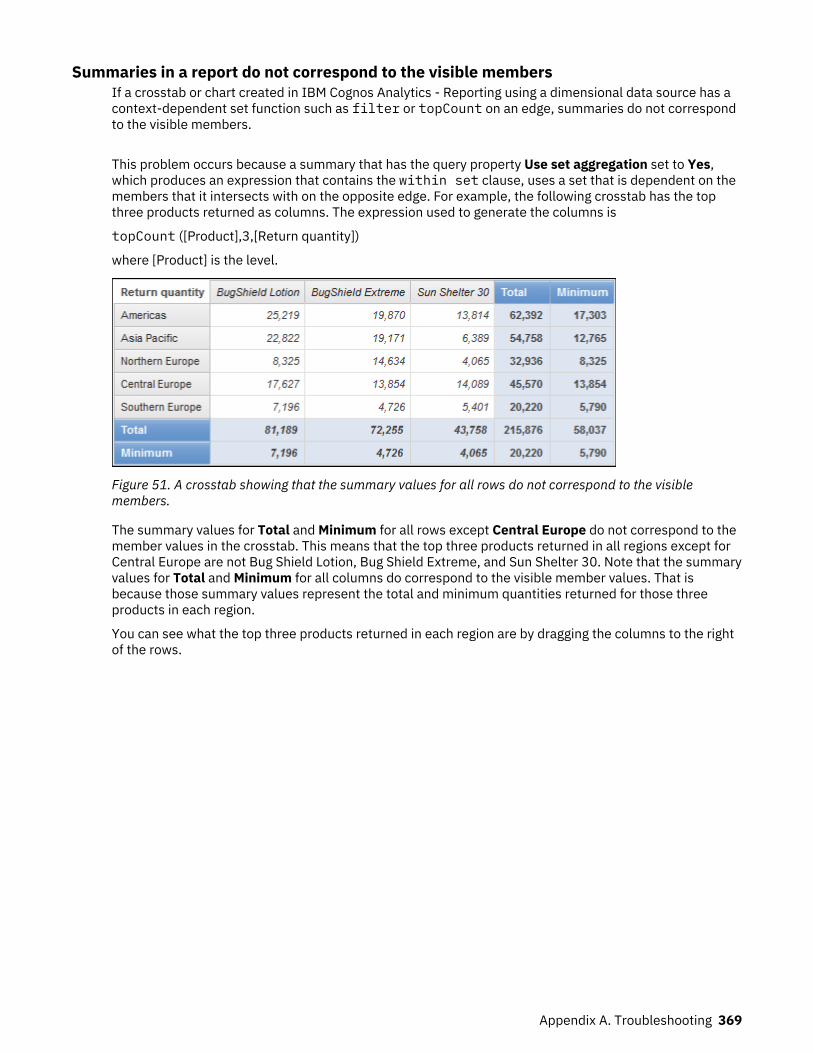
Summaries in a report do not correspond to the visible membersIf a crosstab or chart created in IBM Cognos Analytics - Reporting using a dimensional data source has acontext-dependent set function such as filter or topCount on an edge, summaries do not correspondto the visible members.
This problem occurs because a summary that has the query property Use set aggregation set to Yes,which produces an expression that contains the within set clause, uses a set that is dependent on themembers that it intersects with on the opposite edge. For example, the following crosstab has the topthree products returned as columns. The expression used to generate the columns is
topCount ([Product],3,[Return quantity])
where [Product] is the level.
Figure 51. A crosstab showing that the summary values for all rows do not correspond to the visiblemembers.
The summary values for Total and Minimum for all rows except Central Europe do not correspond to themember values in the crosstab. This means that the top three products returned in all regions except forCentral Europe are not Bug Shield Lotion, Bug Shield Extreme, and Sun Shelter 30. Note that the summaryvalues for Total and Minimum for all columns do correspond to the visible member values. That isbecause those summary values represent the total and minimum quantities returned for those threeproducts in each region.
You can see what the top three products returned in each region are by dragging the columns to the rightof the rows.
Appendix A. Troubleshooting 369
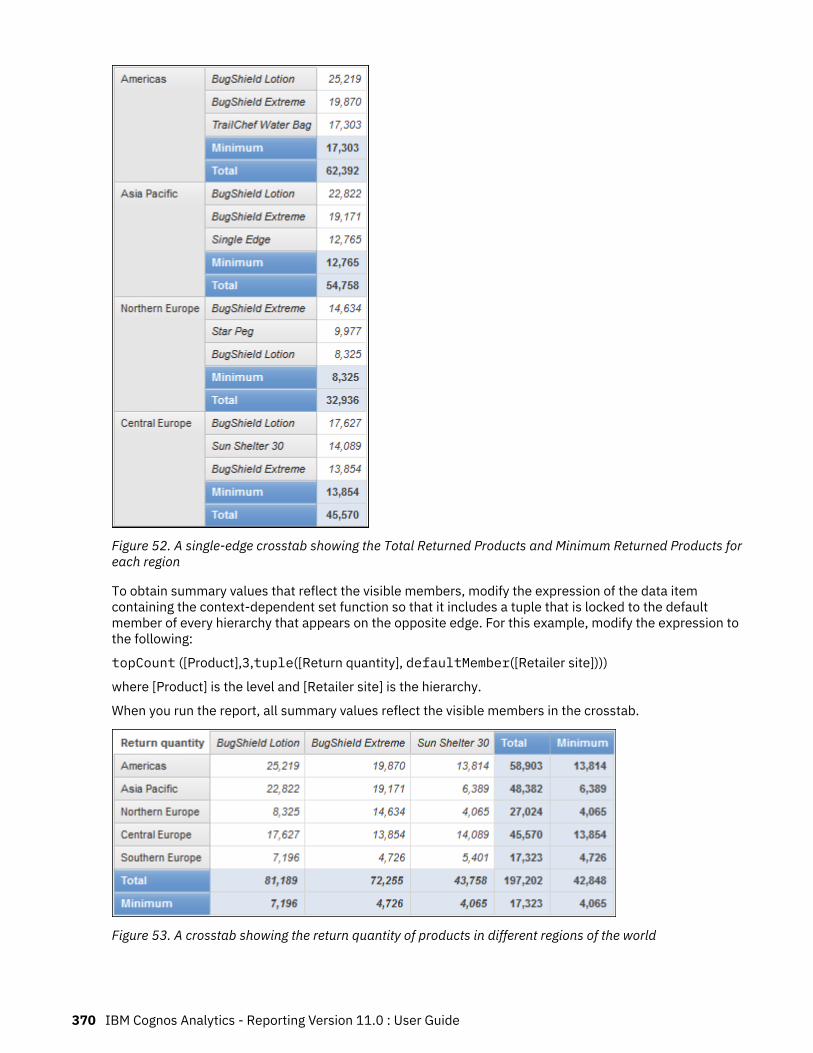
Figure 52. A single-edge crosstab showing the Total Returned Products and Minimum Returned Products foreach region
To obtain summary values that reflect the visible members, modify the expression of the data itemcontaining the context-dependent set function so that it includes a tuple that is locked to the defaultmember of every hierarchy that appears on the opposite edge. For this example, modify the expression tothe following:
topCount ([Product],3,tuple([Return quantity], defaultMember([Retailer site])))
where [Product] is the level and [Retailer site] is the hierarchy.
When you run the report, all summary values reflect the visible members in the crosstab.
Figure 53. A crosstab showing the return quantity of products in different regions of the world
370 IBM Cognos Analytics - Reporting Version 11.0 : User Guide
QE-DEF-0288 Cannot Find the Database in the Content StoreYou cannot retrieve data from the selected database when running a report.
The following error message appears:
QE-DEF-0288 Unable to find the database...
If this error does not occur when you are logged on as an administrator, then to solve the problem, ensurethat the user has permissions to the signon embedded. If this error always occurs, the data source hasnot been created. Create the data source with the name mentioned in the error message.
Parse Errors When Opening or Running an Upgraded ReportEarlier versions of IBM Cognos ReportNet and IBM Cognos Business Intelligence included thecast_Date function for reports that run on an Oracle database. This function does not exist for Oracle inIBM Cognos 8.1.2 MR1 and later versions. If a report that uses an Oracle database includes thecast_Date function, parse errors will be received when you try to open or run the report.
Overflow Error Occurs When a Value in a Crosstab Is More Than 19 CharactersIn a crosstab report, values support a maximum of 19 characters, including the decimal point. If a valueexceeds 19 digits, an overflow error occurs. By default, the decimal precision is set to 7 digits, whichrestricts the number of integers to 11 digits.
To use more than 11 integers, you must edit the qfs_config.xml file in the install_location\configurationdirectory. For more information, see the section about reducing decimal precision in the IBM CognosAnalytics Administration and Security Guide.
The ORA-00907 Error Appears When Running a ReportWhen using an Oracle 9.2 data source, under certain circumstances, multiple or nested join operationsmay fail and produce the following error.
ORA-00907: missing right parenthesis
A query that uses both a left outer join and an ON clause condition returns zero values instead of nullvalues.
A Report or Analysis Does Not Run Because of Missing ItemsYou attempt to run a report or analysis and a message indicates that one or more items are missing orchanged. Each missing item is listed by its MUN (member unique name). The MUN includes the completepath within the hierarchy for the item. When you place your cursor on an item in the Source tab, the MUNfor that item is displayed in a tooltip. This situation may occur if members have been removed from orchanged in the data source. It may also occur when you attempt to run a report that uses items to whichyou do not have access. For example, an administrator may create an analysis that includes items thatyou do not have the correct permission to access.
The solution is to find a suitable replacement in the Source tab, and drag it to the work area. The report oranalysis will then run.
Cannot View Burst ReportWhen you burst a report, each burst output is sent to the associated list of recipients.
If a list of recipients contains invalid entries, the following occurs:
• The burst output is not saved to IBM Cognos Content Manager.
Consequently, you cannot view the burst output.
Appendix A. Troubleshooting 371
• If you choose to send the output by email, only valid recipients will receive an email. Although theoutput is sent as an attachment if you select the Attach the report check box, no link is generated if youselect the Include a link to the report check box.
• The following error message appears in the run history for the report, where parameter 1 is the burstkey, parameter 2 is the list of recipients, and parameter 3 contains the error messages returned byContent Manager:
An error occurred while saving the output for the burst instance <param type="string" index="1"/> withthe recipients (<param type="string" index="2"/>). Here are the details: <param type="string"index="3"/>
Note: The list of recipients includes both the valid and invalid recipients.
For example, a report is set up to burst on Country or Region, and the recipients are managers. Runningthe report produces the following countries and regions and recipients:
• Canada: John, Mary• US: Peter, Frank• France: Danielle, Maryse
Frank is an invalid recipient. The burst outputs for Canada and France are saved to Content Manager, butnot the U.S. output. If you choose to send an e-mail to each recipient and you selected the Include a linkto the report check box, the e-mail to Peter will not contain a link to the output for US. The error messagethat is generated will contain Peter and Frank as values for parameter 2 with no indication as to which isinvalid.
Procedure
1. View the error message in the run history for the report.2. From the list of recipients, determine which recipients are invalid.
You may need to consult with your administrator to find out which recipients are invalid.3. Correct or remove the invalid recipients.
Correcting or removing invalid recipients will depend on how the list of recipients was defined, such asthrough a calculated field or a burst table.
4. Run the report again.
An upgraded report does not retain its original lookWhen you upgrade a report to IBM Cognos Analytics, a new style sheet is applied that changes the look ofthe report.
To preserve the formatting that was used in the original report, you can select a different style sheet. Thisretains the original look of the report and specifies that any new items added to the report, such as listcolumns or crosstab levels, have the original formatting applied to them.
Procedure
1. Open the report in IBM Cognos Analytics - Reporting.
2. Click the Pages icon or the Queries icon , and then click the Report icon .
3. Click the Show properties icon , and in the Properties pane, click the Report styles property andselect one of the available values.
For example, to use the IBM Cognos ReportNet style sheet, select 1.x styles.
Measure Format Disappears in SSAS 2005Microsoft SQL Server 2005 Analysis Services (SSAS) does not propagate formatting through calculations.IBM Cognos compensates for this whenever possible, but cannot guarantee to do so in all cases. As a
372 IBM Cognos Analytics - Reporting Version 11.0 : User Guide
result, if you are working with a Microsoft SSAS cube, any calculation (other than a non-count summary)that is based on or intersects with a formatted measure, such as a currency, may lose the measureformat. This may also happen if you use a detail filter or context filter (slicer).
For example, a crosstab includes members on one edge and a measure with formatting, such as acurrency symbol and decimal places, applied on the other edge. When you run the report, you see theformatting for each cell. However, if you add a detail filter, such as measure > 1 and run the report, all theformatting disappears.
Additionally, the fine details of the MDX generated by IBM Cognos Analytics can change from release torelease. As the SSAS behavior depends on the MDX generated, the loss of formatting in reports might notoccur in a future release.
To avoid this problem, specify explicit formatting for the affected row, column, or cell.
Drill-through Links are Not Active in the Safari BrowserWhen viewing a PDF report in the Macintosh Safari browser, you cannot open hyperlinks. This is becausethe Macintosh Safari browser does not have the necessary Adobe Acrobat plug-in.
To avoid this problem, use the HTML format when creating drill-through reports that may be viewed inSafari.
Data Does Not Appear in a Target Report or the Wrong Data AppearsIf no data appears when you drill through to a target report or if the wrong data appears, the problemmight be data source conformance. The business keys might be different or might be mismatched.
For example, the business key for Camping Equipment might be 100 in the data source for the sourcereport and 1 in the data source for the target report, in which case no data appears in the target report.Another example might be that the business key for Camping Equipment is 100 in the data source for thesource report but, in the data source for the target report, 100 is the business key for Golf Equipment, inwhich case the wrong data appears in the target report.
To solve the problem, ensure that business keys have the same value in both data sources. If there arecases where data does not appear to match, contact your database administrator or data modeler.
For more information about data source conformance, search for "conformed dimensions" and "businesskeys" in the IBM Cognos Transformer User Guide.
You might also want to see “Unexpected or Empty Results When Drilling Through” on page 378.
Related conceptsConformed dimensionsBusiness keys
A Running Total in Grouped Reports Gives Unexpected ResultsYou have a running total calculation in a grouped report that returns unexpected values.
Because tabulation of the running total calculation depends on the order in which the grouping isexecuted, you must ensure that the grouped totals are tabulated before applying the running total.
To ensure that the grouping is executed in correct order, define a running total calculation as afreestanding calculation outside the query subject in IBM Cognos Framework Manager, and ensure thatthe Regular Aggregate property is set to Automatic.
This may also be an issue with other running, moving, and ranking aggregations.
Appendix A. Troubleshooting 373

Recursive evaluation errorYou run a report and encounter the following error.
PCA-ERR-0057 Recursive evaluation has exceeded limit. Calculated member trace:COG_OQP_USR_Aggregate(Retailer Type): COG_OQP_INT_m2: COG_OQP_INT_m1:COG_OQP_USR_Aggregate(Retailer Type): COG_OQP_INT_m2: COG_OQP_INT_m1:COG_OQP_USR_Aggregate(Retailer Type): COG_OQP_INT_m2: COG_OQP_INT_m1:COG_OQP_USR_Aggregate(Retailer Type): COG_OQP_INT_m2: COG_OQP_INT_m1
You may encounter this error when two or more data items form a recursive evaluation. For example, inthis error, the calculation of Aggregate(Retailer Type) is dependent on a column expression while at thesame time the column expression is dependent on Aggregate(Retailer Type). Therefore, the cyclicrelationship cannot be resolved.
To avoid this problem, ensure that calculations do not have cyclic relationships.
Arithmetic Overflow Error When Running a Report in PDF FormatIf you use a Microsoft SQL Server 2005 data source and your report includes aggregations, you mayencounter the following error when you run your report in PDF format:
RQP-DEF-0177 An error occurred while performing operation 'sqlOpenResult' status='-28'. UDA-SQL-0114The cursor supplied to the operation "sqlOpenResult" is inactive. UDA-SQL-0564 [Microsoft OLE DBProvider for SQL Server] Arithmetic overflow error converting expression to data type int.(SQLSTATE=22003, SQLERRORCODE=8115)
This error occurs because the action is performed in the database, and the database data type is toosmall.
To avoid this problem, increase the size of the the database data type.
RQP-DEF-0177 An error occurred while performing operation 'sqlPrepareWithOptions'status='-69' UDA-SQL-0043 Error
You cannot run a report in IBM Cognos Analytics - Reporting or IBM Cognos Query Studio, and thefollowing error messages appear.
RQP-DEF-0177 An error occurred while performing operation 'sqlPrepareWithOptions' status='-69' UDA-SQL-0043 The underlying database detected an error during processing the SQL request.[NCR][ODBCTeradata Driver][Teradata Database] Partial string matching requires character operands
These error messages do not indicate an IBM Cognos Application Firewall problem.
There is a problem with your data source not converting numeric data items. Ask your administrator toconsult the topic Enable Conversion of Numeric Search Keys to Strings in Queries in the IBM CognosAnalytics Administration and Security Guide.
Problems with viewing saved Active Report output in Mozilla Firefox 8 or later versionsWhen you try to view saved Active Report output in Mozilla Firefox 8 or later, you receive errors. Theproblem also occurs when you try to insert a saved active report in a workspace in IBM CognosWorkspace.
No problems occur when you use an earlier version of Firefox. In Firefox 8 and above, you see thefollowing errors:
Error: ReferenceError: HTMLIsIndexElement is not defined
Error: TypeError: _IS1 is undefined
The problem occurs because HTMLISIndexElement was deprecated as of Firefox 8. To resolve theproblem, rerun the active report and create a new saved output version.
374 IBM Cognos Analytics - Reporting Version 11.0 : User Guide
Tip: If you must rerun many active reports, you can create a job to run multiple reports.
Problems with large SAP BW queriesWhen you are working with an SAP BW data source, if your report includes a data set greater than1,000,000 cells, you might encounter an XQE error.
XQE-CON-0007 XQE error encountered: XSB-ERR-0022 Execution of MDX failed: XSB-ERR-0038 SAPError executing BAPI BAPI_MDDATASET_SELECT_DATA:com.cognos.xqe.data.providers.olap.sbwodp.bapi.JBapiSAPException: RFC Error: MDX result containstoo many cells (more than 1 million).
To avoid this error, set the Processing property for the query to Limited Local. This option allows thereport to process locally.
Master Detail or Burst Reports with Charts or Crosstabs May Result in Denial of ServiceWhen running a master detail or burst report that includes a chart or crosstab, disk space exhaustion maycause the report or other requests to fail. A large set of burst keys or master rows may produce one ormore charts per detail, resulting in many master detail executions. This may cause the temp folder toaccumulate many gigabytes of temporary files containing data required for successful chart rendering.
To avoid this issue, we recommend that you test large master detail or burst reports that include charts orcrosstabs to determine the potential peak disk requirements for the report.
PCA-ERR-0087 error when you run a large reportYou run a large report and you receive a PCA-ERR-0087 error that indicates that the report exceeds themaximum number of tuples allowed.
PCA-ERR-0087 The "crossJoinSet" operator is not applicable. The limit on the number of tuples per edgehas been exceeded (<value>).
This error appears when there is an item in a query that has no relationship to the rest of the data or doesnot make sense in the query.
To resolve the problem, review the query for unrelated items. If an item is found, redesign the query orapply a filter on the item to reduce the number of results returned.
If you still receive the error, ask your administrator to modify the maximum number of tuples setting inIBM Cognos Analytics. The setting is an XML attribute named maxTuplesPerEdge. For more information,see the IBM Cognos Analytics Administration and Security Guide.
Differences in the appearance of charts that are run in different formats or on differentoperating systems
IBM Cognos Analytics - Reporting charts can appear differently when reports are run in different formatsor on different operating systems. For example, donut and pie charts can appear smaller in reports thatare run on the Linux on System z® operating system compared to the Windows operating system.
The differences in appearance occur only with Cognos Analytics - Reporting default charts. CognosAnalytics - Reporting legacy charts are not affected. When default charts are rendered in HTML or PDF,the following font-related problems might occur.
• The font that is used in HTML output is different than the font used in PDF output.• Some chart items appear misaligned. For example, a pie chart might show smaller pies in PDF output
than in HTML output.• The font that is used in the chart is different from the expected font.• The font that is used in the chart is different when you run the chart in different operating systems.
There are two possible causes to the font-related problems.
Appendix A. Troubleshooting 375

• The Java Runtime Environment (JRE) used by IBM Cognos Analytics did not find the font that isspecified in the chart, and substituted the font with a different font.
• An unknown default font is specified.
To resolve the problem, ask your administrator to configure JRE to find the installed fonts on the CognosAnalytics server. There are two ways that you can configure JRE to find the installed fonts:
• Copy the installed fonts to the jre/lib/fonts folder.
For example, to use the Cognos Analytics default font Andale WT, copy Andalewt.ttf from theinstall_location/bin/fonts folder to jre/lib/fonts.
• Configure the JRE font search path to point to the location where the fonts are installed.
On AIX®, set the shell environment variable JAVA_FONTS=<list of directories>
Tip: Setting this variable is equivalent to setting the properties java.awt.fonts andsun.java2d.fontpath.
The default fonts configuration in your Cognos Analytics server default style sheet can also cause font-related problems, particularly when the operating system is UNIX. On UNIX systems, fonts must bepurchased and installed. To ensure that a specific font is used, perform one of the following tasks:
• Ask your administrator to update the Cognos Analytics server default style sheet to reflect the fonts thatare installed on the server.
• Update the chart fonts that are used in your report to use that font, and do not rely on any default fonts.
Out-of-memory errors with reports that are run in interactive HTML formatOut-of-memory errors occur when you run a report in interactive HTML format. The errors do not occurwhen you run the report in other formats, such as PDF or saved HTML.
Out-of-memory errors occur in reports that contain many objects that require memory intensiveprocessing, such as crosstabs and charts that are linked together with master-detail relationships.Running reports in interactive HTML can consume more memory than running reports in other formats.When a report is run in interactive HTML, data sets are kept in memory for all pages in the report. Forreport formats like PDF, data sets are released from memory after the report is rendered.
Under certain conditions, you can exceed the memory limitations of a 32-bit configuration of the CognosAnalytics server report server component when you interact with an interactive HTML report. Forexample, scrolling through a report page by page or drilling up or drilling down can consume morememory and processing capacity in interactive HTML than in other output formats.
Charts in PDF Output Show Unexpected ResultsCharts, when viewed in PDF output, have different levels of interaction support, depending on the versionof Adobe Acrobat Reader and the style of chart element.
Adobe Reader version 5 does not support tooltips. Drill up and down and Go to links have limited support,due to technical limitations. Only rectangular areas in charts, such as bars, columns, horizontal labels onthe axis, or legend labels can be enabled for drill or Go to interaction. Non-rectangular areas, such as pieslices in pie charts, cannot be enabled for drill or Go to interactions.
Adobe Reader version 6 and 7 supports tooltips, drill up and down, and Go to links for all chart types.When chart elements overlap or are separated by only a few pixels, the interactive region may be smallerthan the area shown.
Result set of a multi-fact query contains blanksThe result set of a multi-fact query contains blanks in some columns, even though there is a conformeddimension that should join the records from both fact tables.
When IBM Cognos Analytics processes a multi-fact query, it breaks it up into two single fact queries (eachwith items from a single star in the star schema), then stitches the results of both of those queries
376 IBM Cognos Analytics - Reporting Version 11.0 : User Guide

together to create a single result set. You can see the two queries and stitching in the native SQLgenerated for the multi-fact query in Reporting.
Stitching these queries together is not the same as joining tables in the model. Stitching the two sidestogether requires a stitch key that exists in each single fact query as a unique value for the row. The rowsfrom the two single fact queries are then matched 1:0, based on the stitch key values. The stitching mustbe 1:0. Otherwise, you can get double counting of measure data, or exclude rows that should be included.The stitching also means that it is possible for a row from one of the single fact queries to not have acorresponding row from the other single fact query, leading to blanks in the result set.
When the fact tables contain non-conformed dimensions between them, there is not a suitable stitch keyamong the query items selected. As a result, IBM Cognos Analytics creates one using RSUM, and joins theresults of the two queries. For more information, see the topic Multiple-fact, Multiple-grain Query on Non-Conformed Dimensions in the Framework Manager User Guide.
When there is a conformed dimension, it is still possible to not have a suitable stitch key, depending onwhat items are used in the query and other model design factors. In such cases, IBM Cognos Analyticsuses the conformed dimensions and the row numbers from the results of each query to create a stitchkey. If one single fact query returns more rows than the other, there are blanks in the result.
To resolve the problem, it might be possible to avoid splitting the query by changing the model. For moreinformation, see Resolving Queries That Should Not Have Been Split in the Framework Manager UserGuide. If you cannot avoid splitting the query and the report needs these two result sets to be joineddifferently, create two separate, single-fact queries in Reporting, create a join between them, and definethe join links and cardinality as needed.
Cognos Statistics object is not displayed in a reportAn IBM Cognos Statistics object is not displayed in a report.
Each removed statistical object is replaced with an image in the report:
Figure 54. Image that replaces statistical objects in upgraded reports
A warning also is displayed in the Upgrade Information window for each statistical object that is replacedwith the image.
Beginning with IBM Cognos Business Intelligence version 10.2.1, IBM Cognos Statistics is no longeravailable.
To ensure that reports that were created in previous releases and that contain statistical objects run,statistical objects are removed when the reports are upgraded.
Tip: Queries, and their data items, that are associated to statistical objects are not removed fromupgraded reports.
You can use IBM SPSS® Statistics to perform statistical reporting and analysis.
Problems When Drilling ThroughThe topics in this section document problems you may encounter when drilling through reports.
Cannot Drill Through Between PowerCubes Because MUNs Do Not MatchWe recommend that business keys be unique throughout the dimension for PowerCubes. These keys areused as the source value for levels in a hierarchy of a dimension. If the values are not unique throughoutthe dimension, the corresponding Category Code values may be generated with tildes.
Appendix A. Troubleshooting 377

For example, if a category for the Product Line level has a source value of 101 and a category in theProduct Type level has a source value of 101, the Category Code value for the Product Type level isautomatically generated with a unique value such as 101~245. The Category Code values are used in theMember Unique Name (MUN) for each member, for example, [Sales and Marketing].[Products].[Products].[Product type]->:[PC].[@MEMBER].[101~245].
Because these values are generated automatically, they cannot be guaranteed from one cube build to thenext or in a build for another cube with the same dimension structure using the same source values.Therefore, drilling from one PowerCube to another on what appears to be the same member might notwork since the MUNs might not match.
If the MUNs do not match, consult the cube modellers to see if the business keys can be made uniquethroughout the dimension. If this is not likely, or might take some time to resolve, you can usecalculations to pass the source value from one PowerCube to another for drill-through.
For more information about drill-through access, see the Drill-Through Access chapter in the IBM CognosAnalytics Administration and Security Guide.
Procedure
1. In the target report, create a filter with the following syntax:filter([Hierarchy or Level], roleValue('_businessKey', [Hierarchy or Level])= ?Parameter?)
For example:
filter([Sales Cube].[Products].[Products].[Product type],roleValue('_businessKey',[Sales Cube].[Products].[Products].[Product type])= ?Prod Type?)
2. In the source report, create a Query Calculation which is used to pass the business key (source value)to the target report by mapping it to the target parameter in the drill-through definition. Use thefollowing syntax:
roleValue('_businessKey', [Hierarchy or Level])
For example:
roleValue('_businessKey', [sales_and_marketing].[Products].[Products].[Product type])
Unexpected or Empty Results When Drilling ThroughWhen you drill from a source report to a target report, there might be no data returned. This might be thecorrect result if there is no data that corresponds to the drill-through selections or if you do not havepermission to view the data.
In other cases, if no data or the wrong data appears, the source item might not be mapped to the targetcorrectly or the values in the data sources might not be conformed (the values do not match in both datasources).
If you have the necessary permissions, you can debug drill-through definitions by using the drill-throughassistant from the Go To page (right-click the selection in the source report and select Go To). You canview the passed source values and the mapping to the target report parameters. You can use this tool forboth authored and package drill-through definitions.
You might be able to correct the problem by modifying the parameter mapping in the drill-throughdefinition. For example, when you drill from a cube to a relational data source, sometimes no data isreturned or the wrong data is returned because the business key values in the two data sources do notmatch. You can change the drill-through definition to pass the caption of the IBM Cognos PowerCubemember instead of the business key, but you must also change the target report to filter on thecorresponding string value and not the business key value.
378 IBM Cognos Analytics - Reporting Version 11.0 : User Guide

However, it is best to ensure the data sources are conformed. In this example, the business keys in thecube should match the business keys in the relational source. Filtering on a key is more efficient thanfiltering on a larger string that may or may not be indexed in the database.
For more information on data source conformance, search for "conformed dimensions" and "businesskeys" in the IBM Cognos Transformer User Guide.
Procedure
1. Ensure that the target report filters on a string value that matches the caption being passed from thePowerCube.
2. Edit the drill-through definition as follows:
• If the drill-through definition was created in IBM Cognos Analytics - Reporting, open the report, andgo to the drill-through definition associated with the drill-through source object. On the parametermapping page, select Member caption in the Property to pass column.
• If the drill-through definition was created in the source package, in the IBM Cognos Analytics portal,
click the New icon , Other, Drill-Through Definitions. Open the package drill-through definition.On the Target tab of the drill-through definition, select Member caption in the Property to passcolumn for the appropriate parameter.
ResultsWhen you drill through, instead of the business key, the caption is passed to the target.
You might also want to see “Data Does Not Appear in a Target Report or the Wrong Data Appears” onpage 373. For more information about drill-through access, see the Drill-Through Access chapter in theIBM Cognos Analytics Administration and Security Guide.
Related conceptsConformed dimensionsBusiness keys
Cannot Drill Through From a Relational Source to a CubeBy default, you cannot drill through from a relational data source to a cube. This is because a cubeexpects a Member Unique Name (MUN) as a parameter value and relational sources do not use MUNs.
Members have properties which include a business key and a caption. If either of these match data itemswithin the relational source, drilling through can be performed as long as the cube target report isauthored in Reporting.
If the source data source has a query item, for example display name, that corresponds to a memberproperty in the target cube, for example caption, you must create the parameter on the caption in thetarget report.
To pass the data item to the cube target, do the following:
• In the cube target report, create a parameter that accepts the caption of the member. This parameter
should be created in a Query calculation object from the Toolbox icon with the following syntax.Type the following
filter([ Hierarchy or Level],caption([Hierarchy of Level]) = ?Parameter?)
For example:
filter([sales_and_marketing].[Products].[Products].[Product line],caption([sales_and_marketing].[Products].[Products].[Product line]) = ?Product Line?)
Appendix A. Troubleshooting 379

For more information about drill-through access, see the Drill-Through Access chapter in the IBM CognosAnalytics Administration and Security Guide.
Calculations Do Not Appear in the Target ReportIf you drill through to PowerPlay Studio from a report in Reporting, Analysis Studio, or PowerPlay Studio,calculations on the edges in the target report might not appear.
For example, you have a target report with the calculation Personal Accessories+100 as a column in acrosstab report. When you drill through from a source report to the target report, if Personal Accessoriesis filtered out of the target report (Personal Accessories is not one of the items that is returned on thecolumn edge), then the Personal Accessories+100 calculation does not appear. Personal Accessories hasbeen filtered out of the target report and is not available to fulfill the calculation.
To see the calculations in the target report, ensure the items used in the calculations are returned in theresult set (not filtered out). For more information and examples, see Understanding Drill-ThroughBehavior in IBM Cognos 8 at developerWorks (www.ibm.com/developerworks).
Nested Crosstab Only Filters on Some ItemsIf you perform a parameter-based drill-through from a source report to an IBM Cognos Analytics -Reporting target report with two or more dimensions nested on a row or column, you may encounterunexpected results depending on the filters applied to the target report.
For example, a target Cognos Analytics - Reporting report has the following two filters:
• [sales_and_marketing_mdc].[Order method].[Order method].[Order method type]=?Order MethodType?
• [sales_and_marketing_mdc].[Retailers].[Retailers].[Region]=?Region?
Order method type and Region both have filters, but Product line does not. A drill-through definitionmapped to the appropriate parameters, in this case Order method type and Region, is created.
When the source report is run and the intersection of Outdoor protection, Northern Europe, andTelephone is selected to drill through to the target report, the order method type and region display asexpected, but all product lines are returned. This is because there are filters on Order method type andRegion but not Product line.
For more information and examples, see Understanding Drill-Through Behavior in IBM Cognos 8 atdeveloperWorks (www.ibm.com/developerworks).
Data is Not Filtered in the Target Report After Drill-ThroughYou drill through to a target report, but no filtering occurs in the target report. For example, you drillthrough on a crosstab intersection of Camping Equipment and 2010 and expect to see only data forCamping Equipment for 2010 in the target report. Instead you see all products for all years. This occursbecause the target report has no filters for the parameters that were passed.
To solve the problem, ensure that the target report has the correct filters. In the previous example, thecorrect filters in the target report are Product line and Year. Alternatively, you can enable Dynamic Drill-Through in a package-based drill-through definition.
Drill-through links in active reports do not workWhen viewing an active report that contains drill-through links in Microsoft Internet Explorer 8 and later,the links do not work.
Clicking on a drill-through link produces an error like the following:
The search path "<drill_through_target_search_path>" is invalid. An object may contain invalid syntax, oran unsupported character, or the user account in the namespace may not have sufficient privileges.Check the object to ensure that the target destination location does not contain special characters.
Details
380 IBM Cognos Analytics - Reporting Version 11.0 : User Guide

CM-REQ-4069 The property "na" is unknown. Replace it with a valid property.
When clicking a link in an active report, you are attempting to move from a local domain (the active reportMHT file on your computer) to the IBM Cognos Analytics server's domain. Internet Explorer views this as apotential risk. To resolve the problem, make the following changes to the security settings in InternetExplorer.
Procedure
1. Click Tools, Internet Options.2. Click the Security tab.3. Click Trusted sites and then click Sites.4. In the Add this website to the zone box, type the IBM Cognos Analytics server's domain.5. Click Add and then Close.6. Click Custom level.7. In the Scripting section, under Enable XSS filter, click Disable and then click OK twice.
Appendix A. Troubleshooting 381

382 IBM Cognos Analytics - Reporting Version 11.0 : User Guide
Appendix B. Limitations when using dimensionaldata sources
There are limitations when authoring or running reports against dimensional data sources.
Running a Report Against a Dimensional Data SourceYou can cancel a report that is running against Microsoft SQL Server Analysis Services only during theinitial portion of its execution. After this time, the report runs to completion.
The same behavior applies to SAP BW data sources.
In IBM Cognos Framework Manager, you can also control the number of levels within a hierarchy fromwhich members, or values, are extracted from the hierarchy to populate a tree prompt.
For SAP BW, you can reduce the number of hierarchy levels to limit the number of nodes by setting theSAP BW variable property trimHierarchyLevels to 1. This removes the lowest level from thehierarchy prior to creating the list of nodes.
Units of Measure Notation
When running a report against an SAP BW data source, units of measure are included in the same columnas the data values, separated by one space. For example, Celsius and Fahrenheit notations are appendedto the end of the value.
If you see an asterisk character (*), one of the following was detected:
• an unknown currency• a value with an unknown or questionable unit of measure, such as a mixed currency calculation or rollup
Mixed currency values occur when you calculate values with different currencies.
This behavior occurs when you are using an IBM Cognos cube as a data source.
This behavior also occurs for SAP BW data sources.
Unsupported SAP Variable Properties
The following SAP variable properties are not supported:
• Exclusionary ranges appear as an inclusionary prompt.• Mandatory not initial appears as a mandatory prompt.
When using Business Explorer (BEx) to define variables in your SAP data source, avoid using exclusionaryranges and the mandatory not initial property.
Limitations When Using Set Expressions in List ReportsIn list reports, we recommend that you avoid using set expressions. When in a list, set expressions, suchas TopCount, may produce fewer rows than in the corresponding crosstab.
For example, the following list includes Year in the first column, followed by a column containing anexpression that returns the top three months by revenue. Only three rows appear in the report and they

correspond to the top three months across all years. If you group by Year, the report still shows only threemonths. However, the corresponding crosstab, you see three months for each year.
Figure 55. List showing the top three revenue months in 2013, and the corresponding crosstab
In crosstab reports in IBM Cognos Analytics, set evaluation is always done in the context of what the setis nested under in the report. However, in list reports set evaluation is done independently of thegrouping. For example, if the first column contains Country or Region instead of Year, you see the topthree months for each country or region (across all years) in both cases.
In the case of different dimensions, you can force context independence by replacing [Revenue] in thetopCount expression with tuple ([Revenue], X), where X is the default member of the hierarchy thatcontains Month.
However, for nested levels in the same hierarchy, there is no such workaround at this time.
Limitations When Using Clauses in Summary FunctionsA summary function that uses a for clause may yield unexpected results. These may include errormessages, warnings, incorrect numbers, and more or fewer than expected rows, columns, or chart pointsand lines.
To avoid these problems, ensure that the parameters that follow the for clause adhere to the followingconstraints:
• Parameters must be simple data item references.• All data items in the parameter list must appear on every list, crosstab, or chart that uses that summary.• For any edge used in the for clause, data items listed in the for clause must start with the first data
item on that edge.• Data items must be listed in the order in which they appear on each edge of the report with no gaps.• In crosstabs and charts, there must be no sibling data items that are considered details. Summaries are
normally not considered details.• Section headers must not be included in the parameter list.
If following these constraints does not resolve the problems and your report uses dimensional data withno detail or summary filters, consider using the within set clause instead of the for clause.
384 IBM Cognos Analytics - Reporting Version 11.0 : User Guide

Limited Support for Relational Functions When Used with OLAP DataSources
When working with an OLAP data source, we recommend that you not use relational functions, such assubstring and concatenation functions, in a report that also contains a measure with the AggregateFunction property set to Calculated or Automatic in the model. If you do so, you may encounterunexpected results. For example, some summaries are calculated using the Minimum function instead ofthe aggregate function derived from the individual query items.
In the expression editor, an exclamation mark (!) that precedes a function indicates that the function isnot naturally supported for that data source. IBM Cognos Analytics uses a local approximation for thatfunction. Because an approximation is used, performance can be degraded and the results may not bewhat you expect.
For example, you create an IBM Cognos Query Studio report that contains the data items Product line andRetailer site count. The footer summary is set to Calculated. You then insert a calculated column thatreturns the first three characters of the Product line item, which uses the relational concatenationfunction. The footer summary now shows the lowest gross margin value.
Figure 56. A report that contains a calculated footer summary
Related conceptsSummarizing data dimensionally
Limitations When Summarizing Measures in DMR Data SourcesThere are limitations when summarizing dimensionally-modeled relational (DMR) measures and semi-additive measures in crosstabs using the aggregation function count distinct, median, standard-deviation, or variance. The following limitations can produce empty or error cells when the report isrun:
• The aggregation function must apply to all members of a level or all children of a member.• To use OLAP functions in detail filters that are applied to a dimension that is not in the report, or is at a
level below what is being reported, only the functions children, level, members, roleValue, androotMembers will work.
• You cannot define detail filters that reference one or more measures and are set to After autoaggregation.
• You cannot define context filters that have more than one member from a dimension that does notappear in the report.
• Context filters that have more than one member from a dimension that appears in the report produceerrors in all cells that are ancestors of the slicer members.
Appendix B. Limitations when using dimensional data sources 385
• If a crosstab has a row that is a set of members from one dimension (dimension A) and another row thatis a set of members from another dimension (dimension B), and a context filter containing membersfrom dimension A is defined, error cells are produced in the row that contains members from dimensionB.
• If a context filter contains members from a dimension, and a crosstab has a row that is a set ofmembers from a higher level than the slicer members, error cells are produced for that row.
• Error cells are produced when drilling down on a crosstab that has two nested levels.
If you do not consider these limitations in a calculation, the report may return inaccurate results.
If there is a non-measure calculation that returns a constant or contains a summary function, and thecalculation has a lower solve order than the measure being aggregated, error cells are returned for theaggregated measure.
In list reports, error cells are produced as a result of these limitations if the list uses an OLAP functionother than children, filter, level, members, roleValue, and rootMembers.
Limitations when filtering dimensional data sourcesAvoid combining context filters (slicers) with dimensional constructs that involve members fromhierarchies that are used elsewhere in the report. This combination gives results that are often not whatyou might expect and that may change in a future release.
Dimensional data sources provide implicit rollup at all levels of each dimensional hierarchy. Contextfilters and slicers with more than one member invalidate any pre-computed rollup of members athierarchy levels before the level at which the filter applies.
The following types of filtering are safe for dimensional reporting:
• Context filters (slicers) with one or more explicit, non-calculated members per hierarchy, if thosehierarchies are not used elsewhere in the report.
• Expressions that use the filter function (not in a slicer), comparing measure, tuple, or attributevalues.
Nesting Incomplete Sets
When you nest sets (especially sets of explicit members, and sets that result from the functions such asfilter and intersect), there may be members at one nesting level that have no correspondingmembers that can appear nested after them. In such cases, filtering results may not be what you expect:the higher-lever members may or may not appear in the result.
While this is most commonly seen within a single hierarchy, it can also happen across differenthierarchies and dimensions.
To avoid this problem, ensure that the sets are constructed to ensure that they are never empty for any ofthe members in the higher-level set. For example, you could filter only the high level set and nest only thecomplete set of descendants at the desired levels after that one.
Error Characters (--) When FilteringWhen you use slicers or context filters with a calculated fact or measure, you may see two dashes (--) asvalues for some or all of the cells in the report that represent aggregates that are calculated in thedatabase (aggregation is set to Automatic). This means that the data source is unable to compute thesevalues.
You can avoid this error by using an explicit rollup rule or aggregation function such as Total. However, dothis only if you are familiar with the data and absolutely certain that this is the appropriate answer for thatreport.
386 IBM Cognos Analytics - Reporting Version 11.0 : User Guide
Time Hierarchies
Error characters also appear in summaries if your report includes a time hierarchy and you use two ormore members from a different time hierarchy as a context filter. To avoid the error, use only onemember as the context filter.
Filters in Queries and Sub-queries
For dimensional data sources, filters in queries and sub-queries are considered equivalent. The sameapplies to slicers.
Limitations When Specifying the Scope of Summary Filters with Dimensional DataSources
When you specify the scope for a summary filter, consider the following limitations. The scope of asummary filter
• must refer to a grouped data item for list reports. Otherwise, you encounter the following error:
OP-ERR-0212 The summary filter scope (Scope1) found in the query (Query1) is not valid. It must refer toa grouped query item.
• can refer to multiple data items, but it can refer to only one data item per edge of the crosstab.Otherwise, you encounter the following error:
OP-ERR-0213 The summary filter scope (Scope1) found in the query (Query1) is not valid. Referencingmore than one query item from the same edge is not supported.
• must refer to a level and cannot refer to a measure. Otherwise, you encounter the following error:
OP-ERR-0209 The summary filter scope (Scope1) found in the query (Query1) is not valid. It must refer toa level.
• must refer to a data item that is projected on an edge of the crosstab. If the scope of a summary filterrefers to a data item that was deleted from the report layout, you may encounter unexpected results.Otherwise, you encounter the following error:
OP-ERR-0213 The summary filter scope (Scope1) found in the query (Query1) is not valid. Referencingmore than one query item from the same edge is not supported.
• must refer to unique data items. For example, the summary filter cannot refer to the same data itemmore than once.
Limitations When Filtering Data Using an SAP BW Data SourceIf you are working with an SAP BW data source, you must consider additional exceptions when applyingfilters.
If you apply a filter and a sort to an item that corresponds to the leaf-level of a recursive hierarchy,siblings may appear in the report even though the aggregated values are correct. Siblings arecharacteristic values with the same parent as the filtered member.
Each level in an SAP BW hierarchy has an item with the same name as the level and a role of_businessKey. Such items are known as level identifiers. The level identifier must be an exact value forthe operators =, <, and > to work. For example, for the filter [Office] > 'Chicago' to work, the value'Chicago' must exist in the data source. If you do not know the exact values, you can apply the filter to oneof the attribute items associated with the level, such as [OfficeLongName] > 'C'. Filters on non-identifiersare possible, but they are slower because SAP BW data sources are optimized for queries based on levelidentifiers.
When filtering time-related data, only the level identifier items of the time-related characteristics in SAPBW, such as 0CALDAY and 0CALMONTH, should be used for performing anything other than equalityfilters. All other (attribute) items in these hierarchies are formatted string representations of thecharacteristic values with which they are associated. These formatted values sort alphanumerically andnot chronologically.
Appendix B. Limitations when using dimensional data sources 387

Using Prompt Expressions in Filters
If you create a filter expression using report item attributes, such as the following, no data is returned.
[ report item attribute ] = ?prompt?
To resolve the problem, do one of the following:
• Fully qualify the item by using items from the source tree instead of data items from the report.• Use prompt controls in the report instead of hand coded prompts.
Considerations when Creating CalculationsConsider the following information and limitations when creating dimensional calculations.
Calculation Solve OrderWhen calculations in the rows and columns of a report intersect, calculations are performed in thefollowing order: addition or subtraction, multiplication or division, aggregation (rollup), and then theremaining arithmetic functions.
The remaining functions are as follows:
• absolute, round, average, minimum, maximum, medium, count• percentage, % difference (growth), or % of total• rank, quartile, quantile, percentile
If both calculations have the same precedence, for example, if they are both business functions, then therow calculation takes precedence.
You can override the order of precedence by changing the solve order property. For more information, see“Resolve Multiple Calculations for Crosstabs and Charts” on page 391.
Length of ExpressionsWhen creating layout calculations that use complex expressions, limit the length of the expression to lessthan 1,000 tokens. A token is a keyword, identifier, constant, or special character symbol that the serveridentifies when it parses the SQL. For example, the expression 1+1+1+1+1+1+1+1+1+1 containsapproximately 28 tokens, whereas the expression 1+1+1...+1 (400 times) contains more than 1000tokens.
Tip: The Sales Commissions for Central Europe sample report in the GO Data Warehouse (analysis)package includes expressions.
Quality of Service IndicatorsNot all data sources support functions the same way. The data modeler can set a quality of serviceindicator on functions to give a visual clue about the behavior of the functions. Report authors can use thequality of service indicators to determine which functions to use in a report.
The quality of service indicators are:
• not available (X)
The function is not available for any data source in the package.• limited availability (!!)
The function is not available for some data sources in the package.• limited support (!)
The function is available for all data sources in the package but is not naturally supported for that datasource. IBM Cognos Analytics uses a local approximation for that function. Because an approximation isused, performance can be poor and the results may not be what you expect.
388 IBM Cognos Analytics - Reporting Version 11.0 : User Guide
• unconstrained (check mark)
The function is available for all data sources.
Using Quotation Marks in Literal StringsWhen inserting literal strings in an expression, you must enclose the string in single quotation marks. Ifthe string contains a quotation mark, it must be escaped. For example, if you want to insert the stringab'c, you must type 'ab''c'.
Limitations of calculations in dimensional reportingYou should use only the expressions and functions available in IBM Cognos Analytics - Reporting andfollow their syntax.
Minimal checking exists for calculations. If your calculation uses an invalid expression, your report resultsmay contain unexpected values.
In addition, you should define member summaries as follows:
summary_function (currentMeasure within set set_reference)
where set_reference is a level or set inserted from the Source tab .
Unless otherwise required, summary_function should be the aggregate function. If you use an explicitsummary function, you may encounter problems with measures (such as profit margin, distinct count, andso on) that have complex rollup values, and/or scenario or account dimension members that do not rollup.
Know your data, and confirm with the owner of the cube where overriding the automatic aggregation issafe.
Because of these limitations, summaries of calculations may not provide reliable values. For convenience,you may have to build reports where row summaries and calculated member columns intersect. In suchreports, these intersections may contain unexpected values. In contrast, row calculations intersectingwith column aggregates using the aggregate function are safe because the calculation is performed on thereliably summarized values.
Units of Measure
When creating calculations, you may encounter problems with the units of measure. For example, thecalculation Cost * Cost returns the unit of measure * (asterisk) instead of a currency unit of measure. Toavoid this problem, change the format of the corresponding column to obtain the desired unit of measure.
Limitation When Using Dimensional Functions with Running and Moving Summaries
IBM Cognos Analytics does not currently support queries that contain both dimensional functions andrunning summaries or moving summaries. For example, when you drill down in a report, the query usesthe dimensional function children, which is not compatible with running and moving summaries.Running and moving summaries are supported for only the overall level of a dimension.
Creating Expressions Using SAP BW Data SourcesYou must consider the following when creating expressions using an SAP BW data source, or you may notget the results you expect.
• The case and if/then/else constructs are not supported in filters.• The query item identifier of the leaf-level of the 0CALDAY characteristic and its presentation hierarchies
is of type date. When the values for the query item identifier are presented in IBM Cognos Analytics -
Appendix B. Limitations when using dimensional data sources 389

Reporting, they are formatted as dates. These formatted values should not be used in filter expressions.The correct date constant format for use in expressions is YYYY-MM-DD.
• You can apply a comparison expression with an operator other than equals to a query item thatrepresents a level identifier. However, level identifiers are more efficient for identifying specific values.Range comparisons must be performed on the IBM Cognos application server, which slows down theperformance of the report.
Using Microsoft Excel Functions with SSAS 2005 Data SourcesIf you are working with a Microsoft SQL Server 2005 Analysis Services (SSAS) data source and you wantto use Microsoft Excel VBA functions such as ROUNDDOWN in MDX queries, the following Microsoft Officefeatures must be installed on the SSAS server:
• Microsoft Office Excel• Microsoft Visual Basic for Applications
To see a list of Excel VBA functions, see the Microsoft Web site (http://www.microsoft.com).
If these Microsoft Office features are not installed on the SSAS 2005 server, and you use Excel VBAfunctions, you encounter an error such as the following: YK-ERR-0008 The data provider returned anerror message: "The '[Excel].[ROUNDDOWN]' function does not exist.".
This error occurs because the OLAP server cannot process the function since Excel function libraries aremissing.
For more information, see the Microsoft Knowledge Base article 932214 at http://support.microsoft.com.
Concatenating StringsWhen IBM Cognos Analytics concatenates strings locally and if any of the involved strings contain nullvalues, the result of the concatenation is an empty cell or a null value. This occurs because IBM CognosAnalytics requires that an expression that involves a null value returns a null value. Many databasesignore null strings when they perform concatenations. For example, if you concatenate strings A, B, and C,and if string B is a null value, the database may concatenate only strings A and C.
Intersecting Calculations in Crosstabs and ChartsAn intersection point in a crosstab or chart can contain a value that is derived from multiple calculations.
If the query expressions for the row and column that intersect in a crosstab both include calculations, theintersecting value is the result of performing both calculations. The second calculation is performed onthe result of the first calculation. If you change the order in which the calculations are performed, theresulting value at the intersection point changes.
The solve order is a positive numeric value that you assign to data items. Negative values are notsupported. The data item with the lowest value is calculated first, followed by the next higher value, andso on. The data item with the highest solve order is computed last. If you do not specify a solve order, thedefault value of 0 is used. In crosstabs, if more than one data item has the same solve order, columnitems are calculated first and row items are calculated second.
For example, a crosstab contains the columns Revenue, Sales target, and a column that calculates thepercentage by which actual revenue exceeds target revenue. The crosstab contains a row for each Yearand a summary row that calculates the overall totals for each of the three columns. The cell where thepercentage calculation and the overall total calculation intersect contains only one value. By default, IBMCognos Analytics calculates the column percentage first and the summary row last. The value thatappears at the intersection is therefore a sum of the percentages, which is not a meaningful result. Thevalue is more meaningful if the overall percentage is calculated after the actual and sales target revenuesare summed. Specifying a solve order for the percentage calculation that is higher than the overall totalcalculation gives the following result:
390 IBM Cognos Analytics - Reporting Version 11.0 : User Guide

Figure 57. Crosstab showing a calculation that has a solve order specified
It is not necessary to specify the solve order for the overall total calculation. Because the default solveorder is 0, setting the solve order for the percentage calculation to a value higher than 0 is sufficient.
Nested Calculations in Crosstabs
If a crosstab contains nested calculations, the calculations are performed in the following order bydefault:
1. outermost calculation on the columns2. innermost calculation on the columns3. outermost calculation on the rows4. innermost calculation on the rows
If there are solve order ties, column items are calculated before row items and outer nesting items arecalculated before inner nesting items.
Resolve Multiple Calculations for Crosstabs and ChartsIf an intersection in a crosstab or chart contains a value that is derived from multiple calculations, you canspecify the order in which to perform the calculations. The solve order must be a positive numeric value.The calculations are performed from lowest to highest solve order value.
Setting the Summary aggregation property to Calculated for a data item assigns a solve order that ishigher than any other data item in a query unless a solve order is explicitly specified. If there are multipledata items that have the Summary aggregation property set to Calculated, the normal rules for solveorder apply.
Procedure
1. Click the data item for which to specify the solve order.
A data item can have only one solve order value. Consequently, if a data item is in a query that is usedin more than one context and you want the data item to have a different solve order in each context,you must use a separate data item.
2. Click the Show properties icon , and in the Properties pane, set the Solve order property to aninteger value.
Resolve Query Calculations that Intersect with Calculated Measures Defined in Microsoft AnalysisServicesMicrosoft SQL Server Analysis Services (SSAS) data sources may include data source calculations.Because IBM Cognos Analytics cannot predict the presence of a solve order on such calculations, settingthe Solve order property may not resolve the solve order correctly. You can suppress potentiallymeaningless results when querying dimensional data sources that include data source calculations. Inthe following example, the columns YTD Change and YTD Growth are data source calculated membersand the summary values for these two columns were suppressed.
Appendix B. Limitations when using dimensional data sources 391

Figure 58. Crosstab showing revenue by product line with a summary row
When a query-defined calculated member and a data source calculated member intersect, the value isthe result of performing both calculations. The second calculation is performed on the result of the firstcalculation. Whether the final value is meaningful depends on the order in which the calculations areperformed. Because IBM Cognos Analytics cannot determine the presence of these members ahead oftime, it cannot automatically determine the correct solve order.
In most cases, SSAS 2005 gives the expected results when no solve order is defined in the cube.Therefore, when using SSAS 2005, you do not need to set either the Solve order property in the query orthe Calculation intersection property.
Note: Dimensionally-modeled relational (DMR) data sources query one or more underlying relationaldatabases, and therefore cannot contain data source calculations. They are not considered dimensionaldata sources in the context of this topic.
Procedure
1. Click the Queries icon , and click the query that contains the data item for which to suppress values.2. In the Data Items pane, click the data item.
3. Click the Show properties icon , and in the Properties pane, set the Calculation intersectionproperty to Show "Not applicable".
ResultsWhen a query-defined calculated member and a data source calculated member intersect, the resultingvalue is suppressed. If the intersecting members do not contain data source calculations, the value is notsuppressed.
Null (Missing) Values in Calculations and SummariesThe data source that you use determines how null (or missing) values are handled in calculations,summaries, and other expressions.
Null values represent missing data values. For example, a new eyewear product, called Abby, isintroduced in 2012. Therefore there are no sales in 2011. If you create a report with the years 2011 and2012, the values for sales of Abby for the year 2011 are null (missing).
By default, null values appear as blank cells in a crosstab or list report. You can change the default tospecify the display of other characters, such as the word null, by changing the data format of the MissingValue Characters property for the cells or report. For more information, see “Set the default dataformats” on page 301.
Arithmetic Operations
Null values in arithmetic operations yield different results depending on the type of data source.
392 IBM Cognos Analytics - Reporting Version 11.0 : User Guide

In Microsoft SQL Server Analysis Services (SSAS) and Cubing Services data sources, a null value inarithmetic operations is treated as follows:
• In operations such as addition (+), a null value yields the same result as zero (9 + NULL = 9)• In operations such as multiplication (*), a null value yields a null result (9 * NULL = NULL)
You can accommodate this behavior by using more complex expressions such as the following:
• if ([M] is not NULL, then ([M]) else (0)• if ([M] is not NULL, then (<expression involving M> else NULL)
In relational and other OLAP data sources the result of an operation that includes a null value is alwaysnull. For example, 9 + NULL = NULL.
Equality Comparisons
Equality comparisons, such as equal to (=) and not equal to (<>), compare two values and return aBoolean value of true or false.
For all data sources, equality comparisons are treated as tests for missing data. Inequality comparisonsare treated as tests for non-missing data.
For example, NULL=NULL is true and NULL=0 is false.
Ordered Comparisons
In ordered comparisons, such as rank and quantile functions, null values are handled as follows.
For relational data sources, the result of the comparison is always false. For example, NULL < 1 is false.
For Microsoft SSAS, Cubing Services, and other OLAP data sources, the null value is treated as zero. Forexample, NULL < 1 is true.
Boolean Functions
In Boolean operations, such as or, null values are handled as follows.
For relational and dimensionally-modeled relational data sources, the result of a Boolean operation isalways null. Boolean functions are used in conditions and the null result is treated as a false condition. Forexample, NULL OR TRUE = NULL (FALSE)
For Microsoft SSAS, Cubing Services, and other OLAP data sources, the null value is treated as if it is false.For example, NULL OR TRUE = TRUE.
Summary Functions
All summary functions, such as aggregate, average, and maximum, ignore null values. For all functionsexcept count, if all values in the expression are null, the result is null. For count, if all values in theexpression are null, the result is zero.
For example, if the value for Quantity for 2013 is 10 and the values for 2011 and 2012 are null, then theaverage is as follows:
• average ([Quantity] within set set([2012], [2013] ) ) = 10• average ([Quantity] within set set([2012], [2011] ) ) = NULL
The count is as follows:
• count ([Quantity] within set set([2012], [2013] ) ) = 1• count ([Quantity] within set set([2012], [2011] ) ) = 0
Appendix B. Limitations when using dimensional data sources 393

String Operations
For all data sources, the result of string operations, such as concatenation (||), that include a null value isalways null.
For example, 'A' || NULL = NULL and NULL || NULL = NULL.
Dimensional coercion rulesIBM Cognos Analytics uses dimensional coercion rules to automatically convert dimensional types tobetter match other types. These conversions help you build simpler expressions, making them easier tounderstand. In addition to the implicit rules that IBM Cognos Analytics provides, you can make explicitdata type conversions using various functions, such as children.
IBM Cognos Analytics supports the following types of coercion:
• coercion of an object of one dimensional type into another, such as a level into a member set• coercion of a dimensional object into a numeric, date, time, or string value, such as a numeric measure
into a numeric value
Coercion rules are applied to expressions and data items. In expressions, an operator or function mayrequire operands to be of a particular dimensional type. When an operand is not of the required type, oneor more coercion rules may be applied to coerce the operand to the appropriate type. Coercion rules mayalso be applied to data items to coerce the data item to a collection of members or values.
Function Operands
The following describes how coercion rules are applied to function operands:
• If the operand is of the required type, no coercion is required.• If the function operand is supposed to be a numeric value, it is coerced into one.
A coercion rule exists for each type of dimensional object coercion.• If the function operand is supposed to be a dimensional object and a coercion exists to coerce the
operand to the required type, the coercion is applied.• If no coercion exists, an error message with the code QE-DEF-0478 appears to indicate that an
unsupported conversion of a dimensional object from the source to target type occurred.
Comparison and Other Symmetric Operators
Binary operators that accept operands of more than one type, such as equals (=) and in, need bothoperands to be the same dimensional type.
No coercion is possible between value domains (numeric, date, time, and string) or between membersand values. Consequently, if either operand is a value type, both must be in the same value domain andconverted explicitly using a function. Otherwise, the query fails.
Members and member set operands are valid only with the operators equals (=), not equals (<>), in, andnot in, where the right side of the expression is a member, member set, or prompt. Only the followingare valid:
• [member / member set] = [member]• [member / member set] <> [member]• [member / member set] = ?p?• [member / member set] <> ?p?• [member / member set] in ([member], ...)[member / member set] not in ([member], ...)• [member / member set] in ([member set])[member / member set] not in ([member set])[member /
member set] in ?p?[member / member set] not in ?p?
394 IBM Cognos Analytics - Reporting Version 11.0 : User Guide
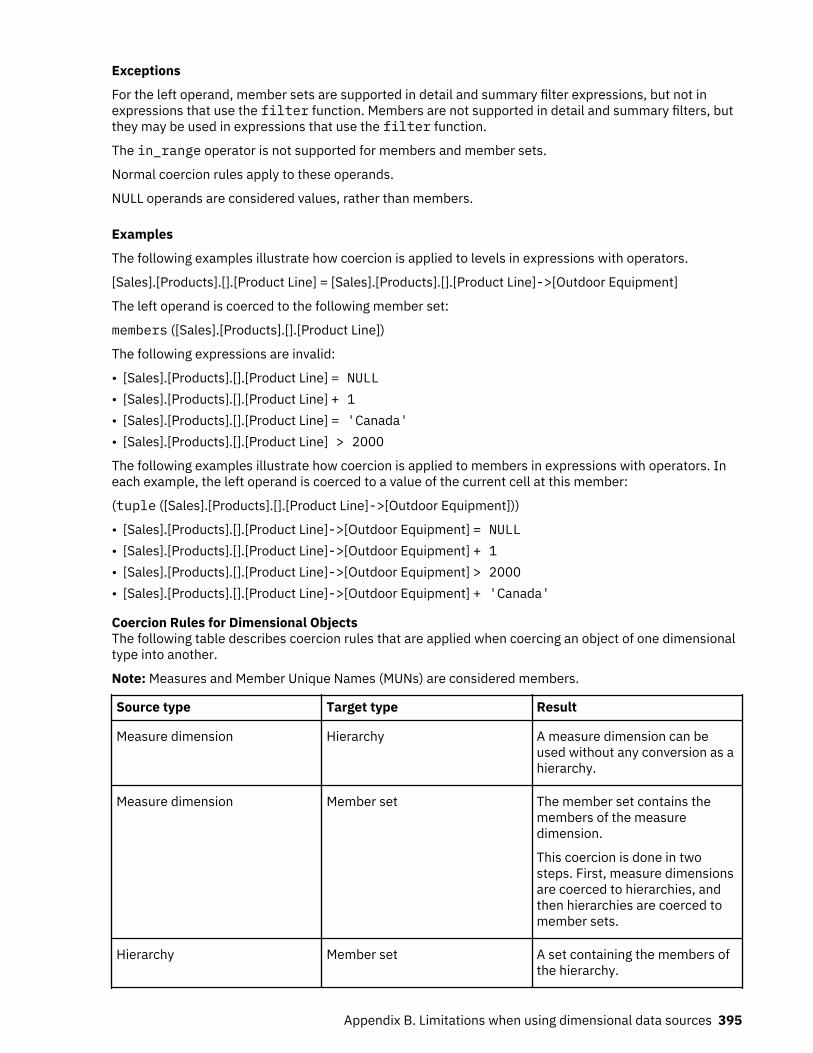
Exceptions
For the left operand, member sets are supported in detail and summary filter expressions, but not inexpressions that use the filter function. Members are not supported in detail and summary filters, butthey may be used in expressions that use the filter function.
The in_range operator is not supported for members and member sets.
Normal coercion rules apply to these operands.
NULL operands are considered values, rather than members.
Examples
The following examples illustrate how coercion is applied to levels in expressions with operators.
[Sales].[Products].[].[Product Line] = [Sales].[Products].[].[Product Line]->[Outdoor Equipment]
The left operand is coerced to the following member set:
members ([Sales].[Products].[].[Product Line])
The following expressions are invalid:
• [Sales].[Products].[].[Product Line] = NULL• [Sales].[Products].[].[Product Line] + 1• [Sales].[Products].[].[Product Line] = 'Canada'• [Sales].[Products].[].[Product Line] > 2000
The following examples illustrate how coercion is applied to members in expressions with operators. Ineach example, the left operand is coerced to a value of the current cell at this member:
(tuple ([Sales].[Products].[].[Product Line]->[Outdoor Equipment]))
• [Sales].[Products].[].[Product Line]->[Outdoor Equipment] = NULL• [Sales].[Products].[].[Product Line]->[Outdoor Equipment] + 1• [Sales].[Products].[].[Product Line]->[Outdoor Equipment] > 2000• [Sales].[Products].[].[Product Line]->[Outdoor Equipment] + 'Canada'
Coercion Rules for Dimensional ObjectsThe following table describes coercion rules that are applied when coercing an object of one dimensionaltype into another.
Note: Measures and Member Unique Names (MUNs) are considered members.
Source type Target type Result
Measure dimension Hierarchy A measure dimension can beused without any conversion as ahierarchy.
Measure dimension Member set The member set contains themembers of the measuredimension.
This coercion is done in twosteps. First, measure dimensionsare coerced to hierarchies, andthen hierarchies are coerced tomember sets.
Hierarchy Member set A set containing the members ofthe hierarchy.
Appendix B. Limitations when using dimensional data sources 395
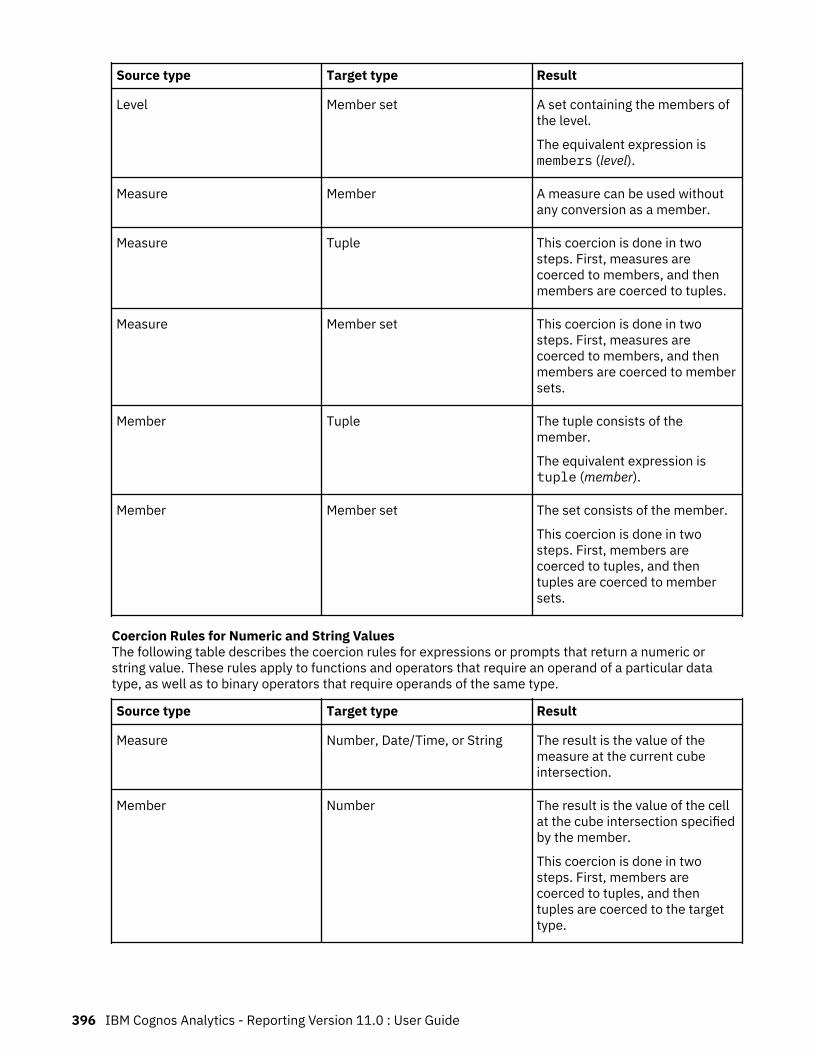
Source type Target type Result
Level Member set A set containing the members ofthe level.
The equivalent expression ismembers (level).
Measure Member A measure can be used withoutany conversion as a member.
Measure Tuple This coercion is done in twosteps. First, measures arecoerced to members, and thenmembers are coerced to tuples.
Measure Member set This coercion is done in twosteps. First, measures arecoerced to members, and thenmembers are coerced to membersets.
Member Tuple The tuple consists of themember.
The equivalent expression istuple (member).
Member Member set The set consists of the member.
This coercion is done in twosteps. First, members arecoerced to tuples, and thentuples are coerced to membersets.
Coercion Rules for Numeric and String ValuesThe following table describes the coercion rules for expressions or prompts that return a numeric orstring value. These rules apply to functions and operators that require an operand of a particular datatype, as well as to binary operators that require operands of the same type.
Source type Target type Result
Measure Number, Date/Time, or String The result is the value of themeasure at the current cubeintersection.
Member Number The result is the value of the cellat the cube intersection specifiedby the member.
This coercion is done in twosteps. First, members arecoerced to tuples, and thentuples are coerced to the targettype.
396 IBM Cognos Analytics - Reporting Version 11.0 : User Guide

Source type Target type Result
Tuple Number The value of the cell at the cubeintersection specified by thetuple.
The equivalent expression isvalue (operand or parameter).
Coercion PathsThe following diagram shows how coercion rules are connected. The expression that coerces a sourcenode type to a target node type is built by following the path that connects them. A dotted line indicates acoercion that does not require an explicit conversion function. This occurs whenever the source type is aspecialization of the target type. For example, every measure is a member so you can use measureswithout conversion wherever a member is required.
Level Hierarchy Measuredimension
Memberset
Member
(Incomplete)tuple
Number
Measure
set (x) tuple (x)
value (x)
set (x)
members (x)
Recommendation - Use Member Unique Name (MUN) AliasesIf you are working with a dimensional data source, use MUN aliases to simplify building reports andexpressions. In addition, you can tie the MUN back to the member in the package.
When working with dimensional data sources, IBM Cognos Analytics uses MUNs to uniquely identifymembers. MUNs are very complex. For example, the MUN for the member 2012 might appear as
[great_outdoors_company].[Years].[Years].[Year]->:[PC].[@MEMBER].[20120101-20121231].
When you build expressions that involve members, the use of MUNs makes these expressions difficult toread and maintain.
IBM Cognos Analytics - Reporting has an option that automatically generates an alias for MUNs (More
icon , Options, Report tab, Alias member unique names). The MUN alias is a data item that has theMUN as its definition. For the previous example, you would see 2012 as the MUN alias in the Expressionproperty for the data item. If the MUN alias is not enabled, in the Expression property, you would see thecomplex MUN for 2012.
Important: Do not modify or rename MUN aliases, because they will lose their connection to theirrespective members in the package.
Running a Report That Contains MembersIf you are using members in a report and your modeler has updated the data source in a way that changesmember unique names, the following problems may arise when you run the report.
Appendix B. Limitations when using dimensional data sources 397

• If the report queries an OLAP data source, you receive an error message explaining that some specificmembers cannot be found.
• If the report queries a dimensionally modeled relational (DMR) data source, data items whose memberunique names have changed do not appear in the report. Calculations that refer to members that havechanged no longer contain values from the members.
To resolve these problems, you must update the member unique names in the report. Open the querythat contains the members that you need to update in Query Explorer. Delete the member from the panein which it appears and reinsert it from the Source tab. For example, if you inserted the member as adetail filter, delete it from the Detail Filters pane and reinsert it.
Limitations When Formatting Empty Cells in SAP BW Data SourcesWhen working with SAP BW data sources, if the SAP BW server administrator configured customformatting for empty cells on the SAP BW server, this custom format does not appear in IBM CognosAnalytics reports. Ask your administrator to configure the formatting of empty cells in IBM CognosAnalytics.Related tasksSuppress empty cells
398 IBM Cognos Analytics - Reporting Version 11.0 : User Guide

Appendix C. Limitations When Producing Reports inMicrosoft Excel Format
There are limitations when producing reports in Microsoft Excel format.
Unable to Load Images from the IBM Cognos Analytics Content Store in aReport
If a report contains an image whose URL points to the IBM Cognos Analytics content store, the MicrosoftExcel spreadsheet software generates an access violation error and shuts down.
This problem is a known issue in the Microsoft knowledge base, and Microsoft is currently investigatingthe problem. This problem occurs only in Excel 2002.
Blank Worksheet AppearsIf the Microsoft Excel spreadsheet software cannot download a worksheet within a timeout period, Excelmay instead open a blank worksheet.
Warning Message Appears When Excel Opens an IBM Cognos AnalyticsReport
Each time the Microsoft Excel spreadsheet software opens an IBM Cognos Analytics report, a warningmessage appears.
The warning message is as follows:
Some of the files in this Web page are not in the expected location. Do you want to download themanyway? If you are sure the Web page is from a trusted source, click Yes.
The Excel workbook in HTML/XML format requires the presence of the file filelist.xml. IBM CognosAnalytics does not allow the creation of local files on the client side. In addition, a local file that containsURLs introduces a security issue. Consequently, this message will appear whenever you open an IBMCognos Analytics report in Excel. If you see this error message, click Yes to open the report.
Spreadsheet Content Not Saved for Reports Saved in XLS FormatIf you open a report that was saved in XLS format or run a report in XLS format, and security settings inyour Web browser are set so that you are prompted to open or save the report, do not click Save. If yousave the report, the spreadsheet content will not be saved. This is because Microsoft Excel reports inMicrosoft Office 2000 HTML format use relative paths to the spreadsheets. The relative URL paths are nolonger available when you open a saved XLS report.
Instead, click Open first and then choose to save the report.
Unable to Nest Labels in ChartsCurrently, it is not possible to specify nested labels for the category axis via XML.
Data Series Are TruncatedThe Microsoft Excel spreadsheet software may group data series or categories differently when comparedto a chart produced by IBM Cognos Analytics.
A 1 KB buffer limit in Excel limits the maximum number of data series per chart to 120. Data series over120 are truncated.
Colors Different From Those in HTML or PDFIf an IBM Cognos Analytics report contains a chart that uses custom colors, the Microsoft Excelspreadsheet software may not be able to add the custom color to the Excel color palette. Excel willattempt to match the custom color to one of its available standard colors. As a result, colors in Excel mayvary from those seen in HTML or PDF.
We recommend that you use standard colors in charts.
Repeating Pie ChartsIf you have a report that has repeating pie charts and you define a chart title, the Microsoft Excelspreadsheet software will show each pie with a title that is a concatenation of the chart title and the dataseries. For example, if the chart title is Quantity Sold by Order Method and Product Line and the dataseries is Order method, the title of each pie in Excel will be Quantity Sold by Order Method and ProductLine, order method.
Unable to Skip Discrete Axis LabelsIn IBM Cognos Analytics charts, you can control the skipping of discrete axis labels. This feature is notsupported in Microsoft Excel charts.
Unsupported IBM Cognos Analytics FormattingAbout 30% of the formatting functions available in IBM Cognos Analytics are not supported in theMicrosoft Excel spreadsheet software.
In particular, Excel does not allow changing locale-dependent formatting attributes, such as thefollowing:
• Decimal Separator• Exponential Symbol• Group Separator• Monetary Decimal Separator• AM String• Day Name• Day Short Name• Decimal Delimiter Symbol• Month Name• Month Short Name• PM String• YYYY date format pattern
400 IBM Cognos Analytics - Reporting Version 11.0 : User Guide

Excel does not provide an equivalent capability to the Y formatting character. As a result, CognosAnalytics cannot preserve this capability when creating XLSX files.
In addition, Excel does not support the following:
• Format Width• International Currency Symbol• List Separator• Percent Symbol (Excel does not support percent symbols for charts)• Multiplier• Overline Text Format• PerMill Symbol• Plus Sign• Scale (Excel has a different scaling formula than IBM Cognos Analytics)• Calendar (Excel does not allow changing the calendar)• Era Name• First Day Of Week• Show Era
Cells Contain Series of #Cells in the Microsoft Excel spreadsheet software have a limit of 255 characters. If your report containstext strings that are longer than 255 characters, they will be formatted as text and appear as ######.
To resolve this problem, use fewer characters.
Table and Column WidthsThe Microsoft Excel spreadsheet software does not support using percentages to determine the width oftables.
If the report contains only one table, the value of the width attribute for the Table element in the reportspecification determines the width of the table in the Excel worksheet. If the report contains more thanone table, Excel determines the width of all the tables in the worksheet. If the tables are nested, thewidth specified for the outer table is used and, if necessary, the width is adjusted to accommodate data inthe nested tables. The columns and rows around the table are merged to preserve the appearance of thenested table. When you save the workbook, only a single table is saved per worksheet.
Secure Socket Layer (SSL) Is Not Supported in Some Excel Formats andVersions
SSL is supported for only the Microsoft Excel 2002 format in Microsoft Excel 2002 and Microsoft Excel2003.
Number Formats Become Currency Formats in Japanese ExcelA report uses the Number data format and you save it as Microsoft Excel output. When you open thereport in the Japanese version of Microsoft Excel, the data format is listed as Currency rather thanNumber. This occurs because Japanese Excel interprets the standard Number data format slightlydifferently than other versions of Excel.
Appendix C. Limitations When Producing Reports in Microsoft Excel Format 401

The value appears correctly in Number format. For example, if you specified five digits as your numberformat, five digits still appear. In Excel, click the Custom number format to see the exact format stringbeing used.
Reports Show Data in Wrong ColumnsA report contains a large amount of data that is presented using a large number of nested report objects,such as tables and blocks. When the report is produced in Microsoft Excel format, some of the dataappears in the wrong columns. This occurs because Excel has a 64K limit on how many nested cellobjects can appear in a single spreadsheet.
To solve this problem, you can redesign the report to present the data using non-nested structures.
Unable to Access Reports on Remote ServersYou cannot access a report in Microsoft Excel format on a remote server.
To resolve this problem, you must change the hostname portion of the gateway URI from localhost toeither the IP address of the computer or the computer name. You do this using IBM Cognos Configuration.
Drill-through Reports Are Not Supported in ExcelIBM Cognos Analytics does not support drill-through for reports in Microsoft Excel format.
Map Reports Are Not Supported in ExcelIBM Cognos Analytics does not support map reports in Microsoft Excel format.
Unsupported Excel FormattingIBM Cognos Analytics does not support some formatting.
The following formatting functions that are available in the Microsoft Excel spreadsheet software are notsupported by IBM Cognos Analytics:
• background images in table cells• Excel-specific headers and footers• text flow and justification• floating text objects• white space, normal, and wrap text formatting• maximum characters
Some layouts do not show exactly in HTML and PDF due to Excel limitations.
Hyperlink Buttons Are Not Supported in ExcelThe Microsoft Excel spreadsheet software does not support hyperlink buttons.
402 IBM Cognos Analytics - Reporting Version 11.0 : User Guide
Unable to View Reports in Excel Format Sent as Email AttachmentsIBM Cognos Analytics can send Microsoft Excel reports in HTML and XML format by email. However, youcannot open them directly from the email message.
Save the Excel email attachments to your computer and view them from there.
Many items on axis produces empty chart in ExcelIf a chart contains many items on the x-axis, an empty chart is generated when the report output format isMicrosoft Excel 2002.
This problem is caused by a limitation in Excel 2002 for chart data strings. To work around the problem,produce the report in Excel 2007 format. Excel 2007 does not have this limitation.
Chart legend titles are not supported in ExcelThe Microsoft Excel spreadsheet software does not support chart legend titles.
Unsupported Chart Properties in ExcelThe following IBM Cognos Analytics chart properties are not supported in the Microsoft Excelspreadsheet software:
• tool tips• conditional text• depth• visual angle• show values• marker text location• show baseline• new note• new marker• truncation text and allow n-degrees rotation category labels• border• margin• box type• font and font alignment• footer• subtitle• regression line• baseline• Include Zero For Auto Scale• Summarize Small Slices• Summarize Small Items
In addition, IBM Cognos Analytics makes sure that Excel reuses the same color palette that is defined inIBM Cognos Analytics. However, Excel can only use the first 16 colors from the IBM Cognos Analytics
Appendix C. Limitations When Producing Reports in Microsoft Excel Format 403

palette. If the number of categories in a chart exceeds 16, the rest of the colors are taken from the defaultExcel palette.
Unsupported chart types in ExcelAbout 30% of the chart types available in IBM Cognos Analytics are not matched in the Microsoft Excelspreadsheet software.
The following chart types appear differently or are not supported. Charts that are not supported appear asa default column chart in Excel.
• Bipolar charts• Bubble charts
Excel does not support regression lines.• Bullet charts
Excel does not support certain fills. As a result, the colored regions in bullet charts do not appear inExcel output.
• Combination charts
In Excel, combination charts appear as two-dimensional. If a three-dimensional or two-dimensionalcombination chart includes only an area, column, or line chart, only the one chart appears.
• Gauge charts• Donut charts
Excel may fill in the donut hole to accommodate extra measures. Excel shows donut three-dimensionalcharts as donut charts.
• Maps
In Excel, no chart appears.• Matrix charts• Metrics range charts
In Excel, they appear as combination charts with two line charts for the tolerance bars.• Pareto charts
In Excel, the cumulative line is not displayed.• Pie charts
Excel shows only one type of pie chart and may show it at a different angle.• Progressive column charts• Polar charts
In Excel, a scatter chart appears instead.• Quadrant charts• Radar charts
Excel does not support stacked area radar charts. Excel names area radar charts as filled radar charts.Excel shows radar charts as radar with markers.
• Scatter charts
In Excel, three-dimensional scatter charts appear as two-dimensional scatter charts. The z-axis isdropped.
• 100% stacked bar and column charts
Clustered (side-by-side) stacked column charts are not supported in Excel. Only one column isrendered in the Excel output. For example, you have a 100% stacked column chart with Product line
404 IBM Cognos Analytics - Reporting Version 11.0 : User Guide
and Order method as columns. In the Excel output, columns for only Product line appear in the chart,but both Product line and Order method appear in the legend.
Cell Height and Width Are IncorrectThe width and height of cells that contain data with curly brackets {} or parentheses () may appearincorrectly.
This is because the Microsoft Excel spreadsheet software uses different word wrapping algorithms thanIBM Cognos Analytics.
Appendix C. Limitations When Producing Reports in Microsoft Excel Format 405

406 IBM Cognos Analytics - Reporting Version 11.0 : User Guide

Appendix D. Prompt API for IBM Cognos AnalyticsThe JavaScript Prompt API provides report authors with a method of customizing prompt interaction inthe reports they author.
With the prompt API, JavaScript applications can interact with IBM Cognos Analytics report prompts forthe purposes of validation or custom interaction. The prompt API can query and set user selections,validate typed-in values using patterns, set default values using expressions or query data, and more.Examples are provided to show various usage scenarios of the prompt API.
Note: The prompt API does not support tree and search prompt controls. Additionally, date and date &time prompt controls do not support the setValidator method.
cognos.Prompt objectDefines the class that contains a prompt object from a report.
This object should only be accessed through an instance of cognos.Report.
cognos.Prompt.getControlByName methodReturns the control object associated with a name.
Syntax
(cognos.Prompt.Control) getControlByName(String sName)
Parameters{String} sName
Specifies the prompt name property set for the control in IBM Cognos Analytics - Reporting.
Returns{cognos.Prompt.Control}
Object associated to the specified sName control. Returns null if the control does not exist.
Example
The following is an example of the clearMyPrompt() function.
<script type="text/javascript"> function clearMyPrompt() { var oCR = cognos.Report.getReport("_THIS_"); var myPrompt = oCR.prompt.getControlByName("myPrompt"); myPrompt.clearValues(); }</script>
cognos.Prompt.getControls methodReturns an array of all controls associated with the report.
Syntax
(cognos.Prompt.Control[]) getControls()

Parameters
None.
Returns{cognos.Prompt.Control[]}
An array of controls associated with the report.
Example
This example implements a function, clearAllValues(), that resets (clears the selection of) all promptcontrols for a page.
<script type="text/javascript"> function clearAllValues() { var oCR = cognos.Report.getReport("_THIS_"); var aControls = oCR.prompt.getControls(); for (var i = 0; i < aControls.length; i++) { aControls[i].clearValues(); } }</script>
cognos.Prompt.Control objectA control is a visual element in the prompt page, such as a text prompt or a value prompt.
cognos.Prompt.Control.addValues methodAdd an array of values to a control.
If the control does not support multiple values, only the first one provided is used.
Syntax
{void} addValues(aValues)
Parameters{cognos.Value[]} aValues
The new values to use for this control.
Returns
{void}
Example
This example adds an array of two values (use and display) to a prompt.
var oCR = cognos.Report.getReport(“_THIS_”);function setPromptValue( promptName, useValue, displayValue ) { var oP = oCR.prompt. getControlByName( promptName ); var oValue = {’use’: useValue, ’display’: displayValue }; oP.addValues( [oValues] );}setPromptValue ( ’country’, ’ca’, ’Canada’);
408 IBM Cognos Analytics - Reporting Version 11.0 : User Guide

cognos.Prompt.Control.clearValues methodClear (or deselect) all values for this control.
Syntax
For a text prompt, the text is set to empty. For a value prompt, all the selections are removed.
{void} clearValues()
Parameters
None.
Returns
{void}
Example
This example resets all the controls of a page.
function clearAllValues() { var oCR = cognos.Report.getReport("_THIS_"); var aControls = oCR.prompt.getControls(); for (var i = 0; i < aControls.length; i++) { aControls[i].clearValues(); }}
cognos.Prompt.Control.getName methodReturns the name of the control.
The name is set in IBM Cognos Analytics - Reporting in the name property set for the control.
Syntax
{String} getName()
Parameters
None.
Returns{String}
The value specified by the name property set for the control.
cognos.Prompt.Control.getValues methodReturns the current value for the control.
This method always returns an array, even if there is only one value selected.
• The following is an example for a text box prompt (single):
[ {use: "Smith", display: "Smith"} ]
• The following is an example for a select prompt (multiple):
[ {use: "CAN", display: "Canada"}, {use: "JPN", display: "Japan"} ]
• The following are examples of range prompts:
Appendix D. Prompt API for IBM Cognos Analytics 409

A range is an array of two elements, with the mandatory names start and end. The value of eachelement is a regular array as in earlier examples. When the range values are equal, this method returnsa normal value instead of a range:
[ {use: useValue, display:displayValue} ]
When the range values are different, this method returns a range:
[ start:{use: useValue, display:displayValue}, end:{use: useValue, display:displayValue} ]
Syntax
{cognos.Value[]} getValues(boolean v_allOptions)
Parameters{Boolean} v_allOptions
This optional parameter is applicable only to value prompts. The parameter specifies whether toretrieve all values or only selected values.
If the parameter is true, then all options are returned. If the parameter is false or missing, then onlythe selected options are returned.
The default value of this parameter is false.
Returns{cognos.Value[]}
An array of values for the control.
Example
This example demonstrates how to adjust your code based on whether the result is a single value or arange.
function isRangeOutOfLimits(datePrompt, rangeLimit) { var result = false; var v = datePrompt.getValues(); var rangeValue = v[0]; var rangeDaysDiff = 0; if (rangeValue.start) { rangeDaysDiff = 0; var startDate = rangeValue.start.use; var endDate = rangeValue.end.use; rangeDaysDiff = dateUtils.substractDate(endDate,startDate); } if (rangeDaysDiff > 0 && rangeDaysDiff <= rangeLimit) { result = true; } return result;}
This example demonstrates the use of the parameter v_allOptions.
var allValues = valueControl.getValues(true);var selectedValues = valueControl.getValues();
cognos.Prompt.Control.setValidator methodChanges the default validation function for a control to one defined by the user.
When the specified function returns false, the UI element associated with the control indicates that avalidation error occurred. When used in a multi-select control, the Insert button is disabled.
410 IBM Cognos Analytics - Reporting Version 11.0 : User Guide

Note: Date and date & time prompt controls do not support this method.
Syntax
{void} setValidator(oFct)
Parameters{function} oFct
A user-defined function that takes the user input as a parameter and returns a Boolean value.
Returns
{void}
Example
This example demonstrates how to ensure that a valid postal code is provided in the form A1A 1A1.
textBox.setValidator( function (values) { var result = false; if (values && values.length > 0) { var sValue = values[0]['use']; var rePostalCodeFormat = new RegExp( "[a-z][0-9][a-z] ?[0-9][a-z][0-9]", "gi" ); if ( rePostalCodeFormat.test(sValue ) ) { result=true; } } return result; });
cognos.Prompt.Control.setValues methodResets the control and adds an array of values to a control.
If the control doesn't support multiple values, only the first value provided is used. This is a conveniencemethod that issues consecutive calls to clearValues() and addValues().
Syntax
{cognos.Value[]} aValues
Parameters{cognos.Value[]} aValues
New values to use for this control.
Returns
{void}
Example
function setPromptValue( promptName, value ) { var oCR = cognos.Report.getReport(“_THIS_”); var oP = oCR.prompt. getControlByName( promptName ); oP.setValues( oValues );}oValues = [{’use’: ’ca’, ’display’: ’Canada’}, {’use’: ’us’, ’display’: ’USA’}];setPromptValue( ’countries’, oValues );
Appendix D. Prompt API for IBM Cognos Analytics 411

cognos.Report objectRepresents a report object in the content store.
Propertiesprompt
References a cognos.Prompt object for this instance.
Example
This example creates a new cognos.Report object from the current instance.
var ocr= cognos.Report.getReport("_THIS_");
The new ocr object is specific to the cognos.Report namespace and avoids collisions with otherobjects in your scripts. The keyword _THIS_ should always be used. The Report Server will replace it witha unique namespace during report execution.
cognos.Report.getReport methodGetter method for a cognos.Report object.
Namespaces are used to support HTML fragments. Always use a proper namespace when using thismethod to retrieve a cognos.Report object.
Syntax
<static> {cognos.Report} cognos.Report.getReport(sNamespace)
Parameters{String} sNamespace Optional
Returns{cognos.Report}
The cognos.Report instance for this namespace.
Example
var oCR = cognos.Report.getReport( "_THIS_" );
cognos.Report.sendRequest methodSends a requests with the current parameters and values.
Syntax
{void} sendRequest(eAction)
Parameters{cognos.Report.Action} eAction
Specifies one of the cognos.Report.Action enumeration values. No other values are allowed.
Returns
{void}
412 IBM Cognos Analytics - Reporting Version 11.0 : User Guide
Example
function customButton( eAction ) { var oCR = cognos.Report.getReport("_THIS_"); oCR.sendRequest( eAction ); }
cognos.Report.Action objectDefines constants for report navigation.
cognos.Report.Action.BACKGo back one prompt page.
Syntax
<static> <constant> cognos.Report.Action.BACK
cognos.Report.Action.CANCELCancel report execution and navigate to the previous page.
Syntax
<static> <constant> cognos.Report.Action.CANCEL
cognos.Report.Action.FINISHSubmit parameter values and skip all remaining optional prompts and prompt pages.
Syntax
<static> <constant> cognos.Report.Action.FINISH
cognos.Report.Action.NEXTSubmit parameter values and go to the next prompt page.
Syntax
<static> <constant> cognos.Report.Action.NEXT
cognos.Report.Action.REPROMPTIf the report contains prompt pages, the first prompt page is displayed. Otherwise, if the report doesn'tcontain prompt pages, this constant will re-prompt for values.
Syntax
<static> <constant> cognos.Report.Action.REPROMPT
cognos.Value classJSON structure to represent parameter values.
This object includes the following valid attributes:
Appendix D. Prompt API for IBM Cognos Analytics 413
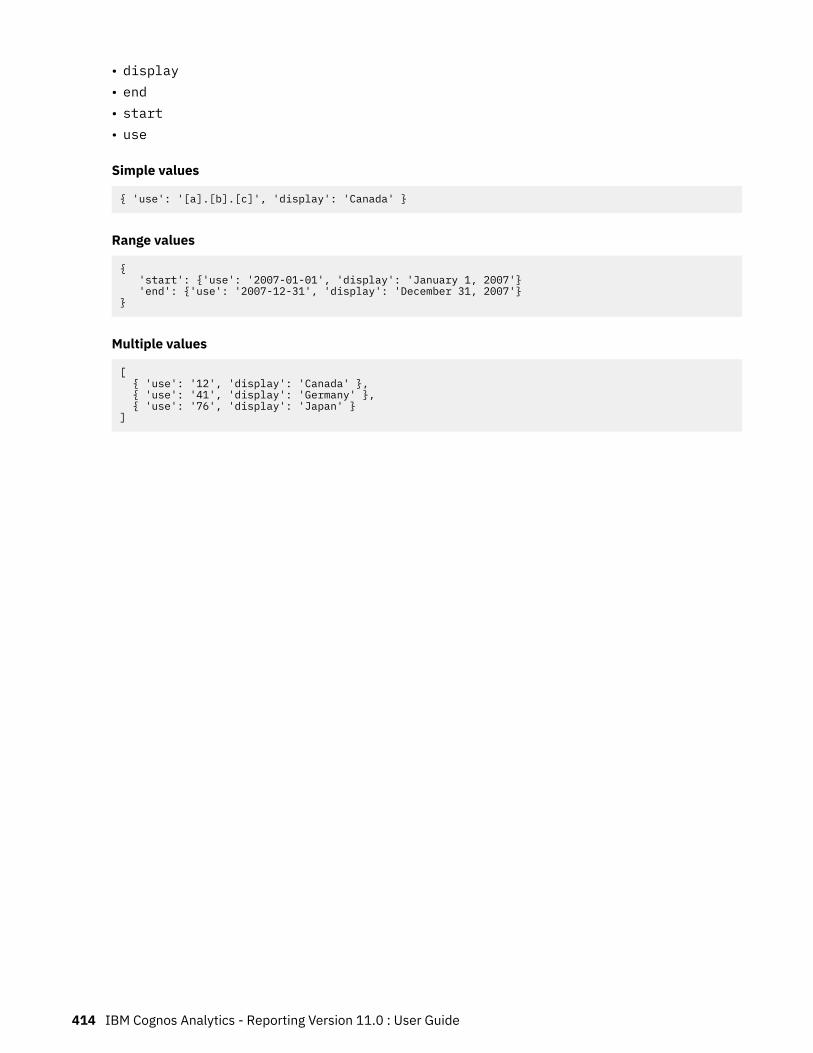
• display• end• start• use
Simple values
{ 'use': '[a].[b].[c]', 'display': 'Canada' }
Range values
{ 'start': {'use': '2007-01-01', 'display': 'January 1, 2007'} 'end': {'use': '2007-12-31', 'display': 'December 31, 2007'}}
Multiple values
[ { 'use': '12', 'display': 'Canada' }, { 'use': '41', 'display': 'Germany' }, { 'use': '76', 'display': 'Japan' }]
414 IBM Cognos Analytics - Reporting Version 11.0 : User Guide
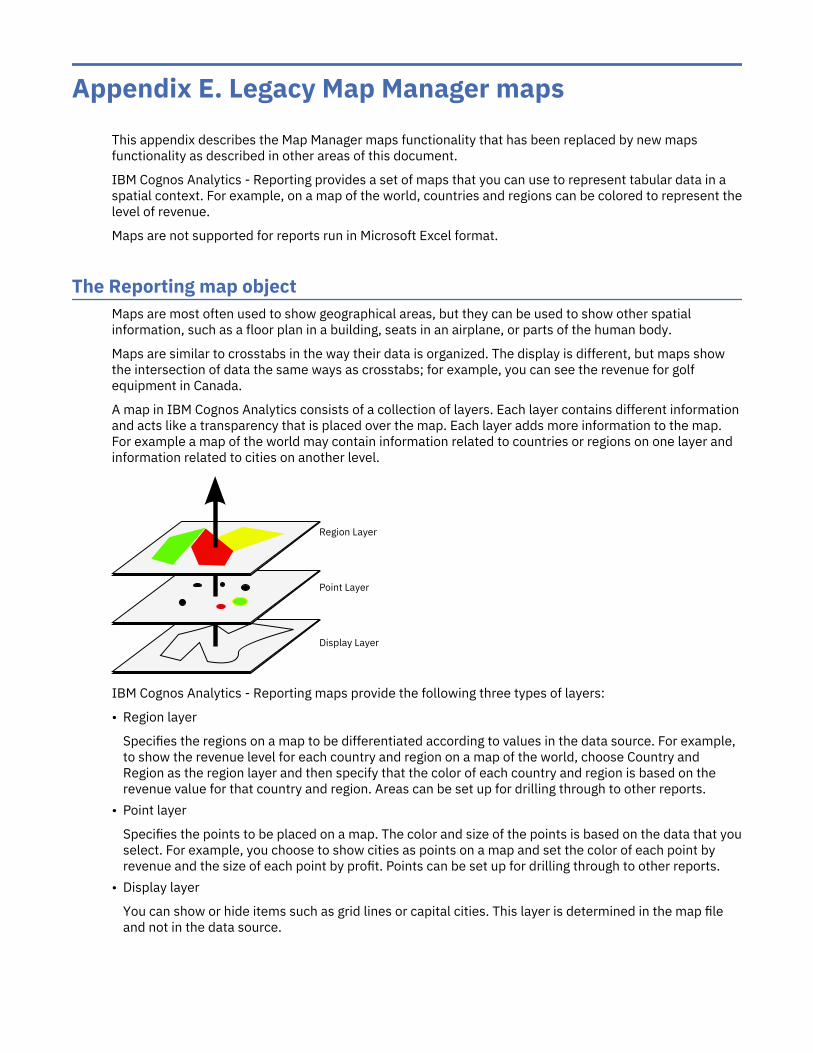
Appendix E. Legacy Map Manager mapsThis appendix describes the Map Manager maps functionality that has been replaced by new mapsfunctionality as described in other areas of this document.
IBM Cognos Analytics - Reporting provides a set of maps that you can use to represent tabular data in aspatial context. For example, on a map of the world, countries and regions can be colored to represent thelevel of revenue.
Maps are not supported for reports run in Microsoft Excel format.
The Reporting map objectMaps are most often used to show geographical areas, but they can be used to show other spatialinformation, such as a floor plan in a building, seats in an airplane, or parts of the human body.
Maps are similar to crosstabs in the way their data is organized. The display is different, but maps showthe intersection of data the same ways as crosstabs; for example, you can see the revenue for golfequipment in Canada.
A map in IBM Cognos Analytics consists of a collection of layers. Each layer contains different informationand acts like a transparency that is placed over the map. Each layer adds more information to the map.For example a map of the world may contain information related to countries or regions on one layer andinformation related to cities on another level.
Region Layer
Point Layer
Display Layer
IBM Cognos Analytics - Reporting maps provide the following three types of layers:
• Region layer
Specifies the regions on a map to be differentiated according to values in the data source. For example,to show the revenue level for each country and region on a map of the world, choose Country andRegion as the region layer and then specify that the color of each country and region is based on therevenue value for that country and region. Areas can be set up for drilling through to other reports.
• Point layer
Specifies the points to be placed on a map. The color and size of the points is based on the data that youselect. For example, you choose to show cities as points on a map and set the color of each point byrevenue and the size of each point by profit. Points can be set up for drilling through to other reports.
• Display layer
You can show or hide items such as grid lines or capital cities. This layer is determined in the map fileand not in the data source.

Note: If you intend to create CSV or XML output from your map, use only a point layer or a region layer.CSV and XML do not support the simultaneous use of both layers in the same map. Only one layer will berendered in the output.
Creating a map reportTo show how revenue for the company is distributed throughout the world, you can create a report thatcontains a map that shows the distribution of revenue by country and region.
Procedure
1. To start IBM Cognos Analytics - Reporting click New and then click Report.2. In the Templates and themes window, click Blank and then click OK.
3. Click the Data icon, click the Add report data icon , find the package and click Open.4. Click the Toolbox icon, double-click Map.5. In the Choose map dialog box, in the Maps pane, expand the World folder and click World.6. In the Region layers box, click Countries and Regions + Territories.7. In the Point layers box, click None.8. In the Display layers box, click Oceans and then click OK.
Tip: You can select or deselect multiple display layers by Ctrl+clicking.
Tip: You can return to the Choose Map dialog box at any time by double-clicking the map background.9. Drag data items to the map and run the report.
Set Map PropertiesWhen you select an element in a map, you can view its properties in the Properties pane. Someproperties are dependent on the existence of other properties.
If you are familiar with using conditional variables, you can customize the map to change appearance orprovide information in response to expressions or conditions.
When you change a map property, you usually do not see the change until you run the report. Changes tothe properties of labels and titles are reflected immediately.
These are some of the properties you can change in maps. These properties are available when you selectthe map object, unless specified otherwise in the Action to perform in the Properties pane column.
Goal Action to perform in the Properties pane
Hide or show the title, subtitle, footer, or axis title Under Chart Titles, set the Title, Subtitle, Footer,or Axis Title property.
Hide or show the legendUnder Chart Annotations, set the Legendproperty.
Hide or show region and point layer values andlabels on the map
Select the region or point layer. Under ChartLabels, double-click the Show Values propertyand select the options that you want.
To hide overlapping labels, select the Hideoverlapping labels check box.
416 IBM Cognos Analytics - Reporting Version 11.0 : User Guide

Goal Action to perform in the Properties pane
Hide or show display layer labels on the map Select the display layer. Under Chart Labels,double-click the Show Labels property and selectthe option that you want.
To hide overlapping labels, select the Hideoverlapping labels check box.
Hide or show the border around the legend Select the legend icon. Under Box, set the Bordersproperty.
Change the border around the map object Under Box, set the Border property.
Hide or show the tooltips
Note: Some versions of Acrobat Reader do notsupport tooltips.
Under Chart Labels, set the Tooltips property.
Change the amount of white space around the map Under Box, set the Padding or Margin property.
Change the default colors for all map elements Under Color & Background, set the BackgroundColor, Foreground Color, or Fill Effects property.
Change the font and the alignment of textUnder Font & Text, set the Font or RelativeAlignment property.
Tip: The 2011 Quarterly Sales Forecast samplereport in the GO Sales (analysis) package includestext alignment.
Resize the map Under Positioning, set the Size & Overflowproperty.
Change the font for the legend Select the legend icon. Under Font & Text, set theFont property.
Change the format of values in the legend Select the value in the region or point layer. UnderData, set the Data Format property.
Ignore data with no featuresUnder Data, set the Ignore Data with No Featuresproperty.
Specify the size of points In the point layer, click the measure in the Sizedrop zone and set the Minimum Size andMaximum Size properties.
Add titles, subtitles, footers, or axis titlesSet the Title, Subtitle, Footer, or Axis Titleproperty.
Procedure
1. Select the map object or map element to change:
• To change general properties, such as size and color, click the map object.• To change specific map elements, such as a layer or title, click the element itself.
Appendix E. Legacy Map Manager maps 417

Tip: To cancel a selection, press the Esc key.2. In the Properties pane, set the property value.
An ellipsis button indicates that a dialog box provides further options.
Note: You may have to scroll to see all the properties.
Defining Data Values for the Region LayerThe map that you created in the previous topic is not yet linked to a data source. You will now specify thedata values from your data source that will determine the color of each region.
Procedure
1. From the Source tab , expand your data.2. Drag your measure to the Color drop zone.3. Drag your country or region items to the Location drop zone.4. Run the report.
Match Data Values to Names in the Map FileIf the Ignore Data with No Features property is set to No, then each object that is called from the datasource must have a matching label in the specified layer of the map file. For example, if your data sourcehas a country and region named United States and the layer in the map file labels the same country andregion USA, then there is a mismatch that must be corrected. IBM Cognos Analytics - Reporting onlymakes you aware of a mismatch if each object in your data source does not have a corresponding label inthe map file. If there are extra labels in the map file that do not have a match in the data source, thereport will run without an error message.
A mismatch between your data and the map file must be corrected by the report author. It can not becorrected by a consumer of the map report at run time. There are two ways to correct a mismatchbetween your data and the labels in the map files. You can use IBM Cognos Map Manager to edit thelabels in the layers of the map file, or you can use the dictionary property to create an alias for eachmismatched object. When you use the dictionary property, it resolves the mismatch only for a singlereport, and is not shared with other reports. If you intend to continue using a map with the same datasource, it is best to edit the map in Map Manager so that the labels match the objects in your data source.
For information about using Map Manager, see the Map Manager Installation and User Guide.
Procedure
1. Select the map object.
The title bar of the Properties pane now shows the word Map.2. In the General section of the Properties pane, double-click the Dictionary property.
3. Click the new button .4. In the Dictionary Entry dialog box, click Search.5. In the Search string box, type a word or part of a word for which to search.
For example, if you are searching for United States, type in part or all of the name.6. In the Search map layer box, click the layer to search and click Search.7. In the Matching features box, click the label to which to match your data source and click OK.8. In the Alias box, type the name as it appears in the data source and click OK.
For example, if the country and region in your data source is named USA, type USA as the alias.
418 IBM Cognos Analytics - Reporting Version 11.0 : User Guide

Note: To find out the name for the objects in your data source, run a list report. For example, you canrun a list report to show the names of all the countries and regions in your data source. For moreinformation see Chapter 3, “Lists,” on page 37.
Define Data Values for the Point LayerThe Point layer in a map is used to visually represent data for point locations, such as cities or salesoutlets. Both the color and size of points can be based on data from your data source.
Procedure
1. Open the Choose Map dialog box:
• When you create a new map report, this dialog box appears automatically.• If you are already in a map report, double-click the map background.
2. In the Point Layers box, select the layer containing the points to show on the map.
For example, on a map of the world, you may want the points to represent cities.
3. From the Source tab , drag a data item to the Color drop zone in the Point Layer.
For example, to have the color of the point based on revenue, drag Revenue from the Source tab tothe Color drop zone.
4. From the Source tab, drag a data item to the Size drop zone in the Point Layer.5. From the Source tab, drag a data item to the Location drop zone in the Point Layer.
The object must be supported in the map file as a point location. For example, in the World samplemap, city is supported as a point location but country or region is not.
6. If you need to refine the location, drag an object to the Refine Location drop zone.
Use this drop zone when there is more than one location with the same name. For example, if you tryto run a report with cities in the point layer, and there is more than one city in your data source withthe same name, the report does not run. An error message indicates that there are cities in your datasource with duplicate names. You can differentiate the cities by using the data object Region to refinethe location.
Add Colors to the Region or Point LayerYou can add colors for regions or points and specify values to determine when those colors are shown.
Procedure
1. In the report, click the Region Layer or Point Layer.2. In the Color & Background section of the Properties pane, double-click the Palette property.
3. Click the new button and click Color.
A new color is added to the list of colors.4. To view the palette colors as a continuous spectrum in which colors blend into one another, click
Continuous Colors.5. With the new color selected, click Color in the right pane of the dialog box and select a color.6. Change the percentage boundaries for the colors.
Tip: To specify absolute values rather than percentages, clear the Percentage check box.
Appendix E. Legacy Map Manager maps 419

Add a Legend Title to a MapThere are legend titles for the entire legend, for the color of the regions, for the color of the points, and forthe size of the points.
Procedure
1. If the legend title is not showing, click the legend icon .2. In the General section of the Properties pane, set the Legend Title to Show.3. In the report, double-click the legend title and type the title.4. By default, the legend titles are taken from the object you have selected from the data source. To
change the legend title for the region color, point color, or point size, do one of the following:
• Click the Toolbox icon , drag a text or calculation object to the Color Legend Title drop zone inthe Region Layer or Point Layer, or the Size Legend Title drop zone in the Point Layer.
• Double-click the Color Legend Title or Size Legend Title drop zone, to change from the defaultlegend title, then double-click the drop zone again. In the Text dialog box, type text for the legendtitle.
Add a Note to a MapYou can add one or more notes, determine their position in the map report, and specify borders aroundnotes.
Procedure
1. Select the map object.2. In the Chart Annotations section of the Properties pane, double-click the Notes property.
3. Click the new button , and click OK twice.
A note icon with the words New Note appears in the report.
4. Click New Note next to the note icon .5. In the Text Source section of the Properties pane, double-click the Text property.6. Type the text to appear in the note and click OK.7. In the report, click the note icon.8. In the Positioning section of the Properties pane, type values to specify the bottom position, left
position, height, and width for the note.
The location of the note is defined by the number of pixels.9. Set the Note Border property to specify a border around the note.
10. Run the report to view the note.
If necessary, change the position again.
Drill Through to Another Report From a MapYou can link regions or points on a map to another report. For example, on a map of the world, you canspecify that when you click on China, a map of China opens.
420 IBM Cognos Analytics - Reporting Version 11.0 : User Guide

Procedure
1. Open the target report.2. From the report object toolbar, click Filters.
3. On the Detail Filters tab, click the add button .4. In the Available Components box, click the Source or Data Items tab to select the data item to use.
For example, to open the target report when Canada is clicked in the source report, expandCountries and Regions and double-click Country and Region.
5. In the Expression Definition box, type an operator after the data item or select an operator from theFunctions tab and then enter a value.
For example, to open the report when Canada is clicked in the source report, the expression would beas follows:
[Country and Region]='Canada', where [Country and Region] is the name of the data item in thepackage.
6. Save the target report.7. Open the source report.8. Select the region layer or the point layer.9. In the Data section of the Properties pane, double-click the Map Drills property.
10. In the Map Drills dialog box, click the new button .11. In the Search string box, type the name of the feature to use for the drill-through link.
For example, to open a report when you click on Canada in the map, search on all or part of the wordCanada.
12. Click Starts with to search for features that start with the search string or click Contains to searchfor feature names that include the search string.
13. To include a parent layer's name in the results of your search, select a layer in the Include parentlayer list.
For example, if you searched for Oslo and you included the parent layer of Countries and Regions +Territories, the search result would be Oslo (Norway).
14. Click Search.15. Select a feature from Matching features box and click OK16. In the Drill-Through Definitions dialog box, click the new button.17. Click the ellipsis button beside the Report box, and select the target report.18. Run the report.
ResultsWhen you click the selected feature in the source report, the target report will open.
Edit a MapWith IBM Cognos Map Manager you can edit the labels in maps to be consistent with the object names inyour database.
Administrators and modelers use a Microsoft Windows operating system utility named Map Manager toimport maps and update labels for maps in IBM Cognos Analytics - Reporting. For map features such ascountry or region and city names, administrators and modelers can define alternative names to providemultilingual versions of text that appears on the map.
For instructions, see the Map Manager Installation and User Guide.
Appendix E. Legacy Map Manager maps 421

Additional MapsIBM Cognos supplies a set of standard maps that can be used directly with IBM Cognos Analytics -Reporting as well as IBM Cognos Map Manager.
If you already have proprietary geographic data, you can also convert them to .TAB and .XML files that canbe imported into Map Manager. Map Manager uses the files to generate .CMF map files, which you can usein Reporting. For more information about the required .TAB and .XML files format and how togenerate .CMF map files with Map Manager, see the Map Manager Installation and User Guide.
Location intelligenceSophisticated mapping functionality, known as location intelligence, can be used for a broad range ofbusiness applications that extend the mapping capability of IBM Cognos Analytics. These include theability to dynamically create geographic filters and custom areas for aggregating data for ad-hoc analysis.Examples of business applications of location intelligence are listed in the following table.
Business application Benefits
Target marketing Learn who your best clients are and find more likethem.
Network optimization and site location analysis Put stores near your customers and look for gapsin geographical coverage.
Routing and work force optimization Reduce the number of trucks you need and makeyour drivers more efficient.
e-government Provide citizens with self-service opportunities.
Sales territory creation Create balanced sales territories.
Economic development Plan the development of your community.
Communications network planning Avoid costly mistakes by putting cell towers in thecorrect locations. Identify the locations of clients inyour service area.
422 IBM Cognos Analytics - Reporting Version 11.0 : User Guide

About this guide
This document is intended for use with IBM Cognos Analytics - Reporting. It provides step-by-stepprocedures and background information to help you create standard and complex reports. Reporting is aWeb product for creating reports that analyze corporate data according to specific information needs.
Finding information
To find product documentation on the web, including all translated documentation, access IBMKnowledge Center (http://www.ibm.com/support/knowledgecenter).
Accessibility features
Accessibility features help users who have a physical disability, such as restricted mobility or limitedvision, to use information technology products. Reporting has accessibility features.
IBM Cognos HTML documentation has accessibility features. PDF documents are supplemental and, assuch, include no added accessibility features.
Forward-looking statements
This documentation describes the current functionality of the product. References to items that are notcurrently available may be included. No implication of any future availability should be inferred. Any suchreferences are not a commitment, promise, or legal obligation to deliver any material, code, orfunctionality. The development, release, and timing of features or functionality remain at the solediscretion of IBM.
Samples disclaimer
The Sample Outdoors Company, Great Outdoors Company, GO Sales, any variation of the SampleOutdoors or Great Outdoors names, and Planning Sample depict fictitious business operations withsample data used to develop sample applications for IBM and IBM customers. These fictitious recordsinclude sample data for sales transactions, product distribution, finance, and human resources. Anyresemblance to actual names, addresses, contact numbers, or transaction values is coincidental. Othersample files may contain fictional data manually or machine generated, factual data compiled fromacademic or public sources, or data used with permission of the copyright holder, for use as sample datato develop sample applications. Product names referenced may be the trademarks of their respectiveowners. Unauthorized duplication is prohibited.

424 IBM Cognos Analytics - Reporting Version 11.0 : User Guide

Index
Special Characters-- characters
errors when filtering 386marking special cells 301troubleshooting in reports 360
! characters 385* characters 301% calculations
in dimensional reporting 227in relational reporting 183
Numerics100% stacked charts 673-D charts 68
Aabsolute charts 65access code
setting for active report 136active reports
adding controls 139adding interactivity 137choosing where to render visualizations 119controls 135converting existing reports 136creating and managing active report variables 137data lists 142, 150defining connections between controls 145drill-through links do not work 380formatting in preview view 151iFrames 142integrating with IBM Cognos Workspace 137linking to other reports or external web pages 152preview view 151report prompts 142running 153saving in MHT format 153setting access code 136setting properties 136specifying maximum number of rows that can appear136specifying reaction behavior of controls 146specifying selection behavior of controls 146summarizing data 151unable to add to Cognos Workspace 374unable to view in Firefox 8 or later 374using master detail relationships when authoring decks149variables 136
aggregatinglimitations with measures 385mapping functions from data sources 166member sets 202specifying aggregation properties in models 161
aggregating (continued)troubleshooting running totals 373using a simple summary in dimensional reporting 200using simple summaries in relational reporting 160values in crosstabs and charts 200
aliases in maps 418aligning objects 262ambiguous data
maps 133annotations
chart baselines 90notes in charts 89
area charts 56arithmetic overflow errors 374Auto Group & Summarize 160automating IBM Cognos Analytics using the IBM CognosSoftware Development Kit 35averages
moving and rolling 203axes
in charts 49titles in maps 417
axis scales 84
Bbackgrounds
adding background effects to charts 256adding colors to objects 274changing in current default charts 79changing in legacy charts 80colors not appearing in templates 358inserting background images 256troubleshooting in charts 358
bar charts 56base text direction 31baselines
adding to charts 90bidirectional support
digit shaping 302enabling 22
binary round-off errors 365BlackBerry devices
creating mobile reports for 35block objects 8blocks
inserting 258resizing 269
booklet items, See report bookletsbookmarks
adding 340creating for drill-through access 327
bordersadding to charts 256adding to legacy charts 80adding to objects 254
bottom filtering 194
Index 425

broadcasting same report to different users, See burstreportsbubble charts
specifying bubble size in current default charts 105Build Prompt Page tool 239bullet charts
customizing current default charts 109burst reports
creating against cubes 299creating against dimensional data sources 299creating calculated fields to define recipients 295defining groups 297defining recipients 295denial of service errors in dimensional reporting 375denial of service errors in relational reporting 179enabling in IBM Cognos Analytics portal 298Microsoft Excel format 403setting options 297troubleshooting 371
business keysusing for drill-through 330
button bars 140
Ccalculated fields in burst reports 295Calculation Intersection 391calculations
adding in dimensional reporting 227adding in relational reporting 182building in dimensional reporting 228building query calculations in relational reporting 184creating simple in dimensional reporting 227creating simple in relational reporting 183function quality of service indicators in dimensionalreporting 388function quality of service indicators in relationalreporting 184intersecting in crosstabs and charts 390limitations in dimensional reporting 389limitations in relational reporting 182limitations with units of measure in dimensionalreporting 389limitations with units of measure in relational reporting182null values 392resolving in dimensional data sources 391solve order in dimensional reporting 388solve order in relational reporting 182unexplained number discrepancies 365using quotation marks in dimensional reporting 389using quotation marks in relational reporting 184
calculations do not appear in target reporttroubleshooting drilling through 380
CAMID,, See IBM Cognos Access Manager IDcascading prompts
adding 247cascading style sheets 271cast_Date functions
troubleshooting 371chart configurations
100% stacked 673-D 68stacked 66
chart configurations (continued)standard 65
chart propertiesspecifying 51
chart typesarea charts 56bar charts 56bubble charts 59bullet charts 60column charts 54combination charts 57gauge charts 61line charts 54Marimekko charts 64metrics range charts 65microcharts 63Pareto charts 62pie charts 55point charts 57polar charts 64progressive column charts 62quadrant charts 60radar charts 64scatter charts 58win-loss charts 63
chartsaggregating values 200background effects 256background effects in legacy charts 80backgrounds in current default charts 79backgrounds in legacy charts 80bands of color in the background 86baselines 90borders 256changing backgrounds in current default charts 79changing backgrounds in legacy charts 80changing colors 74changing lines 83changing scales 83colored regions in current default charts 81configurations 53converting current default charts to a matrix 101converting types 68creating 49cumulation line in current default Pareto charts 108cumulation line in legacy Pareto charts 109current default 49customizing current default combination charts 100customizing labels 82customizing legend items in current default charts 87customizing legend items in legacy charts 88customizing palettes 74defining colors by values in current default charts 104defining query contexts 98displaying every second label 358drilling up and down 110drop shadows 256elements 49fills 256gridlines 86inserting microcharts into crosstabs 109legacy 49legend titles not supported in Excel 403limitations 376
426 IBM Cognos Analytics - Reporting Version 11.0 : User Guide

charts (continued)many items on axis produces empty chart in Excel 2002403markers 92notes 89positioning legends in current default charts 87properties not supported in Microsoft Excel 403regression lines in current default charts 95regression lines in legacy charts 96resizing 269resizing current default 73resizing legacy 74resolving multiple calculations 390series colors in current default combination charts 100setting properties 70showing data labels 97showing data labels in current default pie and donutcharts 98showing data points 99showing value markers 99specifying bubble size in current default bubble charts105specifying default measures 47summarizing small slices or items in current defaultcharts 98tooltips 70troubleshooting axis labels 358troubleshooting differences in appearance when run indifferent formats or on different operating systems 375troubleshooting gray gradient backgrounds 358types 53types not supported in Microsoft Excel 404
checkbox groups 141classes
changing the default for a report 271clipboards
copying reports 349opening reports 349
Cognos SQLin dimensional reporting 223in relational reporting 180
Cognos Statisticsobject missing from a report 377
Cognos Workspacecreating reports for workspaces 32filters in workspaces 34
colored regionsadding to current default charts 81
colorsadding to current default charts 104adding to objects 274changing in charts 74not appearing in templates 358
column charts 54columns
adding multiple items in a single column 264calculated in dimensional reporting 227calculated in relational reporting 182grouping in relational reporting 156hiding or showing in list controls 148setting the group span 157sorting in dimensional reporting 212sorting in relational reporting 173swapping with rows 47
columns (continued)width limitations in Microsoft Excel 401
combination charts 57concatenating strings 390conditional block lists
inserting 259conditional palettes
creating 76conditional rendering
adding multiple layouts 291adding variables 289hiding and showing objects 290
conditional stylescreating 285using variables 288
container direction 31context filters
creating 209prompting with 210
continuous values sliders 142control data items
referencing 144controls
active reports 135adding data 143adding to an active report 139button bars 140buttons 142checkbox groups 141continuous values sliders 142data button bars 140data checkbox groups 141data decks 139data discrete values sliders 142data drop down lists 141data iterators 141data list boxes 141data radio button groups 140data repeater tables 139data tab controls 140data toggle button bars 140decks 139defining connections 145discrete values sliders 142drop down lists 141iterators 141list boxes 141radio button groups 140referencing data items defined in static controls 144repeater tables 139row numbers 139specifying reaction behavior 146specifying selection behavior 146tab 140toggle button bars 140variable text items 139
convertinglists to crosstabs 48to MDX in dimensional reporting 224to SQL in dimensional reporting 224to SQL in relational reporting 181visualizations 123
copyingreports to the clipboard 349
Index 427
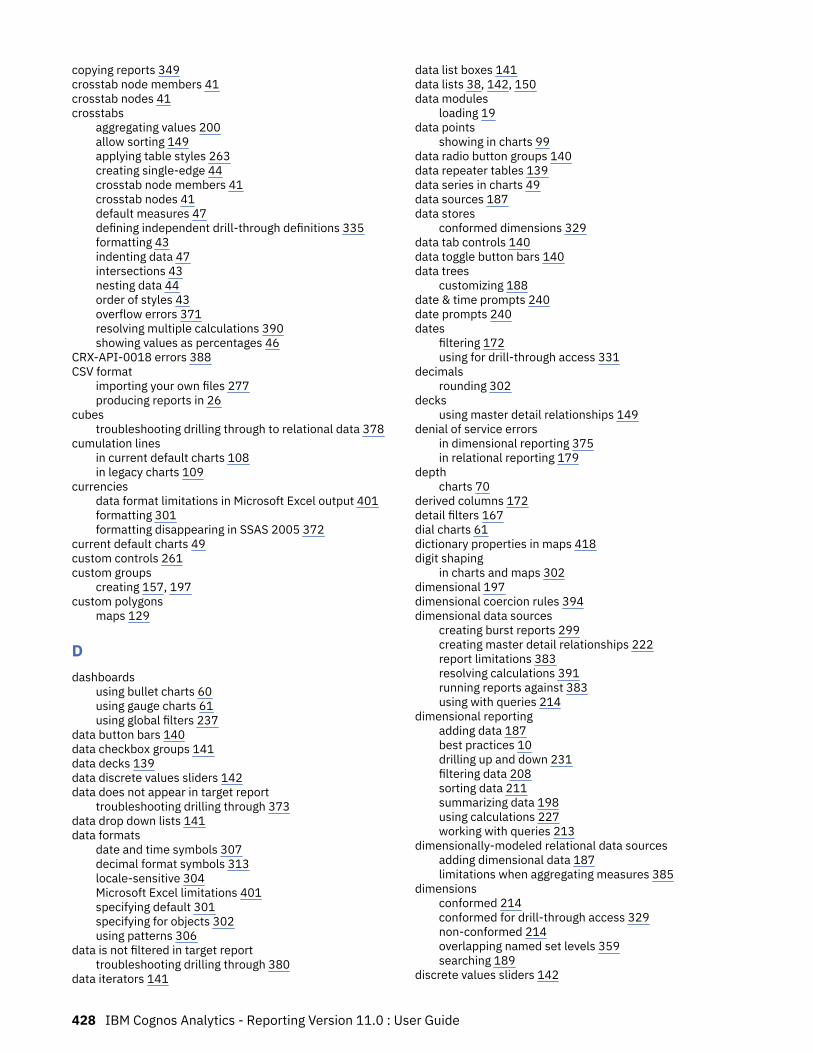
copying reports 349crosstab node members 41crosstab nodes 41crosstabs
aggregating values 200allow sorting 149applying table styles 263creating single-edge 44crosstab node members 41crosstab nodes 41default measures 47defining independent drill-through definitions 335formatting 43indenting data 47intersections 43nesting data 44order of styles 43overflow errors 371resolving multiple calculations 390showing values as percentages 46
CRX-API-0018 errors 388CSV format
importing your own files 277producing reports in 26
cubestroubleshooting drilling through to relational data 378
cumulation linesin current default charts 108in legacy charts 109
currenciesdata format limitations in Microsoft Excel output 401formatting 301formatting disappearing in SSAS 2005 372
current default charts 49custom controls 261custom groups
creating 157, 197custom polygons
maps 129
Ddashboards
using bullet charts 60using gauge charts 61using global filters 237
data button bars 140data checkbox groups 141data decks 139data discrete values sliders 142data does not appear in target report
troubleshooting drilling through 373data drop down lists 141data formats
date and time symbols 307decimal format symbols 313locale-sensitive 304Microsoft Excel limitations 401specifying default 301specifying for objects 302using patterns 306
data is not filtered in target reporttroubleshooting drilling through 380
data iterators 141
data list boxes 141data lists 38, 142, 150data modules
loading 19data points
showing in charts 99data radio button groups 140data repeater tables 139data series in charts 49data sources 187data stores
conformed dimensions 329data tab controls 140data toggle button bars 140data trees
customizing 188date & time prompts 240date prompts 240dates
filtering 172using for drill-through access 331
decimalsrounding 302
decksusing master detail relationships 149
denial of service errorsin dimensional reporting 375in relational reporting 179
depthcharts 70
derived columns 172detail filters 167dial charts 61dictionary properties in maps 418digit shaping
in charts and maps 302dimensional 197dimensional coercion rules 394dimensional data sources
creating burst reports 299creating master detail relationships 222report limitations 383resolving calculations 391running reports against 383using with queries 214
dimensional reportingadding data 187best practices 10drilling up and down 231filtering data 208sorting data 211summarizing data 198using calculations 227working with queries 213
dimensionally-modeled relational data sourcesadding dimensional data 187limitations when aggregating measures 385
dimensionsconformed 214conformed for drill-through access 329non-conformed 214overlapping named set levels 359searching 189
discrete values sliders 142
428 IBM Cognos Analytics - Reporting Version 11.0 : User Guide

distributing reports,, See burst reportsdividing by zero
troubleshooting 357Don't Print class 273drilling down
creating drill-up/drill-down reports 232in charts 110using member sets 231
drilling throughbusiness keys 330calculations do not appear in target report 380concepts 326creating drill-through reports 331cubes to relational data 378data does not appear in target report 373data is not filtered in target report 380defining different drill-through definitions for crosstabs335in maps 420links not active in Safari Web browsers 373members and values 328Microsoft Excel limitations 402model-based access 326multiple values 332nested crosstab only filters on some items 380packages 327paths 326PowerCubes and packages 331problems with active reports 380relational data to cubes 379report formats 326report-based access 326selection contexts 326specifying drill-through text 335troubleshooting PowerCubes 377using bookmarks 327using dates 331using member unique names 328using scope in model-based reporting 330using URLs 327with conformed dimensions 329wrong data appears in target report 373
drilling upcreating drill-up/drill-down reports 232in charts 110using member sets 231
drop down listsdefining no list value item 148
drop shadowsadding to legacy chart elements 80
drop shadows in charts 256Dynamic Query Migration validation option 21
Eemailing reports,, See burst reportsempty cells
specifying what appears for empty data containers 305suppressing 304
error messagesCRX-API-0018 388denial of service in dimensional reporting 375denial of service in relational reporting 179HRESULT 367
error messages (continued)missing items 371MSR-PD-0001 281MSR-PD-0012 362MSR-PD-0013 362OP-ERR-0199 357OP-ERR-0201 359OP-ERR-0209 387OP-ERR-0210 387OP-ERR-0212 387OP-ERR-0213 387ORA-00907 371overflow errors in crosstabs 371PCA-ERR-0057 374PCA-ERR-0087 375QE-DEF-0288 371QE-DEF-0478 394ReferenceError: HTMLIsIndexElement is not defined374RQP-DEF-0177 374RSV-SRV-0025 367RSV-SRV-0040 357TypeError: _IS1 is undefined 374UDA-SQL-0114 367, 374UDA-SQL-0206 367UDA-SQL-0564 374
errorsapplication errors upgrading a report 357filtering results in error characters 386null values in count summaries 359out of memory 234, 376parse errors with upgraded reports 371recursive evaluation 374troubleshooting error cells in reports 385
escape charactersin calculations in dimensional reporting 389in calculations in relational reporting 184
examples for relational metadataprompts 320
Excel 2002empty chart produced when too many items on axis 403
expression editorbrowsing data 171creating filters in dimensional reporting 208creating filters in relational reporting 167creating parameters to create prompts 242dimensional coercion rules 394searching for values 361
expressionslength 388using summary functions in relational reporting 161
extended data itemsenabling for new reports 270report option 14
extensible visualizations 113external data
importing your own files 277MSR-PD-0012 error when importing 362MSR-PD-0013 error when importing 362reporting 277
Ffield sets
Index 429

field sets (continued)inserting 258
filled region, See mapsfills
adding to charts 256adding to legacy charts 80
filter textadding 167
filtering-- error characters 386adding filter text 167creating detail filters 167creating global prompts in dashboards 237creating summary filters 167data from SAP BW data sources 387data in dimensional reporting 208data in relational reporting 167date columns 172limitations when specifying the scope 387limitations with dimensional data sources 386members in a set 195multiple-fact queries 214removing or editing 171removing or editing detail filters 171removing or editing summary filters 171suppressing null values 305to top or bottom values 194troubleshooting _make_timestamp columns 367using context filters 209using slicers 209workspaces in Cognos Workspace 34
filtersin_range 248
Filters pane 4first-rows optimization
in dimensional reporting 225in relational reporting 181
floating objects 269fonts
setting in maps 417specifying colors 274specifying for reports 254
footersadding to maps 417adding to reports and lists 253
for clauses 161FOR clauses
incorrect results for OLAP 363limitations when using in summary functions 384
foregroundsadding colors to objects 274
formattingdisappearing in SSAS 2005 372
functionsquality of service indicators in dimensional reporting388quality of service indicators in relational reporting 184
Ggauge charts 61generated prompts 241geospatial data
maps 133
global filters in dashboards 237glossaries
accessing the IBM InfoSphere Information GovernanceCatalog 30
gridlinesadding to charts 86in charts 49major and minor 83
groupingdata in relational reporting 156setting group spans 157troubleshooting incorrect running totals 373troubleshooting nested list reports 357troubleshooting subtotals in grouped lists 358
groupscustom 157, 197
Hheaders
adding to reports and lists 253creating for sets 45
heatmap visualizations 115heights
specifying for objects 269hiding columns
list reports 38hiding objects 290hierarchies
inserting 190highlighting
adding colors to objects 274using conditional styles 285
horizontal pagination 343hotspots 110HRESULT errors 367HTML format
producing reports in 22viewing report pages as tabs 270, 346
HTML itemsinserting 259
hyperlinksbuttons are not supported for Microsoft Excel 402inserting 259
IIBM Cognos Analytics interactive viewer 24IBM Cognos for Microsoft Office
creating reports for 34IBM Cognos Software Development Kit 35IBM Cognos Viewer 24IBM InfoSphere Information Governance Catalog 30iFrame 142images
adding to chart backgrounds 256inserting in backgrounds 256inserting in reports 255Microsoft Excel limitations 399
in_range filters 248indenting
data in crosstabs 47objects 264
430 IBM Cognos Analytics - Reporting Version 11.0 : User Guide

inline objects 8interactive reports 24intersections of members
in dimensional reporting 231interval prompts 241iPhone devices
creating mobile reports for 35iterators 141
JJapanese
Microsoft Excel limitations 401JavaScript
adding 261join relationships
creating in relational reporting 177justification
setting for objects 266
Llabels
customizing in charts 82gauge charts
customizing 103specifying in current default gauge charts 103specifying in legacy gauge charts 104
latitude 128layout
using tables 262layout component caches 266layout component references
inserting 260layouts
adding 291pages 7relating to queries in dimensional reporting 213relating to queries in relational reporting 174report objects 7report structure 251using the page structure view 251
legacy charts 49legends
adding titles in maps 420hiding or showing in maps 416in charts 49in maps 419positioning in current default charts 87
level hierarchies 187levels
member unique names 328limitations
aggregating measures in dimensionally-modeledrelational or relational data sources 385
line breaks 268line charts 54line spacing 268lineage information 28linear scales
showing 83lines
adding regression lines to charts 95
lines (continued)adding regression lines to legacy charts 96changing in charts 83
linking data items for drilling 232list boxes 141list reports
hiding columns 38lists
adding headers and footers 253allow sorting 149applying table styles 263converting to crosstabs 48formatting 37grouping data 156hiding or showing columns 148limitations 383scrollable 38single-edge crosstabs 44subtotals in grouped lists 358See also data lists
literal stringsin calculations in dimensional reporting 389in calculations in relational reporting 184
localeslocale-sensitive properties 304
locking objects 9logarithmic scales
showing 83longitude 128
MManage External Data tool
overview 277Mapbox 129, 130maps
aliases 418ambiguous data 133creating 127, 128, 416custom polygons 129customizing 416dictionary property 418drilling through 420geospatial data 133ignoring data with no features 417legends 419matching data values 418Microsoft Excel limitations 402notes 420point layers 419region layers 418resizing 269showing or hiding properties 416
marginssetting for objects 264
Marimekko charts 64markers
adding to charts 92master detail relationships
creating in dimensional reporting 220creating in relational reporting 178creating when authoring active reports 149denial of service errors in dimensional reporting 375denial of service errors in relational reporting 179
Index 431

master detail relationships (continued)linking members from two dimensional data sources222using to join page sets 339
matrixcharts 101
matrix reports 41MDX
adding your own in dimensional reporting 223converting to in dimensional reporting 224working with in dimensional reporting 223
measuresspecifying defaults 47
member propertiesinserting 191
member setsaggregating 202creating 191, 232
member unique namesrelational metadata 328troubleshooting running reports with 397
membersdrill-through access 328excluding 194expanding and collapsing 196folder 187inserting properties 191intersections in dimensional reporting 231moving 194
metrics range charts 65MHT
saving active reports 153microcharts
adding to data lists 150inserting 109
Microsoft Excelchart legend titles not supported 403limitations of nested report objects 402producing reports in 26report limitations 399
missing itemstroubleshooting 371
missing valuessuppressing 304
mobile devicescreating reports for 35
modelsaggregation properties 161using design filters 22
moving averages 203MSR-PD-0001 errors 281MSR-PD-0012 errors 362MSR-PD-0013 errors 362multilingual reports 291MUNs,, See member unique namesMy Data Sets tool
overview 277My parameters panel 238
Nnamed sets
limitations when summarizing 199nested or parallel sets overlapping 359
namesupdating references 354
native SQLin dimensional reporting 223in relational reporting 180
nested crosstab only filters on some itemstroubleshooting drilling through 380
nested list reportsnot running after upgrading 357
nested report objectsMicrosoft Excel limitations 402
nested setsunexpected summary values 362
nestingdata in crosstabs 44
no dataspecify not to render pages 25specifying what appears 305
No Data Contents 305notes
adding to charts 89adding to maps 420
null valuescalculations with SAP BW data sources 363suppressing 304suppressing with filters 305troubleshooting in count summaries 359
number data formatsMicrosoft Excel limitations 401
numeric shaping, See digit shaping
Oobjects
adding 7aligning 262as containers 9finding in reports 9hiding and showing 290hierarchies 9indenting 264inheriting formatting from parents 9inline or block 8inserting formatting objects 258locking and unlocking 9reusing for layouts 265specifying data format 302updating reused 266
OLAP data sourcesinserting data 187limitations with relational functions 385
OP-ERR-0199 errors 357OP-ERR-0201 errors 359OP-ERR-0209 errors 387OP-ERR-0210 errors 387OP-ERR-0212 errors 387OP-ERR-0213 errors 387opening reports
from other studios 350ORA-00907 errors 371Oracle data sources
troubleshooting 371Oracle Essbase
changes 359
432 IBM Cognos Analytics - Reporting Version 11.0 : User Guide

out of memory errors 234overflow errors in crosstabs 371
Ppackages
changing 355deleting 19drilling through 327loading 19referencing items in child queries 177replacing 19
packed bubble visualizations 117padding
applying to objects 264page breaks
controlling 270creating 337, 338creating with page layers 340
page layers 340page numbers
adding 343modifying with options 343
page setscreating 337joining nested page sets 339
pagesadding 337associating queries with 337not rendering when there is no data 25viewing as tabs in HTML output 270, 346
paginationhorizontal in PDF output 343specifying for HTML output 270
palettesconditional 76customizing in charts 74
parameter valuesclearing 22
parametersfor prompts 242using in master detail relationships in dimensionalreporting 220using in master detail relationships in relationalreporting 178
Pareto chartscumulation lines in current default charts 108cumulation lines in legacy charts 109
PCA-ERR-0057 errors 374PCA-ERR-0087 375PDF format
producing reports 22PDF problems
charts 376percent calculations
in dimensional reporting 227in relational reporting 183
performance details 28pie charts
converting to current default donut charts 106exploding slices in current default charts 107limitations for Microsoft Excel outputs 400setting the first slice angle in current default charts 106
point charts 57
point layers 419polar charts 64polygon, See mapsPowerCubes
incorrect results 363troubleshooting drilling through 377
Preview viewactive reports 151
printingnot printing objects 273
progressive column charts 62prompt pages
creating your own 239prompt texts
customizing 246prompts
adding prompt buttons 247changing prompt control interfaces 244creating cascading 247creating in a report page 243creating using query macros 318date 240date & time 240examples 320generated 241in_range 248interval 241modifying 244pages 239parameters 242requiring user input 244select & search 240selecting multiple values 245showing and hiding 245showing values in generated SQL or MDX 249specifying default selections 245specifying default values 246text box 240time 240tree 248using context filters 210using slicer filters 210using the Build Prompt Page tool 239using the expression editor 242value 240workspaces in Cognos Workspace 33See also active reports, linking to other reports orexternal web pages
Properties 174Properties menu 4public variables
defining in active reports 137
QQE-DEF-0288 errors 371QE-DEF-0478 errors 394quadrant charts 60quadrants
adding to current default charts 81queries
associating with pages 337connecting between data sources in dimensionalreporting 214
Index 433

queries (continued)connecting between data sources in relational reporting174in dimensional reporting 213in relational reporting 173multiple-fact 214referencing data items in dimensional reporting 213referencing data items in relational reporting 174referencing package items in child queries 177relating to layouts in dimensional reporting 213relating to layouts in relational reporting 174result set of multi-fact query contains blanks 376using with dimensional data sources 214working with MDX in dimensional reporting 223working with SQL in dimensional reporting 223working with SQL in relational reporting 179
query calculationscreating in dimensional reporting 228creating in relational reporting 184null values in count summaries 359
query contextdefining in charts 98
Query Explorerusing in dimensional reporting 213using in relational reporting 173
query macrosadding 317using to create prompts 318
Query Studiotemplates 19
quotation marksin calculations in dimensional reporting 389in calculations in relational reporting 184
Rradar charts 64radio button groups 140ragged hierarchies 196referenced objects
changing 265updating 266
referenced report styles 272region layers 418regression lines
in current default charts 95in legacy charts 96
relational functionslimitations when used with OLAP data sources 385
relational reportingadding data 155best practices 10filtering data 167grouping data 156sorting data 172summarizing data 159troubleshooting drilling through to cubes 379using calculations 182working with queries 173
Render Page when Empty 25repeater tables 139repeaters
formatting 263Report
Report (continued)maps
creating 130report booklets 345report formats
CSV 26Excel 26HTML 22PDF 22specifying 22XML 27
report prompts 142report properties 270report specifications 35report styles
reusing 272Reporting
setting options 12reports
active 135adding data 19adding interactivity 137adding JavaScript 261changing the maximum number of tuples allowed 375converting to active reports 136creating booklets 345creating page breaks 338formatting changes when upgrading 372multilingual 291out of memory errors in interactive HTML output 376setting interactivity level 24supporting bidirectional languages 31tabbed 346templates 19themes 19validating 21validation options 21
resizingcurrent default charts 73legacy charts 74objects 269
reusingstyles 252
rich text itemsinserting 259supported elements 260
rolling averages 203rollup calculations
in dimensional reporting 227in relational reporting 183
round-off errors 365rounding numbers 302row numbers
inserting 260rows
swapping with columns 47rows per page
controlling for multiple containers in HTML and PDF 25setting 22
RQP-DEF-0177 errors 374RSV-SRV-0025 errors 367RSV-SRV-0040 errors 357running and moving summaries
limitations with dimensional functions 389
434 IBM Cognos Analytics - Reporting Version 11.0 : User Guide

running reportsagainst dimensional data sources 383against SAP BW 383cannot find database errors 371IBM Cognos Analytics interactive viewer 24IBM Cognos Viewer 24ORA-00907 errors 371Reporting is slow 367
running totalsdimensional functions 227troubleshooting 373
SSafari Web browsers
drill-through links not active 373SAP BW data sources
creating burst reports 299creating expression 389large queries 375limitations when calculating data 182limitations when sorting data 211null results 363query calculations 359running reports against 383sectioning reports 360units of measure notation 383
SAP variable propertiesunsupported 383
scaleschanging for chart axes 84changing intervals 83linear 83logarithmic 83
scatter charts 58scope
filtering 167using in drill-through access 330
scrollbarsadding to block objects 269adding to lists 38See also data lists
searchingdimensions 189
section headings 158sections
creating for dimensional data 340creating on reports with SAP BW data sources 360removing 158
Secure Socket LayerMicrosoft Excel limitations 401
select & search prompts 240set definitions 193set expressions
building in dimensional reporting 228limitations in list reports 383
setsediting 193filtering 195reusing 191, 192sharing 191, 192
sets of memberscreating 191nested or parallel sets overlapping 359
shared setscopying 192creating 191managing 192
sharingsets 191, 192
showing objects 290single-edge crosstabs 44singletons 20sizes
specifying for objects 269slicer filters
prompting with 210slicers
creating 209solve order
combined with calculated rollup aggregate function 391dimensional data sources 391
sortingcrosstabs 149data in dimensional reporting 211data in relational reporting 172limitations with SAP BW data sources 211lists 149multiple columns in dimensional reporting 212multiple columns in relational reporting 173visualizations 124
source treescustomizing 188
spacesadding around objects 264
Specifying chart properties 51spider charts 64SQL
adding your own in dimensional reporting 223adding your own in relational reporting 180Cognos in dimensional reporting 223Cognos in relational reporting 180converting to in dimensional reporting 224converting to in relational reporting 181first-rows optimization in dimensional reporting 225first-rows optimization in relational reporting 181native in dimensional reporting 223native in relational reporting 180working with in dimensional reporting 223working with in relational reporting 179
SSAS 2005 cubestroubleshooting 360
SSAS 2005 data sourcescreating expression 390disappearing data formats 372
SSAS cubesproblems when very large 234
stacked charts 66standard charts 65star charts 64strings
concatenating 390studios
Oracle Essbase changes 359styles
conditional 285reusing 252, 272
subtotals
Index 435
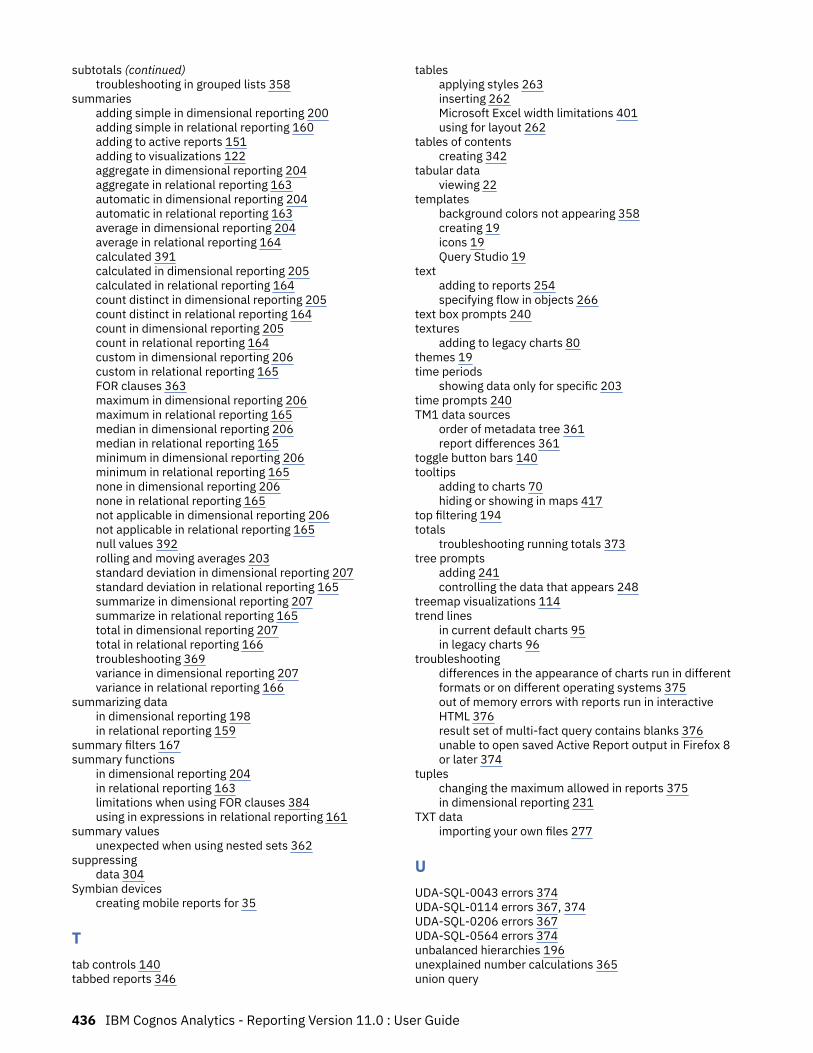
subtotals (continued)troubleshooting in grouped lists 358
summariesadding simple in dimensional reporting 200adding simple in relational reporting 160adding to active reports 151adding to visualizations 122aggregate in dimensional reporting 204aggregate in relational reporting 163automatic in dimensional reporting 204automatic in relational reporting 163average in dimensional reporting 204average in relational reporting 164calculated 391calculated in dimensional reporting 205calculated in relational reporting 164count distinct in dimensional reporting 205count distinct in relational reporting 164count in dimensional reporting 205count in relational reporting 164custom in dimensional reporting 206custom in relational reporting 165FOR clauses 363maximum in dimensional reporting 206maximum in relational reporting 165median in dimensional reporting 206median in relational reporting 165minimum in dimensional reporting 206minimum in relational reporting 165none in dimensional reporting 206none in relational reporting 165not applicable in dimensional reporting 206not applicable in relational reporting 165null values 392rolling and moving averages 203standard deviation in dimensional reporting 207standard deviation in relational reporting 165summarize in dimensional reporting 207summarize in relational reporting 165total in dimensional reporting 207total in relational reporting 166troubleshooting 369variance in dimensional reporting 207variance in relational reporting 166
summarizing datain dimensional reporting 198in relational reporting 159
summary filters 167summary functions
in dimensional reporting 204in relational reporting 163limitations when using FOR clauses 384using in expressions in relational reporting 161
summary valuesunexpected when using nested sets 362
suppressingdata 304
Symbian devicescreating mobile reports for 35
Ttab controls 140tabbed reports 346
tablesapplying styles 263inserting 262Microsoft Excel width limitations 401using for layout 262
tables of contentscreating 342
tabular dataviewing 22
templatesbackground colors not appearing 358creating 19icons 19Query Studio 19
textadding to reports 254specifying flow in objects 266
text box prompts 240textures
adding to legacy charts 80themes 19time periods
showing data only for specific 203time prompts 240TM1 data sources
order of metadata tree 361report differences 361
toggle button bars 140tooltips
adding to charts 70hiding or showing in maps 417
top filtering 194totals
troubleshooting running totals 373tree prompts
adding 241controlling the data that appears 248
treemap visualizations 114trend lines
in current default charts 95in legacy charts 96
troubleshootingdifferences in the appearance of charts run in differentformats or on different operating systems 375out of memory errors with reports run in interactiveHTML 376result set of multi-fact query contains blanks 376unable to open saved Active Report output in Firefox 8or later 374
tupleschanging the maximum allowed in reports 375in dimensional reporting 231
TXT dataimporting your own files 277
UUDA-SQL-0043 errors 374UDA-SQL-0114 errors 367, 374UDA-SQL-0206 errors 367UDA-SQL-0564 errors 374unbalanced hierarchies 196unexplained number calculations 365union query
436 IBM Cognos Analytics - Reporting Version 11.0 : User Guide

union query (continued)creating 176
units of measurenotation for SAP BW data sources 383
unlocking objects 9upgrading reports
applications errors 357formatting not retained 372reports will not open 371
user interface 1
Vvalidating reports 21value markers
showing in charts 99value prompts 240values
showing crosstab values as percentages 46specifying defaults in prompts 246
variable text items 139variables
active reports 136, 137adding 289conditional styles 288
viewing reportstroubleshooting 371
viewspage design view 6page preview 6page structure view 6
visual aids 5visualizations
adding 113changing the nesting order 120choosing where to render 119converting 123extensible 113resizing 120sorting 124specifying the categorical data to display 121specifying the range of values to display 121summarizing data 122updating 123using embedded data 123working with visualization properties 119
Wwaterfall charts 62Web browser settings 16white spaces
adding padding to objects 264margins 264
widthsMicrosoft Excel limitations 401specifying for objects 269
win-loss charts 63Windows Mobile devices
creating mobile reports for 35word breaks 268workspaces
Cognos Workspace 32
workspaces (continued)prompts in Cognos Workspace 33
wrong data appears in target reporttroubleshooting drilling through 373
XXLS format
importing your own files 277limitations 399
XMLimporting your own files 277producing a report 27report specifications 35
XQE-CON-0007 errors 375
Zzeros
suppressing 304
Index 437

438 IBM Cognos Analytics - Reporting Version 11.0 : User Guide


IBM®
Copyright © 2022 FDOKUMEN