Utilizing Web Analytics in the Context of Learning Analytics for ...
10
Utilizing Web Analytics in the Context of Learning Analytics for Large-Scale Online Learning Tobias Rohloff Hasso Plattner Institute Potsdam, Germany [email protected] S¨ oren Oldag Hasso Plattner Institute Potsdam, Germany [email protected] Jan Renz Hasso Plattner Institute Potsdam, Germany [email protected] Christoph Meinel Hasso Plattner Institute Potsdam, Germany [email protected] Abstract—Today, Web Analytics (WA) is commonly used to obtain key information about users and their behavior on websites. Besides, with the rise of online learning, Learning Analytics (LA) emerged as a separate research field for collecting and analyzing learners’ interactions on online learning platforms. Although the foundation of both methods is similar, WA has not been profoundly used for LA purposes. However, especially large-scale online learning environments may benefit from WA as it is more sophisticated and well-established in comparison to LA. Therefore, this paper aims to examine to what extent WA can be utilized in this context, without compromising the learners’ data privacy. For this purpose, Google Analytics was integrated into the Massive Open Online Course platform of the Hasso Plattner Institute as a proof of concept. It was tested with two deployments of the platform: openHPI and openSAP, where thousands of learners gain academic and industry knowledge about engineering education. Besides capturing behavioral data, the platforms’ existing LA dashboards were extended by WA metrics. The evaluation of the integration showed that WA covers a large part of the relevant metrics and is particularly suitable for obtaining an overview of the platform’s global activity, but reaches its limitations when it comes to learner-specific metrics. Keywords—Learning Analytics, Web Analytics, Learning Dashboards, MOOCs, Online Learning Environments I. I NTRODUCTION With the rise of the World Wide Web, the need of website operators to gather information about users and their behavior arose. To satisfy this demand, the field of Web Analytics (WA) emerged. Originally intended for e-commerce websites, it captures users’ interactions and reveals valuable insights about the audience and their activity. Therefore, it has especially gained attention from business corporations, which utilize WA for decision-making processes. Consequently, WA rapidly evolved and is a common technique today that is widely used and no longer restricted to e-commerce websites only [1]. The development of the Internet also results in learning being revolutionized. While facilitated or blended learning takes place online only partly, Massive Open Online Courses (MOOCs) are usually held exclusively on the Internet. MOOCs enable anyone in participating in online courses similar to actual university courses. Therefore, they have to deal with a large scale of learners with different backgrounds from all over the world [2]. Besides the benefits and potential of these new forms of learning, they also bear new challenges. In a traditional classroom setup, instructors can observe their stu- dents face-to-face. However, in online courses teachers cannot directly watch students while learning. Therefore, monitoring systems are needed, which keep track of learners’ progress and interactions. For this purpose, the field of Learning Analytics (LA) emerged for collecting and analyzing data of learners with the goal to support their learning process [2]. WA and LA are subtypes of the general field of analytics and are thus related to each other. Both methods gather and analyze data about users and their interactions on online platforms to understand the audience and their behavior. This data is eventually utilized to derive actions for optimizations. Even though the underlying objective differs, LA may benefit from integrating WA. While LA is a relatively new and active research field, WA is sophisticated and well-established meanwhile. Thus, by using it for analyzing the behavior of learners one could take advantage of its advanced develop- ment. Nevertheless, WA tools have not been profoundly used for this purpose, so far [3]. Therefore, this paper examines the research question: RQ1 To what extend can Web Analytics methods be used in the context of Learning Analytics to gather insights in learning behavior and outcome on e-learning platforms? Addressing this question involves considering sub-questions, which focus on different aspects of the main problem: RQ1.a Can online learning activity be mapped to Web Ana- lytics concepts? RQ1.b How can different stakeholders of e-learning platforms be provided with Web Analytics insights? RQ1.c Can Web Analytics methods improve the usefulness of Learning Analytics insights? To answer these questions, a WA tool is integrated exem- plarily into the white label MOOC platform of the Hasso Plattner Institute (HPI) [4] as a proof of concept. It was evaluated with two deployments of the platform: openHPI and openSAP, where thousands of learners gain academic and industry knowledge about engineering education. For testing the integration of WA, dashboards are used as a typical use case for analytics in general. The applicability of WA in the context of LA is evaluated by discussing potentials and limitations of WA by reference to the proof of concept. Besides, the usability of the revised dashboards is evaluated by conducting an expert survey. 978-1-5386-9506-7/19/$31.00 ©2019 IEEE 9–11 April, 2019 – American University in Dubai, Dubai, UAE 2019 IEEE Global Engineering Education Conference (EDUCON) Page 303
-
Upload
khangminh22 -
Category
Documents
-
view
1 -
download
0
Transcript of Utilizing Web Analytics in the Context of Learning Analytics for ...

Utilizing Web Analytics in the Context of LearningAnalytics for Large-Scale Online Learning
Tobias RohloffHasso Plattner Institute
Potsdam, [email protected]
Soren OldagHasso Plattner Institute
Potsdam, [email protected]
Jan RenzHasso Plattner Institute
Potsdam, [email protected]
Christoph MeinelHasso Plattner Institute
Potsdam, [email protected]
Abstract—Today, Web Analytics (WA) is commonly used toobtain key information about users and their behavior onwebsites. Besides, with the rise of online learning, LearningAnalytics (LA) emerged as a separate research field for collectingand analyzing learners’ interactions on online learning platforms.Although the foundation of both methods is similar, WA hasnot been profoundly used for LA purposes. However, especiallylarge-scale online learning environments may benefit from WAas it is more sophisticated and well-established in comparisonto LA. Therefore, this paper aims to examine to what extentWA can be utilized in this context, without compromising thelearners’ data privacy. For this purpose, Google Analytics wasintegrated into the Massive Open Online Course platform of theHasso Plattner Institute as a proof of concept. It was tested withtwo deployments of the platform: openHPI and openSAP, wherethousands of learners gain academic and industry knowledgeabout engineering education. Besides capturing behavioral data,the platforms’ existing LA dashboards were extended by WAmetrics. The evaluation of the integration showed that WA coversa large part of the relevant metrics and is particularly suitablefor obtaining an overview of the platform’s global activity, butreaches its limitations when it comes to learner-specific metrics.
Keywords—Learning Analytics, Web Analytics, LearningDashboards, MOOCs, Online Learning Environments
I. INTRODUCTION
With the rise of the World Wide Web, the need of websiteoperators to gather information about users and their behaviorarose. To satisfy this demand, the field of Web Analytics (WA)emerged. Originally intended for e-commerce websites, itcaptures users’ interactions and reveals valuable insights aboutthe audience and their activity. Therefore, it has especiallygained attention from business corporations, which utilizeWA for decision-making processes. Consequently, WA rapidlyevolved and is a common technique today that is widely usedand no longer restricted to e-commerce websites only [1].
The development of the Internet also results in learningbeing revolutionized. While facilitated or blended learningtakes place online only partly, Massive Open Online Courses(MOOCs) are usually held exclusively on the Internet. MOOCsenable anyone in participating in online courses similar toactual university courses. Therefore, they have to deal witha large scale of learners with different backgrounds from allover the world [2]. Besides the benefits and potential of thesenew forms of learning, they also bear new challenges. In atraditional classroom setup, instructors can observe their stu-dents face-to-face. However, in online courses teachers cannot
directly watch students while learning. Therefore, monitoringsystems are needed, which keep track of learners’ progress andinteractions. For this purpose, the field of Learning Analytics(LA) emerged for collecting and analyzing data of learnerswith the goal to support their learning process [2].
WA and LA are subtypes of the general field of analyticsand are thus related to each other. Both methods gather andanalyze data about users and their interactions on onlineplatforms to understand the audience and their behavior. Thisdata is eventually utilized to derive actions for optimizations.Even though the underlying objective differs, LA may benefitfrom integrating WA. While LA is a relatively new andactive research field, WA is sophisticated and well-establishedmeanwhile. Thus, by using it for analyzing the behavior oflearners one could take advantage of its advanced develop-ment. Nevertheless, WA tools have not been profoundly usedfor this purpose, so far [3]. Therefore, this paper examines theresearch question:
RQ1 To what extend can Web Analytics methods be used inthe context of Learning Analytics to gather insights inlearning behavior and outcome on e-learning platforms?
Addressing this question involves considering sub-questions,which focus on different aspects of the main problem:
RQ1.a Can online learning activity be mapped to Web Ana-lytics concepts?
RQ1.b How can different stakeholders of e-learning platformsbe provided with Web Analytics insights?
RQ1.c Can Web Analytics methods improve the usefulnessof Learning Analytics insights?
To answer these questions, a WA tool is integrated exem-plarily into the white label MOOC platform of the HassoPlattner Institute (HPI) [4] as a proof of concept. It wasevaluated with two deployments of the platform: openHPIand openSAP, where thousands of learners gain academic andindustry knowledge about engineering education. For testingthe integration of WA, dashboards are used as a typicaluse case for analytics in general. The applicability of WAin the context of LA is evaluated by discussing potentialsand limitations of WA by reference to the proof of concept.Besides, the usability of the revised dashboards is evaluatedby conducting an expert survey.
978-1-5386-9506-7/19/$31.00 ©2019 IEEE 9–11 April, 2019 – American University in Dubai, Dubai, UAE2019 IEEE Global Engineering Education Conference (EDUCON)
Page 303
II. RELATED WORK
In general, WA is widely used on the Internet. However,there has not been much research in making use of WAcapabilities for analyzing learner’s behavior on e-learningplatforms so far. Previous work related to this topic was stillreviewed and is presented in this section.
Cooper [3] claims that the reasons for the missing utilizationof WA tools in the e-learning context are mainly privacyconcerns regarding collected activity data. As the majority ofWA tools stores behavioral data on external servers, controlover captured data is lost. Open-source alternatives, suchas Matomo, enable operators to control the collected data.However, according to the authors tracking of these tools isusually less fine-grained. In general, WA does not meet allneeds of LA as it does not cover all information of a learningprocess that might be useful.
Moissa et al. [5] developed a visualization tool for behav-ioral data collected in the e-learning environment AdaptWebthat uses Piwik (now Matomo) to capture and store analyticsevents. Besides the WA tool, the implemented application alsoretrieves data from the existing database of the platform. Thetool provides 20 metrics by combining both data sources.However, the paper does not reveal, which metrics are basedon Piwik and which are computed by querying the localdatabase. In addition, evaluation and limitations of the useof WA in the e-learning context are not discussed as well.
Romanowski and Konak [2] integrated Google Analyticsinto the website of a course of the Penn State University tounderstand how students interact with it. For data collection,page tagging was used. Different pages and contents werecompared in regard to the number of page views and the aver-age time on page to discover which features of the website aremost effective. The authors concluded that Google Analyticscan gather enough data to understand learners’ behavior, butshould be combined with further log data of the platform itselfto accomplish comprehensive analysis results.
Luo et al. [6] conducted a case study to ascertain potentialsand limitations of utilizing Google Analytics for LA purposesin the context of advanced degree online programs. Activityof students of an online course of the Pennsylvania StateUniversity was captured using page tagging. For analysis, theresearchers considered learner demographics, traffic metrics,efforts of learners, sequence of interactions with contents, andused technology. According to the authors, Google Analytics iswell suited for providing an overview of learning processes one-learning platforms. However, it can not be used to generatepersonalized learning reports. Therefore, they inferred thatusing Google Analytics alone might be to limiting.
In contrast to the assumption of Cooper, several big MOOCplatforms have integrated Google Analytics in their websites.A manual examination revealed that edX, Coursera, and Udac-ity have included the Google Analytics page-tagging snippetin their website. EdX specifies in their developer’s guide thatGoogle Analytics is used to track all page views and obtainmetrics, such as referrers and search terms, used to find the
website [7]. Consequently, WA is not used for improving thelearning experience of users, but to measure and increaseawareness of the platform. However, the other providers donot state their actual intentions and purposes for using WA.
It can be summarized that an integration of WA tools for LApurposes was done only in a basic scope so far. Related workis limited to collecting behavioral data using page taggingand analyzing a fundamental choice of different dimensionsand metrics. Although privacy concerns of page tagging arediscussed, other data collection methods were not consideredin this context, yet. Some limitations of using WA in thecontext of e-learning were ascertained. Using WA alone mightbe too limiting to analyze learners’ behavior in its entirety.Instead, it could be used in combination with additional LAcapabilities to achieve comprehensible results.
Compared with the related work, this paper considers thefull potential of WA by taking into account different tools, datacollection methods, and analysis capabilities. Consequently,results could become more meaningful and universal. How-ever, limitations identified by the presented papers might bevalid for this approach as well.
III. PRIVACY CONCERNS
When analyzing user activity, a huge amount of data aboutusers and their behaviors is collected and stored. Therefore,privacy laws have to be considered when integrating LA or WAinto a website. Applicable regulations depend on the type ofdata that is processed. When collecting only anonymous data,information about individual users cannot be derived and theirprivacy is not affected. Consequently, data privacy laws areonly relevant if collected data contains Personally IdentifiableInformation (PII). For this paper, utilization of WA tools isevaluated using the example of the HPI MOOC platform.Therefore, only applicable regulations were examined in thefollowing. As the service is based in Germany, the EuropeanUnion’s General Data Protection Regulation (GDPR) is thelaw in force for governing processing of personal data.
Art. 4 GDPR defines personal data as ”any informationrelating to an identified or identifiable natural person (’datasubject’)” and an identifiable natural person as ”one who canbe identified, directly or indirectly, in particular by referenceto an identifier such as a name, an identification number,location data, an online identifier or to one or more factorsspecific to the [...] identity of that natural person”. Collectingthis kind of data is allowed only if any of the prerequisiteslisted in Art. 6 GDPR is fulfilled. Among others, this mightbe the explicit consent of the data subject or the necessityof data processing for purposes based on legitimate interestsof the controller. As LA is exclusively used for improvingthe learning experience of users and optimizing the platform,it is considered as a legitimate interest. Therefore, collectingand processing behavioral data for these purposes is allowedand does not require an explicit consent of the learners. Thisalso applies to the envisaged utilization of WA in context ofthis paper, where additional pseudonymization techniques areapplied.
978-1-5386-9506-7/19/$31.00 ©2019 IEEE 9–11 April, 2019 – American University in Dubai, Dubai, UAE2019 IEEE Global Engineering Education Conference (EDUCON)
Page 304
IV. CONCEPT AND IMPLEMENTATION
To evaluate the applicability of WA in context of LA andthus answer the main research question of this paper, a WAtool is integrated into the HPI MOOC platform as a proofof concept. Therefore, this section presents the concept andimplementation for realization of this goal.
A. Choice of Web Analytics Service
There is a great number of different analytics suites avail-able that can be used for analysis of learners’ behavior. Eventhough this work aims to evaluate the utilization of WA toolsfor this purpose only, there are still many services to choosefrom. We decided to integrate only one of these as an exampleand representative for WA tools in general, as their corefeatures are mainly the same. However, there are differencesin regard to more specific and advanced analysis capabilities,processing limitations, and pricing models. We evaluated theproprietary tools Google Analytics and Adobe Analytics, andMatomo as an open source alternative.
Google Analytics is well-established as it is the mostpopular WA tool. Consequently, it is a paragon in its fieldand therefore well suited for examining the applicability ofWA for LA purposes in general. It comes with a wide rangeof features, which enable evaluation of different aspects ofWA. Even though Adobe Analytics still exceeds these anal-ysis capabilities, the majority of additional features are notapplicable in the context of e-learning. Furthermore, AdobeAnalytics is highly complex and not as good documentedas Google Analytics. Therefore, integration of it would bemore complicated and costly. In contrast to the traditional,self-hosted setup of Matomo, Google Analytics and AdobeAnalytics run on servers in the cloud. As a consequence, itdoes not have to be taken care of deployment and maintenanceof the services. Furthermore, the corresponding machines arehighly performant, which results in relative short responsetimes even for more complex computations. Nevertheless, dataprivacy might be an issue when storing user activity data onexternal servers, especially when they are located outside theEuropean Union (EU). All in all, Google Analytics is the bestsuited WA tool for the purpose of this work when the dataprivacy concerns are addressed, as it supports a broad rangeof functions, is easy to set up, and satisfies the needs andrequirements for integration into the existing infrastructure andarchitecture of the platform. As the general concepts and mainfeatures of WA are the same for all related tools, the findingsof this paper are for the most part also valid for the utilizationof WA in context of LA in general.
B. Integration and Data Collection
This section presents a concept for collecting user interac-tion data on the HPI MOOC platform and transmitting it toGoogle Analytics as foundation for further analysis tasks.
1) Processing Pipeline: There are different data collectionmethods available in Google Analytics. The most common andeasiest one is page tagging, which requires to insert a smallJavaScript snippet provided by Google Analytics into each
page. This snippet takes care of gathering needed data andsending it to the WA service. Although integration using thistechnique is simple and effortless, it comes with some issues.Page tagging slightly increases page loading times as anotherJavaScript file needs to be loaded and executed. Besides, theexisting data collection procedure cannot be used as pagetagging would incorporate a separate event tracking. Moreover,page tagging cannot be used properly in the native apps, wheremobile SDKs would have to be utilized. This would cause codeduplication and is vulnerable for inconsistencies between thedifferent clients. Besides these technical issues, there are alsoprivacy concerns in regard to page tagging as control over datathat is sent to the service would be lost.
The HPI MOOC platform already has an analytics infras-tructure [8], [9], which takes care of tracking and persistingcertain user activities for LA purposes. In the platform’sService Oriented Architecture (SOA), the lanalytics service re-ceives interaction events from any client and executes pipelineseach representing an independent Extract, Transform, Load(ETL) process. Thanks to the flexible and extensible architec-ture, we integrated the data collection for Google Analyticsinto the existing service (Figure 1). Thus, a new pipelinewas added for transforming interaction events according tothe Google Analytics hit schema and emitting them via theGoogle Analytics Measurement Protocol. The pipeline consistsof multiple steps: extraction, enrichment, pseudonymization,schema transformation and batching before transferring them.
Backend
Course Service
Course Service
Database
Account Service
Account Service
DatabaseR R R
Other Services
Other Services
Databases
Message Queue
Web Service API
R R R R
Web Client iOS App Android App
R R R
Learning Analytics Service
Analytics Stores
Analytics Stores
Analytics Stores
External Analytics Suites
R
Fig. 1. Platform’s Architecture with internal and external Analytics Stores
The asynchronous data collection has no impact on theperformance of the website. Since tracking is already imple-mented in the clients, there is no need to adapt either theweb client or mobile apps. Instead, all logic related to GoogleAnalytics is encapsulated in the lanalytics service. Moreover,the basis of data stored locally in analytics stores and hits sentto the WA tool are the same, which prevents inconsistencies.As hits are constructed, pseudonymized and sent manually,we can completely decide, which interaction data is sent toGoogle Analytics. Thus, control over the data that is sent tothird parties is regained.
978-1-5386-9506-7/19/$31.00 ©2019 IEEE 9–11 April, 2019 – American University in Dubai, Dubai, UAE2019 IEEE Global Engineering Education Conference (EDUCON)
Page 305
2) Mapping Analytics Events to Hits: In order to be pro-cessed by Google Analytics, each analytics event needs to betransformed to a hit, which follows the schema defined by theMeasurement Protocol and represents the underlying interac-tion in the best possible way. Therefore, depending on theevent type and available context data appropriate parametersare specified manually based on the different analytics events.In general, each hit has a type indicating the kind of interactionit describes. Some parameters may be set only for specifictypes. The types of hits constructed by the mapping are limitedto pageview and event. All events triggered when a user visits acertain page are mapped to pageview hits. Otherwise genericevent hits are created. To ensure data privacy the SHA-256hash of the user ID is used, which cannot be used by thirdparties to identify the user. Also the IP address and User-Agentare omitted, by sending empty payloads. The implementationof this mapping proves that online learning activity can bemapped to WA concepts, which satisfies RQ1.a. However,creating a generic mapping is virtually impossible as eache-learning platform and WA tool has different data schemasand capabilities. This situation could be improved by using astandardized format on the platform side, like xAPI.
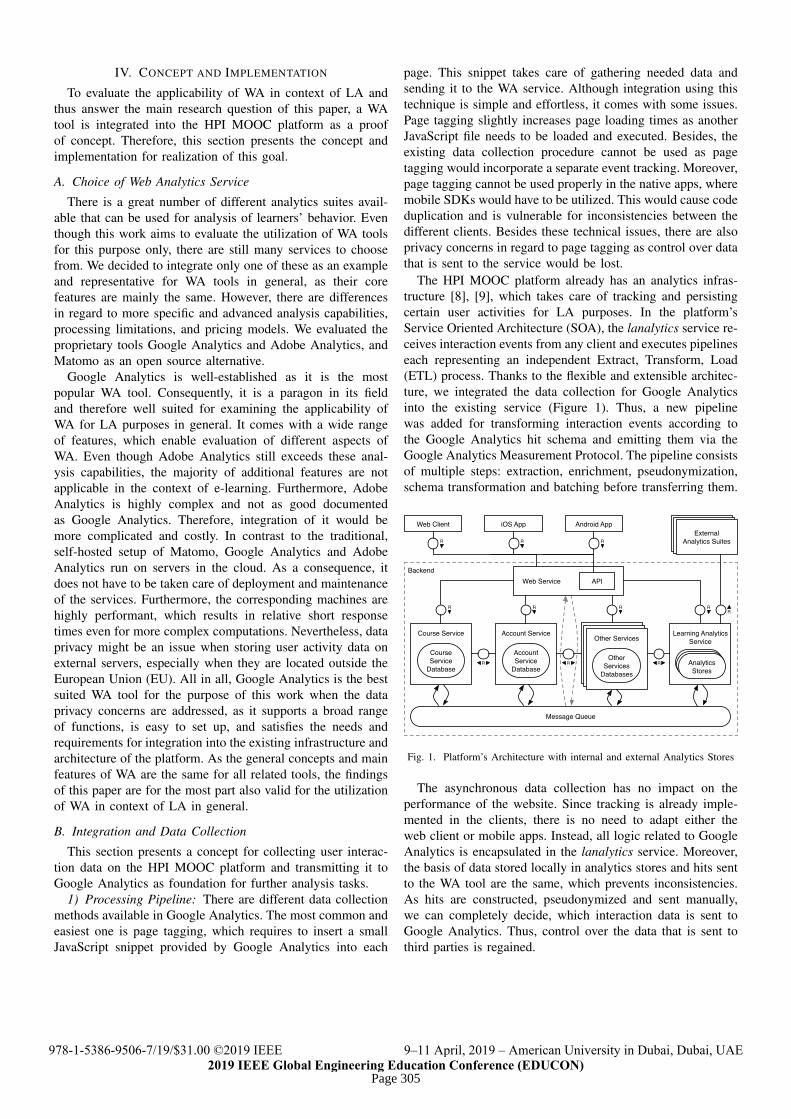
3) Hit Batching and Emitting: The Measurement Protocolsupports sending batches of hits inside a single HypertextTransfer Protocol (HTTP) request. This feature is used in thiscontext to lower the number of requests sent to Google Ana-lytics, and thus increase performance. Batching and emittingof hits with an internal message queue prevents data loss andsimplifies error handling. As requests are sent to an externalservice, connection errors are more likely to occur than it isthe case when accessing local databases. One limitation of theMeasurement Protocol is that it can process only hits that arenot older than four hours [10]. To cope with this restrictionduring low activity times, a timeout less then four hours isassigned to each received hit. If this timeout expires before thehit was emitted, all outstanding hits are dispatched even though
the maximum batch size it not reached, yet. For error handling,a message received by the consumer is acknowledged only ifit was sent successfully to Google Analytics. Consequently,acknowledgement of messages is outstanding as long asthe maximum batch size if not reached. If an error occurswhile sending a batch of hits, the corresponding messagesare negatively acknowledged. This results in the messagesbeing requeued. Consequently, the consumer receives thesemessages again, and thus automatically retries sending themto Google Analytics. Besides, the mentioned data loss issue isprevented. The message queue is configured to be durable, i. e.,store unacknowledged messages on disk [11]. This additionalpersistence layer makes sure, that no hit is getting lost even ifthe lanalytics service, the message broker, or even the machinerunning the service is shut down or crashes. The whole processis visualized in Figure 2.
4) Data Privacy: As discussed, data privacy laws need tobe considered only when processing PII. Therefore, it must bedetermined first, whether PII is collected. As described before,the hashed user ID is sent to Google Analytics. The ID of auser is considered as a pseudonym of the person and thus as PIIaccording to the GDPR. Even though it is sent as a hash, it ispossible for anyone that has access to the platform’s databasesto identify a certain user given its hashed ID by re-computingall hashes. Nevertheless, Google does not have access to theplatform’s databases and consequently cannot identify singleusers. According to the GDPR, location data also belongs topersonal data. As the geographical location is retrieved fromthe user’s IP address, it is only a rough estimation of the cityor the country of the user’s location. Thus, it is not consideredas PII. According to the GDPR, users have the right to receivea copy of collected data about themselves and can claimcorrection and erasure of this data. Google Analytics providesthe possibility to download a file containing all collected dataof a certain user. Besides, the entire personal data of a singleuser can be deleted either in the web frontend or via User
Proc
essi
ng P
ipel
ine
Hits
Em
itter
Transform event to hit
Event messagereceived
Publish hit on message queue
Hit messagereceived
Add hit to memory batching queue
Send batch to Google Analytics
Send positive acknowledgements
Send negative acknowledgements
Max queue time
Pseudonymize dataEnrich context dataExtract event Enrich geographical data
yes
no
Batch size reached?
Hit sent meanwhile?
Sent successfully?no
yes
yes
no
Hit requeued
Hit transmitted
Fig. 2. Process for Interaction Data Collection, Processing, Batching and Emitting to Google Analytics in the Platform’s Lanalytics Service
978-1-5386-9506-7/19/$31.00 ©2019 IEEE 9–11 April, 2019 – American University in Dubai, Dubai, UAE2019 IEEE Global Engineering Education Conference (EDUCON)
Page 306

Deletion API. On request of a user, the person in authoritycan take care of providing the copy of data or deleting thedata of the submitter. Nevertheless, hits once sent to GoogleAnalytics cannot be modified anymore. Therefore, when a userrequests correction of data, it can only be deleted to ensurecorrectness. Google is an US-based company and collecteddata is stored on servers in the US as well. Therefore, specialregulations might apply, because the US is a third countryfrom the perspective of the EU, in which the GDPR is not inforce. However, Google has a Privacy Shield certificate, whichcauses the level of data privacy of the company to be classifiedas appropriate to the GDPR. Thus, an explicit approval of theuser is not necessary.
C. Reporting of Analysis Results
After user interaction data has been collected and analyzed,results need to be reported to the stakeholders of the platform.There are currently several ways how LA insights are providedto the stakeholders in the HPI MOOC platform. For this paper,we decided to utilize dashboards as a typical analytics usecase for two different objectives. First, RQ1.b is examinedby integrating WA metrics retrieved from Google Analyticsinto the dashboards. Second, the main research question isapproached by combining newly acquired WA insights andexisting LA metrics and thus demonstrating to what extentWA can be utilized in the context of e-learning and whichparts of the dashboards require LA-specific processing. Forthese purposes, different stakeholders need to be considered.In general, the platform has four types of stakeholders thatdiffer in their needs in regard to LA:
Platform owners are interested in the overall performance ofthe platform across all courses.
Teaching teams are in charge of specific courses in whichthey inform and support the learners.
Learners are mainly interested in their own learning progressin courses they are enrolled in.
Researchers might use any kind of LA data depending onthe research question they are examining.
Currently, there are two existing types of LA dashboardson the HPI MOOC platform: a global one mainly intendedfor platform owners and a course-specific one for the use bythe teaching teams. The usefulness of WA insights in the e-learning context (RQ1.c) should be evaluated by comparingthe usefulness of the existing dashboards and the extendedones incorporating WA metrics. Consequently, the focus is seton platform owners and teaching teams for this study.
1) Retrieval of Google Analytics Metrics: Independentlyfrom the actual approach for implementing the dashboards itis required to programmatically retrieve analysis results fromGoogle Analytics. Therefore, two Application ProgrammingInterfaces (APIs) are provided, which are be utilized for thispurpose. The Reporting API enables retrieval of preprocessedand aggregated reports defined by a certain query. The Real-time API enables retrieval of realtime data. However, this APIcan return only a small range of basic dimensions and metrics.
Google Analytics reports can be used to obtain or derive cer-tain LA metrics, which can subsequently be integrated into theplatform and visualized in the dashboards. For this purpose,the metrics provided by the lanalytics services are extended bymetrics querying Google Analytics. Currently, metrics aboutthe general activity, enrollments, learner progress, forum ac-tivity, device usage, geographical attributes and demographicalattributes are visualized within the dashboards.
Instead of replacing existing metrics, this work focuses onintegrating new WA metrics into the platform, which are rele-vant in the e-learning and MOOC context. A typical WA topicthat is not well represented in the existing metrics are sessions.The reason for this is that computation of session-relatedmetrics on raw event data is expensive. However, analyzingsessions of learners can help to understand, how often andhow long users are learning on the platform. Consequently,several metrics are implemented querying appropriate GoogleAnalytics dimensions and metrics, like the average sessionduration and days since last session.
Another metric that can be easily obtained from GoogleAnalytics is the number of active users at a certain point intime, as it is also common for WA. Therefore, a metric isimplemented that returns the number of active learners for eachday and hour of a given date range. Besides, another metric isadded aggregating this data by calculating the average numberof active users for the hours of each day of week. While thefirst one can be used to obtain the actual activity of the past,the second metric gives on overview about typical weekdaysand daytimes learners are accessing the platform.
Analyzing how users are navigating through a course canhelp to identify problems of its structure and contents. Un-fortunately, it is also an expensive task when working withraw event data only. However, analysis of navigation paths isalso a common WA task, which is why two correspondingmetrics are integrated. The first one identifies exit items,i. e., items being regularly the last ones within a session andconsequently might cause session exits. A high exit rate couldindicate that the content is too complex or incomprehensiblecausing frustration of learners, which results in session exists.The other metric computes the percentage of backjumps forlearning items, i. e., the proportion of page views originatingfrom any succeeding item regarding the structure of the course.If during the progress of a course many learners return toa certain previous item again, this might indicate that priorknowledge being taught in this item was not understood wellby a large part of learners.
2) Limitations: Although Google Analytics can be usedto retrieve several metrics that are useful for operators andteaching teams of a MOOC platform, there are some limi-tations in regard to the kind of data that can be obtained.These limitations are also relevant for answering RQ1.a asthey reveal mismatches between LA and WA concepts. Ingeneral, the web frontend of Google Analytics is used by themajority of customers, which is why Google mainly focuseson implementation of this component. As a result, a fewinformation can only be extracted from the frontend, but not
978-1-5386-9506-7/19/$31.00 ©2019 IEEE 9–11 April, 2019 – American University in Dubai, Dubai, UAE2019 IEEE Global Engineering Education Conference (EDUCON)
Page 307

via API. Usually, WA is used to analyze behavior of the entireuser base or certain user segments. Therefore, the API doesreturn not any data about individual users [12], [13]. As aresult, learner-specific metrics can not be implemented usingGoogle Analytics. Due to the typical purpose of WA tools,Google Analytics comes with advanced e-commerce analysiscapabilities. Among other features, this includes measuringconversions of predefined goals and analyzing the shoppingbehavior visualized by a funnel that shows at which stagesusers abandon the buying process. In context of this paper,the utilization of these e-commerce features in the MOOCcontext is examined. For example, the progress of a MOOCcan be compared with the purchase of a product. Followingthis idea, different shopping stages can be mapped to actionsconcerning a MOOC and vice-versa as shown in Table I.
TABLE IPOSSIBLE MAPPING OF E-COMMERCE STEPS TO MOOC ACTIONS
E-Commerce Step MOOC Action
Click on a certain product → Click on a certain courseView product details → View course detailsAdd product to cart → Enroll for courseRemove product from cart → Unenroll for courseSeveral checkout steps → Visiting learning items of courseComplete purchase → Pass exam and complete course
Based on this mapping, additional hits could be sent toGoogle Analytics containing the corresponding e-commerceparameters. As a result, respective analysis capabilities couldalso be utilized. For example, completion rates of coursescould be calculated using conversions and corresponding fun-nels could be analyzed. This would make it possible to identifysections or items of a course that cause learners to abandonthe course. The main problem of this idea is the fact that the e-commerce metrics are based on single sessions and cannot becalculated across multiple sessions of the same user [14]. Thiscontradicts the general concept of MOOCs as an entire coursecan usually not be completed within a single session. Instead,a course typically runs over several weeks and is elaborated bya user in multiple sessions. However, the course progress ofan user would not be considered in its entirety, but as severalindependent attempts to complete the course. Therefore, thee-commerce concept of Google Analytics can only be appliedto MOOCs partly.
3) Requirements and Issues of existing Dashboards: TheHPI MOOC platform already provides a global and coursedashboard. However, several issues with these existing so-lutions have been identified by conducting expert interviewswith relevant stakeholders. Six employees of openSAP wereinterviewed about usage scenarios of LA reporting capabilitiesof the platform, especially the global and course dashboard.The participants hold different occupational roles in contextof openSAP. Three of them are in charge of certain courses asmembers of the corresponding teaching teams while two holdthe role of the platform owner. The last person has experiencein both roles. Despite the small number of interviewees,
the gained insights are highly relevant. The respondents areexperts in their field of duty, who work with the dashboardson a daily basis. Besides, openSAP is a big and professionalMOOC platform with roughly 3, 000, 000 enrollments in about270 course (July 2018). Consequently, the views and opinionsof the interviewees are considerable in this context.
The employees were asked for what purposes they use LAdata in their daily work and how they utilize the dashboardsfor accomplishment of these tasks. In this context, specialattention was paid to identifying parts of the dashboardsthat are essential and those that are not used at all by theindividual persons. Additionally, the interviewees were askedfor technical and conceptual issues as well as suggestionsfor improvements for the existing solutions. One problemthat was mentioned by all is the performance of the pages.Especially when loading the course dashboard, it takes a lotof time until the page is eventually shown in the browser. Inaddition, the dashboards are usually visited frequently, whichreinforces the issue. The reason for these long loading timesis that the page is not rendered until all required LA datais loaded and visualized metrics and statistics are calculated.Three of the interviewees charged that the dashboards werecluttered. The pages contain many different visualizations andas explained previously, the majority of them is not relevantfor all stakeholders. As a consequence, users might scroll overa number of components until they reach the visualizationthey were actually looking for. Especially long tables, such asreferrer or social share statistics take up a lot of space, but areused only by certain users.
4) Revised Dashboard Concept: To meet the needs of thestakeholders and solve issues of the existing solutions, theentire concept of the dashboards is revised from differentperspectives. On a structural level the general goal is to cleanup the existing dashboards to simplify the access to metricsand statistics. The actual objective of dashboards in general isto visualize complex data in a simple way to provide a quickoverview about a certain topic, in this case the performanceof the platform or specific courses.
In the interviews it became clear that the existing dashboardscontain a great number of different visualizations, whereas themajority of them is not relevant for all users. The new conceptfocuses on visualizations that are relevant for the majority ofthe users while providing possibilities to obtain extensive in-formation on demand. As Key Performance Indicators (KPIs)are highly relevant for all interviewees, the correspondingsections of both dashboards are retained. In contrast, detailedvisualizations built for special purposes are moved to separatepages, referred as statistic pages in the following. However,the information of the moved parts should still be representedin the dashboards. Therefore, for each statistic page thereis a component in the dashboard visualizing the underlyingdata at a higher level, which takes up less space and is alsoeasier to understand. At the same time, it serves as a linkto the corresponding statistic page. For example, the list ofsocial networks the courses have been shared in is moved tosuch a separate page. Along with this, the total number of
978-1-5386-9506-7/19/$31.00 ©2019 IEEE 9–11 April, 2019 – American University in Dubai, Dubai, UAE2019 IEEE Global Engineering Education Conference (EDUCON)
Page 308
course shares is added as KPI to the dashboards. In this way,users receive an overview about the performance of the entireplatform or a specific course and can follow the links in casethey are interested in more detailed information.
In terms of content, global and course dashboards areassimilated to each other. Both pages start with showingrelevant KPIs and visualize the geographical locations, agedistribution, client usage, and top referrers below. The coursedashboard additionally shows the development of enrollments,forum activity, and helpdesk tickets over time. In addition,the age distribution illustrated as a bar chart is added to thedashboards as suggested by interviewees.
From a technical perspective all pages are rendered server-sided, but required analytics data is retrieved asynchronousin the client now. This approach has the advantage that theinitial page is loaded quickly in the browser and the usersalready see the structure of the page while needed data isloaded in the background. To retrieve all data that is visualizedin the dashboard, multiple API requests to different endpointsare necessary. These requests can be sent and processed inparallel. As a result, data is shown on the page as soon asit is received. Therefore, metrics that can be calculated morequickly are already visible in the user interface while moreexpensive operations are still running.
5) Integration of Web Analytics Metrics: In addition torevision of the existing concept, the new Google Analyticsmetrics are integrated into the dashboards. This is done byadding new visualizations and creating new statistic pages.The average session duration is added to the KPI sectionof the global dashboard. Besides, a heat map shows theaverage number of learners per hour and day of week onboth dashboards. These two components additionally link toa new activity statistic page, which is available for both theglobal and course context as well. This page shows histogramsof session durations and the number of days between twosubsequent sessions. The corresponding metrics group valuesto buckets, which also ensures clarity and understandabilityof the visualizations. When viewing the statistic page incourse context, these bar charts additionally show the platformaverage for each bucket, which makes it possible to comparethe activity of a course with the average of all courses.Next to these two visualizations another heat map shows thenumber of active users for each day and hour in the last twomonths (global) or the course time frame. This visualization issimilar to the heat map of the existing course dashboard thatshows the temporal activity of users.
6) Summary: This section demonstrated how WA in-sights can be provided to stakeholders in a user-friendlyway (RQ1.b). For this purpose, the structural and technicalconcept of the existing dashboards was revised first, sinceseveral issues in regard to their usability have been identified.Afterwards, the existing LA capabilities were enhanced by ex-tending the dashboards by WA insights obtained from GoogleAnalytics. Thereby, no differences between reporting of bothkinds of insights were realized. The use of WA does notsimplify visualizing LA data. Instead, it comes with the same
challenges and problems. Communicating such complex datais always a difficult task and interpretations usually requireexpert knowledge. Thus, this issue is not changed by utilizingWA methods.
V. EVALUATION
This section focuses on evaluating different aspects of thiswork. First, the usability of the revised and extended LAdashboards is evaluated on basis of a conducted survey. Thisincludes answering RQ1.c by examining the usefulness of theimplemented WA metrics. Afterwards, an answer to the mainresearch question is given by discussing the applicability ofWA in context of LA based on the implemented proof ofconcept and answered sub-questions.
A. Usability of Learning Analytics Dashboards
This section presents an evaluation of the usability of theimplemented LA dashboards. By comparing the existing andrevised dashboards in regard to usefulness, ease of use, andsatisfaction, it is examined whether the usability could beimproved by adding new WA metrics and refactoring theunderlying technical concept.
1) Methodology: To achieve the goals of this evaluation,a survey was conducted addressing platform owners andteaching team members of openHPI and openSAP as they arethe target group of the according dashboards. While platformowners were instructed to consider the global dashboards,teaching teams should compare the course dashboards. As theaudience is really specific and thus small, only 11 respondentscould be acquired for answering the questionnaire. However,the importance of participants’ views and positions are stillhighly relevant as they are experts in their fields, who utilizeLA insights in their daily work. Consequently, results ofthis survey are still meaningful despite the small numberof respondents. The participants were asked to express theiragreement with the following ten statements separately for theexisting and the revised dashboard:
Q01 The dashboard helps me to monitor the activity of theplatform or my courses.
Q02 The dashboard facilitates access to relevant metrics.Q03 The dashboard meets my needs.Q04 I regularly use the dashboard for my work.Q05 The dashboard is easy to use.Q06 The dashboard is understandable.Q07 The dashboard loads fast.Q08 The dashboard is clear and tidy.Q09 The dashboard works the way I would expect.Q10 I like to use the dashboard.
A symmetric Likert scale with the following four levels andcorresponding scores was utilized for giving answers:
• Strongly agree (3)• Somewhat agree (2)• Somewhat disagree (1)• Strongly disagree (0)
978-1-5386-9506-7/19/$31.00 ©2019 IEEE 9–11 April, 2019 – American University in Dubai, Dubai, UAE2019 IEEE Global Engineering Education Conference (EDUCON)
Page 309

For evaluating the significance of differences, a Wilcoxontest was performed based on the answers’ scores for each ques-tion. Additionally, effect sizes were computed with Cohen’s d.These statistics can be found in Table II. The participantswere also approached for qualitative feedback by means offree-text questions. This includes asking for suggestions forimprovements. While the first two questions are consideredin the following, the mentioned improvement suggestions arediscussed later as they are part of the future work.
TABLE IIDESCRIPTIVE AND INFERENTIAL STATISTICS FOR USABILITY BEFORE
AND AFTER REVISION OF THE DASHBOARDS
Existing Dashboards Revised Dashboards Wilcoxon
Q Mean Std.Dev. Mean Std.Dev. p-value Cohen’s d
01 2.1818 0.6030 2.2727 0.6467 0.6547 0.145402 2.0909 0.7006 2.4545 0.8202 0.1573 0.476703 1.6364 0.6742 1.9091 0.7006 0.1797 0.396704 2.4545 0.6876 2.5455 0.5222 0.5637 0.148905 1.9091 0.9439 2.3636 0.8090 0.1025 0.517006 1.3636 0.6742 2.1818 0.8739 0.0235 1.048407 1.0909 0.5394 2.0000 0.7746 0.0152 1.362108 1.2727 0.6467 2.3636 0.8090 0.0097 1.489509 1.8182 0.6030 2.1818 0.7508 0.0455 0.534010 1.6364 0.5045 2.2727 0.7862 0.0196 0.9633
The survey results were analyzed in regard to two aspectsof this work. First, the usefulness of WA insights in contextof LA is evaluated for answering RQ1.c. Afterwards, the easeof use and satisfaction of the revised concept are assessedbased on the answers of the participants to examine whetherthe goals of the revision could be accomplished.
2) Usefulness of Web Analytics Insights: From a content-related perspective, integrating the implemented WA metricsdid not result in a significant difference of the usefulness (p <0.05). The new metrics are not highly relevant for the majorityof participants (Q02) and could neither help them in moni-toring the activity on the platform or in courses (Q01), norincrease the satisfaction of their needs (Q03) in a significantextent. Furthermore, the additional insights did not lead torespondents planing to use the dashboards more often ina remarkably scope (Q04). The performance of the dash-boards (Q07) could be significantly increased (p = 0.0152)with a large effect (d = 1.3621). This was achieved partlyby replacing certain existing metrics with appropriate WAmetrics, which can be retrieved faster. Consequently, theintegration of WA contributed to this improvement. Never-theless, the performance of the local analytics stores mightalso be boosted for example by upgrading the underlyinghardware. However, this would cause additional costs forpurchase and maintenance. Therefore, especially for a non-commercial project, such as openHPI, making use of theprovided cloud infrastructure of WA tools, which is in case ofGoogle Analytics even free of charge, is a meaningful decisionto improve the performance of complex queries. The majorityof the underlying metrics could also be covered by using WAmethods. Consequently, WA could provide further insights,whose usefulness is already proven. Nevertheless, the effect of
these insights cannot be measured in this context as there is nobasis of comparison. Nevertheless, e-learning platforms that donot have such sophisticated LA capabilities as the HPI MOOCplatform could benefit from integrating these WA metrics.
3) Ease of Use and Satisfaction of Revised Concept:Besides examining the usefulness of the implemented WAmetrics, the survey also aims to ascertain the ease of use andsatisfaction of the revised dashboard concept. In addition to theimproved performance, whose effect was already determinedpreviously, the redesign led to a significant increase (p =0.0235) of the understandability (Q06) with a proven largeeffect (d = 1.0484). Besides, a highly significant differ-ence (p = 0.0097) was found in regard to the clearness (Q08)with a large practical effect as well (d = 1.4895). In termsof satisfaction of participants, a significant improvement (p =0.0455) with an intermediate effect (d = 0.5340) has beenmeasured in the extent the dashboards work as expectedby the participants (Q09). Additionally, the respondents alsoprefer working with the revised version (Q10) as a significantdifference (p = 0.0196) of respective answers with a largeeffect (d = 0.9633) has been ascertained as well. However,the revision had no significant impact (p = 0.1025) onthe simplicity of the dashboards (Q05). In addition to thequantitative evaluation, the participants were asked to mentionaspects of the revised concept they like the most. The majoritybrought up the improved clarity caused by moving detailedstatistics to separate pages and enabling the possibility to drill-down. Besides, also the fact that data for each chart is loadedindependently was well received. Other mentioned aspectsare the availability of new KPIs and charts, the improvedvisualizations, and the increased number of LA insights.
B. Applicability of Web Analytics
As shown in the previous sections, WA tools can be success-fully integrated into a MOOC platform and thus utilized forLA purposes. A large part of relevant metrics can be retrievedusing WA capabilities. However, there are some limitations,which is why this method can not be used exclusively in thiscontext. This section examines to what extend WA tools canbe utilized to gather insights in learning behavior on e-learningplatforms. A great number of LA metrics correspond or canbe mapped to WA metrics. For example, the session durationprovides information about how long users are learning in onepiece and page views indicate how often and in which orderlearning item are visited. Besides, the number of active usersand characteristics of the audience, such as temporal accesspatterns, used clients and devices, and geographical origins,are relevant for both fields. Thanks to generic event tracking,which is supported by the majority of WA tools, any type ofinteraction can be tracked and therefore analyzed. As a result,especially LA KPIs can be calculated easily using WA as theyusually just count the occurrences of a certain event type in agiven date range.
In general, LA focuses on optimizing the learning ex-perience on online platforms. This also includes improvingthe user experience as it is done by WA. However, the
978-1-5386-9506-7/19/$31.00 ©2019 IEEE 9–11 April, 2019 – American University in Dubai, Dubai, UAE2019 IEEE Global Engineering Education Conference (EDUCON)
Page 310

intention differs between both fields. While WA aims to helpbusinesses in decision-making processes and is intended toincrease revenue, users are in the center of LA as they shouldbe supported while learning. This also includes encouragingindividual learners for example by identifying users at risk thatare likely to dropout soon and might therefore need specialassistance. This is not an use case of WA and consequentlycorresponding tools do typically not support analyzing be-havior of single users. Instead, only metrics regarding usersegments (e. g. mobile users or users of a certain country) orthe entire user base can be accessed.
In WA, sessions are the central element for analyses. Theamount of metrics that are calculated across subsequent ses-sions of the same user are very limited in the majority ofexisting tools. For instance, conversion rates and e-commercemetrics in Google Analytics are restricted to sessions. In con-trast, a learning process usually extends over a long period oftime. This fact also applies to online learning. For example, themajority of MOOCs has a length of six weeks, in which con-tents are typically published gradually. Consequently, learningtakes place in a great number of sessions and perhaps onmultiple devices. To analyze the entire learning process ofusers within a course, activity data has to be considered acrosssessions. For these purposes, WA can not be utilized with itscurrent set of features.
To sum up, certain aspects of LA can also be accomplishedby utilizing WA. However, the aptitude of a metric for beingretrieved using WA strongly depends on the type of stake-holder it is intended for. As explained before, openHPI hasfour different stakeholders: platform owners, teaching teams,learners, and researchers. While researchers are interested inany kind of LA data, the needs of the other three differs. Forplatform owners metrics concerning the overall performanceof the platform are relevant, which is why they most closelycorrespond to the typical user of WA. Consequently, themajority of metrics relevant for this role can be queried usingWA as well. Especially highly aggregated metrics, such asKPIs, can be easily obtained this way, but are neverthelessessential for platform owners. When it comes to teachingteams, WA can be used only partly. As long as informationabout the general activity and progress of a course shouldbe gathered, it still works fine. However, it quickly reachesits limitations when trying to retrieve metrics about smallergroups of users sharing certain characteristics or even singleusers. As teaching teams are responsible for supervising andsupporting learners of a course, WA can help them only witha fraction of their duties. Finally, the method can be used onlyin a minor extent to provide individual learners with LA data.Metrics about single users, which are most important in thiscontext, can usually not be obtained. Nevertheless, there aresome use cases where WA is helpful. For example, informationabout the average performance of learners can help individualsto reflect on their own performance. All in all, WA mainlymeets the needs of platform owners, but can assist teachingteams only in some cases. For individual learners there areonly rare cases where WA data is relevant.
While this evaluation was done based on the proof ofconcept integration of Google Analytics into the HPI MOOCplatform, the key findings also apply to WA and e-learningplatforms in general. The revealed potentials and limitations ofWA are not specific to the HPI MOOC platform. This is mainlybecause characteristics of learning concepts and processes aswell as the needs of stakeholders in regard to their use of LAinsights are similar among e-learning platforms.
Besides, core concepts and features are the same for themajority of WA tools. Differences exist only in regard tomore specific and advanced analysis capabilities, processinglimitations, and pricing models. As this evaluation considersthe general concepts of WA instead of concrete features ofGoogle Analytics, the findings also hold for other tools andare thus valid for the field of WA in general.
VI. CONCLUSION
So far, WA has not been profoundly used to analyzelearners’ behavior on e-learning platforms. However, LA maybenefit from this sophisticated and well-established method.Therefore, the goal of this paper was to examine how WA canbe utilized for LA purposes and what limitations it has in thiscontext (RQ1).
To answer this question, Google Analytics was integratedinto the HPI MOOC platform as a proof of concept to evaluatethe applicability of WA tools in the context of large-scaleonline learning. For this purpose, the platform’s lanalyticsservice was extended by another processing pipeline thattransforms captured interaction data according to the schemadefined by Google Analytics and sends it to the WA service.For this transformation a mapping was developed that modelslearning activity as WA hits (RQ1.a). Instead of using thetypical data collection technique of page tagging, the Measure-ment Protocol is utilized to transmit hits from the platform’sbackend. Consequently, the solution took advantage of theexisting event tracking engine resulting in consistency betweenthe local and external analytics stores. Besides, this approachreinforces data privacy as the amount of data sent to thirdparties is selected manually.
Based on the captured data, it was considered how gatheredinsights can be provided to stakeholders of the platform so thatthey can make use of it (RQ1.b). Thereby, LA dashboardswere chosen for evaluation purposes as they are a typical usecase of analytics in general. This paper focused on dashboardsintended for platform owners and teaching teams as these werealready existing, which enabled comparing the usefulness ofWA metrics (RQ1.c). Requirements of the stakeholders andissues of the existing solutions were identified by conductingexpert interviews. Based on these insights, the concept of thedashboards was revised to improve their usability. Afterwards,they were extended by newly implemented WA metrics, whichwere integrated into the existing architecture of the lanalyticsservice. In doing so, no differences between visualizing WAand LA insights were recognized. Instead, both types ofmetrics were handled exactly the same as the dashboards donot distinguish different data sources in this context.
978-1-5386-9506-7/19/$31.00 ©2019 IEEE 9–11 April, 2019 – American University in Dubai, Dubai, UAE2019 IEEE Global Engineering Education Conference (EDUCON)
Page 311
The evaluation of the usability of the revised and extendeddashboards showed that the newly implemented WA metricsdo not have a statistically significant impact on the usefulnessof the dashboards. However, a large part of the existing LAcapabilities, which are indeed proven to be useful for thestakeholders, could also be realized by using WA methods.Consequently, WA can still provide useful insights in the con-text of LA. In addition, it can contribute to an increase of thegeneral performance by making use of the cloud infrastructureof WA tools (RQ1.c). Besides, the revision of the dashboardshad a significant impact on the ease of use and satisfaction.Especially the clearness could be improved on a large scaleas shown by the quantitative, but also qualitative evaluation.Consequently, the intentions and goals of the revision havebeen accomplished.
To finally answer the main research question (RQ1) of thispaper, the proof of concept integration was evaluated in regardto the applicability of WA for gathering LA insights. It wasshown that WA can indeed be used to retrieve a large part ofmetrics relevant in context of LA. However, its applicabilityhighly depends on the type of stakeholder the correspondingmetrics are intended for. The needs of platform owners ofe-learning platforms and websites in general do not differmuch. Consequently, the majority of insights relevant for thisrole can be retrieved using WA. Especially KPIs are essentialfor this type of stakeholder and can easily be obtained fromWA tools. Nevertheless, when it comes to teaching teams,the technique can be utilized only to a limited extent. WhileWA can provide an overview of the general performance ofa course, it reaches its limitations when considering learner-specific metrics since WA is not designed for retrieving user-level information. Consequently, it is also not suitable forproviding LA data to individual students. In this context, WAmight be used only to support self-reflection by providinginformation about the average performance on the platformas a point of reference. Besides, more advanced features ofWA tools, such as e-commerce analysis, can not be utilized incontext of LA due to a mismatch of concepts.
Additionally, there is still room for further extensions andimprovements. So far, the integration of Google Analytics isdeep-seated in the platform’s Service Oriented Architecture.Nevertheless, also other e-learning platforms could benefitfrom integrating WA capabilities in a similar way. For thispurpose, it would be necessary to generalize the implemen-tation, e. g., by providing a mapping interface from the xAPIstandard to the Google Analytics Measurement Protocol. Thedashboards revised in the context of this paper are intended forplatform owners and teaching teams. However, there are alsoother stakeholders for whom LA data can add value. Individuallearners can directly benefit from LA as well. There is muchresearch going on concerning student-facing dashboards andhow they can be utilized to improve the learning experiencein MOOCs. As already mentioned, at the moment there is
no LA dashboard specifically for learners implemented inthe platform. The existing tracking and reporting capabilitiescould be used as a foundation for such a feature. WhileWA is suited only in a minor extent for this purpose, thelocal analytics stores can be used to obtain relevant metricsfor learner dashboards. In this way, students’ self-reflection,awareness, and self-assessment can be encouraged.
It can be concluded that e-learning platforms can benefitfrom utilizing WA for improving the learning experience.By integrating Google Analytics into the HPI MOOC plat-form, the existing LA capabilities could be extended by new,valuable insights in learners’ behavior. Thereby, WA workswell for obtaining an overview about the general activity onthe platform or within single courses. However, for receivinginsights in the behavior individual learners, WA is not appli-cable. For these purposes, LA-specific methods need to beutilized. This might change with further development of WAand corresponding tools.
REFERENCES
[1] E. Brynjolfsson, L. M. Hitt, and H. H. Kim, “Strength in Numbers: HowDoes Data-Driven Decisionmaking Affect Firm Performance?” SSRNeLibrary, 2011. [Online]. Available: http://ssrn.com/paper=1819486
[2] B. Romanowski and A. Konak, “Using Google Analytics toImprove the Course Website of a Database Course,” 2016.[Online]. Available: https://www.hofstra.edu/pdf/academics/colleges/seas/asee-fall-2016/asee-midatlantic-f2016-konak.pdf
[3] A. Cooper, “Learning Analytics Interoperability - The Big PictureIn Brief,” Learning Analytics Community Exchange, 2014. [Online].Available: http://laceproject.eu/publications/briefing-01.pdf
[4] C. Meinel and C. Willems, “openHPI: the MOOC offer atHasso Plattner Institute,” Tech. Rep., 2013. [Online]. Available:https://publishup.uni-potsdam.de/frontdoor/index/index/docId/6548
[5] B. Moissa, L. S. de Carvalho, and I. Gasparini, “A Web Analytics andVisualization Tool to Understand Students’ Behavior in an AdaptiveE-Learning System,” in Learning and Collaboration Technologies. De-signing and Developing Novel Learning Experiences, 2014.
[6] H. Luo, S. Rocco, and C. Schaad, “Using Google Analytics to Un-derstand Online Learning: A Case Study of a Graduate-Level OnlineCourse,” in International Conference of Educational Innovation throughTechnology (EITT), 2015.
[7] edX Inc., “Open edX Developer’s Guide - Analytics.” [On-line]. Available: http://edx.readthedocs.io/projects/edx-developer-guide/en/latest/analytics.html
[8] J. Renz, G. Navarro-Suarez, R. Sathi, T. Staubitz, and C. Meinel,“Enabling Schema Agnostic Learning Analytics in a Service-OrientedMOOC Platform,” in Proceedings of ACM Learning at Scale Conference(L@S2016). ACM, 2016.
[9] T. Rohloff, M. Bothe, J. Renz, and C. Meinel, “Towards a BetterUnderstanding of Mobile Learning in MOOCs,” in Learning withMOOCs 2018 (LWMOOCS V). IEEE, 2018.
[10] Google Inc., “Measurement Protocol Reference.” [Online].Available: https://developers.google.com/analytics/devguides/collection/protocol/v1/reference
[11] Pivotal Software Inc., “RabbitMQ: Reliability Guide.” [Online].Available: https://www.rabbitmq.com/reliability.html
[12] Google Inc., “User Explorer.” [Online]. Available: https://support.google.com/analytics/answer/6339208
[13] ——, “Dimensions & Metrics Explorer.” [Online]. Available: https://developers.google.com/analytics/devguides/reporting/core/dimsmets
[14] ——, “Enhanced e-commerce reports.” [Online]. Available: https://support.google.com/analytics/answer/6014872
978-1-5386-9506-7/19/$31.00 ©2019 IEEE 9–11 April, 2019 – American University in Dubai, Dubai, UAE2019 IEEE Global Engineering Education Conference (EDUCON)
Page 312