Big Data Analytics and Intelligent Techniques for ... - Taylor & Francis
Upload
khangminh22Category
view
0download
0
/ 1
THE CAPCO INSTITUTE JOURNAL OF FINANCIAL TRANSFORMATION
D AT A A N A LY T I C S5 0 T H E D I T I O N I N O V E M B E R 2 0 1 9
THE CAPCO INSTITUTE JOURNAL OF FINANCIAL TRANSFORMATION
D AT A A N A LY T I C S5 0 T H E D I T I O N I N O V E M B E R 2 0 1 9

EditorShahin Shojai, Global Head, Capco Institute
Advisory BoardMichael Ethelston, Partner, CapcoMichael Pugliese, Partner, CapcoBodo Schaefer, Partner, Capco
Editorial Board Franklin Allen, Professor of Finance and Economics and Executive Director of the Brevan Howard Centre, Imperial College London and Professor Emeritus of Finance and Economics, the Wharton School, University of Pennsylvania Philippe d’Arvisenet, Advisor and former Group Chief Economist, BNP Paribas Rudi Bogni, former Chief Executive Officer, UBS Private Banking Bruno Bonati, Former Chairman of the Non-Executive Board, Zuger Kantonalbank, and President, Landis & Gyr Foundation Dan Breznitz, Munk Chair of Innovation Studies, University of Toronto Urs Birchler, Professor Emeritus of Banking, University of Zurich Géry Daeninck, former CEO, Robeco Jean Dermine, Professor of Banking and Finance, INSEAD Douglas W. Diamond, Merton H. Miller Distinguished Service Professor of Finance, University of Chicago Elroy Dimson, Emeritus Professor of Finance, London Business School Nicholas Economides, Professor of Economics, New York University Michael Enthoven, Chairman, NL Financial Investments José Luis Escrivá, President, The Independent Authority for Fiscal Responsibility (AIReF), Spain George Feiger, Pro-Vice-Chancellor and Executive Dean, Aston Business School Gregorio de Felice, Head of Research and Chief Economist, Intesa Sanpaolo Allen Ferrell, Greenfield Professor of Securities Law, Harvard Law School Peter Gomber, Full Professor, Chair of e-Finance, Goethe University Frankfurt Wilfried Hauck, Managing Director, Statera Financial Management GmbH Pierre Hillion, The de Picciotto Professor of Alternative Investments, INSEAD Andrei A. Kirilenko, Reader in Finance, Cambridge Judge Business School, University of Cambridge Mitchel Lenson, Former Group Chief Information Officer, Deutsche Bank David T. Llewellyn, Professor Emeritus of Money and Banking, Loughborough University Donald A. Marchand, Professor Emeritus of Strategy and Information Management, IMD Colin Mayer, Peter Moores Professor of Management Studies, Oxford University Pierpaolo Montana, Group Chief Risk Officer, Mediobanca Roy C. Smith, Emeritus Professor of Management Practice, New York University John Taysom, Visiting Professor of Computer Science, UCL D. Sykes Wilford, W. Frank Hipp Distinguished Chair in Business, The Citadel
RECIPIENT OF THE APEX AWARD FOR PUBLICATION EXCELLENCE
THE CAPCO INSTITUTEJOURNAL OF FINANCIAL TRANSFORMATION

10 The big gap between strategic intent and actual, realized strategy Howard Yu, LEGO Professor of Management and Innovation, IMD Business School
Jialu Shan, Research Fellow, IMD Business School
24 Data management: A foundation for effective data science Alvin Tan, Principal Consultant, Capco
32 Synthetic financial data: An application to regulatory compliance for broker-dealers J. B. Heaton, One Hat Research LLC Jan Hendrik Witte, Honorary Research Associate in Mathematics, University College London
38 Unlocking value through data lineage Thadi Murali, Principal Consultant, Capco Rishi Sanghavi, Senior Consultant, Capco Sandeep Vishnu, Partner, Capco
44 The CFO of the future Bash Govender, Managing Principal, Capco Axel Monteiro, Principal Consultant, Capco
D ATA M A N A G E M E N T
C O N T E N T S

54 Artificial intelligence and data analytics: Emerging opportunities and challenges in financial services Crispin Coombs, Reader in Information Systems and Head of Information Management Group, Loughborough University
Raghav Chopra, Loughborough University
60 Machine learning for advanced data analytics: Challenges, use-cases and best practices to maximize business value
Nadir Basma, Associate Consultant, Capco Maximillian Phipps, Associate Consultant, Capco Paul Henry, Associate Consultant, Capco Helen Webb, Associate Consultant, Capco
70 Using big data analytics and artificial intelligence: A central banking perspective Okiriza Wibisono, Big Data Analyst, Bank Indonesia Hidayah Dhini Ari, Head of Digital Data Statistics and Big Data Analytics Development Division, Bank Indonesia Anggraini Widjanarti, Big Data Analyst, Bank Indonesia Alvin Andhika Zulen, Big Data Analyst, Bank Indonesia Bruno Tissot, Head of Statistics and Research Support, BIS, and Head of the IFC Secretariat
84 Unifying data silos: How analytics is paving the way Luis del Pozo, Managing Principal, Capco Pascal Baur, Associate Consultant, Capco
D ATA A N A LY T I C S
94 Data entropy and the role of large program implementations in addressing data disorder Sandeep Vishnu, Partner, Capco Ameya Deolalkar, Senior Consultant, Capco George Simotas, Managing Principal, Capco
104 Natural language understanding: Reshaping financial institutions’ daily reality Bertrand K. Hassani, Université Paris 1 Panthéon-Sorbonne, University College London, and Partner, AI and Analytics, Deloitte
110 Data technologies and Next Generation insurance operations Ian Herbert, Senior Lecturer in Accounting and Financial Management, School of Business and Economics, Loughborough University Alistair Milne, Professor of Financial Economics, School of Business and Economics, Loughborough University Alex Zarifis, Research Associate, School of Business and Economics, Loughborough University
118 Data quality imperatives for data migration initiatives: A guide for data practitioners Gerhard Längst, Partner, Capco Jürgen Elsner, Executive Director, Capco Anastasia Berzhanin, Senior Consultant, Capco
D ATA I N T E L L I G E N C E

D E A R R E A D E R ,

Welcome to the milestone 50th edition of the Capco Institute Journal of Financial Transformation.
Launched in 2001, the Journal has covered topics which have charted the evolution of the financial services sector and recorded the fundamental transformation of the industry. Its pages have been filled with invaluable insights covering everything from risk, wealth, and pricing, to digitization, design thinking, automation, and much more.
The Journal has also been privileged to include contributions from some of the world’s foremost thinkers from academia and the industry, including 20 Nobel Laureates, and over 200 senior financial executives and regulators, and has been co-published with some of the most prestigious business schools from around the world.
I am proud to celebrate reaching 50 editions of the Journal, and today, the underlying principle of the Journal remains unchanged: to deliver thinking to advance the field of applied finance, looking forward to how we can meet the important challenges of the future.
Data is playing a crucial role in informing decision-making to drive financial institutions forward, and organizations are unlocking hidden value through harvesting, analyzing and managing their data. The papers in this edition demonstrate a growing emphasis on this field, examining such topics as machine learning and AI, regulatory compliance, program implementation, and strategy.
As ever, you can expect the highest caliber of research and practical guidance from our distinguished contributors, and I trust that this will prove useful to your own thinking and decision making. I look forward to sharing future editions of the Journal with you.
Lance Levy, Capco CEO

F O R E W O R D

Since the launch of the Journal of Financial Transformation nearly 20 years ago, we have witnessed a global financial crisis, the re-emergence of regulation as a dominant engine of change, a monumental increase in computer processing power, the emergence of the cloud and other disruptive technologies, and a significant shift in consumer habits and expectations.
Throughout, there has been one constant: the immense volume of data that financial services institutions accumulate through their interactions with their clients and risk management activities. Today, the scale, processing power and opportunities to gather, analyze and deploy that data has grown beyond all recognition.
That is why we are dedicating the 50th issue of the Journal of Financial Transformation to the topic of data, which has the power to change the financial industry just as profoundly over the coming 20 years and 50 issues. The articles gathered in this issue cover a broad spectrum of data-related topics, ranging from the opportunities presented by data analytics to enhance business performance to the challenges inherent in wrestling with legacy information architectures. In many cases, achieving the former is held back by shortcomings around the quality of, and access to, data arising from the latter.
It is these twin pillars of opportunity and challenge that inform the current inflection point at which the financial industry now stands. Whilst there is opportunity to improve user experiences through better customer segmentation or artificial intelligence, for example, there are also fundamental challenges around how organizations achieve this – and if they can, whether they should.
The expanding field of data ethics will consume a great deal of senior executive time as organizations find their feet as they slowly progress forward into this new territory. In my view, it is critical that organizations use this time wisely, and do not just focus on short-term opportunities but rather ground themselves in the practical challenges they face. Financial institutions must invest in the core building blocks of data architecture and management, so that as they innovate, they are not held back, but set up for long-term success.
I hope that you enjoy reading this edition of the Journal and that it helps you in your endeavours to tackle the challenges of today’s data environment.
Guest Editor Chris Probert, Partner, Capco

8 /
D ATA M A N A G E M E N T

10 The big gap between strategic intent and actual, realized strategy Howard Yu, LEGO Professor of Management and Innovation, IMD Business School
Jialu Shan, Research Fellow, IMD Business School
24 Data management: A foundation for effective data science Alvin Tan, Principal Consultant, Capco
32 Synthetic financial data: An application to regulatory compliance for broker-dealers J. B. Heaton, One Hat Research LLC Jan Hendrik Witte, Honorary Research Associate in Mathematics, University College London
38 Unlocking value through data lineage Thadi Murali, Principal Consultant, Capco Rishi Sanghavi, Senior Consultant, Capco Sandeep Vishnu, Partner, Capco
44 The CFO of the future Bash Govender, Managing Principal, Capco Axel Monteiro, Principal Consultant, Capco

10 /
HOWARD YU | LEGO Professor of Management and Innovation, IMD Business School1
JIALU SHAN | Research Fellow, IMD Business School
However, a peculiar form of the knowing-doing gap still persists, and it is not unique to automakers. A number of financial institutes we spoke to, for instance, have all established corporate venture funds to invest in innovative startups. They practice open innovation, posting challenges online, and running tournaments with external inventors. They have organized “design thinking” workshops for employees to rethink customer solutions. And yet, their core business continues to be encroached on by Google and Amazon every day, if not by Tencent or Alibaba or some other digital upstart. It seems that no matter how hard these in-house innovation experts try, the big companies will simply not budge. “Tell me one thing that I should do but haven’t tried,” hissed a frustrated executive the moment I mentioned Google Venture.4 The ship is not just big; the ship cannot turn.
ABSTRACTMost executives know what needs to get done, but there is always a gap between intention and the realized strategy of the firm. We investigated three different industries (automotive, banking, and consumer goods sectors) and showed how some companies can close this knowing-and-doing gap and beat the competition. We relied on hard market data and ranked companies based on the likelihood that they acquire new knowledge in their efforts to prepare for the future. Such findings can be generalized for other sectors, consequently providing a set of important lessons for managers at large.
THE BIG GAP BETWEEN STRATEGIC INTENT AND ACTUAL, REALIZED STRATEGY
1. INTRODUCTION
It is common knowledge among executives that while humans now live longer,2 companies die faster. The average lifespan of companies listed in Standard & Poor’s 500 was 61 years in 1958. Today, it is less than 18 years, according to a study by McKinsey.3 Every CEO or senior executive is presumed to understand that. Companies are being bought out, merged, or forced to go bankrupt. It is, therefore, no surprise that in 2019, the imperative for virtually all sectors is to leverage connectivity and artificial intelligence (AI) in order to realize some form of competitive advantage. No carmaker, for instance, would speak to investors without mentioning “future mobility”. BMW is a “supplier of individual premium mobility with innovative mobility services.” General Motors aims to “deliver on its vision of an all-electric, emissions-free future.” Toyota possesses the “passion to lead the way to the future of mobility and an enhanced, integrated lifestyle.” And Daimler, the maker of Mercedes, sees the future as “connected, autonomous, and smart.”
1 Howard Yu is the author of LEAP: How to Thrive in a World Where Everything Can Be Copied (http://www.howardyu.org/; PublicAffairs; June 2018), LEGO Professor of Management and Innovation at the IMD Business School in Switzerland, and Director of IMD’s signature Advanced Management Program (https://bit.ly/2npnnJ1). A native of Hong Kong, he earned his doctoral degree from Harvard Business School. Jialu Shan is a Research Fellow at The Global Center for Digital Business Transformation – An IMD and Cisco Initiative.
2 Rini, R., 2019, “The last mortals,” The Times Literary Supplement, May 14, https://bit.ly/2plsOJA3 Garelli, S., 2016, “Why you will probably live longer than most big companies,” IMD Research & Knowledge, December, https://bit.ly/2Z0rSXH4 Knapp, J., J. Zeratsky, and B. Kowitz, 2016, Sprint: how to solve big problems and test new ideas in just five days, Simon & Schuster

11 /
5 https://bit.ly/2nMqMlC 6 https://bit.ly/2nMrQG77 https://mck.co/2oBz93g8 https://bit.ly/2nxM3Pw
2. SUCCESSFUL COMPANIES DON’T JUST TALK, THEY PREPARE
Andrew S. Grove, the long-time chief executive and chairman of Intel Corporation, told a Stanford researcher in 1991, “Don’t ask managers, ‘What is your strategy?’ Look at what they do! Because people will pretend.” What Grove saw as the realized strategy of a firm was the cumulative effect of day-to-day prioritizations or decisions made by middle managers (engineers, salespeople, and financial staff) – decisions made regardless of what the company said its intended strategy was.
And so, at IMD Business School, we track how likely a firm is to successfully move toward a new knowledge discipline in its effort to prepare for the future. For automakers, as mentioned earlier, it is the shift in know-how from mechanical engineering done by combustion-engine experts to electrical engineering and programming for self-driving cars, done by the same kind of experts who build computers, mobile games, and handheld devices. For consumer banking, it is the shift from operating traditional retail branches with knowledgeable staff members who provide investment advice to running data analytics and interacting with consumers the same way an e-commerce retailer would.
A ranking can thus measure incumbents in each sector on the degrees of progress they make toward what they have announced about their strategic intent in annual reports or letters to shareholders. One can rely on hard market data – data that is publicly available with objective rules – rather than using soft data such as polls or the subjective judgments of raters. Polls suffer from the tyranny of hype. Names that get early recognition get greater visibility in the press, which accentuates their popularity, leading to a positive cascade in their favor. Rankings based on polls also overlook fundamental drivers that fuel innovation, such as the health of a company’s current business, the diversity of its workforce, its governance structure, the investments it has made against competitors, the speed of its product launches, and so on. What is needed is a kind of composite index that captures the totality of that multifaceted innovation.
What follows is an analysis using hard market data from three industries: automotive, banking, and consumer goods sectors. We measure how prepared for a changing future companies in these sectors are. The pace of change may differ across these
DATA MANAGEMENT | THE BIG GAP BETWEEN STRATEGIC INTENT AND ACTUAL, REALIZED STRATEGY
sectors, but the directional shift among them is undeniable. Our analysis, therefore, offers a set of important lessons that executives from other sectors can apply in their own attempts to close the gap between strategic intent and the realized strategies of their firms.
Table 1: Ranking of top 20 automakers and component suppliers based on “leap readiness index”
COMPANY NAMES SCORE RANK
TESLA INC. 100.00 1
VOLKSWAGEN AG 95.33 2
GENERAL MOTORS CO. 90.77 3
TOYOTA MOTOR CO. 88.36 4
FORD MOTOR CO. 80.92 5
DAIMLER AG 71.96 6
NISSAN MOTOR CO. 65.47 7
BMW AG 65.19 8
APTIV PLC 63.38 9
GEELY AUTOMOBILE HOLDINGS 60.89 10
PEUGEOT S.A. 60.87 11
FERRARI NV 58.78 12
FIAT CHRYSLER AUTOMOBILES N.V. 57.63 13
HONDA MOTOR 57.40 14
HYUNDAI MOTOR CO. 57.17 15
BAIC MOTOR CORP. 56.58 16
CONTINENTAL AG 56.31 17
AB VOLVO 56.02 18
BYD CO. 55.36 19
FUYAO GLASS GROUP 51.38 20
3. RIDE TO MISADVENTURE AT BMW
Mobility, in the past, was created by the individual cars that manufacturers sold. In contrast to the personally owned, gasoline-powered, human-driven vehicles that dominated the last century, all carmakers today understand that in the future, mobility will be produced by service companies operating a variety of self-driving vehicles in fleets, with some form of ride-sharing scheme. It is a vision too frequently touted in annual reports,5 letters to shareholders,6 consultancy studies,7 and trade magazines.8 When this vision will be fully realized is

12 /
anyone’s guess, but what is certain is that automakers must start their transition toward mobility services, which is based on self-driving electric vehicles that will be paid for by the trip, by the mile, through a monthly subscription, or a combination of all three. Using an objective composite index, Table 1 ranks the top 209 automakers and component suppliers according to their degree of preparedness for such a future. The detailed methodology is described in the Appendix.
This index quickly highlights the general conservatism of large companies and also reveals how opportunities and market leadership are squandered. Most radical ideas fail; large companies do not tolerate failure. Too often, companies conveniently consider innovation solely in terms of the nuts and bolts of everyday implementation: gathering consumer insights, tweaking financial forecasts, iterating product designs in experiments, and prototyping offerings. What executives usually forget is that scaling up disruptions not only takes courage and determination, but also resources so vast and talents so deep that they may exceed the company’s current capital and governance structure. Unless an alternative resource allocation is achieved, the new strategy will never be fully realized. Merely tinkering with innovation on the fringes cannot overcome a constrained capital agenda. Anyone can witness the gravity of this problem firsthand at the BMW Museum.
Walking up the spiral ramp of one of the rotundas inside the BMW Museum, one sees flashes of pictures from BMW history displayed in variable sequences, slipping in and out of view like mirages. At the very top of the museum is a “themed area”10 of about 30 stations demonstrating an emissions-free, autonomously driven future. These are not only a vision but also a real project, begun in earnest in the autumn of 2007 by then-CEO Norbert Reithofer and his chief strategist Friedrich Eichiner. The two men tasked engineer Ulrich Kranz, who had revived the Mini brand in 2001,11 to “rethink mobility.” The task force soon grew to 30 members and moved into a garage-like factory hall inside BMW’s main complex.
“I had the freedom to assemble a team the way I wanted. The project was not tied to one of the company’s brands, so it could tackle any problem,” Kranz said in an interview with
Automotive News Europe in 2013.12 “The job was to position BMW for the future – and that was in all fields: from materials to production, from technologies to new vehicle architectures.”
And so Kranz and his team went on to explore uncharted territory that included “the development of sustainable mobility concepts, new sales channels, and marketing concepts, along with acquiring new customers.” The starting point for “Project i” was, in other words, a blank sheet of paper.
“We traveled to a total of 20 mega-cities, including Los Angeles, Mexico City, London, Tokyo, and Shanghai. We met people who lived in metropolises and who indicated that they had a sustainable lifestyle. We lived with them, traveled with them to work, and asked questions,” Kranz recalled. “We wanted to know the products that they would like from a car manufacturer, how their commute to work could be improved, and how they imagined their mobility in the future. As a second step, we asked the mayors and city planners in each metropolis about their infrastructure problems, the regulations for internal combustion engines, and the advantages of electric vehicles.”
Once all the findings were gathered, Kranz expanded his team by seeking out “the right employees both internally and externally.” The result was BMW’s gas-electric i8 sports coupe and all-electric i3 people mover, which shimmered under white lights at BMW World, where the company’s top automotive offerings are showcased. The i3 had almost no hood, and the front grille was framed by plastic slits that looked like a pair of Ray-Bans. It came in a fun-looking burnt orange.13 The front seats were vertically poised, with the dashboard stretching out, such that they exuded a “loft on wheels” vibe. Like the interior, made of recycled carbon fiber and faux-wood paneling, the electric motor of the i3 was geared toward urban dwellers in mega-cities who yearned for a calm, relaxing drive.
What made BMW all the more remarkable was its timing. Almost two years before Tesla’s Model S was introduced, BMW had presented its own battery-powered car as a revolutionary product and committed to building it and delivering it to showrooms by 2013. By the time the BMW i3 went on sale, Tesla’s Model S had spent just over a year on the U.S. market. The 2014 i3 went on to win a World Green Car award,14 as did the 2015 model, the i8. In short, BMW was fast and early.
9 The rankings for the top 55 is available from the authors.10 https://bit.ly/2qtot4411 Ewing, J., 2010, “Latest electric car will be a BMW, from the battery up,” New York Times, July 1, https://nyti.ms/2ozSaTS12 https://bit.ly/2mY3yZ413 https://yhoo.it/2ozUwCc14 https://bit.ly/2nZRnLM
DATA MANAGEMENT | THE BIG GAP BETWEEN STRATEGIC INTENT AND ACTUAL, REALIZED STRATEGY

13 /
Then something terrible happened – or more specifically, nothing really happened.
The i3 soon turned five years old and the i8 four. The BMW i brand had included the services DriveNow and ReachNow (for car sharing), ParkNow (to find available parking), and ChargeNow (to find charging stations). However, besides being featured in occasional press releases, Project i has since given way to other BMW sports cars in prime-time TV advertising spots. There has not been any news from Project i, except that project members are reportedly leaving.15 Ulrich Kranz, the former manager, got together with former BMW CFO Stefan Krause at Faraday Future, and after a short stay, they started Evelozcity in California, where they recruited another i-model designer, Karl-Thomas Neuman. Kranz is not alone. Carsten Breitfeld, the former i8 development manager, is now CEO of Byton, where he also enlisted a marketing expert and a designer from the BMW team. Key people kept leaving when they did not see their work get into the market.
How much Project i has cost BMW can only be estimated. If, according to BMW figures, the carbon-fiber production and the autobody work for the i3 set the company back some half a billion euros,16 the entire project could easily have cost two to three billion – a sum that would have covered the development of two to three series of a conventional VW Golf or Mercedes S-Class. With this much bleeding, then newly appointed CEO Harald Krüger talked of Project i 2.0,17 a plan to integrate the BMW i sub-brand back into the parent company and refocus distribution efforts on “classic” products. One can speculate the creation of the new organizational structure would only exacerbate the tendency for executives from the mainstream business to resist electric vehicles, because those vehicles, due to their low volumes, remain unprofitable products to sell. Furthermore, if these mainstream business executives do not make their numbers, they will not get their bonuses. In short, the structure of BMW had placed an impossible burden on managers to be successful in selling regular cars and electric vehicles at the same time.
That shift in BMW’s distribution of the i sub-brand in fact echoes what Kodak did a decade ago. Kodak built the first digital camera back in 1975, and was the first to put out a competent product, but then ended up folding its consumer
digital and professional divisions back into its legacy consumer film divisions in 2003. Meanwhile, Nikon, Sony, and Canon kept innovating in the subsequent decades, with features like face detection, smile detection, and in-camera red-eye fixes. We all know what eventually happened to Kodak.
Still, BMW is by no means a laggard in innovation. According to the objective composite index in Table 1 above, BMW is not bad. Yet, there exists a marked difference between the good and the great, a distinction between those who can scale up disruption and those who stay in the prototyping phase. The inconvenient truth remains that: scaling up a disruptive business is always costly. A new initiative can suffer financial losses for years, if not decades, and will be unlikely to achieve the level of profitability of the core business in the foreseeable future. BMW has been profitable for a very long time; Tesla is still operating at a loss today, as is Uber. This is why incumbents need to consider an alternate investment structure, allowing third-parties, venture capitalists, and even competitors to take an equity stake.
4. FROM CO-EXISTENCE TO MONOPOLISTIC COMPETITION
The reason why Uber, which makes no cars, is valued in excess of U.S.$50 billion at the time of this writing, and is commanding a market capitalization higher than that of Ford, BMW, or Honda, is in large part due to its being a “platform” company. In explaining the dynamics of a “platform economy,” as opposed to those of a traditional economy, economists and business researchers emphasize the idea of the “network effect.” The value of a platform largely depends on the number of users on either side of the exchange. The more riders a ride-sharing platform has, for instance, the more attractive it becomes to drivers, leading even more people to use it. And once a platform reaches a certain size, the thinking is that it becomes too dominant to unseat. In other words, a platform economy has no room for multiple players; the market equilibrium will forever move toward a monopoly. That is how Google dominates search engines, Facebook rules social networks, Twitter towers over microblogging, and Netflix, YouTube, and Spotify have cornered the movie-streaming, video-sharing, and music-streaming markets, respectively. It is the winner that takes it all.
DATA MANAGEMENT | THE BIG GAP BETWEEN STRATEGIC INTENT AND ACTUAL, REALIZED STRATEGY
15 https://bit.ly/2ptuEIA16 Grünweg, T., 2013, “Vollgas ins Risiko,” Der Spiegel, July 9, https://bit.ly/2oBSH7E 17 https://bit.ly/2ptuEIA

14 /
Considering such dynamics, the world will simply not be able accommodate so many automakers by the time electric vehicles, autonomous driving, and ride-sharing converge. Once mobility moves away from physical products (the individual cars that manufacturers sell) to on-demand services whose providers operate a variety of self-driving vehicles in fleets, the absolute volume of car sales will drop precipitously. Consequently, the industry will inevitably consolidate, with almost everyone but the very best descending, slowly but inexorably, into irrelevance.
It is not just cars, however. The dilemma experienced by automakers is strikingly similar to the ones facing executives in banking and a host of other industries these days. Just as Detroit is being confronted by Silicon Valley, so too is Wall Street seeing the future of banking everywhere it turns. Turning to China, it sees Alibaba, whose Alipay system has become synonymous with mobile payment, and AntFinancial, Alibaba’s finance subsidiary, which is now worth U.S.$150 billion – more than Goldman Sachs.18 Looking homeward, it sees that startups like Wealthfront, Personal Capital, and Betterment have all launched robo-advisors as industry disruptors. In retail checkout lanes, it sees Square or Clover or PayPal Here taking in credit card payments on behalf of millions of small-time merchants. It sees that the future of banking is not only about big data analytics, but also about drawing on and bundling groups of financial services that take place in real time, with minimal human interaction.
In fact, this data intelligence is the only first-mover advantage that matters. A smart infrastructure that automatically interacts with customers, continuing to improve its algorithm, and adjust its response without human supervision as it handles data gushing in from all around the world at millions of bytes per minute, is essentially a basic competency for any finance institute going forward. Deep-learning-based programs can already decipher human speech, translate documents, recognize images, predict consumer behavior, identify fraud, and help robots “see.” Most computer experts would agree that the most direct application of this sort of machine intelligence is in areas like insurance and consumer lending, where relevant data about borrowers – credit scores,
incomes, credit card histories – is abundant, and the end goal, such as minimizing default rates, can be easily defined. That explains why today, no human eyes are needed to process any credit requests below U.S.$50,000.
But data intelligence also grows in a positive feedback loop, similar to that of the network effect. The more data that are used, the more valuable the business becomes. Google Maps becomes more accurate as more people use it. When the underlying algorithms gain more data to work with, the apps become even more accurate, and consumers like them even more. It is this peculiar dynamic that becomes problematic for traditional banking incumbents when they attempt to scale up their own digital footprints.
Google has made two decades’ worth of investments to digitize all aspects of its workflow, not because the company had a clear notion from day one of what it wanted to predict, but because it is the sort of groundwork that had to take place before a well-defined strategy for AI could be established. Google had digitized everything before a clear view of AI had even fully emerged. Meanwhile, inside many traditional banking companies, managers are often tasked with considering how many different types of data are needed. Data are understandably expensive to acquire, so investment conventionally involves a trade-off between the benefit of more data and the cost of acquiring them. How many different sensors are required to collect data for training? How frequently do data need to be collected? More types, more sensors, and more frequent collection processes mean higher costs along with the potentially higher benefits. In thinking through these decisions, managers have to carefully determine what they want to predict, guided by the belief that this particular prediction exercise will tell them what they need to know. This thinking process is similar to the “re-engineering” movement of the 1990s, during which managers were told to step back from their processes and outline the objective they wanted to achieve before beginning the re-engineering. It is a logical process, but the wrong one.
18 Cheng, E., 2018, “How Ant Financial grew larger than Goldman Sachs,” CNBC, June 8, https://cnb.cx/2LUGG3u
DATA MANAGEMENT | THE BIG GAP BETWEEN STRATEGIC INTENT AND ACTUAL, REALIZED STRATEGY

15 /
Table 2: Ranking of leading financial services companies based on “leap readiness index”
COMPANY NAMES SCORE RANK
MASTERCARD 100.00 1
VISA INC. 93.98 2
GOLDMAN SACHS GROUP 75.49 3
PAYPAL HOLDINGS 69.03 4
SQUARE 63.41 5
WELLS FARGO & CO. 61.87 6
BANK OF AMERICA CORP. 61.48 7
CITIGROUP INC. 61.25 8
CREDIT SUISSE AG 56.06 9
JPMORGAN CHASE & CO. 52.28 10
HSBC HOLDINGS PLC. 51.66 11
UBS AG 50.42 12
BNP PARIBAS 49.54 13
SWISS LIFE AG 49.33 14
PRUDENTIAL PLC 46.73 15
BARCLAYS BANK PLC. 46.61 16
PING AN INSURANCE 44.18 17
ALLIANZ SE 41.92 18
BBVA 40.58 19
AXA SA 39.22 20
PRUDENTIAL FINANCIAL INC. 37.93 21
CNP ASSURANCES 36.96 22
ZURICH INSURANCE GROUP 35.78 23
CHINA MERCHANTS BANK CO. 35.24 24
DBS BANK 34.30 25
CHINA LIFE INSURANCE CO. 33.40 26
MUNICH RE 28.86 27
BANCO SANTANDER SA 28.50 28
CREDIT AGRICOLE S.A. 28.32 29
METLIFE INC. 28.16 30
BANK OF CHINA LTD. 27.74 31
DEUTSCHE BANK AG 25.05 32
OCBC BANK 24.88 33
AMERICAN EXPRESS CO. 24.34 34
STANDARD CHARTERED PLC. 24.28 35
ING GROEP NV 23.09 36
CHINA PACIFIC INSURANCE 22.02 37
ASSICURAZIONI GENERALI S.P.A. 19.59 38
CHINA CONSTRUCTION BANK 19.36 39
INDUSTRIAL & COMMERCIAL BANK OF CHINA (ICBC) 16.56 40
SOCIÉTÉ GÉNÉRALE SA 14.80 41
UNICREDIT SPA 13.23 42
AMERICAN INTERNATIONAL GROUP INC. (AIG) 9.09 43
AGRICULTURAL BANK OF CHINA LTD. 0.00 44
Any data scientist would confirm that datasets become exponentially more valuable when you combine them. Combined datasets often reveal insights and business opportunities that could not have been imagined previously. When Google introduced Gmail, it built a dataset for identity in addition to its search engine dataset. Combining the two datasets created a geometric increase in value, as its AdWords ads would then be capable of providing more value to advertisers and, by extension, to Google. The same thing happened again with Google Maps, which enabled Google to tie identity and purchase intent to location. In each instance, it was only after Google had introduced a new service that the company could then find new scenarios for user data in which combining datasets would be even more valuable. The real value resides in the metadata – the data about data. This is the essence of “you don’t know what you don’t know.”
Put differently, the application of AI renders conventional budget allocations ineffective when banking incumbents seek to scale their digital initiatives. Great businesses often seem like bad ideas when they first appear because their models don’t include proven examples of why they’ll work. This is why banking incumbents have no choice but to follow a disruptive playbook, but with a twist.
5. EMBRACE DISRUPTORS, DON’T SMOTHER THEM
What Table 2 illustrates is a similar composite index to the one used in the automotive sector, but this time, it measures the readiness of each financial institute to leap toward a new frontier of knowledge, and is specifically relevant to the financial sector: mobile payments and services, cryptocurrency and blockchain, AI, and application programming interfaces (APIs).
To achieve a balanced and robust measurement, we take note of the “health” of a company’s ongoing business – the idea that a firm can invest in the future only if it maintains a healthy, ongoing cash flow. Hence, operating margins and
DATA MANAGEMENT | THE BIG GAP BETWEEN STRATEGIC INTENT AND ACTUAL, REALIZED STRATEGY

16 /
rising revenues matter. But for that healthy cash flow to be effectively deployed into new areas, executives need to see beyond their day-to-day operations and be capable of challenging the long-held assumptions of the industry. This process demands diversity in a company’s workforce, which is represented by gender and nationality as well as the specific backgrounds of the top leadership.19 Even if a current CEO is promoted from within the firm, the best-case scenario is what we call the “inside-outsiders.” Legendary CEO Jack Welch of GE is the prototypical inside-outsider. He came from GE’s then-peripheral plastics business, stuttered, had a Boston accent, and was a chemical engineer in a company of mechanical and electrical engineers. Such inside-outsiders know the organization and its culture as well as its people and their capabilities – but they also retain a strong sense of objectivity. Far from just drinking the company Kool-Aid, they understand why and how the company has to change in order to deal with new opportunities and challenges posed by changing markets and technology. From here, we then measure the company’s growth prospects as gauged by investors’ expectations, which are reflected in the company’s price-to-earnings ratio (P/E ratio), the intensity of its investment in startups or new ventures, and, perhaps most importantly, its new product announcements, its announcement frequency, and its press coverage in new areas related to robo-advisors and chatbots, cryptocurrency and blockchain, AI, and APIs.
Unsurprisingly, the index in Table 2 includes a few household names among the fintech developers. PayPal, a digital payments firm that turns 20 this year, and Square, which processes credit card payments from street stalls to coffee stands to fancy farmers’ markets, are both sitting on top of the rankings. And yet, several incumbents have managed to grow just as fast. None are retail banks. The leading incumbents, it turns out, are the legacy infrastructure builders: Visa and Mastercard.
To understand Visa and Mastercard is to understand credit cards themselves. Like Google, Facebook, Uber, WeChat, and many other contemporary platforms, Visa and Mastercard did not make any profit in their initial decades. They did not
even look to make profit during their early days. They were only registered as not-for-profit membership associations,20 although they were allowed to charge their members just enough to cover costs and provide working capital, before they eventually listed on the New York Stock Exchange six decades later.
In 1958, Bank of America, the largest bank in the U.S., as well as in the world, at the time mailed out some 60,000 unsolicited BankAmericards21 in Fresno, California, where it was headquartered at the time. What was unique about the BankAmericard, despite the its limitation of only being usable within the state of California, was that it could be used for any type of purchase at participating merchants, from general stores to gas pumps to restaurants. And unlike other early credit card programs, in which customers were required to pay their balances at the end of each month, BankAmericard was the first to offer revolving credit, allowing customers to pay off their balances over time.
This open approach to various type of merchants prompted numerous banks nationwide to license the card system from Bank of America over the following years. Its subsidiary, BankAmericard Service Corporation, provided other banks with cards and processing services – authorization, clearing, and settlement, including the enforcement of customers’ credit limits, usually by means of a telephone call22 between an authorization center and the purchaser’s banks prior to the arrival of the computer age. By 1968, BankAmericard was accepted in 42 states, with 41 issuing banks, and 1,823 associated banks. The card was also affiliated with banks in Canada, the U.K., Ireland, and Japan.
Bank of America maintained a virtual monopoly in credit card services for other banks for a few years, but its increasing influence worried those other banks, who then sought to shake free. It was a question of how to ensure BankAmericard Service Corporation would not prioritize processing its own credit card transactions at the expense of others. The obvious answer to this question was to create a cooperative association that could then act as a joint venture,23 enabling members to share a centralized payment system while also competing
19 The importance of diversity and inventiveness is reflected even in the Nobel Prizes. Most winners in the U.S. are either first-generation immigrants or their offspring. That relationship between immigration and Nobel Prizes is not surprising when one reflects that the willingness to take risks and to try something drastically new is a prerequisite both for emigrating and for innovating at the highest level. Nobel Prize-winning research demands those same qualities of boldness, risk tolerance, hard work, ambition, and innovativeness. It turns out immigrants and their offspring also contribute disproportionately to American art, music, cuisine, and sports.
20 Evans, D. S., and R. Schmalensee, 2016, “Some of the most successful platforms are ones you’ve never heard of,” Harvard Business Review, March 28, https://bit.ly/22I7nPw
21 https://bit.ly/2xtPzu222 Campbell-Kelly, M., W. Aspray, N. Ensmenger, and J. R Yost, 2013, Computer: a history of the information machine, Westview Press23 https://bit.ly/2HEE76D24 https://bit.ly/2pw9dXp
DATA MANAGEMENT | THE BIG GAP BETWEEN STRATEGIC INTENT AND ACTUAL, REALIZED STRATEGY

17 /
fairly for their own benefit. By 1970, Bank of America ceded control24 of BankAmericard to this newly created association, which was later renamed Visa, a term widely understood in many countries and across many languages to mean “universal acceptance.”
Around the same time, in 1966,25 another group of California banks formed another association, which would soon issue the nation’s second major bank card, Mastercard. It marketed itself to ordinary26 men and women, contrasting with Visa’s historical efforts to capture an upper-income clientele. In the following years, Visa and Mastercard poured resources into computerizing their centralized networks to electronically link the merchants who sold things to the cardholders and the banks that issued the credit cards and underwrote the credit lines for the cardholders. The value of U.S. credit card purchases grew from U.S.$426 billion in 1993 to U.S.$2.17 trillion in 2007.27 Americans increasingly flexed plastic rather than cash to pay for just about everything. The plastic was everything for Visa and Mastercard.
Then, the inevitable happened. Following the lead of Mastercard, which went public in 2006, Visa carried out its own IPO in May 2008, which became the largest U.S. IPO at the time as measured by valuation.28 Still, Visa and Mastercard are similar to a toll road – they collect a fee on every swipe of their plastic cards – and any such established business that relies on a legacy infrastructure is always under threat from an emergent player that could pull customers – cardholders, merchants, and banks, in this case – over to a new ecosystem. Hence, the longevity of the two existing networks and the enormous growth that they continue to enjoy can only be explained by the two opposing strategies that these two now publicly traded companies have embraced so completely.
One strategy to defend a company’s market share when a new offering is making inroads is to improve its existing technology, which can result in a prolonged period of coexistence. Visa and Mastercard have, therefore, exploited all possible extension opportunities. When they saw Mobil, now part of Exxon, introduce Speedpass, a little black tube29 for customers
to attach to a keychain and wave in front of the pump at the gas station to charge their purchase – which is, in effect, a proprietary system that functions as a store card – Visa and Mastercard started working with third-party merchants on a host of smart chip technologies for “contactless payment,” “touch-and-go,” and “pay-with-a-wave” transactions. When they saw the proliferation of personal passwords, which made remembering the additional password of a new credit card impossible, Visa and Mastercard unveiled a card with an embedded fingerprint scanner,30 a small square sitting at the top right-hand corner that acts as a biometric reader. All these innovations were meant to improve the performance of their existing offerings in order to forestall substitution by new solutions.
At the same time, since the dawn of the smartphone era, too many new entrants providing payment methods – Apple Pay, Google Wallet, Square, PayPal, Vimeo, and Revolut, just to name a few – have all proven themselves powerful innovators that can design offerings that consumers crave. Accordingly, they have carved segments of the market away from the credit cards that traditional retail banks issue. And in the face of these changes, the only proven strategy Visa and Mastercard can rely on in order to maintain the relevance of their legacy infrastructure is to bypass their own plastic, de-emphasizing and destroying the very physical embodiment of their products that was cherished for decades, and allowing these disruptors to connect into their own toll road. If you can’t beat them, let them join you.
It should, therefore, come as no surprise that at the Apple event in March this year, when the Apple card was announced, commentators noticed,31 in addition to the card’s “subtle off-white coloring” and “the tasteful thickness of it,” the Apple logo emblazoned in all its minimalist glory. The card promised breakthrough features such as no fees of any kind and AI software that would actively encourage users to avoid debt and provides recommendations to pay it off quickly. Sharing space on the back side of the card are the logos of Goldman Sachs, the underwriter, and Mastercard. Not even Apple can shake off the plastic network.
DATA MANAGEMENT | THE BIG GAP BETWEEN STRATEGIC INTENT AND ACTUAL, REALIZED STRATEGY
25 https://bit.ly/2oxOt0R26 https://bit.ly/2nXLoY227 https://bayareane.ws/2pvTKXr28 https://bit.ly/2vqqzED29 Dean, R., 1998, “Speedpass gas,” Wired, April 1, https://bit.ly/2nLhdmV30 Burgess, M., 2017, “Mastercard trials biometric bank card with built-in fingerprint sensor,” Wired, April 20, https://bit.ly/2ox85iu31 Savov, V., 2019, “The Apple Card is Apple’s thinnest and lightest status symbol ever,” The Verge, March 25, https://bit.ly/2OpuRow

18 /
And it is not just Apple. PayPal, Square, Samsung Pay, Google Pay, Facebook Credits, Stripe,32 and even Coinbase, a cryptocurrency upstart,33 all work with Visa and Mastercard. In other words, no fintech can disrupt anyone unless they pay a toll to the old boys’ network. The reason is simple. An interface standard has emerged that has made Visa and Mastercard so simple and powerful to work with that their vast networks are irresistible for any fintech: application programming interfaces (API).
In the simplest of terms, an API is an official set of rules and guidelines that facilitates the exchange of information between two pieces of software. These software routines, protocols, and tools can, therefore, allow third-parties to tap into Visa and Mastercard’s infrastructure. “While many legacy bank players have been hesitant to see Visa as primarily a technology company,” observed Gilles Ubaghs,34 senior analyst of financial services technology at Ovum, “the recent launch of Visa’s Developer platform, … with a host of APIs offering a full mix of payment functionality, all built on Visa’s underlying core network, [shows that] Visa is opening up its full capabilities directly to the broader digital ecosystem.”
The major breakthrough here, then, is the realization that a product’s best feature will never be invented in-house. Visa and Mastercard realize that killer apps must be invented by third-parties, who are closer to their own customers. For someone who runs a legacy infrastructure, the best strategy is to allow others to discover new uses for the existing system. Whenever a third-party application becomes significant enough, the system co-opts it in order to remain flexible, all the while setting new standards for the industry.
In fact, setting new standards is exactly Visa and Mastercard have in mind. Both networks are launching “tokenization services,”35 which generate a unique token for each individual credit card, rather than using conventional credit numbers, in order to prevent hackers from accessing important information. If anything, Visa and Mastercard are becoming the payment sector equivalents to what standard setting organizations (SSOs) are for telecom. SSOs have helped drive the major technological revolutions of the last several decades, including the internet and mobile phones. Mobile carriers, handset makers, and chip providers, for example, all have to agree on a common standard – like 5G – in order
for what they do to work together. Every generation of mobile phones since the early 1990s has followed years of effort by an SSO to create standards. The SSO usually publishes a standard and disseminates it at low cost, or even for free. Industry observers tend to give a lot of credit to Apple, Google, and Samsung for developing great mobile software platforms. But Android and the iOS would not have been possible and, in fact, probably wouldn’t have been created if SSOs had not created the technology platforms to provide fast and capacious broadband. Inside the massive information technology industry, SSOs are the most successful platforms consumers have probably never heard of.
There may come a day when credit cards themselves disappear, but Visa and Mastercard can still be ubiquitous, still making all the hard parts of sending and receiving money around the world look easy. In that world, their only real competitor is perhaps UnionPay, China’s monopoly bank card service provider.
6. MANAGING BY COMMITMENTS
From Amazon to Square to Ant Financial, from Tesla to Uber to PayPal, profitability is not the most important metric for managers – the user base and market share are. That is also why banking and automotive incumbents need to consider an alternative investment structure, allowing third-parties, venture capitalists, and even competitors to take an equity stake. Such a structure seems controversial but is not unprecedented. Alibaba does not own all of Ant Financial, and Uber now owns a minority share of its Chinese rival, Didi, after exiting China. (Today, Didi provides twenty million rides per day in China, over triple the volume of Uber worldwide.)
And it is not just capital, it is also structure and the reporting line. Treat the new initiative as a company within a company. A classic example is Steve Jobs’ approach to managing the original Macintosh team, which had separate offices that were off-limits to regular Apple employees. Larry Page applied the same technique to Android by allowing Andy Dubin’s team to work in separate offices – Google employee badges did not grant access to the Android offices – and adopt different hiring practices than those of the parent company. The same was largely true for the PlayStation project at Sony, the Kindle project at Amazon, and the Watson team at IBM.
32 https://bit.ly/2oCqu0v33 Mearian, L., 2019, “Visa and Coinbase team up to create crypto-backed debit card,” ComputerWorld, April 11, https://bit.ly/2psFFd334 Samuely, A., 2017, “Visa’s open APIs signal battle against Silicon Valley payment platforms,” Retaildive, https://bit.ly/2oAREoE35 Jaekel, B., 2017, “MasterCard brings tokenization to retailers’ mcommerce apps for added security,” Retaildive, https://bit.ly/2puQ87V
DATA MANAGEMENT | THE BIG GAP BETWEEN STRATEGIC INTENT AND ACTUAL, REALIZED STRATEGY

19 /
This combined strategy of external capital and structural autonomy was adopted by GM’s CEO Mary Barra, and it paid off handsomely in May 2018, when SoftBank announced a U.S.$2.25 billion investment in Cruise Automation, the self-driving unit of General Motors, headquartered in San Francisco. The investment pushed Cruise’s valuation, originally purchased by GM for U.S.$581 million, to U.S.$11.5 billion. It takes more than a vision, belief, passion, and experimentation with AI to transform a company, it takes autonomy and a pocket so deep that it includes other people’s money. It is an unconventional approach taken during an unconventional time.
Lest executives excuse themselves from exploring these radical approaches and forestall changes, thinking that their organizations can bide their time, the travails of Procter and Gambles (P&G) illustrate the necessity of facing the inevitable.
7. BOARDROOM SOAP OPERA AT P&G
No industry is changing faster than retail. A recent report in 2017 by the consultancy BCG documented a general decline in sales36 among consumer-packaged goods (CPG) companies in the U.S., with mid-sized and large companies losing market share and small companies increasing theirs. Consultancy Catalina also revealed that 90 of the 100 top brands37 had all lost market share. In dollar terms, small players – defined as those with sales less than U.S.$1 billion – grabbed approximately U.S.$15 billion in sales from their larger peers between 2012 and 2017. Shoppers now purchase more online, making fewer trips to stores, and seeing fewer in-store promotions. A small but trendy razor club with a hip logo, Harry’s,38 attracts more Instagram followers and product subscriptions through its website than a fully stocked Gillette aisle in a supermarket ever could. Hence, Harry’s has been growing 35% year-on-year between 2014 to 2016, three times faster than the industry average,39 commanding 9% of all online razor sales.
Whereas the Gillette aisle in the local supermarket targets exactly one neighborhood, Harry’s website reaches millions. Harry’s bolsters the subscription habits of its recurring consumers, whereas Gillette relies on in-store impulse buying. When someone buys a razor in a store, Gillette has no clue who is buying what and when; Harry’s knows it all.
Newcomers like Harry’s still represent only a fraction of the overall market,40 but they have captured the majority of the growth in that time – a defining feature of disruptive innovation. This in part explains why consumer product giants like Procter & Gamble are seeing their sales of products like Tide detergent, Gillette razors, Pampers diapers, and Crest toothpaste stagnate, despite the fact that the “restructuring at P&G has been going on for 20 years,” according to one former finance manager, “without much to show for it.”41 It seems that no matter how much P&G tried reorganizing itself, it cannot reverse the decline from U.S.$83 billion in sales in 2008 to U.S.$65 billion in 2017.42 With its total return – stock performance plus reinvested dividends – is about half of that of Kimberly-Clark and Colgate-Palmolive, P&G has inevitably attracted unwanted attention from active investors, who believe the maker of Tide and Pampers has not been moving fast enough to revive sales and profits.
Unlike 1980s corporate raiders, today’s activist hedge funds do not usually seek to take over companies outright in order to break them apart and “unlock shareholder value.” Nelson Peltz, of Trian Fund Management, for instance, bought a 1.5% minority stake of P&G worth U.S.$3.3 billion shares, so as to press for reforms. Trian’s 94-page presentation43 detailed how granting Mr. Peltz a board seat could help shareholders to “revitalize P&G together.” Peltz attacked P&G’s “suffocating bureaucracy and excessive costs which create structural drags on the business,” and the current management team’s “short-term thinking (selling businesses versus fixing businesses, cutting ad spend last quarter, etc.) that doesn’t address the root causes of P&G’s challenges,” and promised to fix P&G’s “innovation machine,” in order to realize the company’s agenda of “winning in digital” and “improving development of small, mid-size & local brands, both organically and through M&A.” Peltz was not trying to break up the company, nor was he suggesting replacing the current CEO. Nor was he seeking to cut pension benefits or reduce R&D and other capital and marketing expenditures. His no-nonsense talk was to appeal to retail investor votes and index funds, trying to win them over for a “proxy fight” during a meeting of shareholders on October 10, 2018.
DATA MANAGEMENT | THE BIG GAP BETWEEN STRATEGIC INTENT AND ACTUAL, REALIZED STRATEGY
36 Edelstein, P., Krishnakumar (KK), S. Davey, A. Gupta, S. Marcus, J. Brennan, and C. Loeys, 2018, “What the fastest-growing CPG companies do differently,” Boston Consulting Group, June 14, https://on.bcg.com/2IV413l
37 Lukovitz, K., 2015, “Top 100 CPG brands’ sales, market share down, even as overall categories grow,” MediaPost, September 30, https://bit.ly/2n2bPLB38 https://bit.ly/2xf7HbB39 https://bit.ly/2n79kYC40 https://bit.ly/2nZKdap41 https://nyti.ms/2yShjc742 https://on.wsj.com/2o14ext

20 /
The lead-up to the shareholders’ meeting ended up being the most expensive proxy fight in the annals of corporate America. While Trian hired the former P&G CFO Clayton Daley as an advisor,44 the activist hedge fund also ran a sophisticated campaign to reach retail shareholders in September, inundating them with mailings, phone calls, and outreach, featuring sleekly produced websites and videos, on social media platforms. Meanwhile, P&G enlisted the help of four banks45 – Goldman Sachs, Morgan Stanley, Centerview and Lazard – to defend its cause. CEO David Taylor appeared on Jim Cramer’s Mad Money,46 saying Peltz was “dangerous” and would “eliminate” R&D. Former P&G CEO, A.G. Lafley, came out against Peltz, arguing that the investor’s “game plan” involved “cost cuts, board and management shake ups, asset sales and break ups.” Both sides were courting independent investors who were set to vote on whether to add Mr. Peltz to the board. P&G vehemently argued the contender “[brought] no new ideas to the table,” while Peltz said the management team “[had] lost and [were] continuing to lose market share.”47 Put differently, P&G’s claim was that it had already launched initiatives to solve the problems that Peltz said he had identified; Peltz argued the efforts were insufficient. By September 22nd,48 Glass Lewis, one of two major shareholder advisory firms, urged investors to back Peltz and his “cogent well-framed arguments.” And on September 29th, Institutional Shareholder Services gave Peltz another boost, saying he presented a “compelling case.” During the campaign, at least U.S.$60 million dollars were reportedly spent by both sides to sway investors to their viewpoint.49
Ultimately, P&G emerged victorious.50 At its announcement of the election results on October 10, it revealed shareholders had voted against Peltz and re-elected all 11 incumbent directors, but with a wrinkle. Institutional investors split their vote, with two of the three largest groups – State Street Global Advisors and Blackrock – supporting Peltz, and the other – Vanguard – supporting management. The wrinkle remains that P&G’s victory was based on only “preliminary results”51 tallied that day, not all the votes cast. All in all, Peltz lost by just 0.2% of P&G’s 2.65 billion eligible shares: he received 48.6% of the vote to P&G’s 48.9%, losing by a margin of 0.0016% of the total shares outstanding.52 “We’ll talk,” CEO Taylor said to Peltz, extending a hand. “We’ll talk but we don’t listen,” Peltz replied, to which Taylor insisted, “No, no, no, that’s not true.”
With the result being “too close to call,” P&G agreed in December 2018 to give Nelson Peltz a seat on its board.53 It also added the CEO of pharmaceutical giant Novartis, Joseph Jimenez, to its board effective March 1, 2019, thereby increasing the board from 11 members to 13.
The vote’s thin margin also means there remains work for P&G to do in order to regain the support of a large percentage of its shareholders, to whom Peltz wrote on an email that “I look forward to bringing fresh perspectives to the boardroom, and working collaboratively with (CEO) David and the rest of the board.”54
It will forever be impossible to quantify the effect of the two new board members on P&G’s own trajectory. What is clear is that the company can no longer be a mere “industrial corporation with a future based on technology”; rather, it must become a house of startup brands that runs pop-up stores, makes home deliveries, celebrates communities with parties, fosters subscription models, and curates compelling product personas, all while gathering comprehensive consumer data to guide new product innovation. That is the long-term goal. In the short term, P&G immediately went to war to clean up the online ad market and used its pull as the world’s biggest advertiser to squeeze more information about the effectiveness of digital ads out of Google and Facebook. It slashed digital ad expenditures by more than U.S.$200 million and issued an ultimatum for tech firms to become more transparent.
Then in early February 2019, P&G’s Tide – the highest-selling detergent brand in the world – announced it was doubling the size of its laundry store business, aiming to have more than 2,000 cleaning stores by the end of 2020 across the U.S.55 Such is P&G’s approach to going after urban millennial and Gen Z consumers and becoming a direct-to-consumer business, all while weaning itself off its total dependence on other e-commerce giants. One can simply walk into one of its airy, bright, and colorful laundry stores, which stand worlds apart in a market dominated by mom-and-pop laundromats. Features include a 24-hour drop-off and pickup kiosk, a two-lane car-side valet service, and free same-day service for drop-offs by 9 a.m.
44 https://bit.ly/2nXvCML45 https://cnb.cx/2g9B2k646 https://bit.ly/2oFMMi847 https://on.wsj.com/2oEOb8i
48 https://bit.ly/2nXvCML49 https://nyti.ms/2yShjc750 https://bit.ly/2zbCKpr51 https://bit.ly/2pusl8a
52 https://on.wsj.com/2ssAcUI53 https://on.ft.com/2nO49xa54 https://cnb.cx/2jctjQ455 https://cnn.it/2pvdgmL
DATA MANAGEMENT | THE BIG GAP BETWEEN STRATEGIC INTENT AND ACTUAL, REALIZED STRATEGY

21 /
Table 3: Ranking of leading consumer brand companies based on “leap readiness index”
COMPANY NAMES SCORE RANK
UNILEVER PLC. 100.000 1
NESTLE S.A. 89.168 2
PROCTER & GAMBLE CO. 81.756 3
COCA-COLA CO. 80.399 4
L'OREAL SA 73.466 5
MCDONALD’S CORP. 71.949 6
STARBUCK COFFEE CO. 64.832 7
ALTRIA GROUP INC. 60.160 8
COTY INC. 58.876 9
BRITISH AMERICAN TOBACCO PLC. 55.532 10
PEPSICO INC. 52.052 11
RECKITT BENCKISER GROUP 49.608 12
DIAGEO PLC. 49.401 13
FONTERRA CO-OPERATIVE GROUP 48.037 14
PERNOD RICARD SA 47.603 15
KRAFT HEINZ CO. 47.002 16
SHISEIDO CO. 46.693 17
ESTEE LAUDER COMPANIES INC. 46.448 18
ANHEUSER-BUSCH INBEV SA/NV 45.120 19
COLGATE PALMOLIVE CO. 42.087 20
The average American spends more than an hour per day –up to 372 hours every year56 – sorting, washing, drying, and folding laundry. And laundry came out as one of the most-hated household chores, only surpassed by toilet-cleaning and doing the dishes. But the nice decorations and polite staff members at Tide Cleaners are not the point. For P&G, the point is that the service is tied to its Tide Cleaners app, where consumers submit cleaning instructions and their drop-box number and are notified when their washing is ready for collection. To access the pickup kiosk, for instance, customers register for the cleaner’s rewards program by entering their email addresses and credit card information. When their order is ready, customers receive an email alert and can pick up their garments at the kiosk by inputting their four-digit PINs or by scanning a QR code from their smartphone. P&G used to
know nothing about who was buying Tide detergent from the local grocers and supermarkets, but now it knows exactly who is using Tide Cleaners as well as how and when they use it. Some say “data is the new oil,” but P&G understands direct customer service is the new oilfield.
Strategy, in the end, is about leveraging one’s unique assets to deliver a competitive punch in the marketplace. While P&G has no edge in a competition against Amazon for an e-commerce website, the Tide brand still commands the advantage of instant recognition and a likeability score higher than Starbucks and Chick-fil-A.57 That means taking a traditional product into a direct consumer business would, for the first time, allow P&G to play a different game, access a new trajectory of learning, and even experiment with a new business model. It would require more than industry benchmarking. No consultant could convince a skeptical management team to undertake such seemingly “unrelated diversification.” But for the 180-year-old P&G to prosper for another century, it must take some bold steps to break away from its past.
Nelson Peltz’s proxy war was a warning shot to blue-chip companies that activist investors are setting their sights on ever-bigger corporate targets – whether it is auto, retail, or even pharmaceutical giants – as they agitate for changes in strategy and structure by asserting direct control over corporate decisions. And P&G, one of the largest consumer-packaged goods (CPG) companies finally climbed back into the major leagues, as shown in Table 3, after its tumultuous proxy fight. The fight does signify58 that “no company is off limits because of its size, industry, the complexity of its business or even its stock price performance.”
8. A FINAL WARNING AND ONE LAST FLASHBACK
Adjacent to the Mercedes-Benz museum in Stuttgart, Germany, is one of the largest Mercedes dealerships in the world, which I also visited during the autumn of 2018. Its cavernous main hall is preceded by a restaurant, a café, and a shop hawking Mercedes-Benz merchandise. I saw a vertical banner stretching down from the ceiling to the floor along the glass panels on one wall. “Ready to change,” the banner cheered. “Electric intelligence by Mercedes-Benz.” It
DATA MANAGEMENT | THE BIG GAP BETWEEN STRATEGIC INTENT AND ACTUAL, REALIZED STRATEGY
56 https://bit.ly/2nZKzOf57 https://bit.ly/2pnhLzB58 https://nyti.ms/2yShjc7

22 /
referred to Concept EQ, a brand of electric plug-in models first unveiled in Stockholm on September 4, 2018. I found three EQs on display, right next to an exhibition kiosk that did not work. It was presenting an error alert, and had tangled cables spilling out from its backside, which had come unglued. Then, an escalator took me to the top floor, where I found visitors gawking at a Mercedes-AMG, known for its “pure performance and sublime sportiness.” Here was the vision of a forward-looking sport car with all the driving pleasure fully realized. The risers and the wrap-around LCD walls only accentuated the carbon-fiber composites of the chassis glowing in matte black. One thing I did also notice was that the rating of CO2 emissions of this Mercedes-AMG GT 63 S, with its 630 horsepower, was an F.
APPENDIX: METHODOLOGY AND DATA
This appendix presents a short description of the calculation behind the “leap readiness index” for the automotive industry, financial services, and consumer packaged goods sector in 2019.
• P/E ratio last year
• Price-to-book value last year**
• 3Y CAGR market capitalization
• % of women management board members
• CEO demography
• Headquarters competitiveness
• AUM per employee last year*
• Operating revenue per employee last year
• Loan-to-deposit ratio**
• Press count on “blockchain”
• Press count on “mobile services”
• Press count on “AI”
• Press count on “APIs”
• Press count on “ventures”
• Number of investments in the last three years
• 3Y CAGR turnover
• 3Y average profit rate
• 3Y average EPS
• AUM (asset under management) last year*
• 3Y CAGR AUM
• Equity-to- asset ratio**
INVESTORS’ EXPECTATIONS OF FUTURE GROWTH
EMPLOYEE DIVERSITY
BUSINESS PRODUCTIVITY
EARLY RESULTS OF INNOVATION
OPENNESS TO NEW IDEAS
• Press count on “corporate venturing”
• Number of patents
• Number of acquisitions
• Number of investments
• % of women employees
• % of women management board members
• CEO demography
• Headquarter competitiveness
• 3Y CAGR R&D intensity
• 3Y average R&D intensity
• 3Y CAGR R&D expenses
• Press count on “autonomous vehicles”
• Press count on “EVs”
• Press count on “connected cars”
• Press count on “sharing mobility”
• % of internatioanl sales last year
• 3Y CAGR turnover
• 3Y CAGR mkt cap
• 3Y average profit change
• P/E ratio last year
BUSINESS DIVERSITY
EMPLOYEE DIVERSITY
RESEARCH AND DEVELOPMENT
EARLY RESULTS OF INNOVATION
FINANCIAL PERFORMANCE
FINANCIAL FUNDAMENTALS
Notes* For payment companies, we use “the number of transactions” as a proxy.**We treat payment companies differently than other financial service companies.
Table 1 includes the top 20 (with the rest of the top 55 available from the authors) automakers and component suppliers by revenue, as at the end of 2018. The ranking measures five factors: (1) financial performance, (2) business diversity, (3)
employee diversity, (4) research and development, and (5) early results of innovation efforts. These five main factors are tracked by 20 separate indicators that carry the same weight in the overall consolidated result.
To compile the 2019 Leap Readiness Index for the financial sector (Table 2), we have included 44 top retail banks, insurance services, and leading payment companies based on their revenue by the end of 2018. The ranking is based on six main factors: (1) financial fundamentals, (2) investors’ expectations of future growth, (3) employee diversity, (4) business productivity, (5) early results of innovation, and (6) openness to new ideas. These six main factors, which carry the same weight in the overall result, produce 21 indicators.
Similarly, the 2019 Leap Readiness Index for the consumer-packaged goods sector (Table 3) which included 20 top companies by their revenue as the end of 2018 (with the rest of the top 44 companies available from the authors), is also built on six main factors: (1) financial fundamentals, (2) investors’ expectations of future growth, (3) employee diversity,
(4) business productivity, (5) early results of innovation, and (6) openness to new ideas. These six main factors are tracked by 19 indicators that carry the same weight in the overall result.
DATA MANAGEMENT | THE BIG GAP BETWEEN STRATEGIC INTENT AND ACTUAL, REALIZED STRATEGY

23 /
To calculate the index, we first collected historical data for each company. Then we performed calculations for each indicator (e.g., 3Y CAGR) before we standardized the criteria data. Next, we aggregated indicators to the main factors and then determined the overall ranking. For the purpose of comparison, we ranked each company from 1 (best) to 55/44 (worst) on a scale of 0 to 100.
DATA MANAGEMENT | THE BIG GAP BETWEEN STRATEGIC INTENT AND ACTUAL, REALIZED STRATEGY
• P/E ratio last year
• 3Y CAGR market capitalization
• Enterprise value / EBITDA last year
• % of women management board members
• CEO demography
• Headquarters competitiveness
• % of women executive comittee
• Revenue per employee last year
• 3Y average profit per employee
• Number of Facebook likes for top brand
• Press count on “sustainability“
• Press count on “omnichannel”
• Press count on “subscription”
• Press count on “venture”
• Number of acquisition in the past three years
• Number of investments in the last three years
• 3Y CAGR turnover
• 3Y average profit rate
• 3Y average EPS
INVESTORS’ EXPECTATIONS OF FUTURE GROWTH
EMPLOYEE DIVERSITY
BUSINESS PRODUCTIVITY
EARLY RESULTS OF INNOVATION
OPENNESS TO NEW IDEAS
FINANCIAL FUNDAMENTALS
All of our indicators are hard data; that is, they are publicly available on company websites and in annual reports, press releases, news stories, and special reports on topics such as corporate social responsibility. For press count data, we consulted Factiva, a global news database that covers various premium sources, and counted the number of press releases on each trending topic previously identified in this sector that had been issued over the past three years (2016–2018). The data was also supplemented by third-party data sources from CrunchBase, which specializes in the topic of corporate ventures.

24 /
ALVIN TAN | Principal Consultant, Capco
the industry. Customers are increasingly expecting a level of servicing (in relation to, for example, accessibility, availability, privacy, security, and personalization), that can only be effectively delivered through fundamental uplifts in the way data is handled and leveraged within the organization.
However, as this article sets out, maximizing the returns on investment (RoI) in data science requires (1) a scalable means of harnessing the hidden connections, correlations, and relationships in the vast quantities of data available, and (2) a business culture that readily accepts and allows data science to influence its business strategy. It is our belief that a strong and mature data management capability is crucial in achieving both objectives.
2. WHAT IS DATA SCIENCE?
Simply put, data science is the collection of analytic methods and tools by which business insights can be extracted from statistical and semantic relationships in data. Data allows an organization to both develop a deeper understanding of what has happened, and also make stronger predictions as to what might happen. Drawing upon a variety of disciplines covering applied mathematics, information technology, computational theory, and data visualization techniques, these methods and
ABSTRACTData sourcing and cleansing is often cited by data scientists to be amongst the most critical, yet most time-consuming aspects of data science. This article examines how data management capabilities, such as data governance and data quality management, can not only reduce the burden of data sourcing and preparation, but also improve quality and trust in the insights delivered by data science. Establishing strong data management capabilities ensures that less time is spent wrangling data to enter into an analytics model and more time is left for actual modeling and identification of actionable business insights. We find that organizations that build analytics data pipelines upon strong data management foundations can extract fuller business value from data science. This provides not only competitive advantage through the insights identified, but also comparative advantage through a virtuous circle of data culture improvements.
DATA MANAGEMENT: A FOUNDATION FOR EFFECTIVE DATA SCIENCE
1. INTRODUCTION
In the past decade, competitive threats from new market entrants, heralded by the digital revolution, are placing ever-increasing pressures on margins within the banking industry. New arrivals from the digitally-savvy fintech sector are free from legacy thinking and infrastructure, and traditionally non-banking organizations are increasingly looking to cross-sell financial services to their large existing customer bases. Both types of entrants possess substantial comparative advantages over traditional banks, which is causing a significant disruption of the banking landscape.
Whether it is seeking to gain an advantage or simply to protect market share and keep up with the competition, this has resulted in a rapid advancement of digital agendas at more traditional banks. Increasing digitization, of course, means increasing dependence on, and generation of more, data. Combined with data from existing ‘analogue’ operations, as well as access to a sea of current and historic market data, banks are increasingly looking for ways to make all their data work for more than it was originally intended.
It is against this backdrop, in the hunt for net margins and differentiation of products/services, that data science is fast becoming a key capability for old and new players alike in

25 /
tools encompass the most basic of spreadsheet-based data analyses to complex machine learning (ML) and inferential artificial intelligence applications.
Financial services organizations (FSOs) leverage data science in a variety of ways to discover new opportunities and make data-driven decisions around risk management and operational efficiency. Use-cases range from developing better customer relationships, and understanding of preferences, to predicting employee behavior and detecting financial crime – data science can be applied in any function that generates or has access to data. The overall idea is that these insights can then be turned into actionable business strategies that would otherwise not be visible to an organization.
DATA MANAGEMENT | DATA MANAGEMENT: A FOUNDATION FOR EFFECTIVE DATA SCIENCE
For all the zeitgeist, however, data science, as the name would suggest, is still a data-driven discipline at heart. Regardless of method or complexity, a common process exists for all data analytics processes (Figure 1): the data must first be sourced and prepared for inputting into the analytics, and the analytics output must then be evaluated by the data scientist who then communicates any insights to decision makers.
The implication is that the intended insights and business value of the analytics can only ever be as good and reliable as the data that underpins it. Or in other words, “garbage in, garbage out”, and when it comes to data science, there is more than just a nugget of truth in this well-worn cliché.
Figure 1: Data analytics processes
SOURCE THE DATA
PREPARE THE DATA
RUN THE MODELS
EVALUATE THE RESULTS
DETERMINE THE INSIGHTS
3. LIES, DAMNED LIES, AND STATISTICS
As a capability, data science is only effective if it ultimately provides positive value – the analytics results must serve a business purpose. Increasing the effectiveness of a data science capability means producing insights that can be trusted so that decision makers can turn these into strategies, which when executed produce business outcomes that are in line with the expectations set. This in turn drives a virtuous circle where data science is increasingly placed at the heart of an organization’s strategic decision making.
‘Garbage out’ – incorrect, misleading, meaningless, or otherwise unusable data science output – causes non-optimal strategies and misguided business decisions at best, and financial and reputational damage at worst. This not only reduces the business value of the immediate results, but also erodes the trust that decision makers will have in future results, breaking the circle.
Here the issue of trust is key. Regardless of how powerful, accurate, or statistically reliable the results are, the data science capability itself needs to be trusted for decision
makers to turn the analytics results into business strategies. Establishing, retaining, and growing this trust requires business outcomes that are consistently in line with the expectations set by the communicated results.
In the evaluation of data science insights, qualifying the results with a degree of confidence sets expectations as to how reliable the conclusions are. Confidence is provided quantitatively by an array of statistical measures, such as confidence intervals, p-values, and r-squared values. It is also provided qualitatively by descriptive interpretation of the statistical results, caveating the assessment with any risks to the reliability of results due to the assumptions made, model specification, sampling, or data quality issues. Together, these form the basis of trust between the data scientist and the decision maker.
Full and appropriate qualification of results with known reliability issues is simply good scientific methodology. Failure to evaluate results properly is something that should be vigorously guarded against by any number of educational, procedural, or ethical controls within the data science capability itself.

26 /
More damaging to trust, however, are the unknown unknowns – when there is an incomplete picture of the reliability and where this fact is not itself known. The causes may stem from issues associated with the scientific methodology, as well as from data scientists having misplaced assumptions in the semantics, provenance, and quality of the underlying data. The results cannot be qualified with something the data scientist is unaware of, and this unknowingly sets false confidence in the results.
This is even more pertinent with data science applications that involve probabilistic outcomes, such as machine learning. In such circumstances, the results are determined from a series of learned outcomes using training datasets. If confidence information is not built into the training process and the learned outcomes adjusted accordingly, the wrong outcomes are learned, and there will likely be significant systemic biases/errors in the final results.
In all cases where the reliability of outcomes is not clearly and accurately determined, significant damage to trust can happen. If analytics results are communicated and acted upon at face value, without knowledge of underlying issues in either the data or the analytics, business outcomes will likely become divergent from the expectations set.
In short, if making no prediction at all is better than providing a false one, then having no data is better than not knowing you have bad data. If data science is to be invested in as a strategic capability, then it is necessary to build trust in data science with decision makers. This not only requires the adoption of sound scientific methodologies, but also a cost-effective mechanism of ensuring data issues are managed, made known, and resolved.
These can be summarized into two key data management requirements for analytics processes: understanding and obtaining the right data, and fixing the data obtained.
3.1 Understanding and obtaining the right data
With model-led analytics (e.g., machine learning) the data scientist inputs data into an existing analytical model in order to ascertain its accuracy and viability. In this paradigm, the data scientist must first understand the semantics of what data is to be sourced so that the conceptual and contextual specifics of the required data can be specified. The data scientist must then determine where to source the specified data from, which requires an understanding of data provenance in order to ensure data is sourced appropriately.
DATA MANAGEMENT | DATA MANAGEMENT: A FOUNDATION FOR EFFECTIVE DATA SCIENCE

27 /
Data semantics and data provenance are also crucial for data-led analytics such as data mining. In this paradigm, the data scientist identifies correlations within a given dataset and derives a theory or hypothesis from the observed results. As such, the semantics and provenance are not required to source the data, but to understand what and where the data has been sourced from so that the results can be appropriately understood and qualified.
In both paradigms, an understanding of data semantics and data provenance are critical for ensuring that the analytics has the right data:
• The data that is needed must be properly and unambiguously defined. To the uninitiated this seems like a trivial task, but the devil is in the detail and getting it wrong risks the analytics being run over the wrong data entirely. This involves identifying and establishing a shared understanding with potential data providers of what is required. If the data scientist wants ‘customer name’, for example, then an agreement must be made with the provider as to whether ‘name of account holder’ means the same thing semantically. In this example, there are many hidden nuances: does customer name include prospective or former customers? Does name of account holder cover mortgages, or current accounts, or both? Arriving at a mutual understanding is no simple task without a commonly agreed understanding of the definition, taxonomy, and ontology of the data.
• The data that is obtained must be representative of the population. An unrepresentative sample, for example where data obtained only represents specific subsets of the required population biases analytics outputs. As an example, if retail banking customer names are required, then it is important to ensure that the data is sourced from a provider that aggregates customers for all retail banking products, and not just, say, mortgages. Resolving this sourcing challenge requires not only accurate semantic articulation of the data required, but also an understanding of where this data can be reliably obtained.
3.2 Fixing the data obtained
Once sourced, data may still contain data quality issues that must be properly understood and resolved prior to analytics. Resolving and correcting for data quality issues is a data cleansing process that forms a critical part of the analytics preparation.
Poor quality data inputs can manifest in a variety of ways:
• Data may contain gaps, which if not corrected at source, accurately inputted, or omitted entirely, biases the output.
• Similarly, data may contain duplicates, which if not omitted will also result in biases.
• Data may not conform to an expected format, which if not corrected may at best break the analytics model, or at worst cause the results to become heteroscedastic (where the statistical results falsely suggest that the data comes from more than a single population distribution).
• Data may contain errors, which if not corrected will reduce the accuracy of the results.
• Data may be out of date, and the relationships inferred may no longer be applicable.
• Data may not be granular enough or sample size may be insufficient, both of which weaken explanatory power and the significance of outcomes.
To go back to our cliché, the ‘garbage in’ – incorrectly defined, inaccurate, incomplete, or otherwise poor quality data entered into an analytics process – is a primary limiting factor on the usefulness and reliability of analytics results. If providing quality inputs helps to ensure quality outputs, then having a cost-effective mechanism for understanding and resolving issues in sourced data is critical for improving the effectiveness of a strategic data science capability. This cost-effectiveness is provided by ensuring an effective centralized data management capability is in place.
4. MANAGING THE INPUTS
If what you get out of an analytics process is only as good as what you put in, then producing good outputs at scale requires cost-effective ways of controlling the inputs. For effective data science, it is just as critical to understand whether or not bad inputs exist, as it is to remediate them.
Good data scientists already know this.
Due to the criticality of ensuring an analytics process is provided with good inputs, data science projects often allocate a seemingly disproportionate amount of time, effort, and resources to simply preparing data for the analytics. The required data needs defining and describing semantically, trusted sources need to be identified, data quality needs to
DATA MANAGEMENT | DATA MANAGEMENT: A FOUNDATION FOR EFFECTIVE DATA SCIENCE

28 /
be measured, and issues identified and controlled. As we have already discussed, these are necessary activities to ensure that the end results are reliable and that decision makers continue to trust in the results.
Defining what is needed, identifying where to get it, and data cleansing are, therefore, the data management requirements of analytics processes.
However, these are also hugely time and resource intensive activities. By some estimates, 80% of project time is typically spent preparing data for an analytics project.1 Even for an organization actively seeking to become more data-driven, this is difficult to scale across more than just a handful of projects, and significantly raises the bar for a data science project to be viable through its benefits. In the bigger picture, organizations must find ways to minimize bad data provided to their data science projects, while also minimizing the marginal cost of doing so.
The answer is to ensure an effective data management capability is in place, providing the scale economies necessary for making more data science projects cost-effective.
An organization’s data management capability provides a set of centralized, scalable services for describing what the data means, for understanding and recording where the data comes from, for maintaining good quality data, and for ensuring the roles and responsibilities for data management are effectively discharged (Figure 2). Briefly, this includes:
• Semantics: data is given commonly agreed and understood definitions, is placed in a commonly known taxonomy and ontology so it can be categorized accordingly, and semantic relationships between data is clear. Defining the semantics of data can also include conceptual modeling of data in order to understand the hierarchy, ordinality, and cardinality of data relationships with business concepts and data domains.
• Provenance: the sources of data, and path taken to where it is consumed, are identified and documented. Depending on the granularity at which this lineage is captured, this can involve identifying the aggregations and transformations en-route. Under provenance, sources of data can be certified as ‘trusted’ if applicable governance (see below) criteria are met.
Figure 2: Organizational data management capability
DATA SEMANTICS
DATA PROVENANCE
DATA QUALITY
ANALYTICS
DATA GOVERNANCE
Figure 3: Moving to centralized data management for data science
TRUSTED SOURCES
1 CrowdFlower, “2016 data science report,” https://bit.ly/2TtLN2c
DATA MANAGEMENT | DATA MANAGEMENT: A FOUNDATION FOR EFFECTIVE DATA SCIENCE

29 /
• Quality: various quality dimensions such as completeness, conformity, consistency, validity, accuracy, and timeliness of data are measured and published/reported on a periodic basis. Issues are formally tracked, often against service level agreements defined against the material criticality of the data/process being impacted.
• Governance: the policies, processes, accountabilities, and responsibilities by which effective data management is defined, monitored, and enforced. Governance acts as a demand-management mechanism for ensuring data management activities are prioritized. Moreover, data governance provides an assurance to data consumers (such as data scientists) that governed data taken from trusted sources is well defined, meets minimum thresholds for data quality, and that data quality issues are formally managed and remediated.
Without a vision for streamlining the servicing of these requirements, an organization’s data science can easily devolve into a web of hit-and-miss, fact-finding engagements between analytics projects and potential providers, as each project independently seeks to find the right data from the right sources.
A centralized data management capability provides the hub of data services and expertise that effectively allows all processes, analytics or not, to outsource their data management requirements. In such a setup, the centralized capability actively maintains a library of semantically defined data along with their
trusted sources, allowing service users to quickly understand what they need and where to get it, avoiding unnecessary fact finding (Figure 3).
There are several benefits to this. Firstly, the data semantics (definition, taxonomy, ontology, and modeling) and data provenance (lineage and trusted sources) services offered not only free valuable time and effort for data scientists to focus on the actual analytics, but also ensure more reliable and explainable analytics results.
Secondly, it acts as a governing body for all data management in the organization and ensures that the outcomes are available for all processes. This allows for incremental gains as the knowledge (semantics, provenance, and quality) built from one project adds to the existing body of knowledge from others. From the data science perspective, the cost of data management is greatly reduced as data science projects benefit from the efforts of not only other data science projects, but also of the entire gamut of regulatory and transformational programs that occur in a modern FSO. For example, bad quality data is no longer remediated at the point of consumption by each data science project, but at the point of origination, therefore benefitting all consumers (data science and non-data science alike).
Thirdly, a centralized data management capability allows analytics processes and models to be defined in terms of a globally accepted semantic model. This allows for analytics results to be defined and communicated in a common business language, which in turn enables better interpretation and understanding of results amongst decision makers.
5. IMPROVING THE DATA CULTURE
We have already described how trust in analytics outputs is key for driving an effective data science capability, and that significant components of this trust are reliant on the cost-effectiveness of ensuring analytics processes have ‘good’ inputs.
However, regardless of how trustworthy analytics results are, decision makers do not habitually act on these insights. This is especially the case with data mining insights that are often produced in financial services with little business sponsorship and poorly defined/planned business implementation.
What is often missing, therefore, is not just trust, but also the willingness of decision makers to take the insights on board and operationalize them. This willingness stems from an
DATA MANAGEMENT | DATA MANAGEMENT: A FOUNDATION FOR EFFECTIVE DATA SCIENCE
Figure 4: Building a strong data culture
BETTER DATA SCIENCE
STRONGER DATA CULTURE
IMPROVED DATA MANAGEMENT
BETTER DATA INPUTS

30 /
inherent mindset or culture for data-driven decision making, where decision makers actively drive the data science process and are invested and interested in the outcomes. In a strong data culture, decision makers place data science output on equal footing to more traditional mechanisms, which are more reliant on experience and intuition.
An effective data management capability helps to foster a strong data culture. As previously described, data governance is a key data management service that ensures the effective discharge of data management roles and responsibilities. Crucially, this involves ensuring data owners and stewards are not only identified but are actively engaged in the governance and management of data. These data owners typically include the same decision makers that analytics projects provide insights to.
In this way, an effective and mature data management capability helps strengthen the data culture of an organization by actively involving decision makers in the governance of the very data that is used to provide insights back to the decision maker (Figure 4). This completes the circle – not only is trust greatly enhanced, becoming an implicit outcome rather than an explicit result of the data science, but it also helps to engender the data culture where decision makers are willingly at the heart of data-driven decision making.
6. CONCLUSION
Data science is effective when decision makers regularly make business decisions from the analytics insights, and the business outcomes are consistently in line with the expectations. These goals require trust and willingness on the part of the decision maker to operationalize the business insights provided by the analytics.
A data management capability helps build the willingness by fostering a data culture that puts decision makers at the forefront of data-driven decision making, and not data scientists. This is done through actively involving data owners in the governance of the data, which is used to provide insights to them.
Trust is built by ensuring business outcomes are consistently in line with expectations. This requires expectations to be properly set, which in turn requires the semantics, provenance, and quality of data inputs to the analytics be defined and known – ‘good’ inputs. While very time-consuming and resource intensive to perform for each data project in a silo, economies of scale are achievable by outsourcing these data management requirements to a centralized data management function.
DATA MANAGEMENT | DATA MANAGEMENT: A FOUNDATION FOR EFFECTIVE DATA SCIENCE

31 /
In summary, more cost-effective, more reliable, and better understood analytics results build trust in the data science capability. Coupled with improving willingness of decision makers to operationalize analytics insights through mature data governance, implementing a mature data management capability is, therefore, essential in ensuring data science is cost-effective and has scalable impact.
In the hierarchy of needs, therefore, data management is the foundational layer for good data science and data-driven decision making (Figure 5).
DATA MANAGEMENT | DATA MANAGEMENT: A FOUNDATION FOR EFFECTIVE DATA SCIENCE
DATA-DRIVEN DECISION MAKING
Figure 5: Hierarchy of needs for data-driven decision making
EFFECTIVE DATA MANAGEMENT
GOOD DATA, COST-EFFECTIVELY
ANALYTICS
BUSINESS INSIGHTS
TRUST AND WILLINGNESS

32 /
J. B. HEATON | One Hat Research LLC
JAN HENDRIK WITTE | Honorary Research Associate in Mathematics, University College London
Nevertheless, financial market participants often use the small data of financial markets to generate and test investment strategies. This comes with two major problems. First, the economic mechanisms that generate prices (and, therefore, returns) may change through time. That is, price-data-generating mechanisms may be nonstationary, so that historical data from an earlier time may tell us little or nothing about future prices and returns. Second, even if data-generating-mechanisms are somewhat stable through time, inferences about the profitability of investment strategies may be sensitive to a handful of outliers in the data that get picked up again and again in different strategies mined from the same small data.
ABSTRACTThe hype of “big data” has not escaped the investment management industry, although the reality is that price data from U.S. financial markets are not really big data; price data is small data. The fact that sellers and advisors in financial markets use small data to generate and test investment strategies creates two major problems. First, the economic mechanisms that generate prices (and, therefore, returns) may change through time, so that historical data from an earlier time may tell us little or nothing about future prices and returns. Second, even if data-generating-mechanisms are somewhat stable through time, inferences about the profitability of investment strategies may be sensitive to a handful of outliers in the data that get picked up again and again in different strategies mined from the same small data set. In this article, we present an answer to the financial small data problem: using machine-learning (ML) methods to generate “synthetic” financial data. The essential part of our approach to developing synthetic data is the use of ML methods to generate data that might have been generated by financial markets but was not. Synthetic price and return data have numerous uses, including testing new investment strategies and helping investors plan for retirement and other personal investment goals with more realistic future return scenarios. In this article, we focus on a particularly important use of synthetic data: meeting legal and regulatory requirements such as best interest and fiduciary requirements.
SYNTHETIC FINANCIAL DATA: AN APPLICATION TO REGULATORY COMPLIANCE
FOR BROKER-DEALERS
1. INTRODUCTION
In the age of “big data”, those in the investment management industry have a “small data” problem. While it is tempting to think of financial market data as voluminous, financial-market data is tiny by comparison to many big data collections. Companies like Walmart, Amazon, PayPal, Facebook, and Google collect petabytes (one petabyte equals a million gigabytes) of data every hour. Their daily data collections dwarf the data that financial market transactions generate. While the hype of big data has not escaped the investment management industry, the reality is that price data from U.S. financial markets are in fact “small data”.

33 /
1 To illustrate the problem with outliers, consider an (equally weighted) index of five securities, four of which (although it is unknown which) will return 10% over the relevant period, and one of which will return 50%. Suppose that active managers choose portfolios of one or two securities and that they equally weight each investment. There are 15 possible one- or two-security “portfolios”. Of these 15, 10 will earn returns of 10%, because they will include only the 10% securities. Just five of the 15 portfolios will include the 50% winner, earning 30% if part of a two-security portfolio and 50% if it is the single security in a one-security portfolio. The mean average return for all possible actively managed portfolios will be 18%, while the median portfolio of all possible one- and two-stock portfolios will earn 10%. The equally weighted index of all five securities will earn 18%. Thus, in this example, the average active management return will be the same as the index, but two-thirds of the actively managed portfolios will underperform the index because they will omit the 50% winner.
It now appears that the outlier problem may be far more serious than previously recognized. For decades, investment advisors and broker-dealers have assumed that the historical premium of equities over risk-free securities implied (1) that stocks are a generally superior investment strategy for the “long term”, and (2) that the superiority of the overall stock-market returns implied that professional money managers could earn even higher returns by actively seeking out stocks with the best risk-return characteristics among the total set of stock market offerings. It turns out, however, that the first implication is highly fragile because the overall historical superiority of equities over risk-free securities rests on the superior performance of a handful of securities. That is, while it is easy to form an intuition that the returns to individual stocks will be roughly bell-shaped and centered around the market return, the return distribution is often highly skewed over time, with a handful of stocks that earn above the total index return and a majority that earn below it.
Recent research has demonstrated that the superiority of equities as a whole (that is, the entire stock market) over risk-free securities in the last century or so does not reflect a reliable tendency for smaller groups of equities to outperform risk-free securities. In a pathbreaking work, Bessembinder (2018) finds that the majority of U.S. listed common stocks have returned (inclusive of dividends) less than the risk-free rate (that is, the one-month Treasury bill) over their lives as listed companies, so that just 4% of listed U.S. companies account for all of the gains of the U.S. stock market from 1926 to 2016. Bessembinder et al. (2019) find similar results for the period 1990 to 2018: a majority of both U.S. and non-U.S. stocks underperform the one-month U.S. treasury bill rate over this period.
Researchers are now realizing that the power of passive indexing to beat active managers year-after-year may rest on this empirical fact, since large indexes tend to catch the handful of extreme winners that stock-pickers and other active managers may miss [Ikenberry et al. (1992), Heaton et al. (2017))]1 Historical price and return data that contains a handful of outliers that drive investment performance is an unreliable basis, on its own, for generating and testing investment strategies.
DATA MANAGEMENT | SYNTHETIC FINANCIAL DATA: AN APPLICATION TO REGULATORY COMPLIANCE FOR BROKER-DEALERS
In this article, we present an answer to the financial small data problem: using machine-learning (ML) methods to generate “synthetic” financial data. Outside of financial services, synthetic data has been used to allow analysis of otherwise confidential data by making modest changes that protect privacy but leave statistical inferences intact [Little (1993), Rubin (1993)]. Methods of generating synthetic data have also been used in a number of other contexts where actual data was lacking in sufficient quantities, such as in training image classification systems [Krizhevsky et al. (2012), Tremblay et al. (2018), Wang et al. (2019)], training systems to read Indic handwriting [Roy et al. (2018)], generating synthetic mobile payment transactions to train fraud-detection algorithms [Lopez-Rojas et al. (2016)], and augmenting data from wearable health sensors [Taewoong Um et al. (2017)], among others.
In the age of “big data”, those in the investment management industry have a “small data” problem.
In these examples, the goal in generating synthetic data for problems like these involves generating data that is different in ways that does not alter the fundamentally stability of the relationship to be learned.
Financial markets present a far different problem. Financial-market data is likely to be generated by mechanisms (interactions of traders using information) that are not stable through time and, more importantly, are unstable (“nonstationary”, in statistical parlance) in unpredictable ways. While dogs generally look the same over a period of decades (even allowing for new hybrid breeds), allowing for successful image recognition algorithms, we know very little about the mechanisms that generate prices and how those mechanisms change through time. Even if a researcher finds a good model of price behavior in a particular period of time, there is little

34 /
reason to believe that prices will behave today as they did 10 or 20, or even five years, ago. Synthetic data that only mimics historical data is unhelpful, since the primary danger presented by the use of historical data is that past performance of a given investment product or strategy may depend on data outliers that do not repeat; outliers that we now know are driving returns.
It is important to note that these “outliers” are, in general, not necessarily apparent to the naked eye. While some outliers are easy to see in the data as individual stocks that have extreme returns, other outliers are outliers in relationships among stocks, rare occurrences in the high-dimensional relationships that exist among a huge number of possible return combinations.
We have developed a method for generating synthetic financial data. The essential part of our approach to developing synthetic data is the use of ML methods to generate data that might have been generated by financial markets but was not. This is an important contrast between our application and previous methods to generate synthetic data. While much synthetic data seeks to introduce randomizations in existing data that do not influence the learning task or statistical inferences, our goal is to generate synthetic data that introduces randomizations that matter for inferences. Our approach is to assume that the features of the past data that are relatively common are
more likely to repeat than the features of the past data that are relatively rare. By identifying the features of the past data that are relatively rare relative to the other features of the data, we can generate data that does not assume that those rarities will appear in the future as they did in the past.
Synthetic price and return data have numerous uses, including testing new investment strategies and helping investors plan for retirement and other personal investment goals with more realistic future return scenarios. In this article, however, we focus on a particularly important use of synthetic data: meeting legal and regulatory requirements such as best interest and fiduciary requirements.
2. THE COMPLIANCE PROBLEM: SMALL DATA AND CHANGING RULES
Recent research casting doubt on the superiority of many equity strategies could not come at a worse time for broker-dealers. In June 2019, the U.S. Securities and Exchange Commission (SEC) adopted Regulation Best Interest (RBI) to regulate the conduct of broker-dealers who make recommendations to retail customer of a securities transaction or investment strategy involving securities. Among its many requirements, the regulation requires broker-dealers to exercise reasonable diligence, care, and skill in making a recommendation to a retail customer. This is known as the “Care Obligation.”
DATA MANAGEMENT | SYNTHETIC FINANCIAL DATA: AN APPLICATION TO REGULATORY COMPLIANCE FOR BROKER-DEALERS

35 /
The SEC’s Final Rule states that “whether a broker-dealer’s recommendation satisfies the Care Obligation will be an objective evaluation turning on the facts and circumstances of the particular recommendation and the particular retail customer” and further states that the care obligation requires that a broker-dealer understands “potential risks, rewards, and costs associated with the recommendation.” The SEC further states that “[s]cienter [bad intent] will not be required to establish a violation of Regulation Best Interest”. This suggests that negligence or recklessness will be sufficient to state a claim against broker-dealers for violations of RBI, including the failure to adequately discharge the Care Obligation.
RBI places substantial new compliance burdens on broker-dealers, but it is not the only law or regulation governing the recommendation and sale of investment strategies. Investment advisors governed by the U.S. Investment Advisors Act of 1940 are fiduciaries to their clients, as are those who oversee pension plans governed by the U.S. Employee Retirement Income Security Act (ERISA).
Even those without these statutory and regulatory duties are liable under common law to those they mislead negligently (in certain circumstances) or recklessly (in many circumstances). This may apply, for example, to otherwise lightly regulated hedge fund managers.
3. A SYNTHETIC DATA SOLUTION
Given the known limitations of historical data, how can a broker or fiduciary gain confidence that an investment strategy will not result in future regulatory action or litigation? Put differently, what work would a broker-dealer or fiduciary want to show was done to support its recommendations and actions if accused of basing advice on bad inferences from historical data?
Our proposal is to use synthetic data to test investment products for investor best interest and the requirements of fiduciary duty. Inexpensively generated synthetic data can supplement more suspect historical data to better screen products for a client’s best interest and the satisfaction of fiduciary requirements.
Our specific approach uses ML fraud-detection algorithms [Bolton and Hand (2002), Kou et al. (2004), Abdallah et al. (2016), Porwal and Mukund (2019)] in a novel way. Fraud-detection algorithms are outlier detectors, designed to detect fraudulent transactions that make up a very small proportion of all financial transactions. For example, the Kaggle Credit Card Fraud Detection Dataset, a dataset of “anonymized credit card transactions labeled as fraudulent or genuine” contains only 0.172% fraudulent transactions; the remaining 99.828% of the transactions are genuine.
DATA MANAGEMENT | SYNTHETIC FINANCIAL DATA: AN APPLICATION TO REGULATORY COMPLIANCE FOR BROKER-DEALERS
31/12
/2007
31/12
/2013
31/12
/2008
31/12
/2014
31/12
/2009
31/12
/2015
31/12
/2010
31/12
/2016
31/12
/2011
31/12
/2017
31/12
/2012
31/12
/2018
1
0.5
0
–0/5
Source: Bloomberg and the authors
Figure 1: Correction to compensate for unsuitable data

36 /
We use a fraud-detection approach to identify high-dimensional outliers in the historical dataset and replace them with a larger alternative dataset that reflects the different ways in which the joint prices might alternatively have been realized in the past. We build on the ML sub-specialty of deep learning that has recently provided a successful set of solutions [Sangeetha et al. (2017), Choi and Lee (2018), Fu et al. (2016), Phua et al. (2018), Zhang et al. (2018)]. We apply the fraud-detection algorithm approach to generate synthetic data that is less dependent on historical outliers. The resulting synthetic datasets have little to no dependence on historical anomalies while maintaining all other characteristics with a high degree of accuracy. This method is far superior to simplistic Monte Carlo-based approaches.
is not as sensitive to outliers suggests an average annual return of 3.4% (the red line in the figure). The difference (the light grey area in the figure), 2.8% per year, demonstrates the importance of a very small number of non-repetitive historical anomalies.
A broker-dealer that recommended the DJIA, but did not consider the dependence of a DJIA investment strategy on a handful of outliers unlikely to repeat, would open itself to legal and regulatory liability easily demonstrated by proof of the undisclosed (and perhaps even unanalyzed) importance of those outliers.
A recommendation that depends on such a small number of non-repetitive historical anomalies is unlikely to pass muster under regulatory requirements. Synthetic data would have shown why.
5. CONCLUSION
Sellers of investment strategies face considerable legal and regulatory hurdles in marketing their products. Synthetic data may provide the only defensible basis for testing investment strategies for compliance. It is becoming better understood that historical data may not support the sale of many investment strategies because the strategies are too highly dependent on outliers that are unlikely to repeat in the future. Sellers and investment advisors who have not taken steps to test “potential risks, rewards, and costs associated with [a] recommendation” beyond looking at historical performance will likely find themselves in an indefensible position with regulators and litigants.
Synthetic data generation methods can identify rare (often very high-dimensional) outliers in data and replace them systematically to capture what data might have been generated instead but was not. Our method uses fraud-detection algorithms “inverted” to identify and replace outliers, creating an enormous number of synthetic datasets that can be used to test investment strategies. Here, we illustrate the approach with the Dow Jones Industrial Average, an easy-to-understand “investment strategy” proxy, but our method applies equally to the most complex quantitative strategies, including those that operate at very high frequency. Our approach provides a way for financial services firms to use advances in ML to solve a new and pressing compliance problem: avoiding regulatory violations in investment advice and oversight.
A recommendation that depends on such a small number of
non-repetitive historical anomalies is unlikely to pass muster under
regulatory requirements. Synthetic data would have shown why.
4. AN EXAMPLE: THE DOW JONES INDUSTRIAL AVERAGE AS AN INVESTMENT STRATEGY
As an example, consider the Dow Jones Industrial Average (DJIA) as if it was a marketed investment strategy. Starting with a dataset of daily closing prices of all DJIA constituents for the period January 2, 2008 to May 22, 2019, we recreate the index and deploy our modified fraud-detection algorithm to identify days for which the price change in the 30 considered stocks exhibit highly unusual activity. These are changes that typically are unnoticeable to the naked eye, occurring as they do in the complex interrelationships among the stocks. While the historical DJIA has an annual return of 6.2% over the period (see dark grey line in Figure 1), synthetic data that
DATA MANAGEMENT | SYNTHETIC FINANCIAL DATA: AN APPLICATION TO REGULATORY COMPLIANCE FOR BROKER-DEALERS

37 /
DATA MANAGEMENT | SYNTHETIC FINANCIAL DATA: AN APPLICATION TO REGULATORY COMPLIANCE FOR BROKER-DEALERS
REFERENCES
Abdallah, A., M. A. Maarof, and A. Zainal, 2016, “Fraud detection system: a survey,” Journal of Network and Computer Applications 68, 90-113
Bessembinder, H., 2018, “Do stocks outperform treasury bills?” Journal of Financial Economics 129, 440-457
Bessembinder, H., T.-F. Chen, G. Choi, and K. C. J. Wei, 2019, “Do global stocks outperform US treasury bills,” working paper, https://bit.ly/2lFYAzz
Bolton, R. J., and D. J. Hand, 2002, “Statistical fraud detection: a review,” Statistical Science 17:3, 235-255
Choi, D., and K. Lee, 2018, “An artificial intelligence approach to financial fraud detection under IoT environment: a survey and implementation,” Security and Communication Networks, https://bit.ly/2mmlsVb
Fu, K., D. Cheng, Y. Tu, and L. Zhang, 2016, “Credit card fraud detection using convolutional neural networks,” International Conference on Neural Information Processing, https://bit.ly/2nl0fed
Heaton, J. B., N. Polson, and J. H. Witte, 2017, “Why indexing works,” Applied Stochastic Models in Business and Industry 33, 690-693
Ikenberry, D., R. Shockley, and K. Womack, 1992, “Why active managers often underperform the S&P500: the impact of size and skewness,” Journal of Private Portfolio Management 1, 13-26
Kou, Y., C. T. Lu, S. Sinvongwattana, and Y. P. Huang, 2004, “Survey of fraud detection techniques,” proceedings of the 2004 IEEE International Conference on Networking
Krizhevsky, A., I. Sutskever, G. E. Hinton, 2012, “Imagenet classification with deep convolutional neural networks,” Advances in Neural Information Processing Systems, https://bit.ly/2nTNOGL
Little, R. J., 1993, “Statistical analysis of masked data,” Journal of Official Statistics 9, 407-426
Lopez-Rojas, E. A., A. Elmir, and S. Axelsson, 2016, “PaySim: a financial mobile money simulator for fraud detection,” available at https://bit.ly/2MJdNfN
Phua, C., V. Lee, K. Smith, and R. Gayler, 2018, “A comprehensive survey of data mining-based fraud detection research,” arXiv:1009.6119
Porwal, U., and S. Mukund, 2019, “Credit card fraud detection in e-commerce: an outlier detection approach,” arXiv: 1811.02196
Roy, P. P., A. Mohta, and B. B. Chaudhuri, 2018, “Synthetic data generation for Indic handwritten text recognition,” arXiv:1804.06254v1
Rubin, D. B., 1993, “Discussion: statistical disclosure limitation,” Journal of Official Statistics 9:2, 461-468
Sangeetha, K. N., Veenadevi, and B. A. Usha, 2017, “Benefits of SVM and deep learning in credit card fraud detection: a survey,” International Conference on Signal, Image Processing Communication & Automation (ICSIPCA), 233-236
Taewoong Um, T., F. M. J. Pfister, D. Pichler, S. Endo, M. Lang, S. Hirche, U. Fietzek, and D. Kulic, 2017, “Data augmentation of wearable sensor data for Parkinson’s disease monitoring using convolutional neural networks,” arXiv:1706.00527v2
Tremblay, J., A. Prakash, D. Acuna, M. Brophy, V. Jampani, C. Anil, T. To, E. Cameracci, S. Boochoon, and S. Birchfield, 2018, “Training deep networks with synthetic data: bridging the reality gap by domain randomization,” arXiv:1804.06516
Wang, K., F. Shi, W. Wang, Y. Nan, and S. Lian, 2019, “Synthetic data generation and adaptation for object detection in smart vending machines,” arXiv: 1904.12294
Zhang, R., F. Zheng, and W. Min, 2018, “Sequential behavioral data processing using deep learning and the Markov transition field in online fraud detection,” arxiv:1808.05329

38 /
THADI MURALI | Principal Consultant, Capco
RISHI SANGHAVI | Senior Consultant, Capco
SANDEEP VISHNU | Partner, Capco1
2. WHY DATA LINEAGE?
To understand how data lineage is useful, it is important to acknowledge the obvious: that data in a large organization is not held in a single repository but flows across many systems and databases. As this proliferation happens there is a risk to data quality, security, and availability. For example, those familiar with the “telephone game”, know that despite best intentions, the original message from the first person (e.g., “The sky is blue.”) changes to something completely different when it ends with the last person (e.g., “Disguises Boo”) (Figure 1). This is the same with information – data can get compromised every time it goes to a new system or database or there is a hand-off between systems. This can occur even when there is no malicious intent on the part of the users of the systems. If there is malicious intent, the risk is exponentially higher. In such situations, data lineage has an even greater role as it provides the traceability needed to mitigate risks with appropriate controls.
ABSTRACTData and information lifecycle management challenges in a financial services organization (FSO) can be daunting, especially when they relate to data security, integrity, or availability. Large FSOs recognize this and are willing to make investments to address IT cyber risk, data management, and data governance, specifically when the payoff is clearly articulated. In a world of big data, current techniques for information risk and control assessment fall woefully short as they do not provide adequate visibility around data nor do they assist the business in decision making. Data lineage can fill this gap. Thus far, data lineage has largely been directed towards regulatory initiatives focused on risk and finance. However, the broader business use of data lineage is relatively unexplored, in part due to a lack of industry standards or methodologies to guide organizations to realize the full potential of data lineage. This article explores how data lineage standards and patterns can drive substantial value beyond regulatory compliance by holistically considering control optimization and cost reduction.
UNLOCKING VALUE THROUGH DATA LINEAGE
1. INTRODUCTION
Banks have always held vast amounts of data inside of their organizations, however, with the recent exponential growth in data volume, velocity, variety, and veracity, efficient usage and governance of data has become a critical success factor and a source of competitive advantage for financial institutions. The ability to identify, monitor, interpret, and extract value from data is something that many organizations have historically struggled to achieve, mostly due to poor tracking of data across the enterprise. Data lineage serves as a tool to track data from origination, through transformation(s), and ultimately to consumption. Financial institutions have an opportunity to provide major value to their organizations by using data lineage to provide benefits along three dimensions: (1) regulatory compliance, (2) control optimization, and (3) cost reduction.
1 The authors would like to thank Mayssam Jahansoozan, Consultant, Capco, Tyler West, Associate Consultant, Capco, and Clara Steiner, Associate Consultant, Capco for their contributions to this article.
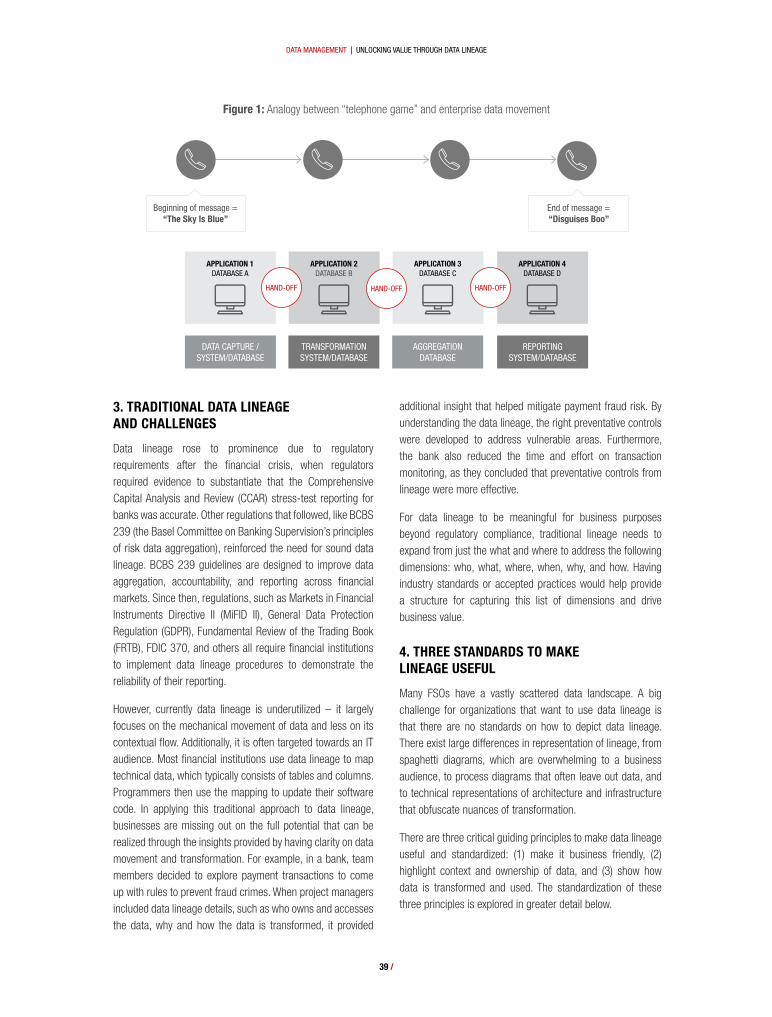
39 /
3. TRADITIONAL DATA LINEAGE AND CHALLENGES
Data lineage rose to prominence due to regulatory requirements after the financial crisis, when regulators required evidence to substantiate that the Comprehensive Capital Analysis and Review (CCAR) stress-test reporting for banks was accurate. Other regulations that followed, like BCBS 239 (the Basel Committee on Banking Supervision’s principles of risk data aggregation), reinforced the need for sound data lineage. BCBS 239 guidelines are designed to improve data aggregation, accountability, and reporting across financial markets. Since then, regulations, such as Markets in Financial Instruments Directive II (MiFID II), General Data Protection Regulation (GDPR), Fundamental Review of the Trading Book (FRTB), FDIC 370, and others all require financial institutions to implement data lineage procedures to demonstrate the reliability of their reporting.
However, currently data lineage is underutilized – it largely focuses on the mechanical movement of data and less on its contextual flow. Additionally, it is often targeted towards an IT audience. Most financial institutions use data lineage to map technical data, which typically consists of tables and columns. Programmers then use the mapping to update their software code. In applying this traditional approach to data lineage, businesses are missing out on the full potential that can be realized through the insights provided by having clarity on data movement and transformation. For example, in a bank, team members decided to explore payment transactions to come up with rules to prevent fraud crimes. When project managers included data lineage details, such as who owns and accesses the data, why and how the data is transformed, it provided
DATA MANAGEMENT | UNLOCKING VALUE THROUGH DATA LINEAGE
additional insight that helped mitigate payment fraud risk. By understanding the data lineage, the right preventative controls were developed to address vulnerable areas. Furthermore, the bank also reduced the time and effort on transaction monitoring, as they concluded that preventative controls from lineage were more effective.
For data lineage to be meaningful for business purposes beyond regulatory compliance, traditional lineage needs to expand from just the what and where to address the following dimensions: who, what, where, when, why, and how. Having industry standards or accepted practices would help provide a structure for capturing this list of dimensions and drive business value.
4. THREE STANDARDS TO MAKE LINEAGE USEFUL
Many FSOs have a vastly scattered data landscape. A big challenge for organizations that want to use data lineage is that there are no standards on how to depict data lineage. There exist large differences in representation of lineage, from spaghetti diagrams, which are overwhelming to a business audience, to process diagrams that often leave out data, and to technical representations of architecture and infrastructure that obfuscate nuances of transformation.
There are three critical guiding principles to make data lineage useful and standardized: (1) make it business friendly, (2) highlight context and ownership of data, and (3) show how data is transformed and used. The standardization of these three principles is explored in greater detail below.
Figure 1: Analogy between “telephone game” and enterprise data movement
Beginning of message = “The Sky Is Blue”
End of message = “Disguises Boo”
APPLICATION 1DATABASE A
APPLICATION 2DATABASE B
APPLICATION 3DATABASE C
APPLICATION 4DATABASE D
HAND-OFF HAND-OFF HAND-OFF
DATA CAPTURE / SYSTEM/DATABASE
TRANSFORMATION SYSTEM/DATABASE
AGGREGATION DATABASE
REPORTING SYSTEM/DATABASE
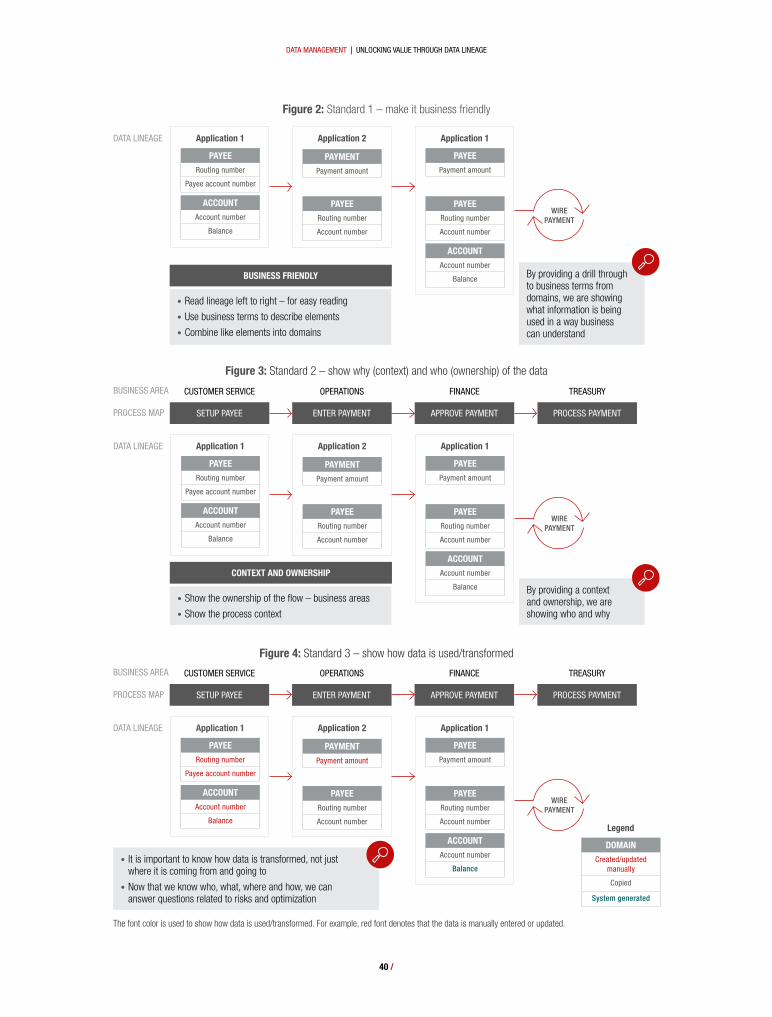
40 /
Figure 2: Standard 1 – make it business friendly
DATA LINEAGE Application 1
PAYEERouting number
Payee account number
ACCOUNTAccount number
Balance
PAYEERouting number
Account number
ACCOUNTAccount number
Balance
Application 1
PAYEEPayment amount
Application 2
PAYMENTPayment amount
PAYEERouting number
Account number
WIRE PAYMENT
By providing a drill through to business terms from domains, we are showing what information is being used in a way business can understand
• Read lineage left to right – for easy reading
• Use business terms to describe elements
• Combine like elements into domains
BUSINESS FRIENDLY
Figure 3: Standard 2 – show why (context) and who (ownership) of the data
DATA LINEAGE
PROCESS MAP
BUSINESS AREA CUSTOMER SERVICE OPERATIONS FINANCE TREASURY
Application 1
PAYEERouting number
Payee account number
ACCOUNTAccount number
Balance
PAYEERouting number
Account number
ACCOUNTAccount number
Balance
Application 1
PAYEEPayment amount
Application 2
PAYMENTPayment amount
PAYEERouting number
Account number
WIRE PAYMENT
• Show the ownership of the flow – business areas
• Show the process context
CONTEXT AND OWNERSHIP
By providing a context and ownership, we are showing who and why
SETUP PAYEE ENTER PAYMENT APPROVE PAYMENT PROCESS PAYMENT
Figure 4: Standard 3 – show how data is used/transformed
DATA LINEAGE
PROCESS MAP
BUSINESS AREA CUSTOMER SERVICE OPERATIONS FINANCE TREASURY
Application 1
PAYEERouting number
Payee account number
ACCOUNTAccount number
Balance
PAYEERouting number
Account number
ACCOUNTAccount number
Balance
Application 1
PAYEEPayment amount
Application 2
PAYMENTPayment amount
PAYEERouting number
Account number
WIRE PAYMENT
• It is important to know how data is transformed, not just where it is coming from and going to
• Now that we know who, what, where and how, we can answer questions related to risks and optimization
SETUP PAYEE ENTER PAYMENT APPROVE PAYMENT PROCESS PAYMENT
DOMAINCreated/updated
manually
Copied
System generated
Legend
The font color is used to show how data is used/transformed. For example, red font denotes that the data is manually entered or updated.
DATA MANAGEMENT | UNLOCKING VALUE THROUGH DATA LINEAGE

41 /
The first step is making it friendly to business. This can be done by ensuring readability and enhancing understandability. It includes using business-centric nomenclature and taxonomy as well as presenting data in easy to consume forms and applications. Figure 2 shows that a left to right read with business terms to define a data element and using domains that group related data elements can enable this. It is also important with data lineage to show only those elements that are critical to the output, or would impact the quality of the output, if compromised. These are typically referred to as ‘critical data elements’ (CDEs) or ‘key data elements’ (KDEs).
Understanding the context of data and who owns the data are vital to setting up standardized data lineage (Figure 3). Organizations need to start by determining the connections that show who owns the process, the application, and, at a finite level, the data element. Given the size and complexity of a financial institution, this can be an enormous undertaking. Taking a top-down approach by division, process, application, data element, and critical data element creates a route to drill through to business terms from the subject area; the goal is to present data in ways that organizations can understand and use. Once the data ownership structure has been established, the enterprise can begin to align the process and create a visual diagram of data lineage.
To fully grasp how a process is aligned, each step needs to be documented from beginning to end across all the divisions it touches. Visualizing the process by looking at the connections that show application ownership, process ownership, data quality, automated or manual processes, data usage,
access request, and the number of outstanding data issues can help drive improvements, identify risk, and strengthen process governance. This visualization is created by defining the different types of ownership, including role of subject matter experts, managing the changes in, and versions of, data lineage diagrams, and incorporating commentary from appropriate stakeholders into the diagram. Once each step is documented and unique data elements are identified and validated by the subject matter experts, the organization will have clarity on who owns each step of the process and what data elements are associated with that step. Consequently, the enterprise will be able to leverage process diagrams to help better understand what happens to the data.
It is essential to know how data is moving, not just where it is coming from and going to — by determining the who, what, when, where and how, we can answer questions related to risks and if they can be improved (Figure 4). Financial institutions will better understand what type of controls are needed around the critical data element based on the type of action that is performed on the data element and how the data element is acted upon – manually or system updated/created or copied.
5. PATTERNS FOR COST AND PROCESS OPTIMIZATION
Using data lineage, financial institutions can easily visualize the flow of data through systems and their applications. By doing so, it becomes possible to recognize distinct patterns, good and bad, that exist within an organization’s data. When
DATA MANAGEMENT | UNLOCKING VALUE THROUGH DATA LINEAGE
Figure 5: Pattern 1 – using data lineage to remove redundancy
DATA LINEAGE
PROCESS MAP
BUSINESS AREA SALES CUSTOMER SERVICE OPERATIONS TREASURY
Application 5
PAYMENT
Application 6
PAYMENT
Application 1
PAYEE
Application 2
PAYEE
Application 3
PAYEE• By aligning business area, process, and application,
we can see which processes use which applications.
• If multiple applications are used for the same process, it is usually a sign of redundancy.
• Optimization can be achieved by extending the functionality of one of the applications.
SETUP ACCOUNT ENTER LOAN AMOUNT APPROVE PAYMENT PROCESS PAYMENT
Application 4
PAYMENT
PAYEE PAYEE
DEPOSIT
1 Applications 1, 2, and 3 are doing the same thing – two of them may be redundant, major cost saving opportunity.
$$$1
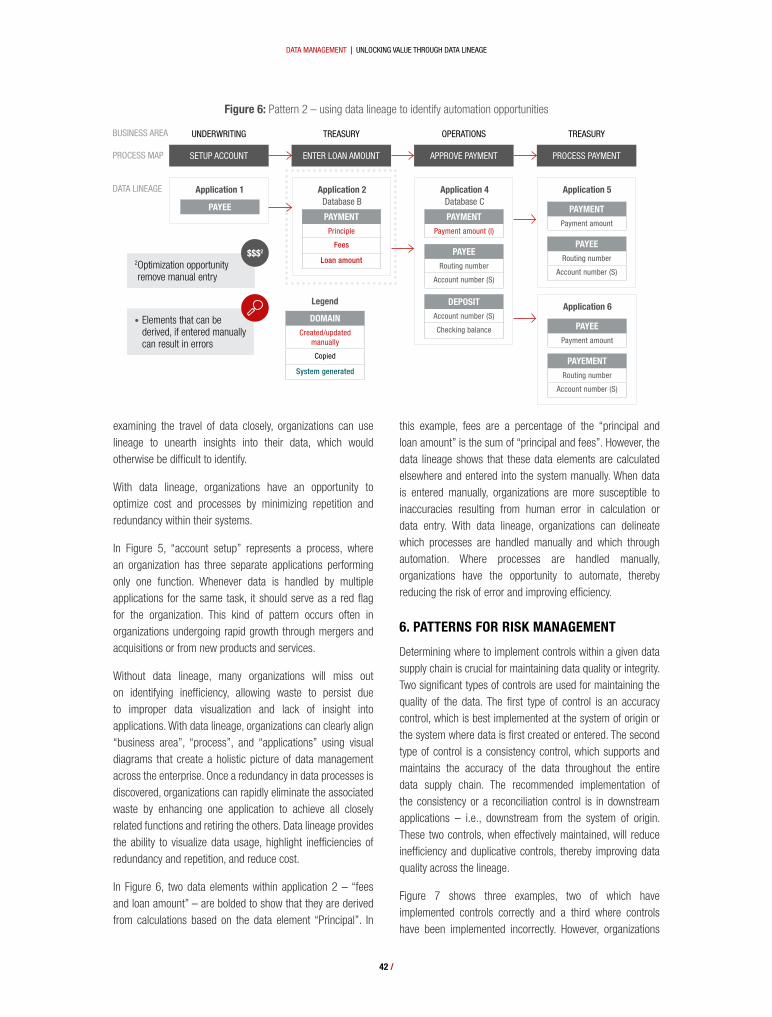
42 /
examining the travel of data closely, organizations can use lineage to unearth insights into their data, which would otherwise be difficult to identify.
With data lineage, organizations have an opportunity to optimize cost and processes by minimizing repetition and redundancy within their systems.
In Figure 5, “account setup” represents a process, where an organization has three separate applications performing only one function. Whenever data is handled by multiple applications for the same task, it should serve as a red flag for the organization. This kind of pattern occurs often in organizations undergoing rapid growth through mergers and acquisitions or from new products and services.
Without data lineage, many organizations will miss out on identifying inefficiency, allowing waste to persist due to improper data visualization and lack of insight into applications. With data lineage, organizations can clearly align “business area”, “process”, and “applications” using visual diagrams that create a holistic picture of data management across the enterprise. Once a redundancy in data processes is discovered, organizations can rapidly eliminate the associated waste by enhancing one application to achieve all closely related functions and retiring the others. Data lineage provides the ability to visualize data usage, highlight inefficiencies of redundancy and repetition, and reduce cost.
In Figure 6, two data elements within application 2 – “fees and loan amount” – are bolded to show that they are derived from calculations based on the data element “Principal”. In
this example, fees are a percentage of the “principal and loan amount” is the sum of “principal and fees”. However, the data lineage shows that these data elements are calculated elsewhere and entered into the system manually. When data is entered manually, organizations are more susceptible to inaccuracies resulting from human error in calculation or data entry. With data lineage, organizations can delineate which processes are handled manually and which through automation. Where processes are handled manually, organizations have the opportunity to automate, thereby reducing the risk of error and improving efficiency.
6. PATTERNS FOR RISK MANAGEMENT
Determining where to implement controls within a given data supply chain is crucial for maintaining data quality or integrity. Two significant types of controls are used for maintaining the quality of the data. The first type of control is an accuracy control, which is best implemented at the system of origin or the system where data is first created or entered. The second type of control is a consistency control, which supports and maintains the accuracy of the data throughout the entire data supply chain. The recommended implementation of the consistency or a reconciliation control is in downstream applications – i.e., downstream from the system of origin. These two controls, when effectively maintained, will reduce inefficiency and duplicative controls, thereby improving data quality across the lineage.
Figure 7 shows three examples, two of which have implemented controls correctly and a third where controls have been implemented incorrectly. However, organizations
Figure 6: Pattern 2 – using data lineage to identify automation opportunities
DATA LINEAGE
PROCESS MAP
BUSINESS AREA UNDERWRITING TREASURY OPERATIONS TREASURY
Application 5
Application 6
Application 1
PAYEE
• Elements that can be derived, if entered manually can result in errors
SETUP ACCOUNT ENTER LOAN AMOUNT APPROVE PAYMENT PROCESS PAYMENT
Application 2 Database B
Application 4 Database C
2 Optimization opportunity remove manual entry
$$$2
DOMAINCreated/updated
manually
Copied
System generated
Legend
PAYMENTPrinciple
Fees
Loan amount
PAYMENTPayment amount (l)
PAYMENTPayment amount
PAYEEPayment amount
PAYEERouting number
Account number (S)
PAYEERouting number
Account number (S)
PAYEMENTRouting number
Account number (S)
DEPOSITAccount number (S)
Checking balance
DATA MANAGEMENT | UNLOCKING VALUE THROUGH DATA LINEAGE
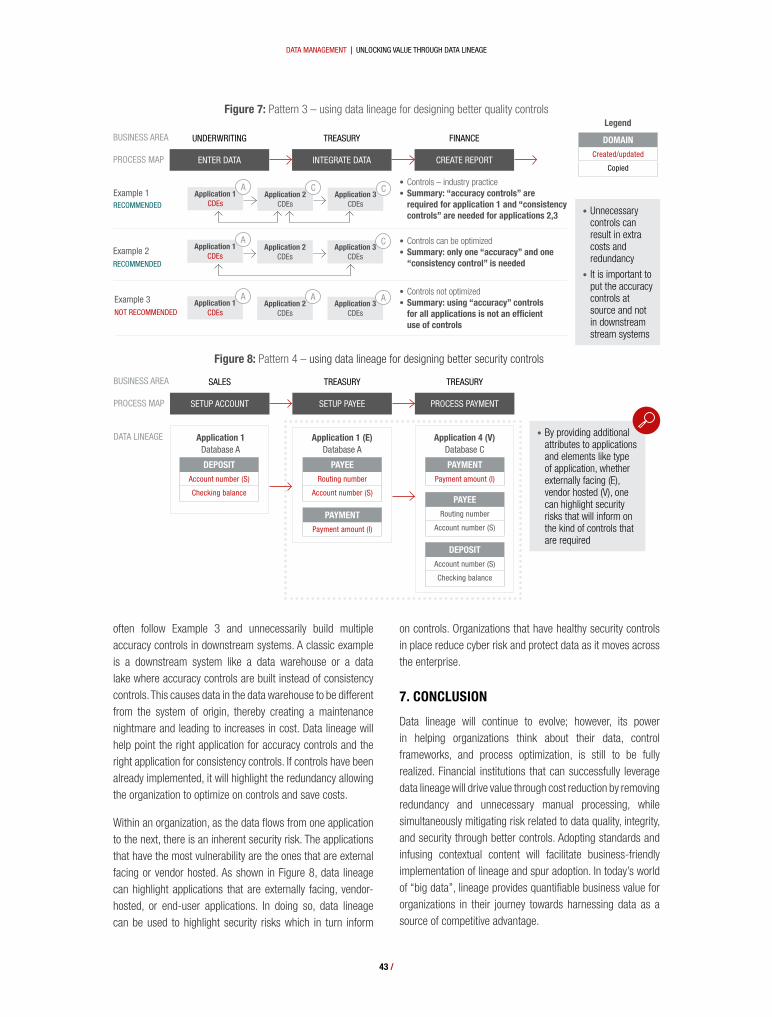
43 /
often follow Example 3 and unnecessarily build multiple accuracy controls in downstream systems. A classic example is a downstream system like a data warehouse or a data lake where accuracy controls are built instead of consistency controls. This causes data in the data warehouse to be different from the system of origin, thereby creating a maintenance nightmare and leading to increases in cost. Data lineage will help point the right application for accuracy controls and the right application for consistency controls. If controls have been already implemented, it will highlight the redundancy allowing the organization to optimize on controls and save costs.
Within an organization, as the data flows from one application to the next, there is an inherent security risk. The applications that have the most vulnerability are the ones that are external facing or vendor hosted. As shown in Figure 8, data lineage can highlight applications that are externally facing, vendor-hosted, or end-user applications. In doing so, data lineage can be used to highlight security risks which in turn inform
on controls. Organizations that have healthy security controls in place reduce cyber risk and protect data as it moves across the enterprise.
7. CONCLUSION
Data lineage will continue to evolve; however, its power in helping organizations think about their data, control frameworks, and process optimization, is still to be fully realized. Financial institutions that can successfully leverage data lineage will drive value through cost reduction by removing redundancy and unnecessary manual processing, while simultaneously mitigating risk related to data quality, integrity, and security through better controls. Adopting standards and infusing contextual content will facilitate business-friendly implementation of lineage and spur adoption. In today’s world of “big data”, lineage provides quantifiable business value for organizations in their journey towards harnessing data as a source of competitive advantage.
DATA MANAGEMENT | UNLOCKING VALUE THROUGH DATA LINEAGE
Figure 7: Pattern 3 – using data lineage for designing better quality controls
Figure 8: Pattern 4 – using data lineage for designing better security controls
PROCESS MAP
Example 1
Example 2
Example 3
BUSINESS AREA UNDERWRITING TREASURY FINANCE
ENTER DATA INTEGRATE DATA CREATE REPORT
DOMAINCreated/updated
Copied
Legend
• Unnecessary controls can result in extra costs and redundancy
• It is important to put the accuracy controls at source and not in downstream stream systems
• Controls not optimized• Summary: using “accuracy” controls
for all applications is not an efficient use of controls
• Controls can be optimized • Summary: only one “accuracy” and one
“consistency control” is needed
• Controls – industry practice• Summary: “accuracy controls” are
required for application 1 and “consistency controls” are needed for applications 2,3
RECOMMENDED
RECOMMENDED
Application 1 CDEs
NOT RECOMMENDED
AApplication 2
CDEs
CApplication 3
CDEs
C
Application 1 CDEs
AApplication 2
CDEsApplication 3
CDEs
C
Application 1 CDEs
AApplication 2
CDEs
AApplication 3
CDEs
A
DATA LINEAGE
PROCESS MAP
BUSINESS AREA SALES TREASURY TREASURY
Application 1 Database A
• By providing additional attributes to applications and elements like type of application, whether externally facing (E), vendor hosted (V), one can highlight security risks that will inform on the kind of controls that are required
SETUP ACCOUNT SETUP PAYEE PROCESS PAYMENT
Application 1 (E) Database A
Application 4 (V) Database C
PAYEERouting number
Account number (S)
PAYMENTPayment amount (l)
PAYEERouting number
Account number (S)
DEPOSITAccount number (S)
Checking balance
DEPOSITAccount number (S)
Checking balance
PAYMENTPayment amount (l)

44 /
BASH GOVENDER | Managing Principal, Capco
AXEL MONTEIRO | Principal Consultant, Capco1
organization struggle to understand the linkages to the cost of the finance department. To cut costs, finance departments had to adopt wage arbitrage/location strategy/offshoring strategies. Rapid offshoring, while simultaneously losing onshore institutional, process, and technical knowhow and senior leadership, saw finance departments barely treading water.
Secondly, it forced FSOs to comply with a decade or more of regulatory change. Adopting and complying with a raft of regulatory compliance become an activity that finance departments were fully consumed with. Cost restrictions meant fewer people were available to get the work done, and offshoring and redundancies had resulted in FSOs losing a large proportion of their institutional knowledge. The people that could “connect the dots” were often no longer around – and those were the people that were needed to help implement sometimes confusing and ambiguous regulatory reform directives (think Basel, Volker, MIFiD, EMIR) in a sustainable and effective manner. Consequently, change was difficult and often done in a “fastest route to market” fashion, which resulted in siloed and non-strategic outcomes. These changes worked for the regulation but often broke other parts of the machine.
ABSTRACTFinance departments of major financial services organizations (FSOs) have undergone dramatic changes since the great crash of 2008. They have had to cut costs severely while still supporting an expanding portfolio of new regulatory and business requirements. As a result, they have been unable to fully benefit from the innovation boom of the past decade. In order to get a better understanding of the perspectives of the Chief Financial Officers (CFOs) of major FSOs on the current and potential operating models of the finance department, we interviewed a number of CFOs and finance executives across Europe and North America. We found that while the past decade has been tough on these departments, the future can be bright should they be able to institute the necessary digital innovations that the other departments and organizations have benefited from.
THE CFO OF THE FUTURE
1. HINDSIGHT
Prior to the crash of 2008, financial services organizations (FSOs) were basking in the glow of steady market growth, relatively high interest rates, and a rather promising outlook. CFOs and the finance departments within these organizations were doing their best to support growth, even though they were grappling with integrating legacy businesses’ data, systems, and infrastructure from the many rounds of acquisitions and consolidations. Finance departments were well resourced, able to invest in technology that improved the status quo, and were able to use generous remuneration packages and growth opportunities to attract the brightest minds. It didn’t seem so at the time, but they were indeed the good old days.
The financial crisis did three things that significantly shaped where CFOs and their finance departments find themselves today.
Firstly, it forced FSOs to rapidly cut costs. As a non-revenue generating department of the bank, the finance department came under enormous pressure to rapidly cut costs. Finance is your typical “iceberg” department, where 80-90% of the activity is done below the surface. While these activities are fundamental, they are not always visible, and other parts of the
1 The authors would like to thank John Ingold, Partner, Capco for his help with interviews in the North American region.

45 /
Finally, it prevented FSOs from fully benefiting from the exponential technological innovation of the past decade. When the financial crisis first began, the Apple iPad was still two years away from being released, cloud computing, as well as robotic process automation (RPA), were still in their infancy, and bitcoin would still be a year away. Looking back, technological innovation has fundamentally and aggressively disrupted almost every aspect of our lives more rapidly in the last decade than at any other point in history so far. FSOs, and in particular the finance departments, have not been able to fully take advantage of that. This is primarily because their focus and budgets were being spent on complying with regulations. Compliance with regulations was mandatory, while technology uplifts were a nice to have. Even as money has started to become more available in recent years, investments in technology have been prioritized within the revenue generating areas of the organization and primarily on enhancing the customer experience. As of 2019, it is a fair to say that most FSO finance departments are significantly behind the technological curve when compared to other departments or even other industries. Excel is still by far the most widely used piece of technology in these departments.
2. TAKING THE PULSE IN 2019
In order to get a better understanding of the impact of the crash of 2008, and the subsequent decade, on the finance departments of major FSOs, we interviewed a number of European and North America CFOs, or their senior deputies. The professionals interviewed work in capital markets, banking (investment, retail, commercial), wealth and asset management, and insurance.
What was striking is that an overwhelming majority of those interviewed concluded that finance teams spend too much time, money, and brain power on building block activities (processing, recording, correcting, and controlling) and not enough time on value enhancing activities (analysis, generation insight, and proactive business partnering).
Given what the industry has endured over the last decade it is not a surprising conclusion. Finance departments are spending too much time on building block activities because they are:
• Compensating for process and system fragmentation: vast amounts of “legacy” technology were already in existence before the 2008 crisis, as a result of the previous rounds of mergers and acquisitions. Well intentioned plans to terminate them and migrate to a strategic architecture had to be placed on hold in
DATA MANAGEMENT | THE CFO OF THE FUTURE
order to support regulatory compliance. Off-shoring attempted to lift processes out of siloes and industrialize them in low-cost centers of excellence. However, efforts to make these processes more efficient, without the required understanding of how they fit into the big picture, resulted in other connected processes breaking down. Unfortunately, this created even more tactical processes in order to compensate. The result was that you had more processes being done on systems that were duplicative/inefficient/broken, by people who had limited experience or understanding of how the organization/industry/end-to-end process worked.
• Fixing data quality issues: finance departments have always suffered from data hygiene issues, ironically on data owned and created by other departments. Data required for new regulatory reporting (e.g., Basel III) exacerbated this issue. New regulatory risk reporting requirements meant that finance and risk data had to be merged, and this led to further contamination of the finance dataset. While BCBS 239 (Basel Committee on Banking Supervision) sought to strengthen risk data aggregation capabilities and internal risk reporting practices, finance departments are still spending a large proportion of their time correcting the consequences of poor data quality.
• Compensating for knowledge drain: cost cutting post-2008 resulted in vast experience and institutional knowledge exiting the industry. The remaining reduced workforce spend a large amount of their time supporting process execution teams offshore, to keep the ship afloat. This left very little time or resources to focus on continuous improvement and the backlog of issues keeps building.
3. A VISION OF THE FUTURE
To build the vision of the “future of finance”, we asked the executives to predict where they see the finance department in 10 years’ time, and what they are doing right now to get there. We distilled the key thematic findings, which are described below:
3.1 Finance “building block” activities will be done seamlessly in a sustainable and controlled manner, with very little need for human intervention
In the future, finance departments will spend minimal time and effort to process, record, and control information in order to produce the right set of reporting for statutory/regulatory compliance and management decision making. Specifically:

46 /
• Distributed ledger technology (DLT) will be at the heart of finance ecosystem, promoting singularity and consistency.
• All transactions will be done using smart instruments and smart contracts. They already contain metadata that allow these instruments to self-execute in real time. This metadata will be enriched to include the accounting and regulatory reporting rules for each transaction, as well as rules for market validation (e.g., marking to market).
• A comprehensive data dictionary, combined with logical and physical data lineage, will be maintained.
• The accounting and regulatory rules embedded at the point of transaction creation, along with data dictionary and lineage, will ensure that every single transaction or event that is recorded in the distributed ledger is valid, accurate, and complete, and that every single transaction or event that is recorded is instantly linked to all relevant data attributes needed to produce all required reporting and MI (management information).
• Predictive modeling will allow finance to fully automate accounting adjustments (e.g., accruals, amortization, etc.), removing the need for a dedicated close process.
• Cloud technology will be used to efficiently process, by optimizing processing power, data storage, and retrieval capability.
• Reporting and MI will be accessed by different stakeholders through self-service visualization portals that are customizable and enhanced by deep machine learning (ML) to offer proactive insights.
• Human intervention will only be needed at three points: (1) to define the accounting rules for each transaction/event type (this will occur only when a new transaction/event type is created, or accounting rules change), (2) to monitor the performance of, and troubleshoot any issues in the finance architectural ecosystem, and (3) to design and implement system changes when needed.
• Cybersecurity will be naturally baked into a distributed ledger ecosystem; however separate privacy data measures will need to be implemented.
• Regulators and other industry supervisors will be directly plugged into the ecosystem, and will be able to monitor in real time. In some instances, they may be able to enforce regulation via a layer in the DLT ecosystem (akin to the way anti-virus software works on computers).
“ One day we will look back in amazement at the fact that we had whole floors of accountants, piecing together different sources of data to produce financial statements.” – Senior Finance Change Lead, Global Investment Bank
3.2 Finance will proactively drive the strategic direction of the firm, by spending more time and focus on “value enhancing” activities
Finance departments consist primarily of accountants, and the role of the accountant will be different in the future. Today, accountants’ efforts in financial services are consumed by some aspect of production of data and reports. In a future where all the production effort is done without human intervention, accountants/finance staff will spend most of their time extracting data driven insights and designing better ways to be even more insightful and predictive. Finance departments will be positioned to make the linkage between cause (business transactions and events) and effect (financial results) and, therefore, help the organization to predict the impacts of decisions. Where this is done in real time and in a scalable manner, FSOs can be extremely agile in pursuing new opportunities, offer increasingly better customer solutions, and certainly avoid trouble where it looms. Specifically:
• Staff at all levels will spend a lot more time gaining a deeper and more intimate understanding of the businesses that they support. This will be combined with the technical measurement and valuation rules, to more fully deeply understand the financial, regulatory, capital, liquidity, and cashflow impacts.
• Finance departments will constantly be evolving the predictive and analytical output of the finance ecosystem. While they may not necessarily write the code, they will provide the critical logical elements for data science analytics, deep ML models, and natural language processing applications.
• Finance departments will be doing a lot more communicating and influencing both within and outside of the organization. The finance department will evolve from being a business partner that reports on what has occurred to a partner that has developed data driven insights about the cause and effect of potential options – and as such will become a key influencer to a wider and more senior spectrum of internal stakeholders. They will also have meaningful and contextual insights about the organization’s various financial and regulatory results – this will make them the logical point of contact for regulators and other industry supervisors.
• Being a data aggregator armed with rich knowledge of the business will allow finance teams to (1) proactively identify emerging and existing risks and share that with the relevant departments to mitigate, (2) draw insights from across the organization to identify opportunities to increase revenue and/or lower costs, and (3) materially drive data
DATA MANAGEMENT | THE CFO OF THE FUTURE

47 /
commercialization by adding enrichment and context to data universes maintained in the bank.
• Change management will become an important function, as all transaction and event type changes will need impact assessment by the finance department and subsequent tweaking. Given the transparent modularity of the ecosystem, the finance department will be able to contribute more meaningfully to the net investment decision of the change, rather than just analyzing the technical impact of system changes.
• Finance departments will continue to interpret accounting and regulatory rules to define how the organization will enact them. However, because of predictive scenario modeling capabilities they will be better equipped to respond quickly and strategically. This will decrease industry consultation and implementation periods and result in a faster regulatory change cycle.
• Finance departments that work with forward looking/predictive insights (like stress-testing and budgeting/forecasting) will have a very frequent cadence. Real time budget comparisons to actual spend, combined with strong predictive analytics, can have a high impact on procurement and cost management as well as help to refocus revenue building activities. This will result in a dramatic decrease in the time it takes for decision making that may be required as a result of these activities.
“ The role of finance will swing from being mainly a guardian (ensuring the business remains compliant with regulations and meets commitment) to being a strategic value creator.” – Finance Innovation Lead, European Bank
4. BEGINNING THE JOURNEY
Getting to a vision of the future finance department is a journey. The journey, however, only feels worthwhile if we can get some real tangible benefits in both the short- and medium-term, on our way to achieving nirvana. So, what can finance departments start to do now that makes a real measurable difference immediately, while still getting them closer to their ultimate vision of the future?
It should be stated from the onset that digital enablement is key. It is the singular lever that allows for both the reduction in time, cost, and effort that finance departments spend on building block activities, while simultaneously arming them with the tools and information to do more value enhancing activities at scale. The CFOs and senior finance leaders we spoke to all acknowledged that making the finance department more digital was critical to the future, but
organizations were at very different phases of the evolutionary journey. We can break up the journey into four different stages (the definitions for which are contained in Figure 1): (1) legacy dominated, (2) digitally enhanced, (3) digitally enabled, and (4) digitally optimized.
None of the executives we spoke to have reached stage 4 as yet. In fact, most organizations are somewhere between stages 1 and 2. There are, however, some leading organizations where CFOs are getting to the end of stage 2 and pushing into stage 3. They are all doing the following four things:
4.1 Automating, with intelligent robots
Ideally, finance departments would always get their technology architecture into its strategic state, by being singular, consistent, and entirely automated from input to output. This takes time and effort and does not pay off immediately – but while this should always be the long-term strategy, RPA is being used as a very effective strategy to help them deal with fragmented process and technology. The benefits are:
• Easy to adopt: finance departments have a great starting point for RPA. Most processes that have been offshored are primed for automation and should form the first prioritized phase. Additionally, RPA is not disruptive to the architecture as it requires little to no change to existing systems.
• Low cost, immediate benefit: RPA has a short quick payback period, allowing immediate realization of the upfront investment. A robot is a fraction of the cost of an onshore employee and much cheaper than an offshore employee. They can work 24/7 and do not get sick or take time off.
• Control: RPA is scalable and has 100% auditability because of control log and timestamp functionality. RPA has inherent control built-in because robots perform tasks consistently without deviation, until told to do so, thereby eliminating the risk of human error.
• On critical path to strategic implementation: Converting to RPA creates a collection of thematic root cause data that will help to prioritize the strategic end state. It is not wasted work, but rather think about it as a way to gather business requirements for your end-state technology while still getting the relief of automation before your end-state is delivered.
• Exponential growth through modularity: once created, a robot’s components can be copied and used in other robots. This increases speed and reduces costs further for making subsequent robots.
DATA MANAGEMENT | THE CFO OF THE FUTURE

48 /
DATA MANAGEMENT | THE CFO OF THE FUTURE
80% BUILDING BLOCK ACTIVITIES
95% VALUE ENHANCEMENT
LEGACY DOMINATED CFO
DIGITALLY ENHANCED LEGACY CFO
DIGITALLY OPTIMIZED CFO
DIGITALLY ENABLED CFO
Figure 1: Phases of the finance departments’ evolutionary journeys
• Little or no use of robotics, AI, and automation
• New requirements tend to be delivered with significant manual process steps
• No significant use of cloud technology
• Core finance systems are fragmented, hosted in own-premise data centers, and hard to keep on latest software versions
• RPA introduced and starting to take the burden off manual processes
• RPA and automation technologies are running significant portions of finance building block activities
• All finance building block activities are fully automated using AI enhanced robots integrated into smart workflows
• Cloud first policy introduced• Core systems are being
migrated to the cloud and are starting to reduce costs
• Rationalized finance estate is leveraging SaaS and cloud optimally
• All core systems are SaaS or microservice based, running in the cloud and integrated using APIs
• Cloud is maximized with minimal data center footprint
• Legacy on-premise systems have been demised
• New functionalities are provisioned from the cloud as they become available and are seamlessly absorbed into the finance technology estate.
• Data is highly fragmented, manually copied, transformed, and amended frequently
• CDO/DMO in place and started to get control of data
• Advanced visualization and analytics tools being introduced to finance
• Data is well managed (owner, lineage, golden source, etc) and available quickly, in the right form, wherever it is needed
• Data is reliable wherever it is delivered and is plumbed into visual analytics tools and ML to support strategic value creation by finance specialists
• Optimally managed and controlled. Seamlessly integrated across external internal data sources
• Securely and seamlessly shared with third-parties on demand (i.e., regulators, credit reference agencies, collaborators, etc)
• Finance work is mostly building block activities
• High reliance on off-shore data processing centers
• Finance processes have changed little for decades
• Finance teams are siloed from each other and the rest of the organization
• Innovation in finance departments is low
• Innovation in finance is encouraged and supported
• Senior finance management are driving cultural change
• Finance are starting to work more collaboratively
• Innovation is external (i.e., adopting what others are doing)
• Finance specialists delivering significant strategic value and spend less time on building block activities
• Innovation being originated internally
• Finance operates collaboratively internally and across the organization
• Finance spend almost all of their time driving value enhancing activities
• Finance has an embedded culture of innovation with porous organizational boundaries and an optimal mix of skillsets to compliment grassroots innovation
AUTOMATION
CLOUD
DATA
WAYS OF WORKING

49 /
• They get smarter: robots can be paired with deep machine learning models to train itself to perform more complex process solutions requiring judgment and context. Chatbots and smart forms are other examples of “modular add-ons” that can extend the range of things that robots can do.
4.2 Detangling data
Despite regulations like BCBS 239 and the introduction of new organizational structures like the Chief Data Office raising the profile and organizational efforts to get data right, the CFOs still tell us that finance departments spend most of their time fixing data quality issues. Finance departments are the biggest data aggregators in the organization and need to be driving the data organizational effort. The benefits of developing an optimized data governance model for finance are:
• Free up time: the finance department will spend less time correcting the impact of poor data hygiene.
• Access information quicker: removing the latency in the “production” of data will allow usable information to get to finance (or other parts of the organization) in near real time.
• Visualization: be able to leverage better visualization tools to improve finance business partner activities and explain.
• Analytics: finance departments will be able to leverage analytics capability for control techniques (e.g., analytical review) and for forecasting and other predictive applications.
• Self-service: allow the creation of dynamic “click through” self-service dashboards and other MI tools.
• Straight through processing (STP): having the right data structure and governance remains a fundamental precursor to enable STP, or the fulfillment of any end state strategic technology architecture.
“The time it takes to get access to data and turn it into actionable business insight is reducing - the cycle is getting shorter and shorter.” – Finance Innovation Lead, European Bank
“ Most financial service firms are starting to use their vast data sets in predictive analytical models and deep ML applications. Care must be taken to either cleanse that data set of any inherent biases (e.g. gender bias, or personal identifying data protected under data protection regulations) or to recalibrate the models to account for these biases.” – Chief Financial Officer, European Insurer
4.3 Getting in the cloud
Embracing and exploiting cloud technologies is vital to building and operating the finance function of the future. Public and hybrid clouds are now significantly more secure and more resilient than proprietary on-premise data centers, and they offer substantial cost, performance, and innovation benefits that will soon become the new norms for finance technology. Cloud is the key enabler for finance that unlocks:
• Conversion of the cost of finance technology from capex to opex: pay for IT as it is required, dynamically scaling compute and storage capacity up and down so that it matches usage patterns. No upfront IT investment required and no need to buy a fixed size IT estate that must be big enough to handle peak usage and will consequently be underutilized most of the time.
• Elimination of operational risk from end of life hardware and infrastructure failures: virtualized cloud servers abstract the real hardware, which is managed by the cloud provider. Failures, upgrades, and maintenance are handled seamlessly without any interruption to service.
• Software-as-a-Service (SaaS) applications: software that implements crowd-sourced best practice finance processes, delivered with cloud provisioning benefits. New features are continually and iteratively released as part of the SaaS subscription, typically on a monthly cycle, instead of requiring the purchase of major new software versions that then need big, high risk projects to implement.
• Data optimization: centralize data in cloud hosted golden source repositories that make it available wherever it’s needed, quickly, reliably, and in the form required. No more need to copy data around (which requires continuous reconciliation back to the source), amend it in numerous places, or transform it using spreadsheets.
DATA MANAGEMENT | THE CFO OF THE FUTURE
One day we will look back in amazement at the fact that
we had whole floors of accountants, piecing together
different sources of data to produce financial statements.

50 /
• Global finance system access: allow finance users to work from anywhere, with secure access to the cloud hosted apps and data. Create a flexible working and highly collaborative finance system environment.
• Innovation in finance departments: additional services and technologies are readily available via cloud providers, which integrate easily with each other without the need for specialist engineers. Finance department users can quickly and easily build proofs of concepts and experiment with new technologies, such as ML and blockchain, without needing support from IT development teams.
• Highly productive ways of working: dynamic provisioning of technology, controlled by finance user teams, powers truly agile working principles.
• Highly secure systems: the three largest cloud providers commit substantially higher investment budgets to cybersecurity than almost any other organizations. Their scale also allows them to detect threats from viruses early and implement countermeasures. Consequently, data stored in the cloud is typically many times more secure than proprietary data centers.
4.4 Prioritizing getting the culture right
Culture is the glue that holds all together. To be successful, the digital levers described above must be combined with a cultural change in the finance department. Cultural change must begin with the tone being set at the top. Some key considerations are:
• Own new ways of working: there is limited value in dedicating a large proportion of highly qualified accountant’s time to (1) running processes that compensate for fragmented systems/data, (2) performing onerous control techniques to ensure those process have been done properly, or (3) navigating complex architecture to retrieve information for reporting or decision making. There must be an acknowledgement in finance that as things get better the jobs that finance do will change.
• No fear factor: finance leadership needs to help to remove the fear that finance innovation will lead to job loss, and instead show their people how it can use their knowledge and expertise to add value to the organization while having sustained and rewarding careers.
• Skills mix: finance needs to hire for the underlying skill set rather that than for knowledge of a process. Apart from core accounting knowledge and controls understanding, skills like data science, analytical insight generation, communication, and ability to innovate should trump previous experience running a specific production process (e.g., producing a P&L or running a stress testing process).
• Fail fast: finance should strive to innovate, by failing fast in a safe environment and iterate to the next phase quickly. Finance need to fight the urge to get into “paralysis by analysis” and, therefore, scupper any chance of innovation inertia.
• Shout from the rooftops: finance must prioritize telling the rest of the organization about their key successes. This allows other departments to fully understand and appreciate the value that finance add and helps the organization to visualize the future potential contribution and support further finance innovation.
5. FINAL THOUGHTS
Finance is a department that could be a powerhouse of the FSO, but consistently undersell both the value they add and more importantly the potential value they could unlock, should they be allowed. You get the distinct feeling that finance departments sometimes do not feel that they deserve a seat at the table where strategic organizational direction is being driven from. Digital enablers are a fantastic tool to enable finance departments to contribute meaningfully to driving strategic direction. However they are just tools, finance first needs to shift the current paradigm.
“ There is a tendency to stick with how we’ve always done things, but the challenge is to adapt. For example, taking budget and forecasting – how do we move from a once per year exercise to continuous forecasting?” – Finance Change Lead, European Bank
Develop and bring in leaders that are emboldened to go for the long-term big wins and are savvy enough to sell this vision to the rest of the organization. Combine this with adopting some digital enablement that both realizes benefits in the short/medium term, while continuing to steer to the end state.
DATA MANAGEMENT | THE CFO OF THE FUTURE

51 /
“ We have implemented a formal Future Ready CFO Leadership program as a way to help coach the next generation of finance leaders in how to proactively advise business leaders, adapt to and drive change in the businesses and finance successfully, and continue to reinforce our leadership values and corporate priorities given the rapid and accelerating changes in the industry and bank’s market leading position.” – Chief Financial Officer, North American Bank
Combine the conservative risk mitigator attitude with an entrepreneurial mindset. The ability to identify potential risks and problems should not lead to “paralysis by analysis”. Rather, finance departments should be encouraged to fail fast in a safe environment in order to promote the innovative and continuous improvement mindset that is required for growth.
“ Senior finance leaders need to lead their teams in a way that avoids the detrimental impacts of change fatigue. Thought needs to be given to the concept of continuous improvement rather than starting from scratch each time. Giving teams a clear understanding of the volatile, uncertain, complex and ambiguous (VUCA) environment and helping them to manage through that is a key tool.” – Product Control Head, Global Universal Bank
CFOs need to show their people what the finance jobs of the future look like, and rather than being a threat they should define the path to get there. Finance professionals must not view change and innovation as a threat, but rather an opportunity to realize a more purposeful, creative, and intellectually stimulating career that is noticeably valued by the rest of the organization.
It is a pioneering step forward. Finance is at an inflection point that requires an evolution rather than revolution, and the digital enablement tools are there to help them seize the win, should they be brave enough to go for it.
DATA MANAGEMENT | THE CFO OF THE FUTURE

52 /
D ATA A N A LY T I C S

54 Artificial intelligence and data analytics: Emerging opportunities and challenges in financial services Crispin Coombs, Reader in Information Systems and Head of Information Management Group, Loughborough University
Raghav Chopra, Loughborough University
60 Machine learning for advanced data analytics: Challenges, use-cases and best practices to maximize business value
Nadir Basma, Associate Consultant, Capco Maximillian Phipps, Associate Consultant, Capco Paul Henry, Associate Consultant, Capco Helen Webb, Associate Consultant, Capco
70 Using big data analytics and artificial intelligence: A central banking perspective Okiriza Wibisono, Big Data Analyst, Bank Indonesia Hidayah Dhini Ari, Head of Digital Data Statistics and Big Data Analytics Development Division, Bank Indonesia Anggraini Widjanarti, Big Data Analyst, Bank Indonesia Alvin Andhika Zulen, Big Data Analyst, Bank Indonesia Bruno Tissot, Head of Statistics and Research Support, BIS, and Head of the IFC Secretariat
84 Unifying data silos: How analytics is paving the way Luis del Pozo, Managing Principal, Capco Pascal Baur, Associate Consultant, Capco

54 /
CRISPIN COOMBS | Reader in Information Systems and Head of Information Management Group, Loughborough University
RAGHAV CHOPRA | Loughborough University
trading/portfolio management, among others. In 2016, for example, JPMorgan Chase used AI-based software to analyze commercial loan contracts, and it was able to analyze 12,000 loan documents within seconds, compared to 360,000 human hours for the same task [Economist (2017)].
Historically, decision making in financial service firms has largely been reliant on a combination of descriptive analytics (such as reports, scorecards, and dashboards) that only provide information about past events and predictive analytics (such as linear regression analysis) using historical data to understand patterns and predict the future. These techniques rely on data generated from past events and lack the sophistication to handle the vast quantity of data required for more accurate predictions [Davenport and Harris (2017)]. With the advent of big data there is a ready supply of data for more accurate predictive decision making. However, this big data is frequently unstructured and is constantly changing at a rapid pace. AI systems have been designed to process large amounts of data with levels of accuracy and consistency that are not possible for humans to achieve [Wall (2018)].
ABSTRACTArtificial intelligence (AI) systems are providing a new opportunity to financial services firms to develop distinctive capabilities to differentiate themselves from their peers. Key to this differentiation is the ability to execute business in the most effective and efficient manner and to take the smartest possible business decisions. AI systems can process large amounts of data with levels of accuracy and consistency that is not possible for humans to achieve, providing a route to more accurate predictions and data-driven analytical decision making. In this paper, we discuss the benefits of AI for improving data analytics and decision making, current and potential applications of AI within financial services, operational challenges and potential solutions for AI adoption, and conclude with requirements for successful adoption of AI systems.
ARTIFICIAL INTELLIGENCE AND DATA ANALYTICS: EMERGING OPPORTUNITIES
AND CHALLENGES IN FINANCIAL SERVICES
1. INTRODUCTION
Advances in artificial intelligence technologies have seen a step change over the past 10 years, leading to substantial digital disruption of the business world. AI is providing firms with new opportunities to develop distinctive capabilities that can be used to differentiate them from their peers. Key to this differentiation is the ability to execute business in the most effective and efficient manner and to take the smartest possible business decisions. Using advanced technologies, such as AI, to support a firm’s distinctive capabilities is instrumental in achieving this end [Davenport and Harris (2017)].
Despite being a quantitative field, the financial services industry was initially slow to adopt AI, when compared to other functions such as marketing and supply chain management, for example. Adoption rates have, however, improved in recent years, and the financial services industry was reportedly among the top three users of AI in 2018 [Chui and Malhotra (2018)]. AI is now being used for compliance, risk management, credit rating and loan decisions, fraud prevention, and

55 /
1 It is reported that a Fortune Global 100 biopharma company that set up an AI/cognitive center of excellence (CoE) realized 10-15% savings on its baseline costs [Aguilar and Girzadas (2019)].
Consequently, the application of AI for data analytics makes it possible to generate more accurate predictions and solving time variant problems [Bahrammirzaee (2010), Buchanan (2019)]. Makridakis (2017) suggests that the increasing use of AI will result in interconnected firms and decisions based on advanced analytics and extensive use of big data, promising widespread competitive advantage to the firms employing the new technology.
2. BENEFITS OF AI FOR DECISION MAKING
For many firms, the key driver of adopting AI-based systems and technologies is cost reduction. In a global survey conducted by Deloitte, covering 1,219 executives from 24 countries, around 76% of the respondents stated that adoption of AI was aimed at reducing costs and increasing productivity. 36% of the respondents reported that AI capabilities met expectations while 47% reported that they exceeded expectations.1
Using AI in the workplace enables more efficient operations, which ultimately results in cost-savings. It allows automation of mundane and repetitive tasks, allowing employees and managers to spend more time decision making and developing action plans for the future [PwC (2019a)]. PwC reports an average improvement of 40% in volumes with just two staff members along with 200 virtual assistants achieving the output of 600 full-time employees. PwC undertook the automation of 3 million transactions per month, which translated into a 200% return on investment (RoI) in one year, and 35% automation of their back-office work has brought 650-800% RoI in three years. They witnessed a 76% improvement in processing times [PwC (2019)a].
PwC is also using AI to combat cyber attacks. According to a Global CEO survey, 76% of U.K. leaders see cybersecurity as the second largest threat their businesses faces. PwC uses a digital game that stimulates the experience of a cyber attack for the employees. This helps employees detect cyber attacks cases faster and be better prepared to deal with such an attack [PwC (2019b)].
Thus, from the above examples and statistics, it is clearly visible that there is great scope for transforming the way firms operate using AI. If the AI technology is used effectively, it can boost organizational performance through improved efficiency, consistency in operations, and allowing employees to focus on taking actions in light of the available analysis rather than spending workhours on the analysis process itself. This
DATA ANALYTICS | ARTIFICIAL INTELLIGENCE AND DATA ANALYTICS: EMERGING OPPORTUNITIES AND CHALLENGES IN FINANCIAL SERVICES
provides the firm with a more focused approach to making faster and smarter decisions.
In the following sections, we will discuss existing and potential applications of AI systems, with specific examples pertaining to financial services, the operational challenges and solutions for AI adoption in financial service firms, and the requirements for successful AI adoption.
3. POTENTIAL AND EXISTING APPLICATIONS OF AI FOR FINANCIAL SERVICES
AI has already been applied in a wide range of financial service functions from auditing to assessing market risk. Some of these will be discussed below.
3.1 Auditing
Given the growing population size and increased complexity of transactions, the use of AI in auditing appears inevitable. Over the last two decades complex AI systems have been developed, in the form of expert systems and neural networks, to assist auditors in decision making. The primary objective of the development and adoption of these AI-based systems is to eliminate potential bias and omissions that may occur in manual audit processing [Omoteso (2012)].
When using AI systems, it is important that auditors do not over-rely on AI decision recommendations, but use them as an aid to inform their decision making. This is because current AI cannot replicate the versatility or judgment of the human auditor. However, use of AI systems ensures efficiency and effectiveness, consistency, improvement in decision-making accuracy, and reduced decision-making time. For example, a study of 96 auditors to test the value add of using an expert system to help assess the risk of management fraud found that it enhanced the auditor’s ability to discriminate between various levels of management fraud compared to the use of traditional checklists and logit statistical models [Omoteso (2012)].
3.2 Credit rating
Credit-reporting firms such as Experian PLC, Equifax Inc., and TransUnion have been using AI to improve identity verification. The main driving factor for this shift is the growing amount and complexity of information that needs to be analyzed in describing and verifying the identity of a person. For example, Experian has a database of around 1.2 billion consumer credit-history records. Using AI technology will allow Experian to verify

56 /
the identity of a customer more effectively while asking fewer questions. One way in which this is achieved is by analyzing a number of data points when a person enters their username and password for internet banking. The data points would include analyzing the IP address, device identifiers, speed of entering the details, etc. [Council (2019)]. Experian has been working on the development of the AI technology for 18 months and during the testing phase it was seen that around 20% of the identities it believed were fake previously, turned out to be true while 5% of the identities they believed were real, turned out as fake.
3.3 Mergers and acquisitions (M&A)
AI is rapidly redesigning the way M&A transactions are being undertaken. Traditionally, M&A required tedious calculations using Excel spreadsheets and the manual review of documents and contracts that were extremely time consuming. Now, with AI powered analytical tools it is possible to undertake a real time in-depth analysis of the specific elements of the target company. Such manual work is not only time-consuming and costly but can also lead to important information contained in several amendments and pages to be over-looked or missed [Deloitte (2018)]. AI based tools allow for quick and accurate calculations and swift extraction of relevant provisions. Young et al. (2018) suggest that AI systems can be used for all transactions and phases during an M&A cycle – diligence, negotiation, and post-merger integration, as well as for divestiture and spin-off decisions.
• Due diligence: during the due diligence step, AI tools enable real time and accurate financial analysis of the target company. It makes it possible to get a better understanding of the target’s real growth-drivers and undertake more in-depth analysis of their customer retention efforts and profit margins at the group as well as business section levels; for example, by product, geography, type of consumer, etc.
• Negotiation: AI tools provide more in-depth and valuable details during the due diligence and contract review process, enabling the deal team to quickly decide whether to further engage with the target company, provide a counteroffer, etc. The tool also identifies the potential risks involved.
• Post-merger integration: AI tools play a crucial role post-merger in identifying opportunities for synergies and growth potential, as well as contributing to business optimization strategies.
AI can achieve all this with cost savings of up to 20% and in nearly half the time [Young et al. (2018)].
3.4 Insurance
Insurance companies have been investing in AI technology in earnest since 2014, with key growth areas including robotic process automation, deep learning, embedded solutions, machine learning, video analytics, and natural language processing [Jubraj et al. (2018)]. AI can be applied across all insurance functions, from the front to the back office. It is estimated that AI can help the insurance sector achieve cost saving of up to U.S.$390 bln by 2030 [Nonninger (2019)]. In the front office, AI can be used in the form of chatbots to speed-up and streamline the claims process for consumers and mitigate the number and magnitude of fraudulent claims for the insurers. Insurance companies can also use AI to improve operational efficiency, by, for example, analyzing vast amounts of data to calculate a more accurate pay-out amount. Intelligent First Notification of Loss (i-FNOL), for example, uses computer vision and machine learning that analyzes images of an accident to establish who was at fault [Jubraj et al. (2018)]. In the middle office, AI plays an important role in improving fraud detection and in the back-office it plays a crucial role in risk assessment and accurate calculation of claim amounts [Nonninger (2019)].
Insurance companies are also using AI to get a better understanding of insurance risks to improve pricing and for developing new products. In the case of property insurance, AI is being used to analyze building permits for code violations, structural modifications, etc. Insurance companies are also trying to speed up claim processes by allowing people to send images of damage via an app. While the adoption of AI in the insurance industry is still in the early stages it has a vast potential for presenting new competitive opportunities [Murawski (2019)].
3.5 Anti-money laundering (AML) compliance
Adoption of AI for AML compliance has been slow compared to other areas of financial services. However, interest in this area is increasing due to pressures from increased volumes of international transactions, frequent changes in regulatory requirements, and the use of economic sanctions by governments. The workload in the AML compliance and know your customer (KYC) space is continuously increasing. Banks and financial institutions have to hire large numbers of employees due to the manual nature of this tedious and time-consuming work. The banks face several important challenges, such as high numbers of false positives, poor data quality, and manual updating and comparison processes [Breslow et al. (2017)].
DATA ANALYTICS | ARTIFICIAL INTELLIGENCE AND DATA ANALYTICS: EMERGING OPPORTUNITIES AND CHALLENGES IN FINANCIAL SERVICES

57 /
To improve efficiency and effectiveness, banks have been investing heavily in three areas: data-aggregation platforms, AI-based statistical modeling tools, and AI-based visualization tools. These steps are expected to reduce error rates by up to 30%, bring down false positives from 90% to under 50%, and reduce the risk of being penalized [Breslow et al. (2017)]. HSBC recently partnered with a startup providing AI-based solutions for automating their AML compliance processes with the aim of improving efficiency. Since implementation, HSBC has seen a 20% reduction in the number of cases referred for further investigation [Irrera (2017)]. Similarly, when United Overseas Bank (UOB) launched an AI pilot program for AML compliance, for transaction monitoring it saw a 5% increase in true positives and a 40% decrease in false positives. Furthermore, in individual/corporate name screenings, the bank observed a 60%/50% drop in false positives. Operational efficiency rose by 40% [Singh et al. (2018)].
3.6 AI and market risk
Market risk refers to the risk associated with trading and investing in financial markets. Trading in financial markets involves the use of risk management models and AI has been used to perform stress tests of such models – also known as model validation. Investment firms are making use of unsupervised learning of the AI systems to identify new patterns of relationship between financial assets. AI systems also play an important role in helping trading firms gain an understanding of the impact of their trading on market pricing. These firms are making use of clustering methods to avoid large exposure in illiquid markets [Aziz and Dowling (2019)]. These advanced AI systems can notify investors to change their trading patterns whenever necessary. The primary advantage of using AI capabilities, as opposed to manual trading advice, is that the system can provide realtime feedback and analyze far more data to improve predictions [Aziz and Dowling (2019)].
We can see from the preceding sections that AI has a vast and diverse potential to improve how businesses, and in specific financial services companies, operate and grow. However, firms may face several barriers in implementation. The next section will elaborate on such barriers and detail the existing and potential measures to overcome them.
4. OPERATIONAL CHALLENGES AND POTENTIAL SOLUTIONS FOR AI ADOPTION
Despite the many benefits associated with the use of AI, there are various barriers to its implementation that need to be identified and effectively managed in order to fully benefit from its application with financial services.
4.1 Availability of data
The basic requirement for implementing AI is the availability of a large labeled and categorized dataset. The full benefits of AI cannot be realized unless there is a rich set of data available, since AI systems are not programmed but “trained” on this vast dataset. In some domains, organizing and labeling large datasets could be challenging. One solution to this problem is the use of unsupervised or semi-supervised approaches to “train” the system. This could include two methods:
• Reinforcement learning: this technique involves training the system through trial and error. It uses the “carrot and stick” methodology – the system or algorithm receives a reward (such as a high score) when it successfully performs a task and low score otherwise. Microsoft used this method for its decision services to adapt to user preferences. Another potential application of this method is in the use of AI-driven portfolio management, where the score is based on the gains and losses in value.
• Generative adversarial networks (GANs): under this technique two systems compete against each other to improve their understanding of a concept. GANs train a generative network by framing the problem as a supervised learning problem with two sub-models: the generator network that we train to generate new examples and the discriminator network that tries to classify examples as either real (from the domain) or fake (generated) [Brownlee (2019)].
4.2 Explainability and transparency
Another challenge arises from being able to explain how the AI system has arrived at a solution or decision. This is particularly a drawback in cases where the user needs to know the reason behind a particular prediction and the prioritization process of key decision criteria that led to the decision outcome. This can important for lending decisions in the European Union (E.U.), where under the guidelines of General Data Protection Regulation (GDPR) citizens have a right to know how the decision was derived. Two techniques used to make AI more transparent include:
• Local interpretable model agnostic explanations (LIME): LIME identifies the parts of the input that were most relevant to arriving at a decision
• Attention techniques: these highlight the parts of the input that the model focused on while arriving at a decision.
DATA ANALYTICS | ARTIFICIAL INTELLIGENCE AND DATA ANALYTICS: EMERGING OPPORTUNITIES AND CHALLENGES IN FINANCIAL SERVICES

58 /
4.3 Challenge of exclusivity
Unlike humans, AI systems are not able to transfer their learning from an experience or task to another. Thus, whatever the system has achieved working on a task remains exclusive to that task. For another task the company would have to train another model. This can be overcome through the following techniques:
• Transfer learning: here, the AI model is trained to complete a task and apply the learning to a different activity. This technique can allow diverse functionality.
• Generalized structure: this method involves the use of a generalized structure to train a model to solve a number of problems instead of just one.
• Meta-learning: this technique can be used to automate designing of the neural network itself. Google has developed AutoML for this purpose. This reduces the workforce requirements of designing a new model for different tasks.
4.4 Shortage of skilled workforce
Another critical challenge facing financial services firms in adopting AI is the acute shortage of skilled workforce. A McKinsey report states that there are approximately 10,000 AI-related job vacancies globally. Adoption of AI in financial services has picked up speed due to high technical feasibility and nature of work, i.e., working with large amount of structured data. For example, AI-optimized fraud-detection systems are expected to become a U.S.$3 billion AI market by 2020 [Bughin et al. (2017)].
5. REQUIREMENTS FOR SUCCESSFUL ADOPTION OF AI SYSTEMS
There are several broad prerequisites for the successful adoption of AI systems.
First, is the availability of a vast amount of historical data. The AI system uses this data to understand patterns and behavior over time to reach a decision or to predict the future occurrence of an event. A lack of big data will limit a firm’s ability to fully capitalize on the potential AI offers.
Second, the quality of the AI-based analysis and predictions will depend on the level of human skills available to design the systems. If there is an error in the algorithm or if the data is “labeled” in a faulty manner, this too will hamper the quality of the output [Davenport and Ronaki (2018)].
Third, firms must acknowledge that not all applications of AI will be successful. Firms need to be careful leveraging any technological advantages of the new systems. Many AI projects have failed due to a high level of expectation and overambitious objectives. Firms must understand which technology will be best for which task – one size does not fit all. Firms should rank in order of priority the portfolio of projects based on the needs of the business and viability of use. The best approach to initiate the adoption of AI is an incremental approach rather than transformative. Firms must use the technology to support human capabilities rather than immediately attempting to replace them [Davenport and Ronaki (2018)].
Fourth, AI helps provide employees with accurate data and good quality predictions, enabling firms to make the smartest possible decisions. This kind of intelligence will be of lesser value if decisions cannot be made quickly in response to a situation. This is most likely to occur in firms with a rigid senior level approval or authorization-based structure. It is imperative that in modern firms, employees at all levels have some degree of decision-making power, especially in cases of critical and time sensitive issues. While it is not possible for every employee to be a data scientist, the firm adopting the use of AI must train its employees to at least have some basic knowledge of how to use and interpret data and the new AI systems. Otherwise, the extensive availability of data and decentralized decision making would be of no real value to the firm [Fiore (2018)].
These requirements will take time for a financial services firm to address. Consequently, the AI adoption journey is likely to comprise of a number of stages. Thomas Davenport argues that firms are likely to transition through three stages of AI adoption:
Stage 1: Assisted intelligence: during this stage, companies utilize big data programs, cloud-based technologies, and science-based approaches to make data-driven decisions. The utility of assisted intelligence is to assist humans in doing routine tasks faster. The human is still taking some of the key decisions and AI is executing the task.
Stage 2: Augmented intelligence: this stage involves developing the machine learning capabilities using the existing information management systems to support human analytical competencies.
DATA ANALYTICS | ARTIFICIAL INTELLIGENCE AND DATA ANALYTICS: EMERGING OPPORTUNITIES AND CHALLENGES IN FINANCIAL SERVICES

59 /
Stage 3: Autonomous intelligence: this is the stage of achieving automation in processes. AI is used to digitize processes and actions. In this stage, the machine, bots, and systems can take decisions from the information, algorithms, and intelligence used to develop the machine learning [Mittal et al. (2019)].
Thus, the firm will begin the AI journey using assisted intelligence and as they become more technically advanced, they would transition to the use of augmented intelligence followed by autonomous intelligence.
6. CONCLUSION
It is clear that AI provides tremendous opportunities for transforming financial service firms. If AI is adopted effectively it can provide new operational benefits to the firm, customers, and employees. For example, applications of AI could provide
higher quality and wider variety of customized products and services to customers, as well as opportunities to upskill employees and enhancing their career development.
Reaping the benefits of AI systems for financial services is likely to rest on the ability of firms to manage bias in the big data used for training algorithms and recruiting sufficient numbers of AI skilled workers. These two factors are the building blocks of AI adoption. The ability of the machine to “learn” depends largely on the quality of the data and human workforce “training” it. Well-trained employees are also needed to be able to correctly understand the output from AI systems and make informed decisions and/or action plans.
Putting these two building blocks in place will help drive the cultural change of data-driven decision making and ensure that financial services firms can integrate new AI systems with their existing information systems.
DATA ANALYTICS | ARTIFICIAL INTELLIGENCE AND DATA ANALYTICS: EMERGING OPPORTUNITIES AND CHALLENGES IN FINANCIAL SERVICES
REFERENCES
Aguilar, O., and J. Girzadas, 2019, “Save-to-transform as a catalyst for embracing digital disruption,” Deloitte, https://bit.ly/33PWMW2
Aziz, S., and M. Dowling, 2019, “Machine learning and AI for risk management,” in Lynn, T., G. Mooney, P. Rosati, and M. Cummins (eds.), Disrupting finance: FinTech and strategy in the 21st century,” Palgrave
Bahrammirzaee, A., 2010, “A comparative survey of artificial intelligence applications in finance: artificial neural networks, expert system and hybrid intelligent systems,” Neural Computing and Applications 19:8, 1165-1195
Breslow, S., M. Hagstroem, D. Mikkelsen, and K. Robu, 2017, “The new frontier in anti–money laundering,” McKinsey & Company, https://mck.co/2sP462x
Brownlee, J., 2019, “A gentle introduction to generative adversarial networks (GANs),” Machine Learning Mastery, https://bit.ly/2xg0Tvf
Buchanan, B., 2019, “Artificial intelligence in finance,” The Alan Turing Institute
Bughin, J., E. Hazan, S. Ramaswamy, M. Chui, T. Allas, P. Dahlström, N. Henke, and M. Trench, 2017, “Artificial intelligence: the next digital frontier?” McKinsey & Co., https://mck.co/2iCPq53
Chui, M., and S. Malhotra, 2018, “AI adoption advances, but foundational barriers remain,” McKinsey & Company, https://mck.co/2ToxF7l
Council, J., 2019, “Experian tests AI platform to improve identity verification,” Wall Street Journal, July 19, https://on.wsj.com/2Mx7cEm
Davenport, T., and J. Harris, 2017, “Competing on analytics,” Harvard Business Review, 94-95
Davenport, T., and R. Ronaki, 2018, “Artificial intelligence for the real world,” Harvard Business Review, 4-10
Deloitte, 2018, “Not using analytics in M&A? You may be falling behind,” https://bit.ly/2ptCkHE
Economist, 2017, “Machine-learning promises to shake up large swathes of finance,” May 25, https://econ.st/2L02SKS
Fiore, A., 2018, “Why AI will shift decision making from the c-suite to the front line,” Harvard Business Review, https://bit.ly/2LV5Naf
Irrera, A., 2017, “HSBC partners with AI startup to combat money laundering,” Reuters, June 1, https://reut.rs/2P7GCE8
Jubraj, R., S. Sachdev, and S. Tottman, 2018, “How smarter technologies are transforming the insurance industry,” Accenture
Makridakis, S., 2017, “The forthcoming artificial intelligence (AI) revolution: its impact on society and firms,” Futures 90, 46-60
Mittal, N., D. Kuder, and S. Hans, 2019, “AI-fueled organizations,” Deloitte insights, https://bit.ly/2RBPmmP
Murawski, J., 2019, “Insurers turn to AI to better assess risk,” Wall Street Journal, March 6, https://on.wsj.com/2MwZnP7
Nonninger, L., 2019, “The AI in insurance report: how forward-thinking insurers are using AI to slash costs and boost customer satisfaction as disruption looms,” Business Insider, June 6, https://bit.ly/2MtQpSN
Omoteso, K., 2012, “The application of artificial intelligence in auditing: looking back to the future,” Expert Systems with Applications 39:9, 8490-8495
PwC, 2019a, “Artificial intelligence,” https://pwc.to/2NolI0Y
PwC, 2019b, “Game of threats,” https://pwc.to/2KWGJNF
Singh, R., M. Fernandes, N. Lim, and E. Ang, 2018, “The case for artificial intelligence in combating money laundering and terrorist financing,” Deloitte, https://bit.ly/2NoEYvb
Wall, L., 2018, “Some financial regulatory implications of artificial intelligence,” Journal of Economics and Business 100, 55-63
Young, J., J. Roth, and M. Joseph, 2018, “M&A hot takes: turbocharge your next transaction,” Deloitte

60 /
NADIR BASMA | Associate Consultant, Capco
MAXIMILLIAN PHIPPS | Associate Consultant, Capco
PAUL HENRY | Associate Consultant, Capco
HELEN WEBB | Associate Consultant, Capco
Machine learning (ML) is a field with strong relevance to advanced analytics. At the most basic level, machine learning describes the use of computational algorithms more advanced than traditional analytics methods (for example, SQL queries and data mining approaches) that are employed to gain insight into large datasets. While the term itself is relatively new, its core concept of learning from data without relying on rules-based programming is not. Machine learning techniques have foundations firmly in the science of statistics, with these concepts built on and refined into the rich and diverse set of tools at our disposal today.
Machine learning has valuable applications in a diverse range of fields, including financial services. These applications include detecting financial crime, predicting loan repayment defaults, and providing personalized customer engagement.
ABSTRACTAs the amount of data produced and stored by organizations increases, the need for advanced analytics in order to turn this data into meaningful business insights becomes crucial. One such technique is machine learning, a wide set of tools that builds mathematical models with minimal human decision making. Although machine learning has the potential to be immensely powerful, it requires well-considered planning and the engagement of key business stakeholders. The type of machine learning used will be determined by the business question the organization is trying to answer, as well as the type and quality of data available. Throughout the development process, ethical considerations and explainability need to be considered by all team members. In this paper, we present some of the challenges of implementing a machine learning project and the best practices to mitigate these challenges.
MACHINE LEARNING FOR ADVANCED DATA ANALYTICS: CHALLENGES, USE-CASES AND BEST
PRACTICES TO MAXIMIZE BUSINESS VALUE
1. INTRODUCTION
Across almost all industries, an unprecedented amount of data is currently being generated, with an estimated 2.5 quintillion (1018) bytes of data created across the globe each day.1 The financial services industry is no exception, with the New York Stock Exchange capturing 1 TB of trade data each trading session, for instance. Not only is the amount of data being produced increasing, but so too is the variety of formats in which it is being produced and the structural complexity of this data. As well as highlighting the importance of controls required to ensure that data quality standards are met,2 the amount and complexity of data an organization handles on a daily basis brings into focus the need for advanced analytics to generate actionable insights.
1 Quintero, D., L. Bolinches, A. G. Sutandyo, N. Joly, R. T. Katahira, 2016, “IBM data engine for hadoop and spark” IBM Redbooks, https://ibm.co/2kgrCoT2 Please refer to “Data quality imperatives for data migration initiatives: A guide for data practitioners” in this edition of the Journal.

61 /
3 For further discussion of automation trends in the financial services industry, see the Journal of Financial Transformation 46, https://bit.ly/2lKS0HM
One of the key enablers of growth for machine learning has been the availability of cloud-based infrastructure.
Figure 1 provides a brief summary of our recommended approach, and further explanation of concepts is provided throughout the article.
2. ASSESSING WHETHER MACHINE LEARNING IS SUITABLE FOR THE BUSINESS CASE
While machine learning is a powerful data analytics tool, machine learning projects can yield disappointing results without a well-considered business case. For a truly successful analytics project delivering insights with value, both data scientists and stakeholders need to speak the same language. This requires both sides to regularly communicate their understanding of the work and help each other understand their expectations of the project. It is important that business managers know that it is their responsibility to ask important business questions of their data scientists and that the data scientists know that they need to be able to answer these questions in ways that are understandable to the business. These questions are not related to the inner workings of every algorithm of interest, such as whether they will be using cosine
DATA ANALYTICS | MACHINE LEARNING FOR ADVANCED DATA ANALYTICS: CHALLENGES, USE-CASES AND BEST PRACTICES TO MAXIMIZE BUSINESS VALUE
or cartesian distance to determine which observation should belong to which cluster. The questions asked should refer to the nature of the results, and which tools are most appropriate. Later, we will discuss what some of these key questions are.
While it is tempting to think that machine learning can solve any business question, for many projects more traditional and less technically challenging analytical methods, such as statistical modeling and descriptive statistics, can provide a comparable level of insight. Some problems are not analytics problems at all, but rather automation problems that require process engineering and robotic process automation.3 By discussing the most appropriate techniques for the desired outcome, both data scientists and stakeholders can develop a clearer understanding of the expected timescales and outcomes for the work.
2.1 Does this problem require exploratory analysis or actionable insights to be derived?
Machine learning can be used to directly gain actionable insights, or to explore large datasets (exploratory data analysis). Exploratory analysis is often used as an initial step in order to search for trends and patterns that could lead to
Figure 1: Our data commercialization framework
Is the data well understood?
Is there a specific insight being sought?
What kind of question is being asked?
To which group does this belong?
e.g., clustering
Exploratory data analysis e.g.,
unsupervised learning
Supervised e.g., classification
Unsupervised e.g., clustering
Yes or no?
Supervised learning e.g., binary classification
What should be recommended?
Collaborative filtering, e.g., based on artificial
neural networks
How much?
Supervised learning e.g., regression
Do you have labeled data?
How can this process be optimized?
Various e.g., reinforcement
learning
No
Yes
Continuing process

62 /
actionable insights. This approach is, therefore, the solution to the problem that discovering actionable insights requires prior knowledge of what to search for. The discussion of which approach will be taken is one of the most important conversations that any stakeholder can have with their data science team, and as a result, can be the biggest source of misaligned expectations between the two groups if it is not had at, or before, the onset of a data science project.
2.2 What is the nature of the insight being sought?
Two fundamentally different learning approaches, supervised learning (SL) and unsupervised learning (UL), suit different datasets. Here, we discuss them in relation to the insight being sought. SL algorithms require labels to be included with the dataset; these labels are simply the true values that the algorithm learns to reproduce. An example of supervised learning is a basic fraud detection model that takes in data relating to the transaction and returns a prediction of whether this transaction is fraudulent or not. This input data, termed the ‘features’, might be the date, time, location, and amount relating to the transaction. Developing this SL fraud detection model begins with building a dataset to train the model; this involves taking historical examples of both fraudulent and genuine transactions and storing their features in a dataset. An additional column is included with this dataset that describes whether each particular example relates to a fraudulent transaction or not; these are termed our ‘labels’ and this is the key ingredient that differentiates SL from UL. The model is then taught to detect future fraudulent transactions; this is performed by repeatedly feeding the model with rows of data relating to a particular transaction, from which the model seeks to reproduce the transaction’s label values, that is ‘fraudulent’ or ‘genuine’, given the input data consisting of such data as location and date. With every new transaction the machine learning algorithm receives, the model’s ability to reproduce this label’s value improves. This training is performed in such a way that the model is general and avoids overfitting to the training data, thereby avoiding making spurious predictions of future events.
UL, on the other hand, does not require labeled outputs or inputs. At the simplest level, UL seeks to characterize data by considering their relationship to one another, a common example being clustering data by partitioning and associating datapoints into groups with similar properties. As a simple example, let us consider a dataset containing information about a bowl of fruit including features such as color, weight, size/dimensions, and time to ripen. We may apply a clustering algorithm to this dataset that contains no
fruit name information (i.e., missing labels such as ‘apple’ and ‘banana’). A successful clustering run will group the fruits by their features. It is likely that the algorithm will have implicitly learned to group the data such that each cluster contains a high proportion of a particular fruit. Since this is an unsupervised learning approach, however, the algorithm achieves this without knowledge of the labels (i.e., names) of each particular fruit; these labels are therefore implied by the final clusters.
There is an element of human intervention and decision making required when adopting an SL method; this is due to the selection and categorization of data for training typically being performed manually, and the requirement to tag unlabeled data with labels. In UL, however, there is less human intervention as the algorithm learns from data that is not labeled; the preparation of training datasets forms the most time-consuming step. This is also the stage at which errors and biases are most likely to be introduced.
2.3 What is the necessary level of certainty?
At first sight, it may be expected that all analyses should be performed to the highest level of accuracy. This, however, is not the case, with the difficulty lying in the balance of cost and outcome value. Specific criteria for meeting an outcome should be directly related to the original business problem being solved. Stakeholders and data scientists should fully commit to regularly assessing results and findings in order to determine whether these meet the success criteria, and decide whether conducting further work is necessary. Alternatively, the business may be at a stage where it can confidently take a decision based on the basis of the current insights gained.
3. CHOOSING A MACHINE LEARNING APPROACH ACCORDING TO THE BUSINESS QUESTION BEING ASKED
In many cases, it is constructive to rephrase the question asked to enable actionable insights to be obtained more efficiently without impacting the overall business objective. For instance, if the objective is to detect risky investments, asking the question “how risky is this investment?” is a complex question that requires the risk to be measured and quantified. Reframing this question as “is this a risky investment?” allows the question to be answered more easily (since this requires a yes/no-type answer), while likely meeting the same business objective. Questions can be considered equivalent if the business outcome remains unchanged and the number of assumptions made does not increase. Changing the question asked should always be driven by the computational complexity
DATA ANALYTICS | MACHINE LEARNING FOR ADVANCED DATA ANALYTICS: CHALLENGES, USE-CASES AND BEST PRACTICES TO MAXIMIZE BUSINESS VALUE

63 /
in answering different types of questions, rather than asking questions based on the types of data that are easily available. Each of the types of questions mentioned can be answered by different types of SL algorithms and may require differing amounts of training data. Machine learning is very well suited to answering five general types of questions (Table 1).
3.1 Yes or no? – classification
Decision tree-based algorithms are used as the basis for many classification and regression problems. The generalized classification and regression tree (CART) is the catch-all term used to describe the general use of decision trees for such problems. These methods typically have the benefit of allowing for the importance of a variable to be measured and the decision tree to be visually charted, making decisions explainable. This explainability of machine learning models is of key importance to the data science team for solving business challenges, as it allows the machine learning model to be easily understood from a non-technical perspective. Machine learning models that can be intuitively explained are key to ensuring that data science teams and stakeholders can work in parallel, rather than diverging. The implications of explainability in machine learning are discussed further below.
3.1.1 EXAMPLE: CLASSIFICATION IN FINANCIAL SERVICES: MONEY LAUNDERING DETECTION
Money laundering is a global problem that provides the means for criminals to conceal their illegal financial profits. While reducing and eliminating money laundering is a key focus for many governments, it remains a difficult task that is often approached by assessing the prior transactional
histories of individuals. Typically, however, money laundering is not an individual matter but rather involves groups of people working together as a collective. Savage et al. (2017)4 recently proposed an SL approach to this problem. This approach uses a combination of network analysis (i.e., analysis of the groups of people and their accounts that are potentially involved in money laundering activities) alongside a classification algorithm. The evaluation of this combined approach indicated that the method is able to correctly detect suspicious activity with a low rate of false positives. This method is, therefore, shown to have high potential for deployment in a real-world environment.
3.2 How much? – regression
Regression, on the other hand, predicts a numerical value. The simplest type of regression is linear regression, which seeks to relate two variables by using the value of one variable to predict the value of the other variable. An example of a simple linear regression might be predicting the salary of an employee based on his/her age. In this type of regression, training data would include historical data containing values of both variables. Although regression can be performed with relatively little data, the quality of the output will generally increase with the amount of training data available. It is best practice to use regression when large training datasets are available. A problem with multiple known variables is called a multivariate regression problem, and a regression problem where input variables are ordered by time and a future prediction is sought is a time series forecasting problem. It is possible when analysis is begun that it is not clear which variables contribute to changes in the value being predicted.
Table 1: Summary of the types of business questions and machine learning approaches that can be used to answer those questions
TYPE OF QUESTION EXAMPLE EXAMPLE MACHINE LEARNING APPROACH
DATA REQUIRED
YES OR NO? Should this customer be granted a loan of £5000?
Supervised classification Labeled data
HOW MUCH…? What will the stock price of Apple be in 2025? Supervised regression Large amounts of labeled data
TO WHICH GROUP DOES THIS BELONG?
Is this transaction normal or potentially fraudulent?
Unsupervised clustering Large amounts of unlabeled data
WHAT SHOULD BE RECOMMENDED?
What type of investment portfolio should I recommend to this customer?
Unsupervised collaborative filtering Large amounts of user preference data
HOW CAN THIS BE OPTIMIZED?
How can the investment in marketing be optimized for maximum ROI?
Reinforcement learningSmall amounts of unlabeled data but a strong data science team and large amounts of computational power are required
4 Savage, D., Q. Wang, P. Chou, X. J. Zhang, and X. Yu, 2016, “Detection of money laundering groups: supervised learning on small networks,” The AAAI-17 Workshop on AI and Operations Research for Social Good, WS-17-01, https://bit.ly/2kIDDUf
DATA ANALYTICS | MACHINE LEARNING FOR ADVANCED DATA ANALYTICS: CHALLENGES, USE-CASES AND BEST PRACTICES TO MAXIMIZE BUSINESS VALUE
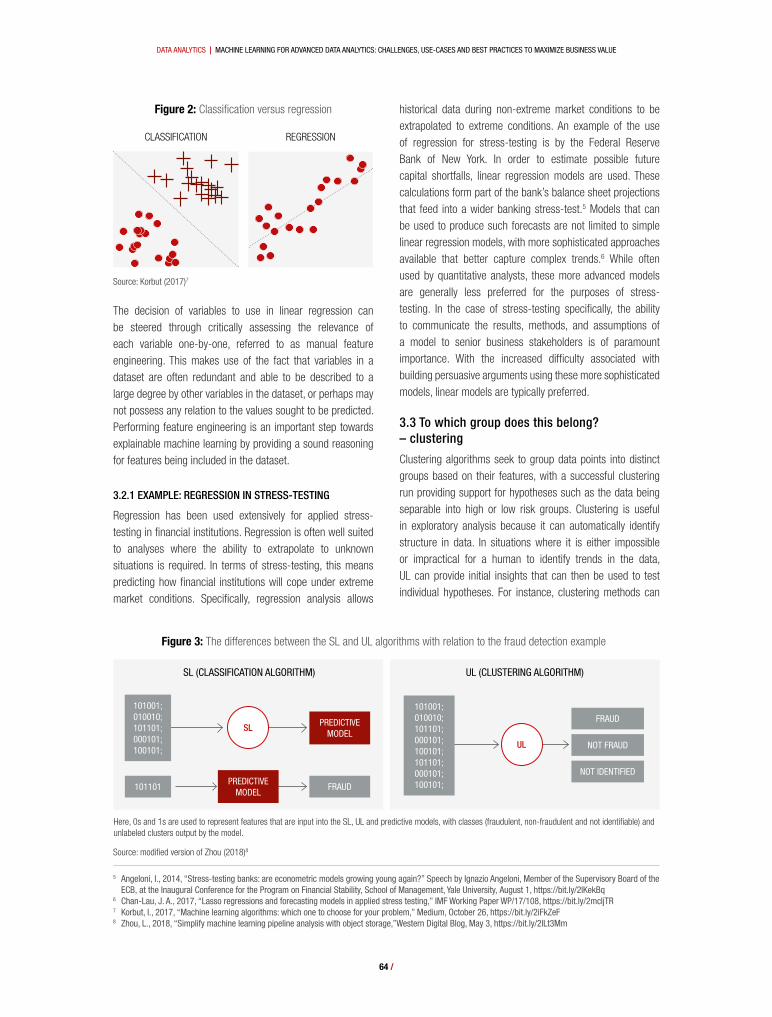
64 /
The decision of variables to use in linear regression can be steered through critically assessing the relevance of each variable one-by-one, referred to as manual feature engineering. This makes use of the fact that variables in a dataset are often redundant and able to be described to a large degree by other variables in the dataset, or perhaps may not possess any relation to the values sought to be predicted. Performing feature engineering is an important step towards explainable machine learning by providing a sound reasoning for features being included in the dataset.
3.2.1 EXAMPLE: REGRESSION IN STRESS-TESTING
Regression has been used extensively for applied stress-testing in financial institutions. Regression is often well suited to analyses where the ability to extrapolate to unknown situations is required. In terms of stress-testing, this means predicting how financial institutions will cope under extreme market conditions. Specifically, regression analysis allows
historical data during non-extreme market conditions to be extrapolated to extreme conditions. An example of the use of regression for stress-testing is by the Federal Reserve Bank of New York. In order to estimate possible future capital shortfalls, linear regression models are used. These calculations form part of the bank’s balance sheet projections that feed into a wider banking stress-test.5 Models that can be used to produce such forecasts are not limited to simple linear regression models, with more sophisticated approaches available that better capture complex trends.6 While often used by quantitative analysts, these more advanced models are generally less preferred for the purposes of stress-testing. In the case of stress-testing specifically, the ability to communicate the results, methods, and assumptions of a model to senior business stakeholders is of paramount importance. With the increased difficulty associated with building persuasive arguments using these more sophisticated models, linear models are typically preferred.
3.3 To which group does this belong? – clustering
Clustering algorithms seek to group data points into distinct groups based on their features, with a successful clustering run providing support for hypotheses such as the data being separable into high or low risk groups. Clustering is useful in exploratory analysis because it can automatically identify structure in data. In situations where it is either impossible or impractical for a human to identify trends in the data, UL can provide initial insights that can then be used to test individual hypotheses. For instance, clustering methods can
Figure 2: Classification versus regression
Source: Korbut (2017)7
CLASSIFICATION REGRESSION
5 Angeloni, I., 2014, “Stress-testing banks: are econometric models growing young again?” Speech by Ignazio Angeloni, Member of the Supervisory Board of the ECB, at the Inaugural Conference for the Program on Financial Stability, School of Management, Yale University, August 1, https://bit.ly/2lKekBq
6 Chan-Lau, J. A., 2017, “Lasso regressions and forecasting models in applied stress testing,” IMF Working Paper WP/17/108, https://bit.ly/2mcljTR7 Korbut, I., 2017, “Machine learning algorithms: which one to choose for your problem,” Medium, October 26, https://bit.ly/2iFkZeF8 Zhou, L., 2018, “Simplify machine learning pipeline analysis with object storage,”Western Digital Blog, May 3, https://bit.ly/2lLt3Mm
Figure 3: The differences between the SL and UL algorithms with relation to the fraud detection example
Source: modified version of Zhou (2018)8
SL (CLASSIFICATION ALGORITHM) UL (CLUSTERING ALGORITHM)
101001; 010010; 101101; 000101; 100101;
101101 FRAUD
PREDICTIVE MODEL
101001; 010010; 101101; 000101; 100101; 101101; 000101; 100101;
UL
PREDICTIVE MODEL
SL
Here, 0s and 1s are used to represent features that are input into the SL, UL and predictive models, with classes (fraudulent, non-fraudulent and not identifiable) and unlabeled clusters output by the model.
FRAUD
NOT FRAUD
NOT IDENTIFIED
DATA ANALYTICS | MACHINE LEARNING FOR ADVANCED DATA ANALYTICS: CHALLENGES, USE-CASES AND BEST PRACTICES TO MAXIMIZE BUSINESS VALUE

65 /
be straightforwardly applied to group customers into sets, which can often be an insightful start for further analysis.
3.3.1 EXAMPLE: CLUSTERING IN FRAUD DETECTION
Clustering is an effective technique for anomaly detection. In financial services, this is useful in anti-money laundering to identify unusual or fraudulent transactions. An example of this is Citibank, who have entered into a strategic partnership with Feedzai,9 a machine learning solutions business, to provide real time fraud risk management using machine learning. Feedzai’s solution10 transforms data streams to create risk profiles for fraud detection, using machine learning to process client transactions automatically. Feedzai is able to do this in millisecond timescales, providing Citibank with a highly rapid and powerful fraud detection product.
3.4 What should be recommended? – collaborative filtering
Recommendation engines are all around us in the form of Amazon telling us what we might be interested in buying, through to Facebook finding people we may know. Recommendation engines have been slow to take off in the financial services sector but have the potential to change the way that portfolios are optimized and how products are cross-sold. We will look at collaborative filtering, which is the most common machine learning method underlying recommendation engines. The name is derived from the idea that the data from many similar users can collaborate to recommend products to a customer in the way that friends would collaborate and recommend purchases to one another in the real world. Two algorithms that can be used for collaborative filtering are ‘nearest neighbors’ and ‘matrix factorization’.
The ‘nearest neighbors’ technique is a type of classification algorithm used in collaborative filtering that uses historical data of users’ ratings for products as training data for predictions about which other products specific users are likely to buy. This data can use either implicit or explicit ratings of products. Implicit ratings are ones where the user has given a numeric rating to a product and explicit ratings are inferred from things like page views or purchases and returns. This type of algorithm finds a user’s “nearest neighbors” in terms of taste, based on ratings and recommends products that those customers have bought. One of the biggest problems with
nearest neighbors in collaborative filtering is that data may be very sparse because users have not rated enough products, or a product has not been rated by enough users. For this reason, it is best practice to use this method if you have large amounts of user data.
Unlike nearest neighbors, matrix factorization creates latent features that are not present in the historical data but are created from underlying patterns in this data. For example, a youth account and an educational loan may all have a “relating to children” feature. Although the algorithm does not know what the feature represents because it has no human knowledge, it knows that such a feature exists and relates specific products to one another. This means that products can be recommended based on users’ historical data even if they have not rated the same products. It upgrades the recommendation engine from “people who bought this product also bought another product” to “people who buy these types of products also buy another type of product”. This type of algorithm typically needs less user data to get started than nearest neighbors.
3.4.1 EXAMPLE: COLLABORATIVE FILTERING IN PRIVATE BANKING
InCube is a company that is developing bespoke recommender engines for private banks. These engines use several AI techniques, including collaborative filtering, to recommend products for clients to add to their existing portfolios. One aspect that makes these recommendations successful is that before any AI algorithms are utilized, business rules are applied to ensure that regulatory requirements are met and that conditions which are obvious to humans but are not necessarily taken into account by algorithms are met. For instance, a product will not be recommended to a client if that product is already part of their portfolio.
3.5 How can this be optimized? – reinforcement learning
Reinforcement learning (RL) is the third basic machine learning paradigm, alongside SL and UL, and is best suited to problems that involve many complex variables and is based on a method of trial-and-improvement, iteratively testing, and refining models to give the ‘best’ outcome. This final ‘best’ solution can be highly varied in form. Possibilities for these types of machine learning applications include finding
9 Feedzai, 2018, “Citi partners with Feedzai to provide machine learning payment solutions,” press release, December 19, https://bit.ly/2lNlogv10 Feedzai.com
DATA ANALYTICS | MACHINE LEARNING FOR ADVANCED DATA ANALYTICS: CHALLENGES, USE-CASES AND BEST PRACTICES TO MAXIMIZE BUSINESS VALUE
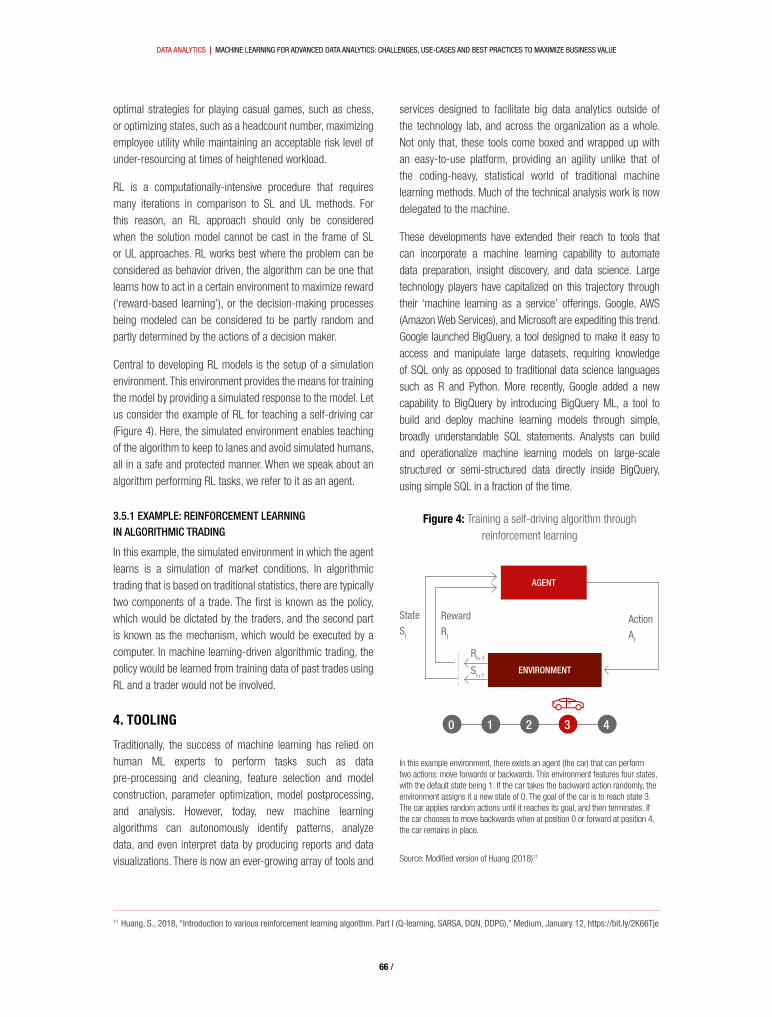
66 /
optimal strategies for playing casual games, such as chess, or optimizing states, such as a headcount number, maximizing employee utility while maintaining an acceptable risk level of under-resourcing at times of heightened workload.
RL is a computationally-intensive procedure that requires many iterations in comparison to SL and UL methods. For this reason, an RL approach should only be considered when the solution model cannot be cast in the frame of SL or UL approaches. RL works best where the problem can be considered as behavior driven, the algorithm can be one that learns how to act in a certain environment to maximize reward (‘reward-based learning’), or the decision-making processes being modeled can be considered to be partly random and partly determined by the actions of a decision maker.
Central to developing RL models is the setup of a simulation environment. This environment provides the means for training the model by providing a simulated response to the model. Let us consider the example of RL for teaching a self-driving car (Figure 4). Here, the simulated environment enables teaching of the algorithm to keep to lanes and avoid simulated humans, all in a safe and protected manner. When we speak about an algorithm performing RL tasks, we refer to it as an agent.
3.5.1 EXAMPLE: REINFORCEMENT LEARNING IN ALGORITHMIC TRADING
In this example, the simulated environment in which the agent learns is a simulation of market conditions. In algorithmic trading that is based on traditional statistics, there are typically two components of a trade. The first is known as the policy, which would be dictated by the traders, and the second part is known as the mechanism, which would be executed by a computer. In machine learning-driven algorithmic trading, the policy would be learned from training data of past trades using RL and a trader would not be involved.
4. TOOLING
Traditionally, the success of machine learning has relied on human ML experts to perform tasks such as data pre-processing and cleaning, feature selection and model construction, parameter optimization, model postprocessing, and analysis. However, today, new machine learning algorithms can autonomously identify patterns, analyze data, and even interpret data by producing reports and data visualizations. There is now an ever-growing array of tools and
services designed to facilitate big data analytics outside of the technology lab, and across the organization as a whole. Not only that, these tools come boxed and wrapped up with an easy-to-use platform, providing an agility unlike that of the coding-heavy, statistical world of traditional machine learning methods. Much of the technical analysis work is now delegated to the machine.
These developments have extended their reach to tools that can incorporate a machine learning capability to automate data preparation, insight discovery, and data science. Large technology players have capitalized on this trajectory through their ‘machine learning as a service’ offerings. Google, AWS (Amazon Web Services), and Microsoft are expediting this trend. Google launched BigQuery, a tool designed to make it easy to access and manipulate large datasets, requiring knowledge of SQL only as opposed to traditional data science languages such as R and Python. More recently, Google added a new capability to BigQuery by introducing BigQuery ML, a tool to build and deploy machine learning models through simple, broadly understandable SQL statements. Analysts can build and operationalize machine learning models on large-scale structured or semi-structured data directly inside BigQuery, using simple SQL in a fraction of the time.
11 Huang, S., 2018, “Introduction to various reinforcement learning algorithm. Part I (Q-learning, SARSA, DQN, DDPG),” Medium, January 12, https://bit.ly/2K66Tje
In this example environment, there exists an agent (the car) that can perform two actions: move forwards or backwards. This environment features four states, with the default state being 1. If the car takes the backward action randomly, the environment assigns it a new state of 0. The goal of the car is to reach state 3. The car applies random actions until it reaches its goal, and then terminates. If the car chooses to move backwards when at position 0 or forward at position 4, the car remains in place.
Figure 4: Training a self-driving algorithm through reinforcement learning
ENVIRONMENT
Action
At
State
St
Reward
Rt
Rt+1
St+1
AGENT
0 1 2 3 4
Source: Modified version of Huang (2018)11
DATA ANALYTICS | MACHINE LEARNING FOR ADVANCED DATA ANALYTICS: CHALLENGES, USE-CASES AND BEST PRACTICES TO MAXIMIZE BUSINESS VALUE

67 /
AWS has launched SageMaker, a fully-managed platform that enables data scientists to quickly and easily build, train, and deploy machine learning models at scale. The solution removes barriers that typically slow down developers who want to use machine learning by promoting a visual-centric approach to model development that integrates with other Amazon tools. Similarly, Microsoft Azure ML Studio offers a cloud-based environment that can be accessed from the web browser and used to create machine learning-based models on any dataset. Following the general trend of accessible machine learning, Azure’s ML platform gives data scientists, without any prior machine learning experience, the ability to experiment with machine learning on datasets.
Other tools also exist to allow those who know the theory of deep learning but have no coding experience to create a deep learning model within minutes without a single line of code. Lobe (recently acquired by Microsoft) is an example of this. Lobe offers users a clean drag-and-drop interface for building deep learning algorithms from scratch, without having to know the ins and outs of machine learning libraries such as TensorFlow, Keras, or PyTorch.
4.1 Example: Financial services machine learning platform
A user-friendly machine learning platform being used in the financial services industry is Kensho, which is a company focused on the development of tailored machine learning-based early warning systems. On voting to leave the European Union in June 2016, traders with access to Kensho’s product had at their disposal powerful insights to their advantage.12 The platform provided access to research-quality machine learning-driven information, informing them that, historically, a populist vote such as Brexit tends to result in a long-term drop in local currency. Traders were then able to exploit this information and profit from changes in the currency rate. Early-warning models are not limited to trading and have uses for predicting credit risk and due-diligence in order to predict future bankruptcy risk in the supply chain.
12 Gara, A., 2017, “Kensho’s AI for investors just got valued at over $500 million in funding round From Wall Street,” Forbes, February 28, https://bit.ly/2lPGEm0
DATA ANALYTICS | MACHINE LEARNING FOR ADVANCED DATA ANALYTICS: CHALLENGES, USE-CASES AND BEST PRACTICES TO MAXIMIZE BUSINESS VALUE

68 /
5. ETHICAL CONSIDERATIONS
Machine learning has suddenly shifted from relative academic obscurity to being in common usage; however, this has not always led to good outcomes. In recent years, some well-designed machine learning projects have led to the unintended reputational damage of institutions. This is because their work has been considered “unethical” due to use of sensitive personal data or the automation of key personal decisions without the necessary level of human oversight. An example of this latter case is Microsoft’s twitter chatbot, Tay,13 released in 2016. Tay was designed to mimic speech patterns of a typical millennial, and was equipped with the ability to learn from the Twitter conversations she engaged in. This ability proved to be to Tay’s detriment, as it was soon observed making derogatory comments, in one tweet14 proclaiming “bush did 9/11 and Hitler would have done a better job than the monkey we have now. Donald trump is the only hope we’ve got.” [sic]
With advanced analytics techniques becoming a key competitive advantage in the digital age, many businesses must quickly learn to adapt to new ethical concerns. The best defense against ethical breaches is to ensure that all members of a machine learning project are aware of their responsibility to understand what is being done, and how to raise concerns. It is no longer acceptable for data scientists to behave like the naïve, impartial computers they instruct; it is imperative that they take time to consider the impacts of adding sensitive information to their models. Likewise, stakeholders and managers cannot treat their data science team as a black box that will return with an insight a few weeks after the initial project brief. They must take an active interest in what
data is being used, and how this could be viewed by an external audience. Ill-conceived machine learning projects are given little leeway in public discourse, and must, therefore, have clear ethical guidelines, because while key insights can help elevate a market leading business, they can also result in irreparable loss of trust.
These ethical concerns extend, not only to the models themselves but the data upon which they have been trained. A good example of a breach of consumer trust around data collection is the scandal surrounding the ‘Unroll.me’ application, which scans email inboxes to flag subscriptions from which users may wish to unsubscribe. It came to light that the application was gathering information from users’ inboxes and selling it to companies such as Uber, with the revelation resulting in public outcry. One approach to considering whether the way the data is used is ethical is to question whether customers are being empowered with greater choice, or disempowered by restricting choice. These choices can relate to customers’ power to decide whether they would like their data to be used or to the number of products and services to which the customer has access when their data is used.
It is important in projects which use machine learning to know who is responsible for decisions made by algorithms; this should be someone within the team with experience developing the model. These decisions should not be left to legal teams after development has taken place but rather be taken into consideration throughout the development lifecycle. In addition, the General Data Protection Regulation (GDPR) requires that organizations are able to provide an explanation of any decisions made using their data. We may not be able to fully explain complex models, for example artificial neural networks (a computational brain-like network of synapses which typically include hidden interconnected layers), but we can explain what data was included in building the model and how important each “feature” or variable is in the results that are generated. We can do this through feature attribution, which determines how much influence changing a particular variable has on changing the results generated by the model. Data scientists must be willing to take responsibility for the decisions that models they have trained make.
Using feature attribution and other explainable AI techniques to check models also allows human subject matter experts (SMEs) to pick up errors in logic that may have originated from anomalies within training data. A famous example of a ‘model gone wrong’
13 Price, R., 2016, “Microsoft is deleting its AI chatbot’s incredibly racist tweets,” Business Insider, March 24, https://bit.ly/2lJE1Cb 14 Hunt, E., 2016, “Tay, Microsoft’s AI chatbot, gets a crash course in racism from Twitter,” The Guardian, March 24, https://bit.ly/23B1uAG
One approach to considering if the way the data is used is ethical
is to question whether customers are being empowered with
greater choice, or disempowered by restricting choice.
DATA ANALYTICS | MACHINE LEARNING FOR ADVANCED DATA ANALYTICS: CHALLENGES, USE-CASES AND BEST PRACTICES TO MAXIMIZE BUSINESS VALUE

69 /
is the algorithm designed at the University of Pittsburgh to predict outcomes in pneumonia patients in the mid-1990s. The model correctly learned that, for the data on which it had been trained, people who also had asthma were less likely to die than other patients and so recommended that these asthmatic patients be sent home with antibiotics rather than admitted to hospital. However, the real underlying reason people with asthma were less likely to die in this particular dataset was because they were almost immediately placed in intensive care units where they received such a high level of care that they rarely have negative outcomes. Sending patients with asthma home with antibiotics could potentially have led to fatal outcomes for these patients.
6. CONCLUSION
Machine learning can be a powerful addition to any data analytics tool kit but requires careful planning and a high-level understanding of the techniques involved by all stakeholders. It is also important that data scientists and organizational stakeholders keep ethical considerations in mind. Table 2 summarizes the challenges that may be faced when implementing machine learning projects and best practices that can mitigate these challenges and harness the power of machine learning to generate value for the business.
DATA ANALYTICS | MACHINE LEARNING FOR ADVANCED DATA ANALYTICS: CHALLENGES, USE-CASES AND BEST PRACTICES TO MAXIMIZE BUSINESS VALUE
Table 2: Challenges and best practices in machine learning
CHALLENGES BEST PRACTICES
Misconceiving machine learning as a ‘black box’ that can be used to solve all problems with a one-size-fits-all approach
Set simple and concise objectives based on a single specific task or use-case
Machine learning may not be the correct solution to the problem, and it might be solved with simpler alternatives
Set clearly defined success criteria to monitor the performance of the model or system, for example, reduce full time equivalent
(FTE) by x% or reduce customer wait times by x amount
Cognitive systems improve over time and results and benefits may not be immediately realized
Manage stakeholders’ expectations by informing them of the limitations as well as abilities of predictive models and
automation systems
Defining processes for obtaining and maintaining high quality clean data
Educate staff that not all data is predictive, and that machine learning cannot be relied on to solve all problems
associated with operational inefficiency
Obtaining long-term stakeholder buy-in to gain the real benefits of these systems
Clearly define how the machine learning process works, what the inputs and outputs are, and how these integrate with the existing
processes and methodologies
Proof of concepts (PoCs) and production systems have very different build and deployment requirements; migration from a PoC to a production system is likely to require an entirely new
architecture and rebuild
PoCs and prototypes should be built to test and demonstrate functionality and win stakeholder buy-in before production
model build and deployment

70 /
OKIRIZA WIBISONO | Big Data Analyst, Bank Indonesia
HIDAYAH DHINI ARI | Head of Digital Data Statistics and Big Data Analytics Development Division, Bank Indonesia
ANGGRAINI WIDJANARTI | Big Data Analyst, Bank Indonesia
ALVIN ANDHIKA ZULEN | Big Data Analyst, Bank Indonesia
BRUNO TISSOT | Head of Statistics and Research Support, BIS, and Head of the IFC Secretariat1
combination of new, rapidly developing electronic footprints as well as large and growing financial, administrative, and commercial records.
This phenomenon has the potential to strengthen analysis for decision making, by providing more complete, immediate, and granular information as a complement to “traditional” macroeconomic indicators. To this end, a number of techniques are being developed, often referred to as “big data analytics” and “artificial intelligence” (AI). These promise faster, more holistic, and more connected insights, as compared with
ABSTRACTInformation and the internet technology have fostered new web-based services that affect every facet of today’s economic and financial activity. For their part, central banks face a surge in “financial big datasets”, reflecting the combination of new, rapidly developing electronic footprints as well as large and growing financial, administrative, and commercial records. This phenomenon has the potential to strengthen analysis for decision making, by providing more complete, immediate, and granular information as a complement to “traditional” macroeconomic indicators. To this end, a number of techniques are being developed, often referred to as “big data analytics” and “artificial intelligence”. However, getting the most out of these new developments is no trivial task. Central banks, like other public authorities, face numerous challenges, especially in handling these new data and using them for policy purposes. This paper covers three main topics discussing these issues: the main big data sources and associated analytical techniques that are relevant for central banks, the type of insights that can be provided by big data, and how big data is actually used in crafting policy.
USING BIG DATA ANALYTICS AND ARTIFICIAL INTELLIGENCE: A CENTRAL
BANKING PERSPECTIVE
1. INTRODUCTION
Information and the internet technology have fostered new web-based services that affect every facet of today’s economic and financial activity. This creates enormous quantities of “big data” – defined as “the massive volume of data that is generated by the increasing use of digital tools and information systems.” [FSB (2017)]. Such data are produced in real time, in differing formats, and by a wide range of institutions and individuals. For their part, central banks face a surge in “financial big datasets,” reflecting the
1 The views expressed here are those of the authors and do not necessarily reflect those of Bank Indonesia, the Bank for International Settlements (BIS), or the Irving Fisher Committee on Central Bank Statistics (IFC). This article draws on the various presentations made on the occasion of the workshop on “Big data for central bank policies” and the high-level policy-oriented seminar on “Building pathways for policymaking with big data” organized by Bank Indonesia with support from the BIS and the IFC in July 2018 at Bali, Indonesia. The proceedings were published in the IFC Bulletin series [IFC (2019)].
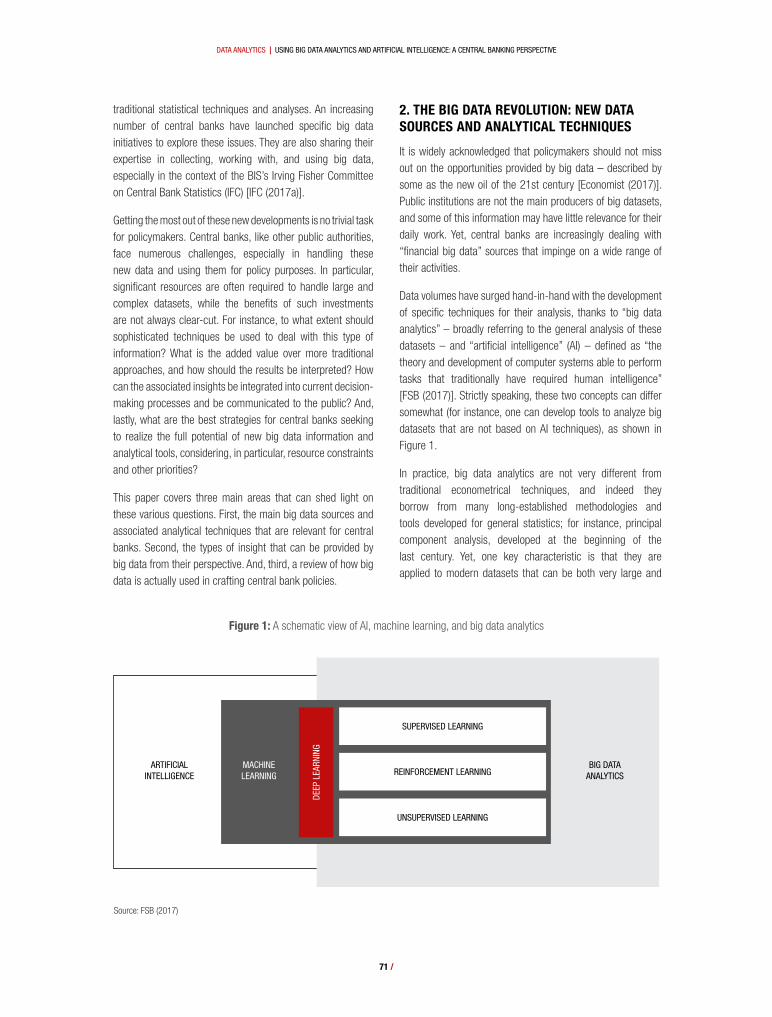
71 /
traditional statistical techniques and analyses. An increasing number of central banks have launched specific big data initiatives to explore these issues. They are also sharing their expertise in collecting, working with, and using big data, especially in the context of the BIS’s Irving Fisher Committee on Central Bank Statistics (IFC) [IFC (2017a)].
Getting the most out of these new developments is no trivial task for policymakers. Central banks, like other public authorities, face numerous challenges, especially in handling these new data and using them for policy purposes. In particular, significant resources are often required to handle large and complex datasets, while the benefits of such investments are not always clear-cut. For instance, to what extent should sophisticated techniques be used to deal with this type of information? What is the added value over more traditional approaches, and how should the results be interpreted? How can the associated insights be integrated into current decision-making processes and be communicated to the public? And, lastly, what are the best strategies for central banks seeking to realize the full potential of new big data information and analytical tools, considering, in particular, resource constraints and other priorities?
This paper covers three main areas that can shed light on these various questions. First, the main big data sources and associated analytical techniques that are relevant for central banks. Second, the types of insight that can be provided by big data from their perspective. And, third, a review of how big data is actually used in crafting central bank policies.
DATA ANALYTICS | USING BIG DATA ANALYTICS AND ARTIFICIAL INTELLIGENCE: A CENTRAL BANKING PERSPECTIVE
2. THE BIG DATA REVOLUTION: NEW DATA SOURCES AND ANALYTICAL TECHNIQUES
It is widely acknowledged that policymakers should not miss out on the opportunities provided by big data – described by some as the new oil of the 21st century [Economist (2017)]. Public institutions are not the main producers of big datasets, and some of this information may have little relevance for their daily work. Yet, central banks are increasingly dealing with “financial big data” sources that impinge on a wide range of their activities.
Data volumes have surged hand-in-hand with the development of specific techniques for their analysis, thanks to “big data analytics” – broadly referring to the general analysis of these datasets – and “artificial intelligence” (AI) – defined as “the theory and development of computer systems able to perform tasks that traditionally have required human intelligence” [FSB (2017)]. Strictly speaking, these two concepts can differ somewhat (for instance, one can develop tools to analyze big datasets that are not based on AI techniques), as shown in Figure 1.
In practice, big data analytics are not very different from traditional econometrical techniques, and indeed they borrow from many long-established methodologies and tools developed for general statistics; for instance, principal component analysis, developed at the beginning of the last century. Yet, one key characteristic is that they are applied to modern datasets that can be both very large and
Figure 1: A schematic view of AI, machine learning, and big data analytics
Source: FSB (2017)
SUPERVISED LEARNING
REINFORCEMENT LEARNING
UNSUPERVISED LEARNING
DEEP
LEA
RNIN
G
MACHINE LEARNING
ARTIFICIAL INTELLIGENCE
BIG DATA ANALYTICS

72 /
complex. Extracting relevant information from these sources is not straightforward, often requiring a distinct set of skills, depending on the type of information involved. As a result, big data analytics and AI techniques comprise a variety of statistical/modeling approaches, such as machine learning, text-mining techniques, network analysis, agent-based modeling,2 etc.
The experience accumulated in recent years underlines that, indeed, there are specific big data sources of relevance to central banks. It also shows that a number of techniques developed for analyzing big data can play a useful role.
2.1 Big data information for central banks
Three main sources of big data are commonly identified.3 These categories are related to (i) social networks (human-sourced information, such as blogs and searches); (ii) traditional business systems (process-mediated data, such as files produced by commercial transactions, e-commerce, credit card operations); and (iii) the internet of things (machine-generated data, such as information produced by pollution/traffic sensors, mobile phones, computer logs, etc). These are very generic categories, and, in practice, big data will comprise multiple types of heterogeneous datasets derived from these three main sources.
with regards to unstructured data, such as images. Even so, several projects are under way to make use of data collected on the internet to support monetary and financial policymaking. Moreover, an important aspect relates to the increased access to digitalized information, reflecting both the fact that more and more textual information is becoming available on the web (e.g., social media) and also that “traditional” printed documents can now be easily digitalized, searched, and analyzed in much the same way as web-based indicators.
In reality, however, the bulk of the financial big datasets relevant to central banks consists of the very granular information provided by large and growing records covering commercial transactions, financial market developments, and administrative operations. This type of information has been spurred by the expansion of the micro-level datasets collected in the aftermath of the Great Financial Crisis (GFC) of 2007–09, especially in the context of the Data Gaps Initiative (DGI) endorsed by the G20 [FSB-IMF (2009)]. For instance, significant efforts have been made globally to compile large and granular loan-by-loan and security-by-security databases, as well as records of individual derivatives trades [IFC (2018)]. There has also been an increasing attempt by central banks to make a greater use of granular information covering firms’ individual financial statements [IFC (2017b)]. As a result of these various initiatives, central banks now have at their disposal very detailed information on the financial system, including at the level of specific institutions, transactions, or instruments.
2.2 Extracting knowledge from large quantitative datasets: Classification and clustering
The expansion of big data sources has gone hand-in-hand with the development of new analytical tools to deal with them. The first, and particularly important, category of these big data techniques aims at extracting summary information from large quantitative datasets. This is an area that is relatively close to “traditional statistics”, as it does not involve the treatment of unstructured information (e.g., text, images). In fact, many big datasets are well structured, and can be appropriately dealt with using statistical algorithms developed for numerical datasets. The main goal is to obtain summary indicators by condensing the large amount of data points available, basically by finding similarities between them (through classification) and regrouping them (through clustering).
Focusing more specifically on central banks, four types of datasets would usually be described as financial big data (see Figure 2): internet-based indicators, commercial datasets, financial market indicators, and administrative records.4
Compared with the private sector,5 central banks’ use of web-based indicators may be somewhat more limited, especially
2 See Haldane (2018), who argues that big data can facilitate policymakers’ understanding of economic agents’ reactions through the exploration of behaviors in a “virtual economy”.
3 Following the work conducted under the aegis of the United Nations [see Meeting of the Expert Group on International Statistical Classifications (2015)].4 For the use of administrative data sources for official statistics, see for instance Bean (2016) in the U.K. context.5 Especially the major U.S. technology companies (GAFAs): Google, Apple, Facebook, and Amazon.
WEB-BASED INDICATORS
ADMINISTRATIVE RECORDS
COMMERCIAL DATASETS
FINANCIAL MARKET DATA
BIG DATA
Figure 2: Four main types of financial big dataset
DATA ANALYTICS | USING BIG DATA ANALYTICS AND ARTIFICIAL INTELLIGENCE: A CENTRAL BANKING PERSPECTIVE

73 /
Many of these techniques involve so-called “machine learning”. This is a subset of AI techniques, which can be defined as “a method of designing a sequence of actions to solve a problem that optimize automatically through experience and with limited or no human intervention” [FSB (2017)]. This approach is quite close to conventional econometrics, albeit with three distinct features. First, machine learning is typically focused on prediction rather than identifying a causal relationship. Second, the aim is to choose an algorithm that fits with the actual data observed, rather than with a theoretical model. Third, and linked to the previous point, the techniques are selected by looking at their goodness-to-fit, and less at the more traditional statistical tests used in econometrics.
There are several categories of machine learning, which can be split into two main groups. First, in “supervised machine learning”, “an algorithm is fed a set of ‘training’ data that contain labels on the observations” [FSB (2017)]. The goal is to classify individual data points, by identifying, among several classes (i.e., categories of observations), the one to which a new observation belongs. This is inferred from the analysis of a sample of past observations, i.e., the training dataset, for which their group (category) is known. The objective of the algorithm is to predict the category of a new observation, depending on its characteristics. For instance, to predict the approval of a new loan (“yes” or “no”, depending on its features as compared to an observed historical dataset of loans that have been approved or rejected); or whether a firm is likely to default in a few months. Various algorithms can be implemented for this purpose, including logistic regression techniques, linear discriminant analysis, Naïve Bayes classifier, support vector machines, k-nearest neighbors, decision trees, random forest, etc.
The second group is “unsupervised machine learning”, for which “the data provided to the algorithm do not contain labels” [FSB (2017)]. This means that categories have not been identified ex-ante for a specific set of observations, so that the algorithm has to identify the clusters, regrouping observations for which it detects similar characteristics or “patterns”. Two prominent examples are clustering and dimensionality reduction algorithms. In “clustering”, the aim is to detect the underlying groups that exist in the granular dataset – for example, to identify groups of customers or firms that have similar characteristics – by putting the most similar observations in the same cluster in an agglomerative
way (bottom-up approach).6 “Dimensionality reduction” relates to the rearrangement of the original information in a smaller number of pockets, in a divisive (top-down) way; the objective is that the number of independent variables becomes (significantly) smaller, without too much compromise in terms of information loss.
There are, of course, additional types of algorithms. One is “reinforcement learning”, which complements unsupervised learning with additional information feedback; for instance, through human intervention. Another is “deep learning” (or artificial neural networks), based on data representations inspired by the function of neurons in the brain. Recent evaluations suggest that deep learning can perform better than traditional classification algorithms when dealing with unstructured data, such as texts and images – one reason being that applying traditional quantitative algorithms is problematic, as it requires unstructured information to be converted into a numerical format. In contrast, deep learning techniques can be used to deal directly with the original raw data.
In view of this diversity, the choice of a specific algorithm will depend on the assumptions made regarding the features of the dataset of interest – for instance, a Naïve Bayes classifier would be appropriate when the variables are assumed to be independent and follow a Gaussian distribution. In practice, data scientists will have to identify which algorithm works best for the problem at hand, often requiring a rigorous and repetitive process of trial and error; this is often as much art as it is science.
In choosing the right “model”, it is important to define an evaluation metric. The aim is to measure how well a specific algorithm fits, and to compare the performance of alternative algorithms. The most straightforward metric for classification is “prediction accuracy”, which is simply the percentage of observations for which the algorithm predicts the class variable correctly (this will usually be done by comparing the result of the algorithm with what a human evaluator would conclude on a specific data sample). But an accuracy metric may not be suitable for all exercises, particularly in the case of an unbalanced distribution of classes. For example, when looking at whether a transaction is legitimate or fraudulent, a very simplistic model could be adopted that assumes that all transactions are legitimate: its accuracy will look very high,
DATA ANALYTICS | USING BIG DATA ANALYTICS AND ARTIFICIAL INTELLIGENCE: A CENTRAL BANKING PERSPECTIVE
6 More precisely, cluster analysis can be defined as “a statistical technique whereby data or objects are classified into groups (clusters) that are similar to one another but different from data or objects in other clusters.” [FSB (2017)].

74 /
because a priori most transactions are not fraudulent; but the usefulness of such a simple model would be quite limited. Hence, other metrics have to be found for evaluating algorithms when the distribution of classes is highly unbalanced.7 Another possible approach is to address the class imbalance issue at the observation level; for instance, by duplicating (over-sampling) elements from the minority class or, conversely, by discarding those (under-sampling) from the dominant class.
2.3 Text mining
Another rapidly developing area of big data analytics is text-mining, i.e., analysis of semantic information – through the automated analysis of large quantities of natural language text and the detection of lexical or linguistic patterns with the aim of extracting useful insights. While most empirical work in economics deals with numerical indicators, such as prices or sales data, a large and increasing amount of textual information is also generated by economic and financial activities – including internet-based activities (e.g., social media posts),
but also the wider range of textual information provided by, say, company financial reports, media articles, public authorities’ deliberations, etc. Analyzing this unstructured information has become of key interest to policymakers, not least in view of the important role played by “soft” indicators such as confidence and expectations during the GFC. And, indeed, text-mining techniques can usefully be applied to dealing with these data in a structured, quantitative way.
Text analysis typically starts with some standard “pre-processing steps”, such as tokenization (splitting text into words), stopword removal (discarding very frequent/non-topical words, e.g., “a”, “the”, “to”), stemming or lemmatizing (converting words into their root forms, for instance, “prediction” and “predicted” into “predict”), and merging words within a common message (e.g., “Bank” and “Indonesia” grouped into “Bank Indonesia”). Once this is done, the initial document can be transformed into a document-term matrix, which indicates for each specific text a term’s
Source: Hansen (2019)
Figure 3: Topic distributions obtained from text-mining techniques8
1
.08
.06
.04
.02
0
200
150
100
501987m7 1991m7 1995m7
FOMC MEETING DATE
FRAC
TION
OF
FOM
C 1
& 2
BBD
1999m7 2003m7 2007m7
1
.08
.06
.04
.02
0
200
150
100
50FOMC MEETING DATE
FRAC
TION
OF
FOM
C 1
& 2
BBD
BBD BBDTopic 35 Topic 12
7 Such other metrics include, for instance, precision, recall, and F1-score. For binary (two-class) classification, precision is defined as the percentage of times an algorithm makes a correct prediction for the positive class; recall is defined as the percentage of positive class that the algorithm discovers from a given dataset; and the F1-score is the harmonic average of precision and recall.
8 Distributions obtained from LDA (black, solid line) and EPU dictionary-based index (BBD; red, dashed line). The word-clouds represent word distributions within each topic, with more frequent words shown in larger fonts.
1987m7 1991m7 1995m7 1999m7 2003m7 2007m7
DATA ANALYTICS | USING BIG DATA ANALYTICS AND ARTIFICIAL INTELLIGENCE: A CENTRAL BANKING PERSPECTIVE

75 /
degree of appearance (or non-appearance). This vectoral text representation is made of numerical values that can then be analyzed by quantitative algorithms; for example, to measure the degree of similarity between documents by comparing the related matrixes (Figure 3).
One popular algorithm for working on textual information is the “Latent Dirichlet Allocation” (LDA) [Blei et al. (2003)]. This assumes that documents are distributed by topics, which in turn are distributed by keywords. For example, one document may combine, for a respective 20% and 80%, a “monetary” and an “employment” topic, based on the number of words reflecting this topic distribution (i.e., 20% of them related to words such as “inflation” or “interest rate”, and the remaining 80% related to words such as “jobs” and “labor”). Based on these calculations, one can build an indicator measuring how frequently a specific topic appears over time, for instance, to gauge the frequency of the messages related to “recession” – providing useful insights when monitoring the state of the economy.
Besides quantitative algorithms, simpler “dictionary-based methods” can be also employed for analyzing text data. A set of keywords can be selected that are relevant to the topic of interest – for example, a keyword related to “business confidence”. Then an index can be constructed based on how frequently these selected keywords appear in a given document, allowing the subject indicator to be assessed (e.g., the evolution of business sentiment) [Tetlock (2007) and Loughran and McDonald (2011)]. A prominent example is the “economic policy uncertainty” (EPU), which quantifies the degree of uncertainty based on the appearance of a set of economic-, policy-, and uncertainty-related keywords in news articles; by the end of 2018, more than 20 country-specific EPU indexes had been compiled [see Baker et al. (2016) and www.policyuncertainty.com/].
2.4 Network analysis
A third important area of big data analytics refers to financial network analysis, which can be seen as the analysis of the relationships between the elements constituting the financial system. Insights into the functioning of this “network” are derived from graphical techniques and representations. This approach can be used to measure how data is connected to other data, clarify how these connections matter, and show how complex systems move in time. It can be particularly effective for big datasets, allowing for the description of complex systems characterized by rich interactions between their components.
The main “modes of analysis” comprise top-down approaches (e.g., analysis of system-wide risk), bottom-up analyses (e.g., analysis of connections between specific nodes of the system), network features analyses (e.g., transmission channels), and agent-based mode ling (e.g., analysis of specific agents involved in the network; for instance, the role of central counterparties (CCPs) in the financial system). Typically, the work will involve three phases, i.e., analysis (data visualization and identification of potential risks), monitoring (e.g., detection of anomalies in real time), and simulation (e.g., scenarios and stress-tests).
In practice, a network is made of elements (nodes), linked to each other either directly or indirectly, and this can be represented by several types of graphs. An important concept is “centrality”, which relates to the importance of nodes (or links) in the network, and which can be measured by specific metrics. Another is “community detection”, which aims at simplifying the visualization of a large and complex network by regrouping nodes in clusters and filtering noise, through the use of specific machine learning algorithms (see above).
This sort of analysis appears particularly well suited to representing interconnectedness within a system, for instance, by mapping the global value chain across countries and sectors or the types of exposure incurred by financial institutions.9 One example is the recent work to assess the role of CCPs in the financial system by looking at the connections between them as well as with other financial institutions, such as banking groups, in particular, by considering subsidiary-parent relationships [CPMI-IOSCO (2018)]. This can help to reveal how a disruption originating in one single CCP would affect that CCP’s clearing members and, in turn, other CCPs.
3. OPPORTUNITIES FOR CENTRAL BANKS
Big data can play an important role in improving the quality of economic analysis and research, as increasingly recognized by policymakers [Hammer et al. (2017)]. For their part, many central banks are now working on how to make use of the characteristics of financial big datasets in pursuing their mandates [Cœuré (2017)]. Indeed, big data has many advantages in terms of details, flexibility, timeliness, and efficiency, as summarized in the list of their so-called “Vs” – e.g., volumes, variety, velocity, veracity, and value [Laney (2001) and Nymand-Andersen (2016)]. Central banks are interested in developing various pilot projects to better
DATA ANALYTICS | USING BIG DATA ANALYTICS AND ARTIFICIAL INTELLIGENCE: A CENTRAL BANKING PERSPECTIVE
9 For a recent example of the monitoring of network effects for global systemic institutions in the context of the DGI, see FSB (2011) and Tissot and Bese Goksu (2018).

76 /
understand the new datasets and techniques, assess their value added in comparison with traditional approaches, and develop concrete “use-cases” [IFC (2015)].
This experience has highlighted the opportunities that big data analytics can provide in key areas of interest to central banks, namely (i) the production of statistical information, (ii) macroeconomic analysis and forecasting, (iii) financial market monitoring, and (iv) financial risk assessment.
3.1 More and enhanced statistical information
Big data can be a useful means of improving the official statistical apparatus. First, it can be an innovative source of support for the current production of official statistics, offering access to a wider set of data, in particular to those that are available in an “organic” way. Unlike statistical surveys and censuses, these data are usually not collected (designed) for a specific statistical purpose, being the by-product of other activities [Groves (2011)]. Their range is quite large, covering transaction data (e.g., prices recorded online), aspirational data (e.g., social media posts, product reviews displayed on the internet), but also various commercial, financial, and administrative indicators. In addition, they present a number of advantages for statistical compilers, such as their rapid availability and the relative ease of collection and processing with modern computing techniques (Table 1) – always noting, however, that actual access to such sources, private or public, can be restricted by commercial and/or confidentiality considerations.
Organic data can be used to enhance existing statistical exercises, especially in improving coverage when this is incomplete. In some advanced economies, the direct web-scraping10 of online retailers’ prices data can, for instance, be used to better measure some specific components of inflation,
such as fresh food prices.11 At the extreme, these data can replace traditional indicators in countries where the official statistical system is underdeveloped. One famous example is the Billion Prices Project [see www.thebillionpricesproject.com, and Cavallo and Rigobon (2016)], which allows inflation indices to be constructed for countries that lack an official and/or comprehensive index. Similarly, a number of central banks in emerging market economies have compiled quick price estimates for selected goods and properties, by directly scraping the information displayed on the web, instead of setting up specific surveys that can be quite time- and resource-intensive.
Second, big data can support a timelier publication of official data, by bridging the time lags before these statistics become available. In particular, the information generated instantaneously by the wide range of web and electronic devices – e.g., search queries – provides high-frequency indicators that can help current economic developments to be tracked more promptly (i.e., through the compilation of advance estimates). Indeed, another objective of the Billion Prices Project is to provide advance information on inflation in a large number of countries, including advanced economies, and with greater frequency – e.g., daily instead of monthly, as with a consumer price index (CPI). Turning to the real economy side, the real time evolution of some “hard” indicators, such as GDP, can now be estimated in advance (nowcast) by using web-based information combined with machine learning algorithms – see Richardson et al. (2019) in the case of New Zealand. The high velocity of big data sources helps to provide more timely information, which can be particularly important during a crisis.
A third benefit is to provide new types of statistics that complement “traditional” statistical datasets. Two important
Table 1: Relative advantages of designed versus organic data
DESIGNED DATA ORGANIC DATA
STRUCTURE Geographic and socio-economic Behavior
REPRESENTATIVE Yes No
SAMPLE SELECTION Response rates deteriorating Extreme
INTRUSIVE Extremely intrusive Non-intrusive
COST Large Small
CURATION Well studied Unclear
PRIVACY Well protected Large violations of privacy
Source: Rigobon (2018)
10 Web-scraping can be defined as the automated capturing of online information.11 Hill (2018) reports that 15% of the US CPI is now collected online.
DATA ANALYTICS | USING BIG DATA ANALYTICS AND ARTIFICIAL INTELLIGENCE: A CENTRAL BANKING PERSPECTIVE

77 /
developments should be noted here. One is the increased availability of digitalized textual information, which allows for the measurement of “soft” indicators such as economic agents’ sentiment and expectations – derived, for instance, from social media posts. Traditional statistical surveys can also provide this kind of information, but they typically focus on specific items, e.g., firms’ production expectations and consumer confidence [Tissot (2019b)]. In contrast, internet-based sources can cover a much wider range of topics. In addition, they are less intrusive than face-to-face surveys, and may, therefore, better reflect true behaviors and thoughts. A second important element has been the increased use of large granular datasets to improve the compilation of macroeconomic aggregates, allowing for a better understanding of their dispersion [IFC (2016a)] – this type of distribution information is generally missing in the System of National Accounts [SNA; European Commission et al. (2009)] framework.12
3.2 Macroeconomic forecasting with big data
Many central banks are already using big datasets for macroeconomic forecasting. Indeed, nowcasting applications as described above can be seen as a specific type of forecasting exercise. For instance, Google Trends data can be used to compile short-term projections of estimates of car sales in the euro area, with a lead time of several weeks over actual publication dates [Nymand-Andersen and Pantelidis (2018)]. Similarly, Gil et al. (2019) argue that big data allows a wider range of indicators to be used for forecasting headline indicators in Spain – for instance Google Trends,13 uncertainty measures such as the EPU index (see above), or credit card operations, as well as more traditional indicators. The devil is in the details, though, and statisticians need to try several approaches. For instance, some indicators may work well in nowcasting GDP (i.e., its growth rate over the current quarter) but less so in forecasting its future evolution (say, GDP growth one year ahead). Another point is that the internet is not the sole source of indicators that can be used in this context; in fact, some web-based indicators may work less well in nowcasting/forecasting exercises than do traditional business confidence surveys.14
In view of these caveats, and considering the vast amount of data potentially available, it may be useful to follow a structured
process when conducting such exercises. Sawaengsuksant (2019) recommends a systematic approach when selecting the indicators of interest, such as internet search queries. For instance, key words in Google Trends data could be selected if they satisfied several criteria, depending on their degree of generality, their popularity (i.e., number of searches recorded), their robustness (i.e., sensitivity to small semantic changes), their predictive value (i.e., correlation with macro indicators), and whether the relationship being tested makes sense from an economic perspective.
3.3 Financial market forecasting and monitoring
As in the macroeconomic arena, big data analytics have also proved useful in monitoring and forecasting financial market developments, a key area for central banks. A number of projects in this area facilitate the processing of huge volume of quantitative information in large financial datasets. For instance, Fong and Wu (2019) show that returns in a number of emerging sovereign bond markets can be predicted using various technical trading rules and machine learning techniques to assess their robustness as well as the relative contributions of specific foreign (e.g., U.S. monetary policy) and domestic factors.
Other types of project are looking at less structured data. As an example, Zulen and Wibisono (2019) describe how a text-mining algorithm could be used to measure public expectations for the direction of interest rates in Indonesia. Specifically, a classification algorithm is trained to predict whether a given piece of text indicates an expectation for the future tightening, loosening, or stability of the central bank policy rate. All the newspaper articles discussing potential developments in the policy rate from two weeks prior to monthly policy meetings are collected, and an index of policy rate expectation is produced. This index has facilitated the analysis of the formation of policy rate expectations, usefully complementing other sources (e.g., Bloomberg surveys of market participants). Other types of textual information, such as social media posts and official public statements, could also be usefully considered.
Experience reported by several central banks shows that new big data sources can also help to elucidate developments in financial markets, and shed light on their potential future
DATA ANALYTICS | USING BIG DATA ANALYTICS AND ARTIFICIAL INTELLIGENCE: A CENTRAL BANKING PERSPECTIVE
12 Indeed, the SNA highlights the importance of considering the skewed distribution of income and wealth across households but recognizes that getting this information is “not straightforward and not a standard part of the SNA” (2008 SNA, #24.69). It also emphasizes that “there would be considerable analytical advantages in having microdatabases that are fully compatible with the corresponding macroeconomic accounts” (2008 SNA, #1.59). An important recommendation of the second phase of the DGI aims at addressing these issues [FSB-IMF (2015)].
13 See https://trends.google.com/trends/. Google Trends provide indexes of the number of Google searches of given keywords. The indexes can be further segregated based on countries and provinces.
14 For the use of nowcasting in forecasting “bridge models” using traditional statistics and confidence surveys, see Carnot et al. (2011).

78 /
direction. Sakiyama and Kobayashi (2018) have used high-frequency “tick” transaction data to assess market liquidity in the Japanese government bond market, and hence the risk of potential abrupt price changes. Similarly, the Bank of England has set up specific projects to identify forex market dynamics and liquidity at times of large market movements – e.g., when the Swiss National Bank decided to remove the EUR/CHF floor in January 2015 [Cielinska et al. (2017)].
3.4 Financial risk assessment
Big data sources and techniques can also facilitate financial risk assessment and surveillance exercises that sit at the core of central banks’ mandates – for both those in charge of micro-financial supervision and those focusing mainly on financial stability issues and macro-financial supervision [Tissot (2019a)]. In particular, the development of big data analytics has opened promising avenues for using the vast amounts of information entailed in granular datasets to assess financial risks.
To start with, they allow new types of indicators to be derived, as highlighted by Petropoulos et al. (2019) for the analysis of the financial strength of individual firms in Greece. Based on the granular information collected in the central bank’s supervisory database (covering around 200,000 borrowers over a decade), a deep learning technique with a specific classification algorithm15 was used to forecast the likelihood of default for each loan outstanding. To facilitate policy monitoring work, this approach was complemented by a dimensionality reduction algorithm to reduce the number of variables to be considered.
Moreover, big data analytics can help to enhance existing financial sector assessment processes (e.g., regtech), by extending conventional methodologies and providing additional insights – in terms of, for example, financial sentiment analysis, early warning systems, stress-test exercises, and network analysis. For instance, with the use of network analytics for systemic risk measurement and contagion effects [Langfield and Soramäki (2016)], the application of text analysis techniques to corporate e-mails and news for risk assessment [Das et al. (2019)], the assistance of complex visualization techniques to support data exploration and monitoring for large-scale financial networks [Heijmans et al. (2016)], etc. Yet, these approaches underline the importance of having a sound theoretical framework to interpret the
signals provided by disparate sources as well as to detect unusual, odd patterns in the data. They also highlight the important role played by model simplicity and transparency, the benefit of a multidisciplinary approach, and the high IT and staff costs involved.
4. THE USE OF BIG DATA IN CRAFTING CENTRAL BANK POLICY: ORGANIZATION AND CHALLENGES
Central bank experience suggests that the opportunities provided by big data sources and related analytical techniques can be significant, supporting a wide range of areas of policy interest. But how should central banks organize themselves to make the most of these opportunities? And what are the key challenges?
4.1 Organizational issues
Central banks’ tasks cover a wide range of topics that can greatly benefit from big data. For instance, central bankers need near-real-time and higher-frequency snapshots of the macroeconomy’s state, its potential evolution (central scenario), and the risks associated with this outlook (e.g., early warning indicators and assessment of turning points). At the same time, their interest in financial stability issues calls for the ability to zoom in and get insights at the micro-level – see the ongoing initiatives among European central banks to develop very granular datasets on security-by-security issuance and holdings as well as on loan-by-loan transactions [the AnaCredit project; Schubert (2016)].
This puts a premium on information systems that can support this diversity of approaches. One reported lesson of the data lake platform project being developed at the French central bank [Villeroy de Galhau (2017)] is that a multidisciplinary and granular data platform is required to supply flexible and innovative services to a wide range of internal users. The aim is to provide key data management services to support multiple activities, covering data collection, supply (access), quality management, storage, sharing, analytics, and dissemination. From a similar perspective, the Deutsche Bundesbank has set up an integrated microdata-based information and analysis system (IMIDIAS) to facilitate the handling of granular data used to support its activities [Staab (2017)]. It has also worked on fostering internal as well as external research on this information to gain new insights and facilitate policy analysis. Moreover, the Bundesbank actively supports the International
15 eXtreme Gradient Boosting (XGBoost), which is commonly used in decision tree-based algorithms; see Chen and Guestrin (2016) and https://xgboost.readthedocs.io/en/latest/.
DATA ANALYTICS | USING BIG DATA ANALYTICS AND ARTIFICIAL INTELLIGENCE: A CENTRAL BANKING PERSPECTIVE

79 /
Network for Exchanging Experience on Statistical Handling of Granular Data (INEXDA) [Bender et al. (2018)].
A key takeaway is that the development of an adequate information system is only one element of a more comprehensive strategy to make the most of big data at central banks. This usually requires the use of various techniques, e.g., machine learning, text-mining, natural language processing, and visualization techniques; and it also has to be backed by an extensive staff training program on data analytics. As an example, several use-cases involving data science have been developed at the Netherlands Bank – e.g., in the areas of credit risk, contagion risk, CCP risk, and stress-testing in specific market segments. An important outcome has been the recognition of the important role played not only by the techniques used but also by the staff, organization, and culture.
4.2 Challenges and limitations
In practice, important challenges remain, especially in handling and using big data sources and techniques.
Handling big data can be resource-intensive, especially in collecting and accessing the information, which can require new, expensive IT equipment, as well as state-of-the-art data security. Staff costs should not be underestimated too, as suggested by the experience reported for many central banks. First, large micro-datasets on financial transactions often have to be corrected for false attributes, missing points, outliers, etc. [Cagala (2017)]; this cleaning work may often require the bulk of the time of the statisticians working with these data. Second, a much wider set of profiles – e.g., statisticians, IT specialists, data scientists, and also lawyers – are needed to work in big data multidisciplinary teams; ensuring a balanced skillset and working culture may be challenging. Third, there is a risk of a “war for talent” when attracting the right candidates, especially vis-à-vis private sector firms that are heavily investing in big data; public compensation and career systems may be less than ideally calibrated for this competition. In addition, and as seen above, a key organizational consideration is how to integrate the data collected into a coherent and comprehensive information model. The challenge for central bank statisticians is thus to make the best use of available data that were not originally designed for specific statistical purposes and can be overwhelming (with the risk of too much “fat data”, and too little valuable information). In most cases, this requires significant preparatory work and sound data governance principles, covering data quality management
processes (e.g., deletion of redundant information), the setup of adequate documentation (e.g., metadata), and the allocation of clear responsibilities (e.g., “who does what for what purpose”) and controls.
Using big data is also challenging for public authorities. One key limitation relates to the underlying quality of the information as noted above. This challenge can be reinforced by the large variety of big data formats, especially when the information collected is not well structured. Moreover, big data analytics rely frequently on correlation analysis, which can reflect coincidence as well as causality patterns. Furthermore, the veracity of the information collected may prove insufficient. Big datasets may often cover entire populations, so by construction there is little sampling error to correct for, unlike with traditional statistical surveys. But a common public misperception is that, because big datasets are extremely large, they are automatically representative of the true population of interest. Yet, this is not guaranteed, and in fact the composition bias can be quite significant, in particular as compared with much smaller traditional probabilistic samples [Meng (2014)]. For example, when measuring prices online, one must realize that not all transactions are conducted on the internet. The measurement bias can be problematic if online prices are significantly different from those observed in physical stores, or if the products consumers buy online are different to those they buy offline.
These challenges are reinforced by two distinctive features of central banks – the first being their independence and the importance they accord to preserving public trust. Since the quality of big datasets may not be at the standard required for official statistics, “misusing” them as the basis of policy actions could raise ethical, reputational, as well as efficiency issues. Similarly, if the confidentiality of the data analyzed is not carefully protected, this could undermine public confidence, in turn calling into question the authorities’ competence in collecting, processing, and disseminating information derived from big data, as well as in taking policy decisions inferred from such data. This implies that central banks would generally seek to provide reassurances that data are used only for appropriate reasons, that only a limited number of staff can access them, and that they are stored securely. The ongoing push to access more detailed data (often down to individual transaction level) reinforces the need for careful consideration of the requirement to safeguard the privacy of the individuals and firms involved.
DATA ANALYTICS | USING BIG DATA ANALYTICS AND ARTIFICIAL INTELLIGENCE: A CENTRAL BANKING PERSPECTIVE

80 /
A second feature is that central banks are policymaking institutions whose actions are influencing the financial system and thereby the information collected on it. Hence, there is a feedback loop between the financial big data collected, its use for designing policy measures, and the actions taken by market participants in response. As a result, any move to measure a phenomenon can lead to a change in the underlying reality, underscoring the relevance of the famous Lucas critique for policymakers [Lucas (1976)].
5. CONCLUSION
5.1 Main lessons
Central banks’ various experiences in using big data analytics and associated AI techniques have highlighted the following points:
• Big data offers new types of data source that complement more traditional varieties of statistics. These sources include Google searches, real estate and consumer prices displayed on the internet, and indicators of economic agents’ sentiments and expectations (e.g., social media).
• Thanks to IT innovation, new techniques can be used to collect data (e.g., web-scraping), process textual information (text-mining), match different data sources (e.g., fuzzy-matching), extract relevant information (e.g., machine learning), and communicate or display pertinent indicators (e.g., interactive dashboards).
• In particular, big data techniques, such as decision trees, may shed interesting light on the decision-making processes of economic agents, e.g., how investors behave in financial markets. As another example, indicators of economic uncertainty extracted from news articles could help explain movements of macroeconomic indicators. This illustrates big data’s potential in providing insights not only into what happened, but also into what might happen and why.
• In turn, these new insights can usefully support central bank policies in a wide range of areas, such as market information (e.g., credit risk analysis), economic forecasting (e.g., nowcasting), financial stability assessments (e.g., network analysis), and external communications (e.g., measurement of agents’ perceptions). Interestingly, the approach can be very granular, helping to target specific markets, institutions, instruments, and locations (e.g., zip codes) and, in particular, to support macroprudential policies. Moreover, big data indicators are often more timely than “traditional” statistics – for instance, labor indicators can be extracted from online job advertisements almost in real time.
• As a note of caution, feedback from central bank pilot projects consistently highlights the complex privacy implications of dealing with big data, and the associated reputational risks. Moreover, while big data applications, such as machine learning algorithms, can excel in terms
DATA ANALYTICS | USING BIG DATA ANALYTICS AND ARTIFICIAL INTELLIGENCE: A CENTRAL BANKING PERSPECTIVE

81 /
of predictive performance, they can lend themselves more to explaining what is happening rather than why. As such, they may be exposed to public criticism when insights gained in this way are used to justify policy decisions.
• Another concern is that, as big data samples are often far from representative (e.g., not everyone is on Facebook, and even fewer are on Twitter), they may not be as reliable as they seem. Lastly, there is a risk that collecting and processing big data will be hindered by privacy laws and/or changes in market participants. Relevant authorities should coordinate their efforts so that they can utilize the advantages of big data analytics without compromising data privacy and confidentiality.
5.2 Looking forward
Taking stock of the implementation of big data projects in the central bank community shows that new big data-related sources of information and analytical techniques can provide various benefits for policymakers. Yet, big data is still seen as complementing, rather than replacing, present statistical frameworks. It raises a number of difficult challenges, not least in terms of accuracy, transparency, confidentiality, and ethical considerations. These limitations apply to big data sources as well as to the techniques that are being developed for their analysis. In particular, one major drawback of big data analytics is their black-box character, a difficulty reinforced by the frequent use of fancy names even for simple things (buzzwords). This can be a challenge for policymakers who need to communicate the rationale behind their analyses and decisions as transparently as possible. Moreover, important uncertainties remain on a number of aspects related to information technology and infrastructures, such as the potential use of cloud-based services and the development of new processes (e.g., cryptography, anonymization techniques) to facilitate the use of micro-level data without compromising confidentiality.
One important point when discussing these issues is that central banks do not work in isolation. They need to explain to the general public how the new data can be used for crafting better policies, say, by providing new insights into
16 On the general data-sharing issues faced by central banks, see IFC (2016b).
the functioning of the financial system, clarifying its changing structure, improving policy design, and evaluating the result of policy actions [Bholat (2015)]. But they also need to transparently recognize the associated risks, and to clearly state the safeguards provided in terms of confidentiality protection, access rights, and data governance. Ideally, if big data is to be used for policymaking, the same quality of standards and frameworks that relate to traditional official statistics should be applied, such as transparency of sources, methodology, reliability, and consistency over time. This will be key to facilitating a greater use of this new information as well as its effective sharing between public bodies.16
As both data users and data producers, central banks are in an ideal position to ensure that big data can be transformed into useful information in support of policy.
Looking forward, it is still unclear whether and how far big data developments will trigger a change in the business models of central banks, given that they are relatively new to exploiting this type of information and techniques. Central banks have historically focused more on analyzing data and less on compiling them. They are now increasingly engaged in statistical production, reflecting the data collections initiated after the GFC as well as the growing importance of financial channels in economic activities – see, for instance, the substantial involvement of central banks in the compilation of financial accounts, a key element of the SNA framework [van de Ven and Fano (2017)]. As both data users and data producers, they are, therefore, in an ideal position to ensure that big data can be transformed into useful information in support of policy.
DATA ANALYTICS | USING BIG DATA ANALYTICS AND ARTIFICIAL INTELLIGENCE: A CENTRAL BANKING PERSPECTIVE

82 /
REFERENCES
Baker, S., N. Bloom, and S. Davis, 2016, “Measuring economic policy uncertainty,” Quarterly Journal of Economics 131:4, 1593–1636
Bean, C., 2016, Independent review of UK economic statistics, March
Bender, S., C. Hirsch, R. Kirchner, O. Bover, M. Ortega, G. D’Alessio, L. Teles Dias, P. Guimarães, R. Lacroix, M. Lyon, and E. Witt, 2016, “INEXDA – the Granular Data Network,” IFC Working Papers no. 18, October
Bholat, D., 2015, “Big data and central banks,” Bank of England, Quarterly Bulletin, March
Blei, D., A. Ng, and M. Jordan, 2003, “Latent dirichlet allocation,” Journal of Machine Learning Research 3, 993–1022
Cagala, T., 2017, “Improving data quality and closing data gaps with machine learning,” IFC Bulletin no. 46, December
Carnot, N., V. Koen, and B. Tissot, 2011, Economic Forecasting and Policy, second edition, Palgrave Macmillan
Cavallo, A., and R. Rigobon, 2016, “The billion prices project: using online prices for measurement and research,” Journal of Economic Perspectives 30:2, 151–178
Chen, T., and C. Guestrin, 2016, “Xgboost: a scalable tree boosting system,” Proceedings of the 22nd ACM SIGKDD International Conference on Knowledge Discovery and Data Mining, 785–794
Cielinska, O., A. Joseph, U. Shreyas, J. Tanner, and M. Vasios, 2017, “Gauging market dynamics using trade repository data: the case of the Swiss franc de-pegging,” Bank of England, Financial Stability Papers no. 41, January
Coeuré, B., 2017, “Policy analysis with big data”, speech at the conference on “Economic and financial regulation in the era of big data,” Bank of France, Paris, November
CPMI- IOSCO, 2018, “Framework for supervisory stress testing of central counterparties (CCPs),” Committee on Payments and Market Infrastructures (CPMI) and Board of the International Organization of Securities Commissions (IOSCO), April
Das, S., S. Kim, and B. Kothari, 2019, “Zero-revelation RegTech: Detecting risk through linguistic analysis of corporate emails and news,” Journal of Financial Data Science 2, 8-34
Economist, 2017, “The world’s most valuable resource is no longer oil, but data,” May 6
E.C., IMF, OECD, U.N., and World Bank, 2009, “System of National Accounts 2008,” European Commission, International Monetary Fund, Organisation for Economic Cooperation and Development, United Nations, and World Bank
FSB, 2011, “Understanding financial linkages: a common data template for global systemically important banks,” FSB Consultation Papers, Financial Stability Board
FSB, 2017, “Artificial intelligence and machine learning in financial services – market developments and financial stability implications,” Financial Stability Board, November
FSB-IMF, 2009, “The financial crisis and information gaps,” Financial Stability Board and International Monetary Fund
FSB-IMF, 2015, “The financial crisis and information gaps – Sixth Implementation Progress Report of the G20 Data Gaps Initiative,” Financial Stability Board and International Monetary Fund
Fong, T., and G. Wu, 2019, “Predictability in sovereign bond returns using technical trading rule: do developed and emerging markets differ?,” IFC Bulletin no. 50, May
Gil, M., J. J Pérez, A. J Sánchez, and A. Urtasun, 2019, “Nowcasting private consumption: traditional indicators, uncertainty measures, credit cards and some internet data,” IFC Bulletin no. 50, May
Groves, R., 2011, “Designed data and organic data,” in the Director’s Blog of the U.S. Census Bureau, https://bit.ly/2kJLscq
Haldane, A., 2018, “Will big data keep its promise?” speech at the Bank of England Data Analytics for Finance and Macro Research Centre, King’s Business School, April 19
Hammer, C., D. Kostroch, G. Quirós, and staff of the IMF Statistics Department (STA) Internal Group, 2017, “Big data: potential, challenges, and statistical implications,” IMF Staff Discussion Notes no. 17/06, September
Hansen, S., 2019, “Introduction to text mining,” IFC Bulletin no. 50, May
Heijmans, R., R. Heuver, C. Levallois, and I. van Lelyveld, 2016, “Dynamic visualization of large financial networks,” Journal of Network Theory in Finance 2:2, 57–79
Hill, S., 2018, “The big data revolution in economic statistics: waiting for Godot ... and government funding,” Goldman Sachs US Economics Analyst, 6 May
IFC, 2015, “Central banks’ use of and interest in ‘big data’,” Irving Fisher Committee on Central Bank Statistics, IFC Report, October
IFC, 2016a, “Combining micro and macro statistical data for financial stability analysis,” Irving Fisher Committee on Central Bank Statistics, IFC Bulletin no. 41, May
IFC, 2016b, “The sharing of micro data – a central bank perspective,” Irving Fisher Committee on Central Bank Statistics, IFC Report, December
IFC, 2017a, “Big data,” Irving Fisher Committee on Central Bank Statistics, IFC Bulletin no. 44, September
IFC, 2017b, “Uses of central balance sheet data offices’ information,” Irving Fisher Committee on Central Bank Statistics, IFC Bulletin no. 45, October
IFC, 2018, “Central banks and trade repositories derivatives data,” Irving Fisher Committee on Central Bank Statistics, IFC Report, October
IFC, 2019, “The use of big data analytics and artificial intelligence in central banking,” Irving Fisher Committee on Central Bank Statistics, IFC Bulletin no. 50, May
Laney, D., 2001, “3D data management: controlling data volume, velocity, and variety,” META Group (now Gartner)
Langfield, S., and K. Soramäki, 2016, “Interbank exposure networks,” Computational Economics 47:1, 3-17
Loughran, T., and B. McDonald, 2011, “When is a liability not a liability? Textual analysis, dictionaries, and 10-Ks,” Journal of Finance 66:1, 35–65
Lucas, R., 1976, “Econometric policy evaluation: A critique,” Carnegie-Rochester Conference Series on Public Policy 1:1, 19–46
Meeting of the Expert Group on International Statistical Classifications, 2015, “Classification of types of big data,” United Nations Department of Economic and Social Affairs, ESA/STAT/AC.289/26, May
Meng, X., 2014, “A trio of inference problems that could win you a Nobel Prize in statistics (if you help fund it),” in Lin, X., C. Genest, D. Banks, G. Molenberghs, D. Scott, and J.-L. Wang (eds), Past, present, and future of statistical science, Chapman and Hall, 537–562
Nymand-Andersen, P., 2016, “Big data – the hunt for timely insights and decision certainty: central banking reflections on the use of big data for policy purposes,” IFC Working Papers no. 14, February
Nymand-Andersen, P., and E. Pantelidis, 2018, “Google econometrics: nowcasting euro area car sales and big data quality requirements,” European Central Bank, Statistics Paper Series no. 30, November
Petropoulos, A., V. Siakoulis, E. Stravroulakis, and A. Klamargias, 2019, “A robust machine learning approach for credit risk analysis of large loan-level datasets using deep learning and extreme gradient boosting,” IFC Bulletin no. 50, May
Richardson, A., T. van Florenstein Mulder, and T. Vehbi, 2019, “Nowcasting New Zealand GDP using machine learning algorithms,” IFC Bulletin no. 50, May
DATA ANALYTICS | USING BIG DATA ANALYTICS AND ARTIFICIAL INTELLIGENCE: A CENTRAL BANKING PERSPECTIVE

83 /
Rigobon, R., 2018, “Promise: measuring from inflation to discrimination,” presentation given at the workshop on “Big data for central bank policies,” Bank Indonesia, Bali, 23–25 July
Sakiyama, T., and S. Kobayashi, 2018, “Liquidity in the JGB cash market: an evaluation from detailed transaction data,” Bank of Japan, Reports & Research Papers, March
Sawaengsuksant, P., 2019, “Standardized approach in developing economic indicators using internet searching applications,” IFC Bulletin no. 50, May
Schubert, A., 2016, “AnaCredit: banking with (pretty) big data,” Central Banking Focus Report
Staab, P., 2017, “The Bundesbank’s house of micro data: Standardization as a success factor enabling data-sharing for analytical and research purposes,” IFC Bulletin no. 43, March
Tetlock, P., 2007, “Giving content to investor sentiment: the role of media in the stock market,” Journal of Finance 62:3, 1139–1168
Tissot, B., and E. Bese Goksu, 2018, “Monitoring systemic institutions for the analysis of micro-macro linkages and network effects,” Journal of Mathematics and Statistical Science 4:4, 129-136
Tissot, B., (2019a), “Making the most of big data for financial stability purposes”, in Strydom, S., and M. Strydom (eds), Big data governance and perspectives in knowledge management, IGI Global, 1–24
Tissot, B., 2019b, “The role of big data and surveys in measuring and predicting inflation,” International Statistical Institute World Statistics Congress, August
Van de Ven, P., and D. Fano, 2017, Understanding financial accounts, OECD Publishing, Paris
Villeroy de Galhau, F., 2017, “Economic and financial regulation in the era of big data,” speech at the Bank of France conference, Paris, November
Zulen, A., and O. Wibisono, 2019, “Measuring stakeholders’ expectations for the central bank’s policy rate,” IFC Bulletin no. 50, May
DATA ANALYTICS | USING BIG DATA ANALYTICS AND ARTIFICIAL INTELLIGENCE: A CENTRAL BANKING PERSPECTIVE

84 /
LUIS DEL POZO | Managing Principal, Capco
PASCAL BAUR | Associate Consultant, Capco
data, vector data, time-series data, and many other data forms. There are also different storage possibilities to consider, such as relational databases, schema-less databases, and various other file formats. Today, financial services firms must cater to all these different data types and formats. But they are inevitably constrained by limited resources and expertise.
Architecture and technology, which are used to manage these data, are evolving at a rapid rate as well. Traditional data management languages, tools, and solutions may find themselves quickly out-of-sync with modern solutions and approaches. Not all systems process all the data in the same manner either. With the move from legacy architecture to cloud services, the very nature of storage, computing, and analytics is being transformed. We live in a world where legacy and modern solutions must live in a hybrid environment and interact with each other in the most efficient way.
3. FRAGMENTED DATA SILOS
Data remains the core asset for all financial services firms, but most of it is deeply siloed in isolated systems, departments, functions, geographies, databases, files, and archives (Figure 1). To service even a simple request from a client or a user, the request is processed through multiple channels, multiple business areas, and accesses multiple data sources (e.g., sales, CRM, financials, transactions, etc.) contained both
ABSTRACTThis article looks at the ongoing issues associated with fragmented data silos, a problem exacerbated by the ever-increasing amount of data that enterprises must deal with. We highlight the need for unifying data silos and how analytics could help investment firms transform themselves. To support our propositions, we provide a number of real-world examples from investment firms on such journeys. In addition, we lay out a roadmap for firms currently on a data analytics-driven transformation journey.
UNIFYING DATA SILOS: HOW ANALYTICS IS PAVING THE WAY
1. INTRODUCTION
Financial institutions today have more data and analytics choices than ever. The amount of data and the speed with which it is collected have increased exponentially in recent years. The types of data, tools, solutions, and vendors have also changed at a significant rate. All this has added to the overall complexity of the business landscape and has created many fragmented data silos. To make data available for a sustainable period at the right place, the right time, and in the right format remains a challenge for many firms.
In this article we outline the very nature of the problem of fragmented data silos, describe how analytics is helping firms to overcome this problem, and provide a roadmap for firms that want to plan for this data analytics-driven transformation.
2. NEW DATA-DRIVEN WORLD
The amount of data being produced and processed by financial firms daily is increasing exponentially. Financial services firms are buried under petabytes of data. These data pools originate from a variety of sources, come in many different formats, and are subjected to different life cycles. Not only have volume, velocity, and variety of data increased exponentially, but also the very nature of data has changed. There exist big data, structured data, unstructured data, static data, streaming

85 /
within and outside of the financial services firm. There are more and more applications being built to cater for all these service requests and this further increases the complexity of the data environment.
On one hand, firms can say that we have more choices and better competition on data and analytics solutions. On the other hand, however, there is the problem of overcomplex business landscapes and future interoperability problems. While there may be numerous technologies, vendors, products, hardware, software, and data providers available for any business or technical problem, each of these has their own stacks, programming languages, and practices that further complicates the environment. Technology is still advancing, products are maturing, and vendors are being consolidated. These developments are all adding new layers that continue to deepen the sea of data silos. The complexity of servicing clients continues to be increasingly challenging. In this environment, financial services firms are always challenged to increase revenue, manage operational costs, address risks such as fraud, and be regulatory compliant.
4. UNIFICATION NEEDS IN THE AGE OF ANALYTICS
The fundamental need remains to make data available at the right place, at the right time, and in the right format. However, today’s organizational data workflow involves numerous manual interventions, which complicate the achievement of this fundamental need (Figure 2). Data is being sourced, extracted, cleansed, enriched, and transformed from
DATA ANALYTICS | UNIFYING DATA SILOS: HOW ANALYTICS IS PAVING THE WAY
homogeneous or heterogeneous data sources. It goes through multiple transformations, validations, and checks during this process. When the entire end-to-end processing happens in a siloed environment and when too many business groups start intercepting these workflows and manipulating the data without a holistic data strategy, the efficiency and effectiveness of the organization is lost.
Clearly the current model of processing is not scalable because the resources available to firms are not scalable themselves; be it budget, time, or human resources. Firms were once proud to maintain a high-quality of service despite their processes having a high-manual input. However, with complexity intensifying and increasing service requests, they are now struggling to meet even the same standards due to head-count reductions and the ever-increasing number of stricter controls. In short, there is a need to do more with less going forward. Firms need to operationalize processing while transforming at the same time.
5. MODERN DAY DATA ANALYTICS CAPABILITIES
Firms can use an analytics platform, with its underlying capabilities, to knit data across silos. Analytics platforms are fundamental tools for unifying data. They are built on existing underlying technologies to capture, store, compute, and analyze data from a variety of sources in the most effective and efficient ways. Modern analytics platforms have expanded beyond traditional business intelligence and reporting platforms. Most of the out-of-the-box platforms come with a
Figure 1: Data silos in organizations
CHANNELS
WEB MOBILE BOTS TOUCH DEVICES VOICE E-MAILS SELF SERVICE ATMs ENQUIRIES OTHERS
BUSINESS AREAS
TRADING INVESTMENTS FINANCE COMMERCE RESEARCH RISK OTHERS
DATA
SALES CRM MARKETING TRADING PORTFOLIO PRICING RESEARCH TRANSACTIONS
INTERNAL EXTERNAL
ERP STATIC OTHERSOTHERS RESEARCHBENCHMARKRISK BEHAVIOR

86 /
large set of connectors that can source data across multiple applications like CRMs, ERPs, financial systems, order managers, etc. They provide a rich set of functionalities and features, computing, visualization, predictive capabilities, model and insight generations, etc. These platforms appeal to users because of their ease of use, scalability, ease of migration, and security (Table 1).
Many advanced analytical capabilities like machine learning techniques (classification, regression, clustering, etc.) have been in use for decades. Today, users have unprecedented computing and processing power at their disposal to create and deploy models at ease. This has made many more analytical use cases feasible now. Deep learning (using neural
Table 1: Modern analytics platform capabilities
AREA NATURE OF TASK HOW IS ANALYTICS AIDING TRANSFORMATION?
DATA INTEGRATION • Authentication data shared with the requesting party with the user’s approval
• Alerts users via a push notification when their identity is being used at the time of the transaction
• Strong connectors and integration capabilities for different data types
• Faster ways of processing /computation using wranglers, fabrics and ELT/ETL techniques (extract load/transform)
REAL TIME ANALYTICS
• Analysis of streaming data to find insights in real time
• Continuous real time streams processing like sentiment analytics, trend analytics, etc.
ADVANCED ANALYTICS AND DATA MINING
• Generate intelligence and advanced insights based on data
• Advanced recommendation engines and decision support systems
• Advanced natural language processing, text analytics capabilities
• Machine learning (classification, regression, and clustering of data) and deep learning capabilities
• Descriptive (reporting on the past), diagnostic (using past data to study the present), predictive (using insights based on past data to predict the future), and prescriptive (using various models to provide next best action) capabilities
SELF-SERVICE VISUALIZATION AND SIMULATIONS
• Loose integration of data sources where analytics can be directly performed by end-users
• Automated/tool capabilities for extraction and presentation of data
• Almost no IT required
• Complex what-if scenarios handling
DASHBOARDS • Present key performance indicators (KPI) with limited drill down capabilities
• Feature-rich sophisticated charts, visual aids, and drag-and-drop tools reduce barriers for a non-technical person to present stories
Figure 2: Organizational data workflow (illustrative)
Gather: Data is initially captured across various internal and external sources
Analyze/Process: Data is aggregated across various sources. Multiple people, systems, tools are involved. Data goes through multiple rounds of reviews before final results are produced
Output: Standard or ad-hoc reports are produced for external use, very limited insights are actually generated and incorporated back
GATHER ANALYZE/PROCESS OUTPUT
DATA ANALYTICS | UNIFYING DATA SILOS: HOW ANALYTICS IS PAVING THE WAY

87 /
networks) and transfer learning (aiding edge computing) are areas that are gaining traction and pushing the boundaries in the area of vision, audio, and text analytics. We are already seeing these innovative capabilities in the form of chat-bots, virtual assistants, etc.
Machine learning, combined with other techniques, has the potential to generate an enormous range of analytics use-cases. These model the complex systems and scenarios that financial firms face today (Figure 3). Transaction analytics, pattern recognition, network analytics, client lifecycle, and behavior analytics are some of the specific areas that are possible today due to the advancements of analytical capabilities. With all these capabilities becoming more advanced and automated, it presents an opportunity for combining humans and smart machines to achieve better results for financial services firms. Analytics is truly becoming a competitive differentiator.
6. ANALYTICS OPPORTUNITIES
Analytics opportunities are transformational or operational in nature. Transformational opportunities require a higher integration of data but retain the potential to impact the top or bottom line significantly. Examples are new product offerings, segmentation analytics, fraud analytics, behavior analytics, life cycle analytics, risk analytics, etc. Operational opportunities focus on automating or servicing day-to-day tasks better, like report generation, risk management, benchmarking, etc.
Analytics-driven workflow can not only automate tasks and produce standard deliverables but also produce advanced insights and reports without significant effort (Figure 4). Insights can be gathered, acted upon, and integrated back to the business for better decision making. It also provides new ways of monetizing and servicing clients. In doing this, firms remain efficient going forward and can have an edge over competitors.
DATA ANALYTICS | UNIFYING DATA SILOS: HOW ANALYTICS IS PAVING THE WAY
Figure 3: Business capabilities made possible by modern analytics
Figure 4: Analytics-driven flows
TRANSACTION ANALYTICS
Transaction-based analytics to improve
operational efficiency, e.g., transaction cost analytics in trading
PATTERN RECOGNITION ANALYTICS
Sales opportunity based on comparisons against
similar clients, e.g., fraud detection
NETWORK ANALYTICS
Understanding how entities are connected
in firms’ networks, e.g., KYC relationships
LIFE STAGE/LIFE EVENT ANALYTICS
Detection of life events like children and education, and offering products based on
these needs, e.g., client lifecycle analytics in trading
CLIENT BEHAVIOR ANALYTICS
Understanding client behavior on how s/he
uses the same
GATHER ANALYZE/PROCESS OUTPUT
Analytical tools and solutions
Resources can be utilized in other value adding tasks
STANDARD DELIVERABLES
ADVANCED INSIGHTS

88 /
In order to implement this, firms must select the right use-cases that are scalable and that can be industrialized. The challenge for today’s investment firms is which use-cases should be considered for building analytics capabilities? Should firms consider small use-cases with large transformational potential? Or should they consider thousands of use-cases with a likely small 1% potential? In the end, there is no magic formula. When you make thousands of small things better, it can lead to a potentially large transformation overall.
7. UNIFICATION EXAMPLES
As systems become more complex and data volumes grow firms have started using self-services tools to not only do their work but to also identify new risks more efficiently. In January 2018, MiFID II (Markets in Financial Instruments Directive) came into effect, requiring firms to provide reports
based on various trading, client, employee, and market data. For example, best execution requirements (RTS 27 and 28) are specific reports produced by firms that indicate quality of execution and top five venue/brokers information. An investment firm used data science workbenches to provide a central solution across locations. By doing so it was able to automate various tasks, perform field analysis, and visualize various metrics for controlling purposes. At the same time the reports were being produced for regulatory purposes.
Another investment firm is trying to unify client information across locations to have a single view of all their assets and portfolios across locations and branches. This was partially driven by regulatory requirements but also to satisfy clients’ underlying needs. This is helping the firm in assessing client risks, transactions, and behaviors across all channels (Figure 6).
Figure 5: Example – MiFID II controls workbench
MERGE TRADES FIX DATA
INSTRUMENT DATA
EMPLOYEE DATA
SUMMARIZE SECURITIES
VISUALIZATIONS/FURTHER MODELS
EXCEL REPORTS
SUPERVISOR SIGN-OFF
ENRICH TRADE DATA FIELDWORK ANALYSIS EMAIL
OTHER TRADES
CH TRADES
EMEA TRADES
ANALYZE SAMPLE
Figure 6: Example – single client view
PORTFOLIO A
ACCOUNT A
TRANSACTION A FACTS
PORTFOLIO B
ACCOUNT B
TRANSACTION B FACTS
PORTFOLIO...N
ACCOUNT C
TRANSACTION...N FACTS
BEHAVIORS
RISKS
DATA ANALYTICS | UNIFYING DATA SILOS: HOW ANALYTICS IS PAVING THE WAY

89 /
Furthermore, a different investment firm is working on integrating the data insights end-to-end on the client advisor’s desktop. All portfolios from different users are analyzed. Users trading similar products are clustered. With the Chief Information Officer’s (CIO) suggestions, new portfolios are being suggested after running through all suitability and product checks. In the end, the insight generated through the process goes back to the client advisor workbenches where they can leverage the same information for client conversations (Figure 7).
8. THE ROAD AHEAD – HOW TO PROCEED
In a technology driven world, it is quite possible we may be hijacked by various buzzwords and upcoming technology. It is imperative that one starts with business objectives first and in areas where maximum value can be provided for the most urgent needs. Firms need to run different kinds of use-cases to build-up the overall business and technical capabilities of an organization.
Firms that are planning on an analytics transformation must architect their data landscape for analytics purposes. Data governance provides a much-needed overarching direction to the analytics program to start with. The team here formalizes overall tasks and roles needed for overall data management (Table 2).
• Data discovery teams collect and analyze data to determine various underlying patterns.
– Profiling: build up a true understanding of the dataset, its strengths and limitations, and understand various data quality issues. Analytics are based on having a variety of high-quality data in hand.
– Lineage: map out key dataset to their origins and understand how they are moving over time. Many regulations, especially the likes of BCBS (Basel Committee on Banking Supervision) make this mandatory. However, fundamental principles must be replicated across organizations and projects.
– Classification: sort out and categorize data into various domains, forms, or any other distinct classes so that users can use it later. This helps in the latter stages in running very domain specific requirements based on a cluster of data.
– Preparation: internal data preparations or any external data procurements need to be done centrally. Identification of golden sources of data inside the organization and through various public data sources (e.g., Amazon’s open data repository, government websites, trends, etc.) must be considered while preparing the data for analytics purposes. Time spent preparing data upstream helps the team get a variety of outputs later.
• Data management teams focus on data catalogues and metadata management.
– Catalogue: offer various catalogues to business and IT domains defining what data is available, in which format, and how it should be used or accessed. This helps when trying to integrate data across the organization.
DATA ANALYTICS | UNIFYING DATA SILOS: HOW ANALYTICS IS PAVING THE WAY
Table 2: Data governance
FORMALIZE DATA ROLES AND OWNERSHIPS, GOVERN DATA PROGRAMS
DATA DISCOVERY
DATA MANAGEMENT
DATA CURATION
• Data profiling
• Lineage
• Classification
• Preparation
• Data catalogue
• Metadata
• Data retention
• Data quality
• Storage
• Security and encryption
• Access and authentication
• Audit capability
Figure 7: Example – investment behavior based advisory ideas
USE-CASE 1
Data collection and aggregation from various
data sources on client and investment behavior
USE-CASE 2
Filtering and clustering of users and instruments
into groups
USE-CASE 3
Recommendation analytics combined with CIO recommendations
USE-CASE 4
Legal, profiling, and suitability checks
USE-CASE 5
Integration of insights into desktop of advisors
1 2 3 4 5

90 /
– Metadata: describes the content about the main data itself. It captures information on who created the data, when was it created, where was it created, and the other keywords associated with it. These are useful for various optimizations, search, and classification purposes.
– Retention: any data used in production has its own legal requirements around recordkeeping, generally for five to seven years. After this period, the data needs to be deleted. Regulations like GDPR (General Data Protection Regulation) also advocate strict requirements with regards to how long data should be retained.
– Quality: monitoring and measurement of data points must be executed at key lifecycle phases. Data quality should be used as key metrics to incentivize data owners.
• Data curation team formalizes requirements on data throughout its lifecycle, from creation and initial storage to the time when it is archived or becomes obsolete.
a) Storage: this includes any local storage, physical storage, or even cloud storage used to save files and perform the necessary computations. As the size of data starts increasing, storage and computation must be addressed in a different manner.
b) Security and encryption: security by design is quite essential across analytics projects and tools.
c) Access and authentication: any datasets being accessed and analyzed must be based on key legal guidelines and access must be restricted wherever possible. Analytics are done with a set of core principles and data ethics must be respected.
d) Audit capability: even when experimenting, auditability must be ensured. It is easy to get lost in the world of algorithms. If one cannot explain an algorithm and clearly enumerate and explain the results, then it could become problematic.
Data analytics implementation remains a journey where one needs to strategize, design, execute, and optimize. Tools, products, and people are added as one advances. As requirements become advanced, there may be a need to adopt a different solution or even different vendor products. Mostly, it is never one-size-fits-all, however certain key points need to be considered (Table 3):
• Strategy: the strategy addresses the key business objectives. The business and correspondent IT capabilities need to be defined for the next three to five years. The use-cases that are required need to be defined in detail with their proper justifications and actual needs. There should also be a boundary set stating what is, and what is not, possible with the available datasets.
• Design: with so many complex datasets available and so many choices to execute, the designing phase makes it clear how data will be managed and how analytics will be performed. The architecture and infrastructure blueprints to be used for the next phases are defined here. Data breaches, privacy, execution principles, tool, and platform selections need to be considered with the business objective in mind. With strict compliance regulations, such as GDPR, there should be a renewed focus on handling sensitive data. Designs must consider end-to-end channel integration and make data readily available to the team for execution.
Table 3: Building analytics capability
ANALYTICS CAPABILITY
STRATEGY DESIGN EXECUTE OPTIMIZE
• Business use-cases
• Overarching strategy
• Architecture
• End-to-end channel design
• Dataset identification and procurement
• Build analytics solutions
• Modernize platforms
• Metrics improvement
• Service models
Center of excellence SMEs and capabilities
Tools and solutions Analytics solutions, sandboxing
DATA ANALYTICS | UNIFYING DATA SILOS: HOW ANALYTICS IS PAVING THE WAY

91 /
• Execute: each firm follows its own execution methodology. Be it agile or waterfall, the firm must determine the best way to execute. The execution phase is where results drive the modern analytics platforms forward. Analytics changes tend to become expensive. Small changes may trigger other changes across multiple areas. It is essential that firms start managing all costs across lifecycle for these changes.
• Optimize: no perfect dataset and solution combination ever exists. Analytics can always improve upon an existing situation. Many companies are also working on cleaning and aggregating data. However, the real transformation happens when the results and insights are integrated back into business systems. The results of execution must flow back to systems where they can be checked as to how their metrics have improved overall.
• Center of excellence: as solutions start maturing and require higher levels of customization, there are specialists who can serve these unique areas far better. Firms can achieve their various specializations with just a few dedicated people and offer tailored and targeted solutions.
• Tools and solutions: there is no one-size-fits-all standard tool available. Organizations tend to adapt to hybrid solutions and designs for different purposes. It is wise to focus on just a few tools, libraries, products, techniques, and frameworks based on the strengths and business domains. These must evolve and scale up while one progresses.
9. CONCLUSION
Data silos in the modern world will continue to increase. The types of data, tools, solutions, and the vendors will evolve and consolidate. To make data available at the right time, at the right place, and in the right format should be the key focus for financial services firms. To achieve this, firms should start unifying their data silos. They must glean advanced insights from their data and integrate the results back to the business for better decision making. By doing this, it will improve their ability to anticipate and quickly respond to evolving demands, be it revenue generation, customer servicing, operational costs, risk monitoring, or meeting various regulatory requirements themselves. To conclude, we also summarize key dos and don’ts that one must consider while driving analytics programs:
1. Do start with clear business case in mind.
2. Analytics may not be a mega IT project. Do demonstrate values in quick sprints.
3. Data driven culture requires new ways of working and delivery. Do drive change management around analytics programs.
4. Do not experiment with random use-cases based on some buzzwords. Always build a specific analytic capability.
5. Do not wait for end-to-end infrastructures, solutions, tools to be ready before launching analytics projects. Start with a small business case where value can be demonstrated.
DATA ANALYTICS | UNIFYING DATA SILOS: HOW ANALYTICS IS PAVING THE WAY

92 /
D ATA I N T E L L I G E N C E

94 Data entropy and the role of large program implementations in addressing data disorder Sandeep Vishnu, Partner, Capco Ameya Deolalkar, Senior Consultant, Capco George Simotas, Managing Principal, Capco
104 Natural language understanding: Reshaping financial institutions’ daily reality Bertrand K. Hassani, Université Paris 1 Panthéon-Sorbonne, University College London, and Partner, AI and Analytics, Deloitte
110 Data technologies and Next Generation insurance operations Ian Herbert, Senior Lecturer in Accounting and Financial Management, School of Business and Economics, Loughborough University Alistair Milne, Professor of Financial Economics, School of Business and Economics, Loughborough University Alex Zarifis, Research Associate, School of Business and Economics, Loughborough University
118 Data quality imperatives for data migration initiatives: A guide for data practitioners Gerhard Längst, Partner, Capco Jürgen Elsner, Executive Director, Capco Anastasia Berzhanin, Senior Consultant, Capco

94 /
SANDEEP VISHNU | Partner, Capco
AMEYA DEOLALKAR | Senior Consultant, Capco
GEORGE SIMOTAS | Managing Principal, Capco
expanding set of applications that provide insight and value to customer and stakeholder segments. In addition, banks face changing regulations, new privacy laws, and a growing need to integrate with third-parties, all of which place additional demands on their data infrastructure.
As organizations launch initiatives that significantly alter business and IT operations, they increasingly face complications and risks driven by data complexity, which in turn surfaces challenges commonly faced by organizations tackling strategic change, including:
• Derived data elements created for specific solutions that need to be continuously maintained over time as other data structures evolve
ABSTRACTClutter is a highly pervasive phenomenon. Homeowners are very familiar with this occurrence as their acquisitions grow to fill available space. Closets, garages, basements, and many areas not in obvious sight become dumping grounds for things that do not have immediate utility or a logical place in the house. Now think of a scenario where the volume, velocity, and variety of goods entering the house goes up by several orders of magnitude in a very short period of time. The house will simply start to overflow with articles strewn wherever they can fit, with little thought given to order, use, and structure. Enterprises face a similar situation with data as volumes have grown dramatically over the last two to three years. Organizational reluctance to retire or purge data creates overflowing repositories, dark corners, and storage spaces full of outdated, unseen, and difficult to access information – i.e., data clutter. Temporary fixes only add layers to the problem, creating additional waste, maintenance challenges, damage, inefficiency, and improvement impediments. All these factors drive data entropy, which for purposes of this paper is defined as the tendency for data in an enterprise to become increasingly disorderly. Large programs are often data centric and surface data clutter issues. This paper explores the concept of data entropy in today’s world of rapidly expanding data types and volumes entering an organization at exponentially higher speeds, and how large program implementations can be used as catalysts to address data clutter and modernize the data supply chain to streamline data management.
DATA ENTROPY AND THE ROLE OF LARGE PROGRAM IMPLEMENTATIONS IN
ADDRESSING DATA DISORDER
1. INTRODUCTION
Over the last few years, data generation has risen exponentially causing organizations to immensely accelerate their ability to store, process, and use data. Every visionary company in the world is working towards leveraging data to differentiate themselves, provide better customer experience, and fuel growth. In large financial institutions, these strategies often clash with legacy systems and architectures, which can accommodate incremental increases in utilization but are inadequate when faced with exponential growth.
With competition from fintech startups and consumer expectations on the rise, financial institutions are leveraging data from an increasing number of data sources to feed an

95 /
• Use of temporary data structures and workarounds that become permanent components of the technology ecosystem
• Extra project work required to develop data for specific applications, which further adds to overall data complexity.
Simply put:
Data complexity = f (derived data elements, number of systems, number of independent data stores, data uses)
For instance, a large program – like CCAR (comprehensive capital analysis and review) or FDIC370 – will have data elements required by the business shared across multiple
DATA MANAGEMENT | DATA ENTROPY AND THE ROLE OF LARGE PROGRAM IMPLEMENTATIONS IN ADDRESSING DATA DISORDER
systems, databases, and uses as shown in Figure 1. The same data element lives in multiple databases with different names and may be transformed by each user as needed.
Adding new or changing existing lines of business impacts applications, databases, and users. Business, systems, and data have a tightly interconnected relationship – for example, business process enhancements trigger changes in the existing IT infrastructure. Every business element required in the process resides in systems, databases, and consumer use-cases as one or many data elements. Every new application, data store, or use-case increases overall complexity. Figure 2 provides an example of key drivers needed to meet FDIC370 requirements and how they impact data elements, systems, databases and users.
Figure 1: Requirements drive data complexity
Figure 2: Business and process elements drive data complexity and FDIC 370 costs for specific covered institutions
Source: FDIC 370 Recordkeeping for Timely Deposit Insurance Original Rule Making Commentary
DATA ELEMENTS SYSTEMS DATA USESDATA STORES
Unique customer IDs
Grantors
Beneficiaries
Beneficiary government ID
Ownership rights and capacity codes
Uninsured deposit amounts
Fiduciary account indicators
Pending file reason codes
Core deposit
Trust
Mortgage
Digital
Investment (brokered deposits)
Mortgage
Wealth management
Customer information files
Beneficiary tables
Call reporting
Regulatory reporting
Data lakes
Alternative recordkeeping entity files
FDIC 370
FR 2052a
Liquidity analysis
Omnichannel support
Customer analysis
DATA ELEMENTS SYSTEMS DATA STORES DATA USES
NUMBER OF DEPOSIT ACCOUNTS
DISTINCT CORE SYSTEMS
NUMBER OF LEGAL ENTITIES AND GEOGRAPHIES
SWEEP ACCOUNTS
BUSINESS, PRODUCT, AND ACCOUNT FEATURES

96 /
Unless proactively managed, each increase in complexity drives up program cost, compliance risk, and inefficiencies. Much like that homeowner, “boxes” of independent data pile up over time and start to clutter the overall environment.
The good news is that these challenges can be mitigated by using a variety of emerging practices. These can be as simple as formulating a common framework for data assessment and lineage to very significant architectural changes designed to allow individual applications to plug into centralized services and data sharing pipelines. The key to effective data governance is proactive and constant vigilance against the build-up of data complexity. Like that nagging feeling when you open a certain closet in your house, the organization needs to have a sense of when things are starting to get out of hand.
Often a large program like CCAR or FDIC370, can trigger a good old-fashioned spring cleaning and prompt the organization to implement leading data governance and management practices.
2. DATA GOVERNANCE AND MANAGEMENT CHALLENGES
Large financial services organizations (FSOs) face data challenges largely as a result of constantly changing business objectives, regulations, and evolution in technology. As data moves through systems and processes in an organization, complexity often grows. Data discrepancies in a single node of a network could have a cascading effect throughout an organization, as illustrated in Figure 3.
These situations occur naturally at different points in the data pipeline. Data management is complex and a change to even a single data point can create cascading challenges across the organization and data stores. When this occurs frequently, multiple changes pile up and interact – like the growth of items over time in a basement or garage.
Efficient data governance and management with well documented metadata, continuously maintained data dictionaries, data access policies, and data retention policies can help avoid these issues. However, organizations keep growing with large business programs that have timelines and goals. When timing considerations become paramount, data governance takes a back seat, which adds to data clutter instead of addressing it. Just like a spring-cleaning project, organizations need to establish thresholds and monitoring that can signal when data complexity has reached a level that requires action.
We have identified three of the biggest drivers of change in an organization that make maintaining good data governance difficult: (1) incomplete M&A integration, (2) business process changes, and (3) technology inconsistencies (e.g., old data structures from outdated systems and applications, mixed coding schemas). Large programs that implement the above-mentioned organizational changes often work around data governance practices, thereby creating data inefficiencies and increasing data complexities, when they could be used as catalysts to solve data disorder. Inefficient data governance in turn adds data complexity, which makes data governance and management challenging, thereby creating a vicious cycle. Data complexities associated with each driver or change are discussed in greater detail below.
Figure 3: Cascading impacts of data
DATA IMPACTS
BUSINESS PROCESS/ TECHNOLOGY CHANGE
INCORRECT AND INCOMPLETE DATA PERSISTING DOWNSTREAM
IMPACTS TO REPORTING DUE TO INCORRECT DATA
IMPACTS TO RISK ANALYSIS DUE TO INCOMPLETE DATA
DOWNSTREAM ETL FAILURES BECAUSE DATA PERSISTING DOES NOT MATCH DDL
ISSUES IN DATA GOVERNANCE DUE TO IMPROPER DATA DOCUMENTATION
IMPACTS PROPAGATE THROUGH AN ORGANIZATION TO ITS CONSUMERS AND HAS CASCADING EFFECT
ENTERPRISE DATA MANAGEMENT
DATA MANAGEMENT | DATA ENTROPY AND THE ROLE OF LARGE PROGRAM IMPLEMENTATIONS IN ADDRESSING DATA DISORDER

97 /
2.1 Incomplete M&A integration
Mergers and acquisitions are common in the financial services industry. These are increasing with large banks acquiring fintech startups and data providers for a competitive edge. Such a transaction not only integrates businesses but also IT infrastructures and data. This includes integration of data governance policies, data management principles, retention policies, and metadata management, to name a few. In general, M&As increase complexity of data and by extension data entropy.
M&As would bring ‘n’ new systems and the underlying data into an organization. During M&As, data integration is sometimes short-changed, as aggressive deadlines and resource shortages increase the pressure on business and IT personnel. Frequently, data conversion and integration becomes an afterthought and does not get handled effectively – the business believes that IT is on point and IT believes that it is a business activity. This lack of clarity on activities and accountabilities can have significant consequences for a business. Incomplete integration of data leaves M&As with a big liability, which could impact every strategic initiative for the new combined entity.
Incomplete integration of data prevents comprehensive analysis of data from both organizations and the establishment of a common governance framework. Lack of insight on available data becomes an issue when combined data from both organizations is required. Temporary fixes will often be made to meet such requirements. While not optimal, this approach may sometimes be required to meet deadlines. Organizations make major investments that can often not wait for all data issues to be resolved before realizing gains. One fix could be to create a temporary data store with data load processes that extract data from different sources, transform data as required, and load it into the store. Incomplete analysis of data stores in both organizations would create new, redundant, or unnecessary datasets, which would further increase complexity. For example, when two banks merge, temporary regulatory reporting data sets need to be established for FDIC 370 purposes along with several related compliance requirements, such as call reporting, CCAR, etc. As a result, ‘m’ independent data stores are added to the overall complexity.
Organizations going through a M&A process are expected to have common data elements with information on their customers and business. Both organizations have a considerable number of derived data elements for their business processes. Performing detailed analysis of data from
both organizations can help identify common data elements and reduce the number of derived data elements in the new combined organization. Reducing the number of derived elements ‘d’ would help control the data complexity which can now be expressed as:
Data complexity = f (d + derived data elements, n + number of systems, m + number of independent data stores, data uses)
These issues create risk of delay in the successful implementation of the venture, risk of having bad or incomplete data, and will take a toll on the cost and number of resources required to execute the venture. It is important to bear in mind that the ability to meet the objectives of a strategic acquisition or merger will depend greatly on the combined data from both the organizations. Data can become a huge asset, offer significant insight, and serve as a source of competitive advantage. However, this value can only be realized if the organization succeeds in efficiently integrating and managing the data.
2.2 Business process changes
The financial services industry has undergone significant disruption over the last decade or so, with increased regulation, continuous technology innovation, and changing customer preferences. To adapt, financial institutions have evolved business processes to not only efficiently manage the existing portfolio of products and services, but to also incorporate new products, new consumers, and new business rules. However, these changes have major impacts on data governance and management.
Data governance often gets short shrift when executing changes that are vital for the overall success of the organization. A financial services company with several business units and products like credit cards, housing finance, personal banking, and wealth and asset management will likely have frequent changes in business processes in each of these units. However, not all of them will follow all relevant data governance and data management procedures. For example, FDIC 370 may require source system changes and modifications to data structures within individual applications to achieve compliance, and an ongoing process for handling change to maintain compliance. Business process changes have the potential to add new data in the organization, which means an addition of new data uses ‘u’ and derived elements ‘d’. Addition of new use-cases and derived elements adds to the existing problem of incomplete traceability from data sources to data consumers. As mismanaged data from each
DATA MANAGEMENT | DATA ENTROPY AND THE ROLE OF LARGE PROGRAM IMPLEMENTATIONS IN ADDRESSING DATA DISORDER

98 /
business transformation program keeps accumulating, data duplication and overall disorder starts to creep up – back to data entropy.
To meet strict delivery timelines with resource constraints, business transformation programs will often cut corners. The organizational strategy of governing data assets to efficiently provision data for downstream consumers may be ignored and a solution for provisioning data on the fastest and cheapest route can get implemented. This is common in organizations where project sponsors, stakeholders, data stewards, and consumers are not aligned on the enterprise data strategy or enforcement is poor. This misalignment will result in data solutions being implemented in silos without leveraging enterprise architects and data architects, thereby creating inefficient workarounds. Siloed implementations that do not involve data governance teams that are responsible for managing metadata and maintaining the data glossary result in incomplete documentation. Siloed solutions can also create unnecessary data transformations implemented as a workaround to provide required data quicker. This will add an additional complexity of ‘e’ derived data elements. A business transformation process will now transform the complexity to:
Data complexity = f (d + e) derived data elements, number of systems, number of independent data stores, u + data uses)
Business process changes implemented without an efficient solution for managing data change are a constant threat to an organization’s data governance framework. The main challenge for the governance and management team will be to maintain a delicate balance – on one hand, enforcement of policies will delay the execution of the change and on the other, not implementing policies will create more problems in the future.
2.3 Technology inconsistencies
Structured data, unstructured data, big data, machine learning (ML), blockchains, and all the other emerging technologies are now buzzwords in every organization. Rise in social media and IoT (Internet-of-things) generated data has exponentially increased the ability to improve intelligence on customer preferences. This data is ingested and persists in many different formats, requiring a variety of technology solutions to process, organize, analyze, and present. What adds to the chaos is that advanced technologies required to ingest and process this data have to integrate with legacy architectures and code bases. Having volumes of data and advanced technologies like big data, ML, and data lakes is of no use if existing applications in an organization cannot consume this data. A large organization typically has hundreds of applications and it is unrealistic to expect that they will immediately switch to new data formats and subscribe to advanced data provisioning technologies.
Figure 4: Retrofitting new data into existing data structures
CURRENT STATE FUTURE STATE
TRANSACTIONAL SYSTEM
TRANSACTIONAL SYSTEM
DATA HUB DATA HUBCONSUMERS CONSUMERS
Transactional datastore
Transactional datastore
Consumer TDS
Consumer TDS
Operational data store/
data warehouse/data lake
Operational data store/
data warehouse/data lake
BI/analytics BI/analytics
Transactional tables
Transactional tablesDATA
MOVEMENTDATA
MOVEMENT
DATA IN DIFFERENT
FORMAT
Transactional tables
Transactional tables
AI/ML AI/MLBusiness transactions
Business transactions
External third-party
ANALYSIS TO MAP NEW AND LEGACY
FORMAT DATA
COMPLEX TRANSFORMATIONS TO RETROFIT INTO
EXISTING DATA STRUCTURES
DATA MANAGEMENT | DATA ENTROPY AND THE ROLE OF LARGE PROGRAM IMPLEMENTATIONS IN ADDRESSING DATA DISORDER

99 /
As the systems increase by ‘m’, they process more data in different formats, which increases demand for data resulting in provisioning of more data stores ‘n’, in turn increasing the number of derived elements ‘d’, thereby increasing the number of consumers ‘u’. This brings the data complexity to:
Data complexity = f (d + derived data elements, m + number of systems, n + number of independent data stores, u + data uses)
Data ingested in different formats will now have to be transformed to fit legacy data structures. This is generally a substantial and resource intensive mapping exercise, which is complex to begin with and further compounded by incomplete data dictionaries and loosely modeled databases. Complicating matters further is the compatibility of technology solutions that enable data movement. Large organizations have several legacy IT components that may not work well with newer technology solutions. Substantial re-coding and re-architecting may be required to make things work seamlessly. These technology inconsistencies are a challenge to the data governance structure in an organization. Since there is no unambiguous solution, a lot of harmful workarounds can proliferate across the enterprise. Figure 4 illustrates a business process change where external data is added for better business decisions. When consumer adoption is not possible within the timeline and budget, a workaround is executed for data to be retrofitted to existing data structures. While this may superficially be quicker, it will likely turn out to be more expensive in the long run.
Retrofitting adds several transformation rules to derive existing data elements from new data sources. This adds ‘e’ elements to the overall complexity:
Data complexity = f (d + e) + Derived data elements, m + number of systems, n + number of independent data stores, u + data uses)
A complex data ecosystem relies on good metadata documentation and data dictionaries, which clearly define data elements and how they relate to each other. Data governance suffers when metadata and data dictionaries are not managed and documented, which is more likely to occur as complexity increases.
3. IMPACTS TO DELIVERY OF LARGE PROGRAMS
The importance of establishing and maintaining good data governance should have become apparent by now.
We have seen how data can turn into a major liability if it is not well managed. Threats to governance are plenty and not easily avoided. An organization needs to treat data governance as an ongoing activity, which gets stronger with every business initiative, merger, or technology implementation. Enterprise operations drive data entropy and large program implementations offer the potential to move towards better data order.
3.1 Quality issues and costs for on-going data quality teams
Inefficient data governance and management increases data quality issues, which surface while consuming and analyzing data across use-cases. For example, institutions may be looking to utilize a larger pool of customer data for up-sell, cross-sell, retention, and win-back purposes. Identifying and creating a unique ID for each individual account holder,
DATA MANAGEMENT | DATA ENTROPY AND THE ROLE OF LARGE PROGRAM IMPLEMENTATIONS IN ADDRESSING DATA DISORDER

100 /
beneficiary, and beneficial funds owner is required under FDIC 370, forcing covered institutions to address this issue. Most institutions still do not have a holistic single view of the customer. However, a large implementation like FDIC 370 can make it a core requirement and develop the capability for enterprise-wide use (Figure 5).
It should be apparent how bad data governance can hamper a venture that depends on good quality customer data. If good governance and management structure is not established between the two merged firms, this task will run into issues like:
• Different physical names for the same data element
• No data dictionary to identify the correct data elements from the new organization
• Erroneous results due to the use of incorrect data elements
• Incompatible metadata resulting in duplication of effort and resources lost in matching metadata between the two organizations
• Inconsistent data standards between the two organizations requiring resources to develop data transformation services
• Resources spending time in identifying the correct data to use instead of deriving insights.
As seen in the example above, identifying good quality data is of utmost importance for successful execution of a business venture. Organizations have established data quality teams that have infrastructures in place to ensure completeness and accuracy of data. When regular data flow is disrupted because of a business transformation (as detailed in Section 2.2 above) or integration with new technologies (as mentioned in Section 2.3 above), then the data quality infrastructure needs to adapt or change. It is sound data governance practice to do this, and most organizations do a good job of implementing data quality checks on major data stores and systems of record. However, it is the temporary data objects that can cause data quality nightmares. These temporary data objects create data duplication, which confuses the data consumer and may result in the use of incorrect data.
Data disorder also happens when new technologies and data standards are integrated. New data elements from a well-structured data model are mapped to legacy databases, which is done purely based on business definitions that may or may not be well documented. Often, organizations try to forcefully retrofit in order to serve data consumers that may not be receptive to change. Such instances exacerbate data quality issues arising from incorrect mapping, change in data batch job frequencies, change in valid values, and rounding versus truncating, to name a few. This causes data quality teams to spend extra time in analysis by navigating complex data mappings and system changes to identify the source, which requires additional resources and increases cost.
Figure 5: Incomplete M&A integration
Source: Joss (2016)1
ARE ALL THESE THE SAME “CUSTOMER”? ARE ALL THESE THE SAME “CUSTOMER”?
CORE CUSTOMER
CORE CUSTOMER
CARDS CUSTOMER
CARDS CUSTOMER
LOANS CUSTOMER
LOANS CUSTOMER
SHARES CUSTOMER
SHARES CUSTOMER
COMPANY AB
HOW DO I SEE “CUSTOMER”
ACROSS THE MERGED ORGANIZATION?
1 Joss, A., 2016, “The role of data in mergers and acquisitions,” Informatica, December 16, https://infa.media/2oYDpdz
DATA MANAGEMENT | DATA ENTROPY AND THE ROLE OF LARGE PROGRAM IMPLEMENTATIONS IN ADDRESSING DATA DISORDER

101 /
3.2 Project inefficiencies
A project is ideally based on a business vision or regulatory mandate. The ability of a vision to be executed depends largely on the impacts to current data, which further impact processes and consumers. The roadblocks and costs associated with mitigating these impacts have a huge influence on the scope of the project. Such initiatives often face large complications and risk, mostly in relation to data.
As mentioned in section 2.2 above, the relationship between business, systems, and data is highly connected and linked. Projects often do not prioritize data as much as the other two. Data typically comes into picture when the project is progressing with full steam, but then hits a bump caused by data quality issues and data governance workarounds. Project teams have to then rework some of their timelines, deliverables, and objectives, thereby creating inconsistencies and inefficiencies. The other approach that teams often take is to build workarounds – and we are back to data entropy. Figure 6 provides an example (from FDIC 370) of how legacy data complexities increase overall program implementation costs.
In addition to cost, program inefficiencies also come in the form of slower time to market. Inefficient data governance increases complexity and these complexities create roadblocks in implementation of large programs. Increased data complexity requires greater analysis and more time spent on data lineage,
including sources and transformations. IT implementation teams face challenges with complex transformation logic and increased cost of data changes in multiple data stores that may have similar data.
4. LARGE PROGRAMS – A CATALYST FOR CHANGE
Clutter of our personal belongings is generated when we acquire new possessions and decide we need our old belongings as well. Surprisingly, it is these acquisitions that often trigger a need to clean-up our old belongings. Similarly, in the data world, a large program disrupts data governance and creates clutter, but it also presents an opportunity to reduce data entropy and drive data agility.
We have seen how large programs increase complexity and disrupt data governance, which in turn increases the net complexity that impacts delivery of large programs. Complexity is not a binary phenomenon, instead it operates on a continuum. Some level of data complexity is necessary to support business objectives and enable operational agility. An organization needs to establish guidelines or guard rails to indicate when data complexity is becoming worrisome and needs to be addressed. Establishing risk, cost, and benefit thresholds will help an organization determine when initiatives are material enough to warrant broader data management considerations beyond the needs of the specific program or project.
DATA MANAGEMENT | DATA ENTROPY AND THE ROLE OF LARGE PROGRAM IMPLEMENTATIONS IN ADDRESSING DATA DISORDER
FDIC 370 costs ~$1 dollar per deposit account to implement
75 cents out of each dollar spent on FDIC 370 implementation costs are driven by data complexity
50 cents out of each dollar spent on FDIC 370 implementation costs are driven by legacy data issues
Source: FDIC 370 Recordkeeping for Timely Deposit Insurance Original Rule Making Commentary
47%
50%
Figure 6: Data complexity drives average FDIC 370 implementation costs
Reporting
Data extraction
Data standardization
Aggregation of data
Legacy data cleanup0% 10%
1%
5%
8%
13%
20% 30% 40%

102 /
The solution then becomes straightforward. If complexity is driven by the number of systems, data stores, derived data elements, and information uses then an organization should leverage individual initiatives that reduce the impact of those variables. This can be achieved through:
• Eliminating outdated or partially used applications and migrating to a single, common platform: it may seem counterintuitive that the savings from keeping smaller legacy systems out of scope would be overwhelmed by future, hidden data management costs.
• Re-architecting systems around a common data backbone: to enable individual applications to leverage centralized services and isolate older systems and data structures. This is akin to many cloud implementations where application datasets leverage common utilities such as customer masters in an on-demand fashion to maintain data consistency while enabling flexibility.
• Conducting periodic data cleaning: at times, projects and M&A integrations are not fully completed, as resources become scarce and enterprise focus shifts elsewhere. Just as those junk drawers also need to be periodically cleaned, organizations should complete projects and remove temporary workarounds or fixes and eliminate those data “loose ends” that end up permanently in the back of the closet.
• Establishing and utilizing common data definitions: this becomes critical when managing related regulatory reporting regimes such as FDIC 370, CCAR, call reporting, and 2052a. Similarly, common datasets across business units and lines of defense are often overlooked and can be streamlined during specific initiatives to the long-term benefit of the organization.
• Capturing data in source systems using common data definitions: this reduces the amount of data derivation required, enables faster system migrations as data anomalies are limited, and supports easier maintenance of centralized data pipelines.
• Creating simple frameworks for data assessment and lineage: will strengthen overall data management.
5. CONCLUSION
Large programs present an opportunity to implement leading practices in data management. An organization that instills a culture where data is seen as an enterprise asset will be successful in ensuring that every large program contributes to the enhancement of the organization’s data ecosystem. Large programs come armed with budget, resources, executive support, and a mandate for change. Enforcement of data governance and upholding standards can go a long way in managing complexity in large programs.
Case study: Resolving enterprise data clutter through FDIC 370 implementation
The FDIC began work on a new rule for Recordkeeping for Timely Deposit Insurance Determination shortly after the financial crisis. After resolving IndyMac and facilitating the sale of Wachovia to Wells Fargo in 2009, the FDIC recognized that the largest banks had too complex of a technology and data environment to enable efficient bank takeover in the event of a failure. As an answer, the FDIC shifted the burden for maintaining information and developing an application to all large financial institutions to calculate deposit insurance, report on beneficial ownership, and quickly make funds available to depositors.
To comply with FDIC 370, Covered Institutions (CIs) are required to create a unique identifier for each customer, assign the appropriate FDIC ownership code to each account, confirm that supporting documentation exists to support these classifications, and run the deposit insurance calculation by aggregating ownership across these categories. In addition, FDIC 370 banks need to be able to quickly ingest information from third-parties to complete insurance calculations within a short time after failure. Finally, banks need to produce reporting that supports annual certification of IT capabilities by the CEO/COO. This data driven compliance effort has exposed covered institutions to many legacy data challenges.
Large banks have complex data environments. CIs have had to integrate data from a variety of source systems, establish unique customer IDs across platforms, map data into centralized data stores, and create new data outputs derived through the assignment of FDIC ownership codes and deposit insurance calculation. This rule has driven institutions
DATA MANAGEMENT | DATA ENTROPY AND THE ROLE OF LARGE PROGRAM IMPLEMENTATIONS IN ADDRESSING DATA DISORDER

103 /
to create new data stores, complete master customer record initiatives, and remediate legacy data from prior mergers and across the enterprise. However, CIs have also used the requirements of FDIC 370 to address data complexity and position the organization for future opportunities.
Some institutions, in preparing for FDIC 370 have linked its requirements to core deposit transformation initiatives. FDIC 370 requires banks to collect new and updated information at the time of customer onboarding, account opening, and maintenance for both. Linking these compliance requirements to changes in customer or deposit operations enables the bank to achieve business enhancement while meeting the compliance requirements for improved data. In addition, streamlining data capture processes reduces data variability enabling stronger analysis of customer activity. This enables cleaner data to feed product level analytic processes and customization of client specific offers.
FDIC 370 requires banks to be able to ingest data from third-parties on individual account holders and beneficiaries. This has prompted CIs to leverage standard data structures for bringing information into the deposit insurance calculation processes. Standardization of data inputs into the centralized calculation engine also enables these banks to connect with other internal systems in a streamlined manner.
In many cases, FDIC 370 banks have grown through acquisition. As a result, the CI has inconsistent data structures as legacy account and customer setups were often not integrated into common data structures. Supporting documentation, such as signature cards, were never scanned into imaging systems. Data analysis has highlighted the existence of these anomalies leading to systematic or manual data remediation and customer outreach. In some cases, AI use-cases have been identified to accelerate the clean-up processes. Addressing FDIC 370 with an AI toolset has enabled the institution to experiment with emerging technologies and use them to address specific business and compliance needs.
CIs have established common data definitions for both operational and other regulatory reporting requirements. The annual summary reporting and certification requirements align to CCAR, Call Reporting, and 2052a. Progressive institutions
have directly linked FDIC 370 to these other efforts and aligned data elements and specific aggregations of information to enhance all related programs.
One question FDIC 370 banks have addressed is the degree to which data should be developed and assigned at a source system level or be derived later. A key element in the data stream is the mapping of accounts to FDIC Ownership Rights and Capacity codes. These codes are FDIC based ownership categories that banks have not previously needed to maintain. In most cases, these codes are derived based on combinations of account tiles, relationships, customer types, and product indicators. In some cases, banks need to derive data elements to do this mapping, such as an indicator if the trust is revocable or irrevocable. Some banks have chosen to completely derive this data. However, other institutions are pushing these business rules into core deposit systems and will display the ORC assignment as the account level. This enables front line staff to aid customers in understanding insurance coverage and managing account types to maximize this benefit.
Most FDIC 370 CIs have completed some form of customer alignment. This ranges from data quality initiatives to reduce the number of duplicate customer records to complete redevelopment of customer master files. FDIC 370 requires banks to be able to uniquely identify each customer and tie all accounts to each individual. This has included linking non-core systems such as wealth or trust into these efforts. Completing customer related master data management opens the door to future omnichannel services and enables the institution to gain a better view of customer activity to link to future growth opportunities.
In general, FDIC 370 has served as a catalyst for reducing data clutter and improving data management. Institutions that had more proactively managed their data environment have had an easier time implementing FDIC 370 requirements. Just like the homeowner who periodically cleans out and organizes the basement or garage, organizations that have embraced leading practices in data management have found themselves better prepared for significant projects and are able to manage data clutter and data entropy.
DATA MANAGEMENT | DATA ENTROPY AND THE ROLE OF LARGE PROGRAM IMPLEMENTATIONS IN ADDRESSING DATA DISORDER

104 /
BERTRAND K. HASSANI | Université Paris 1 Panthéon-Sorbonne, University College London, and Partner, AI and Analytics, Deloitte1
In order to make sure that the terms introduced above are clear, the concepts behind are now introduced. The first one, natural language processing (NLP) [Collobert et al. (2011)], simultaneously belongs to the subfields of linguistics, computer science, information engineering, and artificial intelligence (AI). NLP deals with the interactions between computers and human languages, and as such how computers are processing and analyzing large quantities of natural language data. Natural language understanding (NLU) [Liu et al. (2019)] is itself a subtopic of NLP that deals with machine accurate comprehension of languages, i.e., tone, nuances, etc. NLU is considered an AI-hard problem, i.e., it implies that the complexity of these computational problems is equivalent to that of solving the central AI problem; in other words, making computers as intelligent as people. This would require advanced approaches as the problem would not be solved by a simple algorithm. NLU is usually used on top of
ABSTRACTThough in the past, data captured by financial institutions and used to understand customers, processes, risks, and, more generally, the environment of financial institutions was mainly structured, i.e., sorted in “rigid” databases, today, that is no longer the case. Indeed, the so-called structured data is representing no more than a drop in an ocean of information. The objective of this paper is to present and discuss opportunities offered by natural language processing and understanding (NLP, NLU) to analyze the unstructured data, and automate its treatment. Indeed, NLP and NLU are essential to understanding and analyzing banks’ internal way of functioning and customer needs in order to bring as much value as possible to the firm and the clients it serves. Consequently, while we will briefly describe some algorithms and explain how to implement them, we will focus on the opportunities offered as well as the drawbacks and pitfalls to avoid in order to make the most out of these methodologies.
NATURAL LANGUAGE UNDERSTANDING: RESHAPING FINANCIAL INSTITUTIONS’
DAILY REALITY
1. INTRODUCTION AND MOTIVATION
Financial institutions’ current objective or fantasy – as it is a matter of opinion – of full automation requires several things to become reality, such as a complete capture of information (structured and unstructured data) pertaining to the customers and the bank itself, i.e., behaviors and needs evolution over time, dynamic risk exposure, perception of bank activity, and so on and so forth. Though techniques that rely on structured data to score customers, to understand their needs, and the products that might suit them have been used for years, and is nowadays quite advanced, the solutions using unstructured data are still far from being fully deployable at an industrial level, in particular when it comes to natural language processing, natural language understanding, and even more when it comes to natural language generation.
1 The opinions, ideas and approaches expressed or presented are those of the author(s) and do not necessarily reflect any past or future positions of Deloitte. As a result, Deloitte cannot be held responsible for them.

105 /
2 https://bit.ly/351nrja3 https://bit.ly/2Dq2KBQ4 https://bit.ly/2WhtQBW5 https://bit.ly/358LWLB6 https://bit.ly/1UhoArW7 https://bit.ly/2Vc07e7
NLP algorithms utilizing context from recognition devices (automatic speech recognition (ASR): Qin et al. (2019), personalized profiles, etc.), in all of its forms, to decipher the meaning of sentences to execute the implied intent. NLU aims at informally assessing the probability of that intent. Finally, natural language generation (NLG) [Tran and Nguyen (2019)] consists of a program able to answer queries as if a human being was talking or writing.
There is considerable commercial interest in the field of NLP-NLU. Its application to automated reasoning, machine translation, question answering, news-gathering, text categorization, voice activation, archiving, and large-scale content analysis generates a genuine interest from financial institutions. Swedbank’s famous application of NLP for customer service illustrates the efforts made by financial institutions. At the very least, using their customer base, and the data pertaining to it, financial institutions are able to develop tools to handle simple and common requests, and accurately pass along the most complex to human beings for dedicated processing as unfortunately AI systems are often unable to deal with complex customer requests.
Fundamental improvements in AI and ML methodologies are required to cover this gap, and it will be years before a customer service can be fully automated, if it ever happens; as it might not be the case considering that we are social animals. Fortunately, handling simple requests and routing complex requests is still highly valuable for banks with huge customer service costs, allowing them to reallocate human resources to tasks of higher added value.
Furthermore, it is noteworthy to mention that U.S. Bank2 and ING3 already allow using Siri or Alexa to interact with them. In these cases, methodologies implemented belong to ASR and, therefore, implies signal processing before converting the speech to text for further analysis. However, Voice ID, as rolled out by Santander in the U.K.,4 does not necessarily imply NLP as signal matching (after or before encryption) is the only required thing. Banks are not the only ones looking at NLP techniques. Fintechs are increasingly relying on these approaches, as illustrated by the three following examples. For instance, B2B-oriented fintech venture, Clinc,5 offers a conversational AI platform to banks for personal finance, wealth management, and customer services. Cleo6 provides
DATA INTELLIGENCE | NATURAL LANGUAGE UNDERSTANDING: RESHAPING FINANCIAL INSTITUTIONS’ DAILY REALITY
B2C solutions helping customers to gain insight in, and to improve the management of their daily spending. Invyo7 helps financial institutions to identify opportunities in fintech using NLP-NLU.
In this paper we will discuss the state-of-the-art, the latest trends, the use-cases, the opportunities, and the challenges that implementing these methodologies will engender. We will also present the path from NLP to NLG, considering that NLP itself offers a large scope of opportunities and possibilities, and already allows addressing several fundamental issues faced by financial institutions.
2. METHODOLOGY: STATE-OF-THE-ART
Natural language treatment-related concepts have been previously introduced, hence in the following subsections we will present some of the most widely used methodologies to achieve automated treatment of textual data. To facilitate the understanding of the underlying methodologies, a distinction will be made in what follows between approaches requiring tremendous computational power (referred to as “heavy methodologies”) and methodologies allowing a local implementation (referred to as “light methodologies” in this paper).
2.1 Light methodologies
Light methodologies, as mentioned previously, can be developed at a local level and does not necessarily require the consideration of an alternative IT infrastructure.
2.1.1 RETRIEVING INFORMATION
The methodology traditionally used for retrieving information is usually referred to as TF–IDF (term frequency–inverse document frequency), which is a numerical statistic reflecting how important a word is to a document in a collection or corpus [Luhn (1957), Jones (1972)]. The value increases proportionally to the number of times a word appears in the target document and is offset by the number of documents in the corpus that contain the word, which helps adjusting for the fact that generally some words appear more frequently. This approach is a first step towards document classification, as by retrieving specific words it is possible to sort documents by topics if in the set considered the words have the same meanings.

106 /
2.1.2 CAPTURING THE CONTEXT
The first methodology of interest is called “word2vec”. This approach consists of a set of related models used to produce word embeddings. Word embedding consists of numerically capturing the context of a word in a document, semantic, and syntactic similarity, as well as relations with other words. These models are not very deep as they consist of two-layer neural networks trained for the reconstruction of linguistic contexts of words. Word2vec takes as input a large corpus of text and produces a very large vector space (usually hundreds of dimensions), in which each unique word in the corpus is assigned a corresponding vector in the space. Word vectors are positioned in the vector space such that words that share common contexts in the corpus are located close to one another in the space [Mikolov et al. (2013), Goldberg and Levy (2014), Rong (2014)].
However, though very powerful in a homogeneous context, the methodology is rather limited in an open environment, as only one word embedding can be obtained per word, i.e., word embeddings can only store one vector for each word. Consequently, with respect to the methodology, the word “bank” has only one meaning for “I withdrew some money from my bank account” and “I went walking on the river bank.” This issue can be highly misleading. Furthermore, one main drawback of being easy to implement on a small infrastructure is that this approach is difficult to train on large datasets, and it is very challenging to fine tune them and tailor them to a particular domain.
An alternative approach is called GloVe (Global Vectors for Word Representation) [Pennington et al. (2014)]. GloVe is an unsupervised learning algorithm for obtaining vector representations for words. Training is performed on aggregated global words co-occurrence statistics from a corpus, and the resulting representations showcase interesting linear substructures of the word vector space.
Both word2vec and GloVe learn vectors of words from how often they co-occur in a textual corpus. However, contrary to word2vec, which is a predictive model, GloVe is a count-based approach [Almasian et al. (2019)].
2.1.3 SUMMARIZING A TEXT
While the previous approaches were interesting to capture contextual information or identify similarities between words,
here we introduce TextRank, a graph-based ranking model designed for text processing, and which can be used for finding the most relevant sentences in text as well as the keywords [Mihalcea and Tarau (2004)].
In order to find the most relevant sentences in a text, a graph is constructed where the nodes of the graph represent each sentence in a document and the edges between sentences are reflecting content overlap, usually obtained by calculating the number of common words contained in two sentences.8
Following the creation of this network of sentences, these ones are entered the PageRank algorithm [Page (2001)], which aims to identify the most important – and – theoretically – the most relevant sentences. To create a summary of the text, we only have to gather and combine the most important sentences.
Alternatively, if we are interested in finding relevant keywords, the TextRank algorithm can build a network of words. This network is built by looking at which words follow one another. A link is created between two words if they follow one another, and this link is attributed a higher weight if these two words frequently materialize next to each other in the text considered.
As for the creation of a summary, the PageRank algorithm is laid on the resulting network to obtain each word’s importance. The words ranked at the top are kept, as these are considered relevant (according to the algorithm). Then, a keyword table is obtained by gathering the relevant words together if they come forth following one another in the considered text.
An important aspect of TextRank is that the algorithm does not need deep linguistic knowledge, nor language- or domain-specific annotated corpus. Consequently, this aspect makes it highly portable and generalizable [Barrios et al. (2016)].
2.2 Heavy methodologies
In the following sections, we briefly introduce the latest methodologies developed by institutions such as OpenAI or various branches of Google, which usually require high specifications in terms of required IT infrastructure and computing power. It is noteworthy to mention that it is not always necessary to retrain the full models on the corpus of interest, as fine-tuning them on specific tasks might be sufficient. This possibility drastically reduces the required computing power.
8 https://bit.ly/2LI0SZk
DATA INTELLIGENCE | NATURAL LANGUAGE UNDERSTANDING: RESHAPING FINANCIAL INSTITUTIONS’ DAILY REALITY

107 /
2.2.1 BERT
BERT stands short for Bidirectional Encoder Representations from Transformers [Devlin et al. (2018)] and is closely related to GPT [Radford et al. (2018)]. This large language model is trained on free text and then fine-tuned on specific tasks without customized network architectures. BERT improves on the GPT approach by making the training bidirectional. Consequently, the model learns to predict context on each side of the target. BERT allowed obtaining “best-in-class” results in multiple NLP tasks, such as “question answering” or “natural language inference”.
A previously mentioned, BERT’s key technical innovation is to apply the bidirectional training of Transformer, a popular attention model [Vaswani (2017)], to language modeling. This is in contrast to previous efforts, which looked at a text sequence either from left to right or combined left-to-right and right-to-left training. The paper’s results show that a language model that is bidirectionally trained can have a deeper sense of language context and flow than single-direction language models. It is not surprising that a representation able to learn the context around a word rather than just after the word is able to better capture its meaning, both syntactically and semantically. The main achievement of this approach is that it predicts the missing words without any information regarding which words have been replaced or which words should be predicted.9
2.2.2 OPENAI GPT-2
As with Google’s BERT, GPT-2 [Radford et al. (2018)] is Open AI’s successor to GPT. It was originally trained to predict the next word in 40GB of Internet text. GPT-2 is a large transformer-based language model with 1.5 billion parameters, trained on a dataset of 8 million web pages (i.e., ten times the number of parameters of GPT and ten times the size of the initial training set), supporting our choice to put it in the Heavy Methodology section. GPT-2 is trained with a simple objective, which is to predict the next word, given all of the previous words within some text. As claimed by the authors, GPT-2 seems to have the ability to generate conditional “synthetic text samples of unprecedented quality.” Furthermore, GPT-2 outperforms other language models trained on specific domains without requiring the use of domain-specific training sets.10
2.2.3 XLNET
XLNET is a generalized autoregressive model. An item is dependent on the previous ones. XLNET captures bi-directional context through “permutation language modeling”. It combines auto-regressive modeling with a bi-directional context approach. It outperforms BERT on tasks such as question answering, natural language inference, sentiment analysis, and document ranking.11
Permutation language modeling allows capturing context in both directions by training an autoregressive model on all rearrangements of words possible in a sentence [Yang et al. (2019)].
3. USE-CASES
Considering that most data is unstructured (photo, text, audio…) and that textual data represent the largest part, the combination of NLP-NLU algorithms such as those described above, and the availability of enhanced computational power permitting processing this data, is reshaping financial institutions’ internal management on the one hand and the way they interact with their customers on the other. In this section, we will present use-cases detailing how relying on methodologies presented in the previous sections we can improve financial institutions processes, starting with what in our opinion is the most important: customer experience.
Indeed, customer experience [McColl-Kennedy et al. (2019)] is arguably the most important thing in a commercial relationship, as that is what defines clients’ perception of a brand, a shop, or a professional. Customer experience is what makes people buy and what makes consumer come back. The key to offering a good customer experience is to understand their needs precisely, to answer them in the most customized manner possible, and following up proactively to make the customer feel as if they were experiencing a “valet” service.
To achieve such a performance, data must be analyzed (i.e., customer information, interactions with the financial institutions, products already available, social medias, etc.) in a holistic fashion. To analyze this data, techniques described above to structure the interactions in an actionable manner (i.e., such that we would be able to push the right product at the right time, or to demonstrate empathy during interactions between an agent and a customer) are very helpful.
DATA INTELLIGENCE | NATURAL LANGUAGE UNDERSTANDING: RESHAPING FINANCIAL INSTITUTIONS’ DAILY REALITY
9 https://bit.ly/2S8w6Jt: This link contains the code and the documentation explaining to fine-tune the model using TPUs on the Cloud.10 https://bit.ly/2M9B9b3: This link contains the code to run GPT-2 on the Cloud11 https://bit.ly/31LxDdt

108 /
For instance, claims have to be properly dealt with. Indeed, claims are part of the customer journey, and if not satisfied with the bank’s services, the customer needs to be able to express their grief or disappointment using the multiple channels usually available: a web portal, an email address, a telephone line, or directly in a branch. Multiple channels imply multiple data formats; for instance, audio or texts. Note that the text might be pure as it has not been modified by anyone, or might be reported by an agent and consequently might suffer from perception bias, and may, therefore, require additional treatment. Besides, audio format requires a first transformation, implementing a speech-to-text strategy [Bansal et al. (2018)]. Once the data is pre-processed, the methodologies presented above might be implemented for various purposes. Indeed, claims or, more generally, bank-customer interactions could be classified by type using keyword extractions. Besides, some claims might be properly dealt with using a bot. Advanced chatbots (using NLP and NLU) may allow a precise and customized treatment of a particular matter.
From an internal point of view, an appropriate use of resources is the essence of appropriate management. Considering that we are in an era of specialization and professionalization, a precise understanding of resume, skills, and evolution are critical for success. However, analyzing, qualifying, and routing resumes towards the most appropriate recipient is gradually becoming more complex. Consequently, for keywords extraction, to understand how people sell their skills, or to capture the confidence transpiring from resumes, the algorithms presented earlier can be used as these have literally been designed to tackle these specific tasks.
NLU can also be used for risk management purposes. For instance, named-entity recognition ([Khalifa and Shaalan (2019)] can be used to screen each and every contract in a folder to check that none of them has been signed by a blacklisted third-party, and can, therefore, be used for anti-money laundering purposes. Named-entity recognition or NER consists of extracting and classifying relevant information from unstructured text into predefined categories, such as the person names, organizations, locations, or monetary values. This approach combined with or lauded in a graph database, would allow for making connections between customer, investments, location, etc.; mechanically enhancing compliance assurance.
Related to non-compliance issues is the so-called reputational risk. Indeed, reputational risk is today one of the most damaging exposures bank face. Tackling the issue requires gathering a large quantity of information coming from traditional medias,
podcast, or social medias for the matter at hand, as well as the implementation of a sentiment analysis [Cambria et al. (2019] approach relying once again on NLU and somehow on one of the methodology presented in the second section of this paper. As a matter of fact, the Heavy Methodologies are very interesting to obtain a precise classification of articles, whether these are positive, negative, or neutral with all the nuances that can be captured in between. A score might even be built.
From an operational risk management [Hassani (2016)] point of view, the use of external data to either feed internal databases, scenario analysis, or risk control self-assessment procedures are already consuming large quantities of textual data. These tasks require both manual classification and light sentiment analysis to reduce perception bias. These tasks could be fully automated using methodologies presented above.
Last but not least, both credit scoring and segment hunting based on credit scoring strategies are increasingly reliant on external unstructured data capture and analysis, cobbling the way towards reduced risk taken by financial institutions. The better understanding of customer profiles from a credit worthiness point of view is mechanically improving the accuracy of the pricing of the loans [Wang et al. (2018), Crouspeyre et al. (2019)].
4. LIMITATIONS
After presenting some of the opportunities offered by NLP-NLU techniques, this section will address their limitations. Though, some genuine value can be obtained from NLP-NLU approaches, the methodologies suffer from limitations worth bearing in mind.
The first limitation that comes to mind is the quantity of data required to achieve good results. On case specific tasks, this data might not be available, making the validity of models questionable.
The second aspect is related to the tremendous computational power required. If your company is not cloud computing oriented, though not impossible, the tasks might be extremely complicated to fulfill.
Another main issue associated with NLP-NLU strategies as deployed in banks is relevance. As the devil is in the detail, it is possible that actual understanding of real meanings is not appropriate and as a result the provided response not accurate. One may wonder what is the impact of an inappropriate action triggered by the model?
DATA INTELLIGENCE | NATURAL LANGUAGE UNDERSTANDING: RESHAPING FINANCIAL INSTITUTIONS’ DAILY REALITY

109 /
DATA INTELLIGENCE | NATURAL LANGUAGE UNDERSTANDING: RESHAPING FINANCIAL INSTITUTIONS’ DAILY REALITY
REFERENCES
Almasian, S., A. Spitz, and M. Gertz, 2019, “Word embeddings for entity-annotated texts,” European Conference on Information Retrieval, 307–322. Springer
Bansal, S., H. Kamper, K. Livescu, A. Lopez, and S. Goldwater, 2018, “Pre-training on high-resource speech recognition improves low-resource speech-to-text translation,” arXiv preprint arXiv:1809.01431
Barrios, F., F. López, L. Argerich, and R. Wachenchauzer, 2016, “Variations of the similarity function of textrank for automated summarization,” arXiv preprint arXiv:1602.03606
Cambria, E., S. Poria, and A. Hussain, 2019, “Speaker-independent multimodal sentiment analysis for big data,” in Seng, K. P., L.-m. Ang, A. W.-C. Liew, and J. Gao (eds.), Multimodal analytics for next-generation big data technologies and applications, 13–43, Springer
Collobert, R., J. Weston, L. Bottou, M. Karlen, K. Kavukcuoglu, and P. Kuksa, 2011, “Natural language processing (almost) from scratch,” Journal of Machine Learning Research 12, 2493–2537
Crouspeyre, C., E. Alesi, and K. Lespinasse, 2019, “From creditworthiness to trustworthiness with alternative NLP/NLU approaches,” in Proceedings of the First Workshop on Financial Technology and Natural Language Processing, 96-98
Devlin, J., M-W. Chang, K. Lee, and K. Toutanova, 2018, “Bert: pre-training of deep bidirectional transformers for language understanding,” arXiv preprint arXiv:1810.04805
Goldberg, Y., and O. Levy, 2014, “Word2vec explained: deriving Mikolov et al.’s negative-sampling word-embedding method,” arXiv preprint arXiv:1402.3722
Hassani, B., 2016, Scenario analysis in risk management. Springer International Publishing
Jones, K. S., 1972, “A statistical interpretation of term specificity and its application in retrieval,” Journal of Documentation 28:1, 11-21
Khalifa, M., and K. Shaalan, 2019, “Character convolutions for Arabic named entity recognition with long short-term memory networks,” Computer Speech & Language 58, 335–346
Liu, X., P. He, W. Chen, and J. Gao, 2019, “Multi-task deep neural networks for natural language understanding,” arXiv preprint arXiv:1901.11504
Luhn, H. P., 1957, “A statistical approach to mechanized encoding and searching of literary information,” IBM Journal of Research and Development 1:4, 309–317
McColl-Kennedy, J. R., M. Zaki, K. N. Lemon, F. Urmetzer, and A. Neely, 2019, “Gaining customer experience insights that matter,” Journal of Service Research 22:1, 8–26
Mihalcea, R., and P. Tarau, 2004, “Textrank: Bringing order into text,” Proceedings of the 2004 Conference on Empirical Methods in Natural Language Processing, 404–411
Mikolov, T., K. Chen, G. Corrado, J. Dean, L. Sutskever, and G. Zweig, 2013, “Word2vec,” https://bit.ly/2esteWf
Page, L., 2001, “Method for node ranking in a linked database,” September 4, U.S. Patent 6,285,999
Pennington, J., R. Socher, and C. Manning, 2014, “Glove: Global vectors for word representation,” Proceedings of the 2014 Conference on Empirical Methods in Natural Language Processing (EMNLP), 1532–1543
Qin, Y., N. Carlini, I. Goodfellow, G. Cottrell, and C. Raffel, 2019, “Imperceptible, robust, and targeted adversarial examples for automatic speech recognition,” arXiv preprint arXiv:1903.10346
Radford, A., K. Narasimhan, T. Salimans, and I. Sutskever, 2018, “Improving language understanding by generative pretraining,” https://bit.ly/2t9cjyM
Radford, A., J. Wu, R. Child, D. Luan, D. Amodei, and I. Sutskever, 2019, “Language models are unsupervised multitask learners,” OpenAI Blog 1:8
Rong, X., 2014, “word2vec parameter learning explained,” arXiv preprint arXiv:1411.2738
Tran, V-K., and L-M. Nguyen, 2019, “Gating mechanism based natural language generation for spoken dialogue systems,” Neurocomputing 325, 48-58
Vaswani, A., N. Shazeer, N. Parmar, J. Uszkoreit, L. Jones, A. N. Gomez, L. Kaiser, and I. Polosukhin, 2017, “Attention is all you need,” Advances in Neural Information Processing Systems, 5998– 6008
Wang, C., D. Han, Q. Liu, and S. Luo, 2018, “A deep learning approach for credit scoring of peer-to-peer lending using attention mechanism LSTM,” IEEE Access, 7, 2161-2168
Yang, Z., Z. Dai, Y. Yang, J. Carbonell, R. Salakhutdinov, and Q. V. Le, 2019, “XLNet: generalized autoregressive pretraining for language understanding,” arXiv preprint arXiv:1906.08237
Besides, the number of parameters associated with the models, in particular with the Heavy Methodologies, may potentially generate a model risk in the future, as its interpretability is questionable.
Furthermore, from a business point of view, people’s fickle natures have not been taken into account and as such the responses are assumed stationary, implying that past data is informative of the future. As of today, state-of-the-art results lead us to think that AI algorithms allow for understanding humans better than humans themselves; as if processes were always linear. We believe that this will not always be the case, due to the fact that people may not be completely honest in what they say, they might use nuances due to their education, they might not be direct, they might be biased, or they might be fed up with something they used to enjoy. NLP-NLU is more about having it right all the time than the underlying algorithms.
CONCLUSION
Today, as discussed in this paper NLP-NLU is reshaping the way financial institutions are working, impacting every aspect of the value chain. Considering the number of tasks involved in the three domains of NLP, NLU, and NLG, it is better to state the objective to achieve or the problem to solve clearly and carefully. It is from having clear objectives that we will be able to derive the type of data to be gathered, the most appropriate IT architecture, or the most effective modeling strategy. We need to select the models solving the problems, not the problems being fine-tuned by the models.
In this paper, after presenting the current market appetite for NLP-NLU methodologies and use-cases, we discussed some of the pertaining limitations, and though applications are very attractive, to ensure the durability of the solutions these limitations have to be borne in mind at all time. In any case, though NLP-NLU might sometimes fails, the recent evolutions of the research in the field support the statement that it should attract major investments from financial institutions in the coming years.

110 /
IAN HERBERT | Senior Lecturer in Accounting and Financial Management, School of Business and Economics, Loughborough University
ALISTAIR MILNE | Professor of Financial Economics, School of Business and Economics, Loughborough University1
ALEX ZARIFIS | Research Associate, School of Business and Economics, Loughborough University
digital approach to insurance harness two different but complementary approaches; so-called ‘lights-out’ automatic processing and data-driven decision making? Whilst many managers hold an idealized view of the potential of artificial intelligence (AI), along with a somewhat mechanical view of robotic process automation (RPA), our evolving project finds that a data-centric orientation, which can change both the modus operandi of a firm and its business model, cannot be achieved by focusing on ambitious transformative technology alone. The reality is more prosaic: real change starts by cleaning and curating the firm’s underlying dataset before moving to more advanced challenges. Mundane as this might appear, advanced technologies are just as significant in this preparatory phase as we shall explain.
It is organized as follows. The following section discusses the issues involved and explains the ‘knowledge management’ perspective and how it can help. Section 3 then examines
ABSTRACTThis article uses insights from knowledge management to describe and contrast two approaches to the application of artificial intelligence and data technologies in insurance operations. The first focuses on the automation of existing processes using robotic processing intervention (RPA). Knowledge is codified, routinized, and embedded in systems. The second focuses on using cognitive computing (AI) to support data-driven human decision making based on tacit knowledge. These approaches are complementary, and their successful execution depends on a fully developed organizational data strategy. Four cases are presented to illustrate specific applications and data that are being used by insurance firms to effect change of this kind.
DATA TECHNOLOGIES AND NEXT GENERATION INSURANCE OPERATIONS
1. INSURTECH – OPPORTUNITIES FOR DEEP CHANGE
Compared with the rapid pace of fintech implementation in other financial services – e.g., commercial banking, domestic and international payments, or capital market transactions – adoption of financial technologies by insurance firms (insurtech) is still at a comparatively early stage. There are many technologies and vendors courting the sector and some interesting examples of innovation and application by insurtech startups and established insurance firms. Nonetheless, there are as yet relatively few instances of new business models emerging based on the synthesis of new technologies in order to disrupt the market, either through new products/services or by offering existing products/services at substantially lower cost.
This article takes a knowledge management (KM) view to examine the data challenges that are slowing the adoption of new technologies in insurance. It asks: how might a new
1 The analysis we report here draws on an initial review of the adoption of artificial intelligence and other insurance technologies, developed as the first stage of a current ESRC financed research project. This project, Technology Driven Change and Next Generation Insurance Services Grant Reference ES/S010416/1, is part of the broader Innovate UK/ RCUK Next Generation Services Challenge, https://bit.ly/2o20OdB, that seeks to support the development and application of new data technologies in insurance, accountancy, and legal services. Our work can be followed on our project website at www.techngi.uk and on Twitter at www.twitter.com/techngi

111 /
the associated challenges of data management. Section 4 highlights the role of insurtech in the data journey and Section 5 reviews some examples drawn from our recent research. Section 6 concludes.
2. KNOWLEDGE MANAGEMENT AS AN ALTERNATIVE VIEW
There are many new data technologies that, in combination, have the potential to radically improve the operation and control of financial services [Maul et al. (2019)]. However, as Bohn (2018) notes, the insurance industry is something of contrast, which “…faces a slow-motion parade of promise, possibilities, prematurity, and pared-down expectations” (p.76). Still, despite insurance being relatively less transactional than, say, banking firms, large insurance operations need to process myriad financial transactions efficiently and reliably. So, there is still great potential for using various insurtech applications to reduce operational costs and improve the assessment and mitigation of risk.
In terms of work presently performed by human agents, we can alternatively think of these two aspects as machine agent processes and machine cognitive agents respectively. While, these terms might appear distinctive, in practice both are somewhat loose concepts. We will present our analysis in terms of a set of digital technologies positioned at various points on a continuum between two extremes, from the most basic automation (RPA) to the most sophisticated reliance on computerized decision making (AI).
The application of these technologies is supporting major and ongoing operational changes. But the relatively preliminary review that we have conducted so far in our research project indicates that the key issues are rather more practical than many journalistic discussions suggest.
• First, on closer inspection, it is clear that there is considerable variety in AI technologies, and we are some way from consensus on what is and what is not included under the general AI label. Insurers are currently using some forms of AI technologies in several consumer and back office applications, including natural language processing by virtual assistants, image processing to evaluate the veracity and extent of damage, risk assessment, fraud detection, micro-segmentation, processing diverse unstructured data, and automating low-value tasks [Zarifis et al. (2019)].
DATA INTELLIGENCE | DATA TECHNOLOGIES AND NEXT GENERATION INSURANCE OPERATIONS
• Second, as we emphasize in this article, automated data processing requires a substantial effort upfront to organize and standardize the underlying data. Insurance, even more than other financial services, is characterized by fragmented data. For example, every house and its contents are different. Consequently, the initial efforts at automation will likely continue to be patchy until these underlying data issues are more fully addressed.
The ‘lens’ we use for examining this challenge of data management is the conceptual framework of “knowledge management” (KM). This avoids the trap of forced distinctions between data (as electronic representations of facts) and information (as processed data). Whilst the term ‘data-centric’ is useful for describing new organizational orientations towards data as a firm-level resource, it underemphasizes the role of the intelligent human and computer processes that turn data into useful information. Effective use of information technology in this role requires advanced computation – generically AI, though this label covers a variety of technologies – complementing the data resources that have been gathered and curated using more mechanical approaches to data processing.
A KM approach challenges managers to see beyond data and information as, respectively, the raw material and outputs of computer systems, and alternatively, to reflect on the entirety of how an organization is able to think and do what it does. In its simplest sense, KM distinguishes between on one hand, tacit knowledge, arising from human activity and thought, and on the other hand, explicit knowledge derived from actions and events that have been codified and recorded [Polanyi (1962)]. Because explicit knowledge can be stored and further processed by computers, the ultimate aim is to turn all tacit knowledge into explicit knowledge.
Grant (1996) presents a very useful overview of knowledge-based theories of the firm in which he also elaborates tacit knowledge as ‘knowing about’ and explicit knowledge as ‘knowing how’, emphasizing that ease of communication is a fundamental property of the latter. Further, it can be argued that the new technology allows for machines to adapt by using tacit knowledge gained while the programmed algorithm is running whereas previously machines could only function as programmed with explicit knowledge.

112 /
Put simply, next generation insurance systems will render all the tacit knowledge embodied in people explicit so that it can be embedded in systems that can operate with much less need for human intervention. In so doing there will be intertwining of basic RPA processing used to gather and curate data from more advanced processing along the AI spectrum, to create insight from the new data and which will feed into the next round of RPA-driven operations.
Another way of using the KM lens to ‘see’ into the problem-set of insurance is to distinguish between observable and embedded knowledge [Birkinshaw et al. (2002)]. The challenge being to identify the necessary knowledge of what actually happens and why and then embed this into computer operating systems as programmable routines and more responsive algorithms. Over time, the sum of a firm’s knowledge resources might come to explain its existence. For simplicity, we will use tacit versus explicit knowledge along with the standard industry labels around data management and information processing.
3. THE KEY CHALLENGES: KNOWLEDGE AND DATA MANAGEMENT
Ideally, a KM approach starts by asking what business opportunities are available and hence, what knowledge is required? The reality for existing firms, however, will more likely be an iterative approach that works outwards from more basic considerations: what data and processes are already available?
What is the quality of the data in terms of its correctness, completeness, relevance, etc.? What systems and people exist to produce useful information for decision making?
Paradoxically, the lack of an existing dataset can present an advantage for a startup insurance firm that can plan its data strategy from first principles: crucially, without the lure of using existing data that, although free, may also be flawed or redundant to future business orientations.
Figure 1 depicts how a data transformation journey might be envisaged for an existing firm as a progression from D1) developing an agreed set of shared master data that enables services to be delivered and recorded, to D2) enhanced enterprise data capturing wider contextual data about, say, customers, insured assets, claims, etc., and finally D3) the development of ‘broader data sources’ including vast quantities of structured and unstructured historical data, e.g., personal credit scores, climatic data, customer ‘click-stream’ data (as they make choices about products/services on the website), etc. and dynamic data emanating from social media, the internet-of-things, etc. The two axes indicate how, as the volume of data expands, analysis, storage, curation and retrieval become more complex, as does the complexity of the analytical techniques and computing resources necessary to make sense of the data. This journey of data transformation is in our view the key objective of the firm’s data strategy and data governance.2
Figure 1: Building the resource for data analytics
Source: adapted from CIMA (2013)
COM
PLEX
ITY
OF A
NALY
SIS
SCALE AND COMPLEXITY OF DATA
D3: BROAD DATA SOURCES
From customers and external sources (unknown, unknowns)
D2: ENHANCED DATA
From operations and the wider organization (known, unknowns and unknown, knowns)
D1: MASTER DATA
Financial and customer transactions ERP, CRM & DW (known, knowns)
2 Data governance covering inter alia (as identified by BI Surveys 2018) documents and content, data security, data storage and operations, data modeling and design, data architecture, data quality, meta-data, data warehousing and business intelligence, reference and masterdata, and data integration and interoperatiblity
DATA INTELLIGENCE | DATA TECHNOLOGIES AND NEXT GENERATION INSURANCE OPERATIONS

113 /
From this perspective, it is suggested that rather than diving headlong into capturing broad data, insurance firms should envisage a journey comprising three phases as follows.
D1. Data phase 1: Obtaining clean master data
Master data is agreed upon information shared across an organization. It includes all those details about customers and products that are necessary to provide quotes to customers, administer policies and claims, along with recording amounts charged and paid. Master data may have been collected from within or from outside the organization. The significance for electronic data management and governance is that the data is shared across various functions (typically through an ERP system), each with editing rights but likely no overall responsibility for its correctness. For example, a customer only wishes to advise his/her new billing details once and will
tell whichever function they happen to be dealing with at the time, say, claims processing but the next use might be for policy renewal.
Substandard data in the system may occur for many reasons, even with otherwise good systems discipline. For example, 1) inconsistencies between systems arising from acquisitions and mergers, 2) data gaps and corruptions during operating system upgrades, 3) transitions between hardware vendors when data fields may have been incompatible, etc. Furthermore, there may be certain sub-routines within the overall system that are not electronically integrated; indeed, the issues may be as much about management structures as information systems.
Allowing for such organizational aspects, the key activities of a master data cleansing operation might be as presented in Table 1:
DATA INTELLIGENCE | DATA TECHNOLOGIES AND NEXT GENERATION INSURANCE OPERATIONS
Table 1: Key activities of a master data cleansing operation
STEP ACTIVITY INSURANCE EXAMPLES
1Standardize all data fields, e.g., terminology, headings, descriptions, etc. and also standardize how these are interpreted by workers in practice.
Insurers like Wrisk are digitizing all their processes across the value chain, so the data is more readily available.
2
Digitize all data entries at source wherever possible. Note: this may require workarounds to codify external records and use technologies such as screen scraping and voice recognition software.
Tokio Marine use handwriting recognition to digitize documents in Japanese.
3Automate customer and agent-led* data entry routines wherever possible. Use AI to check digital inputs in real time – flagging up queries for workers to validate with customers.
CUVVA customers use their mobile application to enter their personal details and pictures so agents are only called in for special cases.
4Ensure that all relevant data is captured by the master database and is subsequently stored off-line in a retrievable format.
Insurers are collecting data within milliseconds from internal and external sources and storing it so that it is ready for actionable insights on risk.
5 Automate all transactional routines in the front and back offices from the point of data entry.
FRI:DAY have a fully automated insurance process that creates benefits that are larger than the sum of its parts.
6
Use AI to identify errors/gaps in the historical master data and fill in automatically with reference to other databases, e.g., by comparing policy and claims data, etc., or flag for worker validation input.
Insurers such as Lloyd’s of London use machine learning to audit their data. It is trained by internal data and external benchmarking data.**
* agents = workers in company or with third-party agents
** For more detailed case studies on how insurance is using new technologies we invite readers to follow the TECHNGI project; particularly the library of case studies that we will be curating.

114 /
D2. Data phase 2: Enhancing the dataset
The next stage is to ask how the master dataset might be enhanced and its scope extended? For example, what other data could be captured from within the organization and its customers? How might that data be stored, curated, and analyzed at scale to replace or augment human workers and further ‘train’ the RPA and AI algorithms. It may be that external databases could be accessed, such as credit scores purchased from specialist agencies and bank accounts to evaluate relationships between, say, changing financial patterns as a proxy for changing driving behavior and claims. For instance, are drivers whose finances improve or deteriorate rapidly more likely to have an accident, or even just make a fraudulent claim? Furthermore, new services may be created with the primary purpose of collecting new data on the consumer that will support the AI micro-segmentation [Fountaine and Saleh (2019)].
The quantity of additional data could be significant; for example, storing ‘Google street view’ images of a customer’s home at the point of issuing the policy. This would capture the state of repair and existing property additions to validate the present proposal and set a benchmark against which a future claim for damage might be based.
At this stage, management will have to make some fundamental decisions about data storage resources, e.g., own infrastructure or use of the Cloud, and what data to store given that individual sets of data may not make economic sense in isolation, but only when a critical mass of data is available that can be cross-correlated. In five years’ time, the questions that top management may be asking in evaluating insurance risk will not likely be the same ones as today.
D3. Data phase 3: Gathering and curating broad data
The possibilities to interrogate a massive dataset to provide new insights into customer and asset profiles are endless. In fact, a popular phrase that captures something of the whole intangibility of big data is that it gives users the ability to “see the shape in the shadows”. For example, telemetric “black boxes” are primarily intended to improve driver behavior but these can also produce a massive stream of contextual data in real time, the full uses of which may yet to be discovered.
A further example might be analysis of social media feeds such as Twitter and Facebook. For example, activity on peer-to-peer networks might indicate rising perceptions of crime in a certain area and such an insight, if correct, will be some way in advance of actual claims to insurance companies and official police statistics; in which case premiums may need to rise to reflect the new reality.
Figure 2: Moving to next generation insurance
Q3: AI – WORKING SMARTER Algorithms and big data analytics help people to add value
Q4: NEXT GEN INSURANCE
Q2: RPA – WORKING HARDER AND FASTER Self-service operations, reduced cost,
faster more consistent serviceQ1: HUMAN PROCESSES WITH SOME AUTOMATION
A
B
C
D
Emphasis on lights-out processing using explicit data
Knowledge is: codified, routinized, and embedded in systems
Cognitive knowledge embodied in people is replicated and enhanced by AI
Emphasis on data-driven decision- making based on tacit knowledge
AI-L
ED
RPA-LED
Underlying system data
D1: Clean master data
D3: Data-rich, broad dataD2: Enhanced data
DATA INTELLIGENCE | DATA TECHNOLOGIES AND NEXT GENERATION INSURANCE OPERATIONS

115 /
4. THE ROLE OF INSURTECH IN THE DATA JOURNEY
In moving towards the top right of Figure 1, some actions will be based on RPA, reducing routine human activity and, in the process, automatically recording all transaction and human decisions digitally. Some activities will require more cognitive-based AI algorithms to, say, identify (and even infill) gaps in the data structure. It sounds attractive to ‘throw’ both aspects at the data problem simultaneously. However, our research suggested that each will be used iteratively as depicted by the dashed line in Figure 2.
As RPA cleans up and improves the gathering of new master data (to Point A), AI can cross-check the files with additional data sources, for example, extending the evaluation of risk from, say, only basic asset and demographic characteristics to the consideration of many other variables, e.g., facts about a customer’s lifestyle and financial behavior, Point B. The eventual objective might be to offer the same degree of policy customization as the firm might also offer to, say, the owners of an oil tanker. As AI helps create new insights from the growing database, RPA will generate queries to customers, either on renewal or during the policy, Point C. Perhaps the customer is underinsured and could be encouraged to increase cover or take action to mitigate their exposure. Swiss Re estimate that 70% of insurable assets are under insured [Swiss Re (2018)] and AI can help a firm secure more business and be socially responsible.
Indeed, the development of predictive algorithms at a micro-level might enable an independent insurance company to stay ahead of the ‘consolidator’ insurance websites. These tend to work on a minimum set of data points entered by potential customers so as to be able to offer comparable quotes across the market.
In achieving Point D, AI can be used to evaluate forward risks and validate claims. For example, voice and handwriting recognition software can be used to detect fraud in association with analysis of claims in the way that large organizations use algorithm-based software to check employee expense claim patterns.
In the case of motor insurance, for example, one might hypothesize that the use of ‘satellite navigation’ (satnav) devices may distract drivers and thus, increase the risk for some drivers/vehicle, but data on whether customers have actually fitted these and what make/model they have may not be being captured at present or historically. Perhaps such devices reduce risk but only for those ‘professional’ drivers
(e.g., delivery vans) who use them frequently. Rather, it is those drivers who only venture outside their familiar territory occasionally and, say, use a map or the navigation app on their phones that cause the problems? There are many such questions but, nonetheless, this data may be worth capturing for future use. AI could ‘backfill’ the dataset for those vehicle models that have factory fitted systems, and cross-correlate with GPS tracking data from black boxes, annual mileages, driver’s age, gender, occupation, etc. Again, what to capture needs to be driven by an almost ‘blind faith’ in a future data-centric business model rather than by today’s needs.
As governments try to wean their citizens off the culture of car use, ‘green’ insurance firms could play a larger role by offering pay-per-mile, or pay-per-day/week/month policies? Such policies are already available through companies like CUVVA, FRI:DAY, Wrisk, and Huddle. This might provide a marketing edge and also generate a lot of data that could feed into future data analytics for insurance firms. The data could even be sold to local authorities for transport planning. This would be an opportunity for insurance firms to demonstrate their environmental credentials. The TECHNGI project is developing a library of cases and the next section illustrates some examples of data management and application.
A final point in relation to this data journey is that most companies in insurance and in other industries still have a long way to go. This perception is corroborated by Leandro Dallemule, the chief data office of the global insurer AIG. “More than ever, the ability to manage torrents of data is critical to a company’s success. But even with the emergence of data-management functions and chief data officers (CDOs), most companies remain badly behind the curve. Cross-industry studies show that on average, less than half of an organization’s structured data is actively used in making decisions – and less than 1% of its unstructured data is analyzed or used at all. More than 70% of employees have access to data they should not, and 80% of analysts’ time is spent simply discovering and preparing data. Data breaches are common, rogue data sets propagate in silos, and companies’ data technology often isn’t up to the demands put on it” [Dallemule and Davenport (2017)].
5. EXAMPLES FROM OUR RECENT RESEARCH
There is a wave of ‘data hungry’ technologies transforming insurance, such as AI, big data, IoT, and blockchain. AI has a role in the relationship of all these technologies and the insurer’s data. There are many examples of current implementations of AI in insurance. Firstly, there are voice
DATA INTELLIGENCE | DATA TECHNOLOGIES AND NEXT GENERATION INSURANCE OPERATIONS

116 /
assistants that apply machine learning for the natural language processing used to communicate and the analysis related to insurance. These voice assistants are utilized by both the customer and the employee [Kannan and Bernoff (2019)]. AI is also utilized for image processing, such as handwriting recognition and evaluating damage from accidents. The images can be submitted by the customer or collected by IoT devices including drones. For audit, conforming to regulation, and fraud detection, machine learning is used to review many cases and identify a subset of unusual cases for an employee to check [Maul et al. (2019)]. Four cases are presented that reflect the four quadrants of Figure 2. The first two rely mostly on explicit knowledge and the last two utilize tacit knowledge also.
Change via route A – emphasis on using explicit knowledge by RPA
CASE 1. Q1: HUMAN PROCESSES WITH SOME AUTOMATION (FUNCTIONAL, CLEAN MASTER, AND ENHANCED DATA)
Manulife already uses AI in several ways including underwriting.
This insurer uses AI-enabled automation to handle the simpler cases that can be evaluated based on explicit knowledge and historical master data. This allows humans to focus their time on the remaining cases that need specialized data and tacit knowledge. The underwriting tool, called AIDA, is trained with machine learning and is allowed to underwrite life insurance with up to 1 million Canadian dollars of cover for the age groups of 18-45 without human involvement. A decision algorithm that utilizes machine learning can process the consumer application in a few minutes and make the final decision. Beyond the sophistication of the learning algorithm, success is dependent on the data in Manulife’s systems being accurate, relevant, and available. This implementation illustrates the insurer’s strong understanding of the strengths and weaknesses of current AI applications, their current data, the skills and tacit knowledge of their employees, and their ability to rewire their business processes gradually.
CASE 2. Q2: RPA – WORKING HARDER AND FASTER (CLEAN, ENHANCED, AND BIG DATA)
CUVVA provide hourly vehicle insurance.
This new entrant uses technology in a similar way to other online insurers like Lemonade, Huddle, and FRI:DAY. The consumer makes an initial monthly subscription payment and then makes an additional payment based on the hours they drive. CUVVA uses a mobile app that utilizes AI, automation,
and vast, diverse data. The consumer uploads their picture and enters their vehicle number plate to receive a quote. Their systems check the database of the U.K.’s Driver and Vehicle Licensing Agency to identify any problems with the car and the license. CUVVA’s system also checks the credit history and whether the prospective consumer has a criminal record. These checks are made automatically in a few seconds and the insurance is issued. This case illustrates how data is brought together and analyzed in an automatic way, supported by machine learning. The service offered is simple and requires explicit knowledge with limited tacit knowledge. More complex and challenging insurance services are not offered. As an insurer that was not only ‘born digital’ but also ‘born AI enabled’ the model fits the current capabilities of AI well.
Change via route B – emphasis on using tacit and explicit knowledge by AI
CASE 3. Q3: AI – WORKING SMARTER (CLEAN, ENHANCED AND BIG DATA)
LITA – Natural language capture allows AI supported advice.
From late 2017 to early 2019, Lloyds International Trading Advice (LITA), a service provided across the Lloyd’s insurance market, worked with their technology partner Expert System Ltd. to develop a natural language processing solution for automated retrieval of legal and regulatory for insurance contracts around the world. Expert System provided an initial natural language processing (NLP) solution using their cognitive computing application Cogito, which was then trained on the Lloyd’s regulatory database, Crystal, and employed for retrieval of relevant documentation.
Development from initial proof of concept (PoC) to business implementation required around ten rounds of iteration involving sometimes quite substantial manual intervention and reorganization of the data fed to Cogito. The first two iterations required especially substantial changes, with the development of a tailored taxonomy covering key insurance terms (many of which are specific to the Lloyd’s market ‘Lloydsisms’).
During the testing phase the output to a query was compared to what was produced without Cogito support by an experienced member of the LITA team to assess the accuracy of the output of the system. An initial 50% success rate, retrieving what the experienced members of the LITA team confirmed as the key required documents, was increased to 75%. Further subsequent ‘tuning’ raised the success rate to the current 88%.
DATA INTELLIGENCE | DATA TECHNOLOGIES AND NEXT GENERATION INSURANCE OPERATIONS

117 /
The project has automated much of the work of the Lloyd’s International Trading Advice (LITA), the small team within Lloyd’s that provides members with legal and regulatory information required for underwriting business around the globe. The key lesson though is that the successful automation of this kind requires not only data technology but also the development of an explicit supporting data framework.
CASE 4. Q4: DATA-CENTRIC (DATA RICH AND BIG DATA)
TESLA offer insurance directly for their vehicle drivers.
TESLA do this for several reasons including reducing the cost to insure their cars. TESLA vehicles are usually quite expensive to insure because of their high purchase cost, high complexity, the additional dangers large batteries bring, and the fast acceleration that can lead to accidents. TESLA offers insurance at a lower cost by utilizing the data collected in the car that is processed by AI. Consequently, the TESLA vehicle is part of the Internet of Things (IoT) with several sensors including GPS, cameras, and accelerometers. The real time stream of huge volumes of data is utilized by machine learning to understand the risks and adapt to changing risks. This data cannot be fully utilized by humans, so machine learning leads in understanding it. New models of risk and how to manage it can be created by machine learning. Both the behavior of the driver and the vehicle can be influenced proactively. This current, customer specific, knowledge enables them to measure, predict, and influence behavior better. However, they
still collaborate with existing insurance providers and benefit from their data and knowledge also. This illustrates both the advanced uses of data and AI but also the limitations, as TESLA is still not capable of offering all its driver’s insurance and stills needs traditional insurers.
6. ASSESSMENT AND CONCLUSIONS: KEY ISSUES
We suggest that there will likely be a point of inflexion in the adoption of new data technologies, that will cause a ‘domino’ effect across the insurance industry. We can only speculate about the nature or timing of such a tipping point, but rather we note just one example of a recent potential for disruption. Tesla cars have a particular challenge in pricing their cars attractively as they ramp up production to a critical market mass. Their response is to reduce the total cost of car ownership by offering cheaper insurance directly to their customers on the basis that, as the CEO, Elon Musk put it, “We essentially have a substantial . . . information arbitrage opportunity where we have direct knowledge of the risk profile of customers and basically the car” [Tesla (2019: p1)].
This focus on AI captures both the widespread aspiration employing computers to take on a wide range of responsibilities that currently rely on human intelligence, but also the associated concerns about the ethical and economic implications of such a shift of responsibility from synapses to silicon.
DATA INTELLIGENCE | DATA TECHNOLOGIES AND NEXT GENERATION INSURANCE OPERATIONS
REFERENCES
BI Surveys, 2018, “Data governance: definition, challenges and best practices,” https://bit.ly/2o6gP1Z
Birkinshaw, J., R. Nobel, and J. Ridderstråle, 2002, “Knowledge as a contingency variable: do the characteristics of knowledge predict organisation structure?” Organization Science 13:3, 274-289
Bohn, J., 2018, “Digitally-driven change in the insurance industry-disruption or transformation?” Journal of Financial Transformation 48, 76-87
CIMA, 2013, “From insight to impact – unlocking opportunities in Big Data,” Chartered Institute of Management Accountants
Dallemule, L., and T. H. Davenport, 2017, “What’s your data strategy,” Harvard Business Review 95:3, 112–121
Fountaine, T., and T. Saleh, 2019, “Building the AI-powered organization,” Harvard Business Review July–August, 62–93
Grant, R. M., 1996, “Toward a knowledge-based theory of the firm,” Strategic Management Journal 17, Winter Special Issue, 109-122
Kannan, P. V., and J. Bernoff, 2019, “Four challenges to overcome for AI-driven customer experience,” MIT Sloan Management Review Frontiers, July 16, https://bit.ly/2JBKSa6
Maul, R., J. Collomosse, S. Brewer, A. Bordon, K. Jones, and J. Breeze, 2019, “Taking control: artificial intelligence and insurance,” Lloyd’s of London Emerging Risk Report, Lloyds of London
Polanyi, M., 1962, Personal knowledge: towards a post-critical philosophy, University of Chicago Press
Swiss Re Institute, 2018, “Digitally-driven change in the insurance industry – disruption or transformation?” Swiss Re Management Ltd.
Tesla, 2019, “Insure my Tesla, insurance quote,” https://bit.ly/2o6mXr1
Zarifis A., C. P. Holland, and A. Milne, 2019, “Evaluating the impact of AI on insurance: the four emerging AI and data driven business models,” Emerald Open Research, 1-11

118 /
GERHARD LÄNGST | Partner, Capco
JÜRGEN ELSNER | Executive Director, Capco
ANASTASIA BERZHANIN | Senior Consultant, Capco
and remediate source data, or to turn to altogether new sources of data that are better fit for the purpose.1
Indeed, Gartner research has found that organizations believe poor data quality to be responsible for an average of U.S.$15 million per year in losses.2 In addition, the Data Warehousing Institute warns that “two percent of records in a customer file become obsolete in one month because customers die, divorce, marry, and move. The problem with data is that its quality quickly degenerates over time.”3 In addition to the immediate impact on data migrations, failing to address bad data will result in long-term loss of trust in information, an organization’s most valuable asset in the wake of digitization efforts. As stated in the Gartner Data & Analytics Summit 2018, “as organizations accelerate their digital business efforts, poor data quality is a major contributor to a crisis in information trust and business value, negatively impacting financial performance.”4
ABSTRACTThis article is based on the experiences gained through a large data migration and business process outsourcing project in 2019. Examining static data linked to approximately 12 million customer records spread across over 10 source systems led to the early identification of unclean data in approximately 10% of the golden source data and resulted in large-scale data remediation efforts that were necessary prior to data migration. Key takeaways and lessons learned about data quality on a financial institution’s customer data are summarized here for the data practitioner, with an emphasis on applicable methods and techniques to gain transparency about an institution’s overall current state of data.
DATA QUALITY IMPERATIVES FOR DATA MIGRATION INITIATIVES: A GUIDE FOR DATA PRACTITIONERS
1. AN EARLY EFFORT IS CRITICAL
In a data migration project, risk, in the form of target system (load) failures, usually surfaces very late. These risks are often the result of poor data quality and poor understanding of the data. Most data migration projects rely on documentation of the current state of data landscape or conversations with source data owners and business experts. This approach is insufficient, as data transformations based on assumptions that may only be valid in certain circumstances will result in data issues and load failures, even with minimal deviation from these assumptions.
Our experience of working at data warehouses of Fortune 500 financial institutions confirms the importance of early and analysis-driven data profiling in the context of data migrations. Data quality issues are bound to surface through profiling activities, and the sooner corrupt, duplicate, incomplete, or incoherent data is identified, the more time remains to cleanse
1 Matthes, F., C. Schulz, and K. Haller, 2011, “Testing and quality assurance in data migration projects,” 27th IEEE International Conference on Software Maintenance (ICSM)
2 Judah, S., and T. Friedman, 2018, “How to create a business case for data quality improvement,” Gartner, June 19, https://gtnr.it/2P9VpOI3 Eckerson, E., “Data quality and the bottom line,” Proceedings of the Seventh International Conference on Information Quality (ICIQ-02)4 Friedman, F., 2018, speech at Gartner Data & Analytics Summit 2018 in Frankfurt, Gartnet, https://gtnr.it/2myYjet

119 /
Reviewing source data for content, quality, relationships, interdependencies, and fitness for purpose is thus a crucial step for gaining insights into the state of a company’s data, making it possible to discover the potential data gaps through descriptive data analysis across multiple systems. This process is referred to as data profiling and will be the focus of this paper. Each of the methods and examples that are mentioned in the following sections are based on practical application of data profiling initiatives and have been evaluated to be imperatives for a successful data migration, be it in the context of a business process outsourcing, a cloud data migration, a merger or acquisition, a system rationalization or retirement, or any other similar data management initiative.
2. DATA PROFILING BEYOND STATISTICS
What is the distribution and frequency of occurrence of qualifiers in SWIFT messages over the past year? How many customers have opened trading accounts on a weekend over the past month? Does the value of a securities portfolio on the customer side reconcile with the value on the custodian side? What is the cause of discrepancies in transactions booked on either side? These are some important questions that can be answered with the help of data profiling analyses, beyond the traditional interpretations of ‘data profiling’.
Traditionally, data profiling is thought of as a statistical report that identifies natural keys, foreign keys, distinct values, missing data, and distribution and frequency of a column’s attributes in a relational database. Business analysts and data analysts perform these statistical analyses to be able to assess:
• Whether the required information is available and complete in the source table
• Whether the source data format adheres to the necessary standards of the target data
• What transformations are necessary to accommodate each occurrence of the source data.
While traditional statistical reports based on a particular column-set are a helpful and necessary start, we recommend data profiling that goes beyond statistical data quality analyses on a column level. The real value of data profiling is derived through the analysis of cardinality, relationships, and interdependencies of data among related datasets and across systems. These attributes are the focus of this article.
DATA INTELLIGENCE | DATA QUALITY IMPERATIVES FOR DATA MIGRATION INITIATIVES: A GUIDE FOR DATA PRACTITIONERS
3. DATA PROFILING PREREQUISITES
Several factors need to be determined before a data profiling project is started, from the perspective of technology tools, infrastructure, data security, data synchronization, and data sources. Specifically, before a company can embark on a data profiling project, the following activities need to be performed:
• Agreement with data owners on how source data will be used and which measures will be taken to ensure data security: it is critical that data profiling exercises are performed on production data (often sensitive data containing customer’s personal information) to ensure that the data being analyzed is representative of the true state and quality of the data. Agreements with data owners may include anonymizing sensitive information prior to testing with the data or specific instructions for encrypting data when it needs to be shared with other parties.
• Setup of a common repository in which synchronized source data extracts will be stored: it is imperative that disparate datasets are analyzed in conjunction with each other, rather than independently. For this reason, the earliest stages of a data profiling exercise should include coordinating a synchronized date and time of pulling the various datasets and loading the disparate datasets onto a common staging area. Once the datasets are staged, they can be loaded onto a designated data mart for analysis.
• Setup of a data mart outlining all data in scope for the data migration: data in scope for data profiling needs to be aggregated onto a designated database, with appropriate keys, links, and referential integrity to allow for a comprehensive analysis of the complete dataset. This may require the availability of additional key mapping tables to allow for a cohesive data model to be built, with linkage to and from all source systems. The data model
Figure 1: Data profiling architecture

120 /
should allow for easy transformations between the source and target state. For this reason, a setup that adheres to the target, as opposed to the legacy system’s data model should be sought. To facilitate easier analysis, datasets should be restricted as much as possible to the data that is necessary for the transformations. This may require irrelevant, i.e., historical or out of scope, data to be deleted as part of the setup measures. Alternatively, additional tables need to be created that will flag keys among the various datasets as in scope versus out of scope for the exercise. With appropriate ‘write’ and data load privileges, the data setup exercise can be performed by a data analyst. Alternatively, this step requires the assistance of a database administrator.
• Infrastructure and tools selection for data quality assessment: the process of uncovering data quality exceptions, duplicates, or missing records is fast
and reliable with the implementation of proper data quality profiling tools connected to a database, such as Informatica Data Quality, Oracle Data Profiling, or SAS DataFlux. These modern enterprise tools can reduce time to insights and allow for quick and easy results in a data quality assessment. They include the following types of analyses, as summarized by Panoply:
– Completeness analysis: detection of null or blank values
– Uniqueness analysis: validation of uniqueness in primary keys and duplicates detection
– Values distribution analysis: distribution of records across different values for a given attribute
– Range analysis: minimum, maximum, average, and median values found for a given attribute
– Pattern analysis: formats and structures for a given attribute, e.g., phone number or area code
TAX DATA
CUSTOMER OWNS ACCOUNT
C1
C2
C3
A1
A2
A3
ER Diagram
The expression of the maximum number of entities that can be associated to another entity via relationship.
One customer can have at most one account.One account cannot be owned by more than one customer.
Occurrence Diagram
TAXES
ACCOUNTS
ADDRESSES
AGREEMENTS
ACCOUNT DATA
SEGMENT CUSTOMER
ADDRESS
CUSTOMER
Cardinality constraints
ONE-TO-ONE (1 : 1)
CUSTOMER OWNS ACCOUNT
C1
C2
C3
A1A2
A4A3
A5
A1A2
A4A3
A5
ER Diagram
1 N
M N
1 1
One customer can have many accounts.One account cannot be owned by more than one customer.
Occurrence Diagram
ONE-TO-MANY (1 : N)
CUSTOMER OWNS ACCOUNT
C1
C3C2
C4C5
ER Diagram
One customer can have many accounts.One account may be owned by many customers.
Occurrence Diagram
MANY-TO-MANY (M : N)
Figure 2: Cardinality constraints
Source: Encyclopedia of Database Systems. Springer
DATA INTELLIGENCE | DATA QUALITY IMPERATIVES FOR DATA MIGRATION INITIATIVES: A GUIDE FOR DATA PRACTITIONERS

121 /
A shortcoming of such tools, and traditional interpretations of data profiling, is that the focus remains on an isolated dataset and attribute. We believe that these tools are best leveraged in conjunction with an SQL or SAS data mart to enable discovery of deeper insights related to the interdependencies of the various datasets. For this reason, we have added traditional data profiling methods in the form of a data quality assessment as prerequisites for deeper and more advanced data profiling methods.
Based on the number of resources available to perform these activities, approximately six to eight weeks should be dedicated to the data profiling prerequisite activities mentioned in the steps above. Assuming that the data and infrastructure are established, it is then time to move beyond the basics.
4. DATA PROFILING FOCUS AREAS
In our experience, issues related to data cardinality and miscommunication across different systems are just as pervasive as isolated data quality issues. A tax system, for example, may identify a particular customer as eligible for tax reporting, while the customer data system might perceive this same individual to be free of tax reporting requirements. Another scenario is where a securities static data system may point to a security that is actively traded on an account, which is flagged as inactive in the corresponding account management system. For this reason, data extracts across disparate datasets need to be analyzed in conjunction with each other, and, ideally, target state transformations should be performed in the context of data analysis, in the form of a prototype of the target state transformations. The goal should be to combine and analyze source datasets in a way that will mimic how the source data fits into the new system. The following areas warrant special attention in such an endeavor.
4.1. Cardinality and referential integrity
As mentioned, a key focus of data analysis should be on the relationships among the various datasets. A data profiling assessment cannot underestimate the requirements of validating cardinality constraints. Data design and architecture decisions, after all, are based on data cardinality. If the target system, for instance, expects a legal entity to be unique, with a 1:1 relationship to a legitimate address that is used for tax purposes, then the same validation needs to occur on the source data. It may appear logical that each legal entity is depicted as a unique customer record, however, like many other general assumptions about data, there will likely be exceptions to this rule. If a business customer has set up multiple accounts, with the same tax ID for validation, and has
different legitimate addresses keyed with each account, then the customer record for a legal entity will no longer be unique. At this point, design decisions need to be made on how to address duplicate records, so as to avoid technical load issues that result from failure to adhere to the target data model. Figure 2 visually depicts data cardinality in form of an entity relationship diagram.
Examples of issues to look out for when assessing entity relationships include the following:
1:N relationships between source data and expected target data:
• Source data: several tax exemption clauses are active for a customer during a given time period (e.g., if the inactive clauses have not been terminated yet).
• Target data: the target system will only accept one tax exemption clause per customer.
• Potential remediation: identify which tax exemption clauses are truly active, or in the case of multiple active clauses, which are in scope for the target state data needs. Terminate or identify the rest as ‘out of scope’. Remediate the data to adhere to the 1:N relationship requirements.
N:1 relationships between source data and expected target data:
• Source data: a security links to a CpD (Conto pro Diverse), trust, or custodian account, meaning that a conglomerate of securities link to one and the same account.
• Target data: a security needs to be associated with a unique account. An account cannot be set up on multiple occasions with more than one security.
• Potential remediation: identify all cases of securities linked to CpDs, custodians, or trusts and parametrize corresponding accounts in a unique setup that adheres to the N:1 relationship requirements of the target system.
Both examples are taken from the context of an ongoing business process outsourcing project in one of Germany’s biggest banks, in 2018. Despite strict reporting standards for large financial institutions, the complexity and intricacy of source enterprise data systems, combined with the vast array of errors that can arise in the source data, mean that large financial institutions are not exempt from inconsistencies in data cardinality. While performing data analysis and data profiling activities, the focus needs to be on outlining,
DATA INTELLIGENCE | DATA QUALITY IMPERATIVES FOR DATA MIGRATION INITIATIVES: A GUIDE FOR DATA PRACTITIONERS

122 /
In this way, outliers or inconsistencies to expectations in cardinality can be addressed with adequate time to react. Updates to a data model require significantly more time to address, as these changes need to be discussed with data architects and business experts. For this reason, it is imperative that this type of analysis is performed with adequate lead time, to allow for necessary reconciliations in the data model.
4.2 Data miscommunication across systems
A further focus of data analysis is to identify the most suitable source of information, or the ‘golden source’ of the source data. In many cases, multiple systems appear suitable and yet when comparing data among the different source data extracts, conflicting conclusions can be drawn. Examples to look out for include, but are not limited to the following two scenarios:
• Discrepancies in values within custodian account portfolios indicate that the number of source tables taken into account is inadequate. Transactions in transit are stored in an altogether different table, which additionally needs to be referred to in order to reconcile account portfolios.
Overall takeaway: discrepancies in aggregated data are a sign that source data extracts that have been considered are insufficient, unsynchronized, or contain booking errors that need to be reconciled.
• An external account referenced in a SWIFT message is not linked to an external account listed in a company’s account management system. The target state system requires an external account to be listed as declared on the SWIFT message, while the preferred source of the data is a structured, relational account management system.
Overall takeaway: inconsistencies in the same data across different source systems can signify that a customer can be associated with several external accounts, based on the settlement instructions at a given point in time. The alternative and more probable assumption, however, is that one of the entered accounts is invalid.
Miscommunication across different systems is a classic issue that surfaces frequently during data profiling exercises that compare data across multiple datasets. Such an issue is difficult to identify in the context of isolated data quality assessments that are performed on a column level. Investigations of this sort require SQL or SAS to draw connections across multiple tables and various sources. When such a level of analysis is already performed in the context of data quality investigations, there is significant return on investment in going that last extra step and prototyping the source data into the target state, with the required transformations. A data analyst with deep skills in SQL or SAS can build a prototype of the target state transformations in a far shorter time frame than is required
Table 1: Data relationship assessment
CUSTOMER ACCOUNT #ACCOUNTS #OPEN TRANSACTIONS
ABCDX 08972 3 6
BZODU 14952 3 6
08972 08972 2 1
ACCOUNT #CUSTOMERS IDENTIFIED #OPEN TRANSACTIONS
14952 1 6
08972 2 7
understanding, and documenting data cardinality for every constellation of source data. A data analyst that is well-scripted in SQL can perform this analysis easily with grouping, partitioning, or modeling statements. For visualizing and
identifying relationships between datasets, we recommend building a matrix of keys, which outlines each combination or occurrence of a key value (Table 1).
Implies an many-to-many (M:N) relationship between customers and accounts, as the same customer (identifier BZODU) owns multiple accounts and at the same time this customer’s account (08972) is associated with a further customer, presumably the spouse or another form of a joint owner.
DATA INTELLIGENCE | DATA QUALITY IMPERATIVES FOR DATA MIGRATION INITIATIVES: A GUIDE FOR DATA PRACTITIONERS

123 /
by a development team to build the enterprise software for a data migration project. In doing so, further gaps that may have not been considered will easily surface and can be addressed prior to the build of the software that will take the project live. This leads to the last focus area of a thorough data profiling exercise:
4.3 Prototyping of target state transformations
An ideal use-case can be developed from the perspective of a business outsourcing project, in which customer static data needs to be migrated to a provider in an all-encompassing customer-based view. Customer data may be spread across more than ten enterprise source systems, but this disparate data needs to be clustered together and sent to the provider as a package for each customer. Performed correctly, the segregated data depicted in the source state needs to be transformed into an all-comprising cluster, as presented in Figure 3.
At first glance, this activity may seem simple, as if only a series of connections across the varying tables is required. In practice, this is not the case. In the process of prototyping these target state transformations, all the constellations that stray from a typical customer will become apparent. Examples could be a legal entity corporation with subsidiaries spread across several countries, who may share legal addresses or tax information with other subsidiaries, or a married couple with several joint accounts as well as individual accounts, or an LLC that belongs to a customer, with the account comprising both personal data and tax agreements associated with their corporation. How do you transform each of these
specific cases, and multiple others that will arise during data analysis investigations? By prototyping each constellation, the gaps between the current state of the data in its legacy form, and the future state data requirements will become apparent. The devil, after all, is in the detail. The value of this exercise is the recognition of such data clusters that are different from the norm. A further example that could highlight the benefits of performing target state transformations in the context of data profiling is a scenario of two different corporations, with different legal addresses, that share an account and securities. This is not a normal setup of a client and it points to a trust relationship.
The target state of the data would require these corporations to be depicted as a joint organization, with their ties outlined in further agreements. The present state of the data, however, does not suggest any partnership between the two corporations. How do you then transform such a constellation? Such obscure cases, which most business analysts and data experts may not consider initially, are precisely the constellations that need to be discussed and prototyped early in trials and tests. This would enable a sound development ‘backbone’ that accommodates the full spectrum of constellations that need to be transformed. It would also prevent subsequent load failures of clusters that do not adhere to the norm.
Overall takeaway: inconsistencies in the same data across different source systems can signify that a customer can be associated with several external accounts, based on the settlement instructions at a given point in time. The alternative, and more probable assumption, however, is that one of the entered accounts is invalid.
DATA INTELLIGENCE | DATA QUALITY IMPERATIVES FOR DATA MIGRATION INITIATIVES: A GUIDE FOR DATA PRACTITIONERS
TAX DATA
Figure 3: Target state transformations
ACCOUNT DATA
SEGMENT
ADDRESS
AGREEMENTS
TAXES
ACCOUNTS
ADDRESSES
CUSTOMER
CUSTOMER

124 /
This exercise of prototyping the target state based on current state production data will likely take an analyst between a few weeks to several months, depending on the complexity of the data and transformations. This time investment is strongly recommended to avoid pitfalls in the later development of the software that will bring the project live. It is easier for developers and architects to set up the basis of the technology with a knowledge of the full spectrum of constellations that need to be accounted for, rather than realize that their development framework is insufficient and does not allow for successful transformation of exceptional data constellations during development.
Indeed, the greatest value derived from data profiling activities is in this third step, which examines and raises questions about less conventional constellations that stray from the expected target state data clusters. Having concluded these steps, a representative view of a company’s data will be achieved, with the inevitable identification of the most critical data quality issues. It is now time to engage with the business stakeholders and assess the impact and potential mitigation measures for the data quality issues found.
5. MITIGATION MEASURES UPON IDENTIFYING DATA QUALITY ISSUES
Upon identifying data quality issues, the magnitude and size of the problem needs to be assessed by data owners, upper management, system owners, architects, and business owners alike. A large-scale data cleansing effort is difficult, if not impossible, to initiate without a sound basis of facts, grounded by business context and an impact assessment. For this reason, we strongly suggest that the data analyst validates each identified data quality issue with technology and business owners and discusses root causes and potential workarounds with the appropriate parties, prior to the onset of the data cleansing efforts.
In the context of unsynchronized data across systems, perceived data quality issues may simply turn out to be the result of late data loads. In the context of missing customer information, for example missing countries of citizenship, such issues may already be addressed in later program updates with default values. A tax division, for example, may re-key an
empty record to the country in which the customer is based prior to submitting tax information to government authorities.
It is also important to discuss data with the target system owners. There may be a workaround for data quality issues that the target system can suggest. It may, for example, turn out that certain requested data is not required for any future process and can be altogether excluded from the data migration. Alternatively, the use of technically feasible default keys may be recommended. Data analysis without appropriate conversations with data owners and business consumers of this data will likely lead to some false findings. Enterprise data systems are highly complex and multi-faceted and even an expert data analyst cannot grasp the full context with a mere data-driven approach to analysis.
Upon validating the pool of identified data quality issues that need to be remediated, the next step for a data analyst is to consolidate each record containing data quality issues, with appropriate links and keys that a business unit can work with, into a single report. Large-scale data cleansing efforts will likely be initiated by a company’s senior management, such as a Chief Data Officer (CDO) or Chief Technology Officer (CTO), and statistics, such as the range and frequency of issues per source system (or customer, business unit, etc.), are likely to be requested.
The design of these reports must be well thought out and contain key information that each business unit needs for further investigations. If certain units require the customer’s name, while others require the customer account number, both pieces of information need to be available.
Management will need to understand the overall impact prior to arranging for large-scale data remediation efforts to take place. Assessing the overall impact may require calculating the average number of data quality issues per client in a particular business division, or the number of customers that cannot be migrated due to data quality issues associated with their accounts. As a result, the report needs to be designed in such a way that will make these statistics possible to retrieve. For this reason, it is important to discuss with all relevant stakeholders their requirements for receiving erroneous data records in a way that enables them to initiate data cleansing initiatives.
DATA INTELLIGENCE | DATA QUALITY IMPERATIVES FOR DATA MIGRATION INITIATIVES: A GUIDE FOR DATA PRACTITIONERS

125 /
At this point, regular meetings will need to be set up with the appropriate units that will be responsible for data cleansing. The ideal scenario is a data cleansing effort that does not require manual intervention of personnel to investigate each customer record. The goal is an automated means of data cleansing. This, however, will not always be possible and for this reason it is important to plan ahead and account for time and resources required for manual investigations. The data analyst needs to be available to assist business owners in this step, through further data assessments and data-driven analysis. System experts familiar with communication across different source systems also need to be brought on board to identify the source systems where the data remediation initiative should be performed, for best results. In our experience, the stage of analysis of the root cause of data quality issues, in an effort to determine the best approach for data cleansing measures, will require approximately a month, depending on the number of data quality issues that needs to be addressed.
Upon identifying root causes and methods of remediation, the data cleansing initiatives in each source system can begin. The timeline for data cleansing efforts may differ per source system and per data quality issue, and the number of records cleansed may not be completed the first time round. For this reason, the data analyst will need to engage in ongoing data checks to assess data cleansing success. Data remediation, after all, is an ongoing effort, as new data is collected every day. In order to prevent new ‘bad’ data from entering IT systems, it is advisable at this stage to discuss and assess the feasibility of setting up front-end controls with plausibility checks that prohibit inaccurate data entry records. Only if the data profiling effort has been completed early enough will there be sufficient time for the completion of a multi-month data remediation effort prior to the data migration.
6. CONCLUSION
The advantages of a comprehensive data profiling effort in the early stages of a transformation project are vast and far reaching, facilitating on-time and in-budget project delivery, while making possible the following benefits:
• Risk reduction through early feedback and early testing of planned data transformations
• Identification of data dependencies and inconsistencies
• Early recognition of potential gaps and problems presented by data, to allow for sufficient time for remediation, with reduced effort
• Early quality checks of both source data and target data against the initial conceptional design and documentation
• Consistent and comprehensive understanding of source production data
• Adequate time for any required data scrubbing, cleansing, and remediation activities
• Discovery of unanticipated business rules and data constellations
The overall benefit of this initiative is in the early risk detection and consequent prevention of wasted costs and project extensions that arise from risk detection in the migration test stages.
While highlighting the benefits, it is important to remember that a data profiling effort needs to be performed at the early stages of a project, ideally before the start of larger-scale developments. A data profiling exercise that occurs concurrently with development or in isolation from development is less effective and will not be as advantageous in terms of the risk reduction goals. The earlier the onset of data profiling activities, the higher the benefits and gains from this effort.
DATA INTELLIGENCE | DATA QUALITY IMPERATIVES FOR DATA MIGRATION INITIATIVES: A GUIDE FOR DATA PRACTITIONERS

© 2019 The Capital Markets Company (UK) Limited. All rights reserved.
This document was produced for information purposes only and is for the exclusive use of
the recipient.
This publication has been prepared for general guidance purposes, and is indicative and subject
to change. It does not constitute professional advice. You should not act upon the information
contained in this publication without obtaining specific professional advice. No representation
or warranty (whether express or implied) is given as to the accuracy or completeness of the
information contained in this publication and The Capital Markets Company BVBA and its
affiliated companies globally (collectively “Capco”) does not, to the extent permissible by law,
assume any liability or duty of care for any consequences of the acts or omissions of those
relying on information contained in this publication, or for any decision taken based upon it.

WWW.CAPCO.COM
ABOUT CAPCOCapco is a global technology and management consultancy dedicated to the financial services
industry. Our professionals combine innovative thinking with unrivalled industry knowledge to
offer our clients consulting expertise, complex technology and package integration, transformation
delivery, and managed services, to move their organizations forward.
Through our collaborative and efficient approach, we help our clients successfully innovate,
increase revenue, manage risk and regulatory change, reduce costs, and enhance controls. We
specialize primarily in banking, capital markets, wealth and asset management and insurance.
We also have an energy consulting practice in the US. We serve our clients from offices in leading
financial centers across the Americas, Europe, and Asia Pacific.
WORLDWIDE OFFICESAPACBangaloreBangkok Hong KongKuala LumpurPuneSingapore
EUROPEBratislavaBrusselsDusseldorf EdinburghFrankfurtGenevaLondonParisViennaWarsawZurich
NORTH AMERICA CharlotteChicagoDallasHoustonNew YorkOrlandoTorontoTysons CornerWashington, DC
SOUTH AMERICA São Paulo
Copyright © 2022 FDOKUMEN