ANALYTICS OF TEXTUAL BIG DATA
345
SAINT PETERSBURG STATE UNIVERSITY Manuscript copyright Ali Noaman Muhammad Aboalyazeed Muhammad ANALYTICS OF TEXTUAL BIG DATA Scientific specialty 2.3.8. Informatics and Information Processes Dissertation is submitted for the degree of Candidate of Technical Sciences Scientific supervisors: Doctor of Physical and Mathematical Sciences, Professor Novikov Boris Asenovich Doctor of Physical and Mathematical Sciences, Professor Kosovskaya Tatiana Matveevna Saint Petersburg 2022
-
Upload
khangminh22 -
Category
Documents
-
view
5 -
download
0
Transcript of ANALYTICS OF TEXTUAL BIG DATA

SAINT PETERSBURG STATE UNIVERSITY
Manuscript copyright
Ali Noaman Muhammad Aboalyazeed Muhammad
ANALYTICS OF TEXTUAL BIG DATA
Scientific specialty 2.3.8.
Informatics and Information Processes
Dissertation is submitted for the degree of
Candidate of Technical Sciences
Scientific supervisors:
Doctor of Physical and Mathematical Sciences, Professor
Novikov Boris Asenovich
Doctor of Physical and Mathematical Sciences, Professor
Kosovskaya Tatiana Matveevna
Saint Petersburg
2022

2
CONTENTS
INTRODUCTION ........................................................................................................... 6
CHAPTER 1. SUBJECT AREA RESEARCH ........................................................... 15
1.1. Introduction ..................................................................................................... 15
1.2. Big Data: Concepts and Characteristics .......................................................... 16
1.2.1. Concepts and Definitions .................................................................... 16
1.2.2. The Four V's Characteristics ............................................................... 18
1.3. Big Data Analytics .......................................................................................... 21
1.3.1. Topic Conceptualization ..................................................................... 22
1.3.2. The Benefits of Using Big Data Analytical Solutions ........................ 23
1.3.3. Preliminary Assessments .................................................................... 25
1.4. Applications of Big Data Analytics ................................................................ 25
1.4.1. Applications of BDA in Marketing and E-Commerce ....................... 28
1.5. Analysis of Customer Feedback ..................................................................... 30
1.5.1. Sentiment Analysis ............................................................................. 30
1.5.2. Aspect-Based Sentiment Analysis ...................................................... 31
1.6. Summary ......................................................................................................... 33
CHAPTER 2. DATA GATHERING AND PREPROCESSING .............................. 34
2.1. Introduction ..................................................................................................... 34
2.2. Background ..................................................................................................... 36
2.2.1. Tokenization ....................................................................................... 36
2.2.2. Stop Word Removal ............................................................................ 38
2.2.3. Lemmatization .................................................................................... 39
2.2.4. Data Segmentation .............................................................................. 40
2.2.5. Part of Speech Tagging ....................................................................... 41
2.3. Big Data Framework ....................................................................................... 43
2.3.1. Data Gathering .................................................................................... 44

3
2.3.2. Data Storage ........................................................................................ 45
2.3.3. Data Integration .................................................................................. 46
2.3.4. Data Processing ................................................................................... 47
2.4. The Proposed Model for Data Preprocessing ................................................. 48
2.4.1. Input Data and Extract Review Text .................................................. 53
2.4.2. Data Cleaning and Filtering ................................................................ 53
2.4.3. Misspelling Correction ....................................................................... 56
2.5. Experiments and Results ................................................................................. 60
2.5.1. Implementation Details ....................................................................... 60
2.5.2. Datasets Description ........................................................................... 61
2.5.3. Experiments and Discussion ............................................................... 63
2.6. Summary ......................................................................................................... 69
CHAPTER 3. ASPECT TERM EXTRACTION ....................................................... 70
3.1. Introduction ..................................................................................................... 70
3.2. Background ..................................................................................................... 72
3.3. The Basic Procedures ...................................................................................... 75
3.3.1. Word Embedding ................................................................................ 75
3.3.2. Multi-Dimensional Reduction ............................................................ 78
3.3.3. Clustering Feature ............................................................................... 80
3.3.4. Feature Selection ................................................................................. 81
3.4. The proposed Model for ATE ......................................................................... 81
3.4.1. The Framework Description ............................................................... 83
3.5. Experiments and Results ................................................................................. 84
3.5.1. Datasets ............................................................................................... 85
3.5.2. Experiment Setup ................................................................................ 86
3.5.3. Testing and Evaluation Metrics .......................................................... 89
3.5.4. Result Analysis and Discussion .......................................................... 90
3.6. Summary ......................................................................................................... 95
CHAPTER 4. USER GENDER IDENTIFICATION ................................................ 96
4.1. Introduction ..................................................................................................... 96
4.1.1. Research Objectives ............................................................................ 97

4
4.1.2. Contributions ...................................................................................... 98
4.2. Background ..................................................................................................... 99
4.2.1. Web Personalization ........................................................................... 99
4.2.2. Gender Identification Techniques ....................................................... 99
4.3. The Basic Procedures .................................................................................... 101
4.3.1. Data Conversion and Cleaning ......................................................... 102
4.3.2. Dynamic Pruned N-Gram Feature Selection .................................... 102
4.3.3. Misspelling Correction ..................................................................... 104
4.4. The Proposed Model for GI .......................................................................... 106
4.4.1. The Framework Description ............................................................. 106
4.5. Experiments and Results ............................................................................... 109
4.5.1. Datasets ............................................................................................. 109
4.5.2. Experiment ........................................................................................ 110
4.5.3. Testing and Evaluation ..................................................................... 112
4.6. Discussion ..................................................................................................... 115
4.7. Summary ....................................................................................................... 116
CHAPTER 5. RECOMMENDER SYSTEMS ......................................................... 117
5.1. Introduction ................................................................................................... 117
5.2. Background ................................................................................................... 119
5.2.1. Basic Concepts of RSs ...................................................................... 119
5.2.2. Methods for Creating RSs ................................................................ 120
5.2.3. Applications of RSs .......................................................................... 123
5.3. Related Works ............................................................................................... 124
5.4. The Proposed System for Product Recommendations .................................. 126
5.4.1. Rating Products ................................................................................. 126
5.4.2. Extracting Preferences ...................................................................... 129
5.4.3. Generating Recommendations .......................................................... 130
5.5. Experiments and Results ............................................................................... 131
5.5.1. Datasets ............................................................................................. 131
5.5.2. Testing and Evaluation Metrics ........................................................ 132
5.5.3. Result Analysis and Discussion ........................................................ 133

5
5.6. Summary ....................................................................................................... 134
CONCLUSION ............................................................................................................ 136
LIST OF ACRONYMS ............................................................................................... 139
LIST OF TABLES ...................................................................................................... 141
LIST OF FIGURES .................................................................................................... 143
ACKNOWLEDGMENTS .......................................................................................... 145
REFERENCES ............................................................................................................ 146

6
1. INTRODUCTION
Topic Relevance
Digital data generated every second worldwide is produced in a structured, semi-
structured, and unstructured format. Unfortunately, traditional data analytics techniques
cannot handle these volumes of data considering their complex structures. Therefore, big
data analytics has emerged as a substantial research area and intensively researched to
handle these problems.
Sentiment analysis on social media and e-markets has become an emerging trend.
Preparing and transforming raw textual data into a suitable form for applying the desired
analysis is the most time-consuming and computations step in any analysis task. This
work proposes a data preprocessing model for textual data using a combination of NLP
techniques. The proposed model improves the quality of the resulting data by preserving
the text's context.
Extracting aspect terms for structure-free text is the primary task incorporated in the
aspect-based sentiment analysis. This significance relies on the dependency of other tasks
on the results it provides, which directly influences the accuracy of the final results of the
sentiment analysis. In this work, the aspect term extraction model has been proposed. The
model is based on clustering the word vectors generated using the pre-trained BERT
model. Dimensionality reduction technique "SOM" was employed to improve the quality
of word clusters obtained using the K-Means++ clustering algorithm.
Gender classification represents a significant task towards modeling user behavior.
This work proposes a dynamic pruned n-gram model for recognizing the gender of the
customers from their usernames. It exploits review data availability on online websites
and extracts the username dataset. Gender identification of the customer through his

7
profile name encounters several challenges that we have stated clearly. The proposed
model constitutes several subtasks that cooperate efficiently, including segmentation,
numerical substitution, fuzzy matching, etc.
Online customers' opinions represent a significant resource for both customers and
enterprises to extract much information that helps them make the right decision. Finding
relevant data while searching the internet represents a big challenge for web users, known
as the "Problem of Information Overload." Recommender systems have been recognized
as a promising way of solving such problems. In this thesis, a products recommendation
system called "SmartTips," has been introduced. The proposed model is based on aspect-
based sentiment analysis, which exploits customer feedback and applies the aspect term
extraction model to rate various products and extract user preferences as well. Several
factors were considered, including readers' votes, aspect term frequency, opinion words
frequency, etc.
Research Goals and Objectives
I. Research Goals:
The primary goal of this thesis is to study theoretical, methodological, and practical
issues of big data analytics, aiming to develop computational algorithms and implement
the corresponding software that works in real-time in order to allow efficient processing
of online textual contents using the big data framework. These algorithms are based on
novel incremental approaches of the well-known natural language processing techniques.
The proposed algorithms aim to maximize the benefits of available text resources and
extract the largest amount of information, taking into account various factors affecting
the quality of the resulting information.
II. Research Main Objectives:
In order to reach the mentioned goals, the following objectives have been set, where
the corresponding tasks need to be resolved:

8
1. Analyzing the problematics issues related to big data, including data storage,
processing, and analysis.
2. Studying the state-of-the-art techniques in text mining, natural language
processing, and web recommendations.
3. Examining various NLP techniques in order to justify the options of the developed
pipeline model for text processing.
4. Collecting and building a diverse dataset from real online resources to serve as the
experimental field for the developed algorithms.
5. Developing a novel model for extracting prominent aspect terms from text using
the machine and deep learning techniques.
6. Developing a gender classification algorithm based on a dynamic pruned n-gram
model and the proposed pipeline for data processing.
7. Developing a recommendation model based on the proposed aspect term extraction
algorithm and sentiment analysis technique.
8. Implementing the involved software on the base of the proposed models in order
to verify their efficiency experimentally.
Research Outcomes
▪ The experiments on the proposed pipeline for natural text preprocessing show
improvements in the quality of the processed text, which subsequently affects
positively on the applied analysis technique.
▪ The algorithm offered for aspect term extraction provides improvements in feature
extraction from free text, which outperforms the baseline methods.
▪ The algorithm for gender identification provides promising results respecting the
small amount of information required for classification.
9 ▪ The model for web recommendations offered reasonable performance for
extracting user preferences and making recommendations in addition to handling
the cold starting problem.
▪ The experiment on the proposed models confirms their feasibility for
implementation and demonstrates their efficiency.
Methods and Methodology
The research methods are obtained and justified through the methods of data
collection, information extraction, text parsing, pattern recognition, statistical analysis,
deep learning, machine learning, linguistics, natural language processing, etc.
This dissertation uses a general methodology of the data and information sciences
based on data gathering and preprocessing, text representation, modeling, analysis, and
synthesis of the theoretical and practical work material.
Research Background
The research offered in this dissertation is based on the theoretical approaches and
practical applications presented and proved in Russian and international scientific
literature.
To date, big data analytics is one of the most promising and rapidly developing areas
in data sciences and the entire modern business. Processing natural text is still a
challenging task, with no standard procedures valid for all analysis tasks. Similarly,
developing a domain-independent aspect term extraction model is mandatory.
Additionally, generating real-time recommendations with accepted prediction accuracy
is required. Generally, the scientific domains related to the research problem of this thesis
include Natural Language Processing, Aspect-based Sentiment Analysis, Gender
Classification, and Recommender Systems.

10
Recently, many algorithms have already been offered for the problems mentioned
above. However, the scalability of the algorithms that solve these and other problems on
big data is still the principal direction for research in this area. Additionally, the
development degree of the proposed solutions is still not sufficient in terms of precision,
efficiency, and complexity.
Scientific Novelty
The scientific novelty of the dissertation is that the implemented research and
applied analysis have led to new solutions to the research problems related to textual big
data analytics.
The results of the dissertation research of the scientific novelty can be classified as
follows:
1. Introducing an ensemble model for preprocessing natural text, which improves
resulting text quality and analysis results as well. The proposed technique preserves
the context of the text significantly. Also, the misspelling correction procedure
dramatically reduces the volume of unidentified text.
2. Developing a new aspect term extraction techniques from natural text. The
algorithm is based on neural networks and deep learning techniques. The proposed
technique is domain-independent.
3. Developing a dictionary-based gender classification technique. It introduces a
dynamic pruned n-gram model for feature extraction. Also, it introduces the
leetspeak decoding to retrieve original names.
4. Developing a recommendation model based on aspect-based sentiment analysis.
The proposed model extracts user preferences and uses them to weigh preferred
aspects in order to rate candidate products. It can handle the cold starting problem.

11 Thesis Statements to be Defended
The following provisions are claimed to defend the dissertation research:
1. An ensemble method for natural text preprocessing is developed and implemented,
taking into account various factors affecting the text quality.
2. A new domain-independent algorithm for aspect terms extraction is proposed.
3. A novel model for gender identification is introduced that uses leetspeak decoding
and dynamic pruned n-gram model for feature extraction.
4. A recommendation model based on aspect term extraction and sentiment analysis
is developed. The proposed model guarantees to generate predictions even the user
is new.
Theoretical and Practical Significance of the Work
The theoretical value of this work for future research lies in the offered analysis of
the big data analytics problems and the development of methods for natural language
preprocessing, gender classification, aspect term extraction, and online recommender
system. The fundamental and state-of-the-art solution algorithms and techniques were
analyzed. Such algorithms can be used in modern systems operating on data sciences,
such as social networks, e-marketing, and real-time recommendations.
The practical value of the work involves the new algorithms offered. These
algorithms can also be used in the mentioned systems and meet the users’ demand for fast
data analysis and real-time result generation. The research validity of the results is
verified by using the results of computational experiments.
The Personal Contribution of the Author
All the major scientific findings in this dissertation were achieved by the author
personally and are represented in the joint authorship works with the Russian member

12 (Boris A. Novikov) and the Egyptian members (Hesham A. Hefny and Ahmed M.
Gadallah).
Work Approbation and Publications
The materials presented in this thesis were presented at Russian and International
conferences:
1. 14th International Baltic Conference on Databases and Information Systems (Baltic
DB&IS 2020), Tallinn, Estonia, June 16-19, 2020, http://ceur-ws.org/Vol-
2620/paper6.pdf; "Aspect-Oriented Analytics of Big Data".
2. 2020 International Multi-Conference on Industrial Engineering and Modern
Technologies (FarEastCon), Vladivostok, Russia, October 6-9, 2020,
https://ieeexplore.ieee.org/document/9271467; "An Integrated Framework for Web
Data Preprocessing Towards Modeling User Behavior".
3. The National (All-Russian) Conference on Sciences and Humanities – «Science
SPbU – 2020», St. Petersburg, Russia, December 24, 2020,
https://events.spbu.ru/events/science-2020; "A Hybrid Model for Analyzing
Customer Reviews Through A Big Data Platform".
4. The International Conference on Sciences and Humanities "Science SPbU – 2020",
St. Petersburg, Russia, December 25, 2020, https://events.spbu.ru/events/science-
spbu; "Using Natural Language Processing Techniques and Machine Learning to
Analyze Textual Data: A Big Data Approach".
5. 2021 IEEE Conference of Russian Young Researchers in Electrical and Electronic
Engineering (ElConRus), Moscow and St. Petersburg, Russia, January 26-29, 2021,
https://ieeexplore.ieee.org/document/9396606?fbclid=IwAR05rq_TSmkTVTT7nyQ
lNreWdWQxobzBotMhhSKXwCThuqucQMubylil3jk; "A Multi-Source Big Data
Framework for Capturing and Analyzing Customer Feedback".

13 6. All-Russian Conference on Natural Sciences and Humanities with International
Participation "Science SPbU - 2021", St. Petersburg, Russia, December 28, 2021,
https://events.spbu.ru/events/nauka-2021; "An Ensemble for Natural Text
Processing".
The main results on the topic of the thesis are presented in 5 publications total [1-5]:
1. Ali N. M., Novikov B. A. Big Data: Analytical Solutions, Research Challenges and
Trends // Proceedings of the Institute for System Programming of the Russian
Academy of Sciences. ‒ 2020. ‒ Vol. 32, No. 1. ‒ P. 181-204. ‒ DOI:
10.15514/ISPRAS-2020-32(1)-10.
2. Ali N. M. Aspect-Oriented Analytics of Big Data // The 14th International Baltic
Conference on Databases and Information Systems (Baltic DB&IS 2020) / Ed.
Matulevičius R. et al. ‒ Vol. 2620: CEUR Workshop Proceedings ‒ Tallinn, Estonia:
CEUR-WS.org, 2020. ‒ P. 41-48
3. Ali N. M., Gadallah A. M., Hefny H. A., Novikov B. An Integrated Framework for
Web Data Preprocessing Towards Modeling User Behavior // 2020 International
Multi-Conference on Industrial Engineering and Modern Technologies (FarEastCon)
‒ Vladivostok, Russia: IEEE, 2020. ‒ P. 1-8. ‒ DOI:
10.1109/FarEastCon50210.2020.9271467.
4. Ali N. M., Novikov B. A Multi-Source Big Data Framework for Capturing and
Analyzing Customer Feedback // 2021 IEEE Conference of Russian Young
Researchers in Electrical and Electronic Engineering (ElConRus) / Ed. Shaposhnikov
S. ‒ Moscow and St. Petersburg, Russia: IEEE, 2021. ‒ P. 185-190. ‒ DOI:
10.1109/ElConRus51938.2021.9396606.
5. Ali N. M., Gadallah A. M., Hefny H. A., Novikov B. A. Online Web Navigation
Assistant // Vestnik Udmurtskogo Universiteta. Matematika. Mekhanika.
Komp'yuternye Nauki. ‒ 2021. ‒ Vol. 31, No. 1. ‒ P. 116-131. ‒ DOI:
10.35634/vm210109.

14 Dissertation Structure
The thesis consists of an introduction, five chapters, a conclusion, a list of acronyms,
figures, tables, and references. The total volume of the thesis is 162 pages with 27 figures
and 19 tables. The list of references contains 178 items.

15
1. CHAPTER 1.
SUBJECT AREA RESEARCH
1.1. Introduction
This fact is due to the popularity of the Internet, the advent of Web technologies,
and the increase of utilizing digital sensors, communications, computation, and storage
that create massive data collections [6]. The volume of data available on the Internet is
measured in exabytes (1018) and zettabytes (1021). Accordingly, expectations refer to
that, in the next few years, the volume of data on the Internet will exceed the storage
capacity of living people's brains worldwide [7].
Digital data generated every second worldwide is produced in a structured, semi-
structured, and unstructured format. This massive accumulation of generated data is
known as "Big Data." Moreover, the generation and adoption of specialized applications
related to Social Media, Marketing, E-commerce, etc., provides extensive opportunities
and challenges for researchers and practitioners. The enormous volume of data generated
by users using these platforms results from the integration between their experience and
daily activities [8].
Recently, Big data analytics has emerged as an important research area and
intensively researched. Unfortunately, traditional data analytic techniques may lack the
ability to handle such large quantities of data [9]. Such data consist of data sets that are
difficult for legacy database management systems to analyze [10]. Therefore, this
emerging field has attracted researchers worldwide to design, develop, and implement
various tools, techniques, architecture, and platforms to analyze this growing volume of
generated data [11-14].

16
Interested researchers are invited to handle several challenges and answer the
following questions: (1) How to design and develop a high-performance framework for
efficiently analyzing big data; and (2) How to design a suitable algorithm for mining and
to extract useful information from big data [9]. To deeply discuss these issues, the
structure of the chapter is depicted below.
This section is an introductory section about the subjects and motivations for this
work. Next, section 2 describes topic foundations and the most significant aspects of big
data, including the main characteristics. Section 3 presents a study of big data analytics
and states the advantages of using big data solutions. Additionally, it involves asserting
the necessary preliminary assessments required to perform successful migration to the
new technologies. Next, Section 4 presents the most significant fields that employ big
data applications to obtain a broad perspective regarding big data analytics. The analysis
of customer feedback as a substantial resource for both consumers and companies and
also one of the most significant fields of big data analytics applications are discussed in
section 5 with a concentration of Sentiment analysis and Aspect-based sentiment analysis
as promising techniques used widely to get insights of customers' reviews; finally, in
section 6, presents chapter summary and some conclusions that reached.
1.2. Big Data: Concepts and Characteristics
This section presents theoretical conceptualizations of big data and its characteristics
to reveal the challenges of tackling big data analytics in various applications areas.
Uncovering these challenges helps to determine, at a high level, essential functional and
non-functional requirements that should be considered while designing and developing
big data analytics frameworks.
1.2.1. Concepts and Definitions
Proceeding from the fact concerning the existence of many types of modern digital
technologies that have permeated our daily lives like mobiles, sensors, and social media
networks due to the expansion of using advanced digital artifacts. The proliferation of

17 these technologies in everyday life enhances human-to-human, human-to-machine, and
machine-to-machine interaction at unprecedented levels, resulting in vast amounts of data
known as Big Data. Several proposals appeared to describe this phenomenon and give a
definition of the term Big Data, invented by Roger Magoulas from O'Reilly Media in
2005 [15].
James Manyika et al. [16] define Big Data as "datasets whose size is beyond the
ability of typical database software tools to capture, store, manage, and analyze."
According to this definition, there are no standard limits for considering datasets as big
data (e.g., describe big data as being larger than a certain number of terabytes). Also, we
can notice that the volume of data is not the only factor in considering a dataset as big
data. Therefore, it is significant to distinguish big data from massive data.
The analyst firm Gartner [17] introduces a definition of big data, which considers
one of the most comprehensive and widely used in this context, "Big Data is high-volume,
high-velocity and/or high-variety information assets that demand cost-effective,
innovative forms of information processing that enable enhanced insight, decision
making, and process automation."
The challenge with Gartner's definition is that, in addition to state the main
characteristics of big data, also, it focuses on describing how the benefit of big data can
achieve and state the desired outcome. According to a clear understanding of these
perspectives, organizations could determine whether they are using big data solutions or
even if they have problems that need a big data solution, regarding the difficulties in
scoping what is intended to design, developed, and delivered, and what the result's mean
to the organization.
In accommodation with Gartner's definition, David Loshin states in [18] that, "Big
Data is fundamentally about applying innovative and cost-effective techniques for solving
existing and future business problems whose resources requirements exceed the
capabilities of traditional computing environments." Furthermore, Krish Krishnan [19]
defines Big Data as "volumes of data available in varying degrees of complexity,

18 generated at different velocities and varying degrees of ambiguity, that cannot be
processed using traditional technologies, processing methods, algorithms, or any
commercial off-the-shelf solutions."
Likewise, based on the distinctions between the capabilities of legacy database
technologies and new data storage and processing techniques and tools (e.g., Hadoop
clusters, Bloom filters, and R data analysis tools), Davis and Patterson [20] state that big
data refers to "data too big to be handled and analyzed by traditional database protocols
such as SQL." Also, Paul C. Zikopoulos et al. [21] say, "Big Data applies to information
that can't be processed or analyzed using traditional processes or tools."
1.2.2. The Four V's Characteristics
For the most part, in the popularization of the big data concepts, the group of authors
mentioned previously proceeding away from considering the size aspect of data only
while the process of defining Big Data! Therefore, there are other meaningful
characteristics of big data to be considered in addition to the volume of data. The research
community looks to stick with the attraction that appears in the common parts of
presented definitions, which focus heavily on what is referred to as the 3, 4, or even 9 V's
as depicted in [22].
Although the definition of V's is ubiquitous, it should note that the origin of the
concept is not entirely new, it provided by the analyst Doug Laney in a research note
published by Meta Group (Now Gartner Group), from 2001 concerning "3-D Data
Management" [23]. The author noted that the changing of economic conditions affects
the efforts done by companies as they struggle to standardize systems and fold redundant
databases to enable greater operational, analytical and collaborative coherence; it also
makes this task more difficult. Also, he identifies e-commerce as the reason for raising
data management challenges across three dimensions: Volumes, Velocity, and Variety.
Finally, the author advised information technology organizations to assemble various
methods at their disposal to deal with each of them.

19
Commonly, big data characterizes by four V's characteristics, as mentioned in Figure
1.1: Volume, Velocity, Variety, and Veracity. Other researchers have built upon that trend
to include additional V's such as Visualization or Validity intended to capitalize on an
apparent improvement to the definition. As follows, a brief discussion of the fundamental
characteristics of big data.
• Volume: As the name implies, the data size exceeds the capacity of traditional
operational databases or data warehouses. In 2019, "Hootsuite & We Are Social"
published the Global Digital Statshot report regarding Internet Trends in Q3 [24]. The
report displays the continuous growth of digital connectivity at an extraordinary rate
around the world. Authors say that almost 900,000 people came online for the first
time every day over the past year. Also, many factors increase the volume of data like
streaming data, storing different types of data from social networks, and other
resources. Moreover, the Internet of Things (IoT) and scattered sensors worldwide in
all devices that generate data every second represent a major grantor to the expanding
digital universe [25]. Consequently, International Data Corporation (IDC) expects
that by 2025, the Global Datasphere will grow around 61% from 33 Zettabytes (ZB)
in 2018 to 175 ZB. It noted that as much of the data residing in the cloud as in data
centers [26]. Therefore, companies are required to accommodate the new volumes by
improving archiving and data importance strategies.
• Velocity: Denotes the speed of generating, storing, analyzing, and visualizing the
data. It is noted the high rate of data streaming into hosting platforms. Currently, the
speed of data generation is almost unimaginable. For example, users upload more than
720,000 hours of new content per day on YouTube, which means 500 hours of fresh
video per minute [27]. Moreover, there are 500 million tweets sent every day on
averages of more than 20,000 tweets per minute [28]. Also, in 2014, the Facebook
research center reported that over four new petabytes of data are generated and ran
600,000 queries per day [29]. In addition to the high rate of data generation, this
characteristic imposes an essential concern on data aging and the lifetime of data.

20
Figure 1.1. Big data characteristics
How long the data will be valuable is a big challenge that organizations have to cope
with, regarding the high rate of data generation and use in real-time. The speed of data
generation requires keeping up with processing tasks to meet the demand. Sometimes,
the speed of applying the analysis of streaming data is critical [30].
• Variety: Big data refers to the large volumes of data generated in different formats.
The complexity of Big data formats requires different approaches and techniques to
store all raw data. Several different types of data differ in the way of creation and
storage. These types require various types of analysis to be applied or use different
tools. According to nature and characteristics, data is categorized into three types.
o Structured Data: Most created digital data was structured data in the past, but
today it constitutes around 10% of the total digital data. This type of data concerns
all data which could be neatly fitted in columns and rows and stored into a
spreadsheet or database. Relational data (e.g., SQL database), Meta-data (e.g.,
time and date of creation), Library catalogs (e.g., date and author), Census records
(income and employment), and Economic data (e.g., GDP) are various examples
of this type.

21
o Semi-structured Data: This type refers to data with some organizational
properties; such format could help in the analysis process, also known as a self-
describing structure. Examples of semi-structured data exist like XML (e.g.,
stored personal data), JSON (e.g., script documents), and NoSQL (e.g., databases
like MongoDB).
o Unstructured Data: This type refers to, as the name implies, non-systematic data.
That may include every kind of data that carries an unknown form or structure.
Today more than 80% of the data that organizations generate is unstructured data.
Many examples of unstructured data exist like sensor data, social media streams,
images, videos, mobile data, text files, etc.
• Veracity: Refers to the reliability of the data. Many parts of data consider Not useful
such parts involve noise, biases, anomalies, and abnormal data. Wrong data will lead
to misleading results and incorrect decisions. So, organizations must decide before
beginning the analysis whether data is meaningful or not. Accordingly, ensure the
trustworthiness of data sources and the correctness of data are mandatory. Therefore,
developers have become involved and more willing to invest in cleaning up the data
at the source.
Consequently, the realization of the tremendous business value of data is the main
reason for using big data. Therefore, the term Big data exceed the reference to datasets
only and expand to cover space problems, technologies, and opportunities to enhance
business value, so it considers a general term. However, the expectation that the adjective
big will fade over time is still considered meaningful, as the explicit meaning of the data
will be intuitively expanding to include all data types [31].
1.3. Big Data Analytics
Today, enterprises seek to discover facts they did not know before by searching
through massive amounts of highly detailed data. Analysis of large datasets unfolds and
improves business values. However, the growing volumes of data increase the difficulties
with management and manipulation. This section demonstrates the concepts and basics

22 of big data analytics and the benefits of exploiting available assets of big data regarding
Business Intelligence (BI) [32].
1.3.1. Topic Conceptualization
Big Data Analytics (BDA) refers to the advanced analytic techniques to apply to big
data sets [33]. An example of analytical tasks may include searching for specific data,
patterns, data retrieval, organization, etc. Therefore, the application of superior analytical
techniques comprises the entire processes and tools required for knowledge extraction
[34]. These processes incorporate multiple tasks that start with data acquisition and
extraction, followed by data transformation. Next, preparing and loading data for
analysis, including employing appropriate tools and techniques for getting desirable
results—finally, the delivery of realized results to support decision-makers [35].
Generally, data analysis involves examining sets of data to uncover hidden patterns,
correlations, and other insights and render conclusions. These tasks could classify into
three main areas, Statistical analysis, modeling, and predictive analysis [36]:
• Statistical Analysis: Regarding business intelligence, it involves collecting and
examining each sample of data in a set of elements from which it can draw. It is
strictly related to hypothesis testing, and the main goal is to recognize and predict
future trends.
• Modeling: Refers to the processes used to identify, describe, and analyze the
requirements of data, also to describe the overall behavior of a system, it plays a
crucial role in the growth of any business. These processes include the use of
mathematical equations or some logical language. The main objective of data
modeling is to support business processes and give answers to business questions
more easily and quickly.
• Predictive Analysis: Represents a form of advanced analytics concerned with
guessing how an individual, group, or data object will behave and forecasting trends

23
based on historical data or the recognized behaviors of similar individuals or groups.
It includes several types of algorithms like recommenders, classifiers, and clustering.
Big data analytics are different from small and traditional data analytics. From this
perspective, Joshua Eckroth [11] defines big data in adaption with a definition from Philip
Russom [33] as follows: "A data analysis task may be described as big data if the data to
be processed have such high volume or velocity that more than one commodity machine
is required to store and/or process the data."
Otherwise, from the perspective of Business Intelligence and the advantages of data
analytics, Rick F. van der Lans [37] says, "Big data is revolutionizing the world of
business intelligence and analytics." Thus, big data analytics revolves around two items,
big data, and analytics, and how the collaboration and the combination between the two
items could create one of the most intellectual trends in business intelligence today [33].
1.3.2. The Benefits of Using Big Data Analytical Solutions
Despite the difficulties and challenges involved in building and developing big data
analytics platforms due to the complex nature of big data, enterprises are working quickly
to build analytical solutions for big data. This situation is because of the great opportunity
it offers to upgrade from traditional information extraction methods into new dimensions.
Decisions made without data-driven answers will likely fail, so organizations must build
systems that support data-driven decision-making [38].
Traditionally, organizations recognized that the insights of owned data could
extensively benefit their business performance. The importance of big data does not rely
only on the volume of data a company has but how a company utilizes the collected data.
Hence, big data analytics represents a competitive advantage for businesses. Achieved
benefits and values utilizing big data analytics solutions could be determined by how
enterprises use the data [39].
Enterprises are now facing challenges to create new business actions based on the
benefits brought by available types of analysis. Efficient analysis of owned and collected

24 data helps the business find answers to improve the organizational value [40]. Moreover,
companies that use comprehensive big data analytics solutions realize the benefits,
obtaining even more insights that drive intelligent decision-making. These insights
represent new means of making business by leveraging new types of analytics across
different data types.
Therefore, we can classify the significant contributions of big data to the
organization into four main classes; the essence of these classes and their sub-items
reflects on adding value to the organization through realized benefits using big data
analytics solutions. There are no restrictive borders due to the integration between each
other, so some of the primary elements may belong to more than one category [41-43]:
A. Increasing Revenues:
o Adding value to online and offline customer interactions.
o Generate customer offers based on their buying habits.
o Improve customer participation and increase customer loyalty.
o Online reputation control.
o Personalize the customer experience.
B. Lowering Costs:
o Optimizing the processing time and quality of results.
o Saving and controlling costs.
C. Increasing Productivity:
o Allowing the development of new products and services.
o Increase the capabilities to link production to market needs.
o Increase the capabilities of redesign products.
D. Reducing Risk:
o A full understanding of the capabilities of data-driven marketing.
o Getting a more reliable understanding of the market conditions.

25
o Rapid re-evaluation of risk portfolios.
o Real-time identification of the root causes for failure and issues.
1.3.3. Preliminary Assessments
Before starting to build a new big data solution, enterprises are required to perform
primary assessments. The Migration from traditional analytic solutions to big data may
cost much time and require extra investments in infrastructure. So, it is significant to
know the actual state of the business and evaluate the needs of this step. The trade-off
between costs and potential benefits is essential to select the best path and decide whether
to continue with traditional schemes or transform them into new ones. Without proper
organizational evaluation and preparedness, neither strategy is likely to succeed [44].
The big data approach is more appropriate to address or resolve business problems
that meet one or more of the following criteria as depicted in Figure 1.2 [45]. These
evaluation criteria can be used to assess the relevance of business problems toward big
data technology if there is a correlation with business problems whose solutions fit big
data analysis applications.
1.4. Applications of Big Data Analytics
Concerning the continuous growth in big data analytics and its substantial impact on
human life, big data applications introduce cutting-edge opportunities in every aspect of
our daily life. The primary goal of big data applications is to help companies make more
informative- business decisions by analyzing large volumes of data, given the tremendous
competition where we are living overall the world [46].
The applications of big data positively change our life for the better and smoother as
well. We are utilizing big data solutions to improve our efficiency and productivity. This
opportunity encourages researchers and technology providers to develop complicated
platforms, frameworks, and algorithms to struggle with big data challenges.

26
Figure 1.2. Evaluation criteria to build a big data solution
Table 1.1 outlines the most significant fields where use big data applications and
available data resources and applications trends. As follows, a brief discussion on the
applications of big data analytics in marketing and e-commerce, which represents the
major field of this research.
Table 1.1. The most popular applications of big data analytics
Field Data Resources Application Trends
Education
Personal information; Academic progress; Attendance; Student status; Student activities; Student interests; Financial status; Course plans; Staff details; Organization details; Facial expressions.
▪ The expansion of using e-learning systems,
▪ Enhancing student results, ▪ The development of grading system, ▪ Gaining attention, ▪ Customized programs, ▪ Reducing the number of dropouts.
Agriculture
Geographical and climatic conditions (e.g., climate, temperature, precipitation,
▪ Feeding a growing population, ▪ Using pesticides ethically, ▪ The development of the social economy, ▪ Control greenhouses and cultivate
crops,

27
Field Data Resources Application Trends humidity, sunlight); Crop production; Fertilizers usage data; Pesticides usage data.
▪ Optimize crop efficiency, ▪ Optimizing farm equipment, ▪ Managing supply chain issues, ▪ The automation of the watering system.
Healthcare
Diagnostical reports; Analysis reports; Visiting's records; Clinical trials; Medications usage; Exercise directions; Insurance data; Treatment follow-ups.
▪ Improving the process of rendering healthcare,
▪ Reducing consumption of money and time,
▪ The development of new infrastructure and emergency medical services,
▪ The evaluation of symptoms, ▪ Disease prediction.
Smart Cities
Historical and geographical data (e.g., transportation, crimes); Sensor data (e.g., rails, airports, seaports, roads, power, water, communication); Camera records.
▪ Intelligent traffic management, ▪ Promoting public safety, ▪ Managing smart cities infrastructure, ▪ Optimizing the usage of resources, ▪ Managing maintenance activities.
Criminal Analysis &
Fraud Detection
Bank transaction records; Mobile call records; Web and social media (e.g., social meeting sites like Facebook, Twitter, and LinkedIn).
▪ The determination of fraud against enterprises,
▪ Investigate claims and transactions in real-time,
▪ Discover general patterns across multiple transactions,
▪ Recognize abnormal behavior from individual users,
▪ Credit card fraud detection.
Government
Government records; Transaction records; Digital government portal; Social media (e.g., Facebook, Twitter, and LinkedIn); Residents data; Feedback and questionnaires.
▪ Support government election campaigns,
▪ Policy augmentation, ▪ Strengthening emergency response, ▪ Anti-money laundering, ▪ Prevent internal threats, ▪ Enhance workforce effectiveness, ▪ Strengthening national security.

28
Field Data Resources Application Trends
Marketing & E-
Commerce
Customers data (e.g., personal data, geographical data, preferences); Online transactions records; Online customers reviews and feedback (e.g., ratings, questions); E-mails and SMSs; Social media (e.g., Facebook, Twitter); Customer services call records.
▪ Improved forecasting and planning, ▪ More granular audience targeting, ▪ Optimizing campaigns in real-time, ▪ Moving to multi-touch attribution, ▪ Building better customer relationships, ▪ Appropriate brand positioning, ▪ Optimizing prices, ▪ Designing promotional campaigns and
advertisements, ▪ E-commerce personalization, ▪ Online Recommender Systems.
1.4.1. Applications of BDA in Marketing and E-Commerce
The tremendous expansion in the use of modern technology and various devices in
commercial transactions has made marketing and electronic commerce one of the most
informative areas. This development has brought about drastic changes in the global
economy map due to the successive changes in trade and marketing strategies to keep
pace with this tremendous development. Marketing trends for companies have completely
changed [47].
Digital marketing is the key to success in any company. Big data has made digital
marketing powerful and has become an essential part of any business. Now, any business
can manage marketing promotional activities, run successful advertising campaigns, and
promote their products and services regardless of their size. Various forms of marketing
campaigns appear in different places, such as social media platforms (e.g., Facebook,
Linked In, Twitter, etc.), ads placed on YouTube and TV, companies' websites, Digital
Markets, Text messages, E-mails, etc.
Big data analytics offers several solutions for helping enterprises in analyzing
available tremendous datasets [48]. One example investigates what kinds of

29 advertisements compel viewers to continue watching and what turns viewers off. It uses
facial recognition software to learn how well their advertising succeeds or fails at
stimulating interest in their products. That helps marketers to create widely accepted ads
to increase sales.
Another example of using big data solutions for analyzing customer calls. Analyzing
the content of customer contact records with call centers helps determine their sentiment
that represents a powerful barometer and influencer of the market sentiment. Big data
solutions can help recognize repeating issues or patterns of customer and employee
behavior by understanding time/quality accuracy metrics and recording and analyzing the
call's content.
Moreover, the advent of social media is one of the most substantial contributors to
big data. Based on its significant importance, various solutions were introduced to analyze
user's activities [49-51]. Big data analytics can provide valuable insights in real-time
about how the market is responding to products and campaigns [52]. According to
obtained results, companies can adjust their prices, forecasting demand and its
distribution, adjusting production, update distribution strategies, promotions, and
campaign placements accordingly [53-56]. Therefore, to know the consumer mindset, it
is necessary to apply smart decisions derived from big data [57].
Furthermore, the comprehensive development of e-commerce and the expansion of
establishing electronic markets for online shopping like Amazon, eBay, Walmart,
BestBuy, etc., have created a competitive environment between companies to attract the
highest number of customers. Enterprises seek to measure several factors like customer
satisfaction, loyalty, and the success of marketing strategies by analyzing customer
reviews through electronic platforms such as websites and social media [58-61].
However, enterprises are required to perform preliminary assessments because not
all data are valid to ensure data quality. Data validation is an important task that must be
accomplished before starting the analysis process, which helps improve the quality of

30 results. These tasks may include eliminating fake reviews and negative comments
released by competitors [62].
1.5. Analysis of Customer Feedback
Recently, online shopping has become a reasonable means of survival during the
coronavirus pandemic where people are obliged to practice social distancing. It turned
from being a luxury to becoming a mainstream means for people to purchase and
consume. The increasing development of Internet technology has also confirmed this
phenomenon. Most online retailers like Amazon, Walmart, and BestBuy have quickly
strengthened their platforms and enabled customers to express their opinions regarding
products and services.
Online customer reviews represent a significant resource for both consumers and
enterprises as well. It can impact potential consumers' purchase decisions and lead them
to different choices. On the other hand, it is fundamental for the success of companies to
listen to their customers. Online reviews could provide direct feedback or help for the
identification of the problems of service. The analysis of this feedback is helpful to
support product redesign and improve quality, also for online retailers to develop their
promotional campaigns and improve provided services.
1.5.1. Sentiment Analysis
An opinion is a view or judgment on a particular thing or issue that serves as a key
influencer on individuals' decision-making process. The increasing significance of
customer reviews, which involve valuable knowledge, has prompted large efforts to
analyze this huge volume of data to understand customers' behavior and extract useful
data. Initially, researchers have been sufficiency with employing Sentiment Analysis
(SA). This technique comprises the automated process of analyzing textual data and
classifying opinions, as well as the extraction of properties of reviews like Polarity,
subject, and opinion holder [10, 63, 64].

31
Sentiment Analysis, also known as opinion mining, could be defined as the process
where advanced techniques like Machine Learning (ML), Deep Learning (DL), and
Natural Language Processing (NLP) are used to analyze individuals' viewpoints and
opinions towards a certain entity [65]. Actually, SA works only to determine the polarity
of the whole text (sentence or documents) and annotate it with one class (negative,
positive, neutral, or conflict). Consequently, the standard SA could be applied into two
levels:
(1). Document-level, which concerns to extract opinionated words from the text and
detect their polarities to decides dominant text polarity.
(2). Sentence-level, which concerns detecting subjective sentences to extracting and
classifying their polarity.
1.5.2. Aspect-Based Sentiment Analysis
Though sentiment analysis did not precisely describe customers' opinions towards
specific aspects or characteristics of products or services, an extension of sentiment
analysis techniques called Aspect-Based Sentiment Analysis (ABSA) has been developed
to meet such needs and get valuable insights. Accordingly, we can say that an additional
level to SA has been added: (3) aspect-level, which concerns extracting aspect-opinion
pairs and detects the polarity towards distinct aspects separately.
Aspect-Based Sentiment Analysis is a fine-grained sentiment analysis task in which
sentiments regarding different aspects are detected. The term "Aspect" refers to the
product's attributes, characteristics, or features of service. The primary goal is to predict
the sentiment polarities of given aspects or target terms in the text.
The main purpose of employing an aspect-based sentiment analysis is to extract and
classify the aspect terms of a given entity and then extract opinions expressed against
these aspects to decides their sentiment polarity. In other words, ABSA examines each
review to recognize distinct aspects and identify the corresponding sentiment for each
one [66-68]. Unlike sentiment analysis, it enables the association of specific sentiments

32 with various aspects of a product or service [69]. Consequently, the procedure of applying
ABSA involves the following subtasks as depicted in Figure 1.3 [2, 70-72]:
(1). Aspect term extraction, which concerns extracting the aspect terms regarding a
pre-identified target entity (e.g., Laptops), provides a list comprising all the
distinct aspect terms.
(2). Aspect term polarity, which concerns identifying the sentiment towards each
aspect term from a given set and decides its polarity (positive, negative, neutral,
or conflict).
(3). Aspect category detection, which concerns the classification of aspect terms into
the proper category from a given set of predefined aspects categories (e.g.,
storage, price) that do not necessarily appears in the text as aspect terms.
(4). Aspect category polarity, which concerns the identification of sentiment towards
each aspect category from a given set of pre-identified aspect categories and the
decision of its polarity.
Figure 1.3. Aspect-based sentiment analysis subtasks
33
1.6. Summary
Digital data generated every second worldwide is produced in a structured, semi-
structured, and unstructured format. Unfortunately, traditional data analytics techniques
cannot handle these volumes of data considering their complex structures. Therefore, big
data analytics has emerged as a substantial research area and intensively researched to
handle these problems.
In this chapter, we present theoretical conceptualizations of big data and its
characteristics to reveal the challenges of tackling big data analytics in various fields of
applications. Uncovering these challenges helps to determine, at a high level, essential
functional and non-functional requirements that should be considered while designing
and developing big data analytics frameworks. Also, we demonstrated the concepts and
basics of big data analytics and the benefits of exploiting available assets of big data
regarding Business Intelligence.
The primary goal of big data applications is to help companies make more
informative-business decisions by analyzing large volumes of data, given the tremendous
competition in the world. In this section, we have reviewed the most significant fields
that employ big data applications to demonstrate how it positively changes our lives for
the better and smoother and improves our efficiency and productivity. Also, we state
opportunities for researchers to develop complicated platforms, frameworks, and
algorithms to struggle with big data challenges.
Additionally, we have addressed customer feedback analysis, representing our
research area, which is highly significant for both customers and enterprises. Sentiment
analysis and Aspect-based Sentiment analysis are also discussed because of their
relevance to our work, as we will discuss in detail in the following chapters.

34
2. CHAPTER 2.
DATA GATHERING AND PREPROCESSING
2.1. Introduction
The web is undoubtedly the most influential source of texts, and therefore, the
automatic extraction of useful and relevant information from the massive amount of data
represents a challenging task attracting researchers from many fields. Natural Language
Processing (NLP) is particularly one of the most involved research fields that participate
positively in text processing and analysis tasks. This branch of computer science
discipline is primarily concerned with constructing and developing techniques to provide
computers with the ability to mimic humans in the way of understanding spoken words
and text.
The significance of natural language processing and its contribution to the field of
artificial intelligence has driven the construction of several real-world applications based
on automatic natural language understanding techniques. Such applications include
virtual agents, chatbots, machine translation, spam detection, fake news detection, text
summarization, and social media sentiment analysis.
Generally, text processing in NLP comprises several tasks that aim to break down
natural language data "written or spoken" into forms that allow the computer to
understand and make sense of its meaning. These tasks may include: Named entity
recognition, word sense disambiguation, speech recognition, natural language
generation, part of speech tagging, and sentiment analysis. On the other hand, text
preprocessing tasks in NLP like stop words removal, lemmatization, and stemming are

35 helping in reducing the file size of the data set as well as improving the efficiency of any
Information Retrieval (IR) system.
Commonly, the standard text analysis framework comprises the following tasks:
Data Collection, Data Preprocessing, Pattern Discovery, and Pattern Analysis. Data
collection and preprocessing tasks are mostly time-consuming and computationally
intensive steps in the text analysis process. They involve selecting and gathering desired
data sets from various sources, pre-treatment of original data, data integration from
different sources, and conversion to a suitable form for further analysis operations.
Unfortunately, the collected data come in raw format (e.g., unstructured data) and
cannot be used directly for modeling purposes without preprocessing. For example, most
text available on the web (e.g., customers' feedback) is in HTML format, and such
embedding markups need to be dispensed. So, raw text necessarily needs a preliminary
preprocessing to transform data into a predictable and analyzable form before any
algorithm can be applied to it for modeling or any other type of data analysis, which may
be applied fruitfully.
Not all data are useful to any analysis purpose; therefore, data cleaning represents a
fundamental activity in text data preprocessing; it can be defined as the process of
removing unnecessary items and cleaning raw data from noise "which is varying and
depends on the purpose of text analysis" to improve the quality of data which in turn
affects the analysis results.
This work introduces a big data framework for natural language text preprocessing;
we have proposed a layered and recurrent data preparation model, which comprises a
three-level of data cleaning and filtering. We have examined the impact of employing
different arrangements of steps-sequence on the final results. Also, several techniques
were examined to select the most suitable for our analysis task.
This section is an introductory section about the subjects and motivations for this
work. Next, section 2 introduces a brief discussion about the key concepts of NLP,
including tokenization, stop words removal, lemmatization, segmentation, and part-of-

36 speech tagging. Section 3 presents the main parts of the developed big data framework,
starting from collecting the desired datasets, storage infrastructure, integrating data from
different resources, and finally, the processing technique. Next, Section 4 presents the
proposed model for data preprocessing. A brief demonstration of the main procedures of
the model was presented, including data input, data cleaning and filtering, and misspelling
correction. Conducted experiments that prove the efficiency of our model are discussed
in section 5, stating the details of our implementation, a description of the collected
datasets. Additionally, it involves an exploration of achieved results with discussion;
finally, section 6 presents a chapter summary, and some conclusions were reached.
2.2. Background
Text analysis requires several preprocessing tasks for text structuring and features
extraction, which include tokenization, stop words removal, lemmatization, Part of
Speech (POS) tagging, and word segmentation. Now we give a brief overview of these
techniques that represent key concepts in NLP.
2.2.1. Tokenization
Undoubtedly, the Web represents the most important source of texts. These raw
contents involve many details that useless and not interesting that may be optionally
throwing away, like line breaks, whitespace, blank lines, punctuation, and others.
Tokenization is one of the most significant key concepts in Natural Language Processing.
It could be defined as the process of chopping a sequence of characters up into pieces,
and each one is called a token. Tokens represent identifiable linguistic units that constitute
a piece of language data.
The primary purpose of tokenization is to convert text into features towards further
analysis tasks, and it is a significant task to find the correct tokens for use. There is no
standard method that appears to be valid and works well for all applications; it is a
domain-specific task. Generally, tokenization could be applied in two-level:
37
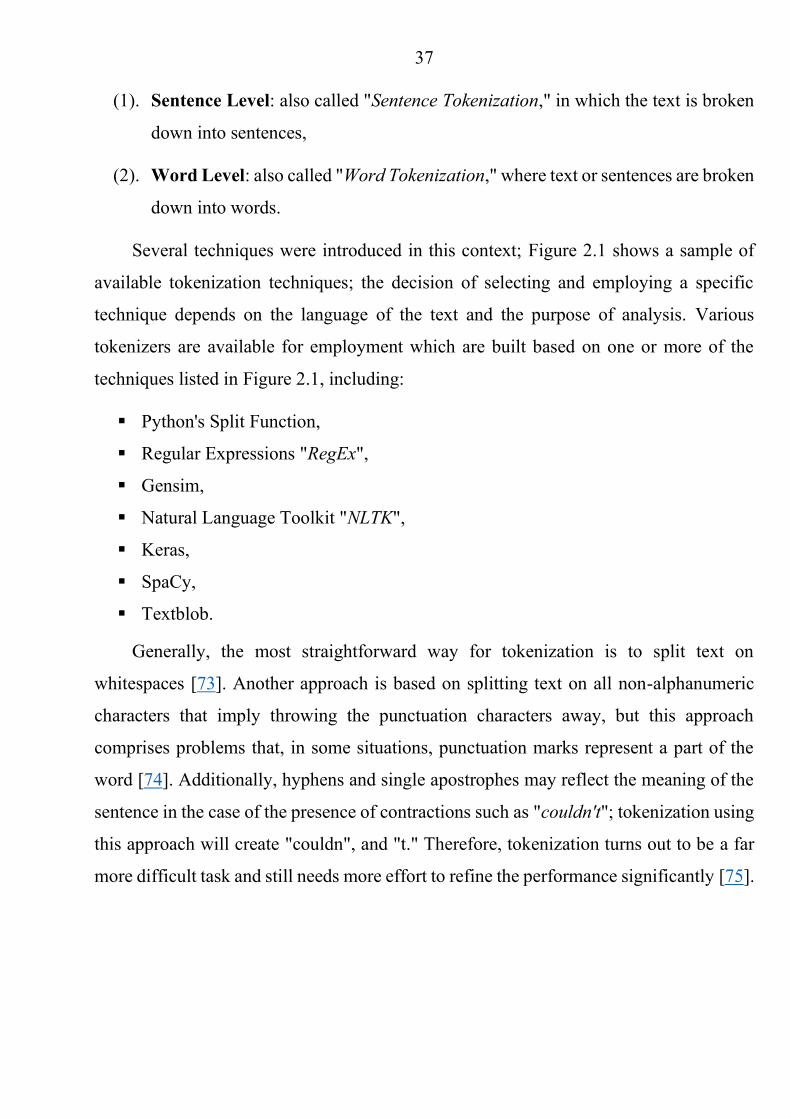
(1). Sentence Level: also called "Sentence Tokenization," in which the text is broken
down into sentences,
(2). Word Level: also called "Word Tokenization," where text or sentences are broken
down into words.
Several techniques were introduced in this context; Figure 2.1 shows a sample of
available tokenization techniques; the decision of selecting and employing a specific
technique depends on the language of the text and the purpose of analysis. Various
tokenizers are available for employment which are built based on one or more of the
techniques listed in Figure 2.1, including:
▪ Python's Split Function,
▪ Regular Expressions "RegEx",
▪ Gensim,
▪ Natural Language Toolkit "NLTK",
▪ Keras,
▪ SpaCy,
▪ Textblob.
Generally, the most straightforward way for tokenization is to split text on
whitespaces [73]. Another approach is based on splitting text on all non-alphanumeric
characters that imply throwing the punctuation characters away, but this approach
comprises problems that, in some situations, punctuation marks represent a part of the
word [74]. Additionally, hyphens and single apostrophes may reflect the meaning of the
sentence in the case of the presence of contractions such as "couldn't"; tokenization using
this approach will create "couldn", and "t." Therefore, tokenization turns out to be a far
more difficult task and still needs more effort to refine the performance significantly [75].

38
Figure 2.1. The hierarchy of the most popular tokenization techniques
2.2.2. Stop Word Removal
Extracting the most significant words or phrases from text represents the primary
goal of any text mining task (e.g., feature extraction, aspect-term extraction, etc.). The
assumption of considering the most frequent words that would appear in a document to
be of high significance is not necessarily true all over cases, but only in some cases like
language detection; and is false in other cases like document classification. Therefore,
most researchers tend to consider that such vocabularies, known as stop words, have little
lexical content and are of little value in helping to achieve the natural language processing
task. Also, the presence of stop words in a text may lead to failure in distinguishing it
from other texts. Therefore, there is a tendency to eliminate stop words out from the text.
The process of stop words removal involves employing a pre-identified list of words
and removing each occurrence of any list element "stop word" from the text. The list of
stop words may include tens of vocabularies like: 'of', 'at', 'a', 'an', 'by', 'for', 'such', 'and',
'but', 'if', 'or', 'as', 'the', 'with', and etc. The following procedure is one of the most simple
strategy of extraction of the candidate vocabularies to be included in the stop words list
[74, 76]:

39
2.2.3. Lemmatization
A collection of words along with associated information form the content of any
lexical resource "Lexicon," which represents the language's inventory of lexemes.
Information associated with words may include part of speech, sense definitions, etc. The
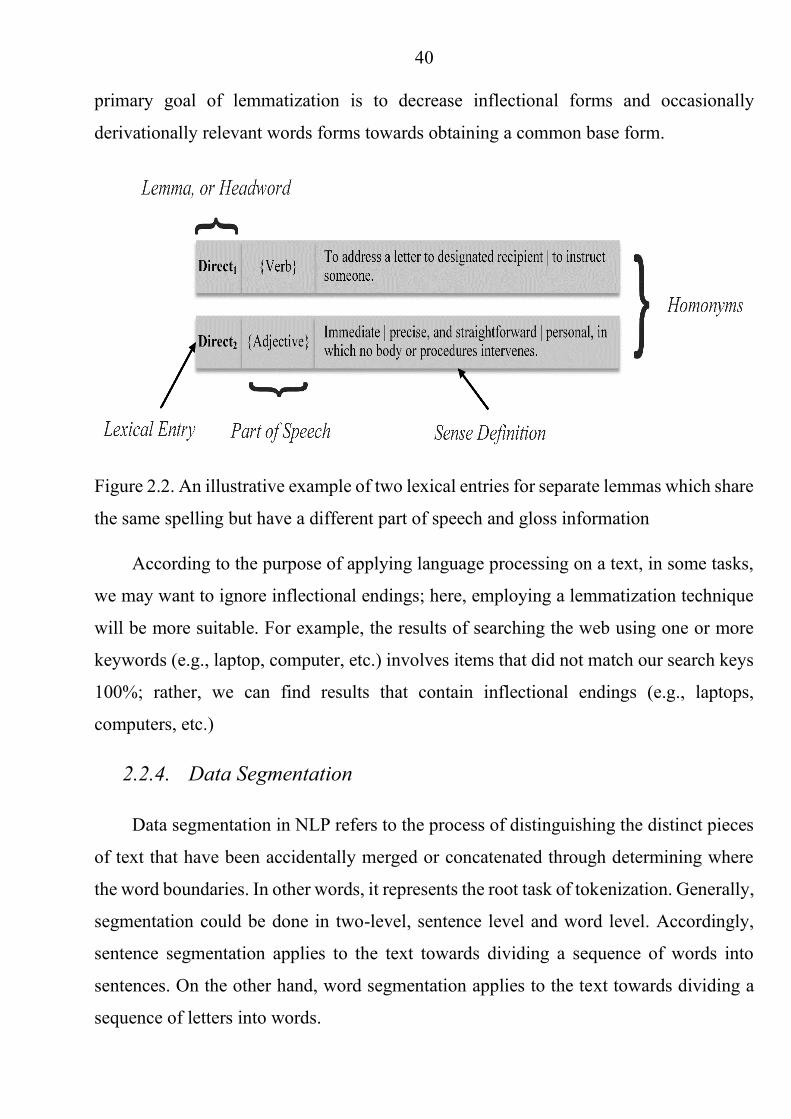
dictionary form of the word (also known as a Lemma) with associated information
represents one lexical entry. It is possible that two or more different headwords "lemmas"
have the same spelling regardless of pronunciation but differs in the part of speech and
glossary information "meaning," these lemmas are called homonyms (e.g., Band, bat,
match, mean, right, ring, etc.), see Figure 2.2 that shows an illustrative example of
homonyms.
Generally, text normalization techniques like stemming and lemmatization strive to
recognize the canonical representative for a group of relevant word forms. Accordingly,
we can define Lemmatization as the process of converting words in the text to the base
or dictionary form "Lemmas." The applied technique turns words into meaning forms by
employing a vocabulary and morphological analysis of words without eliminating any
character, except removing inflectional endings only. In other words, we can say that the
40 primary goal of lemmatization is to decrease inflectional forms and occasionally
derivationally relevant words forms towards obtaining a common base form.
Figure 2.2. An illustrative example of two lexical entries for separate lemmas which share
the same spelling but have a different part of speech and gloss information
According to the purpose of applying language processing on a text, in some tasks,
we may want to ignore inflectional endings; here, employing a lemmatization technique
will be more suitable. For example, the results of searching the web using one or more
keywords (e.g., laptop, computer, etc.) involves items that did not match our search keys
100%; rather, we can find results that contain inflectional endings (e.g., laptops,
computers, etc.)
2.2.4. Data Segmentation
Data segmentation in NLP refers to the process of distinguishing the distinct pieces
of text that have been accidentally merged or concatenated through determining where
the word boundaries. In other words, it represents the root task of tokenization. Generally,
segmentation could be done in two-level, sentence level and word level. Accordingly,
sentence segmentation applies to the text towards dividing a sequence of words into
sentences. On the other hand, word segmentation applies to the text towards dividing a
sequence of letters into words.

41
Concerning our work objectives, the main purpose of employing the segmentation
technique is to handle typos, misspelling, and other accidental typing mistakes like
missing white spaces, etc. Therefore, in our implementation, we have employed word-
level segmentation. Many approaches were recently introduced for handling this task that
varies from using linguistic-based techniques or applying machine and/or deep learning
techniques. Generally, we can categories the word segmentation techniques into three
categories [77]:
(1). Rule-based approaches,
(2). Machine learning approaches,
(3). Dictionary-based approaches.
In this work, we have been employed word segmentation using a dictionary-based
algorithm built on the released version of Google's web trillion-word corpus developed
by Peter Norvig [78]. Simply the process starts by scanning characters from the left,
adding one at a time to the search pattern, and looking up in the dictionary for matching
words. Maximal matching algorithms were utilized to avoid the nearest matching case
and continue searching for the longest possible pattern. Several lookup dictionaries were
built from the text available on the web that contains the usually trillions of words.
Usually, such type of dictionaries contains the words and their frequencies. Also, the
number of words that appear together was considered using the n-gram technique; i.e.,
unigram represents one word where n = 1, bigram consist of two words, n = 2, etc.
2.2.5. Part of Speech Tagging
The part of speech (POS) describes the way in which each word is used within a
sentence, also known as lexical categories or word classes. Commonly, there are eight
main word classes: Noun, Verb, Interjection, Adjective, Adverb, Preposition,
Conjunction, and Pronoun. Determine which class each word belongs to (e.g., noun,
adjective) is helpful to the aspect-based sentiment analysis tasks where most aspect terms
42 are usually expressed using nouns, adjectives, verbs, or any combinations of these classes,
and sentiment words are adjectives.
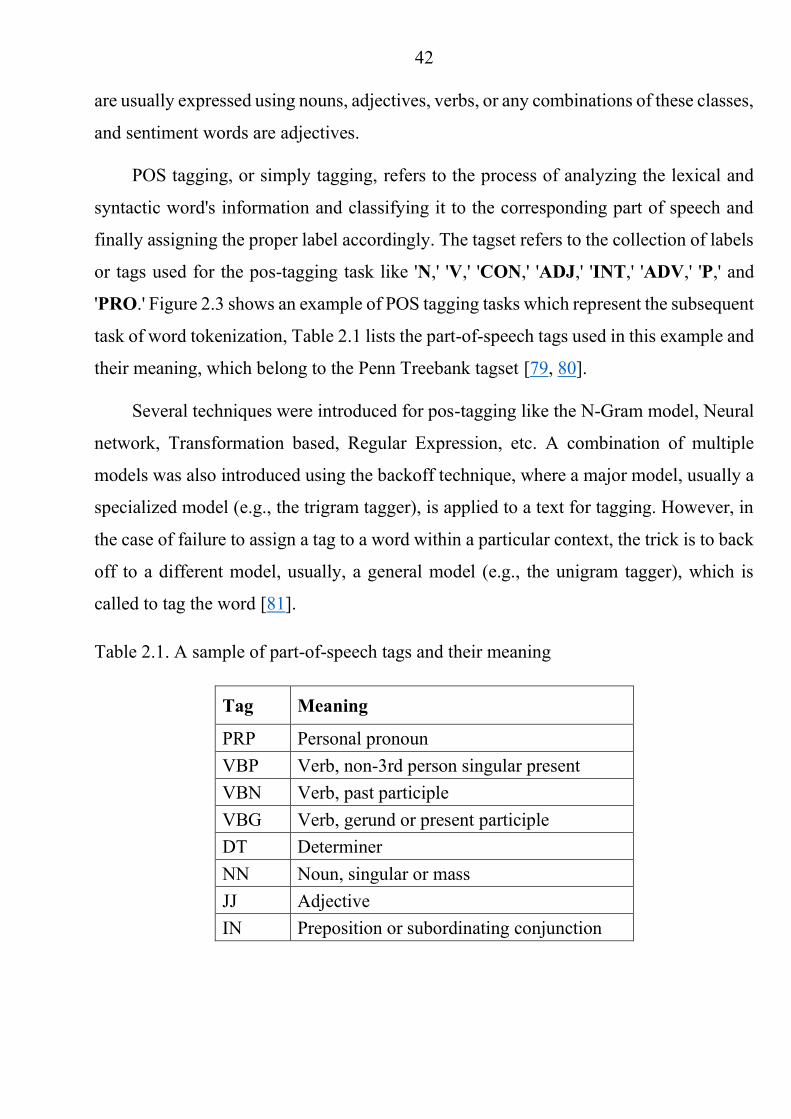
POS tagging, or simply tagging, refers to the process of analyzing the lexical and
syntactic word's information and classifying it to the corresponding part of speech and
finally assigning the proper label accordingly. The tagset refers to the collection of labels
or tags used for the pos-tagging task like 'N,' 'V,' 'CON,' 'ADJ,' 'INT,' 'ADV,' 'P,' and
'PRO.' Figure 2.3 shows an example of POS tagging tasks which represent the subsequent
task of word tokenization, Table 2.1 lists the part-of-speech tags used in this example and
their meaning, which belong to the Penn Treebank tagset [79, 80].
Several techniques were introduced for pos-tagging like the N-Gram model, Neural
network, Transformation based, Regular Expression, etc. A combination of multiple
models was also introduced using the backoff technique, where a major model, usually a
specialized model (e.g., the trigram tagger), is applied to a text for tagging. However, in
the case of failure to assign a tag to a word within a particular context, the trick is to back
off to a different model, usually, a general model (e.g., the unigram tagger), which is
called to tag the word [81].
Table 2.1. A sample of part-of-speech tags and their meaning
Tag Meaning
PRP Personal pronoun VBP Verb, non-3rd person singular present VBN Verb, past participle VBG Verb, gerund or present participle DT Determiner NN Noun, singular or mass JJ Adjective IN Preposition or subordinating conjunction

43
Figure 2.3. Part-of-Speech tagging example
2.3. Big Data Framework
The main goal of performing sentiment analysis of social media is to support
enterprises and potential customers and provide them with an accurate, summarized, and
up-to-date market view towards a specific set of products or product aspects. Developing
a big data framework to accomplish this task is mandatory to handle such incremental
data volumes regarding the huge volume of online review data.
The proposed framework aims to collect and prepare customer feedback from
multiple sources simultaneously. It starts with gathering reviews data from a pre-defined
list of websites, including electronic markets and products' web pages on the
manufacturer's website. Collecting data from different sources poses challenges due to
the diversity of technologies involved in creating web pages and presenting data.
On the other hand, collected data come in different formats, therefore processing
large amounts of data denotes a challenging task due to the heterogeneity of data types
and structures that impose additional difficulties in data integration and storage.
Generally, the proposed framework of data preparation incorporates several phases: Data
gathering, data storage, data integration, and data processing, illustrated as follows.

44
2.3.1. Data Gathering
Data collection is the first step in any data-driven analytical solution; it starts with
identifying the desired data and selecting suitable sources. Regarding this work's
objectives to implement a sentiment analysis on customer feedback, we define a list of
websites containing customer feedback about the specified products. Our target is
electronic products and, more specifically, personal computers and laptops, hence a list
of websites was selected, which is appropriate for this purpose. The mentioned list
contains e-markets like Amazon and BestBuy, and also it contains the manufacturer
websites like Lenovo and Dell.
Unfortunately, most websites employ different structures and techniques for
maintaining and presenting their data, and we seek to crawl a great number of review
data, which exceeds the maximum number of reviews that could fit and present in a single
web page. Generally, the website's content could be presented using two methods:
• Static URLs: As every web page has one URL that does not change, the main
content of the page is still unchanged, but other contents may be loaded
dynamically in a specific frame from a database using Java Scripts based on
actions like selections, button clicks, etc. Typically, this type does not contain any
URL parameters.
• Dynamic URLs: The content of a specific website is stored in a database and
loaded dynamically for showing on the page on demand. Website, in this case,
serves as a template for contents. Dynamic URL usually contains parameters that
change dynamically like id, page number, query, etc. The same contents may be
loaded under different URLs based on specific parameters like sorting, filtering,
etc., representing the main disadvantages of this type.
Also, websites collect different types of data besides the review text (e.g., rating for
specific features, the product's primary use, featured list, etc.). These differences preclude
the development of a single program for gathering such data. Therefore, we have

45 developed programs for crawling and scraping the websites using two tools built on the
Python programming language. The first group of programs is built on Scrapy to get data
from websites that present data using dynamic URLs. The second group is built on
Selenium to scrape content from websites that use static URLs. Selenium is slow
compared to Scrapy, but it solves the problems like dynamically loaded content in static
URLs and clicking buttons; the following is a brief description of these tools.
• Scrapy: Scrapy is a high-level web crawling scraping framework written in
Python. It is a free, open-source framework and could be used as a general-
purpose web crawler. The main advantage of Scrapy is the speed and powerful
capabilities to extract data using APIs.
• Selenium: Originally was developed as a portable framework for testing web
applications. It is open-source software that provides domain-specific tests and
enables embedding in programs written in several popular programming
languages like C# and Python. However, it could be used for web crawling—the
main advantage is its capabilities in crawling and scraping dynamic web pages.
2.3.2. Data Storage
After collecting the desired dataset, the storage needs appear on the fly because data
requires a place to stay. Collected data needs to be stored towards being available for
applying different processing tasks. The storage and management of the massive data
generated through various devices are vital challenges. Developing any analytical
solution will never get there without having an efficient, long-term data storage solution
to provide a stable foundation.
Concerning a data management perspective, the limitations of existing techniques
regarding the high rate of data generation are another challenge. Various techniques are
proposed to solve this problem involving data clustering, replication, and indexing [82,
83]. However, these activities impose a development challenge to improve effectiveness
and performance [84-86].

46
Big Data provides a wide variety of solutions to maintain these types of data. Among
these solutions appears Apache Hadoop, one of the most efficient, long-term data storage
solutions that provide a stable foundation.
• Apache Hadoop: Hadoop is a batch-oriented data processing system. Originally,
this technology was developed by Google for indexing the web and analyzing user
behavior to improve performance algorithms. Hadoop is designed to run on
distributed machines by storing and tracking data across them using the Hadoop
Distributed File System (HDFS). It works on splitting data into pieces,
distributing it across multiple machines, and keeping track of where the data
resides. The Hadoop platform has two main components, which are responsible
for: Storage "HDFS" and Computations which will be discussed in the data
processing section. Concerning the data storage part, it has two primary
components: (1) NameNode, which is responsible for maintaining all metadata
about the filesystem (e.g., directory structure), (2) DataNode, that contains the
actual blocks of data, it also responsible for connection with other DataNodes as
well as NameNodes to respond to queries and during data replication.
2.3.3. Data Integration
The problem of data integration appears when organizations realize there is a need
to analyze data that comes from diverse sources in various formats. Big data's "variety"
characteristic makes data integration a great challenge since differences between several
data structures become more important than before, and matching them is problematic.
Additionally, the exponential growth of volumes and velocities drives both systems and
processes to their limits [87].
Data warehouses frequently use data integration techniques and combine multiple
data sources to consolidate operational system data and enhance reporting or analytical
needs. An example of integrating data of various types may be that e-commerce
companies need to analyze data from website logs, call-centers, e-mails, scans of

47 competitor's websites, and social media. All listed information can be integrated and made
available to support decision-makers [88].
Combining data from diverse external sources is an additional complication imposed
by big data on the data integration process due to the limited control of organizations over
data standards at the source. The integration process of big data involves additional
challenges. Such challenges need to be considered as a confusing diversity of big data
management technologies that mean risk in selecting, synchronizing data across various
sources, the lack of expertise, moving data into a big data platform, extracting useful
information from big data, etc. [89]. The proposed framework integrates textual and rating
data in addition to emotions and other types of data. The system also periodically collects
new and recent feedback and consistently integrates new data sets to update the results.
2.3.4. Data Processing
Data processing is the method to be applied after the data storage to extract useful
information. The primary goals of data processing are to get a significant relationship
between the various fields of data collections and the extraction of valuable analysis. The
complexity and scalability of big data make data processing tasks more complicated and
impose another challenge [90].
The traditional paradigm regarding performing operations on the consolidated
datasets becomes inappropriate. Also, the combination of all related data in a whole
database may cost much time and require extra investments in infrastructure. The
shortages of traditional techniques appear in how much time it takes to analyze through a
single set of datasets, while the speed of processing a query in big data is significant
demand [91].
Regarding big data, in the case of manipulating massive volumes of data collected
from various sources with different formats, the data processing task becomes tricky.
Therefore, a paradigm shift includes applying parallelization to process against multiple
chunks of data, and divide-and-conquer simultaneously are natural computational

48 techniques for handling big data problems. This approach moves the processing to where
the data is stored by distributing the query and update requests across distributed servers
rather than attempting to process against one combination of a dataset.
Several techniques were introduced in big data processing for storing unstructured
data in distributed databases, like HBase, Apache Cassandra, or SimpleDB, and for
classifying data, techniques like MapReduce in Hadoop were introduced [92]. Also,
optimization techniques are introduced to enhance query processing like HiveQL,
SCOPE, etc. [93].
• MapReduce: Distributed data across multiple machines need an algorithmic
framework for processing these data in parallel. Originally, MapReduce was
introduced by Google back in 2004. The mechanism of data processing could be
performed through three stages: Map, Shuffle and Reduce. Also, MapReduce
provides many advantages like efficient balancing of workload and fail-safe
performance. Returning to the Hadoop system for computations, we used Hadoop
to execute MapReduce through the resource management component (YARN) to
implement distributed queries on the data. It maps the queries to the machines,
then reduces the results back into a single result set. The Resource Manager in
Hadoop is responsible for accepting applications and scheduling their execution,
respecting the resources' availability required to execute the application.
2.4. The Proposed Model for Data Preprocessing
Data preprocessing is the method to be applied for preparing stored data for further
processing tasks. This task's primary goal is to transform the raw data into a suitable
format for analysis purposes to extract useful information. Preparing data involves many
subtasks that include data cleaning and filtering, normalization, tokenization,
lemmatization, spelling correction, word segmentation, and part of speech tagging.
Several techniques in natural language processing for data preparation exist.
However, selecting a specific combination of techniques to be applied depends mainly on

49 the primary purpose of performing data analysis. Also, deciding the order and how to use
each technique is crucial. Resulted data from the preprocessing process is the input to the
analysis model; that greatly affects the accuracy of the final results.
In this section, we introduce the use of the Recurrent and Stepped Processing Based
on Natural Language Processing Techniques to improve the quality of the text.
Cleaning natural language text is not straightforward; removing items accidentally may
negatively affects the analysis results. The proposed model incorporates three phases of
data cleaning and filtering to retain data consistency during various preparation processes,
which are applied in a non-sequential manner. Also, several processes have been repeated
at different steps. As follows, we will discuss the workflow of our model and how it
operates. Afterward, we will discuss the primary sub procedures with different variants
of specific tasks for performance tuning.
Generally, the proposed model incorporates several tasks starting from parsing the
collecting data, followed by a series of processes ending with generating a list of tagged
sentences with part of speech, as shown in Figure 2.4. Collected datasets contain review
data regarding specific products; every review consists of the review text associated with
additional information like the date and time of submitting the review, ratings, and
information of the person who wrote this comment, etc.
Consequently, the first step is the extraction of the review text from each review
respectively. The context within a single review and even sentence is important to
correctly identify lexical categories of words which is significant to our analysis task
(Aspect-Based Sentiment Analysis). Therefore, distinguishing review text from another
is mandatory, so we must insert a full stop, if not exist, to end the current sentence and
also insert a white space before appending the next review text. This step helps in
increasing the number of sentences after performing the Sentence Tokenization by almost
29.0%.

50
Figure 2.4. Text processing work flow

51
Raw review text needs to be cleaned; therefore, after finishing the extraction of all
reviews' text, the next step is applying the first phase of data cleaning, which involves the
removal of useless symbols, special characters, and extra white spaces. Also, data
transformation is included in this phase, which refers to converting all text to lower case
characters—following, performing the sentence tokenization to divide every review into
a list of sentences.
Subsequently, applying the second phase of data cleaning and word tokenization for
each sentence, respectively. Cleaning data comprises extracting the list of words from the
sentence and then examining each character in the word to eliminate characters not
belonging to alphabet or number sets and rebuild the sentence again. On the other hand,
word tokenization refers to the NLP technique that involves dividing a sentence into
words "Tokens."
The next step is to check data for misspellings or unusual words. In this step, we use
the fuzzy matching technique to find matchings; also, we handle missing white spaces
using the word segmentation technique to disjoint concatenated words; and then updating
data by replacing misspelled with correct words.
The following procedure will be applied to every single sentence until the end of the
text is reached. Tagging words with the part of speech is the first step. Next, the
application of the third phase of data cleaning, which involves the removal of stop words,
abbreviations (e.g., auxiliary verbs added to the end of the pronoun in a short form like
"I've"), and single characters. Lemmatization is the next step, which is applied to every
word in the sentence to provide the dictionary form of the word, known as "Lemma."
Next, the sentence is updated by replacing each word with the corresponding Lemma.
Finally, the proposed model returns the final list of filtered sentences tagged with
part of speech; such a list is now ready for applying the desired data analysis model.
Algorithm 2.1 presents the proposed model's mechanism with more details and clarifies
how the different sub-procedures can interact and cooperate to output the final results.

52

53
2.4.1. Input Data and Extract Review Text
The first step in our work is to input collected datasets into the model. Collected data
are stored in the JSON (JavaScript Object Notation) format; each record stores data about
one review only. Commonly, online markets websites store various information besides
the review text itself like review title, customer's username, customer's rating of specific
aspects of the product, a list of preferred aspects by the customer, readers' voting on the
review, date and time of submitting the review, etc. Therefore, our model starts with
parsing the input dataset and extracting reviews' text and appending a full-stop and white
space, respectively, at the end of each review for separating reviews and maintaining the
context of single reviews, which enhances sentence tokenization results.
2.4.2. Data Cleaning and Filtering
Data cleaning represents a fine-tuned task this is due to its significant impact on the
final results. Consequently, the decision to keep or remove data elements must be taken
carefully; the order of execution is important as well. Hence, the proposed model
incorporates three phases of data cleaning; we have layered and distributed the cleaning
and filtering tasks in the form that positively affects other tasks and helps improve their
performance like tokenization and pos tagging. This model is suitable for preparing data
to apply sentiment analysis, topic modeling, and similar tasks, as follows a brief
discussion about each data cleaning phase.
Phase (A)
Extracted reviews' text needs a preliminary cleaning to be ready for applying
sentence tokenization. The first phase of data cleaning involves many subtasks that
include removing extra spaces and newline characters, repairing the problems resulting
from the differences in the character encoding systems, and removing useless symbols
and characters like the exclamation and parenthesis. Inserting spaces around specific
symbols are required to avoid considering it part of words by the word tokenization
algorithm. Also, it involves text normalization by ensuring that all alphabetical characters
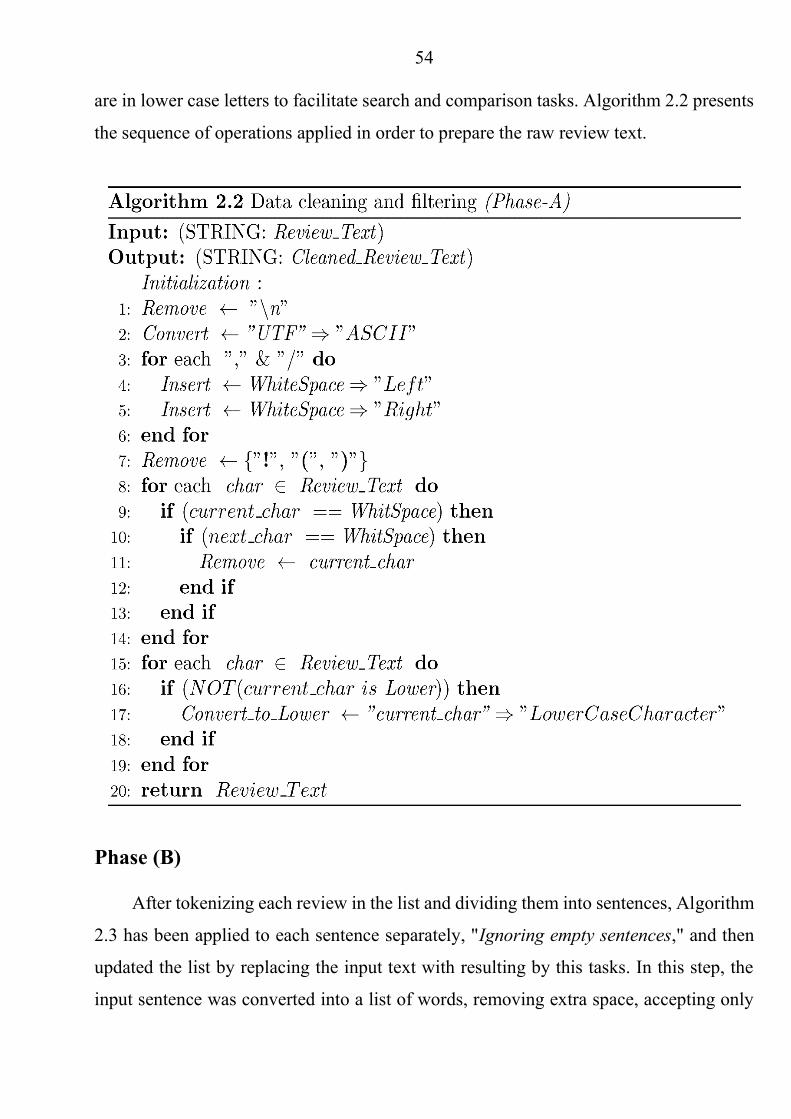
54 are in lower case letters to facilitate search and comparison tasks. Algorithm 2.2 presents
the sequence of operations applied in order to prepare the raw review text.
Phase (B)
After tokenizing each review in the list and dividing them into sentences, Algorithm
2.3 has been applied to each sentence separately, "Ignoring empty sentences," and then
updated the list by replacing the input text with resulting by this tasks. In this step, the
input sentence was converted into a list of words, removing extra space, accepting only

55 alphabetical characters and numbers and ignoring other symbols, then rebuilding the
sentence again.
Phase (C)
Subsequent to part of speech tagging applied to the sentence, the third data cleaning
phase has been applied. It receives a tagged sentence and starts looping through the (word,
pos-tag) pairs and checks if the word belongs to the stop words list, then removing the
current pair, otherwise skipping to the next item. The list of stop words has been chosen
carefully to avoid removing words that could influence the meaning or the context of the
text; for example negation word "Not" have been kept, which used to reflect the meaning

56 such as in sentiment words (e.g., not stable, not fast, not good, not cheap). Also, words
that belong to a pre-defined list of abbreviations are eliminated from the list of tagged
words; the list of abbreviations include short forms of auxiliary verbs like (have: 've'),
(would | had | should: 'd'), and (will: 'll'). Also, single letters are removed. Algorithm 2.4
presents the final phase of data cleaning and filtering incorporated in our model for data
preparation.
2.4.3. Misspelling Correction
Somehow mistakes always hinder humans' works; they are not eligible for doing
everything completely correctly. Spelling irregularities are samples of these mistakes,
also known as misspelling, typo, and spelling mistakes. Several ways of misspelling
include missing white space, changing the order of two or more characters in the word,
missing one or more characters, replacing one or more characters with wrong characters,
etc. Humans can understand most misspelled terms based on their position in the sentence,

57 recognized pronunciation, and context. On the other hand, computers cannot do this task
by themselves; rather, they employ Artificial Intelligence techniques. This work proposes
a model for handling misspellings in reviews' text based on natural languages processing
techniques like segmentation and fuzzy matching, as depicted in Figure 2.5.
Figure 2.5. Misspelling detection and correction workflow

58
The proposed model for misspelling detection and correction starts with receiving
the tokenized text, consisting of a list of sentences; each sentence consists of a list of
tokens. Next, it creates a list of words from the input data to extract the vocabulary set by
ignoring word repetition. The following step comprises checking if the text involved
unusual or misspelled words and extracting them if there exist. This step usually requires
the help of a corpus of words by subtraction of it from the extracted vocabulary set; the
result is the set of words that did not exist in the word corpus "Unusual Words."
𝑀 = 𝑉𝑆 − 𝐸𝑉, (2.1)
where M refers to misspellings, VS refers to the vocabulary set, and EV refers to the corpus
of English vocabulary.
Next is creating a set of contextual vocabularies where misspellings are derived from
as the following:
𝐶𝑉 = 𝑉𝑆 −𝑀 + 𝑅𝑉, (2.2)
where CV refers to the contextual vocabulary set, and RV refers to the recent vocabulary
set.

59
Spelling correction is the next step; we have applied a fuzzy-matching technique to
search for matchings to misspelled words; the fuzzy-matching technique will be discussed
in detail in chapter 4; the following procedure illustrates how it is used in the spelling
correction task.

60
Next to the spelling correction task is to check if there are remaining items in the
misspelling list. Consequently, word segmentation is applied to each remaining item and
sends results as input to the spelling correction process again until reaching every possible
correction. Finally, updating the input data of this model by replacing misspelled words
with corresponding corrections. Algorithm 2.5 presents the sequence of operations
applied in order to check and correct misspelled words.
2.5. Experiments and Results
In order to examine the efficiency of our work, we have tested and evaluated our
model on a real dataset collected from online markets' websites that allow customers to
register and write feedback about products or services. The customer reviews' data and
users' information are available and publicly accessed. The following is a brief description
of the developed framework, its components, and used implementation tools—next, a
discussion of the dataset used in the experiment and exploration of the achieved results.
2.5.1. Implementation Details
In this part, the proposed model's implementation details are presented because it is
necessary to verify our work's viability for implementation and assure its quality and
efficiency. To this end, the proposed method has been implemented on a laptop with
Intel(R) Core(TM) i7-8750H CPU @2.2 GHz and 8 GB of RAM on Windows 10 x64.
We have developed a spider program for crawling and scraping the required data
using Scrapy (version 2.2.0) and Selenium (version 3.141.0). Scrapy was used for
collecting data from websites that use dynamic URLs to present reviews for readers. On
the other hand, Selenium was used to collect data from websites that use static URLs,
employing the dynamically loaded contents' strategy and clicking buttons to explore the
content data. The working framework for the data storage and processing is Hadoop-
MapReduce; we have used Apache Hadoop (version 2.9.1) to store data using HDFS and
execute MapReduce through the resource management component (YARN).

61
Concerning the application development, we have chosen the python programming
language (version 3.7.3) due to its capabilities and richness of libraries. Writing,
compiling, and building the code were done through Geany IDE (version 1.35) to conduct
the experiments. The python development environment offers many helpful packages that
are significant for any data science application. We have performed preprocessing tasks
to prepare data and remove noisy, inconsistent, and incomplete information, including
tokenization, normalization, and removing stop words using python tools for text
processing like regular expressions. Also, the implementation of Part-Of-Speech tagging
"POS" and other text analysis tasks were done using Natural Language Toolkit "NLTK"
(version 3.5), incorporated in the Python packages. Also, we have used wordsegment
(version 1.3.1) for data segmentation, fuzzywuzzy(version 0.18.0) for misspelling
correction. Libraries of Matplotlib (version 3.3.2) and NumPy (version 1.19.3) have been
used for data analysis and visualization purposes.
2.5.2. Datasets Description
Collected datasets were scraped from online markets that contain products reviews
in addition to other data items. The main characteristics of the collected datasets are
presented in Table 2.2. Figure 2.6 shows a sample of data from the BestBuy website for
a laptop product in October 2019. Scraped data were parsed from HTML and stored in
JSON file format. Every single review in the JSON file is encapsulated with braces, and
each data item consists of two parts separated by a colon; the left part includes the name,
and the right part store the value of this item. A comma separates data items.
Table 2.2. The main characteristics of the collected datasets
Dataset Website Product Count
Timespan Review Count Start Date End Date
DS1 Bestbuy 33 Jan.-2019 Mar.-2021 47905 DS2 Amazon 45 Mar.-2018 Mar.-2021 28125 DS3 Dell 19 May-2019 Mar.-2021 44175 DS4 Lenovo 21 Apr.-2018 Mar.-2021 85711

62
Figure 2.6. Sample of the original review data
From Figure 2.6, the sample review includes the review's ID and reviewer's profile
name, the reviewer rating score for the considered product with a range from 1 to 5 stars,

63 the review title, the review text, and customer's ratings for designated characteristics
"Ease of use, Quality, and Value." Also, the review data contains the number of readers
who voted positively and who voted negatively for the current review; and a list of
mentions that represent features the customer prefers in this product.
Also, the manufacturer comment "if available" is included in the review data, and it
includes the name of the organization and the date and time of submitting the comment
by both the reviewer and customer service. Also, distinguishing verified from non-
verified purchases is important for deciding whether the customer experience comes from
personal practice or not.
2.5.3. Experiments and Discussion
The experiment starts with extracting review text and applying the first phase of data
cleaning and filtering. Next, divide each review into sentences. Table 2.3 shows how
separating reviews during the data parsing process has significantly improved sentence
tokenization performance and increased the number of sentences by an average of 29%.
Table 2.3. The effect of separating reviews on the sentence tokenization process
Dataset Review Count
Sentence Count Sentence Per Review Performance
Ratio Before After Before After DS1 47905 70114 88532 1.46 1.85 +26.27% DS2 28125 36696 48360 1.30 1.72 +31.79% DS3 44175 60928 81812 1.38 1.85 +34.28% DS4 85711 123772 156392 1.44 1.82 +26.35% Avg. - - - 1.40 1.81 +29.67%
Table 2.4 summarizes the main linguistic characteristics of our datasets; we can
observe that stop words represents almost half of the total number of words with an
average of 47.74%. Also, the vocabulary set represents almost 12% which is reasonable
due to that all review text are related to the same domain; it refers to the number of unique

64 vocabularies with ignoring the word repetition; we have used the following equation to
compute the proportion of vocabulary set (VS).
𝑉𝑆 =
𝐶𝑜𝑢𝑛𝑡(𝑉𝑜𝑐𝑎𝑏𝑢𝑙𝑎𝑟𝑦 𝑆𝑒𝑡)
𝑊𝑜𝑟𝑑 𝐶𝑜𝑢𝑛𝑡 − 𝐶𝑜𝑢𝑛𝑡(𝑆𝑡𝑜𝑝 𝑊𝑜𝑟𝑑𝑠) (2.3)
Table 2.4. The main linguistic characteristics of datasets
Dataset Sentence Count
Word Count
Sentence Length
Stop Words Vocabulary Set
Count Percent Count Percent
DS1 88532 1405316 15.87 676336 48.13% 93042 12.76% DS2 48360 832050 17.21 398019 47.84% 48917 11.27% DS3 81812 1266654 15.48 625165 49.36% 75369 11.75% DS4 156392 2657667 16.99 1212978 45.64% 173326 12.00% Avg. - - 16.39 - 47.74% - 11.95%
The proposed model incorporates three levels of data cleaning and filtering as
described previously. Figure 2.7 shows how the size of datasets has been affected after
applying each level separately; also, it shows the effect of reviews separation and after
performing the word lemmatization. We can observe that data size has increased after
parsing review text due to the insertion of spaces and periods to separate reviews. Also,
phase (c) of data cleaning has the most significant effect on data size because this stage
includes removing stop words, which in turn represents a big proportion of the data
volume.
Handling misspellings and unusual words represent an important part of our model,
which incorporates several subtasks, including misspelling check, searching for
matchings, word segmentation. It starts with extracting the unusual word set from the
vocabulary set, next, searching for matchings using the fuzzy matching algorithm, which
compute the edit distance "Levenshtein Distance" for the candidate matching list and
select the best matching; Table 2.5 illustrates how it computes the required number of
edits to candidate words to match the search key.

65
Figure 2.7. The proportion of data size after applying the consecutive data preparation
steps
Table 2.5. A sample of misspelled words and the corresponding correct form with an
illustration of the type and number of required edits
Misspelled Correct Edits Edit Type
aptions options 1 Sub (a, o) labtops laptops 1 Sub (b, p) teturn return 1 Sub (t, r) grest great 1 Ins (a) wrk work 1 Ins (o)
proudct product 2 Ins (d) + Del (d) pirchase purchase 1 Sub (i, u)
accessorires accessories 1 Del (r) spead speed 1 Sub (a, e)
anwesome awesome 1 Del (n) funciones functions 2 Ins (t) + Del (e)
On the other hand, the remaining uncorrected words need further preprocessing;
therefore, a word segmentation has been applied to handle missing white spaces. Table
Parsing Phase (A) Phase (B) Phase (c) LemmatizationDS1 101.20% 101.04% 96.08% 56.29% 54.05%DS2 101.03% 96.75% 87.37% 49.98% 47.01%DS3 101.17% 99.77% 95.97% 50.03% 49.20%DS4 101.16% 99.76% 97.51% 55.43% 53.56%
0%
20%
40%
60%
80%
100%
120%

66 2.6 shows a sample of misspelled words and the resulting parts after segmentation. We
can notice that results from word segmentation contain misspelled parts; therefore, these
parts will be input to the fuzzy matching algorithm again to search for matching and so
on until reaching all possible corrections.
Table 2.6. A sample of misspelled words and the resulting parts after segmentation
Word Segments
easyto [easy, to] deliverygreat [delivery, great]
adapterlightning [adapter, lightning] displayport [display, port] adapterusp [adapter, usp] nededdoes [neded, does] muchmor [much, mor] itneww [it, neww]
cableethernt [cable, ethernt]
Table 2.7 presents the performance analysis of the proposed model for misspellings
correction; it shows that our model is performing well and able to reach a high percentage
of corrections considering the initial number of misspellings; the results show that it has
been achieved an average accuracy of 90.1%.
Table 2.7. The percentage of the misspelled vocabularies to the total number of
vocabularies in each dataset and correction ratio
Dataset Vocabulary Set
Misspellings Corrections
Count Percent Count Percent DS1 93042 8104 8.7% 7564 93.3% DS2 48917 5627 11.5% 4856 86.3% DS3 75369 7855 10.4% 6900 87.8% DS4 173326 19329 11.2% 17973 93.0% Avg. - - 10.4% - 90.1%

67
This model has been built using the Trial and Error methodology, where many trials
have been conducted towards reaching the current final version of the proposed model.
We have examined the impact of applying different techniques and chose the best fit; for
example, we have examined the use of Lemmatization or Stemming or both and found
that using lemmatization is more suitable to our analysis task. Also, we have examined
the effect of changing the order of several steps on the final results. Here, we will discuss
only a sample of these trials to demonstrate the efficiency of our model. As follows, we
will explore three arrangements of steps to examine the impact of execution order on the
pos tagging results.
• ORD1: Lemmatization – POS Tagging – Data Cleaning Phase (C)
• ORD2: Data Cleaning Phase (C) – POS Tagging – Lemmatization
• ORD3: POS Tagging – Data Cleaning Phase (C) – Lemmatization
Subsequently, a random sample of results has been selected and examined the pos
tags manually; the testing was performed only for Noun and Adjective tags only since
they represent 29%, and 17%, respectively, of the total number of tags. Three
performance metrics have been computed in this context: Precision, Recall, and F-
Measure, respectively. To this end, the following cases were evaluated and counted: true
positive (TP), false positive (FP), true negative (TN), and false negative (FN) as depicted
in Table 2.8, and then used to compute the mentioned metrics as follows.
Table 2.8. An illustrative example of how each case of pos tagging is evaluated from the
perspective of nouns and adjectives
Actual Correct Nouns Evaluation Adjectives Evaluation
NN NN TP TN ADJ ADJ TN TP ADJ NN FN FP NN ADJ FP FN


70
3. CHAPTER 3.
ASPECT TERM EXTRACTION
3.1. Introduction
Aspect-based sentiment analysis (ABSA) is one of the hotspots of natural language
processing (NLP), which aims to mine opinions and sentiments towards specific products'
aspects or services' features based on investigations of people's views obtained using their
writing (e.g., reviews, blogs, comments, tweets). The process of performing an ABSA
involves several subtasks that begin with the automatic identification of aspect-terms
(also called attributes, or features) of a particular target entity (e.g., Laptops), followed
by the extraction of sentiment towards aspect terms. Next, the classification of extracted
aspect terms into the appropriate categories (e.g., storage, price), and finally, compute the
major polarity for each aspect category (positive, negative, neutral, or conflict) [94].
Aspect Term Extraction (ATE) from free text represents a challenging task. It is
considered the primary task incorporated in aspect-based sentiment analysis. The process
of extracting aspect terms from the text starts with taking the free text as input and returns
a set of aspects for each pre-identified entity [95, 96]. The importance of this task is due
to the dependence of other tasks on the results it provides, which directly influences the
accuracy of the final results of the sentiment analysis. Online reviews could contain two
kinds of product aspects: explicit aspects, which our work is interested in, and implicit
aspects [97].
Explicit aspects refer to product features that users comment on directly within the
review using explicit words; for example, in the review: "Good product for the price
works better with Google chrome," the aspect price has been stated explicitly. On the

71 other hand, implicit aspects do not appear within the review but are commented
implicitly; for example, in the review: "Great little computer that does what is written on
the box," the user is talking about the size aspect without using an explicit word to state
this aspect.
Most research on developing ATE techniques works on extracting aspect terms from
sentences [95, 96, 98-104], while in the era of big data, this will be time-consuming of
inspecting every single sentence individually; rather, a batch processing technique is
required to extract prominent aspect terms instead [105]. Therefore, we propose a novel
method to automatically extract prominent review aspects of a product from customers'
reviews in this work. The main objective of this work is to introduce a scalable framework
for extracting product aspects with stable performance.
The proposed model extract aspect terms from review text based on a data-driven
approach. Various Word embedding techniques were considered to get a numerical
representation of each word. Given the high dimension of the generated word vectors, the
Self Organizing Maps (SOM) technique was applied to reduce the dimensionality and
preserve the original data characteristics. Next, the K-means++ clustering technique was
applied to extract the most prominent aspect terms with the help of pre-defined filtering
criteria. The proposed model extracts single words and is also able to extract phrases as
prominent aspects.
The organization of this chapter is as follows. This section presents the subjects and
motivations of this work. Next, section 2 introduces a brief discussion about the state-of-
the-art techniques for aspect term extraction. The basic procedures of the proposed model
were presented in Section 3, including word embedding, dimensionality reduction,
clustering, and feature selection. Section 4 presents the proposed model for aspect term
extraction with an explanation of the proposed framework. In section 5, an explanation
of the conducted experiments that prove the efficiency of our model is presented, stating
the details of our implementation, a description of the used datasets. Also, an explanation
of achieved results with discussion is presented as well. Finally, section 6 presents a
summary of the chapter and reached conclusions.

72
3.2. Background
The key task in aspect-based sentiment analysis is extracting explicit aspects from
text, more specifically online reviews—this relies on the dependency of other ABSA
tasks on the results of this task. Also, the international semantic evaluation competition
(SemEval-2014) has attracted great attention to ABSA in recent years. The mentioned
competition has involved the four primary ABSA subtasks. The first subtask was the
aspect term extraction which is mainly concerned with the identification of the aspect
terms in the given domain.
Recently, many approaches were introduced to extracting product features from
online customers' reviews; for the sake of convenience, several classifications were
proposed to summarize these approaches. Authors of [106] tend to classify approaches
into three categories: machine learning-based, dependency relation-based, and lexicon-
based approaches. On the other hand, in [95], they tend to classify approaches based on
the learning techniques into supervised, semi-supervised, and unsupervised, as depicted
in Figure 3.1. Additionally, in [107], authors have classified ATE approaches into rule-
based methods, neural network-based methods, and topic modeling-based methods. The
rest of this section explores some of the most recent approaches proposed to ATE.
Shi Li et al. [108] introduced a frequency-based model for feature extraction with
the help of similarity measures using the web. The proposed model represents an
extension of the RCut text classification algorithm. It starts with selecting the candidate
aspects, then measuring the semantic similarity with target entities. The RCut algorithm
is used in the aspect selection process to learn the threshold. Experiment results on the
Chinese language prove the model's ability to handle diverse domains and data sizes.
Zhijun Yan et al. [106] have introduced the integration of PageRank algorithm,
implicit feature inference, and synonym expansion to automatically identify product
aspects, which is called EXPRS (An EXtended PageRank algorithm enhanced by a
Synonym lexicon). The data preparation process includes sentence-level segmentation,
POS tagging. The ATE tasks include extracting dependency relations and ranking words

73 by the proposed NodeRank method to identify candidate aspects. Finally, it generates the
final aspect set after getting word synonyms for candidate aspects and inferring implicit
features.
Figure 3.1. Classification of aspect term extraction techniques
Xin Wang et al. [109] introduced an extension of dependency-based word
embeddings for feature identification. In this work, the authors present an improved
method for word representation based on the Recurrent Neural Networks (RNNs). The
proposed model is language-independent, which means its ability to handle several
languages.

74
Shufeng Xiong and Donghong Ji [110] proposed a semantically relevance-based
model for extracting aspect-phrase. The authors have introduced a pipeline model of word
embedding and clustering. Word embedding was applied to generate a weighted context
representation of data. On the other hand, flexible-constrained clustering has been
introduced that built on the k-means clustering algorithm were employed to obtain aspect-
phrases cluster.
Wei Xue et al. [111] introduced neural networks based model for aspect terms
identification and classifying them into the proper category, respectively, called MTNA.
The proposed multi-task learning model is built on the recurrent neural networks and
convolutional neural networks (CNNs) as well, as they have combined the BiLSTM for
feature extraction and CNNs for aspect category classification in a multi-task framework.
Xin Li et al. [112] introduced a model for capturing aspect detection history and
opinion summary based on LSTM. It consists of two primary parts. The first is Truncated
History-Attention (THA) which is responsible for identifying aspect history. The second
is Selective Transformation Network (STN) which works on capturing the opinion
summary. The LSTMs produce the initial word representation that inputs the result to the
two parts, respectively. Authors have concluded that the joint extraction sacrifices the
accuracy of aspect prediction.
Chuhan Wu et al. [113] introduced a hybrid unsupervised algorithm for aspect term
extraction and opinion target extraction. The proposed model presents a combination of
rule-based and machine learning techniques. The linguistic rules at the chunk level were
used to extract opinion targets and features. Next, domain correlation-based filtering was
applied to exclude irrelevant items. Results of these steps are finally used to train a deep-
gated recurrent unit (GRU) network.
Yanmin Xiang et al. [114] proposed a Multi-Feature Embedding (MFE) clustering
method for extracting aspect terms in the ABSA, which is based on the Conditional
Random Field (CRF). Text representation was done using MFE to extract extensive
semantic information from data. Next, the K-means++ clustering algorithm was

75 employed to generate words clusters to support position features of the CRF. Finally,
MFE clusters with word embedding were used to train the model.
Zhiyi Luo et al. [107] introduced a data-driven-based approach for extracting
prominent aspects from textual reviews called ExtRa (Extraction of Prominent Review
Aspects), which can extract aspect words and phrases. The proposed method employs
knowledge sources like WordNet and Probase to build aspect graphs to limit the aspect
space, and aspect spaces are then divided into clusters to extract the K prominent aspect.
Md Shad Akhtar et al. [115] proposed a pipeline framework for extracting and
classifying aspect terms. The proposed multi-task learning framework begins with
applying a Bi-directional Long Short Term Memory (Bi-LSTM) followed by a self-
attention mechanism on sentences to extract aspect terms. Next, it employs the
convolutional neural networks to predict the sentiments of the extracted product aspects.
Experiments were conducted on English and Hindi and proved its validity to handle both
languages.
3.3. The Basic Procedures
Generally, the proposed model ensembles several sub-tasks, including Word
embedding, multi-dimensional reduction, clustering, and feature selection. As follows,
we will discuss the primary procedures of our model with different variants of specific
tasks for performance tuning.
3.3.1. Word Embedding
In the last few years, researchers have attempted to improve the performance of text
representation techniques, which positively affect several NLP tasks. Many Word
Embedding models were introduced in this context based on statistical models, machine
learning, and deep learning (e.g., Word2Vec, GloVe, BERT) [101, 109, 110, 116, 117].
Such models produce word vectors of real numbers representing the context of the given
words, which can be used as input features for further processing tasks. There are several

76 levels of text representation using embedding techniques in addition to word-level,
including char-based embeddings (e.g., Embeddings from Language Models "ELMo"
[118], and Flair [119]), byte-level embeddings [120], and N-gram embeddings [121].
Concerning the word level, researchers have been introduced several models that
started from the old-fashioned embedding techniques "Bag-of-Words" that built on
simple machine learning algorithms like Term Frequency-Inverse Document Frequency
(TF-IDF). Subsequently, the next-generation models were based on using deep learning
techniques like Word2Vec. Recently, cutting-edge word embedding models have
appeared, introducing the language models used with transfer learning from attention-
based transformers like BERT.
The capabilities of word embedding of capturing the word's meaning in a specific
context considering similarities to other words (e.g., semantically and syntactically and
other relations) have imposed it to be one of the most significant technologies contributing
to NLP. We examined several well-established word embedding techniques towards
evaluating how the performance of different models changes over various word
embeddings.
• Word2Vec: Word2Vec is one of the most popular techniques of text embedding
introduced by Mikolov et al. in 2013 [122] and accompanied by a C package; it
is considered a protoplast model of any neural network word embedding. A pre-
trained version is available, which is trained on Google News [123]. Other popular
models belonging to the same category include Facebook's model "FastText" and
Stanford's "GloVe."
Returning to the Word2Vec, the model consists of two-layer neural networks, and
it takes a text corpus as input and generates a set of vectors representing a set of
words respectively as output. A well-trained model groups similar word vectors
nearby to each other in one space. Training the Word2Vec model has two main
alternatives that use either Hierarchical Softmax or Negative Sampling: The first
approach is Continuous Bag of Words (CBOW), which uses the context to predict

77
a target word. On the other hand, the second approach is the Skip-gram; unlike
CBOW, it uses the word to predict the target context. Commonly, practices proved
that the skip-gram method could have a better performance compared with the
CBOW method.
• BERT: Dynamic Word Embeddings have appeared and developed rapidly, also
known as Language Models or Contextualized Word Embeddings. These models
defeat the most significant limitation of the classic Word Embedding approaches:
representing a single word with different meanings by one vector only and
polysemy disambiguation. BERT (Bidirectional Encoder Representations from
Transformers) represents one of the most well-known language models built
based on Transformer introduced by Google's team, Jacob Devlin et al., in 2018
[124]. The Transformer is an attention mechanism that identifies contextual
relations in the text between words or even sub-words; it incorporates two
separate mechanisms, encoder, and decoder, the first reads the input, and the
second produces a prediction for the task.
The BERT model randomly substitutes a subset of words in a sentence with a
mask token, and next, it predicts the masked word based on the surrounding
unmasked words through a transformer-based architecture. Unlike classical
directional models, which read the input text sequentially (right-to-left or left-to-
right), the prediction is generated considering word neighbors from both sides, the
left and right, this due to the transformer encoder mechanism that reads the
complete sequence of words at once. BERT generates a word vector that is a
function of the entire sentence. Accordingly, based on the context of a word, it
can have different vectors.
The model consists of four dimensions, [# layers, # batches, # tokens, # features].
The model is a deep neural network with 12 layers in the "Base" or 24 in the
"Large" version. The batch number refers to the number of input sentences to the
model, and the token numbers refer to the number of words in input sentences.

78
Finally, the features number of the hidden units refers to the number of
dimensions representing each token, 768 in the "Base" or 1024 in the "Large"
version.
3.3.2. Multi-Dimensional Reduction
Word embeddings are multidimensional; employing a word embedding technique to
represent a corpus of text will generate a set of vectors, each one representing one word
only. The number of values of one vector refers to the number of dimensions that
represent the word. For example, in Word2Vec models, the size parameters refer to the
number of dimensions used to represent each word, directly proportional to the quality of
the resulting vectors. Practically, the preferred values for the dimensionality size of word-
vectors range from 300 to 400, which depends on the input data size. On the other hand,
in BERT, words are represented by 768 dimensions in the Base model or 1024 in the
Large version.
Increasing the dimensionality of data imposes difficulties in data interpretation and
visualization. There are several approaches introduced for nonlinear dimensionality
reduction like PCA, SOM, and t-SNE. Such models provide a mapping from the high-
dimensional space to the low-dimensional embedding.
• SOM: The Self-Organizing Maps (SOM) have introduced by Teuvo Kohonen in
1982 [125-128], also known as Kohonen's Self Organizing Feature Maps, or
Kohonen network. SOMs are an unsupervised machine learning technique that
maps high-dimensional vectors onto a low-dimensional (typically two-
dimensional) space; they learn to classify data without supervision. It is a type of
ANN that can handle datasets with few references. Commonly, SOMs are used
for data clustering and visualization purposes. SOM could be used for reducing
the dimensionality of vectors since it provides a way of representing high-
dimensional data in low-dimensional spaces "2-D".

79
One of the most significant aspects of SOMs distinguishing them from other
clustering techniques is that they preserve the original data's topology because the
distances in the 2-D space reflect those in the high-dimensional space. Kohonen's
networks store information to maintain topological relationships within the input
datasets. The internal learning mechanism continuously modifies network
weights until input and target vectors become consistent. On the other hand, other
clustering techniques like K-means generate a representation that is hard to
visualize because it is not in a convenient 2-D format.
• t-SNE: The t-Distributed Stochastic Neighbor Embedding is an effective
probabilistic technique for dimensionality reduction that can be used for
visualizing multi-dimensional datasets [129-132]. Given complex datasets with
numerous dimensions, t-SNE projects this data and the underlying relationships
between vectors in a lower-dimensional space and represents it in 2D or 3D while
preserving the original dataset's structure. In addition to data visualization, the
power of t-SNE to cluster data in an unsupervised gives it the ability to aid
machine learning algorithms in prediction and classification.
The working mechanism of the t-SNE starts with measuring the similarity
between every possible pair of data points towards generating a similarity
distribution of the high-dimensions input data. Next, it creates a pairwise
similarity distribution of the corresponding low-dimensional points in the
embedding—finally, its works on minimizing the divergence between these two
distributions.
Several approaches for using t-SNE in large-scale datasets; one approach
ensemble it with another technique like PCA; or implementing t-SNE via
approximation technique like the Barnes-Hut approximations.

80
3.3.3. Clustering Feature
Clustering algorithms are used to separate a set of objects and group them according
to the similarity of features measured through their attributes and proximity in the vector
space. Various fields could employ clustering techniques, including statistical analysis,
computer vision, genomics, machine learning, and data science. Generally, clustering
algorithms can be classified into six main categories:
(1). Hierarchical clustering "Connectivity-based" (e.g., BIRCH, ROCK, DIANA)
(2). Partitioning clustering "Centroids-based" (e.g., K-means, k-modes)
(3). Density-based clustering (e.g., DBSCAN, DENCAST)
(4). Distribution-based clustering (e.g., Gaussian Mixed Models, DBCLASD)
(5). Fuzzy Clustering (e.g., Fuzzy C means, Rough k-means)
(6). Constraint-Based (e.g., Decision Trees, Random Forest, Gradient Boosting)
Despite the comprehensive efforts by researchers for improving the clustering
techniques, handling high dimensional feature vectors is still challenging in any clustering
task. Therefore, this work ensemble the stepped clustering of features vectors; the first
phase handles the high-dimensional problem and generates a 2-D representation of vector
space. On the other hand, the second phase produces high-quality clusters of features. For
the second phase, we have selected the K-means++ clustering algorithm.
• K-Means++: David Arthur and Sergei Vassilvitskii introduced the k-means++
clustering algorithm in 2007 to overcome the drawback posed by the k-means
algorithm [133]. They have presented Monte Carlo simulation results that prove
that k-means++ is faster and affords better performance than the standard version.
It is an unsupervised clustering algorithm that collects and separates data into k
number of clusters. The mechanism work of k-means++ is choosing the initial
center points and then starting the standard k-means; this is what k-means++ does
to avoid the poor clustering found by classical k-means algorithms.

81
K-Means++ centers are distributed across data besides being less costly than
random initialization of centroids. Initialization in k-means++ is performed by
randomly allocating one cluster center; given the first center, it then searches for
other centers. Therefore, the algorithm is guaranteed to find the optimal result
instead of getting the local optimum achieved by the old one.
3.3.4. Feature Selection
Concerning the set of vectors' clusters representing words and phrases produced
from the clustering phase, the purpose is to filter out irrelevant tokens and extract the list
of prominent aspects. Algorithm 4.1. presents the proposed features selection procedure.
It starts with counting the frequency distribution for nouns, adjectives, and verbs only
using Part-of-Speech tags since these word classes synthesize most aspect terms. The next
step is computing the distance space for each cluster and extracting the distance from the
cluster's centroid for each item, respectively. Then it sorts items in each cluster
ascendingly and selects the top central items, "Candidate Aspects List." Converting
vectors into textual equivalent tokens is the next step; selected items are words and
phrases as well. Next is filtering the list by accepting only the mentioned word classes for
both single words and parts in phrases. Finally, extracting frequencies for single words
and phrases from the frequency distribution mentioned early and excluding items that did
not pass a certain threshold—consequently, the filtered items constitute the list of
prominent aspects.
3.4. The proposed Model for ATE
This work's primary goal is to extract the most prominent aspect terms from the
customers' review text. The proposed model aims to generate a numerical representation
of the text "Word vectors" and then apply a dimensionality reduction technique to
improve the quality of word clusters and finally filter extracted aspects to obtain the
leading aspects of the subject of reviews. As follows, we will discuss the workflow of our
model and how it operates.

82

83
3.4.1. The Framework Description
Generally, the proposed model incorporates several subtasks starting from collecting
the customers' reviews, followed by a series of data processing tasks, ending with
providing a list of prominent aspects of the target entity, as shown in Figure 3.2. Data
collection and preprocessing is the first step towards achieving the desired task, discussed
comprehensively in Chapter 2. Clustering features accept only numerical data; therefore,
it is imperative to get a numerical representation of textual data. Word embedding is the
most popular technique used to achieve this task. So, the next step is to extract the list of
words because word embedding requires the input data to be formatted as a list of words.
Since our original dataset consists of the customers' reviews, each review could be divided
into sentences "list of sentences," and each sentence would be a list of tokens. Therefore,
we need to convert data into a "list of lists" format to be accepted input to the word
embedding techniques.
In this work, we have investigated two different techniques for word embedding that
are widely used, namely "Word2Vec and BERT," and analyzed their effect on the
performance of our model. The extraction of aspect phrases and aspect terms has also
been considered; therefore, we have employed a Multi-Feature Embedding (MFE) to
capture aspect phrases. Results from several levels of word embedding were then
combined. Since generated vectors are of high-dimension, which hinders any trials for
clustering these vectors by negatively affecting the quality of resulting clusters, an
intermediate process of clustering is necessary to reduce the dimensionality of the input
vectors while preserving the original data topology. Here we have investigated two
different techniques to accomplish this task, namely "SOM and t-SNE."
Clustering of generated 2-D vectors is the next step in our model. The selection of
the K-Means++ clustering algorithm ensembled in the proposed model relies on its
efficiency and appropriateness to our datasets and the analysis purpose. Generated
clusters of vectors are the input to the proposed features selection algorithms discussed
previously, which extract the list of prominent aspects.

84
Figure 3.2. The experimental framework of the proposed aspect term extraction model
3.5. Experiments and Results
In order to examine the efficiency of our model, we have tested and evaluated it
against several datasets which are available and publicly accessed. The following is a
description of the datasets used in the experiment—next, a presentation of the
experimental setup of the ensembled procedures. Following is a review of the evaluation
metrics and benchmarks used in our experiment—finally, a discussion of the achieved
results.

85
3.5.1. Datasets
The experiments were conducted using two groups of datasets. The first group
consists of online customers' reviews that we have collected from online markets using a
developed web scraper. On the other hand, the second group consists of benchmark
datasets that researchers widely use to compare with baseline models. The datasets used
in the experiments are as follows:
A. Collected Datasets
• Amazon: The dataset contains 28,125 online customer reviews regarding 45
different laptop products.
• BestBuy: The dataset contains 47,905 online customer reviews regarding 33
different laptop products.
• Dell: The dataset contains 44,175 online customer reviews regarding 19 different
laptop products.
• Lenovo: The dataset contains 85,711 online customer reviews regarding 21
different laptop products.
B. Benchmark Datasets
▪ SemEval-14: The organizers of the International Workshop on Semantic
Evaluation (SemEval-2014) held in Dublin, Ireland, have announced a
competition of semantic evaluation tasks for two domain-specific datasets; we are
interested in the fourth task that is concerned with the aspect-based sentiment
analysis and, more precisely, with the first subtask that concerned to aspect term
extraction. The datasets include customers reviews from two different domains,
restaurants and laptops. Table 3.1 shows the main characteristics of the mentioned
datasets. Figure 3.3 shows an illustrative example that presents the format of one
annotated sentence of the laptop's trial dataset.

86
Figure 3.3. A sample of the laptop's trial dataset shows an annotated sentence using the
XML tags
Table 3.1. The main characteristics of the SemEval-14 datasets
Dataset Laptops Restaurants
Trial Test Total Trial Test Total Sentence Count 3048 800 3848 3044 800 3844
Aspect Term
With Repetition 2373 654 3027 3699 1134 4833 Unique Items 1048 419 1315 1295 555 1657
3.5.2. Experiment Setup
We experimented with various approaches for involved techniques in our ensemble.
As follows, we will explore experiment settings regarding alternatives available for each
task.
I. Word Embedding
In order to extract aspect terms and aspect phrases as well, we have extracted word
sequences that occur together using n-gram models. Frequent word sequences only were
considered. Subsequently, these phrases substituted singular counterpart words in
sentences before inputting them to the word embedding model to handle them as a single
term.

87
Word2Vec: Several runs were performed to choose the most fitting hyper-
parameters from these runs on our datasets as follows: the dimensionality of word vectors
equal to 300, the maximum distance between the target word and its neighboring word
equal to 30 tokens, the minimum word frequency equal to 100, training the model using
the Skip-Gram algorithm through the negative sampling technique, the number of worker
threads used to train the model equals 8. Our experiments were implemented using
Genism version 4.0.
BERT: We used 2 different pre-trained word embeddings models. The first is the
Base uncased model, consisting of a deep neural network with 12 layers; the dimensions
representing each token are 768 features. On the other hand, the second model is the Large
uncased version, which consists of a deep neural network with 24 layers; the dimensions
representing each token are 1024 features. Tokenizing the sentence was done using the
"BERT Tokenizer" model that adds the special tokens '[CLS]' indicating the start of the
text and '[SEP]' to separate adjacent sentences and for padding & truncating all sentences.
The max_length is set to 64; padding equals the 'max_length'; returning attention mask
property is set to "True" to construct the attention masks; and return tensors is set to 'pt,'
to return PyTorch tensors. The model consists of four dimensions, [# layers, # batches, #
tokens, # features]. For getting word embeddings, we have removed the batches
dimension and rearranged the remaining dimensions to be as follows: [#tokens,# layers,#
features]; for each token, we have concatenated the vectors from the last four layers. Our
experiments were implemented using the torch version 1.10.0 with Transformers version
4.11.3 as the backend.
II. Dimensionality Reduction
SOM: Many trials were executed towards selecting the most fitting hyper-
parameters from these trials on our datasets as follows: the grid size of a SOM is set to
80 for both numbers of rows and columns as well; the selected working mode is the
unsupervised mode; initialization of the unsupervised mode is set to "random"; the
number of iterations is set equal to 50000; the training mode is set to "Batch Mode"; the

88 selected neighborhood mode is the "linear" mode; the chosen learning mode of the
unsupervised SOM is "min"; the distance metric for the comparison on feature level is the
"Euclidean Distance"; the starting and ending learning rate is set to 0.5 and 0.05
respectively; the neighborhood distance weight mode is set to "pseudo gaussian"; the
number of jobs to run in parallel is 3; the random number generator of the NumPy
"random" method is used for the random state property; the verbosity controllers is set to
zero. Our experiments were performed using the "susi" implementation of the SOM.
t-SNE: We have used the following parameters settings which are fitted
appropriately on our dataset: the number of dimensions of the embedded space is set to
2-D; the number of nearest neighbors "perplexity" is set to 40; the learning rate equals
300; the early exaggeration property is set to 24; the maximum number of iterations for
the optimization is set to 2500; aborting the optimization will occur after 500
unprogressive iterations; the minimum gradient norm threshold for halting the
optimization is set to be under 1e-7; the distance metrics between instances in a feature
array is chosen to be "Euclidian"; the initialization of embedding is set to "PCA"; the
random number generator is set to 25; setting the square distances property to "legacy" to
squaring distances values. Our experiments were implemented using the "scikit-learn"
version 0.23.2 as a backend.
III. Clustering
K-Measns++: Depending on the results of numerous trials, we have used the
following parameters settings: the preferred number of clusters is range from 50 to 250
depending on the size of the dataset; the initialization method is set to "k-means++"; the
maximum number of iterations for a single run is equal to 400; the number of runs with
different centroid seeds is set to 15; the relative tolerance property is set to 0.0001; the
verbosity mode is set to zero; the random number generation for centroid initialization is
set to Zero for deterministic randomness; the "copy_x" property is set to "True" to avoid
modifying original data; the K-means algorithm to use is selected to be "Elkan." Our
experiments were implemented using the "scikit-learn" version 0.23.2 as a backend.

89
3.5.3. Testing and Evaluation Metrics
A. Evaluation Metrics
The results of the conducted experiments were evaluated using the following
metrics: Precision (P), Recall (R), and F-measure (F), in order to assess the effectiveness
of the proposed model. Regarding a list of extracted aspects, the precision is the
proportion of correct extracted features "cor(asp)" to the total extracted aspects
"pre(asp)." The recall is the proportion of correct extracted aspects to all correct features
"true(asp)." On the other hand, F-score represents an indication of the overall
performance of precision and recall; it is a harmonic average of precision and recall. The
formulas of the Precision, Recall, and F-Score are as follow:
𝑃𝑟𝑒𝑐𝑖𝑠𝑖𝑜𝑛 (𝑃) =
𝑐𝑜𝑟(𝑎𝑠𝑝)
𝑝𝑟𝑒(𝑎𝑠𝑝) (3.1)
𝑅𝑒𝑐𝑎𝑙𝑙 (𝑅) =
𝑐𝑜𝑟(𝑎𝑠𝑝)
𝑡𝑟𝑢𝑒(𝑎𝑠𝑝) (3.2)
𝐹 − 𝑆𝑐𝑜𝑟𝑒 =
2 ∗ 𝑃 ∗ 𝑅
𝑃 + 𝑅 (3.3)
B. Baseline Methods
In order to validate the performance of our proposed model, a comparison of our
model against multiple baselines was made for this task, including the following models:
• DTBCSNN+F [134]: A convolutional stacked neural network model built on the
dependency parse tree towards capturing the syntactic features.
• MFE-CRF [114]: Based on the Conditional Random Field, Multi-Feature
Embedding clustering was proposed to capture implicit contextual information.
90 • Wo-BiLSTM-CRF [116]: Using pre-trained word embedding model
"Glove.42B", Bi-directional long short-term memory with conditional random
field were proposed to enhance the feature representation and extraction.
• WoCh-BiLSTM-CRF [116]: Using the character-level word embedding as long
with word-level embedding through employing pre-trained word embeddings
"Glove.42B", to enhance the performance of Bi-directional long short-term
memory with the optional conditional random field.
3.5.4. Result Analysis and Discussion
In this section, the proposed models were tested to verify our work's viability for
implementation; also, it compared with the baseline models in order to evaluate our
models' efficiency and assure its quality. We have proposed several models' ensembles
that use two different pre-trained word embeddings techniques, two different
dimensionality reduction methods, and one clustering algorithm as follows:
➢ W-S-K: Word2Vec – SOM – K-Means++
➢ W-t-K: Word2Vec – t-SNE – K-Means++
➢ B(B)-S-K: BERT (Base) – SOM – K-Means++
➢ B(L)-S-K: BERT (Large) – SOM – K-Means++
➢ B(B)-t-K: BERT (Base) – t-SNE – K-Means++
➢ B(L)-t-K: BERT (Large) – t-SNE – K-Means++
(A) Word2Vec Vs BERT
Results appear in Figure 3.4 show that the overall performance of models' employing
BERT word embeddings acting over other those employing the Word2Vec word
embeddings this may relay on the well trained that BERT various models built on and
also the representation of words that involves semantic and contextual information of
words from two sides producing higher quality than those produced by Word2Vec.

91
(A) Amazon dataset (B) BestBuy dataset
(C) Dell dataset (D) Lenovo dataset
Figure 3.4. The effect of K value on the experimental results in terms of percentage of the
precision
76.00
78.00
80.00
82.00
84.00
86.00
88.00
90.00
5 0 1 0 0 1 5 0 2 0 0 2 5 0
The value of K
W-S-K W-t-K B(B)-S-K
B(L)-S-K B(B)-t-K B(L)-t-K
77.00
78.00
79.00
80.00
81.00
82.00
83.00
84.00
85.00
86.00
87.00
88.00
5 0 1 0 0 1 5 0 2 0 0 2 5 0
The value of K
W-S-K W-t-K B(B)-S-K
B(L)-S-K B(B)-t-K B(L)-t-K
77.00
78.00
79.00
80.00
81.00
82.00
83.00
84.00
85.00
86.00
87.00
88.00
5 0 1 0 0 1 5 0 2 0 0 2 5 0
The value of K
W-S-K W-t-K B(B)-S-K
B(L)-S-K B(B)-t-K B(L)-t-K
76.00
78.00
80.00
82.00
84.00
86.00
88.00
90.00
5 0 1 0 0 1 5 0 2 0 0 2 5 0
The value of K
W-S-K W-t-K B(B)-S-K
B(L)-S-K B(B)-t-K B(L)-t-K

92
(B) SOM Vs t-SNE
The experimental results show that SOM and t-SNE act similarly with low volumes
of data with relative advantage to t-SNE, while when the volume of data is going on,
SOM remarkably performed better with huge volumes of data.
(C) The Evaluation of K Value
Numerous runs were performed using different sequential values of K; the results
show that the best performance could be obtained with values in the range of 50 to 250.
Figure 3.4 shows the results of different model combinations in terms of precision on
each dataset separately; we have limited the results to the preferred values range
exclusively for clarity. We can observe that the highest precision achieved was when k =
150.
Figure 3.5. The comparison between the achieved results from applying proposed models
variants on different datasets, where K = 150
81.00
82.00
83.00
84.00
85.00
86.00
87.00
88.00
89.00
W-S-K W-t-K B(B)-S-K B(L)-S-K B(B)-t-K B(L)-t-K
Prec
isio
n (%
)
Model
Amazon BestBuy Dell Lenovo

93
(D) Performance Analysis of the Proposed Models
The comparison between proposed models presented in Figure 3.5 shows that the
third model "B(B)-S-K" and fourth model "B(L)-S-K" respectively outperforms other
models with a slight superiority to the fourth model. This situation was proved previously
by comparing the contributed procedures where BERT and SOM contributions provide
significantly better performance than the Word2Vec and t-SNE, respectively.
(E) The Comparison with Baseline Methods
In order to compare our models against the baseline methods, it is mandatory to test
them on benchmark datasets that researchers widely use. Therefore, we have tested the
proposed models' combinations on the SemEval-2014 datasets. Table 3.2 shows the
experimental results of applying these combinations on the restaurants' dataset using a K
value equal to 200 and laptops datasets using the K value equal to 150. Results show that
the same situation occurred against our collected datasets, where the third and fourth
models provide better performance than other combinations. The main remarks that their
performance is stable for both domain-specific datasets, which proves the efficiency of
our models and its ability to handle various domains separately, as depicted in Figure 3.6.
Furthermore, we can say that handling multi-domain datasets are still a challenge.
Table 3.2. The results of applying different aspect term extraction models on the
SemEval-14 datasets, using the K value equal to 150 with the Laptops dataset and 200
with the restaurants' dataset
Model Laptops Restaurants
Precision Recall F1 Precision Recall F1 W-S-K 83.98% 72.17% 77.63% 85.86% 78.39% 81.96% W-t-K 84.37% 71.41% 77.35% 84.99% 77.91% 81.30% B(B)-S-K 88.28% 74.45% 80.78% 88.54% 83.95% 86.18% B(L)-S-K 88.72% 75.36% 81.50% 89.83% 84.19% 86.92% B(B)-t-K 85.25% 73.84% 79.14% 86.55% 83.10% 84.79% B(L)-t-K 85.45% 74.14% 79.40% 87.11% 83.22% 85.12%

94
Figure 3.6. Comparison of various model combinations in terms of F-score results
Regarding the evaluation of our models, we have compared the results of F-Score
achieved by the fourth model of proposed combinations "B(L)-S-K," which provides the
best performance, against the state-of-the-art models. From Table 3.3 and Figure 3.7, we
can observe that our model outperforms the baseline methods. It acts well with a relative
advantage on the laptops' dataset, while it provides significant improvements over other
models with the restaurants' dataset.
Figure 3.7. Comparisons of F-score between the baseline methods and our model for the
SemEval-14 datasets
72.00%
74.00%
76.00%
78.00%
80.00%
82.00%
84.00%
86.00%
88.00%
W-S-K W-t-K B(B)-S-K B(L)-S-K B(B)-t-K B(L)-t-K
F-Score
Laptop Restaurants
70.00%72.00%74.00%76.00%78.00%80.00%82.00%84.00%86.00%88.00%
Laptops Restaurants
F-Score
B(L)-S-KDTBCSNN+FDTBCSNN+FMFE-CRFWo-BiLSTM-CRF-Glove.42B

95 Table 3.3. Comparison of F-score results of baseline methods for SemEval-14
Model Laptops Restaurants
B(L)-S-K 81.50% 86.92% DTBCSNN+F 75.66% 83.97% MFE-CRF 76.53% 84.33% Wo-BiLSTM-CRF-Glove.42B 81.08% 84.97% WoCh-BiLSTM-CRF-Glove.42B 79.21% 86.05%
3.6. Summary
The primary task incorporated in the aspect-based sentiment analysis is the Aspect
Term Extraction from free text. This significance relies on the dependency of other tasks
on the results it provides, which directly influences the accuracy of the final results of the
sentiment analysis. In this chapter, we have proposed six different models' combinations
for aspect term extraction built based on clustering the word vectors generated using the
pre-trained BERT model with the help of dimensionality reduction techniques "SOM" to
improve the quality of word clusters that could be obtained using the K-Means++
clustering algorithm.
We have conducted extensive experiments to ensure our models' validity for
implementation and to verify their effectiveness, and the results show that all the proposed
models' acting well, but one provides better performance with higher precision than
others. In order to assure its efficiency, we have tested our best model combination on the
SemEval-14 datasets and compared it against the baseline methods, and results show that
our model outperforms them in terms of F-Score results.

96
4. CHAPTER 4.
USER GENDER IDENTIFICATION
4.1. Introduction
Recently, many changes have occurred in the world due to the difficult times we are
going through. The pandemic has affected significantly many areas; e-commerce and e-
marketing have acquired the largest share. Both consumers' and sellers' behavior has been
affected and differed significantly from previously, which prompted many companies to
handle this matter by making more efforts in analyzing customer interests and desires.
The primary motivation is to enhance their marketing capabilities and increase the
commercial share, taking into account the increased degree of competition between
companies to realize customer satisfaction and increase their loyalty. To this end,
companies collect and analyze many essential data to provide marketing and promotional
offers that match customers' requirements [2, 3, 135, 136].
Generally, most online shopping websites allow customers to submit their feedback
about offered products and services. The analysis of customers' data, besides their
feedback, could help companies greatly while developing their marketing strategies,
product redesign, etc., [4, 137, 138]. Customer gender is considered a significant aspect
of personal data that can help understand and predict customer behavior and enhance
organizations' capabilities to provide users with the most relevant information to search
queries and preferences [139, 140].
Commonly, gender classification is considered a binary task, "Male and Female."
However, when dealing with the username or profile name, it may be extended to be a
ternary task where some people, for several reasons, prefer to be registered anonymously;

97 up to the end of this chapter, the term username and profile name will be used
interchangeably. Also, digital platforms may allow users to be registered using virtual
genders that enhance physical anonymity [141].
Gender classification represents a challenging task attracting researchers from
various fields, including computer vision, data science, pattern recognition, etc.
Automatic gender recognition has a wide range of applications in many fields that justify
its importance, including commercial development (i.e., advertising), law enforcement
(i.e., legal investigations), human-computer interaction (i.e., intelligent systems),
demographic research (i.e., social classification).
Several techniques were proposed for gender classification that depends on the type
of data in which the technique was applied (e.g., image, speech, text, biometrics) [142-
147]. Our goal is to recognize the gender from text, more specifically from the username.
Most customers prefer to write short feedback that makes it insufficient to use text-based
approaches for the Gender Identification GI task.
The proposed approach encounters many challenges that make the GI a problematic
task. The first challenge is that the username may not contain only alphabetical letters;
also, it is possible to accept numbers, symbols, and special characters, making the
classification task not straightforward. Second, using Leet language that users widely
employs that implies using some predefined numbers instead of letters. Such a situation
makes removing numbers a risky task that requires a backward process of substitutions
to retrieve the original name. The third comprises using a short form of the name by
ignoring writing one or more middle letters, typically vowels.
4.1.1. Research Objectives
In this work, we strive to accomplish two primary objectives. First, we aim to collect
review data from various online websites and extract profile data to build a diversified
dataset suitable for validating the automatic gender identification model. Second, we

98 investigate the potential of the dynamic pruned n-gram model for handling gender
identification problems from profile data.
4.1.2. Contributions
In order to fulfill these objectives, we build four datasets that contain the profile data
of customers. The created datasets are collected from real and active websites, which
comprise customers' reviews of products and services. Then we have extracted the profile
data of customers who wrote the reviews.
We also propose a multi-layered preprocessing framework to handle the gender
identification problems. The first layer involves the removal of irrelevant symbols and
special characters from the input pattern. Regarding the use of Leet language, reverse
substitutions are considered taking into account all possible cases. On the other hand, the
second layer concerns removing remaining numbers after completing all possible
numeric-alphabet replacements. Additionally, misspellings and short-form cases are
handled as well using a dynamic pruned n-gram model and fuzzy-matching. We evaluate
the performance of the proposed model; the obtained results demonstrate its validity and
reliability.
The rest of this chapter is organized as follows: In Section 2, we briefly present some
related concepts with a discussion of the related studies. The basic components of our
model have been described in detail in Section 3. Section 4 introduces the proposed model
with a description of the gender identification framework. Furthermore, Section 5
provides details of the conducted experiments, including a description of the dataset used
in this study. The implementation details and an exploration of the obtained results are
provided as well. The testing mechanism, and evaluation metrics, and criteria are
described in this context. Finally, the conclusion that summarizes the results and future
work.
99
4.2. Background
This section focuses on giving an overview of the related concepts, including web
personalization. Next, a comprehensive discussion of the gender classification
techniques, We have considered the text-based approaches only due to their relevance to
our work.
4.2.1. Web Personalization
Web mining refers to the application of data mining techniques on web resources to
extract hidden knowledge. One of the most attractive web mining areas is web
personalization that aims to optimize service and data provided to users by monitoring
their interaction history, users profiles', preferences, geographic location, interests, etc.
Therefore, the general definition of the personalization technique is the customization of
system outputs by the gathered information about system users [5, 148].
In other words, the term customization refers to improvements in the outputs
presented to the user by increasing the relevance degree of the results. Recommendations
and suggestions are different output forms of applying the personalization techniques on
collected data (e.g., Facebook's suggestions, Google's search results, etc.) [149].
Traditionally, personalization systems have relied initially on explicit user feedback
and ratings. Numerous researches have been introduced to improve the quality and
relevance of results that employ additional information like dwell time, user clicks, and
others through a rating scheme. Also, other techniques are developed based on the
collaborative filtering CF for building personalization and recommendation systems.
Other techniques incorporate the soft computing techniques (e.g., fuzzy logic, neural
networks, and genetic algorithms) as a helpful tool to handle this issue [150, 151].
4.2.2. Gender Identification Techniques
Recently, the development of gender classification techniques becomes more
interactive and draws increasing interest and attracts researchers from various scientific

100 disciplines. The application of classification techniques strives to extract characteristics
that differentiate between masculinity and femininity. The primary goal is to
automatically identify a person's gender according to the available data. Based on the
adopted data type, we can categorize the proposed approaches into four classes: (1) Text
Analysis Based Approaches, (2) Face Recognition Based Approaches, (3) Speech
Recognition Based Approaches, and (4) Biometrics Based Approaches. As follow a brief
review about gender identification approaches that based on text analysis:
Since most information on the web is in textual form, it is reasonable to receive the
highest interest and carry the largest share of research proposals. Textual data could be
found in several forms: authors names', tweets, Facebook posts, messages, blogs, etc.
Many researchers proposed solutions to recognize the gender of the text authors'; most of
them focus on the text available in the online social networks. In 2015, [152] introduced
combination approaches for gender classification with text mining techniques. It employs
sociolinguistic-inspired text features for enhancing the performance of text mining
methods. Moreover, authors of [153] have proposed integrating the text mining approach
to examine author preferences for gender classification tasks. Searching for linguistic
information in the author's preferences could improve the performance of the gender
classification. Therefore, integrating the self-assigned gender into the binary GI classifier
could improve the accuracy of the results. Authors of [154] have introduced a supervised
learning approach called the "Cascading Transformer" to identify the gender of named
entities in text. Sequence labeling considering the context where the name appears
outlines their solution for inferencing the gender; "Female," "Male," "Ambiguous," and
"Other" represent possible labels. The proposed model has been tested and evaluated on
four open-source datasets created by authors.
Although most researchers tend to develop solutions to the English text, several
research works were proposed to handle other languages like Arabic [155-157], Russian
[158, 159], and Portuguese [160]. Authors of [157] have introduced a language-specific
algorithm based on N-Gram Feature Vector that deals with Egyptian dialect. They achieve
the text classification task using a Mixed Feature Vector, which was applied to the

101 authors' annotated dataset of Egyptian dialect. Feature weights were applied using the
Random Forest with Mixed Feature Vector and Logistic Regression with N-Gram Feature
Vector. Also, in 2020 [156], authors employ deep learning techniques for handling the
gender identification task. They have investigated several Neural Networks varieties (e.g.,
Convolutional Neural Networks, Convolutional Bidirectional Long-Short Term Memory,
Long-Short Term Memory) on Arabic text on Twitter, more specifically Egyptian dialect.
They found that the best-suited model was Convolutional Bidirectional Gated Recurrent
Units, which achieved the highest accuracy. Turning to the Russian language, authors of
[158] have investigated the application of conventional machine learning models (e.g.,
Support Vector Machine, Gradient Boosting, Decision Tree) and varieties of Neural
Networks (e.g., Convolutional Neural Network, Long-Short Term Memory) on the
Russian text with gender deception to handle the task of GI. They examine several
combinations and proposed the best four models that achieved high accuracy. Concerning
the Portuguese language, the authors of [160] have proposed applying machine learning
techniques to Portuguese on Twitter. They incorporate the extracted Meta-Attributes from
the text with the ML algorithms for recognizing the linguistic expression related to
gender. Several factors were considered (e.g., multi-genre, characters, content-free texts,
structure and morphology, syntax) through the classification process. Furthermore, the
gender identification task's significance encouraged the authors of [161] to develop and
build a set of software tools built using the R programming language. The source of the
package is called genderizeR. Also, there exist several tools that have been built
compatible with other programming languages like python. Python packages for gender
classification include chicksexer, gender-guesser, etc.
4.3. The Basic Procedures
Generally, the proposed model incorporates several sub-tasks, including Data
segmentation (for details, please see chapter 2), data conversion and cleaning, dynamic
pruned n-gram feature selection, and misspelling correction. As follows, we will discuss
the primary procedures of our model with different variants of specific tasks for
performance tuning.

102
4.3.1. Data Conversion and Cleaning
Typically, most websites share the same rules for creating usernames. Website
developers allow the customers to synthesis their usernames using alphabetical letters and
numbers. Also, it is possible to allow the use of underscores or any other range of special
characters and symbols. Human names contain only letters, so for gender identification
purposes, it is reasonable to maintain only letters and remove all other symbols and
numbers. Unfortunately, users prefer to use numbers beside letters to create their
username (e.g., Birthdate, marriage data) as an additional factor that distinguishes them
from other users who share the same name. Moreover, there is an increase in using the
numerical substitutions of letters or what is known as "Leet language." So, removing
numbers becomes unsafe and may lead to erroneous results; thus, we must be careful
when deciding which numbers need to be removed and which not.
Leet or "leetspeak" is an informal language that stands on substituting one or more
English letters in the word with special characters or numbers that resemble the letters in
appearance. In this regard, we make a backward substitution by replacing these numbers
with the original letters. The replacement relation not one-to-one but one-to-many, which
means each letter has several possible substitutions [162, 163]. Originally, Leet was
designated for an obscure communication between the users of the computer bulletin
board, but it becomes a phenomenon that dominates social media, chatting, and comix
[164]. Table 4.1 shows the common substitutions that we have considered in our work.
4.3.2. Dynamic Pruned N-Gram Feature Selection
Selecting features dynamically by applying a dynamic pruned n-gram model
represents the main purpose of this task. We refer to the term features in this context to
the name or name part potentially extracted from the input pattern. Search for matchings
uses the help of the fuzzy matching technique to handle misspelling characters.
Consequently, by completing possible replacements of predefined numbers with
corresponding letters, followed by cleaning the data by removing the remaining numbers

103 or any other symbols, the selection of features process starts. Inputs for this stage
comprise a sequence of letters only.
Subsequent to create the search pattern by n-gram model, the algorithm starts
looking at the labeled dataset for matchings using the entire input pattern where "n" refers
to the number of letters in the input pattern. The labeled dataset consists of pre-classified
names into two groups according to the name's gender, male and female. Next, it
computes the similarity between the search pattern and results from the two groups.
Selecting top similar results that exceed a certain threshold and computing the aggregated
similarity separately for each group is the next step. After that, we measure the relevance
of the input pattern and the search results. If we find considerable matchings, we can
directly decide the current pattern belongs to which group.
Table 4.1. The most common letters that have numerical substitutions
Alphabetical Character
Numerical Substitutions
A 4 B 6 | 8 | 13 E 3 G 6 | 9 I 1 L 1 | 7 O 0 P 9 Q 9 R 2 | 12 S 5 T 1 | 7 Z 2

104
Figure 4.1. An illustration of using the N-gram model for synthesizing the search patterns
On the other hand, if there are no matchings or the results did not help recognize the
gender of the current pattern, pruning n-gram will be employed dynamically in this
context. Pruning the search pattern means that the search pattern's length will be reduced
by one, where "n" becomes "n - 1". Figure 4.1 shows an illustration of using this
mechanism to improve the performance of the search process.
So, creating the search pattern always starts with the highest possible order of n-
gram that equals the input pattern length. If no matching, it starts pruning the pattern by
decrease the n-gram order by one at a time until finding matchings or reach a certain
threshold "the minimum order," we have set to n = 3. Since some users prefer to register
anonymously, reaching the end of the search process without any matches means that the
username gender will be classified as Anonymous.
4.3.3. Misspelling Correction
Clients are not obliged to write their names correctly when creating the username
synthesizing string. For example, users may prefer to write names in short forms, like
writing "Jhn" instead of "John." It is also possible to miss one or more letters accidentally
or write wrong letters within the string. Encountering such a problem regardless of its
reason will lead to mismatching during the gender identification processes. Therefore, the

105 searching for matchings processes is greatly dependent on handling the misspelling
problems.
Several techniques have been introduced in this context; fuzzy matching is used
widely to address such a problem, also known as approximate string matching and fuzzy
string searching. It allows the recognition of words that did not typically match the input
pattern with high accuracy. Moreover, many applications like search engines were built
based on fuzzy matching to provide relevant results if a user query has a typo. Fuzzy
searching on text could be implemented using many algorithms like Damerau-Levenstein
distance, Hamming distance, BK tree or Burkhard Keller tree, Bitap algorithm, and
Levenstein distance which we have used as a base algorithm for our implementation.
The Levenshtein distance, also known as edit distance, is a string metric that
calculates the number of edits needed for converting the input word "Str1" to the target
word "Str2" and suggests the minimum number of edits that represents the difference
between two words given by the following equation.
𝑙𝑒𝑣𝑎,𝑏(𝑖, 𝑗) =
{
𝑚𝑎𝑥(𝑖, 𝑗) 𝑖𝑓 𝑚𝑖𝑛(𝑖, 𝑗) = 0,
𝑚𝑖𝑛 {
𝑙𝑒𝑣𝑎,𝑏(𝑖 − 1, 𝑗) + 1
𝑙𝑒𝑣𝑎,𝑏(𝑖, 𝑗 − 1) + 1 𝑜𝑡ℎ𝑒𝑟𝑤𝑖𝑠𝑒,
𝑙𝑒𝑣𝑎,𝑏(𝑖 − 1, 𝑗 − 1) + 1(𝑎𝑖≠𝑏𝑗)
(4.1)
where a, b refer to the first and second strings, respectively, and i, j refer to the characters'
positions in the first and second strings.
Here, the term edit refers to performing actions that exclusively include the
Substitution, Insertion, or Deletion of a single character one at a time. Figure 4.2 shows
an illustrative example of computing the edit distance between two strings using a matrix.

106
Figure 4.2. An example of computing the edit distance between string1 and string2 using
a matrix
4.4. The Proposed Model for GI
This work's primary goal is to recognize the gender of the customer through the
username. The proposed model aims to collect, process, and analyze the consumers' data
from the online markets. In this section, we present the dynamic pruned n-gram model
for identifying the gender of the customer using the registered username. As follows, we
will discuss the workflow of our model and how it operates.
4.4.1. The Framework Description
Generally, the proposed model incorporates several tasks starting from collecting
data, followed by a series of analysis processes ending with assigning the proper labels
to users, as shown in Figure 4.3. Collecting reviews' data is the first step in this work,
which we discussed in Chapter 2. Because we will use the same datasets described
previously, we will move to the next step directly, which comprises the extraction of the
username field from collected data. Commonly, websites do not allow spaces to be used
when creating a user name during the registration or submission of the review. Therefore,
customers may find no alternative to writing concatenated names, making gender
identification tasks more difficult. So, word segmentation appears a suitable solution to
handle this task.

107
Figure 4.3. The experimental framework of the gender identification model
Typically, a username may contain letters, numbers, and special characters.
Additionally, many people prefer to use common substitutions of specific letters in the
word with specific numbers known as the Leet language. The recognition of these
numbers and substituting them with the correct letters is the next task to be achieved.
Afterward, the remaining numbers and/or symbols need to be removed so that after
finishing this step, only alphabetical letters are being maintained.
People names of the same gender converge in groups, and each group shares
morphologies. The forms of affinity vary from the convergence in word structure to parts
of words like prefixes, suffixes, root words, and stems. Searching for match names in the
dataset starts with the input pattern and creates the N-Gram combination, where n
represents the number of characters in the input word. With the continued absence of
matching words, n is decreased by one letter and becomes (n - 1) until finding matching
or reaching a certain threshold; this process is referred to by Dynamic Pruned N-Gram.
Commonly, websites limit the number of characters and symbols that can synthesize
the username, in addition to the practice of some users to ignore some letters, usually the
vowels from the middle of the word.

108

109
From Figure 4.3, we can observe that the process of searching for matching names
is corporate with another task. Handling the misspelling words' problems is the current
task. So, while searching for matchings, we consider the probability of missing characters
With or without intention.
Therefore, the previous tasks' results are a set of nominations for the gender of the
extracted parts of the names associated with specific probabilities. By considering these
results and frequencies of matchings, a final decision on the gender of the user will be
made. Algorithm 4.1 presents the proposed model's mechanism with more details and
clarifies how the different sub-procedures can interact and cooperate to output the final
results.
4.5. Experiments and Results
In order to examine the efficiency of our work, we have tested and evaluated our
model on a real dataset collected from online markets' websites that allow customers to
register and write feedback about products or services. The customer review data and
users' information are available and publicly accessed. Because the implementation
details were presented completely in chapter 2, we will go directly to discuss the dataset
used in the experiment—next; we will explore the achieved results.
4.5.1. Datasets
Notwithstanding the availability of multiple datasets used for gender identification
purposes, there is no dataset containing actual user names with real practice to the best of
our knowledge. Unfortunately, there are no benchmark datasets that can serve our
purpose. Therefore, we have resolved to gather real data from active websites. The
proposed work for gender identification targets the customers' data registered on the
online markets' websites that allow customers to write feedbacks about specific products
or services. To this goal, we have developed a web scraper to collect data from websites
as described in the data-gathering section in chapter 2.

110 Table 4.2. Characteristics of the selected datasets
Dataset Website Product Count
Timespan Review Count Start Date End Date
DS1 Bestbuy 3 Apr.-2019 Sept.-2020 4355 DS2 Amazon 4 May-2018 Sept.-2020 2500 DS3 Dell 1 Nov.-2019 Sept.-2020 2325 DS4 Lenovo 2 Oct.-2018 Sept.-2020 8163
Despite the large volume of data available via the Internet and the ability of the
developed program to collect data easily, experimenting on this amount becomes
impossible, this relay on the nature of the testing process, where the classification process
must be done twice to ensure the validity of the proposed model results. First, raw data
must be classified manually, and then input data to the model to apply the automatic
classification and compare the results with the manual classification. Therefore, we have
set specified criteria for selecting data for participation in the experiment that must be
met. The primary criterion is that the proposed data should involve all cases that the
proposed model can handle. Table 4.2 shows the main characteristics of the selected
datasets from the data collections stated in chapter 2.
4.5.2. Experiment
The first step toward achieving work objectives is to extract the usernames list from
the created datasets; hence, the output comprises four groups of usernames. Next,
performing the necessary preliminary cleaning processes; involves eliminating list items
that contain numbers only, items that have explicitly stated that username is
"Anonymous," or items that contain an aggregation of alphabetical characters less than a
specific threshold. Data segmentation is the next step; for each username, the task is to
identify distinct name parts in the case of customers who registered with full name (e.g.,
name and surname). Consequent processes for gender identification will be applied for

111 each name segment; after that, an evaluation will be done on all name parts together to
make the final decision on the username's gender.
Table 4.3. A sample of usernames and the produced list of names after segmentation
Username (Raw Data)
Name Segments (After Segmentation)
AppleGadgetGuy [Apple, Gadget, Guy] Jangthang [Jang, thang] Floridamarlin63 [Florida, marlin, 63] KingHenry [King, Henry] Jimmyk [Jimmy, k] BruceLee [Bruce, Lee] Rubysss [Ruby, sss] packerboy82 [packer, boy, 82] Sam2019 [Sam, 2019]
Table 4.4. A sample of usernames that have numerical substitution and the equivalent
correct names
Username Substituted Letter Correct Name J0hn O ↔ Zero John
4ndrew A ↔ 4 Andrew Fr4nk A ↔ 4 Frank 9eorge G ↔ 9 George 3llie E ↔ 3 Ellie 5ilvia S ↔ 5 Silvia
7ommy T ↔ 7 Tommy 7ony T ↔ 7 Tony
Enri9ue Q ↔ 9 Enrique
Table 4.3 shows real illustrative examples from our dataset that show the word
segmentation process's impact on the generated output. The gender identification process
begins with receiving the name segment as an input pattern. Start with searches for
numbers to check whether having a suitable substitution or not replacing it with the

112 corresponding letter. Table 4.4 presents examples of data conversion operations that
involve replacing recognized numbers used in the Leet language with the correct letters
considering possible variations. After completing all possible replacements, it is required
to remove all non-alphabetic characters. Therefore, the cleaned segment contains only
letters, so this is the time for applying the n-gram model for generating possible
sequences. Starting with n letters that equal the segment length, it searches for matchings
by incorporating the fuzzy matching technique for handling misspelling issues. Query
results contain candidate names with their similarities, and the model selects only the
most similar to input patterns.
Subsequently, computing the aggregated similarity according to gender and assign
it to the gender with the highest relevance regarding the possible sequences list. If no
matchings were found, the searching process would be repeated with a lower order of n-
gram where n = n - 1 until the input length reaches three characters or find matches—
then computing the probability of part gender and assigning the choice with the highest
probability. Finally, counting the assigned gender for each part and choosing a label with
the highest frequency; finding equal frequencies imposes selecting the highest relevance
if no matches are found, so we are obliged to assign the username gender as Anonymous.
4.5.3. Testing and Evaluation
In order to verify the proposed model, the following procedure has been conducted.
Once the preliminary cleaning task has concluded, we randomly selected a sample of data
from each dataset separately. Subsequently, we have classified the data manually and
assigning the corresponding label for each username of the dataset. After that, we have
applied our model to these samples and get the results. Assigned labels manually were
hiding while experimenting. Next, we have compared the previously assigned labels
manually and those assigned by the model to compute the accuracy. On the other hand,
we have employed the corpus of names as a baseline dataset used for matching names.
The names corpus is publicly available and can be downloaded with the Natural Language
Toolkit package "NLTK," containing 2943 male names and 5001 female names.

113
Figure 4.4. The gender distribution for each dataset in the terms of percentage
Table 4.5. Confusion matrix of the proposed gender classification method on the dataset
in terms of percentage
Dataset Gender Male Female Anonymous Overall Accuracy
DS1 Male 80.0 5.5 14.5
88.6 Female 2.7 87.3 10.0 Anonymous 0.5 1.1 98.4
DS2 Male 78.5 7.9 13.6
83.8 Female 4.8 89.1 6.1 Anonymous 2.9 5.7 91.4
DS3 Male 85.6 4.6 9.7
89.2 Female 2.4 90.7 6.8 Anonymous 3.0 4.0 93.0
DS4 Male 84.2 7.3 8.5
84.2 Female 4.8 83.4 11.7 Anonymous 3.2 11.6 85.3

114
Figure 4.4 shows the gender distribution of our datasets selected samples, on which
we have been applied our model blindly. The experimental results we have obtained have
been presented in Table 4.5 that shows the confusion matrix of the proposed algorithm
for gender identification; it shows the correct classification results for each label in the
diagonal entries (i.e., cells [ii]). On the other hand, the off-diagonal entries indicate wrong
classification results.
We can observe that the number of correct female names classification is more than
the correct classification of male names; we recommend that the reason relies on the
higher number of female names in the baseline dataset. Also, it is remarkable that most
false prediction tends to be anonymous which logically reasonable. Figure 4.5 shows our
model accuracy representing the percentage of correct prediction to the total number of
persons in each gender. Accordingly, we can say that the proposed model's results prove
its capabilities and validity, as evidenced by the classification results' accuracy.
Figure 4.5. The classification accuracy of our model in the terms of percentage

115
4.6. Discussion
In the web personalization literature, various methods have been proposed to analyze
the customers' data, preferences, and sentiments to understand their behavior properly.
Personalization's primary goal is represented in two main objects: realizing satisfying
interaction for customers and vendors; predicting the consumer's needs. Its techniques are
widely utilized by many websites, including search engines and online social networks,
to enhance their capabilities of providing users with the most relevant information to
search queries and preferences. Companies seek to collect and analyze customers' data
for several commercial purposes. The gender of the customers appears as an important
aspect that helps in modeling their behavior. Although online feedback has been
recognized as a significant source for analyzing the market, studies that endeavor to
develop techniques to identify the gender of customers from online reviews automatically
are rarely seen in the literature.
Several approaches have been introduced to infer the gender of the author; most of
them tend to examine written text like tweets, comments, blogs, etc., which mainly rely
on extract features through the use of machine learning techniques, deep learning models.
However, these techniques are not suitable to infer the gender of the author through his
profile data, more specifically the username. Users have been greatly influenced by the
linguistic developments related to the expanding use of online social media, chat rooms,
etc. Several forms of this influence appear in using Leet language, name acronyms, and
other aspects, strengthening the hypothesis of the inappropriateness of the mentioned
techniques for gender identification tasks. Moreover, the volume of text is not enough to
use these techniques.
The study has double implications, theoretical and practical. Theoretically, it is the
first study identifying the gender of the author through the username associated with
online customer feedback to the best of our knowledge. Our study contributes to the
literature on pattern recognition, personalization, and information extraction by
introducing an unconventional approach that can automatically infer the gender of the

116 author from his username. Also, the concept of Leet language still new and is not widely
used, and incorporating reverse substitutions represents a novel approach; Moreover, it
could be incorporated into many other text analytical domains. We conducted
experiments on four datasets collected and derived from active online markets to explore
our proposed method's performance and examine its predictive power to validate our
approach. Besides identifying the gender of the customer from online reviews' data, the
study has practical implications as well. The proposed model has several potential future
business applications; it can be applied to other online networks like Twitter, Instagram,
etc. Also, it could be incorporated with others systems like recommender systems and
user profiling.
4.7. Summary
Gender classification represents a significant task towards modeling user behavior.
In this work, we presented a dynamic pruned n-gram model for recognizing the gender of
the customers from their usernames. We have been utilizing the availability of review
data on online websites and extract the username dataset. Identifying the gender of the
customer through his profile name encounter several challenges that we have stated
clearly. Therefore, our model constitutes several subtasks that cooperate to operate
efficiently, including segmentation, numerical substitution, fuzzy matching, etc. The
results show our work's validity and efficiency for predicting the correct gender using
short data values. As a future direction, we are thinking about applying our model to
datasets from other languages, specifically the Arabic language, and measuring its
validity and effectiveness.

117
5. CHAPTER 5.
RECOMMENDER SYSTEMS
5.1. Introduction
The diversity and abundance of available alternatives of goods and services is a
double-edged sword for both customers and enterprises. From the customers' side, it
provides many options to meet all the different needs of customers, but it adds a heavy
burden on them in choosing the most appropriate option. On the other hand, it imposes
enormous challenges on companies in obtaining a share of the market due to intense
competition and the difficulty of attracting new customers and ensuring the loyalty of
existing customers under the open market system [2, 4].
Customers' opinions represent a significant resource for both customers and
enterprises to extract much information that helps them make the right decision, where
companies resort to analyzing this type of data to get insights into the market trend and
the extent of customer satisfaction with their products and analyze future needs, etc. In
contrast, customers who are about to purchase a new product or obtain a specific service
resort to read customer remarks to evaluate alternatives and choose the most appropriate
alternative [4, 165]. This work is mainly concerned with studying the customer side and
developing a solution for helping them.
Based on the preceding, the need arises for building an intelligent recommender
system that exploits the existing customers' experience to help customers make the
appropriate decision based on their preferences. Practically, it is difficult for customers
to read this large amount of reviews which may take much time and miss many of the
exceptional marketing offers [166].

118
Generally, the problem of finding relevant data while searching the internet
represents a big challenge for web users due to the enormous amounts of available
information on the web. These difficulties are related to the well-known problem of
information overload. Recommender Systems guide users towards the more interesting
or valuable objects in a large area of possible options based on their preferences. It aims
to predict users' intentions and data needs to facilitate and customize their online
experience and help them by providing a list of suggested proper resources. There is a
wide range of recommender systems. Most of them are vary in the base of work (e.g.,
Web content mining, web usage mining, etc.) [3, 5, 150].
This work presents an online product recommendation system called "SmartTips"
built based on analyzing customer reviews utilizing aspect-based sentiment analysis. It
starts with capturing the user preferences using historical review data by extracting aspect
terms and measuring the user sentiments towards each aspect separately. Next, the model
searches the previously rated product sets for similar products to the current user
preferences. Review data are used to rate various products using review text and users'
votes as well. Finally, the recommendation engine generates a list of products that may
be interesting to the user using a ranking scheme that applies a weight reflecting the
relevance of each aspect in accordance with the user preferences.
The organization of this chapter is as follows. This section presents the subjects and
motivations of this work. Next, section 2 briefly discusses recommender systems,
including the definition and basic concepts, development approaches, and popular
applications. In section 3, an exploration of the state-of-the-art techniques for creating
recommender systems. Section 4 presents the proposed model for products
recommendations, providing an explanation of the basic components of our system. In
section 5, an explanation of the conducted experiments that prove the efficiency of our
model is presented, including a description of the used datasets and the metrics used in
order to evaluate our model. Also, an explanation of achieved results with discussion is
presented as well. Finally, section 6 presents a summary of the chapter and reached
conclusions.

119
5.2. Background
This section provides an overview of the recommender systems. It starts with
arguing the basic concepts related to RSs, including the definition, purposes, and the
standard architecture for building RS. Subsequent is a comprehensive discussion of the
existing approaches for creating recommender systems. Also, popular applications of
recommender systems are discussed.
5.2.1. Basic Concepts of RSs
The Internet represents the primary source that users rely on for information
searching and gathering. The volume of information available on the Internet is rapidly
growing due to the ongoing expansion of the World Wide Web and tremendous
applications. So, the information overload problem represents users' biggest challenge
during web searching. This situation occurs when people are flooded with many
information and services options. Therefore, obtaining more "relevant" or "interesting"
information becomes difficult for users.
Recommender systems (RSs) were proposed and developed to alleviate the problem
of information overloading by providing users with a list of recommendations tailored to
their preferences [167]. Therefore, recommender systems could be defined as "a system
that analyzes a user's data and tries to model his behavior in order to generate a list of
ranked objects that could be interesting for a specific user and finally sort these objects
and provide him with the top-ranked items." Based on the above definition, such systems
could be considered a subclass of information filtering systems. Figure 5.1 shows the
basic pipeline to be followed for building a recommender system.
In order to build a recommender system, several data forms could be employed to
accomplish the desired task, including historical data (e.g., purchase history) and
preferences (e.g., the user profile data and settings); also, data of other users may be
employed to compare the current user's behavior to others through measuring the
similarities between distinct users' behaviors.

120
Figure 5.1. General architecture of a recommender system
5.2.2. Methods for Creating RSs
Recently, there has been an increasing interest in developing recommender systems;
integrating a recommendation engine has become essential while building or updating
any web application and mobile application. The most common classification of
approaches for creating a recommender system involves three main categories: Content-
based, Collaborative Filtering, and Hybrid recommender systems. Other researchers
introduced different classifications, including Context-Aware, Group, Multi-Criteria,

121 Cross-Domain, Multi-Stakeholder, Multi-Task [168]. Figure 5.2 shows the hierarchy of
the recommender systems approaches classification. Following, a brief discussion about
these classes.
Figure 5.2. Methods for creating recommender systems
I. Content-based
Content-oriented recommendations are based primarily on creating a profile for each
user and subject as well. The underlying technique is to match the user with the object he
liked (e.g., product, content). In other words, the historical behaviors of the user are used
to make recommendations for him, including implicit or explicit feedback. Comparisons
across users and items are performed to measure their similarities in order to decide which
content is more suitable for the user. Vectorization is the primary step to creating user'
and items' profiles; it converts objects into vectors by producing: Item Vector and User
Vector. These profiles are then used to measure the similarity between objects. There are
several ways to accomplish this task, the most common methods are:

122
Cosine Similarity: Employing this method is recommended when the features are
high-dimensional, specifically in the areas of document clustering, text analysis, ontology
matching, and information retrieval.
Jaccard Similarity: Also known as intersection over union, it is used for object-to-
object likeness. The best employment when the vectors contain binary values, more than
two possible values, the Jaccard affinity does not apply.
II. Collaborative Filtering
Collaborative-oriented recommendations are based primarily on creating the user-
item Utility Matrix. Unlike the content-centric approach, there are no attributes that match
users or subjects. The underlying technique is to learn from the historical transaction
made by users, including explicit feedback like users' ratings on different items or implicit
feedback like transactions history (e.g., purchased, browsing). Therefore, the main
assumption of collaborative filtering is to use similar user behaviors to make
recommendations to a specific user. There are two main subcategories that collaborative
filtering can be divided into:
Memory-based approach: For this approach, the user-item utility matrix is
remembered, and recommendations are made by querying a given user with the rest of
the utility matrix. Such techniques neither require performing dimensionality reduction
nor model fitting. Commonly, these approaches could be divided into two primary
sections: Item-Item filtering and User-User filtering approaches.
Model-driven approach: In this approach, it is not required to remember the utility
matrix. It tries to model the user's behavior from the matrix. Here, reducing the
dimensionality and fitting the model is essential. The most common implementations of
the model-driven approach include the employment of Clustering algorithms, Deep
Learning methods, and Matrix Factorization based algorithms.

123 III. Hybrid Models
A hybrid recommendation system refers to systems that integrate two or more
models that belong to different categories; content-based and collaborative filtering
approaches. Therefore, it could be considered a special type of recommender system. The
primary goal of developing these combinations is to overcome the shortcoming of using
participating approaches separately and increase their efficiency. Several
implementations of hybrid recommender systems were introduced; one of them uses two
selected approaches separately and then combines the predictions. The most common
combinations are introduced by Robin Burke that include seven models: Weighted,
Switching, Mixed, Feature Combination, Feature Augmentation, Cascade, and Meta-
Level [169].
5.2.3. Applications of RSs
Recently, recommender systems have been applied in several domains to facilitate
access to desired information or assist users' making the most suitable decision; the
mentioned domains include online streaming, e-commerce, social networks, education,
etc. Actually, the applications of recommender systems in e-commerce have acquired the
largest share of contributions. The widespread of such applications is due to their
economic nature and the importance they represent for enterprises and customers as well.
Also, the advent of mobile technologies plays a significant role. The recommendation
engine is becoming an integral part of the web and mobile applications; most of these
applications are built using machine learning techniques [166]. Several examples of
recommender systems in this field include:
• Online-contents Recommendations: Offering new content to enhance user
engagement to the website. The goal is to introduce users to new content that may
attract their interest and motivate them to consume more content; online content
may include movies, books, news, etc.
124 • Stocks Recommendations: Present the most profitable stocks to customers. The
novelty does not matter, where the list of recommendations may include early used
promotions by the user; the importance relies on the return on equity.
• Products Recommendations: Recommend a combination of products, including
previously consumed and new products. For the first class of products, the history
of users' transactions serves as a reminder of their frequent purchases. On the other
hand, new products may be suggested according to similar users' behavior.
• Conversational Recommender Systems (CRSs): It is a tool that tries to help the
user determine which products he is going to buy by conversational mechanism.
This agent can mimic a natural conversation between client and professional sales
support to arouse customer preference.
5.3. Related Works
Recently, the development of recommender systems has become more interactive
and draws increasing interest and attracts researchers from various scientific disciplines
[165, 166, 168, 170]. The availability of a massive volume of review data encourages
researchers to develop models that are based on text analysis. Aspect-based sentiment
analysis appears a promising approach for measuring the users' sentiment about specific
aspects. Therefore, the development of such systems strives to capture users' preferences
from their historical feedback. The primary goal is to provide users with a list of items
(e.g., products, service providers) that may be interesting. Following, a brief review of
the recent approaches for developing recommender systems based on the text analysis.
Concerning the product recommendation models, Lin Qiu et al. [167] have
introduced online review texts and rating integration. The proposed Aspect-based Latent
Factor Model (ALFM) starts with grouping review texts by users and similarly by
different items and calculating word frequencies to build a user-review matrix and item-
attribute matrix, respectively. It also considers the polarity scores and item-word
frequencies of corresponding words. Subsequently, the item latent factors with word

125 latent factors and user latent factors can be derived from the built matrices. The proposed
model acts well in the cross-domain task in addition to the rating prediction task through
transferring word embedding. Authors [171] have introduced a computational model for
online products recommendations. The proposed conversational recommender system
incorporates the functional requirements of the product for interactions with users—the
working mechanism is based on collecting information from the client by asking
questions. The model integrates both the ontology and structure in generating the
interactions. The developed system is able to handle multi-function and multi-feature
products domains. Also, Aminu Da'u et al. [172] have introduced the integration of
aspect-based sentiment analysis on generating recommendations. The proposed work
incorporates the deep learning technique to extract aspects from review data.
Additionally, the system generates aspect-oriented ratings through computing the
sentiment polarities. Finally, the generated ratings are integrated into a tensor
factorization machine in order to compute the overall rating predictions. Similarly,
authors in [173] have proposed a collaborative filtering recommendation model that is
based on using aspect-based sentiment analysis. The model incorporates using the
multichannel deep convolutional neural network on extracting product aspect terms from
the review text and then using a weighting scheme in order to rate various aspects and
generate aspects rating matrix. Various aspects' ratings are then integrated to compute the
general product rate. Furthermore, authors in [174] proposed a collaborative filtering
recommender system that utilizes the neural network-based text representation in order
to measure similarities between review texts. Seven model combinations were introduced,
including lexical-based and machine learning based approaches to compute the users' text
similarity; the Long Short Term Memory (LSTM) based model has achieved the best
performance results.
On the other hand, Elham Asani et al. [175] introduced a restaurants recommender
system that analyzes users' feedback and extracts foods preferences to generate
recommendations based on extracted preferences. The proposed model extracts food
names from comments and then clusters them; the sentiment analysis is applied to

126 measure polarity towards various food names. Restaurants' recommendations are made
based on similarities between user preferences and restaurants ratings.
Concerning the hotel's recommendations, Biswarup Ray et al. [176] introduce a hotel
recommender system based on sentiment analysis and aspect-based categorization
techniques. They also introduced a collected dataset from Tripadvisor.com that involves
online hotel reviews. The proposed ensemble starts with creating word embedding of the
clients' review text using the Bidirectional Encoder Representations from Transformers
(BERT) model. After that, a weight assigning protocol was applied that merged with three
phases for neutral-negative, positive-negative, neutral-positive sentiments. Finally,
recommendations were generated by grouping the reviews into different classes by
measuring their similarities using cosine similarity and fuzzy logic.
5.4. The Proposed System for Product Recommendations
This section presents details of our proposed system, "SmartTips," which exploits
the aspect term extraction model introduced in chapter 3 for building the recommender
system. Generally, the proposed system consists of three different components: (1) Rating
Products, (2) Extracting Preferences, and (3) Generating Recommendations. Figure 5.3
shows the proposed recommender system workflow that shows the interaction between
different components. Following, a description of these tasks in detail.
5.4.1. Rating Products
The primary task of the proposed recommender system is rating products, which
have built primarily on the aspect term extraction model introduced in chapter 3.
Generally, the proposed model for rating products considers the following information:
review text, aspect term frequency, sentiment words, and their polarities where the
number of positive or negative sentiment words towards each aspect term were
considered, readers' vote on each review containing one or more aspect terms. Also, we
consider only reviews from actual practice by accepting reviews submitted by customers
with verified purchases.

127
Figure 5.3. The overall scheme of the proposed recommender system
The inputs to this task are the reviews data, including the review text itself and meta-
data, specifically the readers' votes. We believe that positive readers' votes are a
significant indicator of the relevance and confidence of the review's assumptions;
conversely, negative votes represent a justification of distrust of the customer's
assumptions. The model starts with applying the aspect term extraction model on the
review text—next, the extraction of opinion words associated with aspect terms from each
review, respectively. The dependency relations extracted through applying the
dependency parser with the help of POS tags is the more suitable method for extracting
the opinion words. Subsequently, measuring the polarity of these words using the lexical-

128 based technique to rate the extracted aspects. Algorithm 5.1 presents the technique
followed for computing the sentiment score for each aspect related to a specific product
in the dataset.

129
In general, the rating of various aspects related to a particular product can be done
by calculating the sentiment score "SScore," which is primarily based on the derivation
of two leading indicators: the positivity score "PScore" and the negativity score "NScore,"
which can be obtained using the following equations.
𝑃𝑆𝑐𝑜𝑟𝑒(𝑎) = {
∑𝑝𝑟𝑖
𝑘
𝑖=1
+ 𝑣𝑟𝑖+ − 𝑣𝑟𝑖
− 𝑖𝑓 𝑝𝑟𝑖 > 0,
0 𝑖𝑓 𝑝𝑟𝑖 = 0,
(5.1)
where 𝑝𝑟𝑖 refers to the number of positive words associated with the aspect "a" in the ith
review; and 𝑣𝑟𝑖+, 𝑣𝑟𝑖
− refers to the number of positive and negative readers' votes,
respectively.
𝑁𝑆𝑐𝑜𝑟𝑒(𝑎) = {
∑𝑛𝑟𝑖
𝑘
𝑖=1
+ 𝑣𝑟𝑖+ − 𝑣𝑟𝑖
− 𝑖𝑓 𝑛𝑟𝑖 > 0,
0 𝑖𝑓 𝑛𝑟𝑖 = 0,
(5.2)
where 𝑛𝑟𝑖 refers to the number of negative words associated with the aspect "a" in the ith
review; and 𝑣𝑟𝑖+, 𝑣𝑟𝑖
− refers to the number of positive and negative readers' votes,
respectively.
𝑆𝑆𝑐𝑜𝑟𝑒(𝑎) =
𝑃𝑆𝑐𝑜𝑟𝑒(𝑎) − 𝑁𝑆𝑐𝑜𝑟𝑒(𝑎)
𝑃𝑎 +𝑁𝑎, (5.3)
where 𝑃𝑎, 𝑁𝑎 refers to the total number of positive and negative words, respectively,
associated with the aspect "a" in all review data.
5.4.2. Extracting Preferences
Commonly, capturing the user preferences could be accomplished using two main
methods; the first is interactive method "conversational system" by using web agent that
makes a dialog with customers in the form of questions and answers and then extracts

130 preferences from the user answering. The second method for extracting the user's
preferences, which is followed in this work, could be implemented by collecting all
reviews made by the same user and then extracting features from the text "Preferences."
Therefore, the first step in this task is to extract aspect terms to identify the mentioned
features by the user. The next is to compute the positivity and the negativity scores as
mentioned in Eq. 5.1 and Eq. 5.2, respectively, with ignoring the readers' votes since the
primary goal is to capture personal preferences only, where 𝑣𝑟𝑖+, 𝑣𝑟𝑖
− are considered equals
zero. Similarly, computing the sentiment score becomes straightforward according to Eq.
5.3. Accordingly, the list of extracted aspects and their computed sentiment scores are
entered into the recommendations engine in order to generate the appropriate list of
candidate products.
5.4.3. Generating Recommendations
Given a list of rated products and a list of user preferences created by the first and
second components in our system, respectively, the generation of recommendations is
becoming straightforward. Product ratings consist of aspects and the associated computed
sentiment scores. Therefore, the first step is to search the rated products and find items
that have aspects included in the user's preferences list, generating a candidate products
list. The following step is rating each product in the candidate list using the following
equation, where the assigned weight is the sentiment score of the equivalent user
preference "Personalized Rate," using the customer preferences exclusively.
𝑅𝑎𝑡𝑒(𝑡𝑙) = ∑𝑎𝑖|𝑤𝑖|
𝑚
𝑖=1
, (5.4)
where 𝑎𝑖 refers to the ith aspect, and 𝑤𝑖 refers to the associated weight with the given
aspect of the lth item "t".
Similarly, rating different products in the candidate list, but this time including all
mentioned aspects in each product regardless the existence in the customer preferences

131 "General Rate," here we have used equivalent weights equal one. Finally, the candidate
product list was sorted by the personalized and general rates, respectively, and the top
items were recommended to the user.
5.5. Experiments and Results
In this work, we proposed integrating aspect-based sentiment analysis into a
collaborative filtering-based recommender system to improve the system performance
and precision of the predictions. Therefore, to validate the effectiveness of the proposed
model, we conducted a series of experiments. We have tested and evaluated it against
several available and publicly accessed datasets. The following is a description of the
datasets used in the experiment. Next is a review of the evaluation metrics and
benchmarks used in our experiment—finally, a discussion of the achieved results.
5.5.1. Datasets
We evaluate our Aspect-based sentiment analysis models on a dataset that contains
ratings and review texts. The experiments were conducted using a benchmark dataset that
researchers widely use to compare with baseline models collected from the Amazon
website by Julian McAuley and Jure Leskovec (2013) [165]. The data span a period of
18 years starting from June 1995 up to March 2013, including over 34 million reviews
divided into 28 domains according to the item category, including cell phones,
electronics, etc. We have selected five categories for experimenting. Table 5.1 shows a
summary of selected data.
Table 5.1. A summary of the selected dataset
Dataset #Users #Items #Reviews
Automotive 133254 47539 188387 Cell Phone and Accessories 68039 7335 76653 Electronics 811032 80613 1189549 Movies and TV 1224266 207532 6797757 Video Games 228516 20335 364484

132
5.5.2. Testing and Evaluation Metrics
A. Evaluation Metrics
We have evaluated our model and compared it with the baseline models using mean-
squared error (MSE). MSE is a metric used to measure the average of the squares of errors
between the actual and predicted values; in our case, values are the ratings. Therefore, a
lower value of MSE indicates a better performance of a model. Formally, given a test set
of N reviews, where actual ratings are {𝑟1, . . . , 𝑟𝑛}, and the corresponding predicted
ratings are {𝑟1̂ , . . . , 𝑟�̂�}, the mean squared errors is defined by the following equation:
𝑀𝑆𝐸 =
1
𝑁∑(𝑟𝑛 − 𝑟�̂�)
2
𝑁
𝑛=1
(5.5)
While our model generates ratings that consist of real numbers, actual user ratings
consist of discrete values ranging from one to five. Therefore, converting the generated
rates by our model into integer values is mandatory to evaluate our model properly. We
have used the equal-width discretization approach, which separates all possible values
into N number of bins, each having the same width; in order to accomplish this task, we
have used the following equation:
𝑊 =
1
𝑁 (𝑀𝑎𝑥 −𝑀𝑖𝑛), (5.6)
where N is the number of bins or intervals, Max and Min are the maximum and minimum
ratings values, respectively.
B. Baseline Methods
For better evaluation of our model "SmartTips" in terms of rating prediction, a
comparison of our model against multiple baselines was made, including the following
models:

133 • Matrix Factorization (MF) [177]: Represents one of the most common
collaborative filtering recommender systems, classified as a model-based
approach. Typically, matrix factorization uses a rating matrix that characterizes
both items and users as input for rating prediction by estimating two low-ranked
matrices.
• SVD++ [178]: This is one of the Latent factor-based models; SVD++ is an
extension of the original Singular Value Decomposition model (SVD) that exploits
the existence of both implicit and explicit feedback in order to improve the
collaborative filtering-based recommendations performance.
• ALFM-P [167]: Aspect-based Latent Factor Model (ALFM) employs item-
property matrix made of word frequency to integrate ratings and review texts via
latent factor model.
• REAO [172]: Recommender system Exploiting Opinion mining (REAO) which
consists of two major parts: aspect-based opinion mining (ABOM) that employs a
deep CNN model for aspect extraction with the help of LDA technique to transform
the extracted aspect terms into latent factors. The second is rating prediction, which
computes the aspect-based ratings, forming a set of rating matrices that match a
particular aspect.
5.5.3. Result Analysis and Discussion
Table 5.2 shows the performance analysis of our model with various baseline
models. We report the mean squared errors for every selected domain of the dataset based
on the authors' published results; we emphasized the best performance using the bold
font; in the case of no results available related to the related domain, a cell was filled with
a dash. Obviously, the SmartTips outperforms all baselines, except in the Video Game
domain where the ALFM-P model provides slightly better performance while our model
achieved MSE of 0.515 and the ALFM-P achieved MSE of 0.505. The average of the
achieved MSE results is sufficient to justify our analysis. We can observe that the MF

134 and SVD++ models provide a moderate performance compared with the ALFM-P and
REAO models, which act better.
On the other hand, the proposed model guarantees to generate recommendations
even if the user has no historical data "New User," known as a Cold Start Problem; since
our model examines the review text, which has sufficient information for capturing user
preferences. Generally, the worst case when the user provides a short review includes a
small number of aspect terms, or with an aspect-free review, our model will recommend
highly rated products based on other users' feedback regardless of the current user
preferences using the General Rate factor.
Table 5.2. Comparisons results of the proposed SmartTips model in terms of the rating
predictions with the baseline models
Dataset MF SVD++ ALFM-P REAO SmartTips
Automotive 1.715 1.439 0.565 0.663 0.473 Cell Phone and Accessories 2.323 2.112 0.364 - 0.330 Electronics 1.968 1.661 0.396 - 0.313 Movies and TV 0.627 0.544 0.412 - 0.393 Video Games 1.837 1.495 0.505 1.055 0.515 Average 1.694 1.450 0.448 0.859 0.405
5.6. Summary
Online customers' opinions represent a significant resource for both customers and
enterprises to extract much information that helps them make the right decision. Finding
relevant data while searching the internet represents a big challenge for web users, known
as the "Problem of Information Overload." Recommender systems have been recognized
as a promising way of solving such problems.
This chapter proposes a products recommendation system, "SmartTips," built on
aspect-based sentiment analysis. The proposed model exploits customer feedback and
applies the aspect term extraction model to rate various products. Several factors were

135 considered, including readers' votes, aspect term frequency, opinion words frequency,
etc. We have examined the review text and meta-data as well.
On the other hand, a similar scenario has been proposed to capture user preferences
for generating a recommendation for a specific user. User's sentiments towards specific
aspects are used to weigh aspects in candidate products to reflect the relevance of eache
one and match user preferences appropriately.
We have conducted extensive experiments to ensure our models' validity for
implementation and to verify their effectiveness, and the results show that all the proposed
models' acting well. In order to assure its efficiency, we have tested our model on the
Amazon dataset that is widely used by researchers and compared it against the baseline
methods, and results show that our model outperforms them in terms of the mean squared
errors of the generated predictions.

136
6. CONCLUSION
The primary purpose of this work is to develop more reliable domain-specific text
analysis techniques for big data, taking into account the main characteristics of big data
affecting the performance of traditional methods. Following, a presentation of the main
findings and the most significant results of the research work that examine the
performance of the developed techniques with software implementation on real datasets.
The significance of contributions has been proved by the algorithmic implementation's
results, namely:
• A comprehensive literature survey of the current natural language text
preprocessing techniques was prepared to study their effect on performing aspect-
based sentiment analysis.
Standard tasks used in preparing natural language text were studied, including
tokenization, segmentation, stop words removal, lemmatization, stemming, and
part-of-speech tagging, considering their effect on the raw data and application
domains.
• An algorithm for textual data preprocessing was developed and implemented.
Several methods were examined to select the most suitable to apply the ABSA
task. Towards building a pipeline for NLP preprocessing, several combinations
were implemented to investigate mutual effects on their performance, the most
efficient serialization of preprocessing tasks has been proposed. Also, layered and
recurrent data cleaning and filtering approaches were introduced to preserve the
original data's context.

137 • An algorithm for aspect-term extraction has been introduced that is based on
machine and deep learning techniques.
The proposed data-driven approach strives to extract the prominent aspect-terms
from customers' reviews text. Word embedding technique that uses a neural
network model were employed to convert prepared data to vectors. The SOM's
has been employed for reducing the dimensionality of the generated vectors. On
the other hand, the K-means++ clustering algorithm has been applied to extract
the most prominent aspects. The proposed algorithm has the ability to extract
singular aspect terms and aspect phrases as well.
• An algorithm for customer gender identification has been introduced by
examining the customer's username.
This work adopts a dictionary-based approach that aims to recognize the user
gender using a corpus of names. The proposed dynamic pruned n-gram model
employs a dynamic search with the help of the fuzzy-matching technique to find
names that share the same morphological stem. The data preparation process
incorporates several tasks to handle the common behavior of username syntheses,
like using Leet language, acronyms, and adjacent names.
• An algorithm for online products recommendation has been introduced based on
aspect-based sentiment analysis.
The proposed model examines the customers' preferences and returns a list of
recommended products. Based on historical review data, the developed
framework provides sentiment analysis statistics of the given criteria. A weighting
scheme has been introduced for ranking the recommended items.
Given the preceding, all the proposed algorithms have been tested and their
applicability verified by implementing an experimental environment.

138
The results obtained from implementing the developed algorithms are of practical
importance and can be used in different analyzing tasks of natural language text,
specifically in social media and e-marketing.
The proposed techniques have good prospects for prospective development,
including adjusting the GI algorithm to handle other languages, like Arabic. Also,
integrating additional elements besides username may be helpful, like the author's text.
On the other hand, handling text abbreviations like those used in chatting and text
messages during the process of data preprocessing represents another perspective.
Furthermore, incorporating the proposed recommendation model into a conversational-
based recommender system represents a promising prospect for development.

139
7. LIST OF ACRONYMS
ABSA : Aspect Based Sentiment Analysis
ATE : Aspect Term Extraction
BD : Big Data
BDA : Big Data Analytics
BERT : Bidirectional Encoder Representations from Transformers
BI : Business Intelligence
Bi-LSTM : Bi-directional Long Short Term Memory
CBOW : Continuous Bag of Words
CF : Collaborative Filtering
CNNs : Convolutional Neural Networks
CRF : Conditional Random Field
CRSs : Conversational Recommender Systems
DL : Deep Learning
GI : Gender Identification
GloVe : Global Vectors for Word Representation
HDFS : Hadoop Distributed File System
IoT : Internet of Things
IR : Information Retrieval
LSTM : Long Short Term Memory
MF : Matrix Factorization
MFE : Multi-Feature Embedding
ML : Machine Learning
NLP : Natural Language Processing
NLTK : Natural Language Toolkit
PCA : Principal Component Analysis

140 POS : Part of Speech
RNNs : Recurrent Neural Networks
RS : Recommender System
SA : Sentiment Analysis
SOM : Self-Organizing Maps
SVD : Singular Value Decomposition
TF-IDF : Term Frequency-Inverse Document Frequency
t-SNE : t-Distributed Stochastic Neighbor Embedding

141
8. LIST OF TABLES
Table 1.1. The most popular applications of big data analytics ...................................... 26
Table 2.1. A sample of part-of-speech tags and their meaning ...................................... 42
Table 2.2. The main characteristics of the collected datasets ......................................... 61
Table 2.3. The effect of separating reviews on the sentence tokenization process ........ 63
Table 2.4. The main linguistic characteristics of datasets ............................................... 64
Table 2.5. A sample of misspelled words and the corresponding correct form with an
illustration of the type and number of required edits ...................................................... 65
Table 2.6. A sample of misspelled words and the resulting parts after segmentation .... 66
Table 2.7. The percentage of the misspelled vocabularies to the total number of
vocabularies in each dataset and correction ratio ............................................................ 66
Table 2.8. An illustrative example of how each case of pos tagging is evaluated from the
perspective of nouns and adjectives ................................................................................ 67
Table 3.1. The main characteristics of the SemEval-14 datasets .................................... 86
Table 3.2. The results of applying different aspect term extraction models on the
SemEval-14 datasets, using the K value equal to 150 with the Laptops dataset and 200
with the restaurants' dataset ............................................................................................. 93
Table 3.3. Comparison of F-score results of baseline methods for SemEval-14 ............ 95
Table 4.1. The most common letters that have numerical substitutions ....................... 103
Table 4.2. Characteristics of the selected datasets ........................................................ 110
Table 4.3. A sample of usernames and the produced list of names after segmentation 111
Table 4.4. A sample of usernames that have numerical substitution and the equivalent
correct names ................................................................................................................. 111
Table 4.5. Confusion matrix of the proposed gender classification method on the dataset
in terms of percentage ................................................................................................... 113
Table 5.1. A summary of the selected dataset ............................................................... 131

142 Table 5.2. Comparisons results of the proposed SmartTips model in terms of the rating
predictions with the baseline models ............................................................................ 134

143
9. LIST OF FIGURES
Figure 1.1. Big data characteristics ................................................................................. 20
Figure 1.2. Evaluation criteria to build a big data solution ............................................. 26
Figure 1.3. Aspect-based sentiment analysis subtasks .................................................... 32
Figure 2.1. The hierarchy of the most popular tokenization techniques ......................... 38
Figure 2.2. An illustrative example of two lexical entries for separate lemmas which share
the same spelling but have a different part of speech and gloss information ................. 40
Figure 2.3. Part-of-Speech tagging example ................................................................... 43
Figure 2.4. Text processing work flow ........................................................................... 50
Figure 2.5. Misspelling detection and correction workflow ........................................... 57
Figure 2.6. Sample of the original review data ............................................................... 62
Figure 2.7. The proportion of data size after applying the consecutive data preparation
steps ................................................................................................................................. 65
Figure 2.8. F-score performance of the POS tagging results with different order of
preprocessing steps for Noun tags ................................................................................... 68
Figure 2.9. F-score performance of the POS tagging results with different order of
preprocessing steps for Adjective tags ............................................................................ 69
Figure 3.1. Classification of aspect term extraction techniques ..................................... 73
Figure 3.2. The experimental framework of the proposed aspect term extraction model
......................................................................................................................................... 84
Figure 3.3. A sample of the laptop's trial dataset shows an annotated sentence using the
XML tags ......................................................................................................................... 86
Figure 3.4. The effect of K value on the experimental results in terms of percentage of the
precision .......................................................................................................................... 91
Figure 3.5. The comparison between the achieved results from applying proposed models
variants on different datasets, where K = 150 ................................................................. 92

144 Figure 3.6. Comparison of various model combinations in terms of F-score results ..... 94
Figure 3.7. Comparisons of F-score between the baseline methods and our model for the
SemEval-14 datasets........................................................................................................ 94
Figure 4.1. An illustration of using the N-gram model for synthesizing the search patterns
....................................................................................................................................... 104
Figure 4.2. An example of computing the edit distance between string1 and string2 using
a matrix .......................................................................................................................... 106
Figure 4.3. The experimental framework of the gender identification model .............. 107
Figure 4.4. The gender distribution for each dataset in the terms of percentage .......... 113
Figure 4.5. The classification accuracy of our model in the terms of percentage ........ 114
Figure 5.1. General architecture of a recommender system ......................................... 120
Figure 5.2. Methods for creating recommender systems .............................................. 121
Figure 5.3. The overall scheme of the proposed recommender system ........................ 127

145
10. ACKNOWLEDGMENTS
First and foremost, praises and thanks to ALLAH, the Almighty, for His showers of
blessings throughout my research work to complete the research successfully.
In the beginning, I would like to express my thankfulness to my advisor, Prof. Boris
A. Novikov, for the continuous assistance of my Ph.D. thesis and related research, for his
dedication, inspiration, and tremendous expertise. His encouragement has guided me to
write this thesis during my research. Also, I would like to thank my advisor, Prof. Tatiana
M. Kosovskaya, the head of the Department of Informatics, for her help, advice, insightful
comments, and encouragement.
I also would like to express sincere gratitude to my former supervisors, Prof. Hesham
A. Hefny and Assoc. Prof. Ahmed M. Gadallah, at the Department of Computer Sciences,
Cairo University, for introducing me to pattern recognition and web mining in order to
deeply understand related research challenges.
This research would not have been possible without the support and a grant [EGY-
6428/17] from both the General Administration of Missions - Ministry of Higher
Education of Egypt and the Russian government.
I am thankful to Saint Petersburg State University for its kind hospitality during a
stay at the Department of Informatics, where this work originated. I would like to thank
all staff members for their kind assistance and for educating me with numerous theoretical
courses to enhance my background.
I would like to express my deep thank to all staff members at the Department of
Information Technology & Systems at Port Said University, Egypt, for their kind support.
Last but not least, I would like to thank my family for supporting me spiritually
throughout writing this thesis and my life in general.

146
11. REFERENCES
1. Ali N. M., Novikov B. A. Big Data: Analytical Solutions, Research Challengesand Trends // Proceedings of the Institute for System Programming of the RussianAcademy of Sciences. ‒ 2020. ‒ Vol. 32, No. 1. ‒ P. 181-204. ‒ DOI:10.15514/ISPRAS-2020-32(1)-10.
2. Ali N. M. Aspect-Oriented Analytics of Big Data // The 14th International BalticConference on Databases and Information Systems (Baltic DB&IS 2020) / Ed.Matulevičius R. et al. ‒ Vol. 2620: CEUR Workshop Proceedings ‒ Tallinn,Estonia: CEUR-WS.org, 2020. ‒ P. 41-48.
3. Ali N. M., Gadallah A. M., Hefny H. A., Novikov B. An Integrated Frameworkfor Web Data Preprocessing Towards Modeling User Behavior // 2020International Multi-Conference on Industrial Engineering and ModernTechnologies (FarEastCon) ‒ Vladivostok, Russia: IEEE, 2020. ‒ P. 1-8. ‒ DOI:10.1109/FarEastCon50210.2020.9271467.
4. Ali N. M., Novikov B. A Multi-Source Big Data Framework for Capturing andAnalyzing Customer Feedback // 2021 IEEE Conference of Russian YoungResearchers in Electrical and Electronic Engineering (ElConRus) / Ed.Shaposhnikov S. ‒ Moscow and St. Petersburg, Russia: IEEE, 2021. ‒ P. 185-190.‒ DOI: 10.1109/ElConRus51938.2021.9396606.
5. Ali N. M., Gadallah A. M., Hefny H. A., Novikov B. A. Online Web NavigationAssistant // Vestnik Udmurtskogo Universiteta. Matematika. Mekhanika.Komp'yuternye Nauki. ‒ 2021. ‒ Vol. 31, No. 1. ‒ P. 116-131. ‒ DOI:10.35634/vm210109.
6. Ghani N. A., Hamid S., Hashem I. A. T., Ahmed E. Social Media Big DataAnalytics: A Survey // Computers in Human Behavior. ‒ 2019. ‒ Vol. 101. ‒ P.417-428. ‒ DOI: 10.1016/j.chb.2018.08.039.
7. Emani C. K., Cullot N., Nicolle C. Understandable Big Data: A survey //Computer Science Review. ‒ 2015. ‒ Vol. 17. ‒ P. 70-81. ‒ DOI:10.1016/j.cosrev.2015.05.002.
8. Stieglitz S., Mirbabaie M., Ross B., Neuberger C. Social Media Analytics –Challenges in Topic Discovery, Data Collection, and Data Preparation //International Journal of Information Management. ‒ 2018. ‒ Vol. 39. ‒ P. 156-168.

147 9. Tsai C. W., Lai C. F., Chao H. C., Vasilakos A. V. Big Data Analytics: A Survey
// Journal of Big Data. ‒ 2015. ‒ Vol. 2, No. 21. ‒ P. 1-32. ‒ DOI: 10.1186/s40537-015-0030-3.
10. Yadav K., Rautaray S. S., Pandey M. A Prototype for Sentiment Analysis Using Big Data Tools // Book A Prototype for Sentiment Analysis Using Big Data Tools / Editor. ‒ Singapore: Springer, 2017. ‒ P. 103–117. ‒ DOI: 10.1007/978-981-10-6427-2_9.
11. Eckroth J. A Course on Big Data Analytics // Journal of Parallel and Distributed Computing. ‒ 2018. ‒ Vol. 118, No. 1. ‒ P. 166-176. ‒ DOI: 10.1016/j.jpdc.2018.02.019.
12. Smirnova E., Ivanescu A., Bai J., Crainiceanu C. M. A Practical Guide to Big Data // Statistics & Probability Letters. ‒ 2018. ‒ Vol. 136. ‒ P. 25-29. ‒ DOI: 10.1016/j.spl.2018.02.014.
13. Siddiqa A., TargioHashem I. A., Yaqoob I., Marjani M., Shamshirband S., Gani A., Nasaruddin F. A Survey of Big Data Management: Taxonomy and State-of-the-Art // Journal of Network and Computer Applications. ‒ 2016. ‒ Vol. 71. ‒ P. 151-166. ‒ DOI: 10.1016/j.jnca.2016.04.008.
14. Soufi A. M., El-Aziz A. A. A., Hefny H. A. A Survey on Big Data and Knowledge Acquisition Techniques // IPASJ International Journal of Computer Science (IIJCS). ‒ 2018. ‒ Vol. 06, No. 07. ‒ P. 15–29.
15. Halevi G., Moed H. F. The Evolution of Big Data as a Research and Scientific Topic: Overview of the Literature // Research Trends: Special Issue on Big Data. ‒ 2012. No. 30. ‒ P. 3-6.
16. Manyika J., Chui M., Brown B., Bughin J., Dobbs R., Roxburgh C., Byers A. H. Big Data: The Next Frontier for Innovation, Comptetition, and Productivity // McKinsey Global Institute. ‒ 2011.
17. Gartner I. Gartner Glossary : Big Data. ‒ 2019. ‒ URL: https://www.gartner.com/en/information-technology/glossary/big-data (Date Accessed: 14.10.2019).
18. Loshin D. Chapter 1 - Market and Business Drivers for Big Data Analytics // Big Data Analytics / Loshin D. ‒ Boston: Morgan Kaufmann, 2013. ‒ P. 1-9. ‒ DOI: 10.1016/B978-0-12-417319-4.00001-6.
19. Krishnan K. Chapter 1 - Introduction to Big Data // Data Warehousing in the Age of Big Data / Krishnan K. ‒ Boston: Morgan Kaufmann, 2013. ‒ P. 3-14. ‒ DOI: 10.1016/B978-0-12-405891-0.00001-5.

148 20. Ethics of Big Data: Balancing Risk and Innovation. / Davis K., Patterson D. ‒ 1
ed.: O’Reilly Media, Inc., 2012. ‒ Vol. 1.
21. Understanding Big Data: Analytics for Enterprise Class Hadoop and Streaming Data. / Zikopoulos P. C., Eaton C., deRoos D., Deutsch T., Lapis G. ‒ 1st ed.: McGraw-Hill Osborne Media, 2012. ‒ 176 P.
22. Owais S. S., Hussein N. S. Extract Five Categories CPIVW from the 9V’s Characteristics of the Big Data // International Journal of Advanced Computer Science and Applications (IJACSA). ‒ 2016. ‒ Vol. 7, No. 3. ‒ P. 254-258.
23. Laney D. 3D Data Management: Controlling Data Volume, Velocity and Variety // Application Delivery Strategies, META Group Research Note. ‒ 2001.
24. Digital 2019: Internet Trends in Q3 2019 / Hootsuite & We Are Social. ‒: Kepios, 2019. ‒ 06-11.
25. Kemp S. Digital Ttrends 2019: Every Single Stat You Need to know About the Internet. ‒ 2019. ‒ URL: https://thenextweb.com/contributors/2019/01/30/digital-trends-2019-every-single-stat-you-need-to-know-about-the-internet/ (Date Accessed: 06-11.2019).
26. The Digitization of the World: From Edge to Core [White paper]. ‒ Framingham, MA, USA: Corporation I. D., 2018. ‒ 28 p. ‒ US44413318.
27. Hale J. L. More Than 500 Hours of Content Are Now Being Uploaded to YouTube Every Minute. ‒ 2019. ‒ URL: https://www.tubefilter.com/2019/05/07/number-hours-video-uploaded-to-youtube-per-minute/ (Date Accessed: 07-11.2019).
28. The Twitter Engagement Report 2018. ‒: Solutions M., 2018. ‒ 33 p.
29. Wiener J., Bronson N. Facebook’s Top Open Data Problems. ‒ 2014. ‒ URL: https://research.fb.com/blog/2014/10/facebook-s-top-open-data-problems/ (Date Accessed: 07-11.2019).
30. Torrecilla J. L., Romob J. Data Learning From Big Data // Statistics and Probability Letters. ‒ 2018. ‒ Vol. 136. ‒ P. 15-19. ‒ DOI: 10.1016/j.spl.2018.02.038.
31. Osman A. M. S. A Novel Big Data Analytics Framework for Smart Cities // Future Generation Computer Systems. ‒ 2019. ‒ Vol. 91. ‒ P. 620-633. ‒ DOI: 10.1016/j.future.2018.06.046.
32. Gandomi A., Haider M. Beyond the Hype: Big Data Concepts, Methods, and Analytics // International Journal of Information Management. ‒ 2015. ‒ Vol. 35, No. 2. ‒ P. 137-144. ‒ DOI: 10.1016/j.ijinfomgt.2014.10.007.

149 33. Russom P. Big Data Analytics // TDWI Best Practices Report, Fourth Quarter. ‒
2011.
34. Jha A., Dave M., Madan S. A Review on the Study and Analysis of Big Data Using Data Mining Techniques // International Journal of Latest Trends in Engineering and Technology (IJLTET). ‒ 2016. ‒ Vol. 6, No. 3. ‒ P. 94-102.
35. Elgendy N., Elragal A. Big Data Analytics: A Literature Review Paper. ‒ Vol. 8557: Advances in Data Mining. Applications and Theoretical Aspects ‒ Cham: Springer International Publishing, 2014. ‒ P. 214-227.
36. Principles of Big Data: Preparing, Sharing, and Analyzing Complex Information. / Berman J. J.: Elsevier, 2013. ‒ 288 P.
37. Analytics of Textual Big Data: Text Exploration of the Big Untapped Data Source / Independent Business Intelligence Analyst R20: Consultancy. ‒: InterSystems, 2013. ‒ 9 p.
38. Shim J. P., French A. M., Guo C., Jablonski J. Big Data and Analytics: Issues, Solutions, and ROI // Communications of the Association for Information Systems (CAIS). ‒ 2015. ‒ Vol. 37. ‒ P. 797-810. ‒ DOI: 10.17705/1CAIS.03739.
39. Malaka I., Brown I. Challenges to the Organisational Adoption of Big Data Analytics: A Case Study in the South African Telecommunications Industry // Book Challenges to the Organisational Adoption of Big Data Analytics: A Case Study in the South African Telecommunications Industry / Editor. ‒ Stellenbosch, South Africa: ACM, 2015. ‒ P. 1-9. ‒ DOI: 10.1145/2815782.2815793.
40. Analytics: The New Path to Value [Research Report, Fall 2010] / MIT Sloan Management Review and the IBM Institute for Business Value. ‒ North Hollywood, CA: Technology M. I. o., 2010. ‒ 25 p.
41. Fahmideh M., Beydoun G. Big Data Analytics Architecture Design—An Application in Manufacturing Systems // Computers & Industrial Engineering. ‒ 2019. ‒ Vol. 128. ‒ P. 948-963. ‒ DOI: 10.1016/j.cie.2018.08.004.
42. Lopes C., Cabral B., Bernardino J. Personalization Using Big Data Analytics Platforms // Proceedings of the Ninth International C* Conference on Computer Science & Software Engineering (C3S2E '16) / Ed. Desai E. ‒ Porto, Portugal: ACM, 2016. ‒ P. 131-132. ‒ DOI: 10.1145/2948992.2949000.
43. White C., Research B. Using Big Data for Smarter Decision Making // BI Research, IBM Big Data & Analytics Hub. ‒ 2011.
44. Samosir R. S., Hendric H. L., Gaol F. L., Abdurachman E., Soewito B. Measurement Metric Proposed For Big Data Analytics System // Proceedings of

150
the 2017 International Conference on Computer Science and Artificial Intelligence (CSAI 2017) ‒ Jakarta, Indonesia: ACM, New York, NY, USA, 2017.
45. Loshin D. Chapter 2 - Business Problems Suited to Big Data Analytics // Big Data Analytics / Loshin D. ‒ Boston: Morgan Kaufmann, 2013. ‒ P. 11-19. ‒ DOI: 10.1016/B978-0-12-417319-4.00001-6.
46. Romary L. Data Management in the Humanities // ERCIM News - Special Theme: Big Data. ‒ 2012. ‒ Vol. 2012, No. 89. ‒ P. 14.
47. Amado A., Cortez P., Rita P., Moro S. Research Trends on Big Data in Marketing: A text Mining and Topic Modeling Based literature Analysis // European Research on Management and Business Economics. ‒ 2018. ‒ Vol. 24, No. 1. ‒ P. 1-7. ‒ DOI: 10.1016/j.iedeen.2017.06.002.
48. Saidali J., Rahich H., Tabaa Y., Medouri A. The Combination Between Big Data and Marketing Strategies to Gain Valuable Business Insights for Better Production Success // Procedia Manufacturing. ‒ 2019. ‒ Vol. 32. ‒ P. 1017-1023. ‒ DOI: 10.1016/j.promfg.2019.02.316.
49. Akter S., Wamba S. F. Big Data Analytics in E-Commerce: A Systematic Review and Agenda for Future Research // Electronic Markets. ‒ 2016. ‒ Vol. 26, No. 2. ‒ P. 173-194. ‒ DOI: 10.1007/s12525-016-0219-0.
50. Chong A. Y. L., Li B., Ngai E. W. T., Ch'ng E., Lee F. Predicting Online Product Sales Via Online Reviews, Sentiments, and Promotion Strategies: A Big Data Architecture and Neural Network Approach // International Journal of Operations & Production Management. ‒ 2016. ‒ Vol. 36, No. 4. ‒ P. 358-383. ‒ DOI: 10.1108/IJOPM-03-2015-0151.
51. Erevelles S., Fukawa N., Swayne L. Big Data Consumer Analytics and the Transformation of Marketing // Journal of Business Research. ‒ 2016. ‒ Vol. 69, No. 2. ‒ P. 897-904. ‒ DOI: 10.1016/j.jbusres.2015.07.001.
52. Jabbar A., Akhtar P., Dani S. Real-time Big Data Processing for Instantaneous Marketing Decisions: A Problematization Approach // Industrial Marketing Management. ‒ 2020. ‒ Vol. 90. ‒ P. 558-569. ‒ DOI: 10.1016/j.indmarman.2019.09.001.
53. Li T. Using Big Data Analytics to Build Prosperity Index of Transportation Market // Proceedings of the 4th ACM SIGSPATIAL International Workshop on Safety and Resilience (Safety and Resilience'18) ‒ Seattle, WA, USA: ACM New York, NY, USA, 2018. ‒ P. 6.
54. See-To E. W. K., Ngai E. W. T. Customer Reviews for Demand Distribution and Sales Nowcasting: A Big Data Approach // Annals of Operations Research. ‒ 2018. ‒ Vol. 270, No. 1-2. ‒ P. 415–431. ‒ DOI: 10.1007/s10479-016-2296-z.
151 55. Kumar A., Shankar R., Aljohani N. R. A Big Data Driven Framework for
Demand-driven Forecasting with Effects of Marketing-mix Variables // Industrial Marketing Management. ‒ 2020. ‒ Vol. 90. ‒ P. 493-507. ‒ DOI: 10.1016/j.indmarman.2019.05.003.
56. Zheng K., Zhang Z., Song B. E-Commerce Logistics Distribution Mode in Big-Data Context: A Case Analysis of JD.COM // Industrial Marketing Management. ‒ 2020. ‒ Vol. 86. ‒ P. 154-162. ‒ DOI: 10.1016/j.indmarman.2019.10.009.
57. Salehan M., Kim D. J. Predicting the Performance of Online Consumer Reviews: A Sentiment Mining Approach to Big Data Analytics // Decision Support Systems. ‒ 2016. ‒ Vol. 81. ‒ P. 30–40. ‒ DOI: 10.1016/j.dss.2015.10.006.
58. Malhotra D., Rishi O. An Intelligent Approach to Design of E-Commerce Metasearch and Ranking System Using Next-Generation Big Data Analytics // Journal of King Saud University - Computer and Information Sciences. ‒ 2021. ‒ Vol. 33, No. 2. ‒ P. 183-194. ‒ DOI: 10.1016/j.jksuci.2018.02.015.
59. Wu P.-J., Lin K.-C. Unstructured Big Data Analytics for Retrieving E-Commerce Logistics Knowledge // Telematics and Informatics. ‒ 2018. ‒ Vol. 35, No. 1. ‒ P. 237-244. ‒ DOI: 10.1016/j.tele.2017.11.004.
60. Zhaoa Y., Xu X., Wang M. Predicting Overall Customer Satisfaction: Big Data Evidence From Hotel Online Textual Reviews // International Journal of Hospitality Management. ‒ 2019. ‒ Vol. 76. ‒ P. 111-121.
61. Liu X., Shin H., Burns A. C. Examining the Impact of Luxury Brand's Social Media Marketing on Customer Engagement: Using Big Data Analytics and Natural Language Processing // Journal of Business Research. ‒ 2019. ‒ DOI: 10.1016/j.jbusres.2019.04.042.
62. Kauffmann E., Peral J., Gil D., Ferrández A., Sellers R., Mora H. A Framework for Big Data Analytics in Commercial Social Networks: A Case Study on Sentiment Analysis and Fake Review Detection for Marketing Decision-making // Industrial Marketing Management. ‒ 2019. ‒ DOI: 10.1016/j.indmarman.2019.08.003.
63. Taylor E. M., O. C. R., Velásquez J. D., Ghosh G., Banerjee S. Web Opinion Mining and Sentimental Analysis // Advanced Techniques in Web Intelligence-2: Web User Browsing Behaviour and Preference Analysis / Velásquez J. D. et al. ‒ Berlin, Heidelberg: Springer, 2013. ‒ P. 105-126. ‒ DOI: 10.1007/978-3-642-33326-2_5.
64. Ramanujam R. S., Nancyamala R., Nivedha J., Kokila J. Sentiment Analysis Using Big Data // Book Sentiment Analysis Using Big Data / Editor. ‒ Chennai, India: IEEE, 2015. ‒ P. 480–484. ‒ DOI: 10.1109/ICCPEIC.2015.7259528.

152 65. Mabrouk A., Redondo R. P. D., Kayed M. Deep Learning-Based Sentiment
Classification: A Comparative Survey // IEEE Access. ‒ 2020. ‒ Vol. 8. ‒ P. 85616-85638. ‒ DOI: 10.1109/ACCESS.2020.2992013.
66. Ma Y., Peng H., Cambria E. Targeted Aspect-Based Sentiment Analysis via Embedding Commonsense Knowledge into an Attentive LSTM // Book Targeted Aspect-Based Sentiment Analysis via Embedding Commonsense Knowledge into an Attentive LSTM / Editor. ‒ New Orleans, Louisiana, USA.: Association for the Advancement of Artificial Intelligence, 2018. ‒ P. 5876-5883.
67. Liu N., Shen B., Zhang Z., Zhang Z., Mi K. Attention‑based Sentiment Reasoner for Aspect‑based Sentiment Analysis // Human-centric Computing and Information Sciences. ‒ 2019. ‒ Vol. 9, No. 35. ‒ P. 17. ‒ DOI: 10.1186/s13673-019-0196-3.
68. Sun C., Huang L., Qiu X. Utilizing BERT for Aspect-Based Sentiment Analysis via Constructing Auxiliary Sentence // 2019 Annual Conference of the North American Chapter of the Association for Computational Linguistics: Human Language Technologies (NAACL-HLT) / Ed. Burstein J. et al. ‒ Vol. 1 ‒ Minneapolis, MN, USA: Association for Computational Linguistics, 2019. ‒ P. 380–385.
69. Bandari S., Bulusu V. V. Survey on Ontology-Based Sentiment Analysis of Customer Reviews for Products and Services // Data Engineering and Communication Technology: Proceedings of 3rd ICDECT-2K19. ‒ Singapore: Springer, 2020. ‒ P. 91-101. ‒ DOI: 10.1007/978-981-15-1097-7_8.
70. Wu S., Xu Y., Wu F., Yuan Z., Huang Y., Li X. Aspect-based Sentiment Analysis Via Fusing Multiple Sources of Textual Knowledge // Knowledge-Based Systems. ‒ 2019. ‒ Vol. 183. ‒ P. 104868. ‒ DOI: 10.1016/j.knosys.2019.104868.
71. Xu Q., Zhu L., Dai T., Yan C. Aspect-based Sentiment Classification With Multi-attention Network // Neurocomputing. ‒ 2020. ‒ Vol. 388. ‒ P. 135-143. ‒ DOI: 10.1016/j.neucom.2020.01.024.
72. Yang C., Zhang H., Jiang B., Li K. Aspect-based Sentiment Analysis With Alternating Coattention Networks // Information Processing & Management. ‒ 2019. ‒ Vol. 56, No. 3. ‒ P. 463-478. ‒ DOI: 10.1016/j.ipm.2018.12.004.
73. Natural Language Processing with Python. / Bird S., Klein E., Loper E. ‒ 1st ed.: O'Reilly Media, Inc., 2009.
74. Introduction to Information Retrieval. / Manning C. D., Raghavan P., Schütze H.: Cambridge University Press, 2008.

153 75. Sun S., Luo C., Chen J. A Review of Natural Language Processing Techniques
for Opinion Mining Systems // Information Fusion. ‒ 2017. ‒ Vol. 36. ‒ P. 10-25. ‒ DOI: 10.1016/j.inffus.2016.10.004.
76. Foundations of Statistical Natural Language Processing. / Manning C. D., Schütze H. ‒ Cambridge, MA: MIT Press, 1999.
77. Venkataraman A. Word Segmentation for Classification of Text: 19059 / Hultåker A.; Uppsala University, 2019. ‒ 50 p.
78. Norvig P. Natural Language Corpus Data // Beautiful Data: The Stories Behind Elegant Data Solutions / Segaran T., Hammerbacher J.O'Reilly Media, Inc., 2009. ‒ P. 219-242.
79. Building a Large Annotated Corpus of English: The Penn Treebank / University of Pennsylvania: School of Engineering and Applied Science: Science D. o. C. a. I. ‒ Philadelphia, PA: ScholarlyCommons, 1993. ‒ 25 p.
80. Pennsylvania U. o. Penn Treebank P.O.S. Tags. ‒ URL: https://www.ling.upenn.edu/courses/Fall_2003/ling001/penn_treebank_pos.html (Date Accessed: 30-09.2021).
81. Kumawat D., Jain V. POS Tagging Approaches: A Comparison // International Journal of Computer Applications (IJCA). ‒ 2015. ‒ Vol. 118, No. 6. ‒ P. 32-38. ‒ DOI: 10.5120/20752-3148.
82. Dean J., Ghemawat S. MapReduce: Simplified Data Processing on Large Clusters // Communications of the ACM - 50th Anniversary Issue: 1958 - 2008. ‒ 2008. ‒ Vol. 51, No. 1. ‒ P. 107-113. ‒ DOI: 10.1145/1327452.1327492.
83. Azevedo D. N. R., Oliveira J. M. P. d. Application of Data Mining Techniques to Storage Management and Online Distribution of Satellite Images // Innovative Applications in Data Mining / Nedjah N. et al. ‒ Berlin, Heidelberg: Springer, 2009. ‒ P. 1-15. ‒ DOI: 10.1007/978-3-540-88045-5_1.
84. Agrawal D., Abbadi A. E., Antony S., Das S. Data Management Challenges in Cloud Computing Infrastructures: Databases in Networked Information Systems ‒ Berlin, Heidelberg: Springer, 2010. ‒ P. 1-10.
85. Buza K., Nagy G. I., Nanopoulos A. Storage-Optimizing Clustering Algorithms for High-Dimensional Tick Data // Expert Systems with Applications. ‒ 2014. ‒ Vol. 41, No. 9. ‒ P. 4148-4157. ‒ DOI: 10.1016/j.eswa.2013.12.046.
86. Mateus R. C., Siqueira T. L. L., Times V. C., Ciferri R. R., Ciferri C. D. d. A. Spatial Data Warehouses and Spatial OLAP Come Towards the Cloud: Design and Performance // Distributed and Parallel Databases. ‒ 2016. ‒ Vol. 34, No. 3. ‒ P. 425–461.

154 87. Data Integration Déjà Vu: Big Data Reinvigorates DI - [White Paper] / SAS
Institute Inc. ‒ USA: SAS, 2018. ‒ 14 p. ‒ 107865_G71578.0318.
88. Reeve A. Chapter 21 - Big Data Integration // Managing Data in Motion / Reeve A. ‒ Boston: Morgan Kaufmann, 2013. ‒ P. 141-156. ‒ DOI: 10.1016/B978-0-12-397167-8.00021-2.
89. FlyData I. The 6 Challenges of Big Data Integration. ‒ 2019. ‒ URL: https://www.flydata.com/the-6-challenges-of-big-data-integration/ (Date Accessed: 18-11.2019).
90. Akusok A., Björk K.-M., Miche Y., Lendasse A. High-Performance Extreme Learning Machines: A Complete Toolbox for Big Data Applications // IEEE Access ‒2015. ‒ Vol. 3. ‒ P. 1011–1025.
91. JI C., LI Y., QIU W., JIN Y., XU Y., AWADA U., LI K., QU W. Big Data Processing: Big Challenges and Opportunities // Journal of Interconnection Networks. ‒ 2012. ‒ Vol. 13, No. 03 & 04. ‒ P. 1250009. ‒ DOI: 10.1142/s0219265912500090.
92. Hadoop: The Definitive Guide. / White T.; Ed. Loukides M., Blanchette M. ‒ 4 ed.: O’Reilly Media, Inc., 2015.
93. Candela L., Castelli D., Pagano P. Managing Big Data through Hybrid Data Infrastructures // ERCIM News - Special Theme: Big Data. ‒ 2012. ‒ Vol. 2012, No. 89. ‒ P. 37-38.
94. Zhang L., Liu B., Lim S. H., O'Brien-Strain E. Extracting and Ranking Product Features in Opinion Documents // Book Extracting and Ranking Product Features in Opinion Documents / Editor. ‒ Beijing, China: ACL, 2010. ‒ P. 1462–1470. ‒ DOI: 10.5555/1944566.1944733.
95. Rana T. A., Cheah Y.-N. Aspect Extraction in Sentiment Analysis: Comparative Analysis and Survey // Artificial Intelligence Review. ‒ 2016. ‒ Vol. 46, No. 4. ‒ P. 459-483. ‒ DOI: 10.1007/s10462-016-9472-z.
96. Dragoni M., Federici M., Rexha A. An Unsupervised Aspect Extraction Strategy for Monitoring Real-Time Reviews Stream // Information Processing & Management. ‒ 2019. ‒ Vol. 56, No. 3. ‒ P. 1103-1118. ‒ DOI: 10.1016/j.ipm.2018.04.010.
97. Tubishat M., Idris N., Abushariah M. A. M. Implicit Aspect Extraction in Sentiment Analysis: Review, Taxonomy, Oppportunities, and Open Challenges // Information Processing & Management. ‒ 2018. ‒ Vol. 54, No. 4. ‒ P. 545-563. ‒ DOI: 10.1016/j.ipm.2018.03.008.

155 98. Ren F., Sohrab M. G. Class-Indexing-Based Term Weighting for Automatic Text
Classification // Information Sciences. ‒ 2013. ‒ Vol. 236. ‒ P. 109-125. ‒ DOI: 10.1016/j.ins.2013.02.029.
99. Akhtar M. S., Gupta D., Ekbal A., Bhattacharyya P. Feature Selection and Ensemble Construction: A two-Step Method for Aspect Based Sentiment Analysis // Knowledge-Based Systems. ‒ 2017. ‒ Vol. 125. ‒ P. 116-135. ‒ DOI: 10.1016/j.knosys.2017.03.020.
100. Al-Smadi M., Al-Ayyoub M., Jararweh Y., Qawasmeh O. Enhancing Aspect-Based Sentiment Analysis of Arabic Hotels’ Reviews Using Morphological, Syntactic and Semantic Features // Information Processing & Management. ‒ 2019. ‒ Vol. 56, No. 2. ‒ P. 308-319. ‒ DOI: 10.1016/j.ipm.2018.01.006.
101. Song M., Park H., Shin K.-s. Attention-Based Long Short-Term Memory Network Using Sentiment Lexicon Embedding for Aspect-Level Sentiment Analysis in Korean // Information Processing & Management. ‒ 2019. ‒ Vol. 56, No. 3. ‒ P. 637-653. ‒ DOI: 10.1016/j.ipm.2018.12.005.
102. Fu Y., Liao J., Li Y., Wang S., Li D., Li X. Multiple Perspective Attention Based on Double BiLSTM for Aspect and Sentiment Pair Extract // Neurocomputing. ‒ 2021. ‒ Vol. 438. ‒ P. 302-311. ‒ DOI: 10.1016/j.neucom.2021.01.079.
103. Zhao H., Liu Z., Yao X., Yang Q. A Machine Learning-Based Sentiment Analysis of Online Product Reviews with A Novel Term Weighting and Feature Selection Approach // Information Processing & Management. ‒ 2021. ‒ Vol. 58, No. 5. ‒ P. 102656. ‒ DOI: 10.1016/j.ipm.2021.102656.
104. Wan C., Peng Y., Xiao K., Liu X., Jiang T., Liu D. An Association-Constrained LDA Model for Joint Extraction of Product Aspects and Opinions // Information Sciences. ‒ 2020. ‒ Vol. 519. ‒ P. 243-259. ‒ DOI: 10.1016/j.ins.2020.01.036.
105. Khan M. T., Durrani M., Khalid S., Aziz F. Lifelong Aspect Extraction from Big Data: Knowledge Engineering // Complex Adaptive Systems Modeling. ‒ 2016. ‒ Vol. 4, No. 1. ‒ P. 15. ‒ DOI: 10.1186/s40294-016-0018-7.
106. Yan Z., Xing M., Zhang D., Ma B. EXPRS: An Extended Pagerank Method for Product Feature Extraction from Online Consumer Reviews // Information & Management. ‒ 2015. ‒ Vol. 52, No. 7. ‒ P. 850-858. ‒ DOI: 10.1016/j.im.2015.02.002.
107. Luo Z., Huang S., Zhu K. Q. Knowledge Empowered Prominent Aspect Extraction from Product Reviews // Information Processing & Management. ‒ 2019. ‒ Vol. 56, No. 3. ‒ P. 408-423. ‒ DOI: 10.1016/j.ipm.2018.11.006.
108. Li S., Zhou L., Li Y. Improving Aspect Extraction by Augmenting A Frequency-Based Method With Web-Based Similarity Measures // Information Processing &

156
Management. ‒ 2015. ‒ Vol. 51, No. 1. ‒ P. 58-67. ‒ DOI: 10.1016/j.ipm.2014.08.005.
109. Wang X., Liu Y., Sun C., Liu M., Wang X. Extended Dependency-Based Word Embeddings for Aspect Extraction // International Conference on Neural Information Processing ICONIP, Neural Information Processing. ‒ Cham: Springer, 2016. ‒ P. 104-111. ‒ DOI: 10.1007/978-3-319-46681-1_13.
110. Xiong S., Ji D. Exploiting Flexible-Constrained K-Means Clustering With Word Embedding for Aspect-Phrase Grouping // Information Sciences. ‒ 2016. ‒ Vol. 367-368. ‒ P. 689-699. ‒ DOI: 10.1016/j.ins.2016.07.002.
111. Xue W., Zhou W., Li T., Wang Q. MTNA: A Neural Multi-task Model for Aspect Category Classification and Aspect Term Extraction On Restaurant Reviews // The The 8th International Joint Conference on Natural Language Processing ‒ Taipei, Taiwan: Asian Federation of Natural Language Processing, 2017. ‒ P. 151–156.
112. Li X., Bing L., Li P., Lam W., Yang Z. Aspect Term Extraction with History Attention and Selective Transformation // The Twenty-Seventh International Joint Conference on Artificial Intelligence, (IJCAI-18) ‒International Joint Conferences on Artificial Intelligence Organization, 2018. ‒ P. 4194-4200. ‒ DOI: 10.24963/ijcai.2018/583.
113. Wu C., Wu F., Wu S., Yuan Z., Huang Y. A Hybrid Unsupervised Method for Aspect Term and Opinion Target Extraction // Knowledge-Based Systems. ‒ 2018. ‒ Vol. 148. ‒ P. 66-73. ‒ DOI: 10.1016/j.knosys.2018.01.019.
114. Xiang Y., He H., Zheng J. Aspect Term Extraction Based on MFE-CRF // Information. ‒ 2018. ‒ Vol. 9, No. 8. ‒ P. 1-15. ‒ DOI: 10.3390/info9080198.
115. Akhtar M. S., Garg T., Ekbal A. Multi-Task Learning for Aspect Term Extraction and Aspect Sentiment Classification // Neurocomputing. ‒ 2020. ‒ Vol. 398. ‒ P. 247-256. ‒ DOI: 10.1016/j.neucom.2020.02.093.
116. Augustyniak Ł., Kajdanowicz T., Kazienko P. Comprehensive Analysis of Aspect Term Extraction Methods using Various Text Embeddings // Computer Speech & Language. ‒ 2021. ‒ Vol. 69. ‒ P. 101217. ‒ DOI: 10.1016/j.csl.2021.101217.
117. Park H.-j., Song M., Shin K.-S. Deep Learning Models and Datasets for Aspect Term Sentiment Classification: Implementing Holistic Recurrent Attention on Target-Dependent Memories // Knowledge-Based Systems. ‒ 2020. ‒ Vol. 187. ‒ P. 104825. ‒ DOI: 10.1016/j.knosys.2019.06.033.
118. Peters M. E., Neumann M., Iyyer M., Gardner M., Clark C., Lee K., Zettlemoyer L. Deep Contextualized Word Representations // Proceedings of the 2018 Conference of the North American Chapter of the Association for Computational

157
Linguistics: Human Language Technologies (NAACL-HLT) ‒ New Orleans, Louisiana: Association for Computational Linguistics, 2018. ‒ P. 2227–2237. ‒ DOI: 10.18653/v1/N18-1202.
119. Akbik A., Blythe D., Vollgraf R. Contextual String Embeddings for Sequence Labeling // Proceedings ofthe 27th International Conference on Computational Linguistics ‒ Santa Fe, New Mexico, USA: Association for Computational Linguistics, 2018. ‒ P. 1638–1649.
120. Kenter T., Jones L., Hewlett D. Byte-Level Machine Reading Across Morphologically Varied Languages // The Thirty-Second AAAI Conference on Artificial Intelligence (AAAI-18) ‒ New Orleans, Louisiana, USA: Association for the Advancement of Artificial Intelligence (AAAI), 2018. ‒ P. 5820 - 5827.
121. Bojanowski P., Grave E., Joulin A., Mikolov T. Enriching Word Vectors with Subword Information // Transactions of the Association for Computational Linguistics. ‒ 2017. ‒ Vol. 5. ‒ P. 135-146. ‒ DOI: 10.1162/tacl_a_00051.
122. Mikolov T., Chen K., Corrado G., Dean J. Efficient Estimation ofWord Representations in Vector Space // arXiv:1301.3781v3 [cs.CL] ‒2013. ‒ P. 12.
123. Le Q., Mikolov T. Distributed Representations of Sentences and Documents // the 31st International Conference on Machine Learning. ‒ Vol. 32 ‒ Beijing, China: Proceedings of Machine Learning Research (PMLR), 2014. ‒ P. 1188-1196.
124. Devlin J., Chang M.-W., Lee K., Toutanova K. BERT: Pre-training of Deep Bidirectional Transformers for Language Understanding // Proceedings of the 2019 Conference of the North American Chapter of the Association for Computational Linguistics: Human Language Technologies. ‒ Vol. 1 ‒ Minneapolis, Minnesota, : Association for Computational Linguistics, 2019. ‒ P. 4171-4186. ‒ DOI: 10.18653/v1/N19-1423.
125. Kohonen T. Self-Organized Formation of Topologically Correct Feature Maps // Biological Cybernetics. ‒ 1982. ‒ Vol. 43, No. 1. ‒ P. 59-69. ‒ DOI: 10.1007/BF00337288.
126. Kohonen T. The Self-Organizing Map // Proceedings of the IEEE. ‒ 1990. ‒ Vol. 78, No. 9. ‒ P. 1464-1480. ‒ DOI: 10.1109/5.58325.
127. Self-Organizing Maps. Springer Series in Information Sciences. / Kohonen T. ‒ 1st ed.: Springer, Berlin, Heidelberg, 1995. Springer Series in Information Sciences. ‒ DOI: 10.1007/978-3-642-97610-0.
128. Kohonen T. Essentials of the Self-Organizing Map // Neural Networks. ‒ 2013. ‒ Vol. 37. ‒ P. 52-65. ‒ DOI: 10.1016/j.neunet.2012.09.018.

158 129. Maaten L. v. d. Learning a Parametric Embedding by Preserving Local Structure
// Proceedings of the 12th International Conference on Artificial Intelligence and Statistics (AISTATS) / Ed. Dyk D. v., Welling M. ‒ Vol. 5 ‒ Florida, USA: Proceedings of Machine Learning Research (JMLR: W&CP), 2009. ‒ P. 384 - 391.
130. Maaten L. v. d. Accelerating t-SNE using Tree-Based Algorithms // Journal of Machine Learning Research. ‒ 2014. ‒ Vol. 15, No. 93. ‒ P. 3221-3245.
131. Maaten L. v. d., Hinton G. Visualizing Data using t-SNE // Journal of Machine Learning Research. ‒ 2008. ‒ Vol. 9, No. 86. ‒ P. 2579-2605.
132. Maaten L. v. d., Hinton G. Visualizing Non-Metric Similarities in Multiple Maps // Machine Learning. ‒ 2012. ‒ Vol. 87. ‒ P. 33–55. ‒ DOI: 10.1007/s10994-011-5273-4.
133. Arthur D., Vassilvitskii S. k-means++: The Advantages of Careful Seeding // Proceedings of the Eighteenth Annual ACM-SIAM Symposium on Discrete Algorithms ‒ New Orleans, Louisiana: Society for Industrial and Applied Mathematics, 2007. ‒ P. 1027–1035. ‒ DOI: 10.5555/1283383.1283494.
134. Ye H., Yan Z., Luo Z., Chao W. Dependency-Tree Based Convolutional Neural Networks for Aspect Term Extraction: Advances in Knowledge Discovery and Data Mining ‒ Cham: Springer International Publishing, 2017. ‒ P. 350-362. ‒ DOI: 10.1007/978-3-319-57529-2_28.
135. Kauffmann E., Peral J., Gil D., Ferrández A., Sellers R., Mora H. A Framework for Big Data Analytics in Commercial Social Networks: A Case Study on Sentiment Analysis and Fake Review Detection for Marketing Decision-Making // Industrial Marketing Management. ‒ 2020. ‒ Vol. 90. ‒ P. 523-537. ‒ DOI: 10.1016/j.indmarman.2019.08.003.
136. Thelwall M., Stuart E. She's Reddit: A Source of Statistically Significant Gendered Interest Information? // Information Processing & Management. ‒ 2019. ‒ Vol. 56, No. 4. ‒ P. 1543-1558. ‒ DOI: 10.1016/j.ipm.2018.10.007.
137. Zhang M., Fan B., Zhang N., Wang W., Fan W. Mining Product Innovation Ideas from Online Reviews // Information Processing & Management. ‒ 2021. ‒ Vol. 58, No. 1. ‒ P. 102389. ‒ DOI: 10.1016/j.ipm.2020.102389.
138. Chen M.-J., Farn C.-K. Examining the Influence of Emotional Expressions in Online Consumer Reviews on Perceived Helpfulness // Information Processing & Management. ‒ 2020. ‒ Vol. 57, No. 6. ‒ P. 102266. ‒ DOI: 10.1016/j.ipm.2020.102266.
159 139. Eke C. I., Norman A. A., Shuib L., Nweke H. F. A Survey of User Profiling: State-
of-the-Art, Challenges, and Solutions // IEEE Access. ‒ 2019. ‒ Vol. 7. ‒ P. 144907-144924. ‒ DOI: 10.1109/ACCESS.2019.2944243.
140. Zhou W., Han W. Personalized Recommendation Via User Preference Matching // Information Processing & Management. ‒ 2019. ‒ Vol. 56, No. 3. ‒ P. 955-968. ‒ DOI: 10.1016/j.ipm.2019.02.002.
141. Fosch-Villaronga E., Poulsen A., Søraa R. A., Custers B. H. M. A Little Bird Told Me Your Gender: Gender Inferences in Social Media // Information Processing & Management. ‒ 2021. ‒ Vol. 58, No. 3. ‒ P. 102541. ‒ DOI: 10.1016/j.ipm.2021.102541.
142. Kim Y., Kim J. H. Using Computer Vision Techniques on Instagram to Link Users’ Personalities and Genders to the Features of their Photos: An Exploratory Study // Information Processing & Management. ‒ 2018. ‒ Vol. 54, No. 6. ‒ P. 1101-1114. ‒ DOI: 10.1016/j.ipm.2018.07.005.
143. Rwigema J., Mfitumukiza J., Tae-Yong K. A Hybrid Approach of Neural Networks for Age and Gender Classification through Decision Fusion // Biomedical Signal Processing and Control. ‒ 2021. ‒ Vol. 66. ‒ P. 102459. ‒ DOI: 10.1016/j.bspc.2021.102459.
144. Cascone L., Medaglia C., Nappi M., Narducci F. Pupil Size as A Soft Biometrics for Age and Gender Classification // Pattern Recognition Letters. ‒ 2020. ‒ Vol. 140. ‒ P. 238-244. ‒ DOI: 10.1016/j.patrec.2020.10.009.
145. Nayak J. S., Indiramma M. An Approach to Enhance Age Invariant Face Recognition Performance Based on Gender Classification // Journal of King Saud University - Computer and Information Sciences. ‒ 2021. ‒ DOI: 10.1016/j.jksuci.2021.01.005.
146. Livieris I. E., Pintelas E., Pintelas P. Gender Recognition by Voice Using an Improved Self-Labeled Algorithm // Machine Learning and Knowledge Extraction. ‒ 2019. ‒ Vol. 1, No. 1. ‒ P. 492-503. ‒ DOI: 10.3390/make1010030.
147. Rim B., Kim J., Hong M. Gender Classification from Fingerprint-images using Deep Learning Approach // International Conference on Research in Adaptive and Convergent Systems ‒ Gwangju, Republic of Korea: ACM, 2020. ‒ P. 7–12. ‒ DOI: 10.1145/3400286.3418237.
148. Chen L., Han M., Shi H., Liu X. Multi-Context Embedding Based Personalized Place Semantics Recognition // Information Processing & Management. ‒ 2021. ‒ Vol. 58, No. 1. ‒ P. 102416. ‒ DOI: 10.1016/j.ipm.2020.102416.
149. López-Santillán R., Montes-Y-Gómez M., González-Gurrola L. C., Ramírez-Alonso G., Prieto-Ordaz O. Richer Document Embeddings for Author Profiling

160
Tasks Based on A Heuristic Search // Information Processing & Management. ‒ 2020. ‒ Vol. 57, No. 4. ‒ P. 102227. ‒ DOI: 10.1016/j.ipm.2020.102227.
150. Al-Yazeed N. M. A., Gadallah A. M., Hefny H. A. A Hybrid Recommendation Model for Web Navigation // The Seventh IEEE International Conference on Intelligent Computing and Information Systems (ICICIS) ‒ Cairo, Egypt: IEEE, 2015. ‒ P. 552-560. ‒ DOI: 10.1109/IntelCIS.2015.7397276.
151. Renjith S., Sreekumar A., Jathavedan M. An Extensive Study on the Evolution of Context-Aware Personalized Travel Recommender Systems // Information Processing & Management. ‒ 2020. ‒ Vol. 57, No. 1. ‒ P. 102078. ‒ DOI: 10.1016/j.ipm.2019.102078.
152. Simaki V., Aravantinou C., Mporas I., Megalooikonomou V. Using Sociolinguistic Inspired Features for Gender Classification of Web Authors // International Conference on Text, Speech, and Dialogue TSD 2015: Text, Speech, and Dialogue. ‒ Vol. 9302: Lecture Notes in Computer Science ‒ Cham: Springer, 2015. ‒ P. 587-594. ‒ DOI: 10.1007/978-3-319-24033-6_66.
153. Kucukyilmaz T., Deniz A., Kiziloz H. E. Boosting Gender Identification Using Author Preference // Pattern Recognition Letters. ‒ 2020. ‒ Vol. 140. ‒ P. 245-251. ‒ DOI: 10.1016/j.patrec.2020.10.002.
154. Das S., Paik J. H. Context-Sensitive Gender Inference of Named Entities in Text // Information Processing & Management. ‒ 2021. ‒ Vol. 58, No. 1. ‒ P. 102423. ‒ DOI: 10.1016/j.ipm.2020.102423.
155. Alsmearat K., Al-Ayyoub M., Al-Shalabi R., Kanaan G. Author Gender Identification from Arabic Text // Journal of Information Security and Applications. ‒ 2017. ‒ Vol. 35. ‒ P. 85-95. ‒ DOI: 10.1016/j.jisa.2017.06.003.
156. ElSayed S., Farouk M. Gender Identification for Egyptian Arabic Dialect in Twitter Using Deep Learning Models // Egyptian Informatics Journal. ‒ 2020. ‒ Vol. 21, No. 3. ‒ P. 159-167. ‒ DOI: 10.1016/j.eij.2020.04.001.
157. Hussein S., Farouk M., Hemayed E. Gender Identification of Egyptian Dialect in Twitter // Egyptian Informatics Journal. ‒ 2019. ‒ Vol. 20, No. 2. ‒ P. 109-116. ‒ DOI: 10.1016/j.eij.2018.12.002.
158. Sboev A., Moloshnikov I., Gudovskikh D., Selivanov A., Rybka R., Litvinova T. Automatic Gender Identification of Author of Russian Text by Machine Learning and Neural Net Algorithms in Case of Gender Deception // Procedia Computer Science. ‒ 2018. ‒ Vol. 123. ‒ P. 417-423. ‒ DOI: 10.1016/j.procs.2018.01.064.
159. Sboev A., Moloshnikov I., Gudovskikh D., Selivanov A., Rybka R., Litvinova T. Deep Learning Neural Nets Versus Traditional Machine Learning in Gender

161
Identification of Authors of RusProfiling Texts // Procedia Computer Science. ‒ 2018. ‒ Vol. 123. ‒ P. 424-431. ‒ DOI: 10.1016/j.procs.2018.01.065.
160. Filho J. A. B. L., Pasti R., Castro L. N. d. Gender Classification of Twitter Data Based on Textual Meta-Attributes Extraction // New Advances in Information Systems and Technologies / Ed. Rocha Á. et al. ‒ Vol. 444: Advances in Intelligent Systems and Computing ‒ Cham: Springer International Publishing, 2016. ‒ P. 1025-1034. ‒ DOI: 10.1007/978-3-319-31232-3_97.
161. Wais K. Gender Prediction Methods Based on First Names with genderizeR // The R Journal. ‒ 2016. ‒ Vol. 8, No. 1. ‒ P. 17-37. ‒ DOI: 10.32614/RJ-2016-002.
162. The Slangit Leet Sheet. ‒ 2021. ‒ URL: https://slangit.com/leet_sheet (Date Accessed: Mar. 20.2021).
163. Christensson P. Leet Definition. ‒ 2019. ‒ URL: https://techterms.com/definition/leet (Date Accessed: Mar. 20.2021).
164. Mitchell A. A Leet Primer. ‒ 2005. ‒ URL: https://www.technewsworld.com/story/47607.html (Date Accessed: Mar. 20.2021).
165. McAuley J., Leskovec J. Hidden Factors and Hidden Topics: Understanding Rating Dimensions With Review Text // Proceedings of the 7th ACM conference on Recommender Systems ‒ Hong Kong, China: ACM, 2013. ‒ P. 165–172. ‒ DOI: 10.1145/2507157.2507163.
166. Hazrati N., Ricci F. Recommender Systems Effect on the Evolution of Users’ Choices Distribution // Information Processing & Management. ‒ 2022. ‒ Vol. 59, No. 1. ‒ P. 102766. ‒ DOI: 10.1016/j.ipm.2021.102766.
167. Qiu L., Gao S., Cheng W., Guo J. Aspect-based Latent Factor Model by Integrating Ratings and Reviews for Recommender System // Knowledge-Based Systems. ‒ 2016. ‒ Vol. 110. ‒ P. 233-243. ‒ DOI: 10.1016/j.knosys.2016.07.033.
168. Zheng Y., Wang D. A Survey of Recommender Systems with Multi-Objective Optimization // Neurocomputing. ‒ 2021. ‒ DOI: 10.1016/j.neucom.2021.11.041.
169. Burke R. Hybrid Recommender Systems: Survey and Experiments // User Modeling and User-Adapted Interaction. ‒ 2002. ‒ Vol. 12, No. 4. ‒ P. 331-370. ‒ DOI: 10.1023/A:1021240730564.
170. Ni J., Li J., McAuley J. Justifying Recommendations using Distantly-Labeled Reviews and Fine-Grained Aspects // Empirical Methods in Natural Language Processing (EMNLP): Proceedings of the 2019 Conference on Empirical Methods in Natural Language Processing and the 9th International Joint Conference on

162
Natural Language Processing (EMNLP-IJCNLP) ‒ Hong Kong, China: ACL, 2019. ‒ P. 188-197. ‒ DOI: 10.18653/v1/D19-1018.
171. Baizal Z. K. A., Widyantoro D. H., Maulidevi N. U. Computational Model for Generating Interactions in Conversational Recommender System Based on Product Functional Requirements // Data & Knowledge Engineering. ‒ 2020. ‒ Vol. 128. ‒ P. 101813. ‒ DOI: 10.1016/j.datak.2020.101813.
172. Da'u A., Salim N., Rabiu I., Osman A. Recommendation System Exploiting Aspect-based Opinion Mining With Deep Learning Method // Information Sciences. ‒ 2020. ‒ Vol. 512. ‒ P. 1279-1292. ‒ DOI: 10.1016/j.ins.2019.10.038.
173. Da'u A., Salim N., Rabiu I., Osman A. Weighted Aspect-based Opinion Mining Using Deep Learning for Recommender System // Expert Systems with Applications. ‒ 2020. ‒ Vol. 140. ‒ P. 112871. ‒ DOI: 10.1016/j.eswa.2019.112871.
174. Ghasemi N., Momtazi S. Neural Text Similarity of User Reviews for Improving Collaborative Filtering Recommender Systems // Electronic Commerce Research and Applications. ‒ 2021. ‒ Vol. 45. ‒ P. 101019. ‒ DOI: 10.1016/j.elerap.2020.101019.
175. Asani E., Vahdat-Nejad H., Sadri J. Restaurant Recommender System Based on Sentiment Analysis // Machine Learning with Applications. ‒ 2021. ‒ Vol. 6. ‒ P. 100114. ‒ DOI: 10.1016/j.mlwa.2021.100114.
176. Ray B., Garain A., Sarkar R. An Ensemble-based Hotel Recommender System Using Sentiment Analysis and Aspect Categorization of Hotel Reviews // Applied Soft Computing. ‒ 2021. ‒ Vol. 98. ‒ P. 106935. ‒ DOI: 10.1016/j.asoc.2020.106935.
177. Koren Y., Bell R., Volinsky C. Matrix Factorization Techniques for Recommender Systems // Computer. ‒ 2009. ‒ Vol. 42, No. 8. ‒ P. 30-37. ‒ DOI: 10.1109/MC.2009.263.
178. Koren Y. Factorization Meets the Neighborhood: A Multifaceted Collaborative Filtering Model // The 14th ACM SIGKDD International Conference on Knowledge Discovery and Data Mining ‒ Las Vegas, Nevada, USA: ACM, 2008. ‒ P. 426–434. ‒ DOI: 10.1145/1401890.1401944.

Санкт-Петербургский государственный университет
На правах рукописи
Али Ноаман Мухаммад Абоалязид Мухаммад
Аналитика Больших Текстовых Данных
Научная специальность 2.3.8.
Информатика и информационные процессы
Диссертация на соискание ученой степени
кандидата технических наук
Перевод с английского
Научные руководители:
доктор физико-математических наук, профессор
Новиков Борис Асенович
доктор физико-математических наук, профессор
Косовская Татьяна Матвеевна
Санкт-Петербург
2022

164
ОГЛАВЛЕНИЕ
Введение ...................................................................................................................... 168
Глава 1. Исследование предметной области ........................................................ 178
1.1. Введение ....................................................................................................... 178
1.2. Большие данные: Понятия и характеристики .......................................... 179
1.2.1. Понятия и определения .................................................................. 180
1.2.2. Характеристики 4V ......................................................................... 182
1.3. Аналитика больших данных ...................................................................... 186
1.3.1. Концептуализация темы ................................................................. 186
1.3.2. Преимущества использования решений для анализа больших данных .......................................................................................................... 188
1.3.3. Предварительная оценка ................................................................ 190
1.4. Применение аналитики больших данных................................................. 191
1.4.1. Применение АБД в маркетинге и электронной коммерции....... 194
1.5. Анализ отзывов потребителей ................................................................... 196
1.5.1. Анализ Тональности ....................................................................... 197
1.5.2. Анализ тональности относительно аспектов ............................... 198
1.6. Выводы ......................................................................................................... 200
Глава 2. Сбор и предварительная обработка данных ....................................... 201
2.1. Введение ....................................................................................................... 201
2.2. Предпосылки исследования ....................................................................... 203
2.2.1. Токенизация ..................................................................................... 204
2.2.2. Удаление стоп-слов ........................................................................ 206
2.2.3. Лемматизация .................................................................................. 207
2.2.4. Сегментация данных ...................................................................... 208
2.2.5. Тегирование частей речи................................................................ 209
2.3. Фреймворк больших данных ..................................................................... 211

165
2.3.1. Сбор данных .................................................................................... 212
2.3.2. Хранение данных ............................................................................ 214
2.3.3. Интеграция данных ......................................................................... 215
2.3.4. Обработка данных .......................................................................... 216
2.4. Предлагаемая модель предварительной обработки данных .................. 218
2.4.1. Ввод данных и извлечение текста обзора .................................... 223
2.4.2. Очистка и фильтрация данных ...................................................... 223
2.4.3. Исправление опечаток .................................................................... 227
2.5. Эксперименты и результаты ...................................................................... 230
2.5.1. Детали реализации .......................................................................... 231
2.5.2. Наборы данных Описание ............................................................. 232
2.5.3. Эксперименты и обсуждение ........................................................ 234
2.6. Выводы ......................................................................................................... 241
Глава 3. Извлечение аспектных терминов .......................................................... 242
3.1. Введение ....................................................................................................... 242
3.2. Предпосылки исследования ....................................................................... 244
3.3. Основные процедуры .................................................................................. 248
3.3.1. Вложения слов ................................................................................ 248
3.3.2. Многомерное сокращение ............................................................. 251
3.3.3. Признак кластеризации .................................................................. 253
3.3.4. Выбор признаков ............................................................................ 255
3.4. Предлагаемая модель для ИАТ ................................................................. 255
3.4.1. Описание фреймворка .................................................................... 257
3.5. Эксперименты и результаты ...................................................................... 259
3.5.1. Наборы данных ............................................................................... 259
3.5.2. Установка эксперимента ................................................................ 261
3.5.3. Метрики тестирования и оценки ................................................... 263
3.5.4. Анализ и обсуждение результатов ................................................ 265
3.6. Выводы ......................................................................................................... 271
Глава 4. Идентификация пола пользователя ...................................................... 272
4.1. Введение ....................................................................................................... 272

166
4.1.1. Цели исследования ......................................................................... 274
4.1.2. Взносы .............................................................................................. 274
4.2. Предпосылки исследования ....................................................................... 275
4.2.1. Веб-персонализация ....................................................................... 275
4.2.2. Техники гендерной идентификации ............................................. 276
4.3. Основные процедуры .................................................................................. 278
4.3.1. Конвертация и очистка данных ..................................................... 279
4.3.2. Динамический отбор признаков с обрезкой N-грамм................. 280
4.3.3. Исправление опечаток .................................................................... 282
4.4. Предлагаемая модель для ГИ..................................................................... 284
4.4.1. Описание фреймворка .................................................................... 284
4.5. Эксперименты и результаты ...................................................................... 287
4.5.1. Наборы данных ............................................................................... 287
4.5.2. Эксперимент .................................................................................... 288
4.5.3. Тестирование и оценка ................................................................... 291
4.6. Обсуждение ................................................................................................. 293
4.7. Выводы ......................................................................................................... 295
Глава 5. Рекомендательные системы .................................................................... 296
5.1. Введение ....................................................................................................... 296
5.2. Предпосылки исследования ....................................................................... 298
5.2.1. Основные концепции РС ................................................................ 298
5.2.2. Методы создания РС ...................................................................... 300
5.2.3. Применение РС ............................................................................... 303
5.3. Связанные работы ....................................................................................... 304
5.4. Предлагаемая система для рекомендаций продуктов ............................. 307
5.4.1. Рейтинг продуктов .......................................................................... 307
5.4.2. Извлечение предпочтений ............................................................. 310
5.4.3. Генерирование рекомендаций ....................................................... 311
5.5. Эксперименты и результаты ...................................................................... 312
5.5.1. Наборы данных ............................................................................... 312
5.5.2. Метрики тестирования и оценки ................................................... 313

167
5.5.3. Анализ и обсуждение результатов ................................................ 315
5.6. Выводы ......................................................................................................... 316
Заключение ................................................................................................................. 318
Словарь терминов ..................................................................................................... 321
Список таблиц ............................................................................................................ 323
Список рисунков ....................................................................................................... 325
Благодарности ............................................................................................................ 327
Список литературы................................................................................................... 329

168
1. Введение
Актуальность темы
Цифровые данные генерируются каждую секунду во всем мире в
структурированном, полуструктурированном и неструктурированном формате. К
сожалению, традиционные методы анализа данных не могут справиться с такими
объемами данных, учитывая их сложную структуру. Поэтому аналитика больших
данных стала важной областью исследований и интенсивно изучается для решения
этих проблем.
Анализ тональности в социальных сетях и на электронных рынках стал
развивающейся тенденцией. Подготовка и преобразование необработанных
текстовых данных в форму, пригодную для применения желаемого анализа,
является наиболее трудоемким и вычислительным этапом в любой аналитической
задаче. В данной работе предлагается модель предварительной обработки
текстовых данных с использованием комбинации методов ОЕЯ. Предложенная
модель улучшает качество получаемых данных, сохраняя контекст текста.
Извлечение аспектных терминов для бесструктурного текста является
основной задачей, включенной в анализ тональности относительно аспектов. Эта
значимость опирается на зависимость других задач от результатов, которые она
предоставляет, что напрямую влияет на точность конечных результатов анализа
тональности. В данной работе предложена модель Извлечение Аспектных
Терминов. Модель основана на кластеризации векторов слов, сгенерированных с
помощью предварительно обученной модели BERT. Для улучшения качества
кластеров слов, полученных с помощью алгоритма кластеризации K-Means++,
была использована техника снижения размерности "SOM".

169
Классификация по полу представляет собой важную задачу в моделировании
поведения пользователей. В данной работе предлагается динамическая обрезанная
модель n-грамм для распознавания пола клиентов по их именам пользователей. Она
использует доступность данных об отзывах на веб-сайтах и извлекает набор
данных об именах пользователей. Идентификация пола клиента по имени его
профиля сталкивается с рядом проблем, которые мы четко обозначили.
Предлагаемая модель состоит из нескольких эффективно взаимодействующих
подзадач, включая сегментацию, числовую подстановку, нечеткое сопоставление и
т. д.
Мнения клиентов в Интернете представляют собой значительный ресурс, из
которого как клиенты, так и предприятия извлекают много информации,
помогающей им принять правильное решение. Поиск релевантных данных при
поиске в интернете представляет собой большую проблему для пользователей сети,
известную как "проблема информационной перегрузки". Рекомендательные
системы были признаны перспективным способом решения таких проблем. В
данной диссертации представлена система рекомендаций продуктов под названием
"SmartTips". Предложенная модель основана на анализе тональности относительно
аспектов, который использует отзывы потребителей и применяет модель
Извлечение Аспектных Терминов для оценки различных продуктов и извлечения
предпочтений пользователей. Были рассмотрены несколько факторов, включая
голоса читателей, частоту терминов аспекта, частоту слов мнения и т.д.
Цели и задачи исследования
I. Цели исследования:
Основной целью данной диссертации является изучение теоретических,
методологических и практических вопросов аналитики больших данных,
направленных на разработку вычислительных алгоритмов и реализацию
соответствующего программного обеспечения, работающего в режиме реального

170 времени, для обеспечения эффективной обработки текстового контента онлайн с
использованием структуры больших данных. Эти алгоритмы основаны на новых
инкрементальных подходах известных методов Обработка Естественного Языка.
Предложенные алгоритмы направлены на максимизацию преимуществ доступных
текстовых ресурсов и извлечение наибольшего количества информации с учетом
различных факторов, влияющих на качество полученной информации.
II. Основные задачи исследования:
Чтобы достичь указанных целей, были поставлены следующие задачи, для
решения которых необходимо решить соответствующие задачи:
1. Анализ проблемных вопросов, связанных с большими данными, включая
хранение, обработку и анализ данных.
2. Изучение современных методов в области интеллектуального анализа
текстов, Обработка Естественного Языка и веб-рекомендаций.
3. Изучение различных методов ОЕЯ для обоснования возможностей
разработанной конвейерной модели для обработки текстов.
4. Сбор и формирование разнообразного набора данных из реальных онлайн-
ресурсов, которые послужат экспериментальным полем для разработанных
алгоритмов.
5. Разработка новой модели для извлечения значимых аспектных терминов из
текста с использованием методов машинного и глубокого обучения.
6. Разработка алгоритма гендерной классификации на основе динамически
обрезанной модели n-грамм и предложенного конвейера для обработки
данных.
7. Разработка рекомендательной модели на основе предложенного алгоритма
Извлечение Аспектных Терминов и анализ тональности.

171
8. Внедрение программного обеспечения на основе предложенных моделей с
целью экспериментальной проверки их эффективности.
Степень достоверности результатов
▪ Эксперименты с предложенным конвейером для предварительной обработки
естественного текста показывают улучшение качества обработанного текста,
что впоследствии положительно сказывается на применяемой методике
анализа.
▪ Алгоритм, предложенный для Извлечение Аспектных Терминов,
обеспечивает улучшение извлечения признаков из свободного текста, что
превосходит базовые методы.
▪ Алгоритм для определения пола дает многообещающие результаты,
учитывая небольшой объем информации, необходимой для классификации.
▪ Модель для веб-рекомендаций показала приемлемую производительность
при извлечении предпочтений пользователя и составлении рекомендаций в
дополнение к решению проблемы холодного старта.
▪ Эксперимент с предложенными моделями подтверждает возможность их
реализации и демонстрирует их эффективность.
Методология и методы исследования
Методы исследования получены и обоснованы с помощью методов сбора
данных, извлечения информации, разбора текста, распознавания образов,
статистического анализа, глубокого обучения, машинного обучения, лингвистики,
обработка естественного языка и др.
В диссертации используется общая методология наук о данных и информации,
основанная на сборе и предварительной обработке данных, представлении текста,

172 моделировании, анализе и обобщении теоретического и практического материала
работы.
Степень разработанности темы
Предлагаемое в диссертации исследование основано на теоретических
подходах и практических приложениях, представленных и обоснованных в
российской и международной научной литературе.
На сегодняшний день аналитика больших данных является одним из наиболее
перспективных и быстро развивающихся направлений в науках о данных и во всем
современном бизнесе. Обработка естественного текста до сих пор остается
сложной задачей, поскольку не существует стандартных процедур, пригодных для
решения всех задач анализа. Кроме того, разработка независимой от домена
Извлечение Аспектных Терминов модели является обязательным. Кроме того,
необходимо генерировать рекомендации в реальном времени с приемлемой
точностью предсказания. В целом, научные области, связанные с проблемой
исследования данной диссертации, включают Обработка Естественного Языка,
Анализ тональности относительно аспектов, Гендерная Классификация и
Рекомендательные Системы.
В последнее время уже предложено множество алгоритмов для решения
упомянутых выше проблем. Однако масштабируемость алгоритмов, решающих эти
и другие проблемы на больших данных, по-прежнему является основным
направлением исследований в этой области. Кроме того, степень проработки
предлагаемых решений все еще недостаточна с точки зрения точности,
эффективности и сложности.
Научная новизна работы
Научная новизна диссертации заключается в том, что проведенные
исследования и прикладной анализ привели к новым решениям исследовательских
задач, связанных с текстовой аналитикой больших данных.

173
Результаты диссертационного исследования по научной новизне можно
классифицировать следующим образом:
1. Предложена ансамблевая модель для предварительной обработки
естественного текста, которая улучшает качество получаемого текста и
результаты анализа. Предложенная методика значительно сохраняет
контекст текста. Кроме того, процедура коррекции опечаток значительно
сокращает объем неопознанного текста.
2. Разработка новой методики Извлечение Аспектных Терминов из
естественного текста. Алгоритм основан на нейронных сетях и методах
глубокого обучения. Предложенная методика не зависит от конкретной
области.
3. Разработка метода гендерной классификации на основе словаря. Предложена
динамическая обрезанная модель n-грамм для извлечения признаков. Также
применяется декодирование leetspeak для извлечения оригинальных имен.
4. Разработка модели рекомендаций на основе анализа тональности
относительно аспектов. Предлагаемая модель извлекает предпочтения
пользователей и использует их для взвешивания предпочтительных аспектов,
чтобы оценить продукты-кандидаты. Она может справиться с проблемой
холодного запуска.
Положения, выносимые на защиту
На защиту диссертационного исследования выносятся следующие положения:
1. Разработан и реализован ансамблевый метод предварительной обработки
естественного текста, учитывающий различные факторы, влияющие на
качество текста.
2. Предложен новый доменно-независимый алгоритм извлечения аспектных
терминов.

174
3. Представлена новая модель идентификации пола, использующая
декодирование leetspeak и динамическую обрезанную модель n-грамм для
извлечения признаков.
4. Разработана рекомендательная модель, основанная на Извлечение
Аспектных Терминов и анализ тональности. Предложенная модель
гарантирует получение прогнозов, даже если пользователь является
новичком.
Теоретическая и практическая значимость работы
Теоретическая ценность данной работы для будущих исследований
заключается в предложенном анализе проблем аналитики больших данных и
разработке методов предварительной обработки естественного языка, гендерной
классификации, Извлечение Аспектных Терминов и онлайновой
рекомендательной системы. Были проанализированы фундаментальные и
современные алгоритмы и методы решения. Такие алгоритмы могут быть
использованы в современных системах, работающих на основе наук о данных,
таких как социальные сети, электронный маркетинг, рекомендации в реальном
времени.
Практическая ценность работы заключается в предложенных новых
алгоритмах. Эти алгоритмы могут быть использованы в указанных системах и
удовлетворить потребности пользователей в быстром анализе данных и
формировании результатов в реальном времени. Научная обоснованность
результатов работы подтверждается использованием результатов вычислительных
экспериментов.

175 Личный вклад автора
Все основные научные результаты в данной диссертации достигнуты автором
лично и представлены в совместных авторских работах с Российским членом
(Новиков Б.А.) и Египетскими членами (Хефни Х.А. и Гадаллах А.М.).
Апробация работы и публикации
Материалы, представленные в данной диссертации, были представлены на
российских и международных конференциях:
1. 14th International Baltic Conference on Databases and Information Systems (Baltic
DB&IS 2020), Tallinn, Estonia, June 16-19, 2020, http://ceur-ws.org/Vol-
2620/paper6.pdf; "Aspect-Oriented Analytics of Big Data".
2. 2020 International Multi-Conference on Industrial Engineering and Modern
Technologies (FarEastCon), Vladivostok, Russia, October 6-9, 2020,
https://ieeexplore.ieee.org/document/9271467; "An Integrated Framework for Web
Data Preprocessing Towards Modeling User Behavior".
3. The National (All-Russian) Conference on Sciences and Humanities – «Science
SPbU – 2020», St. Petersburg, Russia, December 24, 2020,
https://events.spbu.ru/events/science-2020; "A Hybrid Model for Analyzing
Customer Reviews Through A Big Data Platform".
4. The International Conference on Sciences and Humanities "Science SPbU – 2020",
St. Petersburg, Russia, December 25, 2020, https://events.spbu.ru/events/science-
spbu; "Using Natural Language Processing Techniques and Machine Learning to
Analyze Textual Data: A Big Data Approach".
5. 2021 IEEE Conference of Russian Young Researchers in Electrical and Electronic
Engineering (ElConRus), Moscow and St. Petersburg, Russia, January 26-29, 2021,
https://ieeexplore.ieee.org/document/9396606?fbclid=IwAR05rq_TSmkTVTT7nyQ

176
lNreWdWQxobzBotMhhSKXwCThuqucQMubylil3jk; "A Multi-Source Big Data
Framework for Capturing and Analyzing Customer Feedback".
6. All-Russian Conference on Natural Sciences and Humanities with International
Participation "Science SPbU - 2021", St. Petersburg, Russia, December 28, 2021,
https://events.spbu.ru/events/nauka-2021; "An Ensemble for Natural Text
Processing".
Основные результаты по теме диссертации представлены в 5 публикациях [1-
5]:
1. Ali N. M., Novikov B. A. Big Data: Analytical Solutions, Research Challenges and
Trends // Proceedings of the Institute for System Programming of the Russian
Academy of Sciences. ‒ 2020. ‒ Vol. 32, No. 1. ‒ P. 181-204. ‒ DOI:
10.15514/ISPRAS-2020-32(1)-10.
2. Ali N. M. Aspect-Oriented Analytics of Big Data // The 14th International Baltic
Conference on Databases and Information Systems (Baltic DB&IS 2020) / Ed.
Matulevičius R. et al. ‒ Vol. 2620: CEUR Workshop Proceedings ‒ Tallinn, Estonia:
CEUR-WS.org, 2020. ‒ P. 41-48
3. Ali N. M., Gadallah A. M., Hefny H. A., Novikov B. An Integrated Framework for
Web Data Preprocessing Towards Modeling User Behavior // 2020 International
Multi-Conference on Industrial Engineering and Modern Technologies (FarEastCon)
‒ Vladivostok, Russia: IEEE, 2020. ‒ P. 1-8. ‒ DOI:
10.1109/FarEastCon50210.2020.9271467.
4. Ali N. M., Novikov B. A Multi-Source Big Data Framework for Capturing and
Analyzing Customer Feedback // 2021 IEEE Conference of Russian Young
Researchers in Electrical and Electronic Engineering (ElConRus) / Ed. Shaposhnikov
S. ‒ Moscow and St. Petersburg, Russia: IEEE, 2021. ‒ P. 185-190. ‒ DOI:
10.1109/ElConRus51938.2021.9396606.

177 5. Ali N. M., Gadallah A. M., Hefny H. A., Novikov B. A. Online Web Navigation
Assistant // Vestnik Udmurtskogo Universiteta. Matematika. Mekhanika.
Komp'yuternye Nauki. ‒ 2021. ‒ Vol. 31, No. 1. ‒ P. 116-131. ‒ DOI:
10.35634/vm210109.
Структура диссертации
Диссертация состоит из введения, пяти глав, заключения, списка сокращений,
рисунков, таблиц и ссылок. Общий объем диссертации составляет 183 страницу,
содержит 27 рисунков и 19 таблиц. Список литературы содержит 178
наименований.

178
1. Глава 1.
Исследование предметной области
1.1. Введение
Этот факт объясняется популярностью Интернета, появлением веб-
технологий и увеличением использования цифровых датчиков, коммуникаций,
вычислений и хранения, которые создают массивные коллекции данных [6]. Объем
данных, доступных в Интернете, измеряется в эксабайтах (1018) и зеттабайтах
(1021). Соответственно, ожидается, что в ближайшие несколько лет объем данных
в Интернете превысит объем памяти мозга живых людей во всем мире [7].
Цифровые данные, генерируемые каждую секунду во всем мире, производятся
в структурированном, полуструктурированном и неструктурированном формате.
Это массовое накопление генерируемых данных известно как "Большие данные".
Более того, создание и внедрение специализированных приложений, связанных с
социальными сетями, маркетингом, электронной коммерцией и т.д., предоставляет
широкие возможности и проблемы для исследователей и практиков. Огромный
объем данных, генерируемых пользователями, использующими эти платформы,
является результатом интеграции их опыта и повседневной деятельности [8].
В последнее время аналитика больших данных стала важной областью
исследований и интенсивно изучается. К сожалению, традиционные методы
анализа данных могут оказаться неспособными обрабатывать такие большие
объемы данных [9]. Такие данные состоят из наборов данных, которые трудно
анализировать традиционным системам управления базами данных [10]. Поэтому
эта развивающаяся область привлекает исследователей по всему миру к

179 проектированию, разработке и внедрению различных инструментов, методов,
архитектур и платформ для анализа растущего объема генерируемых данных [11-
14].
Заинтересованным исследователям предлагается решить несколько задач и
ответить на следующие вопросы: (1) Как спроектировать и разработать
высокопроизводительную структуру для эффективного анализа больших данных;
и (2) Как разработать подходящий алгоритм для добычи и извлечения полезной
информации из больших данных [9]. Для глубокого обсуждения этих вопросов
структура главы представлена ниже.
Этот раздел является вводным, в нем рассказывается о тематике и мотивах
данной работы. Далее в разделе 2 описываются тематические основы и наиболее
значимые аспекты больших данных, включая основные характеристики. В разделе
3 представлено исследование аналитики больших данных и указаны преимущества
использования решений на основе больших данных. Кроме того, в нем
утверждаются необходимые предварительные оценки, требуемые для успешного
перехода на новые технологии. Далее, в разделе 4 представлены наиболее
значимые области, в которых используются приложения больших данных, чтобы
получить широкую перспективу в отношении аналитики больших данных. Анализ
отзывов потребителей как существенный ресурс как для потребителей, так и для
компаний, а также одна из наиболее значимых областей применения аналитики
больших данных обсуждается в разделе 5 с концентрацией на Анализ тональности
и Анализ тональности относительно аспектов как перспективных методах, широко
используемых для получения информации об отзывах потребителей; наконец, в
разделе 6 представлено резюме главы и некоторые выводы, которые были сделаны.
1.2. Большие данные: Понятия и характеристики
В этом разделе представлены теоретические концепции больших данных и их
характеристик, чтобы выявить проблемы, связанные с аналитикой больших данных
в различных областях применения. Выявление этих проблем помогает определить

180 на высоком уровне основные функциональные и нефункциональные требования,
которые необходимо учитывать при проектировании и разработке систем
аналитики больших данных.
1.2.1. Понятия и определения
Исходя из факта существования многих видов современных цифровых
технологий, которые проникли в нашу повседневную жизнь, таких как мобильные
телефоны, датчики и социальные сети, благодаря расширению использования
передовых цифровых артефактов. Распространение этих технологий в
повседневной жизни усиливает взаимодействие человека с человеком, человека с
машиной и машины с машиной на беспрецедентном уровне, что приводит к
появлению огромных объемов данных, известных как Большие Данные. Появилось
несколько предложений, чтобы описать это явление и дать определение термину
Большие данные, придуманному Roger Magoulas из O'Reilly Media в 2005 году [15].
James Manyika et al. [16] определяют Большие данные как "наборы данных,
размер которых выходит за рамки возможностей типичных программных средств
баз данных для сбора, хранения, управления и анализа". Согласно этому
определению, не существует стандартных границ для рассмотрения наборов
данных в качестве больших данных (например, описывать большие данные как
превышающие определенное количество терабайт). Также можно заметить, что
объем данных не является единственным фактором при рассмотрении набора
данных как больших данных. Поэтому важно отличать большие данные от
массивных данных.
Аналитическая фирма Gartner [17] вводит определение больших данных,
которое считает одним из наиболее полных и широко используемых в данном
контексте: "Большие данные - это большие объемы, высокая скорость и/или
большое разнообразие информационных активов, которые требуют экономически
эффективных, инновационных форм обработки информации, позволяющих
улучшить понимание, принятие решений и автоматизацию процессов".

181
Проблема с определением Gartner заключается в том, что, помимо изложения
основных характеристик больших данных, оно также фокусируется на описании
того, как польза от больших данных может быть достигнута, и излагает желаемый
результат. В соответствии с четким пониманием этих перспектив, организации
могли бы определить, используют ли они решения на основе больших данных или
даже если у них есть проблемы, требующие решения на основе больших данных,
относительно трудностей в определении того, что предполагается спроектировать,
разработать и поставить, и что результат означает для организации.
Согласуясь с определением Gartner, David Loshin в [18] утверждает, что
"Большие данные - это в основном применение инновационных и экономически
эффективных методов для решения существующих и будущих бизнес-задач,
требования к ресурсам которых превышают возможности традиционных
вычислительных сред". Более того, Krish Krishnan [19] определяет Большие данные
как "объемы данных различной степени сложности, генерируемые с разной
скоростью и разной степенью неоднозначности, которые невозможно обработать с
помощью традиционных технологий, методов обработки, алгоритмов или каких-
либо коммерческих готовых решений".
Аналогично, основываясь на различиях между возможностями устаревших
технологий баз данных и новыми методами и инструментами хранения и обработки
данных (например, кластеры Hadoop, фильтры Блума и инструменты анализа
данных R), Davis и Patterson [20] утверждают, что большие данные относятся к
"данным, слишком большим для обработки и анализа традиционными
протоколами баз данных, такими как SQL". Также Paul C. Zikopoulos et al. [21]
говорят: "Большие данные относятся к информации, которая не может быть
обработана или проанализирована с помощью традиционных процессов или
инструментов".

182
1.2.2. Характеристики 4V
В основном, при популяризации концепций больших данных, группа авторов,
упомянутых ранее, отходит от рассмотрения только аспекта объема данных в
процессе определения Больших Данных! Следовательно, помимо объема данных,
существуют и другие значимые характеристики больших данных, которые
необходимо учитывать. Исследовательское сообщество старается придерживаться
того, что привлекает внимание в общих частях представленных определений,
которые в значительной степени сосредоточены на том, что называется 3, 4 или
даже 9 V, как показано в [22].
Хотя определение V's является повсеместным, следует отметить, что
происхождение концепции не совсем новое, его дал аналитик Doug Laney в
исследовательской записке, опубликованной Meta Group (сейчас Gartner Group), от
2001 года, касающейся "3-D Data Management" [23]. Автор отметил, что изменение
экономических условий влияет на усилия, предпринимаемые компаниями,
поскольку они борются за стандартизацию систем и сворачивание избыточных баз
данных для обеспечения большей операционной, аналитической и совместной
согласованности; это также усложняет эту задачу. Кроме того, он называет
электронную коммерцию причиной роста проблем управления данными по трем
направлениям: Объемы, Скорость и Разнообразие. Наконец, автор советует
организациям, занимающимся информационными технологиями, собрать в своем
распоряжении различные методы для решения каждой из них.
Как правило, большие данные характеризуются четырьмя V, как показано на
Рисунок 1.1: Объем, Скорость, Разнообразие и Правдивость. Другие исследователи
развили эту тенденцию и включили дополнительные V, такие как визуализация или
достоверность, чтобы извлечь выгоду из очевидного улучшения определения.
Далее следует краткое обсуждение фундаментальных характеристик больших
данных.

183
Рисунок 1.1. Характеристики больших данных
• Объем: Как следует из названия, объем данных превышает возможности
традиционных оперативных баз данных или хранилищ данных. В 2019 году
"Hootsuite & We Are Social" опубликовали отчет Global Digital Statshot о
тенденциях развития интернета в третьем квартале [24]. Отчет демонстрирует
непрерывный рост цифрового подключения с необычайной скоростью по всему
миру. Авторы утверждают, что за последний год каждый день почти 900 000
человек впервые выходили в сеть. Кроме того, многие факторы увеличивают
объем данных, например, потоковые данные, хранение различных типов
данных из социальных сетей и других ресурсов. Более того, Интернет вещей
(IoT) и разбросанные по всему миру датчики во всех устройствах, которые
ежесекундно генерируют данные, являются основным фактором,
способствующим расширению цифровой вселенной [25]. Соответственно,
International Data Corporation (IDC) ожидает, что к 2025 году глобальная
датасфера вырастет примерно на 61% с 33 зеттабайт (ЗБ) в 2018 году до 175 ЗБ.
Отмечается, что в облаке размещается столько же данных, сколько и в центрах
обработки данных [26]. Поэтому компаниям необходимо приспособиться к

184
новым объемам путем совершенствования стратегий архивирования и
важности данных.
• Скорость: Обозначает скорость генерирования, хранения, анализа и
визуализации данных. Отмечается высокая скорость потока данных,
поступающих на хостинг-платформы. В настоящее время скорость генерации
данных практически невообразима. Например, на YouTube пользователи
загружают более 720 000 часов нового контента в день, что означает 500 часов
свежего видео в минуту [27]. Кроме того, ежедневно отправляется 500
миллионов твитов, в среднем более 20 000 твитов в минуту [28]. Кроме того, в
2014 году исследовательский центр Facebook сообщил, что генерируется более
четырех новых петабайт данных и выполняется 600 000 запросов в день [29].
Помимо высокой скорости генерации данных, эта характеристика накладывает
существенный отпечаток на старение данных и срок их жизни. Как долго
данные будут иметь ценность - это большая проблема, с которой приходится
сталкиваться организациям в связи с высокой скоростью генерации и
использования данных в режиме реального времени. Скорость генерации
данных требует успевать выполнять задачи по обработке, чтобы удовлетворить
спрос. Иногда скорость применения анализа потоковых данных имеет
решающее значение [30].
• Разнообразие: Большие данные относятся к большим объемам данных,
генерируемых в различных форматах. Сложность форматов Больших данных
требует различных подходов и методов для хранения всех необработанных
данных. Несколько различных типов данных отличаются по способу создания
и хранения. Эти типы требуют применения различных видов анализа или
использования различных инструментов. В соответствии с природой и
характеристиками данные делятся на три типа.
o Структурированные данные: Большинство созданных цифровых данных в
прошлом были структурированными данными, но сегодня они составляют

185
около 10% от общего объема цифровых данных. К этому типу данных
относятся все данные, которые могут быть аккуратно уложены в столбцы и
строки и сохранены в электронной таблице или базе данных. Реляционные
данные (например, база данных SQL), метаданные (например, время и дата
создания), библиотечные каталоги (например, дата и автор), записи
переписи населения (доходы и занятость) и экономические данные
(например, GDP) являются различными примерами этого типа.
o Полуструктурированные данные: Этот тип относится к данным с
некоторыми организационными свойствами; такой формат может помочь в
процессе анализа, также известен как самоописывающаяся структура.
Примерами полуструктурированных данных являются XML (например,
хранимые персональные данные), JSON (например, документы сценариев)
и NoSQL (например, базы данных типа MongoDB).
o Неструктурированные данные: Этот тип относится, как следует из
названия, к несистематизированным данным. Сюда можно отнести все виды
данных, которые имеют неизвестную форму или структуру. Сегодня более
80% данных, которые генерируют организации, являются
неструктурированными данными. Существует множество примеров
неструктурированных данных, таких как данные датчиков, потоки
социальных сетей, изображения, видео, данные мобильных устройств,
текстовые файлы и т.д.
• Правдивость: Относится к достоверности данных. Многие части данных
считаются бесполезными, такие части включают шум, смещения, аномалии и
аномальные данные. Неверные данные приведут к недостоверным результатам
и неверным решениям. Поэтому перед началом анализа организации должны
решить, являются ли данные значимыми или нет. Соответственно, обеспечение
надежности источников данных и корректности данных является

186
обязательным. Поэтому разработчики стали активнее и охотнее вкладывать
средства в очистку данных в источнике.
Следовательно, осознание огромной бизнес-ценности данных является
основной причиной использования больших данных. Поэтому термин "большие
данные" выходит за рамки ссылки только на наборы данных и расширяется,
охватывая пространственные проблемы, технологии и возможности для
повышения ценности бизнеса, поэтому его считают общим термином. Однако
ожидание того, что прилагательное большой со временем поблекнет, все еще
считается значимым, поскольку явное значение данных будет интуитивно
расширяться и включать все типы данных [31].
1.3. Аналитика больших данных
Сегодня предприятия стремятся обнаружить неизвестные им ранее факты
путем поиска в огромных массивах высокодетализированных данных. Анализ
больших массивов данных раскрывает и улучшает ценности бизнеса. Однако
растущие объемы данных увеличивают трудности с управлением и
манипулированием. В этом разделе демонстрируются концепции и основы
аналитики больших данных, а также преимущества использования доступных
ресурсов больших данных для Бизнес Разведка (БР) [32].
1.3.1. Концептуализация темы
Аналитика больших данных (АБД) относится к передовым аналитическим
методам, применяемым к большим наборам данных [33]. Примером аналитических
задач может быть поиск конкретных данных, закономерностей, извлечение
данных, их организация и т.д. Таким образом, применение передовых
аналитических методов включает в себя все процессы и инструменты,
необходимые для извлечения знаний [34]. Эти процессы включают в себя
множество задач, которые начинаются со сбора и извлечения данных, затем
следует преобразование данных. Затем подготовка и загрузка данных для анализа,

187 включая использование соответствующих инструментов и методов для получения
желаемых результатов и, наконец, предоставление реализованных результатов для
поддержки лиц, принимающих решения [35].
В целом, анализ данных предполагает изучение наборов данных для
выявления скрытых закономерностей, корреляций и других моментов, а также для
получения выводов. Эти задачи можно разделить на три основные области:
статистический анализ, моделирование и прогнозный анализ [36]:
• Статистический анализ: Применительно к бизнес-аналитике он предполагает
сбор и изучение каждой выборки данных в виде набора элементов, из которых
можно сделать выводы. Он строго связан с проверкой гипотез, а его основная
цель - распознавание и прогнозирование будущих тенденций.
• Моделирование: Относится к процессам, используемым для определения,
описания и анализа требований к данным, а также для описания общего
поведения системы, играет решающую роль в развитии любого бизнеса. Эти
процессы включают использование математических уравнений или какого-
либо логического языка. Основная цель моделирования данных - поддерживать
бизнес-процессы и давать ответы на бизнес-вопросы более легко и быстро.
• Прогнозирующий анализ: Представляет собой разновидность продвинутой
аналитики, направленной на угадывание поведения индивидуума, группы или
объекта данных и прогнозирование тенденций на основе исторических данных
или признанного поведения аналогичных индивидуумов или групп. Он
включает в себя несколько типов алгоритмов, таких как рекомендатели,
классификаторы и кластеризация.
Аналитика больших данных отличается от аналитики малых и традиционных
данных. С этой точки зрения Joshua Eckroth [11] определяет большие данные в
адаптации с определением Philip Russom [33] следующим образом: "Задача анализа
данных может быть описана как большие данные, если данные, подлежащие

188 обработке, имеют настолько большой объем или скорость, что для хранения и/или
обработки данных требуется более одной товарной машины."
Иначе, с точки зрения бизнес-аналитики и преимуществ аналитики данных,
Rick F. van der Lans [37] говорит: "Большие данные революционизируют мир
бизнес-аналитики и аналитики". Таким образом, аналитика больших данных
вращается вокруг двух элементов, больших данных и аналитики, и как
сотрудничество и сочетание этих двух элементов может создать одну из самых
интеллектуальных тенденций в бизнес-аналитике сегодня [33].
1.3.2. Преимущества использования решений для анализа больших
данных
Несмотря на трудности и проблемы, связанные с созданием и развитием
аналитических платформ для больших данных из-за сложной природы больших
данных, предприятия быстро работают над созданием аналитических решений для
больших данных. Такая ситуация объясняется тем, что они предоставляют большие
возможности для перехода от традиционных методов извлечения информации к
новым измерениям. Решения, принимаемые без ответов, основанных на данных,
скорее всего, будут неудачными, поэтому организации должны создавать системы,
поддерживающие принятие решений на основе данных [38].
Традиционно организации признавали, что глубокое понимание собственных
данных может значительно повысить эффективность их бизнеса. Важность
больших данных зависит не только от объема данных, которыми располагает
компания, но и от того, как компания использует собранные данные. Таким
образом, аналитика больших данных представляет собой конкурентное
преимущество для бизнеса. Достигнутые выгоды и ценности при использовании
решений по анализу больших данных могут определяться тем, как предприятия
используют данные [39].

189
В настоящее время предприятия сталкиваются с задачами по созданию новых
бизнес-действий, основанных на преимуществах, которые приносят доступные
виды анализа. Эффективный анализ собственных и собранных данных помогает
бизнесу находить ответы для повышения ценности организации [40]. Более того,
компании, использующие комплексные решения по анализу больших данных,
осознают преимущества, получая еще более глубокие знания, которые
способствуют принятию разумных решений. Эти знания представляют собой
новые способы ведения бизнеса за счет использования новых типов аналитики,
охватывающих различные типы данных.
Таким образом, мы можем классифицировать существенный вклад больших
данных в организацию на четыре основных класса; суть этих классов и их
подпунктов отражает добавление ценности для организации через реализованные
преимущества с помощью решений по аналитике больших данных. Здесь нет
ограничительных границ из-за интеграции друг с другом, поэтому некоторые из
основных элементов могут принадлежать более чем к одной категории [41-43]:
I. Увеличение доходов:
o Повышение ценности онлайн и офлайн взаимодействия с клиентами.
o Генерируйте предложения для клиентов на основе их покупательских
привычек.
o Улучшение вовлеченности клиентов и повышение их лояльности.
o Контроль репутации в Интернете.
o Персонализация клиентского опыта.
II. Снижение затрат:
o Оптимизация времени обработки и качества результатов.
o Экономия и контроль затрат.
III. Повышение производительности:
o Позволяет разрабатывать новые продукты и услуги.
190
o Увеличение возможностей увязки производства с потребностями
рынка.
o Увеличение возможностей редизайна продукции.
IV. Снижение рисков:
o Полное понимание возможностей маркетинга, основанного на данных.
o Получение более достоверного понимания условий рынка.
o Быстрая переоценка портфелей рисков.
o Выявление в реальном времени первопричин неудач и проблем.
1.3.3. Предварительная оценка
Прежде чем приступить к созданию нового решения для работы с большими
данными, предприятия должны провести первичную оценку. Миграция с
традиционных аналитических решений на большие данные может занять много
времени и потребовать дополнительных инвестиций в инфраструктуру. Поэтому
важно знать фактическое состояние бизнеса и оценить потребности этого шага.
Компромисс между затратами и потенциальными выгодами необходим для выбора
оптимального пути и принятия решения о том, продолжать ли использовать
традиционные схемы или трансформировать их в новые. Без надлежащей
организационной оценки и готовности ни одна из стратегий, скорее всего, не будет
успешной [44].
Подход на основе больших данных больше подходит для решения или
устранения бизнес-проблем, которые отвечают одному или нескольким из
следующих критериев, изображенных на Рисунок 1.2 [45]. Эти критерии оценки
могут быть использованы для оценки соответствия бизнес-проблем технологии
больших данных, если существует корреляция с бизнес-проблемами, решения
которых подходят для приложений анализа больших данных.

191
Рисунок 1.2. Критерии оценки для построения решения для работы с большими
данными
1.4. Применение аналитики больших данных
В связи с непрерывным ростом аналитики больших данных и ее
существенным влиянием на жизнь человека, приложения больших данных
открывают передовые возможности в каждом аспекте нашей повседневной жизни.
Основная цель приложений больших данных - помочь компаниям принимать более
информативные бизнес-решения путем анализа больших объемов данных,
учитывая огромную конкуренцию, в которой мы живем во всем мире [46].
Применение больших данных позитивно меняет нашу жизнь к лучшему и
делает ее более гладкой. Мы используем решения на основе больших данных для
повышения нашей эффективности и производительности. Эта возможность
побуждает исследователей и поставщиков технологий разрабатывать сложные
платформы, структуры и алгоритмы для решения задач, связанных с большими
данными.
В Таблица 1.1 приведены наиболее значимые области, где используются
приложения больших данных, а также имеющиеся ресурсы данных и тенденции
применения. Далее следует краткое обсуждение применения аналитики больших
данных в маркетинге и электронной коммерции, которая представляет собой
основную область данного исследования.

192 Таблица 1.1. Наиболее популярные приложения аналитики больших данных
Поле Ресурсы данных Тенденции применения
Образование
Личная информация; Академическая успеваемость; Посещаемость; Статус студента; Студенческая деятельность; Студенческие интересы; Финансовое положение; Планы курса; Детали персонала; Детали организации; Выражения лица.
▪ Расширение использования систем электронного обучения,
▪ Повышение результатов обучения студентов,
▪ Развитие системы оценивания, ▪ Привлечение внимания, ▪ Персонализированные
программы, ▪ Сокращение числа отсева.
Сельское хозяйство
Географические и климатические условия (например, климат, температура, осадки, влажность, солнечный свет); Растениеводство; Данные об использовании удобрений; Данные об использовании пестицидов.
▪ Прокормить растущее население, ▪ Этичное использование
пестицидов, ▪ Развитие социальной экономики, ▪ Управление теплицами и
выращивание сельскохозяйственных культур,
▪ Оптимизация эффективности выращивания культур,
▪ Оптимизация сельскохозяйственного оборудования,
▪ Управление цепочкой поставок, ▪ Автоматизация системы полива.
Здравоохранение
Диагностические отчеты; Аналитические отчеты; Записи посещений; Клинические исследования; Применение лекарств;
▪ Совершенствование процесса оказания медицинской помощи,
▪ Сокращение расходов денег и времени,
▪ Развитие новой инфраструктуры и служб экстренной медицинской помощи,
▪ Оценка симптомов, ▪ Прогнозирование заболеваний.

193
Поле Ресурсы данных Тенденции применения Направления упражнений; Страховые данные; Наблюдения за ходом лечения.
Умные города
Исторические и Географические данные (например, транспорт, преступления); сенсорные данные (например, железные дороги, аэропорты, морские порты, дороги, электроэнергия, вода, связь); Записи с камер.
▪ Интеллектуальное управление дорожным движением,
▪ Содействие общественной безопасности,
▪ Управление инфраструктурой умных городов,
▪ Оптимизация использования ресурсов,
▪ Управление деятельностью по техническому обслуживанию.
Криминальный анализ и
выявление мошенничества
Записи банковских операций; записи мобильных звонков; Интернет и социальные сети (например, сайты социальных встреч, такие как Facebook, Twitter, и LinkedIn).
▪ Определение случаев мошенничества против предприятий,
▪ Расследование претензий и транзакций в режиме реального времени,
▪ Обнаружение общих закономерностей в многочисленных транзакциях,
▪ распознавать аномальное поведение отдельных пользователей,
▪ Обнаружение мошенничества с кредитными картами.
Правительство
Правительственные записи; Записи о сделках; Цифровой правительственный портал; Социальные сети (например, Facebook, Twitter и LinkedIn); Данные о жителях;
▪ Поддержка избирательных кампаний правительства,
▪ Дополнение политики, ▪ Усиление мер реагирования на
чрезвычайные ситуации, ▪ Борьба с отмыванием денег, ▪ Предотвращение внутренних
угроз, ▪ Повышение эффективности
трудовых ресурсов,

194
Поле Ресурсы данных Тенденции применения Обратная связь и анкеты.
▪ Укрепление национальной безопасности.
Маркетинг и электронная коммерция
Данные о клиентах (например, личные данные, географические данные, предпочтения); записи о транзакциях в режиме онлайн; онлайн-обзоры и отзывы клиентов (например, рейтинги, вопросы); Электронная почта и SMS-сообщения; Социальные сети (например, Facebook, Twitter); Записи звонков в службу поддержки клиентов.
▪ Улучшенное прогнозирование и планирование,
▪ Более детальное нацеливание на аудиторию,
▪ Оптимизация кампаний в режиме реального времени,
▪ Переход к мультитач-атрибуции, ▪ Построение лучших отношений с
клиентами, ▪ Правильное позиционирование
бренда, ▪ Оптимизация цен, ▪ Разработка рекламных кампаний
и объявлений, ▪ Персонализация электронной
коммерции, ▪ Онлайновые рекомендательные
системы.
1.4.1. Применение АБД в маркетинге и электронной коммерции
Огромное расширение использования современных технологий и различных
устройств в коммерческих операциях сделало маркетинг и электронную торговлю
одной из самых информативных областей. Это развитие привело к радикальным
изменениям на карте мировой экономики из-за последовательных изменений в
торговле и маркетинговых стратегиях, чтобы идти в ногу с этим колоссальным
развитием. Маркетинговые тенденции для компаний полностью изменились [47].
Цифровой маркетинг - это ключ к успеху любой компании. Большие данные
сделали цифровой маркетинг мощным и стали неотъемлемой частью любого
бизнеса. Теперь любой бизнес может управлять маркетинговыми рекламными
мероприятиями, проводить успешные рекламные кампании и продвигать свои

195 товары и услуги независимо от своего размера. Различные формы маркетинговых
кампаний появляются в разных местах, таких как платформы социальных сетей
(например, Facebook, Linked In, Twitter и т.д.), реклама, размещенная на YouTube и
ТВ, веб-сайты компаний, цифровые рынки, текстовые сообщения, электронные
письма и т.д.
Аналитика больших данных предлагает несколько решений для помощи
предприятиям в анализе имеющихся огромных массивов данных [48]. В одном из
примеров исследуется, какие виды рекламы заставляют зрителей продолжать
просмотр, а какие отталкивают их. Он использует программное обеспечение для
распознавания лиц, чтобы узнать, насколько хорошо или плохо их реклама
стимулирует интерес к их продукции. Это помогает маркетологам создавать
широко распространенные рекламные объявления для увеличения продаж.
Еще один пример использования решений на основе больших данных для
анализа звонков клиентов. Анализ содержания записей контактов клиентов с колл-
центрами помогает определить их настроение, которое представляет собой
мощный барометр и фактор влияния на настроение рынка. Решения на основе
больших данных могут помочь распознать повторяющиеся проблемы или шаблоны
поведения клиентов и сотрудников путем понимания показателей точности
времени/качества, а также записи и анализа содержания звонка.
Более того, появление социальных сетей является одним из наиболее
существенных вкладов в большие данные. Исходя из его значимости, были
представлены различные решения для анализа действий пользователей [49-51].
Аналитика больших данных может дать ценные сведения в режиме реального
времени о том, как рынок реагирует на продукты и кампании [52]. Согласно
полученным результатам, компании могут корректировать свои цены,
прогнозировать спрос и его распределение, корректировать производство,
обновлять стратегии распределения, промоакции и размещение кампаний [53-56].
Таким образом, чтобы знать образ мыслей потребителя, необходимо применять
умные решения, полученные из больших данных [57].

196
Более того, всестороннее развитие электронной коммерции и расширение
электронных рынков для онлайн-покупок, таких как Amazon, eBay, Walmart,
BestBuy и т.д., создали конкурентную среду между компаниями для привлечения
наибольшего числа клиентов. Предприятия стремятся измерить несколько
факторов, таких как удовлетворенность клиентов, лояльность и успех
маркетинговых стратегий, анализируя отзывы клиентов через электронные
платформы, такие как веб-сайты и социальные сети [58-61].
Однако предприятия обязаны проводить предварительную оценку, поскольку
не все данные являются достоверными для обеспечения качества данных. Проверка
данных - это важная задача, которую необходимо выполнить до начала процесса
анализа, что помогает повысить качество результатов. Эти задачи могут включать
устранение поддельных отзывов и негативных комментариев, опубликованных
конкурентами [62].
1.5. Анализ отзывов потребителей
В последнее время покупки через Интернет стали разумным средством
выживания во время пандемии коронавируса, когда люди были вынуждены
практиковать социальное дистанцирование. Из роскоши он превратился в основное
средство приобретения и потребления. Растущее развитие интернет-технологий
также подтвердило этот феномен. Большинство интернет-магазинов, таких как
Amazon, Walmart и BestBuy, быстро укрепили свои платформы и позволили
клиентам выражать свое мнение относительно товаров и услуг.
Отзывы клиентов в Интернете представляют собой значительный ресурс как
для потребителей, так и для предприятий. Они могут повлиять на решения
потенциальных потребителей о покупке и привести их к другому выбору. С другой
стороны, для успеха компаний очень важно прислушиваться к своим клиентам.
Онлайн-отзывы могут обеспечить прямую обратную связь или помочь в выявлении
проблем обслуживания. Анализ этих отзывов полезен для поддержки редизайна

197 продукции и улучшения качества, а также для интернет-магазинов для разработки
своих рекламных кампаний и улучшения предоставляемых услуг.
1.5.1. Анализ Тональности
Мнение - это точка зрения или суждение о конкретной вещи или вопросе,
которое служит ключевым фактором, влияющим на процесс принятия решений
отдельными людьми. Растущее значение отзывов покупателей, которые содержат
ценные знания, побудило к большим усилиям по анализу этого огромного объема
данных для понимания поведения покупателей и извлечения полезных данных.
Изначально исследователям было достаточно использовать Анализ тональности
(АТ). Эта техника включает в себя автоматизированный процесс анализа текстовых
данных и классификации мнений, а также извлечение таких свойств отзывов, как
полярность, тема и носитель мнения [10, 63, 64].
Анализ тональности, также известный как поиск мнений, можно определить
как процесс, в котором передовые методы, такие как машинное обучение (МО),
глубокое обучение (ГО) и обработка естественного языка (ОЕЯ), используются для
анализа точек зрения и мнений людей по отношению к определенному объекту
[65]. На самом деле АТ работает только для определения полярности всего текста
(предложения или документа) и аннотирования его одним классом (негативный,
позитивный, нейтральный или конфликтный). Следовательно, стандарт АТ может
быть применен на двух уровнях:
(1). Уровень документа, который заключается в извлечении из текста слов,
выражающих мнение, и определении их полярности для определения
доминирующей полярности текста.
(2). Уровень предложения, который касается обнаружения субъективных
предложений, извлечения и классификации их полярности.

198
1.5.2. Анализ тональности относительно аспектов
Хотя анализ тональности не давал точного описания мнений клиентов
относительно конкретных аспектов или характеристик продуктов или услуг, для
удовлетворения таких потребностей и получения ценной информации было
разработано расширение методов анализа тональности под названием Анализ
Тональности Относительно Аспектов (АТОА). Соответственно, мы можем сказать,
что к АТ был добавлен дополнительный уровень: (3) аспектный уровень, который
касается извлечения пар " аспект- мнение" и определяет полярность по отношению
к отдельным аспектам.
Анализ тональности относительно аспектов - это тонкий анализ тональности,
в ходе которого выявляются настроения относительно различных аспектов. Термин
"аспект" относится к атрибутам продукта, характеристикам или особенностям
обслуживания. Основная цель - предсказать полярность настроений в отношении
заданных аспектов или целевых терминов в тексте.
Основной целью использования анализа тональности относительно аспектов
является извлечение и классификация аспектных терминов данного объекта, а
затем извлечение мнений, выраженных относительно этих аспектов, для
определения их полярности настроения. Другими словами, АТОА изучает каждый
обзор, чтобы распознать отдельные аспекты и определить соответствующее
настроение для каждого из них [66-68]. В отличие от анализа тональности, он
позволяет связать конкретные настроения с различными аспектами продукта или
услуги [69]. Следовательно, процедура применения АТОА включает следующие
подзадачи, как показано на Рисунок 1.3 [2, 70-72]:
(1). Извлечение аспектных терминов, которое заключается в извлечении
аспектных терминов, относящихся к предварительно определенному
целевому объекту (например, ноутбукам), позволяет получить список,
включающий все отдельные аспектные термины.

199
(2). Полярность аспектных терминов, которая заключается в определении
настроения по отношению к каждому аспектному термину из данного
набора и определении его полярности (положительная, отрицательная,
нейтральная или конфликтная).
(3). Определение категории аспекта, которое заключается в отнесении терминов
аспекта к соответствующей категории из заданного набора
предопределенных категорий аспектов (например, хранение, цена), которые
не обязательно появляются в тексте как термины аспекта.
(4). Полярность категории аспекта, которая касается определения настроения по
отношению к каждой категории аспекта из заданного набора
предварительно определенных категорий аспекта и принятия решения о ее
полярности.
Рисунок 1.3. Подзадачи Анализ тональности в отношении аспектов

200
1.6. Выводы
Цифровые данные генерируются каждую секунду во всем мире в
структурированном, полу структурированном и неструктурированном формате. К
сожалению, традиционные методы анализа данных не могут справиться с такими
объемами данных, учитывая их сложную структуру. Поэтому аналитика больших
данных стала важной областью исследований и интенсивно изучается для решения
этих проблем.
В этой главе мы представляем теоретические концепции больших данных и их
характеристик, чтобы выявить проблемы, связанные с аналитикой больших данных
в различных областях применения. Выявление этих проблем помогает определить
на высоком уровне основные функциональные и нефункциональные требования,
которые следует учитывать при проектировании и разработке систем анализа
больших данных. Кроме того, мы продемонстрировали концепции и основы
аналитики больших данных, а также преимущества использования доступных
ресурсов больших данных для бизнес-аналитики.
Основная цель применения больших данных - помочь компаниям принимать
более информативные бизнес-решения путем анализа больших объемов данных,
учитывая огромную конкуренцию в мире. В этом разделе мы рассмотрели наиболее
значимые области, в которых используются приложения больших данных, чтобы
продемонстрировать, как они положительно меняют нашу жизнь к лучшему и
более плавному, повышают эффективность и производительность. Также мы
указываем возможности для исследователей по разработке сложных платформ,
Фреймворков и алгоритмов для борьбы с проблемами больших данных.
Кроме того, мы рассмотрели анализ отзывов клиентов, представляющий
область наших исследований, которая имеет большое значение как для клиентов,
так и для предприятий. Анализ тональности и Анализ тональности относительно
аспектов также обсуждаются в связи с их значимостью для нашей работы, о чем мы
подробно расскажем в следующих главах.

201
2. Глава 2.
Сбор и предварительная обработка данных
2.1. Введение
Интернет, несомненно, является самым влиятельным источником текстов, и
поэтому автоматическое извлечение полезной и релевантной информации из
огромного количества данных представляет собой сложную задачу,
привлекающую исследователей из многих областей. Обработка естественного
языка (ОЕЯ), в частности, является одной из наиболее вовлеченных областей
исследований, которые принимают положительное участие в задачах обработки и
анализа текстов. Эта отрасль компьютерной науки в первую очередь занимается
созданием и разработкой методов, обеспечивающих компьютерам способность
подражать человеку в понимании произносимых слов и текстов.
Значимость обработки естественного языка и ее вклад в область
искусственного интеллекта привели к созданию нескольких реальных приложений,
основанных на методах автоматического понимания естественного языка. К таким
приложениям относятся виртуальные агенты, чат-боты, машинный перевод,
обнаружение спама, выявление фальшивых новостей, резюмирование текста и
анализ тональности социальных сетей.
В целом, обработка текста в ОЕЯ включает в себя несколько задач, целью
которых является преобразование данных естественного языка "письменного или
устного" в формы, позволяющие компьютеру понять и осмыслить их значение. Эти
задачи могут включать в себя: распознавание именованных сущностей,
разграничение смысла слов, распознавание речи, генерация естественного языка,

202 маркировка частей речи и анализ тональности. С другой стороны, задачи
предварительной обработки текста в ОЕЯ, такие как удаление стоп-слов,
лемматизация и стемминг, помогают уменьшить размер файла набора данных, а
также повысить эффективность любой системы информационного поиска (ИП).
Как правило, стандартная схема анализа текста включает в себя следующие
задачи: Сбор данных, предварительная обработка данных, обнаружение паттернов
и анализ паттернов. Задачи сбора и предварительной обработки данных являются
наиболее трудоемкими и вычислительно затратными этапами процесса анализа
текста. Они включают в себя выбор и сбор необходимых наборов данных из
различных источников, предварительную обработку исходных данных,
интеграцию данных из различных источников и преобразование их в форму,
пригодную для дальнейшего анализа.
К сожалению, собранные данные поступают в сыром формате (например,
неструктурированные данные) и не могут быть использованы непосредственно для
целей моделирования без предварительной обработки. Например, большинство
текстов, доступных в Интернете (например, отзывы клиентов), представлены в
формате HTML, и без встраивания разметки не обойтись. Таким образом,
необработанный текст обязательно нуждается в предварительной предобработке
для преобразования данных в предсказуемую и анализируемую форму, прежде чем
к нему можно будет применить какой-либо алгоритм для моделирования или
любого другого типа анализа данных, который может быть плодотворно
использован.
Не все данные полезны для любой цели анализа, поэтому очистка данных
представляет собой фундаментальную деятельность в предварительной обработке
текстовых данных; ее можно определить как процесс удаления ненужных
элементов и очистки исходных данных от шума, "который варьируется и зависит
от цели анализа текста", чтобы улучшить качество данных, что, в свою очередь,
влияет на результаты анализа.

203
В данной работе представлена структура больших данных для
предварительной обработки текстов на естественном языке; мы предложили
многоуровневую и рекуррентную модель подготовки данных, которая включает в
себя три уровня очистки и фильтрации данных. Мы изучили влияние
использования различных схем последовательности шагов на конечные
результаты. Кроме того, было рассмотрено несколько методов, чтобы выбрать
наиболее подходящий для нашей задачи анализа.
Этот раздел является вводным, в нем рассказывается о предмете и мотивах
данной работы. Далее в разделе 2 представлено краткое обсуждение ключевых
понятий ОЕЯ, включая токенизацию, удаление стоп-слов, лемматизацию,
сегментацию и тегирование частей речи. В разделе 3 представлены основные части
разработанной структуры больших данных, начиная со сбора необходимых
наборов данных, инфраструктуры хранения, интеграции данных из различных
ресурсов и, наконец, техники обработки. Далее, в разделе 4 представлена
предложенная модель предварительной обработки данных. Была представлена
краткая демонстрация основных процедур модели, включая ввод данных, очистку
и фильтрацию данных, а также исправление опечаток. Проведенные эксперименты,
доказывающие эффективность нашей модели, обсуждаются в разделе 5, где
изложены детали нашей реализации, описание собранных наборов данных. Кроме
того, в нем проводится исследование достигнутых результатов с их обсуждением;
наконец, в разделе 6 представлено резюме главы, а также сделаны некоторые
выводы.
2.2. Предпосылки исследования
Анализ текста требует нескольких задач предварительной обработки для
структурирования текста и извлечения характеристик, которые включают в себя
токенизацию, удаление стоп-слов, лемматизацию, маркировку частей речи (ЧР) и
сегментацию слов. Теперь мы дадим краткий обзор этих методов, которые
представляют собой ключевые понятия в ОЕЯ.

204
2.2.1. Токенизация
Несомненно, веб представляет собой самый важный источник текстов. Эти
необработанные тексты содержат множество бесполезных и неинтересных
деталей, которые можно по желанию отбросить, например, переносы строк,
пробелы, пустые строки, пунктуация и другие. Токенизация является одним из
наиболее важных ключевых понятий в обработке естественного языка. Ее можно
определить как процесс измельчения последовательности символов на части,
каждая из которых называется токеном. Токены представляют собой
идентифицируемые лингвистические единицы, составляющие часть языковых
данных.
Основной целью токенизации является преобразование текста в признаки для
дальнейших задач анализа, и поиск правильных лексем для использования является
важной задачей. Не существует стандартного метода, который был бы верен и
хорошо работал для всех приложений; это задача, специфичная для конкретной
области. В целом, токенизация может применяться на двух уровнях:
(1). Уровень предложений: также называется "токенизацией предложений",
при которой текст разбивается на предложения,
(2). Уровень слов: также называется "Токенизация слов", когда текст или
предложения разбиваются на слова.
В этом контексте было представлено несколько методик; Рисунок 2.1
показывает пример доступных методик токенизации; решение о выборе и
применении конкретной методики зависит от языка текста и цели анализа. Для
работы доступны различные токенизаторы, построенные на основе одной или
нескольких техник, перечисленных в Рисунок 2.1, в том числе:
▪ Функция разделения в Python,
▪ Регулярные выражения "RegEx",
▪ Gensim,

205
▪ Natural Language Toolkit "NLTK",
▪ Keras,
▪ SpaCy,
▪ Textblob.
В целом, наиболее простым способом токенизации является разбиение текста
на пробельные символы [73]. Другой подход основан на разделении текста на все
неалфавитно-цифровые символы, что подразумевает отбрасывание знаков
препинания, но этот подход сопряжен с проблемами, поскольку в некоторых
ситуациях знаки препинания представляют собой часть слова [74]. Кроме того,
дефисы и одиночные апострофы могут отражать смысл предложения в случае
наличия сокращений, таких как "couldn't"; токенизация с использованием этого
подхода создаст "could" и "t". Таким образом, токенизация оказывается гораздо
более сложной задачей и требует дополнительных усилий для значительного
улучшения производительности [75].
Рисунок 2.1. Иерархия наиболее популярных методов токенизации

206
2.2.2. Удаление стоп-слов
Извлечение наиболее значимых слов или фраз из текста представляет собой
основную цель любой задачи текстового анализа (например, извлечение признаков,
выделение аспектов и т.д.). Предположение считать наиболее часто встречающиеся
в документе слова высокозначимыми не обязательно верно во всех случаях, а
только в некоторых, таких как обнаружение языка; и ложно в других, таких как
классификация документов. Поэтому большинство исследователей склонны
считать, что такие словари, известные как стоп-слова, имеют мало лексического
содержания и не представляют большой ценности для решения задачи обработки
естественного языка. Кроме того, наличие стоп-слов в тексте может привести к
тому, что его не удастся отличить от других текстов. Поэтому существует
тенденция к исключению стоп-слов из текста.
Процесс удаления стоп-слов предполагает использование заранее
определенного списка слов и удаление из текста каждого вхождения любого
элемента списка "стоп-слова". Список стоп-слов может включать десятки
словарей, таких как: 'of', 'at', 'a', 'an', 'by', 'for', 'such', 'and', 'but', 'if', 'or', 'as', 'the', 'with'
и др. Следующая процедура является одной из наиболее простых стратегий
извлечения словарей-кандидатов для включения в список стоп-слов [74, 76]:

207
2.2.3. Лемматизация
Набор слов и связанная с ними информация составляют содержание любого
лексического ресурса "Лексикон", который представляет собой перечень лексем
языка. Информация, связанная со словами, может включать часть речи,
определения смысла и т.д. Словарная форма слова (также известная как лемма) с
ассоциированной информацией представляет собой одну лексическую статью.
Возможно, что два или более различных заглавных слов "лемм" имеют одинаковое
написание независимо от произношения, но отличаются по части речи и
глоссарной информации "смысл", такие леммы называются омонимами (например,
Band, bat, match, mean, right, ring, etc.), см. Рисунок 2.2, где показан наглядный
пример омонимов.
В целом, такие методы нормализации текста, как стемминг и лемматизация,
направлены на распознавание канонического представителя для группы
соответствующих словоформ. Соответственно, мы можем определить
лемматизацию как процесс преобразования слов в тексте в базовую или словарную
форму "леммы". Применяемая методика превращает слова в смысловые формы,
используя словарный и морфологический анализ слов без устранения каких-либо
символов, за исключением удаления только инфинитивных окончаний. Другими
словами, мы можем сказать, что основная цель лемматизации - это уменьшение
инфинитивных форм и иногда деривационно значимых форм слов для получения
общей базовой формы.
В зависимости от цели применения языковой обработки текста, в некоторых
задачах мы можем захотеть игнорировать инъективные окончания; в этом случае
более подходящим будет использование метода лемматизации. Например,
результаты поиска в Интернете по одному или нескольким ключевым словам
(например, ноутбук, компьютер и т.д.) включают элементы, которые не на 100%
соответствуют нашим поисковым ключам; вместо этого мы можем найти

208 результаты, содержащие инфинитивные окончания (например, ноутбук,
компьютер и т.д.).
Рисунок 2.2. Иллюстративный пример двух лексических записей для отдельных
лемм, которые имеют одинаковое написание, но разную часть речи и информацию
о глоссах
2.2.4. Сегментация данных
Сегментация данных в ОЕЯ относится к процессу выделения отдельных
фрагментов текста, которые были случайно объединены или конкатенированы,
посредством определения границ слов. Другими словами, она представляет собой
корневую задачу токенизации. В целом, сегментация может быть выполнена на
двух уровнях - уровне предложения и уровне слова. Соответственно, сегментация
предложений применяется к тексту для разделения последовательности слов на
предложения. С другой стороны, сегментация слов применяется к тексту для
разделения последовательности букв на слова.
Что касается целей нашей работы, то основная цель применения техники
сегментации - обработка опечаток, описок и других случайных ошибок, таких как
пропущенные пробелы и т.д. Поэтому в нашей реализации мы использовали
сегментацию на уровне слов. Недавно было представлено множество подходов для
решения этой задачи, которые варьируются от использования лингвистических

209 методов до применения методов машинного и/или глубокого обучения. В целом,
мы можем разделить методы сегментации слов на три категории [77]:
(1). Подходы, основанные на правилах,
(2). Подходы машинного обучения,
(3). Подходы на основе словарей.
В данной работе мы использовали сегментацию слов с помощью алгоритма на
основе словаря, построенного на выпущенной версии веб-корпуса Google на
триллион слов, разработанного Peter Norvig [78]. Процесс начинается со
сканирования символов слева, добавления по одному в шаблон поиска и поиска
совпадающих слов в словаре. Использовались алгоритмы максимального
совпадения, чтобы избежать ближайшего совпадения и продолжить поиск
максимально длинного шаблона. Несколько поисковых словарей были построены
на основе текста, доступного в Интернете, который обычно содержит триллионы
слов. Обычно словари такого типа содержат слова и их частоту. Также учитывалось
количество слов, которые встречаются вместе, с помощью метода N-грамм; т.е.
униграмма представляет собой одно слово, где N = 1, биграмма состоит из двух
слов, N = 2 и т.д.
2.2.5. Тегирование частей речи
Часть речи (ЧР) описывает способ употребления каждого слова в
предложении, также известна как лексические категории или классы слов. Как
правило, существует восемь основных классов слов: Существительное, глагол,
междометие, прилагательное, наречие, предлог, союзы и местоимение.
Определение того, к какому классу относится каждое слово (например,
существительное, прилагательное), полезно для анализа тональности относительно
аспектов заданий, где большинство аспектов обычно выражаются с помощью
существительных, прилагательных, глаголов или любых комбинаций этих классов,
а слова настроения являются прилагательными.

210
Тегирование частей речи, или просто тегирование, относится к процессу
анализа лексической и синтаксической информации слова, классификации его на
соответствующие части речи и, наконец, присвоения соответствующей метки.
Набор тегов относится к коллекции меток или тегов, используемых для задачи ЧР-
тегирования, таких как 'N', 'V', 'CON', 'ADJ', 'INT', 'ADV', 'P' и 'PRO'. На Рисунок 2.3
показан пример задачи ЧР-тегирования, которая представляет собой последующую
задачу токенизации слов, в Таблица 2.1 перечислены теги частей речи,
используемые в этом примере, и их значение, которые принадлежат набору тегов
Penn Treebank [79, 80].
Для ЧР-тегирования было представлено несколько методов, таких как модель
N-грамм, нейронная сеть, трансформация, регулярное выражение и др. Также была
введена комбинация нескольких моделей с помощью техники "обратного хода",
когда основная модель, обычно специализированная (например, триграммный
теггер), применяется к тексту для тегирования. Однако в случае, когда не удается
присвоить тег слову в определенном контексте, используется прием отката к
другой модели, обычно общей модели (например, триграммному тегеру), которая
вызывается для тегирования слова [81].
Рисунок 2.3. Пример тегирования части речи

211 Таблица 2.1. Пример тегов части речи и их значение
Тег Значение
PRP Личное местоимение VBP Глагол, не 3-е лицо единственного числа настоящего времени VBN Глагол, причастие прошедшего времени VBG Глагол, герундий или причастие настоящего времени DT Определитель NN Существительное, единственное число или масса JJ Прилагательное IN Предлог или подчинительная связь
2.3. Фреймворк больших данных
Основной целью проведения анализа тональности социальных медиа является
поддержка предприятий и потенциальных клиентов и предоставление им точного,
обобщенного и актуального мнения о рынке в отношении определенного набора
продуктов или аспектов продукта. Разработка структуры больших данных для
выполнения этой задачи является обязательной для обработки таких
дополнительных объемов данных относительно огромного объема данных онлайн-
отзывов.
Предлагаемая система направлена на сбор и подготовку отзывов покупателей
из нескольких источников одновременно. Она начинается со сбора данных об
отзывах с заранее определенного списка веб-сайтов, включая электронные рынки
и веб-страницы товаров на сайте производителя. Сбор данных из разных
источников сопряжен с трудностями из-за разнообразия технологий,
задействованных в создании веб-страниц и представлении данных.
С другой стороны, собранные данные поступают в различных форматах,
поэтому обработка больших объемов данных представляет собой сложную задачу
из-за неоднородности типов и структур данных, что создает дополнительные

212 трудности при интеграции и хранении данных. В целом, предложенная схема
подготовки данных включает в себя несколько этапов: Сбор данных, хранение
данных, интеграция данных и обработка данных, что иллюстрируется следующим
образом.
2.3.1. Сбор данных
Сбор данных - это первый шаг в любом аналитическом решении, основанном
на данных; он начинается с определения нужных данных и выбора подходящих
источников. Что касается целей данной работы по проведению анализа
тональности по отзывам покупателей, мы определяем список веб-сайтов,
содержащих отзывы покупателей об указанных продуктах. Наша цель -
электронные товары, а точнее, персональные компьютеры и ноутбуки, поэтому был
выбран список сайтов, подходящий для этой цели. Указанный список содержит
электронные рынки, такие как Amazon и BestBuy, а также сайты производителей,
таких как Lenovo и Dell.
К сожалению, большинство веб-сайтов используют различные структуры и
методы ведения и представления своих данных, и мы стремимся охватить большое
количество данных об отзывах, что превышает максимальное количество отзывов,
которое можно уместить и представить на одной веб-странице. В целом,
содержание сайта может быть представлено двумя методами:
• Статические URL-адреса: Поскольку каждая веб-страница имеет один
URL, который не меняется, основное содержимое страницы остается
неизменным, но другое содержимое может быть загружено динамически в
определенном фрейме из базы данных с помощью сценариев Java на основе
таких действий, как выбор, нажатие кнопок и т.д. Как правило, этот тип не
содержит параметров URL.
• Динамические URL-адреса: Содержание конкретного веб-сайта хранится в
базе данных и загружается динамически для отображения на странице по

213
требованию. Сайт в этом случае служит шаблоном для содержимого.
Динамический URL обычно содержит параметры, которые изменяются
динамически, такие как id, номер страницы, запрос и т. д. Одно и то же
содержимое может быть загружено под разными URL, основанными на
определенных параметрах, таких как сортировка, фильтрация и т.д., что
является основным недостатком этого типа.
Кроме того, веб-сайты собирают различные типы данных помимо текста
обзора (например, рейтинг за конкретные характеристики, основное использование
продукта, список характеристик и т.д.). Эти различия не позволяют разработать
единую программу для сбора таких данных. Поэтому мы разработали программы
для перебора и соскабливания сайтов с помощью двух инструментов, построенных
на языке программирования Python. Первая группа программ построена на Scrapy
для получения данных с сайтов, которые представляют данные с помощью
динамических URL. Вторая группа построена на Selenium для соскабливания
содержимого с сайтов, использующих статические URL. Selenium медленнее
Scrapy, но он решает такие проблемы, как динамически загружаемый контент в
статических URL и нажатие на кнопки; ниже приведено краткое описание этих
инструментов.
• Scrapy: Scrapy - это высокоуровневый фреймворк для веб-краулинга,
написанный на языке Python. Это бесплатный фреймворк с открытым
исходным кодом, который можно использовать в качестве веб-краулера
общего назначения. Основным преимуществом Scrapy является скорость и
мощные возможности по извлечению данных с помощью API.
• Selenium: Первоначально был разработан как портативный фреймворк для
тестирования веб-приложений. Это программное обеспечение с открытым
исходным кодом, которое предоставляет тесты для конкретных областей и
позволяет встраивать их в программы, написанные на нескольких
популярных языках программирования, таких как C# и Python. Однако его

214
можно использовать и для веб-кроулинга - главное преимущество
заключается в его возможностях по кроулингу и скраппингу динамических
веб-страниц.
2.3.2. Хранение данных
После сбора необходимого набора данных, потребности в хранении возникают
на лету, поскольку данные требуют места для хранения. Собранные данные
необходимо хранить, чтобы они были доступны для применения различных задач
обработки. Хранение и управление огромными данными, генерируемыми
различными устройствами, являются жизненно важными задачами. Разработка
любого аналитического решения никогда не достигнет цели без эффективного,
долгосрочного решения для хранения данных, которое обеспечит стабильную
основу.
Что касается управления данными, то еще одной проблемой являются
ограничения существующих методов, связанные с высокой скоростью генерации
данных. Для решения этой проблемы предлагаются различные методы,
включающие кластеризацию, репликацию и индексирование данных [82, 83].
Однако эти мероприятия ставят перед разработчиками задачу повышения
эффективности и производительности [84-86].
Большие данные предоставляют широкий спектр решений для хранения таких
типов данных. Среди этих решений - Apache Hadoop, одно из самых эффективных
решений для долгосрочного хранения данных, обеспечивающих стабильную
основу.
• Apache Hadoop: Hadoop - это система пакетно-ориентированной обработки
данных. Первоначально эта технология была разработана компанией Google
для индексирования Интернета и анализа поведения пользователей с целью
улучшения работы алгоритмов. Hadoop предназначен для работы на
распределенных машинах путем хранения и отслеживания данных на них с

215
помощью распределенной файловой системы Hadoop (HDFS). Он работает
над разделением данных на части, распределением их по нескольким
машинам и отслеживанием местонахождения данных. Платформа Hadoop
состоит из двух основных компонентов, которые отвечают за: хранение
данных "HDFS" и вычисления, которые будут рассмотрены в разделе
обработки данных. Что касается части хранения данных, то она состоит из
двух основных компонентов: (1) NameNode, который отвечает за
поддержание всех метаданных о файловой системе (например, структуры
каталогов), (2) DataNode, который содержит фактические блоки данных, он
также отвечает за связь с другими DataNode, а также NameNode для ответа
на запросы и во время репликации данных.
2.3.3. Интеграция данных
Проблема интеграции данных возникает, когда организации осознают
необходимость анализа данных, поступающих из различных источников в
различных форматах. Характерное для больших данных "разнообразие" делает
интеграцию данных большой проблемой, поскольку различия между несколькими
структурами данных становятся более важными, чем раньше, и их согласование
становится проблематичным. Кроме того, экспоненциальный рост объемов и
скоростей доводит как системы, так и процессы до предела [87].
Хранилища данных часто используют методы интеграции данных и
объединяют несколько источников данных для консолидации данных
операционной системы и улучшения отчетности или аналитических потребностей.
Примером интеграции данных различных типов может быть то, что компаниям
электронной коммерции необходимо проанализировать данные из журналов
регистрации веб-сайтов, call-центров, электронной почты, сканирования веб-
сайтов конкурентов и социальных сетей. Вся перечисленная информация может
быть интегрирована и доступна для поддержки лиц, принимающих решения [88].

216
Объединение данных из различных внешних источников является
дополнительным осложнением, накладываемым большими данными на процесс
интеграции данных из-за ограниченного контроля организаций над стандартами
данных в источнике. Процесс интеграции больших данных сопряжен с
дополнительными трудностями. К таким вызовам следует отнести запутанное
разнообразие технологий управления большими данными, что означает риск при
выборе, синхронизацию данных между различными источниками, отсутствие
опыта, перемещение данных в платформу больших данных, извлечение полезной
информации из больших данных и т.д. [89]. Предложенная система интегрирует
текстовые и рейтинговые данные в дополнение к эмоциям и другим типам данных.
Система также периодически собирает новые и свежие отзывы и последовательно
интегрирует новые наборы данных для обновления результатов.
2.3.4. Обработка данных
Обработка данных - это метод, который применяется после хранения данных
для извлечения полезной информации. Основными целями обработки данных
являются получение существенной взаимосвязи между различными областями
коллекций данных и извлечение ценного анализа. Сложность и масштабируемость
больших данных усложняют задачи обработки данных и создают новые проблемы
[90].
Традиционная парадигма выполнения операций над объединенными
наборами данных становится неприемлемой. Кроме того, объединение всех
связанных данных в единую базу данных может стоить много времени и
потребовать дополнительных инвестиций в инфраструктуру. Недостатки
традиционных методов проявляются в том, сколько времени требуется для анализа
одного набора данных, в то время как скорость обработки запроса в больших
данных является существенным требованием [91].
Что касается больших данных, то в случае манипулирования огромными
объемами данных, собранных из различных источников с различными форматами,

217 задача обработки данных становится сложной. Поэтому смена парадигмы
включает применение распараллеливания для обработки нескольких блоков
данных, а также одновременное разделение и владение - естественные
вычислительные методы для решения проблем больших данных. Этот подход
переносит обработку туда, где хранятся данные, распределяя запросы на запросы и
обновления по распределенным серверам, а не пытаясь обработать одну
комбинацию набора данных.
В обработке больших данных было представлено несколько методов для
хранения неструктурированных данных в распределенных базах данных, таких как
HBase, Apache Cassandra или SimpleDB, а для классификации данных были
представлены такие методы, как MapReduce в Hadoop [92]. Кроме того, для
улучшения обработки запросов внедряются методы оптимизации, такие как
HiveQL, SCOPE и т.д. [93].
• MapReduce: Распределенные данные на нескольких машинах нуждаются в
алгоритмической структуре для параллельной обработки этих данных.
Первоначально MapReduce был представлен компанией Google еще в 2004
году. Механизм обработки данных может быть выполнен через три этапа:
Map, Shuffle и Reduce. Кроме того, MapReduce обеспечивает множество
преимуществ, таких как эффективная балансировка рабочей нагрузки и
отказоустойчивая производительность. Возвращаясь к системе Hadoop для
вычислений, мы использовали Hadoop для выполнения MapReduce через
компонент управления ресурсами (YARN) для реализации распределенных
запросов к данным. Он распределяет запросы по машинам, а затем сводит
результаты в единый набор результатов. Менеджер ресурсов в Hadoop
отвечает за прием приложений и планирование их выполнения с учетом
доступности ресурсов, необходимых для выполнения приложения.

218
2.4. Предлагаемая модель предварительной обработки данных
Предварительная обработка данных - это метод, применяемый для подготовки
хранимых данных к дальнейшим задачам обработки. Основная цель этой задачи -
преобразовать необработанные данные в формат, подходящий для анализа с целью
извлечения полезной информации. Подготовка данных включает в себя множество
подзадач, среди которых очистка и фильтрация данных, нормализация,
токенизация, лемматизация, коррекция орфографии, сегментация слов и
маркировка частей речи.
Существует несколько методов обработки естественного языка для
подготовки данных. Однако выбор конкретной комбинации методов для
применения зависит в основном от основной цели проведения анализа данных.
Кроме того, решающее значение имеет порядок и способ применения каждого
метода. Полученные в результате предварительной обработки данные являются
входными данными для модели анализа, что в значительной степени влияет на
точность конечных результатов.
В этом разделе мы представляем использование рекуррентной и
ступенчатой обработки на основе методов обработки естественного языка
для улучшения качества текста. Очистка текста на естественном языке не является
простым делом; случайное удаление элементов может негативно сказаться на
результатах анализа. Предлагаемая модель включает в себя три этапа очистки и
фильтрации данных для сохранения согласованности данных во время различных
процессов подготовки, которые применяются непоследовательно. Кроме того,
несколько процессов повторяются на разных этапах. Далее мы обсудим рабочий
процесс нашей модели и принцип ее работы. Затем мы обсудим основные
подпроцедуры с различными вариантами конкретных задач для настройки
производительности.
В целом, предлагаемая модель включает в себя несколько задач, начиная с
разбора собранных данных, за которым следует ряд процессов, заканчивающихся

219 генерацией списка помеченных предложений с частью речи, как показано в
Рисунок 2.4. Собранные наборы данных содержат данные об отзывах о конкретных
продуктах; каждый отзыв состоит из текста отзыва, связанного с дополнительной
информацией, такой как дата и время подачи отзыва, оценки, информация о
человеке, написавшем этот отзыв, и т.д.
Следовательно, первым шагом является извлечение текста обзора из каждого
обзора соответственно. Контекст внутри одного отзыва и даже предложения важен
для правильной идентификации лексических категорий слов, которые являются
значимыми для нашей задачи анализа (Анализ тональности относительно
аспектов). Поэтому выделение текста рецензии из другого текста является
обязательным, поэтому мы должны вставить полную остановку, если ее нет, в
конец текущего предложения, а также вставить пробел перед добавлением
следующего текста рецензии. Этот шаг помогает увеличить количество
предложений после выполнения токенизации предложений почти на 29,0%.
Необработанный текст рецензии необходимо очистить, поэтому после
завершения извлечения текста всех рецензий следующим шагом является
применение первого этапа очистки данных, который включает удаление
бесполезных символов, специальных знаков и лишних пробелов. Также в этот этап
включена трансформация данных, которая заключается в преобразовании всего
текста в символы нижнего регистра и последующем выполнении токенизации
предложений для разделения каждого отзыва на список предложений.
Затем применяется второй этап очистки данных и токенизации слов для
каждого предложения соответственно. Очистка данных включает в себя
извлечение списка слов из предложения, а затем изучение каждого символа в слове
для устранения символов, не принадлежащих алфавиту или набору цифр, и
повторное построение предложения. С другой стороны, токенизация слов
относится к технике ОЕЯ, которая предполагает разделение предложения на слова
"токены".

220
Рисунок 2.4. Рабочий процесс обработки текста

221
Следующим шагом является проверка данных на наличие опечаток или
необычных слов. На этом этапе мы используем метод нечеткого сопоставления для
поиска совпадений; также мы обрабатываем отсутствующие пробелы, используя
метод сегментации слов для разъединения объединенных слов; а затем обновляем
данные, заменяя ошибочные слова правильными.
Следующая процедура будет применяться к каждому предложению до тех пор,
пока не будет достигнут конец текста. Пометка слов с указанием части речи
является первым шагом. Далее применяется третий этап очистки данных, который
включает удаление стоп-слов, сокращений (например, вспомогательных глаголов,
добавленных в конце местоимения в краткой форме типа "I've") и одиночных
символов. Следующим шагом является лемматизация, которая применяется к
каждому слову в предложении для получения словарной формы слова, известной
как "Лемма". Затем предложение обновляется путем замены каждого слова
соответствующей леммой.
Наконец, предлагаемая модель возвращает окончательный список
отфильтрованных предложений, помеченных частью речи; такой список теперь
готов для применения желаемой модели анализа данных. Алгоритм 2.1
представляет механизм предлагаемой модели более подробно и поясняет, как
различные подпроцедуры могут взаимодействовать и сотрудничать для получения
конечных результатов.

222

223
2.4.1. Ввод данных и извлечение текста обзора
Первым шагом в нашей работе является ввод собранных наборов данных в
модель. Собранные данные хранятся в формате JSON (JavaScript Object Notation);
каждая запись хранит данные только об одном отзыве. Обычно на сайтах онлайн-
рынков помимо самого текста отзыва хранится различная информация, например,
заголовок отзыва, имя пользователя покупателя, оценка покупателем конкретных
аспектов продукта, список предпочитаемых покупателем аспектов, голосование
читателей по отзыву, дата и время отправки отзыва и т. д. Поэтому наша модель
начинает с разбора входного набора данных, извлечения текста отзывов и
добавления полной точки и пробела, соответственно, в конце каждого отзыва для
разделения отзывов и сохранения контекста отдельных отзывов, что улучшает
результаты токенизации предложений.
2.4.2. Очистка и фильтрация данных
Очистка данных представляет собой тонкую задачу, что объясняется ее
значительным влиянием на конечные результаты. Следовательно, решение о
сохранении или удалении элементов данных должно приниматься тщательно;
порядок выполнения также важен. Таким образом, предлагаемая модель включает
в себя три фазы очистки данных; мы наслоили и распределили задачи очистки и
фильтрации в форме, которая положительно влияет на другие задачи и помогает
улучшить их производительность, такие как токенизация и ЧР-тегирование. Эта
модель подходит для подготовки данных к применению анализа тональности,
тематического моделирования и подобных задач, далее следует краткое
обсуждение каждой фазы очистки данных.
Фаза (А)
Извлеченный текст отзывов нуждается в предварительной очистке, чтобы
быть готовым к применению токенизации предложений. Первый этап очистки
данных включает множество подзадач, в том числе удаление лишних пробелов и

224 символов новой строки, устранение проблем, возникающих из-за различий в
системах кодирования символов, а также удаление бесполезных символов и знаков,
таких как восклицательный знак и скобки. Вставка пробелов вокруг определенных
символов необходима для того, чтобы алгоритм токенизации слов не считал их
частью слов. Также требуется нормализация текста путем обеспечения того, чтобы
все алфавитные символы были в нижнем регистре букв для облегчения задач
поиска и сравнения. Алгоритм 2.2 представляет последовательность операций,
применяемых для подготовки исходного текста обзора.

225 Фаза (Б)
После токенизации каждого отзыва в списке и разделения их на предложения,
к каждому предложению отдельно был применен алгоритм 2.3 "Игнорирование
пустых предложений", а затем обновлен список путем замены входного текста на
полученный в результате решения этой задачи. На этом этапе входное предложение
было преобразовано в список слов, удаляя лишние пробелы, принимая только
алфавитные символы и цифры и игнорируя другие символы, а затем снова
восстанавливая предложение.

226 Фаза (В)
После применения тегов частей речи к предложению применяется третий этап
очистки данных. Он получает предложение с тегами и начинает перебирать пары
(слово, ЧР-тег) и проверяет, принадлежит ли слово к списку стоп-слов, затем
удаляет текущую пару, в противном случае переходит к следующему элементу.
Список стоп-слов был тщательно подобран, чтобы избежать удаления слов,
которые могут повлиять на смысл или контекст текста; например, было оставлено
отрицание слова "Not", которое использовалось для отражения смысла, например,
в словах настроения (например, not stable, not fast, not good, not cheap). Также из
списка помеченных слов исключаются слова, принадлежащие к заранее
определенному списку сокращений; список сокращений включает краткие формы
вспомогательных глаголов, таких как (have: 've'), (would | had | should: 'd') и (will:
'll'). Также удаляются одиночные буквы. Алгоритм 2.4 представляет
заключительный этап очистки и фильтрации данных, включенный в нашу модель
подготовки данных.

227
2.4.3. Исправление опечаток
Рисунок 2.5. Рабочий процесс обнаружения и исправления опечаток
Так или иначе ошибки всегда мешают работе человека, он не имеет права
делать все абсолютно правильно. Орфографические нарушения являются
образцами таких ошибок, также известных как неправильное написание, опечатка,

228 орфографическая ошибка. Несколько способов неправильного написания
включают отсутствие пробелов, изменение порядка двух или более символов в
слове, пропуск одного или более символов, замену одного или более символов
неправильными символами и т.д. Люди могут понять большинство неправильно
написанных терминов, основываясь на их положении в предложении, узнаваемом
произношении и контексте. С другой стороны, компьютеры не могут справиться с
этой задачей самостоятельно; скорее, они используют методы искусственного
интеллекта. В данной работе предлагается модель для обработки опечаток в
текстах отзывов, основанная на методах обработки естественных языков, таких как
сегментация и нечеткое соответствие, как показано в Рисунок 2.5.
Предлагаемая модель обнаружения и исправления опечаток начинается с
получения токенизированного текста, состоящего из списка предложений; каждое
предложение состоит из списка лексем. Затем из входных данных создается список
слов, чтобы извлечь словарный запас, игнорируя повторение слов. Следующий
этап включает в себя проверку наличия в тексте необычных или неправильно
написанных слов и их извлечение, если они есть. Этот шаг обычно требует помощи
корпуса слов путем вычитания его из извлеченного словарного запаса; в результате
получается набор слов, которых не было в корпусе слов "Необычные слова".
𝑀 = 𝑉𝑆 − 𝐸𝑉, (2.1)
где M обозначает опечатки, VS обозначает набор лексики, а EV обозначает корпус
английской лексики.
Далее создается набор контекстных словарей, из которых извлекаются
опечатки, как показано ниже:
𝐶𝑉 = 𝑉𝑆 −𝑀 + 𝑅𝑉, (2.2)
где CV обозначает набор контекстуальной лексики, а RV - набор недавней лексики.
Следующим шагом является исправление орфографии; мы применили
технику нечеткого сопоставления для поиска совпадений с неправильно

229 написанными словами; техника нечеткого сопоставления будет подробно
рассмотрена в главе 4; следующая процедура иллюстрирует ее использование в
задаче исправления орфографии.
Следующей задачей коррекции орфографии является проверка наличия
оставшихся элементов в списке ошибочных написаний. Следовательно,
сегментация слов применяется к каждому оставшемуся элементу и отправляет
результаты в качестве входных данных в процесс коррекции орфографии снова,
пока не будут достигнуты все возможные исправления. Наконец, обновляются
входные данные этой модели путем замены неправильно написанных слов
соответствующими исправлениями. Алгоритм 2.5 представляет
последовательность операций, применяемых для проверки и исправления
неправильно написанных слов.

230
2.5. Эксперименты и результаты
Чтобы проверить эффективность нашей работы, мы протестировали и оценили
нашу модель на реальном наборе данных, собранных на сайтах онлайн-маркетов,

231 которые позволяют клиентам регистрироваться и писать отзывы о товарах или
услугах. Данные об отзывах покупателей и информация о пользователях находятся
в открытом доступе. Ниже приводится краткое описание разработанной структуры,
ее компонентов и использованных инструментов реализации, далее - обсуждение
набора данных, использованных в эксперименте, и исследование полученных
результатов.
2.5.1. Детали реализации
В этой части представлены детали реализации предложенной модели,
поскольку это необходимо для проверки пригодности нашей работы к внедрению
и обеспечения ее качества и эффективности. С этой целью предложенный метод
был реализован на ноутбуке с процессором Intel(R) Core(TM) i7-8750H CPU @2,2
ГГц и 8 ГБ оперативной памяти под управлением Windows 10 x64.
Мы разработали программу-паук для сбора необходимых данных с помощью
Scrapy (версия 2.2.0) и Selenium (версия 3.141.0). Scrapy использовался для сбора
данных с веб-сайтов, использующих динамические URL-адреса для представления
обзоров читателям. С другой стороны, Selenium использовался для сбора данных с
веб-сайтов, которые используют статические URL-адреса, применяя стратегию
динамически загружаемого содержимого и нажимая кнопки для изучения данных
о содержимом. Рабочая среда для хранения и обработки данных - Hadoop-
MapReduce; мы использовали Apache Hadoop (версия 2.9.1) для хранения данных с
помощью HDFS и выполнения MapReduce с помощью компонента управления
ресурсами (YARN).
Для разработки приложения мы выбрали язык программирования python
(версия 3.7.3) из-за его возможностей и богатства библиотек. Написание,
компиляция и сборка кода для проведения экспериментов осуществлялись с
помощью Geany IDE (версия 1.35). Среда разработки python предлагает множество
полезных пакетов, которые важны для любого приложения в области науки о
данных. Мы выполнили задачи предварительной обработки для подготовки данных
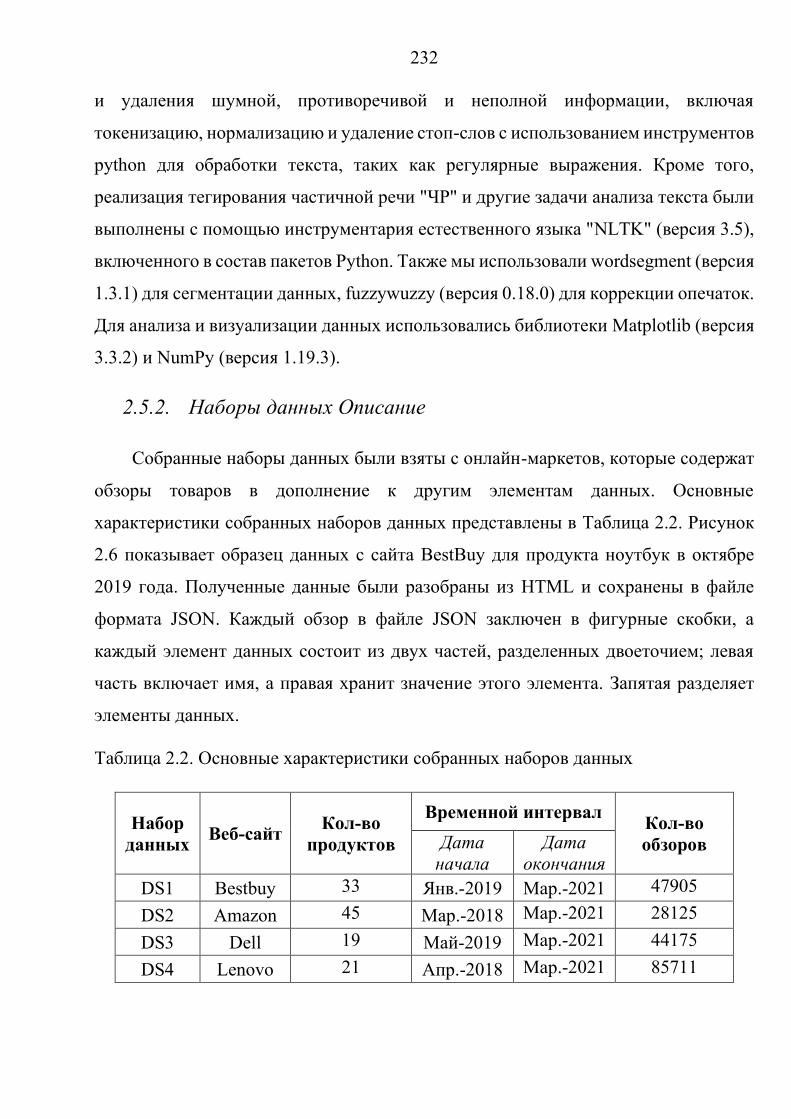
232 и удаления шумной, противоречивой и неполной информации, включая
токенизацию, нормализацию и удаление стоп-слов с использованием инструментов
python для обработки текста, таких как регулярные выражения. Кроме того,
реализация тегирования частичной речи "ЧР" и другие задачи анализа текста были
выполнены с помощью инструментария естественного языка "NLTK" (версия 3.5),
включенного в состав пакетов Python. Также мы использовали wordsegment (версия
1.3.1) для сегментации данных, fuzzywuzzy (версия 0.18.0) для коррекции опечаток.
Для анализа и визуализации данных использовались библиотеки Matplotlib (версия
3.3.2) и NumPy (версия 1.19.3).
2.5.2. Наборы данных Описание
Собранные наборы данных были взяты с онлайн-маркетов, которые содержат
обзоры товаров в дополнение к другим элементам данных. Основные
характеристики собранных наборов данных представлены в Таблица 2.2. Рисунок
2.6 показывает образец данных с сайта BestBuy для продукта ноутбук в октябре
2019 года. Полученные данные были разобраны из HTML и сохранены в файле
формата JSON. Каждый обзор в файле JSON заключен в фигурные скобки, а
каждый элемент данных состоит из двух частей, разделенных двоеточием; левая
часть включает имя, а правая хранит значение этого элемента. Запятая разделяет
элементы данных.
Таблица 2.2. Основные характеристики собранных наборов данных
Набор данных Веб-сайт Кол-во
продуктов
Временной интервал Кол-во обзоров Дата
начала Дата
окончания DS1 Bestbuy 33 Янв.-2019 Мар.-2021 47905 DS2 Amazon 45 Мар.-2018 Мар.-2021 28125 DS3 Dell 19 Май-2019 Мар.-2021 44175 DS4 Lenovo 21 Апр.-2018 Мар.-2021 85711

233
Рисунок 2.6. Образец исходных данных обзора
Из Рисунок 2.6, образец обзора включает в себя идентификатор обзора и имя
профиля рецензента, рейтинговую оценку рецензента для рассматриваемого

234 продукта в диапазоне от 1 до 5 звезд, заголовок обзора, текст обзора и оценки
покупателя по обозначенным характеристикам "Простота использования, Качество
и Ценность". Кроме того, данные обзора содержат количество читателей,
проголосовавших положительно и отрицательно за данный обзор; а также список
упоминаний, представляющих характеристики, которые покупатель предпочитает
в данном продукте.
Кроме того, комментарий производителя "если имеется" включен в данные
обзора, и он включает название организации и дату и время подачи комментария
как рецензентом, так и службой поддержки. Кроме того, различение проверенных
и непроверенных покупок важно для решения вопроса о том, исходит ли
покупательский опыт из личной практики или нет.
2.5.3. Эксперименты и обсуждение
Эксперимент начинается с извлечения текста рецензии и применения первого
этапа очистки и фильтрации данных. Затем разделите каждый отзыв на
предложения. Таблица 2.3 показывает, как разделение отзывов в процессе разбора
данных значительно улучшило производительность токенизации предложений и
увеличило количество предложений в среднем на 29%.
Таблица 2.4 суммирует основные лингвистические характеристики наших
наборов данных; мы можем заметить, что стоп-слова составляют почти половину
от общего количества слов, в среднем 47,74%. Кроме того, набор лексики
составляет почти 12%, что вполне обоснованно, поскольку все тексты обзоров
относятся к одной и той же области; он относится к числу уникальных словарей с
игнорированием повторения слов; мы использовали следующее уравнение для
расчета доли набора лексики (VS).
𝑉𝑆 =
Количество (словарный запас)
Количество слов − количество (стоп − слов) (2.3)

235 Таблица 2.3. Влияние разделения отзывов на процесс токенизации предложений
Набор данных
Кол-во обзоров
Кол-во приговоров
Предложение за отзыв Коэффициент
эффективности Перед После Перед После DS1 47905 70114 88532 1.46 1.85 +26.27% DS2 28125 36696 48360 1.30 1.72 +31.79% DS3 44175 60928 81812 1.38 1.85 +34.28% DS4 85711 123772 156392 1.44 1.82 +26.35%
Сред. - - - 1.40 1.81 +29.67%
Таблица 2.4. Основные лингвистические характеристики наборов данных
Набор данных
Кол-во приговоров
Кол-во слов
Продолж-ительность приговора
Стоп-Слов Словарный набор
Кол-во Процент Кол-во Процент
DS1 88532 1405316 15.87 676336 48.13% 93042 12.76% DS2 48360 832050 17.21 398019 47.84% 48917 11.27% DS3 81812 1266654 15.48 625165 49.36% 75369 11.75% DS4 156392 2657667 16.99 1212978 45.64% 173326 12.00%
Сред. - - 16.39 - 47.74% - 11.95%
Предлагаемая модель включает в себя три уровня очистки и фильтрации
данных, как описано ранее. Рисунок 2.7 показывает, как изменился размер наборов
данных после применения каждого уровня в отдельности; также показан эффект
разделения рецензий и после выполнения лемматизации слов. Можно заметить, что
размер данных увеличился после разбора текста рецензии из-за вставки пробелов
и периодов для разделения рецензий. Кроме того, этап (В) очистки данных
оказывает наиболее значительное влияние на размер данных, поскольку этот этап
включает удаление стоп-слов, которые, в свою очередь, составляют большую часть
объема данных.
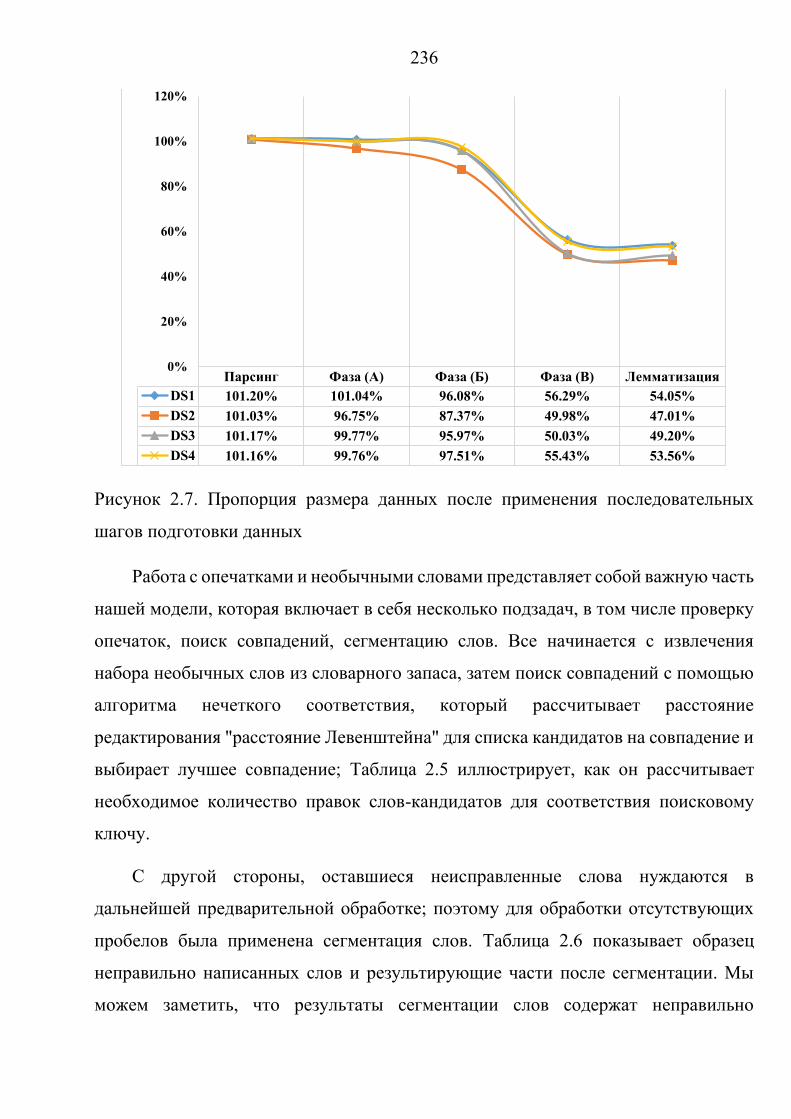
236
Рисунок 2.7. Пропорция размера данных после применения последовательных
шагов подготовки данных
Работа с опечатками и необычными словами представляет собой важную часть
нашей модели, которая включает в себя несколько подзадач, в том числе проверку
опечаток, поиск совпадений, сегментацию слов. Все начинается с извлечения
набора необычных слов из словарного запаса, затем поиск совпадений с помощью
алгоритма нечеткого соответствия, который рассчитывает расстояние
редактирования "расстояние Левенштейна" для списка кандидатов на совпадение и
выбирает лучшее совпадение; Таблица 2.5 иллюстрирует, как он рассчитывает
необходимое количество правок слов-кандидатов для соответствия поисковому
ключу.
С другой стороны, оставшиеся неисправленные слова нуждаются в
дальнейшей предварительной обработке; поэтому для обработки отсутствующих
пробелов была применена сегментация слов. Таблица 2.6 показывает образец
неправильно написанных слов и результирующие части после сегментации. Мы
можем заметить, что результаты сегментации слов содержат неправильно
Парсинг Фаза (A) Фаза (Б) Фаза (В) ЛемматизацияDS1 101.20% 101.04% 96.08% 56.29% 54.05%DS2 101.03% 96.75% 87.37% 49.98% 47.01%DS3 101.17% 99.77% 95.97% 50.03% 49.20%DS4 101.16% 99.76% 97.51% 55.43% 53.56%
0%
20%
40%
60%
80%
100%
120%

237 написанные части; поэтому эти части будут снова введены в алгоритм нечеткого
соответствия для поиска соответствия и так далее, пока не будут достигнуты все
возможные исправления.
Таблица 2.5. Образец неправильно написанных слов и соответствующая
правильная форма с иллюстрацией типа и количества необходимых правок
Неправильное написание Правильно Редактирует Тип
редактирования aptions options 1 Sub (a, o) labtops laptops 1 Sub (b, p) teturn return 1 Sub (t, r) grest great 1 Ins (a) wrk work 1 Ins (o)
proudct product 2 Ins (d) + Del (d) pirchase purchase 1 Sub (i, u)
accessorires accessories 1 Del (r) spead speed 1 Sub (a, e)
anwesome awesome 1 Del (n) funciones functions 2 Ins (t) + Del (e)
Таблица 2.6. Образец неправильно написанных слов и результирующие части
после сегментации
Слово Сегменты
easyto [easy, to] deliverygreat [delivery, great]
adapterlightning [adapter, lightning] displayport [display, port] adapterusp [adapter, usp] nededdoes [neded, does] muchmor [much, mor] itneww [it, neww]
cableethernt [cable, ethernt]

238 Таблица 2.7. Процентное соотношение неправильно написанных словарей к
общему количеству словарей в каждом наборе данных и коэффициент коррекции
Набор данных
Словарный запас
Ошибочные написания Исправления
Кол-во Процент Кол-во Процент DS1 93042 8104 8.7% 7564 93.3% DS2 48917 5627 11.5% 4856 86.3% DS3 75369 7855 10.4% 6900 87.8% DS4 173326 19329 11.2% 17973 93.0% Avg. - - 10.4% - 90.1%
Таблица 2.7 представляет анализ эффективности предложенной модели для
исправления опечаток; он показывает, что наша модель работает хорошо и
способна достичь высокого процента исправлений, учитывая начальное
количество опечаток; результаты показывают, что была достигнута средняя
точность 90,1%.
Эта модель была построена с использованием методологии проб и ошибок, в
рамках которой было проведено множество испытаний для достижения текущей
окончательной версии предлагаемой модели. Мы изучили влияние применения
различных методов и выбрали наиболее подходящий; например, мы изучили
использование лемматизации или стемминга или обоих методов и обнаружили, что
использование лемматизации больше подходит для нашей задачи анализа. Кроме
того, мы исследовали влияние изменения порядка выполнения нескольких шагов
на конечные результаты. Здесь мы рассмотрим только часть этих испытаний, чтобы
продемонстрировать эффективность нашей модели. Далее мы рассмотрим три
варианта расположения шагов, чтобы изучить влияние порядка выполнения на
результаты маркировки ЧР.
• ORD1: Лемматизация - ЧР-тегирование - Фаза очистки данных (В)
• ORD2: Фаза очистки данных (В) - ЧР-тегирование - лемматизация

239 • ORD3: ЧР-тегирование - фаза очистки данных (В) - лемматизация
Затем была отобрана случайная выборка результатов и проверена ЧР-теги
вручную; тестирование проводилось только для тегов существительных и
прилагательных, поскольку они составляют 29% и 17% от общего числа тегов
соответственно. В данном контексте были рассчитаны три метрики эффективности:
Precision, Recall и F-Measure, соответственно. Для этого были оценены и
подсчитаны следующие случаи: истинно положительные (TP), ложно
положительные (FP), истинно отрицательные (TN) и ложно отрицательные (FN),
как показано в Таблица 2.8, а затем использованы для вычисления указанных
метрик следующим образом.
Таблица 2.8. Иллюстративный пример того, как каждый случай маркировки ЧР
оценивается с точки зрения существительных и прилагательных
Действительные Правильно Оценка существительных
Оценка прилагательных
NN NN TP TN ADJ ADJ TN TP ADJ NN FN FP NN ADJ FP FN
𝑃𝑟𝑒𝑐𝑖𝑠𝑖𝑜𝑛 =
𝑇𝑃
𝑇𝑃 + 𝐹𝑃 (2.4)
𝑅𝑒𝑐𝑎𝑙𝑙 =
𝑇𝑃
𝑇𝑃 + 𝐹𝑁 (2.5)
𝐹 −𝑀𝑒𝑎𝑠𝑢𝑟𝑒 =
2 ∗ 𝑃𝑟𝑒𝑠𝑖𝑠𝑖𝑜𝑛 ∗ 𝑅𝑒𝑐𝑎𝑙𝑙
𝑃𝑟𝑒𝑠𝑖𝑠𝑖𝑜𝑛 + 𝑅𝑒𝑐𝑎𝑙𝑙 (2.6)
Из Рисунок 2.8 и Рисунок 2.9 видно, что ORD2 достигает наихудших
результатов, это связано с тем, что удаление стоп-слов сильно влияет на контекст
предложений, но в случае с ORD1, он достигает лучшего результата с небольшим
улучшением до ORD3, который был принят в окончательной модели.


241
2.6. Выводы
Объем текстовых данных, доступных в Интернете, растет экспоненциально,
что делает инвестиции в анализ данных более выгодными. Поэтому анализ
тональности в социальных сетях и на электронных рынках стал развивающейся
тенденцией. Большие данные предоставляют различные решения для хранения и
обработки данных. С другой стороны, подготовка и преобразование
необработанных текстовых данных в форму, подходящую для применения
желаемого анализа, имеет решающее значение, поскольку этот этап является
наиболее трудоемким и вычислительным в любой задаче анализа.
В этой главе мы предложили модель предварительной обработки данных для
текстовых данных с использованием комбинации методов ОЕЯ. Было проведено
краткое обсуждение ключевых концепций ОЕЯ. Было проведено множество
испытаний, чтобы найти наиболее подходящую последовательность и
конфигурацию методов предварительной обработки. Предложенная модель была
протестирована на реальных массивах данных отзывов покупателей, собранных на
электронных рынках, чтобы продемонстрировать ее преимущества. Результаты
показывают, что наша модель улучшает производительность маркировки ЧР,
сохраняя контекст текста.

242
3. Глава 3.
Извлечение аспектных терминов
3.1. Введение
Анализ тональности относительно аспектов (АТОА) является одной из
горячих точек обработки естественного языка (ОЕЯ), целью которой является
поиск мнений и настроений относительно определенных аспектов продуктов или
характеристик услуг на основе изучения мнений людей, полученных с помощью их
письменных сообщений (напр., отзывы, блоги, комментарии, твиты). Процесс
проведения АТОА включает в себя несколько подзадач, которые начинаются с
автоматической идентификации аспектных терминов (также называемых
атрибутами или признаками) конкретного объекта (например, ноутбуков), за
которыми следует извлечение настроений по отношению к аспектным терминам.
Затем производится классификация извлеченных аспектных терминов в
соответствующие категории (например, хранение, цена), и, наконец, вычисляется
общая полярность для каждой аспектной категории (положительная,
отрицательная, нейтральная или конфликтная) [94].
Извлечение аспектных терминов (ИАТ) из свободного текста представляет
собой сложную задачу. Она считается основной задачей, включенной в анализ
тональности относительно аспектов. Процесс извлечения аспектных терминов из
текста начинается с приема свободного текста в качестве входных данных и
возвращает набор аспектов для каждой предварительно идентифицированной
сущности [95, 96]. Важность этой задачи обусловлена зависимостью других задач
от результатов, которые она предоставляет, что напрямую влияет на точность

243 конечных результатов анализа тональности. Онлайн-обзоры могут содержать два
вида аспектов продукта: явные аспекты, которые интересуют нашу работу, и
неявные аспекты [97].
Явные аспекты относятся к характеристикам продукта, которые пользователи
комментируют непосредственно в обзоре, используя явные слова; например, в
обзоре: "Good product for the price works better with Google chrome," аспект цены
был указан в явном виде. С другой стороны, неявные аспекты не появляются в
отзыве, но комментируются неявно; например, в отзыве: "Great little computer that
does what is written on the box," пользователь говорит об аспекте размера, не
используя явного слова для обозначения этого аспекта.
Большинство исследований по разработке методов ИАТ направлены на
извлечение терминов аспектов из предложений [95, 96, 98-104], но в эпоху больших
данных это отнимает много времени на проверку каждого предложения по
отдельности; вместо этого требуется пакетная обработка для извлечения
выдающихся терминов аспектов [105]. Поэтому в данной работе мы предлагаем
новый метод автоматического извлечения значимых аспектов продукта из отзывов
покупателей. Основной целью данной работы является создание масштабируемой
структуры для извлечения аспектов продукта со стабильной производительностью.
Предлагаемая модель извлекает аспектные термины из текста обзора на основе
подхода, основанного на данных. Для получения числового представления каждого
слова были рассмотрены различные методы вложения слов. Учитывая высокую
размерность сгенерированных векторов слов, для уменьшения размерности и
сохранения характеристик исходных данных была применена техника
самоорганизующихся карт (SOM). Затем была применена техника кластеризации
K-means++ для извлечения наиболее значимых терминов аспекта с помощью
предварительно заданных критериев фильтрации. Предложенная модель извлекает
отдельные слова, а также способна извлекать фразы в качестве выдающихся
аспектов.

244
Данная глава организована следующим образом. В этом разделе представлены
предмет и мотивы данной работы. Далее, в разделе 2 представлено краткое
обсуждение современных методов извлечения аспектных терминов. В разделе 3
представлены основные процедуры предлагаемой модели, включая вложение слов,
уменьшение размерности, кластеризацию и выбор признаков. В разделе 4
представлена предлагаемая модель для извлечения аспектных терминов с
объяснением предлагаемой структуры. В разделе 5 представлено объяснение
проведенных экспериментов, доказывающих эффективность нашей модели,
изложены детали нашей реализации, описание использованных наборов данных.
Также представлено объяснение достигнутых результатов с их обсуждением.
Наконец, в разделе 6 подведены итоги главы и сделаны выводы.
3.2. Предпосылки исследования
Ключевой задачей в анализе тональности относительно аспектов является
извлечение явных аспектов из текста, в частности, из онлайн-отзывов - это
основано на зависимости других задач АТОА от результатов этой задачи. Кроме
того, в последние годы большое внимание к АТОА привлек международный
конкурс семантической оценки (SemEval-2014). В упомянутом конкурсе
участвовали четыре основные подзадачи АТОА. Первой подзадачей было
Извлечение Аспектных Терминов, которое в основном связано с идентификацией
аспектных терминов в заданной области.
Недавно было представлено множество подходов к извлечению характеристик
продукта из отзывов онлайн-покупателей; для удобства было предложено
несколько классификаций для обобщения этих подходов. Авторы [106] склонны
классифицировать подходы по трем категориям: подходы на основе машинного
обучения, подходы на основе отношений зависимости и подходы на основе
лексикона. С другой стороны, в [95], они классифицируют подходы на основе
методов обучения на контролируемые, полуконтролируемые и неконтролируемые,
как показано в Рисунок 3.1.

245
Рисунок 3.1. Классификация методов извлечения аспектных терминов
Кроме того, в [107], авторы классифицировали подходы ИАТ на методы,
основанные на правилах, методы, основанные на нейронных сетях, и методы,
основанные на моделировании тем. В остальной части этого раздела
рассматриваются некоторые из последних предложенных подходов к ИАТ.
Shi Li et al. [108] представили модель на основе частот для извлечения
признаков с помощью мер сходства с использованием Интернета. Предложенная
модель представляет собой расширение алгоритма классификации текста RCut.
Она начинается с выбора аспектов-кандидатов, затем измеряется семантическое
сходство с целевыми сущностями. Алгоритм RCut используется в процессе выбора

246 аспектов для определения порога. Результаты экспериментов на китайском языке
доказывают способность модели работать с различными доменами и объемами
данных.
Zhijun Yan et al. [106] представили интеграцию алгоритма PageRank, неявного
вывода признаков и расширения синонимов для автоматического определения
аспектов продукта, которая получила название EXPRS (An EXtended PageRank
algorithm enhanced by a Synonym lexicon). Процесс подготовки данных включает
сегментацию на уровне предложений, ЧР-тегирование. Задачи ИАТ включают
извлечение отношений зависимости и ранжирование слов с помощью
предложенного метода NodeRank для выявления аспектов-кандидатов. Наконец,
генерируется окончательный набор аспектов после получения слов-синонимов для
аспектов-кандидатов и инференции неявных признаков.
Xin Wang et al. [109] представили расширение вложений слов на основе
зависимостей для идентификации признаков. В данной работе авторы
представляют усовершенствованный метод представления слов на основе
рекуррентных нейронных сетей (РНС). Предложенная модель не зависит от языка,
что означает ее способность работать с несколькими языками.
Shufeng Xiong and Donghong Ji [110] предложили модель извлечения
аспектных фраз на основе семантической релевантности. Авторы представили
конвейерную модель вложения слов и кластеризации. Вложение слов было
применено для создания взвешенного контекстного представления данных. С
другой стороны, была введена кластеризация с гибкими ограничениями,
построенная на алгоритме кластеризации k-means для получения кластера
аспектных фраз.
Wei Xue et al. [111] представили модель на основе нейронных сетей для
идентификации терминов аспектов и их классификации в соответствующую
категорию, соответственно, названную MTNA. Предложенная модель
многозадачного обучения построена на рекуррентных нейронных сетях и

247 сверточных нейронных сетях (СНС), поскольку они объединили ДДКП для
извлечения признаков и СНС для классификации категорий аспектов в
многозадачной структуре.
Xin Li et al. [112] представили модель для захвата истории обнаружения
аспектов и резюме мнений на основе ДКП. Она состоит из двух основных частей.
Первая - усеченная история-внимание, которая отвечает за определение истории
аспектов. Вторая - сеть селективного преобразования, которая работает над
сбором информации о мнении. ДКП создают начальное представление слова,
которое вводит результат в две части, соответственно. Авторы пришли к выводу,
что совместное извлечение жертвует точностью предсказания аспектов.
Chuhan Wu et al. [113] представили гибридный алгоритм без наблюдения для
извлечение аспектных терминов и извлечение цели мнения. Предложенная модель
представляет собой комбинацию методов машинного обучения, основанных на
правилах. Лингвистические правила на уровне фрагментов были использованы для
извлечения целей и характеристик мнений. Затем была применена фильтрация на
основе корреляции доменов для исключения нерелевантных элементов. Результаты
этих шагов были использованы для обучения сети с глубоким рекуррентным
блоком.
Yanmin Xiang et al. [114] предложили метод кластеризации Multi-Feature
Embedding (MFE) для извлечения аспектных терминов в АТОА, который основан
на условном случайном поле (УСП). Представление текста было выполнено с
использованием MFE для извлечения обширной семантической информации из
данных. Затем был использован алгоритм кластеризации K-means++ для создания
кластеров слов для поддержки позиционных признаков УСП. Наконец, кластеры
MFE с вкраплениями слов были использованы для обучения модели.
Zhiyi Luo et al. [107] представили основанный на данных подход для
извлечения выдающихся аспектов из текстовых обзоров под названием ExtRa
(Extraction of Prominent Review Aspects), который может извлекать аспектные слова

248 и фразы. Предложенный метод использует такие источники знаний, как WordNet и
Probase, для построения графов аспектов, чтобы ограничить пространство
аспектов, а затем пространства аспектов делятся на кластеры для извлечения K
выдающихся аспектов.
Md Shad Akhtar et al. [115] предложили конвейерную систему для извлечения
и классификации аспектных терминов. Предложенная многозадачная система
обучения начинается с применения двунаправленной долгоной краткосрочнной
памяти (ДДКП), а затем механизма самовнимания на предложениях для извлечения
терминов аспектов. Затем используются сверточные нейронные сети для
прогнозирования настроения извлеченных аспектов продукта. Эксперименты
проводились на английском и хинди и доказали, что система может работать с
обоими языками.
3.3. Основные процедуры
В целом, предлагаемая модель объединяет несколько подзадач, включая
вложение слов, многомерную редукцию, кластеризацию и выбор признаков. Далее
мы обсудим основные процедуры нашей модели с различными вариантами
конкретных задач для настройки производительности.
3.3.1. Вложения слов
В последние несколько лет исследователи пытались улучшить
производительность методов представления текста, которые положительно влияют
на несколько задач ОЕЯ. В этом контексте было представлено множество моделей
вложения слов на основе статистических моделей, машинного обучения и
глубокого обучения (например, Word2Vec, GloVe, BERT) [101, 109, 110, 116, 117].
Такие модели создают векторы слов из реальных чисел, представляющих контекст
заданных слов, которые могут быть использованы в качестве входных признаков
для дальнейших задач обработки. Существует несколько уровней представления
текста с использованием методов вложения, помимо уровня слов, включая

249 вложения на основе символов (например, Embeddings from Language Models
"ELMo" [118], и Flair [119]), вложения на уровне байтов [120], и вложения N-грамм
[121].
Что касается уровня слов, исследователи представили несколько моделей,
которые начинались со старомодных методов вложения "Bag-of-Words",
построенных на простых алгоритмах машинного обучения, таких как Term
Frequency-Inverse Document Frequency (TF-IDF). Впоследствии модели
следующего поколения были основаны на использовании методов глубокого
обучения, таких как Word2Vec. В последнее время появились передовые модели
встраивания слов, представляющие собой языковые модели, используемые с
трансферным обучением на основе трансформаторов внимания, таких как BERT.
Возможности вложения слов, позволяющие передать значение слова в
конкретном контексте с учетом сходства с другими словами (например,
семантически, синтаксически и в других отношениях), сделали его одной из
наиболее значимых технологий, способствующих ОЕЯ. Мы рассмотрели
несколько общепризнанных методов вложения слов, чтобы оценить, как меняется
производительность различных моделей при различных вложениях слов.
• Word2Vec: Word2Vec - одна из самых популярных техник вложения текста,
представленная Mikolov et al. в 2013 году [122] и сопровождаемая пакетом
на языке C; она считается протопластовой моделью любого нейросетевого
вложения слов. Доступна предварительно обученная версия, которая
обучена на Google News [123]. Другие популярные модели, относящиеся к
той же категории, включают модель Facebook "FastText" и Stanford "GloVe".
Возвращаясь к модели Word2Vec, она состоит из двухслойных нейронных
сетей, принимает на вход корпус текстов и генерирует на выходе набор
векторов, представляющих набор слов соответственно. Хорошо обученная
модель группирует похожие векторы слов, расположенные рядом друг с
другом, в одном пространстве. Обучение модели Word2Vec имеет две

250
основные альтернативы, которые используют либо иерархический Softmax,
либо отрицательную выборку: Первый подход - Continuous Bag of Words
(CBOW), который использует контекст для предсказания целевого слова. С
другой стороны, второй подход - это Skip-gram; в отличие от CBOW, он
использует слово для предсказания целевого контекста. Как правило,
практика доказывает, что метод скип-грамм может иметь лучшую
производительность по сравнению с методом CBOW.
• BERT: Появились и быстро развиваются динамические вложения слов,
также известные как языковые модели или контекстуализированные
вложения слов. Эти модели устраняют наиболее существенное ограничение
классических подходов к вкраплениям слов: представление одного слова с
различными значениями только одним вектором и разотождествление
полисемии. BERT (Bidirectional Encoder Representations from Transformers)
представляет собой одну из самых известных языковых моделей,
построенных на основе трансформера, представленную командой Google,
Jacob Devlin et al., в 2018 году [124]. Трансформер - это механизм внимания,
который идентифицирует контекстуальные отношения в тексте между
словами или даже подсловами; он включает в себя два отдельных
механизма, кодер и декодер, первый считывает входные данные, а второй
производит предсказание для задачи.
Модель BERT случайным образом заменяет подмножество слов в
предложении лексемой-маской, а затем предсказывает замаскированное
слово на основе окружающих незамаскированных слов с помощью
архитектуры на основе трансформатора. В отличие от классических
направленных моделей, которые читают входной текст последовательно
(справа налево или слева направо), предсказание генерируется с учетом
соседних слов с обеих сторон, левой и правой, что обусловлено механизмом
трансформаторного кодера, который читает всю последовательность слов

251
сразу. BERT генерирует вектор слов, который является функцией всего
предложения. Соответственно, исходя из контекста слова, оно может иметь
разные векторы.
Модель состоит из четырех измерений, [# layers, # batches, # tokens, #
features]. Модель представляет собой глубокую нейронную сеть с 12 слоями
в версии "Base" или 24 в версии "Large". Номер партии означает количество
входных предложений для модели, а номера лексем - количество слов во
входных предложениях. Наконец, число признаков скрытых блоков
означает количество измерений, представляющих каждую лексему, 768 в
"Base" или 1024 в "Large" версии.
3.3.2. Многомерное сокращение
Вложения слов являются многомерными; при использовании метода вложения
слов для представления корпуса текстов будет создан набор векторов, каждый из
которых представляет только одно слово. Количество значений одного вектора
относится к количеству измерений, которые представляют слово. Например, в
моделях Word2Vec параметры size относятся к количеству размерностей,
используемых для представления каждого слова, прямо пропорционально качеству
получаемых векторов. Практически, предпочтительные значения размерности
векторов слов находятся в диапазоне от 300 до 400, что зависит от размера входных
данных. С другой стороны, в BERT слова представлены 768 размерностями в
модели Base или 1024 в версии Large.
Увеличение размерности данных создает трудности в интерпретации и
визуализации данных. Существует несколько подходов для нелинейного снижения
размерности, таких как PCA, SOM и t-SNE. Такие модели обеспечивают
отображение из высокоразмерного пространства в низкоразмерное вложение.
• SOM: The Self-Organizing Maps (SOM) были введены Teuvo Kohonen в 1982
году [125-128], также известны как Kohonen's Self Organizing Feature Maps,

252
или Kohonen network. SOMs - это метод машинного обучения без
наблюдения, который отображает высокоразмерные векторы на
низкоразмерное (обычно двумерное) пространство; они учатся
классифицировать данные без наблюдения. Это тип ANN , который может
работать с наборами данных с небольшим количеством ссылок. Обычно
SOM используются для кластеризации данных и визуализации. SOM может
быть использована для уменьшения размерности векторов, поскольку она
обеспечивает способ представления высокоразмерных данных в
низкоразмерных пространствах "2-D".
Одним из наиболее важных аспектов SOM, отличающих их от других
методов кластеризации, является то, что они сохраняют топологию
исходных данных, поскольку расстояния в двумерном пространстве
отражают расстояния в высокоразмерном пространстве. Сети Кохонена
хранят информацию для поддержания топологических отношений внутри
входных наборов данных. Внутренний механизм обучения постоянно
изменяет веса сети, пока входные и целевые векторы не станут
согласованными. С другой стороны, другие методы кластеризации, такие
как K-means, создают представление, которое трудно визуализировать,
поскольку оно не имеет удобного двухмерного формата.
• t-SNE: t-Distributed Stochastic Neighbor Embedding - это эффективная
вероятностная техника сокращения размерности, которая может быть
использована для визуализации многомерных наборов данных [129-132].
Учитывая сложные наборы данных с многочисленными измерениями, t-
SNE проецирует эти данные и лежащие в их основе отношения между
векторами в более низкоразмерное пространство и представляет их в 2D или
3D, сохраняя при этом структуру исходного набора данных. Помимо
визуализации данных, возможности t-SNE по кластеризации данных без

253
контроля дают ему возможность помочь алгоритмам машинного обучения
в прогнозировании и классификации.
Механизм работы t-SNE начинается с измерения сходства между каждой
возможной парой точек данных для создания распределения сходства
высокоразмерных входных данных. Затем создается парное распределение
сходства для соответствующих низкоразмерных точек во вложении и,
наконец, минимизируется расхождение между этими двумя
распределениями.
Существует несколько подходов к использованию t-SNE в
крупномасштабных наборах данных; один подход объединяет его с другим
методом, например, PCA, или реализует t-SNE с помощью техники
аппроксимации, например, аппроксимации Barnes-Hut.
3.3.3. Признак кластеризации
Алгоритмы кластеризации используются для разделения набора объектов и их
группировки в соответствии со сходством признаков, измеряемых через их
атрибуты и близость в векторном пространстве. Методы кластеризации могут
применяться в различных областях, включая статистический анализ,
компьютерное зрение, геномику, машинное обучение и науку о данных. В целом,
алгоритмы кластеризации можно разделить на шесть основных категорий:
(1). Иерархическая кластеризация "на основе связности" (например, BIRCH, ROCK, DIANA)
(2). Кластеризация с разделением "на основе центроидов" (например, K-means, k-modes)
(3). Кластеризация на основе плотности (например, DBSCAN, DENCAST)
(4). Кластеризация на основе распределения (например, Gaussian Mixed Models, DBCLASD)
(5). Нечеткая кластеризация (например, Fuzzy C means, Rough k-means)

254
(6). Основанная на ограничениях (например, Decision Trees, Random Forest,
Gradient Boosting)
Несмотря на всесторонние усилия исследователей по совершенствованию
методов кластеризации, обработка векторов признаков высокой размерности все
еще остается сложной задачей в любой задаче кластеризации. Поэтому в данной
работе собрана поэтапная кластеризация векторов признаков; на первом этапе
решается проблема высокой размерности и создается двумерное представление
векторного пространства. С другой стороны, на втором этапе создаются
высококачественные кластеры признаков. Для второй фазы мы выбрали алгоритм
кластеризации K-means++.
• K-Means++: David Arthur and Sergei Vassilvitskii представили алгоритм
кластеризации k-means++ в 2007 году, чтобы преодолеть недостатки,
присущие алгоритму k-means [133]. Они представили результаты
моделирования методом Монте-Карло, которые доказывают, что k-means++
быстрее и имеет лучшую производительность, чем стандартная версия. Это
алгоритм кластеризации без контроля, который собирает и разделяет
данные на k кластеров. Механизм работы k-means++ заключается в выборе
начальных центральных точек и последующем запуске стандартного k-
means; это то, что делает k-means++, чтобы избежать плохой кластеризации,
обнаруженной классическими алгоритмами k-means.
Центры K-Means++ распределяются по данным, кроме того, это менее
затратно, чем случайная инициализация центроидов. Инициализация в k-
means++ осуществляется путем случайного выделения одного центра
кластера; учитывая первый центр, он затем ищет другие центры. Таким
образом, алгоритм гарантированно находит оптимальный результат, а не
получает локальный оптимум, достигнутый старым алгоритмом.

255
3.3.4. Выбор признаков
Что касается набора кластеров векторов, представляющих слова и фразы,
полученных на этапе кластеризации, цель состоит в том, чтобы отсеять
нерелевантные лексемы и извлечь список выдающихся аспектов. Алгоритм 4.1.
представляет предлагаемую процедуру отбора признаков. Он начинается с
подсчета распределения частот для существительных, прилагательных и глаголов,
используя только теги частей речи, поскольку эти классы слов синтезируют
большинство терминов аспектов. Следующим шагом является вычисление
пространства расстояний для каждого кластера и извлечение расстояния от
центроида кластера для каждого элемента, соответственно. Затем происходит
сортировка элементов в каждом кластере по возрастанию и выбор центральных
элементов - "Список аспектных кандидатов". Следующим шагом является
преобразование векторов в текстовые эквиваленты лексем; отобранные элементы
также являются словами и фразами. Далее происходит фильтрация списка путем
принятия только упомянутых классов слов как для отдельных слов, так и для частей
во фразах. И наконец, извлечение частот для отдельных слов и фраз из упомянутого
ранее распределения частот и исключение элементов, не прошедших
определенный порог - в результате отфильтрованные элементы составляют список
выдающихся аспектов.
3.4. Предлагаемая модель для ИАТ
Основной целью данной работы является извлечение наиболее заметных
терминов аспектов из текста отзывов клиентов. Цель предлагаемой модели -
создать числовое представление текста "векторы слов", затем применить технику
снижения размерности для улучшения качества кластеров слов и, наконец,
отфильтровать извлеченные аспекты для получения ведущих аспектов предмета
отзывов. Далее мы обсудим рабочий процесс нашей модели и принцип ее работы.

256

257
3.4.1. Описание фреймворка
В целом, предлагаемая модель включает в себя несколько подзадач, начиная
со сбора отзывов клиентов, затем ряд задач по обработке данных и заканчивая
предоставлением списка выдающихся аспектов целевого объекта, как показано в
Рисунок 3.2. Сбор и предварительная обработка данных - это первый шаг на пути
к достижению поставленной задачи, подробно рассмотренный в Главе 2. Признаки
кластеризации воспринимают только цифровые данные, поэтому крайне
необходимо получить числовое представление текстовых данных. Вложение слов
- наиболее популярная техника, используемая для решения этой задачи. Итак,
следующим шагом будет извлечение списка слов, поскольку встраивание слов
требует, чтобы входные данные были оформлены в виде списка слов. Поскольку
наш исходный набор данных состоит из отзывов покупателей, каждый отзыв
можно разделить на предложения "список предложений", а каждое предложение
будет представлять собой список лексем. Поэтому нам необходимо преобразовать
данные в формат "список списков", чтобы они могли быть приняты на вход
методами вложения слов.
В этой работе мы исследовали две различные техники вложения слов, которые
часто используются, а именно "Word2Vec и BERT", и проанализировали их
влияние на производительность нашей модели. Также было рассмотрено
извлечение аспектных фраз и аспектных терминов; поэтому мы использовали
Multi-Feature Embedding (MFE) для захвата аспектных фраз. Затем результаты
нескольких уровней вложения слов были объединены. Поскольку сгенерированные
векторы имеют высокую размерность, что затрудняет любые попытки
кластеризации этих векторов, негативно влияя на качество получаемых кластеров,
необходим промежуточный процесс кластеризации для снижения размерности
входных векторов при сохранении исходной топологии данных. Здесь мы
исследовали две различные техники для выполнения этой задачи, а именно "SOM
и t-SNE".

258
Рисунок 3.2. Экспериментальная схема предложенной модели извлечения
аспектных терминов
Кластеризация сгенерированных двухмерных векторов является следующим
шагом в нашей модели. Выбор алгоритма кластеризации K-Means++,
объединенного в предлагаемую модель, основывается на его эффективности и
пригодности для наших наборов данных и целей анализа. Сгенерированные
кластеры векторов являются входом для предложенных алгоритмов отбора
признаков, рассмотренных ранее, которые извлекают список выдающихся
аспектов.
259
3.5. Эксперименты и результаты
Чтобы проверить эффективность нашей модели, мы протестировали и
оценили ее на нескольких наборах данных, которые имеются в открытом доступе.
Далее приводится описание наборов данных, использованных в эксперименте-
далее - представление экспериментальной установки ансамблевых процедур. Далее
приводится обзор метрик оценки и эталонов, использованных в нашем
эксперименте, и, наконец, обсуждение полученных результатов.
3.5.1. Наборы данных
Эксперименты проводились с использованием двух групп наборов данных.
Первая группа состоит из отзывов онлайн-покупателей, которые мы собрали с
онлайн-маркетов с помощью разработанного веб-скрепера. С другой стороны,
вторая группа состоит из эталонных наборов данных, которые исследователи
широко используют для сравнения с базовыми моделями. В экспериментах
использовались следующие наборы данных:
I. Собранные наборы данных
• Amazon: Набор данных содержит 28 125 онлайн отзывов покупателей о 45
различных продуктах ноутбуков.
• BestBuy: Набор данных содержит 47 905 онлайн отзывов покупателей о 33
различных продуктах ноутбуков.
• Dell: Набор данных содержит 44 175 онлайн отзывов покупателей о 19
различных продуктах ноутбуков.
• Lenovo: Набор данных содержит 85 711 онлайн отзывов покупателей о 21
различных продуктах ноутбуков.

260 II. Эталонные наборы данных
▪ SemEval-14: Организаторы Международного семинара по семантической
оценке (SemEval-2014), проходящего в Дублине, Ирландия, объявили
конкурс заданий по семантической оценке для двух доменных наборов
данных; Нас интересует четвертая задача, связанная с анализом тональности
относительно аспектов и, точнее, первая подзадача, связанная с Извлечение
Аспектных Терминов. В набор данных входят отзывы покупателей из двух
различных областей - ресторанов и ноутбуков. Таблица 3.1 показывает
основные характеристики упомянутых наборов данных. Рисунок 3.3
показывает иллюстративный пример, в котором представлен формат одного
аннотированного предложения из набора данных об испытании ноутбука.
Рисунок 3.3. Образец пробного набора данных ноутбука показывает
аннотированное предложение с использованием XML-тегов
Таблица 3.1. Основные характеристики наборов данных SemEval-14
Набор данных Ноутбуки Ресторан
Проб Испыт Общ Проб Испыт Общ Количество предложений 3048 800 3848 3044 800 3844
Аспекты Термин
С повтором 2373 654 3027 3699 1134 4833 Уникальные элементы 1048 419 1315 1295 555 1657

261
3.5.2. Установка эксперимента
Мы экспериментировали с различными подходами для задействованных
техник в нашем ансамбле. Далее мы рассмотрим настройки эксперимента
относительно альтернатив, доступных для каждой задачи.
I. Вложения слов
Чтобы извлечь аспектные термины и аспектные фразы, мы извлекли
последовательности слов, которые встречаются вместе, используя модели n-грамм.
При этом учитывались только часто встречающиеся последовательности слов.
Затем эти фразы заменяли слова, встречающиеся в единственном числе в
предложениях, перед тем как ввести их в модель встраивания слов, чтобы
обработать их как один термин.
Word2Vec: Было выполнено несколько прогонов для выбора наиболее
подходящих гиперпараметров из этих прогонов на наших наборах данных
следующим образом: размерность векторов слов равна 300, максимальное
расстояние между целевым словом и соседним словом равно 30 токенам,
минимальная частота слов равна 100, обучение модели с использованием
алгоритма Skip-Gram по методу отрицательной выборки, количество рабочих
потоков, используемых для обучения модели, равно 8. Наши эксперименты были
реализованы с использованием Genism версии 4.0.
BERT: Мы использовали 2 различные предварительно обученные модели
вложений слов. Первая - это модель Base uncased, состоящая из глубокой
нейронной сети с 12 слоями; размерность, представляющая каждую лексему,
составляет 768 признаков. С другой стороны, вторая модель - это Large uncased
version, которая состоит из глубокой нейронной сети с 24 слоями; размерность,
представляющая каждую лексему, составляет 1024 признака. Токенизация
предложения была выполнена с помощью модели "BERT Tokenizer", которая
добавляет специальные токены '[CLS]', обозначающие начало текста, и '[SEP]' для

262 разделения соседних предложений, а также для набивки и усечения всех
предложений. max_length установлено в 64; padding равен 'max_length'; свойство
returning attention mask установлено в "True" для построения масок внимания; а
return tensors установлено в 'pt,' для возврата тензоров PyTorch. Модель состоит из
четырех измерений, [# layers, # batches, # tokens, # features]. Для получения
вкраплений слов мы удалили измерение batches и перестроили оставшиеся
измерения следующим образом: [#tokens,# layers,# features]; для каждого токена мы
объединили векторы из последних четырех слоев. Наши эксперименты были
реализованы с использованием torch версии 1.10.0 с Transformers версии 4.11.3 в
качестве бэкенда.
II. Уменьшение размерности
SOM: Было проведено множество испытаний для выбора наиболее
подходящих гиперпараметров из этих испытаний на наших наборах данных
следующим образом: размер сетки SOM установлен на 80 как для числа строк, так
и для числа столбцов; выбранный режим работы - несамостоятельный режим;
инициализация несамостоятельного режима установлена на "random"; число
итераций установлено равным 50000; режим обучения установлен на "Batch Mode";
выбранный режим соседства - "линейный"; выбранный режим обучения
несамостоятельной SOM - "min"; метрика расстояния для сравнения на уровне
признаков - "евклидово расстояние"; начальная и конечная скорости обучения
установлены на 0. 5 и 0.05 соответственно; весовой режим расстояния между
соседями установлен на "псевдогауссово"; количество заданий для параллельного
выполнения - 3; для свойства случайного состояния используется генератор
случайных чисел метода NumPy "random"; регуляторы многословности
установлены на ноль. Наши эксперименты проводились с использованием
реализации SOM "susi".
t-SNE: Мы использовали следующие параметры, которые подошли для
нашего набора данных: число измерений встроенного пространства установлено на

263 2-D; число ближайших соседей "perplexity" установлено на 40; скорость обучения
равна 300; свойство раннего преувеличения установлено на 24; максимальное
число итераций для оптимизации установлено на 2500; прерывание оптимизации
произойдет после 500 непрогрессивных итераций; минимальный порог нормы
градиента для прекращения оптимизации меньше 1e-7; метрика расстояния между
экземплярами в массиве признаков выбрана "Euclidian"; инициализация
встраивания установлена на "PCA"; генератор случайных чисел установлен на 25;
установка свойства square distances на "legacy" для возведения в квадрат значений
расстояний. Наши эксперименты были реализованы с использованием "scikit-learn"
версии 0.23.2 в качестве внутреннего интерфейса.
III. Кластеризация
K-Measns++: В зависимости от результатов многочисленных испытаний, мы
использовали следующие настройки параметров: предпочтительное число
кластеров находится в диапазоне от 50 до 250 в зависимости от размера набора
данных; метод инициализации установлен на "k-means++"; максимальное число
итераций для одного запуска равно 400; число запусков с различными семенами
центроидов установлено на 15; свойство относительного допуска установлено на 0.
0001; режим многословия установлен на ноль; генерация случайных чисел для
инициализации центроидов установлена на Zero для детерминированной
случайности; свойство "copy_x" установлено на "True", чтобы избежать
модификации исходных данных; используемый алгоритм K-means выбран как
"Elkan". Наши эксперименты были реализованы с использованием "scikit-learn"
версии 0.23.2 в качестве внутреннего интерфейса.
3.5.3. Метрики тестирования и оценки
I. Метрики оценки
Результаты проведенных экспериментов оценивались с помощью следующих
метрик: Precision (P), Recall (R) и F-measure (F), чтобы оценить эффективность

264 предложенной модели. Что касается списка извлеченных аспектов, то точность -
это доля правильных извлеченных аспектов "cor(asp)" к общему количеству
извлеченных аспектов "pre(asp)". А recall - это доля правильных извлеченных
аспектов ко всем правильным признакам "true(asp)". С другой стороны, F-score
представляет собой индикатор общей производительности precision и recall; это
среднее гармоническое значение precision и recall. Формулы точности, отзыва и F-
score следующие:
𝑃𝑟𝑒𝑐𝑖𝑠𝑖𝑜𝑛 (𝑃) =
𝑐𝑜𝑟(𝑎𝑠𝑝)
𝑝𝑟𝑒(𝑎𝑠𝑝) (3.1)
𝑅𝑒𝑐𝑎𝑙𝑙 (𝑅) =
𝑐𝑜𝑟(𝑎𝑠𝑝)
𝑡𝑟𝑢𝑒(𝑎𝑠𝑝) (3.2)
𝐹 − 𝑆𝑐𝑜𝑟𝑒 =
2 ∗ 𝑃 ∗ 𝑅
𝑃 + 𝑅 (3.3)
II. Базовые методы
Чтобы проверить эффективность предложенной нами модели, было проведено
сравнение нашей модели с несколькими базовыми моделями для этой задачи,
включая следующие модели:
• DTBCSNN+F [134]: Модель сверточной нейронной сети с суммированием,
построенная на основе дерева разбора зависимостей для улавливания
синтаксических особенностей.
• MFE-CRF [114]: Основанная на условном случайном поле кластеризация с
многофункциональным встраиванием была предложена для захвата неявной
контекстуальной информации.
• Wo-BiLSTM-CRF [116]: Используя предварительно обученную модель
вложения слов "Glove.42B", двунаправленная длинная кратковременная

265
память с условным случайным полем были предложены для улучшения
представления и извлечения признаков.
• WoCh-BiLSTM-CRF [116]: Использование встраивания слов на уровне
символов, а также встраивания на уровне слов с помощью предварительно
обученной модели вложения слов "Glove.42B", для повышения
производительности двунаправленной долговременной кратковременной
памяти с дополнительным условным случайным полем.
3.5.4. Анализ и обсуждение результатов
В этом разделе предложенные модели были протестированы, чтобы проверить
жизнеспособность нашей работы для реализации; также было проведено сравнение
с базовыми моделями, чтобы оценить эффективность наших моделей и убедиться
в их качестве. Мы предложили несколько ансамблей моделей, которые используют
два различных метода предварительного обучения вложения слов, два различных
метода уменьшения размерности и один алгоритм кластеризации:
➢ W-S-K: Word2Vec – SOM – K-Means++
➢ W-t-K: Word2Vec – t-SNE – K-Means++
➢ B(B)-S-K: BERT (Base) – SOM – K-Means++
➢ B(L)-S-K: BERT (Large) – SOM – K-Means++
➢ B(B)-t-K: BERT (Base) – t-SNE – K-Means++
➢ B(L)-t-K: BERT (Large) – t-SNE – K-Means++
(1). Word2Vec против BERT
Результаты, представленные в Рисунок 3.4, показывают, что общая
производительность моделей, использующих вложения слов BERT, выше, чем у
моделей, использующих вложения слов Word2Vec. Это может быть связано с
хорошим обучением, на котором построены различные модели BERT, а также с

266 представлением слов, которое включает семантическую и контекстуальную
информацию о словах с двух сторон, что дает более высокое качество, чем у
моделей, созданных Word2Vec.
(2). SOM против t-SNE
Результаты эксперимента показывают, что SOM и t-SNE действуют одинаково
при малых объемах данных с относительным преимуществом t-SNE, в то время как
при увеличении объема данных SOM демонстрирует лучшие результаты при
огромных объемах данных.
(3). Оценка значения K
Многочисленные прогоны были выполнены с использованием различных
последовательных значений K; результаты показывают, что наилучшая
производительность может быть получена при значениях в диапазоне от 50 до 250.
Рисунок 3.4 показывает результаты различных комбинаций моделей с точки зрения
точности на каждом наборе данных отдельно; для наглядности мы ограничили
результаты исключительно диапазоном предпочтительных значений. Можно
заметить, что самая высокая точность была достигнута при k = 150.
(4). Анализ производительности предлагаемых моделей
Сравнение предложенных моделей, представленное в Рисунок 3.5,
показывает, что третья модель "B(B)-S-K" и четвертая модель "B(L)-S-K"
соответственно превосходят другие модели с небольшим превосходством
четвертой модели. Эта ситуация была доказана ранее при сравнении внесенных
процедур, где вклады BERT и SOM обеспечивают значительно лучшую
производительность, чем Word2Vec и t-SNE, соответственно.

267
(А) Набор данных Amazon (Б) Набор данных BestBuy
(В) Набор данных Dell (Г) Набор данных Lenovo
Рисунок 3.4. Влияние значения K на результаты эксперимента в процентах
точности
76.00
78.00
80.00
82.00
84.00
86.00
88.00
90.00
5 0 1 0 0 1 5 0 2 0 0 2 5 0
Значение K
W-S-K W-t-K B(B)-S-K
B(L)-S-K B(B)-t-K B(L)-t-K
77.00
78.00
79.00
80.00
81.00
82.00
83.00
84.00
85.00
86.00
87.00
88.00
5 0 1 0 0 1 5 0 2 0 0 2 5 0
Значение K
W-S-K W-t-K B(B)-S-K
B(L)-S-K B(B)-t-K B(L)-t-K
77.00
78.00
79.00
80.00
81.00
82.00
83.00
84.00
85.00
86.00
87.00
88.00
5 0 1 0 0 1 5 0 2 0 0 2 5 0
Значение K
W-S-K W-t-K B(B)-S-K
B(L)-S-K B(B)-t-K B(L)-t-K
76.00
78.00
80.00
82.00
84.00
86.00
88.00
90.00
5 0 1 0 0 1 5 0 2 0 0 2 5 0
Значение K
W-S-K W-t-K B(B)-S-K
B(L)-S-K B(B)-t-K B(L)-t-K

268
Рисунок 3.5. Сравнение полученных результатов от применения предложенных
вариантов моделей на различных наборах данных, где K = 150
(5). Сравнение с базовыми методами
Для того чтобы сравнить наши модели с базовыми методами, необходимо
протестировать их на эталонных наборах данных, которые широко используются
исследователями. Поэтому мы протестировали предложенные комбинации
моделей на наборе данных SemEval-2014. Таблица 3.2 показывает
экспериментальные результаты применения этих комбинаций на наборе данных
ресторанов при значении K, равном 200, и наборе данных ноутбуков при значении
K, равном 150. Результаты показывают, что та же ситуация произошла и с
собранными нами наборами данных, где третья и четвертая модели обеспечивают
лучшую производительность, чем другие комбинации. Главное замечание, что их
производительность стабильна для обоих наборов данных, что доказывает
эффективность наших моделей и их способность обрабатывать различные домены
81.00
82.00
83.00
84.00
85.00
86.00
87.00
88.00
89.00
W-S-K W-t-K B(B)-S-K B(L)-S-K B(B)-t-K B(L)-t-K
Prec
isio
n (%
)
Модель
Amazon BestBuy Dell Lenovo

269 по отдельности, как показано в Рисунок 3.6. Более того, мы можем сказать, что
работа с многодоменными наборами данных все еще остается сложной задачей.
Таблица 3.2. Результаты применения различных Извлечение Аспектных Терминов
моделей на наборе данных SemEval-14, используя значение K, равное 150 для
набора данных ноутбуков и 200 для набора данных ресторанов
Модели Ноутбуков Рестораны
Precision Recall F1 Precision Recall F1 W-S-K 83.98% 72.17% 77.63% 85.86% 78.39% 81.96% W-t-K 84.37% 71.41% 77.35% 84.99% 77.91% 81.30% B(B)-S-K 88.28% 74.45% 80.78% 88.54% 83.95% 86.18% B(L)-S-K 88.72% 75.36% 81.50% 89.83% 84.19% 86.92% B(B)-t-K 85.25% 73.84% 79.14% 86.55% 83.10% 84.79% B(L)-t-K 85.45% 74.14% 79.40% 87.11% 83.22% 85.12%
Рисунок 3.6. Сравнение различных комбинаций моделей с точки зрения
результатов F-score
72.00%
74.00%
76.00%
78.00%
80.00%
82.00%
84.00%
86.00%
88.00%
W-S-K W-t-K B(B)-S-K B(L)-S-K B(B)-t-K B(L)-t-K
F-Score
Ноутбуков Рестораны

270
Что касается оценки наших моделей, мы сравнили результаты F-Score,
достигнутые четвертой моделью предложенных комбинаций "B(L)-S-K", которая
обеспечивает наилучшую производительность, с современными моделями. Из
Таблица 3.3 и Рисунок 3.7 видно, что наша модель превосходит базовые методы.
Она хорошо работает с относительным преимуществом на наборе данных
ноутбуков, в то время как на наборе данных ресторанов она обеспечивает
значительное улучшение по сравнению с другими моделями.
Рисунок 3.7. Сравнение F-score между базовыми методами и нашей моделью для
набора данных SemEval-14
Таблица 3.3. Сравнение результатов F-score базовых методов для SemEval-14
Модели Ноутбуков Рестораны
B(L)-S-K 81.50% 86.92% DTBCSNN+F 75.66% 83.97% MFE-CRF 76.53% 84.33% Wo-BiLSTM-CRF-Glove.42B 81.08% 84.97% WoCh-BiLSTM-CRF-Glove.42B 79.21% 86.05%
70.00%
72.00%
74.00%
76.00%
78.00%
80.00%
82.00%
84.00%
86.00%
88.00%
Ноутбуков Рестораны
F-Score
B(L)-S-K
DTBCSNN+F
DTBCSNN+F
MFE-CRF
Wo-BiLSTM-CRF-Glove.42B

271
3.6. Выводы
Основной задачей, включенной в анализ тональности относительно аспектов,
является извлечение аспектных терминов из свободного текста. Эта значимость
опирается на зависимость других задач от результатов, которые она предоставляет,
что напрямую влияет на точность конечных результатов анализа тональности. В
этой главе мы предложили шесть различных комбинаций моделей для извлечение
аспектных терминов, построенных на основе кластеризации векторов слов,
сгенерированных с помощью предварительно обученной модели BERT, с
помощью техники снижения размерности "SOM" для улучшения качества
кластеров слов, которые могут быть получены с помощью алгоритма
кластеризации K-Means++.
Мы провели обширные эксперименты, чтобы убедиться в правомерности
применения наших моделей и проверить их эффективность, и результаты показали,
что все предложенные модели работают хорошо, но одна из них обеспечивает
лучшую производительность с более высокой точностью, чем другие. Чтобы
убедиться в эффективности модели, мы протестировали нашу лучшую
комбинацию моделей на наборе данных SemEval-14 и сравнили ее с базовыми
методами, и результаты показали, что наша модель превосходит их по показателю
F-Score.

272
4. Глава 4.
Идентификация пола пользователя
4.1. Введение
В последнее время в мире произошло много изменений в связи с трудными
временами, которые мы переживаем. Пандемия существенно затронула многие
сферы; наибольшую долю приобрели электронная коммерция и электронный
маркетинг. Поведение как потребителей, так и продавцов пострадало и
значительно отличается от прежнего, что побудило многие компании заняться этим
вопросом, приложив больше усилий для анализа интересов и желаний клиентов.
Основной мотивацией является повышение своих маркетинговых возможностей и
увеличение коммерческой доли, принимая во внимание возросшую степень
конкуренции между компаниями для достижения удовлетворенности клиентов и
повышения их лояльности. С этой целью компании собирают и анализируют
множество важных данных для предоставления маркетинговых и рекламных
предложений, соответствующих требованиям клиентов [2, 3, 135, 136].
В целом, большинство сайтов интернет-магазинов позволяют клиентам
оставлять свои отзывы о предлагаемых товарах и услугах. Анализ данных о
покупателях, помимо их отзывов, может существенно помочь компаниям при
разработке маркетинговых стратегий, редизайне продукции и т.д. [4, 137, 138]. Пол
клиента считается важным аспектом персональных данных, который может помочь
понять и предсказать поведение клиента и расширить возможности организаций по
предоставлению пользователям наиболее релевантной информации в соответствии
с поисковыми запросами и предпочтениями [139, 140].

273
Обычно гендерная классификация рассматривается как бинарная задача,
"Мужчина и Женщина". Однако, когда речь идет об имени пользователя или имени
профиля, эта задача может быть расширена до троичной задачи, когда некоторые
люди по ряду причин предпочитают регистрироваться анонимно; до конца этой
главы термины "имя пользователя" и "имя профиля" будут использоваться как
взаимозаменяемые. Кроме того, цифровые платформы могут позволить
пользователям регистрироваться с использованием виртуальных имен, что
повышает физическую анонимность [141].
Классификация полов представляет собой сложную задачу, привлекающую
исследователей из различных областей, включая компьютерное зрение, науку о
данных, распознавание образов и т.д. Автоматическое распознавание пола имеет
широкий спектр применения во многих областях, что оправдывает его важность,
включая коммерческие разработки (т.е. рекламу), правоохранительную
деятельность (т.е. юридические расследования), взаимодействие человека и
компьютера (т.е. интеллектуальные системы), демографические исследования (т.е.
социальную классификацию).
Несколько методов было предложено для классификации пола, что зависит от
типа данных, к которым применяется метод (например, изображение, речь, текст,
биометрия) [142-147]. Наша цель - распознать пол по тексту, а точнее, по имени
пользователя. Большинство пользователей предпочитают писать короткие отзывы,
что делает недостаточным использование текстовых подходов для задачи
идентификации гендера.
Предлагаемый подход сталкивается со многими проблемами, которые делают
ГИ проблематичной задачей. Первая проблема заключается в том, что имя
пользователя может содержать не только буквы алфавита, но и цифры, символы и
специальные знаки, что делает задачу классификации не простой. Во-вторых,
использование языка Leet, который широко применяется пользователями,
подразумевает использование некоторых предопределенных цифр вместо букв. В
такой ситуации удаление цифр становится рискованной задачей, требующей

274 обратного процесса подстановок для восстановления исходного имени. Третий
вариант включает использование краткой формы имени путем игнорирования
написания одной или нескольких средних букв, обычно гласных.
4.1.1. Цели исследования
В данной работе мы стремимся достичь двух основных целей. Во-первых, мы
собираем данные об отзывах на различных веб-сайтах и извлекаем данные о
профиле, чтобы создать разнообразный набор данных, подходящий для проверки
модели автоматической идентификации пола. Во-вторых, мы исследуем потенциал
модели динамической обрезки n-грамм для решения проблем идентификации пола
по данным профиля.
4.1.2. Взносы
Чтобы достичь этих целей, мы создаем четыре набора данных, которые
содержат профильные данные покупателей. Созданные наборы данных собраны с
реальных и активных веб-сайтов, которые содержат отзывы покупателей о товарах
и услугах. Затем мы извлекли данные профилей клиентов, написавших отзывы.
Мы также предлагаем многоуровневую систему предварительной обработки
для решения проблем идентификации пола. Первый слой включает удаление
нерелевантных символов и специальных знаков из входного шаблона. Что касается
использования языка Leet, то обратные замены рассматриваются с учетом всех
возможных случаев. С другой стороны, второй слой связан с удалением
оставшихся чисел после завершения всех возможных цифро-алфавитных замен.
Кроме того, опечатки и краткие формы также обрабатываются с помощью
динамически обрезанной модели n-грамм и нечеткого сопоставления. Мы оценили
эффективность предложенной модели; полученные результаты демонстрируют ее
обоснованность и надежность.
Остальная часть этой главы организована следующим образом: В разделе 2 мы
кратко представляем некоторые связанные концепции с обсуждением

275 соответствующих исследований. Основные компоненты нашей модели были
подробно описаны в разделе 3. В разделе 4 представлена предлагаемая модель с
описанием системы идентификации пола. Кроме того, в разделе 5 представлены
подробности проведенных экспериментов, включая описание набора данных,
использованных в данном исследовании. Также приводятся детали реализации и
анализ полученных результатов. В этом контексте описывается механизм
тестирования, а также метрики и критерии оценки. И, наконец, заключение, в
котором обобщаются результаты и дальнейшая работа.
4.2. Предпосылки исследования
Этот раздел посвящен обзору смежных концепций, включая веб-
персонализацию. Далее всесторонне обсуждаются методы гендерной
классификации, Мы рассмотрели только текстовые подходы в связи с их
актуальностью для нашей работы.
4.2.1. Веб-персонализация
Веб-майндинг - это применение методов интеллектуального анализа данных
на веб-ресурсах для извлечения скрытых знаний. Одной из наиболее
привлекательных областей веб-майндинга является веб-персонализация, целью
которой является оптимизация услуг и данных, предоставляемых пользователям,
путем мониторинга истории их взаимодействия, профилей пользователей,
предпочтений, географического положения, интересов и т.д.. Таким образом,
общее определение техники персонализации - это настройка выходных данных
системы на основе собранной информации о пользователях системы [5, 148].
Иначе говоря, термин персонализация относится к улучшению результатов,
представленных пользователю, путем повышения степени релевантности
результатов. Рекомендации и предложения - это различные формы результатов
применения методов персонализации собранных данных (например, предложения
Facebook, результаты поиска Google и т.д.) [149].

276
Традиционно системы персонализации изначально полагались на явные
отзывы пользователей и рейтинги. Было проведено множество исследований для
улучшения качества и релевантности результатов, которые используют
дополнительную информацию, такую как время пребывания, клики пользователя и
другие, через рейтинговую схему. Также разработаны другие методы, основанные
на коллаборативной фильтрации КФ для построения систем персонализации и
рекомендаций. Другие методы включают в себя методы мягких вычислений
(например, нечеткая логика, нейронные сети и генетические алгоритмы) в качестве
полезного инструмента для решения этой проблемы [150, 151].
4.2.2. Техники гендерной идентификации
Последнее время разработка методов гендерной классификации становится
все более интерактивной, вызывает все больший интерес и привлекает
исследователей из различных научных дисциплин. Применение методов
классификации направлено на извлечение характеристик, различающих
мужественность и женственность. Основной целью является автоматическое
определение пола человека по имеющимся данным. Исходя из принятого типа
данных, мы можем разделить предложенные подходы на четыре класса: (1)
подходы на основе анализа текста, (2) подходы на основе распознавания лиц, (3)
подходы на основе распознавания речи и (4) подходы на основе биометрии. Далее
следует краткий обзор подходов к идентификации пола, основанных на анализе
текста:
Поскольку большая часть информации в Интернете представлена в текстовой
форме, вполне оправданно, что она вызывает наибольший интерес и на нее
приходится наибольшая доля исследовательских предложений. Текстовые данные
могут быть представлены в нескольких формах: имена авторов, твиты, посты в
Facebook, сообщения, блоги и т.д. Многие исследователи предлагали решения для
распознавания пола авторов текста; большинство из них сосредоточены на текстах,
доступных в социальных сетях онлайн. В 2015 году в работе [152] были

277 представлены комбинированные подходы к классификации гендерных признаков
с использованием методов интеллектуального анализа текста. В ней используются
социолингвистические особенности текста для повышения эффективности методов
интеллектуального анализа текста. Более того, авторы работы [153] предложили
интегрировать подход текстового анализа для изучения предпочтений автора для
задач гендерной классификации. Поиск лингвистической информации в
предпочтениях автора может повысить эффективность гендерной классификации.
Таким образом, интеграция самоприсвоенного пола в бинарный классификатор ГИ
может повысить точность результатов. Авторы [154] представили подход
контролируемого обучения под названием "Каскадный трансформатор" для
определения пола именованных сущностей в тексте. Маркировка
последовательностей с учетом контекста, в котором появляется имя, определяет их
решение для определения пола; "женский", "мужской", "неоднозначный" и
"другой" представляют собой возможные метки. Предложенная модель была
протестирована и оценена на четырех наборах данных с открытым исходным
кодом, созданных авторами.
Хотя большинство исследователей стремятся разрабатывать решения для
английского текста, было предложено несколько исследовательских работ для
работы с другими языками, такими как арабский [155-157], русский [158, 159], и
португальский [160]. Авторы [157] представили специфический для данного языка
алгоритм, основанный на N-Gram Feature Vector, который работает с египетским
диалектом. Они решают задачу классификации текста с помощью смешанного
вектора признаков, который был применен к аннотированному авторами набору
данных египетского диалекта. Весовые коэффициенты признаков применялись с
помощью Random Forest с Mixed Feature Vector и Logistic Regression с N-Gram
Feature Vector. Кроме того, в работе [156] в 2020 году, авторы используют методы
глубокого обучения для решения задачи идентификации пола. Они исследовали
несколько разновидностей нейронных сетей (например, конволюционные
нейронные сети, конволюционная двунаправленная долговременная

278 кратковременная память, долговременная кратковременная память) на арабском
тексте в Twitter, а точнее на египетском диалекте. Они обнаружили, что наиболее
подходящей моделью была Convolutional Bidirectional Gated Recurrent Units,
которая достигла наивысшей точности. Обращаясь к русскому языку, авторы
работы [158] исследовали применение обычных моделей машинного обучения
(например, Support Vector Machine, Gradient Boosting, Decision Tree) и
разновидностей нейронных сетей (например, Convolutional Neural Network, Long-
Short Term Memory) на русском тексте с гендерным обманом для решения задачи
ГИ. Они рассмотрели несколько комбинаций и предложили четыре лучшие модели,
которые достигли высокой точности. Что касается португальского языка, авторы
работы [160] предложили применить методы машинного обучения к
португальскому языку в Twitter. Они объединили извлеченные из текста мета-
атрибуты с алгоритмами ML для распознавания лингвистических выражений,
связанных с полом. В процессе классификации учитывалось несколько факторов
(например, многожанровость, символы, тексты без содержания, структура и
морфология, синтаксис). Более того, значимость задачи идентификации пола
побудила авторов работы [161] разработать и создать набор программных
инструментов, построенных с использованием языка программирования R.
Исходный текст пакета называется genderizeR. Кроме того, существует несколько
инструментов, совместимых с другими языками программирования, такими как
python. Пакеты Python для гендерной классификации включают chicksexer, gender-
guesser и т.д.
4.3. Основные процедуры
В целом, предлагаемая модель включает в себя несколько подзадач, в том
числе сегментацию данных (подробнее см. главу 2), преобразование и очистку
данных, динамический отбор признаков n-грамм и исправление опечаток. Далее мы
обсудим основные процедуры нашей модели с различными вариантами
конкретных задач для настройки производительности.

279
4.3.1. Конвертация и очистка данных
Большинство веб-сайтов, как правило, используют одни и те же правила для
создания имен пользователей. Разработчики сайтов разрешают клиентам
синтезировать свои имена пользователей, используя буквы алфавита и цифры.
Также можно разрешить использование знаков подчеркивания или любого другого
набора специальных знаков и символов. Человеческие имена содержат только
буквы, поэтому для целей гендерной идентификации разумно оставить только
буквы и убрать все остальные символы и цифры. К сожалению, пользователи
предпочитают использовать цифры рядом с буквами для создания своего имени
пользователя (например, дата рождения, данные о браке) как дополнительный
фактор, отличающий их от других пользователей с таким же именем. Более того,
растет использование числовых замен букв или того, что известно как "Leet
language." Поэтому удаление чисел становится небезопасным и может привести к
ошибочным результатам; таким образом, мы должны быть осторожны при
принятии решения о том, какие числа нужно удалять, а какие нет.
Leet или "leetspeak" - это неформальный язык, суть которого заключается в
замене одной или нескольких английских букв в слове специальными символами
или цифрами, напоминающими буквы по внешнему виду. При этом мы производим
обратную замену, заменяя эти числа на исходные буквы. Отношение замены не
один-к-одному, а один-ко-многим, то есть у каждой буквы есть несколько
возможных замен [162, 163]. Первоначально Leet был предназначен для
непонятного общения между пользователями компьютерной доски объявлений, но
он становится явлением, доминирующим в социальных сетях, чатах и комиксах
[164]. Таблица 4.1 показывает распространенные замены, которые мы
рассматривали в нашей работе.

280 Таблица 4.1. Наиболее распространенные буквы, имеющие числовые замены
Алфавитный Символ
Числовой Замены
A 4 B 6 | 8 | 13 E 3 G 6 | 9 I 1 L 1 | 7 O 0 P 9 Q 9 R 2 | 12 S 5 T 1 | 7 Z 2
4.3.2. Динамический отбор признаков с обрезкой N-грамм
Выбор признаков динамически путем применения динамически обрезанной
модели n-грамм представляет собой основную цель этой задачи. Под термином
"признаки" в данном контексте мы понимаем имя или часть имени, которые
потенциально могут быть извлечены из входного шаблона. Для поиска совпадений
используется техника нечеткого сопоставления, позволяющая справиться с
ошибками в написании символов. Таким образом, после завершения возможных
замен заданных чисел на соответствующие буквы и последующей очистки данных
путем удаления оставшихся чисел или любых других символов начинается процесс
отбора признаков. Входные данные для этого этапа состоят только из
последовательности букв.
После создания поискового шаблона по модели N-грамм алгоритм начинает
просматривать маркированную базу данных на предмет совпадений, используя

281 весь входной шаблон, где "N" означает количество букв во входном шаблоне.
Набор данных с метками состоит из предварительно классифицированных имен,
разделенных на две группы в соответствии с полом имени: мужские и женские.
Затем вычисляется сходство между поисковым шаблоном и результатами из этих
двух групп. На следующем этапе выбираются наиболее похожие результаты,
превышающие определенный порог, и вычисляется суммарное сходство отдельно
для каждой группы. После этого мы измеряем релевантность входного шаблона и
результатов поиска. Если мы находим значительные совпадения, мы можем
непосредственно определить, к какой группе принадлежит текущий шаблон.
С другой стороны, если совпадений нет или результаты не помогли
определить пол текущего шаблона, обрезка N-грамм будет применяться
динамически в этом контексте. Обрезка означает, что длина поискового шаблона
будет уменьшена на единицу, где "N" становится "N - 1". Рисунок 4.1 показывает
иллюстрацию использования этого механизма для улучшения производительности
процесса поиска.
Рисунок 4.1. Иллюстрация использования модели N-грамм для синтеза шаблонов
поиска

282
Таким образом, создание поискового шаблона всегда начинается с
максимально возможного порядка N-грамм, равного длине входного шаблона.
Если совпадений нет, начинается обрезка шаблона путем уменьшения порядка N-
грамм на одну за раз, пока не будут найдены совпадения или достигнут
определенный порог "минимального порядка", который мы установили равным n =
3. Поскольку некоторые пользователи предпочитают регистрироваться анонимно,
достижение конца процесса поиска без совпадений означает, что имя пользователя
будет классифицировано как анонимное.
4.3.3. Исправление опечаток
Клиенты не обязаны правильно писать свои имена при создании
синтезирующей строки имени пользователя. Например, пользователи могут
предпочитать писать имена в краткой форме, например, писать "Jhn" вместо "John".
Также можно случайно пропустить одну или несколько букв или написать
неправильные буквы в строке. Столкновение с такой проблемой, независимо от ее
причины, приведет к несовпадению в процессе идентификации пола. Поэтому
процесс поиска совпадений в значительной степени зависит от решения проблемы
неправильного написания.
В этом контексте было представлено несколько методов; для решения такой
проблемы широко используется нечеткое согласование, также известное как
приблизительное согласование строк и нечеткий поиск строк. Оно позволяет с
высокой точностью распознавать слова, которые обычно не соответствуют
входному образцу. Более того, многие приложения, такие как поисковые системы,
были построены на основе нечеткого соответствия для предоставления
релевантных результатов, если в запросе пользователя есть опечатка. Нечеткий
поиск по тексту может быть реализован с помощью многих алгоритмов, таких как
расстояние Дамерау-Левенштейна, расстояние Хэмминга, дерево BK или дерево
Буркхарда-Келлера, алгоритм Bitap и расстояние Левенштейна, которое мы
использовали в качестве базового алгоритма для нашей реализации.

283
Расстояние Левенштейна, также известное как расстояние редактирования,
является метрикой строки, которая подсчитывает количество правок, необходимых
для преобразования входного слова "Str1" в целевое слово "Str2", и предлагает
минимальное количество правок, которое представляет разницу между двумя
словами, задаваемую следующим уравнением.
𝑙𝑒𝑣𝑎,𝑏(𝑖, 𝑗) =
{
𝑚𝑎𝑥(𝑖, 𝑗) 𝑖𝑓 𝑚𝑖𝑛(𝑖, 𝑗) = 0,
𝑚𝑖𝑛 {
𝑙𝑒𝑣𝑎,𝑏(𝑖 − 1, 𝑗) + 1
𝑙𝑒𝑣𝑎,𝑏(𝑖, 𝑗 − 1) + 1 𝑜𝑡ℎ𝑒𝑟𝑤𝑖𝑠𝑒,
𝑙𝑒𝑣𝑎,𝑏(𝑖 − 1, 𝑗 − 1) + 1(𝑎𝑖≠𝑏𝑗)
(4.1)
где a, b обозначают первую и вторую строки, соответственно, а i, j обозначают
позиции символов в первой и второй строки.
Здесь термин редактирование относится к выполнению действий, которые
включают исключительно замену, вставку или удаление одного символа за один
раз. Рисунок 4.2 показывает наглядный пример вычисления расстояния
редактирования между двумя строками с помощью матрицы.
Рисунок 4.2. Пример вычисления расстояния редактирования между строкой1 и
строкой2 с помощью матрицы

284
4.4. Предлагаемая модель для ГИ
Основной целью данной работы является определение пола покупателя по
имени пользователя. Предлагаемая модель предназначена для сбора, обработки и
анализа данных о потребителях на онлайн-рынках. В этом разделе мы
представляем динамическую модель обрезки n-грамм для определения пола
покупателя по зарегистрированному имени пользователя. Далее мы обсудим
рабочий процесс нашей модели и принцип ее работы.
4.4.1. Описание фреймворка
В целом, предлагаемая модель включает в себя несколько задач, начиная со
сбора данных, затем ряд процессов анализа и заканчивая присвоением правильных
меток пользователям, как показано в Рисунок 4.3. Сбор данных об отзывах - это
первый шаг в данной работе, который мы обсудили в Главе 2. Поскольку мы будем
использовать те же наборы данных, которые были описаны ранее, мы перейдем
непосредственно к следующему шагу, который включает в себя извлечение поля
имени пользователя из собранных данных. Как правило, веб-сайты не разрешают
использовать пробелы при создании имени пользователя во время регистрации или
подачи отзыва. Поэтому клиенты могут не найти альтернативы написанию
слитного имени, что усложняет задачу идентификации пола. Таким образом,
сегментация слов представляется подходящим решением для решения этой задачи.
Как правило, имя пользователя может содержать буквы, цифры и специальные
символы. Кроме того, многие люди предпочитают использовать общепринятые
замены определенных букв в слове на определенные числа, известные как язык
Leet. Распознавание этих чисел и замена их правильными буквами является
следующей задачей, которую необходимо решить. После этого необходимо
удалить оставшиеся цифры и/или символы, чтобы после завершения этого этапа
остались только буквы алфавита.

285
Рисунок 4.3. Экспериментальная структура модели гендерной идентификации
Имена людей одного пола сходятся в группы, и каждая группа имеет общую
морфологию. Формы родства варьируются от сходства в структуре слова до частей
слов, таких как префиксы, суффиксы, корневые слова и стебли. Поиск
совпадающих имен в наборе данных начинается с входного шаблона и создает
комбинацию N-грамм, где n представляет собой количество символов во входном
слове. При постоянном отсутствии подходящих слов n уменьшается на одну букву
и становится (n - 1), пока не будет найдено соответствие или достигнут
определенный порог; этот процесс называется динамической обрезкой N-грамм.
Обычно веб-сайты ограничивают количество знаков и символов, из которых
может состоять имя пользователя, кроме того, некоторые пользователи практикуют
игнорирование некоторых букв, обычно гласных из середины слова. Из Рисунок
4.3 видно, что процесс поиска совпадающих имен и фамилий объединен с другой
задачей. Текущей задачей является решение проблем с неправильным написанием
слов. Таким образом, при поиске совпадений мы учитываем вероятность пропуска
символов С намерением или без намерения.

286

287
Таким образом, результаты предыдущих заданий представляют собой набор
номинаций пола извлеченных частей имен, связанных с определенными
вероятностями. С учетом этих результатов и частот совпадений принимается
окончательное решение о половой принадлежности пользователя. Алгоритм 4.1
представляет механизм предлагаемой модели более подробно и поясняет, как
различные подпроцедуры могут взаимодействовать и сотрудничать для получения
окончательных результатов.
4.5. Эксперименты и результаты
Чтобы проверить эффективность нашей работы, мы протестировали и оценили
нашу модель на реальном наборе данных, собранных на сайтах онлайн-маркетов,
которые позволяют клиентам регистрироваться и писать отзывы о товарах или
услугах. Данные об отзывах покупателей и информация о пользователях находятся
в открытом доступе. Поскольку детали реализации были полностью представлены
в главе 2, мы перейдем непосредственно к обсуждению набора данных,
использованного в эксперименте, а далее рассмотрим полученные результаты.
4.5.1. Наборы данных
Несмотря на наличие множества баз данных, используемых в целях гендерной
идентификации, насколько нам известно, не существует базы данных, содержащей
реальные имена пользователей с реальной практикой. К сожалению, не существует
эталонных наборов данных, которые могли бы служить нашей цели. Поэтому мы
решили собрать реальные данные с активных веб-сайтов. Предлагаемая работа по
идентификации пола нацелена на данные о покупателях, зарегистрированных на
веб-сайтах онлайн-маркетов, которые позволяют покупателям писать отзывы о
конкретных товарах или услугах. Для этого мы разработали веб-скребок для сбора
данных с веб-сайтов, как описано в разделе "Сбор данных" в главе 2.

288 Таблица 4.2. Характеристики выбранных наборов данных
Наборы данных Веб-сайт Кол-во
продуктов
Временной интервал Кол-во обзоров Дата
начала Дата
окончания DS1 Bestbuy 3 Apr.-2019 Sept.-2020 4355 DS2 Amazon 4 May-2018 Sept.-2020 2500 DS3 Dell 1 Nov.-2019 Sept.-2020 2325 DS4 Lenovo 2 Oct.-2018 Sept.-2020 8163
Независимо от большого объема данных, доступных через Интернет, и
способности разработанной программы легко собирать данные, проведение
экспериментов на этом объеме становится невозможным, это реле на характер
процесса тестирования, где процесс классификации должен быть выполнен дважды
для обеспечения достоверности результатов предложенной модели. Сначала
исходные данные должны быть классифицированы вручную, а затем данные
вводятся в модель для применения автоматической классификации и сравнения
результатов с ручной классификацией. Поэтому для отбора данных для участия в
эксперименте мы установили определенные критерии, которым необходимо
соответствовать. Главный критерий заключается в том, что предлагаемые данные
должны включать все случаи, которые может обработать предлагаемая модель.
Таблица 4.2 показывает основные характеристики выбранных наборов данных из
коллекций данных, указанных в главе 2.
4.5.2. Эксперимент
Первым шагом на пути к достижению целей работы является извлечение
списка имен пользователей из созданных наборов данных; таким образом,
результат включает в себя четыре группы имен пользователей. Далее выполняется
необходимая предварительная очистка данных, которая включает в себя удаление
элементов списка, содержащих только цифры, элементов, в которых явно указано,
что имя пользователя является "Анонимным", или элементов, содержащих

289 совокупность буквенных символов меньше определенного порога. Сегментация
данных является следующим шагом; для каждого имени пользователя задача
состоит в том, чтобы определить отдельные части имени в случае клиентов,
которые зарегистрировались с полным именем (например, имя и фамилия).
Последующие процессы для определения пола будут применены для каждого
сегмента имени; затем будет проведена оценка всех частей имени вместе, чтобы
принять окончательное решение о поле имени пользователя.
Таблица 4.3 показывает реальные иллюстративные примеры из нашего набора
данных, которые демонстрируют влияние процесса сегментации слов на
генерируемый результат. Процесс идентификации пола начинается с получения
сегмента имени в качестве входного шаблона. Начинается с поиска цифр для
проверки наличия или отсутствия подходящей замены на соответствующую букву.
Таблица 4.4 представляет примеры операций преобразования данных, которые
включают замену распознанных чисел, используемых в языке Leet, на правильные
буквы с учетом возможных вариаций.
Таблица 4.3. Образец имен пользователей и полученный список имен после
сегментации
Имя пользователя (необработанные данные)
Сегменты имен (После сегментации)
AppleGadgetGuy [Apple, Gadget, Guy] Jangthang [Jang, thang] Floridamarlin63 [Florida, marlin, 63] KingHenry [King, Henry] Jimmyk [Jimmy, k] BruceLee [Bruce, Lee] Rubysss [Ruby, sss] packerboy82 [packer, boy, 82] Sam2019 [Sam, 2019]

290 Таблица 4.4. Пример имен пользователей с числовой заменой и эквивалентные
правильные имена
Имя пользователя Замененная буква Правильное имя J0hn O ↔ Zero John
4ndrew A ↔ 4 Andrew Fr4nk A ↔ 4 Frank 9eorge G ↔ 9 George 3llie E ↔ 3 Ellie
5ilvia S ↔ 5 Silvia 7ommy T ↔ 7 Tommy
7ony T ↔ 7 Tony Enri9ue Q ↔ 9 Enrique
После выполнения всех возможных замен необходимо удалить все
неалфавитные символы. Таким образом, очищенный сегмент содержит только
буквы, и это время для применения модели N-грамм для генерации возможных
последовательностей. Начиная с N букв, равных длине сегмента, производится
поиск совпадений с использованием техники нечеткого сопоставления для
решения проблем с опечатками. Результаты запроса содержат имена-кандидаты с
их сходствами, и модель выбирает только наиболее похожие на входные образцы.
Затем вычисляется агрегированное сходство по полу и присваивается пол с
наибольшей релевантностью относительно списка возможных
последовательностей. Если совпадений не найдено, процесс поиска повторяется с
более низким порядком N-грамм, где N = N - 1, пока длина входных данных не
достигнет трех символов или не будут найдены совпадения, затем вычисляется
вероятность пола части и присваивается выбор с наибольшей вероятностью.
Наконец, подсчет присвоенного пола для каждой части и выбор метки с наивысшей
частотой; нахождение равных частот подразумевает выбор наибольшей
релевантности, если совпадений не найдено, поэтому мы обязаны присвоить пол
имени пользователя как Anonymous.

291
4.5.3. Тестирование и оценка
Чтобы подтвердить предложенную модель, была проведена следующая
процедура. После завершения задачи предварительной очистки мы случайным
образом отобрали выборку данных из каждого набора данных отдельно. Затем мы
классифицировали данные вручную и присвоили соответствующую метку
каждому имени пользователя из набора данных. После этого мы применили нашу
модель к этим выборкам и получили результаты. Присвоенные вручную метки
были скрыты во время экспериментов. Далее мы сравнили ранее присвоенные
вручную метки и метки, присвоенные моделью, чтобы вычислить точность. С
другой стороны, мы использовали корпус имен в качестве базового набора данных,
используемого для сопоставления имен. Корпус имен находится в открытом
доступе и может быть загружен с помощью пакета Natural Language Toolkit
"NLTK", содержит 2943 мужских и 5001 женских имен.
Рисунок 4.4. Гендерное распределение для каждого набора данных в процентах

292 Таблица 4.5. Матрица путаницы предложенного метода гендерной классификации
на наборе данных в процентах
Набор данных Гендер Мужской Женский Анонимный Общая
точность
DS1 Мужской 80.0 5.5 14.5
88.6 Женский 2.7 87.3 10.0 Анонимный 0.5 1.1 98.4
DS2 Мужской 78.5 7.9 13.6
83.8 Женский 4.8 89.1 6.1 Анонимный 2.9 5.7 91.4
DS3 Мужской 85.6 4.6 9.7
89.2 Женский 2.4 90.7 6.8 Анонимный 3.0 4.0 93.0
DS4 Мужской 84.2 7.3 8.5
84.2 Женский 4.8 83.4 11.7 Анонимный 3.2 11.6 85.3
Рисунок 4.4 показывает гендерное распределение отобранных образцов
нашего набора данных, на которых мы применили нашу модель вслепую.
Полученные нами экспериментальные результаты представлены в Таблица 4.5, где
показана матрица путаницы предложенного алгоритма для идентификации пола;
она показывает правильные результаты классификации для каждой метки в
диагональных записях (т.е. в ячейках [ii]). С другой стороны, записи вне диагонали
указывают на неправильные результаты классификации.
Мы можем заметить, что количество правильных классификаций женских
имен больше, чем правильных классификаций мужских имен; мы рекомендуем
предположить, что причина заключается в большем количестве женских имен в
базовом наборе данных. Также примечательно, что большинство ложных
предсказаний, как правило, анонимны, что логически обосновано. Рисунок 4.5
показывает точность нашей модели, представляющую собой процент правильных
предсказаний к общему количеству лиц каждого пола. Таким образом, можно

293 сказать, что результаты предложенной модели подтверждают ее возможности и
обоснованность, о чем свидетельствует точность результатов классификации.
Рисунок 4.5. Точность классификации нашей модели в процентах
4.6. Обсуждение
В литературе по веб-персонализации были предложены различные методы
анализа данных, предпочтений и настроений потребителей для правильного
понимания их поведения. Основная цель персонализации представлена в двух
основных объектах: осуществление удовлетворительного взаимодействия для
клиентов и продавцов; прогнозирование потребностей потребителя. Ее методы
широко используются многими веб-сайтами, включая поисковые системы и
онлайновые социальные сети, для расширения своих возможностей по
предоставлению пользователям наиболее релевантной информации в соответствии
с поисковыми запросами и предпочтениями. Компании стремятся собирать и

294 анализировать данные о клиентах в нескольких коммерческих целях. Пол клиентов
представляется важным аспектом, который помогает моделировать их поведение.
Хотя онлайн-отзывы признаны важным источником для анализа рынка,
исследования, направленные на разработку методов автоматического определения
пола покупателей по онлайн-отзывам, редко встречаются в литературе.
Несколько подходов были представлены для определения пола автора;
большинство из них, как правило, рассматривают письменные тексты, такие как
твиты, комментарии, блоги и т.д., которые в основном полагаются на извлечение
признаков с помощью методов машинного обучения, моделей глубокого обучения.
Однако эти методы не подходят для определения пола автора по данным его
профиля, а точнее, по имени пользователя. На пользователей оказало большое
влияние развитие лингвистики, связанное с расширением использования
онлайновых социальных сетей, чатов и т.д. Некоторые формы этого влияния
проявляются в использовании языка Leet, аббревиатур имен и других аспектов, что
усиливает гипотезу о непригодности упомянутых техник для задач гендерной
идентификации. Кроме того, объем текста недостаточен для использования этих
техник.
Исследование имеет двойное значение - теоретическое и практическое. С
теоретической точки зрения, это первое исследование, определяющее пол автора
по имени пользователя, связанному с отзывами клиентов в Интернете, насколько
нам известно. Наше исследование вносит вклад в литературу по распознаванию
образов, персонализации и извлечению информации, представляя нетрадиционный
подход, позволяющий автоматически определять пол автора по его имени
пользователя. Кроме того, концепция языка Leet все еще нова и не используется
широко, а включение обратных замен представляет собой новый подход; более
того, он может быть использован во многих других областях анализа текста. Мы
провели эксперименты на четырех наборах данных, собранных и полученных с
активных онлайн-рынков, чтобы исследовать эффективность предложенного нами
метода и изучить его предсказательную способность для подтверждения нашего

295 подхода. Помимо определения пола покупателя по данным онлайн-отзывов, данное
исследование имеет и практическое значение. Предложенная модель имеет
несколько потенциальных будущих бизнес-приложений; она может быть
применена к другим онлайн-сетям, таким как Twitter, Instagram и др. Кроме того,
она может быть включена в другие системы, такие как рекомендательные системы
и профилирование пользователей.
4.7. Выводы
Классификация по полу представляет собой важную задачу в моделировании
поведения пользователей. В данной работе мы представили динамическую
обрезанную n-граммную модель для распознавания пола клиентов по их именам
пользователей. Мы использовали доступные данные об отзывах на веб-сайтах и
извлекли набор данных имен пользователей. Определение пола клиента по имени
его профиля сталкивается с рядом проблем, которые мы четко сформулировали.
Поэтому наша модель состоит из нескольких подзадач, которые взаимодействуют
для эффективной работы, включая сегментацию, числовую подстановку, нечеткое
сопоставление и т.д. Результаты показывают обоснованность и эффективность
нашей работы для предсказания правильного пола по коротким значениям данных.
В качестве будущего направления мы думаем применить нашу модель к наборам
данных из других языков, в частности арабского, и измерить ее валидность и
эффективность.

296
5. Глава 5.
Рекомендательные системы
5.1. Введение
Разнообразие и изобилие доступных альтернатив товаров и услуг является
обоюдоострым мечом как для клиентов, так и для предприятий. Со стороны
клиентов это обеспечивает множество вариантов для удовлетворения всех
различных потребностей покупателей, но на них ложится тяжелое бремя выбора
наиболее подходящего варианта. С другой стороны, это налагает на компании
огромные трудности в получении доли рынка из-за интенсивной конкуренции и
сложности привлечения новых клиентов и обеспечения лояльности существующих
клиентов в условиях открытой рыночной системы [2, 4].
Мнения клиентов представляют собой значительный ресурс как для клиентов,
так и для предприятий, из которого можно извлечь много информации,
помогающей принять правильное решение. Компании прибегают к анализу такого
рода данных, чтобы получить представление о тенденциях рынка и степени
удовлетворенности клиентов их продукцией, проанализировать будущие
потребности и т.д. Напротив, клиенты, которые собираются приобрести новый
продукт или получить определенную услугу, прибегают к чтению отзывов
клиентов, чтобы оценить альтернативы и выбрать наиболее подходящую
альтернативу [4, 165]. Данная работа в основном посвящена изучению стороны
клиентов и разработке решения для помощи им.
На основании вышеизложенного возникает необходимость в создании
интеллектуальной рекомендательной системы, которая использует существующий

297 опыт клиентов, чтобы помочь им принять правильное решение на основе их
предпочтений. Практически, покупателям трудно читать такое большое
количество отзывов, что может занять много времени и пропустить многие
исключительные маркетинговые предложения [166].
В целом, проблема поиска релевантных данных при поиске в Интернете
представляет собой большую проблему для пользователей Сети из-за огромного
количества доступной информации в Интернете. Эти трудности связаны с хорошо
известной проблемой информационной перегрузки. Рекомендательные системы
направляют пользователей к более интересным или ценным объектам в большой
области возможных вариантов, основываясь на их предпочтениях. Их цель -
предсказать намерения пользователей и их потребности в данных, чтобы облегчить
и настроить их работу в Интернете и помочь им, предоставив список
предложенных подходящих ресурсов. Существует широкий спектр
рекомендательных систем. Большинство из них варьируются в основе работы
(например, добыча веб-контента, добыча информации о веб-использовании и т.д.)
[3, 5, 150].
В данной работе представлена система онлайн-рекомендаций товаров под
названием "SmartTips", построенная на основе анализа отзывов покупателей с
использованием анализа тональности относительно аспектов. Она начинает с
определения предпочтений пользователей с помощью исторических данных об
отзывах путем извлечения терминов аспектов и измерения настроений
пользователей по отношению к каждому аспекту в отдельности. Затем модель ищет
в ранее оцененных наборах продуктов продукты, схожие с текущими
предпочтениями пользователей. Данные обзоров используются для оценки
различных продуктов с помощью текста обзора и голосов пользователей. Наконец,
рекомендательная система формирует список продуктов, которые могут быть
интересны пользователю, используя схему ранжирования, которая применяет вес,
отражающий значимость каждого аспекта в соответствии с предпочтениями
пользователя.
298
Организация этой главы следующая. В этом разделе представлена тематика и
мотивы данной работы. Далее, в разделе 2 кратко рассматриваются
рекомендательные системы, включая определение и основные концепции, подходы
к разработке и популярные приложения. В разделе 3 исследуются современные
методы создания рекомендательных систем. В разделе 4 представлена
предлагаемая модель для рекомендаций продуктов, дано объяснение основных
компонентов нашей системы. В разделе 5 представлено объяснение проведенных
экспериментов, доказывающих эффективность нашей модели, включая описание
использованных наборов данных и метрик, использованных для оценки нашей
модели. Также представлено объяснение достигнутых результатов с их
обсуждением. Наконец, в разделе 6 подведены итоги главы и сделаны выводы.
5.2. Предпосылки исследования
В этом разделе представлен обзор рекомендательных систем. Он начинается с
аргументации основных понятий, связанных с РС, включая определение, цели и
стандартную архитектуру для построения РС. Далее всесторонне обсуждаются
существующие подходы к созданию рекомендательных систем. Также
обсуждаются популярные приложения рекомендательных систем.
5.2.1. Основные концепции РС
Интернет представляет собой основной источник, на который полагаются
пользователи при поиске и сборе информации. Объем информации, доступной в
Интернете, быстро растет благодаря постоянному расширению Всемирной
паутины и огромному количеству приложений. Таким образом, проблема
информационной перегрузки представляет собой самую большую проблему для
пользователей во время веб-поиска. Эта ситуация возникает, когда люди
наводнены множеством вариантов информации и услуг. Поэтому получение более
"релевантной" или "интересной" информации становится сложной задачей для
пользователей.

299
Рисунок 5.1. Основная архитектура рекомендательной системы
Рекомендательные системы (РС) были предложены и разработаны для
облегчения проблемы информационной перегрузки путем предоставления
пользователям списка рекомендаций с учетом их предпочтений [167]. Таким
образом, рекомендательные системы можно определить как "систему, которая
анализирует данные пользователя и пытается смоделировать его поведение,
чтобы сформировать список ранжированных объектов, которые могут быть
интересны конкретному пользователю, и, наконец, отсортировать эти объекты
и предоставить ему элементы с наивысшим рейтингом". Исходя из приведенного

300 выше определения, такие системы можно считать подклассом систем фильтрации
информации. Рисунок 5.1 показывает основную схему построения
рекомендательной системы.
Чтобы построить рекомендательную систему, можно использовать несколько
форм данных для выполнения поставленной задачи, включая исторические данные
(например, историю покупок) и предпочтения (например, данные и настройки
профиля пользователя); также можно использовать данные других пользователей
для сравнения поведения текущего пользователя с другими посредством измерения
сходства между поведением разных пользователей.
5.2.2. Методы создания РС
В последнее время наблюдается повышенный интерес к разработке
рекомендательных систем; интеграция рекомендательного механизма стала
необходимой при создании или обновлении любого веб-приложения и мобильного
приложения. Наиболее распространенная классификация подходов к созданию
рекомендательных систем включает три основные категории: основанные на
контенте, коллаборативная фильтрация и гибридные рекомендательные системы.
Другие исследователи представили различные классификации, включая
контекстно-ознакомительную, групповую, многокритериальную, междоменную,
многостороннюю, многозадачную [168]. Рисунок 5.2 показывает иерархию
классификации подходов к рекомендательным системам. Далее следует краткое
обсуждение этих классов.
I. Основанный на содержании
Контент-ориентированные рекомендации основаны в первую очередь на
создании профиля для каждого пользователя, а также предмета.
Основополагающая техника заключается в том, чтобы сопоставить пользователя с
понравившимся ему объектом (например, продуктом, контентом). Другими
словами, историческое поведение пользователя используется для составления

301 рекомендаций для него, включая неявные или явные отзывы. Сравнение между
пользователями и предметами проводится для измерения их сходства, чтобы
решить, какой контент больше подходит пользователю. Векторизация - это
первичный этап создания профилей пользователей и элементов; она преобразует
объекты в векторы, создавая: Вектор объекта и Вектор пользователя. Эти профили
затем используются для измерения сходства между объектами. Существует
несколько способов выполнения этой задачи, наиболее распространенными
являются:
Косинусное сходство: Этот метод рекомендуется использовать, когда
признаки имеют высокую размерность, в частности, в таких областях, как
кластеризация документов, анализ текста, сопоставление онтологий и
информационный поиск.
Рисунок 5.2. Методы создания рекомендательных систем

302
Сходство Жаккара: Также известен как пересечение над объединением,
используется для определения сходства между объектами. Лучше всего работает,
когда векторы содержат двоичные значения, более двух возможных значений,
сходство по Жаккарду не применяется.
II. Коллаборативная фильтрация
Рекомендации, ориентированные на сотрудничество, основаны в первую
очередь на создании матрицы полезности пользователь-предмет. В отличие от
подхода, ориентированного на контент, здесь нет атрибутов, которые
соответствуют пользователям или предметам. В основе метода лежит обучение на
основе исторических транзакций, совершенных пользователями, включая явные
отзывы, такие как оценки пользователей по различным предметам, или неявные
отзывы, такие как история транзакций (например, покупка, просмотр). Таким
образом, основное предположение коллаборативной фильтрации заключается в
использовании схожего поведения пользователей для составления рекомендаций
конкретному пользователю. Существует две основные подкатегории, на которые
можно разделить коллаборативную фильтрацию:
Подход на основе памяти: При таком подходе матрица полезности
пользователя и элемента запоминается, и рекомендации составляются путем
запроса данного пользователя с остальной частью матрицы полезности. Такие
методы не требуют ни уменьшения размерности, ни подгонки модели. В целом, эти
подходы можно разделить на два основных раздела: Подходы фильтрации по
элементам и фильтрации по пользователям.
Подход, основанный на модели: В этом подходе не требуется запоминать
матрицу полезности. Он пытается смоделировать поведение пользователя на
основе этой матрицы. Здесь важно уменьшить размерность и подогнать модель.
Наиболее распространенные реализации подхода, основанного на модели,
включают использование алгоритмов кластеризации, методов глубокого обучения
и алгоритмов на основе матричной факторизации.

303 III. Гибридные модели
Гибридная рекомендательная система относится к системам, которые
объединяют две или более моделей, относящихся к разным категориям; подходы
на основе контента и коллаборативной фильтрации. Поэтому ее можно
рассматривать как особый тип рекомендательной системы. Основной целью
разработки таких комбинаций является преодоление недостатков использования
участвующих подходов по отдельности и повышение их эффективности. Было
представлено несколько реализаций гибридных рекомендательных систем; одна из
них использует два выбранных подхода по отдельности, а затем комбинирует
предсказания. Наиболее распространенные комбинации представлены Robin
Burke, которые включают семь моделей: Взвешенная, Переключающая,
Смешанная, Комбинация признаков, Дополнение признаков, Каскад и Мета-
уровень [169].
5.2.3. Применение РС
В последнее время рекомендательные системы применяются в нескольких
областях для облегчения доступа к желаемой информации или помощи
пользователям в принятии наиболее подходящего решения; упомянутые области
включают онлайн-потоки, электронную коммерцию, социальные сети, образование
и т.д. На самом деле, применение рекомендательных систем в электронной
коммерции получило наибольшую долю вклада. Широкое распространение таких
приложений объясняется их экономическим характером и важностью, которую они
представляют для предприятий и клиентов. Кроме того, важную роль играет
появление мобильных технологий. Система рекомендаций становится
неотъемлемой частью веб- и мобильных приложений; большинство таких
приложений создаются с использованием методов машинного обучения [166].
Несколько примеров рекомендательных систем в этой области включают:

304 • Онлайн-контенты Рекомендации: Предложение нового контента для
повышения вовлеченности пользователей в работу сайта. Цель - познакомить
пользователей с новым контентом, который может заинтересовать их и
побудить к потреблению большего количества контента; онлайн-контент
может включать фильмы, книги, новости и т.д.
• Рекомендации по акциям: Представлять клиентам наиболее прибыльные
акции. Новизна не имеет значения, в список рекомендаций могут входить
акции, которые пользователь использовал ранее; важность зависит от
доходности акций.
• Рекомендации продуктов: Рекомендовать комбинацию продуктов, включая
ранее потребленные и новые продукты. Для первого класса продуктов
история операций пользователей служит напоминанием об их частых
покупках. С другой стороны, новые продукты могут быть предложены в
соответствии с поведением аналогичных пользователей.
• Разговорные рекомендательные системы (РРС): Это инструмент, который
пытается помочь пользователю определить, какие продукты он собирается
купить, используя разговорный механизм. Этот агент может имитировать
естественный разговор между клиентом и профессиональным продавцом,
чтобы вызвать предпочтение клиента.
5.3. Связанные работы
В последнее время разработка рекомендательных систем стала более
интерактивной и вызывает все больший интерес и привлекает исследователей из
различных научных дисциплин [165, 166, 168, 170]. Наличие огромного объема
данных об отзывах побуждает исследователей разрабатывать модели, основанные
на анализе текста. Анализ тональности относительно аспектов представляется
перспективным подходом для измерения настроения пользователей относительно
конкретных аспектов. Поэтому разработка таких систем направлена на то, чтобы

305 уловить предпочтения пользователей на основе их исторических отзывов.
Основная цель - предоставить пользователям список объектов (например,
продуктов, поставщиков услуг), которые могут быть интересны. Далее следует
краткий обзор последних подходов к разработке рекомендательных систем на
основе анализа текста.
Относительно моделей рекомендаций товаров, Lin Qiu et al. [167] представили
тексты отзывов в Интернете и интеграцию рейтингов. Предложенная Aspect-based
Latent Factor Model (ALFM) начинается с группировки текстов отзывов по
пользователям и аналогично по различным предметам и вычисления частот слов
для построения матрицы "пользователь-отзыв" и матрицы "предмет-атрибут"
соответственно. При этом также учитываются оценки полярности и частоты слов
соответствующих элементов. Впоследствии из построенных матриц можно
вывести латентные факторы элементов, латентные факторы слов и латентные
факторы пользователей. Предложенная модель хорошо работает в междоменной
задаче в дополнение к задаче предсказания рейтинга за счет переноса вложений
слов. Авторы [171] представили вычислительную модель для рекомендаций
онлайн-продуктов. Предложенная разговорная рекомендательная система
включает в себя функциональные требования продукта для взаимодействия с
пользователями - рабочий механизм основан на сборе информации от клиента
путем задавания вопросов. Модель объединяет онтологию и структуру при
генерации взаимодействий. Разработанная система способна работать с доменами
многофункциональных и многофункциональных продуктов. Также Aminu Da'u et
al. [172] представили интеграцию анализа тональности относительно аспектов
генерации рекомендаций. В предлагаемой работе используется метод глубокого
обучения для извлечения аспектов из данных обзоров. Кроме того, система
генерирует рейтинги, ориентированные на аспекты, путем вычисления
полярностей настроения. Наконец, сгенерированные рейтинги интегрируются в
машину тензорной факторизации для вычисления общего прогноза рейтинга.
Аналогичным образом, авторы в [173] предложили модель рекомендаций с

306 коллаборативной фильтрацией, которая основана на использовании анализа
тональности относительно аспектов. Модель включает в себя использование
многоканальной глубокой сверточной нейронной сети для извлечения терминов
аспектов продукта из текста отзыва, а затем использование схемы взвешивания для
того, чтобы оценить различные аспекты и создать матрицу рейтингов аспектов.
Затем рейтинги различных аспектов интегрируются для вычисления общей оценки
продукта. Кроме того, авторы [174] предложили систему рекомендаций с
совместной фильтрацией, которая использует представление текста на основе
нейронной сети для измерения сходства между текстами отзывов. Было
представлено семь комбинаций моделей, включая лексические подходы и подходы
на основе машинного обучения для вычисления сходства текстов пользователей;
модель на основе ДКП достигла наилучших результатов.
С другой стороны, Elham Asani et al. [175] представили систему рекомендаций
для ресторанов, которая анализирует отзывы пользователей и извлекает
предпочтения в еде, чтобы генерировать рекомендации на основе извлеченных
предпочтений. Предложенная модель извлекает названия блюд из комментариев, а
затем группирует их; анализ тональности применяется для измерения полярности
по отношению к различным названиям блюд. Рекомендации ресторанов
составляются на основе сходства между предпочтениями пользователей и
рейтингами ресторанов.
Касательно рекомендаций отелей, Biswarup Ray et al. [176] представили
систему рекомендаций отелей, основанную на анализе тональности и методах
категоризации на основе аспектов. Они также представили собранный набор
данных с сайта Tripadvisor.com, включающий отзывы об отелях в Интернете.
Предложенный ансамбль начинается с встраивания слов в текст отзывов клиентов
с помощью модели двунаправленного кодирования представлений из
трансформаторов (BERT). После этого был применен протокол присвоения веса,
который объединил три фазы для нейтрально-отрицательных, положительно-
отрицательных и нейтрально-позитивных настроений. Наконец, рекомендации

307 были сгенерированы путем группировки отзывов в различные классы путем
измерения их сходства с помощью косинусного сходства и нечеткой логики.
5.4. Предлагаемая система для рекомендаций продуктов
В этом разделе представлены детали предложенной нами системы
"SmartTips", которая использует Извлечение Аспектных Терминов модель,
представленную в главе 3 для построения рекомендательной системы. В целом,
предлагаемая система состоит из трех различных компонентов: (1) рейтинг
продуктов, (2) извлечение предпочтений и (3) генерация рекомендаций. Рисунок
5.3 показывает рабочий процесс предлагаемой рекомендательной системы,
который демонстрирует взаимодействие между различными компонентами. Далее
следует подробное описание этих задач.
5.4.1. Рейтинг продуктов
Основной задачей предлагаемой рекомендательной системы является
рейтингование продуктов, которое построено в основном на Извлечение
Аспектных Терминов модели, представленной в главе 3. В целом, предлагаемая
модель рейтингования продуктов учитывает следующую информацию: текст
отзыва, частоту аспектных терминов, слова настроения и их полярность, где
учитывается количество положительных или отрицательных слов настроения по
отношению к каждому аспектному термину, голосование читателей по каждому
отзыву, содержащему один или несколько аспектных терминов. Кроме того, мы
учитываем только отзывы из реальной практики, принимая отзывы,
представленные клиентами с подтвержденными покупками.
Исходными данными для решения этой задачи являются данные об отзывах,
включая сам текст отзыва и метаданные, в частности, голоса читателей. Мы
считаем, что положительные голоса читателей являются важным показателем
релевантности и уверенности в предположениях рецензента; и наоборот,
отрицательные голоса являются обоснованием недоверия к предположениям

308 заказчика. Модель начинается с применения модели Извлечение Аспектных
Терминов к тексту рецензии - далее, извлечение слов мнения, связанных с
терминами аспекта из каждой рецензии, соответственно. Отношения зависимости,
извлеченные с помощью синтаксического анализатора зависимостей с
использованием ЧР-тегов, являются более подходящим методом для извлечения
слов мнения. Затем измеряется полярность этих слов с помощью лексической
техники для оценки извлеченных аспектов. Алгоритм 5.1 представляет методику
вычисления оценки настроения для каждого аспекта, связанного с конкретным
продуктом в наборе данных.
Рисунок 5.3. Общая схема предлагаемой рекомендательной системы

309
В целом, оценка различных аспектов, связанных с конкретным продуктом,
может быть выполнена путем расчета балла настроения "SScore", который в
основном основан на выведении двух ведущих показателей: балла позитивности
"PScore" и балла негативности "NScore", которые могут быть получены с помощью
следующих уравнений.

310
𝑃𝑆𝑐𝑜𝑟𝑒(𝑎) = {
∑𝑝𝑟𝑖
𝑘
𝑖=1
+ 𝑣𝑟𝑖+ − 𝑣𝑟𝑖
− 𝑖𝑓 𝑝𝑟𝑖 > 0,
0 𝑖𝑓 𝑝𝑟𝑖 = 0,
(5.1)
где 𝑝𝑟𝑖 означает количество положительных слов, связанных с аспектом "a" в ith
отзыве; а 𝑣𝑟𝑖+, 𝑣𝑟𝑖
− означает количество положительных и отрицательных голосов
читателей, соответственно.
𝑁𝑆𝑐𝑜𝑟𝑒(𝑎) = {
∑𝑛𝑟𝑖
𝑘
𝑖=1
+ 𝑣𝑟𝑖+ − 𝑣𝑟𝑖
− 𝑖𝑓 𝑛𝑟𝑖 > 0,
0 𝑖𝑓 𝑛𝑟𝑖 = 0,
(5.2)
где 𝑛𝑟𝑖 означает количество негативных слов, связанных с аспектом "a" в ith отзыве;
а 𝑣𝑟𝑖+, 𝑣𝑟𝑖
− означает количество положительных и отрицательных голосов читателей,
соответственно.
𝑆𝑆𝑐𝑜𝑟𝑒(𝑎) =
𝑃𝑆𝑐𝑜𝑟𝑒(𝑎) − 𝑁𝑆𝑐𝑜𝑟𝑒(𝑎)
𝑃𝑎 +𝑁𝑎, (5.3)
где 𝑃𝑎, 𝑁𝑎 означает общее количество положительных и отрицательных слов,
соответственно, связанных с аспектом "a" во всех данных обзора.
5.4.2. Извлечение предпочтений
Обычно для сбора предпочтений пользователей используются два основных
метода; первый - интерактивный метод "разговорной системы" с использованием
веб-агента, который ведет диалог с клиентами в форме вопросов и ответов, а затем
извлекает предпочтения из ответов пользователей. Второй метод извлечения
предпочтений пользователя, который используется в данной работе, может быть
реализован путем сбора всех отзывов, сделанных одним и тем же пользователем, а
затем извлечения характеристик из текста "Предпочтения". Таким образом,
первым шагом в этой задаче является извлечение аспектных терминов для

311 идентификации упомянутых пользователем особенностей. Далее вычисляются
оценки позитивности и негативности, как указано в уравнениях 5.1 и 5.2,
соответственно, с игнорированием голосов читателей, поскольку основной целью
является фиксация только личных предпочтений, где 𝑣𝑟𝑖+, 𝑣𝑟𝑖
− считаются равными
нулю. Аналогично, вычисление балла настроения становится простым в
соответствии с уравнением 5.3. Соответственно, список извлеченных аспектов и их
вычисленные оценки настроения вводятся в систему рекомендаций, чтобы
сформировать соответствующий список продуктов-кандидатов.
5.4.3. Генерирование рекомендаций
Учитывая список продуктов с рейтингом и список предпочтений
пользователя, созданный первым и вторым компонентами нашей системы
соответственно, генерация рекомендаций становится простой задачей. Рейтинги
продуктов состоят из аспектов и связанных с ними вычисленных оценок
настроения. Поэтому первым шагом является поиск продуктов с рейтингом и поиск
товаров, которые имеют аспекты, включенные в список предпочтений
пользователя, создавая список продуктов-кандидатов. Следующим шагом является
оценка каждого продукта в списке кандидатов с помощью следующего уравнения,
где присвоенный вес является оценкой настроения эквивалентного
пользовательского предпочтения "Персонализированная оценка", использующего
исключительно предпочтения клиента.
𝑅𝑎𝑡𝑒(𝑡𝑙) = ∑𝑎𝑖|𝑤𝑖|
𝑚
𝑖=1
, (5.4)
где 𝑎𝑖 обозначает ith аспект, а 𝑤𝑖 обозначает связанный вес с данным аспектом lth
элемента "t".
Аналогично, оценивая различные продукты в списке кандидатов, но на этот
раз включая все упомянутые аспекты в каждом продукте независимо от наличия в

312 предпочтениях клиента "Общей ставки", здесь мы использовали эквивалентные
веса, равные единице. Наконец, список продуктов-кандидатов был отсортирован
по персонализированному и общему рейтингу соответственно, и верхние позиции
были рекомендованы пользователю.
5.5. Эксперименты и результаты
В этой работе мы предложили интегрировать анализ тональности
относительно аспектов в систему рекомендаций на основе совместной фильтрации,
чтобы улучшить производительность системы и точность прогнозов. Поэтому для
подтверждения эффективности предложенной модели мы провели серию
экспериментов. Мы протестировали и оценили ее на нескольких доступных и
общедоступных наборах данных. Ниже приводится описание наборов данных,
использованных в эксперименте. Далее приводится обзор метрик оценки и
эталонов, использованных в нашем эксперименте, и, наконец, обсуждение
полученных результатов.
5.5.1. Наборы данных
Мы оцениваем наши модели Анализ тональности относительно аспектов на
наборе данных, содержащем рейтинги и тексты отзывов. Эксперименты
проводились с использованием эталонного набора данных, который исследователи
широко используют для сравнения с базовыми моделями, собранными с сайта
Amazon, Julian McAuley and Jure Leskovec (2013) [165]. Данные охватывают период
в 18 лет, начиная с июня 1995 года по март 2013 года, и включают более 34
миллионов отзывов, разделенных на 28 доменов в соответствии с категорией
товара, включая сотовые телефоны, электронику и т.д. Для экспериментов мы
выбрали пять категорий. Таблица 5.1 показывает сводку выбранных данных.

313 Таблица 5.1. Краткое описание выбранного набора данных
Набор данных #Пользователи #Элементы #Отзывы
Автомобили 133254 47539 188387 Телефоны и аксессуары 68039 7335 76653 Электроника 811032 80613 1189549 Фильмы и телевидение 1224266 207532 6797757 Видеоигры 228516 20335 364484
5.5.2. Метрики тестирования и оценки
I. Метрики оценки
Для оценки нашей модели и сравнения ее с базовыми моделями мы
использовали среднеквадратичную ошибку (MSE). MSE - это метрика,
используемая для измерения среднего квадрата ошибок между фактическими и
предсказанными значениями; в нашем случае значениями являются рейтинги.
Таким образом, меньшее значение MSE указывает на лучшую производительность
модели. Формально, учитывая тестовый набор из N отзывов, где фактические
оценки – это {𝑟1, . . . , 𝑟𝑛}, а соответствующие предсказанные оценки - {𝑟1̂ , . . . , 𝑟�̂�},
средние квадратичные ошибки определяются следующим уравнением:
𝑀𝑆𝐸 =
1
𝑁∑(𝑟𝑛 − 𝑟�̂�)
2
𝑁
𝑛=1
(5.5)
В то время как наша модель генерирует оценки, состоящие из вещественных
чисел, реальные оценки пользователей состоят из дискретных значений от одного
до пяти. Поэтому для правильной оценки нашей модели необходимо преобразовать
генерируемые оценки в целочисленные значения. Мы использовали подход
дискретизации равной ширины, который разделяет все возможные значения на N
количество бинов, каждый из которых имеет одинаковую ширину; чтобы
выполнить эту задачу, мы использовали следующее уравнение:

314
𝑊 =
1
𝑁 (𝑀𝑎𝑥 −𝑀𝑖𝑛), (5.6)
где N - количество бинов или интервалов, Max и Min - максимальное и
минимальное значения рейтинга, соответственно.
II. Базовые методы
Для лучшей оценки нашей модели "SmartTips" с точки зрения предсказания
рейтинга, было проведено сравнение нашей модели с несколькими базовыми
моделями, включая следующие модели:
• Матричная факторизация (МФ) [177]: Представляет собой одну из
наиболее распространенных рекомендательных систем с коллаборативной
фильтрацией, классифицируемую как подход, основанный на модели. Как
правило, матричная факторизация использует матрицу рейтингов, которая
характеризует как предметы, так и пользователей, в качестве входных
данных для прогнозирования рейтингов путем оценки двух матриц с низким
рангом.
• SVD++ [178]: Это одна из моделей на основе латентных факторов; SVD++
является расширением оригинальной модели разложения по сингулярным
значениям (SVD), которая использует существование как неявной, так и
явной обратной связи для улучшения эффективности рекомендаций на
основе коллаборативной фильтрации.
• ALFM-P [167]: Aspect-based Latent Factor Model (ALFM) использует матрицу
свойств элементов из частоты слов для интеграции оценок и текстов отзывов
с помощью латентной факторной модели.
• REAO [172]: Recommender system Exploiting Opinion mining (REAO), которая
состоит из двух основных частей: aspect-based opinion mining (ABOM),
которая использует глубокую модель СНС для извлечения аспектов с

315
помощью техники LDA для преобразования извлеченных терминов аспектов
в латентные факторы. Вторая - прогнозирование рейтингов, которое
вычисляет рейтинги на основе аспектов, формируя набор матриц рейтингов,
соответствующих определенному аспекту.
5.5.3. Анализ и обсуждение результатов
Таблица 5.2 показывает анализ производительности нашей модели в
сравнении с различными базовыми моделями. Мы приводим средние
квадратичные ошибки для каждого выбранного домена набора данных на основе
опубликованных авторами результатов; мы выделили лучшие показатели жирным
шрифтом; в случае отсутствия результатов, относящихся к соответствующему
домену, ячейка была заполнена прочерком. Очевидно, что SmartTips превосходит
все базовые модели, за исключением области видеоигр, где модель ALFM-P
показывает немного лучшие результаты, в то время как наша модель достигла MSE
0,515, а ALFM-P - MSE 0,505. Среднее значение достигнутых результатов MSE
является достаточным для обоснования нашего анализа. Мы можем заметить, что
модели MF и SVD++ обеспечивают умеренную производительность по сравнению
с моделями ALFM-P и REAO, которые действуют лучше.
С другой стороны, предложенная модель гарантирует генерацию
рекомендаций, даже если у пользователя нет исторических данных "Новый
пользователь", известная как проблема холодного старта; поскольку наша модель
рассматривает текст отзыва, который имеет достаточно информации для фиксации
предпочтений пользователя. Как правило, в худшем случае, когда пользователь
предоставляет короткий отзыв, включающий небольшое количество аспектных
терминов, или когда отзыв не содержит аспектов, наша модель будет
рекомендовать продукты с высоким рейтингом на основе отзывов других
пользователей, независимо от текущих предпочтений пользователя, используя
фактор общей оценки.

316 Таблица 5.2. Результаты сравнения предложенной модели SmartTips по
предсказаниям рейтинга с базовыми моделями
Набор данных MF SVD++ ALFM-P REAO SmartTips
Автомобили 1.715 1.439 0.565 0.663 0.473 Телефоны и аксессуары 2.323 2.112 0.364 - 0.330 Электроника 1.968 1.661 0.396 - 0.313 Фильмы и телевидение 0.627 0.544 0.412 - 0.393 Видеоигры 1.837 1.495 0.505 1.055 0.515 Сред. 1.694 1.450 0.448 0.859 0.405
5.6. Выводы
Мнения клиентов в Интернете представляют собой значительный ресурс, из
которого как клиенты, так и предприятия извлекают много информации,
помогающей им принять правильное решение. Поиск релевантных данных при
поиске в интернете представляет собой большую проблему для пользователей сети,
известную как "проблема информационной перегрузки". Рекомендательные
системы были признаны перспективным способом решения таких проблем.
В этой главе предлагается система рекомендаций товаров "SmartTips",
построенная на анализе тональности относительно аспектов. Предлагаемая модель
использует отзывы потребителей и применяет модель "Извлечение Аспектных
Терминов" для оценки различных продуктов. Учитывались несколько факторов,
включая голоса читателей, частоту терминов аспекта, частоту слов мнения и т.д.
Мы также изучили текст отзыва и мета-данные.
С другой стороны, аналогичный сценарий был предложен для учета
предпочтений пользователя с целью создания рекомендации для конкретного
пользователя. Чувства пользователя по отношению к определенным аспектам
используются для взвешивания аспектов в продуктах-кандидатах, чтобы отразить

317 значимость каждого из них и соответствующим образом соотнести с
предпочтениями пользователя.
Мы провели обширные эксперименты, чтобы убедиться в пригодности наших
моделей для реализации и проверить их эффективность, и результаты показали, что
все предложенные модели работают хорошо. Чтобы убедиться в ее эффективности,
мы протестировали нашу модель на наборе данных Amazon, который широко
используется исследователями, и сравнили ее с базовыми методами, и результаты
показали, что наша модель превосходит их по среднему квадрату ошибок
генерируемых прогнозов.

318
6. Заключение
Основной целью данной работы является разработка более надежных
доменно-специфических методов анализа текста для больших данных с учетом
основных характеристик больших данных, влияющих на производительность
традиционных методов. Далее представлены основные выводы и наиболее
значимые результаты исследовательской работы, в которых рассматривается
производительность разработанных методик с программной реализацией на
реальных наборах данных. Значимость вклада подтверждается результатами
алгоритмической реализации, а именно:
• Подготовлен обширный литературный обзор существующих методов
предварительной обработки текстов на естественном языке с целью
изучения их влияния на выполнение анализа тональности относительно
аспектов.
Изучались стандартные задачи, используемые при подготовке текстов на
естественном языке, включая токенизацию, сегментацию, удаление стоп-
слов, лемматизацию, стемминг и тегирование части речи, с учетом их
влияния на исходные данные и области применения.
• Разработан и внедрен алгоритм предварительной обработки текстовых
данных.
Различные методы были рассмотрены для выбора наиболее подходящего
для применения задачи АТОА. Для построения конвейера предварительной
обработки ОЕЯ было реализовано несколько комбинаций для исследования
взаимного влияния на их производительность, предложена наиболее
эффективная сериализация задач предварительной обработки. Также были

319
внедрены многоуровневые и рекуррентные подходы к очистке и
фильтрации данных для сохранения контекста исходных данных.
• Представлен алгоритм извлечения аспектных терминов, основанный на
методах машинного и глубокого обучения.
Предлагаемый подход, основанный на данных, направлен на извлечение
значимых аспектов-терминов из текста отзывов покупателей. Для
преобразования подготовленных данных в векторы была применена
техника вложения слов, использующая нейросетевую модель. Для
уменьшения размерности сгенерированных векторов была использована
модель SOM. С другой стороны, алгоритм кластеризации K-means++ был
применен для извлечения наиболее заметных аспектов. Предложенный
алгоритм способен извлекать сингулярные термины аспектов и фразы
аспектов.
• Введен алгоритм идентификации пола клиента путем изучения его имени
пользователя.
В данной работе используется подход, основанный на словаре, который
направлен на распознавание пола пользователя по корпусу имен.
Предложенная модель динамической обрезки n-грамм использует
динамический поиск с помощью техники нечеткого сопоставления для
поиска имен, имеющих одинаковый морфологический стержень. Процесс
подготовки данных включает в себя несколько задач для обработки общего
поведения синтеза имен пользователей, например, использование языка
Leet, аббревиатур и смежных имен.
• Представлен алгоритм для рекомендации товаров в Интернете, основанный
на анализе тональности относительно аспектов.

320
Предложенная модель изучает предпочтения покупателей и выдает список
рекомендуемых товаров. Основываясь на данных исторических обзоров,
разработанная схема обеспечивает анализ тональности статистики заданных
критериев. Для ранжирования рекомендуемых товаров была введена схема
взвешивания.
Учитывая вышесказанное, все предложенные алгоритмы были
протестированы и их применимость проверена путем реализации
экспериментальной среды.
Результаты, полученные при реализации разработанных алгоритмов, имеют
практическое значение и могут быть использованы в различных задачах анализа
текстов на естественном языке, в частности, в социальных медиа и электронном
маркетинге.
Предложенные методы имеют хорошие перспективы для дальнейшего
развития, включая адаптацию алгоритма ГИ для работы с другими языками,
например, арабским. Кроме того, может оказаться полезной интеграция
дополнительных элементов, помимо имени пользователя, например, авторского
текста. С другой стороны, обработка текстовых сокращений, например,
используемых в чатах и текстовых сообщениях, в процессе предварительной
обработки данных представляет собой еще одну перспективу. Более того,
включение предложенной модели рекомендаций в систему рекомендаций на
основе разговорного общения представляет собой многообещающую перспективу
для развития.

321
7. Словарь терминов
BERT : Двунаправленные кодирующие представления из трансформаторов
CBOW : Непрерывный мешок слов
GloVe : Глобальные векторы для представления слов
HDFS : Распределенная файловая система Hadoop
IoT : Интернет вещей
MFE : Вложение нескольких функций
NLTK : Инструментарий естественного языка
PCA : Анализ главных компонент
SOM : Самоорганизующиеся карты
SVD : Сингулярное разложение значений
TF-IDF : Частота термина - Обратная частота документа
t-SNE : t-распределенное стохастическое вложение соседей
АБД : Аналитика Больших Данных
АТ : Анализ Тональности
АТОА : Анализ Тональности Относительно Аспектов
БД : Большие Данные
БР : Бизнес Разведка
ГИ : Гендерная Идентификация
ГО : Глубокое Обучение
ДДКП : Двунаправленная Долговременная Кратковременная Память
ДКП : Долгая Краткосрочная Память
ИАТ : Извлечение Аспектных Терминов
ИП : Информационный Поиск
КФ : Коллаборативная Фильтрация
МО : Машинное Обучение

322 МФ : Матричная Факторизация
ОЕЯ : Обработка Естественного Языка
РНС : Рекуррентные Нейронные Сети
РРС : Разговорные Рекомендательные Системы
РС : Рекомендательные Системы
СНС : Сверточные Нейронные Сети
УСП : Условном Случайном Поле
ЧР : Части Речи

323
8. Список таблиц
Таблица 1.1. Наиболее популярные приложения аналитики больших данных ... 192
Таблица 2.1. Пример тегов части речи и их значение ............................................. 211
Таблица 2.2. Основные характеристики собранных наборов данных ................... 232
Таблица 2.3. Влияние разделения отзывов на процесс токенизации предложений
....................................................................................................................................... 235
Таблица 2.4. Основные лингвистические характеристики наборов данных ........ 235
Таблица 2.5. Образец неправильно написанных слов и соответствующая
правильная форма с иллюстрацией типа и количества необходимых правок ..... 237
Таблица 2.6. Образец неправильно написанных слов и результирующие части
после сегментации ....................................................................................................... 237
Таблица 2.7. Процентное соотношение неправильно написанных словарей к
общему количеству словарей в каждом наборе данных и коэффициент коррекции
....................................................................................................................................... 238
Таблица 2.8. Иллюстративный пример того, как каждый случай маркировки ЧР
оценивается с точки зрения существительных и прилагательных ........................ 239
Таблица 3.1. Основные характеристики наборов данных SemEval-14.................. 260
Таблица 3.2. Результаты применения различных Извлечение Аспектных Терминов
моделей на наборе данных SemEval-14, используя значение K, равное 150 для
набора данных ноутбуков и 200 для набора данных ресторанов ........................... 269
Таблица 3.3. Сравнение результатов F-score базовых методов для SemEval-14 .. 270
Таблица 4.1. Наиболее распространенные буквы, имеющие числовые замены .. 280
Таблица 4.2. Характеристики выбранных наборов данных ................................... 288
Таблица 4.3. Образец имен пользователей и полученный список имен после
сегментации ................................................................................................................. 289

324 Таблица 4.4. Пример имен пользователей с числовой заменой и эквивалентные
правильные имена ....................................................................................................... 290
Таблица 4.5. Матрица путаницы предложенного метода гендерной классификации
на наборе данных в процентах ................................................................................... 292
Таблица 5.1. Краткое описание выбранного набора данных .................................. 313
Таблица 5.2. Результаты сравнения предложенной модели SmartTips по
предсказаниям рейтинга с базовыми моделями ....................................................... 316

325
9. Список рисунков
Рисунок 1.1. Характеристики больших данных ....................................................... 183
Рисунок 1.2. Критерии оценки для построения решения для работы с большими
данными ........................................................................................................................ 191
Рисунок 1.3. Подзадачи Анализ тональности в отношении аспектов ................... 199
Рисунок 2.1. Иерархия наиболее популярных методов токенизации .................... 205
Рисунок 2.2. Иллюстративный пример двух лексических записей для отдельных
лемм, которые имеют одинаковое написание, но разную часть речи и информацию
о глоссах ....................................................................................................................... 208
Рисунок 2.3. Пример тегирования части речи .......................................................... 210
Рисунок 2.4. Рабочий процесс обработки текста ..................................................... 220
Рисунок 2.5. Рабочий процесс обнаружения и исправления опечаток.................. 227
Рисунок 2.6. Образец исходных данных обзора ...................................................... 233
Рисунок 2.7. Пропорция размера данных после применения последовательных
шагов подготовки данных .......................................................................................... 236
Рисунок 2.8. F-score производительности результатов тегирования ЧР с различным
порядком шагов предварительной обработки для тегов существительных ......... 240
Рисунок 2.9. F-score производительности результатов тегирования ЧР с различным
порядком шагов предварительной обработки для тегов прилагательных ............ 240
Рисунок 3.1. Классификация методов извлечения аспектных терминов .............. 245
Рисунок 3.2. Экспериментальная схема предложенной модели извлечения
аспектных терминов .................................................................................................... 258
Рисунок 3.3. Образец пробного набора данных ноутбука показывает
аннотированное предложение с использованием XML-тегов ................................ 260
Рисунок 3.4. Влияние значения K на результаты эксперимента в процентах
точности ....................................................................................................................... 267

326 Рисунок 3.5. Сравнение полученных результатов от применения предложенных
вариантов моделей на различных наборах данных, где K = 150 ............................ 268
Рисунок 3.6. Сравнение различных комбинаций моделей с точки зрения
результатов F-score ...................................................................................................... 269
Рисунок 3.7. Сравнение F-score между базовыми методами и нашей моделью для
набора данных SemEval-14 ......................................................................................... 270
Рисунок 4.1. Иллюстрация использования модели N-грамм для синтеза шаблонов
поиска ........................................................................................................................... 281
Рисунок 4.2. Пример вычисления расстояния редактирования между строкой1 и
строкой2 с помощью матрицы ................................................................................... 283
Рисунок 4.3. Экспериментальная структура модели гендерной идентификации 285
Рисунок 4.4. Гендерное распределение для каждого набора данных в процентах
....................................................................................................................................... 291
Рисунок 4.5. Точность классификации нашей модели в процентах ...................... 293
Рисунок 5.1. Основная архитектура рекомендательной системы .......................... 299
Рисунок 5.2. Методы создания рекомендательных систем .................................... 301
Рисунок 5.3. Общая схема предлагаемой рекомендательной системы ................. 308

327
10. Благодарности
Прежде всего, хвала и благодарность АЛЛАХУ, Всемогущему, за Его
благословения на протяжении всей моей научной работы для успешного
завершения исследования.
В начале я хотел бы выразить благодарность моему консультанту, профессору
Новикову Борису Асеновичу, за постоянную помощь в работе над моей
кандидатской диссертацией и сопутствующими исследованиями, за его
преданность, вдохновение и огромный опыт. Его поддержка помогла мне написать
эту диссертацию в ходе моих исследований. Также я хотел бы поблагодарить
своего советника, профессора Косовскую Татьяну Матвеевну, заведующую
кафедрой Информатики, за ее помощь, советы, проницательные комментарии и
поддержку.
Я также хотел бы выразить искреннюю благодарность моим бывшим
руководителям, профессору Хешаму А. Хефни и доценту Ахмеду М. Гадаллаху, на
кафедре Компьютерных Наук Каирского Университета, за то, что они познакомили
меня с распознаванием образов и веб-майндингом для глубокого понимания
соответствующих исследовательских задач.
Данное исследование было бы невозможно без поддержки и гранта [EGY-
6428/17] как от Главного управления по делам миссий - Министерства высшего
образования Египта, так и от Российского правительства.
Я благодарен Санкт-Петербургскому государственному университету за
гостеприимство во время пребывания на Кафедре Информатики, где была написана
эта работа. Я хотел бы поблагодарить всех сотрудников за их любезную помощь и
за обучение на многочисленных теоретических курсах для повышения моей
квалификации.

328
Я хотел бы выразить глубокую благодарность всем сотрудникам факультета
Информационных Технологий и Систем Университета Порт-Саида, Египет, за их
любезную поддержку.
Последнее, но не менее важное, я хотел бы поблагодарить свою семью за
духовную поддержку на протяжении всего времени написания этой диссертации и
моей жизни в целом.

329
11. Список литературы
1. Ali N. M., Novikov B. A. Big Data: Analytical Solutions, Research Challengesand Trends // Proceedings of the Institute for System Programming of the RussianAcademy of Sciences. ‒ 2020. ‒ Vol. 32, No. 1. ‒ P. 181-204. ‒ DOI:10.15514/ISPRAS-2020-32(1)-10.
2. Ali N. M. Aspect-Oriented Analytics of Big Data // The 14th International BalticConference on Databases and Information Systems (Baltic DB&IS 2020) / Ed.Matulevičius R. et al. ‒ Vol. 2620: CEUR Workshop Proceedings ‒ Tallinn,Estonia: CEUR-WS.org, 2020. ‒ P. 41-48.
3. Ali N. M., Gadallah A. M., Hefny H. A., Novikov B. An Integrated Frameworkfor Web Data Preprocessing Towards Modeling User Behavior // 2020International Multi-Conference on Industrial Engineering and ModernTechnologies (FarEastCon) ‒ Vladivostok, Russia: IEEE, 2020. ‒ P. 1-8. ‒ DOI:10.1109/FarEastCon50210.2020.9271467.
4. Ali N. M., Novikov B. A Multi-Source Big Data Framework for Capturing andAnalyzing Customer Feedback // 2021 IEEE Conference of Russian YoungResearchers in Electrical and Electronic Engineering (ElConRus) / Ed.Shaposhnikov S. ‒ Moscow and St. Petersburg, Russia: IEEE, 2021. ‒ P. 185-190.‒ DOI: 10.1109/ElConRus51938.2021.9396606.
5. Ali N. M., Gadallah A. M., Hefny H. A., Novikov B. A. Online Web NavigationAssistant // Vestnik Udmurtskogo Universiteta. Matematika. Mekhanika.Komp'yuternye Nauki. ‒ 2021. ‒ Vol. 31, No. 1. ‒ P. 116-131. ‒ DOI:10.35634/vm210109.
6. Ghani N. A., Hamid S., Hashem I. A. T., Ahmed E. Social Media Big DataAnalytics: A Survey // Computers in Human Behavior. ‒ 2019. ‒ Vol. 101. ‒ P.417-428. ‒ DOI: 10.1016/j.chb.2018.08.039.
7. Emani C. K., Cullot N., Nicolle C. Understandable Big Data: A survey //Computer Science Review. ‒ 2015. ‒ Vol. 17. ‒ P. 70-81. ‒ DOI:10.1016/j.cosrev.2015.05.002.
8. Stieglitz S., Mirbabaie M., Ross B., Neuberger C. Social Media Analytics –Challenges in Topic Discovery, Data Collection, and Data Preparation //International Journal of Information Management. ‒ 2018. ‒ Vol. 39. ‒ P. 156-168.

330 9. Tsai C. W., Lai C. F., Chao H. C., Vasilakos A. V. Big Data Analytics: A Survey
// Journal of Big Data. ‒ 2015. ‒ Vol. 2, No. 21. ‒ P. 1-32. ‒ DOI: 10.1186/s40537-015-0030-3.
10. Yadav K., Rautaray S. S., Pandey M. A Prototype for Sentiment Analysis Using Big Data Tools // Book A Prototype for Sentiment Analysis Using Big Data Tools / Editor. ‒ Singapore: Springer, 2017. ‒ P. 103–117. ‒ DOI: 10.1007/978-981-10-6427-2_9.
11. Eckroth J. A Course on Big Data Analytics // Journal of Parallel and Distributed Computing. ‒ 2018. ‒ Vol. 118, No. 1. ‒ P. 166-176. ‒ DOI: 10.1016/j.jpdc.2018.02.019.
12. Smirnova E., Ivanescu A., Bai J., Crainiceanu C. M. A Practical Guide to Big Data // Statistics & Probability Letters. ‒ 2018. ‒ Vol. 136. ‒ P. 25-29. ‒ DOI: 10.1016/j.spl.2018.02.014.
13. Siddiqa A., TargioHashem I. A., Yaqoob I., Marjani M., Shamshirband S., Gani A., Nasaruddin F. A Survey of Big Data Management: Taxonomy and State-of-the-Art // Journal of Network and Computer Applications. ‒ 2016. ‒ Vol. 71. ‒ P. 151-166. ‒ DOI: 10.1016/j.jnca.2016.04.008.
14. Soufi A. M., El-Aziz A. A. A., Hefny H. A. A Survey on Big Data and Knowledge Acquisition Techniques // IPASJ International Journal of Computer Science (IIJCS). ‒ 2018. ‒ Vol. 06, No. 07. ‒ P. 15–29.
15. Halevi G., Moed H. F. The Evolution of Big Data as a Research and Scientific Topic: Overview of the Literature // Research Trends: Special Issue on Big Data. ‒ 2012. No. 30. ‒ P. 3-6.
16. Manyika J., Chui M., Brown B., Bughin J., Dobbs R., Roxburgh C., Byers A. H. Big Data: The Next Frontier for Innovation, Comptetition, and Productivity // McKinsey Global Institute. ‒ 2011.
17. Gartner I. Gartner Glossary : Big Data. ‒ 2019. ‒ URL: https://www.gartner.com/en/information-technology/glossary/big-data (Date Accessed: 14.10.2019).
18. Loshin D. Chapter 1 - Market and Business Drivers for Big Data Analytics // Big Data Analytics / Loshin D. ‒ Boston: Morgan Kaufmann, 2013. ‒ P. 1-9. ‒ DOI: 10.1016/B978-0-12-417319-4.00001-6.
19. Krishnan K. Chapter 1 - Introduction to Big Data // Data Warehousing in the Age of Big Data / Krishnan K. ‒ Boston: Morgan Kaufmann, 2013. ‒ P. 3-14. ‒ DOI: 10.1016/B978-0-12-405891-0.00001-5.

331 20. Ethics of Big Data: Balancing Risk and Innovation. / Davis K., Patterson D. ‒ 1
ed.: O’Reilly Media, Inc., 2012. ‒ Vol. 1.
21. Understanding Big Data: Analytics for Enterprise Class Hadoop and Streaming Data. / Zikopoulos P. C., Eaton C., deRoos D., Deutsch T., Lapis G. ‒ 1st ed.: McGraw-Hill Osborne Media, 2012. ‒ 176 P.
22. Owais S. S., Hussein N. S. Extract Five Categories CPIVW from the 9V’s Characteristics of the Big Data // International Journal of Advanced Computer Science and Applications (IJACSA). ‒ 2016. ‒ Vol. 7, No. 3. ‒ P. 254-258.
23. Laney D. 3D Data Management: Controlling Data Volume, Velocity and Variety // Application Delivery Strategies, META Group Research Note. ‒ 2001.
24. Digital 2019: Internet Trends in Q3 2019 / Hootsuite & We Are Social. ‒: Kepios, 2019. ‒ 06-11.
25. Kemp S. Digital Ttrends 2019: Every Single Stat You Need to know About the Internet. ‒ 2019. ‒ URL: https://thenextweb.com/contributors/2019/01/30/digital-trends-2019-every-single-stat-you-need-to-know-about-the-internet/ (Date Accessed: 06-11.2019).
26. The Digitization of the World: From Edge to Core [White paper]. ‒ Framingham, MA, USA: Corporation I. D., 2018. ‒ 28 p. ‒ US44413318.
27. Hale J. L. More Than 500 Hours of Content Are Now Being Uploaded to YouTube Every Minute. ‒ 2019. ‒ URL: https://www.tubefilter.com/2019/05/07/number-hours-video-uploaded-to-youtube-per-minute/ (Date Accessed: 07-11.2019).
28. The Twitter Engagement Report 2018. ‒: Solutions M., 2018. ‒ 33 p.
29. Wiener J., Bronson N. Facebook’s Top Open Data Problems. ‒ 2014. ‒ URL: https://research.fb.com/blog/2014/10/facebook-s-top-open-data-problems/ (Date Accessed: 07-11.2019).
30. Torrecilla J. L., Romob J. Data Learning From Big Data // Statistics and Probability Letters. ‒ 2018. ‒ Vol. 136. ‒ P. 15-19. ‒ DOI: 10.1016/j.spl.2018.02.038.
31. Osman A. M. S. A Novel Big Data Analytics Framework for Smart Cities // Future Generation Computer Systems. ‒ 2019. ‒ Vol. 91. ‒ P. 620-633. ‒ DOI: 10.1016/j.future.2018.06.046.
32. Gandomi A., Haider M. Beyond the Hype: Big Data Concepts, Methods, and Analytics // International Journal of Information Management. ‒ 2015. ‒ Vol. 35, No. 2. ‒ P. 137-144. ‒ DOI: 10.1016/j.ijinfomgt.2014.10.007.
332 33. Russom P. Big Data Analytics // TDWI Best Practices Report, Fourth Quarter. ‒
2011.
34. Jha A., Dave M., Madan S. A Review on the Study and Analysis of Big Data Using Data Mining Techniques // International Journal of Latest Trends in Engineering and Technology (IJLTET). ‒ 2016. ‒ Vol. 6, No. 3. ‒ P. 94-102.
35. Elgendy N., Elragal A. Big Data Analytics: A Literature Review Paper. ‒ Vol. 8557: Advances in Data Mining. Applications and Theoretical Aspects ‒ Cham: Springer International Publishing, 2014. ‒ P. 214-227.
36. Principles of Big Data: Preparing, Sharing, and Analyzing Complex Information. / Berman J. J.: Elsevier, 2013. ‒ 288 P.
37. Analytics of Textual Big Data: Text Exploration of the Big Untapped Data Source / Independent Business Intelligence Analyst R20: Consultancy. ‒: InterSystems, 2013. ‒ 9 p.
38. Shim J. P., French A. M., Guo C., Jablonski J. Big Data and Analytics: Issues, Solutions, and ROI // Communications of the Association for Information Systems (CAIS). ‒ 2015. ‒ Vol. 37. ‒ P. 797-810. ‒ DOI: 10.17705/1CAIS.03739.
39. Malaka I., Brown I. Challenges to the Organisational Adoption of Big Data Analytics: A Case Study in the South African Telecommunications Industry // Book Challenges to the Organisational Adoption of Big Data Analytics: A Case Study in the South African Telecommunications Industry / Editor. ‒ Stellenbosch, South Africa: ACM, 2015. ‒ P. 1-9. ‒ DOI: 10.1145/2815782.2815793.
40. Analytics: The New Path to Value [Research Report, Fall 2010] / MIT Sloan Management Review and the IBM Institute for Business Value. ‒ North Hollywood, CA: Technology M. I. o., 2010. ‒ 25 p.
41. Fahmideh M., Beydoun G. Big Data Analytics Architecture Design—An Application in Manufacturing Systems // Computers & Industrial Engineering. ‒ 2019. ‒ Vol. 128. ‒ P. 948-963. ‒ DOI: 10.1016/j.cie.2018.08.004.
42. Lopes C., Cabral B., Bernardino J. Personalization Using Big Data Analytics Platforms // Proceedings of the Ninth International C* Conference on Computer Science & Software Engineering (C3S2E '16) / Ed. Desai E. ‒ Porto, Portugal: ACM, 2016. ‒ P. 131-132. ‒ DOI: 10.1145/2948992.2949000.
43. White C., Research B. Using Big Data for Smarter Decision Making // BI Research, IBM Big Data & Analytics Hub. ‒ 2011.
44. Samosir R. S., Hendric H. L., Gaol F. L., Abdurachman E., Soewito B. Measurement Metric Proposed For Big Data Analytics System // Proceedings of
333
the 2017 International Conference on Computer Science and Artificial Intelligence (CSAI 2017) ‒ Jakarta, Indonesia: ACM, New York, NY, USA, 2017.
45. Loshin D. Chapter 2 - Business Problems Suited to Big Data Analytics // Big Data Analytics / Loshin D. ‒ Boston: Morgan Kaufmann, 2013. ‒ P. 11-19. ‒ DOI: 10.1016/B978-0-12-417319-4.00001-6.
46. Romary L. Data Management in the Humanities // ERCIM News - Special Theme: Big Data. ‒ 2012. ‒ Vol. 2012, No. 89. ‒ P. 14.
47. Amado A., Cortez P., Rita P., Moro S. Research Trends on Big Data in Marketing: A text Mining and Topic Modeling Based literature Analysis // European Research on Management and Business Economics. ‒ 2018. ‒ Vol. 24, No. 1. ‒ P. 1-7. ‒ DOI: 10.1016/j.iedeen.2017.06.002.
48. Saidali J., Rahich H., Tabaa Y., Medouri A. The Combination Between Big Data and Marketing Strategies to Gain Valuable Business Insights for Better Production Success // Procedia Manufacturing. ‒ 2019. ‒ Vol. 32. ‒ P. 1017-1023. ‒ DOI: 10.1016/j.promfg.2019.02.316.
49. Akter S., Wamba S. F. Big Data Analytics in E-Commerce: A Systematic Review and Agenda for Future Research // Electronic Markets. ‒ 2016. ‒ Vol. 26, No. 2. ‒ P. 173-194. ‒ DOI: 10.1007/s12525-016-0219-0.
50. Chong A. Y. L., Li B., Ngai E. W. T., Ch'ng E., Lee F. Predicting Online Product Sales Via Online Reviews, Sentiments, and Promotion Strategies: A Big Data Architecture and Neural Network Approach // International Journal of Operations & Production Management. ‒ 2016. ‒ Vol. 36, No. 4. ‒ P. 358-383. ‒ DOI: 10.1108/IJOPM-03-2015-0151.
51. Erevelles S., Fukawa N., Swayne L. Big Data Consumer Analytics and the Transformation of Marketing // Journal of Business Research. ‒ 2016. ‒ Vol. 69, No. 2. ‒ P. 897-904. ‒ DOI: 10.1016/j.jbusres.2015.07.001.
52. Jabbar A., Akhtar P., Dani S. Real-time Big Data Processing for Instantaneous Marketing Decisions: A Problematization Approach // Industrial Marketing Management. ‒ 2020. ‒ Vol. 90. ‒ P. 558-569. ‒ DOI: 10.1016/j.indmarman.2019.09.001.
53. Li T. Using Big Data Analytics to Build Prosperity Index of Transportation Market // Proceedings of the 4th ACM SIGSPATIAL International Workshop on Safety and Resilience (Safety and Resilience'18) ‒ Seattle, WA, USA: ACM New York, NY, USA, 2018. ‒ P. 6.
54. See-To E. W. K., Ngai E. W. T. Customer Reviews for Demand Distribution and Sales Nowcasting: A Big Data Approach // Annals of Operations Research. ‒ 2018. ‒ Vol. 270, No. 1-2. ‒ P. 415–431. ‒ DOI: 10.1007/s10479-016-2296-z.

334 55. Kumar A., Shankar R., Aljohani N. R. A Big Data Driven Framework for
Demand-driven Forecasting with Effects of Marketing-mix Variables // Industrial Marketing Management. ‒ 2020. ‒ Vol. 90. ‒ P. 493-507. ‒ DOI: 10.1016/j.indmarman.2019.05.003.
56. Zheng K., Zhang Z., Song B. E-Commerce Logistics Distribution Mode in Big-Data Context: A Case Analysis of JD.COM // Industrial Marketing Management. ‒ 2020. ‒ Vol. 86. ‒ P. 154-162. ‒ DOI: 10.1016/j.indmarman.2019.10.009.
57. Salehan M., Kim D. J. Predicting the Performance of Online Consumer Reviews: A Sentiment Mining Approach to Big Data Analytics // Decision Support Systems. ‒ 2016. ‒ Vol. 81. ‒ P. 30–40. ‒ DOI: 10.1016/j.dss.2015.10.006.
58. Malhotra D., Rishi O. An Intelligent Approach to Design of E-Commerce Metasearch and Ranking System Using Next-Generation Big Data Analytics // Journal of King Saud University - Computer and Information Sciences. ‒ 2021. ‒ Vol. 33, No. 2. ‒ P. 183-194. ‒ DOI: 10.1016/j.jksuci.2018.02.015.
59. Wu P.-J., Lin K.-C. Unstructured Big Data Analytics for Retrieving E-Commerce Logistics Knowledge // Telematics and Informatics. ‒ 2018. ‒ Vol. 35, No. 1. ‒ P. 237-244. ‒ DOI: 10.1016/j.tele.2017.11.004.
60. Zhaoa Y., Xu X., Wang M. Predicting Overall Customer Satisfaction: Big Data Evidence From Hotel Online Textual Reviews // International Journal of Hospitality Management. ‒ 2019. ‒ Vol. 76. ‒ P. 111-121.
61. Liu X., Shin H., Burns A. C. Examining the Impact of Luxury Brand's Social Media Marketing on Customer Engagement: Using Big Data Analytics and Natural Language Processing // Journal of Business Research. ‒ 2019. ‒ DOI: 10.1016/j.jbusres.2019.04.042.
62. Kauffmann E., Peral J., Gil D., Ferrández A., Sellers R., Mora H. A Framework for Big Data Analytics in Commercial Social Networks: A Case Study on Sentiment Analysis and Fake Review Detection for Marketing Decision-making // Industrial Marketing Management. ‒ 2019. ‒ DOI: 10.1016/j.indmarman.2019.08.003.
63. Taylor E. M., O. C. R., Velásquez J. D., Ghosh G., Banerjee S. Web Opinion Mining and Sentimental Analysis // Advanced Techniques in Web Intelligence-2: Web User Browsing Behaviour and Preference Analysis / Velásquez J. D. et al. ‒ Berlin, Heidelberg: Springer, 2013. ‒ P. 105-126. ‒ DOI: 10.1007/978-3-642-33326-2_5.
64. Ramanujam R. S., Nancyamala R., Nivedha J., Kokila J. Sentiment Analysis Using Big Data // Book Sentiment Analysis Using Big Data / Editor. ‒ Chennai, India: IEEE, 2015. ‒ P. 480–484. ‒ DOI: 10.1109/ICCPEIC.2015.7259528.

335 65. Mabrouk A., Redondo R. P. D., Kayed M. Deep Learning-Based Sentiment
Classification: A Comparative Survey // IEEE Access. ‒ 2020. ‒ Vol. 8. ‒ P. 85616-85638. ‒ DOI: 10.1109/ACCESS.2020.2992013.
66. Ma Y., Peng H., Cambria E. Targeted Aspect-Based Sentiment Analysis via Embedding Commonsense Knowledge into an Attentive LSTM // Book Targeted Aspect-Based Sentiment Analysis via Embedding Commonsense Knowledge into an Attentive LSTM / Editor. ‒ New Orleans, Louisiana, USA.: Association for the Advancement of Artificial Intelligence, 2018. ‒ P. 5876-5883.
67. Liu N., Shen B., Zhang Z., Zhang Z., Mi K. Attention‑based Sentiment Reasoner for Aspect‑based Sentiment Analysis // Human-centric Computing and Information Sciences. ‒ 2019. ‒ Vol. 9, No. 35. ‒ P. 17. ‒ DOI: 10.1186/s13673-019-0196-3.
68. Sun C., Huang L., Qiu X. Utilizing BERT for Aspect-Based Sentiment Analysis via Constructing Auxiliary Sentence // 2019 Annual Conference of the North American Chapter of the Association for Computational Linguistics: Human Language Technologies (NAACL-HLT) / Ed. Burstein J. et al. ‒ Vol. 1 ‒ Minneapolis, MN, USA: Association for Computational Linguistics, 2019. ‒ P. 380–385.
69. Bandari S., Bulusu V. V. Survey on Ontology-Based Sentiment Analysis of Customer Reviews for Products and Services // Data Engineering and Communication Technology: Proceedings of 3rd ICDECT-2K19. ‒ Singapore: Springer, 2020. ‒ P. 91-101. ‒ DOI: 10.1007/978-981-15-1097-7_8.
70. Wu S., Xu Y., Wu F., Yuan Z., Huang Y., Li X. Aspect-based Sentiment Analysis Via Fusing Multiple Sources of Textual Knowledge // Knowledge-Based Systems. ‒ 2019. ‒ Vol. 183. ‒ P. 104868. ‒ DOI: 10.1016/j.knosys.2019.104868.
71. Xu Q., Zhu L., Dai T., Yan C. Aspect-based Sentiment Classification With Multi-attention Network // Neurocomputing. ‒ 2020. ‒ Vol. 388. ‒ P. 135-143. ‒ DOI: 10.1016/j.neucom.2020.01.024.
72. Yang C., Zhang H., Jiang B., Li K. Aspect-based Sentiment Analysis With Alternating Coattention Networks // Information Processing & Management. ‒ 2019. ‒ Vol. 56, No. 3. ‒ P. 463-478. ‒ DOI: 10.1016/j.ipm.2018.12.004.
73. Natural Language Processing with Python. / Bird S., Klein E., Loper E. ‒ 1st ed.: O'Reilly Media, Inc., 2009.
74. Introduction to Information Retrieval. / Manning C. D., Raghavan P., Schütze H.: Cambridge University Press, 2008.

336 75. Sun S., Luo C., Chen J. A Review of Natural Language Processing Techniques
for Opinion Mining Systems // Information Fusion. ‒ 2017. ‒ Vol. 36. ‒ P. 10-25. ‒ DOI: 10.1016/j.inffus.2016.10.004.
76. Foundations of Statistical Natural Language Processing. / Manning C. D., Schütze H. ‒ Cambridge, MA: MIT Press, 1999.
77. Venkataraman A. Word Segmentation for Classification of Text: 19059 / Hultåker A.; Uppsala University, 2019. ‒ 50 p.
78. Norvig P. Natural Language Corpus Data // Beautiful Data: The Stories Behind Elegant Data Solutions / Segaran T., Hammerbacher J.O'Reilly Media, Inc., 2009. ‒ P. 219-242.
79. Building a Large Annotated Corpus of English: The Penn Treebank / University of Pennsylvania: School of Engineering and Applied Science: Science D. o. C. a. I. ‒ Philadelphia, PA: ScholarlyCommons, 1993. ‒ 25 p.
80. Pennsylvania U. o. Penn Treebank P.O.S. Tags. ‒ URL: https://www.ling.upenn.edu/courses/Fall_2003/ling001/penn_treebank_pos.html (Date Accessed: 30-09.2021).
81. Kumawat D., Jain V. POS Tagging Approaches: A Comparison // International Journal of Computer Applications (IJCA). ‒ 2015. ‒ Vol. 118, No. 6. ‒ P. 32-38. ‒ DOI: 10.5120/20752-3148.
82. Dean J., Ghemawat S. MapReduce: Simplified Data Processing on Large Clusters // Communications of the ACM - 50th Anniversary Issue: 1958 - 2008. ‒ 2008. ‒ Vol. 51, No. 1. ‒ P. 107-113. ‒ DOI: 10.1145/1327452.1327492.
83. Azevedo D. N. R., Oliveira J. M. P. d. Application of Data Mining Techniques to Storage Management and Online Distribution of Satellite Images // Innovative Applications in Data Mining / Nedjah N. et al. ‒ Berlin, Heidelberg: Springer, 2009. ‒ P. 1-15. ‒ DOI: 10.1007/978-3-540-88045-5_1.
84. Agrawal D., Abbadi A. E., Antony S., Das S. Data Management Challenges in Cloud Computing Infrastructures: Databases in Networked Information Systems ‒ Berlin, Heidelberg: Springer, 2010. ‒ P. 1-10.
85. Buza K., Nagy G. I., Nanopoulos A. Storage-Optimizing Clustering Algorithms for High-Dimensional Tick Data // Expert Systems with Applications. ‒ 2014. ‒ Vol. 41, No. 9. ‒ P. 4148-4157. ‒ DOI: 10.1016/j.eswa.2013.12.046.
86. Mateus R. C., Siqueira T. L. L., Times V. C., Ciferri R. R., Ciferri C. D. d. A. Spatial Data Warehouses and Spatial OLAP Come Towards the Cloud: Design and Performance // Distributed and Parallel Databases. ‒ 2016. ‒ Vol. 34, No. 3. ‒ P. 425–461.

337 87. Data Integration Déjà Vu: Big Data Reinvigorates DI - [White Paper] / SAS
Institute Inc. ‒ USA: SAS, 2018. ‒ 14 p. ‒ 107865_G71578.0318.
88. Reeve A. Chapter 21 - Big Data Integration // Managing Data in Motion / Reeve A. ‒ Boston: Morgan Kaufmann, 2013. ‒ P. 141-156. ‒ DOI: 10.1016/B978-0-12-397167-8.00021-2.
89. FlyData I. The 6 Challenges of Big Data Integration. ‒ 2019. ‒ URL: https://www.flydata.com/the-6-challenges-of-big-data-integration/ (Date Accessed: 18-11.2019).
90. Akusok A., Björk K.-M., Miche Y., Lendasse A. High-Performance Extreme Learning Machines: A Complete Toolbox for Big Data Applications // IEEE Access ‒2015. ‒ Vol. 3. ‒ P. 1011–1025.
91. JI C., LI Y., QIU W., JIN Y., XU Y., AWADA U., LI K., QU W. Big Data Processing: Big Challenges and Opportunities // Journal of Interconnection Networks. ‒ 2012. ‒ Vol. 13, No. 03 & 04. ‒ P. 1250009. ‒ DOI: 10.1142/s0219265912500090.
92. Hadoop: The Definitive Guide. / White T.; Ed. Loukides M., Blanchette M. ‒ 4 ed.: O’Reilly Media, Inc., 2015.
93. Candela L., Castelli D., Pagano P. Managing Big Data through Hybrid Data Infrastructures // ERCIM News - Special Theme: Big Data. ‒ 2012. ‒ Vol. 2012, No. 89. ‒ P. 37-38.
94. Zhang L., Liu B., Lim S. H., O'Brien-Strain E. Extracting and Ranking Product Features in Opinion Documents // Book Extracting and Ranking Product Features in Opinion Documents / Editor. ‒ Beijing, China: ACL, 2010. ‒ P. 1462–1470. ‒ DOI: 10.5555/1944566.1944733.
95. Rana T. A., Cheah Y.-N. Aspect Extraction in Sentiment Analysis: Comparative Analysis and Survey // Artificial Intelligence Review. ‒ 2016. ‒ Vol. 46, No. 4. ‒ P. 459-483. ‒ DOI: 10.1007/s10462-016-9472-z.
96. Dragoni M., Federici M., Rexha A. An Unsupervised Aspect Extraction Strategy for Monitoring Real-Time Reviews Stream // Information Processing & Management. ‒ 2019. ‒ Vol. 56, No. 3. ‒ P. 1103-1118. ‒ DOI: 10.1016/j.ipm.2018.04.010.
97. Tubishat M., Idris N., Abushariah M. A. M. Implicit Aspect Extraction in Sentiment Analysis: Review, Taxonomy, Oppportunities, and Open Challenges // Information Processing & Management. ‒ 2018. ‒ Vol. 54, No. 4. ‒ P. 545-563. ‒ DOI: 10.1016/j.ipm.2018.03.008.

338 98. Ren F., Sohrab M. G. Class-Indexing-Based Term Weighting for Automatic Text
Classification // Information Sciences. ‒ 2013. ‒ Vol. 236. ‒ P. 109-125. ‒ DOI: 10.1016/j.ins.2013.02.029.
99. Akhtar M. S., Gupta D., Ekbal A., Bhattacharyya P. Feature Selection and Ensemble Construction: A two-Step Method for Aspect Based Sentiment Analysis // Knowledge-Based Systems. ‒ 2017. ‒ Vol. 125. ‒ P. 116-135. ‒ DOI: 10.1016/j.knosys.2017.03.020.
100. Al-Smadi M., Al-Ayyoub M., Jararweh Y., Qawasmeh O. Enhancing Aspect-Based Sentiment Analysis of Arabic Hotels’ Reviews Using Morphological, Syntactic and Semantic Features // Information Processing & Management. ‒ 2019. ‒ Vol. 56, No. 2. ‒ P. 308-319. ‒ DOI: 10.1016/j.ipm.2018.01.006.
101. Song M., Park H., Shin K.-s. Attention-Based Long Short-Term Memory Network Using Sentiment Lexicon Embedding for Aspect-Level Sentiment Analysis in Korean // Information Processing & Management. ‒ 2019. ‒ Vol. 56, No. 3. ‒ P. 637-653. ‒ DOI: 10.1016/j.ipm.2018.12.005.
102. Fu Y., Liao J., Li Y., Wang S., Li D., Li X. Multiple Perspective Attention Based on Double BiLSTM for Aspect and Sentiment Pair Extract // Neurocomputing. ‒ 2021. ‒ Vol. 438. ‒ P. 302-311. ‒ DOI: 10.1016/j.neucom.2021.01.079.
103. Zhao H., Liu Z., Yao X., Yang Q. A Machine Learning-Based Sentiment Analysis of Online Product Reviews with A Novel Term Weighting and Feature Selection Approach // Information Processing & Management. ‒ 2021. ‒ Vol. 58, No. 5. ‒ P. 102656. ‒ DOI: 10.1016/j.ipm.2021.102656.
104. Wan C., Peng Y., Xiao K., Liu X., Jiang T., Liu D. An Association-Constrained LDA Model for Joint Extraction of Product Aspects and Opinions // Information Sciences. ‒ 2020. ‒ Vol. 519. ‒ P. 243-259. ‒ DOI: 10.1016/j.ins.2020.01.036.
105. Khan M. T., Durrani M., Khalid S., Aziz F. Lifelong Aspect Extraction from Big Data: Knowledge Engineering // Complex Adaptive Systems Modeling. ‒ 2016. ‒ Vol. 4, No. 1. ‒ P. 15. ‒ DOI: 10.1186/s40294-016-0018-7.
106. Yan Z., Xing M., Zhang D., Ma B. EXPRS: An Extended Pagerank Method for Product Feature Extraction from Online Consumer Reviews // Information & Management. ‒ 2015. ‒ Vol. 52, No. 7. ‒ P. 850-858. ‒ DOI: 10.1016/j.im.2015.02.002.
107. Luo Z., Huang S., Zhu K. Q. Knowledge Empowered Prominent Aspect Extraction from Product Reviews // Information Processing & Management. ‒ 2019. ‒ Vol. 56, No. 3. ‒ P. 408-423. ‒ DOI: 10.1016/j.ipm.2018.11.006.
108. Li S., Zhou L., Li Y. Improving Aspect Extraction by Augmenting A Frequency-Based Method With Web-Based Similarity Measures // Information Processing &

339
Management. ‒ 2015. ‒ Vol. 51, No. 1. ‒ P. 58-67. ‒ DOI: 10.1016/j.ipm.2014.08.005.
109. Wang X., Liu Y., Sun C., Liu M., Wang X. Extended Dependency-Based Word Embeddings for Aspect Extraction // International Conference on Neural Information Processing ICONIP, Neural Information Processing. ‒ Cham: Springer, 2016. ‒ P. 104-111. ‒ DOI: 10.1007/978-3-319-46681-1_13.
110. Xiong S., Ji D. Exploiting Flexible-Constrained K-Means Clustering With Word Embedding for Aspect-Phrase Grouping // Information Sciences. ‒ 2016. ‒ Vol. 367-368. ‒ P. 689-699. ‒ DOI: 10.1016/j.ins.2016.07.002.
111. Xue W., Zhou W., Li T., Wang Q. MTNA: A Neural Multi-task Model for Aspect Category Classification and Aspect Term Extraction On Restaurant Reviews // The The 8th International Joint Conference on Natural Language Processing ‒ Taipei, Taiwan: Asian Federation of Natural Language Processing, 2017. ‒ P. 151–156.
112. Li X., Bing L., Li P., Lam W., Yang Z. Aspect Term Extraction with History Attention and Selective Transformation // The Twenty-Seventh International Joint Conference on Artificial Intelligence, (IJCAI-18) ‒International Joint Conferences on Artificial Intelligence Organization, 2018. ‒ P. 4194-4200. ‒ DOI: 10.24963/ijcai.2018/583.
113. Wu C., Wu F., Wu S., Yuan Z., Huang Y. A Hybrid Unsupervised Method for Aspect Term and Opinion Target Extraction // Knowledge-Based Systems. ‒ 2018. ‒ Vol. 148. ‒ P. 66-73. ‒ DOI: 10.1016/j.knosys.2018.01.019.
114. Xiang Y., He H., Zheng J. Aspect Term Extraction Based on MFE-CRF // Information. ‒ 2018. ‒ Vol. 9, No. 8. ‒ P. 1-15. ‒ DOI: 10.3390/info9080198.
115. Akhtar M. S., Garg T., Ekbal A. Multi-Task Learning for Aspect Term Extraction and Aspect Sentiment Classification // Neurocomputing. ‒ 2020. ‒ Vol. 398. ‒ P. 247-256. ‒ DOI: 10.1016/j.neucom.2020.02.093.
116. Augustyniak Ł., Kajdanowicz T., Kazienko P. Comprehensive Analysis of Aspect Term Extraction Methods using Various Text Embeddings // Computer Speech & Language. ‒ 2021. ‒ Vol. 69. ‒ P. 101217. ‒ DOI: 10.1016/j.csl.2021.101217.
117. Park H.-j., Song M., Shin K.-S. Deep Learning Models and Datasets for Aspect Term Sentiment Classification: Implementing Holistic Recurrent Attention on Target-Dependent Memories // Knowledge-Based Systems. ‒ 2020. ‒ Vol. 187. ‒ P. 104825. ‒ DOI: 10.1016/j.knosys.2019.06.033.
118. Peters M. E., Neumann M., Iyyer M., Gardner M., Clark C., Lee K., Zettlemoyer L. Deep Contextualized Word Representations // Proceedings of the 2018 Conference of the North American Chapter of the Association for Computational

340
Linguistics: Human Language Technologies (NAACL-HLT) ‒ New Orleans, Louisiana: Association for Computational Linguistics, 2018. ‒ P. 2227–2237. ‒ DOI: 10.18653/v1/N18-1202.
119. Akbik A., Blythe D., Vollgraf R. Contextual String Embeddings for Sequence Labeling // Proceedings ofthe 27th International Conference on Computational Linguistics ‒ Santa Fe, New Mexico, USA: Association for Computational Linguistics, 2018. ‒ P. 1638–1649.
120. Kenter T., Jones L., Hewlett D. Byte-Level Machine Reading Across Morphologically Varied Languages // The Thirty-Second AAAI Conference on Artificial Intelligence (AAAI-18) ‒ New Orleans, Louisiana, USA: Association for the Advancement of Artificial Intelligence (AAAI), 2018. ‒ P. 5820 - 5827.
121. Bojanowski P., Grave E., Joulin A., Mikolov T. Enriching Word Vectors with Subword Information // Transactions of the Association for Computational Linguistics. ‒ 2017. ‒ Vol. 5. ‒ P. 135-146. ‒ DOI: 10.1162/tacl_a_00051.
122. Mikolov T., Chen K., Corrado G., Dean J. Efficient Estimation ofWord Representations in Vector Space // arXiv:1301.3781v3 [cs.CL] ‒2013. ‒ P. 12.
123. Le Q., Mikolov T. Distributed Representations of Sentences and Documents // the 31st International Conference on Machine Learning. ‒ Vol. 32 ‒ Beijing, China: Proceedings of Machine Learning Research (PMLR), 2014. ‒ P. 1188-1196.
124. Devlin J., Chang M.-W., Lee K., Toutanova K. BERT: Pre-training of Deep Bidirectional Transformers for Language Understanding // Proceedings of the 2019 Conference of the North American Chapter of the Association for Computational Linguistics: Human Language Technologies. ‒ Vol. 1 ‒ Minneapolis, Minnesota, : Association for Computational Linguistics, 2019. ‒ P. 4171-4186. ‒ DOI: 10.18653/v1/N19-1423.
125. Kohonen T. Self-Organized Formation of Topologically Correct Feature Maps // Biological Cybernetics. ‒ 1982. ‒ Vol. 43, No. 1. ‒ P. 59-69. ‒ DOI: 10.1007/BF00337288.
126. Kohonen T. The Self-Organizing Map // Proceedings of the IEEE. ‒ 1990. ‒ Vol. 78, No. 9. ‒ P. 1464-1480. ‒ DOI: 10.1109/5.58325.
127. Self-Organizing Maps. Springer Series in Information Sciences. / Kohonen T. ‒ 1st ed.: Springer, Berlin, Heidelberg, 1995. Springer Series in Information Sciences. ‒ DOI: 10.1007/978-3-642-97610-0.
128. Kohonen T. Essentials of the Self-Organizing Map // Neural Networks. ‒ 2013. ‒ Vol. 37. ‒ P. 52-65. ‒ DOI: 10.1016/j.neunet.2012.09.018.

341 129. Maaten L. v. d. Learning a Parametric Embedding by Preserving Local Structure
// Proceedings of the 12th International Conference on Artificial Intelligence and Statistics (AISTATS) / Ed. Dyk D. v., Welling M. ‒ Vol. 5 ‒ Florida, USA: Proceedings of Machine Learning Research (JMLR: W&CP), 2009. ‒ P. 384 - 391.
130. Maaten L. v. d. Accelerating t-SNE using Tree-Based Algorithms // Journal of Machine Learning Research. ‒ 2014. ‒ Vol. 15, No. 93. ‒ P. 3221-3245.
131. Maaten L. v. d., Hinton G. Visualizing Data using t-SNE // Journal of Machine Learning Research. ‒ 2008. ‒ Vol. 9, No. 86. ‒ P. 2579-2605.
132. Maaten L. v. d., Hinton G. Visualizing Non-Metric Similarities in Multiple Maps // Machine Learning. ‒ 2012. ‒ Vol. 87. ‒ P. 33–55. ‒ DOI: 10.1007/s10994-011-5273-4.
133. Arthur D., Vassilvitskii S. k-means++: The Advantages of Careful Seeding // Proceedings of the Eighteenth Annual ACM-SIAM Symposium on Discrete Algorithms ‒ New Orleans, Louisiana: Society for Industrial and Applied Mathematics, 2007. ‒ P. 1027–1035. ‒ DOI: 10.5555/1283383.1283494.
134. Ye H., Yan Z., Luo Z., Chao W. Dependency-Tree Based Convolutional Neural Networks for Aspect Term Extraction: Advances in Knowledge Discovery and Data Mining ‒ Cham: Springer International Publishing, 2017. ‒ P. 350-362. ‒ DOI: 10.1007/978-3-319-57529-2_28.
135. Kauffmann E., Peral J., Gil D., Ferrández A., Sellers R., Mora H. A Framework for Big Data Analytics in Commercial Social Networks: A Case Study on Sentiment Analysis and Fake Review Detection for Marketing Decision-Making // Industrial Marketing Management. ‒ 2020. ‒ Vol. 90. ‒ P. 523-537. ‒ DOI: 10.1016/j.indmarman.2019.08.003.
136. Thelwall M., Stuart E. She's Reddit: A Source of Statistically Significant Gendered Interest Information? // Information Processing & Management. ‒ 2019. ‒ Vol. 56, No. 4. ‒ P. 1543-1558. ‒ DOI: 10.1016/j.ipm.2018.10.007.
137. Zhang M., Fan B., Zhang N., Wang W., Fan W. Mining Product Innovation Ideas from Online Reviews // Information Processing & Management. ‒ 2021. ‒ Vol. 58, No. 1. ‒ P. 102389. ‒ DOI: 10.1016/j.ipm.2020.102389.
138. Chen M.-J., Farn C.-K. Examining the Influence of Emotional Expressions in Online Consumer Reviews on Perceived Helpfulness // Information Processing & Management. ‒ 2020. ‒ Vol. 57, No. 6. ‒ P. 102266. ‒ DOI: 10.1016/j.ipm.2020.102266.

342 139. Eke C. I., Norman A. A., Shuib L., Nweke H. F. A Survey of User Profiling: State-
of-the-Art, Challenges, and Solutions // IEEE Access. ‒ 2019. ‒ Vol. 7. ‒ P. 144907-144924. ‒ DOI: 10.1109/ACCESS.2019.2944243.
140. Zhou W., Han W. Personalized Recommendation Via User Preference Matching // Information Processing & Management. ‒ 2019. ‒ Vol. 56, No. 3. ‒ P. 955-968. ‒ DOI: 10.1016/j.ipm.2019.02.002.
141. Fosch-Villaronga E., Poulsen A., Søraa R. A., Custers B. H. M. A Little Bird Told Me Your Gender: Gender Inferences in Social Media // Information Processing & Management. ‒ 2021. ‒ Vol. 58, No. 3. ‒ P. 102541. ‒ DOI: 10.1016/j.ipm.2021.102541.
142. Kim Y., Kim J. H. Using Computer Vision Techniques on Instagram to Link Users’ Personalities and Genders to the Features of their Photos: An Exploratory Study // Information Processing & Management. ‒ 2018. ‒ Vol. 54, No. 6. ‒ P. 1101-1114. ‒ DOI: 10.1016/j.ipm.2018.07.005.
143. Rwigema J., Mfitumukiza J., Tae-Yong K. A Hybrid Approach of Neural Networks for Age and Gender Classification through Decision Fusion // Biomedical Signal Processing and Control. ‒ 2021. ‒ Vol. 66. ‒ P. 102459. ‒ DOI: 10.1016/j.bspc.2021.102459.
144. Cascone L., Medaglia C., Nappi M., Narducci F. Pupil Size as A Soft Biometrics for Age and Gender Classification // Pattern Recognition Letters. ‒ 2020. ‒ Vol. 140. ‒ P. 238-244. ‒ DOI: 10.1016/j.patrec.2020.10.009.
145. Nayak J. S., Indiramma M. An Approach to Enhance Age Invariant Face Recognition Performance Based on Gender Classification // Journal of King Saud University - Computer and Information Sciences. ‒ 2021. ‒ DOI: 10.1016/j.jksuci.2021.01.005.
146. Livieris I. E., Pintelas E., Pintelas P. Gender Recognition by Voice Using an Improved Self-Labeled Algorithm // Machine Learning and Knowledge Extraction. ‒ 2019. ‒ Vol. 1, No. 1. ‒ P. 492-503. ‒ DOI: 10.3390/make1010030.
147. Rim B., Kim J., Hong M. Gender Classification from Fingerprint-images using Deep Learning Approach // International Conference on Research in Adaptive and Convergent Systems ‒ Gwangju, Republic of Korea: ACM, 2020. ‒ P. 7–12. ‒ DOI: 10.1145/3400286.3418237.
148. Chen L., Han M., Shi H., Liu X. Multi-Context Embedding Based Personalized Place Semantics Recognition // Information Processing & Management. ‒ 2021. ‒ Vol. 58, No. 1. ‒ P. 102416. ‒ DOI: 10.1016/j.ipm.2020.102416.
149. López-Santillán R., Montes-Y-Gómez M., González-Gurrola L. C., Ramírez-Alonso G., Prieto-Ordaz O. Richer Document Embeddings for Author Profiling

343
Tasks Based on A Heuristic Search // Information Processing & Management. ‒ 2020. ‒ Vol. 57, No. 4. ‒ P. 102227. ‒ DOI: 10.1016/j.ipm.2020.102227.
150. Al-Yazeed N. M. A., Gadallah A. M., Hefny H. A. A Hybrid Recommendation Model for Web Navigation // The Seventh IEEE International Conference on Intelligent Computing and Information Systems (ICICIS) ‒ Cairo, Egypt: IEEE, 2015. ‒ P. 552-560. ‒ DOI: 10.1109/IntelCIS.2015.7397276.
151. Renjith S., Sreekumar A., Jathavedan M. An Extensive Study on the Evolution of Context-Aware Personalized Travel Recommender Systems // Information Processing & Management. ‒ 2020. ‒ Vol. 57, No. 1. ‒ P. 102078. ‒ DOI: 10.1016/j.ipm.2019.102078.
152. Simaki V., Aravantinou C., Mporas I., Megalooikonomou V. Using Sociolinguistic Inspired Features for Gender Classification of Web Authors // International Conference on Text, Speech, and Dialogue TSD 2015: Text, Speech, and Dialogue. ‒ Vol. 9302: Lecture Notes in Computer Science ‒ Cham: Springer, 2015. ‒ P. 587-594. ‒ DOI: 10.1007/978-3-319-24033-6_66.
153. Kucukyilmaz T., Deniz A., Kiziloz H. E. Boosting Gender Identification Using Author Preference // Pattern Recognition Letters. ‒ 2020. ‒ Vol. 140. ‒ P. 245-251. ‒ DOI: 10.1016/j.patrec.2020.10.002.
154. Das S., Paik J. H. Context-Sensitive Gender Inference of Named Entities in Text // Information Processing & Management. ‒ 2021. ‒ Vol. 58, No. 1. ‒ P. 102423. ‒ DOI: 10.1016/j.ipm.2020.102423.
155. Alsmearat K., Al-Ayyoub M., Al-Shalabi R., Kanaan G. Author Gender Identification from Arabic Text // Journal of Information Security and Applications. ‒ 2017. ‒ Vol. 35. ‒ P. 85-95. ‒ DOI: 10.1016/j.jisa.2017.06.003.
156. ElSayed S., Farouk M. Gender Identification for Egyptian Arabic Dialect in Twitter Using Deep Learning Models // Egyptian Informatics Journal. ‒ 2020. ‒ Vol. 21, No. 3. ‒ P. 159-167. ‒ DOI: 10.1016/j.eij.2020.04.001.
157. Hussein S., Farouk M., Hemayed E. Gender Identification of Egyptian Dialect in Twitter // Egyptian Informatics Journal. ‒ 2019. ‒ Vol. 20, No. 2. ‒ P. 109-116. ‒ DOI: 10.1016/j.eij.2018.12.002.
158. Sboev A., Moloshnikov I., Gudovskikh D., Selivanov A., Rybka R., Litvinova T. Automatic Gender Identification of Author of Russian Text by Machine Learning and Neural Net Algorithms in Case of Gender Deception // Procedia Computer Science. ‒ 2018. ‒ Vol. 123. ‒ P. 417-423. ‒ DOI: 10.1016/j.procs.2018.01.064.
159. Sboev A., Moloshnikov I., Gudovskikh D., Selivanov A., Rybka R., Litvinova T. Deep Learning Neural Nets Versus Traditional Machine Learning in Gender
344
Identification of Authors of RusProfiling Texts // Procedia Computer Science. ‒ 2018. ‒ Vol. 123. ‒ P. 424-431. ‒ DOI: 10.1016/j.procs.2018.01.065.
160. Filho J. A. B. L., Pasti R., Castro L. N. d. Gender Classification of Twitter Data Based on Textual Meta-Attributes Extraction // New Advances in Information Systems and Technologies / Ed. Rocha Á. et al. ‒ Vol. 444: Advances in Intelligent Systems and Computing ‒ Cham: Springer International Publishing, 2016. ‒ P. 1025-1034. ‒ DOI: 10.1007/978-3-319-31232-3_97.
161. Wais K. Gender Prediction Methods Based on First Names with genderizeR // The R Journal. ‒ 2016. ‒ Vol. 8, No. 1. ‒ P. 17-37. ‒ DOI: 10.32614/RJ-2016-002.
162. The Slangit Leet Sheet. ‒ 2021. ‒ URL: https://slangit.com/leet_sheet (Date Accessed: Mar. 20.2021).
163. Christensson P. Leet Definition. ‒ 2019. ‒ URL: https://techterms.com/definition/leet (Date Accessed: Mar. 20.2021).
164. Mitchell A. A Leet Primer. ‒ 2005. ‒ URL: https://www.technewsworld.com/story/47607.html (Date Accessed: Mar. 20.2021).
165. McAuley J., Leskovec J. Hidden Factors and Hidden Topics: Understanding Rating Dimensions With Review Text // Proceedings of the 7th ACM conference on Recommender Systems ‒ Hong Kong, China: ACM, 2013. ‒ P. 165–172. ‒ DOI: 10.1145/2507157.2507163.
166. Hazrati N., Ricci F. Recommender Systems Effect on the Evolution of Users’ Choices Distribution // Information Processing & Management. ‒ 2022. ‒ Vol. 59, No. 1. ‒ P. 102766. ‒ DOI: 10.1016/j.ipm.2021.102766.
167. Qiu L., Gao S., Cheng W., Guo J. Aspect-based Latent Factor Model by Integrating Ratings and Reviews for Recommender System // Knowledge-Based Systems. ‒ 2016. ‒ Vol. 110. ‒ P. 233-243. ‒ DOI: 10.1016/j.knosys.2016.07.033.
168. Zheng Y., Wang D. A Survey of Recommender Systems with Multi-Objective Optimization // Neurocomputing. ‒ 2021. ‒ DOI: 10.1016/j.neucom.2021.11.041.
169. Burke R. Hybrid Recommender Systems: Survey and Experiments // User Modeling and User-Adapted Interaction. ‒ 2002. ‒ Vol. 12, No. 4. ‒ P. 331-370. ‒ DOI: 10.1023/A:1021240730564.
170. Ni J., Li J., McAuley J. Justifying Recommendations using Distantly-Labeled Reviews and Fine-Grained Aspects // Empirical Methods in Natural Language Processing (EMNLP): Proceedings of the 2019 Conference on Empirical Methods in Natural Language Processing and the 9th International Joint Conference on

345
Natural Language Processing (EMNLP-IJCNLP) ‒ Hong Kong, China: ACL, 2019. ‒ P. 188-197. ‒ DOI: 10.18653/v1/D19-1018.
171. Baizal Z. K. A., Widyantoro D. H., Maulidevi N. U. Computational Model for Generating Interactions in Conversational Recommender System Based on Product Functional Requirements // Data & Knowledge Engineering. ‒ 2020. ‒ Vol. 128. ‒ P. 101813. ‒ DOI: 10.1016/j.datak.2020.101813.
172. Da'u A., Salim N., Rabiu I., Osman A. Recommendation System Exploiting Aspect-based Opinion Mining With Deep Learning Method // Information Sciences. ‒ 2020. ‒ Vol. 512. ‒ P. 1279-1292. ‒ DOI: 10.1016/j.ins.2019.10.038.
173. Da'u A., Salim N., Rabiu I., Osman A. Weighted Aspect-based Opinion Mining Using Deep Learning for Recommender System // Expert Systems with Applications. ‒ 2020. ‒ Vol. 140. ‒ P. 112871. ‒ DOI: 10.1016/j.eswa.2019.112871.
174. Ghasemi N., Momtazi S. Neural Text Similarity of User Reviews for Improving Collaborative Filtering Recommender Systems // Electronic Commerce Research and Applications. ‒ 2021. ‒ Vol. 45. ‒ P. 101019. ‒ DOI: 10.1016/j.elerap.2020.101019.
175. Asani E., Vahdat-Nejad H., Sadri J. Restaurant Recommender System Based on Sentiment Analysis // Machine Learning with Applications. ‒ 2021. ‒ Vol. 6. ‒ P. 100114. ‒ DOI: 10.1016/j.mlwa.2021.100114.
176. Ray B., Garain A., Sarkar R. An Ensemble-based Hotel Recommender System Using Sentiment Analysis and Aspect Categorization of Hotel Reviews // Applied Soft Computing. ‒ 2021. ‒ Vol. 98. ‒ P. 106935. ‒ DOI: 10.1016/j.asoc.2020.106935.
177. Koren Y., Bell R., Volinsky C. Matrix Factorization Techniques for Recommender Systems // Computer. ‒ 2009. ‒ Vol. 42, No. 8. ‒ P. 30-37. ‒ DOI: 10.1109/MC.2009.263.
178. Koren Y. Factorization Meets the Neighborhood: A Multifaceted Collaborative Filtering Model // The 14th ACM SIGKDD International Conference on Knowledge Discovery and Data Mining ‒ Las Vegas, Nevada, USA: ACM, 2008. ‒ P. 426–434. ‒ DOI: 10.1145/1401890.1401944.