Big data analytics for earth sciences: the earth server approach
29
This article was downloaded by: [83.37.146.112] On: 11 March 2015, At: 07:19 Publisher: Taylor & Francis Informa Ltd Registered in England and Wales Registered Number: 1072954 Registered office: Mortimer House, 37-41 Mortimer Street, London W1T 3JH, UK Click for updates International Journal of Digital Earth Publication details, including instructions for authors and subscription information: http://www.tandfonline.com/loi/tjde20 Big Data Analytics for Earth Sciences: the EarthServer approach Peter Baumann ab , Paolo Mazzetti c , Joachim Ungar d , Roberto Barbera efg , Damiano Barboni h , Alan Beccati a , Lorenzo Bigagli c , Enrico Boldrini c , Riccardo Bruno ef , Antonio Calanducci f , Piero Campalani a , Oliver Clements i , Alex Dumitru a , Mike Grant i , Pasquale Herzig j , George Kakaletris k , John Laxton l , Panagiota Koltsida k , Kinga Lipskoch a , Alireza Rezaei Mahdiraji a , Simone Mantovani h , Vlad Merticariu a , Antonio Messina m , Dimitar Misev a , Stefano Natali h , Stefano Nativi c , Jelmer Oosthoek a , Marco Pappalardo m , James Passmore n , Angelo Pio Rossi a , Francesco Rundo e , Marcus Sen n , Vittorio Sorbera e , Don Sullivan o , Mario Torrisi f , Leonardo Trovato m , Maria Grazia Veratelli h & Sebastian Wagner j a Large-Scale Scientific Information Systems, Jacobs University, Bremen, Germany b Rasdaman GmbH, Bremen, Germany c CNR-IIA, National Research Council of Italy, Institute of Atmospheric Pollution Research, Florence, Italy d EOX IT Services GmbH, Vienna, Austria e Consorzio COMETA, Catania, Italy f Division of Catania, Italian National Institute for Nuclear Physics, Catania, Italy g Department of Physics and Astronomy, University of Catania, Catania, Italy h MEEO S.r.l., Ferrara, Italy i Plymouth Marine Laboratory, Plymouth, UK j Fraunhofer IGD, Darmstadt, Germany k Athena Research and Innovation Center in Information Communication & Knowledge Technologies, Athens, Greece l British Geological Survey, Edinburgh, UK m Software Engineering Italia S.r.l., Catania, Italy n British Geological Survey, Keyworth, UK o NASA Ames Research Center, Moffett Field, CA, USA
-
Upload
jacobs-university -
Category
Documents
-
view
0 -
download
0
Transcript of Big data analytics for earth sciences: the earth server approach

This article was downloaded by: [83.37.146.112]On: 11 March 2015, At: 07:19Publisher: Taylor & FrancisInforma Ltd Registered in England and Wales Registered Number: 1072954 Registeredoffice: Mortimer House, 37-41 Mortimer Street, London W1T 3JH, UK
Click for updates
International Journal of Digital EarthPublication details, including instructions for authors andsubscription information:http://www.tandfonline.com/loi/tjde20
Big Data Analytics for Earth Sciences:the EarthServer approachPeter Baumannab, Paolo Mazzettic, Joachim Ungard, RobertoBarberaefg, Damiano Barbonih, Alan Beccatia, Lorenzo Bigaglic,Enrico Boldrinic, Riccardo Brunoef, Antonio Calanduccif, PieroCampalania, Oliver Clementsi, Alex Dumitrua, Mike Granti,Pasquale Herzigj, George Kakaletrisk, John Laxtonl, PanagiotaKoltsidak, Kinga Lipskocha, Alireza Rezaei Mahdirajia, SimoneMantovanih, Vlad Merticariua, Antonio Messinam, Dimitar Miseva,Stefano Natalih, Stefano Nativic, Jelmer Oosthoeka, MarcoPappalardom, James Passmoren, Angelo Pio Rossia, FrancescoRundoe, Marcus Senn, Vittorio Sorberae, Don Sullivano, MarioTorrisif, Leonardo Trovatom, Maria Grazia Veratellih & SebastianWagnerj
a Large-Scale Scientific Information Systems, Jacobs University,Bremen, Germanyb Rasdaman GmbH, Bremen, Germanyc CNR-IIA, National Research Council of Italy, Institute ofAtmospheric Pollution Research, Florence, Italyd EOX IT Services GmbH, Vienna, Austriae Consorzio COMETA, Catania, Italyf Division of Catania, Italian National Institute for Nuclear Physics,Catania, Italyg Department of Physics and Astronomy, University of Catania,Catania, Italyh MEEO S.r.l., Ferrara, Italyi Plymouth Marine Laboratory, Plymouth, UKj Fraunhofer IGD, Darmstadt, Germanyk Athena Research and Innovation Center in InformationCommunication & Knowledge Technologies, Athens, Greecel British Geological Survey, Edinburgh, UKm Software Engineering Italia S.r.l., Catania, Italyn British Geological Survey, Keyworth, UKo NASA Ames Research Center, Moffett Field, CA, USA

Accepted author version posted online: 03 Jan 2015.Publishedonline: 02 Mar 2015.
To cite this article: Peter Baumann, Paolo Mazzetti, Joachim Ungar, Roberto Barbera, DamianoBarboni, Alan Beccati, Lorenzo Bigagli, Enrico Boldrini, Riccardo Bruno, Antonio Calanducci, PieroCampalani, Oliver Clements, Alex Dumitru, Mike Grant, Pasquale Herzig, George Kakaletris, JohnLaxton, Panagiota Koltsida, Kinga Lipskoch, Alireza Rezaei Mahdiraji, Simone Mantovani, VladMerticariu, Antonio Messina, Dimitar Misev, Stefano Natali, Stefano Nativi, Jelmer Oosthoek, MarcoPappalardo, James Passmore, Angelo Pio Rossi, Francesco Rundo, Marcus Sen, Vittorio Sorbera, DonSullivan, Mario Torrisi, Leonardo Trovato, Maria Grazia Veratelli & Sebastian Wagner (2015): BigData Analytics for Earth Sciences: the EarthServer approach, International Journal of Digital Earth,DOI: 10.1080/17538947.2014.1003106
To link to this article: http://dx.doi.org/10.1080/17538947.2014.1003106
PLEASE SCROLL DOWN FOR ARTICLE
Taylor & Francis makes every effort to ensure the accuracy of all the information (the“Content”) contained in the publications on our platform. However, Taylor & Francis,our agents, and our licensors make no representations or warranties whatsoever as tothe accuracy, completeness, or suitability for any purpose of the Content. Any opinionsand views expressed in this publication are the opinions and views of the authors,and are not the views of or endorsed by Taylor & Francis. The accuracy of the Contentshould not be relied upon and should be independently verified with primary sourcesof information. Taylor and Francis shall not be liable for any losses, actions, claims,proceedings, demands, costs, expenses, damages, and other liabilities whatsoever orhowsoever caused arising directly or indirectly in connection with, in relation to or arisingout of the use of the Content.
This article may be used for research, teaching, and private study purposes. Anysubstantial or systematic reproduction, redistribution, reselling, loan, sub-licensing,systematic supply, or distribution in any form to anyone is expressly forbidden. Terms &Conditions of access and use can be found at http://www.tandfonline.com/page/terms-and-conditions
Dow
nloa
ded
by [
83.3
7.14
6.11
2] a
t 07:
19 1
1 M
arch
201
5

Big Data Analytics for Earth Sciences: the EarthServer approach
Peter Baumanna,b*, Paolo Mazzettic, Joachim Ungard, Roberto Barberae,f,g,Damiano Barbonih, Alan Beccatia, Lorenzo Bigaglic, Enrico Boldrinic, Riccardo Brunoe,f,Antonio Calanduccif, Piero Campalania, Oliver Clementsi, Alex Dumitrua, Mike Granti,
Pasquale Herzigj, George Kakaletrisk, John Laxtonl, Panagiota Koltsidak,Kinga Lipskocha, Alireza Rezaei Mahdirajia, Simone Mantovanih, Vlad Merticariua,
Antonio Messinam, Dimitar Miseva, Stefano Natalih, Stefano Nativic, Jelmer Oosthoeka,Marco Pappalardom, James Passmoren, Angelo Pio Rossia, Francesco Rundoe,
Marcus Senn, Vittorio Sorberae, Don Sullivano, Mario Torrisif, Leonardo Trovatom,Maria Grazia Veratellih and Sebastian Wagnerj
aLarge-Scale Scientific Information Systems, Jacobs University, Bremen, Germany; bRasdamanGmbH, Bremen, Germany; cCNR-IIA, National Research Council of Italy, Institute of Atmospheric
Pollution Research, Florence, Italy; dEOX IT Services GmbH, Vienna, Austria; eConsorzioCOMETA, Catania, Italy; fDivision of Catania, Italian National Institute for Nuclear Physics,Catania, Italy; gDepartment of Physics and Astronomy, University of Catania, Catania, Italy;hMEEO S.r.l., Ferrara, Italy; iPlymouth Marine Laboratory, Plymouth, UK; jFraunhofer IGD,
Darmstadt, Germany; kAthena Research and Innovation Center in Information Communication &Knowledge Technologies, Athens, Greece; lBritish Geological Survey, Edinburgh, UK; mSoftwareEngineering Italia S.r.l., Catania, Italy; nBritish Geological Survey, Keyworth, UK; oNASA Ames
Research Center, Moffett Field, CA, USA
(Received 3 October 2014; accepted 23 December 2014)
Big Data Analytics is an emerging field since massive storage and computingcapabilities have been made available by advanced e-infrastructures. Earth andEnvironmental sciences are likely to benefit from Big Data Analytics techniquessupporting the processing of the large number of Earth Observation datasets currentlyacquired and generated through observations and simulations. However, EarthScience data and applications present specificities in terms of relevance of thegeospatial information, wide heterogeneity of data models and formats, andcomplexity of processing. Therefore, Big Earth Data Analytics requires specificallytailored techniques and tools. The EarthServer Big Earth Data Analytics engine offersa solution for coverage-type datasets, built around a high performance array databasetechnology, and the adoption and enhancement of standards for service interaction(OGC WCS and WCPS). The EarthServer solution, led by the collection ofrequirements from scientific communities and international initiatives, provides aholistic approach that ranges from query languages and scalability up to mobileaccess and visualization. The result is demonstrated and validated through thedevelopment of lighthouse applications in the Marine, Geology, Atmospheric,Planetary and Cryospheric science domains.
Keywords: big data; Big Data Analytics; array databases; Earth Sciences; interoper-ability; standards
*Corresponding author. Email: [email protected]
International Journal of Digital Earth, 2015
http://dx.doi.org/10.1080/17538947.2014.1003106
© 2015 Taylor & Francis
Dow
nloa
ded
by [
83.3
7.14
6.11
2] a
t 07:
19 1
1 M
arch
201
5

Introduction
In the recent years, the evolution of communication and digital storage technologiesallowed the collection of a huge amount of information raising the need for effectiveways of maintaining, accessing, and processing data efficiently. In this context, the term‘big data’ became widely used. Its first definition, by Doug Laney of META Group (thenacquired by Gartner; Laney 2001), as data requiring high management capabilitiescharacterized by the 3Vs: Volume, Velocity and Variety, is still relevant, especially for thegeospatial data domain. It points out that big data does not simply mean large datasets(big Volume) but also efficient dataset handling (big Velocity) and great heterogeneity(big Variety). Later, other Vs have been added by other authors: Veracity (i.e. addressingquality and uncertainty), Value, etc.
In the scientific domain, several disciplinary areas are facing big data challenges aspart of an innovative approach to science usually referred to as e-Science. Earth Scienceshave been some of the disciplinary domains most strongly pushing, and potentiallybenefiting from, the e-Science approach, intended as ‘global collaboration in key areas ofscience, and the next generation of infrastructure that will enable it’ (Hey and Trefethen2002). They were in the forefront in many initiatives on distributed computing trying torealize the e-Science vision, including high performance computing, grid technologies(Petitdidier et al. 2009), and cloud services. The reason is that Earth Sciences raisesignificant challenges in terms of storage and computing capabilities, as:
(1) They encompass a wide range of applications: from disciplinary sciences (e.g.Climate, Ocean, Geology) to the multidisciplinary study of the Earth as a system(the so-called Earth System Science). Therefore, Earth Sciences make use ofheterogeneous information (Big Variety):(a) covering a diverse temporal range (such as for Climate and Geological studies);(b) supporting a wide spatial coverage (the whole Earth, for global studies, and
beyond when considering planetary sciences);(c) modeling many different geospatial data types, including profiles, trajectories,
regularly and irregularly gridded data, etc.;(2) They are based on observations and measurements coming from in situ and remote-
sensing data with ever-growing spatial, temporal, and radiometric resolution,requiring handling of Big Volumes, e.g. Sentinel satellites will increase the size ofthe ESA data archive to more than 20 PB in 2020 (Houghton 2013).
(3) They make use of complex scientific modeling and simulations to study complexscenarios (e.g. for Climate Change) requiring fast processing (Big Velocity).
It is therefore clear that – referring to the Big data Vs – big Volume, big Variety, and highVelocity are characteristic issues of Earth Science data systems.
The work presented in this paper is result of the project EarthServer funded under theEuropean Community’s Seventh Framework Programme in 2011–2014. EarthServer iscoordinated by Jacobs University of Bremen, with the participation of European researchcenters and private companies, and with an international collaboration with NASA. Theproject objective is the development of specific solutions for supporting open access andad hoc analytics on Earth Science (ES) big data, based on the OGC geoservice standards.EarthServer included research and development activities to develop client and servertechnologies, and demonstration activities through a set of lighthouse applications forvalidation.
2 P. Baumann et al.
Dow
nloa
ded
by [
83.3
7.14
6.11
2] a
t 07:
19 1
1 M
arch
201
5

The paper presents and discusses the main outcomes of the project with contributionsfrom the different research groups involved.
Big Data Analytics challenges for Earth Sciences
Since its beginning, the EarthServer project paid great attention to the collection ofscientific and technological requirements from relevant Earth Science communities.Moreover, a specific action was dedicated to the collection of requirements andevaluation of the alignment with international initiatives on Earth and environmentaldata-sharing like GEOSS (http://www.earthobservations.org), INSPIRE (http://inspire.ec.europa.eu), and Copernicus (http://www.copernicus.eu).
The EarthServer project addressed the scientific communities through partners thatare part of the communities themselves. This approach was successful because it greatlysimplified the interaction. The Plymouth Marine Laboratory (PML) acted as a proxytoward the Marine community, as the British Geological Survey (BGS) did for the SolidEarth community and Meteorological Environmental Earth Observation S.r.l. (MEEO) forthe Atmospheric community. They collected requirements and validated the ongoingactivities, through questionnaires, consultations, and organizations of dedicated work-shops, usually back-to-back with relevant events for the community. In addition, theEarth Science community as a whole was addressed through dedicated meetings heldduring the annual European Geosciences Union (EGU) General Assembly.
Other actions were specifically directed to the Earth Observation community throughthe organization of presentation and meetings during the Group on Earth Observation(GEO) Plenary and the co-organization of the ESA ‘Big Data from Space’ conference(Bargellini et al. 2013).
The main results of this activity can be summarized in the following list of generalrequirements (Mazzetti et al. 2013):
(1) Earth Observation applications are already facing the Big Data issue, with a needfor advanced solutions supporting big data handling and big data analytics.
(2) There is a need for flexible solutions enabling ad hoc analytics on big data forscientific data exploration on demand.
(3) Users require big data technologies supporting multiple data models and reducingdata transfer.
(4) Users require advanced visualization techniques easily integrated in differentGUIs including Web and mobile systems.
The EarthServer approach
General approach
In a nutshell, EarthServer provides open, interoperable, and format-independent access to‘Big Geo Data’, ranging from simple access and extraction to complex agile analytics/retrieval services on data. An Array Database, rasdaman (http://www.rasdaman.org)(Jacobs University Bremen and rasdaman GmbH 2013; Rasdaman, 2013), empowers theEarthServer technology to integrate data/metadata retrieval, resulting in same level ofsearch, filtering, and extraction convenience as is typical for metadata (Array DBMS 2014).
Traditionally, data dealing with the Earth or with planetary systems are categorizedinto vector, raster, and metadata. The latter is what is generally considered small,
International Journal of Digital Earth 3
Dow
nloa
ded
by [
83.3
7.14
6.11
2] a
t 07:
19 1
1 M
arch
201
5

semantic-rich, and queryable. Vector data representing points, lines, areas, etc. havereached this Holy Grail since some time, too. Raster data – i.e. data points aligned onsome regular or irregular grid – due to their sheer size are generally considered as suitableonly for download, maybe extracting subsets, but otherwise with no particular queryablesemantics and without a standard functionality set. Standardization is one of the means toenhance interoperability. In the geospatial data domain, the Open Geospatial Consortium(OGC) plays a key role in standardization. Concerning service interfaces, it providesspecifications for accessing different data: the Web Feature Service (WFS) is tailored toserve vector data, while the Web Coverage Service (WCS) is devoted to multidimensionalraster data, point clouds, and meshes; the Web Map Service (WMS) has a special role inthat it aims at visualizing vector and raster maps in 2D in the simplest fashion possible.WCS is particularly interesting for data archives since it allows accessing data values forfurther processing and not just for visualization (as WMS does). One use case is to obtaindata in guaranteed unmodified, such as bathymetry data; another one is server-sideprocessing to obtain the tailor-made product required. Part of this further processing canbe conveniently implemented server-side, directly within the archive and executed uponrequest. The Web Coverage Processing Service (WCPS) is specifically designed toenhance data archives by doing this, providing ‘analytics’ directly on top of them, aimingat enhancing data use and exploitation.
For spatio-temporal ‘Big Data’, the OGC has defined its unified coverage model(nicknamed GMLCOV) which refines the abstract model of ISO 19123 (ISO 2005) to aconcrete, interoperable model that can be conformance tested down to single pixel level.Coverage is a subtype (i.e., specialization) of a feature, a feature being a geographicobject; informally speaking, coverage is a digital representation of some space-time(multidimensional) varying phenomenon (Baumann 2012a). Technically, a coverageencompasses regular and irregular grids, point clouds, and general meshes. As this notionis not tied to a particular service model, many services can receive or generate coverages,such as OGC WFS, WMS, WCS, WCPS, and WPS. Specifically, the Web CoverageService standard provides rich, tailored functionality essential for data access andanalysis. For the latter, WCS is closely connected to the Web Coverage ProcessingService (WCPS) which defines a query language on coverages, currently on spatio-temporal rasters, i.e. geo-referenced arrays addressable by some spatio-temporalcoordinate reference system. Generally speaking, this includes n-D sensor, image,simulation output, and statistics data. Over such multidimensional data entities, theWCPS standard offers a leap ahead with respect to interoperable processing: it defines apowerful and flexible query language that, on top of data archives, enables coverage datato be used in complex queries. Derived products can thus be built on the fly andcombined with other coverages.
EarthServer recognizes that Big Data in geoservices often means coverages –certainly with regard to volume, but generally in all respects of the Vs characterizingBig Data. Therefore, the whole architecture centers around supporting coverages. Thenucleus is the rasdaman array database serving regular and irregular grids and,experimentally, point clouds. It is particularly suitable for geoservices that are intensivein both data quantity and processing because its query language gives the flexibility tophrase any task without reprogramming the server (as is effectively the case, e.g. withWPS-based systems).
The OGC standards for Big Geo Data, centered around the OGC coverage data andservice model, represent a suitable client/server interface for general purpose use in the
4 P. Baumann et al.
Dow
nloa
ded
by [
83.3
7.14
6.11
2] a
t 07:
19 1
1 M
arch
201
5

Earth Sciences. Therefore, the WCS and WCPS standards have been adopted byEarthServer, together with WMS for 2D visualization. EarthServer extends this platformtoward a comprehensive coverage analytics engine. It comprehensively supports theWMS/WCS/WCPS suite on multidimensional, spatio-temporal coverages; data andmetadata search has been integrated, thereby effectively abolishing this age-olddistinction; interfaces to GIS tools like MapServer and GDAL have been established;the server engine has been massively parallelized to achieve strong scalability; and 3Dbrowser clients have been established effectively hiding the query language from casualusers while allowing query writing for expert users. This technology forms the commonplatform for the six Lighthouse Applications which together comprehensively address theEarth sciences.
Finally, findings obtained in platform development and service operation are fed backinto the standardization process where they have significantly shaped recent WCS andWCPS specification work.
Data service infrastructure
Figure 1 shows a UML component diagram of the overall EarthServer architecture fromthe data flow and access perspective. Details of the single components are omitted and thehigh-level elements are connected by dependencies on elements which they drive (as isthe case with the ingestion system) or from which they access stored data. The externalinterfaces are also highlighted in the left side of the ‘EarthServer’ data service package.
The infrastructure components and their main functions are described in the followingsubsections.
Data layer and file based ingestion
Depending on the specific service provider, data can be accessed as a network resource orcan be stored locally on internal file servers. Regardless of the source type and location,the first required step is the data ingestion into rasdaman. Basically, it means providingthe rasdaman server with descriptive information about the dataset so that it can beproperly accessed by the rasdaman array database engine and translated into a GMLCOVinstance for delivery. Data ingestion is performed through a set of command line tools.
Figure 1. EarthServer data service component diagram (generic architecture).
International Journal of Digital Earth 5
Dow
nloa
ded
by [
83.3
7.14
6.11
2] a
t 07:
19 1
1 M
arch
201
5

Backend: Rasdaman (structured array and in situ)
The rasdaman system is a so-called array DBMS, a recent research direction in databaseswhich it actually pioneered. An array DBMS offers the same quality of service – such asquery language, optimization, parallel and distributed query processing – on largemultidimensional arrays as conventional SQL systems offer on sets (Array DBMS 2014;Baumann et al. 2011).
The conceptual model of rasdaman consists of multidimensional arrays with some celltype and n-D extent. The rasdaman query language, rasql (Rasdaman GmbH 2013), addsgeneric array operators which can be combined freely. Its expressiveness encompassessubsetting, cell manipulation, and general image, signal, and statistical analysis up to,e.g., the Fourier Transform. As it will be discussed in the Related Work section, rasdamancurrently is the only Array DBMS operationally used on multi-TB holdings, fullyparallelized, and proven in scalability.
The storage model relies on the partitioning of the arrays into sub-arrays. Arraypartitioning for speeding up access exists in data formats such as TIFF and NetCDF. Inthe service communities, this concept has been described in the context of rasdamanunder the name ‘tiling’ (Baumann 1994), later it also has been termed ‘chunking’(Sarawagi and Stonebraker 1994). Actually, chunking often refers to a regular partitioningwhile the rasdaman tiling covers the spectrum of regular, irregular, and non-alignedpartitioning in any number of dimensions. As opposed to, say, PostGIS Raster (http://postgis.net/docs/manual-2.1/using_raster_dataman.html), tiling is transparent to the user,but accessible to the database tuner as an optimization method; for example, for timeseries analysis tiles would be stretched along time while having a smaller spatialfootprint, thereby reducing disk accesses during query evaluation. Storage of tiles iseither in a relational database (RDBMS) or in flat files. An RDBMS – in EarthServer thisis PostgreSQL – offers the advantage of information integration with metadata plus thewealth of tools available, but comes at some extra cost, e.g. due to the data duplication aswell as for transaction handling. File-based storage allows access to data in the pre-existing archive, which is faster and not relying on redundant storage in a database, butlacks transaction support; additionally, existing archives frequently are not tuned towarduser access patterns. Therefore, in practice often a mix will be optimal.
The rasdaman engine as such operates on arrays in a domain-agnostic way. Thespecific geo-semantics of coordinates, regular and irregular grids, etc., are provided by anadditional layer in the rasdaman overall architecture, called petascope, which is describedin the following.
Rasdaman web service interfaces (petascope)
Coverages offered by the data service are made accessible over the web by the petascopecomponent of rasdaman, which is also the reference implementation of the WCPSstandard (Aiordachioaie and Baumann 2010). Petascope consists of Java servlets thatleverage several open source geospatial and geometry libraries, as well as rasdaman dataaccess libraries and relational database access components. Basically, it translatesincoming processing requests (WCPS queries) into rasdaman (rasql) queries to efficientlyfetch and process array data (according to information in the coverage rangeType anddomainSet elements). It then translates the output into the proper coverage type,formatted according to the requested encoding. Moreover, the ‘encode’ WCPS operatorallows for delivering coverage data in other formats (not necessarily maintaining all
6 P. Baumann et al.
Dow
nloa
ded
by [
83.3
7.14
6.11
2] a
t 07:
19 1
1 M
arch
201
5

coverage metadata) such as GeoTIFF (http://trac.osgeo.org/geotiff/) or non-geo-refer-enced image formats, such as PNG, which are suitable for direct image display.
EarthServer search engine and xWCPS
The EarthServer search engine builds on top of the above-mentioned technologies,offering a query language, an abstract data model, and a series of coordinating services.In particular, it offers the functionality to transparently exploit coverages distributedacross different services. The main enabling component is a query language named‘xQuery compliant WCPS’ or xWCPS (Kakaletris et al. 2013), which closely followsxQuery’s syntax and philosophy allowing mixed search and results on both XMLrepresented metadata and coverage data under a familiar syntactic formalism. An exampleof an xWCPS query that returns CRISM greyscale images with observation type ‘FRT’combining both metadata and data follows:
Listing 1: Example of an xWCPS query.
Scalability
One of the tasks of the EarthServer project was to enhance and prove scalability of theproposed technologies.
Generally, scalability of rasdaman, being an array DBMS, is leveraged through thefollowing core properties, among others:
. by performing a partitioning of large arrays into tractable sub-arrays of suitablesize. Suitability mainly is given by the access pattern to which the rasdaman arrayscan be trimmed in the tiling clause of the insert statement. In the optimal case, aquery can be answered with one disk access or entirely from cache. Categories ofqueries, so-called workloads, can be tuned this way. Examples include time seriesanalysis where the incoming image slices are reshaped into time ‘sticks.’ In theextreme case, administrators provide only the location of hotspots in space andtime; the systems will put these into single tiles for fast access and perform asuitable tiling around those by itself. Therefore, queries depend less on the size ofthe objects touched, but only on the size of the excerpt used from them.
. Whenever multiple tiles are loaded to answer a query, these can be processed inparallel, for example, in a multi-core environment. For objects sitting on differentserver nodes, parallel subqueries can be spawned.
. Query expressions can be replaced by more efficient ones. For example, addingtwo images pixelwise and then doing an average on the result image is lessefficient than first averaging each image (which can be parallelized in addition) and
International Journal of Digital Earth 7
Dow
nloa
ded
by [
83.3
7.14
6.11
2] a
t 07:
19 1
1 M
arch
201
5

then subtracting the two resulting single numbers. In rasdaman, every incomingquery is analyzed against 150 rules to find the most efficient variant.
. On highest level, queries are optimized in various ways, including the methodslisted, to achieve high performance. Such adaptive optimization is substantiallymore promising than the static parallelization methods deployed in techniques suchas MapReduce. In rasdaman, query swarms can be distributed over a peer networkof rasdaman-enabled servers (‘inter-query parallelization’), and single queries canbe split and distributed in the rasdaman network (‘intra-query parallelization’).
In the next sections we address both parallelization types and report tests conducted.
Inter-query parallelization
Inter-query parallelization spreads a large number of queries across different nodes. It isuseful when executing a large number of small queries. For evaluation purposes, a set oftests were run performing 1000 queries over N slave virtual machines deployed on a 64cores server, with N varying from 1 to 60. Results demonstrated that while the averagenumber of queries processed by each slave node decreases as 1/N, the overall number ofparallel processes saturated rapidly and the overall run time value decreased almostlinearly. The inter-query parallelization is currently available on both standard andenterprise edition of rasdaman.
Intra-query parallelization
Intra-query parallelization smartly splits a complex query into many different smallqueries sent to different nodes in a network of rasdaman peers. Query splitting andplacement is done in a way that minimizes data transfer and maximizes parallelevaluation (Dumitru, Merticariu, and Baumann 2014). This approach is useful whendealing with very big and complex queries. For evaluation, a rasdaman federation hasbeen deployed in the Amazon Elastic Cloud (EC2) environment. Test queries have beenexecuted in a series of scenarios by varying the number of network nodes up to more than1000. The results indicate good scalability of the system, with processing speed growingalmost linearly with the number of nodes. More information about the testing procedure,used data-sets and queries, as well as detailed results and their interpretation can be foundin Merticariu’s (2014) study.
Ingestion
At the beginning of the EarthServer project, the COMETA Grid infrastructure (Iacono-Manno et al. 2010) was used to aid the processing and ingestion phase of the PlanetaryService (see below Planetary Service section). To accomplish this task, a new Grid virtualorganization (VO) ‘vo.earthserver.eu’ was created and registered in the official EuropeanGrid Infrastructure. Then a set of services and grid applications were developed, dealingwith the overall processing in two separate phases. In the first phase, more than 7100 filescontaining input data for a total of about 0.5 TB were downloaded from NASA dataarchives by several grid jobs, piloted by the COMETA’ Computing Elements and thenstored on the COMETA’ Grid Storage Elements. Each stored file to process was enrichedwith metadata from the AMGA metadata catalog (ARDA Project 2012). In the secondphase, grid jobs were prepared and executed on the COMETA Grid sites to retrieve data
8 P. Baumann et al.
Dow
nloa
ded
by [
83.3
7.14
6.11
2] a
t 07:
19 1
1 M
arch
201
5

according to their metadata, apply transformation algorithms to them, and store the outputback on the COMETA Storage Elements.
Up to 100 worker nodes were allocated to execute the jobs on the grid and the scalingfactor measured was proportional to the number of worker nodes allocated, with aconstant of proportionality close to 1 (the difference is due to the contribution of the jobsubmission time to the total job execution time). Overall, almost 30,000 output files,organized in about 900 directories, have been produced for a total of about 6 TB of data.
Visualization
The service endpoints, offering coverages via WCS and WCPS, can be directly accessedover the web by any compatible client. To make the archives accessible in a more user-friendly and domain-specific way, data services provide a dedicated Web client interface,which builds queries according to user-specified parameter and displays results in agraphical form readily interpretable by the user. Both 2D widget and 3D visualizationlibraries have been made available for client-side interface development. The use of suchclient interfaces makes it as immediate as possible for users to interact with the contentsof the data service archives, including map and graph display of aggregated data resultingfrom queries.
3D client
The EarthServer 3D web client builds on X3DOM (X3DOM, n.d.), an open-sourceframework and runtime for declarative 3D content. The 3D client deeply leverages theadvantage of EarthServer technology: large datasets are split and accessed as smallerchunks and separately inserted into the browser Document Object Model (DOM) tomaintain a high frame rate, thus enabling interactivity.
The client accesses data through OGC protocols like WCPS, WMS, and WCS(Herzig et al. 2013). Various modules turn data into visual representations, and multiplerepresentations are combined in a shared 3D scene. In particular, WCPS, allowingextremely expressive queries, allowed enabling advanced client functionalities such asspecifying different kinds of information for each RGB and alpha channel.
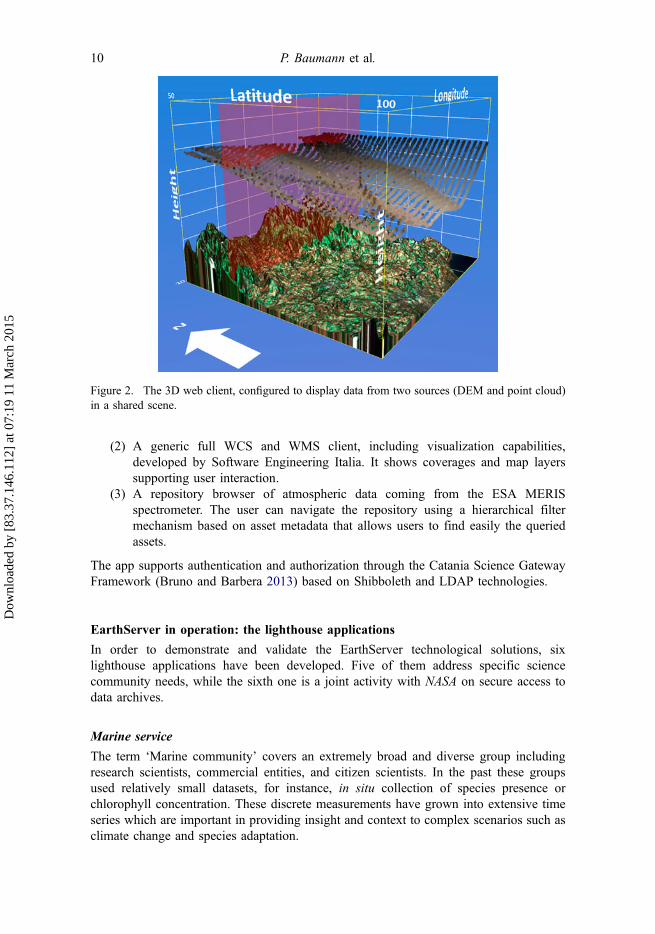
Additional visualization modules exist for point clouds (LIDAR), underground(SHARAD ground-penetrating radar) data, etc. Other features include annotations, axislabels, grids, exaggerations, separation of layers, etc. The outcome demonstrates thathigh-quality, hardware-accelerated, and flexible visualization of multidimensional datacan be realized on the web by combining EarthServer server-side technology andX3DOM client-side technology (Figure 2).
Mobile client
EarthServer provides a mobile application named ‘EarthServer SG Mobile’ built for thetwo main platforms: Android (https://play.google.com/store/apps/details?id=it.infn.ct.earthserverSGmobile) and iOS (https://itunes.apple.com/us/app/earthserver-sg-mobile/id740603213?ls=1&mt=8). The app provides access to a collection of three services(Figure 3):
(1) Access to Climate Data Services provided by the MEEO WCS server. The usercan access a 97-hour forecast, as graph or image animation, since the selecteddate for a location specified or retrieved through the GPS.
International Journal of Digital Earth 9
Dow
nloa
ded
by [
83.3
7.14
6.11
2] a
t 07:
19 1
1 M
arch
201
5
(2) A generic full WCS and WMS client, including visualization capabilities,developed by Software Engineering Italia. It shows coverages and map layerssupporting user interaction.
(3) A repository browser of atmospheric data coming from the ESA MERISspectrometer. The user can navigate the repository using a hierarchical filtermechanism based on asset metadata that allows users to find easily the queriedassets.
The app supports authentication and authorization through the Catania Science GatewayFramework (Bruno and Barbera 2013) based on Shibboleth and LDAP technologies.
EarthServer in operation: the lighthouse applications
In order to demonstrate and validate the EarthServer technological solutions, sixlighthouse applications have been developed. Five of them address specific sciencecommunity needs, while the sixth one is a joint activity with NASA on secure access todata archives.
Marine service
The term ‘Marine community’ covers an extremely broad and diverse group includingresearch scientists, commercial entities, and citizen scientists. In the past these groupsused relatively small datasets, for instance, in situ collection of species presence orchlorophyll concentration. These discrete measurements have grown into extensive timeseries which are important in providing insight and context to complex scenarios such asclimate change and species adaptation.
Figure 2. The 3D web client, configured to display data from two sources (DEM and point cloud)in a shared scene.
10 P. Baumann et al.
Dow
nloa
ded
by [
83.3
7.14
6.11
2] a
t 07:
19 1
1 M
arch
201
5

With the advent and proliferation of remotely sensed data, the creation of larger andlarger datasets has become common place in the marine community. Data are now at highspatial resolutions and available for decadal time series lengths. A single variable timeseries for the North Atlantic could be over 1 TB in size. This creates challenges forstorage, transfer, and analysis.
The dataset selected as the core of the Ocean Data Service (PML 2013a) is the ESAOcean Colour Climate Change Initiative (OC-CCI) chlorophyll time series (Clements andWalker 2013). This global dataset covers a 15-year time series (1998–present) created bymerging the products of three sensors (SeaWiFS, MODIS, MERIS) and is around 17 TBin size). One reason for selecting the OC-CCI dataset is that, as well as the directly sensedand indirectly computed parameters, the dataset contains per pixel metadata describingwhich sensors contributed to the parameter, a nine-class water type classification and twouncertainty estimates for each pixel. Few other ocean color datasets have such anextensive range of per pixel metadata and this provides a great opportunity to demonstrate
Figure 3. Screenshots from the EarthServer Science Gateway Mobile app.
International Journal of Digital Earth 11
Dow
nloa
ded
by [
83.3
7.14
6.11
2] a
t 07:
19 1
1 M
arch
201
5
how a more intelligent data service can be used to generate derived products based oncombining these parameters into a single product in real time.
When creating the Ocean Data Service, the focus was on providing the user with theability to interact with and analyze these large time series of remote-sensed data using aweb-based interface. Data of interest may be selected using a graphical bounding box,and a simple ‘timeline’ has been implemented to allow sections of the time series to beselected using a similar paradigm. This geo-temporal range can then be used for analysisand visualization or data selection for download.
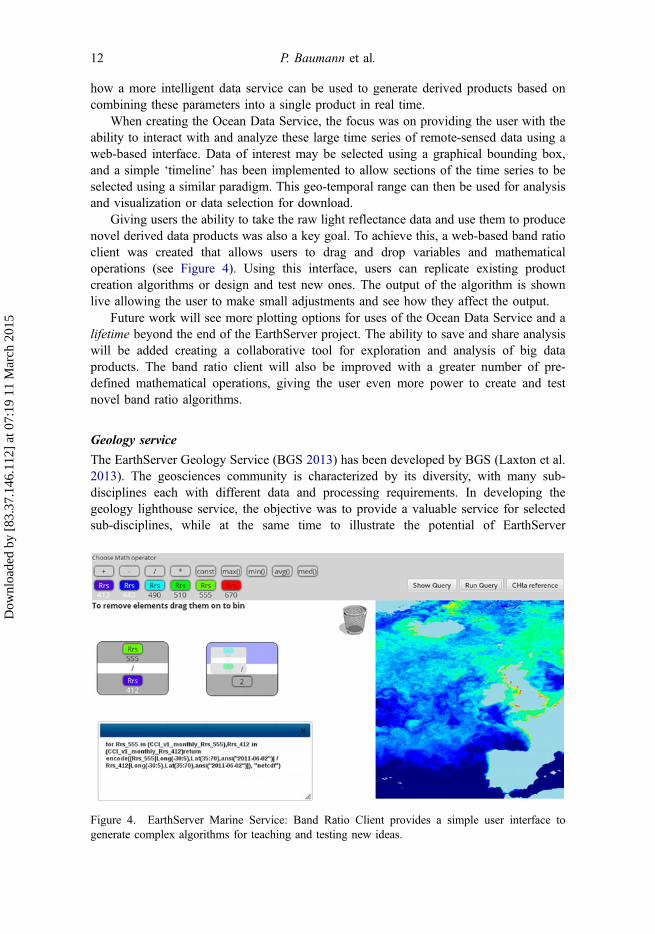
Giving users the ability to take the raw light reflectance data and use them to producenovel derived data products was also a key goal. To achieve this, a web-based band ratioclient was created that allows users to drag and drop variables and mathematicaloperations (see Figure 4). Using this interface, users can replicate existing productcreation algorithms or design and test new ones. The output of the algorithm is shownlive allowing the user to make small adjustments and see how they affect the output.
Future work will see more plotting options for uses of the Ocean Data Service and alifetime beyond the end of the EarthServer project. The ability to save and share analysiswill be added creating a collaborative tool for exploration and analysis of big dataproducts. The band ratio client will also be improved with a greater number of pre-defined mathematical operations, giving the user even more power to create and testnovel band ratio algorithms.
Geology service
The EarthServer Geology Service (BGS 2013) has been developed by BGS (Laxton et al.2013). The geosciences community is characterized by its diversity, with many sub-disciplines each with different data and processing requirements. In developing thegeology lighthouse service, the objective was to provide a valuable service for selectedsub-disciplines, while at the same time to illustrate the potential of EarthServer
Figure 4. EarthServer Marine Service: Band Ratio Client provides a simple user interface togenerate complex algorithms for teaching and testing new ideas.
12 P. Baumann et al.
Dow
nloa
ded
by [
83.3
7.14
6.11
2] a
t 07:
19 1
1 M
arch
201
5

technology to the community as a whole. Geological remote sensing and 3D spatialmodeling were chosen as the two areas that the service would concentrate on.
We carried out a survey of geosciences data providers (Mazzetti et al. 2012) andestablished that most geosciences sub-disciplines have limited experience in the use ofcoverage data, although the application of remotely sensed data to geoscience is wellestablished and large data holdings have been built up by many geosciences organizations(Gupta 2003). Providing easy access to these data holdings, along with the ability topreview datasets for their suitability and carry out some simple pre-processing prior todownload is the use case that the service aims to address.
Traditionally, geological maps were the principal means by which geologicalinformation was disseminated, and in recent times this has developed into the provisionof digital maps and web services. There is an increasing move from geological maps togeological 3D spatial models, to make explicit the implicit geometry on geological maps(Howard et al. 2009). There is a requirement to deliver and visualize 3D models usingweb services and standard browsers (Mazzetti et al. 2012) and the EarthServer geologyservice aimed to address this with particular reference to the 3D spatial models of thesuperficial deposits of the Glasgow area (Monaghan et al. 2014). These models comprise35 gridded surfaces separating geological units, each geological unit having an upper anda lower bounding surface. The remote sensed data available in the service comprises sixband Landsat 7 (Blue, Green, Red, NIR 1, NIR 2, MIR) and three band false color aerialphotography (NIR, green, blue) for the UK. The availability of digital terrain models(DTMs) is important for visualizing and processing both remote-sensed data and models,and the service includes 50 m and 2 m resolution DTMs for the UK. By the end of theproject, the combined data will have a volume of 20 TB.
It is a common feature of geosciences data that differing access constraints apply todifferent datasets. For example, the Landsat data in the geology service can be madefreely available, whereas the aerial photographic data are restricted to use by BGS staffonly. Two models of the superficial deposits of Glasgow were developed, one limited tocentral Glasgow and freely available and another covering a wider area and incorporatingmore data which are restricted to use by members of a user consortium who have signed alicence agreement. In order to address these differing access requirements, parallelservices have been set up with GUIs providing access to different sets of coverages.
The remote-sensed data is accessible through a web GUI which allows spatialselection to be carried out graphically against a range of background maps. The imagesavailable in the chosen area are listed and can be viewed, compared, and overlaid onDTMs in the 3D client to aid selection and download. The images can also be enhancedthrough interactive contrast adjustment (Figure 5) and the enhanced image downloaded.The GUI also provides access to the Glasgow model in the 3D client, where the user canview the model interactively, turn on and off individual surfaces, and increase the verticalexaggeration to enhance the geological features.
Future developments of the service will increase the range of data types available andmove from specific EarthServer interfaces to incorporating coverage services into a rangeof domain-specific portals and applications.
Atmospheric service
The Climate Data Service is the lighthouse application developed by MEEO (MEEO2013) to support the Climate and Atmospheric communities in exploiting the
International Journal of Digital Earth 13
Dow
nloa
ded
by [
83.3
7.14
6.11
2] a
t 07:
19 1
1 M
arch
201
5

heterogeneous multidimensional datasets at regional, European, and global scales (up to5D: x/y/z/time/forecast time, in case of time series of forecasts of three-dimensionalpollutant fields; Mantovani, Barboni and Natali 2013).
The Climate Data Service User Interest Group includes national and internationalauthorities that use a variety of data to analyze environmental phenomena occurring at thedifferent scales numerical model data, Earth Observation satellite products, groundmeasurements of atmospheric and meteo-climatic parameters are used independently (forspecific applications, e.g. air quality monitoring) or simultaneously to improveoperational products as in the case of assimilation of ground measurements and EOproducts into numerical models to improve air quality forecasts (Hirtl et al. 2014).
The common thread is the handling of big data variety and volumes: the expertise ofthe involved communities to manipulate Big Data is already consolidated, with hundredsof gigabytes of data processed and produced every day in operational and researchprocessing chains. Nevertheless, the use of standard interfaces and services for real-timedata manipulation, visualization, and exploitation are still not effective, leaving to offlineprocessing components the role of performing data analysis and providing summary maps(e.g. three-hourly bulletins).
The Climate Data Service enables immediate access and processing capabilities toterabytes of data: the Multi-sensor Evolution Analysis (MEA) graphical user interfaceprovides effective time series data analytic tools powered with WCS/WCPS interfaceoffered by the rasdaman array database (ESA 2014). A powerful infrastructure (+50CPUs, +150 GB RAM, and +20 TB disk space) distributed between the European SpaceAgency and MEEO allows real-time data exploitation on:
Figure 5. EarthServer Geology Service: Contrast adjustment of selected image.
14 P. Baumann et al.
Dow
nloa
ded
by [
83.3
7.14
6.11
2] a
t 07:
19 1
1 M
arch
201
5

(1) pixel basis: permitting the selection of a set of products to be simultaneouslyvisualized and analyzed to investigate relationship of natural and anthropogenicphenomena (see Figure 6);
(2) area of interest basis: permitting the selection of limited or global areas analysisdomains, to superimpose different measurements of the same parameter fromdifferent sources, or to drive the analysis of specific pixels providing ameaningful background map (see Figure 6).
As requested by the Atmospheric Science communities, the Climate Data Service hasbeen enriched with 3D/4D/5D model-derived datasets (e.g. meteorological fields,pollutants maps, etc.) to allow the users implementing advanced access processingservices via WCPS interface (http://earthserver.services.meeo.it/tools/#wcps) – e.g.evaluating cross-comparison of satellite and model data, extract statistical parameters,etc. At present, more than 100 collections, including third-party data (aerosol opticalmaps over the entire globe, provided by ECMWF; meteorological fields and pollutantsconcentrations maps over Europe, Italy and Austria, provided by the SHMI, ENEA, andZAMG, respectively) are available for intensive data exploitation.
By the end of the EarthServer project, the Climate Data Service is providing accessand processing access to over 130 TB of ESA, NASA, and third-party products
Cryospheric service
The Cryospheric Service (EOX 2013) is designed to help the community discover andassess snow cover products (Ungar 2013). It consists of EarthServer infrastructure in thebackground, a synchronization tool between CryoService and the snow cover dataprovider. Furthermore, it is a web client which allows data preprocessing andvisualization.
Figure 6. EarthServer Atmospheric Service: Analysis of aerosol (MACC, MODIS, AATSR) andtemperature (MACC) time series: the AOT anomaly (high values) over China on 21 March 2013 isinvestigated to identify spatial-temporal impacts of meteorological parameters.
International Journal of Digital Earth 15
Dow
nloa
ded
by [
83.3
7.14
6.11
2] a
t 07:
19 1
1 M
arch
201
5

The snow cover products are provided by the FP7 project CryoLand (http://cryoland.eu). The most relevant products are the Fractional Snow Cover (FSC) as well as the SnowWater Equivalent (SWE). Apart from pan-European coverages, CryoLand also producesregional products with a higher resolution which are accessible via the CryosphericService.
Additional data such as various digital elevation models (GTOPO30, SRTM, EU-DEM) and river basin districts (EEA WISE WFD) are available as well. This makes itpossible to combine snow cover data with contour information and aggregating statisticsover certain watershed areas. Watershed areas or drainage basins define areas of landwhere all surface water from precipitation converges into one single point, mostly a river.Estimating the amount of snow in such a watershed area therefore provides usefulinformation for hydrologists or hydroelectric power plants (Figure 7).
Snow products are mainly generated on a daily basis either from optical MODIS/Terraor from a combination of a satellite-based radiometer (DMSP SSM/I from 1987 topresent) and snow depth data provided by ground-based weather stations (ECMWF). Asynchronization script daily checks the availability of new time slices, downloads,ingests, and registers them into the EarthServer infrastructure.
Apart from the mandatory WMS, WCS, and WCPS endpoints (provided byrasdaman), the Cryospheric Service offers EO-WCS (Baumann and Meissl 2010) andEO-WMS (Lankester 2009) endpoints (provided by EOxServer) to the data. The EOapplication profile for WCS is an extension designed to cope with specific needs of EarthObservation data. It adds mandatory metadata like time stamps and footprints as well asextended coverage definitions to represent dataset series or stitched mosaics.
The web application in the front end offers a map interface and two types of widgetsto interact with the data. Selection widgets keep track of user-defined selections throughthe manipulation of the underlying models. Visualization widgets allow rendering ofvarious graphs through heavy use of the D3 JavaScript library (D3 2013). The graphs arerendered using the responses of dynamically generated WCPS queries which are based onthe underlying model data.
Figure 7. EarthServer Cryosphere Service: drainage basin statistics.
16 P. Baumann et al.
Dow
nloa
ded
by [
83.3
7.14
6.11
2] a
t 07:
19 1
1 M
arch
201
5

Per product the user can select various spatial subsets: points of interests, river basindistricts, or bounding boxes. In addition, subsets can be made according to the contourlevels making use of the underlying digital elevation models. To define the temporalsubset, a time slider widget was developed. Here, the user can select the time of interestwhich is then applied to the WCPS query. In addition, the time slider serves as well as avisualization tool for the respective product's temporal distribution.
In the end, the results are visualized via Hovmoeller-like diagrams (Hovmöller 1949)which are well suited to show time series of data coming from various locations, usingthe Cubism D3 plugin (Square 2012). This enables the user to assess the development ofvarious snow cover parameters already aggregated on relevant spatial entities like riverbasin areas.
Planetary service
Planetary data are freely available on relevant archives provided by space agencies, suchas the NASA Planetary Data System (PDS; McMahon 1996) and the ESA PlanetaryScience Archive (PSA; Heather et al. 2013) archives. Their exploitation by thecommunity is limited by the variable amount of calibrated/higher level datasets. Thecomplexity of these multi-experiment, multi-mission datasets is due largely to theheterogeneity of data themselves, rather than their sheer volume.
Orbital – so far – data are best suited for an inclusion in array databases. Most lander-or rover-based remote sensing experiment (and possibly in situ as well) are suitable forsimilar approaches, although the complexity of coordinate reference systems (CRS) ishigher in the latter case.
PlanetServer, the Planetary Service of EarthServer (PlanetServer Home Page 2013) isa state-of-art online data exploration and analysis system based on the Open GeospatialConsortium (OGC) standards for Mars orbital data. It provides access to topographic,panchromatic, multispectral, and hyperspectral calibrated data. It has been underdevelopment at Jacobs University Bremen since October 2011 (Oosthoek et al. 2013).From the beginning of 2013, Software Engineering Italia provided refactoring andrestyling of Planetary Service Client toward a Web 2.0-based application, namely the neoversion, followed by further developments.
Hyperspectral data from Mars currently can only be analyzed offline with relativelycumbersome processing and need to access commercial tools, in addition to the need foropen source desktop/workstation data processing/reduction tools. WCPS allows foronline analysis with a minimal fraction of the bandwidth and storage space needed bytypical planetary image analysis workflows. The service focuses mainly on data from theCompact Reconnaissance Imaging Spectrometer (CRISM; Murchie et al. 2007) on boardthe NASA Mars Reconnaissance Orbiter (MRO). It does also include other imaging data,such as the MRO Context Imager (CTX) camera (Malin et al. 2007) and Mars Express(MEX) High Resolution Stereo Camera (HRSC; Jaumann et al. 2007; Gwinner et al.2010), among others.
While its core focus has been on hyperspectral data analysis through the WCPS(Oosthoek et al. 2013; Rossi and Oosthoek 2013) matched to WMS map delivery, theservice progressively expanded to host also subsurface sounding radar data (Cantini et al.2014). Additionally, both single swath and mosaicked imagery and topographic data wereadded to the service, deriving from the HRSC experiment (Jaumann et al. 2007; Gwinneret al. 2010).
International Journal of Digital Earth 17
Dow
nloa
ded
by [
83.3
7.14
6.11
2] a
t 07:
19 1
1 M
arch
201
5
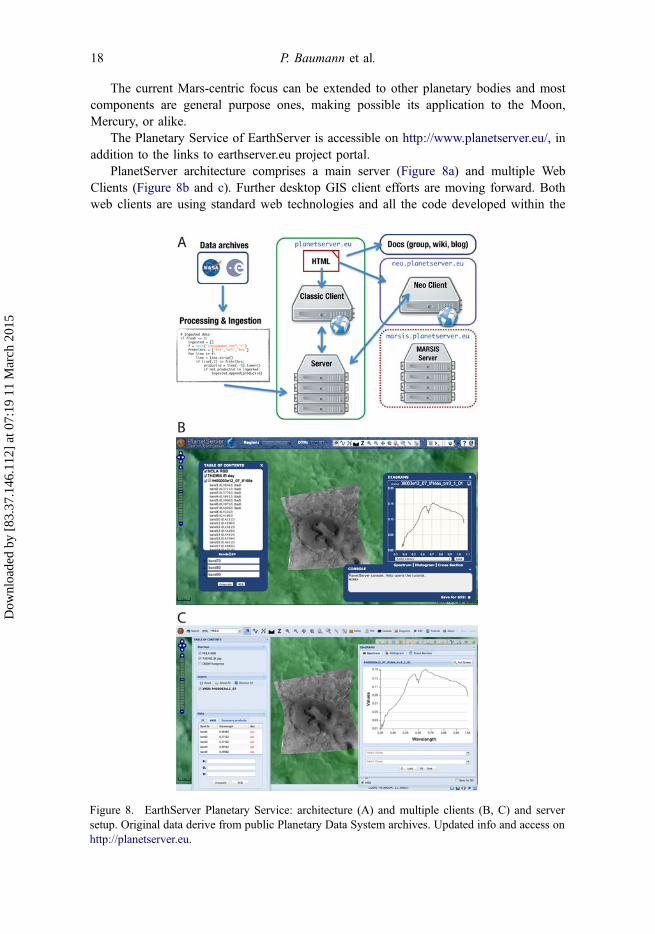
The current Mars-centric focus can be extended to other planetary bodies and mostcomponents are general purpose ones, making possible its application to the Moon,Mercury, or alike.
The Planetary Service of EarthServer is accessible on http://www.planetserver.eu/, inaddition to the links to earthserver.eu project portal.
PlanetServer architecture comprises a main server (Figure 8a) and multiple WebClients (Figure 8b and c). Further desktop GIS client efforts are moving forward. Bothweb clients are using standard web technologies and all the code developed within the
Figure 8. EarthServer Planetary Service: architecture (A) and multiple clients (B, C) and serversetup. Original data derive from public Planetary Data System archives. Updated info and access onhttp://planetserver.eu.
18 P. Baumann et al.
Dow
nloa
ded
by [
83.3
7.14
6.11
2] a
t 07:
19 1
1 M
arch
201
5

project is released on both the project repository and on GitHub on: https://github.com/planetserver.
Secured intercontinental access
Many scientists working on NASA’s Airborne Science programs share common dilemmaswith their colleagues from ESA, and elsewhere on the planet. Datasets collected are large,and often cyclically acquired over the same areas. International collaborations are common,so participating scientists are identified and authenticated by discontinuous realms.
To achieve effective and expeditious results, both dilemmas had to be simultaneouslyaddressed.
A team with members from both the USA and EU assembled a secure, distributed,Identity Management and Service Provisioning system. This system utilizes openstandards developed under the Open Geospatial Consortium (OGC) and Organizationfor the Advancement of Structured Information Standards (OASIS) stewardship.
The identity and service provisioning installation at the NASA Ames Research Centerutilizes a variety of software engines: rasdaman, developed at Jacobs University, Bremen,Germany; MapServer, originally developed at the University of Minnesota, USA; and aShibboleth/SAML2-based Security Engine developed by Secure Dimensions, Munich,Germany.
Recently demonstrated at the GEO-X Plenary in Geneva, the resulting installation, aparticipant in the EU FP7 Cobweb project, allows a user authenticated by any of theparticipants to access data services provided by any of the participants.
The scenario demonstrated in Geneva involved a user, authenticated by EDINA at theUniversity of Edinburgh, who then accessed the NASA server for Unmanned AircraftSystem (UAS) acquired wildfire imagery, the EU server for radar-based elevation data,and combined them in real time, in a browser, to form a 3D landscape.
Standardization impact
EarthServer not only utilizes OGC standards in a rigorous, comprehensive manner, theproject also has direct impact on the development of standards, thereby feeding backexperience from the large-scale deployments done with the Lighthouse Applications.
OGC
We discuss three main areas addressed: advancing the OGC coverage data and servicestandards, combining coverages with GeoSciML, and mapping multidimensionalcoverages to the NetCDF data exchange format.
An online demonstrator (http://standards.rasdaman.org) has been established toexplain OGC WCS, and WCPS use and to promote their uptake by geoservicestakeholders. Further, EarthServer has set up information resources on Wikipedia (http://en.wikipedia.org/wiki/Coverage_data, http://en.wikipedia.org/wiki/Web_Coverage_Service,http://en.wikipedia.org/wiki/Web_Coverage_Processing_Service) and an OGC externalwiki.
GMLCOV, WCS
A coverage, introduced in OGC Abstract Topic 6 (OGC 2007) and ISO 19123 (ISO2005) is the general concept for space-time-varying data, such as regular and irregular
International Journal of Digital Earth 19
Dow
nloa
ded
by [
83.3
7.14
6.11
2] a
t 07:
19 1
1 M
arch
201
5

grids, point clouds, and general meshes. Being high-level and abstract, however, thesestandards are not suitable for interoperable data exchange, and they also largely lackpractice-oriented service functionality.
OGCs concrete coverage concept remedies this. A concise data definition ofcoverages is provided with GMLCOV (Baumann 2012a), allowing conformance testingof data and services down to single pixel level. GMLCOV relies on GML for adescription that can be validated by a machine, but coverages by no means areconstrained to that: any suitable data format – such as JPEG, NetCDF, comma-separatedvalues (CSV) – can be used as well. OGC format profiles define the mapping for eachsuch format. The concrete definition of a coverage, together with a format encodingspecification, allow instances to be created and transmitted among different softwareelements, thus ensuring interoperability: a key aspect to be achieved in modern archivesto foster data dissemination and exploitation.
Any OGC service interface that can handle features – and, as such, the special case ofcoverages – can also offer coverages, for example, WFS, WPS, and SOS. However, thededicated WCS suite offers the most functionality (Baumann 2012b). The WCS coredefines how to access and download a coverage or a cutout of it in some chosen format.WCS extensions add bespoke functionality like band (‘channel’, ‘variable’) extraction,scaling, and processing. They also define communication protocols over which servicescan be addressed, such as GET/KVP, SOAP, and (in future) REST and JSON. A specificfacet is the Web Coverage Processing Service (WCPS) standard which adds an agileanalytics language for spatio-temporal sensor, image, simulation, and statistics data.Figure 9 shows the ‘Big Picture’ of the OGC coverage suite.
In EarthServer, substantial contributions have been made to this framework. Severalextension specifications have been established by Jacobs University and rasdaman GmbH,most of them being implemented in rasdaman. Logically, rasdaman has become the OGC
Figure 9. The OGC coverage suite of standards for spatio-temporal data access.
20 P. Baumann et al.
Dow
nloa
ded
by [
83.3
7.14
6.11
2] a
t 07:
19 1
1 M
arch
201
5

WCS Core Reference Implementation. The conformance tests required to checkimplementations have been developed and given to OGC for free use by all implementers.
Further, EarthServer has significantly enhanced understanding of coverage data whichare not regularly gridded (such as orthoimages or climate datasets). Some special cases ofirregular grids have been described by GML 3.3, and EarthServer has complemented thisto also cover any combination of the GML 3.3 grid types. Point clouds have beenintegrated in WCS, and with rasdaman for the first time grids and point clouds can beserved over the same WCS service interface. General meshes are being studiedconceptually, aiming at a uniform algebraic treatment and a query language (possiblyextending WCPS) for such coverages.
A major conceptual issue that has arisen is the insufficient understanding of the timedimension. Traditionally, time axes have been treated independently and differently fromspatial axes. EarthServer has worked hard to convince OGC of the need for uniformcoordinate reference systems (CRSs) integrating space and time (Baumann et al. 2012). Aparticularly interesting use case is WCS slicing. Assuming a 4D x/y/z/t coverage, userscan obtain any axis subset through slicing. Most such combinations, such as x/t and y/z,are not covered by traditional CRSs. Therefore, a mechanism has been devised whichallows recombination of new CRSs and axes on the fly, based on the URL-based namingscheme used by OGC. A corresponding URL resolver, SECORE, has been implementedand is now in operational use by OGC (Misev, Rusu, and Baumann 2012).
WCPS
Basically, WCPS (P. Baumann, Web Coverage Processing Service (WCPS) Implementa-tion Specification, OGC 08-068 2008) consists of a query language in the tradition ofSQL, but targeted to spatio-temporal coverages and with specific geo-semantics support.The basic query schema consists of a for clause where an iteration variable is bound to aseries of coverages to be inspected in turn. This ‘loop’ can be nested, thereby allowingcombination of different datasets. In the return clause, an expression containing variablereferences is provided which the server evaluates. Scalar results are transmitted back inASCII, coverage-valued results get encoded in some user-selected data format prior tosending. Optionally, a where clause can be added which acts as a filter on the coveragesto be inspected. (Baumann 2010) provides an introductory overview, whereas PML(2013b) offers an online tutorial focusing on the Marine/Ocean domain.
The following example delivers ‘From MODIS scenes ModisScene1, ModisS-cene2, and ModisScene3, the absolute of the difference between red and nir (near-infrared) bands, in NetCDF – but only for those where nir exceeds 127 somewhere withinregion R’:
Listing 2: Sample WCPS query.
International Journal of Digital Earth 21
Dow
nloa
ded
by [
83.3
7.14
6.11
2] a
t 07:
19 1
1 M
arch
201
5

Readers familiar with XQuery will notice that the WCPS syntax is close to thestandard XML query language XQuery (W3C 2014). This is intentional, as metadata intoday’s operational systems typically are represented in XML, and the door shouldremain open for a later integration of both.
In order to include extended coverage notion and to incorporate new functionalityrequested by service operators in WCPS, WCPS 2.0 is under development by JacobsUniversity and rasdaman GmbH, paired by implementation work of ATHENA (cf.Section ‘EarthServer Search Engine and xWCPS’). It addresses: harmonization withGMLCOV and WCS, support for irregular grids, XQuery integration, invocation ofexternal code (e.g. Hadoop) from within a query, an extended operation set, polygonaldata extraction, etc.
GeoSciML
GeoSciML is a GML-based data transfer standard for geoscientific information which istypically shown on geological maps. The geological objects in 3D spatial models are thesame as those on maps and we have investigated the use of GeoSciML to describe themodels delivered by the EarthServer geology service. The objective is to enable queriesagainst both the GeoSciML description and the coverage values such as ‘find allgeological units with a predominant sand lithology within 25 m of the surface’.GeoSciML was incorporated into the coverage metadata where it can be queried usingxWCPS.
NetCDF
NetCDF is a set of software libraries and self-describing, machine-independent dataformats that support the creation, access, and sharing of array-oriented scientific data(UCAR, n.d.). It is maintained by the UNIDATA Program at the University Corporationfor Atmospheric Research (UCAR). As a data model, netCDF is able to accommodatemultidimensional array data types. Specific semantics is provided through conventions;the most widespread convention is the Climate and Forecast convention (CF) widelyadopted especially in the Meteo/Ocean community. CF-netCDF and related specificationsare standardized by the OGC through the OGC CF-netCDF SWG (Domenico 2010,2011). EarthServer contributed in the definition of specifications for the harmonization ofISO coverage types and the netCDF data model (Domenico 2012; Domenico andNativi 2013).
ISO
The ISO SQL database query standard, while originally focusing on table-orientedstructures, has seen several extensions to accommodate further relevant informationstructures. Recently, Jacobs University and rasdaman GmbH jointly proposed to ISO toadd support for multidimensional arrays. As of its meeting in June 2014, ISO/IEC JTC1WG3 has commenced activities on SQL/MDA (Multi-Dimensional Arrays).
Related work
Statistics and image processing tools like R and Matlab have supported processing arraydata types for a considerable time. More recently, desktop tools like the Analysis andDisplay System (GrADS, http://iges.org/grads/) have joined.
22 P. Baumann et al.
Dow
nloa
ded
by [
83.3
7.14
6.11
2] a
t 07:
19 1
1 M
arch
201
5

However, this class of engines is mostly limited to main memory and definitely notscalable to Petabyte sizes. Such scalability is provided with Array Databases (Baumann2009). A more recent approach is SciQL (Kersten et al. 2011) which extends SQL witharray operations, but with a different paradigm where arrays are treated like tables. This isnot expected to scale to millions of arrays, such as satellite image archives. Further,SciQL does not yet have a scalable storage and query evaluation engine. SciDB (n.d.),even more recent, is following a similar approach to SciQL; only a lab prototype isknown today, so scalability is still to be proven. Another class of systems is constrainedto small 2D arrays; PostGIS Raster (Paragon, n.d.), Oracle GeoRaster (Oracle, n.d.), andTeradata arrays (Teradata, n.d.) fall into this category. Hence, rasdaman is the only ArrayDatabase operationally used on multi-TB holdings, fully parallelized, and proven inscalability.
OPeNDAP is a project developing the Hyrax server implementing the DAP (DataAccess Protocol). Based on a procedural array language, Hyrax allows accessing datafiles on local or remote servers while abstracting from the data format, mainly centeringaround NetCDF. Since recently, OPeNDAP supports WCS as well, not yet WCPS,though. There is no evidence, or thought, that the (procedural, so harder to parallelize)OPeNDAP language is supported by adaptive storage organization and parallelization asthe (declarative, so optimizable) WCPS query language is through rasdaman.
MapReduce is often mentioned in the context of Big Data due to its builtinparallelization support. However, MapReduce is not aware of the specific nature of arrayswith the n-D Euclidean neighborhood of array cells – when once cell is used by theapplication it is extremely likely that its direct neighbors will be fetched soon after.Systems like rasdaman support this through adaptive tiling, MapReduce will do onlysplitting of a large array if programmed so by the user. Further, existing algorithms haveto be rewritten into the map() and reduce() functions of this particular approach whichrequires significant effort and skills by the user. With WCPS, on the other hand, a high-level language in the tradition of SQL where the engine determines at runtime andindividually how to distribute load between nodes. Finally, MapReduce assumes ahomogeneous operational interface – no case has been reported where requests have beendistributed over independent data centers with heterogeneous hardware, as has been donewith rasdaman in EarthServer where ad-hoc data fusion between a NASA and an ESAserver has been demonstrated.
Aside from such general-purpose techniques, dedicated tools have been implemented.The NOAA Live Access Server (LAS, http://ferret.pmel.noaa.gov/LAS) is a highlyconfigurable web server designed to provide flexible access to geo-referenced scientificdata. Capabilities include access to distributed datasets, visualization capabilities, andconnectors to common science tools. It seems, though, that LAS does not offer a flexiblequery language with internal parallelization. Also, it does not support any of the OGC‘Big Geo Data’ standards WCS and WCPS.
Conclusions
The EarthServer infrastructure provides a fully functional, production-level set of flexibleand interoperable data services, fully committed to the OGC coverage standards suite andthe OGC WCPS query language that can be leveraged to effectively filter, extract, andprocess coverage data. Such data, depending on the chosen encoding, is suitable forimmediate visualization or for further processing (e.g. making the services directly usable
International Journal of Digital Earth 23
Dow
nloa
ded
by [
83.3
7.14
6.11
2] a
t 07:
19 1
1 M
arch
201
5

as data elements for a staged processor). This approach also avoids the need to locate,download and access data files in native format or the need to process them with specific(dataset dependent) tools or custom written programs, in favor of a flexible query language,over a unified data model. Finally, parameterization of a query is straightforward, thusenhancing client-side integration and ease of development.
These capabilities have been demonstrated in implementation of several largeLighthouse applications, each covering a specific Earth Sciences domain and bringinglarge datasets and differing community needs.
Disclosure statementNo potential conflict of interest was reported by the authors.
FundingThe research leading to these results has received funding from the European Community undergrant agreement 283610 EarthServer.
ReferencesAiordachioaie, Andrei, and Peter Baumann. 2010. “PetaScope: An Open-source Implementation of
the OGC WCS Geo Service Standards Suite.” In Proceedings of the 22nd InternationalConference on Scientific and Statistical Database Management, edited by Michael, Gertz, andBertram Ludäscher, 160–168. Heidelberg: Springer.
ARDA Project. 2012. AMGA – Overview. Aprile 16. http://amga.web.cern.ch/amga/.“Array DBMS.” 2014. Wikipedia, Agosto 20. http://en.wikipedia.org/wiki/Array_DBMS.Bargellini, Pier, Cheli Simonetta, Yves-Louis Desnos, Bruno Greco, veronica Guidetti, Marchetti
Pier Giorgio, Carmen Comparetto, Stefano Nativi, and Geoff Sawyer. 2013. Big Data fromSpace – Event Report. Frascati: ESA. http://www.congrexprojects.com/docs/default-source/13c10_docs/13c10_event_report.pdf?sfvrsn=2.
Baumann, Peter. 1994. “Management of Multidimensional Discrete Data.” The VLDB Journal3 (4): 401–444. doi:10.1007/BF01231603.
Baumann, Peter. 2008. Web Coverage Processing Service (WCPS) Implementation Specification,OGC 08-068. Version 1.0. OGC. http://www.opengeospatial.org/standards/.
Baumann, P. 2009. “Array Databases and Raster Data Management.” In Encyclopedia of DatabaseSystems, edited by L. Liu, and T. Özsu. Heidelberg: Springer. www.opengeospatial.org/standards/.
Baumann, Peter. 2010. “The OGC Web Coverage Processing Service (WCPS) Standard.”Geoinformatica 14 (4): 447–479. doi:10.1007/s10707-009-0087-2.
Baumann, Peter. 2012a. “OGC GML Application Schema – Coverages.” OGC 09-146r2. Version1.0. OGC.
Baumann, Peter. 2012b. “OGC® WCS 2.0 Interface Standard – Core.” OGC 09-110r4. Version2.0. OGC.
Baumann, Peter, Piero Campalani, Jinsongdi Yu, and Dimitar Misev. 2012. “Finding My CRS: ASystematic Way of Identifying CRSs.” In Proceedings of the 20th International Conference onAdvances in Geographic Information Systems, 71–78. Redondo Beach, CA: ACM, ISBN 978-1-4503-1697-2.
Baumann, Peter, Bill Howe, Kjell Orsborn, and Silvia Stefanova. 2011. “EDBT/ICDT Workshop onArray Databases.” Proceedings of 2011 EDBT/ICDT Workshop on Array Databases, Uppsala,Sweden.
Baumann, Peter, and Stephan Meissl. 2010. OGC WCS 2.0 Application Profile Earth Observation.OGC 10-140. Version 1.0. OGC.
BGS. 2013. Geology Service Home Page. British Geological Survey. Accessed September 1, 2013.http://earthserver.bgs.ac.uk/.
24 P. Baumann et al.
Dow
nloa
ded
by [
83.3
7.14
6.11
2] a
t 07:
19 1
1 M
arch
201
5

Bruno, Riccardo, and Roberto Barbera. 2013. “The EarthServer Project and Its LighthouseApplications: Exploiting Science Gateways and Mobile Clients for Big Earth Data Analysis.” InProceedings International Symposium on Grids and Clouds (ISGC). Taipei: Academia Sinica.
Cantini, Federico, Angelo Pio Rossi, Roberto Orosei, Peter Baumann, Dimitar Misev, JelmerOosthoek, Alan Beccati, Piero Campalani, and Vikram Unnitan. 2014. MARSIS Data andSimulation Exploited Using Array Databases: PlanetServer/EarthServer for Sounding Radars.Vienna: Geophysical Research Abstracts.
Clements, Oliver, and Peter Walker. 2013. EarthServer Project Deliverable D240.12. Ply-mouth: PML.
D3. 2013. Data-Driven Documents. Accessed 2014. http://d3js.org/.Domenico, Ben. 2010. OGC CF-netCDF Core and Extensions Primer. OGC 10-091r1. Version
1.0. OGC.Domenico, Ben. 2011. OGC Network Common Data form (NetCDF) Core Encoding Standard
Version 1.0. OGC. http://portal.opengeospatial.org/files/?artifact_id=43732.Domenico, Ben. 2012. OGC Network Common Data form (NetCDF) NetCDF Enhanced Data
Model Extension Standard. OGC. https://portal.opengeospatial.org/files/?artifact_id=50294.Domenico, Ben, and Stefano Nativi. 2013. CF-netCDF3 Data Model Extension Standard. OGC.
https://portal.opengeospatial.org/files/?artifact_id=51908.Dumitru, A., V. Merticariu, P. Baumann. 2014. Exploring Cloud Opportunities from an Array
Database Perspective. Snowbird, USA: Proceeding of the ACM SIGMOD Workshop on Dataanalytics in the Cloud (DanaC’2014).
EOX. 2013. CryoService Home Page. EOX. Accessed September 1, 2013. http://earthserver.eox.at.ESA. 2014. Multi-sensor Evolution Analysis. 28 Aprile. http://wiki.services.eoportal.org/tiki-index.
php?page=Multi-sensor+Evolution+Analysis.Gupta, R. P. 2003. Remote Sensing Geology. Berlin: Springer.Gwinner, Klaus, Frank Scholten, Frank Preusker, Stephan Elgner, Thomas Roatsch, Michael
Spiegel, Ralph Schmidt, Jurgen Oberst, Ralf Jaumann, and Christian Heipke. 2010. “Topographyof Mars from Global Mapping by HRSC High-resolution Digital Terrain Models andOrthoimages: Characteristics and Performance.” Earth and Planetary Science Letters 294 (3):506–519. doi:10.1016/j.epsl.2009.11.007.
Heather, David J, Maud Barthelemy, Nicolas Manaud, Santa Martinez, Marek Szumlas, Jose LuisVazquez, and Pedro Osuna. 2013. “ESA’s Planetary Science Archive: Status, Activities andPlans.” European Planetary Science Congress. http://www.epsc2013.eu/.
Herzig, Pasquale, Michael Englert, Sebastian Wagner, and Yvonne Jung. 2013. “X3D-Earth-Browser: Visualize Our Earth in Your Web Browser.” Web3D’13 Proceedings of the 18thInternational Conference on 3D Web Technology. San Sebastian: ACM New York.
Hey, Tony, and Anne E. Trefethen. 2002. “The UK e-Science Core Programme and the Grid.”International Journal for e-Learning Security (IJeLS) 1 (1/2): 1017–1031.
Hirtl, Marcus, Simone Mantovani, Bernd C. Krüger, Gerhard Triebnig, Claudia Flandorfer, andMaurizio Bottoni. 2014. “Improvement of Air Quality Forecasts with Satellite and Ground BasedParticulate Matter Observations.” Atmospheric Environment 1: 20–27.
Houghton, Nigel. 2013. “ESA Reprocessing. A Service Based Approach.” Big Data from Space.Frascati. http://www.congrexprojects.com/docs/default-source/13c10_docs/session-2a.zip.
Hovmöller, Ernest. 1949. “The Trough-and-Ridge Diagram.” Tellus 1 (2): 62–66.Howard, Andrew, Bill Hatton, Femke Reitsma, and Kenneth Lawrie. 2009. “Developing a
Geoscience Knowledge Framework for a National Geological Survey Organisation.” Computersand Geosciences 35 (4): 820–835.
Iacono-Manno, Marcello, Marco Fargetta, Roberto Barbera, Alberto Falzone, Giuseppe Andronico,Salvatore Monforte, Annamaria Muoio, et al. 2010. “The Sicilian Grid Infrastructure for HighPerformance Computing.” International Journal of Distributed Systems and Technologies 1:40–54.
ISO. 2005. Geographic Information – Schema for Coverage Geometry and Functions. ISO19123:2005.
Jacobs University Bremen and Rasdaman GmbH. 2013. Rasdaman Project, Standards andDemonstrator Page. Accessed September 15, 2013. http://standards.rasdaman.org/.
Jaumann, Ralf, Gerhard Neukum, Thomas Behnke, Thomas C. Duxbury, Karin Eichentopf,Joachim Flohrer, Stephan van Gasselt, et al. 2007. “The High-resolution Stereo Camera (HRSC)
International Journal of Digital Earth 25
Dow
nloa
ded
by [
83.3
7.14
6.11
2] a
t 07:
19 1
1 M
arch
201
5

Experiment on Mars Express: Instrument Aspects and Experiment Conduct from InterplanetaryCruise Through the Nominal Mission.” Planetary and Space Science 55 (7): 928–952.
Kakaletris, George, Panagiota Koltsida, Thanassis Perperis, and Peter Baumann. 2013. EarthServerProject Deliverable, Query Language Pilot, D330.12. EarthServer Project.
Kersten, M., Y. Zhang, M. Ivanova, and N. Nes. 2011. “SciQL, a Query Language for ScienceApplications.” Proceedings of the Workshop on Array Databases, Uppsala.
Laney, Doug. 2001. 3D Data Management. Controlling Data Volume, Velocity, and Variety inApplication Delivery Strategy. Stamford: META Group.
Lankester, Thomas. 2009. OpenGIS Web Map Services – Profile for EO Products. OGC 07-063r1.Laxton, John, Marcus Sen, James Passmore, and Simon Burden. 2013. EarthServer Project
Deliverable D250.11, OGC 07-063r1. Nottingham: BGS.Malin, Michael C., James F. Bell, Bruce A. Cantor, Michael A. Caplinger, Wendy M. Calvin, Robert
Todd Clancy, Kenneth S. Edgett, et al. 2007. “Context Camera Investigation on Board the MarsReconnaissance Orbiter.” Journal of Geophysical Research: Planets 112: 2156–2202. doi:10.1029/2006JE002808.
Mantovani, Simone, Damiano Barboni, and Stefano Natali. 2013. EarthServer Project DeliverableD230.12. Ferrara: MEEO.
Mazzetti, Paolo, Angelo Pio Rossi, Oliver Clements, Simone Mantovani, Stefano Natali, MariaGrazia Veratelli, Joachim Ungar, and John Laxton. 2013. Community Reporting. EarthServerDeliverable D120.21.
Mazzetti, Paolo, John Laxton, Maria Grazia Veratelli, and Mike Grant. 2012. CommunityReporting. EarthServer Deliverable D120.21.
McMahon, Susan K. 1996. “Overview of the Planetary Data System.” Planetary and Space Science44 (1): 3–12.
MEEO. 2013. Climate Data Service Home Page. MEEO. Accessed September 1, 2013. http://earthserver.services.meeo.it/.
Merticariu, George. 2014. “Keeping 1001 Nodes Busy.” BSc diss., Bremen: Jacobs University.Misev, Dimitar, Mihaela Rusu, and Peter Baumann. 2012. “A Semantic Resolver for Coordinate
Reference Systems.” Proceedings of 11th International Symposium on Web and WirelessGeographical Information Systems (W2GIS), 47–56. Naples: Springer.
Monaghan, A. A., S. L. B. Arkley, K. Whitbread, and M. McCormac. 2014. Clyde SuperficialDeposits and Bedrock Models Released to the ASK Network 2014: A Guide for Users. Version 3.Nottingham: British Geological Survey.
Murchie, Scott L., Raymond E. Arvidson, Peter Bedini, K. Beisser, J. P. Bibring, J. Bishop, J.Boldt, et al. 2007. “Compact Reconnaissance Imaging Spectrometer for Mars (CRISM) on MarsReconnaissance Orbiter (MRO).” Journal of Geophysical Research: Planets 112 (E5): 2156–2202. doi:10.1029/2006JE002682.
OGC. 2007. Abstract Specification Topic 6: Schema for Coverage Geometry and Functions. OGC07-011. Version 7.0. OGC.
Oosthoek, J. H. P., J. Flahaut, A. P. Rossi, P. Baumann, D. Misev, P. Campalani, and V. Unnithan.2013. “PlanetServer: Innovative Approaches for the Online Analysis of Hyperspectral.”Advances in Space Research 23 (12): 1858–1871. doi:10.1016/j.asr.2013.07.002.
Oracle. n.d. Accessed June 10, 2014. http://www.oracle.com.Paragon. n.d. PostGIS. Accessed June 10, 2014. http://www.postgis.org.Petitdidier, Monique, Roberto Cossu, Paolo Mazzetti, Peter Fox, Horst Schwichtenberg, and Wim
Som de Cerff. 2009. “Grid in Earth Sciences.” Earth Science Informatics 2: 1–3.PML. 2013a. Ocean Data Service Home Page. PML. Accessed September 1, 2013. http://
earthserver.pml.ac.uk/portal.PML. 2013b. WCPS How to Pages (EarthServer: Ocean Data Service). Accessed September 14,
2013. http://earthserver.pml.ac.uk/portal/how_to/.“Rasdaman.” 2013. Wikipedia, December 29. http://en.wikipedia.org/wiki/Rasdaman.Rasdaman GmbH. 2013. Rasdaman Query Language Guide. 8.4 ed., 91. Bremen: Rasdaman GmbH.Rossi, Angelo Pio, and Jelmer Oosthoek. 2013. EarthServer Project Deliverable D260.12. Bremen:
Jacobs University Bremen.Sarawagi, Sunita, and Michael Stonebraker. 1994. “Efficient Organization of Large Multidimen-
sional Arrays.” Proceedings of the 11th IEEE ICDE Conference, Hannover, Germany, 328–336.SciDB. n.d. SciDB. Accessed June 10, 2014. http://www.scidb.org.
26 P. Baumann et al.
Dow
nloa
ded
by [
83.3
7.14
6.11
2] a
t 07:
19 1
1 M
arch
201
5

Square. 2012. Cubism.js. https://square.github.io/cubism/.Teradata. n.d. Accessed June 10, 2014. http://www.teradata.com.UCAR. n.d. Network Common Data Form (NetCDF). Accessed March 27, 2014. http://www.
unidata.ucar.edu/software/netcdf/.Ungar, Joachim. 2013. EarthServer Project Deliverable D220.12. Wien: EOX.W3C. 2014. “XQuery 3.0: An XML Query Language.” http://www.w3.org/TR/2014/REC-xquery-
30-20140408/.X3DOM. n.d. x3dom Homepage. http://www.x3dom.org.
International Journal of Digital Earth 27
Dow
nloa
ded
by [
83.3
7.14
6.11
2] a
t 07:
19 1
1 M
arch
201
5