VERISK ANALYTICS, INC.
111
Table of Contents UNITED STATES SECURITIES AND EXCHANGE COMMISSION Washington, D.C. 20549 FORM 10-K ☑ ANNUAL REPORT PURSUANT TO SECTION 13 OR 15(d) OF THE SECURITIES EXCHANGE ACT OF 1934 For the fiscal year ended December 31, 2021 or ☐ TRANSITION REPORT PURSUANT TO SECTION 13 OR 15(d) OF THE SECURITIES EXCHANGE ACT OF 1934 For the transition period from to Commission file number 001-34480 VERISK ANALYTICS, INC. (Exact name of registrant as specified in its charter) Delaware 26-2994223 (State or other jurisdiction of incorporation or organization) (I.R.S. Employer Identification No.) 545 Washington Boulevard Jersey City NJ 07310-1686 (Address of principal executive offices) (Zip Code) (201) 469-3000 (Registrant’s telephone number, including area code) Securities registered pursuant to Section 12(b) of the Act: Title of each class Trading Symbol Name of each exchange on which registered Common Stock $.001 par value VRSK NASDAQ Global Select Market Securities registered pursuant to Section 12(g) of the Act: None Indicate by check mark if the registrant is a well-known seasoned issuer, as defined in Rule 405 of the Securities Act. ☑ Yes ☐ No Indicate by check mark if the registrant is not required to file reports pursuant to Section 13 or Section 15(d) of the Act. ☐ Yes ☑ No Indicate by check mark whether the registrant (1) has filed all reports required to be filed by Section 13 or 15(d) of the Securities Exchange Act of 1934 during the preceding 12 months (or for such shorter period that the registrant was required to file such reports), and (2) has been subject to such filing requirements for the past 90 days. ☑ Yes ☐ No Indicate by check mark whether the registrant has submitted electronically every Interactive Data File required to be submitted pursuant to Rule 405 of Regulation S-T (§ 232.405 of this chapter) during the preceding 12 months (or for such shorter period that the registrant was required to submit such files). ☑ Yes ☐ No Indicate by check mark whether the registrant is a large accelerated filer, an accelerated filer, a non-accelerated filer, a smaller reporting company or an emerging growth company. See the definitions of “large accelerated filer,” “accelerated filer”, “smaller reporting company” and “emerging growth company” in Rule 12b-2 of the Exchange Act. Large accelerated filer ☑ Accelerated filer ☐ Non-accelerated filer ☐ Smaller reporting company ☐ Emerging growth company ☐ If an emerging growth company, indicate by check mark if the registrant has elected not to use the extended transition period for complying with any new or revised financial accounting standards provided pursuant to Section 13(a) of the Exchange Act. ☐ Indicate by check mark whether the registrant has filed a report on and attestation to its management's assessment on the effectiveness of its internal control over financial reporting under Section 404(b) of the Sarbanes-Oxley Act (15 U.S.C. 7262(b)) by the registered public accounting firm that prepared or issued its audit report. ☑ Indicate by check mark whether the registrant is a shell company (as defined in Rule 12b-2 of the Act). ☐ Yes ☑ No As of June 30, 2021, the last business day of the registrant’s most recently completed second fiscal quarter, the aggregate market value of the registrant’s common stock held by non-affiliates of the registrant was $27,228,949,452 based on the closing price reported on the NASDAQ Global Select Market on such date. As of February 18, 2022, there were 161,282,942 shares outstanding of the registrant's Common Stock, par value $.001. DOCUMENTS INCORPORATED BY REFERENCE Certain information required by Part III of this annual report on Form 10-K is incorporated by reference to our definitive Proxy Statement for our 2022 Annual
-
Upload
khangminh22 -
Category
Documents
-
view
2 -
download
0
Transcript of VERISK ANALYTICS, INC.

Table of Contents
UNITED STATES
SECURITIES AND EXCHANGE COMMISSIONWashington, D.C. 20549
FORM 10-K ☑ ANNUAL REPORT PURSUANT TO SECTION 13 OR 15(d) OF THE SECURITIES EXCHANGE ACT OF 1934
For the fiscal year ended December 31, 2021or
☐ TRANSITION REPORT PURSUANT TO SECTION 13 OR 15(d) OF THE SECURITIES EXCHANGE ACT OF 1934
For the transition period from to Commission file number 001-34480
VERISK ANALYTICS, INC. (Exact name of registrant as specified in its charter)
Delaware 26-2994223
(State or other jurisdiction ofincorporation or organization)
(I.R.S. EmployerIdentification No.)
545 Washington Boulevard
Jersey City NJ 07310-1686
(Address of principal executive offices) (Zip Code)
(201) 469-3000(Registrant’s telephone number, including area code)
Securities registered pursuant to Section 12(b) of the Act:
Title of each class Trading Symbol Name of each exchange on which registeredCommon Stock $.001 par value VRSK NASDAQ Global Select Market
Securities registered pursuant to Section 12(g) of the Act: NoneIndicate by check mark if the registrant is a well-known seasoned issuer, as defined in Rule 405 of the Securities Act. ☑ Yes ☐ NoIndicate by check mark if the registrant is not required to file reports pursuant to Section 13 or Section 15(d) of the Act. ☐ Yes ☑ NoIndicate by check mark whether the registrant (1) has filed all reports required to be filed by Section 13 or 15(d) of the Securities Exchange Act of 1934 during thepreceding 12 months (or for such shorter period that the registrant was required to file such reports), and (2) has been subject to such filing requirements for thepast 90 days. ☑ Yes ☐ NoIndicate by check mark whether the registrant has submitted electronically every Interactive Data File required to be submitted pursuant to Rule 405 of RegulationS-T (§ 232.405 of this chapter) during the preceding 12 months (or for such shorter period that the registrant was required to submit such files). ☑ Yes ☐ NoIndicate by check mark whether the registrant is a large accelerated filer, an accelerated filer, a non-accelerated filer, a smaller reporting company or an emerginggrowth company. See the definitions of “large accelerated filer,” “accelerated filer”, “smaller reporting company” and “emerging growth company” in Rule 12b-2of the Exchange Act. Large accelerated filer ☑ Accelerated filer ☐ Non-accelerated filer ☐ Smaller reporting company ☐ Emerging growth company ☐If an emerging growth company, indicate by check mark if the registrant has elected not to use the extended transition period for complying with any new orrevised financial accounting standards provided pursuant to Section 13(a) of the Exchange Act. ☐Indicate by check mark whether the registrant has filed a report on and attestation to its management's assessment on the effectiveness of its internal control overfinancial reporting under Section 404(b) of the Sarbanes-Oxley Act (15 U.S.C. 7262(b)) by the registered public accounting firm that prepared or issued its auditreport. ☑Indicate by check mark whether the registrant is a shell company (as defined in Rule 12b-2 of the Act). ☐ Yes ☑ No As of June 30, 2021, the last business day of the registrant’s most recently completed second fiscal quarter, the aggregate market value of the registrant’s commonstock held by non-affiliates of the registrant was $27,228,949,452 based on the closing price reported on the NASDAQ Global Select Market on such date. As of February 18, 2022, there were 161,282,942 shares outstanding of the registrant's Common Stock, par value $.001.
DOCUMENTS INCORPORATED BY REFERENCE
Certain information required by Part III of this annual report on Form 10-K is incorporated by reference to our definitive Proxy Statement for our 2022 Annual

Meeting of Stockholders, which will be filed with the Securities and Exchange Commission not later than 120 days after December 31, 2021.
1

Table of Contents
INDEX PagePART I Item 1. Business 4 Item 1A. Risk Factors 16 Item 1B. Unresolved Staff Comments 26 Item 2. Properties 26 Item 3. Legal Proceedings 26 Item 4. Mine Safety Disclosures 26 PART II Item 5. Market for Registrant’s Common Equity, Related Stockholder Matters and Issuer Purchases of Equity Securities 27 Item 6. [Reserved] 29 Item 7. Management’s Discussion and Analysis of Financial Condition and Results of Operations 30 Item 7A. Quantitative and Qualitative Disclosures About Market Risk 45 Item 8. Consolidated Financial Statements and Supplementary Data 45 Consolidated Balance Sheets 54 Consolidated Statements of Operations 55 Consolidated Statements of Comprehensive Income 56 Consolidated Statements of Changes in Stockholders' Equity 57 Consolidated Statements of Cash Flows 58 Notes to Consolidated Financial Statements 60 Item 9. Changes in and Disagreements with Accountants on Accounting and Financial Disclosure 45 Item 9A. Controls and Procedures 46 Item 9B. Other Information 49 Item 9C Disclosure Regarding Foreign Jurisdictions that Prevent Inspections PART III Item 10. Directors, Executive Officers and Corporate Governance 49 Item 11. Executive Compensation 49 Item 12. Security Ownership of Certain Beneficial Owners and Management and Related Stockholder Matters 49 Item 13. Certain Relationships and Related Transactions and Director Independence 49 Item 14. Principal Accounting Fees and Services 49 PART IV Item 15. Exhibits and Financial Statement Schedule 50 Item 16. Form 10-K Summary 50 EXHIBIT INDEX 97 SIGNATURES 100 Exhibit 21.1 Exhibit 23.1 Exhibit 31.1 Exhibit 31.2 Exhibit 32.1
2
Table of Contents Unless the context otherwise indicates or requires, as used in this annual report on Form 10-K, references to “we,” “us,” “our” or the “Company” refer toVerisk Analytics, Inc. and its subsidiaries. In this annual report on Form 10-K, all dollar amounts are expressed in millions, unless indicated otherwise.
SPECIAL NOTE REGARDING FORWARD-LOOKING STATEMENTS
Verisk Analytics, Inc. ("Verisk") has made statements under the captions “Business,” “Risk Factors,” “Management’s Discussion and Analysis ofFinancial Condition and Results of Operations,” and in other sections of this annual report on Form 10-K that are forward-looking statements. In some cases, youcan identify these statements by forward-looking words such as “may,” “might,” “will,” “should,” “expects,” “plans,” “anticipates,” “believes,” “estimates,”“predicts,” “potential,” or “continue,” the negative of these terms and other comparable terminology. These forward-looking statements, which are subject to risks,uncertainties and assumptions about us, may include projections of our future financial performance, our anticipated growth strategies, and anticipated trends in ourbusiness. These statements are only predictions based on our current expectations and projections about future events. There are important factors that could causeour actual results, level of activity, performance, or achievements to differ materially from the results, level of activity, performance, or achievements expressed orimplied by the forward-looking statements, including those factors discussed under the caption entitled “Risk Factors.” You should specifically consider thenumerous risks outlined under “Risk Factors.”
Although we believe the expectations reflected in the forward-looking statements are reasonable, we cannot guarantee future results, level of activity,
performance, or achievements. Moreover, neither we nor any other person assumes responsibility for the accuracy and completeness of any of these forward-looking statements. We are under no duty to update any of these forward-looking statements after the date of this annual report on Form 10-K to conform our priorstatements to actual results or revised expectations.
3

Table of Contents
PART I
Item 1. Business Our Company
Verisk is a leading data analytics provider serving customers in insurance, energy and specialized markets, and financial services. Using advancedtechnologies to collect and analyze billions of records, we draw on unique data assets and deep domain expertise to provide innovations that may be integrated intocustomer workflows. We offer predictive analytics and decision support solutions to customers in rating, underwriting, claims, catastrophe and weather risk,natural resources intelligence, economic forecasting, commercial banking and finance, and many other fields. In the United States ("U.S.") and around the world,we help customers protect people, property, and financial assets.
Our customers use our solutions to make better decisions about risk and opportunities with greater efficiency and discipline. We refer to these products
and services as solutions due to the integration among our services and the flexibility that enables our customers to purchase components or a comprehensivepackage. These solutions take various forms, including proprietary data assets, expert industry insight, statistical models, tailored analytic object, and robustsoftware platforms all designed to allow our customers to make more informed risk decisions. We believe our solutions for analyzing risk have a positive impacton our customers’ revenues and help them better manage their costs. In 2021, our customers included all of the top 100 property and casualty ("P&C") insuranceproviders in the U.S. for the lines of P&C services we offer and the top 30 credit card issuers in North America, the United Kingdom, and Australia as well asnine of the top ten global energy producers around the world. We also work with a wide range of companies, governments, and institutions across the energy andmetals and mining value chains. We believe that our commitment to our customers and the embedded nature of our solutions serve to strengthen and extend ourrelationships.
We believe that Verisk is uniquely positioned because of the set of Distinctives or competitive advantages we cultivate and continue to expand, as
indicated below. Our existing businesses, in addition to new product innovations, integrate the following four singular qualities into the foundation of our strategy. Our Distinctives
•Unique Data Assets - Data is at the core of what we do. We use our proprietary data assets to develop predictive analytics and transformative models forour customers.
•Deep Domain Expertise - We have specialized and in-depth knowledge in a number of defined vertical markets, including insurance, energy, financial
services, and risk management. We understand that different verticals require different approaches, and our deep domain expertise adds value to our analytics inthe markets we serve.
•Steady Stream of First-to-Market Innovations - We move quickly to be the first to market with new solutions. Typically, the marketplace assumes that
those who are first to market are superior to the competition and better positioned to succeed. •Deep Integration into Customer Workflows - By embedding our solutions into customer workflows, we help our customers better manage risk and
optimize their bottom line. We achieve this goal by remaining closely connected to our customers at all times and serving their distinct needs. We offer our solutions and services primarily through annual subscriptions or long-term agreements, which are typically prepaid and represented over
81% of our revenues in 2021. For the year ended December 31, 2021, we had revenues of $2,998.6 million and net income of $666.3 million. For the five-yearperiod ended December 31, 2021, our consolidated revenues grew at a compound annual growth rate ("CAGR") of 8.7% and our net income grew at 4.7%.
Our History
We trace our history to 1971, when Insurance Services Office, Inc. ("ISO") started operations as a not-for-profit advisory and rating organizationproviding services to the U.S. P&C insurance industry. ISO was formed as an association of insurance companies to gather statistical data and other informationfrom insurers and report to regulators, as required by law. ISO’s original functions also included developing programs to help insurers define and manageinsurance products and providing information to help insurers determine their own independent premium rates. Insurers used and continue to use our offeringsprimarily in their product development, underwriting, and rating functions.
On May 23, 2008, in contemplation of our initial public offering ("IPO"), ISO formed Verisk Analytics, Inc. ("Verisk"), a Delaware corporation, to be the
holding company for our business. Verisk was initially formed as a wholly owned subsidiary of ISO. On October 6, 2009, in connection with our IPO, we effecteda reorganization whereby ISO became a wholly owned subsidiary of Verisk. Verisk common stock began trading on the NASDAQ Global Select Market onOctober 7, 2009, under the ticker symbol “VRSK.”
4
Table of Contents Over the past two decades, we have transformed our business beyond its original functions by deepening and broadening our data assets, developing a set
of integrated risk management solutions and services, and addressing new markets. Our expansion into analytics began when we acquired the American InsuranceServices Group ("AISG") and certain operations and assets of the National Insurance Crime Bureau in 1997 and 1998, respectively. Those organizations brought tothe company large databases of insurance claims as well as expertise in detecting and preventing claims fraud. To further expand our business, in 2002, weacquired AIR Worldwide ("AIR"), the technological leader in catastrophe modeling. In 2006, to bolster our position in the insurance claims field, we acquiredXactware Solutions Inc., a leading supplier of estimation software for professionals involved in building repair and reconstruction. In 2012, we acquired ArgusInformation & Advisory Services, LLC ("Argus") to expand our global presence providing information, competitive benchmarking, analytics, and customizedservices to financial institutions in the payments space. In 2015, we acquired Wood Mackenzie Limited ("Wood Mackenzie") to advance our strategy to expandinternationally and position us in the global energy market. In 2017, we acquired G2 Web Services, LLC ("G2"); Sequel Business Solutions Ltd. ("Sequel");Lundquist Consulting, Inc. ("LCI"); and PowerAdvocate, Inc. ("PowerAdvocate") to further strengthen our position in their respective segments. G2 providesmerchant risk intelligence solutions for acquirers, commercial banks, and other payment system providers. Sequel is a leading insurance and reinsurance softwarespecialist based in London. LCI offers risk insight, prediction, and management solutions for banks and creditors. PowerAdvocate is a leading data analyticsprovider with a one-of-a-kind spend and cost data curated from millions of transactions across thousands of services, materials, and equipment categories in theenergy industry. In 2018, we acquired Rulebook Limited ("Rulebook") to further our international insurance presence in the overseas market. In 2019, we acquiredGenscape, Inc. ("Genscape") and Flexible Architecture and Simplified Technology, LLC ("FAST") to enhance our solutions within the Energy and SpecializedMarkets segment and Insurance segment, respectively. In 2020, we acquired Franco Signor, LLC to further our offerings in the Medicare space and LeadIntelligence, Inc. ("Jornaya") to grow our set of marketing solutions for the insurance and financial services markets. In 2021, we acquired Whitespace SoftwareLimited ("Whitespace"), Ignite Software Systems Limited ("Ignite"), and Data Driven Safety, LLC ("Data Driven Safety") to enhance our solutions within theunderwriting & rating category of our Insurance segment. We also acquired Roskill Holdings Limited ("Roskill") to reinforce our ability to providecomprehensive analysis across the energy and metals and mining value chain and ACTINEO GmbH to support the entire bodily injury settlement process.
Those acquisitions have added scale, geographic reach, highly skilled workforces, and a wide array of new capabilities to support our customers. They
have helped make us a leading provider of information and decision analytics for customers involved in the business of risk in the U.S. and selectively around theworld. Segments
We organize our business in three segments: Insurance, Energy and Specialized Markets, and Financial Services. See “Management’s Discussion andAnalysis of Financial Condition and Results of Operations” in Part II of this annual report for additional information regarding our segments. See Note 19. of ourconsolidated financial statements included in this annual report on Form 10-K for further information. Insurance Segment
Our Insurance segment primarily serves our P&C insurance customers and focuses on the prediction of loss, the selection and pricing of risk, andcompliance with their reporting requirements in each U.S. state in which they operate. We also develop and utilize machine learned and artificially intelligentmodels to forecast scenarios and produce both standard and customized analytics that help our customers better manage their businesses, including detecting fraudbefore and after a loss event and quantifying losses. Our customers include most of the P&C insurance providers in the U.S. In recent years, we have expanded ourofferings to also serve certain non-U.S. markets. Finally, we have also expanded into the life and annuity sectors through the acquisition of FAST in December2019, as well as internal solutions development, to enable the transformation of the industry across the policy lifecycle through no-code technology, data analytics,and modeling.
Underwriting & rating
We are the recognized leader in the U.S. for industry-standard insurance programs that help P&C insurers define coverages and issue policies. We provide
policy language, prospective loss costs, policy writing rules, and a variety of underwriting solutions for risk selection and segmentation, pricing, and workflowoptimization across 30 lines of insurance. Our policy language, prospective loss cost information and policy writing rules can serve as integrated turnkey insuranceprograms for our customers. Insurance companies need to ensure that their policy language, rules, and rates comply with all applicable legal and regulatoryrequirements. They must also make sure their policies remain competitive by promptly changing coverages in response to changes in statutes, case law, orregulatory requirements. To meet our insurers' needs, we process approximately 2,300 regulatory filings and interface with state regulators in all 50 states plus theDistrict of Columbia, Guam, Puerto Rico, and the Virgin Islands each year to ensure smooth implementation of our rules and forms. When insurers choose todevelop their own alternative programs, our industry-standard insurance programs also help regulators ensure that such insurers’ policies meet basic coveragerequirements.
Standardized coverage language, which has been tested in litigation and tailored to reflect judicial interpretation, helps ensure consistent treatment of
claimants. As a result, our industry-standard language also simplifies claim settlements and can reduce the occurrence of costly litigation because our languagecauses the meaning of coverage terminology to become established and known. Our policy language includes standard coverage language, endorsements, andpolicy writing support language that assist our customers in understanding the risks they assume and the coverages they offer. With these policy programs, insurersalso benefit from economies of scale. We have more than 195 specialized lawyers and insurance experts reviewing changes in each state’s insurance rules andregulations, including an average of approximately 13,200 legislative actions, 8,500 regulatory actions, and 2,000 court decisions per year, to make any requiredchanges to our policy language and rating information.
5

Table of Contents To cover the wide variety of risks in the marketplace, we offer a broad range of policy programs. For example, in the homeowners line of insurance, we
maintain policy language and rules for 6 basic coverages, 282 national endorsements, and 620 state-specific endorsements. The P&C insurance industry is heavily regulated in the U.S.: P&C insurers are required to collect statistical data about their premiums and losses and to
report that data to regulators in every state in which they operate. Our statistical agent services have enabled P&C insurers to meet those regulatory requirementsfor more than 50 years. We aggregate the data, and as a licensed or appointed “statistical agent” in all 50 states, Puerto Rico, and the District of Columbia, wereport those statistics to insurance regulators. We are able to capture significant economies of scale given the level of penetration of this service within the U.S.P&C insurance industry.
To provide our customers and the regulators the information they require, we maintain one of the largest private databases in the world. Over the past five
decades, we have developed core expertise in acquiring, processing, managing, protecting, and operating large and comprehensive databases that are thefoundation of our insurance offerings. We use our proprietary technology to assemble, organize, and update vast amounts of detailed information submitted by ourcustomers. We supplement this data with publicly available information.
In 2021 alone, P&C insurers sent us approximately 2.6 billion detailed individual records of insurance transactions, such as insurance premiums collected
or losses incurred. We maintain a database of more than 29.7 billion statistical records, including approximately 8.2 billion commercial lines records andapproximately 21.5 billion personal lines records. We collect unit transaction detail of each premium and loss record, which enhances the validity, reliability, andaccuracy of our data sets and our actuarial analyses. Our proprietary quality process includes more than 2,900 separate checks to ensure that the data meets ourhigh standards of quality.
We provide actuarial services to help our customers analyze and price their risks. Using our large database of premium and loss data, our actuaries are
able to perform sophisticated analyses using our predictive models and analytic methods to help our P&C insurance customers with pricing, loss reserving, andmarketing. We distribute a number of actuarial solutions and offer flexible services to meet our customers’ needs. In addition, our actuarial consultants providecustomized services for our customers that include assisting them with the development of independent insurance programs, analysis of their own underwritingexperience, development of classification systems and rating plans, and a wide variety of other business decisions. We also supply information to variouscustomers in other markets, including reinsurance and government agencies.
We project customers' future losses and loss expenses using a broad set of data. Those projections tend to be more reliable than if our customers used their
own data exclusively. We make a number of actuarial adjustments before the data is used to estimate future costs. Our customers can use our estimates of futurecosts in making independent decisions about the prices charged for their policies. For most P&C insurers in most lines of business, we believe that our estimates offuture costs are an essential input to rating decisions. Our actuarial products and services are also used to create the analytics underlying our industry-standardinsurance programs described above.
We gather information on individual properties and communities so that insurers can use our information to evaluate and price personal and commercial
property insurance, as well as commercial liability insurance. Our property-specific rating and underwriting information allows our customers to understand,quantify, underwrite, mitigate, and avoid potential loss for residential and commercial properties. Our database contains data and analytics on approximately 15.4million commercial properties in the U.S. We have a staff of approximately 520 field representatives strategically located around the U.S. who observe and reporton conditions at commercial and residential properties, evaluate community fire-protection capabilities and assess the effectiveness of municipal building-codeenforcement. Each year, our field staff visits more than 368,000 commercial properties to collect information on new buildings and verify building attributes.
We are a leading provider of innovative solutions for the personal underwriting markets, including homeowners and auto lines. Drawing on an array of
resources from proprietary and third-party data to geospatial imagery, we build and maintain widely used industry-standard tools that assist insurers inunderwriting and rating—that is, measuring and selecting risks and pricing coverage appropriately to help ensure fairness to the consumer and a reasonable returnfor the insurer. Our solutions apply advanced predictive analytics to our deep reservoir of data and information to gauge the degree and cost of risk quickly andprecisely, and our workflow tools help insurers increase speed and cost-efficiency while delivering superior customer experiences. These premier solutions span arange of applications—from using precise home reconstruction costs to ensure policyholders have the right amount of coverage, to providing auto insurers withdata to bind policies in minutes with once-and-done quoting.
Our solutions span a wide range of P&C insurance, encompassing personal and commercial lines of coverage that protect private residences, private and
commercial vehicles, and businesses. We also provide proprietary analytic measures of the ability of individual communities to mitigate losses from important perils. Nearly every property
insurer in the U.S. uses our evaluations of community firefighting capabilities to help determine premiums for fire insurance throughout the country. We providefield-verified and validated data on the fire protection services for approximately 40,000fire response jurisdictions. We also offer services to evaluate theeffectiveness of community enforcement of building codes and the efforts of communities to mitigate damage from flooding. Further, we provide information onthe insurance rating territories, premium taxes, crime risk, and hazards of windstorm, earthquake, wildfire, and other perils. To supplement our data on specificcommercial properties and individual communities, we have assembled, from a variety of internal and third-party sources, information on hazards related togeographic locations representing every postal address in the U.S. Insurers use this information not only for policy quoting but also for analyzing risk concentrationin geographical areas. We also make our data and analytics available to commercial real estate lenders to allow them to better understand risks associated withpeople they lend against.
6
Table of Contents We are a leader in and pioneered the field of probabilistic catastrophe modeling used by insurers, reinsurers, financial institutions, and government to
manage their risk from extreme events. Our models, which form the basis of our solutions, enable companies to identify, quantify, and plan for the financialconsequences of catastrophes. We have developed models for hurricanes, earthquakes, winter storms, tornadoes, hailstorms, and floods in more than 110 countriesas well as pandemics worldwide. We have developed a probabilistic terrorism model capable of quantifying the risk in the U.S. from this evolving threat, whichsupports pricing and underwriting decisions down to the level of an individual policy, as well as models for estimating losses to crop insurance programs in theU.S., Canada, and China. Our newest models offer risk management solutions for the cyber and casualty lines of business.
We help businesses and governments better anticipate and monitor risks in Earth’s natural environment. We prepare certain agencies and companies to
anticipate, manage, react to, and profit from climate- and weather-related risk. We serve our customers by providing state-of-the-art research, development, andanalysis delivered in reports, data streams, and software solutions. We are dedicated to the advancement of the atmospheric and remote sensing science disciplinesand directly addressing problems regarding weather, climate, and air quality as well as oceanography and the planetary sciences. Through research conducted byour in-house scientific staff, and often in collaboration with world-renowned scientists at academic and other research institutions, we have developed analyticaltools to help measure and observe environmental properties and translate those measurements into actionable information.
We have begun to expand our footprint of data and solutions to include both U.S. and international markets. Our international insurance markets grew
through acquisitions, and today serves a large proportion of those insurers operating in both the United Kingdom ("U.K.") and Irish property and casualty markets.Additionally, our international market provides services to much of the Lloyd's and London market, whilst also serving customers in Canada, Continental Europe,Singapore, China, Australia, and New Zealand. The international enhanced commercial and residential property models and enriched data sets help insurers withtriage, reconstruction value, risk selection, pricing, benchmarking, and portfolio management across multiple insured segments, with an emphasis on residentialand commercial property. Insurers also use our solutions to finetune the accuracy of their rating models, to drive underwriting results through a set of analyticalproducts that predict the relative risk and variation of major insurance perils including theft, flood, storm, fire, freeze, etc. Our international small and medium sizecommercial lines casualty solutions help customers digitally transform, enabling straight through processing and underwriting. In addition to property data andsolutions, customers benefit from decision and benchmarking analytics using firmographic, technographic, and business intelligence, and proprietary managementcompetency scores.
Claims
Our claims insurance solutions provide our customers analytics in fraud detection, compliance reporting, subrogation, liability assessment, litigation, andrepair cost estimation, including emerging areas of interest within these categories.
We are a leading provider of fraud-detection tools for the P&C insurance industry. Our anti-fraud solutions improve our customers’ profitability
by predicting the likelihood that fraud may be occurring and detecting suspicious activity after it has occurred. When a claim is submitted, our system searches ourall-claims database and returns information about other claims filed by the same individuals or businesses (either as claimants or insureds) that helps our customersdetermine if fraud may be occurring. The system searches for matches in identifying information fields, such as name, address, Social Security number, vehicleidentification number, driver’s license number, tax identification number, or other parties to the loss. Our system also includes advanced name and addresssearching to perform intelligent searches and improve the overall quality of the matches. Information from match reports speeds payment of meritorious claimswhile providing a defense against fraud and can lead to denial of a claim, negotiation of a reduced award, or further investigation by the insurer or lawenforcement. We also have a suite of advanced fraud analytics solutions: a solution that uses predictive models to accurately score claims based on fraudindicators; an injury claims solution that uses predictive analytics to detect medical provider fraud, waste, and abuse; and a network analytics solution that helpsdetect patterns indicative of organized fraud. We also have a comprehensive case management system claims adjusters and investigation professionals use tomanage claim investigations.
Our claims database is one of the key tools in the fight against insurance fraud. The benefits of a single all-claims database include improved efficiency in
reporting data and searching for information, enhanced capabilities for detecting suspicious claims, and superior information for investigating fraudulent claims,suspicious individuals, and possible fraud rings. Our database also helps insurers fulfill their regulatory compliance reporting requirements at both the state andfederal levels for delinquent child support liens and other required checks. The database contains information for more than 1.5 billion claims and is the world’slargest database of P&C claims information used for claims processing and investigations. Insurers and other participants submit more than 175,000 new claims aday on average across all U.S. P&C insurance industry categories.
We also offer solutions to help the P&C industry comply with the federal Medicare Secondary Payer ("MSP") Statute, mandating claims data reporting,
conditional payments liabilities repayment, and ongoing protection of the Medicare Trust Fund. Our solutions include highly accurate Medicare reportingcustomized to the way insurers, self-insured employers, and third-party administrators ("TPAs") do business. We also provide integrated conditional paymentprocessing and a full range of Medicare Set-Aside ("MSA") services. We have services that automatically extract unstructured medical records and demandpackages for easy, efficient review and analysis. In addition to full compliance support-including First Report of Injury ("FROI")/Subsequent Report of Injury("SROI") and other Electronic Data Interchange ("EDI") reporting-claims professionals can also access robust analytic solutions for workers' compensation andliability claims and leverage litigation analytics for improved claim results.
7

Table of Contents
We also provide data, analytics, and networking products for professionals involved in estimating all phases of building repair and reconstruction. Weprovide solutions for every phase of a building’s life, including: • quantifying the ultimate cost of repair or reconstruction of damaged or destroyed buildings, • aiding in the settlement of insurance claims; and • tracking the process of repair or reconstruction and facilitating communication among insurers, adjusters, contractors, and policyholders.
To help our customers estimate repair costs, we provide a solution that assists contractors and insurance adjusters in estimating repairs using a patentedplan-sketching program. The program allows our customers to manually sketch floor, roof, and wall framing plans based upon their own measurements andautomatically calculates material and labor quantities for all desired construction or repairs to the structure.
We also provide our customers access to price lists, which include structural repair and restoration pricing for 468 separate economic areas in North
America. We revise this information monthly, and as often as weekly in the aftermath of major disasters, to reflect rapid price changes. Our structural repair andcleaning database contains approximately 21,000 unit-cost line items. For each line item, we report time and material pricing, and improve our reported pricingdata by several methods, including direct market surveys and an analysis of the actual claim experiences of our customers. We estimate that more than 80% ofinsurance repair contractors and service providers in the U.S. and Canada with computerized estimating systems use our building and repair pricing data. This largepercentage leads to accurate reporting of pricing information, which we believe is unmatched in the industry.
Our virtual claims adjusting tools help improve policyholder satisfaction and save on loss adjustment expense. These tools simplify collaboration
among claims professionals, contractors, and policyholders as they work together remotely and efficiently. Real-time video collaboration, remote measuringtools, AI-powered damage assessment, and image analytics fraud warnings are just a few of the advantages we deliver through these solutions.
Customers access our claims ecosystem to enhance their business and operations. For example, they can tap into our weather API for near-real-time
updates and valuable insights for responding to weather perils that can impact their policyholders and their business. Plus, they can use our data insights to analyzeand benchmark their performance against peers in the industry and manage claims assignments.
We continually pursue new solutions that help our customers keep abreast of changing markets and technology. For example, we developed a digital
media database that allows customers to view prior-loss images on claim matches so they can detect pre-existing damage on new claims. Our cutting-edge imageforensics can detect suspicious claim-related photos and our customers can flag stolen and synthetic identities in the database to help subscribers deter that type offraud.
8
Table of Contents Energy and Specialized Markets Segment
We are a leading provider of data analytics across the natural resources value chain including the global energy, chemicals, metals and mining, and powerand renewables sectors. We deliver analysis and advice on assets, companies, governments, and markets based on proprietary near real time data as well as historicinformation. This enables us to offer a comprehensive and integrated analysis of relevant commodities to our customers. We provide research and consultingservices focusing on supporting customer capital allocation decisions, asset valuation and benchmarking, commodity markets, and corporate analysis. We offerconsultancy in the areas of business environment, business improvement, business strategies, commercial advisory, and transaction support.
We differentiate our solutions in the market by continuously gathering and managing proprietary information, insight, and analysis on thousands of oil
and gas assets, wind turbines and solar assets, mines, refineries, and other assets, as well as detailed assessments of the market fundamentals across each valuechain. These market insights help our customers achieve operational excellence, increase profitability and optimize business performance. And our experts applythe data and work directly with customers to address their business challenges.
We also offer a comprehensive suite of data and information services that enable improved compliance with global environmental health and safety
("EH&S") requirements related to the safe manufacturing, distribution, transportation, usage, and disposal of chemicals and products. From the supply chain orsolutions life cycle, we deliver a program specific to the EH&S compliance information and management needs of our customers. Our full-solutions life cycle andcross-supply chain approach provides a single, integrated solution for managing customers' EH&S capabilities, which results in improved processes and reducedcost, risk, and liability. Financial Services Segment
We maintain the largest bank account consortia to provide competitive benchmarking, decisioning algorithms, business intelligence, and customized
analytic services to financial institutions, payment networks and processors, alternative lenders, regulators, and merchants enabling better strategy, marketing, andrisk decisions. Our teams are located across the U.S., U.K., Canada, Australia, New Zealand, the United Arab Emirates, Mexico, and India, deliveringunique products and services to an expanding customer base that values the comprehensiveness of our data and solutions as well as our full wallet-spend view of aconsumer. Complementing this, we leverage our partnerships with processors and credit bureaus not only to augment the richness of our data but also to provideexpanded solutions across the broad span of consumer banking and retail products. Meanwhile, we offer services and a suite of solutions to satisfygrowing customer needs for better forecasting and expense tools and regulatory-focused solutions. In addition, we provide solutions in the media effectivenessspace given the unique nature and strength of our partnerships and through our developing Verisk Financial Marketview brand.
Our professionals have substantive industry knowledge about providing solutions to the financial services sector. We are known for our unique ability to
blend the highly technical, data-centered aspects of our projects with expert communication and business knowledge. Our solutions enhance our customers’ abilityto manage their businesses profitably and position them better to handle present-day challenges (competitive, regulatory, and economic). Specifically, we usecomprehensive transaction, risk, behavioral, and bureau-sourced account data to assist customers in making better business decisions through analysis andanalytical solutions. We maintain a comprehensive and granular direct-observation financial services industry database for credit card, debit card, and deposittransactions as well as merchant and collections transactions.
9

Table of Contents Our Growth Strategy
Over the past five years, we have grown our revenues at a CAGR of 8.7% through the successful execution of our business plan. Those results reflect
strong organic revenue growth, new product development, and acquisitions. We have made, and continue to make, investments in people, data sets, analyticsolutions, technology, and complementary businesses. The key components of our strategy include the following:
Increase Solution Penetration with Customers. We expect to expand the application of our solutions in customers’ internal processes. Building on ourdeep knowledge of and embedded position in, various industries, we expect to sell more solutions to existing customers tailored to individual marketsegments. By increasing the breadth and relevance of our offerings, we believe that we can strengthen our relationships with customers and increase ourvalue to their decision making in critical ways. We have opportunities to expand solution penetration to our insurance, energy, and financial servicescustomers. Develop New Proprietary Data Sets and Predictive Analytics. We work with our customers to understand their evolving needs. We plan to create newsolutions by enriching our mix of proprietary data sets, analytic solutions, and effective decision support across the markets we serve. We constantly seekto add new data sets that can further leverage our analytic methods, technology platforms, and intellectual capital. Leverage Our Intellectual Capital to Expand into Adjacent Markets and New Customer Sectors. Our organization is built on more than five decades ofintellectual property in risk management. We believe we can continue to expand the use of our intellectual capital profitably and apply our analyticmethods in new markets where significant opportunities for long-term growth exist. We also continue to pursue growth through targeted internationalexpansion. We have already demonstrated the effectiveness of this strategy with our expansion into non-insurance financial services. Pursue Strategic Acquisitions That Complement Our Leadership Positions. We will continue to expand our data and analytics capabilities acrossindustries. While we expect this will occur primarily through organic growth, we have acquired and will continue to acquire assets and businesses thatstrengthen our value proposition to customers. We have developed an internal capability to source, evaluate, and integrate acquisitions that have createdvalue for shareholders.
Our Customers
The customers in our Insurance segment for the lines of P&C services we offer include the top 100 P&C insurance providers in the U.S. as well asdomestic InsurTech companies and insurers in international markets. A substantial majority of P&C insurance providers in the U.S. use our statistical agentservices to report to regulators, and the majority of insurers and reinsurers in the U.S. use our actuarial services and industry-standard insurance programs. Inaddition, certain agencies of the federal government as well as county and state governmental agencies and organizations use our solutions to help satisfygovernment needs for risk assessment and emergency response information. For life and annuity insurers, we offer digital solutions including electronicapplications and policy administration systems to enable automated/accelerated triage, underwriting, fraud detection, and modeling. Our claims database servesthousands of customers, representing approximately 90% of the P&C insurance industry by premium volume, more than 500 self-insurers, approximately 400 thirdparty administrators, several state fraud bureaus, and many law enforcement agencies involved in the investigation and prosecution of insurance fraud. We estimatethat more than 80% of insurance repair contractors and service providers in the U.S. and Canada with computerized estimating systems use our building and repaircost estimation pricing data.
Our customers within the Energy and Specialized Markets segment include nine of the top ten global energy producers around the world. Our customer
base includes international and national energy companies as well as renewables companies, power utilities, metals and mining, and chemicals companies;financial institutions; and governments, among others. Within these organizations, we work with a range of diverse teams. These include strategists and policymakers, business developers, market analysts, commodity traders, corporate finance, risk teams, and investors. Alongside large corporate and government clients,we also work with many small and medium-size enterprises, offering services tailored to each customer’s needs.
Within the Financial Services segment, our customers include financial institutions, payment networks and processors, alternative lenders, regulators,
merchants, and the top 30 credit card issuers in North America, the United Kingdom, and Australia.
10

Table of Contents Our Competitors
We believe that no single competitor currently offers the same scope of services and market coverage we provide. The breadth of markets we serveexposes us to a broad range of competitors as described below. Businesses that we acquire may introduce us to additional competitors.
Our Insurance segment operates primarily in the U.S. P&C insurance industry, where we enjoy a leading market presence. We have a number of
competitors in specific lines or services. We encounter competition from a number of sources, including insurers that develop internal technology and actuarialmethods for proprietary insurance programs. Competitors also include other statistical agents, such as the National Independent Statistical Service, the IndependentStatistical Service, Inc., and other advisory organizations, that provide underwriting rules, prospective loss costs, and coverage language, including the AmericanAssociation of Insurance Services, Inc. and Mutual Services Organization. However, we believe that none of our competitors have the breadth or depth of data wehave. Competitors for our property-specific rating and underwriting information are primarily limited to a number of regional providers of commercial propertyinspections and surveys, including Overland Solutions, Inc., and Regional Reporting, Inc., and emerging providers in the InsurTech space. We also compete with avariety of organizations that offer consulting services, primarily specialty technology and consulting firms. In addition, a customer may use its own internalresources rather than engage an outside firm for these services. Finally, our underwriting products compete with Lexis Nexis and Core Logic in the marketplace.Our competitors also include information technology product and services vendors; management and strategy consulting firms; and smaller specialized informationtechnology and analytical services firms, including Pinnacle Consulting and EMB, a unit of Willis Towers Watson. Finally, in the life insurance sector, oursolutions compete against vendors such as Accenture, Oracle, DXC, Majesco and iPipeline, as well as the in-house technology departments of Life Insurers. In theP&C insurance claims and catastrophe modeling markets, certain products are offered by a number of companies, including Risk Management Solutions(catastrophe modeling), CoreLogic (repair cost estimating), LexisNexis® Risk Solutions (claims investigative reports), SAS (claims fraud analytics), and Enlyte(injury claims analytics). We believe that our P&C insurance industry expertise, and our ability to offer multiple applications, services, and integrated solutions toindividual customers are competitive strengths.
In the Energy and Specialized Markets segment, certain products are offered by a number of companies, including IHS Markit (natural resources), RystadEnergy (upstream), Enverus (upstream), Energy Aspects (commodities), CRU Group (metals), and Bloomberg New Energy Finance (power and renewables). Webelieve that our global integrated value chain knowledge and insight, bottom-up proprietary data, and long-term trusted relationships enhance our competitiveposition in relation to those companies.
Within the Financial Services segment, our unique datasets and wallet solutions mean that we have no direct competitors, and we work closely to create
partnerships for mutual clients with organizations such as the card networks and credit bureaus to deepen ongoing relationships and create new value solutions. Ourkey competitors for our major brands are EverCompliant, WebShield, Trustwave, LegitScript, Lexis Nexis, American Infosource, and Phin Solutions.
Development of New Solutions
We take a market-focused team approach to developing our solutions. Our operating units are responsible for developing, reviewing, and enhancing ourvarious products and services. Our data management and production team designs and manages our processes and systems for market data procurement,proprietary data production, and quality control. Our Joint Development Environment ("JDE") and Enterprise Data Management ("EDM") teams support ourefforts to create new information and products from available data and explore new methods of collecting data. EDM is focused on understanding and documentingbusiness unit and corporate data assets and data issues, sharing and combining data assets across the enterprise, creating an enterprise data strategy, facilitatingresearch and product development, and promoting cross-enterprise communication. Our Verisk Innovative Analytics ("VIA") team is a corporate center ofexcellence for analytical methods in applying modeling techniques to predict risk outcomes.
Our software development teams build the technology used in many of our solutions. As part of our product development process, we continually solicit
feedback from our customers on the value of our products and services and the market’s needs. We have established an extensive system of customer advisorypanels that meet regularly throughout the year to help us respond effectively to the needs of our markets. In addition, we use frequent sales calls, executive visits,user group meetings, and other industry forums to gather information to align our product development efforts with the needs of the market. We also use a varietyof market research techniques to enhance our understanding of our customers and the markets in which they operate.
We add to our offerings through an active acquisition program. Since 2017, we have acquired 32 businesses, which have allowed us to enter new markets,
offer new solutions, and enhance the value of existing services with additional proprietary sources of data. When we find it advantageous, we augment our proprietary data sources and systems by forming alliances with other leading information providers and
technology companies and integrating their product offerings into our offerings. This approach gives our customers the opportunity to obtain the information theyneed from a single source and more easily integrate the information into their workflows.
11

Table of Contents Sales, Marketing, and Customer Support
We sell our solutions and services primarily through direct interaction with our customers. We employ a three-tier sales structure that includessalespeople, technical consultants, and sales support. Within our company, several areas have sales teams that specialize in specific products and services. Thosespecialized sales teams sell specific, highly technical solution sets to targeted markets in coordination with account management.
To provide account management to our largest customers in the insurance, energy, and financial markets, we divide our customers into three groups. TierOne (“Global/National Accounts") comprises our largest customers. Tier Two (“Strategic Accounts") represents both large and middle-market customer groups.Tier Three is composed of small and specialized companies that may represent one line of business, may be regionally focused, or are recent new entrants into themarketplace. In Tier One and Tier Two segments, we have sales teams organized by the following specialties: personal or commercial lines underwriting andpricing, claims, catastrophe risk, and energy. In the Tier Three segment, we assign a sales generalist with overall account management responsibility. Our tieredapproach has proven to be a successful sales model and approach to building customer relationships. Our senior executives regularly engage with the seniormanagement of our customers to ensure customer satisfaction and strategic alignment and to support mutual partnership innovation opportunities.
Salespeople participate in both sales and customer service activities. They provide direct support, interacting frequently with assigned customers to ensurea satisfactory experience using our services. Salespeople primarily seek out new sales opportunities and work with the various product teams to coordinate salesactivities and ensure our solutions fit the customer's needs. We believe our salespeople’s product knowledge, skills to develop relationships of trust, and localpresence differentiate us from our competition. Technical consultants are subject matter experts and work with salespeople on specific opportunities for theirassigned products and segments. Salespeople manage the overall sales process and technical consultants manage the rigorous integration and functional fitdiscussions to ensure mutual success and satisfaction. Both salespeople and technical consultants have responsibility for identifying new sales opportunities. Ateam approach and a common customer relationship management system allow for effective coordination among the groups. Sources of Our Data
The data we use to perform our analytics and power our solutions is sourced through seven different kinds of data arrangements. First, we gather datafrom our customers within agreements that also permit our customers to use the solutions created from their data. Those agreements remain in effect unless thedata contributor chooses to opt out. It is very rare that contributors elect not to continue providing us data. Second, we have agreements with data contributors inwhich we specify the particular uses of their data and provide their required levels of privacy, protection of data, and where necessary, de-identification of data.The agreements represent no cost to us, generally feature a specified period of time for the data contributions, and require renewal. Third, we “mine” data foundinside the transactions supported by our solutions; as an example, we use the claims settlement data generated inside our repair cost estimating solution to improvethe cost factors used in our models. Again, those arrangements represent no cost to us, and we obtain the consent of our customers to make use of their data in thisway. Fourth, we source data generally at no cost from public sources, including federal, state, and local governments. Fifth, we gather data about the physicalcharacteristics of commercial properties through the direct observation of our field staff members, who also perform property surveys at the request of, andfacilitated by, property insurers. Sixth, we collect data, or license or purchase from third parties, on geographic and spatially referenced information relating toresidential and commercial structures by using the latest remote sensing and machine learning technologies. Lastly, we purchase data from data aggregators undercontracts that reflect prevailing market pricing for the data elements purchased, including county tax assessor records, descriptions of hazards such as flood plains,and professional licenses. We are the owners of the derivative solutions we create using the data we collect.
12

Table of Contents Information Technology
Technology
Our information technology systems and the more recent adoption of cloud computing are fundamental to our success. They are used for the storage,processing, access, and delivery of the data that forms the foundation of our business and the development and delivery of the solutions we provide to ourcustomers. We generally own, or have secured ongoing rights to use for the purposes of our business, all the customer-facing applications that are material to ouroperations. We support and implement a mix of technologies and focus on implementing the most efficient technology for any given business requirement or task.
Data Centers
We have two primary data centers in Somerset, New Jersey, and Lehi, Utah, creating redundancy and back up capabilities. In addition, we have datacenters located in other states dedicated to certain business units.
Disaster Recovery
We are committed to a framework for business continuity management and carry out annual reviews of the state of preparedness of each business unit.We also have documented disaster recovery plans in place for each of our major data centers and each of our solutions. The data center in Somerset, New Jersey isthe recovery site for the Lehi, Utah, data center and vice versa. Business continuity planning is in place for all of our critical business processes to provide for theprompt and effective continuation of critical services in the event of a business disruption. Our business continuity program adheres to ISO 22301:2019, which isan international standard for business continuity. All business impact analysis and business continuity plans are reviewed and updated, at a minimum, annually orwhen significant business changes occur.
Security
We have adopted a wide range of measures to secure our IT infrastructure and data. Security measures generally cover the following key areas: securitypolicies and governance committees, physical security, logical security of the perimeter, network security such as firewalls, logical access to applications andoperating systems, deployment of endpoint anti-malware software, email security, and appropriate procedures relating to removable media such as laptops. Laptopsare encrypted, and media leaving our premises and sent to third-party storage facilities are also encrypted. Our commitment to security has earned ISO 27001:2013Certification for our core data centers, which is an international standard for best practices associated with our Information Security Management System. Intellectual Property
We own a significant number of intellectual property rights, including copyrights, trademarks, trade secrets, and patents. Specifically, our policylanguage, insurance manuals, software, and databases are protected by both registered and common law copyrights; and the licensing of those materials to ourcustomers for their use represents a large portion of our revenue. We also own in excess of 500 trademarks in the U.S. and foreign countries, including the namesof our products and services and our logos and tag lines, many of which are registered. We believe many of our trademarks, trade names, service marks, and logosto be of material importance to our business, as they assist our customers in identifying our products and services and the quality that stands behind them. Weconsider our intellectual property to be proprietary, and we rely on a combination of statutory (for example, copyright, trademark, trade secret, and patent) andcontractual safeguards in a comprehensive intellectual property enforcement program to protect it wherever it is used.
We also own several patents and have several pending patent applications in the U.S. that complement our products. We believe the protection of our
proprietary technology is important to our success, and we will continue to seek to protect those intellectual property assets for which we have expendedsubstantial research and development capital and that are material to our business.
To maintain control of our intellectual property, we enter into contractual agreements with our customers, granting each customer permission to use our
products and services, including our software and databases. This helps maintain the integrity of our proprietary intellectual property and to protect the embeddedinformation and technology contained in our solutions. As a general practice, employees, contractors, and other parties with access to our proprietary informationsign agreements that prohibit the unauthorized use or disclosure of our proprietary rights, information, and technology.
13
Table of Contents Human Capital
Our global workforce is united by our mission to serve, add value, and innovate for our customers. We continue to invest in our people worldwide byencouraging all employees to reach their full potential through our focus on learning in the flow of work, competitive compensation and benefits, and our cultureanchored on innovation, collaboration, and inclusivity.
As a knowledge-based business, we carefully integrate the skills and talents of 9,367 employees worldwide as of December 31, 2021. Most of our highly
credentialed team holds advanced degrees and professional certifications specializing in actuarial science, chemistry and physics, commercial banking and finance,commodity analytics, data science and artificial intelligence, economics, engineering, GIS mapping, meteorology, natural resources, predictive analytics, supplychain, and other fields.
Approximately 64% of our employees are based in the United States, 15% in the United Kingdom, 7% in India, with the remainder serving in 35 other
countries across the globe. None of our employees are represented by unions or subject to collective bargaining agreements, other than a small number of employees in Germany
who are represented by a works council. We consider our relationship with our employees to be good and have not experienced interruptions of operations due tolabor disagreements.
We support and work to inspire our people with a collaborative and engaging culture, and career development opportunities at all levels, competitive
compensation and benefits, an ongoing focus on well-being, and responsive leadership. Starting in 2021, we have introduced a common global wellbeing dayacross the enterprise to recognize the importance of the total wellbeing of our workforce. In addition, in 2022, we have introduced Juneteenth, as a U.S. holiday torecognize this significant milestone in U.S. history.
We have a culture of continuous learning and improvement. To help our employees grow in their careers, we curate self-paced learning resources, and
create real-time opportunities for employees to connect and learn from each other. All employees have access to our world-class virtual learning platform, whichfeatures thousands of courses taught by industry experts, ranging from public speaking, to balancing work and personal life, to data science fundamentals. We alsoencourage our managers to provide guidance, support, and clarity for our employees – through group town halls, engagement events, and on-going one-on-onediscussions about goals, progress, and development.
Our Leadership Institute also conducts leadership development programs tailored to leaders from first-time managers to senior executives. In 2021, 477
participants committed more than 10,000 total learning hours to gaining practical tools to lead themselves, others, and the business. We offer competitive salaries, annual merit salary reviews, and the opportunity for advancement. In addition, our program includes an incentive
compensation component for eligible job categories, paid time off (“PTO”), flextime and telecommuting options, and a 401(k) program with a 100% company cashmatch (up to 6%). We also offer health insurance plans, no-cost life insurance equivalent to annual salary (with the option to purchase more), a discounted stockpurchase program, a variety of physical, mental, and financial well-being offerings and resources, and more. Terms vary by business unit and country.
Employees can also take advantage of our employee networks, grassroots groups that help support diversity-related programs and events and promote an
inclusive community. As of 2021, there were eight networks: the Verisk Women's Network, the Verisk Pride Network, the Verisk Veterans and Military ServiceMembers Network, the Verisk REACH Network (dedicated to empowering Black employees), the Verisk Parents Network, the Verisk Unidos Network (promotingawareness of Hispanic and Latinx culture), the Verisk Asian Network, and the Verisk Accessibility Network.
The enterprise sponsored over ten special events in 2021 through our various employee network groups focused on helping our employees find ways to
continue conversations that center around equality and the employee experience. Included in these events were webcasts, author led book reviews, fundraisers andopen discussions with topics ranging from “Teach Girls Bravery, Not Perfection” to the reflections of minority team members to how our Verisk Veterans haveleveraged their skills in civilian life.
To support our goal to have a workforce that reflects the diversity of the communities we operate in, our Board of Directors adopted our Statement on
Racial Equity and Diversity in 2020. Its purpose is to confront and overcome barriers to individual achievement based on race, ethnicity, gender, sexual orientation,identity, and beliefs.
We continually strive to encourage collaboration throughout the organization, involve and empower all of our employees, and develop a diverse
workforce. Surveys conducted by outside organizations and our annual employee engagement survey measure our progress against these critical metrics. Startingin 2022, we will evaluate our senior leaders against an enterprise goal to attract and retain diverse talent across the globe. The performance goal is linked toleaders' annual compensation and leaders' performance will be assessed by the senior operating committee and the Board of Directors.
The health and safety of our people working around the globe is a top priority, and our facilities worldwide follow rigorous, internally and externally
audited, occupational health and safety policies. We also recognize that protecting the health, safety and wellbeing of our employees is crucial to our ability tocontinue to address the impact of the global COVID-19 pandemic.
The majority of our people continued to work remotely in 2021. We continue to evolve our preparedness strategy for office reopenings to integrate key
learnings, safety measures and employee feedback to rethink the future of work.
Our employee engagement score for 2021 is at 76%. Verisk continues to be recognized for our outstanding workplace culture by Great Place to Work® inthe U.S., the United Kingdom, India, and Spain. The Great Place to Work Institute is a global authority on high-trust, high-performance workplaces.
14

Table of Contents Regulation
Because our business involves the distribution of certain personal, public, and nonpublic data to businesses and governmental entities that makeeligibility, service, and marketing decisions based on such data, certain of our solutions and services are subject to regulation under federal, state, and local laws inthe U.S. and, to a lesser extent, in foreign countries. Examples of such regulation include the Fair Credit Reporting Act, which regulates the use of consumer creditreport information; the Gramm-Leach-Bliley Act, which regulates the use of nonpublic personal financial information held by financial institutions and appliesindirectly to companies that provide services to financial institutions; the Drivers Privacy Protection Act, which prohibits the public disclosure, use, or resale byany state’s department of motor vehicles of personal information about an individual that was obtained by the department in connection with a motor vehiclerecord, except for a “permissible purpose”; and various other federal, state, and local laws and regulations.
Those laws generally restrict the use and disclosure of personal information and provide consumers certain rights to know the manner in which their
personal information is being used, to challenge the accuracy of such information, and/or to prevent the use and disclosure of such information. In certaininstances, the laws also impose requirements for safeguarding personal information through the issuance of data security standards or guidelines. Certain state lawsimpose similar privacy obligations as well as obligations to provide notification of security breaches in certain circumstances.
We are also licensed as a rating, rate service, advisory, or statistical organization under state insurance codes in all 50 states, Puerto Rico, Guam, the U.S.
Virgin Islands, and the District of Columbia. As such an advisory organization, we provide statistical, actuarial, policy language development, and related productsand services to P&C insurers, including advisory prospective loss costs, other prospective cost information, manual rules, and policy language. We also serve as anofficially designated statistical agent of state insurance regulators to collect policy writing and loss statistics of individual insurers and compile that informationinto reports used by the regulators.
Many of our products, services, and operations as well as insurers' use of our services are subject to state rather than federal regulation by virtue of the
McCarran-Ferguson Act. As a result, many of our operations and products are subject to review and/or approval by state regulators. Further, our operationsinvolving licensed advisory organization activities are subject to periodic examinations conducted by state regulators; and our operations and products are subjectto state antitrust and trade practice statutes within or outside state insurance codes, which are typically enforced by state attorneys general and/or insuranceregulators. Available Information
We maintain an Investor Relations website on the Internet at investor.verisk.com. We make available free of charge on or through this website, our
annual, quarterly, and current reports and any amendments to those reports as soon as reasonably practicable following the time they are electronically filed with orfurnished to the U.S. Securities and Exchange Commission ("SEC"). For access to the filings, click the “SEC Filings” link on the “Financial Information” tab onour Investor Relations homepage. The contents of our website are not incorporated into this filing. Verisk trades on the NASDAQ Global Market in the NasdaqGlobal Select Market segment under the ticker symbol “VRSK.” Our stock was first publicly traded on October 7, 2009.
The public may read any materials filed by Verisk with the SEC on the SEC's Internet site (www.sec.gov), which contains reports, proxy and information
statements, and other information regarding issuers that file electronically with the SEC.
15
Table of Contents Item 1A. Risk Factors
You should carefully consider the following risks and all of the other information set forth in this annual report on Form 10-K before deciding to invest in
any of our securities. If any of the following risks actually occurs, our business, financial condition or results of operations would likely suffer. In such case, thetrading price of our securities, including our common stock, could decline due to any of these risks, and you may lose all or part of your investment. In addition tothe effects of the COVID-19 pandemic and resulting global disruptions on our business and operations discussed in Item 7 of Part II, "Management's DiscussionAnalysis of Financial Condition and Results of Operations," and in the risk factors below, additional or unforeseen effects from the COVID-19 pandemic and theglobal economic climate may give rise to or amplify many of the risks discussed below.
Risks Related to Our Business We could lose our access to data from external sources, which could prevent us from providing our solutions.
We depend upon data from external sources, including data received from customers and various government and public record services, for informationused in our databases. In general, we do not own the information in these databases, and the participating organizations could discontinue contributing informationto the databases. Our data sources could withdraw or increase the price for their data for a variety of reasons, and we could also become subject to legislative,judicial, or contractual restrictions on the use of such data, in particular if such data is not collected by the third parties in a way that allows us to legally use and/orprocess the data. In addition, some of our customers have been, and in the future may continue to be, stockholders of our company. If our customers’ percentage ofownership of our common stock decreases, or they cease to be stockholders of our company, there can be no assurance that our customers will continue to providedata to the same extent or on the same terms. If a substantial number of data sources, or certain key sources, were to withdraw or be unable to provide their data, orif we were to lose access to data due to government regulation or if the collection of data became uneconomical, our ability to provide solutions to our customerscould be impacted, which could materially adversely affect our business, reputation, financial condition, operating results, and cash flows.
Agreements with our data suppliers are short-term agreements. Some suppliers are also competitors, which may make us vulnerable to unpredictable price
increases and may cause some suppliers not to renew certain agreements. Our competitors could also enter into exclusive contracts with our data sources. If ourcompetitors enter into such exclusive contracts, we may be precluded from receiving certain data from these suppliers or restricted in our use of such data, whichwould give our competitors an advantage. Such a termination or exclusive contracts could have a material adverse effect on our business, financial position, andoperating results if we were unable to arrange for substitute data sources. We derive a substantial portion of our revenues from U.S. P&C primary insurers. If there is a downturn in the U.S. insurance industry or that industry doesnot continue to accept our solutions, our revenues will decline.
Revenues derived from solutions we provide to U.S. P&C primary insurers account for a substantial portion of our total revenues. During the year endedDecember 31, 2021, approximately 52% of our revenue was derived from solutions provided to U.S. P&C primary insurers. Also, our invoices for certain of oursolutions are linked in part to premiums in the U.S. P&C insurance market, which may rise or fall in any given year due to loss experience and capital capacity andother factors in the insurance industry that are beyond our control. In addition, our revenues will decline if the insurance industry does not continue to accept oursolutions.
Factors that might affect the acceptance of these solutions by P&C primary insurers include the following:
• changes in the business analytics industry, • changes in technology, • our inability to obtain or use state fee schedule or claims data in our insurance solutions, • saturation of market demand, • loss of key customers, • industry consolidation, and • failure to execute our customer-focused selling approach.
A downturn in the insurance industry, pricing pressure or lower acceptance of our solutions by the insurance industry could result in a decline in revenues
from that industry and have a material adverse effect on our financial condition, results of operations and cash flows.
16

Table of Contents Acquisitions, other strategic relationships and dispositions of our business, and related integration and separation risks, could result in operatingdifficulties and other harmful consequences, and we may not be successful in achieving the anticipated benefits of such transactions.
Our long-term business strategy includes growth through acquisitions and other strategic relationships. Future acquisitions may not be completed on
acceptable terms and acquired assets, data or businesses may not be successfully integrated into our operations, and we may ultimately divest unsuccessfulacquisitions or investments. Moreover, from time to time we may also undertake dispositions of certain businesses or assets. Any acquisitions, investments anddispositions will be accompanied by the risks commonly encountered in such transactions. Such risks include, among other things:
• failing to implement or remediate controls, procedures and policies appropriate for a larger public company at acquired companies that prior to the
acquisition lacked such controls, procedures and policies, • paying more than fair market value for an acquired company or assets, or receiving less than fair market value for disposed businesses or assets, • failing to integrate or separate the operations and personnel of the acquired or disposed businesses in an efficient, timely manner, • assuming potential liabilities of an acquired company, • managing the potential disruption to our ongoing business, • distracting management focus from our core businesses, • failing to retain management at the acquired company, • difficulty in acquiring suitable businesses, including challenges in predicting the value an acquisition will ultimately contribute to our business, • possibility of overpaying for acquisitions, particularly those with significant intangible assets that derive value using novel tools and/or are
involved in niche markets, • impairing relationships with employees, customers, and strategic partners, • incurring expenses associated with the amortization of intangible assets particularly for intellectual property and other intangible assets, • incurring expenses associated with an impairment of all or a portion of goodwill and other intangible assets due to changes in market conditions,
weak economies in certain competitive markets, or the failure of certain acquisitions to realize expected benefits, and • diluting the share value and voting power of existing stockholders.
The anticipated benefits of many of our acquisitions may not materialize. Future acquisitions or dispositions could result in the incurrence of debt,
contingent liabilities or amortization expenses, or write-offs of goodwill and other intangible assets, any of which could harm our financial condition. We typically fund our acquisitions through our debt facilities. Although we have capacity under committed facilities, those may not be sufficient.
Therefore, future acquisitions may require us to obtain additional financing through debt or equity, which may not be available on favorable terms or at all andcould result in dilution. In addition, to the extent we cannot identify or consummate, on terms acceptable to us, acquisitions that are complementary or otherwiseattractive to our business, we may experience difficulty in achieving future growth. There may be consolidation in our end customer market, which could reduce the use of our services.
Mergers or consolidations among our customers could reduce the number of our customers and potential customers. This could adversely affect our
revenues even if these events do not reduce the aggregate number of customers or the activities of the consolidated entities. If our customers merge with or areacquired by other entities that are not our customers, or that use fewer of our services, they may discontinue or reduce their use of our services. The adverse effectsof consolidation will be greater in sectors that we are particularly dependent upon, for example, in the P&C insurance sector. Any of these developments couldmaterially adversely affect our business, financial condition, operating results, and cash flows.
17

Table of Contents If we are unable to develop successful new solutions or if we experience defects, failures and delays associated with the introduction of new solutions, ourbusiness could suffer serious harm.
Our growth and success depend upon our ability to develop and sell new solutions. If we are unable to develop new solutions, or if we are not successful
in introducing and/or obtaining regulatory approval or acceptance for new solutions, or products we develop face sufficient pricing pressure to make themunattractive to pursue, we may not be able to grow our business, or growth may occur more slowly than we anticipate. In addition, significant undetected errors ordelays in new solutions may affect market acceptance of our solutions and could harm our business, financial condition or results of operations. In the past, wehave experienced delays while developing and introducing new solutions, primarily due to difficulties in developing models, acquiring data and adapting toparticular operating environments. Errors or defects in our solutions that are significant, or are perceived to be significant, could result in rejection of our solutions,damage to our reputation, loss of revenues, diversion of development resources, an increase in product liability claims, and increases in service and support costsand warranty claims. We typically face a long selling cycle to secure new contracts that require significant resource commitments, which result in a long lead time before we receiverevenues from new relationships.
We typically face a long selling cycle to secure a new contract and there is generally a long preparation period in order to commence providing theservices. We typically incur significant business development expenses during the selling cycle and we may not succeed in winning a new customer’s business, inwhich case we receive no revenues and may receive no reimbursement for such expenses. Even if we succeed in developing a relationship with a potential newcustomer, we may not be successful in obtaining contractual commitments after the selling cycle or in maintaining contractual commitments after theimplementation cycle, which may have a material adverse effect on our business, results of operations and financial condition. To the extent the availability of free or relatively inexpensive information increases, the demand for some of our solutions may decrease.
Public sources of free or relatively inexpensive information have become increasingly available recently, particularly through the Internet, and this trend
is expected to continue. Governmental agencies in particular have increased the amount of information to which they provide free public access. Public sources offree or relatively inexpensive information may reduce the demand for our solutions. To the extent that customers choose not to obtain solutions from us and insteadrely on information obtained at little or no cost from these public sources, our business and results of operations may be adversely affected.
Our senior leadership team is critical to our continued success and the loss of such personnel could harm our business.
Our future success substantially depends on the continued service and performance of the members of our senior leadership team. These personnel
possess business and technical capabilities that are difficult to replace. However, as a general practice we do not enter into employee contracts with the members of our senior management operating team, except for certain
limited situations. If we lose key members of our senior management operating team, we may not be able to effectively manage our current operations or meetongoing and future business challenges, and this may have a material adverse effect on our business, results of operations and financial condition. We may fail to attract and retain enough qualified employees to support our operations, which could have an adverse effect on our ability to expand ourbusiness and service our customers.
Our business relies on large numbers of skilled employees and our success depends on our ability to attract, train and retain a sufficient number of
qualified employees. If our attrition rate increases, our operating efficiency and productivity may decrease. We compete for employees not only with othercompanies in our industry, but also with companies in other industries, such as software services, engineering services and financial services companies, and thereis a limited pool of employees who have the skills and training needed to do our work.
If our business continues to grow, the number of people we will need to hire will increase. We will also need to increase our hiring if we are not able to
maintain our attrition rate through our current recruiting and retention policies. Increased competition for employees could have an adverse effect on our ability toexpand our business and service our customers, as well as cause us to incur greater personnel expenses and training costs.
18
Table of Contents General economic, political and market forces and dislocations beyond our control could reduce demand for our solutions and harm our business.
The demand for our solutions may be impacted by domestic and international factors that are beyond our control, including macroeconomic, political and
market conditions, the energy transition driven by climate change and decarbonization, the availability of short-term and long-term funding and capital, the leveland volatility of interest rates, currency exchange rates, and inflation. Any one or more of these factors may contribute to reduced activity and prices in thesecurities markets generally and could result in a reduction in demand for our solutions, which could have an adverse effect on our results of operations andfinancial condition. A significant additional decline in the value of assets for which risk is transferred in market transactions could have an adverse impact on thedemand for our solutions. We may incur substantial additional indebtedness in connection with future acquisitions.
In order to finance acquisitions, which are an important part of our long-term growth strategy, we may incur substantial additional indebtedness and suchincreased leverage could adversely affect our business. In particular, the increased leverage could increase our vulnerability to sustained, adverse macroeconomicweakness, limit our ability to obtain further financing and limit our ability to pursue other operational and strategic opportunities. The increased leverage, potentiallack of access to financing and increased expenses could have a material adverse effect on our financial condition, results of operations and cash flows. General economic uncertainties, including downward trends in the energy industry, could reduce demand by Wood Mackenzie’s customers for its products andservices.
Demand for Wood Mackenzie’s products and services may be negatively influenced by general economic uncertainties, particularly any downward trendsin the energy industry and the energy transition driven by climate change and decarbonization. Many factors could negatively affect the revenues, profits anddiscretionary spending of Wood Mackenzie’s customers. Such factors include commodity prices (in particular, oil and coal), the state of the local economy, interestrates, currency exchange rates, political uncertainty or restrictions and regulations, the availability of industry resources, and other matters. A downturn orperceived downturn in the economy, particularly the energy industry, could add pricing pressure, delay subscription renewals or lead to more challenging orprotracted fee negotiations or generally lower acceptance of our solutions by Wood Mackenzie’s customers, which could cause a decline in our revenues and havea material adverse effect on our financial condition, results of operations and cash flows.
19
Table of Contents Risks Related to Our Intellectual Property and Cybersecurity Fraudulent or unpermitted data access and other cyber-security or privacy breaches may negatively impact our business and harm our reputation.
Security breaches in our facilities, computer networks, and databases may cause harm to our business and reputation and result in a loss of customers.Many of our solutions involve the storage and transmission of proprietary information and sensitive or confidential data. As with other global companies, oursystems are regularly subject to cyber-attacks, cyber-threats, attempts at fraudulent access, physical break-ins, computer viruses, attacks by hackers and similardisruptive problems. As cyber-threats continue to evolve, we are required to expend significant additional resources to continue to modify and enhance ourprotective measures and to investigate and remediate any information security vulnerabilities and incidents. Despite efforts to ensure the integrity of our systemsand implement controls, processes, policies and other protective measures, we may not be able to anticipate or detect all security breaches, nor may we be able toimplement guaranteed preventive measures against such security breaches. Cyber-threats are rapidly evolving and we may not be able to anticipate, prevent ordetect all such attacks and could be held liable for any security breach or loss.
Third-party contractors, including cloud-based service providers, also may experience security breaches involving the storage and transmission of
proprietary information. If users gain improper access to our databases, they may be able to steal, publish, delete or modify confidential third-party information thatis stored or transmitted on our networks. Our business relies on the secure processing, transmission, storage and retrieval of confidential, proprietary and otherinformation in our computer and data management systems and networks, and in the computer and data management systems and networks of third parties. Inaddition, to access our network, products and services, our customers and other third parties may use personal mobile devices or computing devices that are outsideof our network environment and are subject to their own cybersecurity risks.
In addition, customers’, employees’ or other’s misuse of and/or gaining fraudulent or unpermitted access to or failure to properly secure our information
or services could cause harm to our business and reputation and result in loss of customers. Any such misappropriation and/or misuse of or failure to properlysecure our information could result in us, among other things, being in breach of certain data protection and related legislation.
A security or privacy breach may affect us in the following ways:
• deterring customers from using our solutions; • deterring data suppliers from supplying data to us; • harming our reputation; • exposing us to liability; • increasing operating expenses to correct problems caused by the breach; • affecting our ability to meet customers’ expectations; and/or • causing inquiry from governmental authorities.
Incidents in which consumer data has been fraudulently or improperly acquired or viewed, or any other security or privacy breaches, have in the past
occurred, and may in the future occur and could go undetected. The number of potentially affected consumers identified by any future incidents is inherentlyuncertain. Any such incident could materially adversely affect our business, reputation, financial condition, operating results and cash flows. In addition, media orother reports of perceived security vulnerabilities to our systems or those of our third-party suppliers, even if no breach has been attempted or occurred, could alsoadversely impact our reputation and materially impact our business.
20

Table of Contents We could face claims for intellectual property infringement, which if successful could restrict us from using and providing our technologies and solutions toour customers.
There has been substantial litigation and other proceedings, particularly in the U.S., regarding patent and other intellectual property rights in the
information technology industry. There is a risk that we are infringing, or may in the future infringe, the intellectual property rights of third parties. We have, fromtime-to-time, been subject to litigation alleging intellectual property infringement. We monitor third-party patents and patent applications that may be relevant toour technologies and solutions and we carry out freedom to operate analysis where we deem appropriate. However, such monitoring and analysis has not been, andis unlikely in the future to be, comprehensive, and it may not be possible to detect all potentially relevant patents and patent applications. Since the patentapplication process can take several years to complete, there may be currently pending applications, unknown to us, that may later result in issued patents thatcover our products and technologies. As a result, we may infringe existing and future third-party patents of which we are not aware. As we expand our operationsthere is a higher risk that such activity could infringe the intellectual property rights of third parties.
Third-party intellectual property infringement claims and any resultant litigation against us or our technology partners or providers, could subject us to
liability for damages, restrict us from using and providing our technologies and solutions or operating our business generally, or require changes to be made to ourtechnologies and solutions. Even if we prevail, litigation is time consuming and expensive to defend and would result in the diversion of management’s time andattention.
If a successful claim of infringement is brought against us and we fail to develop non-infringing technologies and solutions or to obtain licenses on a
timely and cost-effective basis, this could materially adversely affect our business, reputation, financial condition, operating results, and cash flows. We may lose key business assets, through the loss of data center capacity or the interruption of telecommunications links, the internet, or power sources, whichcould significantly impede our ability to do business.
Our operations depend on our ability, as well as that of third-party service providers to whom we have outsourced several critical functions, to protect
data centers, whether in cloud or dedicated environments, and related technology against damage from hardware failure, fire, flood, power loss,telecommunications failure, impacts of terrorism, breaches in security (such as the actions of computer hackers), natural disasters, or other disasters. Certain of ourfacilities are located in areas that could be impacted by coastal flooding, earthquakes or other disasters. The online services we provide are dependent on links totelecommunications providers. In addition, we generate a significant amount of our revenues through telesales centers and websites that we utilize in theacquisition of new customers, fulfillment of solutions and services and responding to customer inquiries. We may not have sufficient redundant operations to covera loss or failure in all of these areas in a timely manner. Certain of our customer contracts provide that our online servers may not be unavailable for specifiedperiods of time. Any damage to our or our third-party service provider’s data centers, failure of our telecommunications links or inability to access these telesalescenters or websites could cause interruptions in operations that materially adversely affect our ability to meet customers’ requirements, resulting in decreasedrevenue, operating income and earnings per share.
21

Table of Contents Risks Related to Legal, Regulatory and Compliance Matters We will continue to rely upon proprietary technology rights, and if we are unable to protect them, our business could be harmed.
Our success depends, in part, upon our intellectual property rights. To date, we have relied primarily on a combination of copyright, patent, trade secret,
and trademark laws and nondisclosure and other contractual restrictions on copying and distribution to protect our proprietary technology. This protection of ourproprietary technology is limited, and our proprietary technology could be used by others without our consent. In addition, patents may not be issued with respectto our pending or future patent applications, and our patents may not be upheld as valid or may not prevent the development of competitive products. Businesseswe acquire also often involve intellectual property portfolios, which increase the challenges we face in protecting our strategic advantage. Any disclosure, loss,invalidity of, or failure to protect our intellectual property could negatively impact our competitive position, and ultimately, our business. Our protection of ourintellectual property rights in the U.S. or abroad may not be adequate and others, including our competitors, may use our proprietary technology without ourconsent. Furthermore, litigation may be necessary to enforce our intellectual property rights, to protect our trade secrets, or to determine the validity and scope ofthe proprietary rights of others. Such litigation could result in substantial costs and diversion of resources and could harm our business, financial condition, resultsof operations, and cash flows.
Regulatory developments could negatively impact our business.
Because personal, public and non-public information is stored in some of our databases, we are vulnerable to government regulation and adverse publicity
concerning the use of our data. We provide many types of data and services that already are subject to regulation under the Fair Credit Reporting Act, Gramm-Leach-Bliley Act, Driver’s Privacy Protection Act, the European Union’s General Data Protection Regulation, the Dodd Frank Wall Street Reform and ConsumerProtection Act and to a lesser extent, various other federal, state, and local laws and regulations. These laws and regulations are designed to protect the privacy ofthe public and to prevent the misuse of personal information in the marketplace. However, many consumer advocates, privacy advocates, and governmentregulators believe that the existing laws and regulations do not adequately protect privacy. They have become increasingly concerned with the use of personalinformation, particularly social security numbers, department of motor vehicle data and dates of birth. As a result, they are lobbying for further restrictions on thedissemination or commercial use of personal information to the public and private sectors. Similar initiatives are under way in other countries in which we dobusiness or from which we source data. We have implemented various measures to comply with the data privacy and protection principles of the European Union’sGeneral Data Protection Regulation, however, there can be no assurances that such methods will be deemed fully compliant. If we are unable to comply with thedata privacy and protection principles adopted pursuant to the General Data Protection Regulation, it will impede our ability to conduct business between the U.S.and the E.U. which could have a material adverse effect on our business, financial position, results of operations or cash flows.
The following legal and regulatory developments also could have a material adverse effect on our business, financial position, results of operations or
cash flows: • amendment, enactment, or interpretation of laws and regulations which restrict the access and use of personal information and reduce the supply of
data available to customers; • changes in cultural and consumer attitudes to favor further restrictions on information collection and sharing, which may lead to regulations that
prevent full utilization of our solutions; • failure of our solutions to comply with current and future laws and regulations; and • failure of our solutions to adapt to changes in the regulatory environment in an efficient, cost-effective manner.
22

Table of Contents Our financial position may be impacted by audit examinations or changes in tax laws or tax rulings.
Our existing corporate structure and tax positions have been implemented in a manner in which we believe is compliant with current prevailing tax laws.
However, changes in existing tax laws or rulings, including Federal, State and International, could have a significant impact on our effective tax rate, cash taxpositions and deferred tax assets and liabilities. Tax audit examinations with an adverse outcome could have a negative effect in the jurisdictions in which weoperate. Furthermore, the Organization for Economic Co-operation and Development (OECD) released its Base Erosion and Profit Shifting (BEPS) action planswhich may also lead to future tax reform that could affect our results. In addition, our tax positions are impacted by fluctuations in our earnings and financialresults in the various countries in which we do business. We are subject to antitrust, consumer protection, intellectual property and other litigation, as well as governmental investigations, and may in the futurebecome further subject to such litigation and investigations; an adverse outcome in such litigation or investigations could have a material adverse effect on ourfinancial condition, revenues and profitability.
We participate in businesses (particularly insurance-related businesses and services) that are subject to substantial litigation, including antitrust, consumer
protection and intellectual property litigation. In addition, our insurance specialists are in the business of providing advice on standard contract terms, which ifchallenged could expose us to substantial reputational harm and possible liability. We are subject to the provisions of a 1995 settlement agreement in an antitrustlawsuit brought by various state Attorneys General and private plaintiffs, which imposes certain constraints with respect to insurer involvement in our governanceand business.
Our failure to successfully defend or settle any litigation or resolve any governmental investigation could result in liability that, to the extent not covered
by our insurance, could have a material adverse effect on our financial condition, revenues and profitability. Given the nature of our business, we may be subject tolitigation or investigation in the future. Even if the direct financial impact of such litigation or investigations is not material, settlements or judgments arising out ofsuch litigation or investigations could include further restrictions on our ability to conduct business, including potentially the elimination of entire lines of business,which could increase our cost of doing business and limit our prospects for future growth.
23

Table of Contents Risks Related to International Operations
We are subject to competition in many of the markets in which we operate and we may not be able to compete effectively.
Some markets in which we operate or which we believe may provide growth opportunities for us are highly competitive, and are expected to remain
highly competitive. We compete on the basis of quality, customer service, product and service selection, and pricing. Our competitive position in various marketsegments depends upon the relative strength of competitors in the segment and the resources devoted to competing in that segment. Due to their size, certaincompetitors may be able to allocate greater resources to a particular market segment than we can. As a result, these competitors may be in a better position toanticipate and respond to changing customer preferences, emerging technologies and market trends. In addition, new competitors and alliances may emerge to takemarket share away, and as we enter into new lines of business, due to acquisition or otherwise, we face competition from new players with different competitivedynamics. We may be unable to maintain our competitive position in our market segments, especially against larger competitors. We may also invest further toupgrade our systems in order to compete. If we fail to successfully compete, our business, financial position and results of operations may be adversely affected. Our operations are subject to additional risks inherent in international operations.
Wood Mackenzie is based in the United Kingdom and conducts its principal operations outside the U.S. Conducting extensive international operationssubjects us to risks that are inherent in international operations, including challenges posed by different pricing environments and different forms of competition;lack of familiarity and burdens of complying with foreign laws, legal standards, regulatory requirements, tariffs and other barriers; unexpected changes inregulatory requirements, taxes, trade laws, tariffs, export quotas, custom duties, or other trade restrictions; differing technology standards; difficulties in collectingaccounts receivable; difficulties in managing and staffing international operations; varying expectations as to employee standards; potentially adverse taxconsequences, including possible restrictions on the repatriation of earnings; and reduced or varied protection for intellectual property rights in some countries. Inaddition, our international operations subject us to obligations associated with anti-corruption laws and regulations, such as the U.K. Bribery Act 2010, the U.S.Foreign Corrupt Practices Act and regulations established by the U.S. Office of Foreign Assets Control. Government agencies and authorities have a broad range ofcivil and criminal penalties they may seek to impose against companies for violations of export controls, anti-corruption laws or regulations, and other laws, rules,sanctions, embargoes, and regulations.
Moreover, international operations could be interrupted and negatively affected by economic changes, geopolitical regional conflicts, terrorist activity,
political unrest, civil strife, acts of war, and other economic or political uncertainties. All of these risks could result in increased costs or decreased revenues, eitherof which could have a material adverse effect on our financial condition, results of operations and cash flows.
We are subject to the increased risk of exchange rate fluctuations.
As a result of our acquisition of Wood Mackenzie and other recent acquisitions outside of the U.S., we face greater exposure to movements in currencyexchange rates, which may cause our revenue and operating results to differ materially from expectations. Our operating results could be negatively affecteddepending on the amount of revenue and expense denominated in foreign currencies. As exchange rates vary, revenue, cost of revenue, operating expenses, andother operating results, when remeasured in U.S. dollars, may differ materially from expectations. Although we may apply certain strategies to mitigate foreigncurrency risk, these strategies may not eliminate our exposure to foreign exchange rate fluctuations and would involve costs and risks of their own, such as ongoingmanagement time and expertise, external costs to implement the strategies and potential accounting implications.
24
Table of Contents Risks Related to Our Common Stock If there are substantial sales of our common stock, our stock price could decline.
The market price of our common stock could decline as a result of sales of a large number of shares of our common stock in the market, or the perceptionthat these sales could occur. These sales, or the possibility that these sales may occur, also might make it more difficult for us to sell equity securities in the futureat a time and at a price that we deem attractive. As of December 31, 2021, our ten largest shareholders owned 36.1% of our common stock, including 2.6% of ourcommon stock owned by our Employee Stock Ownership Plan or ESOP. Such stockholders are able to sell their common stock in the public market from time totime without registration, and subject to limitations on the timing, amount and method of those sales imposed by securities laws. If any of these stockholders wereto sell a large number of their common stock, the market price of our common stock could decline significantly. In addition, the perception in the public marketsthat sales by them might occur could also adversely affect the market price of our common stock.
Pursuant to our equity incentive plans, options to purchase approximately 5,608,239 shares of common stock were outstanding as of February 18, 2022.
We filed a registration statement under the Securities Act, which covers the shares available for issuance under our equity incentive plans (including for suchoutstanding options) as well as shares held for resale by our existing stockholders that were previously issued under our equity incentive plans. Such furtherissuance and resale of our common stock could cause the price of our common stock to decline.
Also, in the future, we may issue our securities in connection with investments and acquisitions. The amount of our common stock issued in connection
with an investment or acquisition could constitute a material portion of our then outstanding common stock. Our capital structure, level of indebtedness and the terms of anti-takeover provisions under Delaware law and in our amended and restated certificate ofincorporation and bylaws could diminish the value of our common stock and could make a merger, tender offer or proxy contest difficult or could impede anattempt to replace or remove our directors.
We are a Delaware corporation and the anti-takeover provisions of the Delaware General Corporation Law may discourage, delay or prevent a change in
control by prohibiting us from engaging in a business combination with an interested stockholder for a period of three years after the person becomes an interestedstockholder, even if a change of control would be beneficial to our existing stockholders. In addition, our certificate of incorporation and bylaws may discourage,delay or prevent a change in our management or control over us that stockholders may consider favorable or make it more difficult for stockholders to replacedirectors even if stockholders consider it beneficial to do so. Our certificate of incorporation and bylaws:
• authorize the issuance of “blank check” preferred stock that could be issued by our Board of Directors to increase the number of outstanding shares
to thwart a takeover attempt, • prohibit cumulative voting in the election of directors, which would otherwise allow holders of less than a majority of the stock to elect some
directors, • require that vacancies on the Board of Directors, including newly created directorships, be filled only by a majority vote of directors then in office, • limit who may call special meetings of stockholders, • prohibit stockholder action by written consent, requiring all stockholder actions to be taken at a meeting of the stockholders, and • establish advance notice requirements for nominating candidates for election to the Board of Directors or for proposing matters that can be acted
upon by stockholders at stockholder meetings. In addition, Section 203 of the Delaware General Corporation Law may inhibit potential acquisition bids for us. As a public company, we are subject to
Section 203, which regulates corporate acquisitions and limits the ability of a holder of 15.0% or more of our stock from acquiring the rest of our stock. UnderDelaware law, a corporation may opt out of the anti-takeover provisions, but we do not intend to do so.
These provisions may prevent a stockholder from receiving the benefit from any premium over the market price of our common stock offered by a bidderin a potential takeover. Even in the absence of an attempt to effect a change in management or a takeover attempt, these provisions may adversely affect theprevailing market price of our common stock if they are viewed as discouraging takeover attempts in the future.
25
Table of Contents
Item 1B. Unresolved Staff Comments
Not Applicable.
Item 2. Properties Our headquarters are in Jersey City, New Jersey. As of December 31, 2021, our principal offices consisted of the following properties:
Location Square Feet Lease Expiration DateJersey City, New Jersey 352,765 December 31, 2033Lehi, Utah 200,000 January 31, 2024Boston, Massachusetts 115,271 November 30, 2030White Plains, New York 66,303 June 29, 2025Houston, Texas 56,584 April 30, 2023
We also lease offices in 21 states in the U.S., and offices outside the U.S. to support our international operations in Australia, Bahrain, Brazil, Bulgaria,
Canada, China, Czech Republic, Denmark, France, Germany, India, Indonesia, Ireland, Israel, Italy, Japan, Malaysia, Mexico, Nepal, Netherlands, New Zealand,Poland, Russia, Singapore, South Africa, South Korea, Spain, the United Arab Emirates, and the U.K.
We believe that our properties are in good operating condition and adequately serve our current business operations. We also anticipate that suitable
additional or alternative space, including those under lease options, will be available at commercially reasonable terms for future expansion.
Item 3. Legal Proceedings See Note 21, Commitments and Contingencies, to the consolidated financial statements included in Item 8 Part II of this 10-K for information regarding
certain legal proceedings in which we are involved.
Item 4. Mine Safety Disclosures Not Applicable.
26
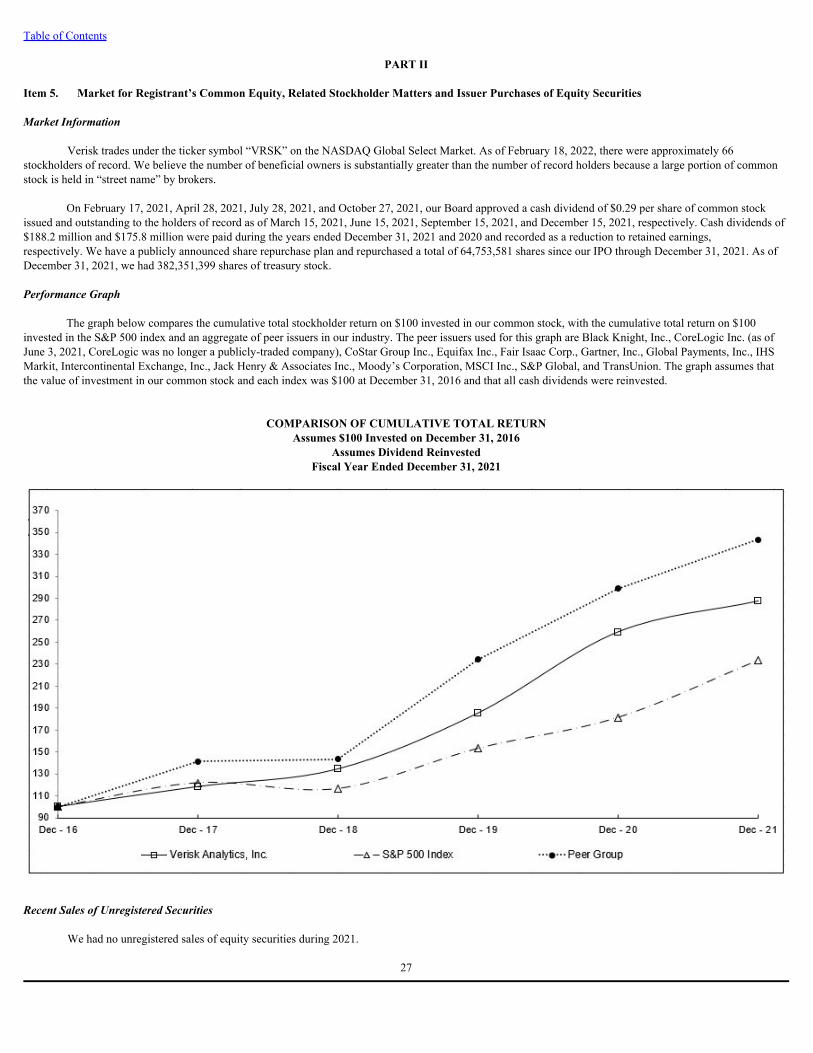
Table of Contents
PART II
Item 5. Market for Registrant’s Common Equity, Related Stockholder Matters and Issuer Purchases of Equity Securities Market Information
Verisk trades under the ticker symbol “VRSK” on the NASDAQ Global Select Market. As of February 18, 2022, there were approximately 66stockholders of record. We believe the number of beneficial owners is substantially greater than the number of record holders because a large portion of commonstock is held in “street name” by brokers.
On February 17, 2021, April 28, 2021, July 28, 2021, and October 27, 2021, our Board approved a cash dividend of $0.29 per share of common stock
issued and outstanding to the holders of record as of March 15, 2021, June 15, 2021, September 15, 2021, and December 15, 2021, respectively. Cash dividends of$188.2 million and $175.8 million were paid during the years ended December 31, 2021 and 2020 and recorded as a reduction to retained earnings,respectively. We have a publicly announced share repurchase plan and repurchased a total of 64,753,581 shares since our IPO through December 31, 2021. As ofDecember 31, 2021, we had 382,351,399 shares of treasury stock. Performance Graph
The graph below compares the cumulative total stockholder return on $100 invested in our common stock, with the cumulative total return on $100
invested in the S&P 500 index and an aggregate of peer issuers in our industry. The peer issuers used for this graph are Black Knight, Inc., CoreLogic Inc. (as ofJune 3, 2021, CoreLogic was no longer a publicly-traded company), CoStar Group Inc., Equifax Inc., Fair Isaac Corp., Gartner, Inc., Global Payments, Inc., IHSMarkit, Intercontinental Exchange, Inc., Jack Henry & Associates Inc., Moody’s Corporation, MSCI Inc., S&P Global, and TransUnion. The graph assumes thatthe value of investment in our common stock and each index was $100 at December 31, 2016 and that all cash dividends were reinvested.
COMPARISON OF CUMULATIVE TOTAL RETURNAssumes $100 Invested on December 31, 2016
Assumes Dividend ReinvestedFiscal Year Ended December 31, 2021
Recent Sales of Unregistered Securities
We had no unregistered sales of equity securities during 2021.
27

Table of Contents Issuer Purchases of Equity Securities
Our Board of Directors has authorized a share repurchase program ("Repurchase Program"), of up to $4.6 billion, inclusive of the $500.0 millionauthorization approved by the board on August 17, 2021. As of December 31, 2021, $603.8 million remains available for share repurchases. In December 2020,March 2021, June 2021, and September 2021, we entered into four Accelerated Share Repurchase ("ASR") agreements to repurchase shares of our common stockfor an aggregate purchase price of $400.0 million. These ASRs were settled in February 2021, May 2021, September 2021, and December 2021. In December2021, we entered into an additional ASR agreement to repurchase shares of our common stock for an aggregate purchase price of $100.0 million. This ASR wassettled in February 2022. Please refer to Note 22. Subsequent Events, for more information. Under the Repurchase Program, we may repurchase stock in themarket or as otherwise determined by us. These authorizations have no expiration dates and may be suspended or terminated at any time. Since the introduction ofshare repurchase as a feature of our capital management strategies in 2010, we have repurchased shares with an aggregated value of $3,996.2 million. On February16, 2022, our Board of Directors approved an additional share repurchase authorization of $1.0 billion. Our share repurchases for the quarter ended December 31,2021 are set forth below:
Period Total Number ofShares Purchased
Average Price Paid perShare
Total Number of SharesPurchased as Part of
Publicly Announced Plansor Programs
Approximate Dollar Valueof Shares that May Yet BePurchased Under the Plans
or Programs (in millions) October 1, 2021 through October 31, 2021 299,596(1) $ 200.27(1) 299,596 $ 603.8 November 1, 2021 through November 30, 2021 — $ — — $ 603.8 December 1, 2021 through December 31, 2021 52,815(1) $ 212.82(1) 52,815 $ 603.8 352,411(1) $ 212.82(1) 352,411 _______________(1) In September 2021, we entered into an ASR agreement to repurchase shares of our common stock for an aggregate purchase price of $75.0 million with WellsFargo Bank. The ASR agreement is accounted for as a treasury stock transaction and a forward stock purchase agreement indexed to our common stock. Upon thepayment of the aggregate purchase price of $75.0 million on October 1, 2021, we received 299,596 shares of our common stock at a price of $200.27 per share.Upon final settlement in December 2021, we received an additional 52,815 shares as determined by the daily volume weighted average share price of our commonstock during the term of the ASR agreement, bringing the total shares received under this ASR agreement to 352,411 and a final average price paid of $212.82 pershare.
28

Table of Contents Item 6. [Reserved]
29
Table of Contents Item 7. Management’s Discussion and Analysis of Financial Condition and Results of Operations
The following discussion should be read in conjunction with our historical financial statements and the related notes included elsewhere in this annual
report on Form 10-K. This discussion contains forward-looking statements that involve risks and uncertainties, including the impact of the 2019 novel coronavirus("COVID-19"). Our actual results may differ materially from those discussed in or implied by any of the forward-looking statements as a result of various factors,including but not limited to those listed under “Risk Factors” and “Special Note Regarding Forward-Looking Statements.”
This discussion includes a comparison of our results of operations, liquidity and capital resources, financing and financing capacity and cash flow for theyears ended December 31, 2021 and 2020. A discussion of changes in our results of operations and cash flows for the years ended December 31, 2020 and 2019can be found in "Item 7. Management's Discussion and Analysis of Financial Condition and Results of Operations" within the annual report on Form 10-K for theyear ended December 31, 2020 filed on February 23, 2021.
We are a leading data analytics provider serving customers in insurance, energy and specialized markets, and financial services. Using advancedtechnologies to collect and analyze billions of records, we draw on unique data assets and deep domain expertise to provide innovations that may be integrated intocustomer workflows. We offer predictive analytics and decision support solutions to customers in rating, underwriting, claims, catastrophe and weather risk, globalrisk analytics, natural resources intelligence, economic forecasting, commercial banking and finance, and many other fields. In the U.S., and around the world, wehelp customers protect people, property, and financial assets. Refer to Item 1. Business for further discussion.
Our customers use our solutions to make better decisions about risk and opportunities with greater efficiency and discipline. We refer to these products
and services as “solutions” due to the integration among our services and the flexibility that enables our customers to purchase components or the comprehensivepackage. These solutions take various forms, including data, statistical models, or tailored analytics, all designed to allow our customers to make more logicaldecisions. We believe our solutions for analyzing risk positively impact our customers’ revenues and help them better manage their costs.
Our Insurance segment provides underwriting and ratings, and claims insurance data for the U.S. P&C insurance industry. This segment's revenues
represented approximately 73% and 72% of our revenues for the years ended December 31, 2021 and 2020, respectively. Our Energy and Specialized Marketssegment provides research and consulting data analytics for the global energy, chemicals, and metals and mining industries. Our Energy and Specialized Marketssegment's revenues represented approximately 22% of our revenues for the years ended December 31, 2021 and 2020. Our Financial Services segment providescompetitive benchmarking, decisioning algorithms, business intelligence, and customized analytic services to financial institutions, payment networks andprocessors, alternative lenders, regulators and merchants. Our Financial Services segment's revenues represented approximately 5% and 6% of our revenues for theyears ended December 31, 2021 and 2020, respectively.
COVID-19
Since January 2020, an outbreak of COVID-19 has evolved into a worldwide pandemic. We have modified our operations in line with our businesscontinuity plans due to COVID-19. While our facilities generally remain open, we are making extensive use of the work-from-home model at this moment. On adaily basis, management is reviewing our operations and there have been to date minimal interruptions in our customer-facing operations. Given the digital natureof our business and the move toward cloud enablement, we expect to remain operationally stable and fully available to our customers. We are in compliance withall financial and non-financial covenants and have not observed a loss of any significant customers, a significant deterioration in the collectability of receivables, asignificant reduction in our liquidity, nor a significant decline in the subscription renewal rates.
We have analyzed our solutions and services to assess the impact of COVID-19 on our revenue streams. We have not identified any material impactstemming from COVID-19 on approximately 85% of our revenues at this point, as much of these revenues are subscription in nature and subject to long-termcontracts. These revenues grew approximately 6% for the year ended December 31, 2021.
Of the remaining 15%, we have identified specific solutions and services, largely transactional in nature, that are being impacted by COVID-19. Theprimary causal factors are lower auto and travel insurance activity, the inability to enter commercial buildings to perform engineering analyses, decreased capitalexpenditure in the energy sector, and reduced levels of advertising by financial institutions and marketers. The portion of our revenue that is attributable to thesesolutions has been negatively impacted by COVID-19 beginning in March 2020 with the onset of the pandemic. These revenues increased approximately 1% forthe year ended December 31, 2021 as compared to the same period in 2020. As the global outbreak of COVID-19 continues to evolve, management continues toclosely monitor its impact on our business.
30

Table of Contents Recent Developments
As of December 31, 2021, we reassessed the recoverability of the long-lived assets for our Financial Services reporting unit based upon the weaker thanexpected operating performance as a result of changing market conditions. These conditions constituted a triggering event, which resulted in a$134.0 million impairment to the long-lived assets for our Financial Services reporting unit including $88.2 million to intangible assets and $45.8 million to fixedassets. We based our analysis of the fair value of our long-lived assets on the indication of fair value provided by the offer to purchase such reporting unit, whichwas approved by our Board of Directors on February 16, 2022. This impairment is included within "Other operating loss (income)" in our accompanyingconsolidated statement of operations.
On January 12, 2022, our Board of Directors approved the action to make our environmental health and safety business within the Energy & Specialized
Markets segment available for immediate sale at its current fair value. On January 21, 2022, we entered into a stock purchase agreement (the “PurchaseAgreement”) to sell 3E Company Environmental, Ecological and Engineering ("3E") to Tamarack Buyer, L.L.C. (“Buyer”) in exchange for a potential aggregatecash consideration of up to $950.0 million. Buyer is an entity that was formed on behalf of, and is controlled by, certain investment funds affiliated with NewMountain Capital, L.L.C. (“New Mountain”).
The purchase price consists of $630.0 million of cash consideration to be paid at the closing of the transaction (subject to customary purchase price
adjustments for, among other things, the cash, working capital and indebtedness of 3E as of the closing), up to $50.0 million of earnout payments based on 3E’sfinancial performance in 2023 and 2024, and up to $270.0 million of additional deferred payments based on New Mountain’s future return on its investment in 3E.
Buyer has secured financing, consisting of equity financing to be provided by certain investment funds affiliated with New Mountain and committed debtfinancing, to consummate the transaction. The closing of the transaction is not subject to a financing condition, but is subject to other customary conditions,including the expiration or termination of the applicable waiting period under the Hart-Scott-Rodino Act. There can be no assurance that these closing conditionswill be satisfied.
The Purchase Agreement contains representations, warranties and covenants of the parties that are customary for transactions of this type and that are
subject, in some cases, to specified exceptions and qualifications. Until the consummation of the transaction, we have agreed, subject to certain exceptions, to,conduct 3E’s business in the ordinary course consistent with past practice. The parties are required to use their respective commercially reasonable efforts to take,or cause to be taken, all actions necessary, proper or advisable under applicable laws to consummate the transaction. We will enter into a transition servicesagreement with Buyer at the closing of the transaction to ensure an orderly transition.
On February 11, 2022, we acquired 100 percent of the membership interest of Infutor Data Solutions, LLC ("Infutor"), for an aggregate net cash
consideration of $223.5 million, of which $1.5 million represents a working capital escrow, plus a contingent earn-out payment of up to $25.0 million subject to theachievement of certain revenue and other performance targets. Infutor, a leading provider of identity resolution and consumer intelligence data, has become a partof the underwriting & rating category within our Insurance segment. We believe this acquisition further enhances Verisk’s marketing solutions offerings tocompanies across several industries including the insurance industry.
On February 16, 2022, our Board of Directors approved the action to make our financial services business within the Financial Services segment available
for immediate sale at its current fair value. On February 21, 2022, we entered into a stock purchase agreement to sell our financial services business to TransUnion,a global information and insights company, for $515.0 million in cash consideration paid at closing. This transaction is subject to customary closing conditions,including regulatory approvals and working capital adjustments. Executive Summary
Key Performance Metrics
Revenue growth. We use year-over-year revenue growth as a key performance metric. We assess revenue growth based on our ability to generateincreased revenue through increased sales to existing customers, sales to new customers, sales of new or expanded solutions to existing and new customers, andstrategic acquisitions of new businesses.
We believe our business’s ability to grow recurring revenue and generate positive cash flow is the key indicator of the successful execution of our
business strategy. We use year-over-year revenue and EBITDA growth as metrics to measure our performance. EBITDA and EBITDA margin are non-GAAPfinancial measures. EBITDA is defined as net income before interest expense, provision for income taxes, and depreciation and amortization of fixed andintangible assets. We calculate EBITDA margin as EBITDA divided by revenues. The respective nearest applicable GAAP financial measures are net income andnet income margin. Although EBITDA is a non-GAAP financial measure, EBITDA is frequently used by securities analysts, lenders, and others in their evaluationof companies; EBITDA has limitations as an analytical tool, and should not be considered in isolation, or as a substitute for an analysis of our operating income,net income, or cash flow from operating activities reported under GAAP. Management uses EBITDA and EBITDA margin in conjunction with traditional GAAPoperating performance measures as part of its overall assessment company performance. We believe these measures are useful and meaningful because they helpus allocate resources, make business decisions, allow for greater transparency regarding our operating performance, and facilitate period-to-periodcomparisons. Some of these limitations involved in the use of EBITDA are:
• EBITDA does not reflect our cash expenditures, or future requirements for capital expenditures or contractual commitments. • EBITDA does not reflect changes in, or cash requirements for, our working capital needs. • Although depreciation and amortization are non-cash charges, the assets being depreciated and amortized often will have to be replaced in the future and
EBITDA does not reflect any cash requirements for such replacements.

• Other companies in our industry may calculate EBITDA differently than we do, limiting its usefulness as a comparative measure. EBITDA growth. We use EBITDA growth as a measure of our ability to balance the size of revenue growth with cost management and investing for
future growth. EBITDA growth allows for greater transparency regarding our operating performance and facilitate period-to-period comparison. EBITDA margin. We use EBITDA margin as a performance measure to assess segment performance and scalability of our business. We assess EBITDA
margin based on our ability to increase revenues while controlling expense growth.
31
Table of Contents
Revenues
We earn revenues through agreements for hosted subscriptions, advisory/consulting services, and for transactional solutions, recurring and non-recurring.Subscriptions for our solutions are generally paid in advance of rendering services either quarterly or in full upon commencement of the subscription period, whichis usually for one year and automatically renewed each year. As a result, the timing of our cash flows generally precedes our recognition of revenues and incomeand our cash flow from operations tends to be higher in the first quarter as we receive subscription payments. Examples of these arrangements includesubscriptions that allow our customers to access our standardized coverage language, our claims fraud database, or our actuarial services throughout thesubscription period. In general, we experience minimal revenue seasonality within the business.
Approximately 81% and 82% of the revenues in our Insurance segment for the years ended December 31, 2021 and 2020 were derived from hosted
subscriptions through agreements (generally one to five years) for our solutions, respectively. Our customers in this segment include most of the P&C insuranceproviders in the U.S. Approximately 83% and 85% of the revenues in our Energy and Specialized Markets segment for the years ended December 31, 2021 and2020 were derived from hosted subscriptions with long-term agreements for our solutions, respectively. Our customers in this segment include most of the top 10global energy providers around the world. Approximately 83% and 77% of the revenues in our Financial Services segment for the years ended December 31, 2021and 2020 were derived from subscriptions with long-term agreements for our solutions, respectively. Our customers in this segment include financial institutions,payment networks and processors, alternative lenders, regulators, merchants, and the top 30 credit card issuers in North America, the United Kingdom, andAustralia.
We also provide advisory/consulting services, which help our customers get more value out of our analytics and their subscriptions. In addition, certain of
our solutions are paid for by our customers on a transactional basis, recurring and non-recurring. For example, we have solutions that allow our customers to accessproperty-specific rating and underwriting information to price a policy on a commercial building, or compare a P&C insurance or a workers' compensation claimwith information in our databases, or use our repair cost estimation solutions on a case-by-case basis. For the years ended December 31, 2021 and 2020,approximately 19% and 18%, respectively, of our consolidated revenues were derived from providing transactional and advisory/consulting solutions.
Principal Operating Costs and Expenses
Personnel expenses are a major component of both our cost of revenues and selling, general and administrative expenses. Personnel expenses, whichrepresented approximately 55% and 59% of ourtotal operating expenses for each of the years ended December 31, 2021 and 2020, respectively, include salaries,benefits, incentive compensation, equity compensation costs, sales commissions, employment taxes, recruiting costs, and outsourced temporary agency costs.
We assign personnel expenses between two categories, cost of revenues and selling, general and administrative costs, based on the actual costs associated
with each employee. We categorize employees who maintain our solutions as cost of revenues, and all other personnel, including executive managers, salespeople,marketing, business development, finance, legal, human resources, and administrative services, as selling, general and administrative expenses. A significantportion of our other operating costs, such as facilities and communications, are either captured within cost of revenues or selling, general and administrativeexpense based on the nature of the work being performed.
While we expect to grow our headcount over time to take advantage of our market opportunities, we believe that the economies of scale in our operating
model will allow us to grow our personnel expenses at a lower rate than revenues. Historically, our EBITDA margin has improved because we have been able toincrease revenues without a proportionate corresponding increase in expenses. However, part of our corporate strategy is to invest in new solutions and newbusinesses, which may offset margin expansion.
Cost of Revenues. Our cost of revenues consists primarily of personnel expenses. Cost of revenues also includes the expenses associated with the
acquisition and verification of data, the maintenance of our existing solutions, and the development and enhancement of our next-generation solutions. Our cost ofrevenues excludes depreciation and amortization.
Selling, General and Administrative Expense. Our selling, general and administrative expense also consists primarily of personnel costs. A portion of the
other operating costs such as facilities, insurance, and communications are allocated to selling, general and administrative costs based on the nature of the workbeing performed by the employee. Our selling, general and administrative expenses excludes depreciation and amortization.
32

Table of Contents
Trends Affecting Our Business
We serve customers in three primary vertical markets: P&C insurance, energy and specialized markets, and financial services. The industry trends in eachof those markets can affect our business.
A significant change in P&C insurers’ profitability could affect the demand for our solutions. For insurers, the keys to profitability include increasing
investment income, premium growth and disciplined underwriting of risks. Investment income remains under pressure as a result of low interest rates. Growth inP&C insurers’ direct written premiums is cyclical, with total industry premium growth receding from a peak of 14.8% in 2002 to a trough of negative 3.1% in 2009and subsequently recovering to 4.4% in 2012, slowing down to 3.7% in 2015 and 2016, accelerating to 4.7% in 2017 and 5.5% in 2018, then again slowing downto 5.1% in 2019. In recent years, we have signed multi-year contracts with certain customers, and pricing is fixed at the beginning of each multi-year period;pricing for other customers is still linked to prior years' premiums. Direct premium growth slowed to 2.3% in 2020 due to COVID-19 pandemic, and premiums forpersonal automobile insurance actually declined. Based on the most recent results available, direct premium growth recovered in 2021, despite continuingdisruptions and uncertainties associated with the COVID-19 pandemic. In 2020 and 2021, insurers were also challenged by heightened catastrophic lossesassociated with a record number of events ISO's Property Claims Service classified as catastrophes in each of the years. The catastrophes of 2020 included thehurricane Laura and the Midwest derecho, both in August 2020, and multiple wildfires in the Western states, while the most notable events of 2021 included thewinter storm in February that left much of Texas without power and hurricane Ida in August. Both Ida and Laura are among the strongest hurricanes to ever makelandfall in the United States. These events illustrate the need for broader coverages, such as flood to meet the changing needs of communities. We continue toprovide the necessary resources to meet insurer needs. In the life insurance market, carriers are looking to modernize and digitize their core platforms, as well asoffer streamlined underwriting decision-making process to expand the number of policies which can be offered more rapidly, and without cumbersome medicaltests. Our no-code modular technology stack and advanced analytics (such as using electronic health records to model mortality and detecting of tobacco usethrough voice analysis) enable the digital transformation of our customers' core infrastructure and automate their decision-making processes across the policylifecycle.
Trends in catastrophe and non-catastrophe losses (such as from weather, climate, cyber, casualty, terrorism, pandemics, and tsunamis) can have an effect
on our customers’ profitability, and therefore on their appetite for buying analytics to help them manage their risks. Any increase or decrease in frequency orseverity of these events over time could lead to an increased or decreased demand for our catastrophe modeling, catastrophe loss information, and repair costsolutions. Likewise, any structural changes in the reinsurance and related brokerage industry from alternative capital or newer technologies could affect demand forour products. We also have a portion of our revenue related to the number of claims processed due to losses, which can be impacted by seasonal storm activity. Theneed by our customers to fight insurance fraud - both in claims and at policy inception - could lead to increased demand for our underwriting and claims solutions.
Trends in the energy, chemicals, metals and mining sectors, and activity in financial markets can influence our revenues. In 2021, global economic
growth, commodity flows and prices recovered strongly after being impacted negatively by the COVID-19 pandemic in 2020. Commodity markets performedimpressively, with Brent oil averaging $71 dollars per barrel in 2021, compared to an average of $42 dollars per barrel in 2020. Gas prices also increased from their2020 levels, as global energy demand recovered. Investment in the natural resources increased in 2021, following a sharp decline in 2020. We expect investment tocontinue to increase this year as natural resources companies reinvest the higher cashflows generated from their operations as a result of the significantly highercommodity prices seen in 2021. However, natural resources companies are also expected to demonstrate capital discipline, using higher commodity prices as anopportunity to build stronger balance sheets and to return capital to shareholders. The energy transition continues to gather pace. Governments and companies in allareas of our customer base globally are setting targets for the reduction in CO2 emissions and are adjusting their investment plans to take into account expectedchanges in energy demand, regulation and consumer behavior. The transition presents both a threat and an opportunity for the sector and our revenues. Fossil fuelswill meet much of global demand for some decades, but investments in zero carbon energy (renewables and emerging technologies such as electric vehicles andenergy storage) and the associated infrastructure will grow in importance. Electrification of economies will drive demand for base metals, some bulk commoditiesand battery raw materials. Climate change and decarbonization are rising up the agenda, and policy on environmental and social governance is intensifying.Attracting the capital needed to meet future energy demand is one of the industry’s challenges and data, analysis and insight will help our customers achieve this.
Trends in the banking and retail sectors, as well as material external factors can influence revenues in our Financial Services segment in many ways.
COVID-19 has had a significant impact on our one-time consultative revenue streams over the past year as our clients sought to temporarily reduce externalexpenditure while they focused on critical customer needs. Additionally, governmental intervention and actions to support indebted consumers by extending creditterms has created a lag in bankruptcy and similar filings which have adversely impacted our credit analytics business, but we do believe this is a temporary impactwhich will reverse over time. As retailers saw reduced consumer spend due to COVID-19 however, this created an opportunity for our spend analytics businessesto work more closely with retailers to help them understand and target emerging spend as the economies in our markets re-emerged. Our sector specific trends haveremained broadly consistent with fraud and similar financial crimes continuing to impact our customers in ways ranging from regulatory risk and credit loss forfinancial institutions, to counterfeit loss and inventory shrinkage for merchants, with risks being elevated at times of financial stress. This can strengthen demandfor our credit risk and fraud solutions ranging from enhanced brand protection solutions for retailers, through to enhanced artificial-intelligence led models toidentify cross bank and cross-border fraudulent transactions. We continue to see increasing competition for traditional retail banks and consumer lenders fromfinancial technology companies and other on-line lending new entrants, which provides opportunities for us to support many existing and potential clients, with ourenhanced digital solutions and analytical tools providing new ways for us to communicate and engage with our clients today in our remote environment, and in thefuture.
33

Table of Contents
Description of Acquisitions
We acquired sixteen businesses since January 1, 2019. These acquisitions affect the comparability of our consolidated results of operations betweenperiods. See a description of our 2021 acquisitions below and Note 10. Acquisitions to our consolidated financial statements included in this annual report on Form10-K for further discussions.
2021 Acquisitions
On December 23, 2021, we acquired approximately 96.7 percent of the stock of ACTINEO GmbH ("ACTINEO") with an option to acquire the remainingshares at a future date, for a net cash purchase price of $148.9 million. ACTINEO offers a comprehensive portfolio of services, technology and data solutions tosupport the entire bodily injury settlement process. With this acquisition, we add ACTINEO's established claims management solutions to our leading dataanalytics and insurance ecosystem, providing customers with digitalization and medical expertise solutions throughout the entire claims process. ACTINEO is partof the claims vertical within our Insurance segment.
On November 2, 2021, we acquired 100 percent of the stock of Data Driven Safety, LLC ("Data Driven Safety") for a net cash purchase price of$93.5 million, of which $2.0 million represents indemnity escrows. Data Driven Safety, a leading public record data aggregation firm that specializes in driver riskassessment in the U.S., has become a part of the underwriting & rating category within our Insurance segment. We believe that Data Driven Safety will expand ourrobust auto insurance analytics, providing insurers with information to further refine underwriting, improve the customer experience and promote public safety.
On September 1, 2021, we acquired 100 percent of the stock of Ignite Software Systems Limited ("Ignite") for a net cash purchase price of $13.8 million.Ignite, a provider of insurance policy administration systems to brokers, managing general agents, and insurers, has become a part of the underwriting & ratingcategory within our Insurance segment. We believe that Ignite's client focus and deep domain knowledge will fit into our business model providing new andexisting clients with access to a broader expert advice and service.
On June 17, 2021, we acquired 100 percent of the stock of Roskill Holdings Limited ("Roskill") for a net cash purchase price of $22.1 million, ofwhich $4.8 million represents indemnity escrows. Roskill, a provider of metals and materials supply chain intelligence, has become part of our Energyand Specialized Markets segment. Roskill’s capabilities reinforce our ability to provide comprehensive analysis across the energy, and metals and mining valuechain while adding analysis, data, and insight on battery raw materials metals.
On March 2, 2021, we acquired a 51.0 percent ownership in Whitespace Software Limited ("Whitespace") for a net cash purchase price of $16.8 million.The remaining 49.0 percent ownership interest in Whitespace will be acquired by us, in three equal proportions over the next three years, at a purchase pricedetermined based upon a fixed revenue multiple and adjusted for any free cash flow shortfall. Whitespace, a provider of digital placing technology to the(re)insurance market, has become part of the underwriting & rating category within our Insurance segment. We expect our investment in Whitespace to enable aseamless real-time quote-to-bind electronic placing and global distribution solution, with straight-through submissions for our customers.
34

Table of Contents
Year Ended December 31, 2021 Compared to Year Ended December 31, 2020 Consolidated Results of Continuing Operations
Revenues
Revenues were $2,998.6 million for the year ended December 31, 2021 compared to $2,784.6 million for the year ended December 31, 2020, an increase
of $214.0 million or 7.7%. Our recent acquisitions (Franco Signor, Jornaya, Whitespace, Ignite Software Systems, Data Driven Safety within the underwriting &rating category of the Insurance segment, ACTINEO within the claims category of the Insurance segment, and Roskill within the Energy and Specialized Marketssegment) and dispositions (the aerial imagery sourcing group and the compliance background screening business within the claims category of the Insurancesegment and the data warehouse business within the Financial Services segment) contributed net revenues of $53.7 million. The remaining growth in consolidatedrevenues of $160.3 million or 5.8% is related to the following: revenues within our Insurance segment increased $146.0 million or 7.3%; revenues withinour Energy and Specialized Markets segment increased $26.8 million or 4.3%; offset by revenues within our Financial Services segment which decreased$12.5 million or 8.1%. Refer to the Results of Operations by Segment within this section for more information regarding our revenues.
2021 2020 Percentage
change
Percentage changeexcluding recent
acquisitions,businesses held forsale and disposition
(in millions) Insurance $ 2,206.9 $ 2,008.7 9.9% 7.3%Energy and Specialized Markets 648.9 619.2 4.8% 4.3%Financial Services 142.8 156.7 (8.9)% (8.1)%Total revenues $ 2,998.6 $ 2,784.6 7.7% 5.8%
Cost of Revenues
Cost of revenues was $1,057.8 million for the year ended December 31, 2021 compared to $993.9 million for the year ended December 31, 2020, an
increase of $63.9 million or 6.4%. Our recent acquisitions and dispositions accounted for a net increase of $14.9 million in cost of revenues, which was primarilyrelated to salaries and employee benefits. The remaining increase in cost of revenues of $49.0 million or 4.9% was primarily due to increases in salaries andemployee benefits of $24.3 million, information technology expenses of $18.9 million, professional consulting costs of $8.3 million, and other operating costs of$0.7 million. The increase in salaries and employee benefits was primarily due to a pause in our employee hiring activities in the prior year's period as a result ofCOVID-19, which have gradually resumed in the second half of 2020 through 2021. These increases were partially offset by decreases in travel expenses of$3.1 million and data costs of $0.1 million. The decrease in travel expense primarily resulted from travel restrictions in connection with the COVID-19 pandemic.
Selling, General and Administrative Expenses
Selling, general and administrative expenses ("SGA") were $422.7 million for the year ended December 31, 2021 compared to $413.9 million for the year
ended December 31, 2020, an increase of $8.8 million or 2.1%. Our recent acquisitions and dispositions accounted for an increase of $18.2 million in SGAprimarily related to salaries and employee benefits. Our acquisition-related costs (earn-outs) accounted for a decrease of $2.0 million (See Note 10. Acquisitions toour consolidated financial statements included in this annual report on Form 10-K). The remaining SGA decrease of $7.4 million or 1.8% was primarily dueto decreases in professional consulting costs of $36.4 million and travel expenses of $2.0 million. The decrease in professional consulting costs is primarily due tothe release of the previously established Xactware Solutions Patent Litigation's ("EVT Litigation Reserve") reserve once the final payment was made in the fourthquarter of 2021 (the original accrual for this matter was recorded as part of SGA). See Note 21. Commitments and Contingencies. The decrease in travel expenseprimarily resulted from travel restrictions in connection with the COVID-19 pandemic. These decreases were partially offset by increases of salaries and employeebenefits of $27.3 million, information technology expenses of $3.3 million, and other operating costs of $0.4 million. The increase in salaries and employeebenefits was primarily due to a pause in our employee hiring activities in the first half of the prior year as a result of COVID-19, which have gradually resumed inthe second half of 2020 through 2021.
35

Table of Contents Depreciation and Amortization of Fixed Assets
Depreciation and amortization of fixed assets was $206.9 million for the year ended December 31, 2021 compared to $192.2 million for the year ended
December 31, 2020, an increase of $14.7 million or 7.6%. The increase was primarily driven by assets placed in service of $14.3 million to support data capacityexpansion and revenue growth and due to recent acquisitions of $0.5 million. These increases were partially offset by our recent dispositions of $0.1 million.
Amortization of Intangible Assets Amortization of intangible assets was $176.7 million for the year ended December 31, 2021 compared to $165.9 million for the year ended December 31,
2020, an increase of $10.8 million or 6.5%. This was primarily driven by the additional amortization of intangible assets incurred in connection with our recentacquisitions.
Other Operating (Loss) Income
Other operating (loss) income was a loss of $134.0 million for the year ended December 31, 2021 compared to a gain of $19.4 million for the year ended
December 31, 2020. This decrease of $153.4 million was primarily related to the long-lived asset impairment loss associated with our Financial Services segmentrecorded in the current period and gains associated with the dispositions of our compliance background screening business and data warehouse business that wererecorded in 2020.
Investment Income (Loss) and Others, Net
Investment income (loss) and others, net was a gain of $1.9 million for the year ended December 31, 2021 compared to a loss of $2.4 million for the year
ended December 31, 2020. The increase was primarily due to a gain on foreign currencies. Interest Expense
Interest expense was $127.0 million for the year ended December 31, 2021 compared to $138.2 million for the year ended December 31, 2020,
a decrease of $11.2 million or 8.2%. We repaid our 5.800% senior notes in May 2021, which contributed to a lower interest expense.
Provision for Income Taxes
The provision for income taxes was $209.1 million for the year ended December 31, 2021 compared to $184.8 million for the year ended December 31,2020, an increase of $24.3 million or 13.2%. The effective tax rate was 23.9% for the year ended December 31, 2021 compared to 20.6% for the year endedDecember 31, 2020. The increase in the effective tax rate in 2021 compared to 2020 was primarily due to the deferred tax impact of the tax rate increase in theUnited Kingdom that was enacted and recorded in 2021, the impact of the current year Global Intangible Low-taxed income inclusion ("GILTI"), and the impact ofhigher tax benefits from equity compensation in the prior period versus the current period.
Net Income Margin
The net income margin for our consolidated results was 22.2% for the year ended December 31, 2021 compared to 25.6% for each of the yearended December 31, 2020. The decrease in net income margin was primarily related to the long-lived asset impairment loss associated with our Financial Servicessegment.
EBITDA Margin
The EBITDA margin for our consolidated results was 46.2% for the year ended December 31, 2021 compared to 50.1% for the year ended December 31,
2020. The decrease in EBITDA margin was primarily related to the long-lived asset impairment loss associated with our Financial Services segment, partiallyoffset by the release of the previously established EVT Litigation Reserve once the final payment was made in the fourth quarter of 2021.
36

Table of Contents
Results of Continuing Operations by Segment Insurance Revenues
Revenues were $2,206.9 million for the year ended December 31, 2021 compared to $2,008.7 million for the year ended December 31, 2020, an increase
of $198.2 million or 9.9%. Our underwriting & rating revenues increased $142.1 million or 10.1%. Our claims revenues increased $56.1 million or 9.4%.
2021 2020 Percentage
change
Percentage changeexcluding recent
acquisitions,businesses held forsale and disposition
(in millions) Underwriting & rating $ 1,555.1 $ 1,413.0 10.1% 7.2%Claims 651.8 595.7 9.4% 7.5%Total Insurance $ 2,206.9 $ 2,008.7 9.9% 7.3%
Our recent acquisitions (Franco Signor, Jornaya, Whitespace, Ignite Software Systems, and Data Driven Safety within the underwriting & rating category
and ACTINEO within the claims category) and dispositions (the aerial imagery sourcing group and the compliance background screening business within theclaims category) contributed net revenues of $52.2 million and the remaining Insurance revenues increased $146.0 million or 7.3%. Our underwriting & ratingrevenues increased $101.7 million or 7.2% primarily due to an annual increase in prices derived from continued enhancements to the content of the solutionswithin our industry-standard insurance programs as well as selling expanded solutions to existing customers within commercial and personal lines. In addition,catastrophe modeling services contributed to the growth. Our claims revenues increased $44.3 million or 7.5%, primarily due to growth in our repair costestimating solutions revenue and claims analytics revenue related to annual price as well as volume increases.
Cost of Revenues
Cost of revenues for our Insurance segment was $704.4 million for the year ended December 31, 2021 compared to $644.3 million for the year ended
December 31, 2020, an increase of $60.1 million or 9.3%. Our recent acquisitions and dispositions represented a net increase of $14.7 million in cost of revenues,which was primarily related to salaries and employee benefits. The remaining increase in cost of revenues of $45.4 million or 7.1% was primarily due toincreases in salaries and employee benefits of $24.3 million, information technology expenses of $16.4 million, professional consulting costs of $2.9 million, datacosts of $2.0 million, and other operating costs of $0.9 million. The increase in salaries and employee benefits was primarily due to more robust employee hiringactivities as stated above. These increases were partially offset by a decrease in travel expenses of $1.1 million. The decrease in travel expenses primarily resultedfrom travel restrictions in connection with the COVID-19 pandemic.
Selling, General and Administrative Expenses
Selling, general and administrative expenses for our Insurance segment were $239.1 million for the year ended December 31, 2021 compared to $248.1million for the year ended December 31, 2020, a decrease of $9.0 million or 3.6%. Our recent acquisitions and dispositions accounted for an increase of$15.2 million primarily related to salaries and employee benefits. Our acquisition-related costs (earn-outs) accounted for a decrease of $2.0 million. The remainingdecrease in SGA of $22.2 million or 9.1% was primarily due to decreases in professional consulting costs of $42.3 million, travel expenses of $1.3 million, andother operating costs of $0.7 million. The decrease in professional consulting fees was primarily due to the release of the previously established EVT LitigationReserve once the final payment was made in the fourth quarter of 2021 (the original accrual for this matter was recorded as part of SGA). These decreases werepartially offset by increases in salaries and employee benefits of $19.5 million and information technology expenses of $2.6 million.
Other Operating Income
Other operating income was $0.0 for the year ended December 31, 2021 compared to $15.9 million for the year ended December 31, 2020. This decrease
was primarily related to the gain associated with the disposition of our compliance background screening business that was recorded in 2020.
Investment Income (Loss) and Others, Net Investment income (loss) and others, net was a gain of $2.3 million for the year ended December 31, 2021 compared to a loss of $1.2 million for the year
ended December 31, 2020. This change was primarily due to a gain on foreign currencies. EBITDA Margin
EBITDA for our Insurance segment was $1,265.7 million for the year ended December 31, 2021 compared to $1,131.0 million for the year ended
December 31, 2020. The EBITDA margin for our Insurance segment was 57.4% for the year ended December 31, 2021 compared to 56.3% for the year endedDecember 31, 2020. The increase in EBITDA margin was primarily due to the release of the previously established EVT Litigation Reserve once the final paymentwas made in the fourth quarter of 2021, a reduction in travel expenses as a result of COVID-19, and cost discipline.
37
Table of Contents
Energy and Specialized Markets Revenues
Revenues for our Energy and Specialized Markets segment were $648.9 million for the year ended December 31, 2021 compared to $619.2 million for
the year ended December 31, 2020, an increase of $29.7 million or 4.8%. Our recent acquisition within this segment, Roskill, contributed revenues of $2.9 million.The remaining increase in revenue of $26.8 million or 4.3% was primarily due to increases in our core research subscription solutions, and environmental healthand safety service subscription revenues.
Cost of Revenues
Cost of revenues for our Energy and Specialized Markets segment was $263.0 million for the year ended December 31, 2021 compared to $256.8 million
for the year ended December 31, 2020, an increase of $6.2 million or 2.4%. Our recent acquisition accounted for an increase of $0.9 million in cost of revenues,which was primarily related to salaries and employee benefits. The remaining cost of revenues increase of $5.3 million or 2.1% was primarily due toincreases in professional consulting fees of $6.5 million, information technology expenses of $2.3 million, and salaries and employee benefits of$0.7 million. These increases were partially offset by decreases in travel expenses of $1.3 million,and data costs of $0.6 million, and other operating costs of $2.3million. The decrease in travel expenses primarily resulted from travel restrictions in connection with the COVID-19 pandemic.
Selling, General and Administrative Expenses Selling, general and administrative expenses for our Energy and Specialized Markets segment were $154.4 million for the year ended December 31, 2021
compared to $146.1 million for the year ended December 31, 2020, an increase of $8.3 million or 5.6%. Our recent acquisition accounted for an increase of$3.7 million, primarily related to salaries and employee benefits. The remaining SGA increase of $4.6 million or 3.1% was primarily due to increases in salariesand employee benefits of $2.6 million, professional consulting costs of $2.1 million, information technology expenses of $0.2 million, and other operating costs of0.3 million. These increases were partially offset by a decrease in travel expenses of $0.6 million. The decrease in travel expenses primarily resulted from travelrestrictions in connection with the COVID-19 pandemic.
Investment Loss and Others, Net Investment loss and others, net was a loss of $0.2 million for the year ended December 31, 2021 compared to a loss of $1.2 million for the year ended
December 31, 2020. EBITDA Margin
EBITDA for our Energy and Specialized Markets segment was $231.3 million for the year ended December 31, 2021 compared to $215.1 million for the
year ended December 31, 2020. The EBITDA margin for our Energy and Specialized Markets segment was 35.6% for the year ended December 31, 2021compared to 34.7% for the year ended December 31, 2020. The increase in EBITDA margin was primarily related to cost-discipline, a reduction in travel expensesas a result of COVID-19, and a decrease in acquisition-related costs (earn-outs).
38
Table of Contents
Financial Services Revenues
Revenues for our Financial Services segment were $142.8 million for the year ended December 31, 2021 compared to $156.7 million for the year ended
December 31, 2020, a decrease of $13.9 million or 8.9%. Our recent disposition of the data warehouse business contributed a decrease in revenues of $1.4 million.The remaining decrease in revenue of $12.5 million or 8.1% was related to projects that did not reoccur and decrease in revenue in connection with the COVID-19pandemic, which resulted in lower consulting revenue, and lower transactional bankruptcy revenue because of government support and forbearance programs.
Cost of Revenues
Cost of revenues for our Financial Services segment was $90.4 million for the year ended December 31, 2021 compared to $92.8 million for the yearended December 31, 2020, a decrease of $2.4 million or 2.6%. Our recent disposition of the data warehouse business represented a decrease of $0.7 million, whichwas primarily related to salaries and employee benefits. The remaining cost of revenues decrease of $1.7 million or 1.9% was primarily due to decreases in datacosts of $1.5 million, professional consulting costs of $1.1 million, salaries and employee benefits of $0.7 million, and travel expenses of $0.7 million. Thedecrease in travel expenses primarily resulted from travel restrictions in connection with the COVID-19 pandemic. These decreases were partially offset byincreases in information technology expenses of $0.2 million, and other operating costs of 2.1 million.
Selling, General and Administrative Expenses Selling, general and administrative expenses for our Financial Services segment were $29.2 million for the year ended December 31, 2021 compared
to $19.7 million for the year ended December 31, 2020, an increase of $9.5 million or 48.6%. Our recent disposition represented a net decrease of $0.7 million. Theremaining increase in SGA of $10.2 million or 53.9% was primarily due to increases in salaries and employee benefits of $5.2 million, professional consultingcosts of $3.8 million, information technology expenses of $0.5 million, and other operating costs of 0.8 million. These increases were partially offset by adecrease in travel expenses of $0.1 million.
Other Operating (Loss) Income
Other operating (loss) income was a loss of $134.0 million for the year ended December 31, 2021 compared to a gain of $3.5 million for the year ended
December 31, 2020. The decrease of $137.5 million was primarily due a long-lived asset impairment loss that was recorded in the current period and a gaingenerated from the sale of our data warehouse business that was recorded in 2020.
Investment Loss and Others, Net Investment loss and others, net was a loss of $0.2 million for the year ended December 31, 2021 compared to $0.0 for the year ended December 31,
2020. The variance was primarily due to a loss on foreign currencies.
EBITDA Margin EBITDA for our Financial Services segment was a loss of $111.0 million for the year ended December 31, 2021 compared to $47.7 million for the year
ended December 31, 2020. The EBITDA margin for our Financial Services segment was -77.7% for the year ended December 31, 2021 compared to 30.4% for theyear ended December 31, 2020. The decrease in EBITDA margin is primarily related to the long-lived asset impairment loss, decrease in revenue, and the gaingenerated from the sale of our data warehouse business that was recorded in 2020.
See Note 19. of our consolidated financial statements included in this annual report on Form 10-K.
39
Table of Contents Liquidity and Capital Resources
As of December 31, 2021 and 2020, we had cash and cash equivalents and available-for-sale securities of $285.3 million and $222.9 million, respectively.Subscriptions for our solutions are billed and generally paid in advance of rendering services either quarterly or in full upon commencement of the subscriptionperiod, which is usually for one year. Subscriptions are automatically renewed at the beginning of each calendar year. We have historically generated significantcash flows from operations. As a result of this factor, as well as the availability of funds under our syndicated revolving credit facility, we believe we will havesufficient cash to meet our working capital, human capital and capital expenditure needs, and to fuel our future growth plans.
We have historically managed the business with a working capital deficit due to the fact that, as described above, we offer our solutions and services
primarily through annual subscriptions or long-term contracts, which are generally prepaid quarterly or annually in advance of the services being rendered. Whencash is received for prepayment of invoices, we record an asset (cash and cash equivalents) on our balance sheet with the offset recorded as a current liability(deferred revenues). This current liability is deferred revenue that does not require a direct cash outflow since our customers have prepaid and are obligated topurchase the services. In most businesses, growth in revenue typically leads to an increase in the accounts receivable balance causing a use of cash as a companygrows. Unlike these businesses, our cash position is favorably affected by revenue growth, which results in a source of cash due to our customers prepaying formost of our services.
Our consolidated capital expenditures as a percentage of consolidated revenues for the years ended December 31, 2021 and 2020, were 9.0% and 8.9%,
respectively. Expenditures related to developing and enhancing our solutions are predominately related to internal-use software and are capitalized in accordancewith ASC 350-40, “Accounting for Costs of Computer Software Developed or Obtained for Internal Use.” We also capitalize amounts in accordance with ASC985-20, “Software to be Sold, Leased or Otherwise Marketed.”
We have historically used a portion of our cash for repurchases of our common stock from our stockholders. For the years ended December 31, 2021,
2020, and 2019, we repurchased $475.0 million, $348.8 million and $300.0 million, respectively, of our common stock. For the years ended December 31, 2021,2020, and 2019, we also paid dividends of $188.2 million, $175.8 million, and $163.5 million, respectively.
Financing and Financing Capacity
We had total debt, excluding finance lease obligations, unamortized discounts and premium, and debt issuance costs of $3,310.0 million and $3,200.0
million at December 31, 2021 and 2020, respectively. The debt at December 31, 2021 primarily consists of senior notes issued in 2020, 2019, 2015, 2012 and 2011and borrowings outstanding under our committed senior unsecured Syndicated Revolving Credit Facility ("Credit Facility"), described below. Interest on the seniornotes is payable semi-annually each year. The unamortized discount and debt issuance costs were recorded as "Long-term debt" in the accompanying consolidatedbalance sheets, and will be amortized to "Interest expense" in the accompanying consolidated statements of operations within this Form 10-K over the life of therespective senior note. The indenture governing the senior notes restricts our ability to, among other things, create certain liens, enter into sale/leasebacktransactions and consolidate with, sell, lease, convey, or otherwise transfer all or substantially all of our assets, or merge with or into, any other person or entity. Asof December 31, 2021, we had senior notes with an aggregate principal amount of $2,700.0 million outstanding, and we were in compliance with our financial andnon-financial debt covenants.
We have a Credit Facility with a borrowing capacity of $1,000.0 million with Bank of America N.A., HSBC Bank USA, N.A., JP Morgan Chase Bank,
N.A., Wells Fargo Bank, National Association, Citibank, N.A., Credit Suisse AG, Cayman Islands Branch, Morgan Stanley Bank, N.A., First Commercial Bank,Ltd., Los Angeles Branch, TD Bank, N.A., and the Northern Trust Company. Interest on borrowings under the Credit Facility is payable at an interest rate ofLIBOR plus 1.0% to 1.625%, depending upon the public debt rating. A commitment fee on any unused balance is payable periodically and may range from 8.0 to20.0 basis points based upon the public debt rating. The Credit Facility also contains certain financial and other covenants that, among other things, impose certainrestrictions on indebtedness, liens, investments, and capital expenditures. These covenants place restrictions on mergers, asset sales, sale/leaseback transactions,and certain transactions with affiliates. The financial covenants require that, at the end of any fiscal quarter, we have a consolidated funded debt leverage ratio ofless than 3.5 to 1.0. At our election, the maximum consolidated funded debt leverage ratio could be permitted to increase one time each to 4.0 to 1.0 and 4.25 to1.0. The Credit Facility may be used for general corporate purposes, including working capital needs and capital expenditures, acquisitions, dividends and the sharerepurchase program (the "Repurchase Program"). As of December 31, 2021, we were in compliance with all financial and other debt covenants under the CreditFacility. As of December 31, 2021 and 2020, the available capacity under the Credit Facility was $384.9 million and $944.6 million, net of the letters of credit of$5.1 million and $5.4 million, respectively. Subsequent to December 31, 2021 we have made repayments of $130.0 million under the Credit Facility resulting in$480.0 million in borrowings under the Revolving Credit Facility.
40
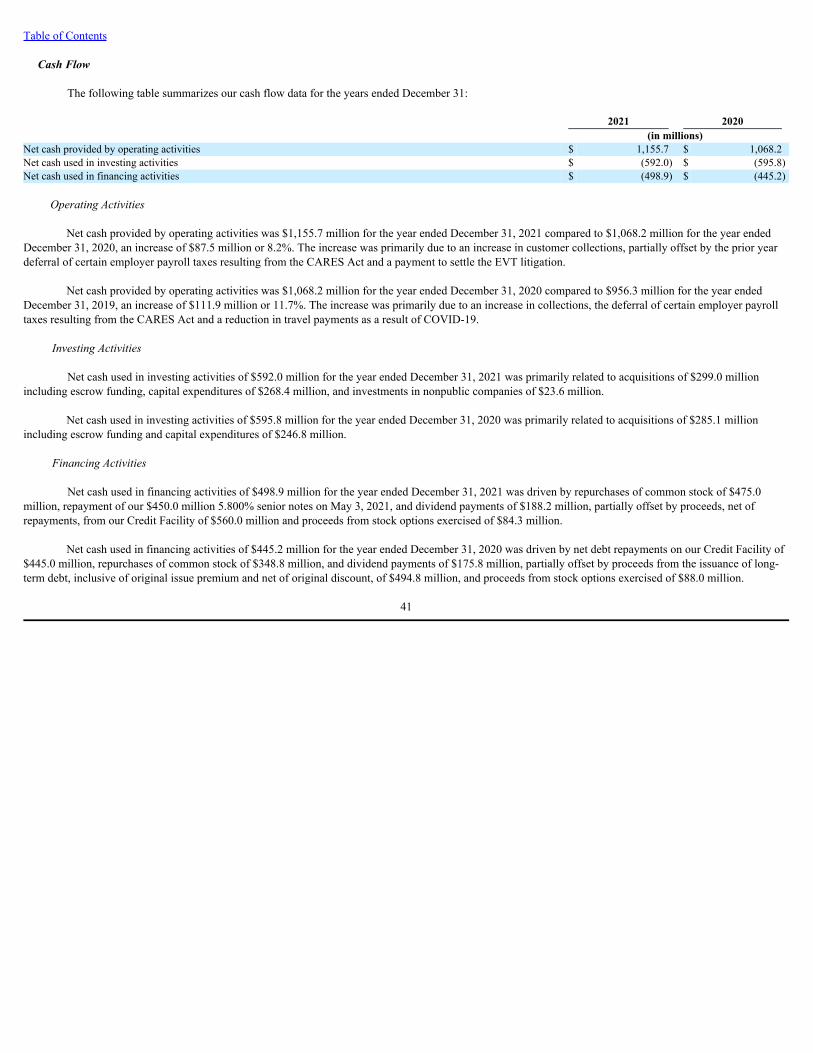
Table of Contents
Cash Flow The following table summarizes our cash flow data for the years ended December 31:
2021 2020 (in millions) Net cash provided by operating activities $ 1,155.7 $ 1,068.2 Net cash used in investing activities $ (592.0) $ (595.8)Net cash used in financing activities $ (498.9) $ (445.2)
Operating Activities
Net cash provided by operating activities was $1,155.7 million for the year ended December 31, 2021 compared to $1,068.2 million for the year endedDecember 31, 2020, an increase of $87.5 million or 8.2%. The increase was primarily due to an increase in customer collections, partially offset by the prior yeardeferral of certain employer payroll taxes resulting from the CARES Act and a payment to settle the EVT litigation.
Net cash provided by operating activities was $1,068.2 million for the year ended December 31, 2020 compared to $956.3 million for the year ended
December 31, 2019, an increase of $111.9 million or 11.7%. The increase was primarily due to an increase in collections, the deferral of certain employer payrolltaxes resulting from the CARES Act and a reduction in travel payments as a result of COVID-19.
Investing Activities
Net cash used in investing activities of $592.0 million for the year ended December 31, 2021 was primarily related to acquisitions of $299.0 millionincluding escrow funding, capital expenditures of $268.4 million, and investments in nonpublic companies of $23.6 million.
Net cash used in investing activities of $595.8 million for the year ended December 31, 2020 was primarily related to acquisitions of $285.1 millionincluding escrow funding and capital expenditures of $246.8 million.
Financing Activities
Net cash used in financing activities of $498.9 million for the year ended December 31, 2021 was driven by repurchases of common stock of $475.0
million, repayment of our $450.0 million 5.800% senior notes on May 3, 2021, and dividend payments of $188.2 million, partially offset by proceeds, net ofrepayments, from our Credit Facility of $560.0 million and proceeds from stock options exercised of $84.3 million.
Net cash used in financing activities of $445.2 million for the year ended December 31, 2020 was driven by net debt repayments on our Credit Facility of
$445.0 million, repurchases of common stock of $348.8 million, and dividend payments of $175.8 million, partially offset by proceeds from the issuance of long-term debt, inclusive of original issue premium and net of original discount, of $494.8 million, and proceeds from stock options exercised of $88.0 million.
41

Table of Contents
Contractual Obligations The following table summarizes our contractual obligations at December 31, 2021 and the future periods in which such obligations are expected to be
settled in cash:
Payments Due by Period
Total Less than 1 year 2-3 years 4-5 years More than 5
years (in millions) Contractual obligations Long-term debt, current portion of long-term debt and interest $ 4,591.6 $ 1,068.9 $ 196.3 $ 1,040.7 $ 2,285.7 Operating leases 351.9 51.5 88.9 65.7 145.8 Pension and postretirement plans (1) 14.5 2.3 3.3 2.8 6.1 Finance lease obligations 14.8 13.0 1.7 0.1 —
Total (2) $ 4,972.8 $ 1,135.7 $ 290.2 $ 1,109.3 $ 2,437.6 (1) Our funding policy is to contribute at least equal to the minimum legal funding requirement. (2) Unrecognized tax benefits of approximately $3.4 million have been recorded as liabilities in accordance with ASC 740, which have been omitted from the
table above, and we are uncertain as to if or when such amounts may be settled, with the exception of those amounts subject to a statute of limitation.Related to the unrecognized tax benefits, we also have recorded a liability for potential penalties and interest of $0.5 million.
Off-Balance Sheet Arrangements
We have no off-balance sheet arrangements.
Critical Accounting Policies and Estimates
Our management’s discussion and analysis of financial condition and results of operations are based on our consolidated financial statements, which have
been prepared in accordance with accounting principles generally accepted in the United States. The preparation of these financial statements require managementto make estimates and judgments that affect reported amounts of assets and liabilities and related disclosures of contingent assets and liabilities at the dates of thefinancial statements and revenue and expenses during the reporting periods. These estimates are based on historical experience and on other assumptions that arebelieved to be reasonable under the circumstances. On an ongoing basis, management evaluates its estimates, including those related to revenue recognition,goodwill and intangible assets, pension and other postretirement benefits, stock-based compensation, and income taxes. Actual results may differ from theseassumptions or conditions.
Revenue Recognition
We recognize revenue based on the transfer of promised goods or services to customers for the amount that reflects the consideration to which we expect
to be entitled in exchange for those goods or services. Revenue is recognized in a five-step model: 1) identify the contract with a customer; 2) identify theperformance obligations in the contract; 3) determine the transaction price; 4) allocate the transaction price to the performance obligations in the contract; and 5)recognize revenue when or as the company satisfies a performance obligation. Revenues for hosted subscription services are recognized ratably over thesubscription term. Revenues from certain discrete project based advisory/consulting services are recognized over time by measuring the progress toward completesatisfaction of the performance obligation, based on the input method of consulting hours worked; this aligns with the results achieved and value transferred to thecustomer. Revenues from transactional solutions are recognized as the solutions are delivered or services performed at point in time.
We invoice our customers in annual, quarterly, or monthly installments. Amounts billed and collected in advance are recorded as deferred revenues on the
balance sheet and are recognized as the services are performed and revenue recognition criteria are met.
42
Table of Contents
Stock-Based Compensation Stock-based compensation cost, including stock options, restricted stock, and performance share units ("PSUs"), is measured at the grant date, based on
the fair value of the awards granted, and is recognized as expense over the requisite service period. The fair value of stock options is measured using a Black-Scholes option-pricing model, which requires the use of several estimates, including expected term, expected risk-free interest rate, expected volatility, andexpected dividend yield. The fair value of the restricted stock is determined using the closing price of our common stock on the grant date. The fair value of PSUsis determined on the grant date using the Monte Carlo Simulation model.
Option grants and restricted stock awards are generally expensed ratably over the four-year vesting period. PSUs are generally expensed ratably over the
three-year vesting period. We follow the substantive vesting period approach for awards granted after January 1, 2005, which requires that stock-basedcompensation expense be recognized over the period from the date of grant to the date when the award is no longer contingent on the employee providingadditional service.
We estimate expected forfeitures of equity awards at the date of grant and recognize compensation expense only for those awards expected to vest. The
forfeiture assumption is ultimately adjusted to the actual forfeiture rate.
Goodwill and Intangibles Goodwill represents the excess of acquisition costs over the fair value of tangible net assets and identifiable intangible assets of the businesses acquired.
Goodwill and intangible assets deemed to have indefinite lives are not amortized. Intangible assets determined to have definite lives are amortized over their usefullives. Goodwill and intangible assets with indefinite lives are subject to impairment testing annually as of June 30, or whenever events or changes in circumstancesindicate that the carrying amount may not be fully recoverable, using the guidance and criteria described in the accounting standard for Goodwill and OtherIntangible Assets. This testing compares carrying values to fair values and, when appropriate, the carrying value of these assets is reduced to fair value.
As of December 31, 2021, we had goodwill of $4,331.2 million, which represents 55.5% of our total assets. During 2021, we performed an impairmenttest as of June 30, 2021 and confirmed that no impairment charge was necessary as the fair value of each reporting unit exceeded its carrying value. There aremany assumptions and estimates used that directly impact the results of impairment testing, including an estimate of future expected revenues, EBITDA, EBITDAmargins and cash flows, useful lives and discount rates, and an estimate of value using multiples derived from the stock prices of publicly traded guidelinecompanies applied to such expected cash flows and market approaches in order to estimate fair value. We have the ability to influence the outcome and ultimateresults based on the assumptions and estimates we choose for determining the fair value of our reporting units. To mitigate undue influence, we set criteria andbenchmarks that are reviewed and approved by various levels of management and reviewed by other independent parties. The determination of whether or notgoodwill or indefinite-lived acquired intangible assets have become impaired involves a significant level of judgment in the assumptions and estimates underlyingthe approach used to determine the value of our reporting units. Changes in our strategy or market conditions could significantly impact these judgments andrequire an impairment to be recorded to intangible assets and goodwill. As of December 31, 2021, we reassessed the recoverability of long-lived assets for ourFinancial Services reporting unit based upon the weaker than expected operating performance as a result of changing market conditions. These conditionsconstituted a triggering event, which resulted in a $134.0 million impairment to the long-lived assets in our Financial Services operating segment including $88.2million to intangible assets and $45.8 million to fixed assets. We based our analysis of the fair value of our long-lived assets on the indication of fair valueprovided by the offer to purchase such reporting unit, which was approved by our Board of Directors on February 16, 2022. This impairment is included within"Other operating loss (income)" in our accompanying consolidated statement of operations. Please refer to Note 9. Fixed Assets and Note 12. Goodwill andIntangible assets for more information.
We allocate the fair value of the purchase consideration to the tangible assets acquired, liabilities assumed and intangible assets acquired based on their
estimated fair values. The excess of the fair value of the purchase consideration over the fair values of these identifiable assets and liabilities is recorded asgoodwill. Such valuations require management to make significant estimates and assumptions, especially with respect to intangible assets. The estimates used invaluing the intangible assets are determined with the assistance of third-party specialists, a discounted cash flow analysis and estimates made by management.Management’s estimates of fair value are based upon assumptions believed to be reasonable, but which are inherently uncertain and unpredictable and, as a result,actual results may differ from estimates. During the measurement period, which is not to exceed one year from the acquisition date, we may record adjustments tothe assets acquired and liabilities assumed, with the corresponding offset to goodwill. Upon the conclusion of the measurement period, any subsequent adjustmentsare recorded to earnings.
Income Taxes
In projecting future taxable income, we develop assumptions including the amount of future state, federal and foreign pretax operating income, the
reversal of temporary differences, and the implementation of feasible and prudent tax planning strategies. These assumptions require significant judgment aboutthe forecasts of future taxable income and are consistent with the plans and estimates we use to manage the underlying businesses. The calculation of our taxliabilities also involves dealing with uncertainties in the application and evolution of complex tax laws and regulations in other jurisdictions.
We account for uncertain tax positions in accordance with Accounting for Uncertainty in Income Taxes — an interpretation of ASC 740, which addresses
the determination of whether tax benefits claimed or expected to be claimed on a tax return should be recorded in the financial statements. Under thisinterpretation, we may recognize the tax benefit from an uncertain tax position only if it is more likely than not that the tax position will be sustained uponexamination by the taxing authorities, based on the technical merits of the position.
We recognize and adjust our liabilities when our judgment changes as a result of the evaluation of new information not previously available. Due to the
complexity of some of these uncertainties, the ultimate resolution may result in a payment that is materially different from our current estimate of the tax liabilities.These differences will be reflected as increases or decreases to income tax expense in the period in which they are determined.
43

Table of Contents
We estimate unrecognized tax positions of $0.6 million that may be recognized by December 31, 2022, due to expiration of statutes of limitations and
resolution of audits with taxing authorities, net of additional uncertain tax positions. As of December 31, 2021, we have gross federal, state, and foreign income tax net operating loss carryforwards of $154.6 million, which will expire at
various dates from 2022 through 2041. Such net operating loss carryforwards expire as follows:
Years Ending (In millions) 2022 - 2029 $ 21.9 2030 - 2034 20.5 2035 - 2041 112.2 Total $ 154.6
The net deferred income tax liability of $463.9 million consists primarily of timing differences involving amortization. Recent Accounting Pronouncements
For a discussion of recent accounting pronouncements, refer to Note 2(s) to the audited consolidated financial statements included elsewhere in this
annual report on Form 10-K.
44
Table of Contents
Item 7A. Quantitative and Qualitative Disclosures about Market Risk Interest Rate Risk
We are exposed to market risk from fluctuations in interest rates. At December 31, 2021, we had borrowings outstanding under our credit facility of
$610.0 million. A total of $130.0 million of this outstanding balance has been paid in the first three weeks post year end. The borrowings bear interest at variablerates based on LIBOR plus 1.0% to 1.625% depending on the public debt rating defined in the credit agreement. The current margin is 1.25% as a result of thecurrent public debt rating. A change in interest rates on variable rate debt impacts our pre-tax income and cash flows, but does not impact the fair value of theinstruments. Based on our overall interest rate exposure at December 31, 2021, a one percent change in interest rate would result in a change in annual pre-taxinterest expense of approximately $6.1 million based on our current borrowing levels.
We have started to consider the implications of the transition of LIBOR to alternative reference rate measures that will likely become effective postDecember 2021. We believe that there is still some uncertainty over what these rates will be but one possibility for U.S. dollar LIBOR would be the SecuredOvernight Financing Rate ("SOFR"). As this decision has not been finalized at the time of amending our Credit Facility agreement, there is no definitive alternativerate proposed in the current contract. We are, however, reviewing the potential impact on the application of this rate on our interest expense once it becomesapplicable. As our only current contract extending beyond 2021, that is subject to the LIBOR rate is the Credit Facility, the impact will be dependent on what theoutstanding borrowing amount is on the Credit Facility and the relevant interest rate that will be contractually applicable. Should we amend our Credit Facility toreflect SOFR, based on recent borrowings and applicable SOFR, we do not anticipate to have a material impact on the business. Foreign Currency Risk
Our foreign-based businesses and results of operations are exposed to movements in the U.S. dollar to British pounds and other foreign currency
exchange rates. A portion of our revenue is denominated in British pounds and other foreign currencies. If the U.S. dollar strengthens against British pounds andother foreign currencies, our revenues reported in U.S. dollars would decline. With regard to operating expense, our primary exposure to foreign currencyexchange risk relates to operating expense incurred in British pounds and other foreign currencies. If British pounds and other foreign currencies strengthen, costsreported in U.S. dollars will increase. Movements in the U.S. dollar to British pounds and other foreign currency exchange rates did not have a material effect onour revenue for the year ended December 31, 2021. A hypothetical ten percent change in average exchange rates versus the U.S. dollar would not have resulted in amaterial change to our earnings.
Item 8. Consolidated Financial Statements and Supplementary Data
The information required by this Item is set forth on pages 51 through 96 of this annual report on Form 10-K.
Item 9. Changes in and Disagreements with Accountants on Accounting and Financial Disclosure None.
45

Table of Contents
Item 9A. Controls and Procedures Evaluation of Disclosure Controls and Procedures
We are required to maintain disclosure controls and procedures (as that term is defined in Rules 13a-15(e) under the Securities Exchange Act of 1934, as
amended (the “Exchange Act”) that are designed to ensure that information required to be disclosed in our reports under the Exchange Act is recorded, processed,summarized, and reported within the time periods specified in the Securities and Exchange Commission’s rules and forms, and that such information isaccumulated and communicated to our management, including our Chief Executive Officer and Chief Financial Officer, as appropriate, to allow timely decisionsregarding required disclosures. Any controls and procedures, no matter how well designed and operated, can provide only reasonable assurance of achieving thedesired control objectives at the reasonable assurance level.
Our management, with the participation of the Chief Executive Officer and Chief Financial Officer, has evaluated the effectiveness of our disclosurecontrols and procedures (as defined in Exchange Act Rules 13a-15(e) and 15d-15(e)) as of the end of the period covered by this annual report on Form 10-K forour company and subsidiaries other than our recent acquisitions in 2021 (See Note 10. of our consolidated financial statements included in this annual report onForm 10-K). Management excluded from its assessment the internal control over financial reporting of these acquisitions and collectively represents less than 0.5%of total assets (excluding goodwill and intangible assets which were integrated into our systems and control environment) and less than 0.5% of revenues as of andfor the year ended December 31, 2021. Based upon the foregoing assessments, our Chief Executive Officer and Chief Financial Officer have concluded that, as ofDecember 31, 2021, our disclosure controls and procedures were effective at the reasonable assurance level. Management’s Report on Internal Control over Financial Reporting
The information required by this Item is set forth on page 47 of this annual report on Form 10-K.
Attestation Report of the Registered Public Accounting Firm The information required by this Item is set forth on page 48 of this annual report on Form 10-K.
Changes in Internal Control over Financial Reporting
We are in the process of integrating our recent acquisitions in 2021 into our overall internal control over financial reporting process. Other than thisongoing integration, there have been no changes in our internal control over financial reporting identified in connection with the evaluation of such internal controlthat occurred during the fourth quarter of 2021 that have materially affected, or are reasonably likely to materially affect, our internal control over financialreporting.
46

Table of Contents
MANAGEMENT’S REPORT ON INTERNAL CONTROL OVER FINANCIAL REPORTING Our management is responsible for establishing and maintaining adequate internal control over financial reporting as defined in Rules 13a-15(f) and 15d-
15(f) under the Exchange Act. Our internal control over financial reporting is a process designed to provide reasonable assurance regarding the reliability offinancial reporting and the preparation of the financial statements for external purposes in accordance with U.S. generally accepted accounting principles. Becauseof its inherent limitations, a system of internal control over financial reporting can provide only reasonable assurance and may not prevent or detect misstatements.Also, projections of any evaluation of effectiveness to future periods are subject to the risk that internal control may become inadequate because of changes inconditions, or that the degree of compliance with the policies or procedures may deteriorate.
Under the supervision and with the participation of our management, including our principal executive officer and principal financial officer, we
conducted an evaluation of the effectiveness of our internal control over financial reporting based on the framework set forth in Internal Control — IntegratedFramework issued by the Committee of Sponsoring Organizations of the Treadway Commission in 2013.
Based on this assessment, management concluded that our internal control over financial reporting was effective at December 31, 2021. Management excluded from its assessment the internal control over financial reporting for our acquisitions in 2021 (See Note 10. of our consolidated
financial statements included in this annual report on Form 10-K). The excluded financial statements of these acquisitions constitute approximately 0.5% of totalassets (excluding goodwill and intangible assets which were integrated into our systems and control environment) and 0.5% of revenues collectively includedwithin our consolidated financial statements as of and for the year ended December 31, 2021. Due to the timing of the acquisitions, management did not assess theeffectiveness of internal control over financial reporting for these acquisitions.
Deloitte & Touche LLP, the independent registered public accounting firm that audited the consolidated financial statements included in this annual reporton Form 10-K has also audited the effectiveness of our internal control over financial reporting as of December 31, 2021, as stated in their report which is includedherein.
47
Table of Contents
REPORT OF INDEPENDENT REGISTERED PUBLIC ACCOUNTING FIRM To the Stockholders and the Board of Directors of Verisk Analytics, Inc. Opinion on Internal Control over Financial Reporting
We have audited the internal control over financial reporting of Verisk Analytics, Inc. and subsidiaries (the “Company”) as of December 31, 2021, basedon criteria established in Internal Control - Integrated Framework (2013) issued by the Committee of Sponsoring Organizations of the Treadway Commission(COSO). In our opinion, the Company maintained, in all material respects, effective internal control over financial reporting as of December 31, 2021, based oncriteria established in Internal Control - Integrated Framework (2013) issued by COSO.
We have also audited, in accordance with the standards of the Public Company Accounting Oversight Board (United States) (PCAOB), the consolidated
financial statements as of and for the year ended December 31, 2021, of the Company and our report dated February 22, 2022, expressed an unqualified opinion onthose consolidated financial statements.
As described in Management’s Report on Internal Controls over Financial Reporting, management excluded from its assessment the internal control over
financial reporting at Whitespace Software Limited which was acquired on March 2, 2021, Roskill Holdings Limited on June 17, 2021, Ignite SoftwareSystems Limited on September 1, 2021, Data Driven Safety, LLC on November 2, 2021, and ACTINEO GmbH on December 23, 2021 (collectively the“2021 Acquisitions”). The financial statements of the 2021 Acquisitions constitute less than 0.5% of total assets (excluding goodwill and intangible assets whichwere integrated into the Company's systems and control environment) and 0.5% of revenues collectively of the consolidated financial statement amounts as of andfor the year ended December 31, 2021. Accordingly, our audit did not include the internal control over financial reporting at the 2021 Acquisitions. Basis for Opinion
The Company’s management is responsible for maintaining effective internal control over financial reporting and for its assessment of the effectivenessof internal control over financial reporting, included in the accompanying Management’s Report on Internal Controls over Financial Reporting. Our responsibilityis to express an opinion on the Company’s internal control over financial reporting based on our audit. We are a public accounting firm registered with the PCAOBand are required to be independent with respect to the Company in accordance with the U.S. federal securities laws and the applicable rules and regulations of theSecurities and Exchange Commission and the PCAOB.
We conducted our audit in accordance with the standards of the PCAOB. Those standards require that we plan and perform the audit to obtain reasonable
assurance about whether effective internal control over financial reporting was maintained in all material respects. Our audit included obtaining an understandingof internal control over financial reporting, assessing the risk that a material weakness exists, testing and evaluating the design and operating effectiveness ofinternal control based on the assessed risk, and performing such other procedures as we considered necessary in the circumstances. We believe that our auditprovides a reasonable basis for our opinion. Definition and Limitations of Internal Control over Financial Reporting
A company’s internal control over financial reporting is a process designed to provide reasonable assurance regarding the reliability of financial reportingand the preparation of financial statements for external purposes in accordance with generally accepted accounting principles. A company’s internal control overfinancial reporting includes those policies and procedures that (1) pertain to the maintenance of records that, in reasonable detail, accurately and fairly reflect thetransactions and dispositions of the assets of the company; (2) provide reasonable assurance that transactions are recorded as necessary to permit preparation offinancial statements in accordance with generally accepted accounting principles, and that receipts and expenditures of the company are being made only inaccordance with authorizations of management and directors of the company; and (3) provide reasonable assurance regarding prevention or timely detection ofunauthorized acquisition, use, or disposition of the company’s assets that could have a material effect on the financial statements.
Because of its inherent limitations, internal control over financial reporting may not prevent or detect misstatements. Also, projections of any evaluation
of effectiveness to future periods are subject to the risk that controls may become inadequate because of changes in conditions, or that the degree of compliancewith the policies or procedures may deteriorate. /s/ Deloitte & Touche LLPParsippany, New JerseyFebruary 22, 2022
48

Table of Contents Item 9B. Other Information
None.
Item 9C. Disclosure Regarding Foreign Jurisdictions that Prevent Inspections
Not applicable.
PART III
Item 10. Directors, Executive Officers and Corporate Governance The information required to be furnished by this Item 10 is incorporated herein by reference to our Notice of Annual Meeting of Stockholders and Proxy
Statement to be filed within 120 days of December 31, 2021 (the “Proxy Statement”). Our Board of Directors has adopted a Code of Business Conduct and Ethics applicable to all officers, directors and employees, which is available on our
website (investor.verisk.com) under "Corporate Governance". We intend to satisfy the disclosure requirement under Item 5.05 of Form 8-K regarding anyamendment to, or waiver from, a provision of our Code of Business Conduct and Ethics by posting such information on the website address and location specifiedabove.
Item 11. Executive Compensation
The information required to be furnished by this Item 11 is incorporated herein by reference to our Proxy Statement.
Item 12. Security Ownership of Certain Beneficial Owners and Management and Related Stockholder Matters
The information required to be furnished by this Item 12 is incorporated herein by reference to our Proxy Statement.
Item 13. Certain Relationships and Related Transactions and Director Independence
The information required to be furnished by this Item 13 is incorporated herein by reference to our Proxy Statement.
Item 14. Principal Accounting Fees and Services
The information required to be furnished by this Item 14 is incorporated herein by reference to our Proxy Statement.
49

Table of Contents
PART IV
Item 15. Exhibits and Financial Statement Schedule (a) The following documents are filed as part of this report.
(1) Financial Statements. See Index to Financial Statements and Schedules in Part II, Item 8 on this Form 10-K. (2) Financial Statement Schedule. See Schedule II. Valuation and Qualifying Accounts and Reserves. (3) Exhibits. See Index to Exhibits in this annual report on Form 10-K. Item 16. Form 10-K Summary
None.
50
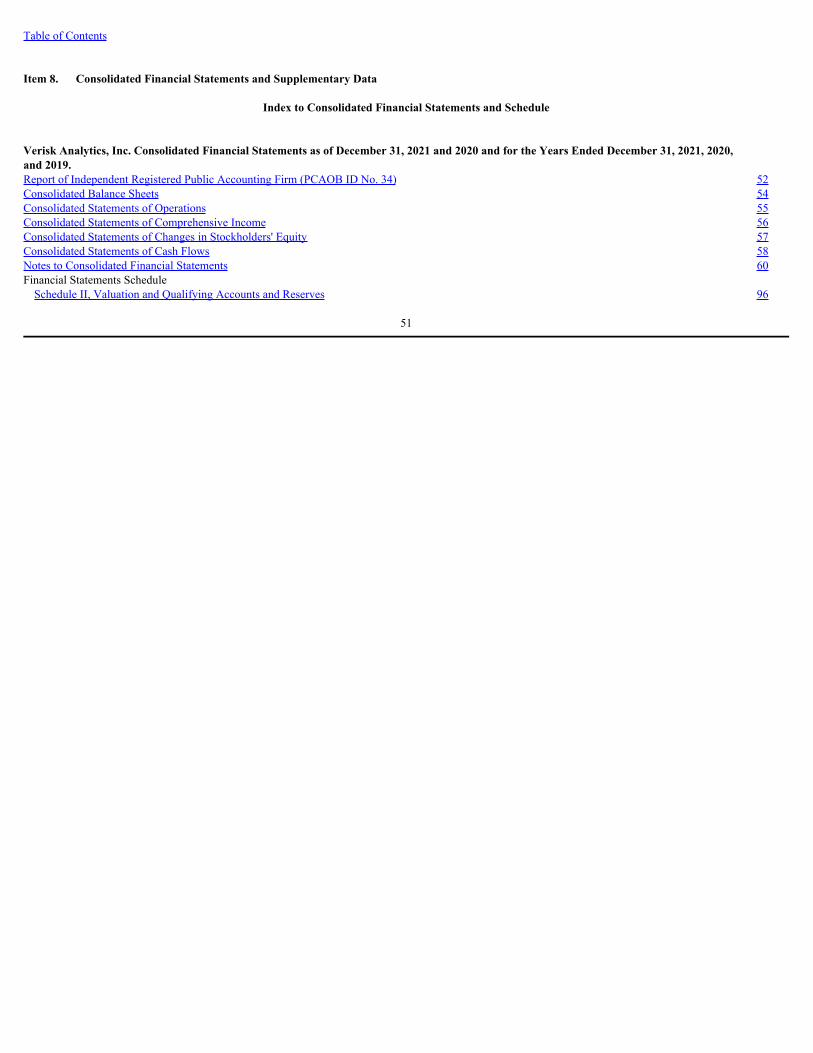
Table of Contents Item 8. Consolidated Financial Statements and Supplementary Data
Index to Consolidated Financial Statements and Schedule
Verisk Analytics, Inc. Consolidated Financial Statements as of December 31, 2021 and 2020 and for the Years Ended December 31, 2021, 2020,and 2019. Report of Independent Registered Public Accounting Firm (PCAOB ID No. 34) 52Consolidated Balance Sheets 54Consolidated Statements of Operations 55Consolidated Statements of Comprehensive Income 56Consolidated Statements of Changes in Stockholders' Equity 57Consolidated Statements of Cash Flows 58Notes to Consolidated Financial Statements 60Financial Statements Schedule Schedule II, Valuation and Qualifying Accounts and Reserves 96
51

Table of Contents
REPORT OF INDEPENDENT REGISTERED PUBLIC ACCOUNTING FIRM To the Stockholders and the Board of Directors of Verisk Analytics, Inc. Opinion on the Financial Statements
We have audited the accompanying consolidated balance sheets of Verisk Analytics, Inc. and subsidiaries (the "Company") as of December 31, 2021 and2020, the related consolidated statements of operations, comprehensive income, stockholders' equity, and cash flows, for each of the three years in the period endedDecember 31, 2021, and the related notes and the schedule listed in the Index at Item 15 (collectively referred to as the "financial statements"). In our opinion, thefinancial statements present fairly, in all material respects, the financial position of the Company as of December 31, 2021 and 2020, and the results of itsoperations and its cash flows for each of the three years in the period ended December 31, 2021, in conformity with accounting principles generally accepted in theUnited States of America.
We have also audited, in accordance with the standards of the Public Company Accounting Oversight Board (United States) (PCAOB), the Company's
internal control over financial reporting as of December 31, 2021, based on criteria established in Internal Control - Integrated Framework (2013) issued by theCommittee of Sponsoring Organizations of the Treadway Commission and our report dated February 22, 2022, expressed an unqualified opinion on the Company'sinternal control over financial reporting. Basis for Opinion
These financial statements are the responsibility of the Company's management. Our responsibility is to express an opinion on the Company's financial
statements based on our audits. We are a public accounting firm registered with the PCAOB and are required to be independent with respect to the Company inaccordance with the U.S. federal securities laws and the applicable rules and regulations of the Securities and Exchange Commission and the PCAOB.
We conducted our audits in accordance with the standards of the PCAOB. Those standards require that we plan and perform the audit to obtain reasonable
assurance about whether the financial statements are free of material misstatement, whether due to error or fraud. Our audits included performing procedures toassess the risks of material misstatement of the financial statements, whether due to error or fraud, and performing procedures that respond to those risks. Suchprocedures included examining, on a test basis, evidence regarding the amounts and disclosures in the financial statements. Our audits also included evaluating theaccounting principles used and significant estimates made by management, as well as evaluating the overall presentation of the financial statements. We believethat our audits provide a reasonable basis for our opinion. Critical Audit Matter
The critical audit matter communicated below is a matter arising from the current-period audit of the financial statements that was communicated orrequired to be communicated to the audit committee and that (1) relates to accounts or disclosures that are material to the financial statements and (2) involved ourespecially challenging, subjective, or complex judgments. The communication of critical audit matters does not alter in any way our opinion on the financialstatements, taken as a whole, and we are not, by communicating the critical audit matter below, providing a separate opinion on the critical audit matter or on theaccounts or disclosures to which it relates. Goodwill - Energy and Specialized Markets and Financial Services Reportable Segments - Refer to Notes 2 and 12 to the financial statements Critical Audit Matter Description
The Company’s evaluation of goodwill for impairment involves the comparison of the fair value of each reporting unit to its carrying value. TheCompany determines the fair value of its reporting units using the discounted cash flow model and the market approach. The determination of fair value using thediscounted cash flow model requires management to make significant estimates and assumptions related to forecasts of future revenues, EBITDA margins, and thediscount rate. The determination of fair value using the market approach requires management to make significant estimates and assumptions related to theselection of revenue and EBITDA multiples. Changes in these assumptions could have a significant impact on either the fair value, the amount of any goodwillimpairment charge, or both. The goodwill balance was $4,331.2 million as of December 31, 2021 of which $2,283.6 million was attributable to a reporting unitwithin the Energy and Specialized Markets reportable segment and $475.4 million was attributable to the Financial Services reportable segment.
Given the significant judgments made by management to estimate the fair value of the reporting unit within the Energy and Specialized Marketsreportable segment and the Financial Services reportable segment, including management’s judgments in selecting significant assumptions to forecast futurerevenues, EBITDA margins, and the discount rate, as well as the selection of revenue and EBITDA multiples, performing audit procedures to evaluate thereasonableness of management’s estimates and assumptions for the reporting unit within the Energy and Specialized Markets reportable segment and the FinancialServices reportable segment required a high degree of auditor judgment and an increased extent of effort, including the need to involve our fair value specialists.
52
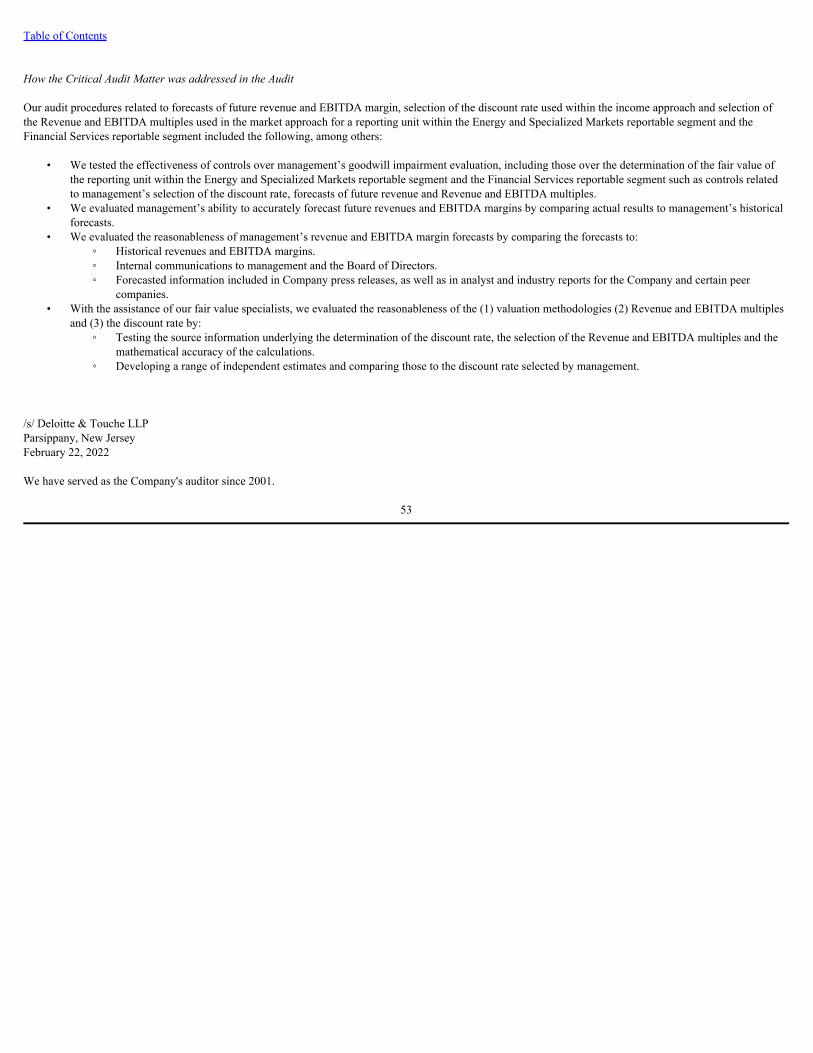
Table of Contents How the Critical Audit Matter was addressed in the Audit Our audit procedures related to forecasts of future revenue and EBITDA margin, selection of the discount rate used within the income approach and selection ofthe Revenue and EBITDA multiples used in the market approach for a reporting unit within the Energy and Specialized Markets reportable segment and theFinancial Services reportable segment included the following, among others: • We tested the effectiveness of controls over management’s goodwill impairment evaluation, including those over the determination of the fair value of
the reporting unit within the Energy and Specialized Markets reportable segment and the Financial Services reportable segment such as controls relatedto management’s selection of the discount rate, forecasts of future revenue and Revenue and EBITDA multiples.
• We evaluated management’s ability to accurately forecast future revenues and EBITDA margins by comparing actual results to management’s historicalforecasts.
• We evaluated the reasonableness of management’s revenue and EBITDA margin forecasts by comparing the forecasts to: ◦ Historical revenues and EBITDA margins. ◦ Internal communications to management and the Board of Directors. ◦ Forecasted information included in Company press releases, as well as in analyst and industry reports for the Company and certain peer
companies. • With the assistance of our fair value specialists, we evaluated the reasonableness of the (1) valuation methodologies (2) Revenue and EBITDA multiples
and (3) the discount rate by: ◦ Testing the source information underlying the determination of the discount rate, the selection of the Revenue and EBITDA multiples and the
mathematical accuracy of the calculations. ◦ Developing a range of independent estimates and comparing those to the discount rate selected by management. /s/ Deloitte & Touche LLPParsippany, New JerseyFebruary 22, 2022 We have served as the Company's auditor since 2001.
53

Table of Contents
VERISK ANALYTICS, INC.CONSOLIDATED BALANCE SHEETS
As of December 31, 2021 and 2020 2021 2020
(in millions, except par value and
number of shares) ASSETS:
Current assets: Cash and cash equivalents $ 280.3 $ 218.8 Accounts receivable, net 446.3 432.4 Prepaid expenses 102.6 81.2 Income taxes receivable 36.7 25.4 Other current assets 36.7 36.4 Total current assets 902.6 794.2
Noncurrent assets: Fixed assets, net 658.2 632.3 Operating lease right-of-use assets, net 253.1 267.6 Intangible assets, net 1,225.9 1,384.8 Goodwill 4,331.2 4,108.1 Deferred income tax assets 6.6 9.1 Other noncurrent assets 430.5 365.7 Total assets $ 7,808.1 $ 7,561.8
LIABILITIES AND STOCKHOLDERS’ EQUITY:
Current liabilities: Accounts payable and accrued liabilities $ 320.7 $ 407.3 Short-term debt and current portion of long-term debt 971.3 514.3 Deferred revenues 501.0 466.7 Operating lease liabilities 41.2 38.7 Income taxes payable 9.0 3.8 Total current liabilities 1,843.2 1,430.8
Noncurrent liabilities: Long-term debt 2,342.8 2,699.6 Deferred income tax liabilities 470.5 396.9 Operating lease liabilities 254.7 271.6 Other noncurrent liabilities 54.4 64.7 Total liabilities 4,965.6 4,863.6
Commitments and contingencies (Note 21) Stockholders’ equity: Common stock, $.001 par value; 2,000,000,000 shares authorized; 544,003,038 shares issued; 161,651,639 and 162,817,526shares outstanding, respectively 0.1 0.1
Additional paid-in capital 2,608.7 2,490.9 Treasury stock, at cost, 382,351,399 and 381,185,512 shares, respectively (4,638.1) (4,179.3)Retained earnings 5,240.4 4,762.2 Accumulated other comprehensive losses (394.6) (375.7)Total Verisk stockholders' equity 2,816.5 2,698.2 Noncontrolling interests 26.0 — Total stockholders’ equity 2,842.5 2,698.2 Total liabilities and stockholders’ equity $ 7,808.1 $ 7,561.8
The accompanying notes are an integral part of these consolidated financial statements.
54
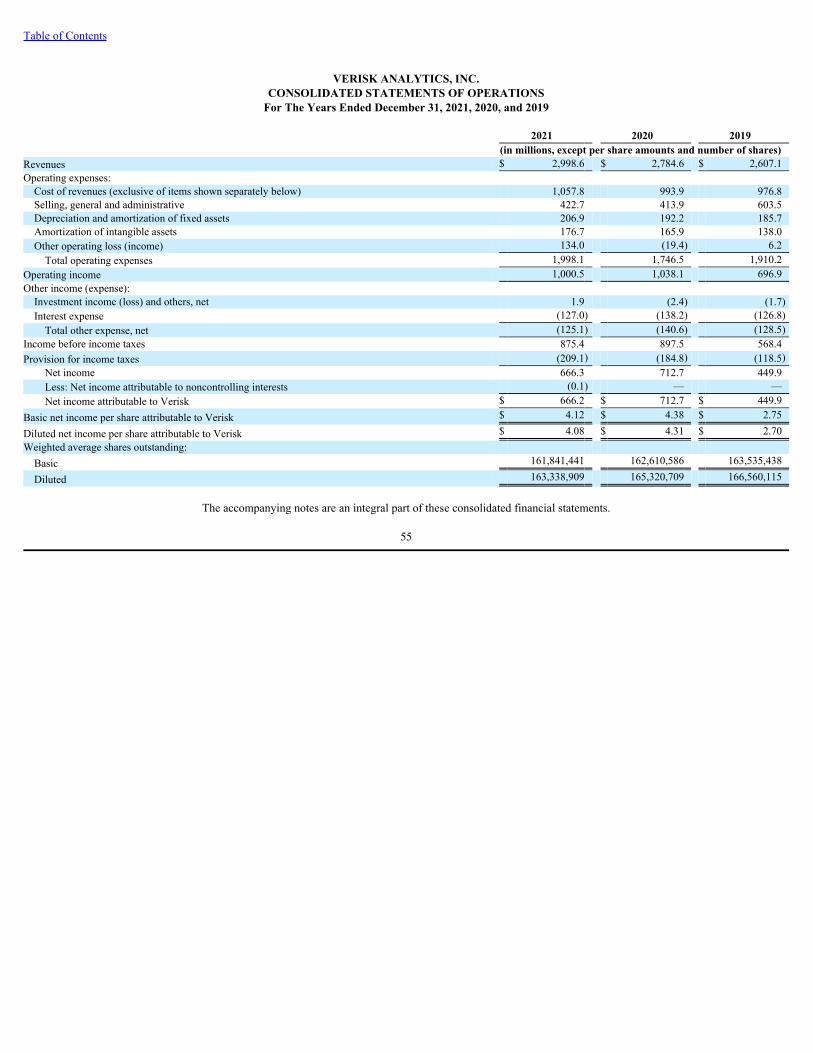
Table of Contents
VERISK ANALYTICS, INC.CONSOLIDATED STATEMENTS OF OPERATIONS
For The Years Ended December 31, 2021, 2020, and 2019 2021 2020 2019 (in millions, except per share amounts and number of shares) Revenues $ 2,998.6 $ 2,784.6 $ 2,607.1 Operating expenses: Cost of revenues (exclusive of items shown separately below) 1,057.8 993.9 976.8 Selling, general and administrative 422.7 413.9 603.5 Depreciation and amortization of fixed assets 206.9 192.2 185.7 Amortization of intangible assets 176.7 165.9 138.0 Other operating loss (income) 134.0 (19.4) 6.2 Total operating expenses 1,998.1 1,746.5 1,910.2
Operating income 1,000.5 1,038.1 696.9 Other income (expense): Investment income (loss) and others, net 1.9 (2.4) (1.7)Interest expense (127.0) (138.2) (126.8)Total other expense, net (125.1) (140.6) (128.5)
Income before income taxes 875.4 897.5 568.4 Provision for income taxes (209.1) (184.8) (118.5)
Net income 666.3 712.7 449.9 Less: Net income attributable to noncontrolling interests (0.1) — — Net income attributable to Verisk $ 666.2 $ 712.7 $ 449.9
Basic net income per share attributable to Verisk $ 4.12 $ 4.38 $ 2.75
Diluted net income per share attributable to Verisk $ 4.08 $ 4.31 $ 2.70 Weighted average shares outstanding: Basic 161,841,441 162,610,586 163,535,438
Diluted 163,338,909 165,320,709 166,560,115
The accompanying notes are an integral part of these consolidated financial statements. 55
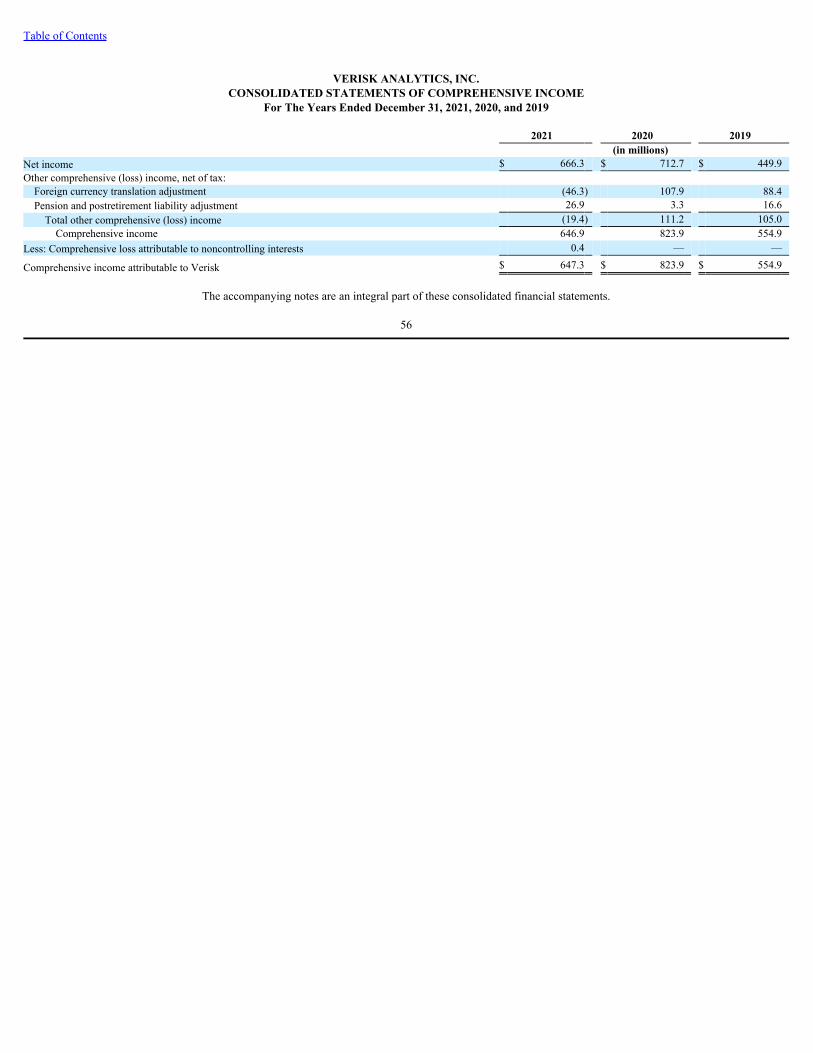
Table of Contents
VERISK ANALYTICS, INC.CONSOLIDATED STATEMENTS OF COMPREHENSIVE INCOME
For The Years Ended December 31, 2021, 2020, and 2019
2021 2020 2019 (in millions) Net income $ 666.3 $ 712.7 $ 449.9 Other comprehensive (loss) income, net of tax: Foreign currency translation adjustment (46.3) 107.9 88.4 Pension and postretirement liability adjustment 26.9 3.3 16.6 Total other comprehensive (loss) income (19.4) 111.2 105.0 Comprehensive income 646.9 823.9 554.9
Less: Comprehensive loss attributable to noncontrolling interests 0.4 — —
Comprehensive income attributable to Verisk $ 647.3 $ 823.9 $ 554.9
The accompanying notes are an integral part of these consolidated financial statements.
56
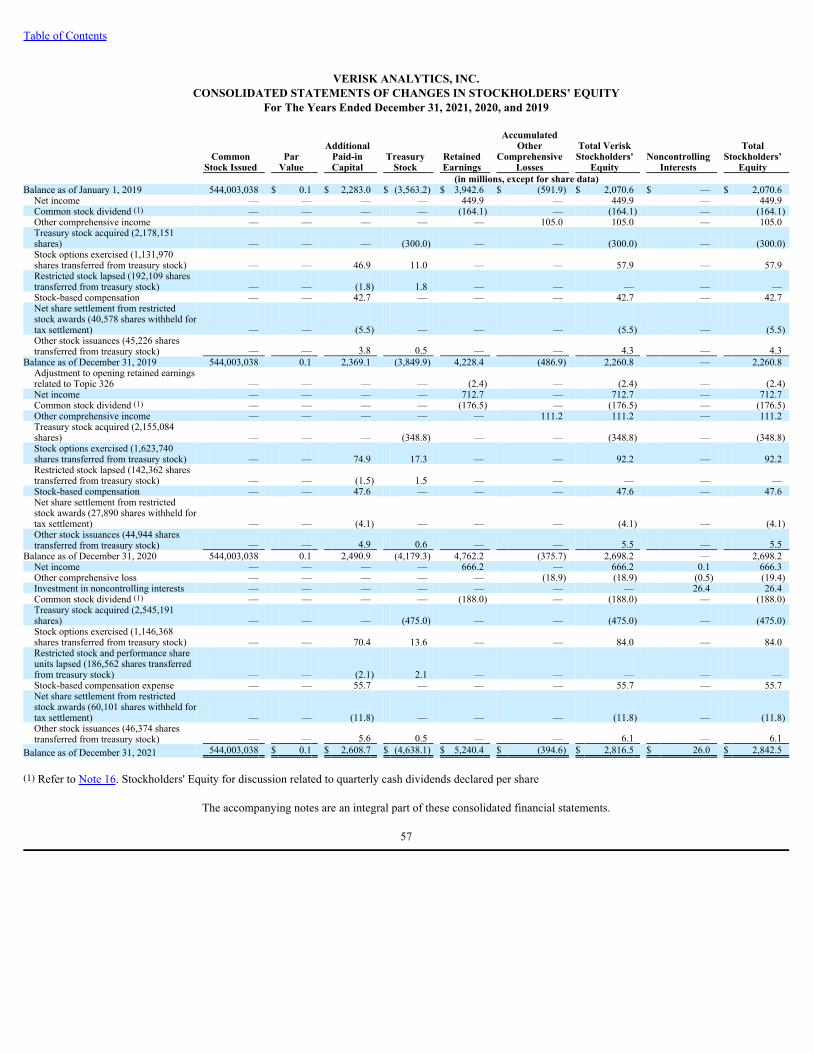
Table of Contents
VERISK ANALYTICS, INC.CONSOLIDATED STATEMENTS OF CHANGES IN STOCKHOLDERS’ EQUITY
For The Years Ended December 31, 2021, 2020, and 2019
Common
Stock Issued Par
Value
AdditionalPaid-inCapital
TreasuryStock
RetainedEarnings
AccumulatedOther
ComprehensiveLosses
Total VeriskStockholders'
Equity Noncontrolling
Interests
TotalStockholders’
Equity (in millions, except for share data) Balance as of January 1, 2019 544,003,038 $ 0.1 $ 2,283.0 $ (3,563.2) $ 3,942.6 $ (591.9) $ 2,070.6 $ — $ 2,070.6 Net income — — — — 449.9 — 449.9 — 449.9 Common stock dividend (1) — — — — (164.1) — (164.1) — (164.1)Other comprehensive income — — — — — 105.0 105.0 — 105.0 Treasury stock acquired (2,178,151shares) — — — (300.0) — — (300.0) — (300.0)Stock options exercised (1,131,970shares transferred from treasury stock) — — 46.9 11.0 — — 57.9 — 57.9 Restricted stock lapsed (192,109 sharestransferred from treasury stock) — — (1.8) 1.8 — — — — — Stock-based compensation — — 42.7 — — — 42.7 — 42.7 Net share settlement from restrictedstock awards (40,578 shares withheld fortax settlement) — — (5.5) — — — (5.5) — (5.5)Other stock issuances (45,226 sharestransferred from treasury stock) — — 3.8 0.5 — — 4.3 — 4.3
Balance as of December 31, 2019 544,003,038 0.1 2,369.1 (3,849.9) 4,228.4 (486.9) 2,260.8 — 2,260.8 Adjustment to opening retained earningsrelated to Topic 326 — — — — (2.4) — (2.4) — (2.4)Net income — — — — 712.7 — 712.7 — 712.7 Common stock dividend (1) — — — — (176.5) — (176.5) — (176.5)Other comprehensive income — — — — — 111.2 111.2 — 111.2 Treasury stock acquired (2,155,084shares) — — — (348.8) — — (348.8) — (348.8)Stock options exercised (1,623,740shares transferred from treasury stock) — — 74.9 17.3 — — 92.2 — 92.2 Restricted stock lapsed (142,362 sharestransferred from treasury stock) — — (1.5) 1.5 — — — — — Stock-based compensation — — 47.6 — — — 47.6 — 47.6 Net share settlement from restrictedstock awards (27,890 shares withheld fortax settlement) — — (4.1) — — — (4.1) — (4.1)Other stock issuances (44,944 sharestransferred from treasury stock) — — 4.9 0.6 — — 5.5 — 5.5
Balance as of December 31, 2020 544,003,038 0.1 2,490.9 (4,179.3) 4,762.2 (375.7) 2,698.2 — 2,698.2 Net income — — — — 666.2 — 666.2 0.1 666.3 Other comprehensive loss — — — — — (18.9) (18.9) (0.5) (19.4)Investment in noncontrolling interests — — — — — — — 26.4 26.4 Common stock dividend (1) — — — — (188.0) — (188.0) — (188.0)Treasury stock acquired (2,545,191shares) — — — (475.0) — — (475.0) — (475.0)Stock options exercised (1,146,368shares transferred from treasury stock) — — 70.4 13.6 — — 84.0 — 84.0 Restricted stock and performance shareunits lapsed (186,562 shares transferredfrom treasury stock) — — (2.1) 2.1 — — — — — Stock-based compensation expense — — 55.7 — — — 55.7 — 55.7 Net share settlement from restrictedstock awards (60,101 shares withheld fortax settlement) — — (11.8) — — — (11.8) — (11.8)Other stock issuances (46,374 sharestransferred from treasury stock) — — 5.6 0.5 — — 6.1 — 6.1
Balance as of December 31, 2021 544,003,038 $ 0.1 $ 2,608.7 $ (4,638.1) $ 5,240.4 $ (394.6) $ 2,816.5 $ 26.0 $ 2,842.5 (1) Refer to Note 16. Stockholders' Equity for discussion related to quarterly cash dividends declared per share
The accompanying notes are an integral part of these consolidated financial statements. 57

Table of Contents
VERISK ANALYTICS, INC.CONSOLIDATED STATEMENTS OF CASH FLOWS
For The Years Ended December 31, 2021, 2020, and 2019
2021 2020 2019 (In millions) Cash flows from operating activities: Net income $ 666.3 $ 712.7 $ 449.9 Adjustments to reconcile net income to net cash provided by operating activities: Depreciation and amortization of fixed assets 206.9 192.2 185.7 Amortization of intangible assets 176.7 165.9 138.0 Amortization of debt issuance costs and original issue discount, net of original issue premium 1.4 1.8 3.9 Provision for doubtful accounts 17.7 13.1 7.2 (Gain) loss from sale of assets — (19.4) 6.2 Stock-based compensation expense 55.7 47.6 42.7 Realized gain on available-for-sale securities, net — — (0.9)Impairment of long-lived assets 134.0 — — Deferred income taxes 49.8 31.1 (29.3)Loss on disposal of fixed assets, net 0.4 0.6 0.3
Changes in assets and liabilities, net of effects from acquisitions: Accounts receivable (29.7) 1.8 (70.3)Prepaid expenses and other assets (33.6) (66.5) (19.7)Operating lease right-of-use assets, net 41.3 43.1 51.3 Income taxes (5.7) (0.5) 15.0 Acquisition-related liabilities — (77.0) 70.4 Accounts payable and accrued liabilities (80.8) 24.3 150.9 Deferred revenues 32.4 21.2 11.4 Operating lease liabilities (41.3) (29.6) (49.5)Other liabilities (35.8) 5.8 (6.9)Net cash provided by operating activities 1,155.7 1068.2 956.3
Cash flows from investing activities: Acquisitions and purchases of controlling interests, net of cash acquired of $9.3, $11.1, and $10.4,respectively (289.8) (275.8) (699.2)Proceeds from sale of assets — 23.1 — Investments in nonpublic companies (23.6) (94.8) — Escrow funding associated with acquisitions (9.2) (9.3) (4.5)Capital expenditures (268.4) (246.8) (216.8)Payment of contingent liability related to acquisitions (1.2) — — Other investing activities, net 0.2 7.8 (7.4)Net cash used in investing activities (592.0) (595.8) (927.9)
The accompanying notes are an integral part of these consolidated financial statements.
58
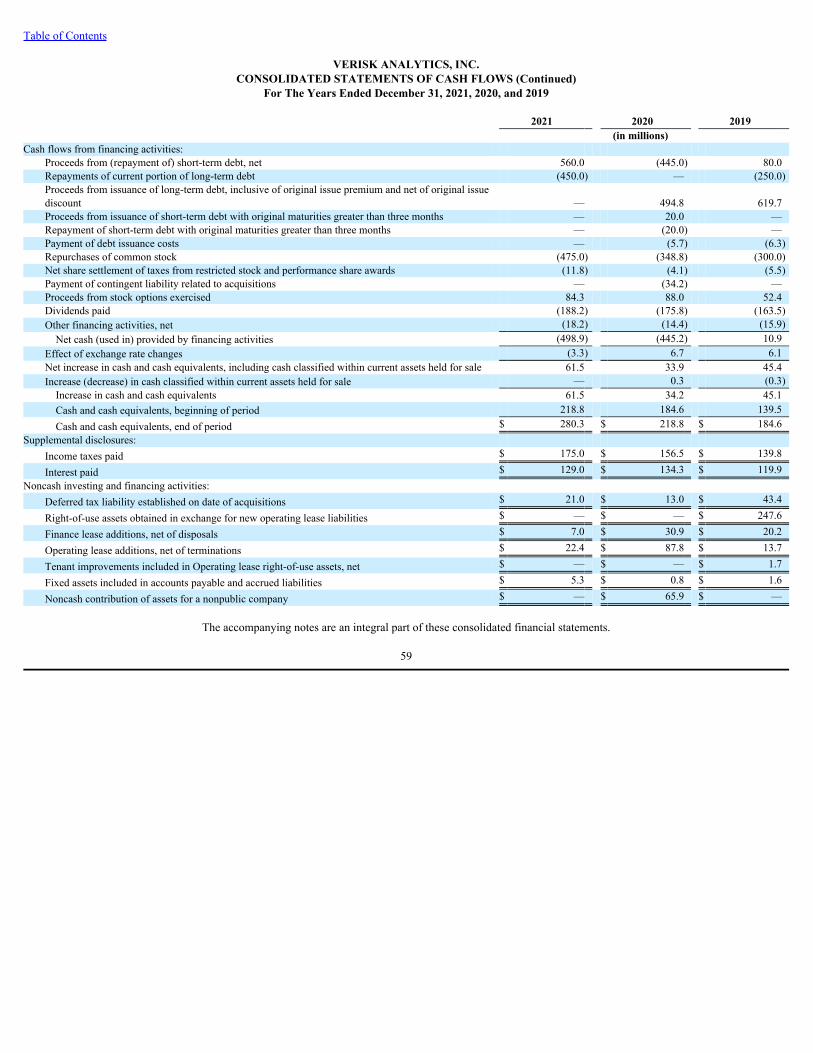
Table of Contents
VERISK ANALYTICS, INC.CONSOLIDATED STATEMENTS OF CASH FLOWS (Continued)
For The Years Ended December 31, 2021, 2020, and 2019
2021 2020 2019 (in millions) Cash flows from financing activities:
Proceeds from (repayment of) short-term debt, net 560.0 (445.0) 80.0 Repayments of current portion of long-term debt (450.0) — (250.0)Proceeds from issuance of long-term debt, inclusive of original issue premium and net of original issuediscount — 494.8 619.7 Proceeds from issuance of short-term debt with original maturities greater than three months — 20.0 — Repayment of short-term debt with original maturities greater than three months — (20.0) — Payment of debt issuance costs — (5.7) (6.3)Repurchases of common stock (475.0) (348.8) (300.0)Net share settlement of taxes from restricted stock and performance share awards (11.8) (4.1) (5.5)Payment of contingent liability related to acquisitions — (34.2) — Proceeds from stock options exercised 84.3 88.0 52.4 Dividends paid (188.2) (175.8) (163.5)Other financing activities, net (18.2) (14.4) (15.9)Net cash (used in) provided by financing activities (498.9) (445.2) 10.9
Effect of exchange rate changes (3.3) 6.7 6.1 Net increase in cash and cash equivalents, including cash classified within current assets held for sale 61.5 33.9 45.4 Increase (decrease) in cash classified within current assets held for sale — 0.3 (0.3)Increase in cash and cash equivalents 61.5 34.2 45.1 Cash and cash equivalents, beginning of period 218.8 184.6 139.5
Cash and cash equivalents, end of period $ 280.3 $ 218.8 $ 184.6 Supplemental disclosures:
Income taxes paid $ 175.0 $ 156.5 $ 139.8
Interest paid $ 129.0 $ 134.3 $ 119.9 Noncash investing and financing activities:
Deferred tax liability established on date of acquisitions $ 21.0 $ 13.0 $ 43.4
Right-of-use assets obtained in exchange for new operating lease liabilities $ — $ — $ 247.6
Finance lease additions, net of disposals $ 7.0 $ 30.9 $ 20.2
Operating lease additions, net of terminations $ 22.4 $ 87.8 $ 13.7
Tenant improvements included in Operating lease right-of-use assets, net $ — $ — $ 1.7
Fixed assets included in accounts payable and accrued liabilities $ 5.3 $ 0.8 $ 1.6
Noncash contribution of assets for a nonpublic company $ — $ 65.9 $ —
The accompanying notes are an integral part of these consolidated financial statements. 59
Table of Contents
VERISK ANALYTICS, INC.NOTES TO CONSOLIDATED FINANCIAL STATEMENTS
(Amounts in millions, except for share and per share data, unless otherwise stated)
1. Organization:
Verisk Analytics, Inc. is a data analytics provider serving customers in insurance, energy and specialized markets, and financial services. Using varioustechnologies to collect and analyze billions of records, we draw on numerous data assets and domain expertise to provide first-to-market innovations that areintegrated into customer workflows. We offer predictive analytics and decision support solutions to customers in rating, underwriting, claims, catastrophe andweather risk, global risk analytics, natural resources intelligence, economic forecasting, commercial banking and finance, and many other fields. Around the world,we help customers protect people, property, and financial assets.
We were established to serve as the parent holding company of Insurance Services Office, Inc. (“ISO”) upon completion of the initial public offering
(“IPO”), which occurred on October 9, 2009. ISO was formed in 1971 as an advisory and rating organization for the property and casualty ("P&C") insuranceindustry to provide statistical and actuarial services, to develop insurance programs, and to assist insurance companies in meeting state regulatory requirements.Over the past decade, we broadened our data assets, entered new markets, placed a greater emphasis on analytics, and pursued strategic acquisitions. We tradeunder the ticker symbol “VRSK” on the Nasdaq Global Select Market.
Since January 2020, an outbreak of the 2019 novel coronavirus ("COVID-19") has evolved into a worldwide pandemic. We have modified our operations
in line with our business continuity plans due to COVID-19. While our facilities generally remain open, we are making extensive use of the work-from-homemodel at this moment. On a daily basis, management is reviewing our operations and there have been to date minimal interruptions in our customer-facingoperations. Given the digital nature of our business and the move toward cloud enablement, we expect to remain operationally stable and fully available to ourcustomers. We are in compliance with all financial and non-financial covenants and have not observed a loss of any significant customers, a significantdeterioration in the collectability of receivables, a significant reduction in our liquidity, nor a significant decline in subscription renewal rates.
2. Basis of Presentation and Summary of Significant Accounting Policies:
Our accompanying consolidated financial statements have been prepared on the basis of accounting principles generally accepted in the United States ofAmerica (“U.S. GAAP”). The preparation of financial statements in conformity with these accounting principles requires management to make estimates andassumptions that affect the reported amounts of assets, liabilities, disclosure of contingent assets and liabilities at the date of the financial statements, and thereported amounts of revenues and expenses during the reporting periods. Significant estimates include acquisition purchase price allocations, the fair value ofgoodwill, the realization of deferred tax assets and liabilities, acquisition-related liabilities, fair value of stock-based compensation for equity awards granted, andassets and liabilities for pension and postretirement benefits. Actual results may ultimately differ from those estimates. Certain reclassifications, includingcombining acquisition-related liabilities into the "Accounts payable and accrued liabilities" line in 2021 (they used to be shown as a separate line item) and movingAtmospheric and Environmental Research ("AER"), an immaterial component, from the Energy and Specialized Markets segment to the underwriting and ratingcategory within the Insurance segment, have been made within our consolidated balance sheets, consolidated statements of operations, consolidated statements ofcash flows, and in our notes to conform to our respective 2021 presentation.
Significant accounting policies include the following: (a) Intercompany Accounts and Transactions
The consolidated financial statements include all of our accounts. All intercompany accounts and transactions have been eliminated.
(b) Revenue Recognition
The following describes our primary types of revenues and the applicable revenue recognition policies. We recognize revenues through
recurring and non-recurring long-term agreements (generally one to five years) for hosted subscriptions, advisory/consulting services, and for transactionalsolutions. Each of our reportable segments, Insurance, Energy and Specialized Markets, and Financial Services, has a portion of its revenue from more than one ofthese revenue types. Our revenues are primarily derived from the sale of services where revenue is recognized when control of the promised services is transferredto customers in an amount that reflects the consideration that we expect to be entitled to in exchange for those services. Fees for services provided by us are non-refundable. Revenue is recognized net of applicable sales tax withholdings.
Hosted Subscriptions
We offer two forms of hosted subscriptions. The first and most prevalent form of hosted subscription is where customers access content only
through our online portal (the "Hosted Subscription"). We grant a license to our customer to enter our online portal. The license is a contractual mechanism thatallows our customer to access our online portal for a defined period of time. As the license alone does not provide utility to our customer, our customer has nocontractual right to take possession of our online portal at any time, and our customer cannot engage another party to host our online portal and related content, it isnot considered a functional license under Topic 606. Our promise to our customer is to provide continuous access to our online portal and to update the contentthroughout the subscription period. Hosted Subscription is a single performance obligation that represents a series of distinct services (daily access to our onlineportal and related content) that are substantially the same and that have the same pattern of transfer to our customer. We recognize revenue for HostedSubscriptions ratably over the subscription period on a straight-line basis as services are performed and continuous access to information in our online portal isprovided over the entire term of the agreements.

60

Table of Contents
VERISK ANALYTICS, INC.NOTES TO CONSOLIDATED FINANCIAL STATEMENTS — (Continued)
The second form of hosted subscription is where customers have access to our online portals combined with software content that is delivered
via disk drive/download to our customer (“Hosted Subscription with Disk Drive/Download”) and is offered only on a limited basis. For this form of hostedsubscription, we also grant our customer a license to enter our online portal as well as access the software content as needed and act as the same contractualmechanism as described for Hosted Subscriptions. The Hosted Subscription with Disk Drive/Download works in such a manner that our customer gains significantbenefit, functionality, and overall utility only when the online portal and the software content are used together. The disk drive/download contains the models whilethe online portal contains the latest data and research which is updated throughout the subscription period. The models within the disk drive/download depend onthe data and research contained within our online portal. The data and research within our online portal is only useful when our customer can utilize it within themodels (e.g., queries, projections, etc.) so that they may use the most current information and alerts to forecast potential future losses. The software content is onlysold together with our online portal to provide a highly interdependent and interrelated promise and therefore represents a single performance obligation. As ourcustomer has no contractual right to take possession of our online portal at any time, and our customer cannot engage another party to host our online portal andrelated software content, it is not considered a functional license under Topic 606. Our promise to our customer is to deliver the disk drive/download, to providecontinuous access to our online portal, and to update the software content throughout the subscription period. We recognize revenue for Hosted Subscriptions withDisk Drive/Download ratably over the subscription period on a straight-line basis as services are performed and continuous access to information is provided overthe entire term of the agreements.
Subscriptions are generally paid in advance of rendering services either quarterly or annually upon commencement of the subscription period,
which is usually for one year and in most instances automatically renewed each year. Advisory/Consulting Services
We provide certain discrete project based advisory/consulting services, which are recognized over time by measuring the progress toward
complete satisfaction of the performance obligation, based on the input method of consulting hours worked; this aligns with the results achieved and valuetransferred to our customer. The hours consumed are most reflective of the measure of progress towards satisfying the performance obligation, as the resourceshours worked directly tie to the progress of the services to be provided. In general, they are billed over the course of the project.
Transactional Solutions
Certain solutions are also paid for by customers on a transactional basis. We recognize these revenues as the solutions are delivered or servicesperformed at a point in time. In general, our customers are billed monthly at the end of each month.
(c) Deferred Revenues
We invoice our customers in annual, quarterly, monthly, or milestone installments. Amounts billed and/or collected in advance of services being
provided are recorded as “Deferred revenues” and “Other noncurrent liabilities” in our accompanying consolidated balance sheets and are recognized as theservices are performed, control is transferred to customers, and the applicable revenue recognition criteria is met.
(d) Accounts Receivable and Allowance for Doubtful Accounts
Accounts receivable are generally recorded at the invoiced amount. Unbilled receivables are short-term in nature and expected to be billed
within one year. The allowance for doubtful accounts or expected credit losses is estimated based on an analysis of the aging of the accounts receivable, historicalwrite-offs, customer payment patterns, individual customer credit worthiness, current economic trends, reasonable and supportable forecasts of future economicconditions, and/or establishment of specific reserves for customers in adverse financial condition. We assess the adequacy of the allowance for doubtful accountson a quarterly basis.
(e) Deferred Commissions
We recognize an asset for the incremental costs of obtaining a contract with a customer if we expect the benefit of those costs to be longer than
one year. We have determined that certain sales incentive programs meet the requirements to be capitalized. The incremental costs of obtaining a contract with acustomer, which primarily consist of sales commissions, are deferred and amortized over a useful life of five years that is consistent with the transfer to ourcustomer the services to which the asset relates. We classify deferred commissions as current or noncurrent based on the timing of expense recognition. The currentand noncurrent portions of deferred commissions are included in "Prepaid expenses" and "Other noncurrent assets", respectively, in our consolidated balancesheets as of December 31, 2021. Amortization expense related to deferred commissions is computed on a straight-line basis over its estimated useful lives andincluded in "Selling, general and administrative" within our accompanying consolidated statements of operations.
61

Table of Contents
VERISK ANALYTICS, INC.NOTES TO CONSOLIDATED FINANCIAL STATEMENTS — (Continued)
(f) Fixed Assets and Finite-lived Intangible Assets
Fixed assets and finite-lived intangibles are stated at cost less accumulated depreciation and amortization, which are computed on a straight-linebasis over their estimated useful lives. Leasehold improvements are amortized over the shorter of the useful life of the asset or the lease term.
Our internal software development costs primarily relate to internal-use software. Such costs are capitalized in the application development stage
in accordance with ASC 350-40, Internal-use Software ("ASC 350-40"). We also capitalize software development costs upon the establishment of technologicalfeasibility for a product in accordance with ASC 985-20, Software to be Sold, Leased, or Marketed (“ASC 985-20”). Software development costs are amortized ona straight-line basis.
In accordance with ASC 360, Property, Plant & Equipment, whenever events or changes in circumstances indicate that the carrying amount of
long-lived assets and finite-lived intangible assets may not be recoverable, we review our long-lived assets and finite-lived intangible assets for impairment by firstcomparing the carrying value of our assets to the sum of the undiscounted cash flows expected to result from the use and eventual disposition of our assets. If thecarrying value exceeds the sum of our assets’ undiscounted cash flows, we estimate and recognize an impairment loss by taking the difference between thecarrying value and fair value of our assets.
As of December 31, 2021, we reassessed the recoverability of long-lived assets for our Financial Services reporting unit based upon the weaker
than expected operating performance as a result of changing market conditions. These conditions constituted a triggering event, which resulted in a long-lived assetimpairment for our Financial Services operating segment. Please refer to Note 9. Fixed Assets and Note 12. Goodwill and Intangible Assets for more information.
(g) Leases
We have operating and finance leases for corporate offices, data centers, and certain equipment that are accounted for under ASC 842. The leaseterm for our corporate headquarters ends in 2033 and includes the options to extend for one 10-year renewal period and two 5-year renewal periods. The lease ofour Hyderabad, India office may be terminated in six months without penalty. Extension and termination options are considered in our calculation of the right-of-use (“ROU”) assets and lease liabilities when we determine it is reasonably certain that we will exercise those options.
We determine if an arrangement is a lease at inception. We consider any contract where there is an identified asset and that it has the right tocontrol the use of such asset in determining whether the contract contains a lease. A ROU asset represents our right to use an underlying asset for the lease termand the lease liabilities represent our obligation to make lease payments arising from the lease. Operating lease ROU assets and lease liabilities are recognized atcommencement date based on the present value of lease payments over the lease term. As our operating leases do not provide an implicit rate, we use anincremental borrowing rate based on the information available on the adoption date in determining the present value of lease payments. The incremental borrowingrate was calculated by using our credit rating on our publicly-traded U.S. unsecured bonds and estimating an appropriate credit rating for similar secured debtinstruments. Our calculated credit rating on secured debt instruments determined the yield curve used. We calculated an implied spread and applied the spreads tothe risk-free interest rates based on the yield of the U.S. Treasury zero coupon securities with a maturity equal to the remaining lease term in determining theborrowing rates for all operating leases. Our operating lease ROU assets include any lease payments made prior to the rent commencement date and exclude leaseincentives. Lease expense for lease payments are recognized on a straight-line basis over the lease term. Operating lease transactions are included in "Operatinglease right-of-use assets, net", and "Operating lease liabilities", current and noncurrent, within our accompanying consolidated balance sheets. Finance leases areincluded in property and equipment under "Fixed assets, net", "Short-term debt and current portion of long-term debt", and "Long-term debt" within ouraccompanying consolidated balance sheets.
(h) Fair Value of Financial and Non-financial Instruments
We follow the provisions of ASC 820-10, Fair Value Measurements (“ASC 820-10”), which defines fair value, establishes a framework for
measuring fair value under U.S. GAAP and expands fair value measurement disclosures. We follow the provisions of ASC 820-10 for our financial assets andliabilities recognized or disclosed at fair value on a recurring basis. We follow the provisions of ASC 820-10 for our non-financial assets and liabilities recognizedor disclosed at fair value.
(i) Foreign Currency
We have determined local currencies are the functional currencies of our foreign operations. The assets and liabilities of foreign subsidiaries are
translated at the period-end rate of exchange and statement of operations items are translated at the average rates prevailing during the year. The resultingtranslation adjustment is recorded as a component of “Accumulated other comprehensive losses” in our accompanying consolidated statements of changes instockholders’ equity.
62

Table of Contents
VERISK ANALYTICS, INC.NOTES TO CONSOLIDATED FINANCIAL STATEMENTS — (Continued)
(j) Stock-Based Compensation
We follow ASC 718, Stock Compensation (“ASC 718”). Under ASC 718, stock-based compensation cost is measured at the grant date, based onthe fair value of the awards granted, and is recognized as expense over the requisite service period.
Our nonqualified stock options have an exercise price equal to the closing price of our common stock on the grant date, with a ten-year
contractual term. The expected term for our stock options granted for a majority of the awards granted was estimated based on studies of historical experience andprojected exercise behavior. However, for certain awards granted, for which no historical exercise pattern exists, the expected term was estimated using thesimplified method. The risk-free interest rate is based on the yield of U.S. Treasury zero coupon securities with a maturity equal to the expected term of the equityaward. The volatility factor is calculated using our historical daily closing prices over the most recent period that is commensurate with the expected term of thestock option awards. The expected dividend yield was based on our expected annual dividend rate on the date of grant.
The fair value of our restricted stock is determined using the closing price of our common stock on the grant date. Our restricted stock is not
assignable or transferable until it becomes vested. Restricted stock generally has a service vesting period of four years and we recognize the expense ratably overthis service vesting period.
Performance share units (“PSU”) vest at the end of a three-year performance period, subject to the recipient’s continued service. Each PSU
represents the right to receive one share of our common stock and the ultimate realization is based on our achievement of certain market performance criteria. Wedetermined the grant date fair value of PSUs with the assistance of a third-party valuation specialist and based on estimates provided by us. The valuation of ourPSUs employed the Monte Carlo simulation model, which includes certain key assumptions that were applied to us and our peer group. Those key assumptionsincluded valuation date stock price, expected volatility, correlation coefficients, risk-free rate of return, and expected dividend yield. The valuation date stock priceis based on the dividend-adjusted closing price on the grant date. Expected volatility is calculated using historical daily closing prices over a period that iscommensurate with the length of the performance period. The correlation coefficients are based on the price data used to calculate the historical volatilities. Therisk-free rate of return is based on the yield of U.S. Treasury zero coupon securities with a maturity equal to the length of the performance period. The expecteddividend yield was based on our and our peer group’s expected dividend rate over the performance period. PSUs are tied to the achievement of certain marketperformance conditions, namely relative total shareholder return as compared to the S&P 500 index ("TSR-based PSUs").
We estimate expected forfeitures of equity awards at the date of grant and recognize compensation expense only for those awards expected to
vest. The forfeiture assumption is ultimately adjusted to the actual forfeiture rate. Estimated forfeiture is ultimately adjusted to actual forfeiture. Changes in theforfeiture assumptions may impact the total amount of expense ultimately recognized, as well as the timing of expense recognized over the requisite service period.
Excess tax benefit from exercised stock options, lapsing of restricted stock and PSUs is recorded as an income tax benefit in our accompanyingconsolidated statements of operations. This tax benefit is calculated as the excess of the intrinsic value of options exercised and of the market value of restrictedstock lapsed over the compensation recognized for financial reporting purposes.
(k) Research and Development Costs
Research and development costs, which are primarily related to personnel and related overhead costs incurred in developing new services forcustomers, are expensed as incurred. Such costs were $49.2 million, $48.9 million, and $60.0 million for the years ended December 31, 2021, 2020, and2019, respectively, and were included in our accompanying consolidated statements of operations.
(l) Advertising Costs
Advertising costs, which are primarily associated with promoting our brand, names and solutions provided, are expensed as incurred. Such costswere $12.0 million, $8.5 million, and $10.7 million for the years ended December 31, 2021, 2020, and 2019, respectively.
(m) Income Taxes
We account for income taxes under the asset and liability method under ASC 740, Income Taxes (“ASC 740”), which requires the recognition ofdeferred tax assets and liabilities for the expected future tax consequences of events that have been included in the financial statements. Under this method,deferred tax assets and liabilities are determined based on the differences between the financial statements and tax basis of assets and liabilities using enacted taxrates in effect for the year in which the differences are expected to reverse. The effect of a change in tax rates on deferred tax assets and liabilities is recognized inincome in the period that includes the enactment date.
Deferred tax assets are recorded to the extent these assets are more likely than not to be realized. In making such determination, we consider all
available positive and negative evidence, including future reversals of existing taxable temporary differences, projected future taxable income, tax planningstrategies, and recent financial operations. Valuation allowances are recognized to reduce deferred tax assets if it is determined to be more likely than not that all orsome of the potential deferred tax assets will not be realized.
63
Table of Contents
VERISK ANALYTICS, INC.NOTES TO CONSOLIDATED FINANCIAL STATEMENTS — (Continued)
We follow ASC 740-10, Income Taxes (“ASC 740-10”), which clarifies the accounting for uncertainty in income taxes recognized in the
financial statements. ASC 740-10 provides that a tax benefit from an uncertain tax position may be recognized based on the technical merits when it is more likelythan not that the position will be sustained upon examination, including resolutions of any related appeals or litigation processes. Income tax positions must meet amore likely than not recognition threshold in accordance with ASC 740-10. This standard also provides guidance on measurement, derecognition, classification,interest and penalties, accounting in interim periods, disclosure, and transition.
We recognize interest and penalties related to unrecognized tax benefits within the income tax expense line in our accompanying consolidated
statements of operations. Accrued interest and penalties are included within “Other liabilities” on our accompanying consolidated balance sheets.
(n) Earnings Per Share
Basic and diluted earnings per share (“EPS”) are determined in accordance with ASC 260, Earnings per Share, which specifies the computation,presentation and disclosure requirements for EPS. Basic EPS excludes all dilutive common stock equivalents. It is based upon the weighted average number ofcommon shares outstanding during the period. Diluted EPS, as calculated using the treasury stock method, reflects the potential dilution that would occur if ourdilutive outstanding stock options and stock awards were issued.
(o) Pension and Postretirement Benefits
We account for our pension and postretirement benefits under ASC 715, Compensation — Retirement Benefits (“ASC 715”). ASC 715 requires
the recognition of the funded status of a benefit plan in the balance sheet, the recognition in other comprehensive income (loss) of gains or losses and prior servicecosts arising during the period, but which are not included as components of periodic benefit cost or credit, and the measurement of defined benefit plan assets andobligations as of the balance sheet date. We utilize a valuation date of December 31.
(p) Product Warranty Obligations
We provide warranty coverage for certain of our solutions. We recognize a product warranty obligation when claims are probable and can be
reasonably estimated. As of December 31, 2021 and 2020, product warranty obligations were not material.
In the ordinary course of business, we enter into numerous agreements that contain standard indemnities whereby we indemnify another partyfor breaches of confidentiality, infringement of intellectual property or gross negligence. Such indemnifications are primarily granted under licensing of computersoftware. Most agreements contain provisions to limit the maximum potential amount of future payments that we could be required to make under theseindemnifications; however, we are not able to develop an estimate of the maximum potential amount of future payments to be made under these indemnificationsas the triggering events are not subject to predictability.
(q) Loss Contingencies
We accrue for costs relating to litigation, claims, and other contingent matters when such liabilities become probable and reasonably estimable.
Such estimates are based on management’s judgment. Actual amounts paid may differ from amounts estimated, and such differences will be charged to operationsin the period in which the final determination of the liability is made.
(r) Goodwill
Goodwill represents the excess of acquisition costs over the fair value of tangible net assets and identifiable intangible assets of our businesses
acquired. Goodwill and intangible assets deemed to have indefinite lives are not amortized. Intangible assets determined to have finite lives are amortized overtheir useful lives. Goodwill and intangible assets with indefinite lives are subject to impairment testing annually as of June 30 or whenever events or changes incircumstances indicate that the carrying amount may not be fully recoverable. We completed the required annual impairment test as of June 30, 2021,which resulted in no impairment of goodwill in 2021. This test compares the carrying value of each reporting unit to its fair value. If the fair value of the reportingunit exceeds the carrying value of our net assets, including goodwill assigned to that reporting unit, goodwill is not impaired. If the carrying value of the reportingunit’s net assets, including goodwill, exceeds the fair value of the reporting unit, then an impairment loss is recorded for the difference between the carryingamount and the fair value of the reporting unit.
64
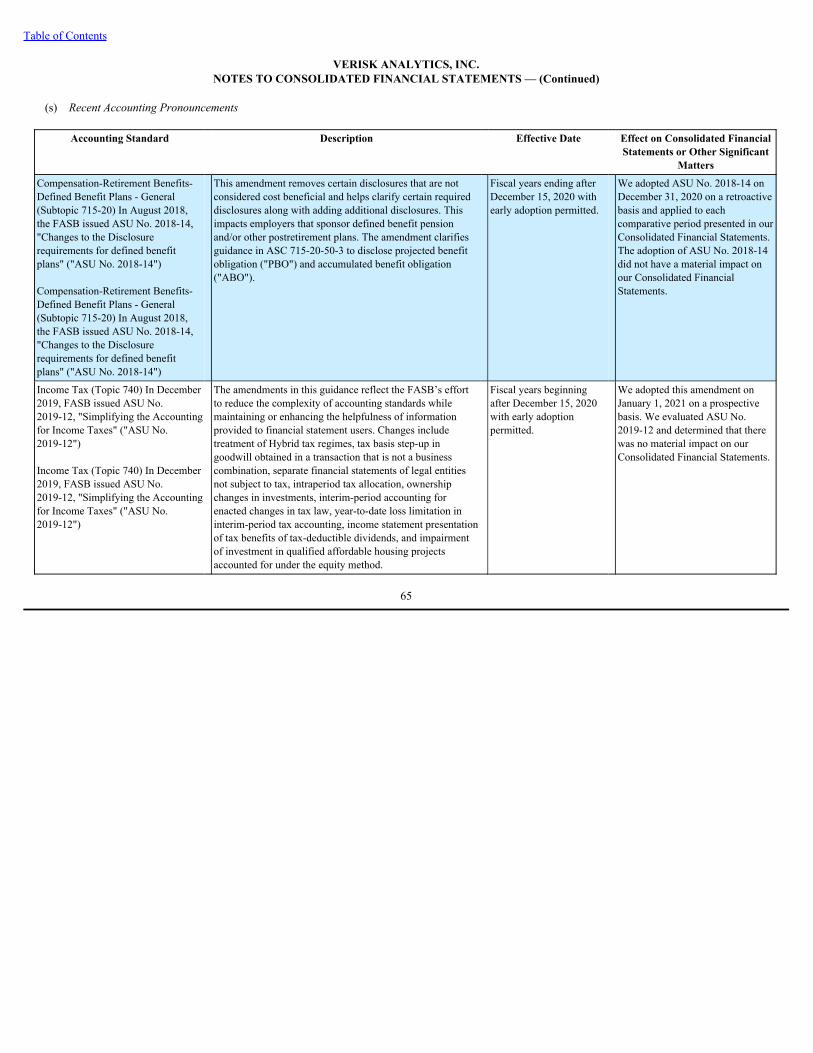
Table of Contents
VERISK ANALYTICS, INC.NOTES TO CONSOLIDATED FINANCIAL STATEMENTS — (Continued)
(s) Recent Accounting Pronouncements
Accounting Standard Description Effective Date Effect on Consolidated Financial
Statements or Other SignificantMatters
Compensation-Retirement Benefits-Defined Benefit Plans - General(Subtopic 715-20) In August 2018,the FASB issued ASU No. 2018-14,"Changes to the Disclosurerequirements for defined benefitplans" ("ASU No. 2018-14") Compensation-Retirement Benefits-Defined Benefit Plans - General(Subtopic 715-20) In August 2018,the FASB issued ASU No. 2018-14,"Changes to the Disclosurerequirements for defined benefitplans" ("ASU No. 2018-14")
This amendment removes certain disclosures that are notconsidered cost beneficial and helps clarify certain requireddisclosures along with adding additional disclosures. Thisimpacts employers that sponsor defined benefit pensionand/or other postretirement plans. The amendment clarifiesguidance in ASC 715-20-50-3 to disclose projected benefitobligation ("PBO") and accumulated benefit obligation("ABO").
Fiscal years ending afterDecember 15, 2020 withearly adoption permitted.
We adopted ASU No. 2018-14 onDecember 31, 2020 on a retroactivebasis and applied to eachcomparative period presented in ourConsolidated Financial Statements.The adoption of ASU No. 2018-14did not have a material impact onour Consolidated FinancialStatements.
Income Tax (Topic 740) In December2019, FASB issued ASU No.2019-12, "Simplifying the Accountingfor Income Taxes" ("ASU No.2019-12") Income Tax (Topic 740) In December2019, FASB issued ASU No.2019-12, "Simplifying the Accountingfor Income Taxes" ("ASU No.2019-12")
The amendments in this guidance reflect the FASB’s effortto reduce the complexity of accounting standards whilemaintaining or enhancing the helpfulness of informationprovided to financial statement users. Changes includetreatment of Hybrid tax regimes, tax basis step-up ingoodwill obtained in a transaction that is not a businesscombination, separate financial statements of legal entitiesnot subject to tax, intraperiod tax allocation, ownershipchanges in investments, interim-period accounting forenacted changes in tax law, year-to-date loss limitation ininterim-period tax accounting, income statement presentationof tax benefits of tax-deductible dividends, and impairmentof investment in qualified affordable housing projectsaccounted for under the equity method.
Fiscal years beginningafter December 15, 2020with early adoptionpermitted.
We adopted this amendment onJanuary 1, 2021 on a prospectivebasis. We evaluated ASU No.2019-12 and determined that therewas no material impact on ourConsolidated Financial Statements.
65

Table of Contents
VERISK ANALYTICS, INC.NOTES TO CONSOLIDATED FINANCIAL STATEMENTS — (Continued)
3. Cash and Cash Equivalents:
Cash and cash equivalents consist of cash in banks, commercial paper, money-market funds, and other liquid instruments with original maturities of 90days or less at the time of purchase. 4. Accounts Receivable:
Accounts receivable, net consisted of the following at December 31:
2021 2020 Billed receivables $ 395.5 $ 380.5 Unbilled receivables 72.1 69.6 Total receivables 467.6 450.1 Less allowance for doubtful accounts (21.3) (17.7)Accounts receivable, net $ 446.3 $ 432.4
5. Concentration of Credit Risk:
Financial instruments that potentially expose us to credit risk consist primarily of cash and cash equivalents as well as accounts receivable, net which aregenerally not collateralized. We maintain our cash and cash equivalents in higher credit quality financial institutions in order to limit the amount of credit exposure.The total domestic cash balances are insured by the Federal Deposit Insurance Corporation (“FDIC”) to a maximum amount of $250.0 thousand per bank as ofDecember 31, 2021 and 2020. As of December 31, 2021 and 2020, we had cash balances on deposit with fifteen and ten banks that exceeded the balance insuredby the FDIC limit by approximately$40.3 million and $92.8 million, respectively. As of December 31, 2021 and 2020, we also had cash on deposit with foreignbanks of approximately $240.4 million and $122.5 million, respectively.
We consider the concentration of credit risk associated with our accounts receivable to be commercially reasonable and believe that such concentration
does not result in the significant risk of near-term severe adverse impacts. Our top fifty customers represent approximately 32% of revenues for 2021 and 33% for2020 and 2019, respectively, with no individual customer accounting for more than approximately 3% of revenues for the years ended December 31, 2021, 2020,and 2019. No individual customer comprised more than approximately 4% and 2% of accounts receivable as of December 31, 2021 and 2020, respectively. 6. Revenues:
Disaggregated revenues by type of service and by country are provided below for the years ended December 31, 2021, 2020, and 2019. No individualcountry outside of the U.S. accounted for more than 10.0% of our consolidated revenues for the years ended December 31, 2021, 2020, or 2019.
2021 2020 2019 Insurance: Underwriting & rating $ 1,555.1 $ 1,413.0 $ 1,274.5 Claims 651.8 595.7 610.9 Total Insurance 2,206.9 2,008.7 1,885.4
Energy and Specialized Markets 648.9 619.2 543.7 Financial Services 142.8 156.7 178.0
Total revenues $ 2,998.6 $ 2,784.6 $ 2,607.1 2021 2020 2019 Revenues: United States $ 2,285.5 $ 2,133.6 $ 2,005.6 United Kingdom 204.4 181.6 177.3 Other countries 508.7 469.4 424.2 Total revenues $ 2,998.6 $ 2,784.6 $ 2,607.1
Contract assets are defined as an entity's right to consideration in exchange for goods or services that the entity has transferred to a customer when thatright is conditioned on something other than the passage of time. As of December 31, 2021 and 2020, we had no contract assets.
66

Table of Contents
VERISK ANALYTICS, INC.NOTES TO CONSOLIDATED FINANCIAL STATEMENTS — (Continued)
Contract liabilities are defined as an entity's obligation to transfer goods or services to a customer for which the entity has received consideration (or an
amount of consideration is due) from the customer. As of December 31, 2021 and 2020, we had contract liabilities that primarily related to unsatisfied performanceobligations to provide customers with the right to use and update the online content over the remaining contract term of $504.8 million and $468.2 million,respectively. Contract liabilities, which are current and noncurrent, are included in "Deferred revenues" and "Other noncurrent liabilities" in our consolidatedbalance sheets, respectively, as of December 31, 2021 and 2020.
The following is a summary of the change in contract liabilities from December 31, 2019 through December 31, 2021:
Contract Liabilities at December 31, 2019 $ 443.2 Revenue (2,784.6)Billings 2,809.6
Contract Liabilities at December 31, 2020 468.2 Revenue (2,998.6)Billings 3,035.2
Contract Liabilities at December 31, 2021 $ 504.8
Our most significant remaining performance obligations relate to providing customers with the right to use and update the online content over theremaining contract term. Our disclosure of the timing for satisfying the performance obligation is based on the requirements of contracts with customers. However,from time to time, these contracts may be subject to modifications, impacting the timing of satisfying the performance obligations. These performance obligations,which are expected to be satisfied within one year, comprised approximately 97% and 99% of the balance as of December 31, 2021 and 2020, respectively.
We recognize an asset for incremental costs of obtaining a contract with a customer if we expect the benefits of those costs to be longer than one year. As
of December 31, 2021 and 2020, we had deferred commissions of $86.8 million and $73.8 million, respectively, which have been included in "Prepaid expenses"and "Other noncurrent assets" in our accompanying consolidated balance sheets. 7. Fair Value Measurements:
Certain assets and liabilities are reported at fair value in our accompanying consolidated balance sheets. Such assets and liabilities include amounts for
both financial and non-financial instruments. To increase consistency and comparability of assets and liabilities recorded at fair value, ASC 820-10 established athree-level fair value hierarchy to prioritize the inputs to valuation techniques used to measure fair value. ASC 820-10 requires disclosures detailing the extent towhich companies' measure assets and liabilities at fair value, the methods and assumptions used to measure fair value, and the effect of fair value measurements onearnings. In accordance with ASC 820-10, we applied the following fair value hierarchy:
Level 1 — Assets or liabilities for which the identical item is traded on an active exchange, such as publicly-traded instruments. Level 2 — Assets and liabilities valued based on observable market data for similar instruments. Level 3 — Assets or liabilities for which significant valuation assumptions are not readily observable in the market; instruments valued based on the bestavailable data, some of which is internally-developed, and considers risk premiums that a market participant would require.
The fair value of cash and cash equivalents, accounts receivable, accounts payable and accrued liabilities, and short-term debt approximate their carrying
amounts because of the short-term nature of these instruments. Our investments in registered investment companies, which are Level 1 assets measured at fairvalue on a recurring basis using quoted prices in active markets multiplied by the number of shares owned, were $5.0 million and $4.1 million as of December 31,2021 and 2020, respectively. Our investments in registered investment companies have been included in "Other current assets" in our consolidated balance sheetsas of December 31, 2021 and 2020.
We elected not to carry our long-term debt at fair value. The carrying value of our long-term debt represents the amortized cost, inclusive of unamortized
premium, and net of unamortized discount and debt issuance costs. We assess the fair value of these financial instruments based on an estimate of interest ratesavailable to us for financial instruments with similar features, our current credit rating, and spreads applicable to us. The following table summarizes the carryingvalue and estimated fair value of these financial instruments as of December 31, 2021 and 2020, respectively:
2021 2020 Fair Value Carrying Estimated Carrying Estimated Hierarchy Value Fair Value Value Fair Value Financial instrument not carried at fair value: Senior Notes (Note 15) Level 2 $ 2,692.0 $ 3,017.4 $ 3,140.8 $ 3,652.2
On February 1, 2020, the sale of the aerial imagery sourcing group was completed. We contributed the assets related to the disposed business and cash of
$63.8 million in exchange for a non-controlling 35.0% ownership interest in a nonpublic company, Vexcel Group, Inc. ("Vexcel"). On May 25, 2021, we made anadditional $15.0 million cash investment in Vexcel for an additional 3.7% ownership. As of December 31, 2021 and 2020, we had an investment of $144.1 millionand $129.1 million, respectively, related to such interest. The value of our investment is based on management's estimates with the assistance of valuationsperformed by third-party specialists. This investment was included in "Other noncurrent assets" in our accompanying consolidated balance sheets. Refer to Note11. Dispositions for further discussion.
As of December 31, 2021 and 2020, we had securities without readily determinable market values, inclusive of Vexcel, of $161.6 million and

$143.1 million, respectively, which were accounted for at cost. We do not have the ability to exercise significant influence over the investees’ operating andfinancial policies or do not hold investments in common stock or in-substance common stock in such entities. As of December 31, 2021 and 2020, we also hadinvestments in private companies of $54.6 million and $49.5 million, respectively, accounted for in accordance with ASC 323-10-25, The Equity Method ofAccounting for Investments in Common Stock ("ASC 323-10-25") as equity method investments. All such investments were included in "Other noncurrent assets"in our accompanying consolidated balance sheets. For the years ended December 31, 2021 and 2020, there was no provision for credit losses related to theseinvestments.
67
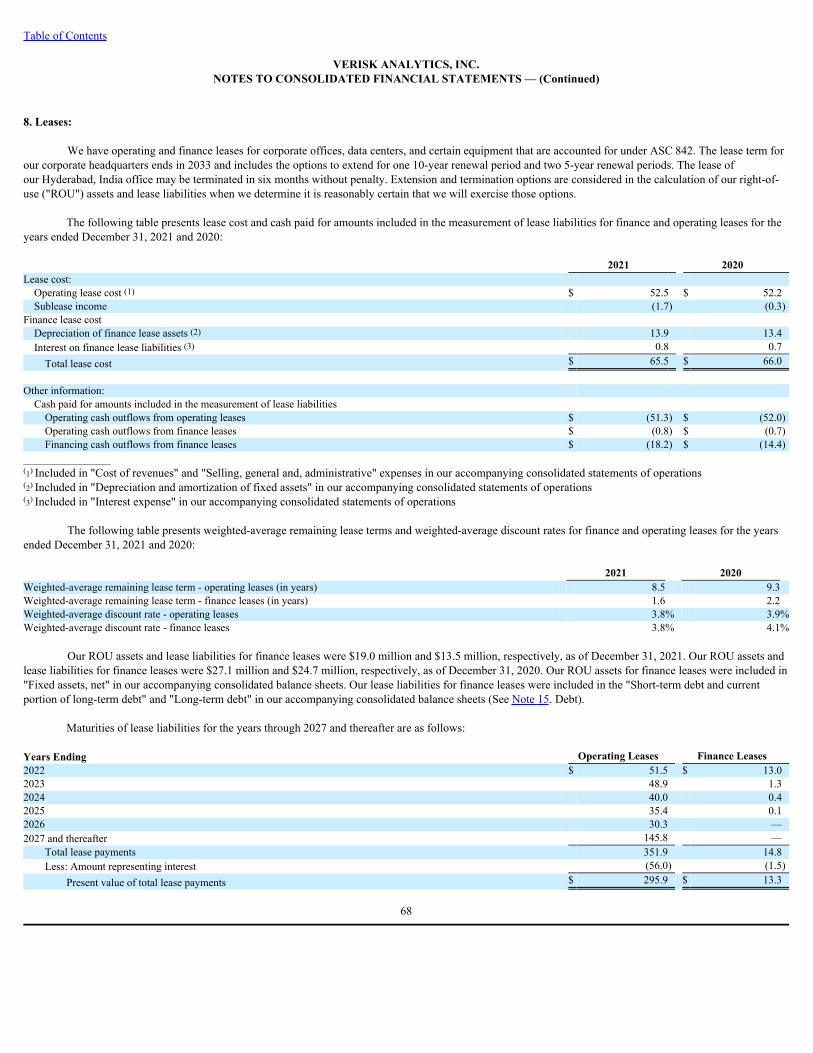
Table of Contents
VERISK ANALYTICS, INC.NOTES TO CONSOLIDATED FINANCIAL STATEMENTS — (Continued)
8. Leases:
We have operating and finance leases for corporate offices, data centers, and certain equipment that are accounted for under ASC 842. The lease term forour corporate headquarters ends in 2033 and includes the options to extend for one 10-year renewal period and two 5-year renewal periods. The lease ofour Hyderabad, India office may be terminated in six months without penalty. Extension and termination options are considered in the calculation of our right-of-use ("ROU") assets and lease liabilities when we determine it is reasonably certain that we will exercise those options.
The following table presents lease cost and cash paid for amounts included in the measurement of lease liabilities for finance and operating leases for theyears ended December 31, 2021 and 2020:
2021 2020 Lease cost: Operating lease cost (1) $ 52.5 $ 52.2 Sublease income (1.7) (0.3)
Finance lease cost Depreciation of finance lease assets (2) 13.9 13.4 Interest on finance lease liabilities (3) 0.8 0.7 Total lease cost $ 65.5 $ 66.0
Other information: Cash paid for amounts included in the measurement of lease liabilities Operating cash outflows from operating leases $ (51.3) $ (52.0)Operating cash outflows from finance leases $ (0.8) $ (0.7)Financing cash outflows from finance leases $ (18.2) $ (14.4)
_______________(1) Included in "Cost of revenues" and "Selling, general and, administrative" expenses in our accompanying consolidated statements of operations(2) Included in "Depreciation and amortization of fixed assets" in our accompanying consolidated statements of operations(3) Included in "Interest expense" in our accompanying consolidated statements of operations
The following table presents weighted-average remaining lease terms and weighted-average discount rates for finance and operating leases for the yearsended December 31, 2021 and 2020:
2021 2020 Weighted-average remaining lease term - operating leases (in years) 8.5 9.3 Weighted-average remaining lease term - finance leases (in years) 1.6 2.2 Weighted-average discount rate - operating leases 3.8% 3.9%Weighted-average discount rate - finance leases 3.8% 4.1%
Our ROU assets and lease liabilities for finance leases were $19.0 million and $13.5 million, respectively, as of December 31, 2021. Our ROU assets andlease liabilities for finance leases were $27.1 million and $24.7 million, respectively, as of December 31, 2020. Our ROU assets for finance leases were included in"Fixed assets, net" in our accompanying consolidated balance sheets. Our lease liabilities for finance leases were included in the "Short-term debt and currentportion of long-term debt" and "Long-term debt" in our accompanying consolidated balance sheets (See Note 15. Debt).
Maturities of lease liabilities for the years through 2027 and thereafter are as follows:
Years Ending Operating Leases Finance Leases 2022 $ 51.5 $ 13.0 2023 48.9 1.3 2024 40.0 0.4 2025 35.4 0.1 2026 30.3 — 2027 and thereafter 145.8 —
Total lease payments 351.9 14.8 Less: Amount representing interest (56.0) (1.5)
Present value of total lease payments $ 295.9 $ 13.3
68
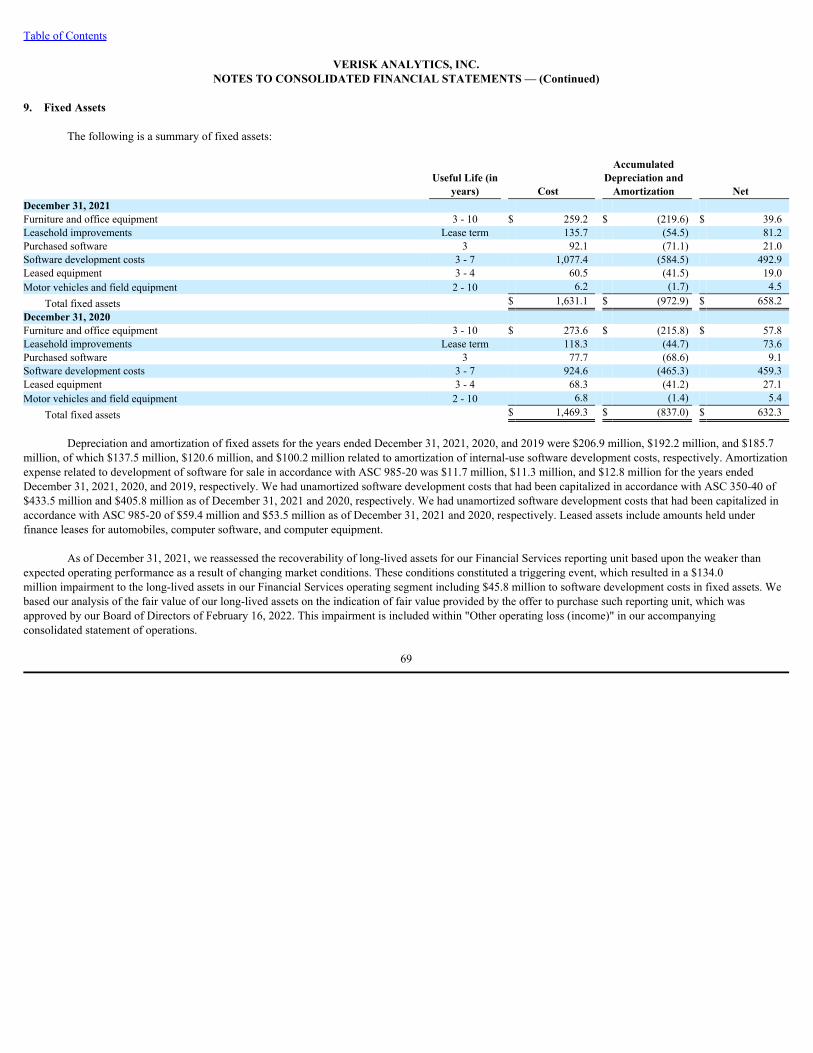
Table of Contents
VERISK ANALYTICS, INC.NOTES TO CONSOLIDATED FINANCIAL STATEMENTS — (Continued)
9. Fixed Assets
The following is a summary of fixed assets:
Useful Life (in
years) Cost
AccumulatedDepreciation and
Amortization Net December 31, 2021 Furniture and office equipment 3 - 10 $ 259.2 $ (219.6) $ 39.6 Leasehold improvements Lease term 135.7 (54.5) 81.2 Purchased software 3 92.1 (71.1) 21.0 Software development costs 3 - 7 1,077.4 (584.5) 492.9 Leased equipment 3 - 4 60.5 (41.5) 19.0 Motor vehicles and field equipment 2 - 10 6.2 (1.7) 4.5
Total fixed assets $ 1,631.1 $ (972.9) $ 658.2 December 31, 2020 Furniture and office equipment 3 - 10 $ 273.6 $ (215.8) $ 57.8 Leasehold improvements Lease term 118.3 (44.7) 73.6 Purchased software 3 77.7 (68.6) 9.1 Software development costs 3 - 7 924.6 (465.3) 459.3 Leased equipment 3 - 4 68.3 (41.2) 27.1 Motor vehicles and field equipment 2 - 10 6.8 (1.4) 5.4
Total fixed assets $ 1,469.3 $ (837.0) $ 632.3
Depreciation and amortization of fixed assets for the years ended December 31, 2021, 2020, and 2019 were $206.9 million, $192.2 million, and $185.7million, of which $137.5 million, $120.6 million, and $100.2 million related to amortization of internal-use software development costs, respectively. Amortizationexpense related to development of software for sale in accordance with ASC 985-20 was $11.7 million, $11.3 million, and $12.8 million for the years endedDecember 31, 2021, 2020, and 2019, respectively. We had unamortized software development costs that had been capitalized in accordance with ASC 350-40 of$433.5 million and $405.8 million as of December 31, 2021 and 2020, respectively. We had unamortized software development costs that had been capitalized inaccordance with ASC 985-20 of $59.4 million and $53.5 million as of December 31, 2021 and 2020, respectively. Leased assets include amounts held underfinance leases for automobiles, computer software, and computer equipment.
As of December 31, 2021, we reassessed the recoverability of long-lived assets for our Financial Services reporting unit based upon the weaker than
expected operating performance as a result of changing market conditions. These conditions constituted a triggering event, which resulted in a $134.0million impairment to the long-lived assets in our Financial Services operating segment including $45.8 million to software development costs in fixed assets. Webased our analysis of the fair value of our long-lived assets on the indication of fair value provided by the offer to purchase such reporting unit, which wasapproved by our Board of Directors of February 16, 2022. This impairment is included within "Other operating loss (income)" in our accompanyingconsolidated statement of operations.
69

Table of Contents
VERISK ANALYTICS, INC.NOTES TO CONSOLIDATED FINANCIAL STATEMENTS — (Continued)
10. Acquisitions 2021 Acquisitions
On December 23, 2021, we acquired approximately 96.7 percent of the stock of ACTINEO GmbH ("ACTINEO") with an option to acquire the remainingshares at a future date, for a net cash purchase price of $148.9 million. ACTINEO offers a comprehensive portfolio of services, technology and data solutions tosupport the entire bodily injury settlement process. With this acquisition, we add ACTINEO's established claims management solutions to our leading dataanalytics and insurance ecosystem, providing customers with digitalization and medical expertise solutions throughout the entire claims process. ACTINEO is partof the claims vertical within our Insurance segment.
On November 2, 2021, we acquired 100 percent of the stock of Data Driven Safety, LLC ("Data Driven Safety") for a net cash purchase price of
$93.5 million, of which $2.0 million represents indemnity escrows. Data Driven Safety, a leading public record data aggregation firm that specializes in driver riskassessment in the U.S., has become a part of the underwriting & rating category within our Insurance segment. We believe that Data Driven Safety will expand ourrobust auto insurance analytics, providing insurers with information to further refine underwriting, improve the customer experience and promote public safety.
On September 1, 2021, we acquired 100 percent of the stock of Ignite Software Systems Limited ("Ignite") for a net cash purchase price of $13.8 million.
Ignite, a provider of insurance policy administration systems to brokers, managing general agents, and insurers, has become a part of the underwriting & ratingcategory within our Insurance segment. We believe that Ignite's client focus and deep domain knowledge will fit into our business model providing new andexisting clients with access to a broader expert advice and service.
On June 17, 2021, we acquired 100 percent of the stock of Roskill Holdings Limited ("Roskill") for a net cash purchase price of $22.1 million, ofwhich $4.8 million represents indemnity escrows. Roskill, a provider of metals and materials supply chain intelligence, has become part of our Energyand Specialized Markets segment. Roskill’s capabilities reinforce our ability to provide comprehensive analysis across the energy, and metals and mining valuechain while adding analysis, data, and insight on battery raw materials metals.
On March 2, 2021, we acquired a 51.0 percent ownership in Whitespace Software Limited ("Whitespace") for a net cash purchase price of $16.8 million.The remaining 49.0 percent ownership interest in Whitespace will be acquired by us, in three equal proportions over the next three years, at a purchase pricedetermined based upon a fixed revenue multiple and adjusted for any free cash flow shortfall. Whitespace, a provider of digital placing technology to the(re)insurance market, has become part of the underwriting & rating category within our Insurance segment. We expect our investment in Whitespace to enable aseamless real-time quote-to-bind electronic placing and global distribution solution, with straight-through submissions for our customers.
The preliminary purchase price allocation of the 2021 acquisitions resulted in the following:
ACTINEO Data Driven
Safety Others Total Cash and cash equivalents $ 0.2 $ 3.4 $ 5.7 $ 9.3 Accounts receivable 1.8 1.1 2.1 5.0 Other current assets — 2.0 1.2 3.2 Fixed assets 1.4 — 0.2 1.6 Operating lease right-of-use assets, net 4.2 0.4 0.9 5.5 Intangible assets 48.3 42.1 25.3 115.7 Goodwill 121.9 73.7 61.5 257.1 Other assets — — 4.8 4.8
Total assets acquired 177.8 122.7 101.7 402.2 Current liabilities 2.1 3.3 4.0 9.4 Deferred revenues — 0.4 4.7 5.1 Operating lease liabilities 4.2 0.4 0.9 5.5 Deferred income tax, net 15.8 — 5.2 21.0 Other liabilities — 21.7 4.8 26.5
Total liabilities assumed 22.1 25.8 19.6 67.5 Net assets acquired 155.7 96.9 82.1 334.7
Less: Noncontrolling interests 6.6 — 19.8 26.4 Less: Cash acquired 0.2 3.4 5.7 9.3
Net cash purchase price $ 148.9 $ 93.5 $ 56.6 299.0
70

Table of Contents
The preliminary amounts assigned to intangible assets by type for our 2021 acquisitions are summarized in the table below:
Weighted Average
Useful Life (in years) Total Technology-based 5 $ 21.2 Marketing-related 4 1.4 Customer-related 13 84.7 Database-based 5 8.4
Total intangible assets $ 115.7
The preliminary allocations of the purchase price for the 2021 acquisitions with less than a year of ownership are subject to revisions as additionalinformation is obtained about the facts and circumstances that existed as of each acquisition date. The revisions may have a significant impact on our consolidatedfinancial statements. The allocations of the purchase price will be finalized once all the information is obtained, but not to exceed one year from the acquisitiondate. The primary areas of the purchase price allocation that are not yet finalized relate to income and non-income taxes, deferred revenues, the valuation ofintangible assets acquired, right-of-use assets and operating lease liabilities and residual goodwill. The goodwill associated with our acquisitions include theacquired assembled work force, the value associated with the opportunity to leverage the work force to continue to develop the technology and content assets, aswell as our ability to grow through adding additional customer relationships or new solutions in the future. Of the $257.1 million in goodwill associated withour acquisitions, $182.5 million is not deductible for tax purposes. The preliminary amounts assigned to intangible assets by type for these acquisitions were basedupon our valuation model and historical experiences with entities with similar business characteristics.
For the year ended December 31, 2021, we incurred transaction costs related to acquisitions of $2.8 million, which are included within "Selling, general
and administrative expenses in the accompanying consolidated statements of operations. Refer to Note 12. Goodwill and Intangible Assets for further discussion.
Our 2021 acquisitions were not significant, both individually and in the aggregate, to our consolidated financial statements for the years endedDecember 31, 2021, 2020 and 2019, and therefore, supplemental information disclosure on an unaudited pro forma basis is not presented.
71

Table of Contents
VERISK ANALYTICS, INC.NOTES TO CONSOLIDATED FINANCIAL STATEMENTS — (Continued)
2020 Acquisitions
On December 16, 2020, we acquired 100 percent of the stock of Lead Intelligence, Inc. ("Jornaya"), a provider of consumer behavioral data andintelligence, for a net cash purchase price of $124.9 million. The acquisition added Jornaya's proprietary view of consumer buying journeys to our growing set ofmarketing solutions for the insurance and financial services markets, as well as provide customers with the intelligence and agility to time and tailor interactionsbased on actual in-market behaviors. Jornaya has become part of the underwriting & rating category within our Insurance segment. The final purchase priceallocation of the acquisition is presented in the table below.
On September 9, 2020, we acquired 100 percent of the stock of Franco Signor LLC ("Franco Signor") for a net cash purchase price of $159.7 million, of
which $8.0 million represents indemnity escrows. Franco Signor is a Medicare Secondary Payer compliance solutions provider to large employers, insurers andthird-party administrators in the U.S. Franco Signor has become part of the claims category within our Insurance segment and enhanced the solutions we currentlyoffer, as well as added professional administrative services for Medicare Set Asides to our suite of solutions. The final purchase price allocation of the acquisitionis presented in the table below.
The final purchase price allocations, inclusive of closing adjustments, of our 2020 acquisitions resulted in the following:
Lead Intelligence Franco Signor Total Cash and cash equivalents (1) $ 5.9 $ 10.9 $ 16.8 Accounts receivable 2.8 2.2 5.0 Other current assets 1.4 0.9 2.3 Fixed assets 0.8 0.4 1.2 Operating lease right-of-use assets, net 1.6 1.5 3.1 Intangible assets 64.3 59.1 123.4 Goodwill 69.9 101.5 171.4 Other assets 0.1 8.0 8.1 Total assets acquired 146.8 184.5 331.3
Current liabilities (1) 2.1 8.3 10.4 Deferred revenues 2.6 0.3 2.9 Operating lease liabilities 1.6 1.5 3.1 Deferred income tax, net 9.7 1.5 11.2 Other liabilities — 8.0 8.0 Total liabilities assumed 16.0 19.6 35.6 Net assets acquired 130.8 164.9 295.7
Less: Cash and cash equivalents 5.9 10.9 16.8 Restricted cash (1) — (5.7) (5.7)Cash acquired 5.9 5.2 11.1 Net cash purchase price $ 124.9 $ 159.7 $ 284.6
_______________(1) Within cash and cash equivalents, there is $5.7 million of restricted cash related to Franco Signor's professional administrative services for Medicare Set Asides,with an offsetting liability of $5.7 million included within current liabilities.
The final amounts assigned to intangible assets by type for our 2020 acquisitions are summarized in the table below:
Weighted Average
Useful Life (in years) Total Technology-based 11 $ 30.8 Marketing-related 5 2.1 Customer-related 11 90.5 Total intangible assets $ 123.4
For the year ended December 31, 2021, we finalized the purchase accounting for our 2020 acquisitions during the measurement periods in accordance
with ASC 805, Business Combinations. The impact of finalization of the purchase accounting associated with these acquisitions was not material to ouraccompanying consolidated statements of operations for the years ended December 31, 2020 and 2019.
The goodwill of $90.6 million associated with the purchases of Jornaya and Franco Signor is not deductible for tax purposes. For the year ended
December 31, 2020, we incurred transaction costs related to acquisitions of $2.2 million, which are included within "Selling, general and administrative" expensesin our accompanying consolidated statements of operations. Refer to Note 12. Goodwill and Intangible Assets for further discussion.
Our 2020 acquisitions were not significant, both individually and in the aggregate, to our consolidated financial statements for the years ended December
31, 2020 and 2019, and therefore, supplemental information disclosure on an unaudited pro forma basis is not presented.
72
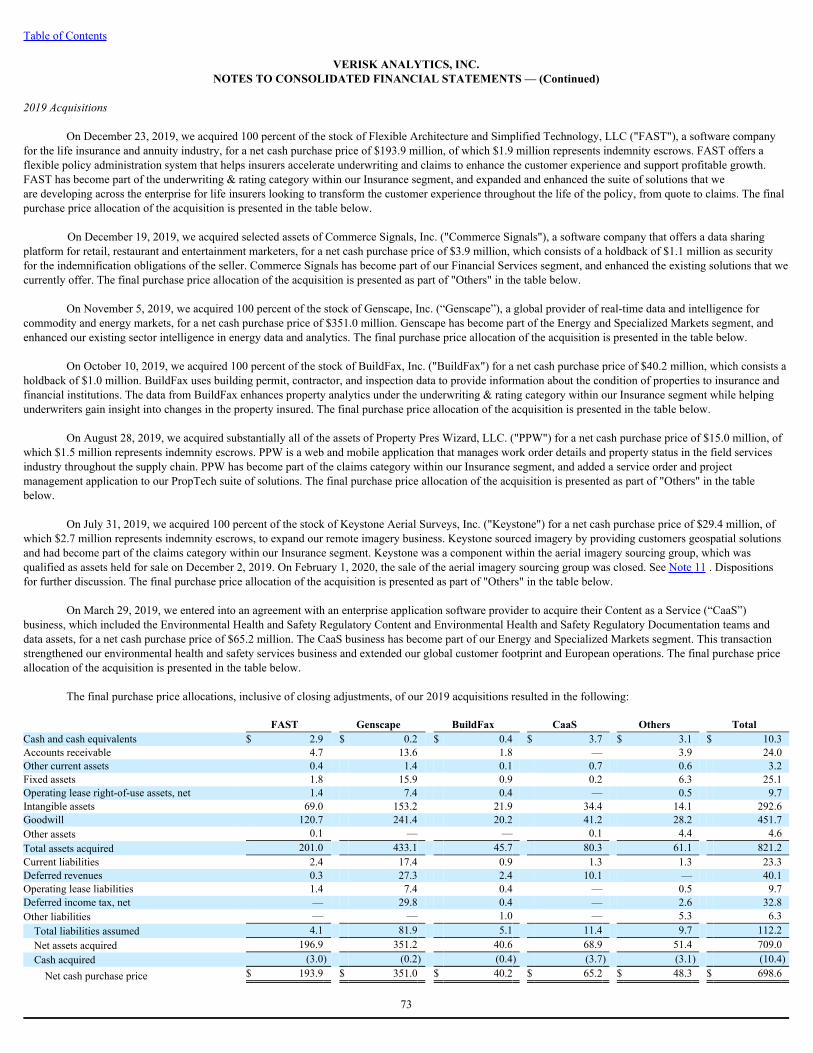
Table of Contents
VERISK ANALYTICS, INC.NOTES TO CONSOLIDATED FINANCIAL STATEMENTS — (Continued)
2019 Acquisitions
On December 23, 2019, we acquired 100 percent of the stock of Flexible Architecture and Simplified Technology, LLC ("FAST"), a software company
for the life insurance and annuity industry, for a net cash purchase price of $193.9 million, of which $1.9 million represents indemnity escrows. FAST offers aflexible policy administration system that helps insurers accelerate underwriting and claims to enhance the customer experience and support profitable growth.FAST has become part of the underwriting & rating category within our Insurance segment, and expanded and enhanced the suite of solutions that weare developing across the enterprise for life insurers looking to transform the customer experience throughout the life of the policy, from quote to claims. The finalpurchase price allocation of the acquisition is presented in the table below.
On December 19, 2019, we acquired selected assets of Commerce Signals, Inc. ("Commerce Signals"), a software company that offers a data sharing
platform for retail, restaurant and entertainment marketers, for a net cash purchase price of $3.9 million, which consists of a holdback of $1.1 million as securityfor the indemnification obligations of the seller. Commerce Signals has become part of our Financial Services segment, and enhanced the existing solutions that wecurrently offer. The final purchase price allocation of the acquisition is presented as part of "Others" in the table below.
On November 5, 2019, we acquired 100 percent of the stock of Genscape, Inc. (“Genscape”), a global provider of real-time data and intelligence for
commodity and energy markets, for a net cash purchase price of $351.0 million. Genscape has become part of the Energy and Specialized Markets segment, andenhanced our existing sector intelligence in energy data and analytics. The final purchase price allocation of the acquisition is presented in the table below.
On October 10, 2019, we acquired 100 percent of the stock of BuildFax, Inc. ("BuildFax") for a net cash purchase price of $40.2 million, which consists aholdback of $1.0 million. BuildFax uses building permit, contractor, and inspection data to provide information about the condition of properties to insurance andfinancial institutions. The data from BuildFax enhances property analytics under the underwriting & rating category within our Insurance segment while helpingunderwriters gain insight into changes in the property insured. The final purchase price allocation of the acquisition is presented in the table below.
On August 28, 2019, we acquired substantially all of the assets of Property Pres Wizard, LLC. ("PPW") for a net cash purchase price of $15.0 million, ofwhich $1.5 million represents indemnity escrows. PPW is a web and mobile application that manages work order details and property status in the field servicesindustry throughout the supply chain. PPW has become part of the claims category within our Insurance segment, and added a service order and projectmanagement application to our PropTech suite of solutions. The final purchase price allocation of the acquisition is presented as part of "Others" in the tablebelow.
On July 31, 2019, we acquired 100 percent of the stock of Keystone Aerial Surveys, Inc. ("Keystone") for a net cash purchase price of $29.4 million, ofwhich $2.7 million represents indemnity escrows, to expand our remote imagery business. Keystone sourced imagery by providing customers geospatial solutionsand had become part of the claims category within our Insurance segment. Keystone was a component within the aerial imagery sourcing group, which wasqualified as assets held for sale on December 2, 2019. On February 1, 2020, the sale of the aerial imagery sourcing group was closed. See Note 11 . Dispositionsfor further discussion. The final purchase price allocation of the acquisition is presented as part of "Others" in the table below.
On March 29, 2019, we entered into an agreement with an enterprise application software provider to acquire their Content as a Service (“CaaS”)business, which included the Environmental Health and Safety Regulatory Content and Environmental Health and Safety Regulatory Documentation teams anddata assets, for a net cash purchase price of $65.2 million. The CaaS business has become part of our Energy and Specialized Markets segment. This transactionstrengthened our environmental health and safety services business and extended our global customer footprint and European operations. The final purchase priceallocation of the acquisition is presented in the table below.
The final purchase price allocations, inclusive of closing adjustments, of our 2019 acquisitions resulted in the following:
FAST Genscape BuildFax CaaS Others Total Cash and cash equivalents $ 2.9 $ 0.2 $ 0.4 $ 3.7 $ 3.1 $ 10.3 Accounts receivable 4.7 13.6 1.8 — 3.9 24.0 Other current assets 0.4 1.4 0.1 0.7 0.6 3.2 Fixed assets 1.8 15.9 0.9 0.2 6.3 25.1 Operating lease right-of-use assets, net 1.4 7.4 0.4 — 0.5 9.7 Intangible assets 69.0 153.2 21.9 34.4 14.1 292.6 Goodwill 120.7 241.4 20.2 41.2 28.2 451.7 Other assets 0.1 — — 0.1 4.4 4.6 Total assets acquired 201.0 433.1 45.7 80.3 61.1 821.2 Current liabilities 2.4 17.4 0.9 1.3 1.3 23.3 Deferred revenues 0.3 27.3 2.4 10.1 — 40.1 Operating lease liabilities 1.4 7.4 0.4 — 0.5 9.7 Deferred income tax, net — 29.8 0.4 — 2.6 32.8 Other liabilities — — 1.0 — 5.3 6.3 Total liabilities assumed 4.1 81.9 5.1 11.4 9.7 112.2 Net assets acquired 196.9 351.2 40.6 68.9 51.4 709.0 Cash acquired (3.0) (0.2) (0.4) (3.7) (3.1) (10.4)Net cash purchase price $ 193.9 $ 351.0 $ 40.2 $ 65.2 $ 48.3 $ 698.6
73
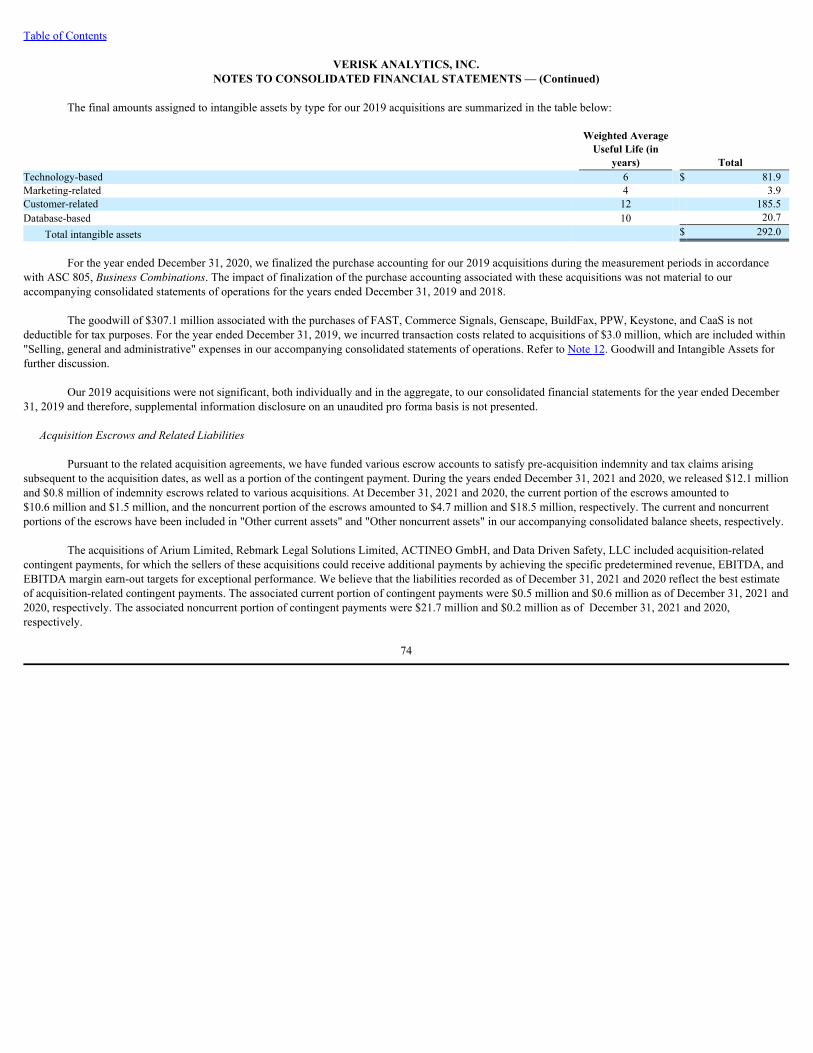
Table of Contents
VERISK ANALYTICS, INC.NOTES TO CONSOLIDATED FINANCIAL STATEMENTS — (Continued)
The final amounts assigned to intangible assets by type for our 2019 acquisitions are summarized in the table below:
Weighted AverageUseful Life (in
years) Total Technology-based 6 $ 81.9 Marketing-related 4 3.9 Customer-related 12 185.5 Database-based 10 20.7
Total intangible assets $ 292.0
For the year ended December 31, 2020, we finalized the purchase accounting for our 2019 acquisitions during the measurement periods in accordancewith ASC 805, Business Combinations. The impact of finalization of the purchase accounting associated with these acquisitions was not material to ouraccompanying consolidated statements of operations for the years ended December 31, 2019 and 2018.
The goodwill of $307.1 million associated with the purchases of FAST, Commerce Signals, Genscape, BuildFax, PPW, Keystone, and CaaS is not
deductible for tax purposes. For the year ended December 31, 2019, we incurred transaction costs related to acquisitions of $3.0 million, which are included within"Selling, general and administrative" expenses in our accompanying consolidated statements of operations. Refer to Note 12. Goodwill and Intangible Assets forfurther discussion.
Our 2019 acquisitions were not significant, both individually and in the aggregate, to our consolidated financial statements for the year ended December
31, 2019 and therefore, supplemental information disclosure on an unaudited pro forma basis is not presented. Acquisition Escrows and Related Liabilities
Pursuant to the related acquisition agreements, we have funded various escrow accounts to satisfy pre-acquisition indemnity and tax claims arising
subsequent to the acquisition dates, as well as a portion of the contingent payment. During the years ended December 31, 2021 and 2020, we released $12.1 millionand $0.8 million of indemnity escrows related to various acquisitions. At December 31, 2021 and 2020, the current portion of the escrows amounted to$10.6 million and $1.5 million, and the noncurrent portion of the escrows amounted to $4.7 million and $18.5 million, respectively. The current and noncurrentportions of the escrows have been included in "Other current assets" and "Other noncurrent assets" in our accompanying consolidated balance sheets, respectively.
The acquisitions of Arium Limited, Rebmark Legal Solutions Limited, ACTINEO GmbH, and Data Driven Safety, LLC included acquisition-related
contingent payments, for which the sellers of these acquisitions could receive additional payments by achieving the specific predetermined revenue, EBITDA, andEBITDA margin earn-out targets for exceptional performance. We believe that the liabilities recorded as of December 31, 2021 and 2020 reflect the best estimateof acquisition-related contingent payments. The associated current portion of contingent payments were $0.5 million and $0.6 million as of December 31, 2021 and2020, respectively. The associated noncurrent portion of contingent payments were $21.7 million and $0.2 million as of December 31, 2021 and 2020,respectively.
74

Table of Contents
VERISK ANALYTICS, INC.NOTES TO CONSOLIDATED FINANCIAL STATEMENTS — (Continued)
11. Dispositions:
On February 1, 2020, the sale of the aerial imagery sourcing group was completed. We contributed assets related to the disposed business, including cashof $63.8 million, in exchange for a noncontrolling 35.0% ownership interest in a nonpublic company, Vexcel. We determined the fair value of the securitiesassociated with the noncontrolling ownership interest in Vexcel with the assistance of valuations performed by third-party specialists, including the discountedcash flow analysis and estimates made by management. The securities were concluded not to have a readily determinable fair value and did not qualify for thepractical expedient to estimate fair value. The contributed assets approximated the fair value of the equity securities related to the noncontrolling ownershipinterest; therefore, there was no gain or loss recorded in conjunction with this disposition for the year ended December 31, 2020.
On February 14, 2020, the sale of the compliance background screening business was completed for net cash proceeds of $23.1 million. A gain of $15.9million was included in "Other operating loss (income)" within our accompanying consolidated statements of operations for the year ended December 31, 2020.
On March 1, 2020, the sale of the data warehouse business within the Financial Services segment was completed. We recorded a gain of $3.5 million in
"Other operating loss (income)" within our accompanying consolidated statements of operations for the year ended December 31, 2020.
75

Table of Contents
VERISK ANALYTICS, INC.NOTES TO CONSOLIDATED FINANCIAL STATEMENTS — (Continued)
12. Goodwill and Intangible Assets:
We completed the required annual impairment test as of June 30, 2021, 2020 and 2019, which resulted in no impairment of goodwill. Based on the resultsof our impairment assessment as of June 30, 2021, we determined that the fair value of each of our reporting units exceeded their respective carrying value. As ofDecember 31, 2021, we reassessed the recoverability of the long-lived assets for our Financial Services reporting unit based upon the weaker than expectedoperating performance as a result of changing market conditions. These conditions constituted a triggering event, which resulted in a $134.0 million impairment tothe long-lived assets for our Financial Services reporting unit including $88.2 million to intangible assets and $45.8 million to fixed assets. We based our analysisof the fair value of our long-lived assets on the indication of fair value provided by the offer to purchase such reporting unit, which was approved by our Board ofDirectors on February 16, 2022. This impairment is included within "Other operating loss (income)" in our consolidated statement of operations.
The following is a summary of the change in goodwill from December 31, 2019 through December 31, 2021, both in total and as allocated to ouroperating segments:
Insurance
Energy andSpecialized
Markets FinancialServices Total
Goodwill at December 31, 2019 $ 998.8 $ 2,389.5 $ 476.0 $ 3,864.3 Acquisitions 171.7 — — 171.7 Purchase accounting reclassifications 2.1 (6.0) (0.2) (4.1)Current period adjustment 21.4 (19.5) — 1.9 Foreign currency translation adjustment 14.6 59.6 0.1 74.3
Goodwill at December 31, 2020 1,208.6 2,423.6 475.9 4,108.1 Acquisitions and purchases of controlling interests 235.9 21.2 — 257.1 Purchase accounting reclassifications (0.3) — — (0.3)Current period adjustment (1) 15.8 (15.8) — — Foreign currency translation adjustment (5.2) (28.0) (0.5) (33.7)
Goodwill at December 31, 2021 $ 1,454.8 $ 2,401.0 $ 475.4 $ 4,331.2 ____________(1) This adjustment relates to a segment reclassification; refer to Note 19. Segment Reporting
Our intangible assets and related accumulated amortization consisted of the following:
Weighted Average Useful Life Accumulated (in years) Cost Amortization Net December 31, 2021 Technology-based 7 $ 576.4 (403.3) $ 173.1 Marketing-related 15 274.1 (129.6) $ 144.5 Contract-based 6 5.0 (5.0) $ — Customer-related 13 1,015.4 (426.5) $ 588.9 Database-based 18 484.2 (164.8) $ 319.4 Total intangible assets $ 2,355.1 $ (1,129.2) $ 1,225.9
December 31, 2020 Technology-based 7 $ 559.6 $ (349.5) $ 210.1 Marketing-related 16 275.2 (113.4) 161.8 Contract-based 6 5.0 (5.0) — Customer-related 13 1,004.3 (354.2) 650.1 Database-based 19 501.0 (138.2) 362.8 Total intangible assets $ 2,345.1 $ (960.3) $ 1,384.8
Amortization expense related to intangible assets for the years ended December 31, 2021, 2020, and 2019, was $176.7 million, $165.9 million, and
$138.0 million, respectively. Estimated amortization expense in future periods through 2027 and thereafter for intangible assets subject to amortization is asfollows:
Years Ending Amount 2022 $ 170.6 2023 155.8 2024 133.8 2025 109.3 2026 104.6 2027 and thereafter 551.8
Total $ 1,225.9
76
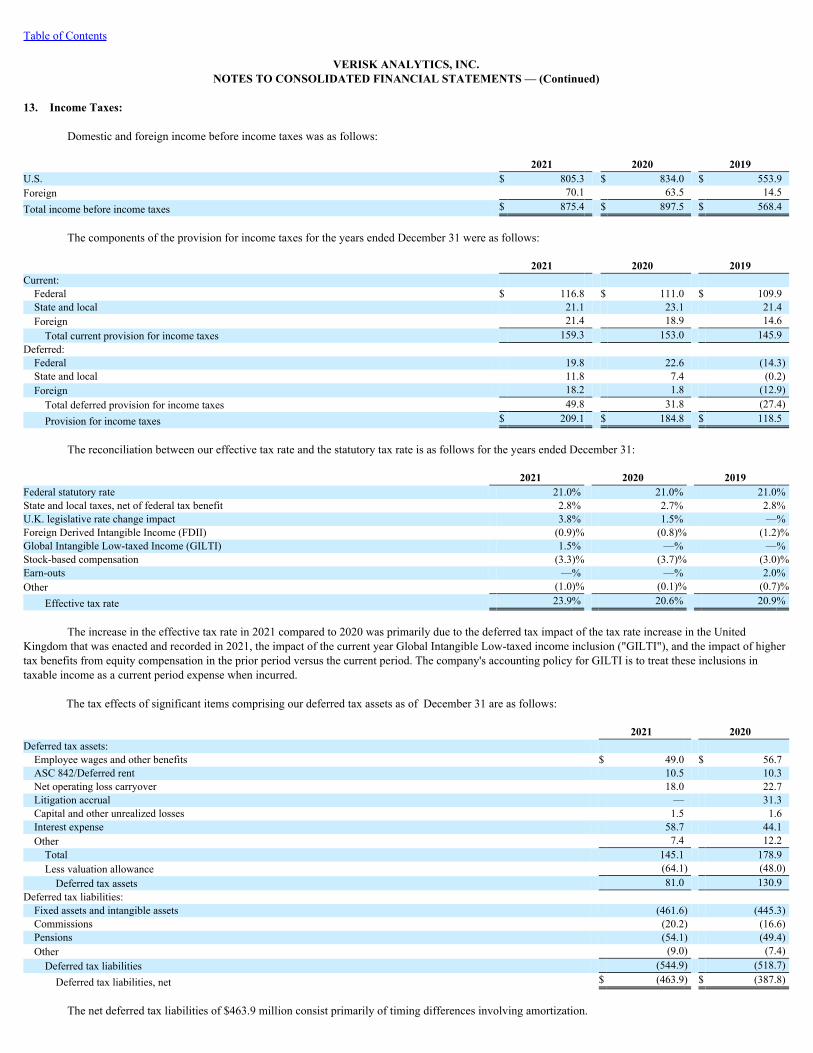
Table of Contents
VERISK ANALYTICS, INC.NOTES TO CONSOLIDATED FINANCIAL STATEMENTS — (Continued)
13. Income Taxes:
Domestic and foreign income before income taxes was as follows:
2021 2020 2019 U.S. $ 805.3 $ 834.0 $ 553.9 Foreign 70.1 63.5 14.5 Total income before income taxes $ 875.4 $ 897.5 $ 568.4
The components of the provision for income taxes for the years ended December 31 were as follows:
2021 2020 2019 Current: Federal $ 116.8 $ 111.0 $ 109.9 State and local 21.1 23.1 21.4 Foreign 21.4 18.9 14.6 Total current provision for income taxes 159.3 153.0 145.9
Deferred: Federal 19.8 22.6 (14.3)State and local 11.8 7.4 (0.2)Foreign 18.2 1.8 (12.9)Total deferred provision for income taxes 49.8 31.8 (27.4)Provision for income taxes $ 209.1 $ 184.8 $ 118.5
The reconciliation between our effective tax rate and the statutory tax rate is as follows for the years ended December 31:
2021 2020 2019 Federal statutory rate 21.0% 21.0% 21.0%State and local taxes, net of federal tax benefit 2.8% 2.7% 2.8%U.K. legislative rate change impact 3.8% 1.5% —%Foreign Derived Intangible Income (FDII) (0.9)% (0.8)% (1.2)%Global Intangible Low-taxed Income (GILTI) 1.5% —% —%Stock-based compensation (3.3)% (3.7)% (3.0)%Earn-outs —% —% 2.0%Other (1.0)% (0.1)% (0.7)%
Effective tax rate 23.9% 20.6% 20.9% The increase in the effective tax rate in 2021 compared to 2020 was primarily due to the deferred tax impact of the tax rate increase in the United
Kingdom that was enacted and recorded in 2021, the impact of the current year Global Intangible Low-taxed income inclusion ("GILTI"), and the impact of highertax benefits from equity compensation in the prior period versus the current period. The company's accounting policy for GILTI is to treat these inclusions intaxable income as a current period expense when incurred.
The tax effects of significant items comprising our deferred tax assets as of December 31 are as follows:
2021 2020 Deferred tax assets: Employee wages and other benefits $ 49.0 $ 56.7 ASC 842/Deferred rent 10.5 10.3 Net operating loss carryover 18.0 22.7 Litigation accrual — 31.3 Capital and other unrealized losses 1.5 1.6 Interest expense 58.7 44.1 Other 7.4 12.2 Total 145.1 178.9 Less valuation allowance (64.1) (48.0)Deferred tax assets 81.0 130.9
Deferred tax liabilities: Fixed assets and intangible assets (461.6) (445.3)Commissions (20.2) (16.6)Pensions (54.1) (49.4)Other (9.0) (7.4)Deferred tax liabilities (544.9) (518.7)Deferred tax liabilities, net $ (463.9) $ (387.8)
The net deferred tax liabilities of $463.9 million consist primarily of timing differences involving amortization.

77

Table of Contents
VERISK ANALYTICS, INC.NOTES TO CONSOLIDATED FINANCIAL STATEMENTS — (Continued)
The ultimate realization of the deferred tax assets depends on our ability to generate sufficient taxable income in the future. We have provided a valuation
allowance against the deferred tax assets associated with the interest expense deduction limitation in the U.K. We have also provided for a valuation allowanceagainst the deferred tax assets associated with the net operating losses of certain subsidiaries. Our net operating loss carryforwards expire as follows:
Years Ending Amount 2022 - 2029 $ 21.9 2030 - 2034 20.5 2035 - 2041 112.2
Total $ 154.6 A valuation allowance has been established based on our evaluation of the likelihood of utilizing these benefits before they expire. We have determined
that the generation of future taxable income from certain subsidiaries to fully realize the deferred tax assets is uncertain. Other than these items, we havedetermined, based on our historical operating performance, that our taxable income will more likely than not be sufficient to fully realize the deferred tax assets.
As of December 31, 2021, we have not made a provision for U.S. or additional foreign withholdings taxes for any additional outside basis difference
inherent in our foreign subsidiaries, as these amounts continue to be indefinitely reinvested in foreign operations. Determining the amount of unrecognizeddeferred tax liability related to any additional outside basis difference in these entities is not practicable. We do not rely on these unremitted earnings as a source offunds for our domestic business as we expect to have sufficient cash flow in the U.S. to fund our U.S. operational and strategic needs.
We follow ASC No. 740-10 which prescribes a comprehensive model for the financial statement recognition, measurement, presentation, and disclosure
of uncertain tax positions taken or expected to be taken in income tax returns. For each tax position, we must determine whether it is more likely than not that theposition will be sustained upon examination based on the technical merits of the position, including resolution of any related appeals or litigation. A tax positionthat meets the more likely than not recognition threshold is then measured to determine the amount of benefit to recognize within the financial statements. Nobenefits may be recognized for tax positions that do not meet the more likely than not threshold. A reconciliation of the beginning and ending amount ofunrecognized tax benefit is as follows:
2021 2020 2019 Unrecognized tax benefit as of January 1 $ 9.9 $ 11.5 $ 17.4 Gross increase in tax positions in prior period 1.3 0.5 0.6 Gross decrease in tax positions in prior period (0.1) (0.2) (3.3)Settlements — — (2.4)Lapse of statute of limitations (7.7) (1.9) (0.8)Unrecognized tax benefit as of December 31 $ 3.4 $ 9.9 $ 11.5
Of the total unrecognized tax benefits as of December 31, 2021, 2020, and 2019, $3.4 million, $8.1 million, and $8.6 million, respectively, represent the
amounts that, if recognized, would have a favorable effect on our effective tax rate in any future periods. The total gross amount of accrued interest and penalties for the years ended December 31, 2021, 2020, and 2019 was $0.5 million, $3.9 million, and $4.6
million, respectively. Our practice is to recognize interest and penalties associated with income taxes as a component of “Provision for income taxes” in ouraccompanying consolidated statements of operations.
We do not expect a significant increase in unrecognized benefits related to federal, state, or foreign tax exposures within the coming year. In addition, we
believe that it is reasonably possible that approximately $0.6 million of our currently remaining unrecognized tax positions, each of which is individuallyinsignificant, may be recognized by the end of 2021 as a result of a combination of audit settlements and lapses of statute of limitations, net of additional uncertaintax positions.
We are subject to tax in the U.S., various state, and foreign jurisdictions. Joined by our domestic subsidiaries, we file a consolidated income tax return.
With a few exceptions, none of which are material to our consolidated financial statements as of December 31, 2021, we are no longer subject to U.S. federal, stateand local, or non-US income tax examinations by tax authorities for tax years before 2017. In New Jersey, we are being audited for the years ended December 31,2013 through 2018 with a statute extension until September 30, 2022. In Pennsylvania, we are being audited for the years ended December 31, 2018 through 2020with a statute extension until April 30, 2023. We do not expect that the results of these examinations will have a material effect on our financial position, results ofoperations, or cash flow.
78

Table of Contents
VERISK ANALYTICS, INC.NOTES TO CONSOLIDATED FINANCIAL STATEMENTS — (Continued)
14. Composition of Certain Financial Statement Caption:
The following table presents the components of “Accounts payable and accrued liabilities” as of December 31:
2021 2020 Accounts payable and accrued liabilities: Accrued salaries, benefits and other related costs $ 169.5 $ 158.7 Legal accrual (1) 6.5 126.5 Escrow liabilities 10.6 1.5 Accrued interest 16.3 20.7 Trade accounts payable and other accrued expenses 117.3 99.3 Acquisition-related liabilities 0.5 0.6 Total accounts payable and accrued liabilities $ 320.7 $ 407.3
_______________(1) Included a litigation reserve for Xactware Solutions, Inc. Patent Litigation of $125.0 million in 2020
The following table presents the components of "Other noncurrent assets" as of December 31: 2021 2020 Other noncurrent assets: Pension benefits $ 130.5 $ 77.3 Other assets - prepaid expenses 73.0 70.6 Acquisition related escrows 4.7 18.5 Investments in nonpublic companies 216.2 192.6 Deposits and other 6.1 6.7 Total other noncurrent assets $ 430.5 $ 365.7
79

Table of Contents
VERISK ANALYTICS, INC.NOTES TO CONSOLIDATED FINANCIAL STATEMENTS — (Continued)
15. Debt:
The following table presents short-term and long-term debt by issuance as of December 31:
Issuance Maturity Date Date 2021 2020 Short-term debt and current portion of long-term debt: Syndicated revolving credit facility Various Various $ 610.0 $ 50.0 Senior notes: 4.125% senior notes, less unamortized discount and debt issuance costs of $(0.4) 9/12/2012 9/12/2022 349.6 — 5.800% senior notes, less unamortized discount and debt issuance costs of $0.1 4/6/2011 5/1/2021 — 449.9
Finance lease liabilities (1) Various Various 11.7 14.4 Short-term debt and current portion of long-term debt 971.3 514.3
Long-term debt: Senior notes: 3.625% senior notes, less unamortized discount and debt issuance costs of $(10.3) and$(10.7), respectively 5/13/2020 5/15/2050 489.7 489.3
4.125% senior notes, inclusive of unamortized premium, and net of unamortized discount anddebt issuance costs of $10.9 and $12.4, respectively 3/6/2019 3/15/2029 610.9 612.4
4.000% senior notes, less unamortized discount and debt issuance costs of $(4.1) and $(5.4),respectively 5/15/2015 6/15/2025 895.9 894.6
5.500% senior notes, less unamortized discount and debt issuance costs of $(4.1) and $(4.3),respectively 5/15/2015 6/15/2045 345.9 345.7
4.125% senior notes, less unamortized discount and debt issuance costs of $(1.1) 9/12/2012 9/12/2022 — 348.9 Finance lease liabilities (1) Various Various 1.6 10.3 Syndicated revolving credit facility debt issuance costs Various Various (1.2) (1.6)
Long-term debt 2,342.8 2,699.6 Total debt $ 3,314.1 $ 3,213.9
_______________(1) Refer to Note 8. Leases
Accrued interest associated with our outstanding debt obligations was $16.3 million and $20.7 million as of December 31, 2021 and 2020, respectively,and included in “Accounts payable and accrued liabilities” within our accompanying consolidated balance sheets. Interest expense associated with our financelease and outstanding debt obligations, including amortization of debt issuance costs and original discounts, was $127.0 million, $138.3 million, and $125.7 millionfor the years ended December 31, 2021, 2020, and 2019, respectively.
Senior Notes
As of December 31, 2021 and December 31, 2020, we had senior notes with an aggregate principal amount of $2,700.0 million and $3,150.0 millionoutstanding, respectively, and were in compliance with our financial and other debt covenants. On May 3, 2021, we repaid the 5.800% senior notes in full in theamount of $450.0 million utilizing a combination of $250.0 million in borrowings from the credit facility and cash from operations.
80

Table of Contents
VERISK ANALYTICS, INC.NOTES TO CONSOLIDATED FINANCIAL STATEMENTS — (Continued)
Syndicated Revolving Credit Facility
We have a Credit Facility with a borrowing capacity of $1,000.0 million with Bank of America N.A., HSBC Bank USA, N.A., JP Morgan Chase Bank,
N.A., Wells Fargo Bank, National Association, Citibank, N.A., Credit Suisse AG, Cayman Islands Branch, Morgan Stanley Bank, N.A., First Commercial Bank,Ltd., Los Angeles Branch, TD Bank, N.A., and the Northern Trust Company. Interest on borrowings under the Credit Facility is payable at an interest rate of theadministrative agent's prime rate plus 1.0% to 1.625%, depending upon the public debt rating. A commitment fee on any unused balance is payable periodicallyand may range from 8.0 to 20.0 basis points based upon the public debt rating. The Credit Facility also contains certain financial and other covenants that, amongother things, impose certain restrictions on indebtedness, liens, investments, and capital expenditures. These covenants place restrictions on mergers, asset sales,sale/leaseback transactions, and certain transactions with affiliates. The financial covenants require that, at the end of any fiscal quarter, we have a consolidatedfunded debt leverage ratio of less than 3.5 to 1.0. At our election, the maximum consolidated funded debt leverage ratio could be permitted to increase one timeeach to 4.0 to 1.0 and 4.25 to 1.0. The Credit Facility may be used for general corporate purposes, including working capital needs and capital expenditures,acquisitions, dividends, and the share repurchase program (the "Repurchase Program"). As of December 31, 2021, we were in compliance with all financial andother debt covenants under the Credit Facility. As of December 31, 2021 and 2020, the available capacity under the Credit Facility was $384.9 million and $944.6million, net of the letters of credit of $5.1 million and $5.4 million, respectively. Subsequent to December 31, 2021 we have made repayments of $130.0 millionunder the Credit Facility resulting in $480.0 million in borrowings under the Revolving Credit Facility.
Debt Maturities The following table reflects our debt maturities:
Years Ending Amount 2022 $ 971.7 2023 1.3 2024 0.4 2025 900.1 2026 — 2027 and thereafter 1,450.0
Total $ 3,323.5
81
Table of Contents
VERISK ANALYTICS, INC.NOTES TO CONSOLIDATED FINANCIAL STATEMENTS — (Continued)
16. Stockholders’ Equity:
We have 2,000,000,000 shares of authorized common stock as of December 31, 2021 and 2020. The common shares have rights to any dividend declaredby our Board of Directors, subject to any preferential or other rights of any outstanding preferred stock, and voting rights to elect all eleven members of our Boardof Directors. At December 31, 2021, 2020, and 2019, the adjusted closing price of our common stock was $228.73, $206.34, and $147.50 per share, respectively.
We have 80,000,000 shares of authorized preferred stock, par value $0.001 per share. The preferred shares have preferential rights over the common
shares with respect to dividends and net distribution upon liquidation. We did not issue any preferred shares as of December 31, 2021 and 2020. On February 17, 2021, April 28, 2021, July 28, 2021, and October 27, 2021, our board approved a cash dividend of $0.29 per share of common stock
issued and outstanding to the holders of record as of March 15, 2021, June 15, 2021, September 15, 2021, and December 15, 2021, respectively. Cash dividends of$188.2 million and $175.8 million were paid during the years ended December 31, 2021 and 2020 and recorded as a reduction to retained earnings, respectively.
Share Repurchase Program We have authorized repurchases of up to $4,600.0 million of our common stock through our Repurchase Program, inclusive of the $500.0 million
authorization approved by our board on August 17, 2021. Since the introduction of share repurchase as a feature of our capital management strategies in 2010, wehave repurchased shares with an aggregate value of $3,996.2 million. As of December 31, 2021, we had $603.8 million available to repurchase shares. We have noobligation to repurchase stock under this program and intend to use this authorization as a means of offsetting dilution from the issuance of shares under our 2021Equity Incentive Plan (the "2021 Incentive Plan), our 2013 Equity Incentive Plan (the "2013 Incentive Plan"), our 2009 Equity Incentive Plan (the “2009 IncentivePlan”), our sharesave plan (“U.K. Sharesave Plan”), and our employee stock purchase plan ("ESPP") while providing flexibility to repurchase additional shares ifwarranted. This authorization has no expiration date and may be increased, reduced, suspended, or terminated at any time. Shares that are repurchased under theRepurchase Program will be recorded as treasury stock and will be available for future issuance.
In December 2020, March 2021, June 2021, and September 2021, we entered into Accelerated Share Repurchase ("ASR") agreements to repurchase
shares of our common stock for an aggregate purchase price of $50.0 million, $125.0 million, $150.0 million, and $75.0 million, respectively, with HSBC BankUSA, Citibank, N.A., and Wells Fargo Bank. The ASR agreements are each accounted for as a treasury stock transaction and a forward stock purchase agreementindexed to our common stock. The forward stock purchase agreements are each classified as an equity instrument under ASC 815-40, Contracts in Entity's OwnEquity ("ASC 815-40") and were deemed to have a fair value of zero at the respective effective date. Upon payments of the aggregate purchase price on January 4,2021, April 1, 2021, July 1, 2021, and October 1, 2021, we received an aggregate delivery of 192,687, 565,963, 686,813, and 299,596 shares of our common stock,respectively. Upon the final settlement of the ASR agreements in February 2021, May 2021, September 2021, and December 2021, we received additional sharesof 70,787, 121,965, 111,429, and 52,815 as determined by the volume weighted average share price of our common stock of $189.77, $181.71, $187.91, and$212.82 during the term of the ASR agreements, respectively. The aggregate purchase price was recorded as a reduction to stockholders' equity in our consolidatedstatements of changes in stockholders' equity for the year ended December 31, 2021. These repurchases of 2,102,055 shares for the year ended December 31, 2021resulted in a reduction of outstanding shares used to calculate the weighted average common shares outstanding for basic and diluted earnings per share ("EPS").
During the years ended December 31, 2021 and 2020, we repurchased 2,545,191 and 2,155,084 shares of common stock as part of the Repurchase
Program, inclusive of the ASRs, at a weighted average price of $186.63 and $161.84 per share, respectively. We utilized cash from operations and borrowingsfrom our Credit Facility to fund these repurchases.
Treasury Stock
As of December 31, 2021, our treasury stock consisted of 382,351,399 shares of common stock. During the years ended December 31, 2021, 2020, and
2019, we transferred 1,379,304, 1,811,046, and 1,369,305 shares of common stock, under the 2021 Incentive Plan, 2013 Incentive Plan, and 2009 Incentive Plan,from the treasury shares at a weighted average price of $11.78, $10.67, and $9.72 per share, respectively.
82
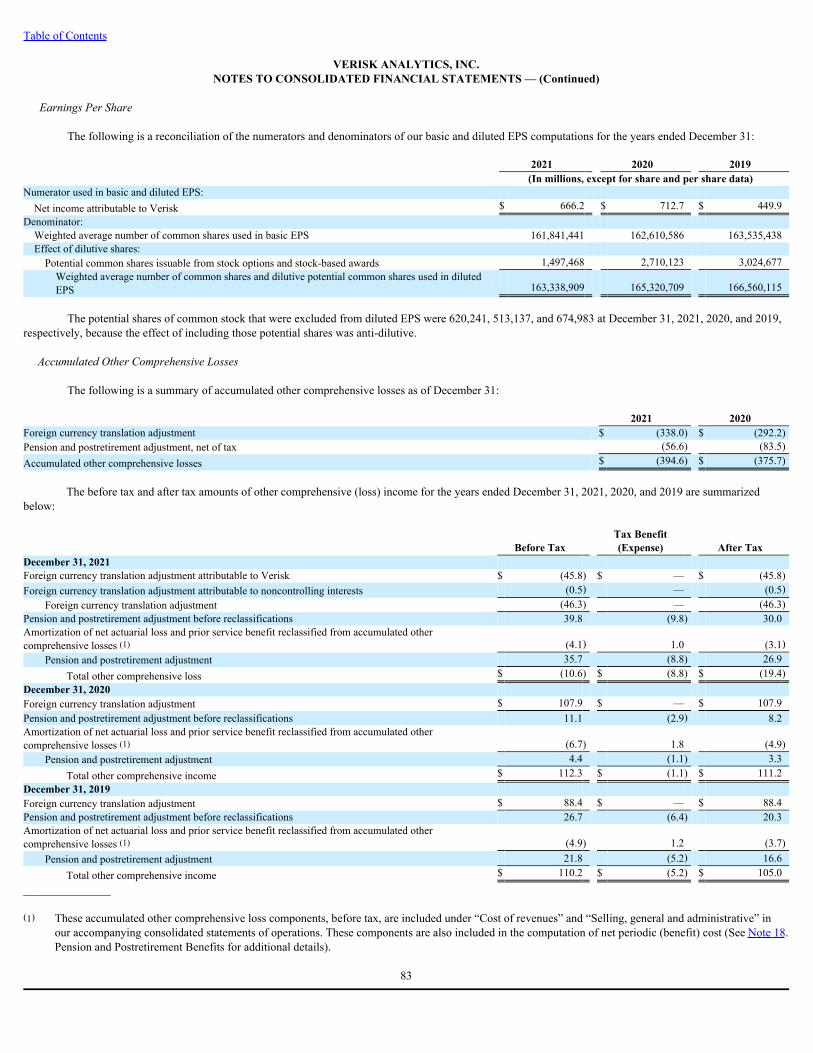
Table of Contents
VERISK ANALYTICS, INC.NOTES TO CONSOLIDATED FINANCIAL STATEMENTS — (Continued)
Earnings Per Share
The following is a reconciliation of the numerators and denominators of our basic and diluted EPS computations for the years ended December 31:
2021 2020 2019 (In millions, except for share and per share data) Numerator used in basic and diluted EPS: Net income attributable to Verisk $ 666.2 $ 712.7 $ 449.9
Denominator: Weighted average number of common shares used in basic EPS 161,841,441 162,610,586 163,535,438 Effect of dilutive shares: Potential common shares issuable from stock options and stock-based awards 1,497,468 2,710,123 3,024,677 Weighted average number of common shares and dilutive potential common shares used in dilutedEPS 163,338,909 165,320,709 166,560,115
The potential shares of common stock that were excluded from diluted EPS were 620,241, 513,137, and 674,983 at December 31, 2021, 2020, and 2019,
respectively, because the effect of including those potential shares was anti-dilutive. Accumulated Other Comprehensive Losses
The following is a summary of accumulated other comprehensive losses as of December 31:
2021 2020 Foreign currency translation adjustment $ (338.0) $ (292.2)Pension and postretirement adjustment, net of tax (56.6) (83.5)Accumulated other comprehensive losses $ (394.6) $ (375.7)
The before tax and after tax amounts of other comprehensive (loss) income for the years ended December 31, 2021, 2020, and 2019 are summarizedbelow:
Tax Benefit Before Tax (Expense) After Tax December 31, 2021 Foreign currency translation adjustment attributable to Verisk $ (45.8) $ — $ (45.8)Foreign currency translation adjustment attributable to noncontrolling interests (0.5) — (0.5)
Foreign currency translation adjustment (46.3) — (46.3)Pension and postretirement adjustment before reclassifications 39.8 (9.8) 30.0 Amortization of net actuarial loss and prior service benefit reclassified from accumulated othercomprehensive losses (1) (4.1) 1.0 (3.1)
Pension and postretirement adjustment 35.7 (8.8) 26.9 Total other comprehensive loss $ (10.6) $ (8.8) $ (19.4)
December 31, 2020 Foreign currency translation adjustment $ 107.9 $ — $ 107.9 Pension and postretirement adjustment before reclassifications 11.1 (2.9) 8.2 Amortization of net actuarial loss and prior service benefit reclassified from accumulated othercomprehensive losses (1) (6.7) 1.8 (4.9)
Pension and postretirement adjustment 4.4 (1.1) 3.3 Total other comprehensive income $ 112.3 $ (1.1) $ 111.2
December 31, 2019 Foreign currency translation adjustment $ 88.4 $ — $ 88.4 Pension and postretirement adjustment before reclassifications 26.7 (6.4) 20.3 Amortization of net actuarial loss and prior service benefit reclassified from accumulated othercomprehensive losses (1) (4.9) 1.2 (3.7)
Pension and postretirement adjustment 21.8 (5.2) 16.6
Total other comprehensive income $ 110.2 $ (5.2) $ 105.0 _______________ (1) These accumulated other comprehensive loss components, before tax, are included under “Cost of revenues” and “Selling, general and administrative” in
our accompanying consolidated statements of operations. These components are also included in the computation of net periodic (benefit) cost (See Note 18.Pension and Postretirement Benefits for additional details).
83
Table of Contents
VERISK ANALYTICS, INC.NOTES TO CONSOLIDATED FINANCIAL STATEMENTS — (Continued)
17. Compensation Plans:
KSOP
We have established the KSOP for the benefit of eligible employees in the U.S. and Puerto Rico. The KSOP includes both an employee savingscomponent and an employee stock ownership component. The purpose of the combined plan is to enable our employees to participate in a tax-deferred savingsarrangement under Internal Revenue Service Code Sections 401(a) and 401(k) (the “Code”), and to provide our employees equity participation through theemployee stock ownership plan (“ESOP”) accounts.
Under the KSOP, eligible employees may make pre-tax and after-tax cash contributions as a percentage of their compensation, subject to certain
limitations under the applicable provisions of the Code. The maximum pre-tax contribution that can be made to the 401(k) account as determined under theprovisions of Code Section 401(g) is $19.5 thousand for 2021 and 2020 and $19.0 thousand for 2019. Certain eligible participants (age 50 and older) maycontribute an additional $6.5 thousand on a pre-tax basis for 2021 and 2020 and $6.0 thousand for 2019. After-tax contributions are limited to 10.0% of aparticipant’s compensation. Effective January 1, 2019, we increased the matching contributions to 100.0% of the first 6.0% of the participant’s contribution. The401(k) matching contributions under the KSOP for the years ended December 31, 2021, 2020, and 2019, were $33.7 million, $31.6 million, and $31.0 million,respectively; which, at our option, were funded in cash.
In 2005, we established the ISO Profit Sharing Plan (the “Profit Sharing Plan”), a defined contribution plan, to replace the qualified pension plan for all
eligible employees hired on or after March 1, 2005. The Profit Sharing Plan is a component of the KSOP. Eligible employees participated in the Profit SharingPlan if they completed 1,000 hours of service each plan year and were employed on December 31 of that year. We can make a discretionary contribution to theProfit Sharing Plan based on our annual performance. Participants vest once they have completed four years and 1,000 hours of service. For the years endedDecember 31, 2021, 2020, and 2019, there were no profit sharing contributions.
Equity Compensation Plans
On May 19, 2021 (the "Approval Date"), our shareholders approved the Verisk Analytics, Inc. 2021 Incentive Plan, which replaced the 2013 Incentive
Plan for any new grants made after the Approval Date. As of the Approval Date, the number of shares of our common stock available for issuance under the 2021Incentive Plan was 16,000,000, reduced by (i) one share for every one share that was subject to an option or stock appreciation right granted after December 31,2020 and prior to the Approval Date under the 2013 Incentive Plan, and (ii) two and one-half shares for every one share that was subject to any award other than anoption or stock appreciation right granted after December 31, 2020 and prior to the Approval Date under the 2013 Incentive Plan. All of our outstanding stockoptions, restricted stock, and PSUs are covered under our 2021 Incentive Plan, 2013 Incentive Plan, or 2009 Incentive Plan. Awards under our 2021 Incentive Planmay include one or more of the following types: (i) stock options (both nonqualified and incentive stock options), (ii) stock appreciation rights, (iii) restrictedstock, (iv) restricted stock units, (v) performance awards, (vi) other share-based awards, and (vii) cash. Employees, directors, and consultants are eligible forawards under our 2021 Incentive Plan. We issued common stock under these plans from our treasury shares. We have granted equity awards to key employees anddirectors. The ultimate realization of the PSUs may range from 0% to 200% of the recipient’s target levels established on the grant date. As of December 31, 2021,there were 14,915,295 shares of common stock reserved and available for future issuance.
84

Table of Contents
VERISK ANALYTICS, INC.NOTES TO CONSOLIDATED FINANCIAL STATEMENTS — (Continued)
A summary of the status of the stock options, restricted stock, and PSUs awarded under our 2021 Incentive Plan as of December 31, 2021, 2020, and
2019 and changes during the years is presented below.
Stock Option Restricted Stock PSU Weighted Weighted Weighted Average Average Average Aggregate Grant Date Grant Date Number Exercise Intrinsic Number Fair Value Number Fair Value of Options Price Value of Shares Per Share of Shares Per Share
(in
millions) Outstanding at January 1, 2019 6,820,046 $ 67.27 $ 284.9 533,335 $ 88.55 42,050 $ 140.70
Granted 920,398 $ 135.64 167,231 $ 135.82 51,792 $ 173.59 Dividend reinvestment — $ — — $ — 550 N/A Exercised or lapsed (1,131,970) $ 51.20 $ 101.0 (242,815) $ 84.60 — $ — Canceled, expired or forfeited (175,660) $ 92.27 (29,022) $ 109.72 (432) $ 134.24
Outstanding at December 31, 2019 6,432,814 $ 79.51 $ 449.2 428,729 $ 107.96 93,960 $ 158.50 Granted 936,843 $ 159.28 163,441 $ 159.96 50,736 $ 192.93 Dividend reinvestment — $ — — $ — 913 N/A Exercised or lapsed (1,623,740) $ 56.83 $ 189.8 (178,317) $ 102.00 — $ — Canceled, expired or forfeited (134,140) $ 125.95 (23,799) $ 124.40 — $ —
Outstanding at December 31, 2020 5,611,777 $ 98.28 $ 613.4 390,054 $ 131.63 145,609 $ 170.75 Granted 750,822 $ 189.29 162,378 $ 189.23 59,144 $ 210.07 Dividend reinvestment — $ — — $ — 980 N/A Exercised or lapsed (1,146,422) $ 73.30 $ 147.6 (173,726) $ 120.94 (42,610) $ 140.70 Canceled, expired or forfeited (149,079) $ 155.40 (27,202) $ 157.79 — $ —
Outstanding at December 31, 2021 5,067,098 $ 115.73 $ 572.6 351,504 $ 161.33 163,123 $ 192.99 Exercisable at December 31, 2021 3,173,592 $ 89.14 $ 443.0 Exercisable at December 31, 2020 3,494,164 $ 76.84 $ 456.9 Nonvested at December 31, 2021 1,893,506 351,504 163,123 Expected to vest at December 31, 2021 1,641,393 305,607 181,817 (1) _______________(1) Includes estimated performance achievement
The fair value of our stock options granted was estimated on the date of grant using a Black-Scholes option valuation model that uses the weighted-
average assumptions noted in the following table during the years ended December 31:
2021 2020 2019 Expected volatility 23.66% 18.48% 18.76%Risk-free interest rate 0.39% 1.51% 2.25%Expected term in years 4.3 4.3 4.4 Dividend yield 0.63% 0.71% 0.80%Weighted average grant date fair value per stock option $ 35.15 $ 25.87 $ 24.13
85

Table of Contents
VERISK ANALYTICS, INC.NOTES TO CONSOLIDATED FINANCIAL STATEMENTS — (Continued)
A summary of the status of our nonvested options and changes are presented below:
Number of Options
Weighted AverageGrant-Date FairValue Per Share
Nonvested balance at January 1, 2019 2,459,929 $ 17.41 Granted 920,398 $ 24.13 Vested (947,708) $ 17.29 Cancelled or expired (175,660) $ 17.77
Nonvested balance at December 31, 2019 2,256,959 $ 20.17 Granted 936,843 $ 25.87 Vested (942,049) $ 18.30 Cancelled or expired (134,140) $ 22.40
Nonvested balance at December 31, 2020 2,117,613 $ 23.39 Granted 750,822 $ 35.15 Vested (825,850) $ 21.62 Cancelled or expired (149,079) $ 27.54
Nonvested balance at December 31, 2021 1,893,506 $ 28.49 Intrinsic value for stock options is calculated based on the exercise price of the underlying awards and the quoted price of our common stock as of the
reporting date. Excess tax benefits of $35.9 million, $42.9 million, and $23.2 million from exercised stock options were recorded as income tax benefit in ouraccompanying consolidated statements of operations for the years ended December 31, 2021, 2020, and 2019, respectively. Stock-based compensation expense forthe years ended December 31, 2021, 2020, and 2019 was $55.7 million, $47.6 million, and $42.7 million, respectively. As of December 31, 2021, the weightedaverage remaining contractual terms were 6.0 years and 4.8 years for outstanding and exercisable stock options, respectively. As of December 31, 2020, theweighted average remaining contractual terms were 6.0 years and 4.7 years for outstanding and exercisable stock options, respectively.
As of December 31, 2021, there was $88.0 million of total unrecognized compensation cost, exclusive of the impact of vesting upon retirement eligibility,related to nonvested share-based compensation arrangements granted under our 2021 and 2013 Incentive Plans. That cost is expected to be recognized over aweighted-average period of 2.3 years.
Our U.K. Sharesave Plan offers qualifying employees in the United Kingdom the opportunity to own shares of our common stock. Employees who electto participate are granted stock options, of which the exercise price is equal to the average of the closing price on the five trading days immediately preceding theplan invitation date discounted by 5%, and enter into a savings contract, the proceeds of which are then used to exercise the options upon the three-year maturity ofthe savings contract. During the years ended December 31, 2021, 2020, and 2019, we granted 11,254, 8,174, and 18,713 stock options under the U.K. SharesavePlan at a discounted exercise price of $166.16, $159.98, and $136.35, respectively. As of December 31, 2021, there were 451,207 shares of common stock reservedand available for future issuance under our U.K. Sharesave Plan.
We also offer eligible employees the opportunity to participate in an ESPP. Under our ESPP, participating employees may authorize payroll deductions of
up to 20.0% of their regular base salary and up to 50.0% of their short-term incentive compensation, both of which in total may not exceed $25.0 thousand in anycalendar year, to purchase shares of our common stock at a 5.0% discount of its fair market value at the time of purchase. In accordance with ASC 718, our ESPPis noncompensatory as the purchase discount is 5.0% or less from the fair market value, substantially all employees that meet limited employment qualificationsmay participate, and it incorporates no option features. During the years ended December 31, 2021, 2020, and 2019, we issued 33,974, 32,502, and 30,705 sharesof common stock at a weighted average discounted price of $181.77, $164.44, and $141.17 respectively. As of December 31, 2021, there were 1,226,292 shares ofcommon stock reserved and available for future issuance under our ESPP.
86

Table of Contents
VERISK ANALYTICS, INC.NOTES TO CONSOLIDATED FINANCIAL STATEMENTS — (Continued)
18. Pension and Postretirement Benefits:
We have a frozen qualified defined benefit pension plan for certain of our employees through membership in the Pension Plan for Insurance
Organizations (the “Pension Plan”), a multiple-employer trust. Prior to the freeze, we applied a cash balance formula to determine future benefits. Under the cashbalance formula, each participant has an account, which was credited annually based on salary rates determined by years of service, as well as the interest earnedon the previous year-end cash balance. We also have a non-qualified frozen supplemental cash balance plan (“SERP”) for certain employees. Our SERP is fundedfrom our general assets. We contributed $0.7 million to our SERP in 2021 and 2020, respectively, and expect to contribute $1.4 million in 2022.
Our Pension Plan’s funding policy is to contribute annually at an amount between the minimum funding requirements set forth in the Employee
Retirement Income Security Act of 1974 and the maximum amount that can be deducted for federal income tax purposes. No minimum contribution requirementwas and is expected for 2021 and 2022, respectively.
We also provide certain healthcare and life insurance benefits for both active and retired employees. The Postretirement Health and Life Insurance Plan
(the “Postretirement Plan”), which has been frozen, is contributory, requiring participants to pay a stated percentage of the premium for coverage. We do notexpect to contribute to our Postretirement Plan in 2022.
The following table sets forth the changes in the benefit obligations and the plan assets, the funded status of the Pension Plan, SERP, and Postretirement
Plan, and the amounts recognized in our consolidated balance sheets at December 31:
Pension Plan and SERP Postretirement Plan 2021 2020 2021 2020 Change in benefit obligation:
Benefit obligation at January 1 $ 459.9 $ 443.6 $ 7.5 $ 8.2 Interest cost 11.0 12.6 0.1 0.2 Actuarial (gain) loss (9.0) 32.1 (0.9) (0.2)Plan participants’ contributions — — 1.5 1.6 Benefits paid (30.2) (28.4) (2.2) (2.3)
Benefit obligation at December 31 $ 431.7 $ 459.9 $ 6.0 $ 7.5
Accumulated benefit obligation at December 31 $ 431.7 $ 459.9 Change in plan assets:
Fair value of plan assets at January 1 $ 520.8 $ 488.9 $ 10.5 $ 10.3 Actual return on plan assets, net of expenses 54.9 59.6 (0.2) 0.3 Employer contributions, net 0.7 0.7 (0.1) 0.6 Plan participants’ contributions — — 1.5 1.6 Benefits paid (30.2) (28.4) (2.2) (2.3)
Fair value of plan assets at December 31 $ 546.2 $ 520.8 $ 9.5 $ 10.5
Funded status at December 31 $ (114.5) $ (60.9) $ (3.5) $ (3.0)Amounts recognized in the consolidated balance sheets consist of:
Pension assets, noncurrent (1) $ (127.0) $ (74.3) $ (3.5) $ (3.0)Pension, SERP and postretirement benefits, current (2) 1.4 1.0 — — Pension, SERP and postretirement benefits, noncurrent (3) 11.1 12.4 — —
Total Pension, SERP and Postretirement benefits $ (114.5) $ (60.9) $ (3.5) $ (3.0)_______________(1) Included in "Other noncurrent assets" in our accompanying consolidated balance sheets(2) Included in "Accounts payable and accrued liabilities" in our accompanying consolidated balance sheets(3) Included in "Other noncurrent liabilities" in our accompanying consolidated balance sheets
87

Table of Contents
VERISK ANALYTICS, INC.NOTES TO CONSOLIDATED FINANCIAL STATEMENTS — (Continued)
The pre-tax components included within accumulated other comprehensive losses as of December 31 are summarized below:
Pension Plan and SERP Postretirement Plan 2021 2020 2021 2020 Prior service benefit cost (credit) $ 2.8 $ 3.0 $ — $ (0.1)Actuarial losses 98.3 133.2 2.4 3.1
Accumulated other comprehensive losses, pretax $ 101.1 $ 136.2 $ 2.4 $ 3.0
The pre-tax components of net periodic benefit (credit) cost and the amounts recognized in other comprehensive loss are summarized below for the years
ended December 31:
Pension Plan and SERP Postretirement Plan 2021 2020 2019 2021 2020 2019 Interest cost $ 11.0 $ 12.6 $ 15.6 $ 0.1 $ 0.2 $ 0.3 Expected return on plan assets (32.8) (29.9) (30.3) (0.2) (0.2) (0.2)Amortization of prior service cost (credit) reclassified from accumulated othercomprehensive losses 0.2 0.2 0.2 (0.1) (0.1) (0.1)
Amortization of net actuarial loss reclassified from accumulated othercomprehensive losses 3.8 6.3 4.5 0.2 0.3 0.3 Net periodic benefit (credit) cost (17.8) (10.8) (10.0) — 0.2 0.3
Amortization of prior service (cost) credit reclassified from accumulated othercomprehensive losses (0.2) (0.2) (0.2) 0.1 0.1 0.1
Amortization of actuarial loss reclassified from accumulated othercomprehensive losses (0.2) (0.2) (0.1) — — —
Net loss recognized reclassified from accumulated other comprehensive losses (3.6) (6.1) (4.4) (0.2) (0.3) (0.3)Actuarial (gain) loss (31.1) 2.4 (16.4) (0.5) (0.3) (0.8)Total recognized in other comprehensive income (35.1) (4.1) (21.1) (0.6) (0.5) (1.0)Total recognized in net periodic benefit credit and other comprehensive(income) loss $ (52.9) $ (14.9) $ (31.1) $ (0.6) $ (0.3) $ (0.7)
The weighted-average assumptions used to determine benefit obligations as of December 31, 2021 and 2020 and net periodic benefit (credit) cost for the
years 2021, 2020 and 2019 are provided below:
Pension Plan and SERP Postretirement Plan Weighted-average assumptions used to determine benefit obligations: 2021 2020 2021 2020 Discount rate 2.75% 2.49% 2.25% 1.50% Expected return on plan assets 6.25% 6.50% 1.75% 2.00% Cash balance interest credit rate 2.57% 2.57% N/A
Weighted-average assumptions used to determine net periodic benefit (credit)cost: 2021 2020 2019 2021 2020 2019 Discount rate 2.49% 2.83% 3.82% 1.50% 2.50% 3.75%Expected return on plan assets 6.50% 6.75% 7.00% 2.00% 2.00% 2.00%Cash balance interest credit rate 2.57% 2.57% 2.57% N/A
88

Table of Contents
VERISK ANALYTICS, INC.NOTES TO CONSOLIDATED FINANCIAL STATEMENTS — (Continued)
The following table presents the estimated future benefit payments for the respective plans. The future benefit payments for the Postretirement Plan are
net of the federal Medicare subsidy.
Pension Plan Postretirement and SERP Plan Gross Gross Medicare Net Benefit Benefit Subsidy Benefit Amount Amount Payments Amount 2022 $ 30.5 $ 1.1 $ (0.2) $ 0.9 2023 $ 30.3 $ 1.0 $ (0.2) $ 0.8 2024 $ 30.0 $ 0.8 $ (0.1) $ 0.7 2025 $ 29.0 $ 0.7 $ (0.1) $ 0.6 2026 $ 28.5 $ 0.6 $ — $ 0.6 2027 and thereafter $ 132.5 $ 2.0 $ — $ 2.0
The healthcare cost trend rate for 2021 was 7.75% gradually decreasing to 4.50% in 2035. Assumed healthcare cost trend rates have a significant effect
on the amounts reported for the healthcare plan. The subsidy benefit from the Medicare Prescription Drug, Improvement and Modernization Act of 2003 reduced our accumulated postretirement benefit
assets by approximately $0.8 million as of December 31, 2021 and 2020. The subsidy cost increased the net periodic benefit cost by approximately $75.8 thousand,$58.2 thousand, and $48.5 thousand in fiscal 2021, 2020 and 2019, respectively.
The expected return on our Pension Plan assets as of December 31, 2021 and 2020 was 6.25% and 6.50%, respectively, which was determined by taking
into consideration our analysis of our actual historical investment returns to a broader long-term forecast after adjusting for the target investment allocation andreflecting the current economic environment. During the first quarter of 2021, we changed the investment guidelines on our Pension Plan assets to targetinvestment allocation of 50% to equity securities and 50% to debt securities from our previous target allocation of 55% to equity securities and 45% to debtsecurities as of December 31, 2020. Our Pension Plan assets consist primarily of investments in various fixed income and equity funds. Investment guidelines areestablished with each investment manager. These guidelines provide the parameters within which the investment managers agree to operate, including criteria thatdetermine eligible and ineligible securities, diversification requirements and credit quality standards, where applicable. Investment managers are prohibited fromentering into any speculative hedging transactions. The investment objective is to achieve a maximum total return with strong emphasis on preservation of capitalin real terms.
The asset allocation at December 31, 2021 and 2020, and target allocation by asset category are as follows:
Target Percentage of Plan Assets Asset Category Allocation 2021 2020 Equity securities 50.0% 45.8% 52.5%Debt securities 50.0% 47.8% 40.0%Other —% 6.4% 7.5%
Total 100.0% 100.0% 100.0%
We have used the target investment allocation to derive the expected return as we believe this allocation will be retained on an ongoing basis that will becommensurate with the projected cash flows of the plan. The expected return for each investment category within the target investment allocation is developedusing average historical rates of return for each targeted investment category, considering the projected cash flow of our Pension Plan. The difference between thisexpected return and the actual return on plan assets is generally deferred and recognized over subsequent periods through future net periodic benefit costs. Webelieve that the use of the average historical rates of returns is consistent with the timing and amounts of expected contributions to the plans and benefit paymentsto plan participants. These considerations provide the basis for reasonable assumptions with respect to the expected long-term rate of return on plan assets.
89

Table of Contents
VERISK ANALYTICS, INC.NOTES TO CONSOLIDATED FINANCIAL STATEMENTS — (Continued)
We also maintain a voluntary employees beneficiary association plan (the “VEBA Plan”) under Section 501(c)(9) of the Internal Revenue Code to fund
the Postretirement Plan. The asset allocation for our VEBA Plan at December 31, 2021 and 2020 was 100% in debt securities. There were no transfers among Levels 1, 2, or 3 for the years ended December 31, 2021 and 2020. Refer to Note 7. Fair Value Measurements for further
discussion with respect to fair value hierarchy. The following table summarizes the fair value measurements by level of our Pension Plan and Postretirement Planassets:
Quoted Prices Significant in Active Other Markets for Observable Identical Assets Inputs Total (Level 1) (Level 2) December 31, 2021 Equity
Managed equity accounts (1) $ 195.0 $ 195.0 $ — Equity — pooled separate account (2) 54.9 — 54.9
Debt Fixed income manager — separately managed account (5) 163.7 — 163.7 Fixed income manager — pooled separate account (2) 97.9 — 97.9 Fixed income manager — government securities (3) 9.5 9.5 —
Others Cash — pooled separate account (2) (0.1) — (0.1)Global real estate account (4) 34.8 — 34.8
Total $ 555.7 $ 204.5 $ 351.2 December 31, 2020 Equity
Managed equity accounts (1) $ 206.3 $ 206.3 $ — Equity — pooled separate account (2) 67.2 — 67.2
Debt Fixed income manager — pooled separate account (2) 208.3 — 208.3 Fixed income manager — government securities (3) 10.5 10.5 —
Others Cash — pooled separate account (2) 2.1 — 2.1 Global real estate account (4) 36.9 — 36.9
Total $ 531.3 $ 216.8 $ 314.5 _______________ (1) Valued at the closing price of shares for domestic stocks within the managed equity accounts, and valued at the net asset value (“NAV”) of shares for mutual
funds at either the closing price reported in the active market or based on yields currently available on comparable securities of issuers with similar creditratings for corporate bonds held by the Pension Plan in these managed accounts.
(2) The pooled separate accounts invest in domestic and foreign stocks, bonds and mutual funds. The fair values of these stocks, bonds and mutual funds are
publicly quoted and are used in determining the NAV of the pooled separate account, which is not publicly quoted. (3) The fund invested in the U.S. government, its agencies or instrumentalities or securities that are rated AAA by S&P, AAA by Fitch, or Aaa by Moody’s,
including but not limited to mortgage securities such as agency and non-agency collateralized mortgage obligations, and other obligations that are secured bymortgages or mortgage backed securities, and valued at the closing price reported in the active market.
(4) The funds invested in common stocks and other equity securities issued by domestic and foreign real estate companies, including real estate investment trusts
("REIT") and similar REIT-like entities. The fair values of these stocks, bonds and mutual funds are publicly quoted and are used in determining the NAV ofthe funds, which is not publicly quoted.
(5) The separately managed accounts invest in U.S. Treasury Bonds and U.S. Treasury Separate Trading of Registered Interest and Principal of Securities (“UST
STRIPS”). The fair values of these bonds and UST STRIPS are publicly quoted and are used in determining the NAV of the separately managed account,which is not publicly quoted.
90

Table of Contents
VERISK ANALYTICS, INC.NOTES TO CONSOLIDATED FINANCIAL STATEMENTS — (Continued)
19. Segment Reporting
ASC 280-10, Disclosures About Segments of an Enterprise and Related Information (“ASC 280-10”), establishes standards for reporting informationabout operating segments. ASC 280-10 requires that a public business enterprise reports financial and descriptive information about its reportable operatingsegments. Operating segments are components of an enterprise for which separate financial information is available that is evaluated regularly by the chiefoperating decision maker (“CODM”) in deciding how to allocate resources and in assessing performance. Our President and CEO is identified as the CODM asdefined by ASC 280-10.
Each of our reportable segments, Insurance, Energy and Specialized Markets, and Financial Services has a portion of its revenue from more than one of
the three revenue types described within the revenue recognition policy within Note 2. Basis of Presentation and Summary of Significant Accounting Policies.Below is the overview of the solutions offered within each reportable segment.
Insurance: We are the leading provider of statistical, actuarial, and underwriting data for the U.S. P&C insurance industry. Our databases include
cleansed and standardized records describing premiums and losses in insurance transactions, casualty and property risk attributes for commercial buildings andtheir occupants, and fire suppression capabilities of municipalities. We use this data to create policy language and proprietary risk classifications that are industrystandards and to generate prospective loss cost estimates used to price insurance policies, which are accessed via a hosted platform. We also develop solutions thatour customers use to analyze key processes in managing risk. Our combination of algorithms and analytic methods incorporates our proprietary data to generatesolutions. We also help businesses and governments better anticipate and manage climate and weather-related risks. In most cases, our customers integrate thesolutions into their models, formulas or underwriting criteria in order to predict potential loss events, ranging from hurricanes to earthquakes. Wedevelop catastrophe and extreme event models and offer solutions covering natural and man-made risks, including acts of terrorism. We further develop solutionsthat allow customers to quantify costs after loss events occur. Our multitier, multispectral terrestrial imagery and data acquisition, processing, analytics, anddistribution system using the remote sensing and machine learning technologies help gather, store, process, and deliver geographic and spatially referencedinformation that supports uses in many markets. Additionally, we offer fraud-detection solutions including review of data on claim histories, analysis of claims tofind emerging patterns of fraud, and identification of suspicious claims in the insurance sector. Our underwriting & rating, insurance anti-fraud claims, catastrophemodeling, and loss quantification are included in this segment. During the first quarter of 2021, due to management restructuring, our CODM reorganized AER, animmaterial component of the Energy and Specialized Markets segment, to the Insurance segment. Consequently, AER became part of the underwriting and ratingcategory within the Insurance segment. The inclusion of AER within our Insurance segment better aligns with how our CODM makes operating decisions, assessesthe performance of the business, and allocates resources. Our prior year results have been recast to reflect this change. The related impact to our consolidatedfinancial statements was not material for all periods presented.
Energy and Specialized Markets: We are a leading provider of data analytics via hosted platform for the global energy, chemicals, and metals and mining
industries. Our research and consulting solutions focus on exploration strategies and screening, asset development and acquisition, commodity markets, andcorporate analysis in the areas of business environment, business improvement, business strategies, commercial advisory, and transaction support. We gather andmanage proprietary information, insight, and analysis on oil and gas fields, mines, refineries, and other assets across the interconnected global energy sectors toadvise customers in making asset investment and portfolio allocation decisions. Our analytical tools measure and observe environmental properties and translatethose measurements into actionable information based on customer needs. In addition, we provide market and cost intelligence to energy companies to optimizefinancial results. We further offer a suite of data and information services that enable improved compliance with global Environmental Health and Safetyrequirements related to the safe manufacturing, distribution, transportation, usage, and disposal of chemicals and products. Our energy business and environmentalhealth and safety services are included in this segment.
Financial Services: We maintain a bank account consortia to provide competitive benchmarking, decisioning algorithms, business intelligence, and
customized analytic services that help financial institutions, payment networks and processors, alternative lenders, regulators, and merchants make better strategy,marketing, and risk decisions. Customers apply our solutions in the areas of tailored data management and media effectiveness that include business intelligenceplatforms, profile views, mobile data solutions, enterprise database services, and fraud risk scoring algorithms for marketing, fraud, and risk mitigation. In addition,our bankruptcy management solutions assist creditors, debt servicing businesses, and credit services to enhance regulatory compliance by eliminating stay violationand portfolio valuation risk.
The three aforementioned operating segments represent the segments for which discrete financial information is available and upon which operating
results are regularly evaluated by our CODM in order to assess performance and allocate resources. We use EBITDA as the profitability measure for makingdecisions regarding ongoing operations. EBITDA is net income before interest expense, provision for income taxes, depreciation and amortization of fixed andintangible assets. EBITDA is the measure of operating results used to assess corporate performance and optimal utilization of debt and acquisitions. Operatingexpenses consist of direct and indirect costs principally related to personnel, facilities, software license fees, consulting, travel, and third-party informationservices. Indirect costs are generally allocated to the segments using fixed rates established by management based upon estimated expense contribution levels andother assumptions that management considers reasonable. We do not allocate interest expense and provision for income taxes, since these items are not consideredin evaluating the segment’s overall operating performance. In addition, our CODM does not evaluate the financial performance of each segment based on assets.See Note 6. Revenues for information on disaggregated revenues by type of service and by country.
91

Table of Contents
VERISK ANALYTICS, INC.NOTES TO CONSOLIDATED FINANCIAL STATEMENTS — (Continued)
The following table provides our revenue and EBITDA by reportable segment for the years ended December 31, as well as a reconciliation of EBITDA to
income before income taxes for all periods presented in our accompanying consolidated statements of operations:
2021 2020 2019
Insurance
Energyand
SpecializedMarkets
FinancialServices Total Insurance
Energyand
SpecializedMarkets
FinancialServices Total Insurance
Energyand
SpecializedMarkets
FinancialServices Total
Revenues $ 2,206.9 $ 648.9 $ 142.8 $ 2,998.6 $ 2,008.7 $ 619.2 $ 156.7 $ 2,784.6 $ 1,885.4 $ 543.7 $ 178.0 $ 2,607.1 Expenses: Cost of revenues(exclusive of itemsshown separatelybelow) (704.4) (263.0) (90.4) (1,057.8) (644.3) (256.8) (92.8) (993.9) (654.1) (225.5) (97.2) (976.8)Selling, general andadministrative (239.1) (154.4) (29.2) (422.7) (248.1) (146.1) (19.7) (413.9) (407.9) (175.9) (19.7) (603.5)Other operating (loss)income — — (134.0) (134.0) 15.9 — 3.5 19.4 — — (6.2) (6.2)Investment income(loss) and others, net 2.3 (0.2) (0.2) 1.9 (1.2) (1.2) — (2.4) 0.7 (1.9) (0.5) (1.7)EBITDA $ 1,265.7 $ 231.3 $ (111.0) 1,386.0 $ 1,131.0 $ 215.1 $ 47.7 1,393.8 $ 824.1 $ 140.4 $ 54.4 1,018.9
Depreciation andamortization of fixedassets (206.9) (192.2) (185.7)Amortization ofintangible assets (176.7) (165.9) (138.0)Interest expense (127.0) (138.2) (126.8)Income beforeincome taxes $ 875.4 $ 897.5 $ 568.4
Long-lived assets by country are provided below as of December 31:
2021 2020 Long-lived assets: U.S. $ 3,527.6 $ 3,525.0 U.K. 2,754.0 2,775.8 Other countries 623.9 466.8 Total long-lived assets $ 6,905.5 $ 6,767.6
92

Table of Contents
VERISK ANALYTICS, INC.NOTES TO CONSOLIDATED FINANCIAL STATEMENTS — (Continued)
20. Related Parties:
We consider our stockholders that own more than 5% of the outstanding stock within the class to be related parties as defined within ASC 850, RelatedParty Disclosures. We had no material transactions with related parties owning more than 5% of the entire class of stock for the years ended December 31, 2021and 2020.
In addition, we had no revenues from related parties for the years ended December 31, 2021, 2020, and 2019.
21. Commitments and Contingencies:
We are a party to legal proceedings with respect to a variety of matters in the ordinary course of business, including the matters described below. With
respect to ongoing matters, we are unable, at the present time, to determine the ultimate resolution of or provide a reasonable estimate of the range of possible lossattributable to ongoing matters or the impact these matters may have on our results of operations, financial position, or cash flows. Although webelieve we have strong defenses and intend to appeal any adverse rulings to us, we could in the future incur judgments or enter into settlements of claims that couldhave a material adverse effect on our results of operations, financial position, or cash flows.
Xactware Solutions, Inc. Patent Litigation
On October 8, 2015, we were served with a summons and complaint in an action titled Eagle View Technologies, Inc. and Pictometry International
Group, Inc. v. Xactware Solutions, Inc. and Verisk Analytics, Inc. filed in the United States District Court for the District of New Jersey (the "Court" or “DistrictCourt”). The complaint alleged that our Roof InSight (now known as Geomni Roof), Property InSight product (now known as Geomni Property) and Aerial Sketchproduct in combination with our Xactimate product infringe seven patents owned by Eagle View and Pictometry namely, Patent Nos. 8,078,436 (the "436 patent"),8,170,840 (the "840 patent"), 8,209,152 (the "152 patent"), 8,542,880 (the "880 patent"), 8,818,770 (the "770 patent"), 8,823,732 (the "732 patent"), and 8,825,454(the "454 patent"). On November 30, 2015, plaintiffs filed a First Amended Complaint adding Patent Nos. 9,129,376 (the "376 patent") and 9,135,737 (the "737patent") to the lawsuit. The First Amended Complaint sought an entry of judgment by the Court that defendants have and continue to directly infringe and/orindirectly infringe, including by way of inducement, the Patents-in-Suit, permanent injunctive relief, damages, costs and attorney’s fees. On May 19, 2017, theDistrict Court entered a Joint Stipulated Order of Partial Dismissal with Prejudice dismissing all claims or assertions pertaining to the 880 and 732 patents, andcertain asserted claims of the 436, 840, 152, 770, 454, 376 and 737 patents (collectively the "Patents in Suit"). Subsequently, Eagle View dropped the 152 patentand the 737 patent and reduced the number of asserted claims from the five remaining Patents in Suit to six asserted claims. On September 25, 2019, following atrial, the jury determined that we had willfully infringed the six asserted claims, and assessed damages in the amount of $125.0 million. After trial, Eagle Viewmoved for a temporary restraining order ("TRO") and a permanent injunction preventing our sales of the Geomni Roof, Geomni Property and Aerial Sketchproducts in combination with Xactimate. The Court granted the motion for a TRO on September 26, 2019 and on October 18, 2019, issued an Order permanentlyenjoining our sales of the Geomni Roof, Geomni Property and Aerial Sketch products in combination with Xactimate. On March 2, 2020, the Court signed anOrder staying execution of the $125.0 million judgment pending our appeal, and we subsequently secured a supersedeas bond in the amount of $137.5 million tosatisfy the New Jersey court rule requiring a bond in the amount of 110% of the monetary judgment. In addition, Eagle View asked the Court to award enhanceddamages by trebling the jury's damages award, together with attorneys' fees, costs, and pre- and post-judgment interest. We opposed all of Eagle View's requestsand asked the Court for judgment as a matter of law and for a new trial. Eagle View opposed our requests. On September 9, 2020, the Court denied our motionseeking judgment as a matter of law and a new trial. We timely filed our Amended Notice of Appeal on October 8, 2020. Eagle View filed a motion to dismiss ordeactivate the appeal for lack of appellate jurisdiction on November 4, 2020 which was denied by the Federal Circuit on December 15, 2020. We filed ourappellate brief on December 24, 2020. On February 16, 2021, the Court granted Eagle View's motion for enhanced damages and attorneys' fees. The Court trebledthe jury's award of $125.0 million, awarding enhanced damages for a total of $375.0 million, and also awarded Eagle View pre-judgment and post-judgmentinterest. The Court's award of Eagle View's attorneys' fees was limited to the period just before the commencement of trial through the trial, and did not include theearlier approximately four-year period in the case. On March 17, 2021, we filed an unopposed application with the Federal Circuit seeking consolidation of ourappeals addressing the trial Court’s findings on infringement, the denial of our motion for judgment as a matter of law and a new trial, and the Court’s Order onenhanced damages. As of June 29, 2021, the appeal was fully briefed. Following the outcome of the trial in 2019, we established a $125.0 million reserve inconnection with this litigation, which was included in selling, general and administrative expenses in our consolidated statements of operations for the year endedDecember 31, 2019. On April 15, 2021, the Court signed an order continuing the stay of execution of the monetary judgment. In light of the Court’s Orderenhancing damages, we posted an additional bond in the amount of $305.0 million. On July 2, 2021, Eagle View sent us a cease and desist letter claiming that ourRoof Underwriting Report (“RUR”) product infringes its asserted patents, and therefore, violates the trial court’s permanent injunction. On July 15, we respondedwith a letter denying infringement and violation of the injunction, and explaining how our RUR is vastly different from the asserted patents. On August 9, 2021,Eagle View filed a motion to initiate contempt proceedings against us for alleged violation of the injunction, seeking a Temporary Restraining Order prohibiting usfrom offering, marketing or selling our RUR and asking the court to grant discovery to assess our RUR and determine whether we were complying with theinjunction. On October 8, 2021, the Federal Circuit Court of Appeals heard oral argument in our appeal. On November 5, 2021, the parties settled the entirelitigation, thereby reversing the excess accrual amount. The Federal Circuit appeal was dismissed on November 9, 2021, and the District Court subsequentlyentered an Order dismissing the contempt action, as well as the parties’ underlying claims, counterclaims and defenses, and dissolving the permanent injunction.Upon a joint motion by both parties, on January 18, 2022, the Court entered an Order releasing the supersedeas bonds and discharging us and our sureties from anycorresponding obligations.
93
Table of Contents
VERISK ANALYTICS, INC.NOTES TO CONSOLIDATED FINANCIAL STATEMENTS — (Continued)
ERISA Litigation
On September 24, 2020, former employees Jillyn Peterson, Gabe Hare, Robert Heynen and Adam Krajewski ("Plaintiffs"), filed suit in the United States
District Court, District of New Jersey (No. 2:20-cv-13223-CCC-MF) against Defendants Insurance Services Office Inc. ("ISO"), the Plan AdministrationCommittee of Insurance Services Office Inc. and its members ("Committee Defendants"), and the Trust Investment Committee of Insurance Services Office Inc.and its members. The class action complaint alleges violations of the Employee Retirement Income Security Act, ("ERISA"). The class is defined as all personswho were participants in or beneficiaries of the ISO 401(k) Savings and Employee Stock Ownership Plan ("Plan"), at any time between September 24, 2014through the date of judgment. The complaint alleges that all defendants are fiduciaries with respect to the Plan. Plaintiffs challenge the amount of fees paid by Planparticipants to maintain the investment funds in the plan portfolio and the amount of recordkeeper fees paid by participants. Plaintiffs allege that by permitting thepayment of excessive fees, the Committee Defendants breached their ERISA duties of prudence and loyalty. Plaintiffs further allege that ISO breached its ERISAduty by failing to monitor the Committee Defendants who they allege committed known breaches of their fiduciary duties. The complaint does not specifydamages but alleges the fiduciary breaches cost Plan participants millions of dollars. Defendants filed their motion to dismiss the complaint on January 12, 2021,which the Court partially denied on April 13, 2021. The parties are currently proceeding with discovery. At this time, it is not possible to reasonably estimate theliability related to this matter as the case is still in its early stages.
Jornaya Litigation
On December 10, 2020, we were served with a putative class action lawsuit brought by Erica Jackson in the Court of Common Pleas of Lackawanna
County, Pennsylvania against Lead Intelligence, Inc. d/b/a Jornaya ("we" or "us"), Case No. 2020 CV 03695. The class complaint alleges that we violatedPennsylvania’s Wiretap Act ("PWA"), 18 Pa. Const. Stat. § 5701 et seq. by "wiretapping" and "intercepting" the plaintiff’s communications on the websitecolleges.educationgrant.com. The plaintiff alleges a class of all persons whose electronic communications were intercepted through the use of our wiretapping onthe website. The complaint claims damages pursuant to the PWA for actual damages, but not less than liquidated damages computed at the rate of $100 a day foreach day of violation, or $1,000, whichever is higher, punitive damages, and reasonable attorney's fees and other litigation costs. On February 16, 2021, we filedpreliminary objections to the plaintiff’s complaint, the plaintiff opposed, and the Court ultimately denied our preliminary objections. We subsequently filed apetition to compel arbitration and a motion to stay this action pending the completion of the parties’ arbitration proceedings. On September 30, 2021, the courtdenied our motions and directed the parties to proceed with discovery. On October 8, 2021, we filed a Notice of Appeal to seek review of the lower court’sdecision with the Pennsylvania appellate court system. At this time, it is not possible to reasonably estimate the liability related to this matter.
Financial Services Government Inquiry
We continue to cooperate with an inquiry by the civil division of the United States Attorney’s Office for the Eastern District of Virginia related togovernment contracts within our financial services segment. The inquiry is ongoing, we have voluntarily produced documents, and we cannot anticipate the timing,outcome or possible impact of the inquiry, financial or otherwise.
Breach of Contract Litigation
On April 2, 2021, Leica Geosystems ("Leica") and its subsidiary, Intergraph Corporation filed a lawsuit against Verisk Analytics and Geomni, Inc.("we" "our" or "us") in the Circuit Court of Madison County, Alabama, titled Leica Geosystems AG, et al. v. Geomni, Inc., Verisk Analytics, Inc., Vexcel Imaging,Inc., et al. Co-Defendant, Vexcel Imaging, through its subsidiary, GV Air, is alleged to have breached a master lease agreement related to Leica’s aerial sensorunits. The complaint further alleges breach of a license agreement for royalties earned from the sale of aerial imagery data, and breach of a mutual nondisclosureagreement related to the alleged disclosure of confidential information to co-defendant, Vexcel Imaging. Leica seeks compensatory and punitive damages, as wellas attorney’s fees and costs. We filed a motion to dismiss the Plaintiffs’ claims and the hearing took place on January 7, 2022. At this time, it is not possible toreasonably estimate the liability related to this matter.
94
Table of Contents
VERISK ANALYTICS, INC.NOTES TO CONSOLIDATED FINANCIAL STATEMENTS — (Continued)
Wood Mackenzie Litigation
On August 10, 2021, S&P Global Inc. d/b/a Platts filed a lawsuit against Wood Mackenzie (“we,” “us,” or “our”) in the United States District Court forthe Southern District of New York, titled S&P Global Inc. d/b/a Platts v. Wood Mackenzie Ltd., Civil Action No. 21-cv-6739. The Complaint alleges that our useof Platts’ data exceeded the scope of the applicable licensing agreement between the two parties. Platts seeks to recover actual damages as a result of the allegedbreach of the agreement, attorney’s fees and costs, as well as injunctive relief requiring Wood Mackenzie to cease all use of its proprietary data. The deadline tofile our responsive pleading was extended to March 11, 2022. At this time, it is not possible to reasonably estimate the liability related to this matter.
Data Privacy Litigation
On December 15, 2021, Plaintiff Jillian Cantinieri brought a putative class action against Verisk Analytics, Insurance Services Office and ISO Claims
Services, Inc. (“we,” “our,” “us”) in the United States District Court for the Eastern District of New York, titled Cantinieri v. Verisk Analytics Inc., et al., CivilAction No. 2:21-cv-6911. The Complaint alleges that we failed to safeguard the personally identifiable information (PII) of Plaintiff and the members of theproposed classes from a purported breach of our databases by unauthorized entities. Plaintiff and class members allege actual and imminent injuries, including theftof their PII, fraudulent activity on their financial accounts, lowered credit scores, and costs associated with detection and prevention of identity theft and fraud.They seek to recover compensatory, statutory and punitive damages, disgorgement of earnings and profits, and attorney’s fees and costs. We filed our responsivepleading on February 7, 2022. At this time, it is not possible to reasonably estimate the liability related to this matter.
LCI Litigation
On December 30, 2021, Plaintiff William Norman Brooks filed a consumer class action lawsuit against Lundquist Consulting, Inc. (“LCI,” “us,” “we,” or“our”) in California Superior Court, San Matteo County, titled Brooks v. Lundquist Consulting, Inc., Case No. 21-CIV-06824. Plaintiff alleges violations of theFair Credit Reporting Act, the California Consumer Credit Reporting Agencies Act, and California Unfair Competition Law, and Defamation. LCI has not yet beenserved with the Complaint. Plaintiff claims that LCI inaccurately reported Mr. Brooks as bankrupt, and that this caused emotional harm and harmed his creditstanding, credit score and reputation. Plaintiff alleges that LCI’s statements about his (and other class members’) bankruptcies to third parties amounted todefamation. It is also alleged that LCI did not provide Plaintiff and others an opportunity to review and dispute any accuracies in the information sold by LCI aboutthem and did not disclose their consumer credit files when asked. Plaintiff seeks to certify Nationwide Inaccuracy and Failure to Disclose Classes, as well asCalifornia Inaccuracy and Failure to Disclose Subclasses. He also seeks to recover actual and punitive damages, restitution of funds suspended and the value ofcredit privileges revoked or terminated, injunctive relief ordering LCI to rectify the credit reporting errors and change its procedures for attributing bankruptcyinformation, and reasonable attorney’s fees and costs. At this time, it is not possible to reasonably estimate the liability related to this matter.
22. Subsequent Events:
In December 2021, we entered into an additional ASR agreement with Citibank, N.A. to repurchase shares of our common stock for an aggregatepurchase price of $100.0 million. Upon payment of the aggregate purchase price on January 4, 2022, we received an initial delivery of 360,913 shares of ourcommon stock, representing approximately $80.0 million of the aggregate purchase price. Upon the final settlement of the ASR agreement in February 2022, wereceived an additional 141,766 shares, as determined by the volume weighted average share price of our common stock of $198.93 during the term of the ASRagreement. See Note 16. Stockholders' Equity for further discussion.
On January 12, 2022, our Board of Directors approved the action to make our environmental health and safety business within the Energy & Specialized
Markets segment available for immediate sale at its current fair value. On January 21, 2022, we entered into a stock purchase agreement to sell 3E CompanyEnvironmental, Ecological and Engineering ("3E") in exchange for a potential aggregate cash consideration of up to $950.0 million. The purchase price consists ofup to $630.0 million of cash consideration paid at closing, subject to customary purchase adjustments, up to $50.0 million of earnout payments based on financialperformance in 2023 and 2024, and up to $270.0 million of additional deferred payments based on the buyer's future return on its investment.
In January 2022, we granted 608,895 nonqualified stock options, 130,555 shares of restricted stock, and 74,887 PSUs to key employees. The nonqualified
stock options and restricted stock have a graded service vesting period of four years. The PSUs granted consisted of 49,533 TSR-based PSUs and 25,354 PSUs thatare tied to the achievement of certain financial performance conditions, namely incremental return on invested capital (“ROIC-based PSUs”). Each of the TSR-based PSUs and ROIC-based PSUs have a three-year performance period, subject to the recipients' continued service. The grant date fair value of the ROIC-basedPSUs is determined using the closing price of our common stock on the grant date. The related performance condition is driven by the incremental return oninvested capital based on net operating profit. The ultimate realization of the PSUs may range from 0% to 200% of the recipient’s target levels established on thegrant date. See Note 17. Compensation Plans for further discussion.
On February 11, 2022, we acquired 100 percent of the membership interest of Infutor Data Solutions, LLC ("Infutor"), for an aggregate net cash
consideration of $223.5 million, of which $1.5 million represents a working capital escrow, plus a contingent earn-out payment of up to $25.0 million subject to theachievement of certain revenue and other performance targets. Infutor, a leading provider of identity resolution and consumer intelligence data, has become a partof the underwriting & rating category within our Insurance segment. We believe this acquisition further enhances Verisk’s marketing solutions offerings tocompanies across several industries including the insurance industry.
On February 16, 2022, our Board of Directors approved a cash dividend of $0.31 per share of common stock issued and outstanding, payable on March
31, 2022, to holders of record as of March 15, 2022. Our Board of Directors also approved an additional share repurchase authorization of $1,000.0 million.

On February 16, 2022, our Board of Directors approved the action to make our financial services business within the Financial Services segment available
for immediate sale at its current fair value. On February 21, 2022, we entered into a stock purchase agreement to sell our financial services business to TransUnion,a global information and insights company, for $515.0 million in cash consideration paid at closing. This transaction is subject to customary closing conditions,including regulatory approvals and working capital adjustments.
**************
95

Table of Contents
Schedule IIValuation and Qualifying Accounts and Reserves
For the Years Ended December 31, 2021, 2020, and 2019(In millions)
Balance at Charged to Beginning Costs and Deductions— Balance at Description of Year Expenses (1) Write-offs (2) End of Year Year ended December 31, 2021 Allowance for doubtful accounts $ 17.7 $ 17.7 $ (14.1) $ 21.3
Valuation allowance for income taxes $ 48.0 $ 17.4 $ (1.3) $ 64.1 Year ended December 31, 2020 Allowance for doubtful accounts $ 11.7 $ 13.1 $ (7.1) $ 17.7
Valuation allowance for income taxes $ 46.5 $ 10.7 $ (9.2) $ 48.0 Year ended December 31, 2019 Allowance for doubtful accounts $ 5.7 $ 7.2 $ (1.2) $ 11.7
Valuation allowance for income taxes $ 34.5 $ 16.7 $ (4.7) $ 46.5
(1) Primarily additional reserves for bad debts (2) Primarily accounts receivable balances written off, net of recoveries, the expiration of loss carryforwards, and businesses held for sale
96

Table of Contents
EXHIBIT INDEX ExhibitNumber Description3.1 Amended and Restated Certificate of Incorporation, incorporated herein by reference to Exhibit 3.1 to the Company’s Current Report on Form 8-K,
dated May 29, 2015. 3.2 Amended and Restated By-Laws, incorporated herein by reference to Exhibit 3.1 to the Company’s Current Report on Form 8-K, dated February 15,
2019. 4.1 Form of Common Stock Certificate, incorporated herein by reference to Exhibit 4.1 to Amendment No. 6 to the Company’s Registration Statement on
Form S-1, dated September 21, 2009. 4.2 Senior Notes Indenture, dated as of April 6, 2011, among Verisk Analytics, Inc., the guarantors named therein and Wells Fargo Bank, National
Association, as Trustee, incorporated herein by reference to Exhibit 4.1 to the Company’s Current Report on Form 8-K, dated April 6, 2011. 4.3 First Supplemental Indenture, dated as of April 6, 2011, among Verisk Analytics, Inc., the guarantors named therein and Wells Fargo Bank, National
Association, as Trustee, incorporated herein by reference to Exhibit 4.2 to the Company’s Current Report on Form 8-K, dated April 6, 2011. 4.4 Third Supplemental Indenture, dated as of September 12, 2012, among Verisk Analytics, Inc., the guarantors named therein and Wells Fargo Bank,
National Association, as Trustee, incorporated herein by reference to Exhibit 4.2 to the Company’s Current Report on Form 8-K, dated September 12,2012.
4.5 Fifth Supplemental Indenture, dated as of May 15, 2015, between Verisk Analytics, Inc. and Wells Fargo Bank, National Association, as Trustee,
incorporated herein by reference to Exhibit 4.2 to the Company’s Current Report on Form 8-K, dated May 15, 2015. 4.6 Senior Notes Indenture, dated March 6, 2019, among Verisk Analytics, Inc. and Wells Fargo Bank, National Association, as Trustee, incorporated
herein by reference to Exhibit 4.1 to the Company’s Current Report on Form 8-K, dated March 6, 2019. 4.7 First Supplemental Indenture, dated March 6, 2019, between Verisk Analytics, Inc. and Wells Fargo Bank, National Association, as Trustee,
incorporated herein by reference to Exhibit 4.2 to the Company’s Current Report on Form 8-K, dated March 6, 2019.
4.8Second Supplemental Indenture, dated May 13, 2020, between Verisk Analytics, Inc. and Wells Fargo Bank, National Association, as Trustee,incorporated herein by reference to Exhibit 4.1 to the Company's Current Report on Form 8-K, dated May 13, 2020.
4.9 Description of Verisk Analytics, Inc.’s securities registered pursuant to Section 12 of the Securities Exchange Act, incorporated herein by reference to
Exhibit 4.8 to the Company's Annual Report on Form 10-K, dated February 18, 2020. 10.1 401(k) Savings Plan and Employee Stock Ownership Plan, incorporated herein by reference to Exhibit 10.1 to the Company’s Registration Statement
on Form S-1, dated August 12, 2008. 10.2 Verisk Analytics, Inc. 2009 Equity Incentive Plan, incorporated herein by reference to Exhibit 10.2 to Amendment No. 6 to the Company’s
Registration Statement on Form S-1, dated September 21, 2009. 10.3 Form of Letter Agreement, incorporated herein by reference to Exhibit 10.3 to Amendment No. 1 to the Company’s Registration Statement on
Form S-1, dated October 7, 2008. 10.4 Form of Master License Agreement and Participation Supplement, incorporated herein by reference to Exhibit 10.4 to Amendment No. 1 to the
Company’s Registration Statement on Form S-1, dated October 7, 2008.
97

Table of Contents ExhibitNumber Description10.5 Schedule of Master License Agreements Substantially Identical in All Material Respects to the Form of Master License Agreement and Participation
Supplement, incorporated herein by reference to Exhibit 10.5 to Amendment No. 2 to the Company’s Registration Statement on Form S-1, datedNovember 20, 2008.
10.6 Form of Change of Control Severance Agreement, incorporated herein by reference to Exhibit 10.8 to Amendment No. 6 to the Company’s
Registration Statement on Form S-1, dated September 21, 2009. 10.7 Insurance Services Office, Inc. 1996 Incentive Plan and Form of Stock Option Agreement thereunder, incorporated herein by reference to
Exhibit 10.9 to Amendment No. 7 to the Company’s Registration Statement on Form S-1, dated September 29, 2009. 10.8 Form of Stock Option Award Agreement under the Verisk Analytics, Inc. 2009 Equity Incentive Plan, incorporated herein by reference to
Exhibit 10.2 to the Company’s Quarterly Report on Form 10-Q, dated November 16, 2009. 10.9 Insurance Services Office, Inc. Supplemental Cash Balance Plan dated January 1, 2009 as amended by the Amendment to the Insurance Services
Office, Inc. Supplemental Cash Balance Plan dated February 10, 2012 incorporated by reference to Exhibit 10.12 to the Company's annual report onForm 10-K dated February 25, 2014.
10.10 Insurance Services Office, Inc. Supplemental Executive Retirement Savings Plan dated January 1, 2009 incorporated by reference to Exhibit 10.13 to
the Company's annual report on Form 10-K dated February 25, 2014. 10.11 Verisk Analytics, Inc. 2013 Equity Incentive Plan, incorporated herein by reference to Appendix A to the Company's Proxy Statement on Schedule
14A, dated April 1, 2013. 10.12 Form of Stock Option Award Agreement under Verisk Analytics, Inc. 2013 Equity Incentive Plan, incorporated herein by reference to Exhibit 99.2 to
Company’s Registration Statement on Form S-8 dated May 15, 2013. 10.13 Form of Restricted Stock Award Agreement under Verisk Analytics, Inc. 2013 Equity Incentive Plan, incorporated herein by reference to Exhibit 99.3
to Company’s Registration Statement on Form S-8 dated May 15, 2013. 10.14 Second Amended and Restated Credit Agreement dated April 22, 2015 among Verisk Analytics, Inc., as borrower, and the lenders and agents party
thereto, incorporated herein by reference to Exhibit 10.1 to the Company’s Current Report on Form 8-K dated April 24, 2015. 10.15 First Amendment to Second Amended and Restated Credit Agreement dated July 24, 2015 among Verisk Analytics, Inc., as borrower, and the lenders
and agents party thereto, incorporated herein by reference to Exhibit 10.2 to the Company’s quarterly report on Form 10-Q dated July 28, 2015. 10.16 Second Amendment to the Second Amended and Restated Credit Agreement dated May 26, 2016 among Verisk Analytics, Inc., as borrower, and the
lenders and agents party thereto, incorporated herein by reference to Exhibit 10.1 to the Company’s Current Report on Form 8-K dated May 26, 2016. 10.17 Third Amendment to the Second Amended Restated Credit Agreement dated May 18, 2017 among Verisk Analytics, Inc., as borrower, and the
lenders and agents party thereto, incorporated herein by reference to Exhibit 10.1 to the Company's Current Report on Form 8-K dated May 19, 2017. 10.18 Fourth Amendment dated August 15, 2019 to the Second Amended and Restated Credit Agreement dated April 22, 2015 among Verisk Analytics,
Inc., as borrower, and the lenders and agents party thereto, incorporated herein by reference to Exhibit 10.18 to the Company’s Current Report onForm 8-K, dated August 16, 2019.
98
Table of Contents ExhibitNumber Description10.19 Verisk Analytics, Inc. 2021 Equity Incentive Plan incorporated herein by reference to Appendix B to the Company's Proxy Statement on Schedule
14A dated April 2, 2021. 10.20 Purchase Agreement, dated as of January 21, 2022, by and among Verisk Analytics, Inc., Tamarack Buyer, L.L.C. and, solely for the limited purpose
set forth therein, 3E Company Environmental, Ecological and Engineering, incorporated herein by reference to Exhibit 2.1 to the Company’s CurrentReport on Form 8-K, dated January 24, 2022.
21.1 Subsidiaries of the Registrant.* 23.1 Consent of Deloitte & Touche LLP.* 31.1 Certification of the Chief Executive Officer of Verisk Analytics, Inc. pursuant to Rule 13a-14 under the Securities Exchange Act of 1934.* 31.2 Certification of the Chief Financial Officer of Verisk Analytics, Inc. pursuant to Rule 13a-14 under the Securities Exchange Act of 1934.* 32.1 Certification of the Chief Executive Officer and Chief Financial Officer of Verisk Analytics, Inc. pursuant to 18 U.S.C. Section 1350 as Adopted
Pursuant to Section 906 of the Sarbanes-Oxley Act of 2002.* 101.INS Inline XBRL Instance Document.* 101.SCH Inline XBRL Taxonomy Extension Schema.* 101.CAL Inline XBRL Taxonomy Extension Calculation Linkbase.* 101.DEF Inline XBRL Taxonomy Definition Linkbase.* 101.LAB Inline XBRL Taxonomy Extension Label Linkbase.* 101.PRE Inline XBRL Taxonomy Extension Presentation Linkbase.* 104 Cover Page Interactive Data File (formatted as Inline XBRL and contained in Exhibit 101).* * Filed herewith.
99
Table of Contents
SIGNATURESPursuant to the requirements of Section 13 or 15(d) of the Securities Exchange Act of 1934, the registrant has duly caused this report to be signed on its
behalf by the undersigned, thereunto duly authorized, on February 22, 2022.
VERISK ANALYTICS, INC.(Registrant)
/S/ Scott G. Stephenson Scott G. Stephenson President and Chief Executive Officer
Pursuant to the requirements of the Securities Exchange Act of 1934, this report has been signed below by the following persons on behalf of the registrant
and in the capacities indicated on February 22, 2022.
Signature Capacity
/S/ SCOTT G. STEPHENSON President and Chief Executive Officer (principal executive officer and
director)Scott G. Stephenson
/S/ LEE M. SHAVEL Chief Financial Officer and Group President
Lee M. Shavel (principal financial officer)
/S/ DAVID J. GROVER Controller and Chief Accounting OfficerDavid J. Grover (principal accounting officer)
/S/ CHRISTOPHER M. FOSKETT Lead Independent Director
Christopher M. Foskett
/S/ ANNELL BAY DirectorAnnell R. Bay
/S/ VINCENT BROOKS Director
Vincent K. Brooks
/S/ BRUCE E. HANSEN DirectorBruce E. Hansen
/S/ KATHLEEN HOGENSON Director
Kathleen A. Hogenson
/S/ CONSTANTINE P. IORDANOU DirectorConstantine P. Iordanou
/S/ LAURA K. IPSEN Director
Laura K. Ipsen
/S/ SAMUEL G. LISS DirectorSamuel G. Liss
/S/ THERESE M. VAUGHAN Director
Therese M. Vaughan
/S/ DAVID B. WRIGHT DirectorDavid B. Wright
100

Exhibit 21.1
LIST OF SUBSIDIARIES OF THE REGISTRANT NAME OF SUBSIDIARY JURISDICTION Insurance Services Office, Inc. DelawareISO Services, Inc. DelawareWood Mackenzie Limited United KingdomXactware Solutions, Inc. Delaware

Exhibit 23.1
CONSENT OF INDEPENDENT REGISTERED PUBLIC ACCOUNTING FIRM
We consent to the incorporation by reference in Registration Statement Nos. 333-237408, 333-216966, 333-194874, and 333-173135 on Form S-3 and RegistrationStatement Nos. 333-256332, 333-188629, 333-183476, and 333-165912 on Form S-8 of our reports dated February 22, 2022 relating to the financial statements ofVerisk Analytics, Inc., and the effectiveness of Verisk Analytics, Inc.’s internal control over financial reporting, appearing in this Annual Report on Form 10-K ofVerisk Analytics, Inc. for the year ended December 31, 2021. /s/ Deloitte & Touche LLPParsippany, New JerseyFebruary 22, 2022

Exhibit 31.1
CERTIFICATION
I, Scott G. Stephenson, certify that:
1. I have reviewed this annual report on Form 10-K of Verisk Analytics, Inc.; 2. Based on my knowledge, this report does not contain any untrue statement of a material fact or omit to state a material fact necessary to make the
statements made, in light of the circumstances under which such statements were made, not misleading with respect to the period covered by this report; 3. Based on my knowledge, the financial statements, and other financial information included in this report, fairly present in all material respects the
financial condition, results of operations and cash flows of the registrant as of, and for, the periods presented in this report; 4. The registrant’s other certifying officer and I are responsible for establishing and maintaining disclosure controls and procedures (as defined in
Exchange Act Rules 13a-15(e) and 15d-15(e)) and internal control over financial reporting (as defined in Exchange Act Rules 13a-15(f) and 15d-15(f)) for theregistrant and have:
(a) Designed such disclosure controls and procedures, or caused such disclosure controls and procedures to be designed under our supervision, to ensurethat material information relating to the registrant, including its consolidated subsidiaries, is made known to us by others within those entities, particularly duringthe period in which this report is being prepared;
(b) Designed such internal control over financial reporting, or caused such internal control over financial reporting to be designed under our supervision,to provide reasonable assurance regarding the reliability of financial reporting and the preparation of financial statements for external purposes in accordance withgenerally accepted accounting principles;
(c) Evaluated the effectiveness of the registrant’s disclosure controls and procedures and presented in this report our conclusions about the effectivenessof the disclosure controls and procedures, as of the end of the period covered by this report based on such evaluation; and
(d) Disclosed in this report any change in the registrant’s internal control over financial reporting that occurred during the registrant’s most recent fiscalquarter (the registrant’s fourth fiscal quarter in the case of an annual report) that has materially affected, or is reasonably likely to materially affect, the registrant’sinternal control over financial reporting; and
5. The registrant’s other certifying officer and I have disclosed, based on our most recent evaluation of internal control over financial reporting, to theregistrant’s auditors and the audit committee of the registrant’s board of directors (or persons performing the equivalent functions):
(a) All significant deficiencies and material weaknesses in the design or operation of internal control over financial reporting which are reasonably likelyto adversely affect the registrant’s ability to record, process, summarize and report financial information; and
(b) Any fraud, whether or not material, that involves management or other employees who have a significant role in the registrant’s internal control overfinancial reporting. /s/ Scott G. Stephenson Scott G. Stephenson President and Chief Executive Officer Date: February 22, 2022

Exhibit 31.2
CERTIFICATION
I, Lee M. Shavel, certify that:
1. I have reviewed this annual report on Form 10-K of Verisk Analytics, Inc.; 2. Based on my knowledge, this report does not contain any untrue statement of a material fact or omit to state a material fact necessary to make the
statements made, in light of the circumstances under which such statements were made, not misleading with respect to the period covered by this report; 3. Based on my knowledge, the financial statements, and other financial information included in this report, fairly present in all material respects the
financial condition, results of operations and cash flows of the registrant as of, and for, the periods presented in this report; 4. The registrant’s other certifying officer and I are responsible for establishing and maintaining disclosure controls and procedures (as defined in
Exchange Act Rules 13a-15(e) and 15d-15(e)) and internal control over financial reporting (as defined in Exchange Act Rules 13a-15(f) and 15d-15(f)) for theregistrant and have:
(a) Designed such disclosure controls and procedures, or caused such disclosure controls and procedures to be designed under our supervision, to ensure
that material information relating to the registrant, including its consolidated subsidiaries, is made known to us by others within those entities, particularly duringthe period in which this report is being prepared;
(b) Designed such internal control over financial reporting, or caused such internal control over financial reporting to be designed under our supervision,
to provide reasonable assurance regarding the reliability of financial reporting and the preparation of financial statements for external purposes in accordance withgenerally accepted accounting principles;
(c) Evaluated the effectiveness of the registrant’s disclosure controls and procedures and presented in this report our conclusions about the effectiveness
of the disclosure controls and procedures, as of the end of the period covered by this report based on such evaluation; and (d) Disclosed in this report any change in the registrant’s internal control over financial reporting that occurred during the registrant’s most recent fiscal
quarter (the registrant’s fourth fiscal quarter in the case of an annual report) that has materially affected, or is reasonably likely to materially affect, the registrant’sinternal control over financial reporting; and
5. The registrant’s other certifying officer and I have disclosed, based on our most recent evaluation of internal control over financial reporting, to the
registrant’s auditors and the audit committee of the registrant’s board of directors (or persons performing the equivalent functions): (a) All significant deficiencies and material weaknesses in the design or operation of internal control over financial reporting which are reasonably likely
to adversely affect the registrant’s ability to record, process, summarize and report financial information; and (b) Any fraud, whether or not material, that involves management or other employees who have a significant role in the registrant’s internal control over
financial reporting. /s/ Lee M. Shavel Lee M. Shavel Chief Financial Officer and Group PresidentDate: February 22, 2022
Exhibit 32.1
CERTIFICATION PURSUANT TO 18 U.S.C. SECTION 1350,AS ADOPTED PURSUANT TO SECTION 906 OF THE SARBANES-OXLEY ACT OF 2002
The certification set forth below is being submitted in connection with the annual report on Form 10-K of Verisk Analytics, Inc. (the “Company”) for the
year ending December 31, 2021, as filed with the Securities and Exchange Commission (the “Report”), for the purpose of complying with Rule 13a-14(b) orRule 15d-14(b) of the Securities Exchange Act of 1934 (the “Exchange Act”) and Section 1350 of Chapter 63 of Title 18 of the United States Code.
Scott G. Stephenson, the Chief Executive Officer of the Company, and Lee M. Shavel, the Chief Financial Officer of the Company, each hereby certifies
that, to the best of his knowledge: 1. the Report fully complies with the requirements of Section 13(a) or 15(d) of the Exchange Act; and 2. the information contained in the Report fairly presents, in all material respects, the financial condition and results of operations of the Company.
/s/ Scott G. Stephenson Scott G. Stephenson President and Chief Executive Officer /s/ Lee M. Shavel Lee M. Shavel Chief Financial Officer and Group PresidentDate: February 22, 2022