Predictive Analytics in Life Insurance
38
Predictive Analytics in Life Insurance ACLI Annual Conference Sam Nandi, FSA, MAAA October 9, 2017
-
Upload
khangminh22 -
Category
Documents
-
view
1 -
download
0
Transcript of Predictive Analytics in Life Insurance

Predictive Analytics in Life Insurance
ACLI Annual ConferenceSam Nandi, FSA, MAAA
October 9, 2017

Predictive Analytics and Big Data
Actuaries have been analyzing data and making predictions for centuries…. so what’s new?
Availability of Data
Computational Power
New Approaches to Analyzing
Data
Technology to Automate Processes
Cultural Shifts
2

DATA!
Without data, nothing is possible!Companies need to:
Capture Digitize Organize
Acquire Cultivate a Data Culture
Store and Manage
3

Direct Mail
Web sites
CRM/Sales
Data management platforms used across different industries
Marketing Data
Activation
ID Demos Media Sales1
2
3
DMP
Client DataR
each
Res
on.
Rea
ctio
n
TV, Mobile, OOH, Radio
Brand metrics, segmentationMMM, household sales data
ROI Measurement & Optimization
Analysis
Calibration
Hygiene
Dis
play
Vide
oM
obile
Sea
rch
Pers
onal
izat
ion
3rd Party Data
Experian, Acxiom, etc
TV
MTA
Seg
men
tatio
n &
Tar
getin
g

Life Insurance Data Enrichment and Organization Framework
Underwriting
5

Life Insurance Applications
We have observed companies use Predictive Analytics for the following:
Predictive UnderwritingSales/MarketingCustomer segmentationCross and up-sellingPropensity to buyLead generationRetention/Proactive Lapse
Management
Fraud DetectionDistribution ManagementAssumption SettingCustomer Value Analysis
6

Assumption Setting Example: VALUES Industry Utilization Study 2016 Study covered 7 companies, 2 million policies,
$200bn AV
Studied both timing of first WB withdrawal and amount of withdrawals relative to MAWA using experience data from 2007 to 2015
Impact of drivers and predicted behavior are analyzed by applying advanced statistical modeling.
Study showed that policyholders who are older at issue tend to utilize their policies sooner
Policyholders with rollup feature wait longer to utilize the GLWB.
Less than half of all policyholders currently taking GLWB withdrawals utilize their GLWB benefit with 100% efficiency.
7

VA Data Enrichment Study (1)
1. Enrich with external data 2. Use analytical tools to develop customer segmentation
8

VA Data Enrichment Study (2)
3. Use Predictive Modeling to develop distinct behavioral profiles
4. Visualize results of customer profitability individually and by segment
9

VA Data Enrichment Study (3)
Potential applications Retrospective pricing review
Distribution strategy
Targeted retention and buyout
Targeted M&A
Product strategy
Improvement of assumptions for reserving, capital, hedging
10

Product Development Example: Vitality
Vitality is a leading company in integrating wellness benefits in life insurance products, and has partnered to launch life insurance products in different countries
John Hancock has launched a UL product in partnership with Vitality
Customers accumulate points and rewards for maintaining a healthy lifestyle (diet, exercise, health screenings)
Points status is used to determine discounts for each year’s premium
The product proposition is empowered by Predictive Analytics and new data Steady stream of data is captured from customer Historical dataset used to analyze impact of various lifestyle indicators on mortality
rates Presented as a win-win proposition to customer Data from customer can be used for other purposes (cross-sell/up-sell)
11

Predictive Modelingwith Prescription Histories
ACLI Annual Conference
Eric Carlson, FSA, MAAAOctober 9, 2017

Agenda
Proprietary and Confidential for Client. Not for distribution.
Milliman IntelliScript
Big Data and Underwriting
Big Data from an Rx Perspective
Predictive Modeling using Rx
Case Studies
13

IntelliScript History
2005Acquired by Milliman
3 clients / 3 employees
2001Founded as IntelRx
2010GRx launched
2009RxRules launched
20081 million
transactions processed
2017200 clients / 70 employees
Medical Data launched
20168 million
transactions processed
Risk Score launched
2014PopulationRx
launched
14

Why is Big Data important?
Electronic requirements (Rx, MIB, MVR, Medical, Credit …)
Decision engines driven by data
Predictive Models
Automation
Increasing
APS, Labs
Cycle times
Costs
Decreasing
Better Customer Experience
The Future of Underwriting…
15

Big Data – Milliman Perspective
2015Milliman mortality study 53M exposure years 13M lives 231,000 deaths Created Milliman Risk Score
Health Plan
PBM
Clearing House
RetailPharmacy
Access (with authorization) to Rx Histories on more than
200 million Americans.
Milliman has accumulated a large Rx and mortality data set.
16

Rx Histories
1 PrescriptionBrand and generic name | Dosage and quantity | Date of fill
2 PhysicianSpecialty | Contact information
3 PharmacyContact information
4 Dates of eligibilityWith or without prescriptions
5 Underwriting significance indicatorRed, yellow, green
17

RxRules interprets big data.
RxRulesData Input Rx data Application data MIB / MVR Medical data
UW Guidance Conditions Severity Decisions
Rule Variables Indication / Therapeutic class Drug combinations Fill timing(date or duration ranges) Fill counts / patterns Dosage / quantity Physician specialty / count Gender / Age Other variables
18

RxRules – Timing and Duration Matter
Corticosteroids are very common among insurance applicants
Corticosteroids105% relative mortality
Low Frequency / Duration
99%
High Frequency / Duration
201%
19

RxRules – Dosage Matters
Trazodone147% relative mortality
Low Dose
132%
High Dose
224%
20

RxRules – Drug Combinations Matter
Spironolactone209% relative mortality
Thiazide Diuretics (102%)
Ace / Angio II (ARBS) (116%)
Beta Blocker (122%)
With 2 out of 3 of:
328%
Thiazide Diuretics (102%)
Ace / Angio II (ARBS) (116%)
Beta Blocker (122%)
Without 2 out of 3 of:
166%
21

RxRules – Morphine Equivalence Matters
* MED = Morphine equivalent dosage
Opioids156% relative mortality
Low MED*
135%
High MED*
322%
22

Predictive Modeling: Milliman Risk Score
RxRules-driven Predictive Model
Predicts relative mortality of a life or group of lives
Multi-variate Rx based score
23

The Milliman Risk Score is built on RxRules.
Milliman Risk Score
250,000NDC codes
7,500GPI codes
Hundreds of RxRules
1.27
24

Milliman’s Risk Score effectively predicts mortality.
25

What’s so great about this predictive model?
Evidence based and data driven
Stratify risk within a given medical condition
Detect unintuitive patterns
Quickly and consistently interpret large amounts of data
Relatively easy to test, implement, use, and update
26

Risk Score stratifies platelet inhibitor risk.
0%
50%
100%
150%
200%
250%
300%
350%
400%
0
15,000
30,000
45,000
60,000
75,000
90,000
105,000
120,000
x < 1 1 ≤ x < 1.5 1.5 ≤ x < 2 2 ≤ x
Risk Score Range
Very Serious Platelet Inhibitor (Plavix)
Lives
Relative Mortality
27

Risk Score stratifies insulin risk.
0%
50%
100%
150%
200%
250%
300%
350%
400%
450%
0
5,000
10,000
15,000
20,000
25,000
30,000
35,000
40,000
45,000
50,000
x < 1 1 ≤ x < 1.5 1.5 ≤ x < 2 2 ≤ x
Risk Score Range
Diabetes Third Line with Insulin
Lives
Relative Mortality
28
Predictive Model Applications
1 Individual Underwriting
2 Group Underwriting
3 Inforce Analysis
4 Market Segmentation
5 Pension Risk Transfer
29

SI Case Study Background
Mostly auto-decision via RxRules
Risk Score as of time of underwriting
Have deaths on issued and declined cases
30

0
2,000
4,000
6,000
8,000
10,000
12,000
14,000
16,000
0.2 0.4 0.6 0.8 1.0 1.2 1.4 1.6 1.8 2.0 2.2 2.4 2.6 2.8 3.0 3.2 3.4 3.6 3.8 > 4.0
# of Lives
Risk Score
Risk Score Distribution by UW DecisionSI Case Study #1 ‐ Hits Only
Lives ‐ Issue Lives ‐ Decline
SI Case Study #1 – Distribution of Lives
Issue
Decline
Average Score (Hits Only)
Issue 0.96
Decline 1.52
31

0%
100%
200%
300%
400%
500%
600%
0.00 ≤ x < 1.00 1.00 ≤ x < 1.50 1.50 ≤ x < 2.00 2.00 ≤ x < 3.00 3.00 ≤ x
Relativ
e Mortality
Risk Score Range
Relative Mortality by Risk Score and UW DecisionSI Case Study #1 ‐ (Hits Only)
Issue Decline
SI Case Study #1 - Relative Mortality
Decline
Issue
32

0
2,000
4,000
6,000
8,000
10,000
12,000
14,000
16,000
0.2 0.4 0.6 0.8 1.0 1.2 1.4 1.6 1.8 2.0 2.2 2.4 2.6 2.8 3.0 3.2 3.4 3.6 3.8 > 4.0
# of Lives
Risk Score
Lives ‐ Issue Lives ‐ Decline
Thresholds can be adjusted to achieve desired business results.
Low ThresholdHigh Threshold
33

Some issued premium now gets declined
Equal amount of declined premium now gets issued
Set Risk Score threshold to issue the same amount of business.
02,0004,0006,0008,000
10,00012,00014,00016,00018,000
0.4 0.6 0.8 1.0 1.2 1.4 1.6 1.8 2.0 2.2 2.4 2.6 2.8 3.0 3.2 3.4 3.6 3.8 > 4.0
# of
App
sNew Issues New Declines
02,0004,0006,0008,000
10,00012,00014,00016,00018,000
0.4 0.6 0.8 1.0 1.2 1.4 1.6 1.8 2.0 2.2 2.4 2.6 2.8 3.0 3.2 3.4 3.6 3.8 > 4.0
# of
App
sNew Issues New Declines
02,0004,0006,0008,000
10,00012,00014,00016,00018,000
0.4 0.6 0.8 1.0 1.2 1.4 1.6 1.8 2.0 2.2 2.4 2.6 2.8 3.0 3.2 3.4 3.6 3.8 > 4.0
# of
App
sLives - Issue Lives - Decline
Threshold
83%
Before Risk Score
75%
After Risk Score
Issued Cases Relative A/ESame amount of business issued
$4 Million increase in profit
9% Mortality improvement
34

Set Risk Score threshold to maintain the same mortality A/E.
Some issued premium now gets declined
More declined premium now gets issued
02,0004,0006,0008,000
10,00012,00014,00016,00018,000
0.4 0.6 0.8 1.0 1.2 1.4 1.6 1.8 2.0 2.2 2.4 2.6 2.8 3.0 3.2 3.4 3.6 3.8 > 4.0#
of A
pps
New Issues New Declines
02,0004,0006,0008,000
10,00012,00014,00016,00018,000
0.4 0.6 0.8 1.0 1.2 1.4 1.6 1.8 2.0 2.2 2.4 2.6 2.8 3.0 3.2 3.4 3.6 3.8 > 4.0#
of A
pps
New Issues New Declines
02,0004,0006,0008,000
10,00012,00014,00016,00018,000
0.4 0.6 0.8 1.0 1.2 1.4 1.6 1.8 2.0 2.2 2.4 2.6 2.8 3.0 3.2 3.4 3.6 3.8 > 4.0#
of A
pps
Lives - Issue Lives - Decline
Threshold
$56.1 M
Before Risk Score
$66.0 M
After Risk Score
Premium IssuedSame mortality A/E
$2.9 Million increase in profit
18% More issued business
35
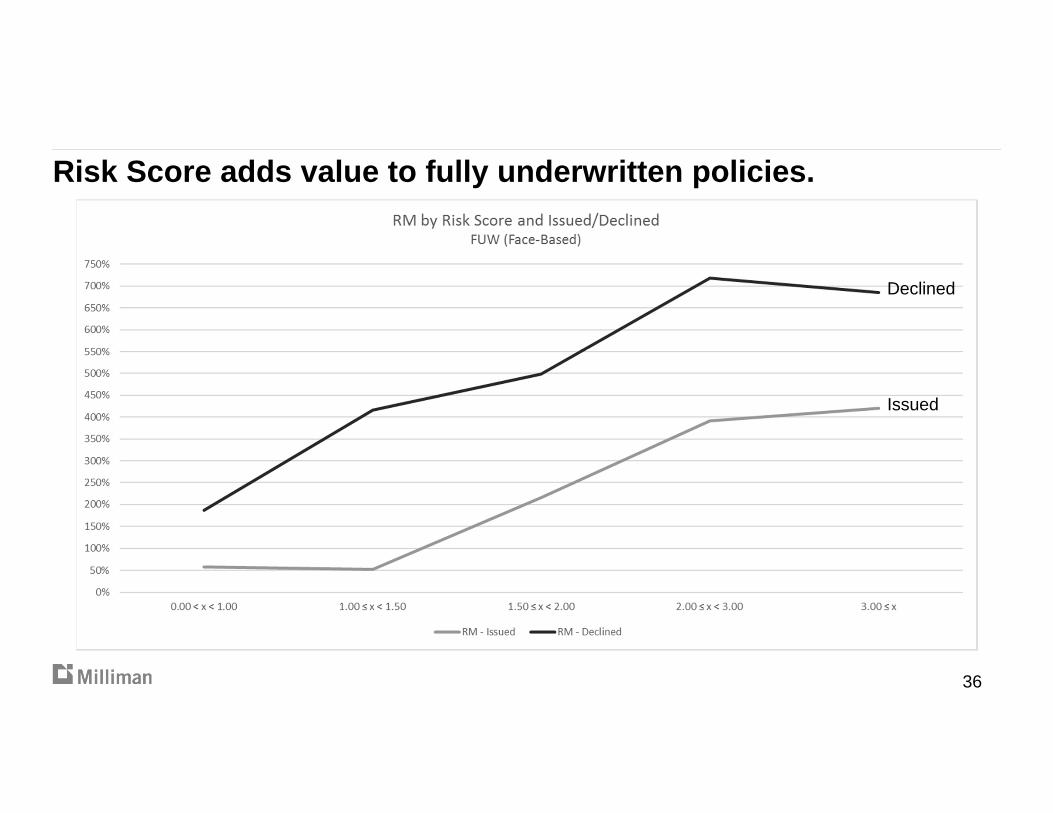
Risk Score adds value to fully underwritten policies.
Issued
Declined
36

Questions?

Thank you
Eric Carlson, Life [email protected] | 262-641-3537
Sam Nandi, Principal and Consulting [email protected] | 312-499-5652