Secure Network Analytics Default Application Definitions - Cisco
Upload
khangminh22Category
view
2download
0
Juniper Secure Analytics Administration Guide
Release
2014.8
Modified: 2018-01-24
Copyright © 2018, Juniper Networks, Inc.

Juniper Networks, Inc.1133 InnovationWaySunnyvale, California 94089USA408-745-2000www.juniper.net
Juniper Networks, the Juniper Networks logo, Juniper, and Junos are registered trademarks of Juniper Networks, Inc. and/or its affiliates inthe United States and other countries. All other trademarks may be property of their respective owners.
Juniper Networks assumes no responsibility for any inaccuracies in this document. Juniper Networks reserves the right to change, modify,transfer, or otherwise revise this publication without notice.
Juniper Secure Analytics Administration Guide2014.8Copyright © 2018 Juniper Networks, Inc. All rights reserved.
The information in this document is current as of the date on the title page.
YEAR 2000 NOTICE
Juniper Networks hardware and software products are Year 2000 compliant. Junos OS has no known time-related limitations through theyear 2038. However, the NTP application is known to have some difficulty in the year 2036.
ENDUSER LICENSE AGREEMENT
The Juniper Networks product that is the subject of this technical documentation consists of (or is intended for use with) Juniper Networkssoftware. Use of such software is subject to the terms and conditions of the End User License Agreement (“EULA”) posted athttp://www.juniper.net/support/eula/. By downloading, installing or using such software, you agree to the terms and conditions of thatEULA.
Copyright © 2018, Juniper Networks, Inc.ii

Table of Contents
About the Documentation . . . . . . . . . . . . . . . . . . . . . . . . . . . . . . . . . . . . . . . . . . . . xxi
Documentation and Release Notes . . . . . . . . . . . . . . . . . . . . . . . . . . . . . . . . . xxi
Documentation Conventions . . . . . . . . . . . . . . . . . . . . . . . . . . . . . . . . . . . . . . xxi
Documentation Feedback . . . . . . . . . . . . . . . . . . . . . . . . . . . . . . . . . . . . . . . xxiii
Requesting Technical Support . . . . . . . . . . . . . . . . . . . . . . . . . . . . . . . . . . . . xxiv
Self-Help Online Tools and Resources . . . . . . . . . . . . . . . . . . . . . . . . . . xxiv
Opening a Case with JTAC . . . . . . . . . . . . . . . . . . . . . . . . . . . . . . . . . . . . xxiv
Chapter 1 What's New for Administrators in JSA 2014.8 . . . . . . . . . . . . . . . . . . . . . . . . . 27
What's New for Administrators in JSA 2014.8 . . . . . . . . . . . . . . . . . . . . . . . . . . . . . 27
Manage Expensive Searches by Setting Resource Restrictions . . . . . . . . . . . 27
Data Segregation . . . . . . . . . . . . . . . . . . . . . . . . . . . . . . . . . . . . . . . . . . . . . . . . 27
Juniper X-Force Threat Intelligence Feed is Included with All Standard
Deployments . . . . . . . . . . . . . . . . . . . . . . . . . . . . . . . . . . . . . . . . . . . . . . . 28
Simplified Data Ingestion . . . . . . . . . . . . . . . . . . . . . . . . . . . . . . . . . . . . . . . . . 28
Delete or Reassign Content When You Delete Users . . . . . . . . . . . . . . . . . . . . 28
Chapter 2 Overview Of JSA Administration . . . . . . . . . . . . . . . . . . . . . . . . . . . . . . . . . . . . 29
Overview Of JSA Administration . . . . . . . . . . . . . . . . . . . . . . . . . . . . . . . . . . . . . . . 29
Capabilities in Your Security Intelligence Product . . . . . . . . . . . . . . . . . . . . . . . . . 29
Supported Web Browsers . . . . . . . . . . . . . . . . . . . . . . . . . . . . . . . . . . . . . . . . . . . . . 31
Admin Tab Overview . . . . . . . . . . . . . . . . . . . . . . . . . . . . . . . . . . . . . . . . . . . . . . . . . 31
Deploying Changes . . . . . . . . . . . . . . . . . . . . . . . . . . . . . . . . . . . . . . . . . . . . . . . . . . 32
Updating User Details . . . . . . . . . . . . . . . . . . . . . . . . . . . . . . . . . . . . . . . . . . . . . . . 33
Resetting SIM . . . . . . . . . . . . . . . . . . . . . . . . . . . . . . . . . . . . . . . . . . . . . . . . . . . . . . 34
Monitoring Systems with SNMP . . . . . . . . . . . . . . . . . . . . . . . . . . . . . . . . . . . . . . . 35
Managing Aggregated Data Views . . . . . . . . . . . . . . . . . . . . . . . . . . . . . . . . . . . . . 35
Accessing a GLOBALVIEW Database . . . . . . . . . . . . . . . . . . . . . . . . . . . . . . . . . . . 36
RESTful API . . . . . . . . . . . . . . . . . . . . . . . . . . . . . . . . . . . . . . . . . . . . . . . . . . . . . . . . 37
Access and User Role Permissions . . . . . . . . . . . . . . . . . . . . . . . . . . . . . . . . . . 37
Access to the REST API Technical Documentation User Interface . . . . . . . . . 37
Adding Custom Actions . . . . . . . . . . . . . . . . . . . . . . . . . . . . . . . . . . . . . . . . . . . . . . 39
Testing Your Custom Action . . . . . . . . . . . . . . . . . . . . . . . . . . . . . . . . . . . . . . . . . . 40
Chapter 3 User Management . . . . . . . . . . . . . . . . . . . . . . . . . . . . . . . . . . . . . . . . . . . . . . . . . 41
User Management . . . . . . . . . . . . . . . . . . . . . . . . . . . . . . . . . . . . . . . . . . . . . . . . . . 41
User Roles . . . . . . . . . . . . . . . . . . . . . . . . . . . . . . . . . . . . . . . . . . . . . . . . . . . . . . . . . 41
Creating a User Role . . . . . . . . . . . . . . . . . . . . . . . . . . . . . . . . . . . . . . . . . . . . . 41
Editing a User Role . . . . . . . . . . . . . . . . . . . . . . . . . . . . . . . . . . . . . . . . . . . . . . 42
Deleting a User Role . . . . . . . . . . . . . . . . . . . . . . . . . . . . . . . . . . . . . . . . . . . . . 43
iiiCopyright © 2018, Juniper Networks, Inc.

Security Profiles . . . . . . . . . . . . . . . . . . . . . . . . . . . . . . . . . . . . . . . . . . . . . . . . . . . . 44
Domains . . . . . . . . . . . . . . . . . . . . . . . . . . . . . . . . . . . . . . . . . . . . . . . . . . . . . . 44
Permission Precedence . . . . . . . . . . . . . . . . . . . . . . . . . . . . . . . . . . . . . . . . . . 45
Permission Precedence for Offense Data . . . . . . . . . . . . . . . . . . . . . . . . . 45
Creating a Security Profile . . . . . . . . . . . . . . . . . . . . . . . . . . . . . . . . . . . . . . . . 45
Editing a Security Profile . . . . . . . . . . . . . . . . . . . . . . . . . . . . . . . . . . . . . . . . . . 47
Duplicating a Security Profile . . . . . . . . . . . . . . . . . . . . . . . . . . . . . . . . . . . . . . 48
Deleting a Security Profile . . . . . . . . . . . . . . . . . . . . . . . . . . . . . . . . . . . . . . . . 48
User Accounts . . . . . . . . . . . . . . . . . . . . . . . . . . . . . . . . . . . . . . . . . . . . . . . . . . . . . 49
Creating a User Account . . . . . . . . . . . . . . . . . . . . . . . . . . . . . . . . . . . . . . . . . . 49
Deleting a User Account . . . . . . . . . . . . . . . . . . . . . . . . . . . . . . . . . . . . . . . . . . 50
User Authentication . . . . . . . . . . . . . . . . . . . . . . . . . . . . . . . . . . . . . . . . . . . . . . . . . 51
Prerequisite Checklist for External Authentication Providers . . . . . . . . . . . . . 52
External Authentication Guidelines for Administrative Users . . . . . . . . . . . . . 52
Configuring System Authentication . . . . . . . . . . . . . . . . . . . . . . . . . . . . . . . . . 53
LDAP Authentication . . . . . . . . . . . . . . . . . . . . . . . . . . . . . . . . . . . . . . . . . . . . 53
Configuring LDAP Authentication . . . . . . . . . . . . . . . . . . . . . . . . . . . . . . . 53
Synchronizing Data with an LDAP Server . . . . . . . . . . . . . . . . . . . . . . . . . 55
Configuring SSL or TLS Certificates . . . . . . . . . . . . . . . . . . . . . . . . . . . . . 55
Displaying Hover Text for LDAP Information . . . . . . . . . . . . . . . . . . . . . . 56
Multiple LDAP Repositories . . . . . . . . . . . . . . . . . . . . . . . . . . . . . . . . . . . . 57
Example: Least Privileged Access Configuration and Set Up . . . . . . . . . . 57
Resource Restrictions . . . . . . . . . . . . . . . . . . . . . . . . . . . . . . . . . . . . . . . . . . . . . . . 58
Types Of Resource Restrictions . . . . . . . . . . . . . . . . . . . . . . . . . . . . . . . . . . . . 59
User-based Restrictions . . . . . . . . . . . . . . . . . . . . . . . . . . . . . . . . . . . . . . 59
Role-based Restrictions . . . . . . . . . . . . . . . . . . . . . . . . . . . . . . . . . . . . . . 59
Tenant-based Restrictions . . . . . . . . . . . . . . . . . . . . . . . . . . . . . . . . . . . . 60
Resource Restrictions in Distributed Environments . . . . . . . . . . . . . . . . . . . . 60
Configuring Resource Restrictions . . . . . . . . . . . . . . . . . . . . . . . . . . . . . . . . . . 61
Chapter 4 System and Licenses Management . . . . . . . . . . . . . . . . . . . . . . . . . . . . . . . . . . 63
System and Licenses Management . . . . . . . . . . . . . . . . . . . . . . . . . . . . . . . . . . . . 63
System and License Management Overview . . . . . . . . . . . . . . . . . . . . . . . . . . . . . 63
License Management Checklist . . . . . . . . . . . . . . . . . . . . . . . . . . . . . . . . . . . . . . . 65
Uploading a License Key . . . . . . . . . . . . . . . . . . . . . . . . . . . . . . . . . . . . . . . . . 66
Allocating a License to a System . . . . . . . . . . . . . . . . . . . . . . . . . . . . . . . . . . . 67
Reverting an Allocation . . . . . . . . . . . . . . . . . . . . . . . . . . . . . . . . . . . . . . . . . . 68
Viewing License Details . . . . . . . . . . . . . . . . . . . . . . . . . . . . . . . . . . . . . . . . . . 68
Exporting a License . . . . . . . . . . . . . . . . . . . . . . . . . . . . . . . . . . . . . . . . . . . . . 69
System Management . . . . . . . . . . . . . . . . . . . . . . . . . . . . . . . . . . . . . . . . . . . . . . . . 70
Viewing System and License Details . . . . . . . . . . . . . . . . . . . . . . . . . . . . . . . . 70
Allocating a License to a System . . . . . . . . . . . . . . . . . . . . . . . . . . . . . . . . . . . 72
Restarting a System . . . . . . . . . . . . . . . . . . . . . . . . . . . . . . . . . . . . . . . . . . . . . 72
Shutting Down a System . . . . . . . . . . . . . . . . . . . . . . . . . . . . . . . . . . . . . . . . . 73
Exporting System Details . . . . . . . . . . . . . . . . . . . . . . . . . . . . . . . . . . . . . . . . . 73
Collecting Log Files . . . . . . . . . . . . . . . . . . . . . . . . . . . . . . . . . . . . . . . . . . . . . . 74
Checking the Integrity Of Event and Flow Logs . . . . . . . . . . . . . . . . . . . . . . . . 74
Bandwidth Considerations for Managed Hosts . . . . . . . . . . . . . . . . . . . . . . . . 76
Deploying Managed Hosts and Components After Installation . . . . . . . . . . . 76
Copyright © 2018, Juniper Networks, Inc.iv
Juniper Secure Analytics Administration Guide

System Information Configuration . . . . . . . . . . . . . . . . . . . . . . . . . . . . . . . . . . . . . . 77
Network Interface Management . . . . . . . . . . . . . . . . . . . . . . . . . . . . . . . . . . . 78
What Can You Use Extra Network Interfaces For? . . . . . . . . . . . . . . . . . . 78
Configuring Management Network Interfaces . . . . . . . . . . . . . . . . . . . . . 78
Configuring Network Interfaces . . . . . . . . . . . . . . . . . . . . . . . . . . . . . . . . . . . . 78
Configuring Your Local Firewall . . . . . . . . . . . . . . . . . . . . . . . . . . . . . . . . . . . . 79
Configuring Email . . . . . . . . . . . . . . . . . . . . . . . . . . . . . . . . . . . . . . . . . . . . . . . 80
Changing the Root Password on Your JSA Console . . . . . . . . . . . . . . . . . . . . . 81
Chapter 5 JSA System Time Configuration . . . . . . . . . . . . . . . . . . . . . . . . . . . . . . . . . . . . . 83
JSA System Time Configuration . . . . . . . . . . . . . . . . . . . . . . . . . . . . . . . . . . . . . . . 83
Problems Caused by Mismatched Time Zones . . . . . . . . . . . . . . . . . . . . . . . . 83
Configuring System Time Manually . . . . . . . . . . . . . . . . . . . . . . . . . . . . . . . . . . . . 84
Configuring an NTP Server to Maintain System Time . . . . . . . . . . . . . . . . . . . . . . 85
Chapter 6 User Information Source Configuration . . . . . . . . . . . . . . . . . . . . . . . . . . . . . . 87
User Information Source Configuration . . . . . . . . . . . . . . . . . . . . . . . . . . . . . . . . . . 87
User Information Source Overview . . . . . . . . . . . . . . . . . . . . . . . . . . . . . . . . . . . . . 87
User Information Sources . . . . . . . . . . . . . . . . . . . . . . . . . . . . . . . . . . . . . . . . . 88
Reference Data Collections for User Information . . . . . . . . . . . . . . . . . . . . . . 88
IntegrationWorkflow Example . . . . . . . . . . . . . . . . . . . . . . . . . . . . . . . . . . . . . 89
User Information Source Configuration and Management Task
Overview . . . . . . . . . . . . . . . . . . . . . . . . . . . . . . . . . . . . . . . . . . . . . . . . . . 89
Configuring the Tivoli Directory Integrator Server . . . . . . . . . . . . . . . . . . . . . . . . . . 89
Creating and Managing User Information Source . . . . . . . . . . . . . . . . . . . . . . . . . . 92
Creating a User Information Source . . . . . . . . . . . . . . . . . . . . . . . . . . . . . . . . . 93
Retrieving User Information Sources . . . . . . . . . . . . . . . . . . . . . . . . . . . . . . . . 93
Editing a User Information Source . . . . . . . . . . . . . . . . . . . . . . . . . . . . . . . . . . 94
Deleting a User Information Source . . . . . . . . . . . . . . . . . . . . . . . . . . . . . . . . . 94
Collecting User Information . . . . . . . . . . . . . . . . . . . . . . . . . . . . . . . . . . . . . . . . . . . 94
Chapter 7 Set Up JSA . . . . . . . . . . . . . . . . . . . . . . . . . . . . . . . . . . . . . . . . . . . . . . . . . . . . . . . 97
Set Up JSA . . . . . . . . . . . . . . . . . . . . . . . . . . . . . . . . . . . . . . . . . . . . . . . . . . . . . . . . 97
Network Hierarchy . . . . . . . . . . . . . . . . . . . . . . . . . . . . . . . . . . . . . . . . . . . . . . . . . . 97
Acceptable CIDR Values . . . . . . . . . . . . . . . . . . . . . . . . . . . . . . . . . . . . . . . . . . 99
Defining Your Network Hierarchy . . . . . . . . . . . . . . . . . . . . . . . . . . . . . . . . . . . 101
Automatic Updates . . . . . . . . . . . . . . . . . . . . . . . . . . . . . . . . . . . . . . . . . . . . . . . . 102
Automatic Update Requirements . . . . . . . . . . . . . . . . . . . . . . . . . . . . . . . . . . 103
Description Of Updates . . . . . . . . . . . . . . . . . . . . . . . . . . . . . . . . . . . . . . . . . . 103
Automatic Updates for High Availability Deployments . . . . . . . . . . . . . . . . . 103
Frequency Of Automatic Updates for New Installations and Upgrades . . . . 103
Viewing Pending Updates . . . . . . . . . . . . . . . . . . . . . . . . . . . . . . . . . . . . . . . . 104
Configuring Automatic Update Settings . . . . . . . . . . . . . . . . . . . . . . . . . . . . 105
Configuring Updates Behind a Proxy Server That Uses SSL or TLS
Interception . . . . . . . . . . . . . . . . . . . . . . . . . . . . . . . . . . . . . . . . . . . . . . . . 107
Scheduling an Update . . . . . . . . . . . . . . . . . . . . . . . . . . . . . . . . . . . . . . . . . . . 107
Clearing Scheduled Updates . . . . . . . . . . . . . . . . . . . . . . . . . . . . . . . . . . . . . . 107
Checking for New Updates . . . . . . . . . . . . . . . . . . . . . . . . . . . . . . . . . . . . . . . 108
Manually Installing Automatic Updates . . . . . . . . . . . . . . . . . . . . . . . . . . . . . 108
Viewing Your Update History . . . . . . . . . . . . . . . . . . . . . . . . . . . . . . . . . . . . . 109
vCopyright © 2018, Juniper Networks, Inc.
Table of Contents

Restoring Hidden Updates . . . . . . . . . . . . . . . . . . . . . . . . . . . . . . . . . . . . . . . 109
Viewing the Autoupdate Log . . . . . . . . . . . . . . . . . . . . . . . . . . . . . . . . . . . . . . 110
Set Up a JSA Update Server . . . . . . . . . . . . . . . . . . . . . . . . . . . . . . . . . . . . . . . . . . 110
Configuring Your Update Server . . . . . . . . . . . . . . . . . . . . . . . . . . . . . . . . . . . 110
Configuring Your JSA Console As the Update Server . . . . . . . . . . . . . . . . . . . 112
Adding New Updates . . . . . . . . . . . . . . . . . . . . . . . . . . . . . . . . . . . . . . . . . . . . 113
Configuring System Settings . . . . . . . . . . . . . . . . . . . . . . . . . . . . . . . . . . . . . . . . . . 114
Customizing the Right-click Menu . . . . . . . . . . . . . . . . . . . . . . . . . . . . . . . . . . 115
Enhancing the Right-click Menu for Event and Flow Columns . . . . . . . . . . . . 116
Asset Retention Values Overview . . . . . . . . . . . . . . . . . . . . . . . . . . . . . . . . . . 118
Creating JSA Login Message File . . . . . . . . . . . . . . . . . . . . . . . . . . . . . . . . . . . 119
Configuring Your IF-MAP Server Certificates . . . . . . . . . . . . . . . . . . . . . . . . . . . . . 120
Configuring IF-MAP Server Certificate for Basic Authentication . . . . . . . . . . 120
Configuring IF-MAP Server Certificate for Mutual Authentication . . . . . . . . . 121
SSL Certificate Replacement in JSA Products . . . . . . . . . . . . . . . . . . . . . . . . . . . . 122
SSL Certificates Overview . . . . . . . . . . . . . . . . . . . . . . . . . . . . . . . . . . . . . . . . 122
Trusted Root . . . . . . . . . . . . . . . . . . . . . . . . . . . . . . . . . . . . . . . . . . . . . . . . . . . 122
SSL Connections Between JSA Components . . . . . . . . . . . . . . . . . . . . . . . . . 122
Creating an SSL Certificate Request with 1024-bit and 2048-bit RSA
Keys . . . . . . . . . . . . . . . . . . . . . . . . . . . . . . . . . . . . . . . . . . . . . . . . . . . . . . 122
Replacing the Default SSL Certificate . . . . . . . . . . . . . . . . . . . . . . . . . . . . . . . 124
Generating a Private/public RSA Key Pair . . . . . . . . . . . . . . . . . . . . . . . . . . . . 124
IPv6 Addressing in JSA Deployments . . . . . . . . . . . . . . . . . . . . . . . . . . . . . . . . . . . 125
JSA Components That Support IPv6 Addressing . . . . . . . . . . . . . . . . . . . . . . 126
Deploying JSA in IPv6 Environment . . . . . . . . . . . . . . . . . . . . . . . . . . . . . . . . 126
IPv6 Addressing Limitations . . . . . . . . . . . . . . . . . . . . . . . . . . . . . . . . . . . . . . 127
Data Retention . . . . . . . . . . . . . . . . . . . . . . . . . . . . . . . . . . . . . . . . . . . . . . . . . . . . 127
Tenant Data . . . . . . . . . . . . . . . . . . . . . . . . . . . . . . . . . . . . . . . . . . . . . . . . . . . 128
Configuring Retention Buckets . . . . . . . . . . . . . . . . . . . . . . . . . . . . . . . . . . . . 128
Managing Retention Bucket Sequence . . . . . . . . . . . . . . . . . . . . . . . . . . . . . . 129
Enabling and Disabling a Retention Bucket . . . . . . . . . . . . . . . . . . . . . . . . . . 130
Deleting a Retention Bucket . . . . . . . . . . . . . . . . . . . . . . . . . . . . . . . . . . . . . . 130
Configuring System Notifications . . . . . . . . . . . . . . . . . . . . . . . . . . . . . . . . . . . . . . 131
Configuring Custom Email Notifications . . . . . . . . . . . . . . . . . . . . . . . . . . . . . 133
Custom Offense Close Reasons . . . . . . . . . . . . . . . . . . . . . . . . . . . . . . . . . . . . . . . 136
Adding a Custom Offense Close Reason . . . . . . . . . . . . . . . . . . . . . . . . . . . . 137
Editing Custom Offense Close Reason . . . . . . . . . . . . . . . . . . . . . . . . . . . . . . 137
Deleting a Custom Offense Close Reason . . . . . . . . . . . . . . . . . . . . . . . . . . . 138
Configuring a Custom Asset Property . . . . . . . . . . . . . . . . . . . . . . . . . . . . . . . . . . 138
Index Management . . . . . . . . . . . . . . . . . . . . . . . . . . . . . . . . . . . . . . . . . . . . . . . . . 139
Enabling Indexes . . . . . . . . . . . . . . . . . . . . . . . . . . . . . . . . . . . . . . . . . . . . . . . 140
Enabling Payload Indexing to Optimize Search Times . . . . . . . . . . . . . . . . . . 141
Configuring the Retention Period for Payload Indexes . . . . . . . . . . . . . . . . . . 142
Chapter 8 Juniper Networks X-Force Integration . . . . . . . . . . . . . . . . . . . . . . . . . . . . . . . 145
Juniper Networks X-Force Integration . . . . . . . . . . . . . . . . . . . . . . . . . . . . . . . . . . 145
Internet Threat Information Center Dashboard Widget . . . . . . . . . . . . . . . . . . . . 145
Updating X-Force Data in a Proxy Server . . . . . . . . . . . . . . . . . . . . . . . . . . . . . . . 146
Stop X-Force Data from Downloading Locally . . . . . . . . . . . . . . . . . . . . . . . . . . . 147
Copyright © 2018, Juniper Networks, Inc.vi
Juniper Secure Analytics Administration Guide

Chapter 9 Reference Sets Management . . . . . . . . . . . . . . . . . . . . . . . . . . . . . . . . . . . . . . 149
Reference Sets Management . . . . . . . . . . . . . . . . . . . . . . . . . . . . . . . . . . . . . . . . . 149
Adding a Reference Set . . . . . . . . . . . . . . . . . . . . . . . . . . . . . . . . . . . . . . . . . . . . . 149
Editing a Reference Set . . . . . . . . . . . . . . . . . . . . . . . . . . . . . . . . . . . . . . . . . . . . . . 151
Deleting Reference Sets . . . . . . . . . . . . . . . . . . . . . . . . . . . . . . . . . . . . . . . . . . . . . 152
Viewing the Contents Of a Reference Set . . . . . . . . . . . . . . . . . . . . . . . . . . . . . . . 152
Adding an Element to a Reference Set . . . . . . . . . . . . . . . . . . . . . . . . . . . . . . . . . 154
Deleting Elements from a Reference Set . . . . . . . . . . . . . . . . . . . . . . . . . . . . . . . . 155
Importing Elements Into a Reference Set . . . . . . . . . . . . . . . . . . . . . . . . . . . . . . . 155
Exporting Elements from a Reference Set . . . . . . . . . . . . . . . . . . . . . . . . . . . . . . . 156
Chapter 10 Manage Reference Data Collections . . . . . . . . . . . . . . . . . . . . . . . . . . . . . . . . 157
Manage Reference Data Collections . . . . . . . . . . . . . . . . . . . . . . . . . . . . . . . . . . . 157
Creating a Reference Data Collection by Using the Command Line Interface . . . 157
Creating a Reference Data Collection by Using the API Documentation
Interface . . . . . . . . . . . . . . . . . . . . . . . . . . . . . . . . . . . . . . . . . . . . . . . . . . . . . . 158
Chapter 11 Managing Authorized Services . . . . . . . . . . . . . . . . . . . . . . . . . . . . . . . . . . . . . 163
Managing Authorized Services . . . . . . . . . . . . . . . . . . . . . . . . . . . . . . . . . . . . . . . . 163
Viewing Authorized Services . . . . . . . . . . . . . . . . . . . . . . . . . . . . . . . . . . . . . . . . . 164
Adding an Authorized Service . . . . . . . . . . . . . . . . . . . . . . . . . . . . . . . . . . . . . . . . 164
Revoking Authorized Services . . . . . . . . . . . . . . . . . . . . . . . . . . . . . . . . . . . . . . . . 165
Chapter 12 Manage Backup and Recovery . . . . . . . . . . . . . . . . . . . . . . . . . . . . . . . . . . . . . 167
Manage Backup and Recovery . . . . . . . . . . . . . . . . . . . . . . . . . . . . . . . . . . . . . . . . 167
Backup Archive Management . . . . . . . . . . . . . . . . . . . . . . . . . . . . . . . . . . . . . . . . 168
Viewing Backup Archives . . . . . . . . . . . . . . . . . . . . . . . . . . . . . . . . . . . . . . . . 168
Importing a Backup Archive . . . . . . . . . . . . . . . . . . . . . . . . . . . . . . . . . . . . . . 168
Deleting a Backup Archive . . . . . . . . . . . . . . . . . . . . . . . . . . . . . . . . . . . . . . . 169
Backup Archive Creation . . . . . . . . . . . . . . . . . . . . . . . . . . . . . . . . . . . . . . . . . . . . 169
Scheduling Nightly Backup . . . . . . . . . . . . . . . . . . . . . . . . . . . . . . . . . . . . . . . 170
Creating an On-demand Configuration Backup Archive . . . . . . . . . . . . . . . . 172
Creating an Email Notification for a Failed Backup . . . . . . . . . . . . . . . . . . . . 172
Backup Archive Restoration . . . . . . . . . . . . . . . . . . . . . . . . . . . . . . . . . . . . . . . . . . 173
Restoring a Backup Archive . . . . . . . . . . . . . . . . . . . . . . . . . . . . . . . . . . . . . . . 174
Restoring a Backup Archive Created on a Different JSA System . . . . . . . . . . 176
Restoring Data . . . . . . . . . . . . . . . . . . . . . . . . . . . . . . . . . . . . . . . . . . . . . . . . . 178
Verifying Restored Data . . . . . . . . . . . . . . . . . . . . . . . . . . . . . . . . . . . . . . . . . 180
Chapter 13 Deployment Editor . . . . . . . . . . . . . . . . . . . . . . . . . . . . . . . . . . . . . . . . . . . . . . . 183
Deployment Editor . . . . . . . . . . . . . . . . . . . . . . . . . . . . . . . . . . . . . . . . . . . . . . . . . 183
Deployment Editor Requirements . . . . . . . . . . . . . . . . . . . . . . . . . . . . . . . . . . . . . 183
Deployment Editor Views . . . . . . . . . . . . . . . . . . . . . . . . . . . . . . . . . . . . . . . . . . . . 184
System View . . . . . . . . . . . . . . . . . . . . . . . . . . . . . . . . . . . . . . . . . . . . . . . . . . 184
Event View . . . . . . . . . . . . . . . . . . . . . . . . . . . . . . . . . . . . . . . . . . . . . . . . . . . . 185
Vulnerability View . . . . . . . . . . . . . . . . . . . . . . . . . . . . . . . . . . . . . . . . . . . . . . 185
Configuring Deployment Editor Preferences . . . . . . . . . . . . . . . . . . . . . . . . . 185
Building Your Deployment Using the Deployment Editor . . . . . . . . . . . . . . . . . . . 186
Generating Public Keys for JSA Products . . . . . . . . . . . . . . . . . . . . . . . . . . . . . . . . 187
viiCopyright © 2018, Juniper Networks, Inc.
Table of Contents

Event View Management . . . . . . . . . . . . . . . . . . . . . . . . . . . . . . . . . . . . . . . . . . . . 187
Building Your Event View . . . . . . . . . . . . . . . . . . . . . . . . . . . . . . . . . . . . . . . . . 187
Event Views Of JSA Components in Your Deployment . . . . . . . . . . . . . . . . . 188
JSA Flow Processor . . . . . . . . . . . . . . . . . . . . . . . . . . . . . . . . . . . . . . . . . 188
Event Collector . . . . . . . . . . . . . . . . . . . . . . . . . . . . . . . . . . . . . . . . . . . . . 188
Data Node . . . . . . . . . . . . . . . . . . . . . . . . . . . . . . . . . . . . . . . . . . . . . . . . 188
Off-site Source . . . . . . . . . . . . . . . . . . . . . . . . . . . . . . . . . . . . . . . . . . . . . 189
Off-site Target . . . . . . . . . . . . . . . . . . . . . . . . . . . . . . . . . . . . . . . . . . . . . 189
Magistrate . . . . . . . . . . . . . . . . . . . . . . . . . . . . . . . . . . . . . . . . . . . . . . . . 189
Adding Components . . . . . . . . . . . . . . . . . . . . . . . . . . . . . . . . . . . . . . . . . . . . 189
Connecting Components . . . . . . . . . . . . . . . . . . . . . . . . . . . . . . . . . . . . . . . . 190
Forwarding Normalized Events and Flows . . . . . . . . . . . . . . . . . . . . . . . . . . . 192
Renaming Components . . . . . . . . . . . . . . . . . . . . . . . . . . . . . . . . . . . . . . . . . 193
Viewing the Progress Of Data Rebalancing . . . . . . . . . . . . . . . . . . . . . . . . . . . . . . 193
Archiving Data Node Content . . . . . . . . . . . . . . . . . . . . . . . . . . . . . . . . . . . . . . . . . 194
Saving Event Processor Data to a Data Node Appliance . . . . . . . . . . . . . . . . . . . 194
System View Management . . . . . . . . . . . . . . . . . . . . . . . . . . . . . . . . . . . . . . . . . . 195
Overview Of the System View Page . . . . . . . . . . . . . . . . . . . . . . . . . . . . . . . . 195
Software Compatibility Requirements for Console and Non-Console
Hosts . . . . . . . . . . . . . . . . . . . . . . . . . . . . . . . . . . . . . . . . . . . . . . . . . . . . . 195
Encryption . . . . . . . . . . . . . . . . . . . . . . . . . . . . . . . . . . . . . . . . . . . . . . . . . . . . 195
Adding a Managed Host . . . . . . . . . . . . . . . . . . . . . . . . . . . . . . . . . . . . . . . . . 196
Editing a Managed Host . . . . . . . . . . . . . . . . . . . . . . . . . . . . . . . . . . . . . . . . . 197
Removing a Managed Host . . . . . . . . . . . . . . . . . . . . . . . . . . . . . . . . . . . . . . . 198
Configuring a Managed Host . . . . . . . . . . . . . . . . . . . . . . . . . . . . . . . . . . . . . 198
Assigning a Component to a Host . . . . . . . . . . . . . . . . . . . . . . . . . . . . . . . . . 199
Configuring Host Context . . . . . . . . . . . . . . . . . . . . . . . . . . . . . . . . . . . . . . . . 199
Configuring an Accumulator . . . . . . . . . . . . . . . . . . . . . . . . . . . . . . . . . . . . . . 201
NAT Management . . . . . . . . . . . . . . . . . . . . . . . . . . . . . . . . . . . . . . . . . . . . . . . . . 202
Adding a NAT-enabled Network to JSA . . . . . . . . . . . . . . . . . . . . . . . . . . . . . 202
Editing a NAT-enabled Network . . . . . . . . . . . . . . . . . . . . . . . . . . . . . . . . . . 203
Deleting a NAT-enabled Network from JSA . . . . . . . . . . . . . . . . . . . . . . . . . . 203
Changing the NAT Status for a Managed Host . . . . . . . . . . . . . . . . . . . . . . . 203
Component Configuration . . . . . . . . . . . . . . . . . . . . . . . . . . . . . . . . . . . . . . . . . . . 205
Configuring a JSA Flow Processor . . . . . . . . . . . . . . . . . . . . . . . . . . . . . . . . . 205
Configuring an Event Collector . . . . . . . . . . . . . . . . . . . . . . . . . . . . . . . . . . . . 210
Configuring an Event Processor . . . . . . . . . . . . . . . . . . . . . . . . . . . . . . . . . . . . 211
Configuring the Magistrate . . . . . . . . . . . . . . . . . . . . . . . . . . . . . . . . . . . . . . . 212
Configuring an Off-site Source . . . . . . . . . . . . . . . . . . . . . . . . . . . . . . . . . . . . 213
Configuring an Off-site Target . . . . . . . . . . . . . . . . . . . . . . . . . . . . . . . . . . . . . 213
Chapter 14 Flow Sources Management . . . . . . . . . . . . . . . . . . . . . . . . . . . . . . . . . . . . . . . . 215
Flow Sources Management . . . . . . . . . . . . . . . . . . . . . . . . . . . . . . . . . . . . . . . . . . 215
Flow Sources . . . . . . . . . . . . . . . . . . . . . . . . . . . . . . . . . . . . . . . . . . . . . . . . . . . . . . 215
NetFlow . . . . . . . . . . . . . . . . . . . . . . . . . . . . . . . . . . . . . . . . . . . . . . . . . . . . . . 216
IPFIX . . . . . . . . . . . . . . . . . . . . . . . . . . . . . . . . . . . . . . . . . . . . . . . . . . . . . . . . . 217
SFlow . . . . . . . . . . . . . . . . . . . . . . . . . . . . . . . . . . . . . . . . . . . . . . . . . . . . . . . . 218
J-Flow . . . . . . . . . . . . . . . . . . . . . . . . . . . . . . . . . . . . . . . . . . . . . . . . . . . . . . . . 218
Packeteer . . . . . . . . . . . . . . . . . . . . . . . . . . . . . . . . . . . . . . . . . . . . . . . . . . . . . 219
Copyright © 2018, Juniper Networks, Inc.viii
Juniper Secure Analytics Administration Guide

Flowlog File . . . . . . . . . . . . . . . . . . . . . . . . . . . . . . . . . . . . . . . . . . . . . . . . . . . 219
Adding or Editing a Flow Source . . . . . . . . . . . . . . . . . . . . . . . . . . . . . . . . . . . . . . 220
Enabling and Disabling a Flow Source . . . . . . . . . . . . . . . . . . . . . . . . . . . . . . . . . . 221
Deleting a Flow Source . . . . . . . . . . . . . . . . . . . . . . . . . . . . . . . . . . . . . . . . . . . . . . 222
Flow Source Aliases Management . . . . . . . . . . . . . . . . . . . . . . . . . . . . . . . . . . . . 222
Adding or a Flow Source Alias . . . . . . . . . . . . . . . . . . . . . . . . . . . . . . . . . . . . 223
Deleting a Flow Source Alias . . . . . . . . . . . . . . . . . . . . . . . . . . . . . . . . . . . . . 223
Chapter 15 Remote Networks and Services Configuration . . . . . . . . . . . . . . . . . . . . . . . 225
Remote Networks and Services Configuration . . . . . . . . . . . . . . . . . . . . . . . . . . . 225
Default Remote Network Groups . . . . . . . . . . . . . . . . . . . . . . . . . . . . . . . . . . . . . 225
Default Remote Service Groups . . . . . . . . . . . . . . . . . . . . . . . . . . . . . . . . . . . . . . . 227
Guidelines for Network Resources . . . . . . . . . . . . . . . . . . . . . . . . . . . . . . . . . . . . . 228
Managing Remote Networks Objects . . . . . . . . . . . . . . . . . . . . . . . . . . . . . . . . . . 228
Managing Remote Services Objects . . . . . . . . . . . . . . . . . . . . . . . . . . . . . . . . . . . 229
QID Map Overview . . . . . . . . . . . . . . . . . . . . . . . . . . . . . . . . . . . . . . . . . . . . . . . . . 230
Creating a QID Map Entry . . . . . . . . . . . . . . . . . . . . . . . . . . . . . . . . . . . . . . . . 231
Modifying a QID Map Entry . . . . . . . . . . . . . . . . . . . . . . . . . . . . . . . . . . . . . . . 231
Importing Qid Map Entries . . . . . . . . . . . . . . . . . . . . . . . . . . . . . . . . . . . . . . . 232
Exporting QID Map Entries . . . . . . . . . . . . . . . . . . . . . . . . . . . . . . . . . . . . . . . 234
Chapter 16 Server Discovery . . . . . . . . . . . . . . . . . . . . . . . . . . . . . . . . . . . . . . . . . . . . . . . . . 235
Server Discovery . . . . . . . . . . . . . . . . . . . . . . . . . . . . . . . . . . . . . . . . . . . . . . . . . . . 235
Discovering Servers . . . . . . . . . . . . . . . . . . . . . . . . . . . . . . . . . . . . . . . . . . . . . . . . 236
Chapter 17 Domain Segmentation . . . . . . . . . . . . . . . . . . . . . . . . . . . . . . . . . . . . . . . . . . . . 237
Domain Segmentation . . . . . . . . . . . . . . . . . . . . . . . . . . . . . . . . . . . . . . . . . . . . . . 237
Overlapping IP Addresses . . . . . . . . . . . . . . . . . . . . . . . . . . . . . . . . . . . . . . . . . . . 238
Domain Definition and Tagging . . . . . . . . . . . . . . . . . . . . . . . . . . . . . . . . . . . . . . . 238
Specifying Domains for Events . . . . . . . . . . . . . . . . . . . . . . . . . . . . . . . . . . . . 238
Specifying Domains for Flows . . . . . . . . . . . . . . . . . . . . . . . . . . . . . . . . . . . . 239
Specifying Domains for Scan Results . . . . . . . . . . . . . . . . . . . . . . . . . . . . . . 239
Precedence Order for Evaluating Domain Criteria . . . . . . . . . . . . . . . . . . . . . 239
Forwarding Data to Another JSA System . . . . . . . . . . . . . . . . . . . . . . . . . . . 240
Creating Domains . . . . . . . . . . . . . . . . . . . . . . . . . . . . . . . . . . . . . . . . . . . . . . . . . 240
Domain Privileges That Are Derived from Security Profiles . . . . . . . . . . . . . . . . . 242
Rule Modifications in Domain-aware Environments . . . . . . . . . . . . . . . . . . . 243
Domain-aware Searches . . . . . . . . . . . . . . . . . . . . . . . . . . . . . . . . . . . . . . . . 243
Domain-specific Rules and Offenses . . . . . . . . . . . . . . . . . . . . . . . . . . . . . . . . . . 244
Example: Domain Privilege Assignments Based on Custom Properties . . . . . . . 246
Chapter 18 Multitenant Management . . . . . . . . . . . . . . . . . . . . . . . . . . . . . . . . . . . . . . . . . 249
Multitenant Management . . . . . . . . . . . . . . . . . . . . . . . . . . . . . . . . . . . . . . . . . . . 249
User Roles in a Multitenant Environment . . . . . . . . . . . . . . . . . . . . . . . . . . . . . . . 249
Service Provider . . . . . . . . . . . . . . . . . . . . . . . . . . . . . . . . . . . . . . . . . . . . . . . 249
Tenants . . . . . . . . . . . . . . . . . . . . . . . . . . . . . . . . . . . . . . . . . . . . . . . . . . . . . . 250
Domains and Log Sources in Multitenant Environments . . . . . . . . . . . . . . . . . . . 250
Domain Segmentation . . . . . . . . . . . . . . . . . . . . . . . . . . . . . . . . . . . . . . . . . . 251
Automatic Log Source Detection . . . . . . . . . . . . . . . . . . . . . . . . . . . . . . . . . . 251
Provisioning a New Tenant . . . . . . . . . . . . . . . . . . . . . . . . . . . . . . . . . . . . . . . . . . . 252
ixCopyright © 2018, Juniper Networks, Inc.
Table of Contents

Monitoring License Usage in Multitenant Deployments . . . . . . . . . . . . . . . . . . . . 252
Viewing the Cumulative License Limits in Your Deployment . . . . . . . . . . . . 253
Viewing EPS Rates Per Log Source . . . . . . . . . . . . . . . . . . . . . . . . . . . . . . . . 253
Viewing EPS Rates Per Domain . . . . . . . . . . . . . . . . . . . . . . . . . . . . . . . . . . . 254
Viewing Individual License Limits in Your Deployment . . . . . . . . . . . . . . . . . 254
Viewing the EPS Rate for an Individual Log Source . . . . . . . . . . . . . . . . . . . . 254
Viewing the EPS Rate for an Individual Domain . . . . . . . . . . . . . . . . . . . . . . 255
Detecting Dropped Events and Flows . . . . . . . . . . . . . . . . . . . . . . . . . . . . . . 255
Rules Management in Multitenant Deployments . . . . . . . . . . . . . . . . . . . . . . . . . 256
Restricting Log Activity Capabilities for Tenant Users . . . . . . . . . . . . . . . . . . 257
Network Hierarchy Updates in a Multitenant Deployment . . . . . . . . . . . . . . . . . . 257
Retention Policies for Tenants . . . . . . . . . . . . . . . . . . . . . . . . . . . . . . . . . . . . . . . . 258
Chapter 19 Asset Management . . . . . . . . . . . . . . . . . . . . . . . . . . . . . . . . . . . . . . . . . . . . . . 259
Asset Management . . . . . . . . . . . . . . . . . . . . . . . . . . . . . . . . . . . . . . . . . . . . . . . . 259
Sources Of Asset Data . . . . . . . . . . . . . . . . . . . . . . . . . . . . . . . . . . . . . . . . . . . . . . 259
Domain-aware Asset Data . . . . . . . . . . . . . . . . . . . . . . . . . . . . . . . . . . . . . . . 260
Incoming Asset Data Workflow . . . . . . . . . . . . . . . . . . . . . . . . . . . . . . . . . . . . . . . 260
Updates to Asset Data . . . . . . . . . . . . . . . . . . . . . . . . . . . . . . . . . . . . . . . . . . . . . . 262
Identity Information . . . . . . . . . . . . . . . . . . . . . . . . . . . . . . . . . . . . . . . . . . . . 262
Asset Reconciliation Exclusion Rules . . . . . . . . . . . . . . . . . . . . . . . . . . . . . . . 263
Asset Merging . . . . . . . . . . . . . . . . . . . . . . . . . . . . . . . . . . . . . . . . . . . . . . . . . 264
Identification Of Asset Growth Deviations . . . . . . . . . . . . . . . . . . . . . . . . . . . . . . 264
DHCP Server Example Of Unnatural Asset Growth in an Asset Profile . . . . 265
Threshold Settings . . . . . . . . . . . . . . . . . . . . . . . . . . . . . . . . . . . . . . . . . . . . . 265
System Notifications That Indicate Asset Growth Deviations . . . . . . . . . . . 265
Asset Data That Changes Frequently . . . . . . . . . . . . . . . . . . . . . . . . . . . 266
Example: How Configuration Errors for Log Source Extensions Can Cause
Asset Growth Deviations . . . . . . . . . . . . . . . . . . . . . . . . . . . . . . . . . . . . . 266
Troubleshooting Asset Profiles That Exceed the Normal Size Threshold . . 266
New Asset Data is Added to the Asset Blacklists . . . . . . . . . . . . . . . . . . . . . 267
Prevention Of Asset Growth Deviations . . . . . . . . . . . . . . . . . . . . . . . . . . . . . . . . 268
Stale Asset Data . . . . . . . . . . . . . . . . . . . . . . . . . . . . . . . . . . . . . . . . . . . . . . . 269
Asset Blacklists and Whitelists . . . . . . . . . . . . . . . . . . . . . . . . . . . . . . . . . . . 269
Asset Blacklists . . . . . . . . . . . . . . . . . . . . . . . . . . . . . . . . . . . . . . . . . . . . 269
Asset Whitelists . . . . . . . . . . . . . . . . . . . . . . . . . . . . . . . . . . . . . . . . . . . . 270
Updating the Asset Blacklists andWhitelists by Using Reference Set
Utility . . . . . . . . . . . . . . . . . . . . . . . . . . . . . . . . . . . . . . . . . . . . . . . . . 271
Updating the Blacklists and Whitelists Using the RESTful API . . . . . . . 272
Tuning the Asset Profiler Retention Settings . . . . . . . . . . . . . . . . . . . . . . . . . 273
Tuning the Number Of IP Addresses Allowed for a Single Asset . . . . . . . . . . 274
Identity Exclusion Searches . . . . . . . . . . . . . . . . . . . . . . . . . . . . . . . . . . . . . . 275
Differences Between Identity Exclusion Searches and Blacklists . . . . . 275
Creating Identity Exclusion Searches . . . . . . . . . . . . . . . . . . . . . . . . . . . 276
Advanced Tuning Of Asset Reconciliation Exclusion Rules . . . . . . . . . . . . . . 277
Applying Different Tuning for Rules . . . . . . . . . . . . . . . . . . . . . . . . . . . . . 277
Copyright © 2018, Juniper Networks, Inc.x
Juniper Secure Analytics Administration Guide

Example: Asset Exclusion Rules That Are Tuned to Exclude IP Addresses
from the Blacklist . . . . . . . . . . . . . . . . . . . . . . . . . . . . . . . . . . . . . . . . . . . 278
Blacklisting IP Addresses . . . . . . . . . . . . . . . . . . . . . . . . . . . . . . . . . . . . . 278
Tuning Asset Reconciliation Rules to Ignore Some Asset Updates . . . . 279
Clean Up Asset Data After Growth Deviations . . . . . . . . . . . . . . . . . . . . . . . . . . . 279
Deleting Invalid Assets . . . . . . . . . . . . . . . . . . . . . . . . . . . . . . . . . . . . . . . . . . 280
Deleting Blacklist Entries . . . . . . . . . . . . . . . . . . . . . . . . . . . . . . . . . . . . . . . . 280
Chapter 20 Configuring JSA to Forward Data to Other Systems . . . . . . . . . . . . . . . . . . 283
Configuring JSA to Forward Data to Other Systems . . . . . . . . . . . . . . . . . . . . . . . 283
Adding Forwarding Destinations . . . . . . . . . . . . . . . . . . . . . . . . . . . . . . . . . . . . . . 284
Configuring Forwarding Profiles . . . . . . . . . . . . . . . . . . . . . . . . . . . . . . . . . . . . . . 285
Configuring Routing Rules for Bulk Forwarding . . . . . . . . . . . . . . . . . . . . . . . . . . 286
Configuring Selective Forwarding . . . . . . . . . . . . . . . . . . . . . . . . . . . . . . . . . . . . . 288
Viewing Forwarding Destinations . . . . . . . . . . . . . . . . . . . . . . . . . . . . . . . . . . . . . 288
Viewing and Managing Forwarding Destinations . . . . . . . . . . . . . . . . . . . . . . . . . 289
Viewing and Managing Routing Rules . . . . . . . . . . . . . . . . . . . . . . . . . . . . . . . . . . 290
Chapter 21 Event Store and Forward . . . . . . . . . . . . . . . . . . . . . . . . . . . . . . . . . . . . . . . . . . 291
Event Store and Forward . . . . . . . . . . . . . . . . . . . . . . . . . . . . . . . . . . . . . . . . . . . . 291
Store and Forward Overview . . . . . . . . . . . . . . . . . . . . . . . . . . . . . . . . . . . . . . . . . 291
Viewing the Store and Forward Schedule List . . . . . . . . . . . . . . . . . . . . . . . . . . . 292
Creating a New Store and Forward Schedule . . . . . . . . . . . . . . . . . . . . . . . . . . . . 294
Editing a Store and Forward Schedule . . . . . . . . . . . . . . . . . . . . . . . . . . . . . . . . . 295
Deleting a Store and Forward Schedule . . . . . . . . . . . . . . . . . . . . . . . . . . . . . . . . 296
Chapter 22 Security Content . . . . . . . . . . . . . . . . . . . . . . . . . . . . . . . . . . . . . . . . . . . . . . . . . 297
Security Content . . . . . . . . . . . . . . . . . . . . . . . . . . . . . . . . . . . . . . . . . . . . . . . . . . . 297
Types Of Security Content . . . . . . . . . . . . . . . . . . . . . . . . . . . . . . . . . . . . . . . . . . . 297
Sources Of Security Content . . . . . . . . . . . . . . . . . . . . . . . . . . . . . . . . . . . . . 297
Methods Of Importing and Exporting Content . . . . . . . . . . . . . . . . . . . . . . . . . . . 298
Extensions Management Tool . . . . . . . . . . . . . . . . . . . . . . . . . . . . . . . . . . . . 298
Content Management Script . . . . . . . . . . . . . . . . . . . . . . . . . . . . . . . . . . . . . 298
Exporting All Custom Content . . . . . . . . . . . . . . . . . . . . . . . . . . . . . . . . . . . . 298
Exporting All Custom Content Of a Specific Type . . . . . . . . . . . . . . . . . . . . . 299
Searching for Specific Content Items to Export . . . . . . . . . . . . . . . . . . . . . . 300
Exporting a Single Custom Content Item . . . . . . . . . . . . . . . . . . . . . . . . . . . 302
Exporting Custom Content Items Of Different Types . . . . . . . . . . . . . . . . . . 302
Installing Extensions by Using Extensions Management . . . . . . . . . . . . . . . 303
Importing Content by Using the Content Management Script . . . . . . . . . . . 303
Updating Content by Using the Content Management Script . . . . . . . . . . . 304
Content Type Identifiers for Exporting Custom Content . . . . . . . . . . . . . . . . . . . 304
Content Management Script Parameters . . . . . . . . . . . . . . . . . . . . . . . . . . . . . . 306
Chapter 23 SNMP Trap Configuration . . . . . . . . . . . . . . . . . . . . . . . . . . . . . . . . . . . . . . . . . 309
SNMP Trap Configuration . . . . . . . . . . . . . . . . . . . . . . . . . . . . . . . . . . . . . . . . . . . 309
Customizing the SNMP Trap Information Sent to Another System . . . . . . . . . . 309
Customizing the SNMP Trap Output . . . . . . . . . . . . . . . . . . . . . . . . . . . . . . . . . . . . 311
Adding a Custom SNMP Trap to JSA . . . . . . . . . . . . . . . . . . . . . . . . . . . . . . . . . . . 312
Sending SNMP Traps to a Specific Host . . . . . . . . . . . . . . . . . . . . . . . . . . . . . . . . 313
xiCopyright © 2018, Juniper Networks, Inc.
Table of Contents

Chapter 24 Protect Sensitive Data . . . . . . . . . . . . . . . . . . . . . . . . . . . . . . . . . . . . . . . . . . . . 317
Protect Sensitive Data . . . . . . . . . . . . . . . . . . . . . . . . . . . . . . . . . . . . . . . . . . . . . . 317
How Does Data ObfuscationWork? . . . . . . . . . . . . . . . . . . . . . . . . . . . . . . . . . . . . 317
Existing Event Data . . . . . . . . . . . . . . . . . . . . . . . . . . . . . . . . . . . . . . . . . . . . . 317
Assets . . . . . . . . . . . . . . . . . . . . . . . . . . . . . . . . . . . . . . . . . . . . . . . . . . . . . . . . 318
Offenses . . . . . . . . . . . . . . . . . . . . . . . . . . . . . . . . . . . . . . . . . . . . . . . . . . . . . . 318
Rules . . . . . . . . . . . . . . . . . . . . . . . . . . . . . . . . . . . . . . . . . . . . . . . . . . . . . . . . 318
Log Source Extensions . . . . . . . . . . . . . . . . . . . . . . . . . . . . . . . . . . . . . . . . . . 318
Data Obfuscation Profiles . . . . . . . . . . . . . . . . . . . . . . . . . . . . . . . . . . . . . . . . . . . 318
Data Obfuscation Expressions . . . . . . . . . . . . . . . . . . . . . . . . . . . . . . . . . . . . . . . . 319
Field-based Properties . . . . . . . . . . . . . . . . . . . . . . . . . . . . . . . . . . . . . . . . . . 319
Regular Expressions . . . . . . . . . . . . . . . . . . . . . . . . . . . . . . . . . . . . . . . . . . . . 320
Scenario: Obfuscating User Names . . . . . . . . . . . . . . . . . . . . . . . . . . . . . . . . . . . 320
Creating a Data Obfuscation Profile . . . . . . . . . . . . . . . . . . . . . . . . . . . . . . . . 321
Creating Data Obfuscation Expressions . . . . . . . . . . . . . . . . . . . . . . . . . . . . . 322
Deobfuscating Data So That It Can Be Viewed in the Console . . . . . . . . . . . 323
Editing or Disabling Obfuscation Expressions Created in Previous
Releases . . . . . . . . . . . . . . . . . . . . . . . . . . . . . . . . . . . . . . . . . . . . . . . . . . 324
Chapter 25 Log Files . . . . . . . . . . . . . . . . . . . . . . . . . . . . . . . . . . . . . . . . . . . . . . . . . . . . . . . . 327
Log Files . . . . . . . . . . . . . . . . . . . . . . . . . . . . . . . . . . . . . . . . . . . . . . . . . . . . . . . . . 327
Audit Logs . . . . . . . . . . . . . . . . . . . . . . . . . . . . . . . . . . . . . . . . . . . . . . . . . . . . . . . . 327
Viewing the Audit Log File . . . . . . . . . . . . . . . . . . . . . . . . . . . . . . . . . . . . . . . 328
Logged Actions . . . . . . . . . . . . . . . . . . . . . . . . . . . . . . . . . . . . . . . . . . . . . . . . 329
Chapter 26 Event Categories . . . . . . . . . . . . . . . . . . . . . . . . . . . . . . . . . . . . . . . . . . . . . . . . . 337
Event Categories . . . . . . . . . . . . . . . . . . . . . . . . . . . . . . . . . . . . . . . . . . . . . . . . . . . 337
High-level Event Categories . . . . . . . . . . . . . . . . . . . . . . . . . . . . . . . . . . . . . . . . . . 338
Recon . . . . . . . . . . . . . . . . . . . . . . . . . . . . . . . . . . . . . . . . . . . . . . . . . . . . . . . . . . . 339
DoS . . . . . . . . . . . . . . . . . . . . . . . . . . . . . . . . . . . . . . . . . . . . . . . . . . . . . . . . . . . . . 341
Authentication . . . . . . . . . . . . . . . . . . . . . . . . . . . . . . . . . . . . . . . . . . . . . . . . . . . . 344
Access . . . . . . . . . . . . . . . . . . . . . . . . . . . . . . . . . . . . . . . . . . . . . . . . . . . . . . . . . . 350
Exploit . . . . . . . . . . . . . . . . . . . . . . . . . . . . . . . . . . . . . . . . . . . . . . . . . . . . . . . . . . . 352
Malware . . . . . . . . . . . . . . . . . . . . . . . . . . . . . . . . . . . . . . . . . . . . . . . . . . . . . . . . . 354
Suspicious Activity . . . . . . . . . . . . . . . . . . . . . . . . . . . . . . . . . . . . . . . . . . . . . . . . . 355
System . . . . . . . . . . . . . . . . . . . . . . . . . . . . . . . . . . . . . . . . . . . . . . . . . . . . . . . . . . 358
Policy . . . . . . . . . . . . . . . . . . . . . . . . . . . . . . . . . . . . . . . . . . . . . . . . . . . . . . . . . . . 363
Unknown . . . . . . . . . . . . . . . . . . . . . . . . . . . . . . . . . . . . . . . . . . . . . . . . . . . . . . . . 364
CRE . . . . . . . . . . . . . . . . . . . . . . . . . . . . . . . . . . . . . . . . . . . . . . . . . . . . . . . . . . . . . 365
Potential Exploit . . . . . . . . . . . . . . . . . . . . . . . . . . . . . . . . . . . . . . . . . . . . . . . . . . . 365
User Defined . . . . . . . . . . . . . . . . . . . . . . . . . . . . . . . . . . . . . . . . . . . . . . . . . . . . . 366
SIM Audit . . . . . . . . . . . . . . . . . . . . . . . . . . . . . . . . . . . . . . . . . . . . . . . . . . . . . . . . 368
VIS Host Discovery . . . . . . . . . . . . . . . . . . . . . . . . . . . . . . . . . . . . . . . . . . . . . . . . . 369
Application . . . . . . . . . . . . . . . . . . . . . . . . . . . . . . . . . . . . . . . . . . . . . . . . . . . . . . . 370
Audit . . . . . . . . . . . . . . . . . . . . . . . . . . . . . . . . . . . . . . . . . . . . . . . . . . . . . . . . . . . . 390
Risk . . . . . . . . . . . . . . . . . . . . . . . . . . . . . . . . . . . . . . . . . . . . . . . . . . . . . . . . . . . . . 391
Risk Manager Audit . . . . . . . . . . . . . . . . . . . . . . . . . . . . . . . . . . . . . . . . . . . . . . . . 392
Control . . . . . . . . . . . . . . . . . . . . . . . . . . . . . . . . . . . . . . . . . . . . . . . . . . . . . . . . . . 393
Asset Profiler . . . . . . . . . . . . . . . . . . . . . . . . . . . . . . . . . . . . . . . . . . . . . . . . . . . . . 395
Copyright © 2018, Juniper Networks, Inc.xii
Juniper Secure Analytics Administration Guide

Chapter 27 Common Ports and Servers Used by JSA . . . . . . . . . . . . . . . . . . . . . . . . . . . . 401
Common Ports and Servers Used by JSA . . . . . . . . . . . . . . . . . . . . . . . . . . . . . . . 401
SSH Communication on Port 22 . . . . . . . . . . . . . . . . . . . . . . . . . . . . . . . . . . . 401
Open Ports That Are Not Required by JSA . . . . . . . . . . . . . . . . . . . . . . . . . . . 401
JSA Port Usage . . . . . . . . . . . . . . . . . . . . . . . . . . . . . . . . . . . . . . . . . . . . . . . . . . . . 402
WinCollect Remote Polling . . . . . . . . . . . . . . . . . . . . . . . . . . . . . . . . . . . . . . 402
JSA Listening Ports . . . . . . . . . . . . . . . . . . . . . . . . . . . . . . . . . . . . . . . . . . . . . 402
Viewing IMQ Port Associations . . . . . . . . . . . . . . . . . . . . . . . . . . . . . . . . . . . . . . . 410
Searching for Ports in Use by JSA . . . . . . . . . . . . . . . . . . . . . . . . . . . . . . . . . . . . . . 411
JSA Public Servers . . . . . . . . . . . . . . . . . . . . . . . . . . . . . . . . . . . . . . . . . . . . . . . . . . 411
Public Servers . . . . . . . . . . . . . . . . . . . . . . . . . . . . . . . . . . . . . . . . . . . . . . . . . 412
RSS Feeds for JSA Products . . . . . . . . . . . . . . . . . . . . . . . . . . . . . . . . . . . . . . 412
Chapter 28 Getting Data Into JSA . . . . . . . . . . . . . . . . . . . . . . . . . . . . . . . . . . . . . . . . . . . . . 415
Getting Data Into JSA . . . . . . . . . . . . . . . . . . . . . . . . . . . . . . . . . . . . . . . . . . . . . . . 415
DSM Editor Overview . . . . . . . . . . . . . . . . . . . . . . . . . . . . . . . . . . . . . . . . . . . . . . . 415
Workspace . . . . . . . . . . . . . . . . . . . . . . . . . . . . . . . . . . . . . . . . . . . . . . . . . . . . 415
Log Activity Preview . . . . . . . . . . . . . . . . . . . . . . . . . . . . . . . . . . . . . . . . . . . . 416
Properties Tab . . . . . . . . . . . . . . . . . . . . . . . . . . . . . . . . . . . . . . . . . . . . . . . . . 416
Event Mappings Tab . . . . . . . . . . . . . . . . . . . . . . . . . . . . . . . . . . . . . . . . . . . . 416
Access the DSM Editor . . . . . . . . . . . . . . . . . . . . . . . . . . . . . . . . . . . . . . . . . . 416
Properties in the DSM Editor . . . . . . . . . . . . . . . . . . . . . . . . . . . . . . . . . . . . . . . . . . 417
System Properties . . . . . . . . . . . . . . . . . . . . . . . . . . . . . . . . . . . . . . . . . . . . . . 417
Custom Properties . . . . . . . . . . . . . . . . . . . . . . . . . . . . . . . . . . . . . . . . . . . . . . 417
Custom Property Definitions in the DSM Editor . . . . . . . . . . . . . . . . . . . . . . . . . . 418
Selectivity . . . . . . . . . . . . . . . . . . . . . . . . . . . . . . . . . . . . . . . . . . . . . . . . . . . . 418
Expressions . . . . . . . . . . . . . . . . . . . . . . . . . . . . . . . . . . . . . . . . . . . . . . . . . . . 418
Creating a Custom Property . . . . . . . . . . . . . . . . . . . . . . . . . . . . . . . . . . . . . . 419
Configuring a Log Source Type . . . . . . . . . . . . . . . . . . . . . . . . . . . . . . . . . . . . . . . . 419
Creating an Event Map and Categorization . . . . . . . . . . . . . . . . . . . . . . . . . . . . . 420
xiiiCopyright © 2018, Juniper Networks, Inc.
Table of Contents

Copyright © 2018, Juniper Networks, Inc.xiv
Juniper Secure Analytics Administration Guide

List of Figures
Chapter 17 Domain Segmentation . . . . . . . . . . . . . . . . . . . . . . . . . . . . . . . . . . . . . . . . . . . . 237
Figure 1: Assigning Domains by Using Custom Event Property . . . . . . . . . . . . . . 246
Chapter 19 Asset Management . . . . . . . . . . . . . . . . . . . . . . . . . . . . . . . . . . . . . . . . . . . . . . 259
Figure 2: Asset DataWorkflow Diagram . . . . . . . . . . . . . . . . . . . . . . . . . . . . . . . . . 261
xvCopyright © 2018, Juniper Networks, Inc.

Copyright © 2018, Juniper Networks, Inc.xvi
Juniper Secure Analytics Administration Guide

List of Tables
About the Documentation . . . . . . . . . . . . . . . . . . . . . . . . . . . . . . . . . . . . . . . . . xxi
Table 1: Notice Icons . . . . . . . . . . . . . . . . . . . . . . . . . . . . . . . . . . . . . . . . . . . . . . . . xxii
Table 2: Text and Syntax Conventions . . . . . . . . . . . . . . . . . . . . . . . . . . . . . . . . . . xxii
Chapter 2 Overview Of JSA Administration . . . . . . . . . . . . . . . . . . . . . . . . . . . . . . . . . . . . 29
Table 3: Comparison Of JSA Capabilities . . . . . . . . . . . . . . . . . . . . . . . . . . . . . . . . 30
Table 4: Supported Web Browsers for JSA Products . . . . . . . . . . . . . . . . . . . . . . . . 31
Table 5: Admin Tab Menu Options . . . . . . . . . . . . . . . . . . . . . . . . . . . . . . . . . . . . . . 31
Table 6: Aggregated Data Management View Column Descriptions . . . . . . . . . . . 36
Table 7: REST API Interfaces . . . . . . . . . . . . . . . . . . . . . . . . . . . . . . . . . . . . . . . . . . 38
Table 8: Custom Action Parameters . . . . . . . . . . . . . . . . . . . . . . . . . . . . . . . . . . . . 39
Chapter 3 User Management . . . . . . . . . . . . . . . . . . . . . . . . . . . . . . . . . . . . . . . . . . . . . . . . . 41
Table 9: User Role Privilege Groups . . . . . . . . . . . . . . . . . . . . . . . . . . . . . . . . . . . . . 58
Table 10: Security Profile Privilege Groups . . . . . . . . . . . . . . . . . . . . . . . . . . . . . . . 58
Chapter 4 System and Licenses Management . . . . . . . . . . . . . . . . . . . . . . . . . . . . . . . . . . 63
Table 11: System and License Management Toolbar Functions . . . . . . . . . . . . . . . 64
Table 12: System and License ManagementWindow Parameters - Licenses
View . . . . . . . . . . . . . . . . . . . . . . . . . . . . . . . . . . . . . . . . . . . . . . . . . . . . . . . . . . 64
Table 13: License Parameters . . . . . . . . . . . . . . . . . . . . . . . . . . . . . . . . . . . . . . . . . . 70
Table 14: Parameters for the Check_ariel_integrity.sh Utility . . . . . . . . . . . . . . . . . . 75
Chapter 6 User Information Source Configuration . . . . . . . . . . . . . . . . . . . . . . . . . . . . . . 87
Table 15: Supported Information Sources . . . . . . . . . . . . . . . . . . . . . . . . . . . . . . . . 88
Table 16: Certification Configuration Parameters . . . . . . . . . . . . . . . . . . . . . . . . . . 90
Table 17: Supported User Interface Property Values . . . . . . . . . . . . . . . . . . . . . . . . 93
Chapter 7 Set Up JSA . . . . . . . . . . . . . . . . . . . . . . . . . . . . . . . . . . . . . . . . . . . . . . . . . . . . . . . 97
Table 18: Example Of Multiple CIDRs and Subnets in a Single Network Group . . 98
Table 19: Example Of an All-encompassing Group . . . . . . . . . . . . . . . . . . . . . . . . 98
Table 20: Acceptable CIDR Values . . . . . . . . . . . . . . . . . . . . . . . . . . . . . . . . . . . . . 99
Table 21: Check for Updates Toolbar Functions . . . . . . . . . . . . . . . . . . . . . . . . . . 104
Table 22: Description Of the ArielRightClick.properties File Parameters . . . . . . . 116
Table 23: Asset Components . . . . . . . . . . . . . . . . . . . . . . . . . . . . . . . . . . . . . . . . . 118
Table 24: Global System Notifications Window Parameters . . . . . . . . . . . . . . . . . 131
Table 25: Accepted Notification Parameters . . . . . . . . . . . . . . . . . . . . . . . . . . . . . 135
Table 26: Custom Close ReasonsWindow Parameters . . . . . . . . . . . . . . . . . . . . . 137
Chapter 8 Juniper Networks X-Force Integration . . . . . . . . . . . . . . . . . . . . . . . . . . . . . . . 145
Table 27: AlertCon Threat Levels . . . . . . . . . . . . . . . . . . . . . . . . . . . . . . . . . . . . . . 146
Chapter 9 Reference Sets Management . . . . . . . . . . . . . . . . . . . . . . . . . . . . . . . . . . . . . . 149
xviiCopyright © 2018, Juniper Networks, Inc.

Table 28: Reference Set Parameters . . . . . . . . . . . . . . . . . . . . . . . . . . . . . . . . . . . 150
Table 29: Reference Set Parameters . . . . . . . . . . . . . . . . . . . . . . . . . . . . . . . . . . . . 151
Table 30: Content Tab Parameters . . . . . . . . . . . . . . . . . . . . . . . . . . . . . . . . . . . . 153
Table 31: Content Tab Parameters . . . . . . . . . . . . . . . . . . . . . . . . . . . . . . . . . . . . . 153
Chapter 10 Manage Reference Data Collections . . . . . . . . . . . . . . . . . . . . . . . . . . . . . . . . 157
Table 32: Parameters - Reference Map Of Sets . . . . . . . . . . . . . . . . . . . . . . . . . . . 159
Table 33: Parameters - Reference Map . . . . . . . . . . . . . . . . . . . . . . . . . . . . . . . . . 159
Table 34: Parameters - Reference Set . . . . . . . . . . . . . . . . . . . . . . . . . . . . . . . . . . 160
Table 35: Parameters - Reference Table . . . . . . . . . . . . . . . . . . . . . . . . . . . . . . . . . 161
Chapter 11 Managing Authorized Services . . . . . . . . . . . . . . . . . . . . . . . . . . . . . . . . . . . . . 163
Table 36: Parameters for Authorized Services . . . . . . . . . . . . . . . . . . . . . . . . . . . . 163
Chapter 12 Manage Backup and Recovery . . . . . . . . . . . . . . . . . . . . . . . . . . . . . . . . . . . . . 167
Table 37: Backup Recovery Configuration Parameters . . . . . . . . . . . . . . . . . . . . . 170
Table 38: Restore a Backup Parameters . . . . . . . . . . . . . . . . . . . . . . . . . . . . . . . . 175
Table 39: Restore a Backup (Managed Host Accessibility) Parameters . . . . . . . . 176
Table 40: Restore a Backup Parameters . . . . . . . . . . . . . . . . . . . . . . . . . . . . . . . . 176
Table 41: Description Of File Name Variables . . . . . . . . . . . . . . . . . . . . . . . . . . . . 179
Chapter 13 Deployment Editor . . . . . . . . . . . . . . . . . . . . . . . . . . . . . . . . . . . . . . . . . . . . . . . 183
Table 42: Description Of Supported Component Connections . . . . . . . . . . . . . . 190
Table 43: Parameters for the Managed Host . . . . . . . . . . . . . . . . . . . . . . . . . . . . . 196
Table 44: Parameters for a NAT-enabled Network . . . . . . . . . . . . . . . . . . . . . . . . 196
Table 45: Parameters for the Managed Host . . . . . . . . . . . . . . . . . . . . . . . . . . . . . 197
Table 46: Parameters for a NAT-enabled Network . . . . . . . . . . . . . . . . . . . . . . . . 198
Table 47: Host Context Parameters . . . . . . . . . . . . . . . . . . . . . . . . . . . . . . . . . . . 200
Table 48: Accumulator Parameters . . . . . . . . . . . . . . . . . . . . . . . . . . . . . . . . . . . . 201
Table 49: Parameters for a NAT-enabled Network . . . . . . . . . . . . . . . . . . . . . . . 204
Table 50: Advanced JSA Flow Processor Parameters: . . . . . . . . . . . . . . . . . . . . . 206
Table 51: Event Collector Advanced Parameters . . . . . . . . . . . . . . . . . . . . . . . . . . 210
Table 52: Parameter Values for the Event Processor . . . . . . . . . . . . . . . . . . . . . . . 211
Table 53: Event Processor Advanced Parameters . . . . . . . . . . . . . . . . . . . . . . . . . 212
Chapter 15 Remote Networks and Services Configuration . . . . . . . . . . . . . . . . . . . . . . . 225
Table 54: Default Remote Network Groups . . . . . . . . . . . . . . . . . . . . . . . . . . . . . 226
Table 55: Default Remote Network Groups . . . . . . . . . . . . . . . . . . . . . . . . . . . . . . 227
Table 56: QID Map Utility Options . . . . . . . . . . . . . . . . . . . . . . . . . . . . . . . . . . . . . 230
Chapter 16 Server Discovery . . . . . . . . . . . . . . . . . . . . . . . . . . . . . . . . . . . . . . . . . . . . . . . . . 235
Table 57: Server Type Vulnerabilities . . . . . . . . . . . . . . . . . . . . . . . . . . . . . . . . . . . 235
Chapter 17 Domain Segmentation . . . . . . . . . . . . . . . . . . . . . . . . . . . . . . . . . . . . . . . . . . . . 237
Table 58: Domain-aware Rules . . . . . . . . . . . . . . . . . . . . . . . . . . . . . . . . . . . . . . . 244
Chapter 18 Multitenant Management . . . . . . . . . . . . . . . . . . . . . . . . . . . . . . . . . . . . . . . . . 249
Table 59: Scope Of Rules in a Multitenant Environment . . . . . . . . . . . . . . . . . . . 256
Chapter 19 Asset Management . . . . . . . . . . . . . . . . . . . . . . . . . . . . . . . . . . . . . . . . . . . . . . 259
Table 60: Rule Tests and Responses . . . . . . . . . . . . . . . . . . . . . . . . . . . . . . . . . . . 263
Table 61: Reference Collection Names for Asset Blacklist Data . . . . . . . . . . . . . . 270
Copyright © 2018, Juniper Networks, Inc.xviii
Juniper Secure Analytics Administration Guide

Table 62: Reference Collection Name for Asset Whitelist Data . . . . . . . . . . . . . . 271
Table 63: Command Syntax to Modify Asset Blacklist and Whitelist Data . . . . . 271
Table 64: Parameters That Are Required to Add New Asset Data . . . . . . . . . . . . 273
Table 65: Options for Tuning the Asset Reconciliation Rules . . . . . . . . . . . . . . . . 277
Chapter 20 Configuring JSA to Forward Data to Other Systems . . . . . . . . . . . . . . . . . . 283
Table 66: Forwarding Destinations Parameters . . . . . . . . . . . . . . . . . . . . . . . . . . 284
Table 67: Routing RulesWindow Parameters . . . . . . . . . . . . . . . . . . . . . . . . . . . . 286
Table 68: Description Of the Forwarding Destination Toolbar Actions . . . . . . . . 289
Chapter 21 Event Store and Forward . . . . . . . . . . . . . . . . . . . . . . . . . . . . . . . . . . . . . . . . . . 291
Table 69: Store and Forward Window Parameters . . . . . . . . . . . . . . . . . . . . . . . 293
Chapter 22 Security Content . . . . . . . . . . . . . . . . . . . . . . . . . . . . . . . . . . . . . . . . . . . . . . . . . 297
Table 70: Content Type Identifiers for Exporting Custom Content . . . . . . . . . . . 299
Table 71: Content Type Identifiers for Searching Custom Content . . . . . . . . . . . 300
Table 72: Content Type Identifiers for Exporting Custom Content . . . . . . . . . . . . 305
Table 73: ContentManagement.pl Script Parameters . . . . . . . . . . . . . . . . . . . . . 306
Chapter 23 SNMP Trap Configuration . . . . . . . . . . . . . . . . . . . . . . . . . . . . . . . . . . . . . . . . . 309
Table 74: Value Types for Variable Binding . . . . . . . . . . . . . . . . . . . . . . . . . . . . . . . 311
Table 75: Fields for the Variable Bindings . . . . . . . . . . . . . . . . . . . . . . . . . . . . . . . . 312
Table 76: Attributes for the <include> Element . . . . . . . . . . . . . . . . . . . . . . . . . . . 313
Table 77: Attribute Values to Update in the <trapConfig> Element . . . . . . . . . . . 314
Chapter 24 Protect Sensitive Data . . . . . . . . . . . . . . . . . . . . . . . . . . . . . . . . . . . . . . . . . . . . 317
Table 78: Locked Profile Examples . . . . . . . . . . . . . . . . . . . . . . . . . . . . . . . . . . . . . 319
Table 79: Regex User Name Parsing . . . . . . . . . . . . . . . . . . . . . . . . . . . . . . . . . . . 320
Chapter 25 Log Files . . . . . . . . . . . . . . . . . . . . . . . . . . . . . . . . . . . . . . . . . . . . . . . . . . . . . . . . 327
Table 80: Description Of the Parts Of the Log File Format . . . . . . . . . . . . . . . . . 328
Chapter 26 Event Categories . . . . . . . . . . . . . . . . . . . . . . . . . . . . . . . . . . . . . . . . . . . . . . . . . 337
Table 81: High-level Event Categories . . . . . . . . . . . . . . . . . . . . . . . . . . . . . . . . . . 338
Table 82: Low-level Categories and Severity Levels for the Recon Events
Category . . . . . . . . . . . . . . . . . . . . . . . . . . . . . . . . . . . . . . . . . . . . . . . . . . . . . 339
Table 83: Low-level Categories and Severity Levels for the DoS Events
Category . . . . . . . . . . . . . . . . . . . . . . . . . . . . . . . . . . . . . . . . . . . . . . . . . . . . . . 341
Table84: Low-levelCategories andSeverity Levels for theAuthenticationEvents
Category . . . . . . . . . . . . . . . . . . . . . . . . . . . . . . . . . . . . . . . . . . . . . . . . . . . . . 344
Table 85: Low-level Categories and Severity Levels for the Access Events
Category . . . . . . . . . . . . . . . . . . . . . . . . . . . . . . . . . . . . . . . . . . . . . . . . . . . . . 350
Table 86: Low-level Categories and Severity Levels for the Exploit Events
Category . . . . . . . . . . . . . . . . . . . . . . . . . . . . . . . . . . . . . . . . . . . . . . . . . . . . . 352
Table 87: Low-level Categories and Severity Levels for the Malware Events
Category . . . . . . . . . . . . . . . . . . . . . . . . . . . . . . . . . . . . . . . . . . . . . . . . . . . . . 354
Table 88: Low-level Categories and Severity Levels for the Suspicious Activity
Events Category . . . . . . . . . . . . . . . . . . . . . . . . . . . . . . . . . . . . . . . . . . . . . . . 355
Table 89: Low-level Categories and Severity Levels for the System Events
Category . . . . . . . . . . . . . . . . . . . . . . . . . . . . . . . . . . . . . . . . . . . . . . . . . . . . . 358
Table 90: Low-level Categories and Severity Levels for the Policy Category . . . 363
xixCopyright © 2018, Juniper Networks, Inc.
List of Tables

Table 91: Low-level Categories and Severity Levels for the Unknown
Category . . . . . . . . . . . . . . . . . . . . . . . . . . . . . . . . . . . . . . . . . . . . . . . . . . . . . 364
Table 92: Low-level Categories and Severity Levels for the CRE Category . . . . . 365
Table 93: Low-level Categories and Severity Levels for the Potential Exploit
Category . . . . . . . . . . . . . . . . . . . . . . . . . . . . . . . . . . . . . . . . . . . . . . . . . . . . . 365
Table 94: Low-level Categories and Severity Levels for the User Defined
Category . . . . . . . . . . . . . . . . . . . . . . . . . . . . . . . . . . . . . . . . . . . . . . . . . . . . . 367
Table 95: Low-level Categories and Severity Levels for the SIM Audit
Category . . . . . . . . . . . . . . . . . . . . . . . . . . . . . . . . . . . . . . . . . . . . . . . . . . . . . 369
Table 96: Low-level Categories and Severity Levels for the VIS Host Discovery
Category . . . . . . . . . . . . . . . . . . . . . . . . . . . . . . . . . . . . . . . . . . . . . . . . . . . . . 369
Table 97: Low-level Categories and Severity Levels for the Application
Category . . . . . . . . . . . . . . . . . . . . . . . . . . . . . . . . . . . . . . . . . . . . . . . . . . . . . 370
Table 98: Low-level Categories and Severity Levels for the Audit Category . . . . 390
Table 99: Low-level Categories and Severity Levels for the Risk Category . . . . . 391
Table 100: Low-level Categories and Severity Levels for the Risk Manager Audit
Category . . . . . . . . . . . . . . . . . . . . . . . . . . . . . . . . . . . . . . . . . . . . . . . . . . . . . 393
Table 101: Low-level Categories and Severity Levels for the Control Category . . 393
Table 102: Low-level Categories and Severity Levels for the Asset Profiler
Category . . . . . . . . . . . . . . . . . . . . . . . . . . . . . . . . . . . . . . . . . . . . . . . . . . . . . 395
Chapter 27 Common Ports and Servers Used by JSA . . . . . . . . . . . . . . . . . . . . . . . . . . . . 401
Table 103: Listening Ports That Are Used by JSA Services and Components . . . 402
Table 104: Public Servers That JSA Must Access . . . . . . . . . . . . . . . . . . . . . . . . . . 412
Table 105: RSS Feeds . . . . . . . . . . . . . . . . . . . . . . . . . . . . . . . . . . . . . . . . . . . . . . . 412
Copyright © 2018, Juniper Networks, Inc.xx
Juniper Secure Analytics Administration Guide

About the Documentation
• Documentation and Release Notes on page xxi
• Documentation Conventions on page xxi
• Documentation Feedback on page xxiii
• Requesting Technical Support on page xxiv
Documentation and Release Notes
To obtain the most current version of all Juniper Networks®technical documentation,
see the product documentation page on the Juniper Networks website at
http://www.juniper.net/techpubs/.
If the information in the latest release notes differs from the information in the
documentation, follow the product Release Notes.
Juniper Networks Books publishes books by Juniper Networks engineers and subject
matter experts. These books go beyond the technical documentation to explore the
nuances of network architecture, deployment, and administration. The current list can
be viewed at http://www.juniper.net/books.
Documentation Conventions
Table 1 on page xxii defines notice icons used in this guide.
xxiCopyright © 2018, Juniper Networks, Inc.

Table 1: Notice Icons
DescriptionMeaningIcon
Indicates important features or instructions.Informational note
Indicates a situation that might result in loss of data or hardware damage.Caution
Alerts you to the risk of personal injury or death.Warning
Alerts you to the risk of personal injury from a laser.Laser warning
Indicates helpful information.Tip
Alerts you to a recommended use or implementation.Best practice
Table 2 on page xxii defines the text and syntax conventions used in this guide.
Table 2: Text and Syntax Conventions
ExamplesDescriptionConvention
To enter configuration mode, type theconfigure command:
user@host> configure
Represents text that you type.Bold text like this
user@host> show chassis alarms
No alarms currently active
Represents output that appears on theterminal screen.
Fixed-width text like this
• A policy term is a named structurethat defines match conditions andactions.
• Junos OS CLI User Guide
• RFC 1997,BGPCommunities Attribute
• Introduces or emphasizes importantnew terms.
• Identifies guide names.
• Identifies RFC and Internet draft titles.
Italic text like this
Configure themachine’s domain name:
[edit]root@# set system domain-namedomain-name
Represents variables (options for whichyou substitute a value) in commands orconfiguration statements.
Italic text like this
Copyright © 2018, Juniper Networks, Inc.xxii
Juniper Secure Analytics Administration Guide

Table 2: Text and Syntax Conventions (continued)
ExamplesDescriptionConvention
• To configure a stub area, include thestub statement at the [edit protocolsospf area area-id] hierarchy level.
• Theconsoleport is labeledCONSOLE.
Represents names of configurationstatements, commands, files, anddirectories; configurationhierarchy levels;or labels on routing platformcomponents.
Text like this
stub <default-metricmetric>;Encloses optional keywords or variables.< > (angle brackets)
broadcast | multicast
(string1 | string2 | string3)
Indicates a choice between themutuallyexclusive keywords or variables on eitherside of the symbol. The set of choices isoften enclosed in parentheses for clarity.
| (pipe symbol)
rsvp { # Required for dynamicMPLS onlyIndicates a comment specified on thesame lineas theconfiguration statementto which it applies.
# (pound sign)
community namemembers [community-ids ]
Encloses a variable for which you cansubstitute one or more values.
[ ] (square brackets)
[edit]routing-options {static {route default {nexthop address;retain;
}}
}
Identifies a level in the configurationhierarchy.
Indention and braces ( { } )
Identifies a leaf statement at aconfiguration hierarchy level.
; (semicolon)
GUI Conventions
• In the Logical Interfaces box, selectAll Interfaces.
• To cancel the configuration, clickCancel.
Representsgraphicaluser interface(GUI)items you click or select.
Bold text like this
In the configuration editor hierarchy,select Protocols>Ospf.
Separates levels in a hierarchy of menuselections.
> (bold right angle bracket)
Documentation Feedback
We encourage you to provide feedback, comments, and suggestions so that we can
improve the documentation. You can provide feedback by using either of the following
methods:
• Online feedback rating system—On any page of the Juniper Networks TechLibrary site
athttp://www.juniper.net/techpubs/index.html, simply click the stars to rate thecontent,
and use the pop-up form to provide us with information about your experience.
Alternately, you can use the online feedback form at
http://www.juniper.net/techpubs/feedback/.
xxiiiCopyright © 2018, Juniper Networks, Inc.
About the Documentation

• E-mail—Sendyourcommentsto [email protected]. Includethedocument
or topic name, URL or page number, and software version (if applicable).
Requesting Technical Support
Technical product support is available through the JuniperNetworksTechnicalAssistance
Center (JTAC). If you are a customer with an active J-Care or Partner Support Service
support contract, or are covered under warranty, and need post-sales technical support,
you can access our tools and resources online or open a case with JTAC.
• JTAC policies—For a complete understanding of our JTAC procedures and policies,
review the JTAC User Guide located at
http://www.juniper.net/us/en/local/pdf/resource-guides/7100059-en.pdf.
• Product warranties—For product warranty information, visit
http://www.juniper.net/support/warranty/.
• JTAC hours of operation—The JTAC centers have resources available 24 hours a day,
7 days a week, 365 days a year.
Self-Help Online Tools and Resources
For quick and easy problem resolution, Juniper Networks has designed an online
self-service portal called the Customer Support Center (CSC) that provides youwith the
following features:
• Find CSC offerings: http://www.juniper.net/customers/support/
• Search for known bugs: https://prsearch.juniper.net/
• Find product documentation: http://www.juniper.net/documentation/
• Find solutions and answer questions using our Knowledge Base: http://kb.juniper.net/
• Download the latest versions of software and review release notes:
http://www.juniper.net/customers/csc/software/
• Search technical bulletins for relevant hardware and software notifications:
http://kb.juniper.net/InfoCenter/
• Join and participate in the Juniper Networks Community Forum:
http://www.juniper.net/company/communities/
• Open a case online in the CSC Case Management tool: http://www.juniper.net/cm/
Toverify serviceentitlementbyproduct serial number, useourSerialNumberEntitlement
(SNE) Tool: https://entitlementsearch.juniper.net/entitlementsearch/
Opening a Casewith JTAC
You can open a case with JTAC on theWeb or by telephone.
• Use the Case Management tool in the CSC at http://www.juniper.net/cm/.
• Call 1-888-314-JTAC (1-888-314-5822 toll-free in the USA, Canada, and Mexico).
Copyright © 2018, Juniper Networks, Inc.xxiv
Juniper Secure Analytics Administration Guide

For international or direct-dial options in countries without toll-free numbers, see
http://www.juniper.net/support/requesting-support.html.
xxvCopyright © 2018, Juniper Networks, Inc.
About the Documentation

Copyright © 2018, Juniper Networks, Inc.xxvi
Juniper Secure Analytics Administration Guide
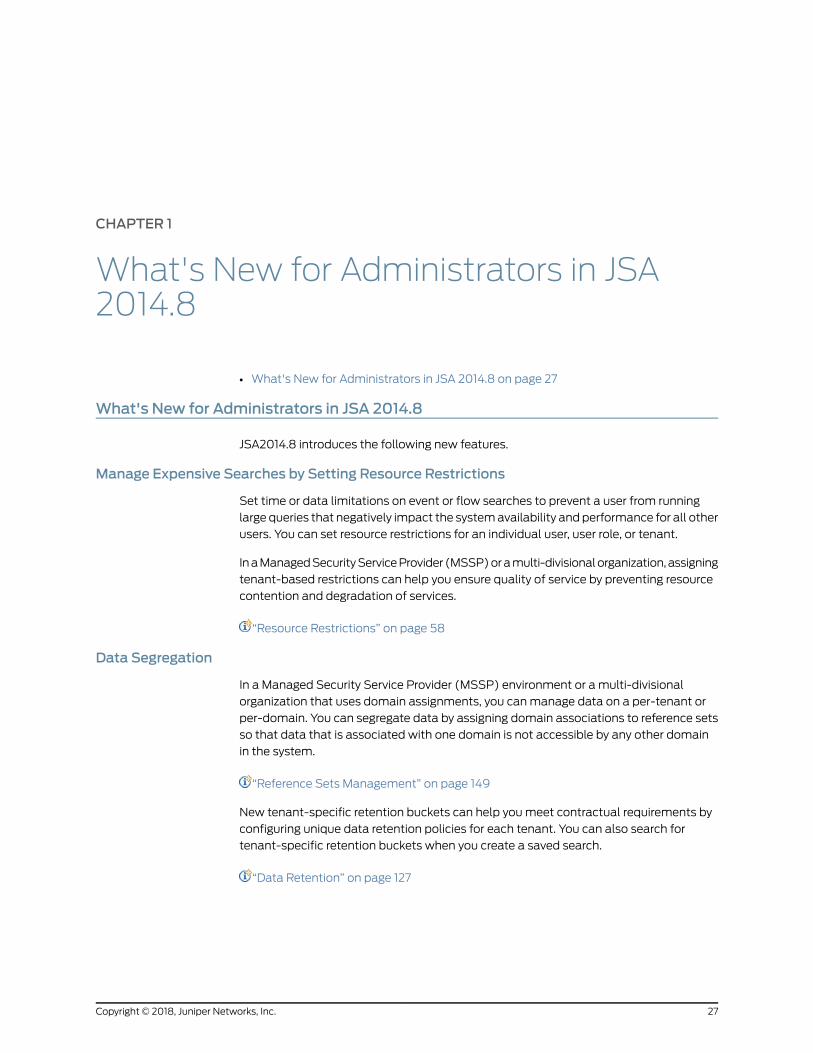
CHAPTER 1
What's New for Administrators in JSA2014.8
• What's New for Administrators in JSA 2014.8 on page 27
What's New for Administrators in JSA 2014.8
JSA2014.8 introduces the following new features.
Manage Expensive Searches by Setting Resource Restrictions
Set time or data limitations on event or flow searches to prevent a user from running
large queries that negatively impact the systemavailability and performance for all other
users. You can set resource restrictions for an individual user, user role, or tenant.
InaManagedSecurityServiceProvider (MSSP)oramulti-divisionalorganization,assigning
tenant-based restrictions can help you ensure quality of service by preventing resource
contention and degradation of services.
“Resource Restrictions” on page 58
Data Segregation
In a Managed Security Service Provider (MSSP) environment or a multi-divisional
organization that uses domain assignments, you canmanage data on a per-tenant or
per-domain. You can segregate data by assigning domain associations to reference sets
so that data that is associated with one domain is not accessible by any other domain
in the system.
“Reference Sets Management” on page 149
New tenant-specific retention buckets can help youmeet contractual requirements by
configuring unique data retention policies for each tenant. You can also search for
tenant-specific retention buckets when you create a saved search.
“Data Retention” on page 127
27Copyright © 2018, Juniper Networks, Inc.

Juniper X-Force Threat Intelligence Feed is Includedwith All Standard Deployments
The IP reputation data from Juniper NetworksX-Force®provides enhanced vulnerability
protection by providing deeper insight into the offenses that occur in your environment.
When you upgrade to JSA2014.8, the rich threat data in the Juniper X-Force®Threat
Intelligence feed does not require a separate license and is available to all JSA users.
“Juniper Networks X-Force Integration” on page 145
Simplified Data Ingestion
JSA introduces simplified data ingestion, with a new streamlined user interface that is
intended for rapiddata ingestion, andcapabilities tomodify existingparsingasnecessary.
The new DSM editor enhances capability by allowing field extraction, custom property
definition, event categorization, and newQID definition.
“Getting Data Into JSA” on page 415
Delete or Reassign ContentWhen You Delete Users
When you delete a user, JSA checks for content that is owned by the user and gives you
the option of either deleting it or reassigning it to another user. This capability helps you
avoid orphaned content, which can lead to unnecessary resource usage and unexpected
warnings in JSA.
Copyright © 2018, Juniper Networks, Inc.28
Juniper Secure Analytics Administration Guide

CHAPTER 2
Overview Of JSA Administration
• Overview Of JSA Administration on page 29
• Capabilities in Your Security Intelligence Product on page 29
• SupportedWeb Browsers on page 31
• Admin Tab Overview on page 31
• Deploying Changes on page 32
• Updating User Details on page 33
• Resetting SIM on page 34
• Monitoring Systems with SNMP on page 35
• Managing Aggregated Data Views on page 35
• Accessing a GLOBALVIEWDatabase on page 36
• RESTful API on page 37
• Adding Custom Actions on page 39
• Testing Your Custom Action on page 40
OverviewOf JSA Administration
Administrators use the Admin tab in JSA tomanage dashboards, log activity, offenses,
network activity, assets (if available), and reports.
This overview includes general information on how to access and use the user interface
and the Admin tab.
Capabilities in Your Security Intelligence Product
JSA product documentation describes functionality such as offenses, flows, assets, and
historical correlation, that might not be available in all JSA products. Depending on the
product that you are using, some documented features might not be available in your
deployment. Review the capabilities for each product to guide you to the information
that you need.
JSA includes the full range of security intelligence capabilities for on-premises
deployments. JSA consolidates log source event data from device endpoints and
applications that are distributed throughout your network, and performs immediate
29Copyright © 2018, Juniper Networks, Inc.

normalization and correlation activities on raw data to distinguish real threats from false
positives.
Use Log Manager to collect, analyze, archive, and store large volumes of network and
security event logs. LogManager analyzesdata toprovide visibility intodeveloping threats,
and it can help you to meet compliancemonitoring and reporting requirements.
When you are looking for help, use the following table, which lists the capabilities of the
products:
Table 3: Comparison Of JSA Capabilities
LogManagerJSACapability
NoNoSupports hosted deployments
YesYesCustomizable dashboards
YesYesCustom rules engine
YesYesManage network and security events
YesYesManage host and application logs
YesYesThreshold-based alerts
YesYesCompliance templates
YesYesData archiving
YesYesJuniper X-Force® Threat Intelligence IP reputation feed integration
YesYesWinCollect stand alone deployments
YesYesWinCollect managed deployments
YesYesJSA Vulnerability Manager integration
NoYesNetwork activity monitoring
No 1YesAsset profiling
NoYesOffenses management
NoYesNetwork flow capture and analysis
NoYesHistorical correlation
NoYesJSA Risk Manager integration
1Log Manager only tracks asset data if JSA Vulnerability Manager is installed.
Copyright © 2018, Juniper Networks, Inc.30
Juniper Secure Analytics Administration Guide

RelatedDocumentation
SupportedWeb Browsers on page 31•
• Admin Tab Overview on page 31
• Deploying Changes on page 32
SupportedWeb Browsers
For the features in JSAproducts towork properly, youmust use a supportedwebbrowser.
When you access the JSA system, you are prompted for a user name and a password.
The user name and passwordmust be configured in advance by the administrator.
The following table lists the supported versions of web browsers.
Table 4: SupportedWeb Browsers for JSA Products
Supported versionsWeb browser
45.2 Extended Support ReleaseMozilla Firefox
11.064-bit Microsoft Internet Explorer with Microsoft Edgemode enabled.
RelatedDocumentation
Admin Tab Overview on page 31•
• Deploying Changes on page 32
• Updating User Details on page 33
Admin Tab Overview
The Admin tab provides several tab andmenu options that allow you to configure JSA.
Youmust have administrative privileges to access administrative functions. To access
administrative functions, click the Admin tab on the user interface.
The Admin tab also includes the following menu options:
Table 5: Admin TabMenu Options
DescriptionMenu option
Opens theDeploymentEditorwindow.Formore information, see “DeploymentEditor” onpage 183.Deployment Editor
Deploys any configuration changes from the current session to your deployment. For moreinformation, see “Deploying Changes” on page 32.
Deploy Changes
31Copyright © 2018, Juniper Networks, Inc.
Chapter 2: Overview Of JSA Administration

Table 5: Admin TabMenu Options (continued)
DescriptionMenu option
The Advancedmenu provides the following options:
Clean SIMModel—Resets the SIMmodule. See “Resetting SIM” on page 34.
Deploy Full Configuration—Deploys all configuration changes.
When you deploy the full configuration, JSA restarts all services. Data collection for events andflows stops until the deployment completes.
For more information, see “Deploying Changes” on page 32.
Advanced
RelatedDocumentation
Deploying Changes on page 32•
• Updating User Details on page 33
• Resetting SIM on page 34
Deploying Changes
You can update your configuration settings from the Admin tab. Your changes are saved
to a staging area where they are stored until you manually deploy the changes.
Each time that youaccess theAdmin tabandeach timeyoucloseawindowon theAdmin
tab, a banner at the top of the Admin tab displays the following message: Checking for
undeployed changes. If undeployed changes are found, the banner updates to provide
information about the undeployed changes.
If the list of undeployed changes is lengthy, a scroll bar is provided. Scroll through the
list.
The banner message also suggests which type of deployment change to make. Choose
one of the two options:
• Deploy Changes—Click the Deploy Changes icon on the Admin tab toolbar to deploy
any configuration changes from the current session to your deployment.
• DeployFullConfiguration—SelectAdvanced>DeployFullConfiguration from theAdmin
tabmenu todeployall configuration settings to yourdeployment. All deployedchanges
are then applied throughout your deployment.
NOTE: When you click Deploy Full Configuration, JSA restarts all services,
which results in a gap in data collection until deployment completes.
After you deploy your changes, the banner clears the list of undeployed changes and
checks the staging area again for any new undeployed changes. If none are present, the
following message is displayed: There are no changes to deploy.
Copyright © 2018, Juniper Networks, Inc.32
Juniper Secure Analytics Administration Guide

1. Click View Details
2. Choose one of the following options:
a. To expand a group to display all items, click the plus sign (+) beside the text.When
done, you can click the minus sign (-).
b. To expand all groups, click Expand All. When done, you can click Collapse All.
c. Click Hide Details to hide the details from view again.
3. Perform the suggested task:
a. From the Admin tabmenu, click Deploy Changes.
b. From the Admin tabmenu, click Advanced >Deploy Full Configuration.
When you deploy the full configuration, JSA restarts all services. Data collection
for events and flows stops until the deployment completes.
RelatedDocumentation
Updating User Details on page 33•
• Resetting SIM on page 34
• Monitoring Systems with SNMP on page 35
Updating User Details
You can access your administrative user details through themain user interface.
1. Click Preferences.
2. Update the configurable user details.
DescriptionParameter
Type a new email addressEmail
Type a new passwordPassword
Type the new password againPassword (Confirm)
Pop-up system notification messages are displayed at thelower right corner of the user interface. To disable pop-upnotifications, clear this check box.
For more information about pop-up notifications, see theJuniper Secure Analytics Users Guide for your product.
Enable Popup Notifications
3. Click Save.
33Copyright © 2018, Juniper Networks, Inc.
Chapter 2: Overview Of JSA Administration

RelatedDocumentation
Resetting SIM on page 34•
• Monitoring Systems with SNMP on page 35
• Managing Aggregated Data Views on page 35
Resetting SIM
Use the Admin to reset the SIMmodule. You can now remove all offense, source IP
address, and destination IP address information from the database and the disk.
This option is useful after you tune your deployment to avoid receiving any additional
false positive information.
The SIM reset process can take several minutes, depending on the amount of data in
your system. If you attempt to move to other areas of the JSA user interface during the
SIM reset process, an error message is displayed.
1. Click the Admin tab.
2. From the Advancedmenu, select Clean SIMModel.
3. Read the information on the Reset SIM DataModulewindow.
4. Select one of the following options.
Closes all offenses in the database. If you select theSoftCleanoption, you can also select the Deactivate all offenses checkbox.
Soft Clean
Purges all current and historical SIM data, which includesoffenses, source IP addresses, and destination IP addresses.
Hard Clean
5. If youwant to continue, select theAreyousureyouwant to reset thedatamodel? check
box.
6. Click Proceed.
7. When the SIM reset process is complete, click Close.
8. When the SIM reset process is complete, reset your browser.
RelatedDocumentation
Monitoring Systems with SNMP on page 35•
• Managing Aggregated Data Views on page 35
Copyright © 2018, Juniper Networks, Inc.34
Juniper Secure Analytics Administration Guide

• Accessing a GLOBALVIEWDatabase on page 36
Monitoring Systemswith SNMP
Monitoring of appliances through SNMP polling.
JSAuses theNet-SNMPagent,which supports various system resourcemonitoringMIBs.
They can be polled by Network Management solutions for the monitoring and alerting
of system resources. For more information about Net-SNMP, see Net-SNMP
documentation.
RelatedDocumentation
Managing Aggregated Data Views on page 35•
• Accessing a GLOBALVIEWDatabase on page 36
• RESTful API on page 37
Managing Aggregated Data Views
A large volume of data aggregation can decrease your system performance. The Ariel
function uses a separate database for aggregated data in order to improve system
performance and tomake the data more readily available. You can disable, enable, or
delete aggregated data views. Time series charts, report charts use aggregated data
views.
The items that appear in the Display list sort the data.
The Aggregated Data View is required to generate data for ADE rules, time series graphs,
and reports.
Disable or delete views if the maximum number of views is reached.
Duplicate views can appear in the Aggregated Data ID column because an aggregated
data view can includemultiple searches.
1. On the Admin tab, click SystemConfiguration.
2. Click the Aggregated DataManagement icon.
3. To filter the list of aggregated data views, perform one the following options:
• Select an option from the View, Database, Show, or Display list.
• Type an aggregated data ID, report name, chart name, or saved search name in the
search field.
4. Tomanage an aggregated data view, select the view, and then click the appropriate
action on the toolbar:
35Copyright © 2018, Juniper Networks, Inc.
Chapter 2: Overview Of JSA Administration

• If you select Disable View or Delete View, content dependencies are displayed for
the aggregated data view. After you disable or delete the view, the dependent
components no longer use aggregated data.
• Enable a previously disabled aggregated data view to restore the view.
Table 6: Aggregated DataManagement View Column Descriptions
DescriptionColumn
Identifier for the aggregated dataAggregated Data ID
Defined name for the saved searchSaved Search Name
Column identifierColumn Name
Search countTimes Searches
The size of the written dataDataWritten
Database where the file was writtenDatabase Name
Timestamp of the last data modificationLast Modified Time
True or False: Search the results to display unique event andflowcounts instead of average counts over time.
Unique Count Enabled
RelatedDocumentation
Accessing a GLOBALVIEWDatabase on page 36•
• RESTful API on page 37
• Adding Custom Actions on page 39
Accessing a GLOBALVIEWDatabase
Use the JSARESTAPIdocumentation interface toget theGLOBALVIEWdatabase results
foragivensavedsearchnameandtime range.The typeofdatacontained in thedatabase
results corresponds to the type of saved search queried.
1. Find a saved search.
a. On the Admin tab, click Aggregated DataManagement.
b. Under the Saved Search Name column, record a saved search name from the list.
2. Query the JSA REST API to find a search ID.
a. Log in to the JSA API, https://<Console IP>/api_doc, as an administrator.
b. Click the most recent version of the JSA API.
c. Click the /ariel/searches endpoint.
Copyright © 2018, Juniper Networks, Inc.36
Juniper Secure Analytics Administration Guide

d. Click POST.
e. In thequery_expressionparameter field, type the following command: select * from
GLOBALVIEW('savedsearch','timerange')
Use one of the following values for the timerange variable:
NORMALHOURLYDAILY
The following example shows query for Top Log Sources with a time range of the
last two days:
select * fromGLOBALVIEW('Top Log Sources','DAILY') last 2 days
f. Click Try It Out!
g. Copy the search ID from the response body.
3. Get the search results.
a. From the /ariel/searches/search{id}/results endpoint, click GET.
b. In the search_id parameter field, enter the search ID.
c. Click Try It Out!.
d. Ensure that the search successfully completes.
e. Get the database results from the response body.
RelatedDocumentation
RESTful API on page 37•
• Adding Custom Actions on page 39
• Testing Your Custom Action on page 40
RESTful API
Use the representational state transfer (REST) application programming interface (API)
to make HTTPS queries and integrate JSA with other solutions.
Access and User Role Permissions
Youmust have administrative user role permissions in JSA to access and use RESTful
APIs.
Access to the REST API Technical Documentation User Interface
The API user interface provides descriptions and capabilities for the following REST API
interfaces:
37Copyright © 2018, Juniper Networks, Inc.
Chapter 2: Overview Of JSA Administration

Table 7: REST API Interfaces
DescriptionREST API
Query databases, searches, search IDs, and search results./api/ariel
Returns a list of all assets in the model. You can also list allavailableassetproperty typesandsavedsearches, andupdatean asset.
/api/asset_model
Log out and invalidate the current session./api/auth
Returns a list of API capabilities./api/help
Returns a list of all offenses./api/siem
Review andmanage JSA Vulnerability Manager data./api/qvm
View andmanage reference data collections./api/reference_data
Retrieves assets, vulnerabilities, networks, open services,networks, and filters. You can also create or updateremediation tickets.
/api/qvm
View, create, or start a remote scan that is related to a scanprofile.
/api/scanner
The RESTAPI technical documentation interface provides a framework that you can use
togather the requiredcode that youneed to implement JSA functions intoother products.
1. Enter the following URL in your web browser to access the technical documentation
interface: https://ConsoleIPaddress/api_doc.
2. Click the header for the API that you want to access, for example, /ariel.
3. Click the subhead for the endpoint that you want to access, for example, /databases.
4. Click the Experimental or Provisional sub header.
NOTE: TheAPI endpoints are annotated as either experimental or stable.
Experimental—Indicates that the API endpoint might not be fully testedandmight change or be removed in the future without any notice.
Stable—Indicates that the API endpoint is fully tested and supported.
5. Click Try it out to receive properly formatted HTTPS responses.
6. Review and gather the information that you need to implement in your third-party
solution.
Copyright © 2018, Juniper Networks, Inc.38
Juniper Secure Analytics Administration Guide

RelatedDocumentation
Adding Custom Actions on page 39•
• Testing Your Custom Action on page 40
• Accessing a GLOBALVIEWDatabase on page 36
Adding CustomActions
Attach scripts to custom rules to do specific actions in response to network events. Use
the CustomActionwindow tomanage custom action scripts.
Use custom actions to select or define the value that is passed to the script and the
resulting action.
For example, you can write a script to create a firewall rule that blocks a source IP
address from your network in response to a rule that is triggered by a defined number of
failed login attempts.
The following examples are custom actions that are the outcomes of passing values to
a script:
• Block users and domains.
• Initiate work flows and updates in external systems.
• Update TAXI servers with a STIX representation of a threat.
Custom actions work best with low volume custom rule events and with custom rules
that have a low response limiter value.
1. Click the Admin tab.
2. Under CustomAction, click Define CustomAction.
3. Touploadscripts, clickAdd. Programming languageversions that theproduct supports
are listed in the Interpreter list.
For the security of your deployment, JSA does not support the full range of scripting
functionality that is provided by the Python, Perl, or Bash languages.
4. Specify the parameters to pass to the script that you uploaded.
Table 8: CustomAction Parameters
DescriptionParameter
Values that are passed to the custom action script.
These properties are not based on the events or flow themselves, but cover otherdefined values that you can use the script to act on.
For example, pass the fixedpropertiesusernameandpassword for a third-party systemto a script to send an SMS alert.
Encrypt fixed properties by selecting the Encrypt value check box.
Fixed property
39Copyright © 2018, Juniper Networks, Inc.
Chapter 2: Overview Of JSA Administration

Table 8: CustomAction Parameters (continued)
DescriptionParameter
Dynamic Ariel properties that are generated by events. Select from the Property list.
For example, the network event property sourceip provides a parameter that matchesthe source IP address of the triggered event.
Formore informationaboutAriel properties, see the Juniper SecureAnalyticsArielQueryLanguage Guide.
Network event property
Parameters are passed into your script in the order inwhich you added them in theDefine
CustomAction dialog.
RelatedDocumentation
Testing Your Custom Action on page 40•
• Accessing a GLOBALVIEWDatabase on page 36
• RESTful API on page 37
Testing Your CustomAction
Testwhether your script runssuccessfullyandhas the intended resultbeforeyouassociate
it with a rule.
Custom action scripts run inside a testing environment on your JSAmanaged hosts that
is isolated from your production environment. If youmust write to disk from a custom
action script, you must use the following directory: /home/customactionuser. Custom
action scripts typically run on themanaged host that runs the event processor. However,
if youhaveanAll-In-Oneappliance, customactions runon the JSAconsole.TestExecution
is supported only on the JSA console and is not supported onmanaged hosts.
1. On the Admin tab, click Define Actions.
2. Select a custom action from the list and click Test Execution >Execute to test your
script. The result of the test and any output that is produced by the script is returned.
3. After you configure and test your custom action, use the RuleWizard to create a new
event rule and associate the custom action with it.
For more information about event rules, see the Juniper Secure Analytics Users Guide.
RelatedDocumentation
• Accessing a GLOBALVIEWDatabase on page 36
• RESTful API on page 37
• Adding Custom Actions on page 39
Copyright © 2018, Juniper Networks, Inc.40
Juniper Secure Analytics Administration Guide

CHAPTER 3
User Management
• User Management on page 41
• User Roles on page 41
• Security Profiles on page 44
• User Accounts on page 49
• User Authentication on page 51
• Resource Restrictions on page 58
User Management
You define user roles, security profiles, and user accounts to control who has access to
JSA, which tasks they can perform, and which data they have access to.
Use the UserManagement feature in the Admin tab in JSA to configure andmanage user
accounts.
When you initially configure JSA, youmust create user accounts for all users that require
access to JSA.
User Roles
A user role defines the functions that a user can access in JSA.
During the installation, two default user roles are defined: Admin and All.
Before you add user accounts, youmust create the user roles to meet the permission
requirements of your users.
• Creating a User Role on page 41
• Editing a User Role on page 42
• Deleting a User Role on page 43
Creating a User Role
Create user roles to manage the functions that a user can access in JSA.
Bydefault, your systemprovidesadefault administrativeuser role,whichprovidesaccess
to all areas of JSA. Users who are assigned an administrative user role cannot edit their
41Copyright © 2018, Juniper Networks, Inc.

ownaccount.This restrictionapplies to thedefaultAdminuser role.Anotheradministrative
user must make any account changes.
1. Click the Admin tab.
2. On the navigation menu, click SystemConfiguration >User Management.
3. Click the User Roles icon.
4. On the toolbar, click New.
5. In the User Role Name field, type a unique name for this user role.
6. Select the permissions that you want to assign to the user role.
7. In the Dashboards area, select the dashboards you want the user role to access, and
click Add.
NOTE: Adashboard displays no information if the user role does not havepermission to view dashboard data. If a user modifies the displayeddashboards, the defined dashboards for the user role appear at the nextlogin.
8. Click Save and close the User Role Managementwindow.
9. On the Admin tabmenu, click Deploy Changes.
Editing a User Role
You can edit an existing role to change the permissions that are assigned to the role.
To quickly locate the user role you want to edit on the User Role Managementwindow,
you can type a role name in the Type to filter text box. This box is located above the left
pane.
1. Click the Admin tab.
2. On the navigation menu, click SystemConfiguration >User Management.
3. Click the User Roles icon.
4. In the left pane of the User Role Managementwindow, select the user role that you
want to edit.
Copyright © 2018, Juniper Networks, Inc.42
Juniper Secure Analytics Administration Guide

5. In the right pane, update the permissions, as necessary.
6. Modify the Dashboards options for the user role as required.
7. Click Save.
8. Close the User Role Managementwindow.
9. On the Admin tabmenu, click Deploy Changes.
Deleting a User Role
If a user role is no longer required, you can delete the user role.
If user accounts are assigned to the user role you want to delete, youmust reassign the
user accounts to another user role. The system automatically detects this condition and
prompts you to update the user accounts.
You canquickly locate the user role that youwant to delete on theUserRoleManagement
window. Type a role name in the Type to filter text box, which is located above the left
pane.
1. Click the Admin tab.
2. On the Navigationmenu, click SystemConfiguration >User Management.
3. Click the User Roles icon.
4. In the left pane of the User Role Managementwindow, select the role that you want
to delete.
5. On the toolbar, click Delete.
6. ClickOK.
• If user accounts are assigned to this user role, the Users are Assigned to this User
Rolewindow opens. Go to Step 7.
• If no user accounts are assigned to this role, the user role is successfully deleted.
Go to Step 8.
7. Reassign the listed user accounts to another user role:
a. From the User Role to assign list box, select a user role.
b. Click Confirm.
43Copyright © 2018, Juniper Networks, Inc.
Chapter 3: User Management

8. Close the User Role Managementwindow.
9. On the Admin tabmenu, click Deploy Changes.
RelatedDocumentation
Security Profiles on page 44•
• User Accounts on page 49
• User Authentication on page 51
Security Profiles
Security profiles definewhich networks, log sources, anddomains that a user canaccess.
JSA includes one default security profile for administrative users. The Admin security
profile includes access to all networks, log sources, and domains.
Before youadduser accounts, youmust createmore security profiles tomeet the specific
access requirements of your users.
• Domains on page 44
• Permission Precedence on page 45
• Creating a Security Profile on page 45
• Editing a Security Profile on page 47
• Duplicating a Security Profile on page 48
• Deleting a Security Profile on page 48
Domains
Security profilesmust be updatedwith an associated domain. Youmust define domains
on the DomainManagementwindow before the Domains tab is shown on the Security
Profile Managementwindow. Domain-level restrictions are not applied until the security
profiles are updated, and the changes are deployed.
Domain assignments take precedence over all settings on the Permission Precedence,
Networks, and Log Sources tabs.
If the domain is assigned to a tenant, the tenant name appears in brackets beside the
domain name in the Assigned Domainswindow.
RelatedDocumentation
User Accounts on page 49•
• User Authentication on page 51
• Resource Restrictions on page 58
Copyright © 2018, Juniper Networks, Inc.44
Juniper Secure Analytics Administration Guide

Permission Precedence
Permission precedence determineswhich security profile components to consider when
the system displays events in the Log Activity tab and flows in the Network Activity tab.
Choose from the following restrictions when you create a security profile:
• No Restrictions This option does not place restrictions on which events are displayed
in the Log Activity tab, and which flows are displayed in the Network Activity tab.
• Network Only This option restricts the user to view only events and flows that are
associated with the networks that are specified in this security profile.
• Log Sources Only This option restricts the user to view only events that are associated
with the log sources that are specified in this security profile.
• Networks AND Log Sources This option allows the user to view only events and flows
that are associatedwith the log sources and networks that are specified in this security
profile.
For example, if the security profile allows access to events from a log source but the
destination network is restricted, the event is not displayed in the Log Activity tab. The
event must match both requirements.
• Networks OR Log Sources This option allows the user to view events and flows that
are associatedwith either the log sources or networks that are specified in this security
profile.
For example, if a security profile allows access to events from a log source but the
destination network is restricted, the event is displayed on the Log Activity tab if the
permission precedence is set to Networks OR Log Sources. If the permission precedence
is set to Networks AND Log Sources, the event is not displayed on the Log Activity tab.
Permission Precedence for Offense Data
Securityprofilesautomatically use theNetworksORLogSourcespermissionwhenoffense
data is shown. For example, if an offense has a destination IP address that your security
profile permits you to see, but the security profile doesnot grantpermissions to the source
IP address, theOffense Summarywindow shows both the destination and source IP
addresses.
Creating a Security Profile
To add user accounts, youmust first create security profiles to meet the specific access
requirements of your users.
JSA includes one default security profile for administrative users. The Admin security
profile includes access to all networks, log sources, and domains.
To select multiple items on the Security Profile Managementwindow, hold the Control
key while you select each network or network group that you want to add.
45Copyright © 2018, Juniper Networks, Inc.
Chapter 3: User Management

If after you addnetworks, log sources or domains youwant to remove one ormore before
you save the configuration, you can select the item and click the Remove (<) icon. To
remove all items, click Remove All.
1. Click the Admin tab.
2. On the navigation menu, click SystemConfiguration >User Management.
3. Click the Security Profiles icon.
4. On the Security Profile Management window toolbar, click New.
5. Configure the following parameters:
a. In the Security Profile Name field, type a unique name for the security profile. The
security profile namemust meet the following requirements: minimum of 3
characters andmaximum of 30 characters.
b. <Optional>Type a description of the security profile. Themaximum number of
characters is 255.
6. Click the Permission Precedence tab.
7. In the Permission Precedence Setting pane, select a permission precedence option.
See “Permission Precedence” on page 45.
8. Configure the networks that you want to assign to the security profile:
a. Click the Networks tab.
b. From the navigation tree in the left pane of the Networks tab, select the network
that you want this security profile to have access to.
c. Click the Add (>) icon to add the network to the Assigned Networks pane.
d. Repeat for each network you want to add.
9. Configure the log sources that you want to assign to the security profile:
a. Click the Log Sources tab.
b. From the navigation tree in the left pane, select the log source group or log source
you want this security profile to have access to.
c. Click the Add (>) icon to add the log source to the Assigned Log Sources pane.
d. Repeat for each log source you want to add.
10. Configure the domains that you want to assign to the security profile:
a. Click the Domains tab.
b. From the navigation tree in the left pane, select the domain that you want this
security profile to have access to.
Copyright © 2018, Juniper Networks, Inc.46
Juniper Secure Analytics Administration Guide

c. Click the Add (>) icon to add the domain to the Assigned Domains pane.
d. Repeat for each domain that you want to add.
11. Click Save.
NOTE: The log sources and domains that are assigned to the securityprofilemustmatch. You cannot save the security profile if the log sourcesand domains do not match.
12. Close the Security Profile Managementwindow.
13. On the Admin tabmenu, click Deploy Changes.
Editing a Security Profile
You can edit an existing security profile to update which networks and log sources a user
can access and the permission precedence.
To quickly locate the security profile youwant to edit on the Security ProfileManagement
window, type the security profile name in the Type to filter text box. It is located above
the left pane.
1. Click the Admin tab.
2. On the navigation menu, click SystemConfiguration >User Management.
3. Click the Security Profiles icon.
4. In the left pane, select the security profile you want to edit.
5. On the toolbar, click Edit.
6. Update the parameters as required.
7. Click Save.
8. If the Security Profile Has Time Series Datawindow opens, select one of the following
options:
Select this option to keep previously accumulated time seriesdata. If you choose this option, issuesmight occur when usersassociated with this security profile views time series charts.
Keep Old Data and Save
Select this option to hide the time-series data. If you choosethis option, time series data accumulation restarts after youdeploy your configuration changes.
Hide Old Data and Save
47Copyright © 2018, Juniper Networks, Inc.
Chapter 3: User Management

9. Close the Security Profile Managementwindow.
10. On the Admin tabmenu, click Deploy Changes.
Duplicating a Security Profile
If you want to create a new security profile that closely matches an existing security
profile, you can duplicate the existing security profile and thenmodify the parameters.
To quickly locate the security profile you want to duplicate on the Security Profile
Management window, you can type the security profile name in the Type to filter text
box, which is located above the left pane.
1. Click the Admin tab.
2. On the navigation menu, click SystemConfiguration User Management.
3. Click the Security Profiles icon.
4. In the left pane, select the security profile you want to duplicate.
5. On the toolbar, click Duplicate.
6. In the Confirmationwindow, type a unique name for the duplicated security profile.
7. ClickOK.
8. Update the parameters as required.
9. Close the Security Profile Managementwindow.
10. On the Admin tabmenu, click Deploy Changes.
Deleting a Security Profile
If a security profile is no longer required, you can delete the security profile.
If user accountsareassigned to the security profiles youwant todelete, youmust reassign
the user accounts to another security profile. JSA automatically detects this condition
and prompts you to update the user accounts.
To quickly locate the security profile you want to delete on the Security Profile
Managementwindow, you can type the security profile name in the Type to filter text box.
It is located above the left pane.
Copyright © 2018, Juniper Networks, Inc.48
Juniper Secure Analytics Administration Guide

1. Click the Admin tab.
2. On the navigation menu, click SystemConfiguration >User Management.
3. Click the Security Profiles icon.
4. In the left pane, select the security profile that you want to delete.
5. On the toolbar, click Delete.
6. ClickOK.
• If user accounts are assigned to this security profile, the Users are Assigned to this
Security Profilewindow opens. Go to “Deleting a User Role” on page 43.
• If no user accounts are assigned to this security profile, the security profile is
successfully deleted. Go to “Deleting a User Role” on page 43.
7. Reassign the listed user accounts to another security profile:
a. From the User Security Profile to assign list box, select a security profile.
b. Click Confirm.
8. Close the Security Profile Managementwindow.
9. On the Admin tabmenu, click Deploy Changes.
User Accounts
The user account defines the unique username that is used to log in to JSA, and specifies
which user role, security profile, and tenant assignments the user is assigned to.
When you initially configure your system, youmust create user accounts for each user
who requires access to JSA.
• Creating a User Account on page 49
• Deleting a User Account on page 50
RelatedDocumentation
User Authentication on page 51•
• Resource Restrictions on page 58
• Security Profiles on page 44
Creating a User Account
You can create new user accounts.
49Copyright © 2018, Juniper Networks, Inc.
Chapter 3: User Management

Before you can create a user account, youmust ensure that the required user role and
security profile are created.
When you create a new user account, youmust assign access credentials, a user role,
and a security profile to the user. User Roles definewhat actions the user has permission
to perform. Security Profiles define what data the user has permission to access.
You can create multiple user accounts that include administrative privileges; however,
anyAdministratorManager user accounts can create other administrative user accounts.
1. Click the Admin tab.
2. On the navigation menu, click SystemConfiguration >User Management.
3. Click the Users icon.
4. On the User Management toolbar, click New.
5. Enter values for the following parameters:
a. In the Username field, type a unique user name for the new user. The user name
must contain a maximum 30 characters.
b. In the Password field, type a password for the user to gain access.
The passwordmust meet the following criteria:
• Minimum of 5 characters
• Maximum of 255 characters
6. Click Save.
7. Close the User Detailswindow.
8. Close the User Managementwindow.
9. On the Admin tabmenu, click Deploy Changes.
Deleting a User Account
If a user account is no longer required, you can delete the user account.
After you delete a user, the user no longer has access to the user interface. If the user
attempts to log in, a message is displayed to inform the user that the user name and
password is no longer valid. Items that a deleted user created, such as saved searches
and reports remain associated with the deleted user.
To quickly locate the user account you want to delete on the User Managementwindow,
you can type the user name in the Search User text box on the toolbar.
Copyright © 2018, Juniper Networks, Inc.50
Juniper Secure Analytics Administration Guide

1. Click the Admin tab.
2. On the navigation menu, click SystemConfiguration >User Management.
3. Click the Users icon.
4. Select the user that you want to delete.
5. On the toolbar, click Delete.
6. ClickOK.
7. Close the User Managementwindow.
User Authentication
When authentication is configured and a user enters an invalid user name and password
combination, a message is displayed to indicate that the login was invalid.
If the user attempts to access the systemmultiple times with invalid information, the
user must wait the configured amount of time before another attempt to access the
system again. You can configure console settings to determine the maximum number
of failed logins, andother relatedsettings. Formore informationabout configuringconsole
settings for authentication, see “JSA System Time Configuration” on page 83.
JSA supports the following authentication types:
• System authentication Users are authenticated locally. System authentication is the
default authentication type.
• RADIUS authentication Users are authenticated by a Remote Authentication Dial-in
User Service (RADIUS) server. When a user attempts to log in, JSA encrypts the
password only, and forwards the user name and password to the RADIUS server for
authentication.
• TACACSauthenticationUsersareauthenticatedbyaTerminalAccessControllerAccess
Control System (TACACS) server. When a user attempts to log in, JSA encrypts the
user name and password, and forwards this information to the TACACS server for
authentication. TACACS Authentication uses Cisco Secure ACS Express as a TACACS
server. JSA supports up to Cisco Secure ACS Express 4.3.
• Microsoft Active Directory Users are authenticated by a Lightweight Directory Access
Protocol (LDAP) server that uses Kerberos.
• LDAP Users are authenticated by a Native LDAP server.
• Prerequisite Checklist for External Authentication Providers on page 52
• External Authentication Guidelines for Administrative Users on page 52
51Copyright © 2018, Juniper Networks, Inc.
Chapter 3: User Management

• Configuring System Authentication on page 53
• LDAP Authentication on page 53
Prerequisite Checklist for External Authentication Providers
Before youcanconfigureRADIUS,TACACS,ActiveDirectory, or LDAPas theauthentication
type, youmust complete the following tasks:
• Configure the authentication server before you configure authentication in JSA. For
more information, see your server documentation.
• Ensure that the server has the appropriate user accounts and privilege levels to
communicate with JSA. For more information, see your server documentation.
• Ensure that the time of the authentication server is synchronized with the time of the
JSA server. For more information about setting time, see “Set Up JSA” on page 97.
• Ensure that all users have appropriate user accounts and roles to allow authentication
with the vendor servers.
RelatedDocumentation
Resource Restrictions on page 58•
• Security Profiles on page 44
• User Accounts on page 49
External Authentication Guidelines for Administrative Users
Administrative users must be able to log into JSA when external authentication fails.
The JSA administrative roles have both the external and local authentication methods
available in case the external authentication fails. If the remote authentication fails, the
administrative users can log in by using the local password. A local passwordmust be
set for administrative users when external authentication is configured.
The local password is not set when you create a non-administrative users because the
local password I not synchronized with the remote authority. Non-administrative users
are only able to authenticate their username and password to the remote authority. If
the remoteauthority is disabledor theother user credentials are rejected, theuser cannot
log in.
Administrative users must update both the local and remote authentication passwords
at the same time to avoid issues when the user logs in to JSA and the remote
authentication source is disabled. You cannot change the local administration password
while the remote authority is active. To change the administration password, youmust:
1. Temporarily disable external authentication.
2. Reset the password.
3. Reconfigure external password.
Copyright © 2018, Juniper Networks, Inc.52
Juniper Secure Analytics Administration Guide

Configuring SystemAuthentication
You can configure local authentication on your JSA system.
1. Click the Admin tab.
2. On the navigation menu, click SystemConfiguration >User Management.
3. Click the Authentication icon.
4. From the AuthenticationModule list box, select SystemAuthentication.
5. Click Save.
LDAP Authentication
You can configure JSA to use supported Lightweight Directory Access Protocol (LDAP)
providers for user authentication and authorization.
JSA reads the user and role information from the LDAP server, basedon the authorization
criteria that you defined.
In geographically dispersed environments, performance can be negatively impacted if
the LDAP server and the JSA console are not geographically close to each other. For
example, user attributes can take a long time to populate if the JSA console is in North
America and the LDAP server is in Europe.
Configuring LDAP Authentication
You can configure LDAP authentication on your JSA system.
If you plan to use SSL encryption or use TLS authentication with your LDAP server, you
must import the SSL or TLS certificate from the LDAP server to the
/opt/qradar/conf/trusted_certificatesdirectory on your JSAconsole. Formore information
about configuring the certificates, see “Configuring SSL or TLS Certificates” on page 55.
If you are using group authorization, youmust configure a JSA user role or security profile
on the JSAconsole for eachLDAPgroup that is usedby JSA. Every JSAuser role or security
profile must have at least one Accept group. Themapping of group names to user roles
and security profiles is case-sensitive.
Authentication establishes proof of identity for any user who attempts to log in to the
JSA server. When a user logs in, the user name and password are sent to the LDAP
directory to verify whether the credentials are correct. To send this information securely,
configure the LDAP server connection to use Secure Socket Layer (SSL) or Transport
Layer Security (TLS) encryption.
Authorization is the process of determining what access permissions a user has. Users
are authorized to perform tasks based on their role assignments. Youmust have a valid
bind connection to the LDAP server before you can select authorization settings.
53Copyright © 2018, Juniper Networks, Inc.
Chapter 3: User Management

User attribute values are case-sensitive. Themapping of group names to user roles and
security profiles is also case-sensitive.
1. Click the Admin tab.
2. On the navigation menu, click SystemConfiguration >User Management and click the
Authentication icon.
3. From the AuthenticationModule list box, select LDAP.
4. Click Add and complete the basic configuration parameters.
5. Under Connection Settings, select the type of bind connection.
6. Click Test connection to test the connection information.
Youmust provide user information to authenticate against the user attributes that
you specified in LDAPUser Field. If you specified multiple values in LDAPUser Field,
you must provide user information to authenticate against the first attribute that is
specified.
7. Select the authorization method to use.
8. If you specified Group Based authorization, click Load Groups and click the plus (+)
or minus (-) icon to add or remove privilege groups.
The user role privilege options control which JSA components the user has access to.
The security profile privilege options control the JSA data that each user has access
to.
NOTE: Query limits can be set by selecting theQuery Limit Enabled check
box or the limits can be set on the LDAP server. If query limits are set ontheLDAPserver, youmight receiveamessage that indicates that thequerylimit is enabled even if you did not select theQuery Limit Enabled check
box.
9. Click Save.
10. ClickManagesynchronization toexchangeauthenticationandauthorization information
between the LDAP server and the JSA console.
a. If you are configuring the LDAP connection for the first time, click Run
Synchronization Now to synchronize the data.
b. Specify the frequency for automatic synchronization.
Copyright © 2018, Juniper Networks, Inc.54
Juniper Secure Analytics Administration Guide

c. Click Close.
11. Repeat the steps to addmore LDAP servers, and click Savewhen complete.
Synchronizing Data with an LDAP Server
Youcanmanually synchronize databetween the JSA server and the LDAPauthentication
server.
If you use authorization that is based on user attributes or groups, user information is
automatically imported from the LDAP server to the JSA console.
Each group that is configured on the LDAP server must have amatching user role or
security profile that is configured on the JSA console. For each group that matches, the
users are imported and assigned permissions that are based on that user role or security
profile.
By default, synchronization happens every 24 hours. The timing for synchronization is
based on the last run time. For example, if youmanually run the synchronization at 11:45
pm, and set the synchronization interval to 8 hours, the next synchronizationwill happen
at 7:45 am. If the access permissions change for a user that is logged in when the
synchronization occurs, the session becomes invalid. The user is redirected back to the
login screen with the next request.
1. Click the Admin tab.
2. On the navigation menu, click SystemConfiguration.
3. Click Authentication.
4. In the AuthenticationModule list, select LDAP.
5. ClickManage Synchronization >Run Synchronization Now.
Configuring SSL or TLS Certificates
If you use an LDAP directory server for user authentication and you want to enable SSL
encryption or TLS authentication, youmust configure your SSL or TLS certificate.
1. Using SSH, log in to your system as the root user.
a. User name: root
b. Password: <password>
2. Type the following command to create the /opt/qradar/conf/trusted_certificates/
directory:
mkdir -p /opt/qradar/conf/trusted_certificates
55Copyright © 2018, Juniper Networks, Inc.
Chapter 3: User Management

3. Copy the SSL or TLS certificate from the LDAP server to the
/opt/qradar/conf/trusted_certificates directory on your system.
4. Verify that thecertificate file nameextension is .cert,which indicates that thecertificate
is trusted.
The JSA system loads only .cert files.
Displaying Hover Text for LDAP Information
You create an LDAP properties configuration file to display LDAP user information as
hover text. This configuration file queries the LDAP database for LDAP user information
that is associated with events, offenses, or assets (if available).
The web server must be restarted after the LDAP properties is created. Consider
scheduling this task during amaintenance windowwhen no active users are logged in
to the system.
The followingexample listsproperties that youcanadd toan ldap.propertiesconfiguration
file.
ldap.url=ldap://LDAPserver.example.com:389ldap.authentication=simpleldap.userName=user.nameldap.password=your.encrypted.passwordldap.basedn=O=IBM,C=US ldap.filterString=(&(objectclass=user)(samaccountname=%USER%))ldap.attributes.displayName=Nameldap.attributes.email=Emailldap.attributes.employeeID=EmployeeIDldap.attributes.department=Department
1. Use SSH to log in to JSA as a root user.
2. To encrypt the LDAP user password, run the /opt/qradar/bin/runjava.sh
com.q1labs.core.util.PasswordEncrypt [password] script.
3. Use a text editor to create the /opt/qradar/conf/ldap.properties configuration file.
4. Specify the locationandauthentication information toaccess the remoteLDAPserver.
a. Specify the URL of the LDAP server and the port number.
Use ldaps:// or ldap:// to connect to the remote server, for example,
ldap.url=ldaps://LDAPserver.example.com:389.
b. Type the authentication method that is used to access the LDAP server.
Administrators can use the simple authentication method, for example,
ldap.authentication=simple.
c. Type the user name that has permissions to access the LDAP server.
For example, ldap.userName=user.name .
Copyright © 2018, Juniper Networks, Inc.56
Juniper Secure Analytics Administration Guide

d. Toauthenticate to the remoteLDAPserver, type theencryptedLDAPuserpassword
for the user.
For example, ldap.password=password .
e. Type the base DN used to search the LDAP server for users.
For example, ldap.basedn=BaseDN .
f. Type a value to use for the search parameter filter in LDAP.
For example, in JSA, when you hover over
ldap.filterString=(&(objectclass=user)(samaccountname=%USER%)), the
%USER% value is replaced by the user name.
5. Type one or more attributes to display in the hover text.
Youmust include at least one LDAP attribute. Each value must use this format:
ldap.attributes.AttributeName=Descriptive text to show in UI.
6. Verify that there is read-level permission for the ldap.properties configuration file.
7. Log in to JSA as an administrator.
8. On the Admin tab, select Advanced >RestartWeb Server.
Administrators can hover over the Username field on the Log Activity tab andOffenses
tab, or hover over the Last User field on the Assets tab (if available) to display more
information about the LDAP user.
Multiple LDAP Repositories
You can configure JSA tomapentries frommultiple LDAP repositories into a single virtual
repository.
If multiple repositories are configured, when a user logs in, they must specify which
repository to use for authentication. Theymust specify the full path to the repository and
the domain name in the user name field. For example, if Repository_1 is configured to use
domain ibm.com and Repository_2 is configured to use domain ibm.ca.com, the login
information might look like these examples:
• OU=User Accounts,OU=PHX,DC=qcorpaa,DC=aa,DC=ibm.com\username
• OU=Office,OU=User Accounts,DC=qcorpaa,DC=aa,DC=ibm.ca.com\username
User information is automatically imported from the LDAP server for repositories that
use user attributes or group authorization. For repositories that use local authorization,
youmust create users directly on the JSA system.
Example: Least Privileged Access Configuration and Set Up
Grant users only theminimumamount of access that they require to do their day-to-day
tasks.
57Copyright © 2018, Juniper Networks, Inc.
Chapter 3: User Management

You can assign different privileges for JSA data and JSA capabilities. You can do this
assignment by specifying different accept and deny groups for security profiles and user
roles. Accept groups assign privileges and deny groups restrict privileges.
Let's look at an example. Your company hired a group of student interns. John is in his
final year of a specialized cyber security program at the local university. He was asked
to monitor and review known network vulnerabilities and prepare a remediation plan
based on the findings. Information about the company's network vulnerabilities is
confidential.
As the JSA administrator, you must ensure that the student interns have limited access
to data and systems. Most student interns must be denied access to JSA Vulnerability
Manager, but John's special assignment requires that he has this access. Your
organization's policy is that student interns never have access to the JSA API.
The following table shows that Johnmust be amember of the company.interns and
qvm.interns groups to have access to JSA Risk Manager and JSA Vulnerability Manager.
Table 9: User Role Privilege Groups
DenyAcceptUser Role
company.firedemployeesqradar.adminAdmin
company.firedemployees
qradar.qrm
company.interns
qradar.qvm
qvm.interns
QVM
company.firedemployeesqradar.qrm
company.interns
QRM
The following table shows that the security profile for qvm.interns restricts John from
accessing the JSA API.
Table 10: Security Profile Privilege Groups
DenyAcceptSecurity profile
company.firedemployeesqradar.secprofile.qvmQVM
company.firedemployees
qradar.secprofile.qvm.interns
qradar.secprofile.qvm.apiAPI
Resource Restrictions
Before you set resource restrictions, carefully consider thenormal operational procedures
in your environment. Try to set restrictions that ensure that all users have access to the
Copyright © 2018, Juniper Networks, Inc.58
Juniper Secure Analytics Administration Guide

data that they require, yet prevent them from inadvertently running large queries that
negatively impact the system availability and performance for other users.
• Types Of Resource Restrictions on page 59
• Resource Restrictions in Distributed Environments on page 60
• Configuring Resource Restrictions on page 61
You can balance the utilization of your JSA infrastructure by setting resource restrictions
on JSA event and flow searches.
RelatedDocumentation
Security Profiles on page 44•
• User Accounts on page 49
• User Authentication on page 51
Types Of Resource Restrictions
Resource restrictions are applied in the following order: user, user role, and tenant. For
example, restrictions that are set for a user take precedence over restrictions that are
set for the user role or tenant that the user is assigned to.
You can set the following types of restrictions on event and flow searches:
• The length of time that a search runs before data is returned
• The time span of the data to be searched
• The number of records that are processed by the Ariel query server
You can set limitations on searches by configuring either time or data set restrictions
based on user, role, or tenant.
User-based Restrictions
User-based restrictions define limits for an individual user, and they take precedence
over role and tenant restrictions.
For example, your organization hires university students to work with the junior analysts
in your SOC. The students have the same user role as the other junior analysts, but you
apply more restrictive user-based restrictions until the students are properly trained in
building JSA queries.
Role-based Restrictions
Role-based restrictions allow you to define groups of users who require different levels
of access to your JSA deployment. By setting role-based restrictions, you can balance
the needs of different types of users.
For example, a junior security analyst might focus on security incidents that happened
recently, while a senior security analyst might bemore involved in forensic investigations
that review data over a longer period of time. By setting role-based restrictions, you can
59Copyright © 2018, Juniper Networks, Inc.
Chapter 3: User Management

limit a junior analyst to accessing only the last 7 days of data, while a senior analyst has
access to amuch larger time span of data.
Tenant-based Restrictions
In a Managed Security Service Provider (MSSP) or a multi-divisional organization,
tenant-based restrictions can help you ensure quality of service by preventing resource
contentionanddegradationof services. Youcanpreventa tenant fromquerying terabytes
of data that can negatively impact the system performance for all other tenants.
As an MSSP, youmight define standard resource restrictions based on a set of criteria
that each tenant is compared to. For example, the standard configuration for a
medium-sized tenantmight include resource restrictions that limit searches to accessing
only the last 14 days of data and amaximum of 10,000 records returned.
Resource Restrictions in Distributed Environments
In a distributed environment, the timing of the data transfer between the JSA console
andmanaged hosts can impact the search results.
When you run a search in JSA, the search runs on all nodes at the same time. Each
managed host runs the search, and sends the aggregated results to the JSA console
when the search is complete or when it reaches the predefined number of rows.
It is important to understand how the resource restrictions that you setmight impact the
search results that are returned to a user:
Canceled searches—Eachmanaged host periodically checks the state of the resourcerestriction limit. If a limit is reached, the search is automatically canceled to prevent
the incomplete results from being cached and reused.
Results that were collected before the search was canceled by the system can be
viewed by clicking Search >Manage Search Results on the Log Activity or Network
Activity tab.
Empty search results—When you set time-limit or record-limit restrictions, the remote
aggregationmight cause the JSAconsole to reach the resource restriction limit before
the managed host sends the partial aggregate to the console. In this situation, the
search results might appear to be empty even though some data was collected.
Inconsistentsearch results—JSAmonitors the loadoneachmanagedhost, andmanages
the search to ensure optimized performance throughout the entire deployment.
Depending on the system load, searches that are run repeatedlymight show slightly
different results due to the managed hosts returning the data in a different order.
For example, in a deployment that has six event processors, EP1, EP3, and EP5might
be the first processors to return data on the initial run. In subsequent runs, EP2, EP4,
and EP6might return data first, which accounts for the inconsistent search results.
Depending on the frequency that users reach the resource restrictions, you can tune the
limits to avoid restricting users from running reasonable searches to meet their job
requirements. Users who consistently run searches that strain the systemmight benefit
Copyright © 2018, Juniper Networks, Inc.60
Juniper Secure Analytics Administration Guide

frommore training in building JSA queries. For more information, see the Juniper Secure
Analytics Ariel Query Language Guide.
Configuring Resource Restrictions
Set resource restrictions to apply time or data limitations to event and flow searches.
You can set the following types of resource restrictions:
• Set Execution time restrictions to specify the maximum amount of time that a query
runs before data is returned.
• Set Record limit restrictions to specify the maximum number of data records that are
returned by a search query.
• Set Time span restrictions to specify the time span of the data to be searched.
Userswho runsearches thatare limitedby resource restrictionssee the resource restriction
icon ( ) next to the search criteria.
1. Click the Admin tab.
2. On the navigation menu, click SystemConfiguration >Resource Restrictions.
3. If your deployment has tenants that are configured, click Role or Tenant to specify the
type of restrictions to set.
4. Double-click the role or tenant that you want to set restrictions for.
5. To set restrictions for all users who are assigned to the user role or tenant, follow
these steps:
a. Click the summary row at the top to open the Edit Restriction dialog box.
b. Click Enabled for the type of restriction that you want to set, and specify the
restriction values.
c. Click Save.
6. To set restrictions for a specific user, follow these steps:
a. Double-click the user that you want to set the restrictions for.
To search for a user, type the user name in the filter field.
b. Click Enabled for the type of restriction that you want to set, and specify the
restriction values.
c. Click Save.
61Copyright © 2018, Juniper Networks, Inc.
Chapter 3: User Management

Copyright © 2018, Juniper Networks, Inc.62
Juniper Secure Analytics Administration Guide

CHAPTER 4
System and Licenses Management
• System and Licenses Management on page 63
• System and License Management Overview on page 63
• License Management Checklist on page 65
• SystemManagement on page 70
• System Information Configuration on page 77
System and LicensesManagement
Manage systems and licenses in your JSA deployment.
Youmust allocate a license for each system in your deployment, including software
appliances. Flow and JSA Event Collectors do not require a license.
When you install a JSA system, a default license key provides youwith access to the user
interface for five weeks. Before the default license expires, youmust allocate a license
key to your system. You can also add licenses to enable JSA products, such as JSA
Vulnerability Manager.
There is a 14-day grace period to reallocate a license. You can unlock a license if the key
is uploaded, after a host is patched with a fix, or after an unlock key is uploaded. After
the grace period is passed, the license is locked to the system.
If your license status is Invalid, the license must be replaced. The status might indicate
that your license was altered without authorization.
A license remains undeployed until you deploy the license change.
System and LicenseManagement Overview
Use the System and LicenseManagementwindow tomanage your system and license
keys, and for system restart or shutdown.
The toolbar in the System and LicenseManagementwindow provides the following
functions:
63Copyright © 2018, Juniper Networks, Inc.

Table 11: System and LicenseManagement Toolbar Functions
DescriptionFunction
Use this function to allocate a license to a system.
When you select Licenses from the Displaymenu, the label on this function changes toAllocateSystem to License.
Allocate License to System
Use this function to upload a license to your Console. For more information, see “Uploading aLicense Key” on page 66.
Upload License
Select Licenses from the Displaymenu, to view license menu options.
If you selectActions>RevertAllocation on a deployed licensewithin the allocation grace period,which is 14 days after deployment, the license state changes to Unlocked. You can reallocatean unlocked license to another system.
Actions (License)
Select Systems from the Displaymenu, and click Actionsmenu to view the following options:
View andManage System—Select a system, and then click Actions >View andManage Systemto view the System Informationwindow. Click the Licence, Firewall, Network Interfaces, andEmail Server tabs to configure these elements of your system.
AddHAHost—Select a system, and then select this option to add an HA host to the system toform an HA cluster. For more information about HA, see the High Availability Guide for yourproduct.
RevertAllocation—Select this option to undo staged license changes. The configuration revertsto the last deployed license allocation.
NOTE: If you revert theallocationofadeployed licensewithin thegraceperiod for theallocation,which is 14 days after deployment, the license state changes to Unlocked. You can reallocatean Unlocked license to another system.
RestartWebServer—Select this option to restart theuser interface,when required. For example,youmight be required to restart your user interface after you install a new protocol that addsnew user interface components.
Shutdown System—Select a system, and then select this option to shut down the system. Formore information, see “Shutting Down a System” on page 73.
Restart System—Select a system, and then select this option to restart the system. For moreinformation, see “Restarting a System” on page 72.
Collect Log Files—Collect log files for the selected host.
Actions (System)
When you select Licenses from the Displaymenu, the System and LicenseManagement
window displays the following information:
Table 12: System and LicenseManagementWindowParameters - Licenses View
DescriptionParameter
System that is allocated to this license.Host Name
System that is allocated to this license.Host IP
Copyright © 2018, Juniper Networks, Inc.64
Juniper Secure Analytics Administration Guide

Table 12: System and LicenseManagementWindowParameters - Licenses View (continued)
DescriptionParameter
Type of appliance that is allocated to this license.License Appliance Type
Name of the JSA product this license provides.License Identity
Status of the license that is allocated to this system include the following Statuses:
Unallocated—The license is not allocated to a system.
Undeployed—The license is allocated to a system, but the allocation change is not deployed.This means that the license is not active in your deployment yet.
Deployed—The license is allocated and active in your deployment.
Unlocked—The license is unlocked. Licenses that are deployed within the last 10 days can beunlocked. This is thedefault graceperiod to reallocatea license. After thegraceperiod is passed,the license is locked to the system. If you need to unlock a license after that period, contactJuniper Customer Support.
Invalid—The license is not valid andmust be replaced. This status might indicate that yourlicense was altered without authorization.
License Status
Date of expiration.License Expiration Date
Maximum event rate that is allowed per the terms of your license.Event Rate Limit
Maximum flow rate that is allowed per the terms of your license.Flow Rate Limit
RelatedDocumentation
License Management Checklist on page 65•
• SystemManagement on page 70
• System Information Configuration on page 77
LicenseManagement Checklist
1. Obtain a license key by one of the following methods:
• For a new or updated license key, contact your local sales representative.
• For all other technical issues, contact Juniper Customer Support.
2. Upload your license key.
When you upload a license key, it is listed in the System and LicenseManagement
window, but remains unallocated. For more information, see “Uploading a License
Key” on page 66
65Copyright © 2018, Juniper Networks, Inc.
Chapter 4: System and Licenses Management

3. Allocate your license to a system or allocate a system to a license.
4. To deploy your changes, from the Admin tabmenu, click Advanced >Deploy Full
Configuration.
When you deploy the full configuration, JSA restarts all services. Data collection for
events and flows stops until the deployment completes.
You use the options available in theSystemandLicenseManagementwindow tomanage
your license keys.
A default license key provides you with access to the user interface for five weeks. You
must allocate a license key to your system.
Youmust set up the JSA system before users can use the tools. Begin by obtaining a
license key. After you have a license key, youmust upload it to the console and allocate
it to a system.
During the initial set up of a system youmust complete the following tasks:
• Uploading a License Key on page 66
• Allocating a License to a System on page 67
• Reverting an Allocation on page 68
• Viewing License Details on page 68
• Exporting a License on page 69
Uploading a License Key
Upload a license key to the JSA Console when you install a new JSA system, update an
expired license, or add a JSA product, such as JSA Vulnerability Manager, to your
deployment.
Choose one of the following options if you need assistance with your license key:
• For a new or updated license key, contact your local sales representative.
• For all other technical issues, contact Juniper Customer Support.
If you log on to your JSA console and find that your license key is expired, you are
automatically directed to theSystemandLicenseManagementwindow.Youmust upload
a license key before you can continue. If one of your managed host systems includes an
expired license key, a message is displayed when you log in indicating that a system
requiresanew licensekey.Youmustaccess theSystemandLicenseManagementwindow
to update that license key.
1. Click the Admin tab.
2. On the navigation menu, click SystemConfiguration.
3. Click the System and LicenseManagement icon.
Copyright © 2018, Juniper Networks, Inc.66
Juniper Secure Analytics Administration Guide

4. On the toolbar, click Upload License.
5. In the dialog box, click Select File.
6. On the File Uploadwindow, locate and select the license key.
7. ClickOpen.
8. Click Upload.
The license is uploaded to your JSA console and is displayed in the System and License
Managementwindow. By default, the license is not allocated.
“Allocating a License to a System” on page 72
NOTE: Youmust purchase a separate HA license to set up high availability.However, the license should not be allocated to the secondary console orthe secondary managed host.
Allocating a License to a System
Allocate a license from the System and LicenseManagement window.
When you install a JSA system, a default license key provides youwith access to the user
interface for five weeks. Before the default license expires, youmust allocate a license
key to your system. You can also add licenses to enable JSA products, such as JSA
Vulnerability Manager.
You can allocate multiple licenses to a system. For example, in addition to JSA, you can
allocate JSA Risk Manager, and JSA Vulnerability Manager to your JSA console system.
The following are license statuses of JSA systems:
• Unallocated License is not allocated to a system.
• Undeployed License is allocated toa system, but theallocation change is not deployed.
This means that the license is not active in your deployment yet.
• Deployed License is allocated and active in your deployment.
• Unlocked Licenses that are deployed within the last 10 days can be unlocked. This is
the default grace period to reallocate a license. After the grace period is passed, the
license is locked to the system. If you need to unlock a license after that period, contact
Juniper Customer Support.
• Invalid License is not valid andmust be replaced. This status might indicate that your
license was altered without authorization.
67Copyright © 2018, Juniper Networks, Inc.
Chapter 4: System and Licenses Management

1. Click the Admin tab.
2. On the navigation menu, click SystemConfiguration.
3. Click the System and LicenseManagement icon.
4. From the Displaymenu, select Licenses.
5. Select an unallocated license.
6. Click Allocate System to License.
7. To filter the list of licenses, type a keyword in the Upload License search box.
8. From the list of licenses, select a license.
9. Select a system.
10. Click Allocate License to System.
Reverting an Allocation
You can revert an allocated license within the 14-day grace period.
After youallocatea license toa systemandbefore youdeploy your configurationchanges,
you can undo the license allocation. When you undo the license allocation, the last
allocated and deployed license on the system is maintained.
1. Click theAdmin tab.
2. On the navigation menu, click SystemConfiguration.
3. Click the System and LicenseManagement icon.
4. From the Displaymenu, select Licenses.
5. Select the license that you want to revert.
6. Click Actions >Revert Allocation.
Viewing License Details
A license key provides information and enforces the limits and capabilities on an JSA
system.
Copyright © 2018, Juniper Networks, Inc.68
Juniper Secure Analytics Administration Guide

From the System and LicenseManagementwindow, you can view license details, such
as the number of allowable log sources and the expiration dates.
NOTE: If you exceed the limit of configured logs sources, an error messageis displayed. If log sources are auto-discovered and your limit is exceeded,theyareautomaticallydisabled.Toextend thenumberof logsources, contactyour sales representative.
1. Click the Admin tab.
2. On the navigation menu, click SystemConfiguration.
3. Click the System and LicenseManagement icon.
4. From the Displaymenu, select Licenses.
5. To view license information for a host, select the host, and then click Actions >View
License.
From the Licenseswindow, you can complete the following tasks:
• Click Upload Licenses to upload a license. See “Uploading a License Key” on page 66.
• Click Allocate License to System on the toolbar to assign a license. See “Allocating a
License to a System” on page 67.
Exporting a License
Export license key information to an external file on a desktop system.
1. Click the Admin tab.
2. On the navigation menu, click SystemConfiguration.
3. Click the System and LicenseManagement icon.
4. From the Displaymenu, select Licenses.
5. From the Actionsmenu, select Export Licenses.
6. Select one of the following options:
Openwith—Opens the license key data using the selected application.
Save File—Saves the file to your desktop.
69Copyright © 2018, Juniper Networks, Inc.
Chapter 4: System and Licenses Management

7. ClickOK.
RelatedDocumentation
•
SystemManagement
Use theSystemandLicenseManagementwindowtomanagesystems inyourdeployment.
View system information, manage licenses, manage systems, restart and shut down a
system, add a HA host, collect log files, and complete other management activities on
your system.
• Viewing System and License Details on page 70
• Allocating a License to a System on page 72
• Restarting a System on page 72
• Shutting Down a System on page 73
• Exporting System Details on page 73
• Collecting Log Files on page 74
• Checking the Integrity Of Event and Flow Logs on page 74
• Bandwidth Considerations for Managed Hosts on page 76
• Deploying Managed Hosts and Components After Installation on page 76
Viewing System and License Details
View information about the system, including licenses from the SystemDetailswindow.
Open theSystemDetailswindow to view information about the systemand licenses that
are allocated to the system.
The License pane displays the following details for each license that is allocated to the
selected system:
Table 13: License Parameters
DescriptionParameter
Name of the JSA product this license provides.License Identity
Copyright © 2018, Juniper Networks, Inc.70
Juniper Secure Analytics Administration Guide

Table 13: License Parameters (continued)
DescriptionParameter
Status of the license that is allocated to this system include the following Statuses:
Unallocated License is not allocated to a system.
Undeployed License is allocated to a system, but the allocation change is not deployed. Thismeans that the license is not active in your deployment yet.
Deployed License is allocated and active in your deployment.
Unlocked License is unlocked. Licenses deployed within the last 10 days can be unlocked. Thisis the default grace period to reallocate a license. After the grace period is passed, the licenseis locked to the system. If you need to unlock a license after that period, contact JuniperCustomer Support.
Invalid License is not valid andmust be replaced. This status might indicate that your licensewas altered without authorization.
License Status
Type of appliance that is allocated to this license.License Appliance Types
Date of expiration.License Expiration Date
Maximum event rate that is allowed per the terms of your license.Event Rate Limit
Maximum flow rate that is allowed per the terms of your license.Flow Rate Limit
1. Click the Admin tab.
2. On the navigation menu, click SystemConfiguration.
3. Click the System and LicenseManagement icon.
4. From the Displaymenu, select Systems.
5. To display the system details, select a host and click Actions >View andManage
System, or double-click the host.
6. Click the License tab.
From the License pane, you can complete the following tasks:
• Select a license and click View License. See “Viewing License Details” on page 68.
• Click Upload License to upload a license. See “Uploading a License Key” on page 66.
• Click Allocate License to System on the toolbar to assign a license. See “Allocating a
License to a System” on page 67.
71Copyright © 2018, Juniper Networks, Inc.
Chapter 4: System and Licenses Management

Allocating a License to a System
1. Click the Admin tab.
2. On the navigation menu, click SystemConfiguration.
3. Click the System and LicenseManagement icon.
4. From the Displaymenu, select Systems.
5. Select an available system.
6. Click Allocate License to System.
7. To filter the list of licenses, type a keyword in the Upload License search box.
8. From the list of licenses, select a license.
9. Select a system.
10. Click Allocate License to System.
After you obtain and upload a license, use the menus in the System and License
Managementwindow to allocate a license.
You can allocate multiple licenses to a system. For example, in addition to JSA , you can
allocate JSA Risk Manager, and JSA Vulnerability Manager to your JSA console system.
Restarting a System
From the Actionsmenu in the System and LicenseManagementwindow, you can restart
a system in your deployment.
Data collection stops while the system is shutting down and restarting.
1. Click the Admin tab.
2. On the navigation menu, click SystemConfiguration.
3. Click the System and LicenseManagement icon.
4. From the Displaymenu, select Systems.
Copyright © 2018, Juniper Networks, Inc.72
Juniper Secure Analytics Administration Guide

5. Select the system that you want to restart.
6. From the Actionsmenu, select Restart System.
Shutting Down a System
From the Actionsmenu in the System and LicenseManagementwindow, you can shut
down a system in your deployment.
Data collection stops while the system is shutting down.
1. Click theAdmin tab.
2. On the navigation menu, click SystemConfiguration.
3. Click the System and LicenseManagement icon.
4. From the Displaymenu, select Systems.
5. Select the system that you want to shut down.
6. From the Actionsmenu, select Shutdown.
Exporting SystemDetails
From the Actionsmenu in the System and LicenseManagementwindow, you can export
systems information to an external file.
1. Click the Admin tab.
2. On the navigation menu, click SystemConfiguration.
3. Click the System and LicenseManagement icon.
4. From the Displaymenu, select Systems.
5. From the Actionsmenu, select Export Systems.
6. Select one of the following options:
• Openwith—Opens the license key data by using the selected application.
• Save File—Saves the file to your desktop.
7. ClickOK.
73Copyright © 2018, Juniper Networks, Inc.
Chapter 4: System and Licenses Management

Collecting Log Files
JSA log files contain detailed information about your deployment, such as host names,
IP addresses, and email addresses. If you needhelpwith troubleshooting, you can collect
the log files and send them to Juniper Networks Support.
You can collect the log files for one or more host systems at the same time. The time
that is required to collect the log files depends on the size of your deployment and the
number of hosts that you want to include in the log file collection. The JSA console log
files are automatically included in each log file collection.
You can continue to use the JSA console while the log file collection is running. If the
system is actively collecting log files, you cannot initiate a new collection request. You
must cancel the active collection process and start another collection.
When the log file collection process completes, a system notification appears on the
SystemMonitoring dashboard.
1. Click the Admin tab.
2. Onthenavigationwindow, clickSystemConfigurationandclick theSystemandLicense
Management icon.
3. Press Ctrl on the keyboard and click each host that you want to include in the log file
collection.
4. Click Actions >Collect Log Files.
5. Click Advanced Options and choose the options for the log file collection.
Encrypted log file collections can be decrypted only by Juniper Networks Support. If
you want access to the log file collection, do not encrypt the file.
6. Click Collect Log Files.
7. Under SystemSupport Activities Messages, a message indicates the status of the
collection process.
To cancel an active log file collection process, click the X in the notification message.
8. To download the log file collection, click Click here to download files in the Log file
collection completed successfully notification.
Checking the Integrity Of Event and Flow Logs
Ensure that log hashing is enabled for your JSA system. For information about enabling
the flow log hashing or event log hashing parameters, see “Configuring SystemSettings”
on page 114.
Copyright © 2018, Juniper Networks, Inc.74
Juniper Secure Analytics Administration Guide

Youmust log in to the system that has the data storage for events and flows, and run a
utility to check the logs. You cannot check the log integrity in the event and flow viewer
interface.
This table describes the parameters that are used with thecheck_ariel_integrity.sh
utility.
Table 14: Parameters for the Check_ariel_integrity.sh Utility
DescriptionParameter
Duration of time, inminutes, of the log file data to scan. The time period immediately precedes the end timethat is specified using the -t parameter. For example, if -d 5 is entered, all log data that was collected fiveminutes before the -t end time is scanned.
-d
The JSA database to scan. Valid options are events and flows.-n
The end time for the scan. The format for the end time is “yyyy/mm/dd hh:mm”where hh is specified in24-hour format. If no end time is entered, the current time is used.
-t
Hashing algorithm to use. This algorithmmust be the same one that was used to create the hash keys. If noalgorithm is entered, SHA-1 is used.
-a
The location of the log hashing. This argument is required only when the log hashing is not in the locationthat is specified in the configuration file, /opt/qradar/conf/arielConfig.xml.
-r
The key that is used for Hash-basedMessageAuthentication Code (HMAC) encryption. If you do not specifyan HMAC key and your system is enabled for HMAC encryption, thecheck_ariel_integrity.shscript defaults to the key specified in the system settings.
-k
Shows the help message for thecheck_ariel_integrity.shutility.
-h
1. Use SSH to log in to JSA as the root user.
2. To run the utility, type the following command:
/opt/qradar/bin/check_ariel_integrity.sh -d <duration> -n <database name>[-t <endtime>] [-a <hash algorithm>] [-r <hash root directory>] [-k <hmac key>]
For example, to validate the last 10 minutes of event data, type the following
command:
/opt/qradar/bin/check_ariel_integrity.sh -n events -d 10
If an ERROR or FAILEDmessage is returned, the hash key that is generated from the
current data on the disk does not match the hash key that was created when the data
was written to the disk. Either the key or the data wasmodified.
75Copyright © 2018, Juniper Networks, Inc.
Chapter 4: System and Licenses Management

When log hashing is enabled, any system that writes event and flow data creates hash
files. Use these hash files to verify that the event and flow logs were not modified since
they were originally written to disk.
The hash files are generated in memory before the files are written to disk, so the event
and flow logs cannot be tampered with before the hash files are generated.
Bandwidth Considerations for Managed Hosts
To replicate state and configuration data, ensure that you have aminimum bandwidth
of 100Mbps between the Juniper Security Analytics console and all managed hosts.
Higher bandwidth is necessary when you search log and network activity, and you have
over 10,000 events per second (EPS). System and network performance affect your
data search speed. JSAEventCollectors, with the storeand forwardconfiguration, forward
all data based on your schedule. Youmust allocate sufficient bandwidth for the data
that you plan to collect, or your store and forward appliance cannot maintain your
scheduled pace.
You canmitigate bandwidth limitations between data centers, by using the following
methods:
Process and send data to hosts at the primary data center
Design your deployment to process and send data to hosts at the primary data center,
where the console resides, as the data is collected. In this design, all user-based searches
query the data from the local data center, rather than waiting for remote sites to send
back data. You can deploy a store and forward event collector, such as JSA physical or
virtual appliance, in the remote locations to control bursts of data across the network.
Bandwidth is used in the remote locations, and searches for data occur at the primary
data center, rather than at a remote location.
Don't run long-term searches over limited bandwidth connections
Ensure that users don't run long-term searches over links that have limited bandwidth.
Searches that have precise filters limit the amount of data that is retrieved from the
remote locations and reduces the amount of bandwidth that is required to send data
back for the result.
DeployingManaged Hosts and Components After Installation
After installation, you can addmanaged hosts to your deployment. To help distribute
processing, you can add JSA event collectors, flow processors, or other appliances in
your deployment.
You can configure components, such as vulnerability scanners, on amanaged host.
If you configured JSAVulnerabilityManager in your deployment, you canaddvulnerability
scanners and a vulnerability processor. For more information, see the Juniper Secure
Analytics Vulnerability Manager User Guide.
If you configured JSA Risk Manager in your deployment, you can add amanaged host.
For more information, see the Juniper Secure Analytics Risk Manager Installation Guide.
Copyright © 2018, Juniper Networks, Inc.76
Juniper Secure Analytics Administration Guide

1. Click the Admin tab.
2. In the SystemConfiguration pane, click System and LicenseManagement.
3. From the host table, select one of the following appliances that youwant tomanage.
• JSA console
• JSAmanaged host
4. Use theDeploymentActionsmenu toaddandconfigure components of your software
install. Youcan see visualizationsof your deploymentby selectingDeploymentactions
>View Deployment.
YoucandownloadaPNG imageoraMicrosoftVisio (2010)VDX fileof yourdeployment
visualization from the Deployment Viewwindow.
5. From the Deployment actionsmenu, choose an action.
6. Enter the required information and select the appropriate options.
7. Close the System and LicenseManagementwindow.
8. Click the Admin tab.
9. On the Admin tabmenu, click Deploy Changes.
RelatedDocumentation
System Information Configuration on page 77•
• System and License Management Overview on page 63
• License Management Checklist on page 65
System Information Configuration
To get your JSA security systemup and running and formaintenance, youmust configure
your JSA console andmanaged hosts from the System Informationwindow.
You assign roles for network interfaces, manage licenses, configure the email server that
you want JSA to use, and use the local firewall to manage access from external devices
to JSA.
Tomake network configuration changes, such as an IP address change to your JSA
console andmanaged host systems after you install your JSA deployment, use the
77Copyright © 2018, Juniper Networks, Inc.
Chapter 4: System and Licenses Management

qchange_netsetuputility. Formore informationaboutnetwork settings, see the Installation
Guide for your product.
• Network Interface Management on page 78
• Configuring Network Interfaces on page 78
• Configuring Your Local Firewall on page 79
• Configuring Email on page 80
• Changing the Root Password on Your JSA Console on page 81
Network InterfaceManagement
You can add extra network interfaces to your JSA appliances to provide alternative
network connectivity that can be used in addition to the default management interface.
What Can You Use Extra Network Interfaces For?
Use extra network interfaces for the following purposes:
• To provide a dedicated crossover connection between high-availability (HA) peers.
You configure a crossover connection during HA setup.
• To provide a dedicated data collection interface for inbound events or external flow
sources.
• To connect to backup and network storage systems (iSCSI).
ConfiguringManagement Network Interfaces
You can configure only the JSA appliance network management interface, at the UNIX
shell prompt during setup.
• Configure the management interface before you add a host to your deployment.
• Configure the management interface on a JSA console before you add amanaged
host.
Configuring Network Interfaces
You can edit a management interface only at the shell prompt.
1. Click the Admin tab.
2. On the navigation menu, click SystemConfiguration.
3. Click the System and LicenseManagement icon.
4. From the Displaymenu, click Systems.
Copyright © 2018, Juniper Networks, Inc.78
Juniper Secure Analytics Administration Guide

5. Select the host for which you want to configure network interfaces.
6. To edit a network interface, click a network interface and then click EDIT.
a. From the Rolemenu, click one of the following roles or leave as the current role.
• Regular
Use for data collection. This interface must have an IP address.
• Monitor
Useon a JSA flowprocessor for packet collection. This interface does not require
an IP address.
• Disabled
Disable this interface to prevent it from being used for any network connectivity.
b. Select Apply this interface configuration and IP address to the active HA node to
apply this interface configuration and IP address to the active HA node.
This option is used only when HA is added to this system.
c. Click Save.
Configuring Your Local Firewall
Use your local firewall to manage access from external devices to your JSA deployment.
1. Click the Admin tab.
2. On the navigation menu, click SystemConfiguration.
3. Click the System and LicenseManagement icon.
4. From the Displaymenu, select Systems.
5. Select the host for which you want to configure firewall access settings.
6. From the Actionsmenu, click View andManage System.
NOTE: You can right-click the selected host to access this menu option,or you can double-click the host to open theSystems Informationwindow.
7. To configure your local firewall to allow access to this host from specified devices
outside of your JSA deployment, click the Firewall tab.
a. Configure access for devices that are outside of your deployment and need to
connect to this host.
79Copyright © 2018, Juniper Networks, Inc.
Chapter 4: System and Licenses Management

b. Add this access rule by clicking the arrow.
8. Click Save.
If you change the External Flow SourceMonitoring Port parameter in the Flow
configuration, youmust also update your firewall access configuration.
Configuring Email
Configure an email server to distribute alerts, reports, notifications, and eventmessages.
1. Click the Admin tab.
2. On the navigation menu, click SystemConfiguration.
3. Click the System and LicenseManagement icon.
4. From the Displaymenu, select Systems.
5. Select the host for which you want to configure firewall access settings.
6. From the Actionsmenu, click View andManage System.
NOTE: You can right-click the selected host to access this menu option,or you can double-click the host to open theSystems Informationwindow.
7. To configure an email server to distribute alerts, reports, notifications, and event
messages, click the Email Server tab.
8. In the Email Server Address field, type the host name or IP address of the email server
that you want to use.
If youdon't haveanemail serverandyouwant touse theemail server that JSAprovides,
type localhost to provide local email processing.
When you are setting up JSA, it looks for a mail relay server, which it uses to send out
email messages. For example, if you want to sendmail to [email protected],
you must configure the Email Server setting to amail relay server, that knows how to
get to YourCompany.com.
If you configure the mail server setting as localhost, then the mail messages do notleave the JSA box.
If you want external mail delivery, use a valid mail relay server.
Copyright © 2018, Juniper Networks, Inc.80
Juniper Secure Analytics Administration Guide

NOTE: Use port 25 for the email server connection.
9. Click Save.
Changing the Root Password on Your JSA Console
As a good security practice, change the root password on your JSA console at regular
intervals.
1. Use SSH to log in to your JSA console as the root user.
2. Type the user name and password for the root user.
The user name and password are case-sensitive.
3. Use the passwd command to change your password.
RelatedDocumentation
• System and License Management Overview on page 63
• License Management Checklist on page 65
• SystemManagement on page 70
81Copyright © 2018, Juniper Networks, Inc.
Chapter 4: System and Licenses Management

Copyright © 2018, Juniper Networks, Inc.82
Juniper Secure Analytics Administration Guide

CHAPTER 5
JSA System Time Configuration
• JSA System Time Configuration on page 83
• Configuring System TimeManually on page 84
• Configuring an NTP Server to Maintain System Time on page 85
JSA System Time Configuration
When running a system that spans multiple time zones, configure all appliances to use
the same time zone as the JSA Console. Alternatively, you can configure all appliances,
including the JSA console, to use Greenwich Mean Time (GMT).
Use one of the following methods to configure the JSA system time:
• Configure a Network Time Protocol (NTP) server to maintain the system time.
The time is automatically synchronized between the JSA console and themanaged
hosts.
• Configure the system timemanually.
Problems Caused byMismatched Time Zones
To ensure that searches and data-related functions work properly, all appliances must
synchronize time settings with the JSA console appliance. When the time zone settings
are mismatched, youmay see inconsistent results between JSA searches and report
data.
The Accumulator service runs on all appliances with local storage to create minute by
minute accumulations, and hourly and daily rollups. JSA uses the accumulated data in
reports and time series graphs. When the time zones are mismatched in a distributed
deployment, reportand timeseriesgraphsmayshow inconsistent resultswhencompared
to AQL query results due to the way that the accumulated data is aggregated.
JSA searches run against data that is stored in the Ariel databases, which use a date
structure (YYYY/MM/DD/HH/MM) to store files to disk. Changing the timezone after the
data has beenwritten to diskwill disrupt the file naming sequence in the Ariel databases
andmay cause data integrity problems.
83Copyright © 2018, Juniper Networks, Inc.

Configuring System TimeManually
Set system time on your JSA Console manually, and synchronize this time with your
managed hosts.
Before youmanually adjust the system time, stop JSA services, then use thedate
command to change the system time and date.
1. Stop JSA services.
service hostcontext stop
service tomcat stop
service hostservices stop
2. Type thedate
command with time parameters.
date <MMddhhmm><YYYY>
For example, if you want to set the time to December 13, 2018, 5:24 PM, type thefollowing command:
date 121317242018
3. Synchronize the system hardware clock to the current time.
/sbin/hwclock --systohc
4. Restart JSA services.
service hostservices start
service tomcat start
service hostcontext start
5. Synchronize your JSA console time with your JSAmanaged hosts by typing the
following command.
/opt/qradar/support/all_servers.sh /opt/qradar/bin/time_sync.sh
6. On the Admin tab, click Advanced >Deploy Full Configuration, to restart services on all
JSAmanaged hosts.
Time is now synchronized between the JSA console and themanaged hosts.
To synchronize your JSA console time with a time server, you must “Configuring an
NTP Server to Maintain System Time” on page 85 on your JSA console.
Copyright © 2018, Juniper Networks, Inc.84
Juniper Secure Analytics Administration Guide

RelatedDocumentation
Configuring an NTP Server to Maintain System Time on page 85•
Configuring an NTP Server to Maintain System Time
Configure the JSA Console to use a Network Time Protocol (NTP) server tomaintain the
time on the console and synchronize the time across your managed hosts.
Complete these procedures during scheduledmaintenance. JSA services are restarted
when you update the time server setting, which causes users to be logged off, and event
and flow collection are interrupted until services resume.
1. Use SSH to log in to the JSA console as the root user.
2. Edit the ntp.conf file.
vi /etc/ntp.conf
3. In the server section of the ntp.conf file, leave the existing server entries or replace
themwith your own internal (Network Time Protocol) NTP server.
Server entries in the ntp.conf file begin with 'server'.
You can use public servers from the NTP project at (http://www.ntp.org/).
server 0.rhel.pool.ntp.org iburstserver 1.rhel.pool.ntp.org iburst server 2.rhel.pool.ntp.org iburstserver 3.rhel.pool.ntp.org iburst
If you use public NTP servers, check that your firewall allows outboundNTP requests.
4. Save changes and close the file.
5. Enable the ntpd service to run at run level 3.
chkconfig --level 3 ntpd on
6. Verify that the ntpd service is enabled to run at restart.
chkconfig --list ntpd
Verify that 3:on shows in the output.
ntpd 0:off 1:off 2:off 3:on 4:off 5:off 6:off
7. Toprevent data collection errorswhen you change the system time, stop JSA services.
service hostcontext stop
service tomcat stop
service hostservices stop
85Copyright © 2018, Juniper Networks, Inc.
Chapter 5: JSA System Time Configuration

8. Synchronize the time with your NTP server.
ntpdate <ntp.server.address>
9. Start the ntpd service.
service ntpd start
10. Restart JSA services.
service hostservices start
service tomcat start
service hostcontext start
11. Synchronize the time on all managed hosts with your JSA console by typing the
following command:
/opt/qradar/support/all_servers.sh /opt/qradar/bin/time_sync.sh
12. On the Admin tab, click Advanced >Deploy Full Configuration, to restart services on all
JSAmanaged hosts.
Time is now synchronized between the JSA console and themanaged hosts.
RelatedDocumentation
• Configuring System TimeManually on page 84
Copyright © 2018, Juniper Networks, Inc.86
Juniper Secure Analytics Administration Guide

CHAPTER 6
User Information Source Configuration
• User Information Source Configuration on page 87
• User Information Source Overview on page 87
• Configuring the Tivoli Directory Integrator Server on page 89
• Creating and Managing User Information Source on page 92
• Collecting User Information on page 94
User Information Source Configuration
Configure your JSAsystemtocollectuserandgroup information from IdentityandAccess
Management endpoints.
JSA uses the information that is collected from the endpoints to enrich the user
information that is associated with the traffic and events that occur on your network.
User Information Source Overview
You can configure a user information source to enable user information collection from
an Identity and Access Management endpoint.
An Identity and Access Management endpoint is a product that collects andmanages
electronic user identities, groupmemberships, and access permissions. These endpoints
are called user information sources.
Use the following utilities to configure andmanage user information sources:
• Tivoli Directory Integrator- Youmust install and configure a Tivoli®Directory Integrator
on a non-JSA host.
• UISConfigUtil.sh Use this utility to create, retrieve, update, or delete user information
sources. You can use user information sources to integrate JSA using a Tivoli®Directory
Integrator server.
87Copyright © 2018, Juniper Networks, Inc.

• GetUserInfo.shUse this utility to collect user information fromauser information source
and store the information in a reference data collection. You can use this utility to
collect user information on demand or on a schedule.
• User Information Sources on page 88
• Reference Data Collections for User Information on page 88
• IntegrationWorkflow Example on page 89
• User Information Source Configuration and Management Task Overview on page 89
RelatedDocumentation
Configuring the Tivoli Directory Integrator Server on page 89•
• Creating and Managing User Information Source on page 92
• Collecting User Information on page 94
User Information Sources
A user information source is a configurable component that enables communication
with an endpoint to retrieve user and group information.
JSA systems support the following user information sources:
Table 15: Supported Information Sources
Information that is collectedInformation Source
• full_name
• user_name
• user_principal_name
• family_name
• given_name
• account_is_disabled
• account_is_locked
• password_is_expired
• password_can_not_be_changed
• no_password_expired
• password_does_not_expire
Microsoft Windows Active Directory (AD), version 2008 -Microsoft Windows AD is a directory service thatauthenticates and authorizes all users and computers thatuse your Windows network.
Reference Data Collections for User Information
This topicprovides informationabouthow referencedatacollections storedata collected
from user information sources.
When JSA collects information from a user information source, it automatically creates
a reference data collection to store the information. The name of the reference data
collection is derived from the user information source group name. For example, a
reference data collection that is collected fromMicrosoft Windows ADmight be named
Domain Admins.
Copyright © 2018, Juniper Networks, Inc.88
Juniper Secure Analytics Administration Guide

The reference data collection type is a Map of Maps. In a Reference Map of Maps, data
is stored in records that map one key to another key, which is thenmapped to a single
value.
For example:
• #
• #Domain Admins
• # key1,key2,data
• smith_j,Full Name,John Smith
• smith_j,account_is_disabled,0
• smith_j,account_is_locked,0
• smith_j,account_is_locked,1
• smith_j,password_does_not_expire,1
Formore informationabout referencedatacollections, see theReferenceDataCollections
Technical Note.
IntegrationWorkflow Example
After user and group information is collected and stored in a reference data collection,
there are many ways in which you can use the data in JSA.
You can create meaningful reports and alerts that characterize user adherence to your
company's security policies.
NOTE: If you want to collect application security logs, youmust create aDevice Support Module (DSM). Formore information, see the Juniper SecureAnalytics Configuring DSMs.
User Information Source Configuration andManagement Task Overview
To initially integrate user information sources, youmust perform the following tasks:
1. Configure a Tivoli®Directory Integrator server. See “Configuring the Tivoli Directory
Integrator Server” on page 89.
2. Create andmanage user information sources. See “Creating and Managing User
Information Source” on page 92.
3. Collect user information. See “Collecting User Information” on page 94.
Configuring the Tivoli Directory Integrator Server
For JSA to integratewithuser informationsources, youmust install andconfigureaTivoli®
Directory Integrator on a non-JSA host.
89Copyright © 2018, Juniper Networks, Inc.
Chapter 6: User Information Source Configuration

No configuration is required on your JSA system; however, youmust access your Console
to obtain theQRadarIAM_TDI.zip file. Then, install and configure a Tivoli®Directory
Integrator server on a separate host. Create and import a self-signed certificate.
When you extract theQRadarIAM_TDI.zip file on the Tivoli®Directory Integrator server,
the TDI directory is automatically created. The TDI directory includes the following files:
• QradarIAM.sh, which is the TDI start up script for Linux
• QradarIAM.bat, which is the TDI start up script for Microsoft Windows
• QradarIAM.xml, which is the TDI xml script andmust be stored in the same location as
theQradarIAM.properties file
• QradarIAM.properties, which is the properties file for TDI xml script
When you install Tivoli®Directory Integrator, youmust configure a name for theSolutions
directory. This task requires you to access the Solutions directory. Therefore, in the task
steps, <solution_directory> refers to the name that you gave to the directory.
The following parameters are used to create and import certificates:
Table 16: Certification Configuration Parameters
DescriptionParameter
Defines the IP address of the Tivoli® Directory Integrator server.<server_ip_address>
Defines the number of days that the certificate is valid.<days_valid>
Defines the name of the keystore file.<keystore_file>
Defines the password for keystore.-storepass <password>
Defines the password for the private/public key pair.- keypass <password>
Defines the alias for an exported certificate.<alias>
Defines the file name of the certificate.<certificate_file>
1. Install Tivoli®Directory Integrator on a non-JSA host. For more information on how to
install and configure Tivoli®Directory Integrator, see your Tivoli
®Directory Integrator
(TDI) documentation.
2. Using SSH, log in to your JSA Console as the root user.
a. User name: root
b. Password: <password>
3. Copy theQRadarIAM_TDI.zip file to the Tivoli®Directory Integrator server.
Copyright © 2018, Juniper Networks, Inc.90
Juniper Secure Analytics Administration Guide

4. On the Tivoli®Directory Integrator server, extract theQRadarIAM_TDI.zip file in the
Solutions directory.
5. Configure your Tivoli®Directory Integrator server to integrate with JSA.
a. Open the Tivoli®Directory Integrator <solution_directory>/solution.properties file.
b. Uncomment the com.ibm.di.server.autoload property. If this property is already
uncommented, note the value of the property.
c. Choose one of the following options:
• Change directories to the autoload.tdi directory, which contains the
com.ibm.di.server.autoload property by default.
• Create an autoload.tdi directory in the <solution_directory> to store the
com.ibm.di.server.autoload property.
d. Move the TDI/QRadarIAM.xml and TDI/QRadarIAM.property files from the Tivoli®
Directory Integrator directory to<solution_directory>/autoload.tdi directory or the
directory you created in the previous step.
e. Move theQradarIAM.bat andQradarIAM.sh scripts from the Tivoli®Directory
Integrator directory to the location fromwhich youwant to start theTivoli®Directory
Integrator.
6. Create and import the self-signed certificate into the Tivoli®Directory Integrator
truststore.
a. To generate a keystore and a private/public key pair, type the following command:
• keytool -genkey -dname cn=<server_ip_address> -validity <days_valid>-keystore <keystore_file> -storepass <password> - keypass <password>
• For example, keytool -genkey -dname cn=192.168.1.1 -validity 365 -keystoreserver.jks -storepass secret -keypass secret
b. To export the certificate from the keystore, type the following command:
• keytool -export -alias <alias> -file <certificate_file> - keystore <keystore_file>- storepass <password>
• For example, keytool -export -aliasmykey -file server.cert -keystore server.jks-storepass secret
c. To import the primary certificate back into the keystore as the self-signed CA
certificate, type the following command:
• keytool -import -trustcacerts -file <certificate_file> -keystore <keystore_file>-storepass <password> -alias <alias>
• For example, keytool -import -trustcacerts -file server.cert -keystore server.jks-storepass secret -aliasmytrustedkey
d. Copy the certificate file to the /opt/qradar/conf/trusted_certificates on the JSA
console.
91Copyright © 2018, Juniper Networks, Inc.
Chapter 6: User Information Source Configuration

7. Import the CA certificate into the Tivoli®Directory Integrator truststore.
a. To import the CA certificate into the keystore as the self-signedCA certificate, type
the following command:
• keytool -import -trustcacerts -file <certificate_file> -keystore <keystore_file>-storepass <password> -alias <alias>
• For example, keytool -import -trustcacerts -file server.cert -keystore server.jks-storepass secret -aliasmytrustedkey
b. Copy the CA certificate file to the /opt/qradar/conf/trusted_certificates on the JSA
console.
8. Edit the<solution_directory>/solution.properties file to uncomment and configure the
following properties:
• javax.net.ssl.trustStore=<keystore_file>
• {protect}-javax.net.ssl.trustStorePassword=<password>
• javax.net.ssl.keyStore=<keystore_file>
• {protect}-javax.net.ssl.keyStorePassword=<password>
NOTE: The default unmodified passwordmight be displayed in thefollowing format: {encr}EyHbak. Enter the password as plain text. The
passwordencrypts the first time that you start Tivoli®Directory Integrator.
9. Start Tivoli®Directory Integrator.
RelatedDocumentation
Creating and Managing User Information Source on page 92•
• Collecting User Information on page 94
• User Information Source Overview on page 87
Creating andManaging User Information Source
Use theUISConfigUtil utility to create, retrieve, update, or delete user information sources.
• Creating a User Information Source on page 93
• Retrieving User Information Sources on page 93
• Editing a User Information Source on page 94
• Deleting a User Information Source on page 94
RelatedDocumentation
Collecting User Information on page 94•
• User Information Source Overview on page 87
Copyright © 2018, Juniper Networks, Inc.92
Juniper Secure Analytics Administration Guide

• Configuring the Tivoli Directory Integrator Server on page 89
Creating a User Information Source
Use the UISConfigUtil utility to create a user information source.
Before you create a user information source, youmust install and configure your Tivoli®
Directory Integrator server. For more information, see “Configuring the Tivoli Directory
Integrator Server” on page 89.
Whenyoucreateauser information source, youmust identify theproperty values required
to configure the user information source. The following table describes the supported
property values:
Table 17: Supported User Interface Property Values
DescriptionProperty
Defines the host name of the Tivoli® Directory Integrator server.tdiserver
Defines the listening port for the HTTP connector on the Tivoli® Directory Integrator server.tdiport
Defines the host name of the user information source host.hostname
Defines the listeningport for the IdentityandAccessManagement registryon theuser informationhost.
port
Defines theuser name that JSAanduse toauthenticate to the Identity andAccessManagementregistry.
username
Defines the password that is required to authenticate to the Identity and Access Managementregistry.
password
Defines the base DN.
NOTE: All users thatare referenced inall groupsmustbe found ina search fromthesearchbase.
searchbase
Defines the search filter that is required to filter the groups that are retrieved from the Identityand Access Management registry.
search filter
Retrieving User Information Sources
Use the UISConfigUtil utility to retrieve user information sources.
1. Using SSH, log in to your JSA Console as the root user.
a. User name: root
b. Password: <password>
2. Choose one of the following options:
a. Type the following command to retrieve all user information sources:
UISConfigUtil.sh get <name>
93Copyright © 2018, Juniper Networks, Inc.
Chapter 6: User Information Source Configuration

b. Type the following command to retrieve a specific user information source:
UISConfigUtil.sh get <name>
Where <name> is the name of the user information source you want to retrieve.
For example:
[root@vmibm7089 bin]# .UISConfigUtil.sh get "UIS_AD"
Editing a User Information Source
Use the UISConfigUtil utility to edit a user information source.
1. Using SSH, log in to your JSA Console as the root user.
a. User name: root
b. Password: <password>
Deleting a User Information Source
Use the UISConfigUtil utility to delete a user information source.
1. Using SSH, log in to your JSA Console as the root user.
a. User name: root
b. Password: <password>
2. Type the following command to delete a user information source:
UISConfigUtil.sh delete <name>
Where <name> is the name of the user information source you want to delete.
Thecollecteduser information is stored in a referencedata collection in the JSAdatabase.
If no reference data collection exists, a new reference data collection is created. If a
reference data collection was previously created for this user information source, the
referencemap is purged of previous data and the new user information is stored. For
more information about reference data collections, see “Reference Data Collections for
User Information” on page 88.
Collecting User Information
Use the GetUserInfo utility to collect user information from the user information sources
and store the data in a reference data collection.
Use this task to collect user information on demand. If you want to create automatic
user information collection on a schedule, create a cron job entry. For more information
about cron jobs, see your Linux documentation.
1. Using SSH, log in to your JSA Console as the root user.
a. User name: root
b. <password>
Copyright © 2018, Juniper Networks, Inc.94
Juniper Secure Analytics Administration Guide

2. Type the following command to collect user information on demand:
GetUserInfo.sh <UISName>
Where <UISName> is the name of the user information source you want to collectinformation from.
The collected user information is stored in a reference data collection on the database.
If no reference date collection exists, a new reference data collection is created. If a
reference data collection was previously created for this user information source, the
referencemap is purged of previous data and the new user information is stored. For
more information about reference data collections, see “Reference Data Collections for
User Information” on page 88.
RelatedDocumentation
• User Information Source Overview on page 87
• Configuring the Tivoli Directory Integrator Server on page 89
• Creating and Managing User Information Source on page 92
95Copyright © 2018, Juniper Networks, Inc.
Chapter 6: User Information Source Configuration

Copyright © 2018, Juniper Networks, Inc.96
Juniper Secure Analytics Administration Guide

CHAPTER 7
Set Up JSA
• Set Up JSA on page 97
• Network Hierarchy on page 97
• Automatic Updates on page 102
• Set Up a JSA Update Server on page 110
• Configuring System Settings on page 114
• Configuring Your IF-MAP Server Certificates on page 120
• SSL Certificate Replacement in JSA Products on page 122
• IPv6 Addressing in JSA Deployments on page 125
• Data Retention on page 127
• Configuring System Notifications on page 131
• CustomOffense Close Reasons on page 136
• Configuring a Custom Asset Property on page 138
• Index Management on page 139
Set Up JSA
Use the features on the Admin tab to set up JSA.
You can configure your network hierarchy, automatic updates, system settings, event
and flow retention buckets,
system notifications,
console settings, offense close reasons, and index management.
Network Hierarchy
JSA uses the network hierarchy to understand your network traffic and provide you with
the ability to view activity for your entire deployment.
Whenyoudevelopyournetworkhierarchy, consider themosteffectivemethod for viewing
network activity. The network hierarchy does not need to resemble the physical
deployment of your network. JSA supports any network hierarchy that can be defined by
a rangeof IP addresses. You canbase your network onmanydifferent variables, including
geographical or business units.
97Copyright © 2018, Juniper Networks, Inc.

When you define your network hierarchy, youmust consider the systems, users, and
servers that can be grouped.
You can group systems and user groups that have similar behavior. However, do not
group a server that has unique behavior with other servers on your network. Placing a
unique server alone provides the server greater visibility in JSA, and you canmanage
specific policies.
Within a group, you can place servers with high volumes of traffic, such as mail servers,
at the top of the group. This hierarchy provides you with a visual representation when a
discrepancy occurs.
If your deployment processes more than 600,000 flows, then you can create multiple
top-level groups.
You can organize your systems and networks by role or similar traffic patterns. For
example, mail servers, departmental users, labs, or development groups. Using this
organization, you can differentiate network behavior and enforce network management
security policies.
Large network groups can cause you difficulty when you view detailed information for
each object. Do not configure a network group with more than 15 objects.
Combine multiple Classless Inter-Domain Routings (CIDRs) or subnets into a single
network group to conserve disk space. For example:
Table 18: Example OfMultiple CIDRs and Subnets in a Single Network Group
IP addressesDescriptionGroup
10.10.5.0/24Marketing1
10.10.8.0/21Sales2
10.10.1.3/32
10.10.1.4/32
10.10.1.5/32
Database Cluster3
Add key servers as individual objects and group other major but related servers into
multi-CIDR objects.
Define an all-encompassing group so when you define new networks, the appropriate
policies, and behavioral monitors are applied. For example:
Table 19: Example Of an All-encompassing Group
IP addressSubgroupGroup
10.10.0.0/16ClevelandmiscellaneousCleveland
10.10.8.0/21Cleveland SalesCleveland
Copyright © 2018, Juniper Networks, Inc.98
Juniper Secure Analytics Administration Guide

Table 19: Example Of an All-encompassing Group (continued)
IP addressSubgroupGroup
10.10.1.0/24Cleveland MarketingCleveland
If you add a network to the example, such as 10.10.50.0/24, which is an HR department,
the traffic displays as Cleveland-based and any rules you apply to the Cleveland group
are applied by default.
• Acceptable CIDR Values on page 99
• Defining Your Network Hierarchy on page 101
RelatedDocumentation
Automatic Updates on page 102•
• Set Up a JSA Update Server on page 110
• Configuring System Settings on page 114
Acceptable CIDR Values
JSA accepts specific CIDR values.
The following table provides a list of the CIDR values that JSA accepts:
Table 20: Acceptable CIDR Values
HostsNumber of NetworksMaskCIDR Length
2,147,483,392128 A128.0.0.0/1
1,073,741,69664 A192.0.0.0/2
536,870,84832 A224.0.0.0/3
268,435,42416 A240.0.0.0/4
134,217,7128 A248.0.0.0/5
67,108,8564 A252.0.0.0/6
33,554,4282 A254.0.0.0/7
16,777,2141 A255.0.0.0/8
8,388,352128 B255.128.0.0/9
4,194,17664 B255.192.0.0/10
2,097,08832 B255.224.0.0/11
99Copyright © 2018, Juniper Networks, Inc.
Chapter 7: Set Up JSA

Table 20: Acceptable CIDR Values (continued)
HostsNumber of NetworksMaskCIDR Length
1,048,54416 B255.240.0.0/12
524,2728 B255.248.0.0/13
262,1364 B255.252.0.0/14
131,0682 B255.254.0.0/15
65,5341 B255.255.0.0/16
32,512128 C255.255.128.0/17
16,25664 C255.255.192.0/18
8,12832 C255.255.224.0/19
4,06416 C255.255.240.0/20
2,0328 C255.255.248.0/21
1,0164 C255.255.252.0/22
5082 C255.255.254.0/23
2541 C255.255.255.0/24
1242 subnets255.255.255.128/25
624 subnets255.255.255.192/26
308 subnets255.255.255.224/27
1416 subnets255.255.255.240/28
632 subnets255.255.255.248/29
264 subnets255.255.255.252/30
nonenone255.255.255.254/31
11/256 C255.255.255.255/32
For example, a network is called a supernet when the prefix boundary contains fewer
bits than thenatural (or classful)maskof thenetwork. A network is calleda subnetwhen
the prefix boundary contains more bits than the natural mask of the network:
• 209.60.128.0 is a class C network address with amask of /24.
Copyright © 2018, Juniper Networks, Inc.100
Juniper Secure Analytics Administration Guide

• 209.60.128.0 /22 is a supernet that yields:
• 209.60.128.0 /24
• 209.60.129.0 /24
• 209.60.130.0 /24
• 209.60.131.0 /24
• 192.0.0.0 /25
Subnet Host Range
0 192.0.0.1-192.0.0.126
1 192.0.0.129-192.0.0.254
• 192.0.0.0 /26
Subnet Host Range
0 192.0.0.1 - 192.0.0.62
1 192.0.0.65 - 192.0.0.126
2 192.0.0.129 - 192.0.0.190
3 192.0.0.193 - 192.0.0.254
• 192.0.0.0 /27
Subnet Host Range
0 192.0.0.1 - 192.0.0.30
1 192.0.0.33 - 192.0.0.62
2 192.0.0.65 - 192.0.0.94
3 192.0.0.97 - 192.0.0.126
4 192.0.0.129 - 192.0.0.158
5 192.0.0.161 - 192.0.0.190
6 192.0.0.193 - 192.0.0.222
7 192.0.0.225 - 192.0.0.254
Defining Your Network Hierarchy
JSA considers all networks in the network hierarchy as local. Keep the network hierarchy
up to date to prevent false offenses.
Network objects are a container for CIDR addresses. Any IP address that is covered by a
CIDR range in the network hierarchy is considered a local address. Any IP address that is
not defined in a network objects CIDR range is considered a remote IP address. A CIDR
can belong only to one network object, however subsets of a CIDR range can belong to
another network object. Network traffic matches themost exact CIDR. A network object
can havemultiple CIDR ranges assigned to it.
101Copyright © 2018, Juniper Networks, Inc.
Chapter 7: Set Up JSA

1. Click the Admin tab.
2. On the navigation menu, click SystemConfiguration.
3. Click Network Hierarchy.
4. From themenu tree on the Network Viewswindow, select the area of the network in
which you want to work.
5. To add network objects, follow these steps:
a. Click Add and type a unique name and description for the object.
b. From the Group list, select the group in which you want to add the new network
object.
c. To add a group, click the icon beside the Group list and type a name for the group.
d. Type a CIDR range for this object and click Add.
e. Click Create.
f. Repeat the steps for all network objects.
6. Click Edit or Delete to work with existing network objects.
Automatic Updates
You can automatically or manually update your configuration files to ensure that your
configuration files contain the latest network security information.
Updated configuration files help to eliminate false positives and to protect your system
from the latest malicious sites, botnets, and other suspicious Internet activity.
• Automatic Update Requirements on page 103
• Description Of Updates on page 103
• Automatic Updates for High Availability Deployments on page 103
• Frequency Of Automatic Updates for New Installations and Upgrades on page 103
• Viewing Pending Updates on page 104
• Configuring Automatic Update Settings on page 105
• Configuring Updates Behind a Proxy Server That Uses SSL or TLS
Interception on page 107
• Scheduling an Update on page 107
• Clearing Scheduled Updates on page 107
• Checking for New Updates on page 108
• Manually Installing Automatic Updates on page 108
• Viewing Your Update History on page 109
Copyright © 2018, Juniper Networks, Inc.102
Juniper Secure Analytics Administration Guide

• Restoring Hidden Updates on page 109
• Viewing the Autoupdate Log on page 110
Automatic Update Requirements
The JSAConsolemustbeconnected to the Internet to receive theupdates. If your console
is not connected to the Internet, youmust configure an internal update server for your
console to download the files.
Tomaintain the integrity of your current configuration and information, either replace
your existing configuration files or integrate the updated files with your existing files.
After you install updates on your console and deploy your changes, the console updates
its managed hosts if your deployment is defined in your deployment editor. For more
information about the deployment editor, see “Deployment Editor” on page 183.
Description Of Updates
Update files can include the following updates:
• Configuration updates that are based on content, including configuration file changes,
vulnerabilities,QIDmaps, supportability scripts, andsecurity threat informationupdates.
• DSM, scanner, andprotocol updates that include corrections toparsing issues, scanner
changes, and protocol updates.
• Major updates, such as updated JAR files or large patches, that require restarting the
user interface service.
• Minor updates, such as daily automatic update logs or QIDmap scripts, that do not
restart the user interface service.
Automatic Updates for High Availability Deployments
When you update your configuration files on a primary host and deploy your changes,
the updates are automatically made on the secondary host. If you do not deploy your
changes, the updates are made on the secondary host through an automated process
that runs hourly.
Frequency Of Automatic Updates for New Installations and Upgrades
The default frequency of the automatic update is determined by the installation type
and the JSA version.
• If you upgrade from JSA versions earlier than 2014.1, the value to which the update
frequency is set remains the same after the upgrade. By default, the update is set to
weekly, but you canmanually change the frequency.
• If you install anew installationof JSA2014.1 or later, thedefault frequencyof theupdate
is daily. You canmanually change the frequency.
103Copyright © 2018, Juniper Networks, Inc.
Chapter 7: Set Up JSA

Viewing Pending Updates
Your system needs to be operational long enough to retrieve the weekly updates. If no
updatesaredisplayed in theUpdateswindow,either your systemhasnotbeen inoperation
long enough to retrieve theweekly updates or noupdates havebeen issued. If this occurs,
you canmanually check for new updates. For more information about checking for new
updates, see “Checking for New Updates” on page 108.
The Check for Updates toolbar provides the following functions:
Table 21: Check for Updates Toolbar Functions
DescriptionFunction
Select one or more updates, and then click Hide to remove the selected updates from the Check forUpdates page. You can view and restore the hidden updates on the Restore Hidden Updates page.For more information, see “Restoring Hidden Updates” on page 109.
Hide
You canmanually install updates.When youmanually install updates, the installation process startswithin a minute. For more information, see “Manually Installing Automatic Updates” on page 108.
Install
You can configure a specific date and time tomanually install selected updates on your Console.Scheduling is useful when you want to schedule the update installation during off-peak hours. Formore information, see “Scheduling an Update” on page 107.
Schedule
You can remove preconfigured schedules for manually installing updates on your Console. For moreinformation, see “Scheduling an Update” on page 107.
Unschedule
You can locate a specific update by name.Search By Name
This counter displays the amount of time until the next automatic refresh. The list of updates on theCheck forUpdatespageautomatically refreshes every60seconds. The timer is automatically pausedwhen you select one or more updates.
Next Refresh
Pauses the automatic refresh process. To resume automatic refresh, click Play.Pause
Refreshes the list of updates.Refresh
1. Click the Admin tab.
2. On the navigation menu, click SystemConfiguration.
3. Click Auto Update.
4. To view details on an update, select the update.
Your system is preconfigured for weekly automatic updates. You can view the pending
updates in the Updateswindow.
Copyright © 2018, Juniper Networks, Inc.104
Juniper Secure Analytics Administration Guide

Configuring Automatic Update Settings
You can select the Auto Deploy to automatically deploy updates. If Auto Deploy is not
selected, thenyoumustmanuallydeploychanges, fromtheDashboard tab, after updates
are installed.
NOTE: In high-availability (HA) environment, automatic updates aren'tinstalledwhenasecondaryhost isactive.Theupdatesare installedonlyafterthe primary host become the active node.
You can select Auto Restart Service to allow automatic updates that require the user
interface to restart. A user interface disruption occurs when the service restarts.
Alternatively, you canmanually install the updated from the Check for Updateswindow.
1. Click the Admin tab.
2. On the navigation menu, click SystemConfiguration.
3. Click Auto Update.
4. On the navigation menu, click Change Settings.
5. On the Basic tab, select the schedule for updates.
6. In the Configuration Updates section, select the method that you want to use for
updating your configuration files.
• Tomerge your existing configuration files with the server updates without affecting
your custom signatures, custom entries, and remote network configurations, select
the Auto Integration option.
• To override your customizationswith server settings, select theAutoUpdate option.
7. In the DSM, Scanner, Protocol Updates section, select an option to install updates.
8. In theMajor Updates section, select an option for receiving major updates for new
releases.
9. In theMinor Updates section, select an option for receiving patches for minor system
issues.
10. Choose one of the following options:
• If you want to deploy update changes automatically after updates are installed,
select the Auto Deploy check box.
105Copyright © 2018, Juniper Networks, Inc.
Chapter 7: Set Up JSA

• If you want to restart the user interface service automatically after updates are
installed, select the Auto Restart Service check box.
11. Click the Advanced tab.
12. InWeb Server field, type the web server fromwhich you want to obtain the updates.
The default web server is https://download.juniper.net/.
13. In the Directory field, type the directory location on which the web server stores the
updates.
The default directory is software/strm/autoupdate/.
14. In the Proxy Server field, type the URL for the proxy server.
If the application server uses a proxy server to connect to the Internet, the proxy server
is required.
15. In the Proxy Username field, type the user name for the proxy server.
If you are using an authenticated proxy, a user name is required.
16. In the Proxy Password field, type the password for the proxy server.
If you are using an authenticated proxy, a password is required.
17. Select theSendFeedback checkbox if youwant to send feedback to JuniperNetworks
about the update.
If errors occur during an update, feedback is automatically sent by a web form.
18. In the Backup Retention Period list, type or select the number of days that you want
to store files that are replaced during the update process.
The files are stored in the location that is specified in the Backup Location. The
minimum is one day and themaximum is 65535 years.
19. In the Backup Location field, type the location where you want to store backup files.
20. In theDownloadPath field, type the directory path location towhich youwant to store
DSM, minor, andmajor updates.
The default directory path is /store/configservices/staging/updates.
21. Click Save.
You customize the automatic update settings to change the frequency, update type,
server configuration, and backup settings.
Copyright © 2018, Juniper Networks, Inc.106
Juniper Secure Analytics Administration Guide

Configuring Updates Behind a Proxy Server That Uses SSL or TLS Interception
To configure JSA updates behind a proxy server, add your proxy server's CA certificate
to the ca-bundle.crt file.
1. Create a backup copy of the ca-bundle.crt file in JSA For example, use the copy
command to create a .bak file: cp /etc/ssl/certs/ca-bundle.crt{,bak}.
2. Get the CA certificate from your proxy server. For more information, see the proxy
server documentation.
3. Add the CA certificate to the ca-bundle.crt file by running the following command:
openssl x509 -text -in /path/to/proxycert.crt >> /etc/ssl/certs/ca-bundle.crt
Scheduling an Update
To reduce performance impacts on your system, schedule a large update to run during
off-peak hours.
For detailed information on each update, you can select the update. A description and
any error messages are displayed in the right pane of the window.
Automatic updates occur ona recurring schedule according to the settings on theUpdate
Configuration page. You can also schedule an update or a set of updates to run at a
specific time.
1. Click the Admin tab.
2. On the navigation menu, click SystemConfiguration.
3. Click Auto Update.
4. If youwant to schedule specific updates, select theupdates that youwant to schedule.
5. From the Schedule list box, select the type of update you want to schedule.
6. Using the calendar, select the start date and time of when you want to start your
scheduled updates.
Clearing Scheduled Updates
Scheduled updates display a status of Scheduled in the Status field. After the schedule
is cleared, the status of the update displays as New.
107Copyright © 2018, Juniper Networks, Inc.
Chapter 7: Set Up JSA

You can cancel any scheduled update.
1. Click the Admin tab.
2. On the navigation menu, click SystemConfiguration.
3. Click Auto Update.
4. On the navigation menu, click Check for Updates.
5. If you want to clear specific scheduled updates, select the updates that you want to
clear.
6. From the Unschedule list box, select the type of scheduled update that you want to
clear.
Checking for NewUpdates
JuniperNetworksprovidesupdatesona regularbasis.Bydefault, theAutoUpdate feature
is scheduled to automatically download and install updates. If you require an update at
a time other than the preconfigured schedule, you can download new updates.
1. Click the Admin tab.
2. On the navigation menu, click SystemConfiguration.
3. Click Auto Update.
4. On the navigation menu, click Check for Updates.
5. Click Get new updates.
Manually Installing Automatic Updates
The system retrieves the new updates and this might take an extended period. When
complete, new updates are listed on the Updateswindow.
Juniper Networks provides updates regularly. By default, updates are automatically
downloaded and installed on your system. However, you can install an update at a time
other than the preconfigured schedule.
1. Click the Admin tab.
2. On the navigation menu, click SystemConfiguration.
3. Click Auto Update.
Copyright © 2018, Juniper Networks, Inc.108
Juniper Secure Analytics Administration Guide

4. On the navigation menu, click Check for Updates.
5. If you want to install specific updates, select the updates that you want to schedule.
6. From the Install list box, select the type of update you want to install.
Viewing Your Update History
Adescription of the update and any installation errormessages are displayed in the right
paneof theViewUpdateHistorypage.TheViewUpdateHistorypageprovides the following
information:
After an update was successfully installed or failed to install, the update is displayed on
the ViewUpdate History page.
1. Click the Admin tab.
2. On the navigation menu, click SystemConfiguration.
3. Click Auto Update.
4. On the navigation menu, click ViewUpdate History.
5. Using the Search by Name text box, you can type a keyword and then press Enter to
locate a specific update by name.
6. To investigate a specific update, select the update.
Restoring Hidden Updates
You can remove updates from the Check for Updates page. You can view and restore the
hidden updates on the Restore Hidden Updates page.
1. Click the Admin tab.
2. On the navigation menu, click SystemConfiguration.
3. Click Auto Update.
4. On the navigation menu, click Restore Hidden Updates.
5. To locate an update by name, type a keyword in the Search by Name text box and
press Enter.
109Copyright © 2018, Juniper Networks, Inc.
Chapter 7: Set Up JSA

6. Select the hidden update that you want to restore.
7. Click Restore.
Viewing the Autoupdate Log
The autoupdate log contains the most recent automatic update that was run on your
system.
1. Click the Admin tab.
2. On the navigation menu, click SystemConfiguration.
3. Click Auto Update.
4. On the navigation menu, click View Log.
RelatedDocumentation
Set Up a JSA Update Server on page 110•
• Configuring System Settings on page 114
• Configuring Your IF-MAP Server Certificates on page 120
Set Up a JSA Update Server
If your deployment includes a JSA Console that is unable to access the Internet or you
want to manually manage updates to your system, you can set up a JSA update server
to manage the update process.
The autoupdate package includes all files necessary tomanually set up an update server
in addition to the necessary system configuration files for each update. After the initial
setup, youonlyneedtodownloadanduncompress themostcurrentautoupdatepackage
to manually update your configuration.
• Configuring Your Update Server on page 110
• Configuring Your JSA Console As the Update Server on page 112
• Adding New Updates on page 113
Configuring Your Update Server
Use this task to configure an Apache server.
1. Access your Apache server.
By default, the update directory is in the web root directory of the Apache server. You
can place the directory in another location if you configure JSA accordingly.
2. Create an update directory named software/strm/autoupdate//.
Copyright © 2018, Juniper Networks, Inc.110
Juniper Secure Analytics Administration Guide

3. Create an Apache user account and password to be used by the update process.
4. Download the autoupdate package from Juniper Customer Support.
5. Save the autoupdate package file on your Apache server in the
software/strm/autoupdate/ directory that you created.
6. On the Apache server, type the following command to decompress the autoupdate
package:
tar -zxf updatepackage-[timestamp].tgz
7. Click the Admin tab.
8. On the navigation menu, click SystemConfiguration.
9. Click Auto Update.
10. Click Change Settings.
11. Select the Advanced tab.
12. Todirect the update process to theApache server, configure the following parameters
in the Server Configuration panel:
a. InWeb Server field, type the address or directory path of your Apache server.
If the Apache server runs on non-standard ports, add :<portnumber> to the end of
the address.
http://ApacheserverIP:8080
b. In theDirectory field, type the directory location onwhich theweb server stores the
updates. The default directory is software/strm/autoupdate/.
c. In the Proxy Server field, type the URL for the proxy server.
The proxy server is required if the application server uses a proxy server to connect
to the Internet.
d. In the Proxy Username field, type the user name for the proxy server.
A user name is required if you are using an authenticated proxy.
e. In the Proxy Password field, type the password for the proxy server.
A password is required if you are using an authenticated proxy.
13. Select Deploy changes.
14. Click Save.
111Copyright © 2018, Juniper Networks, Inc.
Chapter 7: Set Up JSA

15. Using SSH, log in to JSA as the root user.
16. Type the following command to configure the user name that you set for your Apache
server:
/opt/qradar/bin/UpdateConfs.pl -change_username <username>
17. Type the following command to configure the password that you set for your Apache
server:
/opt/qradar/bin/UpdateConfs.pl -change_password <password>
18. Test your update server by typing the command:
lynx https://<your update server>/<directory path to updates>/manifest_list
19. Type the user name and password.
Configuring Your JSA Console As the Update Server
Toconfigure your JSAconsole to be your update server, perform the following three tasks:
• Create an autoupdate directory.
• Download the autoupdate package from Juniper Customer Support.
• Configure JSA to accept the autoupdates.
To create the JSA autoupdate directory, download the autoupdate package, and to
configure for autoupdates:
1. Log in to JSA as the root user.
2. Type the following command to create the autoupdate directory:
mkdir /opt/qradar/www/software/strm/autoupdate/
3. Download the autoupdate package from Juniper Customer Support.
4. Save the autoupdate package file on your JSA server in the
/opt/qradar/www/software/strm/autoupdate/ directory that you created.
5. On your JSA console, type the following command to decompress the autoupdate
package:
tar -zxf autoupdate[timestamp].tgz
6. Log in to JSA UI.
7. Select Admin tab.
Copyright © 2018, Juniper Networks, Inc.112
Juniper Secure Analytics Administration Guide

8. In the navigation pane, click SystemConfiguration.
9. Click Auto Update.
10. Click Change Settings.
11. Select the Advanced tab.
12. In theWeb Server field, type https://localhost/ being sure to include forward slashes
as shown.
13. In the Directory field, type software/strm/autoupdate/ being sure to include forward
slashes as shown.
14. Click Save, you will receive a blue notification, this is normal.
15. Click Check for Updates from the left menu.
16. Click Get NewUpdates button.
Your JSA autoupdate directory is created, the autoupdate package downloaded, and
the configuration for autoupdates is complete.
Adding NewUpdates
Youmust configure your update server and set up JSA to receiveupdates fromtheupdate
server.
1. Download the autoupdate package from Juniper Customer Support.
2. Save the autoupdate package file on your update server in the autoupdates/ directory
that you created.
3. Type the following command to decompress the autoupdate package:
tar -zxf autoupdate-[timestamp].tgz
4. Log in to JSA as the root user.
5. Type the following command to test your update server:
lynx https://<your update server>/<directory path to updates>/manifest_list
6. Type the user name and password of your update server.
113Copyright © 2018, Juniper Networks, Inc.
Chapter 7: Set Up JSA

RelatedDocumentation
Configuring System Settings on page 114•
• Configuring Your IF-MAP Server Certificates on page 120
• SSL Certificate Replacement in JSA Products on page 122
Configuring SystemSettings
The SystemSettingswindow includes configurable parameters for the following system
settings:
• System settings
• Database settings
• Ariel database settings
• SNMP settings
• Embedded SNMP daemon settings
• Asset profile settings
• Console settings
• Authentication settings
• DNS settings
• WINS settings
• Reporting settings
• Data export settings
1. Click the Admin tab.
2. On the navigation menu, click SystemConfiguration.
3. Click the SystemSettings icon.
4. Configure the system settings. Click the Help button to see setting descriptions.
5. Click Save.
6. On the Admin tabmenu, select Advanced >Deploy Full Configuration.
When you deploy the full configuration, JSA restarts all services. Data collection for
events and flows stops until the deployment completes.
• Customizing the Right-click Menu on page 115
• Enhancing the Right-click Menu for Event and Flow Columns on page 116
Copyright © 2018, Juniper Networks, Inc.114
Juniper Secure Analytics Administration Guide

• Asset Retention Values Overview on page 118
• Creating JSA Login Message File on page 119
You can configure common system settings on the SystemSettingswindow.
RelatedDocumentation
Configuring Your IF-MAP Server Certificates on page 120•
• SSL Certificate Replacement in JSA Products on page 122
• IPv6 Addressing in JSA Deployments on page 125
Customizing the Right-click Menu
To provide quick access to functions, customize menu options by using a plug-in
application programming interface (API). For example, you can addmore menu items,
such as an option to scan the NetBIOS.
The ip_context_menu.xml file acceptsmenuEntryXML nodes to customize the right-click
menu.
<menuEntry name="{Name}" description="{Description}" exec="{Command}" url="{URL}" requiredCapabilities="{Required Capabilities}"/>
The following list describes the attributes in themenuEntry element:
Name—The text that is displayed in the right-click menu.
Description—The description of the entry. The description text is displayed in the tooltip
for your menu option. The description is optional.
URL—Specifies the web address that opens in a newwindow.
You can use the placeholder%IP% to represent the IP address. The ampersand
character (&), the left angle bracket (<), and the right angle bracket (>) must be
escaped using the strings &, <, and > respectively.
For example, to pass a URL with multiple parameters that includes a placeholder
for the IPaddress, youcanuse this syntax:url="/lookup?&ip=%IP%;force=true"
Command—A command that you want to run on the JSA Console. The output of thecommand is displayed in a newwindow. Use the placeholder,%IP%, to represent
the IP address that is selected.
Required Capabilities—Any capabilities, for example, "ADMIN", that the user must havebefore they select this option, comma-delimited. If the user does not have all
capabilities that are listed, the entries are not displayed. Required capabilities is an
optional field.
The edited file must look similar to the following example:
<?xml version="1.0" encoding="UTF-8"?><!- This is a configuration file to add custom actions intothe IP address right-click menu. Entries must be of one of thefollowing formats: -->
115Copyright © 2018, Juniper Networks, Inc.
Chapter 7: Set Up JSA

<contextMenu><menuEntry name="Traceroute" exec="/usr/sbin/traceroute %IP%" /><menuEntry name="External ARIN Lookup"url="http://ws.arin.net/whois/?queryinput=%IP%" /></contextMenu>
1. Using SSH, log in to JSA as the root user.
2. On the JSA server, copy the ip_context_menu.xml file from the
/opt/qradar/conf/templates directory to the /opt/qradar/conf directory.
3. Open the /opt/qradar/conf/ip_context_menu.xml file for editing.
4. Edit the attributes in themenuEntry element .
5. Save and close the file.
6. To restart services, type the following command:
service tomcat restart
Enhancing the Right-click Menu for Event and Flow Columns
1. Using SSH, log in to the JSA console appliance as the root user.
2. Go to the /opt/qradar/conf directory and create a file that is named
arielRightClick.properties.
3. Edit the /opt/qradar/conf/arielRightClick.properties file. Use the following table to
specify the parameters that determine the options for the right-click menu.
Table 22: Description Of the ArielRightClick.properties File Parameters
ExampleDescriptionRequirementParameter
IndicateseitheraURLor scriptaction.RequiredpluginActions
sourceIP
sourcePort
destinationIP
qid
Specifies the column, or Ariel fieldname, for which the right-clickmenuis enabled.
RequiredarielProperty
Google searchSpecifies the text that isdisplayedonthe right-click menu.
Requiredtext
Copyright © 2018, Juniper Networks, Inc.116
Juniper Secure Analytics Administration Guide

Table 22: Description Of the ArielRightClick.properties File Parameters (continued)
ExampleDescriptionRequirementParameter
If the parameter is set to true for theevent name (QID) property, the eventname of the QID is passed to the script.
If the parameter is set to false, the raw,unformatted QID value is passed to thescript.
Specifies whether formatted valuesare passed to the script.
Set to <true> to ensure that theformatted value for attributes, suchasusernameandpayload, arepassed.Formatted values are easier foradministrators to read thanunformatted values.
OptionaluseFormattedValue
sourceIPwebUrlAction.url=http://www.mywebsite.com?q=$sourceIP$
Specifies the URL, which opens in anewwindow, and the parameters topass to the URL.
Use the format: $Ariel_Field Name$
Required toaccess a URL
url
destinationPortScriptAction.command=/bin/echo
Specifies the absolute path of thecommand or script file.
Required if theaction is acommand
command
destinationPortScriptAction.arguments=$qid$
Specifies the data to pass to thescript.
Use the following format:$Ariel_FieldName$
Required if theaction is acommand
arguments
For each of the key names that are specified in the pluginActions list, define the action
by using a key with the format key name, property.
4. Save and close the file.
5. Log in to the JSA user interface.
6. Click the Admin tab.
7. Select Advanced >RestartWeb Server.
The following example shows how to add Test URL as a right-click option for source IP
addresses.
pluginActions=sourceIPwebUrlAction
sourceIPwebUrlAction.arielProperty=sourceIPsourceIPwebUrlAction.text=Test URLsourceIPwebUrlAction.url=http://www.mywebsite.com?q=$sourceIP$
The following example shows how to enable script action for destination ports.
pluginActions=destinationPortScriptAction
117Copyright © 2018, Juniper Networks, Inc.
Chapter 7: Set Up JSA

destinationPortScriptAction.arielProperty=destinationPortdestinationPortScriptAction.text=Test Unformatted CommanddestinationPortScriptAction.useFormattedValue=falsedestinationPortScriptAction.command=/bin/echodestinationPortScriptAction.arguments=$qid$
The following example shows adding several parameters to a URL or a scripting action.
pluginActions=qidwebUrlAction,sourcePortScriptAction
qidwebUrlAction.arielProperty=qid,device,eventCountqidwebUrlAction.text=Search on GoogleqidwebUrlAction.url=http://www.google.com?q=$qid$-$device$-$eventCount$
sourcePortScriptAction.arielProperty=sourcePortsourcePortScriptAction.text=Port Unformatted CommandsourcePortScriptAction.useFormattedValue=truesourcePortScriptAction.command=/bin/echosourcePortScriptAction.arguments=$qid$-$sourcePort$-$device$-$CONTEXT$
You can addmore actions to the right-click options that are available on the columns in
the Log Activity table or the Network Activity table. For example, you can add an option
to viewmore information about the source IP or destination IP.
You can pass any data that is in the event or flow to the URL or script.
Asset Retention Values Overview
Additional information for the period, in days, that you want to store the asset profile
information.
• Assets are tested against the retention thresholds at regular intervals. By default, the
cleanup interval is 12 hours.
• All specified retention periods are relative to the last seen date of the information,
regardlessofwhether the informationwas last seenbya scanner or passively observed
by the system.
• Asset information is deleted as it expires, meaning that following a cleanup interval,
all asset information within its retention threshold remains.
• By default, assets that are associatedwith un-remediated vulnerabilities (as detected
by JSA Vulnerability Manager or other scanner) are retained.
• Assets can always be deletedmanually through the user interface.
Table 23: Asset Components
NotesDefault retention (in days)Asset component
By default, user-supplied IP Addressesare retained until they are deletedmanually.
120 daysIP Address
By default, user-supplied interfaces areretained until they are deletedmanually.
120 daysMAC Addresses (Interfaces)
Copyright © 2018, Juniper Networks, Inc.118
Juniper Secure Analytics Administration Guide

Table 23: Asset Components (continued)
NotesDefault retention (in days)Asset component
bydefault, user-suppliedhostnamesareretained until they are deletedmanually.
120 daysDNS and NetBIOS Hostnames
By default, user-supplied IP Addressesare retained until they are deletedmanually.
Theassetproperties this valuecanaffectare Given Name, Unified Name,Weight,Description, Business Owner, BusinessContact, Technical Owner, TechnicalContact, Location, Detection Confidence,Wireless AP,Wireless SSID, Switch ID,Switch Port ID, CVSS ConfidentialityRequirement,CVSSIntegrityRequirement,CVSS Availability Requirement, CVSSCollateral Damage Potential, TechnicalUser,UserSuppliedOS,OSOverrideType,OSOverride Id, Extended, Legacy(Pre-2014.1) Cvss Risk, VLAN, and AssetType.
120 daysAsset Properties
By default, user-supplied products areretained until they are deletedmanually.
Asset products include Asset OS, AssetInstalledApplications, andproducts thatare associated with open asset ports
120 daysAsset Products
120 daysAsset "Open" Ports
NetBIOS groups are seldom used, andmore customers may not be aware oftheir existence. In the case where theyare used, they are deleted after 120days.
120 daysAsset netBIOS Groups
Client Applications are not yet leveragedin the user interface. This value can beignored.
120 daysAsset Client Application
30 daysAsset Users
Creating JSA Login Message File
You can add and customize a login message on your JSA Console.
To create a login message file, youmust have root access to the command line and
experience with editing files in Linux or UNIX.
119Copyright © 2018, Juniper Networks, Inc.
Chapter 7: Set Up JSA

1. Log in to JSA as the root user.
2. Go to the /etc/ directory.
3. In a Linux or UNIX text editor, create a file without special characters in the file name.
For example, create a file named loginMSG.
4. Type your message in the loginMsg file.
5. Save your message.
6. To enable your login banner, go to Admin >SystemSettings.
7. Click Authentication Settings.
8. In the Login Message File field, type the following file path:
/etc/loginMsg
9. Click Save.
10. On the Admin tabmenu, click Deploy Changes.
11. Log out of JSA to see the new login message.
Configuring Your IF-MAP Server Certificates
Before you can configure IF-MAP authentication on the System Settings window, you
must configure your IF-MAP server certificate.
• Configuring IF-MAP Server Certificate for Basic Authentication on page 120
• Configuring IF-MAP Server Certificate for Mutual Authentication on page 121
RelatedDocumentation
SSL Certificate Replacement in JSA Products on page 122•
• IPv6 Addressing in JSA Deployments on page 125
• Data Retention on page 127
Configuring IF-MAP Server Certificate for Basic Authentication
Contact your IF-MAP server administrator to obtain a copy of the IF-MAP server public
certificate. The certificatemust have the .cert file extension, for example, ifmapserver.cert.
1. Using SSH, log in to JSA as the root user.
Copyright © 2018, Juniper Networks, Inc.120
Juniper Secure Analytics Administration Guide

2. Copy the certificate to the /opt/qradar/conf/trusted_certificates directory.
This task provides instruction for how to configure your IF-MAP certificate for basic
authentication.
Configuring IF-MAP Server Certificate for Mutual Authentication
Contact your IF-MAP server administrator to obtain a copy of the IF-MAP server public
certificate. The certificatemust have the .cert file extension, for example, ifmapserver.cert.
Mutualauthentication requirescertificateconfigurationonyourConsoleandyour IF-MAP
server. For assistance configuring the certificate on your IF-MAP server, contact your
IF-MAP server administrator.
1. Using SSH, log in to JSA as the root user.
2. Access the certificate to the /opt/qradar/conf/trusted_certificates directory
3. Copy theSSL intermediate certificate andSSLVerisign root certificate to your IF-MAP
server as CA certificates. For assistance, contact your IF-MAP server administrator.
4. Type the following command to create the Public-Key Cryptography Standards file
with the .pkcs12 file extension using the following command:openssl pkcs12 -export-inkey<private_key> -in<certificate> -out<pkcs12_filename.pkcs12> -name"IFMAPClient"
5. Type the following command to copy the pkcs12 file to the
/opt/qradar/conf/key_certificates directory:cp <pkcs12_filename.pkcs12>/opt/qradar/conf/key_certificates
6. Create a client on the IF-MAP server with the Certificate authentication and upload
the SSL certificate. For assistance, contact your IF-MAP server administrator.
7. Change the permissions of the directory by typing the following commands:chmod755 /opt/qradar/conf/trusted_certificates chmod 644/opt/qradar/conf/trusted_certificates/*.cert
8. Type the following command to restart the Tomcat service:service tomcat restart
121Copyright © 2018, Juniper Networks, Inc.
Chapter 7: Set Up JSA

This task provides instruction for how to configure your IF-MAP certificate for mutual
authentication.
SSL Certificate Replacement in JSA Products
By default, JSA products provide an untrusted SSL certificate. You can replace the
untrusted SSL certificate with either a self-signed or trusted certificate.
• SSL Certificates Overview on page 122
• Trusted Root on page 122
• SSL Connections Between JSA Components on page 122
• Creating an SSL Certificate Request with 1024-bit and 2048-bit RSA Keys on page 122
• Replacing the Default SSL Certificate on page 124
• Generating a Private/public RSA Key Pair on page 124
SSL Certificates Overview
Secure Sockets Layer (SSL) is a security protocol that provides communication privacy.
WithSSL, client/server applicationscancommunicate inaway that isdesigned toprevent
eavesdropping, tampering, andmessage forgery.
SSL is an industry standard and is used by websites to protect online transactions. To
generate an SSL link, a web server requires an SSL certificate. SSL certificates are issued
by software or trusted third-party certifying authorities.
Trusted Root
Browsers and operating systems include a preinstalled list of trusted certificates, which
are installed in the Trusted Root Certification Authorities store. JSA products trust any
certificate that is signed by a trusted root CA.
SSL Connections Between JSA Components
To establish all internal SSL connections between components, JSA uses theweb server
certificate that is preinstalled on the JSA console. If you replace the certificate with a
third-party certificate, the certificate must be the same on the JSA console and all
managed hosts.
RelatedDocumentation
IPv6 Addressing in JSA Deployments on page 125•
• Data Retention on page 127
• Configuring System Notifications on page 131
Creating an SSL Certificate Request with 1024-bit and 2048-bit RSA Keys
Togenerate anSSL certificate request fromyour JSAConsole, your RootCAmight require
a length longer than a 1024-bit key.
Copyright © 2018, Juniper Networks, Inc.122
Juniper Secure Analytics Administration Guide

1. Use an SSH client to log in JSA console.
2. Generate a private key file by using one of the following commands. Do not use the
private encryption options because of compatibility issues.
• For a 1024-bit RSA key, type the following command:
openssl genrsa -out qradar.key 1024
• For a 2048-bit RSA key, type the following command:
openssl genrsa -out qradar.key 2048
The qradar.key file is created in the current directory.
3. Generate the certificate signing request (CSR) file by using the command:
openssl req -new -key qradar.key -out qradar.csr
The qradar.csr file is created for Verisign or Comodo use.
4. Provide the following information prompted in the command-line:
• Country Name (2 letter code)
• State or Province Name
• Locality Name
• Organization Name
• Organizational Unit Name
• CommonName
• Email Address
5. If the command-line asks for more properties, leave the fields empty.
If you enter a password for the Challenge Password property and you forget the entry,
youmight not be able to use the CSR. Comodo and Verisign might not support a
challenge password.
6. To verify the information in the CSR before you send it, type the command:
openssl req -noout -text -in qradar.csr
7. Use Secure File Transfer Protocol or another program to securely copy the CSR file
to your computer.
8. Submit the CSR to Comodo or Verisign according to their instructions.
The CSR is identified as a certificate in Apache format.
123Copyright © 2018, Juniper Networks, Inc.
Chapter 7: Set Up JSA

After you have the signed certificate, you can replace the JSA installed certificate with
the instructions listed in “Replacing the Default SSL Certificate” on page 124.
Replacing the Default SSL Certificate
All trusted certificates for JSAmust meet the following requirements:
• The certificate must be a X.509 certificate and have PEM base64 encoding.
• The certificate must have a .cert, .crt, or .der file extension.
• Keystore files that contain certificates must have the .truststore file extension.
• Thecertificate filemustbe stored in the /opt/qradar/conf/trusted_certificatesdirectory.
1. Obtain a certificate from a trusted certificate authority.
2. Use SSH to log in to your JSA console as the root user.
3. To install the certificate, type the following command:
/opt/qradar/bin/install_ssl_cert.sh -i
4. Type the location of your private key file.
Do not encrypt the private key when you install or replace an SSL certificate.
5. If you are using an intermediate certificate, type the location of your public key file
and the location of your intermediate certificate.
6. To continue, type Y and press Enter.
7. If you have JSA Risk Manager installed, youmust deploy the full configuration. On the
Admin tab, click Advanced >Deploy Full Configuration.
Replace the untrusted SSL certificate in JSA with either a self-signed certificate or a
certificate that is issued by a trusted third-party certificate authority.
SSL certificates that are issued from some vendors, such as VeriSign, require an
intermediate certificate. Youmustdownload the intermediate certificate fromthevendor
and use it during the configuration.
Generating a Private/public RSA Key Pair
To obtain a trusted certificate, youmust generate a public/private RSA key pair.
1. Type the following command:
ssh-keygen -t rsa
If you want to use DSA keys, you need to use the ssh-keygen -t dsa command.
Copyright © 2018, Juniper Networks, Inc.124
Juniper Secure Analytics Administration Guide

2. Type the file in which to save the key or accept the default location.
NOTE: The default file is /root/.ssh/id_rsa.
3. Type a passphrase.
4. Type the passphrase again.
If you accepted the default file location, the identification is /root/.ssh/id_rsa. Your public
key is /root/.ssh/id_rsa.pub.
The key fingerprint is as follows:
0b:33:bb:76:1e:54:a8:48:d0:c8:b3:f9:31:41:77:e6 [email protected]
The random art image is as follows:
+--[ RSA 2048]----+| ..+. . o || +.o. + . || +.. E . || o.o. . . || ..o= S || . * . || . o || .... || ..o. |+-----------------+
In the .ssh file, there are three files:
• id_rsa id_rsa.pub know_hosts
• rsa.pub is the public key
• rsa.id is the private key
Send the private key to get the certificate and then you are returned a new public key
and an intermediate key.
IPv6 Addressing in JSA Deployments
IPv4 and IPv6 addressing is supported for network connectivity andmanagement of JSA
software and appliances. When you install JSA, you are prompted to specify whether
your Internet Protocol is IPv4 or IPv6.
Review the following details about IPv6 addressing.
JSA components that support IPv6 addressing
Deploying JSA in IPv6 or mixed environments
125Copyright © 2018, Juniper Networks, Inc.
Chapter 7: Set Up JSA

IPv6 addressing limitations
• JSA Components That Support IPv6 Addressing on page 126
• Deploying JSA in IPv6 Environment on page 126
• IPv6 Addressing Limitations on page 127
JSA Components That Support IPv6 Addressing
The following JSA components support IPv6: addressing.
Network Activity tab—Because IPv6 Source Address and IPv6 Destination Address arenotdefault columns, theyarenot automatically displayed. Todisplay these columns,
youmustselect themwhenyouconfigureyour searchparameters (columndefinition).
To save space and indexing in an IPv4 or IPv6 source environment, extra IP address
fields are not stored or displayed.
IPv6 addresses are supported for both packet data, including sFlow, and NetFlow
V9 data. However, older versions of NetFlowmight not support IPv6.
Log Activity tab—Because IPv6 Source Address and IPv6 Destination Address are notdefault columns, they are not automatically displayed. To display these columns,
youmustselect themwhenyouconfigureyour searchparameters (columndefinition).
When an address does not exist, template-based records are used to avoid wasted
space. DSMs can parse IPv6 addresses from the event payload. If any DSM cannot
parse IPv6 addresses, a log source extension can parse the addresses. For more
informationabout log sourceextensions, see the JuniperSecureAnalytics LogSources
User Guide.
Searching, grouping, and reporting on IPv6 fields—You can search events and flows byusing IPv6 parameters in the search criteria.
You can also group and sort event and flow records that are based on IPv6
parameters.
You can create reports that are based on data from IPv6-based searches.
Custom rules—The following custom rule to support IPv6 addressing was added:
SRC/DST IP = IPv6 Address
IPv6-based building blocks are available in other rules.
Deployment editor—The deployment editor supports IPv6 addresses.
Devicesupportmodules(DSMs)—DSMscanparse IPv6sourceanddestinationaddressfrom event payloads.
Deploying JSA in IPv6 Environment
To log in to JSA in an IPv6 environment, wrap the IP address in square brackets:
https://[<IP Address> ]
Copyright © 2018, Juniper Networks, Inc.126
Juniper Secure Analytics Administration Guide

Both IPv4 and IPv6 environments can use a hosts file for address translation. In an IPv6
environment, the client resolves the Console address by its host name. Youmust add
the IP address of the IPv6 console to the /etc/hosts file on the client.
Flow sources, such as NetFlow and sFlow, are accepted from IPv4 and IPv6 addresses.
Event sources, such as syslog and SNMP, are accepted from IPv4 and IPv6 addresses.
You can disable superflows and flow bundling in an IPv6 environment.
IPv6 Addressing Limitations
When JSA is deployed in an IPv6 environment, the following limitations are known:
• The network hierarchy is not updated to support IPv6.
Some parts of the JSA deployment, including surveillance, searching, and analysis, do
not take advantage of the network hierarchy. For example, within the Log Activity tab,
you cannot search or aggregate events By Network
• No IPv6-based asset profiles.
• Asset profiles are created only if JSA receives events, flows, and vulnerability data for
IPv4 hosts.
• No host profile test in custom rules for IPv6 addresses.
• No specialized indexing or optimization of IPv6 addresses.
• No IPv6-based sources and destinations for offenses
RelatedDocumentation
Data Retention on page 127•
• Configuring System Notifications on page 131
• CustomOffense Close Reasons on page 136
Data Retention
As JSA receives events and flows, each one is compared against the retention bucket
filter criteria. When an event or flowmatches a retention bucket filter, it is stored in that
retention bucket until the deletion policy time period is reached.
Retention buckets are sequenced in priority order from the top row to the bottom row.
A record is stored in the bucket that matches the filter criteria with highest priority. If the
record does not match any of your configured retention buckets, the record is stored in
the default retention bucket, which is always located below the list of configurable
retention buckets.
• Tenant Data on page 128
• Configuring Retention Buckets on page 128
• Managing Retention Bucket Sequence on page 129
127Copyright © 2018, Juniper Networks, Inc.
Chapter 7: Set Up JSA

• Enabling and Disabling a Retention Bucket on page 130
• Deleting a Retention Bucket on page 130
Retention buckets define how long event and flow data is retained in JSA.
Tenant Data
You can configure up to 10 retention buckets for shared data, and up to 10 retention
buckets for each tenant.
Whendata comes into the system, thedata is assessed todeterminewhether it is shared
data or whether the data belongs to a tenant. Tenant-specific data is compared to the
retentionbucket filters thataredefined for that tenant.When thedatamatchesa retention
bucket filter, the data is stored in that retention bucket until the retention policy time
period is reached.
If you don't configure retention buckets for the tenant, the data is automatically placed
in the default retention bucket for the tenant.
Configuring Retention Buckets
Changes to the retention bucket filters are applied immediately to incoming data only.
For example, if you configureda retentionbucket to retain all data fromsource IP address
10.0.0.0/8 for 1 day, and you later edit the filter to retain data from source IP 192.168.0.1,
the change is not retroactive. Immediately upon changing the filter, the retention bucket
has 24 hours of 10.0.0.0/8 data, and all data that is collected after the filter change is
192.168.0.1 data.
The retention policy on the bucket is applied to all data in the bucket, regardless of the
filters criteria. Using the previous example, if you changed the retention policy from 1 day
to 7 days, both the 10.0.0.0/8 data and the 192.168.0.1 data in the bucket is retained for
7 days.
TheDistributionofa retentionbucket indicates the retentionbucketusageasapercentage
of total data retention in all your retention buckets. The distribution is calculated on a
per-tenant basis.
1. Click the Admin tab.
2. On the navigation menu, click Data Sources.
3. Click the Event Retention or Flow Retention icon.
4. If you configured tenants, in the Tenant list, select the tenant that you want the
retention bucket to apply to.
NOTE: Tomanage retention policies for shared data in amulti-tenantconfiguration, choose N/A in the Tenant list.
Copyright © 2018, Juniper Networks, Inc.128
Juniper Secure Analytics Administration Guide

5. To configure a new retention bucket, follow these steps:
a. Double-click the first empty row in the table to open the Retention Properties
window.
b. Configure the retention bucket parameters.
c. Click Add Filter after you specify each set of filter criteria.
d. Click Save.
6. To edit an existing retention bucket, select the row from the table and click Edit.
Refer to Step 5for information about the retention policy properties.
7. To delete a retention bucket, select the row from the table and click Delete.
8. Click Save.
Incoming data that matches the retention policy properties is immediately stored in
the retention bucket.
Configure retention policies to define how long JSA is required to keep event and flow
data, and what to do when that data reaches a certain age.
Managing Retention Bucket Sequence
Retention buckets are sequenced in priority order from the top row to the bottom row
on theEventRetentionandFlowRetentionwindows.A record is stored in the first retention
bucket that matches the record parameters.
You cannot move the default retention bucket. It always resides at the bottom of the
list.
1. Click the Admin tab.
2. On the navigation menu, click Data Sources.
3. Click the Event Retention or Flow Retention icon.
4. If you configured tenants, in the Tenant list, select the tenant for the retention buckets
that you want to reorder.
NOTE: Tomanage retention policies for shared data in amulti-tenantconfiguration, choose N/A in the Tenant list.
129Copyright © 2018, Juniper Networks, Inc.
Chapter 7: Set Up JSA

5. Select the row that corresponds to the retention bucket that you want to move, and
click Up or Down to move it to the correct location.
6. Click Save.
You can change the order of the retention buckets to ensure that data is being matched
against the retention buckets in the order that matches your requirements.
Enabling and Disabling a Retention Bucket
When you disable a bucket, any new events or flows that match the requirements for
the disabled bucket are stored in the next bucket that matches the event or flow
properties.
1. Click the Admin tab.
2. On the navigation menu, click Data Sources.
3. Click the Event Retention or Flow Retention icon.
4. If you configured tenants, in the Tenant list, select the tenant for the retention bucket
that you want to change.
NOTE: Tomanage retention policies for shared data in amulti-tenantconfiguration, choose N/A in the Tenant list.
5. Select the retention bucket you want to disable, and then click Enable/Disable.
When you configure and save a retention bucket, it is enabled by default. You can disable
a bucket to tune your event or flow retention.
Deleting a Retention Bucket
When you delete a retention bucket, the data contained in the retention bucket is not
removed from the system, only the criteria defining the bucket is deleted. All data is
maintained in storage.
1. Click the Admin tab.
2. On the navigation menu, click Data Sources.
3. Click the Event Retention icon or the Flow Retention icon.
4. If you configured tenants, in the Tenant list, select the tenant for the retention bucket
that you want to delete.
Copyright © 2018, Juniper Networks, Inc.130
Juniper Secure Analytics Administration Guide

NOTE: Tomanage retention policies for shared data in amulti-tenantconfiguration, choose N/A in the Tenant list.
5. Select the retention bucket you want to delete, and then click Delete.
Whenyoudeletea retentionbucket, the events or flowscontained in the retentionbucket
are not removed from the system, only the criteria defining the bucket is deleted. All
events or flows are maintained in storage.
RelatedDocumentation
Configuring System Notifications on page 131•
• CustomOffense Close Reasons on page 136
• Configuring a Custom Asset Property on page 138
Configuring SystemNotifications
The following table describes the Global System Notifications window parameters
Table 24: Global SystemNotificationsWindowParameters
DescriptionParameter
Type the threshold system load average over the last minute.System load over 1 minute
Type the threshold system load average over the last 5 minutes.System load over 5 minutes
Type the threshold system load average over the last 15 minutes.System load over 15 minutes
Type the threshold percentage of used swap space.Percentage of swap used
Type the threshold number of packets received per second.Received packets per second
Type the threshold number of packets transmitted per second.Transmitted packets per second
Type the threshold number of bytes received per second.Received bytes per second
Type the threshold number of bytes transmitted per second.Transmitted bytes per second
Type the threshold number of corrupted packets received per second.Receive errors
Type the threshold number of corrupted packets transmitted per second.Transmit errors
Type the threshold number of collisions that occur per secondwhile transmittingpackets.
Packet collisions
131Copyright © 2018, Juniper Networks, Inc.
Chapter 7: Set Up JSA

Table 24: Global SystemNotificationsWindowParameters (continued)
DescriptionParameter
Type the threshold number of received packets that are dropped per second dueto a lack of space in the buffers.
Dropped receive packets
Type the threshold number of transmitted packets that are dropped per seconddue to a lack of space in the buffers.
Dropped transmit packets
Type the threshold number of carrier errors that occur per second whiletransmitting packets.
Transmit carrier errors
Type the threshold number of frame alignment errors that occur per second onreceived packets.
Receive frame errors
Type the threshold number of First In First Out (FIFO) overrun errors that occurper second on received packets.
Receive fifo overruns
Type the threshold number of First In First Out (FIFO) overrun errors that occurper second on transmitted packets.
Transmit fifo overruns
1. Click the Admin tab.
2. On the navigation menu, click SystemConfiguration.
3. Click the Global SystemNotifications icon.
4. Enter values for each parameter that you want to configure.
5. For each parameter, select Enabled and Respond if value is and then select one of the
following options:
An alert occurs if the parameter value exceeds the configuredvalue.
Greater Than
An alert occurs if the parameter value is less than theconfigured value.
Less Than
6. Type a description of the preferred resolution to the alert.
7. Click Save.
8. On the tabmenu, click Deploy Changes.
• Configuring Custom Email Notifications on page 133
Copyright © 2018, Juniper Networks, Inc.132
Juniper Secure Analytics Administration Guide

You can configure system performance alerts for thresholds. This section provides
information about configuring your system thresholds.
RelatedDocumentation
CustomOffense Close Reasons on page 136•
• Configuring a Custom Asset Property on page 138
• Index Management on page 139
Configuring Custom Email Notifications
When you configure rules in JSA, specify that each time the rule generates a response,
an email notification is sent to recipients. The email notification provides useful
information, such as event or flow properties.
You can customize the content that is included in the email notification for rule response
by editing the alert-config.xml file.
NOTE: References to flows do not apply to LogManager.
Youmust create a temporary directory where you can safely edit your copy of the files,
without the risk of overwriting thedefault files. After youedit and save thealert-config.xml
file, youmust run a script that validates your changes. The validation script automatically
applies your changes to a staging area, fromwhere you can deploy by using the JSA
deployment editor.
1. Using SSH, log in to the JSA console as the root user.
2. Create a new temporary directory to use to safely edit copies of the default files.
3. To copy the files that are stored in the custom_alerts directory to the temporary
directory, type the following command:
cp /store/configservices/staging/globalconfig/templates/ custom_alerts/*.* <directory_name>
The<directory_name>option is the nameof the temporary directory that you created.
4. Confirm that the files were copied successfully:
a. To list the files in the directory, type the following command:
ls -lah
b. Verify that the following file is listed:
alert-config.xml
5. Open the alert-config.xml file for editing.
133Copyright © 2018, Juniper Networks, Inc.
Chapter 7: Set Up JSA

6. To create multiple template elements, copy the <template></template> element,
including tags and the contents, and then paste it below the existing
<template></template> element.
NOTE: Set the Active property to True for each event and flow template
type that you want to appear as an option in JSA.
7. Edit the contents of the <template></template> element:
a. Specify the template type by using the following XML property:
<templatetype></templatetype>
The possible values are event or flow. This value is mandatory.
b. Specify the template name by using the following XML element:
<templatename></templatename>
c. Set the active element to true:
<active>true</active>
d. Edit the subject element, if required.
e. Addor removeparameters fromthebodyor subject element. For validparameters,
see the “Configuring Custom Email Notifications” on page 133 table.
f. Repeat these steps for each template that you add.
8. Save and close the file.
9. To validate your changes, type the following command:
/opt/qradar/bin/runCustAlertValidator.sh <directory_name>
The <directory_name> option is the nameof the temporary directory that you created.
If the script validates the changes successfully, the following message is displayed:
File alert-config.xml was deployed successfully to staging!
10. Log in to JSA.
11. Click the Admin tab.
12. Select Advanced > Deploy Full Configuration.
Copyright © 2018, Juniper Networks, Inc.134
Juniper Secure Analytics Administration Guide

When you deploy the full configuration, JSA restarts all services. Data collection for
events and flows stops until the deployment completes.
Table 25: Accepted Notification Parameters
Flow ParametersEvent ParametersCommon Parameters
TypeEventCollectorIDAppName
CompoundAppIDDeviceIdRuleName
FlowSourceIDsDeviceNameRuleDescription
SourceASNListDeviceTimeEventName
DestinationASNListDstPostNATPortEventDescription
InputIFIndexListSrcPostNATPortEventProcessorId
OutputIFIndexListDstMACAddressQid
AppIdDstPostNATIPAddressCategory
HostDstPreNATIPAddressRemoteDestinationIP
PortSrcMACAddressPayload
SourceBytesSrcPostNATIPAddressCredibility
SourcePacketsSrcPreNATIPAddressRelevance
DirectionSrcPreNATPorSource
SourceTOSDstPreNATPortSourcePort
SourceDSCPSourceIP
SourcePrecedenceDestination
DestinationTOSDestinationPort
DestinationDSCPDestinationIP
SourceASNDestinationUserName
DestinationASNProtocol
InputIFIndexStartTime
OutputIFIndexDuration
135Copyright © 2018, Juniper Networks, Inc.
Chapter 7: Set Up JSA

Table 25: Accepted Notification Parameters (continued)
Flow ParametersEvent ParametersCommon Parameters
FirstPacketTimeStopTime
LastPacketTimeEventCount
TotalSourceBytesSourceV6
TotalDestinationBytesDestinationV6
TotalSourcePacketsUserName
TotalDestinationPacketsDestinationNetwork
SourceQOSSourceNetwork
DestinationQOSSeverity
SourcePayloadCustomPropertiesList
CustomOffense Close Reasons
You canmanage the options listed in the Reason for Closing list box on theOffenses tab.
Whenauser closesanoffenseon theOffenses tab, theCloseOffensewindow isdisplayed.
Theuser is prompted to select a reason from theReason forClosing list box. Threedefault
options are listed:
• False-positive, tuned
• Non-issue
• Policy violation
Administrators can add, edit, and delete custom offense close reasons from the Admin
tab.
• Adding a CustomOffense Close Reason on page 137
• Editing CustomOffense Close Reason on page 137
• Deleting a CustomOffense Close Reason on page 138
RelatedDocumentation
Configuring a Custom Asset Property on page 138•
• Index Management on page 139
• Configuring System Notifications on page 131
Copyright © 2018, Juniper Networks, Inc.136
Juniper Secure Analytics Administration Guide

Adding a CustomOffense Close Reason
The CustomOffense Close Reasons window provides the following parameters.
Table 26: CustomClose ReasonsWindowParameters
DescriptionParameter
The reason that is displayed in theReasonforClosing list boxon theCloseOffensewindowof theOffenses tab.
Reason
The user that created this custom offense close reason.Created by
The date and time of when the user created this custom offense close reason.Date Created
1. Click the Admin tab.
2. On the navigation menu, click SystemConfiguration.
3. Click the CustomOffense Close Reasons icon.
4. Click Add.
5. Type a unique reason for closing offenses. Reasons must be between 5 and 60
characters in length.
6. ClickOK.
Your new custom offense close reason is now listed in the Custom Close Reasons
window. The Reason for Closing list box on the Close Offensewindow of theOffenses
tab also displays the custom reason you added.
When you add a custom offense close reason, the new reason is listed on the Custom
CloseReasonswindowand in theReasonforClosing list boxon theCloseOffensewindow
of theOffenses tab.
Editing CustomOffense Close Reason
1. Click the Admin tab.
2. On the navigation menu, click SystemConfiguration.
3. Click the CustomOffense Close Reasons icon.
4. Select the reason you want to edit.
5. Click Edit.
137Copyright © 2018, Juniper Networks, Inc.
Chapter 7: Set Up JSA

6. Type a new unique reason for closing offenses. Reasons must be between 5 and 60
characters in length.
7. ClickOK.
Editing a custom offense close reason updates the reason in the Custom Close Reasons
windowand theReason for Closing list box on the CloseOffensewindowof theOffenses
tab.
Deleting a CustomOffense Close Reason
1. Click the Admin tab.
2. On the navigation menu, click SystemConfiguration.
3. Click the CustomOffense Close Reasons icon.
4. Select the reason you want to delete.
5. Click Delete.
6. ClickOK.
Deleting a custom offense close reason removes the reason from the CustomClose
Reasonswindow and the Reason for Closing list box on the Close Offensewindow of the
Offenses tab.
Configuring a CustomAsset Property
Define asset properties to facilitate asset queries. Customproperties providemore query
options.
1. Click the Admin tab.
2. Click CustomAsset Properties.
3. In the Name field, enter a descriptor for the custom asset property.
4. In the Type drop-downmenu, select Numeric or Text to define the information type
for the custom asset property.
5. ClickOK.
6. Click the Assets tab.
Copyright © 2018, Juniper Networks, Inc.138
Juniper Secure Analytics Administration Guide

7. Click Edit Asset >CustomAsset Properties.
8. Enter the required information in the value field.
9. ClickOK.
RelatedDocumentation
Index Management on page 139•
• Configuring System Notifications on page 131
• CustomOffense Close Reasons on page 136
IndexManagement
Use Index Management to control database indexing on event and flow properties. To
improve the speed of searches in JSA, narrow the overall data by adding an indexed field
in your search query.
An index is a set of items that specify information about data in a file and its location in
the file system. Data indexes are built in real-time as data is streamed or are built upon
request after data is collected. Searching is more efficient because systems that use
indexes don't have to read through every piece of data to locate matches. The index
contains references to unique terms in the data and their locations. Because indexes use
disk space, storage spacemight be used to decrease search time.
Use indexing event and flow properties first to optimize your searches. You can enable
indexing on any property that is listed in the Index Management window and you can
enable indexing onmore than one property. When a search starts in JSA, the search
engine first filters thedata setby indexedproperties. The indexed filter eliminatesportions
of the data set and reduces the overall data volume and number of event or flow logs
that must be searched. Without any filters, JSA takes more time to return the results for
large data sets.
For example, youmight want to find all the logs in the past six months that match the
text: The operation is not allowed. By default, JSA stores full text indexing for the past 30
days. Therefore, to complete a search from the last 6months, the systemmust reread
every payload value from every event or flow in that time frame to find matches. Your
results display faster when you search with an indexed value filter such as a Log Source
Type, Event Name, or Source IP.
The Index Management feature also provides statistics, such as:
• Thepercentageof saved searches running in your deployment that include the indexed
property
• The volume of data that is written to the disk by the index during the selected time
frame
139Copyright © 2018, Juniper Networks, Inc.
Chapter 7: Set Up JSA

To enable payload indexing, youmust enable indexing on the Quick Filter property.
• Enabling Indexes on page 140
• Enabling Payload Indexing to Optimize Search Times on page 141
• Configuring the Retention Period for Payload Indexes on page 142
RelatedDocumentation
Configuring System Notifications on page 131•
• CustomOffense Close Reasons on page 136
• Configuring a Custom Asset Property on page 138
Enabling Indexes
Modifying database indexing might decrease system performance. Ensure that you
monitor the statistics after you enable indexing onmultiple properties.
1. Click the Admin tab.
2. On the navigation menu, click SystemConfiguration.
3. Click the IndexManagement icon.
4. Select one or more properties from the Index Management list.
5. Choose one of the following options:
ReasonActionTime frameSituation
This search property is usedoften. Enabling an index canimprove performance.
Click Enable Index.24 hours, 7 days, or 30 daysThe index is disabled and%of Searches Using Property isabove 30% and%ofSearchesMissing Index isabove 30%.
Theenabled index is not usedin the searches. Disable theindexed property to preservedisk space.
Click Disable Index.30 daysThe index is enabled and%of Searches Using Property iszero.
6. Click Save.
7. ClickOK.
In lists that include event and flow properties, indexed property names are appended
with the following text: [Indexed]. Examples of such lists include the search parameters
Copyright © 2018, Juniper Networks, Inc.140
Juniper Secure Analytics Administration Guide

on the Log Activity and Network Activity tab search criteria pages and the Add Filter
window.
The Index Management window lists all event and flow properties that can be indexed
andprovides statistics for theproperties. Toolbaroptionsallowyou toenableanddisable
indexing on selected event and flow properties.
Enabling Payload Indexing to Optimize Search Times
1. From the navigation pane on the Admin tab in the JSA product, click System
Configuration.
2. Click IndexManagement.
3. In theQuick Search field, typeQuick Filter.
TheQuick Filter property is displayed.
4. Select theQuick Filter property that you want to index.
In the results table, use the value in theDatabase column to identify the flowsor events
Quick Filter property.
5. On the toolbar, click Enable Index.
A green dot indicates that the payload index is enabled.
If a list includes event or flow properties that are indexed, the property names are
appended with the following text: [Indexed].
6. Click Save.
To manage payload indexes, see “Configuring the Retention Period for Payload Indexes”
on page 142.
141Copyright © 2018, Juniper Networks, Inc.
Chapter 7: Set Up JSA

To optimize event and flow search times, enable payload indexing on theQuick Filter
property.
NOTE: Use theQuick Filter feature in the LogActivity andNetworkActivity tab
to search event and flow payloads by using a text string.
Payload indexing increasesdiskstorage requirementsandmightaffectsystemperformance.Enablepayload indexing if yourdeploymentmeets the followingconditions:
• The event and flow processors are at less than 70%disk usage.
• The event and flow processors are less than 70%of themaximum eventsper second (EPS) or flows per interface (FPI) rating.
Configuring the Retention Period for Payload Indexes
By default, JSA sets 30 days for the data retention period of the payload index. You can
search for specific values in quick filter indexes beyond 30 days by changing the default
retention in JSA.
Your virtual and physical appliances require a minimum of 24 GB of RAM to enable full
payload indexing. However, 48 GB of RAM is suggested.
Theminimum and suggested RAM values applies to all JSA systems, such as 16xx, 17xx,
or 18xx appliances, that are processing events or flows.
The retentionvalues reflect the timespans that youare typically searching.Theminimum
retention period is 1 day and themaximum is 2 years.
1. Click the Admin tab.
2. On the navigation menu, click SystemConfiguration.
3. Click SystemSettings.
4. In theDatabaseSettings section, select a retention timeperiod from thePayload Index
Retention list.
5. Click Save.
6. Close the SystemSettingswindow.
7. On the Admin tabmenu, click Deploy Changes.
Copyright © 2018, Juniper Networks, Inc.142
Juniper Secure Analytics Administration Guide

If you retain payload indexes longer than the default value, extra disk space is used. After
youselectagreater value in thePayload IndexRetention field,monitor systemnotifications
to ensure that you do not fill disk space.
143Copyright © 2018, Juniper Networks, Inc.
Chapter 7: Set Up JSA

Copyright © 2018, Juniper Networks, Inc.144
Juniper Secure Analytics Administration Guide

CHAPTER 8
Juniper Networks X-Force Integration
• Juniper Networks X-Force Integration on page 145
• Internet Threat Information Center DashboardWidget on page 145
• Updating X-Force Data in a Proxy Server on page 146
• Stop X-Force Data from Downloading Locally on page 147
Juniper Networks X-Force Integration
Juniper NetworksX-Force®security experts use a series of international data centers to
collect tens of thousands of malware samples, analyze web pages and URLs, and run
analysis to categorize potentially malicious IP addresses and URLs. You can integrate
this data into JSA to help your organization stay ahead of emerging threats by identifying
and remediating undesirable activity in your environment before it threatens the stability
of your network.
For example, you can identify and prioritize these types of incidents:
• A series of attempted logins for a dynamic range of IP addresses
• An anonymous proxy connection to a Business Partner portal
• Aconnectionbetweenan internal endpoint andaknownbotnet commandandcontrol
• Communication between an endpoint and a knownmalware distribution site
Internet Threat Information Center DashboardWidget
The Internet Threat Information Centerwidget on the Threat and Security Monitoring
dashboard uses X-Force®data to provide up-to-date advisories on security issues, daily
threat assessments, security news, and threat repositories.
The dashboard widget uses an embedded RSS feed to display X-Force®data in the
dashboard widget. The JSA console must have access to the Internet to receive data
from the X-Force®update server (www.iss.net).
The dashboard uses four AlertCon threat level images to provide a visual indicator of the
current threat level.
145Copyright © 2018, Juniper Networks, Inc.

Table 27: AlertCon Threat Levels
DescriptionTypeLevel
Ordinary activity that compromises unprotected networks, minutes to hoursafter JSA connects to the Internet.
Normal threats1
Vulnerabilitiesoronline threats tocomputernetworks that requires vulnerabilityassessment and corrective action.
Increased vigilance2
Specific weakness and vulnerabilities that are the target of Internet attacksand require immediate defensive action.
Focused attacks3
Critical security situations within a network that dictate an immediate andfocused defensive action. This condition might be imminent or ongoing.
Catastrophic threats4
For more information about the current threat level, click the LearnMore link to open the
Current Threat Activity page on the Juniper X-Force®Exchange website.
To view a summary of the current advisories, click the arrow icon next to the advisory.
To investigate the full advisory, click the advisory link.
RelatedDocumentation
Updating X-Force Data in a Proxy Server on page 146•
• Stop X-Force Data from Downloading Locally on page 147
• Juniper Networks X-Force Integration on page 145
Updating X-Force Data in a Proxy Server
JSA uses a reverse proxy lookup through an Apache server to collect data directly from
Juniper X-Force®Threat Intelligence servers on the Internet.
All JSA appliances in a deployment contact the Apache server to send cached requests.
After the data is received by the JSA Console, the result is cached and replayed for all
other managed hosts that make a request for new IP reputation data.
If a proxy is configured in your network, youmust update the configuration to receive the
X-Force®data.
NOTE: NTLM authentication is not supported.
1. Use SSH to log in to the JSA console.
2. Open the /etc/httpd/conf.d/ssl.conf file in a text editor.
3. Add the following lines before </VirtualHost>:
ProxyRemotehttps://license.xforce-security.com/http://PROXY_IP:PROXY_PORT
Copyright © 2018, Juniper Networks, Inc.146
Juniper Secure Analytics Administration Guide

ProxyRemotehttps://update.xforce-security.com/http://PROXY_IP:PROXY_PORT
4. Update the IP address and port of the corporate proxy server to allow an anonymous
connection to the X-Force®security servers.
5. Save the changes to the ssl.conf file.
6. Restart the Apache server by typing the following command:
apachectl restart
Restarting the Apache server on the JSA console logs out all users and themanaged
hosts might produce error messages. Restart the Apache server during scheduled
maintenance windows.
RelatedDocumentation
Stop X-Force Data from Downloading Locally on page 147•
• Internet Threat Information Center DashboardWidget on page 145
• Juniper Networks X-Force Integration on page 145
Stop X-Force Data fromDownloading Locally
If youwant to stop JSA fromdownloading theX-Force®data to your local system, disable
the Enable X-Force Threat Intelligence Feed system setting.
Before you disable the X-Force®feed, ensure that the X-Force
®rules are disabled, and
that you are not using X-Force®functions in saved searches.
The X-Force®content is still visible in the product interface after the X-Force
®Threat
Intelligence feed isdisabled.Youcannotuse theX-Force®rulesoraddX-Force
®functions
to AQL searches when the feed is disabled.
NOTE: The InternetThreat InformationCenterwidgetontheThreatandSecurity
Monitoring dashboard uses an embedded RSS feed from X-Force®. To show
daily threat levels and advisories from X-Force®, the widget requires only
that JSA has an Internet connection. It does not require the X-Force® Threat
Intelligence feed to be enabled.
RelatedDocumentation
• Updating X-Force Data in a Proxy Server on page 146
• Juniper Networks X-Force Integration on page 145
• Internet Threat Information Center DashboardWidget on page 145
147Copyright © 2018, Juniper Networks, Inc.
Chapter 8: Juniper Networks X-Force Integration

Copyright © 2018, Juniper Networks, Inc.148
Juniper Secure Analytics Administration Guide

CHAPTER 9
Reference Sets Management
• Reference Sets Management on page 149
• Adding a Reference Set on page 149
• Editing a Reference Set on page 151
• Deleting Reference Sets on page 152
• Viewing the Contents Of a Reference Set on page 152
• Adding an Element to a Reference Set on page 154
• Deleting Elements from a Reference Set on page 155
• Importing Elements Into a Reference Set on page 155
• Exporting Elements from a Reference Set on page 156
Reference Sets Management
Using the Reference Set Managementwindow, you can create andmanage reference
sets. You can also import elements into a reference set from an external file.
A reference set is a set of elements that are derived from events and flows that occur on
your network. Examples of elements that are derived from events are IP addresses or
user names.
After you create a reference set, you can create rules to detect log activity or network
activity that is associated with the reference set. For example, you can create a rule to
detect when an unauthorized user attempts to access your network resources. You can
also configure a rule to add an element to a reference set when log activity or network
activity matches the rule conditions. For example, you can create a rule to detect when
an employee accesses a prohibited website and add that employee's IP address to a
reference set.
For more information on configuring rules, see the Juniper Secure Analytics Users Guide.
Adding a Reference Set
From the Admin tab, you can add a reference set that you can include in rule tests.
After you create a reference set, the reference set is listed on the Reference Set
Managementwindow. In the Rule wizard, this reference set is listed as an option on the
149Copyright © 2018, Juniper Networks, Inc.

Rule Response page. After you configure one or more rules to send elements to this
reference set, the Number of Elements, Associated Rules, and Capacity parameters are
automatically updated.
1. On the Reference Set Managementwindow, click Add.
2. Configure the parameters:
Table 28: Reference Set Parameters
DescriptionParameter
A unique name for this reference set.Name
There are 5 reference set element types you can choose:
Alphanumeric—A collection of alphanumeric values
Numeric—A collection of numeric values
IP—A collection of IP addresses
Port—A collection of port numbers
Alphanumeric (Ignore Case)—A collection of alphanumeric values but tests ignore
case
You cannot edit the Type parameter after you create a reference set.
Type
Use this parameter to indicate whether the time_to_live interval is based on whenthe data was first seen or last seen.
Since first seen—Since the timewhen element was first inserted into the reference
set
Since last seen—Since the time when the element was last inserted into the
reference set
A Reference Data Expiry event that contains the reference set name and elementvalue is triggered when a reference set element expires.
By default all elements live forever. If you do not clear the Lives Forever check box,the element never expires.
Time to Live of elements
3. Click Create.
Element Expiry Events
You can use the events that are created when elements expire in a reference set to track
such things as expired user accounts on your network.
By default, all reference set elements live forever, which means that they exist in the
referencesetuntil theyare removed.However, youcanset the time-to-liveof theelement
Copyright © 2018, Juniper Networks, Inc.150
Juniper Secure Analytics Administration Guide

so that an event that contains the reference set nameandelement value is createdwhen
the element expires.
You can use these events to detect, for example, when network accounts are not being
used:
1. Create a reference set to track expired users. Set the time-to-live for theelements to reflect a reasonable period of account inactivity.
2. Create a custom event rule to add login data (such as username) as elementsto the reference set.
3. If no data is added for a particular user within the time-to-live period, thereference set element expires and a Reference Data Expiry event is triggered.
4. You can then use the Log Activity tab to track the events.
RelatedDocumentation
Editing a Reference Set on page 151•
• Deleting Reference Sets on page 152
• Viewing the Contents Of a Reference Set on page 152
Editing a Reference Set
Use the Reference Set Managementwindow to edit a reference set.
1. In the Reference Set Managementwindow, select a reference set.
2. Click Edit.
3. Edit the parameters.
Table 29: Reference Set Parameters
DescriptionParameter
A unique name for this reference set.
Themaximum length is 255 characters
Name
You cannot edit the Type parameter after you create a reference set.Type
The amount of time that you want to maintain each element in the reference set.
If you specify an amount of time, youmust also indicate when you want to start tracking timefor an element.
Lives Forever is the default setting.
Time to Live of Elements
4. Click Submit.
151Copyright © 2018, Juniper Networks, Inc.
Chapter 9: Reference Sets Management

RelatedDocumentation
Deleting Reference Sets on page 152•
• Viewing the Contents Of a Reference Set on page 152
• Adding an Element to a Reference Set on page 154
Deleting Reference Sets
You can delete a reference set from the Reference Set Managementwindow.
When you delete reference sets, a confirmation window indicates whether the reference
sets that you want to delete have rules that are associated with them. After you delete
a reference set, the Add to Reference Set configuration is cleared from the associated
rules.
TIP: Before you delete a reference set, you can view associated rules in theReference tab.
1. Choose one of the following options:
• On the Reference Set Managementwindow, select a reference set, and then click
Delete.
• On theReferenceSetManagementwindow, use theQuick Search text box to search
for the reference sets that you want to delete, and then click Delete Listed.
RelatedDocumentation
Viewing the Contents Of a Reference Set on page 152•
• Adding an Element to a Reference Set on page 154
• Deleting Elements from a Reference Set on page 155
Viewing the Contents Of a Reference Set
The Content tab provides a list of the elements that are included in this reference set.
1. On the Reference Set Managementwindow, select a reference set.
2. Click View Contents.
3. To view contents, click the Content tab.
TIP: Use theQuickSearch field to filter for specific elements. All elements
thatmatch the keyword are listed in the Content list. Then, you can select
the action from the toolbar.
Copyright © 2018, Juniper Networks, Inc.152
Juniper Secure Analytics Administration Guide

You cannot search for data in the Time To Live column.
Table 30: Content Tab Parameters
DescriptionParameter
The value of the element.
For example, if the reference contains a list of IP addresses, the value is the IP address.
Value
The rulename is placed in the reference set as a response to a rule.
The User is imported from an external file or manually added to the reference set.
Origin
The time that is remaining until this element is removed from the reference set.Time to Live
The date and time that this element was last detected on your network.Date Last Seen
4. Click the References tab to view the rules that add data to the reference set.
TIP: Use theQuickSearch field to filter for specific elements. All elements
thatmatch the keyword are listed in the Content list. Then, you can select
the action from the toolbar.
Table 31: Content Tab Parameters
DescriptionParameter
The name of this rule.Rule Name
The name of the group this rule belongs to.Group
The category of the rule. Options include CustomRule.Category
The rule type.Type
Indicates whether the rule is enabled or disabled.Enabled
The responses that are configured for this rule.Response
System indicates a default rule.
Modified indicates that a default rule was customized.
User indicates a user-created rule.
Origin
5. To view or edit an associated rule, double-click the rule in the References list.
153Copyright © 2018, Juniper Networks, Inc.
Chapter 9: Reference Sets Management

In the Rule wizard, you can edit the rule configuration settings.
RelatedDocumentation
Adding an Element to a Reference Set on page 154•
• Deleting Elements from a Reference Set on page 155
• Importing Elements Into a Reference Set on page 155
Adding an Element to a Reference Set
You add an element to a reference set by using the Reference Set Managementwindow.
1. On the Reference Set Managementwindow, select a reference set.
2. Click View Contents.
3. Click the Content tab.
4. On the toolbar, click Add.
5. Configure the following parameters:
DescriptionParameter
If you want to typemultiple values, include a separator character between each value,and then specify the separator character in the Separator Character field.
Value(s)
Type the separator character that you used in the Value(s) field.Separator Character
Choose the domain for the reference set data.Domain
6. Click Add.
RelatedDocumentation
Deleting Elements from a Reference Set on page 155•
• Importing Elements Into a Reference Set on page 155
• Exporting Elements from a Reference Set on page 156
Copyright © 2018, Juniper Networks, Inc.154
Juniper Secure Analytics Administration Guide

Deleting Elements from a Reference Set
You can delete elements from a reference set.
1. On the Reference Set Managementwindow, select a reference set.
2. Click View Contents.
3. Click the Content tab.
4. Choose one of the following options:
• Select an element, and then click Delete.
• Use theQuick Search text box to search for elements that you want to delete, and
then click Delete Listed.
5. Click Delete.
RelatedDocumentation
Importing Elements Into a Reference Set on page 155•
• Exporting Elements from a Reference Set on page 156
• Adding an Element to a Reference Set on page 154
Importing Elements Into a Reference Set
You can import elements from an external CSV or text file.
Ensure that the CSV or text file that you want to import is stored on your local desktop.
1. On the Reference Set Managementwindow, select a reference set.
2. Click View Contents.
3. Click the Content tab.
4. On the toolbar, click Import.
5. Click Browse.
6. Select the CSV or text file that you want to import.
7. Select the Domain that you want the reference set data to be added to.
8. Click Import.
155Copyright © 2018, Juniper Networks, Inc.
Chapter 9: Reference Sets Management

RelatedDocumentation
Exporting Elements from a Reference Set on page 156•
• Adding an Element to a Reference Set on page 154
• Deleting Elements from a Reference Set on page 155
Exporting Elements from a Reference Set
You can export reference set elements to an external CSV or text file.
1. On the Reference Set Managementwindow, select a reference set.
2. Click View Contents.
3. Click the Content tab.
4. On the toolbar, click Export.
5. Choose one of the following options:
a. If youwant to open the list for immediate viewing, select theOpenwith option and
select an application from the list box.
b. If you want to save the list, select the Save File option.
6. ClickOK.
RelatedDocumentation
• Adding an Element to a Reference Set on page 154
• Deleting Elements from a Reference Set on page 155
• Importing Elements Into a Reference Set on page 155
Copyright © 2018, Juniper Networks, Inc.156
Juniper Secure Analytics Administration Guide

CHAPTER 10
Manage Reference Data Collections
• Manage Reference Data Collections on page 157
• CreatingaReferenceDataCollectionbyUsing theCommandLine Interfaceonpage 157
• Creating a Reference Data Collection by Using the API Documentation
Interface on page 158
Manage Reference Data Collections
Create complex reference data collections by using the command line interface or the
JSA REST API documentation interface.
Use the ReferenceDataUtil.sh and ReferenceSetUtil.sh utilities to create reference data
collections from the command line. You can also create reference data collections by
using the/reference_data endpoint in the JSA Rest API. You can create the following
reference data collection types:
• Referencemap
• Referencemap of sets
• Reference sets
• Referencemap of maps
• Reference table
Creating a Reference Data Collection by Using the Command Line Interface
Use the ReferenceDataUtil.sh utility to create a reference data collection.
1. Using SSH, log in to JSA as the root user.
2. Go to the /opt/qradar/bin directory.
3. To create the reference data collection, type the following command:
157Copyright © 2018, Juniper Networks, Inc.

./ReferenceDataUtil.sh create name [MAP | MAPOFSETS | MAPOFMAPS | REFTABLE]
[ALN | NUM | IP | PORT | ALNIC | DATE] [-timeoutType=[FIRST_SEEN | LAST_SEEN]]
[-timeToLive=]
4. To populate the map with data from an external file, type the following command:
./ReferenceDataUtil.sh load name filename [-encoding=...] [-sdf=" ... "]
Create an Alphanumeric Map ./ReferenceDataUtil.sh create testALN MAP ALN
Create a Map of Sets of PORT values that will age out 3 hours after they were last seen ./ReferenceDataUtil.sh create testPORT MAPOFSETS PORT -timeoutType=LAST_SEEN
-timeToLive='3 hours'
Create a Map of Maps of Numeric values that will age out 3 hours 15 minutes after they were first seen ./ReferenceDataUtil.sh create testNUM MAPOFMAPS NUM -timeoutType=FIRST_SEEN
-timeToLive='3 hours 15 minutes'
Create a ReferenceTable with a default of Alphanumeric values ./ReferenceDataUtil.sh create testTable REFTABLE ALN -keyType=ipKey:IP,portKey:PORT,numKey:NUM,dateKey:DATE
Log in to theuser interface tocreate rules thatadddata toyour referencedatacollections.
You canalso create rule tests that detect activity fromelements that are in your reference
data collection. For more information about creating rules and rule tests, see the Juniper
Secure Analytics Users Guide for your product.
RelatedDocumentation
Creating a Reference Data Collection by Using the API Documentation Interface on
page 158
•
• Manage Reference Data Collections on page 157
Creating a Reference Data Collection by Using the API Documentation Interface
Use the application program interface (API) to create a reference data collection.
1. Access https://<Console IP>/api_doc and log in as the administrator.
2. Select the iteration of the JSA API with the highest number.
3. Select the /reference_data directory.
4. Create a new referencemap of sets.
Copyright © 2018, Juniper Networks, Inc.158
Juniper Secure Analytics Administration Guide

a. Select /map_of_sets from /reference_data.
b. Select POST.
c. Enter the relevant information in the Value fields:
Table 32: Parameters - ReferenceMapOf Sets
SampleMIME TypeData TypeValueTypeParameter
String <one of:ALN, NUM, IP,PORT, ALNIC,DATE>
text/plainString(required)queryelement_type
Stringtext/plainString(required)queryname
field_one(field_two,field_three),field_four
text/plainString(optional)queryfields
Stringtext/plainString(optional)querykey_label
Stringtext/plainString(optional)querytime_to_live
String <one of:UNKNOWN,FIRST_SEEN,LAST_SEEN>
text/plainString(optional)querytimeout_type
Stringtext/plainString(optional)queryvalue_label
d. Select Try It Out! to finish creating the referencemap of sets and view results.
5. Create a new referencemap.
a. Select /maps from /reference_data.
b. Select POST.
c. Enter the relevant information in the Value fields:
Table 33: Parameters - ReferenceMap
SampleMIME TypeData TypeValueTypeParameter
String <one of:ALN, NUM, IP,PORT, ALNIC,DATE>
text/plainString(required)queryelement_type
Stringtext/plainString(required)queryname
159Copyright © 2018, Juniper Networks, Inc.
Chapter 10: Manage Reference Data Collections

Table 33: Parameters - ReferenceMap (continued)
SampleMIME TypeData TypeValueTypeParameter
field_one(field_two,field_three),field_four
text/plainString(optional)queryfields
Stringtext/plainString(optional)querykey_label
Stringtext/plainString(optional)querytime_to_live
String <one of:UNKNOWN,FIRST_SEEN,LAST_SEEN>
text/plainString(optional)querytimeout_type
Stringtext/plainString(optional)queryvalue_label
d. Select Try It Out! to finish creating the new referencemap and view results.
6. Create a new reference set.
a. Select /sets from /reference_data.
b. Select POST.
c. Enter the relevant information in the Value fields:
Table 34: Parameters - Reference Set
SampleMIME TypeData TypeValueTypeParameter
String <one of:ALN, NUM, IP,PORT, ALNIC,DATE>
text/plainString(required)queryelement_type
Stringtext/plainString(required)queryname
field_one(field_two,field_three),field_four
text/plainString(optional)queryfields
Stringtext/plainString(optional)querytime_to_live
String <one of:UNKNOWN,FIRST_SEEN,LAST_SEEN>
text/plainString(optional)querytimeout_type
d. Select Try It Out! to finish creating the new reference set and view results.
7. Create a new reference table or map of maps.
Copyright © 2018, Juniper Networks, Inc.160
Juniper Secure Analytics Administration Guide

a. Select /tables from /reference_data.
b. Select POST.
c. Enter the relevant information in the Value fields:
Table 35: Parameters - Reference Table
SampleMIME TypeData TypeValueTypeParameter
String <one of: ALN,NUM, IP, PORT,ALNIC, DATE>
text/plainString(required)queryelement_type
Stringtext/plainString(required)queryname
field_one (field_two,field_three),field_four
text/plainString(optional)queryfields
[ { "element_type":"String <one of: ALN,NUM, IP, PORT,ALNIC, DATE>","key_name": "String"}]
application/jsonArray(optional)querykey_name_types
Stringtext/plainString(optional)queryouter_key_label
Stringtext/plainString(optional)querytime_to_live
String <one of:UNKNOWN,FIRST_SEEN,LAST_SEEN>
text/plainString(optional)querytimeout_type
d. Select Try It Out! to finish creating the new reference table/map ofmaps and view
results.
RelatedDocumentation
• Manage Reference Data Collections on page 157
• CreatingaReferenceDataCollectionbyUsing theCommandLine Interfaceonpage 157
161Copyright © 2018, Juniper Networks, Inc.
Chapter 10: Manage Reference Data Collections

Copyright © 2018, Juniper Networks, Inc.162
Juniper Secure Analytics Administration Guide

CHAPTER 11
Managing Authorized Services
• Managing Authorized Services on page 163
• Viewing Authorized Services on page 164
• Adding an Authorized Service on page 164
• Revoking Authorized Services on page 165
Managing Authorized Services
You can configure authorized services on the Admin tab to authenticate a customer
support service or an API call for your JSA deployment.
Authenticating a Juniper customer support service allows the service to connect to your
JSA user interface and either dismiss or update notes to an offense using a web service.
You can add or revoke an authorized service at any time.
The JSARESTfulAPI usesauthorized services toauthenticateAPI calls to the JSAconsole.
For more information about the RESTful API, see the Juniper Secure Analytics API Guide.
TheManage Authorized Serviceswindow provides the following information:
Table 36: Parameters for Authorized Services
DescriptionParameter
The name of the authorized service.Service Name
The name of the user or administrator that authorized the addition of the service.Authorized By
The token that is associated with this authorized service.Authentication Token
The user role that is associated with this authorized service.User Role
The security profile that is associated with this authorized service.Security Profile
The date that this authorized service was created.Created
Thedate and time that the authorized service expires. By default, the authorized serviceis valid for 30 days.
Expires
163Copyright © 2018, Juniper Networks, Inc.

Viewing Authorized Services
The Authorized Serviceswindow displays a list of authorized services, fromwhich you
can copy the token for the service.
1. Click the Admin tab.
2. On the navigation menu, click SystemConfiguration.
3. Click Authorized Services.
4. From theManage Authorized Serviceswindow, select the appropriate authorized
service.
The token is displayed in the Selected Token field in the top bar. You can copy the
token into your vendor software to authenticate with JSA.
RelatedDocumentation
Adding an Authorized Service on page 164•
• Revoking Authorized Services on page 165
Adding an Authorized Service
Use the Add Authorized Servicewindow to add a new authorized service.
1. Click the Admin tab.
2. On the navigation menu, click SystemConfiguration.
3. Click Authorized Services.
4. Click Add Authorized Service.
5. In the Service Name field, type a name for this authorized service. The name can be
up to 255 characters in length.
6. From the User Role list, select the user role that you want to assign to this authorized
service. The user roles that are assigned to an authorized service determine the
functions that this service can access on the JSA user interface.
7. From the Security Profile list, select the security profile that you want to assign to this
authorized service. The security profile determines the networks and log sources that
this service can access on the JSA user interface.
Copyright © 2018, Juniper Networks, Inc.164
Juniper Secure Analytics Administration Guide

8. In the Expiry Date list, type or select a date that you want this service to expire. If an
expiry date is not required, select No Expiry
9. Click Create Service.
The confirmationmessage contains a token field that youmust copy into your vendor
software to authenticate with JSA.
RelatedDocumentation
Revoking Authorized Services on page 165•
• Viewing Authorized Services on page 164
Revoking Authorized Services
Use the Add Authorized Servicewindow to revoke an authorized service.
1. Click the Admin tab.
2. On the navigation menu, click SystemConfiguration.
3. Click Authorized Services.
4. From theManage Authorized Serviceswindow, select the service that you want to
revoke.
5. Click Revoke Authorization.
RelatedDocumentation
• Viewing Authorized Services on page 164
• Adding an Authorized Service on page 164
165Copyright © 2018, Juniper Networks, Inc.
Chapter 11: Managing Authorized Services

Copyright © 2018, Juniper Networks, Inc.166
Juniper Secure Analytics Administration Guide

CHAPTER 12
Manage Backup and Recovery
• Manage Backup and Recovery on page 167
• Backup Archive Management on page 168
• Backup Archive Creation on page 169
• Backup Archive Restoration on page 173
Manage Backup and Recovery
You can back up and recover JSA configuration information and data.
You can use the backup and recovery feature to back up your event and flow data;
however, youmust restore event and flow data manually. For more information, see
“Restoring Data” on page 178.
By default, JSA creates a backup archive of your configuration information daily at
midnight. The backup archive includes configuration information, data, or both from the
previous day.
You can use two types of backups: configuration backups and data backups.
Configuration backups include the following components:
• Assets
• Certificates
• Custom logos
• Custom rules
• Device Support Modules (DSMs)
• Event categories
• Flow sources
• Flow and event searches
• Groups
• Index management information
• License key information
167Copyright © 2018, Juniper Networks, Inc.

• Log sources
• Offenses
• Reference set elements
• Store and Forward schedules
• User and user roles information
• Vulnerability data (if JSA Vulnerability Manager is installed)
Data backups include the following information:
• Audit log information
• Event data
• Flow data
• Report data
• Indexes
Backup ArchiveManagement
View andmanage backup archives.
From the BackupManagement Archivewindow, you can view andmanage all successful
backup archives.
• Viewing Backup Archives on page 168
• Importing a Backup Archive on page 168
• Deleting a Backup Archive on page 169
RelatedDocumentation
Backup Archive Creation on page 169•
• Backup Archive Restoration on page 173
Viewing Backup Archives
1. Click the Admin tab.
2. On the navigation menu, click SystemConfiguration.
3. Click Backup and Recovery.
Use the Backup Archiveswindow to view a list of your backup archives.
Importing a Backup Archive
If you place a JSA backup archive file in the /store/backupHost/inbound directory on the
Console server, the backup archive file is automatically imported.
Copyright © 2018, Juniper Networks, Inc.168
Juniper Secure Analytics Administration Guide

1. Click the Admin tab.
2. On the navigation menu, click SystemConfiguration.
3. Click the Backup and Recovery icon.
4. In the Upload Archive field, click Browse.
5. Locateandselect thearchive file that youwant toupload. Thearchive filemust include
a .tgz extension.
6. ClickOpen.
7. Click Upload.
Importing a backup archive is useful if you want to restore a backup archive that was
created on another JSA host.
Deleting a Backup Archive
If a backup file is deleted, it is removed from the disk and from the database. Also, the
entry is removed from this list and an audit event is generated to indicate the removal.
1. Click the Admin tab.
2. On the navigation menu, click SystemConfiguration.
3. Click Backup and Recovery.
4. In the Existing Backups section, select the archive that you want to delete.
5. Click Delete.
To delete a backup archive file, the backup archive file and the Host Context component
must be located on the same system. The systemmust also be in communication with
the JSA Console and no other backup can be in progress.
Backup Archive Creation
By default, JSA creates a backup archive of your configuration information daily at
midnight. The backup archive includes your configuration information, data, or both from
169Copyright © 2018, Juniper Networks, Inc.
Chapter 12: Manage Backup and Recovery

the previous day. You can customize this nightly backup and create an on-demand
configuration backup, as required.
• Scheduling Nightly Backup on page 170
• Creating an On-demand Configuration Backup Archive on page 172
• Creating an Email Notification for a Failed Backup on page 172
RelatedDocumentation
Backup Archive Restoration on page 173•
• Backup Archive Management on page 168
Scheduling Nightly Backup
By default, the nightly backup process includes only your configuration files. You can
customizeyournightlybackupprocess to includedata fromyour JSAConsoleandselected
managed hosts. You can also customize your backup retention period, backup archive
location, the time limit for a backup to process before timing out, and the backup priority
in relation to other JSA processes.
NOTE: To ensure optimum performance, it is a good idea not to scheduleyour nightly backup to run at the same time as JSA automatic updates.
The Backup Recovery Configuration window provides the following parameters:
Table 37: Backup Recovery Configuration Parameters
DescriptionParameter
General Backup Configuration
Type the location where you want to store your backup file. The default location is/store/backup. This path must exist before the backup process is initiated. If this path doesnot exist, the backup process aborts.
If youmodify this path, make sure the new path is valid on every system in your deployment.
• Active data is stored on the /storedirectory. If you have both active data andbackup archivesstored in thesamedirectory, data storagecapacitymight easily be reachedandyour scheduledbackupsmight fail.We recommend you specify a storage location on another systemor copyyour backup archives to another system after the backup process is complete. You can usea Network File System (NFS) storage solution in your JSA deployment. For more informationon using NFS, see the Configuring Offboard Storage Guide.
Backup Repository Path
Type or select the length of time, in days, that you want to store backup files. The default is 2days.
This period of time only affects backup files generated as a result of a scheduled process.On-demand backups or imported backup files are not affected by this value.
Backup Retention Period(days)
Select a backup option.Nightly Backup Schedule
Copyright © 2018, Juniper Networks, Inc.170
Juniper Secure Analytics Administration Guide

Table 37: Backup Recovery Configuration Parameters (continued)
DescriptionParameter
This option is only displayed if you select the Configuration and Data Backups option.
All hosts in your deployment are listed. The first host in the list is your Console; it is enabled fordata backup by default, therefore no check box is displayed. If you havemanaged hosts in yourdeployment, themanaged hosts are listed below the Console and eachmanaged host includesa check box.
Select the check box for the managed hosts you want to run data backups on.
For each host (Console or managed hosts), you can optionally clear the data items you wantto exclude from the backup archive.
Select the managed hostsyou would like to run databackups:
Configuration Only Backup
Type or select the length of time, in minutes, that you want to allow the backup to run. Thedefault is 180minutes. If the backup process exceeds the configured time limit, the backupprocess is automatically canceled.
Backup Time Limit (min)
From this list box, select the level of importance that you want the system to place on theconfiguration backup process compared to other processes.
A priority of medium or high have a greater impact on system performance.
Backup Priority
Data Backup
Type or select the length of time, in minutes, that you want to allow the backup to run. Thedefault is 1020minutes. If the backup process exceeds the configured time limit, the backup isautomatically canceled.
Backup Time Limit (min)
From the list, select the level of importance you want the system to place on the data backupprocess compared to other processes.
A priority of medium or high have a greater impact on system performance.
Backup Priority
1. Click the Admin tab.
2. On the navigation menu, click SystemConfiguration.
3. Click the Backup and Recovery.
4. On the toolbar, click Configure.
5. On the Backup Recovery Configurationwindow, customize your nightly backup.
6. Click Save.
171Copyright © 2018, Juniper Networks, Inc.
Chapter 12: Manage Backup and Recovery

7. Close the Backup Archiveswindow.
8. On the Admin tabmenu, click Deploy Changes.
Use the Backup Recovery Configurationwindow to configure a night scheduled backup
process.
Creating an On-demand Configuration Backup Archive
You initiate an on-demand backup archive during a period when JSA has low processing
load, such as after normal office hours. During the backup process, system performance
is affected.
1. Click the Admin tab.
2. On the navigation menu, click SystemConfiguration.
3. Click Backup and Recovery.
4. From the toolbar, clickOnDemand Backup.
5. Enter values for the following parameters:
Type a unique name that you want to assign to this backuparchive. The name can be up to 100 alphanumeric charactersin length. The name can contain following characters:underscore (_), dash (-), or period (.).
Name
Type a description for this configuration backup archive. Thedescription can be up to 255 characters in length.
Description
6. Click Run Backup.
You can start a new backup or restore processes only after the on-demand backup
is complete. You canmonitor the backup archive process in the Backup Archives
window. See “Viewing Backup Archives” on page 168.
If youmust back up your configuration files at a time other than your nightly scheduled
backup, you can create an on-demand backup archive. On-demand backup archives
include only configuration information.
Creating an Email Notification for a Failed Backup
To receive a notification by email about a backup failure on the JSA Console or a JSA
Event Processor, create a rule that is based on the system notification message.
Youmust configure an email server to distribute system notifications in JSA. For more
information, see “Configuring Your Local Firewall” on page 79.
Copyright © 2018, Juniper Networks, Inc.172
Juniper Secure Analytics Administration Guide

If a backup fails, you see one of the following backup failure system notifications:
• Backup: requiresmore disk space
• Backup: last Backup exceeded execution threshold
• Backup: unable to execute request
1. Click theOffenses tab.
2. In theOffenses pane, click Rules.
3. Click Actions >New Event Rule.
4. In the RuleWizard, check the Skip this pagewhen running this rules wizard box and
click Next.
5. In the filter box, type the following search query:
when the event QID is one of the following QIDs
6. Click the green add (+) icon.
7. In the Rule pane, click theQIDs link.
8. In theQID/Name field, type Backup:
9. Select the following QIDs and click Add +:
• Backup requiresmore disk space
• Backup: last backup exceeded execution threshold
• Backup unable to execute request
10. Click Submit.
11. In the Rule pane, type the following name for your rule test and click Next:
Backup Failure
12. In the Rule Response section, check the Email box and type the email addresses you
want to notify.
Backup Archive Restoration
Restoringabackuparchive isuseful if youwant to restorepreviouslyarchivedconfiguration
files, offense data, and asset data on your JSA system.
173Copyright © 2018, Juniper Networks, Inc.
Chapter 12: Manage Backup and Recovery

Before you restore a backup archive, note the following considerations:
• You can only restore a backup archive created within the same release of software,
including thepatch level. For example, if youare running Juniper SecureAnalytics (JSA)
2014.7, the backup archive must have been created in Juniper Secure Analytics (JSA).
• The restore process only restores your configuration information, offense data, and
asset data. For more information, see “Restoring Data” on page 178.
• If the backup archive originated on a NATed Console system, you can only restore that
backup archive on a NATed system.
During the restore process, the following steps are taken on the Console:
1. Existing files and database tables are backed up.
2. Tomcat is shut down.
3. All system processes are shut down.
4. Files are extracted from the backup archive and restored to disk.
5. Database tables are restored.
6. All system processes are restarted.
7. Tomcat restarts.
• Restoring a Backup Archive on page 174
• Restoring a Backup Archive Created on a Different JSA System on page 176
• Restoring Data on page 178
• Verifying Restored Data on page 180
RelatedDocumentation
Backup Archive Management on page 168•
• Backup Archive Creation on page 169
Restoring a Backup Archive
You can restart the Console only after the restore process is complete.
The restore process can take up to several hours; the process time depends on the size
of the backup archive that must be restored. When complete, a confirmation message
is displayed.
A window provides the status of the restore process. This window provides any errors
for each host and instructions for resolving the errors.
The following parameters are available in the Restore a Backupwindow:
Copyright © 2018, Juniper Networks, Inc.174
Juniper Secure Analytics Administration Guide

Table 38: Restore a Backup Parameters
DescriptionParameter
The name of the backup archive.Name
The description, if any, of the backup archive.Description
The type of backup. Only configuration backups can be restored, therefore, this parameterdisplays config.
Type
Whenselected, thisoption indicates thatall configuration itemsare included in the restorationof the backup archive.
Select All Configuration Items
Lists the configuration items to include in the restoration of the backup archive. To removeitems, you can clear the check boxes for each item you want to remove or clear the SelectAll Configuration Items check box.
Restore Configuration
When selected, this option indicates that all data items are included in the restoration ofthe backup archive.
Select All Data Items
Lists the configuration items to include in the restoration of the backup archive. All itemsare cleared by default. To restore data items, you can select the check boxes for each itemyou want to restore.
Restore Data
1. Click the Admin tab.
2. On the navigation menu, click SystemConfiguration.
3. Click the Backup and Recovery.
4. Select the archive that you want to restore.
5. Click Restore.
6. On the Restore a Backupwindow, configure the parameters.
7. Click Restore.
8. ClickOK.
9. ClickOK.
10. Choose one of the following options:
• If the user interfacewas closed during the restore process, open aweb browser and
log in to JSA.
175Copyright © 2018, Juniper Networks, Inc.
Chapter 12: Manage Backup and Recovery

• If the user interface was not closed, the login window is displayed. Log in to JSA.
11. Follow the instructions on the status window.
After you verify that your data is restored to your system, ensure that your DSMs,
vulnerability assessment (VA) scanners, and log source protocols are also restored.
If thebackuparchiveoriginatedonanHAcluster, youmust clickDeployChanges to restore
the HA cluster configuration after the restore is complete. If disk replication is enabled,
the secondary host immediately synchronizes data after the system is restored. If the
secondary host was removed from the deployment after a backup, the secondary host
displays a failed status on the System and LicenseManagementwindow.
You can restore a backup archive. Restoring a backup archive is useful if you have a
system hardware failure or you want to store a backup archive on a replacement
appliance.
Restoring a Backup Archive Created on a Different JSA System
You can restart the Console only after the restore process is complete.
The restore process can take up to several hours; the process time depends on the size
of the backup archive that must be restored. When complete, a confirmation message
is displayed.
A window provides the status of the restore process. This window provides any errors
for each host and instructions for resolving the errors.
Youmust stop the iptables service on eachmanaged host in your deployment. The
Iptables service is a Linux based firewall.
The Restore a Backup (Managed Hosts Accessibility) window provides the following
information.
Table 39: Restore a Backup (Managed Host Accessibility) Parameters
DescriptionParameter
Themanaged host name.Host Name
The IP address of the managed host.IP Address
The access status to the managed host.Access Status
The Restore a Backup window provides the following parameters:
Table 40: Restore a Backup Parameters
DescriptionParameter
The name of the backup archive.Name
The description, if any, of the backup archive.Description
Copyright © 2018, Juniper Networks, Inc.176
Juniper Secure Analytics Administration Guide

Table 40: Restore a Backup Parameters (continued)
DescriptionParameter
The type of backup. Only configuration backups can be restored, therefore, this parameterdisplays config.
Type
When selected, this option indicates that all configuration items are included in the restorationof the backup archive. This check box is selected by default. To clear all configuration items,clear the check box.
Select All Configuration Items
Lists the configuration items to include in the restoration of the backup archive. All items areselected by default. To remove items, you can clear the check boxes for each item you wantto remove or clear the Select All Configuration Items check box.
Restore Configuration
When selected, this option indicates that all data items are included in the restoration of thebackup archive. This check box is selected by default. To clear all data items, clear this checkbox.
Select All Data Items
Lists the configuration items to include in the restoration of the backup archive. All items arecleared by default. To restore data items, you can select the check boxes for each item youwant to restore.
Restore Data
1. Click the Admin tab.
2. On the navigation menu, click SystemConfiguration.
3. Click the Backup and Recovery.
4. Select the archive that you want to restore.
5. Click Restore.
6. On the Restore a Backupwindow, configure the parameters.
7. Click Restore.
8. Stop the IP tables:
a. Using SSH, log in to the managed host as the root user.
b. Type the command,service iptables stop
.
c. Repeat for all managed hosts in your deployment.
9. On the Restore a Backupwindow, click Test Hosts Access.
177Copyright © 2018, Juniper Networks, Inc.
Chapter 12: Manage Backup and Recovery

10. After testing is complete for all managed hosts, verify that the status in the Access
Status column indicates a status ofOK.
11. If the Access Status column indicates a status of No Access for a host, stop iptables
again, and then click Test Host Access again to attempt a connection.
12. On the Restore a Backupwindow, configure the parameters.
13. Click Restore.
14. ClickOK.
15. ClickOK to log in.
16. Choose one of the following options:
• If the user interfacewas closed during the restore process, open aweb browser and
log in to JSA.
• If the user interface was not closed, the login window is displayed. Log in to JSA.
17. Viewthe resultsof the restoreprocessand followthe instructions to resolveanyerrors.
18. Refresh your web browser window.
19. From the Admin tab, select Advanced >Deploy Full Configuration.
When you deploy the full configuration, JSA restarts all services. Data collection for
events and flows stops until the deployment completes.
After you verify that your data is restored to your system, youmust reapply RPMs for any
DSMs, vulnerability assessment (VA) scanners, or log source protocols.
If thebackuparchiveoriginatedonanHAcluster, youmust clickDeployChanges to restore
the HA cluster configuration after the restore is complete. If disk replication is enabled,
the secondary host immediately synchronizes data after the system is restored. If the
secondary host was removed from the deployment after a backup, the secondary host
displays a failed status on the System and LicenseManagementwindow.
Each backup archive includes the IP address information of the system fromwhich the
backup archive was created. When you restore a backup archive from a different JSA
system, the IP address of the backup archive and the system that you are restoring are
mismatched. You can correct the mismatched IP addresses.
Restoring Data
Ensure that the following conditions are met:
Copyright © 2018, Juniper Networks, Inc.178
Juniper Secure Analytics Administration Guide

• If you are restoring data on a new JSA console, the configuration backup is restored.
• You know the location of the managed host where the data is backed up.
• If your deployment includes a separate mount point for that volume, the /store or
/store/ariel directory has sufficient space for the data that you want to recover.
• You know the date and time for the data that you want to recover.
1. Use SSH to log in to JSA as the root user.
2. Go to the /store/backup directory.
3. To list the backup files, type the following command:
ls -l
4. If backup files are listed, go to the root directory by typing the following command:
cd /
NOTE: The restored files must be in the /store directory. If you type cdinstead of cd /, the files are restored to the /root/store directory.
5. To extract the backup files to their original directory, type the following command:
tar -zxpvPf /store/backup/backup.name.hostname_hostID .target date.backuptype.timestamp.tgz
Table 41: Description Of File Name Variables
DescriptionFile name variable
The name of the backup.name
The name of the JSA system that hosts the backup file followed by theidentifier for the JSA system.
hostname_hostID
The date that the backup file was created. The format of the target date isday_month_year.
target date
The options are <data> or <config>.backup type
The time that the backup file was created.timestamp
Daily backup of data captures all data on each host. If you want to restore data on a
managed host that contains only event or flow data, only that data is restored to that
host. If you want to maintain the restored data, increase your data retention settings to
prevent the nightly disk maintenance routines from deleting your restored data.
179Copyright © 2018, Juniper Networks, Inc.
Chapter 12: Manage Backup and Recovery

You can restore the data on your JSA Console andmanaged hosts from backup files.
The data portion of the backup files includes information such as source and destination
IP address information, asset data, event category information, vulnerability data, flow
data, and event data.
Eachmanaged host in your deployment, including the JSA console, creates all backup
files in the /store/backup/ directory. Your systemmight include a /store/backupmount
fromanexternalSANorNASservice. External servicesprovide long term,offline retention
of data, which is commonly required for compliancy regulations, such as PCI.
NOTE: Youmust restore the configuration backup before you restore thedata backup.
Verifying Restored Data
1. To verify that the files are restored, review the contents of one of the restored
directories by typing the following command:
cd /store/ariel/flows/payloads/<yyyy/mm/dd>
cd /store/ariel/events/payloads/<yyyy/mm/dd>
You can view the restored directories that are created for each hour of the day. If
directories are missing, data might not be captured for that time period.
2. Verify that the restored data is available.
a. Log in to the JSA interface.
b. Click the Log Activity or Network Activity tab.
c. Select Edit Search from the Search list on the toolbar.
d. In the Time Range pane of the Searchwindow, select Specific Interval.
e. Select the time range of the data you restored and then click Filter.
f. View the results to verify the restored data.
g. If your restored data is not available in the JSA interface, verify that data is restored
in the correct location and file permissions are correctly configured.
Restored files must be in the /store directory. If you typed cd instead of cd /whenyou extracted the restored files, check the /root/store directory for the restored
files. If you did not change directories before you extracted the restored files, check
the /store/backup/store directory for the restored files.
Typically, files are restored with the original permissions. However, if the files are
owned by the root user account, issues might occur. If the files are owned by the
root user account, change the permissions by using thechown
andchmod
commands.
Copyright © 2018, Juniper Networks, Inc.180
Juniper Secure Analytics Administration Guide

After you verified that your data is restored, youmust reapply RPMs for any DSMs,
vulnerability assessment (VA) scanners, and log source protocols.
Verify that your data is restored correctly in JSA.
181Copyright © 2018, Juniper Networks, Inc.
Chapter 12: Manage Backup and Recovery

Copyright © 2018, Juniper Networks, Inc.182
Juniper Secure Analytics Administration Guide

CHAPTER 13
Deployment Editor
• Deployment Editor on page 183
• Deployment Editor Requirements on page 183
• Deployment Editor Views on page 184
• Building Your Deployment Using the Deployment Editor on page 186
• Generating Public Keys for JSA Products on page 187
• Event ViewManagement on page 187
• Viewing the Progress Of Data Rebalancing on page 193
• Archiving Data Node Content on page 194
• Saving Event Processor Data to a Data Node Appliance on page 194
• System ViewManagement on page 195
• NATManagement on page 202
• Component Configuration on page 205
Deployment Editor
Use the deployment editor to manage the individual components of your JSA. After you
configure your deployment, you can access and configure the individual components of
eachmanaged host in your deployment.
Deployment Editor Requirements
Before you can use the deployment editor, ensure that it meets the minimum system
requirements.
The deployment editor requires Java Runtime Environment (JRE). You can download
Java 1.6 or 1.7 from the Java website. If you are using the Mozilla Firefox web browser, you
must configure your browser to accept Java Network Language Protocol (JNLP) files.
Many web browsers that use the Microsoft Internet Explorer engine, such as Maxthon,
install components thatmightbe incompatiblewith theAdmin tab.Youmightbe required
to disable any web browsers that are installed on your system.
183Copyright © 2018, Juniper Networks, Inc.

Toaccess thedeploymenteditor frombehindaproxy serveror firewall, youmust configure
the appropriate proxy settings on your desktop. The software can then automatically
detect the proxy settings from your browser.
To configure the proxy settings, open the Java configuration in your Control Pane and
configure the IP address of your proxy server. For more information, see the Microsoft
documentation.
RelatedDocumentation
Deployment Editor Views on page 184•
• Building Your Deployment Using the Deployment Editor on page 186
• Generating Public Keys for JSA Products on page 187
Deployment Editor Views
The deployment editor provides the different views of your deployment.
You can access the deployment editor by using the Admin tab. You can use the
deployment editor to create your deployment, assign connections, and configure each
component.
After you update your configuration settings by using the deployment editor, you must
save those changes to the staging area. Youmust manually deploy all changes by using
the Admin tabmenu option. All deployed changes are then enforced throughout your
deployment.
The deployment editor provides the following views:
• System View on page 184
• Event View on page 185
• Vulnerability View on page 185
• Configuring Deployment Editor Preferences on page 185
SystemView
Use the SystemView page to assign software component to managed hosts in your
deployment. The SystemView page includes all managed hosts in your deployment. A
managed host is a system in your deployment that has JSA software that is installed.
By default, the SystemView page also includes the following components:
• Host Context, which monitors all JSA components to ensure that each component is
operating as expected.
• Accumulator, which analyzes flows, events, reporting, writing database data, and
alerting a device systemmodule (DSM).
An accumulator is on any host that contains an Event Processor.
Copyright © 2018, Juniper Networks, Inc.184
Juniper Secure Analytics Administration Guide

On the SystemView page, the left pane provides a list of managed hosts, which you can
viewandconfigure.Thedeploymenteditorpolls yourdeployment forupdates tomanaged
hosts. If the deployment editor detects a change to amanaged host in your deployment,
amessage isdisplayednotifying youof thechange. For example, if you removeamanaged
host, amessage is displayed, indicating that the assigned components to that hostmust
be reassigned to another host.
Also, if you add amanaged host to your deployment, the deployment editor displays a
message that indicates that the managed host was added.
Event View
Use the Event View page to create a view of your components:
• JSA flow processor components
• Event Processors
• JSA Event Collectors
• Off-site Sources
• Off-site Targets
• Magistrate components
• Data Nodes
On the Event View page, the left pane provides a list of components you can add to the
view. The right pane provides a view of your deployment.
Vulnerability View
Use the Vulnerability View page to create a view of your JSA Vulnerability Manager
components. Youmust install JSA Vulnerability Manager to see this view. For more
information, see the Juniper Secure Analytics Vulnerability Manager User Guide.
RelatedDocumentation
Building Your Deployment Using the Deployment Editor on page 186•
• Generating Public Keys for JSA Products on page 187
• Event ViewManagement on page 187
Configuring Deployment Editor Preferences
1. Select File >Edit Preferences.
2. To configure the Presence Poll Frequency parameter, type how often, in milliseconds,
you that want the managed host to monitor your deployment for updates.
3. Toconfigure theZoomIncrementparameter, type the increment valuewhen the zoom
option is selected.
For example, 0.1 indicates 10%.
185Copyright © 2018, Juniper Networks, Inc.
Chapter 13: Deployment Editor

You can configure the deployment editor preferences to modify the zoom increments
and the presence poll frequency.
Building Your Deployment Using the Deployment Editor
Use the Deployment Editor on the Admin tab to add and configure components in your
JSA deployment. You can also use Deployment Editor to see visualizations of your
deployment.
To addmanaged hosts to an existing deployment or to add JSA event collectors, flow
processors, or otherappliances toyourdeployment, useDeploymentactions in theSystem
and LicenseManagement tool on the Admin tab.
Before you use the deployment editor, ensure that the following conditions are met:
• Install the Java Runtime Environment (JRE). You can download Java 1.6 or 1.7 from the
Java website (www.java.com).
• If you are using the Firefox browser, youmust configure your browser to accept Java
Network Language Protocol (JNLP) files.
• Plan your JSA deployment, including the IP addresses and login information for all
devices in your deployment.
1. Click the Admin tab and click Deployment Editor.
2. Click the Event View tab and add event components to the deployment.
3. Click the SystemView tab, and build the system.
4. Configure the components.
5. To stage your deployment, in the Deployment Editor, click File >Save to Staging.
6. Deploy the configuration by choosing one of the following options on the Admin tab
in the JSA console.
• Click Deploy Changes.
• Click Advanced >Deploy Full Configuration.
When you deploy the full configuration, JSA restarts all services. Data collection for
events and flows stops until the deployment completes.
RelatedDocumentation
Generating Public Keys for JSA Products on page 187•
• Event ViewManagement on page 187
• Viewing the Progress Of Data Rebalancing on page 193
Copyright © 2018, Juniper Networks, Inc.186
Juniper Secure Analytics Administration Guide

Generating Public Keys for JSA Products
To forward normalized events in the JSA deployment editor, you must copy the public
key file, /root/.ssh/id_rsa.pub, from the off-site source to the off-site target.
If the off-site source and off-site target are on separate systems, the public key is
automatically generated. If theoff-site sourceand targetarebothonanall-in-onesystem,
the public key is not automatically generated. Youmust manually generate the public
key.
Tomanually generate the public key, follow these steps:
1. Use SSH to log in to your system as the root user.
2. To generate the public key, type the following command:
opt/qradar/bin/ssh-key-generating
3. Press Enter.
The public and private key pair is generated and saved in the /root/.ssh/id_rsa folder.
RelatedDocumentation
Event ViewManagement on page 187•
• Viewing the Progress Of Data Rebalancing on page 193
• Archiving Data Node Content on page 194
Event ViewManagement
Use the Event View page to create andmanage the components for your deployment.
• Building Your Event View on page 187
• Event Views Of JSA Components in Your Deployment on page 188
• Adding Components on page 189
• Connecting Components on page 190
• Forwarding Normalized Events and Flows on page 192
• Renaming Components on page 193
Building Your Event View
To build your Event View, do the following steps:
1. Add components to your view.
2. Connect the components.
187Copyright © 2018, Juniper Networks, Inc.
Chapter 13: Deployment Editor

3. Connect deployments.
4. Rename the components so each component has a unique name.
Event Views Of JSA Components in Your Deployment
Use the Event View page to create a view of your JSA components, including JSA flow
processor, Event Processors, JSA Event Collector, off-site sources, off-site targets, and
Magistrate components.
JSA Flow Processor
JSA Flow Processor collects network flows from devices on your network. Live and
recorded feeds are included, such as network taps, span ports, NetFlow, and JSA flow
logs.
JSA flow processor groups related individual packets into a flow. A flow starts when JSA
flow processor detects the first packet that has a unique source IP address, destination
IP address, source port, destination port, and other specific protocol options.
Each new packet is evaluated. Counts of bytes and packets are added to the statistical
counters in the flow record. At the end of an interval, a status record of the flow is sent
to an Event Collector and statistical counters for the flow are reset. A flow ends when
no activity for the flow is detected within the configured time.
If the protocol does not support port-based connections, JSA combines all packets
between the two hosts into a single flow record. However, JSA flow processor does not
record flows until a connection is made to another JSA component and data is retrieved.
Event Collector
Collects security events from security devices, which are known as log sources, in your
network.
The Event Collector normalizes the collected events and sends the information to the
Event Processor.
Youcanconnectanon-ConsoleEventProcessor toanEventProcessoron the JSAconsole
or to another Event Processor in your deployment. The accumulator gathers flow and
event information from the Event Processor.
The Event Processor on the JSA console is always connected to the Magistrate. This
connection cannot be deleted.
Data Node
The Data Node receives security events and flows from associated event and flow
processors.
The Data Node stores this security data to disk.
The Data Node is always connected to Event Processor or Flow Processor components.
Copyright © 2018, Juniper Networks, Inc.188
Juniper Secure Analytics Administration Guide

Off-site Source
An off-site data source that forwards normalized data to an Event Collector. You can
configure an off-site source to receive data and encrypt the data before forwarding.
Later versions of JSA systems can receive data from earlier versions of JSA systems.
However, earlier versions cannot receive data from later versions. To avoid, upgrade all
receivers before you upgrade senders.
Off-site Target
Indicates an off-site device that receives event or flowdata. An off-site target can receive
data only from an Event Collector.
Later versions of JSA systems can receive data from earlier versions of JSA systems.
However, earlier versions cannot receive data from later versions. To avoid, upgrade all
receivers before you upgrade senders.
Magistrate
You can add one Magistrate component for each deployment. The Magistrate provides
views, reports, alerts, and analysis of network traffic and security events. The Magistrate
processes the events or flows by using the custom rules that are configured to create a
response. If no custom rules exist, the Magistrate uses the default rule set to process the
offending event or flow.
The Magistrate prioritizes the response and assigns amagnitude value that is based on
several factors, including the number of responses, severity, relevance, and credibility.
After theMagistrateestablishes themagnitude, it providesmultipleoptions for resolution.
Adding Components
1. On the Admin tab, click Deployment Editor.
2. In the Event Components pane, select a component that you want to add to your
deployment.
3. Type a unique name for the component you want to add and click Next.
NOTE: The name can be up to 20 characters in length andmight includeunderscores or hyphens.
4. From theSelect ahost toassign to list box, select amanagedhost, and then clickNext.
5. Click Finish.
6. Repeat steps 3- 5 for each component you want to add to your view.
189Copyright © 2018, Juniper Networks, Inc.
Chapter 13: Deployment Editor

7. From the deployment editor menu, select File >Save to staging.
The deployment editor saves your changes to the staging area and automatically
closes.
8. On the Admin tabmenu, click Deploy Changes.
When you configure your deployment, youmust use the Event View page in the
deployment editor to add your components.
You can add the following JSA components to your Event View page:
• JSA Event Collector
• JSA Event Processor
• Off-site source
• Off-site target
• JSA flow processor
• Data Node
Connecting Components
Use theEventViewpage toconnect components together. Some restrictionsareenforced.
For example, you can connect an Event Collector to an Event Processor, but not a
Magistrate component.
The following table describes the components that you can connect.
Table 42: Description Of Supported Component Connections
DescriptionTarget connectionSource connection
A JSA flow processor can connect only to an EventCollector.
The number of connections is not restricted.
Event CollectorJSA flow processor
An Event Collector can be connected only to oneEvent Processor.
A Console Event Collector can be connected only toa Console Event Processor. This connection cannotbe removed.
A non-Console Event Collector can be connected toan Event Processor on the same system.
A non-Console Event Collector can be connected toa remote Event Processor, but only if the EventProcessor does not exist on the Console.
Event ProcessorEvent Collector
The number of connections is not restricted.Off-site targetEvent Collector
Copyright © 2018, Juniper Networks, Inc.190
Juniper Secure Analytics Administration Guide
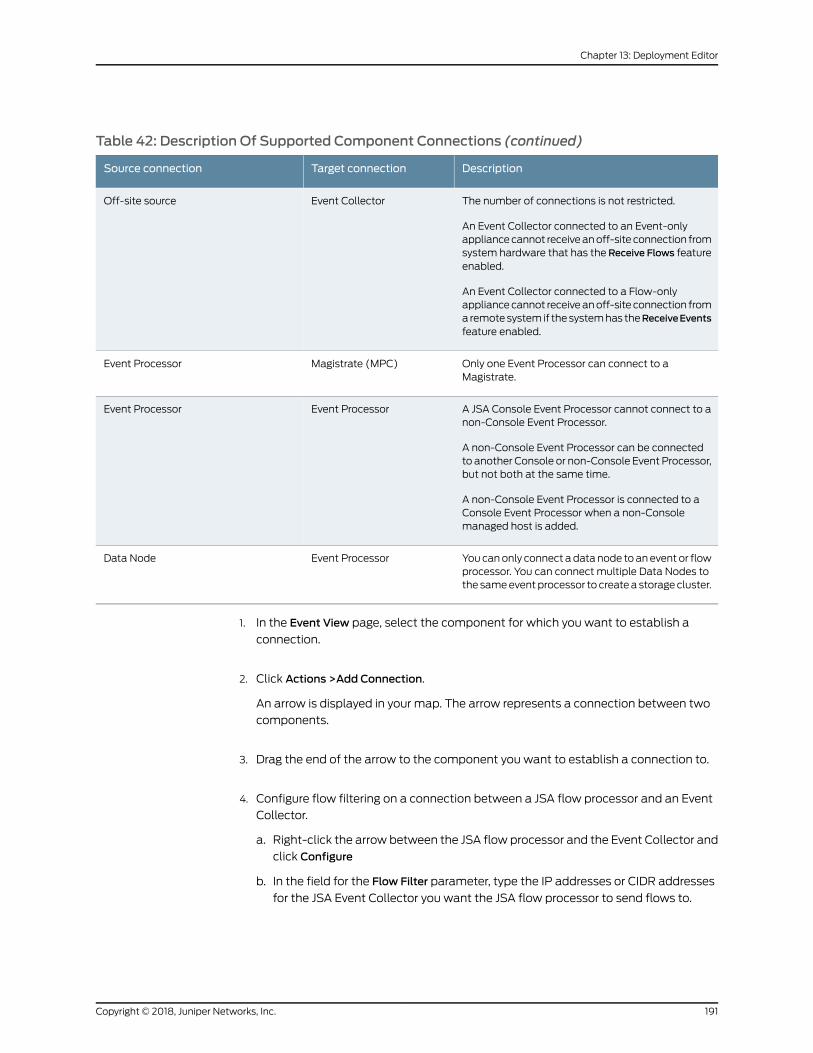
Table 42: Description Of Supported Component Connections (continued)
DescriptionTarget connectionSource connection
The number of connections is not restricted.
An Event Collector connected to an Event-onlyappliancecannot receiveanoff-site connection fromsystem hardware that has theReceive Flows featureenabled.
An Event Collector connected to a Flow-onlyappliancecannot receiveanoff-site connection fromaremotesystem if thesystemhas theReceiveEventsfeature enabled.
Event CollectorOff-site source
Only one Event Processor can connect to aMagistrate.
Magistrate (MPC)Event Processor
A JSA Console Event Processor cannot connect to anon-Console Event Processor.
A non-Console Event Processor can be connectedto another Console or non-Console Event Processor,but not both at the same time.
A non-Console Event Processor is connected to aConsole Event Processor when a non-Consolemanaged host is added.
Event ProcessorEvent Processor
Youcanonly connect adatanode toanevent or flowprocessor. You can connect multiple Data Nodes tothe sameeventprocessor to createa storagecluster.
Event ProcessorData Node
1. In the Event View page, select the component for which you want to establish a
connection.
2. Click Actions >Add Connection.
An arrow is displayed in your map. The arrow represents a connection between two
components.
3. Drag the end of the arrow to the component you want to establish a connection to.
4. Configure flow filtering on a connection between a JSA flow processor and an Event
Collector.
a. Right-click the arrow between the JSA flow processor and the Event Collector and
click Configure
b. In the field for the Flow Filter parameter, type the IP addresses or CIDR addresses
for the JSA Event Collector you want the JSA flow processor to send flows to.
191Copyright © 2018, Juniper Networks, Inc.
Chapter 13: Deployment Editor

5. Click Save.
6. Repeat these steps for all remaining components that require connections.
After you add all the necessary components in your Event View page, youmust connect
them.
Forwarding Normalized Events and Flows
You can add the following components to your Event View page:
• AnOff-site Source is an off-site Event Collector fromwhich you want to receive event
and flow data.
NOTE: Theoff-sitesourcemustbeconfiguredwithappropriatepermissionsto send event and flow data to the off-site target.
• AnOff-site Target is an off-site Event Collector to which you want to send event and
flow data.
1. On the Admin tab, click Deployment Editor.
2. In the Event Components pane, selectOff-site Source orOff-site Target.
3. Type a unique name for the off-site source or off-site target. The name can be up to
20 characters in length andmight include underscores or hyphens. Click Next.
4. Enter values for the parameters and click Finish.
The host name for the Enter a name for the off-site host field can contain amaximum
of 20 characters and can include underscores or hyphens characters.
If you select theEncrypt traffic fromoff-site source the checkbox, youmust also select
the encryption check box on the associated off-site source and target.
5. Repeat for all remaining off-site sources and targets.
6. From the deployment editor menu, click File >Save to staging.
7. On the Admin tabmenu, select Advanced >Deploy Full Configuration.
When you deploy the full configuration, JSA restarts all services. Data collection for
events and flows stops until the deployment completes.
Copyright © 2018, Juniper Networks, Inc.192
Juniper Secure Analytics Administration Guide

To forward normalized events and flows, configure an off-site Event Collector in your
current deployment to receive events and flows from an associated off-site Event
Collector in the receiving deployment.
Renaming Components
1. In the Event Components pane, select the component that you want to rename.
2. Click Actions >Rename Component.
3. Type a new name for the component.
The namemust be alphanumeric with no special characters.
4. ClickOK.
Youmust rename a component in your view to uniquely identify components through
your deployment.
RelatedDocumentation
Viewing the Progress Of Data Rebalancing on page 193•
• Archiving Data Node Content on page 194
• Saving Event Processor Data to a Data Node Appliance on page 194
Viewing the Progress Of Data Rebalancing
After you install aDataNode in your deployment, view theprogressof data that ismoving
between the event processor and the Data Node. If data rebalancing is complete, you
can view additional information about deployed Data Nodes.
1. On the JSA Console, click the Admin tab to view the status of data nodes in your
deployment at the top of the window.
2. Click View in the Detail column to open the System and License Detailswindow.
3. Viewtheprogressofanydata rebalancing, and thecapacityof theDataNodeappliance
in the Security Data Distribution pane.
RelatedDocumentation
Archiving Data Node Content on page 194•
• Saving Event Processor Data to a Data Node Appliance on page 194
• System ViewManagement on page 195
193Copyright © 2018, Juniper Networks, Inc.
Chapter 13: Deployment Editor

Archiving Data Node Content
WhenyousetaDataNodeappliance toArchivemode, nodata iswritten to theappliance.
Existing data is saved.
1. In the Deployment Editor, right-click the Data Node that you want to set to archive
mode and click Configure.
2. Click Archive.
3. From the Admin tabmenu, click Deploy Changes.
4. If youwant to resumebalancingdata toaDataNode that is in archivemode, right-click
Configure >Active.
RelatedDocumentation
Saving Event Processor Data to a Data Node Appliance on page 194•
• System ViewManagement on page 195
• NATManagement on page 202
Saving Event Processor Data to a Data Node Appliance
Improveeventprocessor performanceby savingall data toaDataNodeappliance, rather
than to the event processor. If no active Data Node appliance is available in the same
cluster as the event processor, the event processor saves data locally.When aDataNode
appliance becomes available, it transfers as much data as possible from the event
processor. Data Nodes balance data so that all Data Nodes in a cluster have the same
percentage of free space.
1. In the Deployment Editor, right-click the event processor that has data that you want
to transfer to a Data Node appliance, and click Configure.
2. Click Active and select Processing-Only from the list.
3. From the Admin tabmenu, click Deploy Changes.
RelatedDocumentation
System ViewManagement on page 195•
• NATManagement on page 202
• Component Configuration on page 205
Copyright © 2018, Juniper Networks, Inc.194
Juniper Secure Analytics Administration Guide

SystemViewManagement
• Overview Of the System View Page on page 195
• SoftwareCompatibilityRequirements forConsoleandNon-ConsoleHostsonpage 195
• Encryption on page 195
• Adding a Managed Host on page 196
• Editing a Managed Host on page 197
• Removing a Managed Host on page 198
• Configuring a Managed Host on page 198
• Assigning a Component to a Host on page 199
• Configuring Host Context on page 199
• Configuring an Accumulator on page 201
OverviewOf the SystemView Page
Use the SystemView page to manage all managed hosts in your network.
A managed host is a component in your network that includes JSA software. If you are
using a JSA appliance, the components for that appliancemodel are displayed on the
SystemView page.
Use the SystemView page to do the following tasks:
• Addmanaged hosts to your deployment.
• Use NAT networks in your deployment.
• Update the managed host port configuration.
• Assign a component to amanaged host.
• Configure host context.
• Configure an accumulator.
Software Compatibility Requirements for Console and Non-Console Hosts
Encryption
Encryption provides greater security for all traffic betweenmanaged hosts. To provide
enhanced security, JSA also provides integrated support for OpenSSH.When integrated
with JSA, OpenSSH provides secure communication between components.
Encryption occurs betweenmanaged hosts in your deployment, therefore, your
deploymentmust consist ofmore than onemanaged host before encryption is possible.
Encryption is enabled by using SSH tunnels (port forwarding) initiated from the client. A
client is the system that initiates a connection in a client/server relationship. When
encryption is enabled for a managed host, encryption tunnels are created for all client
applications on amanaged host. Encryption tunnels provide protected access to the
respective servers. If you enable encryption on a non-Consolemanaged host, encryption
195Copyright © 2018, Juniper Networks, Inc.
Chapter 13: Deployment Editor

tunnels are automatically created for databases and other support service connections
to the Console.
When you enable encryption on amanaged host, the encryption SSH tunnel is created
on the client host. For example, the connection between the Event Processor and Event
Collectorand theconnectionbetween theEventProcessorandMagistrateareencrypted.
When you enable encryption on the JSA console, an encryption tunnel is usedwhen your
search events by using theOffenses tab.
TIP: You can right-click a component to enable encryption betweencomponents.
NOTE: Enabling encryption reduces the performance of amanaged host byat least 50%.
Adding aManaged Host
Ensure that you installed JSA on themanaged host.
1. Click Actions >Add aManaged Host.
2. Click Next.
3. Enter values for the parameters.
Use the following table to help you configure the parameters.
Table 43: Parameters for theManaged Host
DescriptionParameter
Select the check box to use an existing Network Address Translation (NAT) on thismanaged host.
Host is NATed
Select the check box to create an SSH encryption tunnel for the host.Enable Encryption
Select the check box to enable data compression between twomanaged hosts.
4. If you selected the Host is NATed check box, configure the parameters.
Table 44: Parameters for a NAT-enabled Network
DescriptionParameter
Themanaged host uses this IP address to communicate with other managed hostsin different networks by using NAT.
Enterpublic IPof theserverorapplianceto add
Copyright © 2018, Juniper Networks, Inc.196
Juniper Secure Analytics Administration Guide

Table 44: Parameters for a NAT-enabled Network (continued)
DescriptionParameter
If the managed host is on the same subnet as the Console, select the Console of theNAT-enabled network .
If the managed host is not on the same subnet as the Console, select the managedhost of the NAT-enabled network.
Select NATed network
5. Click Next.
6. Click Finish.
7. Deploy your changes.
Use the SystemView page of the deployment editor to add amanaged host.
Editing aManaged Host
1. Click the SystemView tab.
2. Right-click the managed host that you want to edit and select Edit Managed Host.
This option is available only when the selected component has amanaged host that
is running a compatible version of JSA.
3. Click Next.
4. Edit the parameter values, as necessary.
Use the following table to help you configure the parameters.
Table 45: Parameters for theManaged Host
DescriptionParameter
Select the check box to use an existing Network Address Translation (NAT) on thismanaged host.
Host is NATed
Select the check box to create an SSH encryption tunnel for the host.Enable Encryption
Select the check box to enable data compression between twomanaged hosts.
5. If you selected the Host is NATed check box, configure the parameters.
197Copyright © 2018, Juniper Networks, Inc.
Chapter 13: Deployment Editor

Table 46: Parameters for a NAT-enabled Network
DescriptionParameter
Themanaged host uses this IP address to communicate with other managed hostsin different networks by using NAT.
Enterpublic IPof theserverorapplianceto add
If the managed host is on the same subnet as the Console, select the Console of theNAT-enabled network.
If the managed host is not on the same subnet as the Console, select the managedhost of the NAT-enabled network.
Select NATed network
6. Click Next.
7. Click Finish.
Use the SystemView page of the deployment editor to edit a managed host.
Removing aManaged Host
1. Click the SystemView tab.
2. Right-click the managed host that you want to delete and select Remove host.
3. ClickOK.
4. On the Admin tabmenu, click Advanced >Deploy Full Configuration.
When you deploy the full configuration, JSA restarts all services. Data collection for
events and flows stops until the deployment completes.
Youcan removenon-Consolemanagedhosts fromyour deployment. Youcannot remove
amanaged host that hosts the JSA Console.
TIP: TheRemove host option is available onlywhen the selected component
has amanaged host that is running a compatible version of JSA.
Configuring aManaged Host
1. From the SystemView page, right-click themanaged host that you want to configure
and click Configure.
2. Enter values for the parameters:
In the Ports to exclude field, use a comma to separate multiple ports
Copyright © 2018, Juniper Networks, Inc.198
Juniper Secure Analytics Administration Guide

3. Click Save.
Use the SystemView page of the deployment editor to configure a managed host.
Assigning a Component to a Host
1. Click the SystemView tab.
2. From theManaged Host list, select the managed host that you want to assign a JSA
component to.
3. Select the component that you want to assign to amanaged host.
4. From themenu, select Actions >Assign.
5. From the Select a host list box, select the host that you want to assign to this
component. Click Next.
6. Click Finish.
Use the SystemView page to assign the JSA components that you added in the Event
View page to the managed hosts in your deployment.
TIP: The list box displays only themanaged hosts that are running acompatible version of JSA.
Configuring Host Context
1. In the deployment editor, click the SystemView tab.
2. Select the managed host that includes the host context you want to configure.
3. Select the Host Contextcomponent.
4. Click Actions >Configure.
5. Enter values for the parameters.
199Copyright © 2018, Juniper Networks, Inc.
Chapter 13: Deployment Editor

Table 47: Host Context Parameters
DescriptionParameter
When the configured threshold of disk usage is exceeded, an email is sent to the administrator thatindicates the current state of disk usage.
The default warning threshold is 0.75. Therefore, when disk usage exceeds 75%, an email thatindicates that disk usage is exceeding 75% is sent.
If disk usage continues to increase above the configured threshold, a new email is sent after every5% increase in usage. By default, Host Contextmonitors the following partitions for disk usage:
• /
• /store
• /store/tmp
NOTE: Notification emails are sent from the email address that is specified in the Alert Email FromAddress parameter to the email address specified in the Administrative Email Address parameter.These parameters are configured on the SystemSettingswindow. For more information, see “SetUp JSA” on page 97.
Warning Threshold
Whenthesystemexceeds theshutdownthreshold,diskusagemust fall belowthe recovery thresholdbefore processes are restarted. The default is 0.90. Therefore, processes are not restarted untildisk usage is below 90%.
NOTE: Notification emails are sent from the email address that is specified in the Alert Email FromAddress parameter to the email address specified in the Administrative Email Address parameter.These parameters are configured on the SystemSettingswindow. For more information, see “SetUp JSA” on page 97.
Recovery Threshold
When the system exceeds the shutdown threshold, all processes are stopped. An email is sent tothe administrator that indicates the current state of the system. The default is 0.95, therefore,when disk usage exceeds 95%, all processes stop.
NOTE: Notification emails are sent from the email address that is specified in the Alert Email FromAddress parameter to the email address specified in the Administrative Email Address parameter.These parameters are configured on the SystemSettingswindow.
NOTE: For more information, see “Set Up JSA” on page 97.
Shutdown Threshold
The frequency, in milliseconds, that you want to determine disk usage.Inspection Interval
The frequency, in milliseconds, that you want to inspect SAR output.Inspection Interval
The frequency, in milliseconds, that you want to be notified that the threshold was exceeded.Alert Interval
The time, in seconds, that you want the SAR inspection to be engaged.Time Resolution
The frequency, in milliseconds, that you want to monitor the log files.Inspection Interval
A file name for the SYSLOG file.Monitored SYSLOG FileName
Copyright © 2018, Juniper Networks, Inc.200
Juniper Secure Analytics Administration Guide

Table 47: Host Context Parameters (continued)
DescriptionParameter
Themaximum number of lines you want to monitor from the log file.Alert Size
6. Click Save .
Use the SystemView page of the deployment editor to configure the Host
Contextcomponent on amanaged host.
The Host Context component monitors all JSA components to make sure that each
component is operating as expected.
Configuring an Accumulator
1. In the deployment editor, click the SystemView tab.
2. Select the managed host that you want to configure.
3. Select the accumulator component.
4. Click Actions >Configure.
5. Configure the parameters.
Table 48: Accumulator Parameters
DescriptionParameter
Specifies whether the current component is a central accumulator. A centralaccumulator exists only on a JSA console system.
Central Accumulator
The listen port responsible for receiving streams of flows from the Event Processor.
The default value is 7802.
Streamer Accumulator Listen Port
The device systemmodule (DSM) address that is used to forwarding alerts from theaccumulator.
Use the following syntax: <DSM_IP address>:<DSM port number>
Alerts DSMAddress
6. Click Save.
RelatedDocumentation
NATManagement on page 202•
• Component Configuration on page 205
201Copyright © 2018, Juniper Networks, Inc.
Chapter 13: Deployment Editor

• Saving Event Processor Data to a Data Node Appliance on page 194
NATManagement
Use the deployment editor to manage NAT-enabled deployments.
Network address translation (NAT) translates an IP address in one network to a different
IP address in another network. NAT provides increased security for your deployment
since requests are managed through the translation process and hides internal IP
addresses.
You can add a non-NAT-enabledmanaged host by using inbound NAT for a public IP
address. You can also use a dynamic IP address for outbound NAT. However, both must
be on the same switch as the JSA Console or managed host. Youmust configure the
managed host to use the same IP address for the public and private IP addresses.
When you add or edit a managed host, you can enable NAT for that managed host. You
can also use the deployment editor to manage your NAT-enabled networks.
• Adding a NAT-enabled Network to JSA on page 202
• Editing a NAT-enabled Network on page 203
• Deleting a NAT-enabled Network from JSA on page 203
• Changing the NAT Status for a Managed Host on page 203
RelatedDocumentation
Component Configuration on page 205•
• Saving Event Processor Data to a Data Node Appliance on page 194
• System ViewManagement on page 195
Adding a NAT-enabled Network to JSA
Ensure that you set up your NAT-enabled networks by using static NAT translation. This
setup ensures that communications betweenmanaged hosts that exist within different
NAT-enabled networks.
1. In the deployment editor, click the NATed Networks icon.
2. Click Add.
3. Type a name for a network you want to use for NAT.
4. ClickOK.
TheManage NATed Networkswindow is displayed, including the added NAT-enabled
network.
Copyright © 2018, Juniper Networks, Inc.202
Juniper Secure Analytics Administration Guide

5. ClickOK.
6. Click Yes.
Use the deployment editor to add a NAT-enabled network to your JSA deployment.
Editing a NAT-enabled Network
1. In the deployment editor, click the NATed Networks icon.
2. Select the NAT-enabled network that you want to edit, and click Edit.
3. Type a new name for of the NAT-enabled network and clickOK.
TheManage NATed Networkswindow shows the updated NAT-enabled networks.
4. ClickOK.
5. Click Yes.
Using the deployment editor, you can edit a NAT-enabled network.
Deleting a NAT-enabled Network from JSA
1. In the deployment editor, click the NATed Networks icon.
2. Select the NAT-enabled network you want to delete.
3. Click Delete.
4. ClickOK.
5. Click Yes.
Use the deployment editor to delete a NAT-enabled network from your deployment:
Changing the NAT Status for a Managed Host
If you want to enable NAT for a managed host, the NAT-enabled network must be using
static NAT translation.
To change your NAT status for a managed host, make sure you update the managed
host configuration within JSA before you update the device. Updating the configuration
first prevents the host from becoming unreachable and you can deploy changes to that
host.
203Copyright © 2018, Juniper Networks, Inc.
Chapter 13: Deployment Editor

1. In the deployment editor, click the SystemView tab.
2. Right-click the managed host that you want to edit and select Edit Managed Host.
3. Click Next.
4. Choose one of the following options:
• If you want to enable NAT for the managed host, select the Host is NATed check
box and click Next.
• If you want to disable NAT for the managed host, clear the Host is NATed check
box.
NOTE: When you change the NAT status for an existingmanaged host,error messagesmight be displayed. Ignore these error messages.
5. If you enabled NAT, select a NAT-enabled network, and enter values for the
parameters:
Table 49: Parameters for a NAT-enabled Network
DescriptionParameter
Themanaged host uses this IP address to communicate with anothermanaged host that belongs to a different network by using NAT.
Change public IP of the server or appliance to add
Update the NAT-enabled network configuration.Select NATed network
Network address translation (NAT) translates an IPaddress in onenetworktoadifferent IPaddress inanothernetwork.NATprovides increasedsecurityfor your deployment since requests are managed through the translationprocess and hides internal IP addresses.
For more information, see “NATManagement” on page 202.
Manage NATs List
6. Click Next.
7. Click Finish.
8. Update the configuration for the device (firewall) to which the managed host is
communicating.
9. On the Admin tabmenu, click Advanced >Deploy Full Configuration.
When you deploy the full configuration, JSA restarts all services. Data collection for
events and flows stops until the deployment completes.
Copyright © 2018, Juniper Networks, Inc.204
Juniper Secure Analytics Administration Guide

Use the deployment editor to change the NAT status of a managed host in your
deployment.
Component Configuration
Use the deployment editor to configure each component in your deployment.
• Configuring a JSA Flow Processor on page 205
• Configuring an Event Collector on page 210
• Configuring an Event Processor on page 211
• Configuring the Magistrate on page 212
• Configuring an Off-site Source on page 213
• Configuring an Off-site Target on page 213
Configuring a JSA Flow Processor
You can configure a flow filter on the connection from a JSA flow processor andmultiple
JSA Event Collectors. A flow filter controls which flow a component receives. The Flow
Filter parameter is available on the Flow Connection Configurationwindow.
Right-click the arrow between the component you want to configure for flow filtering
and select Configure.
The following table describes the advanced JSA flow processor parameters:
1. From either the Event View or SystemView page, select the JSA flow processor you
want to configure.
2. Click Actions >Configure.
3. Enter values for the following parameters:
DescriptionParameter
The Event Collector component that is connected to this JSA flow processor. The connection isdisplayed in the following format: <Host IP Address>:<Port>.
If the JSA flow processor is not connected to an Event Collector, the parameter is empty.
Event CollectorConnections
A unique ID for the JSA flow processor.Flow ProcessorID
205Copyright © 2018, Juniper Networks, Inc.
Chapter 13: Deployment Editor

DescriptionParameter
Specify the amount (Bytes) of data you wish the JSA Flow Processor to capture and retain in theflow payload.
The range is 0 - 65535. A value of 0 disables payload data capture. The default is 64 bytes. This isapplicable for packet flows. For Netflow V9 and IPFIX flow types, the flow payload data is capturedby defining configuration files (IPFixFields.conf and netflowV9Fields.conf)
Transferring large amounts of content across the network might affect network and performance.Onmanaged hosts where the JSA Flow Processor are on close high-speed links, you can increasethe content capture length.
NOTE: Increasing content capture length increases disk storage requirements for suggested diskallotment.
Maximum ContentCapture
The Yes option enables the JSA flow processor to detect external flow source aliases. When a JSAflow processor receives traffic from a device with an IP address, but no current alias, the JSA flowprocessor attempts a reverse DNS lookup to determine the host name of the device. If the lookupis successful, the JSA flow processor adds this information to the database and reports thisinformation to all your deployment.
The No option prevents the JSA flow processor from detecting external flow sources aliases.
Alias Autodetection
4. On the toolbar, click Advanced to display the advanced parameters.
5. Enter values for the advanced parameters, as necessary.
Table 50: Advanced JSA Flow Processor Parameters:
DescriptionParameter
The Event Collector connected to this JSA flow processor.
The connection is displayed in the following format: <Host IP Address>:<Port>.
If the JSA flow processor is not connected to an Event Collector, the parameter is empty.
EventCollectorConnections
The0option enablesDistributorMode, which allows JSA flowprocessor to group flows that havesimilar properties.
The 1 option enables FlowMode, which prevents the bundling of flows.
Flow Routing Mode
The number of bytes per packet that you want the JSA flow processor to analyze.MaximumDataCapture/Packet
The IP address or host name of the time server.TimeSynchronizationServerIP Address
The length of time that you want the managed host to continue attempting to synchronize thetime before timing out.
The default is 15 minutes.
Time SynchronizationTimeout Period
Copyright © 2018, Juniper Networks, Inc.206
Juniper Secure Analytics Administration Guide

Table 50: Advanced JSA Flow Processor Parameters: (continued)
DescriptionParameter
The Endace network monitoring interface card parameters.Endace DAG Interface CardConfiguration
The amount of memory, in MB, that you want to reserve for flow storage.
The default is 400MB.
Flow Buffer Size
Themaximum number of flows you want to send from the JSA flow processor to an EventCollector.
MaximumNumber of Flows
The Yes option enables the JSA flow processor to remove duplicate flows.
The No option prevents the JSA flow processor from removing duplicate flows.
Remove duplicate flows
The Yes enables the JSA flow processor to check the incoming NetFlow sequence numbers toensure that all packets are present and in order.
A notification is displayed if a packet is missing or received out-of-order.
Verify NetFlow SequenceNumbers
Themethod that you want to use to remove duplicate external flow sources (de-duplication):
• The Source enables the JSA flow processor to compare originating flow sources.
This method compares the IP address of the device that exported the current external flowrecord to that of the IP address of the device that exported the first external record of theparticular flow. If the IP addresses do notmatch, the current external flow record is discarded.
• TheRecordoptionenables the JSA flowprocessor to compare individual external flow records.
This method logs a list of every external flow record that is detected by a particular deviceand compares each subsequent record to that list. If the current record is found in the list, thatrecord is discarded.
External FlowDe-duplication method
The number of seconds before the end of an interval that you want one-sided flows to be heldover until the next interval if the flow.
This setting allows time for the inverse side of the flow to arrive before it is reported.
Flow Carry-over Window
207Copyright © 2018, Juniper Networks, Inc.
Chapter 13: Deployment Editor

Table 50: Advanced JSA Flow Processor Parameters: (continued)
DescriptionParameter
• This parameter is only valid if you typed Record in the External Flow De-duplicationmethodparameter.
The external flow record fields that you want to use to remove duplicate flows include thefollowing options:
• D (direction)
• B (ByteCount)
• P (PacketCount)
You can combine these options. Possible combinations of the options include the followingcombinations:
• The DBP option uses direction, byte count, and packet count when it compares flow records.
• The XBP option uses byte count and packet count when it compares flow records.
• The DXP option uses direction and packet count when it compares flow records.
• The DBX option uses direction and byte count when it compares flow records.
• The DXX option uses direction when it compares flow records.
• The XBX option uses byte count when it compares records.
• The XXP option uses packet count when it compares records.
External flow recordcomparisonmask
The Yes option enables the JSA flow processor to create superflows from group flows that havesimilar properties.
The No option prevents the creation of superflows.
Create Superflows
The threshold for type A superflows.
A type A superflow is a group of flows from one host tomany hosts. This flow is a unidirectionalflow that is an aggregate of all flows that have different destination hosts, but the followingparameters are the same:
• Protocol
• Source bytes
• Source hosts
• Destination network
• Destination port (TCP and UDP flows only)
• TCP flags (TCP flows only)
• ICMP type, and code (ICMP flows only)
Type A Superflows
Copyright © 2018, Juniper Networks, Inc.208
Juniper Secure Analytics Administration Guide

Table 50: Advanced JSA Flow Processor Parameters: (continued)
DescriptionParameter
The threshold for type B superflows.
A type B superflow is group of flows frommany hosts to one host. This flow is unidirectionalflow that is an aggregate of all flows that have different source hosts, but the followingparameters are the same:
• Protocol
• Source bytes
• Source packets
• Destination host
• Source network
• Destination port (TCP and UDP flows only)
• TCP flags (TCP flows only)
• ICMP type, and code (ICMP flows only)
Type B Superflows
The threshold for type C superflows.
TypeCsuperflowsareagroupof flows fromonehost toanother host. This flow isaunidirectionalflow that is an aggregate of all non-ICMP flows have different source or destination ports, butthe following parameters are the same:
• Protocol
• Source host
• Destination host
• Source bytes
• Destination bytes
• Source packets
• Destination packets
Type C Superflows
In some networks, traffic is configured to take alternate paths for inbound and outbound traffic.This routing is called asymmetric routing. You can combine flows that are received from one ormore JSA flowprocessor.However, if youwant tocombine flows frommultiple JSA flowprocessorcomponents, youmust configure flow sources in the Asymmetric Flow Source Interface(s)parameter in the JSA flow processor configuration.
• The Yes option enables the JSA flow processor to recombine asymmetric flows.
• The No option prevents the JSA flow processor from recombining asymmetric flows.
Recombine AsymmetricSuperflows
The Yes option enables the JSA flow processor to create superflows while asymmetric flowsare enabled.
TheNooptionprevents the JSA flowprocessor fromcreating superflowswhile asymmetric flowsare enabled.
Ignore AsymmetricSuperflows
Theminimum amount of data, in bytes, that youwant the Endace networkmonitoring interfacecard to receive before the captured data is returned to the JSA flow processor process. If thisparameter is 0 and no data is available, the Endace network monitoring interface card allowsnon-blocking behavior.
Minimum Buffer Data
Themaximum amount of time, in microseconds, that you want the Endace networkmonitoringinterfacecard towait for theminimumamountofdata. Theminimumamountofdata is specifiedin theMinimumBuffer Data parameter.
MaximumWait Time
209Copyright © 2018, Juniper Networks, Inc.
Chapter 13: Deployment Editor

Table 50: Advanced JSA Flow Processor Parameters: (continued)
DescriptionParameter
The interval, in microseconds, that you want the Endace network monitoring interface card towait before it checks for more data. A polling interval avoids excessive polling traffic to the cardand, therefore, conserves bandwidth and processing time.
Polling Interval
6. Click Save.
7. Repeat for all JSA Flow Processor in your deployment you want to configure.
Use the deployment editor to configure a JSA flow processor.
Configuring an Event Collector
1. From either the Event View or SystemView page, select the Event Collector that you
want to configure.
2. Click Actions >Configure.
3. Enter values for the following parameters:
DescriptionParameter
Specifies the Event Processor component that is connected to this EventCollector. The connection is displayed in the following format: <Host IPAddress>:<Port>.
Destination Event Processor
The listen port for flows.Flow Listen Port
The Event Collector event forwarding port.Event Forwarding Listen Port
The Event Collector flow forwarding port.Flow Forwarding Listen Port
4. On the toolbar, click Advanced to display the advanced parameters.
5. Configure the advanced parameters, as necessary.
Table 51: Event Collector Advanced Parameters
DescriptionParameter
True specifies that the Event Collector is on a Console system.
False specifies that the Event Collector is on a non-Console system.
Primary Collector
Copyright © 2018, Juniper Networks, Inc.210
Juniper Secure Analytics Administration Guide

Table 51: Event Collector Advanced Parameters (continued)
DescriptionParameter
Yes enables the Event Collector to automatically analyze and accept traffic from previouslyunknown log sources. The appropriate firewall ports are opened to enable Autodetection toreceive events. This option is the default.
No prevents the Event Collector from automatically analyzing and accepting traffic frompreviously unknown log sources.
For more information, see theManaging Log Sources Guide.
Autodetection Enabled
The amount of time in seconds that flows are buffered before they are forwarded.Flow Deduplication Filter
The amount of time in seconds that asymmetric flow is buffered before they are forwarded.Asymmetric Flow Filter
True enables the Event Collector to forward events that was detected on the system.
False prevents the Event Collector from forwarding events that was detected on the system.This option prevents event-looping on your system.
Forward Events Already Seen
6. Click Save.
7. Repeat for all JSA Event Collectors in your deployment you want to configure.
Use the deployment editor to configure an Event Collector.
Configuring an Event Processor
1. From either the Event View or SystemView page, select the Event Processor that you
want to configure.
2. Click Actions >Configure.
3. Enter values for the parameters:
Table 52: Parameter Values for the Event Processor
DescriptionParameter
The port that the Event Processor monitors for incoming Event Collectorconnections. The default value is port 32005.
Event Collector Connections Listen Port
The port that the Event Processor monitors for incoming Event Processorconnections.
The default value is port 32007.
Event Processor Connections Listen Port
4. On the toolbar, click Advanced to display the advanced parameters.
211Copyright © 2018, Juniper Networks, Inc.
Chapter 13: Deployment Editor

5. Enter values for the parameters, as necessary.
Table 53: Event Processor Advanced Parameters
DescriptionParameter
The test rules list is available only for non-Console Event Processors. If a rule is configured to testlocally, the Globally option does not override the rule setting.
If you select Locally, rules are tested on the Event Processor and not shared with the system.
If you select Globally, individual rules for every Event Processor are shared and tested systemwide. Each rule can be toggled to Global for detection by any Event Processor on the system.
For example, you can create a rule to alert you when there are five failed login attempts within 5minutes.When theEventProcessor that contains the local rule observes five failed login attempts,the rule generates a response. If the rule in the example is set to Global, when five failed loginattempts within 5 minutes are detected on any Event Processor, the rule generates a response.When rules are shared globally, the rule can detect when one failed login attempt comes fromfive event processors.
Testing rules globally is the default for non-Console Event Processor with each rule on the EventProcessor set to test locally.
Test Rules
Type the events per second threshold that the Event Processor canmanage. Events over thisthreshold are placed in the cache.
Overflow Event RoutingThreshold
Type the flows per minute threshold that the Event Processor canmanage. Flows over thisthreshold are placed in the cache.
Overflow Flow RoutingThreshold
Type the location that you want to store events. The default is /store/ariel/events.Events database path
The location that you want to store payload information.
The default is /store/ariel/payloads.
Payloads database length
6. Click Save.
7. Repeat for all Event Processors in your deployment you want to configure.
Use the deployment editor to configure an Event Processor.
Configuring theMagistrate
1. From either the Event View or SystemView page, select the Magistrate that you want
to configure.
2. Click Actions >Configure.
3. On the toolbar, click Advanced to display the advanced parameters.
Copyright © 2018, Juniper Networks, Inc.212
Juniper Secure Analytics Administration Guide

4. In theOverflowRouting Threshold field, type the events per second threshold that the
Magistrate canmanage events.
Events over this threshold are placed in the cache.
The default is 20,000.
5. Click Save.
Use the deployment editor to configure a Magistrate component.
Configuring an Off-site Source
Toprevent connectionerrors,whenyouconfigureoff-site sourceand target components,
deploy the JSA Console with the off-site source first. Then deploy the JSA console with
the off-site target.
1. From either the Event View or SystemView page, select the Event Collector that you
want to configure.
2. Click Actions >Configure.
3. Enter the parameter values.
DescriptionParameter
True enables the system to receive events from the off-site source host.
False prevents the system from receiving events from the off-site source host.
Receive Events
True enables the system to receive flows from the off-site source host.
False prevents the system from receiving flows from the off-site source host.
Receive Flows
4. Click Save.
5. Repeat for all off-site sources in your deployment you want to configure.
Use the deployment editor to configure an off-site source.
Configuring an Off-site Target
Toprevent connectionerrors,whenyouconfigureoff-site sourceand target components,
deploy the JSA Console with the off-site source first. Then, deploy the JSA console with
the off-site target.
213Copyright © 2018, Juniper Networks, Inc.
Chapter 13: Deployment Editor

1. From either the Event View or SystemView page, select the Event Collector that you
want to configure.
2. Click Actions >Configure.
3. Enter values for the parameters:
DescriptionParameter
The Event Collector listen port for receiving event data.
The default port for events is 32004.
Event Collector Listen Port
The Event Collector listening port for receiving flow data.
The default port for flows is 32000.
Flow Collector Listen Port
4. Click Save.
Use the deployment editor to configure an off-site target.
RelatedDocumentation
• Saving Event Processor Data to a Data Node Appliance on page 194
• System ViewManagement on page 195
• NATManagement on page 202
Copyright © 2018, Juniper Networks, Inc.214
Juniper Secure Analytics Administration Guide

CHAPTER 14
Flow Sources Management
• Flow Sources Management on page 215
• Flow Sources on page 215
• Adding or Editing a Flow Source on page 220
• Enabling and Disabling a Flow Source on page 221
• Deleting a Flow Source on page 222
• Flow Source Aliases Management on page 222
Flow SourcesManagement
Use the Flow Sourceswindow tomanage the flow sources in your deployment.
You can add, edit, enable, disable, or delete flow sources.
Flow Sources
For JSA appliances, JSA automatically adds default flow sources for the physical ports
on the appliance. JSA also includes a default NetFlow flow source.
With JSA you can integrate flow sources.
Flow sources are classed as either internal or external:
Internal flow sources— Includes any additional hardware that is installed on amanaged
host, such as a network interface card (NIC). Depending on the hardware
configuration of your managed host, the internal flow sources might include the
following sources:
• Network interface card
External flow sources— Includes any external flow sources that send flows to the JSA
flow processor. If your JSA flow processor receives multiple flow sources, you can
assign each flow source a distinct name.When external flow data is received by the
same JSA flow processor, a distinct name helps to distinguish external flow source
data from each other.
External flow sources might include the following sources:
215Copyright © 2018, Juniper Networks, Inc.

• NetFlow
• IPFIX
• sFlow
• J-Flow
• PacketeerPacketeer
• Flowlog file
JSAcan forwardexternal flowssourcedatabyusing thespoofingornon-spoofingmethod:
Spoofing—Resends the inbound data that is received from flow sources to a secondary
destination. To ensure that flow source data is sent to a secondary destination,
configure theMonitoring Interface parameter in the flow source configuration to the
port onwhichdata is received (managementport).Whenyouuseaspecific interface,
the JSA flow processor uses a promiscuous mode capture to obtain flow source
data, rather than the default UDP listening port on port 2055. As a result, JSA flow
processor can capture flow source packets and forward the data.
Non-Spoofing—For the non-spoofing method, configure theMonitoring Interfaceparameter in the flow source configuration as <Any>. The JSA flow processor opens
the listeningport,which is theport that is configuredas theMonitoringPort to accept
flow source data. The data is processed and forwarded to another flow source
destination. The source IP address of the flow source data becomes the IP address
of the JSA system, not the original router that sent the data.
• NetFlow on page 216
• IPFIX on page 217
• SFlow on page 218
• J-Flow on page 218
• Packeteer on page 219
• Flowlog File on page 219
NetFlow
NetFlow is a proprietary accounting technology that is developed by Cisco Systems.
NetFlowmonitors traffic flows through a switch or router, interprets the client, server,
protocol, and port that is used, counts the number of bytes and packets, and sends that
data to a NetFlow collector.
The process of sending data from NetFlow is often referred to as a NetFlow Data Export
(NDE). You can configure JSA to accept NDEs and thus become aNetFlow collector. JSA
supports NetFlow versions 1, 5, 7, and 9. For more information on NetFlow, see the Cisco
web site (http://www.cisco.com).
While NetFlow expands the amount of the network that is monitored, NetFlow uses a
connection-less protocol (UDP) to deliver NDEs. After an NDE is sent from a switch or
router, the NetFlow record is purged. As UDP is used to send this information and does
Copyright © 2018, Juniper Networks, Inc.216
Juniper Secure Analytics Administration Guide

not guarantee the delivery of data, NetFlow records inaccurate recording and reduced
alerting capabilities. Inaccurate presentations of both traffic volumes and bidirectional
flowsmight result.
Whenyouconfigure anexternal flowsource forNetFlow, youmustdo the following tasks:
• Make sure that theappropriate firewall rules are configured. If you change yourExternal
Flow SourceMonitoring Port parameter in the JSA flow processor configuration, you
must also update your firewall access configuration.
• Make sure that the appropriate ports are configured for your Flow processor.
If youareusingNetFlowversion9,makesure that theNetFlowtemplate fromtheNetFlow
source includes the following fields:
• FIRST_SWITCHED
• LAST_SWITCHED
• PROTOCOL
• IPV4_SRC_ADDR
• IPV4_DST_ADDR
• L4_SRC_PORT
• L4_DST_PORT
• IN_BYTES or OUT_BYTES
• IN_PKTS or OUT_PKTS
• TCP_FLAGS (TCP flows only)
IPFIX
Internet Protocol Flow Information Export (IPFIX) is an accounting technology. IPFIX
monitors traffic flows through a switch or router, interprets the client, server, protocol,
and port that is used, counts the number of bytes and packets, and sends that data to
a IPFIX collector.
The process of sending IPFIX data is often referred to as a NetFlow Data Export (NDE).
IPFIX provides more flow information and deeper insight than NetFlow v9. You can
configure JSA to accept NDEs and thus become an IPFIX collector. IPFIX uses User
DatagramProtocol (UDP) todeliverNDEs. After anNDE is sent fromthe IPFIX forwarding
device, the IPFIX record might be purged.
To configure JSA to accept IPFIX flow traffic, you must add a NetFlow flow source. The
NetFlow flow source processes IPFIX flows by using the same process.
Your JSA systemmight include a default NetFlow flow source; therefore, youmight not
be required to configure a NetFlow flow source. To confirm that your system includes a
default NetFlow flow source, select Admin > Flow Sources. If default_Netflow is listed in
the flow source list, IPFIX is already configured.
217Copyright © 2018, Juniper Networks, Inc.
Chapter 14: Flow Sources Management

When you configure an external flow source for IPFIX, youmust do the following tasks:
• Ensure that the appropriate firewall rules are configured. If you change your External
Flow SourceMonitoring Port parameter in the JSA flow processor configuration, you
must also update your firewall access configuration. For more information about JSA
flow processor configuration, see the Juniper Secure Analytics Administration Guide.
• Ensure that the appropriate ports are configured for your JSA flow processor.
• Ensure the IPFIX template from the IPFIX source includes the following fields:
• FIRST_SWITCHED
• LAST_SWITCHED
• PROTOCOL
• IPV4_SRC_ADDR
• IPV4_DST_ADDR
• L4_SRC_PORT
• L4_DST_PORT
• IN_BYTES or OUT_BYTES
• IN_PKTS or OUT_PKTS
• TCP_FLAGS (TCP flows only)
SFlow
sFlow is a multi-vendor and user standard for sampling technology that provides
continuous monitoring of application level traffic flows on all interfaces simultaneously.
A sFlow combines interface counters and flow samples into sFlow datagrams that are
sent across the network to an sFlow collector. JSA supports sFlow versions 2, 4, and 5.
sFlow traffic is based on sampled data and, therefore, might not represent all network
traffic. For more information, see the sFlowwebsite (www.sflow.org).
sFlow uses a connection-less protocol (UDP).When data is sent from a switch or router,
thesFlowrecord ispurged.AsUDP isused tosend this informationanddoesnotguarantee
thedelivery of data, sFlow records inaccurate recording and reducedalerting capabilities.
Inaccurate presentations of both traffic volumes and bidirectional flowsmight result.
When you configure an external flow source for sFlow, youmust do the following tasks:
• Make sure that the appropriate firewall rules are configured.
• Make sure that the appropriate ports are configured for your JSA VFlow Collector.
J-Flow
A proprietary accounting technology used by Juniper Networks that allows you to collect
IP traffic flow statistics. J-Flow enables you to export data to a UDP port on a J-Flow
Copyright © 2018, Juniper Networks, Inc.218
Juniper Secure Analytics Administration Guide

collector. Using J-Flow, you can also enable J-Flow on a router or interface to collect
network statistics for specific locations on your network.
Note that J-Flow traffic is based on sampled data and, therefore, might not represent all
network traffic. For more information on J-Flow, see the Juniper Networks website
(www.juniper.net).
J-Flowuses a connection-less protocol (UDP).Whendata is sent froma switch or router,
the J-Flow record is purged. As UDP is used to send this information and does not
guarantee the delivery of data, J-Flow records inaccurate recording and reduced alerting
capabilities. This can result in inaccurate presentations of both traffic volumes and
bi-directional flows.
When you configure an external flow source for J-Flow, youmust:
• Make sure the appropriate firewall rules are configured.
• Make sure the appropriate ports are configured for your JSA flow processor.
Packeteer
Packeteer devices collect, aggregate, and store network performance data. After you
configure an external flow source for Packeteer, you can send flow information from a
Packeteer device to JSA.
Packeteer uses a connection-less protocol (UDP). When data is sent from a switch or
router, the Packeteer record is purged. As UDP is used to send this information and does
not guarantee the delivery of data, Packeteer records inaccurate recording and reduced
alerting capabilities. Inaccurate presentations of both traffic volumes and bidirectional
flowsmight occur.
To configure Packeteer as an external flow source, youmust do the following tasks:
• Make sure that the appropriate firewall rules are configured.
• Make sure that you configure Packeteer devices to export flow detail records and
configure the JSA flow processor as the destination for the data export.
• Make sure that the appropriate ports are configured for your JSA flow processor.
• Make sure the class IDs from the Packeteer devices can automatically be detected by
the JSA flow processor.
• For more information, see theMapping Packeteer Applications into JSA Technical Note.
Flowlog File
A Flowlog file is generated from the JSA flow logs.
219Copyright © 2018, Juniper Networks, Inc.
Chapter 14: Flow Sources Management

Adding or Editing a Flow Source
Use the Flow Sourcewindow to add a flow source.
1. Click the Admin tab.
2. On the navigation menu, click Data Sources.
3. On the navigation menu, click Flows.
4. Click Flow Sources.
5. Do one of the following actions:
• To add a flow source, click Add.
• To edit a flow source, select the flow source and click Edit.
6. To create this flow source from an existing flow source, select the Build from existing
flow source check box, and select a flow source from the Use as Template list.
7. Enter the name for the Flow Source Name.
TIP: If the external flow source is also a physical device, use the devicename as the flow source name. If the flow source is not a physical device,use a recognizable name.
For example, if you want to use IPFIX traffic, enter ipf1. If you want to use NetFlow
traffic, enter nf1.
8. Select a flow source from the Flow Source Type list and configure the properties.
• If you select the Flowlog File option, ensure that you configure the location of the
Flowlog file for the Source File Path parameter.
• If you select the JFlow, Netflow, Packeteer FDR, or sFlow options in the Flow Source
Type parameter, ensure that you configure an available port for theMonitoring Port
parameter.
The default port for the first NetFlow flow source that is configured in your network
is2055.ForeachadditionalNetFlowflowsource, thedefaultportnumber increments
by 1. For example, the default NetFlow flow source for the second NetFlow flow
source is 2056.
• If you select the Network Interface option, for the Flow Interface, configure only one
log source for each Ethernet interface.
Copyright © 2018, Juniper Networks, Inc.220
Juniper Secure Analytics Administration Guide

NOTE: You cannot send different flow types to the same port.
9. If traffic on your network is configured to take alternate paths for inbound and
outbound traffic, select the Enable Asymmetric Flows check box.
10. Click Save.
11. On the Admin tabmenu, click Deploy Changes.
RelatedDocumentation
Flow Source Aliases Management on page 222•
• Enabling and Disabling a Flow Source on page 221
• Deleting a Flow Source on page 222
Enabling and Disabling a Flow Source
Using the Flow Sourcewindow, you can enable or disable a flow source.
1. Click the Admin tab.
2. On the navigation menu, click Data Sources.
3. On the navigation menu, click Flows.
4. Click the Flow Sources icon.
5. Select the flow source that you want to enable or disable.
The Enabled column indicates whether the flow source is enabled or disabled.
The following statuses are displayed:
• True indicates that the flow source is enabled.
• False indicates that the flow source is now disabled.
6. Click Enable/Disable.
7. On the Admin tabmenu, click Deploy Changes.
RelatedDocumentation
Deleting a Flow Source on page 222•
• Flow Source Aliases Management on page 222
221Copyright © 2018, Juniper Networks, Inc.
Chapter 14: Flow Sources Management

Deleting a Flow Source
Use the Flow Sourcewindow to delete a flow source.
1. Click the Admin tab.
2. On the navigation menu, click Data Sources.
3. On the navigation menu, click Flows.
4. Click Flow Sources.
5. Select the flow source that you want to delete.
6. Click Delete.
7. ClickOK.
8. On the Admin tabmenu, click Deploy Changes.
RelatedDocumentation
Flow Source Aliases Management on page 222•
• Enabling and Disabling a Flow Source on page 221
Flow Source AliasesManagement
You can use the FlowSource Aliaswindow to configure virtual names, or aliases, for your
flow sources.
You can identify multiple sources that are sent to the same JSA flow processor by using
the source IP address and virtual name.With an alias, a JSA flow processor can uniquely
identify and process data sources that are sent to the same port.
When JSA flow processor receives traffic from a device that has an IP address but does
not have a current alias, the JSA flow processor attempts a reverse DNS lookup. The
lookup is used to determine the host name of the device. If the lookup is successful, the
JSA flow processor adds this information to the database and reports the information
to all JSA flow processor components in your deployment.
Use the deployment editor to configure the JSA flow processor to automatically detect
flow source aliases.
• Adding or a Flow Source Alias on page 223
• Deleting a Flow Source Alias on page 223
Copyright © 2018, Juniper Networks, Inc.222
Juniper Secure Analytics Administration Guide

RelatedDocumentation
Enabling and Disabling a Flow Source on page 221•
• Deleting a Flow Source on page 222
Adding or a Flow Source Alias
1. Click the Admin tab.
2. On the navigation menu, click Data Sources.
3. On the navigation menu, click Flows.
4. Click the Flow Source Aliases icon.
5. Do one of the following actions:
• To add a flow source alias, click Add and enter the values for the parameters.
• To edit an existing flow source alias, select the flow source alias, click Edit, and
update the parameters.
6. Click Save.
7. On the Admin tabmenu, click Deploy Changes.
Use the Flow Source Aliaswindow to add a flow source alias.
Deleting a Flow Source Alias
1. Click the Admin tab.
2. On the navigation menu, click Data Sources.
3. On the navigation menu, click Flows.
4. Click the Flow Source Aliases icon.
5. Select the flow source alias that you want to delete.
6. Click Delete.
7. ClickOK.
8. On the Admin tabmenu, click Deploy Changes.
223Copyright © 2018, Juniper Networks, Inc.
Chapter 14: Flow Sources Management

Use the Flow Source Aliaswindow to delete a flow source alias.
Copyright © 2018, Juniper Networks, Inc.224
Juniper Secure Analytics Administration Guide

CHAPTER 15
Remote Networks and ServicesConfiguration
• Remote Networks and Services Configuration on page 225
• Default Remote Network Groups on page 225
• Default Remote Service Groups on page 227
• Guidelines for Network Resources on page 228
• Managing Remote Networks Objects on page 228
• Managing Remote Services Objects on page 229
• QID Map Overview on page 230
Remote Networks and Services Configuration
Use remote network and service groups to represent traffic activity on your network for
aspecificprofile.Remotenetworksgroupsdisplayuser traffic thatoriginates fromnamed
remote networks.
All remote network and service groups have group levels and leaf object levels. You can
edit remote network and service groups by adding objects to existing groups or changing
preexisting properties to suit your environment.
If youmove an existing object to another group, the object namemoves from the existing
group to the newly selected group. However, when the configuration changes are
deployed, the object data that is stored in the database is lost and the object ceases to
function. To resolve this issue, create a new view and re-create the object that exists
with another group.
On the Admin tab, you can group remote networks and services for use in the custom
rules engine, flow, and event searches. You can also group networks and services in JSA
Risk Manager, if it is available.
Default Remote Network Groups
JSA includes default remote network groups.
The following table describes the default remote network groups.
225Copyright © 2018, Juniper Networks, Inc.

Table 54: Default Remote Network Groups
DescriptionGroup
Specifies traffic that originates from BOT applications.
For more information, see Botnet Command and Control drop rules on the Emerging Threatswebsite (http://rules.emergingthreats.net/blockrules/emerging-botcc.rules)
BOT
Specifies traffic that originates from unassigned IP addresses.
For more information, see bogon reference on the TeamCYMRUwebsite(http://www.team-cymru.org/Services/Bogons/bogon-bn-nonagg.txt).
Bogon
Specifies traffic that originates from known hostile networks.
HostileNets has a set of 20 (rank 1 - 20 inclusive) configurable CIDR ranges.
For more information, seeHostileNets reference on the DShield website(http://www.dshield.org/ipsascii.html?limit=20)
HostileNets
Specifies traffic that originates from nearby networks that your organization has network peeringagreements with.
This group is blank by default. Youmust configure this group to classify traffic that originates fromneighboring networks.
Neighbours
Specifies traffic that originates from smurf attacks.
A smurf attack is a type of denial-of-service attack that floods a destination systemwith spoofedbroadcast ping messages.
Smurfs
This group is non-configurable.
A superflow is a flow that is an aggregate of a number of flows that have a similar predetermined setof elements.
Superflows
Specifies traffic from trusted networks, including business partners that have remote access to yourcritical applications and services.
This group is blank by default.
Youmust configure this group to classify traffic that originates from trusted networks.
TrustedNetworks
Classifies traffic that originates from networks that you want to monitor.
This group is blank by default.
Watchlists
Groups and objects that include superflows are only for informational purposes and
cannotbeedited.Groupsandobjects that includebogonsareconfiguredby theautomatic
update function.
Copyright © 2018, Juniper Networks, Inc.226
Juniper Secure Analytics Administration Guide

NOTE: You can use reference sets instead of remote networks to providesome of this functionality. Although you can assign a confidence level to anIP value in a reference table, reference sets are used only with single IPs andcannot be used with CIDR ranges. You can use a CIDR value after a remotenetwork update, but not with weight or confidence levels.
RelatedDocumentation
Default Remote Service Groups on page 227•
• Guidelines for Network Resources on page 228
• Managing Remote Networks Objects on page 228
Default Remote Service Groups
JSA includes the default remote service groups.
The following table describes the default remote service groups.
Table 55: Default Remote Network Groups
DescriptionParameter
Specifies traffic that originates from addresses commonly known as chat servers.IRC_Servers
Specifies traffic that originates from addresses commonly known online services that mightinvolve data loss.
Online_Services
Specifies traffic that originates from addresses commonly known to contain explicitpornographic material.
Porn
Specifies traffic that originates from commonly known open proxy servers.Proxies
Specifies traffic that originates from reserved IP address ranges.Reserved_IP_ Ranges
Specifies traffic that originates from addresses commonly known to produce SPAM orunwanted email.
Spam
Specifies traffic that originates from addresses commonly known to contain spyware oradware.
Spy_Adware
Specifies traffic that originates from addresses commonly known to produce superflows.Superflows
Specifies traffic that originates fromaddresses commonly known tocontainpirated software.Warez
RelatedDocumentation
Guidelines for Network Resources on page 228•
• Managing Remote Networks Objects on page 228
227Copyright © 2018, Juniper Networks, Inc.
Chapter 15: Remote Networks and Services Configuration

• Managing Remote Services Objects on page 229
Guidelines for Network Resources
Given thecomplexities andnetwork resources that are required for JSA in large structured
networks, follow the suggested guidelines.
The following list describes some of the suggested practices that you can follow:
• Bundle objects and use the Network Activity and Log Activity tabs to analyze your
network data.
Fewer objects create less input and output to your disk.
• Typically, for standard system requirements, do not exceedmore than 200 objects
per group.
More objects might impact your processing power when you investigate your traffic.
RelatedDocumentation
Managing Remote Networks Objects on page 228•
• Managing Remote Services Objects on page 229
• QID Map Overview on page 230
Managing Remote Networks Objects
After you create remote network groups, you canaggregate flowandevent search results
on remote network groups. You can also create rules that test for activity on remote
network groups.
Use the Remote Networkswindow, you can add or edit a remote networks object.
1. Click the Admin tab.
2. On the navigation menu, click Remote Networks and Services Configuration.
3. Click the Remote Networks icon.
4. To add a remote networks object, click Add and enter values for the parameters.
5. To edit remote networks object, click the group that you want displayed, click Edit,
and then change the values.
6. Click Save.
7. Click Return.
Copyright © 2018, Juniper Networks, Inc.228
Juniper Secure Analytics Administration Guide

8. Close the Remote Networkswindow.
9. On the Admin tabmenu, click Deploy Changes.
RelatedDocumentation
Managing Remote Services Objects on page 229•
• QID Map Overview on page 230
• Guidelines for Network Resources on page 228
Managing Remote Services Objects
Remoteservicesgroupsorganize traffic thatoriginates fromuser-definednetwork ranges
or the Juniper Networks automatic update server. After you create remote service groups,
you can aggregate flow and event search results, and create rules that test for activity
on remote service groups.
Use the Remote Serviceswindow to add or edit a remote services object.
1. Click the Admin tab.
2. On the navigation menu, click Remote Networks and Services Configuration.
3. Click the Remote Services icon.
4. To add a remote services object, click Add and enter the parameter values.
5. To edit a remote services object, click the group that you want displayed, click the
Edit icon and change the values.
6. Click Save.
7. Click Return.
8. Close the Remote Serviceswindow.
9. On the Admin tabmenu, click Deploy Changes.
RelatedDocumentation
QID Map Overview on page 230•
• Guidelines for Network Resources on page 228
• Managing Remote Networks Objects on page 228
229Copyright © 2018, Juniper Networks, Inc.
Chapter 15: Remote Networks and Services Configuration

QIDMapOverview
Use the JSA Identifier (QID) map utility to create, export, import, or modify user-defined
QIDmap entries.
The QIDmap associates an event on an external device to a (QID).
See the following tasks for QIDmanagement:
• Creating a QID Map Entry on page 231
• Modifying a QID Map Entry on page 231
• Importing Qid Map Entries on page 232
• Exporting QID Map Entries on page 234
To run the utility, use the following syntax:
qidmap_cli.sh [-l|-c|-m|-i[-f <filename>]|-e[-f <filename>]|-d]
The following table describes the command-line options for the QIDmap utility.
Table 56: QIDMap Utility Options
DescriptionOptions
Lists the low-level category.-l
Creates a QIDmap entry-c
Modifies an existing user-defined QIDmap entry.-m
Imports QIDmap entries.-i
Exports existing user-defined QIDmap entries.-e
If you include the -i or -e option, specifies a file name to import or export QIDmap entries.-f <filename>
If you include the -i or -e option, specifies a delimiter for the import or export file. The defaultis a comma.
-d
Displays the help options.-h
• Creating a QID Map Entry on page 231
• Modifying a QID Map Entry on page 231
• Importing Qid Map Entries on page 232
• Exporting QID Map Entries on page 234
RelatedDocumentation
Guidelines for Network Resources on page 228•
Copyright © 2018, Juniper Networks, Inc.230
Juniper Secure Analytics Administration Guide

• Managing Remote Networks Objects on page 228
• Managing Remote Services Objects on page 229
Creating a QIDMap Entry
Create a JSA Identifier (QID) Map Entry to map an event of an external device to QID.
1. Using SSH, log in to JSA as the root user.
2. To locate the low-level category for the QIDmap entry that you want to create, type
the following command:
/opt/qradar/bin/qidmap_cli.sh -l
If youwant to search for aparticular low-level category, youcanuse thegrepcommand
to filter the results:
/opt/qradar/bin/qidmap_cli.sh -l | grep <text>
3. Type the following command:
qidmap_cli.sh -c --qname <name> --qdescription <description> --severity <severity> --lowlevelcategoryid <ID>
The following table describes the command-line options for the QIDmap utility:
DescriptionOptions
Creates a QIDmap entry.-c
The name that youwant to associate with this QIDmap entry.The name can be up to 255 characters in length.
If you include spaces in the name, enclose the name value indouble quotation marks.
--qname <name>
The description for this QIDmap entry. The description can beup to 2048 characters in length.
If you include spaces in thedescription, enclose thedescriptionvalue in double quotation marks.
--qdescription <description>
Theseverity level that youwant toassign to thisQIDmapentry.The valid range is 1 - 10.
--severity <severity>
The low-level category ID you want to assign to this QIDmapentry. For more information, see the Juniper Secure AnalyticsAdministration Guide.
--lowlevelcategoryid <ID>
Modifying a QIDMap Entry
Modify an existing user-defined JSA Identifier (QID) map entry.
231Copyright © 2018, Juniper Networks, Inc.
Chapter 15: Remote Networks and Services Configuration

1. Using SSH, log in to JSA as the root user.
2. Type the following command:
qidmap_cli.sh -m --qid<QID> --qname <name> --qdescription <description> --severity <severity>
The following table describes the command-line options for the QIDmap utility:
DescriptionOptions
Modifies an existing user-defined QIDmap entry.-m
The QID that you want to modify.--qid <QID>
The name that youwant to associate with this QIDmap entry.Thenamecanbeup to255characters in lengthwithnospaces.
--qname <name>
The description for this QIDmap entry. The description can beup to 2048 characters in length with no spaces.
--qdescription <description>
Theseverity level that youwant toassign to thisQIDmapentry.The valid range is 0 - 10.
--severity <severity>
Importing QidMap Entries
Using the JSA Identifier (QID)map utility, you can import QIDmap entries from a .txt file.
Copyright © 2018, Juniper Networks, Inc.232
Juniper Secure Analytics Administration Guide

1. Create a .txt file that includes the user-defined QIDmap entries that you want to
import. Ensure that each entry in the file is separated with a comma. Choose one of
the following options:
• If youwant to import a new list of user-definedQIDmap entries, create the file with
the following format for each entry:
<,<name>,<description>,<severity>,<category>>
• If youwant to import an existing list of user-definedQIDmap entries, create the file
with the following format for each entry:
<<qid>,<name>,<description>,<severity>>
The following table describes the command-line options of the QID utility.
DescriptionOptions
The existing QID for the entry. This option is required if youwant to import an existing exported list of QID entries.
To importnewQIDentries, donotuse thisoption.TheQIDmaputility assigns an identifier (QID) for each entry in the file.
<qid>
The name that youwant to associate with this QIDmap entry.Thenamecanbeup to255characters in lengthwithnospaces.
--qname <name>
The description for this QIDmap entry. The description can beup to 2048 characters in length with no spaces.
--qdescription <description>
Theseverity level that youwant toassign to thisQIDmapentry.The valid range is 0 - 10.
--severity <severity>
The low-level category ID that you want to assign to this QIDmap entry.
This option is only necessary if you want to import a new listof QID entries.
--lowlevelcategoryid <ID>
2. Save and close the file.
3. Using SSH, log in to JSA as the root user:
4. To import the QIDmap file, type the following command:
/opt/qradar/bin/qidmap_cli.sh -i -f <filename.txt>
The <filename.txt> option is the directory path and name of the file that contains the
QIDmap entries. If any of the entries in the file cause an error, no entries in the file are
enforced.
233Copyright © 2018, Juniper Networks, Inc.
Chapter 15: Remote Networks and Services Configuration

Exporting QIDMap Entries
View themappings between the events of external devices and their unique identifiers
by exporting your QID entries.
For QIDmap entries that you created, use the QIDmap utility to export the entries to a
.txt file.
For an entire QIDmap that includes the default systemQID entries, use theidlist.sh
command.
1. Using SSH, log in to JSA as the root user.
2. To export the QIDmap file of user-defined entries, type the following command:
/opt/qradar/bin/qidmap_cli.sh -e -f <filename.txt>
The <filename.txt> option is the directory path and name of the file that you want to
contain your QIDmap entries.
3. To export the entire QIDmap, type the following command:
/opt/qradar/bin/idlist.sh -e qid > <filename.txt>
4. To determine the last modified date of your QIDmap, run an SQL query.
For example, if a QID has the identification number 64250088, type the following
SQL query to retrieve its last modified date:
psql -Uqradar -c"selectqid,to_timestamp(serial/1000)asdatefromqidmap_serialwhere qid = 64250088;"
Copyright © 2018, Juniper Networks, Inc.234
Juniper Secure Analytics Administration Guide

CHAPTER 16
Server Discovery
• Server Discovery on page 235
• Discovering Servers on page 236
Server Discovery
TheServerDiscovery function uses theAsset Profile database to discover different server
types that are based on port definitions. Then, you can select the servers to add to a
server-type building block for rules.
The Server Discovery function is based on server-type building blocks. Ports are used to
define the server type. Thus, the server-type building block works as a port-based filter
when you search the Asset Profile database.
Formore information about building blocks, see the Juniper Secure Analytics Users Guide.
Use the Server Discovery function with JSA Vulnerability Manager to create exception
rules for benign vulnerabilities. Reduce the number of vulnerabilities that you see for the
following Server Types:
Table 57: Server Type Vulnerabilities
VulnerabilityServer Type
FTP Server PresentFTP Servers
DNS Server is RunningDNS Servers
SMTP Server DetectedMail Servers
Web Service is RunningWeb Servers
Formore information about false positive vulnerabilities, see the Juniper Secure Analytics
Vulnerability Manager User Guide.
235Copyright © 2018, Juniper Networks, Inc.

Discovering Servers
Use the Assets tab to discover servers on your network.
1. Click the Assets tab
2. On the navigation menu, click Server Discovery.
3. From the Server Type list, select the server type that you want to discover.
4. Select one of the following options to determine the servers you want to discover:
• To use the currently selected Server Type to search all servers in your deployment,
select All.
• To search servers in your deployment that were assigned to the currently selected
Server Type, select Assigned.
• To search servers in your deployment that are not assigned, select Unassigned.
5. From the Network list, select the network that you want to search.
6. Click Discover Servers.
7. In theMatching Servers table, select the check boxes of all servers you want to assign
to the server role.
8. Click Approve Selected Servers.
Copyright © 2018, Juniper Networks, Inc.236
Juniper Secure Analytics Administration Guide

CHAPTER 17
Domain Segmentation
• Domain Segmentation on page 237
• Overlapping IP Addresses on page 238
• Domain Definition and Tagging on page 238
• Creating Domains on page 240
• Domain Privileges That Are Derived from Security Profiles on page 242
• Domain-specific Rules and Offenses on page 244
• Example: Domain Privilege Assignments Based on Custom Properties on page 246
Domain Segmentation
Segmentingyournetwork intodifferentdomainshelps toensure that relevant information
is available only to those users that need it.
You can create security profiles to limit the information that is available to a group of
users within that domain. Security profiles provide authorized users access to only the
information that is required to complete their daily tasks. Youmodify only the security
profile of the affected users, and not each user individually.
You can also use domains to manage overlapping IP address ranges. This method is
helpful when you are using a shared JSA infrastructure to collect data frommultiple
networks. By creating domains that represent a particular address space on the network,
multiple devices that are in separate domains can have the same IP address and still be
treated as separate devices.
237Copyright © 2018, Juniper Networks, Inc.

Overlapping IP Addresses
An overlapping IP address is an IP address that is assigned to more than one device or
logical unit, such as an event source type, on a network. Overlapping IP address ranges
can cause significant problems for companies that merge networks after corporate
acquisitions, or for Managed Security Service Providers (MSSPs) who are bringing on
new clients.
JSAmust be able to differentiate events and flows that come from different devices and
that have the same IP address. If the same IP address is assigned tomore than one event
source, you can create domains to distinguish them.
For example, let's look at a situation where Company A acquires Company B and wants
to use a shared instance of JSA tomonitor the new company's assets. The acquisition
hasasimilar network structure that results in the same IPaddressbeingused fordifferent
log sources in each company. Log sources that have the same IPaddress causeproblems
with correlation, reporting, searching, and asset profiling.
To distinguish the origin of the events and flows that come in to JSA from the log source,
you can create twodomains and assign each log source to a different domain. If required,
you can also assign each event collector and flow collector to the same domain as the
log source that sends events to them.
To view the incoming events by domain, create a search and include the domain
information in the search results.
RelatedDocumentation
Domain Definition and Tagging on page 238•
• Creating Domains on page 240
• Domain Privileges That Are Derived from Security Profiles on page 242
Domain Definition and Tagging
Domains are defined based on JSA input sources.When events and flows come into JSA,
thedomaindefinitionsareevaluatedand theeventsand flowsare taggedwith thedomain
information.
Specifying Domains for Events
These are the ways to specify domains for events:
Event collectors—If an event collector is dedicated to a specific network segment or IPaddress range, you can flag that entire event collector as part of that domain.
All log sources that arrive at that event collector belong to the domain; therefore,
any new auto-detected log sources are automatically added to the domain.
Log sources—You can configure specific log sources to belong to a domain.
Copyright © 2018, Juniper Networks, Inc.238
Juniper Secure Analytics Administration Guide

This method of tagging domains is an option for deployments in which an event
collector can receive events frommultiple domains.
Log source groups—You can assign log source groups to a specific domain. This optionallows broader control over the log source configuration.
Any new log sources that are added to the log source group automatically get the
domain tagging that is associated with the log source group.
Custom properties—You can apply custom properties to the log messages that come
from a log source.
To determine which domain that specific log messages belong to, the value of the
customproperty is lookedupagainstamappingdefined in theDomainManagement
editor.
This option is used for multi-address-range or multi-tenant log sources, such as file
servers and document repositories.
Specifying Domains for Flows
These are the ways to specify domains for flows:
Flow processors—You can assign specific Flow processors to a domain.
All flow sources that arrive at that flow processor belong to the domain; therefore,
any new auto-detected flow sources are automatically added to the domain.
Flow sources—You can designate specific flow sources to a domain.
This option is useful when a single Flow processors is collecting flows frommultiple
network segments or routers that contain overlapping IP address ranges.
Specifying Domains for Scan Results
You can also assign vulnerability scanners to a specific domain so that scan results are
properly flagged as belonging to that domain. A domain definition can consist of all JSA
input sources.
For information about assigning your network to preconfigured domains, see “Network
Hierarchy” on page 97.
Precedence Order for Evaluating Domain Criteria
Whenevents and flows come into the JSA system, the domain criteria is evaluatedbased
on the granularity of the domain definition.
If the domain definition is based on an event, the incoming event is first checked for any
custom properties that are mapped to the domain definition. If the result of a regular
expression that is defined in a custom property does not match a domain mapping, the
event is automatically assigned to the default domain.
239Copyright © 2018, Juniper Networks, Inc.
Chapter 17: Domain Segmentation

If the event does not match the domain definition for custom properties, the following
order of precedence is applied:
1. Log source
2. Log source group
3. Event Collector
If the domain is defined based on a flow, the following order of precedence is applied:
1. Flow source
2. Flow Processor
If a scanner has an associated domain, all assets that are discovered by the scanner are
automatically assigned to the same domain as the scanner.
Forwarding Data to Another JSA System
Domain information is removed when data is forwarded to another JSA system. Events
and flows that contain domain information are automatically assigned to the default
domain on the receiving JSA system. To identify which events and flows are assigned to
the default domain, you can create a custom search on the receiving system. Youmight
want to reassign these events and flows to a user-defined domain.
RelatedDocumentation
Creating Domains on page 240•
• Domain Privileges That Are Derived from Security Profiles on page 242
• Domain-specific Rules and Offenses on page 244
Creating Domains
Use the DomainManagementwindow to create domains based on JSA input sources.
Use the following guidelines when you create domains:
• Everything that is not assigned to a user-defined domain is automatically assigned to
the default domain. Users who have limited domain access should not have
administrative privileges because this privilege grants unlimited access to all domains.
• Youcanmapthesamecustomproperty to twodifferentdomains, however thecapture
result must be different for each one.
• You cannot assign a log source, log source group, or event collector to two different
domains. When a log source group is assigned to a domain, each of the mapped
attributes is visible in the DomainManagementwindow.
Security profiles must be updated with an associated domain. Domain-level restrictions
are not applied until the security profiles are updated, and the changes deployed.
Copyright © 2018, Juniper Networks, Inc.240
Juniper Secure Analytics Administration Guide

1. Click the Admin tab.
2. On the navigation menu, click SystemConfiguration.
3. Click DomainManagement.
4. To add a domain, click Add and type a unique name and description for the domain.
TIP: You can check for unique names by typing the name in the Input
domain name search box.
5. Depending on the domain criteria to be defined, click the appropriate tab.
• To define the domain based on a custom property, log source group, log source, or
event collector, click the Events tab.
• To define the domain based on a flow source or flow collector, click the Flows tab.
• To define the domain based on a scanner, including JSA Vulnerability Manager
scanners, click the Scanners tab.
6. To assign a custom property to a domain, in the Capture Result box, type the text that
matches the result of the regular expression (regex) filter.
NOTE: Youmust select theOptimizeparsing for rules, reports, andsearches
check box in the Custom Event Propertieswindow to parse and store the
custom event property. Domain segmentationwill not occur if this optionis not checked.
7. From the list, select the domain criteria and click Add.
8. After you add the source items to the domain, click Create.
“CreatingaSecurityProfile” onpage45 todefinewhichusers haveaccess to thedomains.
After you create the first domain in your environment, youmust update the security
profiles for all non-administrative users to specify the domain assignment. In
domain-aware environments, non-administrative users whose security profile does not
specify a domain assignment will not see any log activity or network activity.
You can also use the Network Hierarchy tool to assign your network to preconfigured
domains. For more information, see “Network Hierarchy” on page 97.
RelatedDocumentation
Domain Privileges That Are Derived from Security Profiles on page 242•
• Domain-specific Rules and Offenses on page 244
241Copyright © 2018, Juniper Networks, Inc.
Chapter 17: Domain Segmentation

• Example: Domain Privilege Assignments Based on Custom Properties on page 246
Domain Privileges That Are Derived from Security Profiles
You can use security profiles to grant domain privileges and ensure that domain
restrictions are respected throughout the entire JSA system. Security profiles also make
it easier tomanage privileges for a large group of userswhen your business requirements
suddenly change.
Users can see only data within the domain boundaries that are set up for the security
profiles that are assigned to them. Security profiles include domains as one of the first
criteria that is evaluated to restrict access to the system.When a domain is assigned to
a security profile, it takespriority over other security permissions. After domain restrictions
are evaluated, individual security profiles are assessed to determine network and log
permissions for that particular profile.
For example, a user is given privileges to Domain_2 and access to network 10.0.0.0/8.
That user can see only events, offenses, assets, and flows that come from Domain_2
and contain an address from the 10.0.0.0/8 network.
As a JSA administrator, you can see all domains and you can assign domains to
non-administrative users. Do not assign administrative privileges to users whom you
want to limit to a particular domain.
Security profiles must be updated with an associated domain. Domain-level restrictions
are not applied until the security profiles are updated, and the changes are deployed.
When you assign domains to a security profile, you can grant access to the following
types of domains:
User-defined domains—You can create domains that are based on input sources byusing the Domain Management tool. For more information, see “Creating Domains”
on page 240.
Defaultdomain—Everything that isnotassignedtoauser-defineddomain isautomaticallyassigned to the default domain. The default domain contains system-wide events.
NOTE: Users who have access to the default domain can seesystem-wide events without restriction. Ensure that this access isacceptable before you assign default domain access to users. Alladministrators have access to the default domain.
Any log source that gets auto-discovered on a shared event collector (one that is
not explicitly assigned toadomain), is auto-discoveredon thedefault domain. These
log sources require manual intervention. To identify these log sources, youmust
periodically run a search in the default domain that is grouped by log source.
Copyright © 2018, Juniper Networks, Inc.242
Juniper Secure Analytics Administration Guide

All domains—Userswho are assigned to a security profile that has access toAll Domainscan see all active domains within the system, the default domain, and any domains
thatwere previously deleted across the entire system. They can also see all domains
that are created in the future.
If you delete a domain, it cannot be assigned to a security profile. If the user has the All
domains assignment, or if the domain was assigned to the user before it was deleted,
the deleted domain is returned in historical search results for events, flows, assets, and
offenses. You can't filter by deleted domains when you run a search.
Administrative users can see which domains are assigned to the security profiles on the
Summary tab in the DomainManagementwindow.
RuleModifications in Domain-aware Environments
Rules canbeviewed,modified, or disabledbyanyuserwhohasboth theMaintainCustom
Rules andViewCustomRules permissions, regardless ofwhich domain that user belongs
to.
NOTE: When you add the Log Activity capability to a user role, theMaintain
CustomRules andViewCustomRulespermissions are automatically granted.
Userswhohave thesepermissionshaveaccess toall logdata forall domains,and they can edit rules in all domains, even if their security profile settingshave domain-level restrictions. To prevent domain users from being able toaccess log data andmodify rules in other domains, edit the user role andremove theMaintain CustomRules and View CustomRules permissions.
Domain-aware Searches
You can use domains as search criteria in custom searches. Your security profile controls
which domains you can search against.
System-wide events and events that are not assigned to a user-defined domain are
automatically assigned to the default domain. Administrators, or users who have a
security profile that provides access to the default domain, can create a custom search
to see all events that are not assigned to a user-defined domain.
The default domain administrator can share a saved search with other domain users.
When the domain user runs that saved search, the results are limited to their domain.
RelatedDocumentation
Domain-specific Rules and Offenses on page 244•
• Example: Domain Privilege Assignments Based on Custom Properties on page 246
• Creating Domains on page 240
243Copyright © 2018, Juniper Networks, Inc.
Chapter 17: Domain Segmentation

Domain-specific Rules and Offenses
A rule can work in the context of a single domain or in the context of all domains.
Domain-aware rules provide the option of including the And Domain Is test.
You can restrict a rule so that it is applied only to events that are happening within a
specified domain. An event that has a domain tag that is different from the domain that
is set on the rule does not trigger an event response.
In an JSA system that does not have user-defined domains, a rule creates an offense and
keeps contributing to it each time the rule fires. In a domain-aware environment, a rule
creates a newoffense each time the rule is triggered in the context of a different domain.
Rules that work in the context of all domains are referred to as system-wide rules. To
create a system-wide rule that tests conditions across the entire system, select Any
Domain in the domain list for the And Domain Is test. An Any Domain rule creates an Any
Domain offense.
Single-domain rule—If the rule is a stateful rule, the states are maintained separatelyfor each domain. The rule is triggered separately for each domain. When the rule is
triggered, offenses are created separately for each domain that is involved and the
offenses are tagged with those domains.
Single-domain offense—The offense is tagged with the corresponding domain name.It can contain only events that are tagged with that domain.
System-wide rule—If the rule is a stateful rule, a single state is maintained for the wholesystem and domain tags are ignored. When the rule runs, it creates or contributes
to a single system-wide offense.
System-wide offense—The offense is tagged with Any Domain. It contains only eventsthat are tagged with all domains.
The following table provides examples of domain-aware rules. The examples use a
system that has three domains that are defined: Domain_A, Domain_B, and Domain_C.
Table 58: Domain-aware Rules
Rule responseExplanationDomain text
Creates or contributes to an offense thatis tagged with Domain_A.
Looks only at events that are tagged withDomain_Aand ignores rules thatare taggedwith other domains.
domain is one of: Domain_A
Creates or contributes to an offense thatis taggedwithDomain_A. A single state, anHTTP flow counter, gets maintained forDomain_A.
Looks only at events that are tagged withDomain_Aand ignores rules thatare taggedwith other domains.
domain is one of: Domain_A and astateful test that is defined aswhenHTTPflowisdetected10timeswithin1 minute
Copyright © 2018, Juniper Networks, Inc.244
Juniper Secure Analytics Administration Guide

Table 58: Domain-aware Rules (continued)
Rule responseExplanationDomain text
For data that is tagged with Domain_A, itcreates or contributes to a single domainoffense that is tagged with Domain_A.
For data that is tagged with Domain_B, itcreates or contributes to a single domainoffense that is tagged with Domain_B.
Looks only at events that are tagged withDomain_A and Domain_B and ignoresevents that are tagged with Domain_C.
This rule behaves as two independentinstances of a single domain rule, andcreates separate offenses for differentdomains.
domain is one of: Domain_A,Domain_B
When the rule detects 10 HTTP flows thatare taggedwithDomain_Awithin aminute,it creates or contributes to an offense thatis tagged with Domain_A.
When the rule detects 10 HTTP flows thatare taggedwithDomain_Bwithin aminute,it creates or contributes to an offense thatis tagged with Domain_B.
Looks only at events that are tagged withDomain_A and Domain_B and ignoresevents that are tagged with Domain_C.
This rule behaves as two independentinstances of a single domain rule, andmaintains twoseparate states (HTTP flowcounters) for two different domains.
domain is one of: Domain_A,Domain_B and a stateful test that isdefined aswhen HTTP flow isdetected 10 times within 1 minute
Each independent domain has offensesthat are generated for it, but offenses donot contain contributions from otherdomains.
Looks at events that are tagged with alldomains and creates or contributes tooffenses on a per-domain basis.
No domain test defined
Maintains separate states and createsseparate offenses for each domain.
Looks at events that are tagged withDomain_A, Domain_B, or Domain_C.
A rule has a stateful test that isdefined aswhen HTTP flow isdetected 10timeswithin 1minuteandno domain test is defined
Creates or contributes to a singlesystem-wide offense that is tagged withAny Domain.
Looks at all events, regardless of whichdomain it is tagged with.
domain is one of: Any Domain
Creates or contributes to a singlesystem-wide offense that is tagged withAny Domain.
For example, if it detects 3 events that aretagged with Domain_A, 3 events that aretagged with Domain_B, and 4 events thatare tagged with Domain_Cwithin 1 minute,it creates an offense because it detected10 events in total.
Looks at all events, regardless of whichdomain it is tagged with, and it maintainsa single state for all domains.
domain is one of: Any Domain and astateful test that is defined aswhenHTTPflowisdetected10timeswithin1 minute
When the domain test includes AnyDomain, any single domains that are listedare ignored.
Works the same as a rule that has domainis one of: Any Domain.
domain is one of: Any Domain,Domain_A
Whenyouviewtheoffense table, youcansort theoffensesbyclicking theDomaincolumn.
TheDefaultDomain is not included in thesort functionso itdoesnotappear inalphabetical
order. However, it appears at the top or bottomof theDomain list, depending onwhether
245Copyright © 2018, Juniper Networks, Inc.
Chapter 17: Domain Segmentation

the column is sorted in ascending or descending order. Any Domain does not appear in
the list of offenses.
RelatedDocumentation
Example: Domain Privilege Assignments Based on Custom Properties on page 246•
• Creating Domains on page 240
• Domain Privileges That Are Derived from Security Profiles on page 242
Example: Domain Privilege Assignments Based on CustomProperties
If your log files contain information that you want to use in a domain definition, you can
expose the information as a custom event property.
You assign a custom property to a domain based on the capture result. You can assign
thesamecustomproperty tomultipledomains, but thecapture resultsmustbedifferent.
For example, a custom event property, such as userID, might evaluate to a single user or
a list of users. Each user can belong to only one domain.
In the following diagram, the log sources contain user identification information that is
exposed as a custom property, userID. The event collector returns two user files, and
each user is assigned to only one domain. In this case, one user is assigned to Domain: 9
and the other user is assigned to Domain: 12.
Figure 1: Assigning Domains by Using Custom Event Property
If the capture results return a user that is not assigned to a specific user-defined domain,
that user is automatically assigned to the default domain. Default domain assignments
require manual intervention. Perform periodic searches to ensure that all entities in the
default domain are correctly assigned.
Copyright © 2018, Juniper Networks, Inc.246
Juniper Secure Analytics Administration Guide

NOTE: Before you use a custom property in a domain definition, ensure thatOptimize parsing for rules, reports, and searches is checked on the Custom
EventPropertieswindow. This option ensures that the customevent property
is parsed and stored when JSA receives the event for the first time. Domainsegmentation doesn't occur if this option is not checked.
RelatedDocumentation
• Creating Domains on page 240
• Domain Privileges That Are Derived from Security Profiles on page 242
• Domain-specific Rules and Offenses on page 244
247Copyright © 2018, Juniper Networks, Inc.
Chapter 17: Domain Segmentation

Copyright © 2018, Juniper Networks, Inc.248
Juniper Secure Analytics Administration Guide

CHAPTER 18
Multitenant Management
• Multitenant Management on page 249
• User Roles in a Multitenant Environment on page 249
• Domains and Log Sources in Multitenant Environments on page 250
• Provisioning a New Tenant on page 252
• Monitoring License Usage in Multitenant Deployments on page 252
• Rules Management in Multitenant Deployments on page 256
• Network Hierarchy Updates in a Multitenant Deployment on page 257
• Retention Policies for Tenants on page 258
Multitenant Management
Multitenant environments allowManaged Security Service Providers (MSSPs) and
multi-divisional organizations to provide security services tomultiple client organizations
from a single, shared JSA deployment. You don't have to deploy a unique JSA instance
for each customer.
In a multitenant deployment, you ensure that customers see only their data by creating
domains that are based on their JSA input sources. Then, use security profiles and user
roles to manage privileges for large groups of users within the domain. Security profiles
and user roles ensure that users have access to only the information that they are
authorized to see.
User Roles in aMultitenant Environment
Multitenant environments include a service provider andmultiple tenants. Each role has
distinct responsibilities and associated activities.
Service Provider
The service provider owns the system andmanages its use by multiple tenants. The
service provider can see data across all tenants. The Managed Security Service Provider
(MSSP) administrator is typically responsible for the following activities:
• Administers andmonitors the system health of the JSA deployment.
• Provisions new tenants.
249Copyright © 2018, Juniper Networks, Inc.

• Creates roles and security profiles for tenant administrators and users.
• Secures the system against unauthorized access.
• Creates domains to isolate tenant data.
• Deploys changes that the tenant administrator made in the tenant environment.
• Monitors JSA licenses.
• Collaborates with the tenant administrator.
Tenants
Each tenancy includesa tenantadministrator and tenantusers. The tenantadministrator
can be an employee of the tenant organization, or the service provider can administer
the tenant on behalf of the customer.
The tenant administrator is responsible for the following activities:
• Configures “Network Hierarchy” on page 97 definitions within their own tenancy.
• Configures andmanages tenant data.
• Views log sources.Canedit the log source tocoalescedataandcandisable log sources.
• Collaborates with the MSSP administrator.
The tenant administrator can configure tenant-specific deployments, but they can't
access or change the configuration for another tenant. They must contact the MSSP
administrator to deploy changes in the JSA environment, including network hierarchy
changes within their own tenant.
Tenant users have no administrative privileges and can see only the data that they have
access to. For example, a user can have privileges to view data from only 1 log source
within a domain that has multiple log sources.
RelatedDocumentation
Domains and Log Sources in Multitenant Environments on page 250•
• Provisioning a New Tenant on page 252
• Monitoring License Usage in Multitenant Deployments on page 252
Domains and Log Sources in Multitenant Environments
Use domains to separate overlapping IP addresses, and to assign sources of data, such
as events and flows, into tenant-specific data sets.
When events or flows come into JSA, JSA evaluates the domain definitions that are
configured, and the events and flows are assigned to a domain. A tenant can havemore
than one domain. If no domains are configured, the events and flows are assigned to the
default domain.
Copyright © 2018, Juniper Networks, Inc.250
Juniper Secure Analytics Administration Guide

Domain Segmentation
Domains are virtual buckets that you use to segregate data based on the source of the
data. They are the building blocks for multitenant environments. You configure domains
from the following input sources:
• Event and flow processors
• Flow sources
• Log sources and log source groups
• Custom properties
• Scanners
Amultitenant deploymentmight consist of a basic hardware configuration that includes
one JSA Console, one centralized event processor, and then one event collector for each
customer. In this configuration, you define domains at the collector level, which then
automatically assigns the data that is received by JSA to a domain.
To consolidate the hardware configuration even further, you can use one collector for
multiple customers. If log or flow sources are aggregated by the same collector but
belong to different tenants, you can assign the sources to different domains. When you
use domain definitions at the log source level, each log source namemust be unique
across the entire JSA deployment.
If you need to separate data from a single log source and assign it to different domains,
you can configure domains from custom properties. JSA looks for the custom property
in the payload, and assigns it to the correct domain. For example, if you configured JSA
to integratewithaCheckPointProvider-1 device, youcanusecustomproperties toassign
the data from that log source to different domains.
Automatic Log Source Detection
When domains are defined at the collector level and the dedicated event collector is
assigned toasingledomain, new logsources thatareautomaticallydetectedareassigned
to that domain. For example, all log sources that are detected on Event_Collector_1 are
assigned to Domain_A. All log sources that are automatically collected on
Event_Collector_2 are assigned to Domain_B.
When domains are defined at the log source or custom property level, log sources that
are automatically detected and are not already assigned to a domain are automatically
assigned to the default domain. The MSSP administrator must review the log sources in
the default domain and allocate them to the correct client domains. In a multitenant
environment, assigning log sources to a specific domain prevents data leakage and
enforces data separation across domains.
RelatedDocumentation
Provisioning a New Tenant on page 252•
• Monitoring License Usage in Multitenant Deployments on page 252
• Rules Management in Multitenant Deployments on page 256
251Copyright © 2018, Juniper Networks, Inc.
Chapter 18: Multitenant Management

Provisioning a New Tenant
As a Managed Security Services Provider (MSSP) administrator, you are using a single
instance of JSA to provide multiple customers with a unified architecture for threat
detection and prioritization.
In this scenario, you are onboarding a new client. You provision a new tenant and create
a tenant administrator account that does limited administrative duties within their own
tenant. You limit the access of the tenant administrator so that they can't see or edit
information in other tenants.
Before you provision a new tenant, youmust create the data sources, such as log sources
or flow processors, for the customer and assign them to a domain.
Complete the following tasks by using the tools on the Admin tab to provision the new
tenant in JSA:
1. To create the tenant, click Tenant Management.
For information about setting events per second (EPS) and flows per minute (FPM)
limits for each tenant, see “Monitoring License Usage in Multitenant Deployments”
on page 252.
2. To assign domains to the tenant, click DomainManagement.
3. To create the tenant administrator role and grant the Delegated Administration
permissions, click User Roles.
In amultitenant environment, tenant userswithDelegatedadministrationpermissions
can see only data for their own tenant environment. If you assign other administrative
permissions thatarenotpart ofDelegatedAdministration, access is no longer restricted
to that domain.
4. To create the tenant security profiles and restrict data access by specifying the tenant
domains, click Security Profiles.
5. To create the tenant users and assign the user role, security profile, and tenant, click
Users.
RelatedDocumentation
Monitoring License Usage in Multitenant Deployments on page 252•
• Rules Management in Multitenant Deployments on page 256
• Network Hierarchy Updates in a Multitenant Deployment on page 257
Monitoring License Usage in Multitenant Deployments
As the Managed Security Service Provider (MSSP) administrator, you monitor the event
and flow rates across the entire JSA deployment.
Copyright © 2018, Juniper Networks, Inc.252
Juniper Secure Analytics Administration Guide

When you create a tenant, you can set limits for both events per second (EPS) and flows
perminute (FPM). By setting EPSandFPM limits for each tenant, you canbettermanage
license capacities acrossmultiple clients. If you have aprocessor that is collecting events
or flows for a single customer, you do not need to assign tenant EPS and FPM limits. If
you have a single processor that collects events or flows formultiple customers, you can
set EPS and FPM limits for each tenant.
If you set the EPS and FPM limits to values that exceed the limits of either your software
licenses or the appliance hardware, the system automatically throttles the events and
flows for that tenant to ensure that the limits are not exceeded. If you do not set EPS
and FPM limits for tenants, each tenant receives events and flows until either the license
limits or the appliance limits are reached. The licensing limits are applied to themanaged
host. If you regularly exceed the license limitations, you can get a different license that
is more suitable for your deployment.
• Viewing the Cumulative License Limits in Your Deployment on page 253
• Viewing EPS Rates Per Log Source on page 253
• Viewing EPS Rates Per Domain on page 254
• Viewing Individual License Limits in Your Deployment on page 254
• Viewing the EPS Rate for an Individual Log Source on page 254
• Viewing the EPS Rate for an Individual Domain on page 255
• Detecting Dropped Events and Flows on page 255
Viewing the Cumulative License Limits in Your Deployment
The EPS and FPM rates that you set for each tenant are not automatically validated
against your license entitlements. To see the cumulative limits for the software licenses
that are applied to the system as compared to the appliance hardware limits, do these
steps:
1. On the Admin tab, click SystemConfiguration >System and LicenseManagement.
2. Expand Deployment Details and hover your mouse pointer over Event Limit or Flow
Limit.
Viewing EPS Rates Per Log Source
Use the Advanced Search field to enter an Ariel Query Language (AQL) query to view the
EPS rates for log sources.
1. On the Log Activity tab, select Advanced Search from the list on the Search toolbar.
2. To view the EPS per log source, type the following AQL query in the Advanced Search
field:
select logsourcename(logsourceid) as LogSource, sum(eventcount) / ( ( max(endTime) - min(startTime) ) / 1000 ) as EPS from eventsgroup by logsourceid order by EPS desc last 24 hours
The date values for (endTime and (startTime)must be represented in milliseconds
since the UNIX Epoch January 1st 1970.
253Copyright © 2018, Juniper Networks, Inc.
Chapter 18: Multitenant Management

Viewing EPS Rates Per Domain
Use the Advanced Search field to enter an Ariel Query Language (AQL) query to view the
EPS rates for domains.
1. On the Log Activity tab, select Advanced Search from the drop-down list box on the
Search toolbar.
2. To view the EPS per domain, type the following AQL query in the Advanced Search
field:
select DOMAINNAME(domainid) as LogSource, sum(eventcount) / ( ( max(endTime) - min(startTime)) / 1000 ) as EPS from eventsgroup by domainid order by EPS desc last 24 hours
The date values for (endTime and (startTime)must be represented inmilliseconds since
the UNIX Epoch January 1st 1970.
If you want to view average EPS rates for log sources only, click Log Sources in the Data
Sources pane on the Admin tab. You can use this to quickly identify configuration issues
with log sources that are failing to report.
Viewing Individual License Limits in Your Deployment
The EPS and FPM rates that you set for each tenant are not automatically validated
against your license entitlements. To see the individual limits for the software licenses
that are applied to the system as compared to the appliance hardware limits, do these
steps:
1. On the Admin tab, click SystemConfiguration >System and LicenseManagement.
2. Expand Deployment Details and hover your mouse over Event Limit or Flow Limit.
Viewing the EPS Rate for an Individual Log Source
Use the Advanced Search field to enter an Ariel Query Language (AQL) query to view the
EPS rate for an individual log source.
1. Use a PSQL query to get a log source ID.
1. Use SSH to log in to JSA as an administrator.
2. Access PSQL by using the following command:
psql -U qradar
3. Get a list of log source names and IDs by using the following command:
select id,devicename from sensordevice;
4. Select a log source ID from the list.
2. On the Log Activity tab, select Advanced Search from the list on the Search toolbar.
3. To view the EPS rate for your selected log source, type the following AQL query in the
Advanced Search field:
Copyright © 2018, Juniper Networks, Inc.254
Juniper Secure Analytics Administration Guide
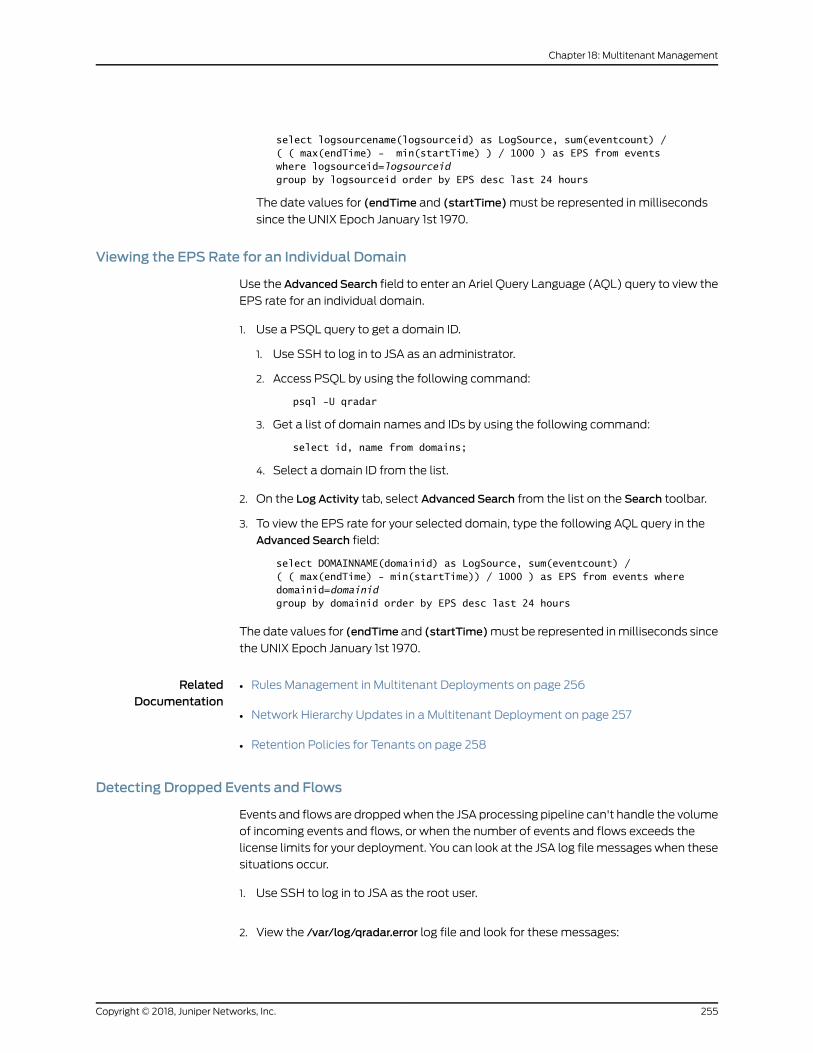
select logsourcename(logsourceid) as LogSource, sum(eventcount) /( ( max(endTime) - min(startTime) ) / 1000 ) as EPS from events where logsourceid=logsourceidgroup by logsourceid order by EPS desc last 24 hours
The date values for (endTime and (startTime)must be represented in milliseconds
since the UNIX Epoch January 1st 1970.
Viewing the EPS Rate for an Individual Domain
Use the Advanced Search field to enter an Ariel Query Language (AQL) query to view the
EPS rate for an individual domain.
1. Use a PSQL query to get a domain ID.
1. Use SSH to log in to JSA as an administrator.
2. Access PSQL by using the following command:
psql -U qradar
3. Get a list of domain names and IDs by using the following command:
select id, name from domains;
4. Select a domain ID from the list.
2. On the Log Activity tab, select Advanced Search from the list on the Search toolbar.
3. To view the EPS rate for your selected domain, type the following AQL query in the
Advanced Search field:
select DOMAINNAME(domainid) as LogSource, sum(eventcount) / ( ( max(endTime) - min(startTime)) / 1000 ) as EPS from events where domainid=domainidgroup by domainid order by EPS desc last 24 hours
The date values for (endTime and (startTime)must be represented inmilliseconds since
the UNIX Epoch January 1st 1970.
RelatedDocumentation
Rules Management in Multitenant Deployments on page 256•
• Network Hierarchy Updates in a Multitenant Deployment on page 257
• Retention Policies for Tenants on page 258
Detecting Dropped Events and Flows
Events and flows are droppedwhen the JSAprocessing pipeline can't handle the volume
of incoming events and flows, or when the number of events and flows exceeds the
license limits for your deployment. You can look at the JSA log filemessages when these
situations occur.
1. Use SSH to log in to JSA as the root user.
2. View the /var/log/qradar.error log file and look for these messages:
255Copyright © 2018, Juniper Networks, Inc.
Chapter 18: Multitenant Management

Thesemessages indicate that events or flows were dropped:
[Tenant:[tenantID]:[tenantName] Event droppedwhile attempting to add to Tenant
Event Throttle queue. The Tenant Event Throttle queue is full.
[Tenant:[tenantID]:[tenantName] Flow droppedwhile attempting to add to Tenant
Flow Throttle queue. The Tenant Flow Throttle queue is full.
Thesemessages indicate that the processing pipeline was near capacity:
Throttle processor cannot keep upwith events.
TENANT_QUEUE_THREAD_INTERVAL_IN_MILLISEC is probably too short.
Throttle processor cannot keep upwith flows.
TENANT_QUEUE_THREAD_INTERVAL_IN_MILLISEC is probably too short.
If this warning persists, JSAmight drop events or flows.
If your system is dropping events and flows, you can expand your license to handlemore
data or you can set more restrictive EPS and FPM limits for each tenant.
Rules Management in Multitenant Deployments
In a multitenant environment, youmust customize rules to make them tenant-aware.
Tenant-aware rules use thewhen the domain is one of the following rule test, but the
domain modifier determines the scope of the rule.
The following table shows how you can use the domainmodifier to change the scope of
rules in a multitenant deployment.
Table 59: Scope Of Rules in aMultitenant Environment
Rule test exampleDescriptionRule scope
andwhen the domain is one of the following:manufacturing
These rules includeonly 1domainmodifier.Single domain rules
andwhen the domain is one of the following:manufacturing, finance, legal
These rules include all the domains thatare assigned to the tenant. Use singletenant rules to correlate events acrossmultiple domains within a single tenant.
Single tenant rules
andwhenthedomain isoneof the following:AnydomainThese rules use the Any domainmodifierand run across all tenants.
Global rules
By being domain-aware, the custom rules engine (CRE) automatically isolates event
correlations fromdifferent tenantsbyusing their respectivedomains. Formore information
about working with rules in a domain-segmented network, see “Domain Segmentation”
on page 237.
• Restricting Log Activity Capabilities for Tenant Users on page 257
Copyright © 2018, Juniper Networks, Inc.256
Juniper Secure Analytics Administration Guide

RelatedDocumentation
Network Hierarchy Updates in a Multitenant Deployment on page 257•
• Retention Policies for Tenants on page 258
• Monitoring License Usage in Multitenant Deployments on page 252
Restricting Log Activity Capabilities for Tenant Users
To ensure that the tenant administrator and users can view the log data for only their
tenant, youmust restrict the permissions for the Log Activity capability.
When you add the Log Activity capability to a user role, theMaintain CustomRules and
View CustomRules permissions are automatically granted. Users who have these
permissions haveaccess toall logdata for all domains. They canedit rules in all domains,
even if their security profile settings have domain-level restrictions.
To prevent users from being able to access log data andmodify rules in other domains
or tenants, edit the user role and remove theMaintain CustomRules and View Custom
Rulespermissions.Without thesepermissions, the tenantadministrator andusers cannot
change rules, including those rules in their own domain.
1. Click the Admin tab.
2. On the navigation menu, click SystemConfiguration.
3. Click User Roles and select the user role that you want to edit.
4. Under Log Activity, clear theMaintain CustomRules and View CustomRules check
boxes.
5. Click Save.
Network Hierarchy Updates in aMultitenant Deployment
Tenant administrators who have the Define network hierarchy permission can change
the network hierarchy within their own tenant, but to deploy the changes, they must
contact the Managed Security Service Provider (MSSP) administrator. The MSSP
administrators can plan the deployment during a scheduled outage, and notify all tenant
administrators in advance.
JSA uses the network hierarchy to understand and analyze the network traffic in your
environment.
Network hierarchy changes require a full configuration deployment to apply the updates
in the JSA environment. Full configuration deployments restart all JSA services, and data
collection for events and flows stops until the deployment completes.
257Copyright © 2018, Juniper Networks, Inc.
Chapter 18: Multitenant Management

In amultitenant environment, the network object namemust be unique across the entire
deployment. You cannot use network objects that have the same name, even if they are
assigned to different domains.
RelatedDocumentation
Retention Policies for Tenants on page 258•
• Monitoring License Usage in Multitenant Deployments on page 252
• Rules Management in Multitenant Deployments on page 256
Retention Policies for Tenants
You can configure up to 10 retention buckets for shared data, and up to 10 retention
buckets for each tenant. Until you configure a retention bucket, all events or flows are
stored in the default retention bucket for each tenant.
If your JSA deployment has more than 10 tenants, you can configure a shared data
retention policy and use the domain filter to create a domain-based retention policy for
each of the domains within the tenant. Adding the domains specifies that the policy
applies only to the data for that tenant.
Formore information about creating retention policies, see “DataRetention” on page 127.
RelatedDocumentation
• Monitoring License Usage in Multitenant Deployments on page 252
• Rules Management in Multitenant Deployments on page 256
• Network Hierarchy Updates in a Multitenant Deployment on page 257
Copyright © 2018, Juniper Networks, Inc.258
Juniper Secure Analytics Administration Guide

CHAPTER 19
Asset Management
• Asset Management on page 259
• Sources Of Asset Data on page 259
• Incoming Asset DataWorkflow on page 260
• Updates to Asset Data on page 262
• Identification Of Asset Growth Deviations on page 264
• Prevention Of Asset Growth Deviations on page 268
• Clean Up Asset Data After Growth Deviations on page 279
Asset Management
The Assets tab in JSA provides a unified view of the known information about the assets
in your network. As JSA discoversmore information, the systemupdates the asset profile
and incrementally builds a complete picture about the asset.
Asset profiles are built dynamically from identity information that is passively absorbed
from event or flow data, or from data that JSA actively looks for during a vulnerability
scan. You can also import asset data or edit the asset profile manually. For more
information, see the topics Importing Asset Profiles and Adding or editing an asset profile
in the Juniper Secure Analytics Users Guide.
NOTE: LogManager tracks only asset data if JSA Vulnerability Manager isinstalled. For more information about the differences between JSA and LogManager, see “Capabilities in Your Security Intelligence Product” on page 29.
Sources Of Asset Data
Asset data is written to the asset database incrementally, usually 2 or 3 pieces of data
at a time. With exception of updates from network vulnerability scanners, each asset
update contains information about only one asset at a time.
Asset data usually comes from one of the following asset data sources:
Events—Event payloads, such as those created byDHCPor authentication servers, oftencontain user logins, IP addresses, host names, MAC addresses, and other asset
259Copyright © 2018, Juniper Networks, Inc.

information. This data is immediately provided to the asset database to help
determine which asset the asset update applies to.
Events are the primary cause for asset growth deviations.
Flows—Flowpayloads contain communication information such as IP address, port, and
protocol that is collected over regular, configurable intervals. At the end of each
interval, the data is provided to the asset database, one IP address at a time.
Because asset data from flows is paired with an asset based on a single identifier,
the IP address, flow data is never the cause of asset growth deviations.
Vulnerability scanners—JSA integrates with both Juniper Networks and third-partyvulnerability scanners that canprovideassetdata suchasoperating system, installed
software, and patch information. The type of data varies from scanner to scanner
and can vary from scan to scan. As new assets, port information, and vulnerabilities
are discovered, data is brought into the asset profile based on the CIDR ranges that
are defined in the scan.
It is possible for scanners to introduce asset growth deviations but it is rare.
User interface—Users who have the Assets role can import or provide asset informationdirectly to the asset database. Asset updates that are provided directly by a user are
for a specific asset. Therefore the asset reconciliation stage is bypassed.
Asset updates that are provided by users do not introduce asset growth deviations.
Domain-aware Asset Data
When an asset data source is configured with domain information, all asset data that
comes from that data source is automatically tagged with the same domain. Because
the data in the asset model is domain-aware, the domain information is applied to all
JSA components, including identities, offenses, asset profiles, and server discovery.
When you view the asset profile, some fields might be blank. Blank fields exist when the
system did not receive this information in an asset update, or the information exceeded
the asset retention period. The default retention period is 120 days. An IP address that
appears as 0.0.0.0 indicates that the asset does not contain IP address information.
RelatedDocumentation
Incoming Asset DataWorkflow on page 260•
• Updates to Asset Data on page 262
• Identification Of Asset Growth Deviations on page 264
Incoming Asset DataWorkflow
JSA uses identity information in an event payload to determine whether to create a new
asset or update an existing asset.
Copyright © 2018, Juniper Networks, Inc.260
Juniper Secure Analytics Administration Guide

Figure 2: Asset DataWorkflow Diagram
StartInput:
asset updateCreate empty list ofpotential matches
Is DNSname in thedatabase?
Output:target asset
Correlatematches intosingle target
asset
End
Does updatecontain MAC
address?
Is IPaddress in the
database?
Is potentialmatches
list empty?
No No No No
Create new asset
Yes
No
No
Yes
Add matchingasset to potential
matches list
Does updatecontain IPaddress?
No
Yes
Does updatecontain DNS
name?
Add matchingasset to potential
matches list
Yes
No
Add matchingasset to potential
matches list
Is NetBIOSname in thedatabase?
Does updatecontain NetBIOS
name?
No
Yes
Yes
Is MACaddress in the
database?
Add matchingasset to potential
matches list
Yes Yes Yes
1. JSA receives the event. The asset profiler examines the event payload for identity
information.
2. If the identity information includes a MAC address, a NetBIOS host name, or a DNS
host name that are already associated with an asset in the asset database, then that
asset is updated with any new information.
261Copyright © 2018, Juniper Networks, Inc.
Chapter 19: Asset Management

3. If the only available identity information is an IP address, the system reconciles the
update to the existing asset that has the same IP address.
4. If an asset update has an IP address that matches an existing asset but the other
identity information does not match, the system uses other information to rule out a
false-positive match before the existing asset is updated.
5. If the identity information does not match an existing asset in the database, then a
new asset is created based on the information in the event payload.
RelatedDocumentation
Updates to Asset Data on page 262•
• Identification Of Asset Growth Deviations on page 264
• Prevention Of Asset Growth Deviations on page 268
Updates to Asset Data
Each asset update must contain trusted information about a single asset. When JSA
receivesanassetupdate, the systemdetermineswhichasset towhich theupdateapplies.
Asset reconciliation is theprocessofdetermining the relationshipbetweenassetupdates
and the relatedasset in the asset database. Asset reconciliation occurs after JSA receives
the update but before the information is written to the asset database.
• Identity Information on page 262
• Asset Reconciliation Exclusion Rules on page 263
• Asset Merging on page 264
Identity Information
Every asset must contain at least one piece of identity data. Subsequent updates that
contain one or more pieces of that same identity data are reconciled with the asset that
owns that data. Updates that are based on IP addresses are handled carefully to avoid
false-positive asset matches. False positive asset matches occur when one physical
asset is assignedownership of an IP address thatwaspreviously ownedby another asset
in the system.
Whenmultiple pieces of identity data are provided, the asset profiler prioritizes the
information from themost deterministic to the least in the following order:
• MAC address
• NetBIOS host name
• DNS host name
• IP address
MAC addresses, NetBIOS host names, and DNS host names are unique and therefore
are considered as definitive identity data. Incoming updates thatmatch an existing asset
Copyright © 2018, Juniper Networks, Inc.262
Juniper Secure Analytics Administration Guide

only by the IP address are handled differently than updates that matchmore definitive
identity data.
RelatedDocumentation
Identification Of Asset Growth Deviations on page 264•
• Prevention Of Asset Growth Deviations on page 268
• Clean Up Asset Data After Growth Deviations on page 279
Asset Reconciliation Exclusion Rules
By default, each piece of asset data is tracked over a two-hour period. If any one piece
of identity data in the asset update exhibits suspicious behavior twoormore timeswithin
2 hours, that piece of data is added to the asset blacklists. Each type of identity asset
data that is tested results in a new blacklist.
Indomain-awareenvironments, theasset reconciliationexclusion rules track thebehavior
of asset data separately for each domain.
The asset reconciliation exclusion rules test the following scenarios:
Table 60: Rule Tests and Responses
Rule responseScenario
Add theMAC address to the Asset Reconciliation DomainMAC blacklist
When a MAC address is associated to three or more different IPaddresses in 2 hours or less
Add the DNS host name to the Asset ReconciliationDomain DNS blacklist
When a DNS host name is associated to three or more different IPaddresses in 2 hours or less
Add the NetBIOS host name to the Asset ReconciliationDomain NetBIOS blacklist
WhenaNetBIOShostname isassociated to threeormoredifferentIP addresses in 2 hours or less
Add the IP address to the Asset Reconciliation DomainIPv4 blacklist
Whenan IPv4address is associated to threeormoredifferentMACaddresses in 2 hours or less
Add the NetBIOS host name to the Asset ReconciliationDomain NetBIOS blacklist
WhenaNetBIOShostname isassociated to threeormoredifferentMAC addresses in 2 hours or less
Add the DNS host name to the Asset ReconciliationDomain DNS blacklist
When a DNS host name is associated to three or more differentMAC addresses in 2 hours or less
Add the IP address to the Asset Reconciliation DomainIPv4 blacklist
Whenan IPv4 address is associated to three ormore differentDNShost names in 2 hours or less
Add the NetBIOS host name to the Asset ReconciliationDomain NetBIOS blacklist
WhenaNetBIOShostname isassociated to threeormoredifferentDNS host names in 2 hours or less
Add theMAC address to the Asset Reconciliation DomainMAC blacklist
When aMAC address is associated to three or more different DNShost names in 2 hours or less
263Copyright © 2018, Juniper Networks, Inc.
Chapter 19: Asset Management

Table 60: Rule Tests and Responses (continued)
Rule responseScenario
Add the IP address to the Asset Reconciliation DomainIPv4 blacklist
When an IPv4 address is associated to three or more differentNetBIOS host names in 2 hours or less
Add the DNS host name to the Asset ReconciliationDomain DNS blacklist
When a DNS host name is associated to three or more differentNetBIOS host names in 2 hours or less
Add theMAC address to the Asset Reconciliation DomainMAC blacklist
When a MAC address is associated to three or more differentNetBIOS host names in 2 hours or less
You can view these rules on theOffenses tab by clicking Rules and then selecting the
asset reconciliation exclusion group in the drop-down list.
Asset Merging
Some systems can cause high volumes of asset merging because they have asset data
sources that inadvertently combine identity information from two different physical
assets into a single asset update. Someexamples of these systems include the following
environments:
• Central syslog servers that act as an event proxy
• Virtual machines
• Automated installation environments
• Non-unique host names, common with assets like iPads and iPhones.
• Virtual private networks that have shared MAC addresses
• Log source extensions where the identity field isOverrideAndAlwaysSend=true
Assets that havemany IP addresses, MAC addresses, or host names show deviations in
asset growth and can trigger system notifications.
Asset merging is the process where the information for one asset is combined with the
information for another asset under the premise that they are actually the samephysical
asset.
Asset merging occurs when an asset update contains identity data that matches two
different asset profiles. For example, a single update that contains aNetBIOS host name
thatmatches one asset profile and aMAC address thatmatches a different asset profile
might trigger an asset merge.
Identification Of Asset Growth Deviations
Asset growth deviations occur when the number of asset updates for a single device
grows beyond the limit that is set by the retention threshold for a specific type of the
identity information. Proper handling of asset growth deviations is critical tomaintaining
an accurate asset model.
Copyright © 2018, Juniper Networks, Inc.264
Juniper Secure Analytics Administration Guide

At the root of every asset growth deviation is an asset data source whose data is
untrustworthy for updating the asset model. When a potential asset growth deviation is
identified, youmust look at the source of the information to determine whether there is
a reasonable explanation for the asset to accumulate large amounts of identity data.
The cause of an asset growth deviation is specific to an environment.
• DHCP Server Example Of Unnatural Asset Growth in an Asset Profile on page 265
• Threshold Settings on page 265
• System Notifications That Indicate Asset Growth Deviations on page 265
• Example:HowConfigurationErrors for LogSourceExtensionsCanCauseAssetGrowth
Deviations on page 266
• Troubleshooting Asset Profiles That Exceed the Normal Size Threshold on page 266
• New Asset Data is Added to the Asset Blacklists on page 267
DHCP Server Example Of Unnatural Asset Growth in an Asset Profile
Consider a virtual privatenetwork (VPN) server in aDynamicHostConfigurationProtocol
(DHCP) network. The VPN server is configured to assign IP addresses to incoming VPN
clients by proxying DHCP requests on behalf of the client to the network's DHCP server.
From the perspective of the DHCP server, the sameMAC address repeatedly requests
many IP address assignments. In the context of network operations, the VPN server is
delegating the IP addresses to the clients, but the DHCP server can't distinguish when a
request is made by one asset on behalf of another.
The DHCP server log, which is configured as a JSA log source, generates a DHCP
acknowledgment (DHCPACK) event that associates theMACaddress of theVPN server
with the IP address that it assigned to the VPN client. When asset reconciliation occurs,
the system reconciles this event by MAC address, which results in a single existing asset
that grows by one IP address for every DHCP ACK event that is parsed.
Eventually, one asset profile contains every IP address that was allocated to the VPN
server. This asset growth deviation is caused by asset updates that contain information
about more than one asset.
Threshold Settings
When an asset in the database reaches a specific number of properties, such asmultiple
IP addresses or MAC addresses, JSA blocks that asset from receiving more updates.
The Asset Profiler threshold settings specify the conditions under which an asset is
blocked from updates. The asset is updated normally up to the threshold value. When
the system collects enough data to exceed the threshold, the asset shows an asset
growth deviation. Future updates to the asset are blocked until the growth deviation is
rectified.
SystemNotifications That Indicate Asset Growth Deviations
JSA generates system notifications to help you identify andmanage the asset growth
deviations in your environment.
265Copyright © 2018, Juniper Networks, Inc.
Chapter 19: Asset Management

The following systemmessages indicate that JSA identified potential asset growth
deviations:
• The system detected asset profiles that exceed the normal size threshold
• The asset blacklist rules have added new asset data to the asset blacklists
The system notificationmessages include links to reports to help you identify the assets
that have growth deviations.
Asset Data That Changes Frequently
Asset growth can be caused by large volumes of asset data that changes legitimately,
such as in these situations:
• Amobile device that travels from office-to-office frequently and is assigned a new IP
address whenever it logs in.
• A device that connects to a public wifi with short IP addresses leases, such as at a
university campus, might collect large volumes of asset data over a semester.
Example: HowConfiguration Errors for Log Source Extensions Can Cause Asset GrowthDeviations
Customized log sourceextensions thatare improperly configuredcancauseasset growth
deviations.
You configure a customized log source extension to provide asset updates to JSA by
parsing user names from the event payload that is on a central log server. You configure
the log source extension to override the event host name property so that the asset
updates that are generated by the custom log source always specify the DNS host name
of the central log server.
Instead of JSA receiving an update that has the host name of the asset that the user
logged in to, the log source generates many asset updates that all have the same host
name.
In this situation, the asset growth deviation is caused by one asset profile that contains
many IP addresses and user names.
Troubleshooting Asset Profiles That Exceed the Normal Size Threshold
JSA generates the following system notification when the accumulation of data under
a single asset exceeds the configured threshold limits for identity data.
The system detected asset profiles that exceed the normal size threshold
Explanation
The payload of the notification shows a list of the top five most frequently deviating
assets and why the systemmarked each asset as a growth deviation. As shown in the
followingexample, thepayloadalsoshowsthenumberof times that theassetattempted
to grow beyond the asset size threshold.
Copyright © 2018, Juniper Networks, Inc.266
Juniper Secure Analytics Administration Guide

Feb 13 20:13:23 127.0.0.1 [AssetProfilerLogTimer]
com.q1labs.assetprofile.updateresolution.UpdateResolutionManager:
[INFO] [NOT:0010006101][9.21.118.83/- -] [-/- -]
The top fivemost frequently deviating asset profiles between
Feb 13, 2015 8:10:23 PMAST and Feb 13, 2015 8:13:23 PMAST:
[ASSET ID:1003, REASON:TooMany IPs, COUNT:508],
[ASSET ID:1002, REASON:Toomany DNSNames, COUNT:93],
[ASSET ID:1001, REASON:ToomanyMACAddresses, COUNT:62]
Required user action
Use the information in thenotificationpayload to identify theassets that are contributing
to the asset growth deviation and determine what is causing the abnormal growth. The
notification provides a link to a report of all assets that experienced deviating asset
growth over the past 24 hours.
After you resolve the asset growth deviation in your environment, you can run the report
again.
1. Click the Log Activity tab and click Search > NewSearch.
2. Select the Deviating Asset Growth: Asset Report saved search.
3. Use the report to identify and repair inaccurate asset data that was created during
the deviation.
If the asset data is valid, JSA administrators can increase the threshold limits for IP
addresses, MAC addresses, NetBIOS host names, and DNS host names in the Asset
Profiler Configuration on the JSA Admin tab.
NewAsset Data is Added to the Asset Blacklists
JSA generates the following system notification when a piece of asset data exhibits
behavior that is consistent with deviating asset growth.
The asset blacklist rules have added new asset data to the asset blacklists
Explanation
Asset exclusion rules monitor asset data for consistency and integrity. The rules track
specificpiecesofassetdataover time toensure that theyareconsistentlybeingobserved
with the same subset of data within a reasonable time.
For example, if an asset update includes both aMAC address and a DNS host name, the
MAC address is associatedwith that DNS host name for a sustained period. Subsequent
asset updates that contain that MAC address also contain that same DNS host name
when one is included in the asset update. If theMACaddress suddenly is associatedwith
adifferentDNShost name for a short period, the change ismonitored. If theMACaddress
changes again within a short period, the MAC address is flagged as contributing to an
instance of deviating or abnormal asset growth.
267Copyright © 2018, Juniper Networks, Inc.
Chapter 19: Asset Management

Required user action
Use the information in the notification payload to identify the rules that are used to
monitor asset data. Click the Asset deviations by log source link in the notification to see
the asset deviations that occurred in the last 24 hours.
If the asset data is valid, JSA administrators can configure JSA to resolve the problem.
• If your blacklists are populating too aggressively, you can tune the asset reconciliation
exclusion rules that populate them.
• If youwant to add the data to the asset database, you can remove the asset data from
the blacklist and add it to the corresponding asset whitelist. Adding asset data to the
whitelist prevents it from inadvertently reappearing on the blacklist.
RelatedDocumentation
Prevention Of Asset Growth Deviations on page 268•
• Clean Up Asset Data After Growth Deviations on page 279
• Asset Management on page 259
Prevention Of Asset Growth Deviations
After you confirm that the reported asset growth is legitimate, there are several ways to
prevent JSA from triggering growth deviation messages for that asset.
Use the following list to help you decide how to prevent asset growth deviations:
• Stale Asset Data on page 269
• Tuning the Asset Profiler Retention Settings on page 273
• Tuning the Number Of IP Addresses Allowed for a Single Asset on page 274
• Identity Exclusion Searches on page 275
• Advanced Tuning Of Asset Reconciliation Exclusion Rules on page 277
• Create asset whitelists to prevent data from reappearing on the asset blacklists.
• Modify the entries on the asset blacklists and asset whitelists.
• Ensure that your DSMs are up to date. JSA provides a weekly automatic update that
might contain DSM updates and corrections to parsing issues.
• Stale Asset Data on page 269
• Asset Blacklists andWhitelists on page 269
• Tuning the Asset Profiler Retention Settings on page 273
• Tuning the Number Of IP Addresses Allowed for a Single Asset on page 274
• Identity Exclusion Searches on page 275
Copyright © 2018, Juniper Networks, Inc.268
Juniper Secure Analytics Administration Guide

• Advanced Tuning Of Asset Reconciliation Exclusion Rules on page 277
• Example: Asset Exclusion Rules That Are Tuned to Exclude IP Addresses from the
Blacklist on page 278
Stale Asset Data
Staleassetdatacanbeproblematicwhen the rateatwhichnewasset recordsare created
exceeds the rate at which stale asset data is removed. Controlling andmanaging asset
retention thresholds is the key to addressing asset growth deviations that are caused by
stale asset data.
Stale asset data is historical asset data that is not actively or passively observed within
a specific time. Stale asset data is deleted when it exceeds the configured retention
period.
The historical records become active again if they are observed by JSA passively, through
events and flows, or actively, through port and vulnerability scanners.
Preventingassetgrowthdeviations requires finding the rightbalancebetween thenumber
of IP addresses allowed for a single asset and the length of time that JSA retains the
asset data. Youmust consider the performance andmanageability trade-offs before
you configure JSA to accommodate high levels of asset data retention. While longer
retention periods and higher per-asset thresholds might appear desirable all the time, a
better approach is to determine a baseline configuration that is acceptable for your
environment and test that configuration. Then, you can increase the retention thresholds
in small increments until the right balance is achieved.
Asset Blacklists andWhitelists
An asset blacklist is a collection of data that JSA considers untrustworthy. Data in the
asset blacklist is likely to contribute to asset growth deviations and JSA prevents the
data from being added to the asset database.
An asset whitelist is a collection of asset data that overrides the asset reconciliation
engine logic about which data is added to an asset blacklist. When the system identifies
a blacklist match, it checks the whitelist to see whether the value exists. If the asset
update matches data that is on the whitelist, the change is reconciled and the asset is
updated. Whitelisted asset data is applied globally for all domains.
The asset blacklists andwhitelists are reference sets. You can view andmodify the asset
blacklist andwhitelist data using the Reference SetManagement tool in the JSA console.
For more information about working with reference sets, see “Reference Sets
Management” on page 149.
Alternatively, you can use the command line interface (CLI) or the RestFUL API endpoint
to update the content of the asset blacklists and whitelists.
Asset Blacklists
An asset blacklist is a collection of data that JSA considers untrustworthy based on the
asset reconciliation exclusion rules. Data in the asset blacklist is likely to contribute to
269Copyright © 2018, Juniper Networks, Inc.
Chapter 19: Asset Management

asset growth deviations and JSA prevents the data from being added to the asset
database.
Every asset update in JSA is compared to the asset blacklists. Blacklisted asset data is
applied globally for all domains. If the asset update contains identity information (MAC
address, NetBIOS host name, DNS host name, or IP address) that is found on a blacklist,
the incoming update is discarded and the asset database is not updated.
The following table shows the referencecollectionnameand type for each typeof identity
asset data.
Table 61: Reference Collection Names for Asset Blacklist Data
Reference collection typeReference collection nameType of identity data
Reference Set [Set Type: IP]Asset Reconciliation IPv4 BlacklistIP addresses (v4)
Reference Set [Set Type: ALNIC*]Asset Reconciliation DNS BlacklistDNS host names
Reference Set [Set Type: ALNIC*]Asset Reconciliation NetBIOS BlacklistNetBIOS host names
Reference Set [Set Type: ALNIC*]Asset Reconciliation MAC BlacklistMAC Addresses
* ALNIC is an alphanumeric type that can accommodate both host name and MAC address values.
You can use the Reference Set Management tool to edit the blacklist entries. For
informationaboutworkingwith reference sets, see JuniperSecureAnalyticsAdministration
Guide.
AssetWhitelists
An asset whitelist is a collection of asset data that overrides the asset reconciliation
engine logic about which data is added to an asset blacklist. When the system identifies
a blacklist match, it checks the whitelist to see whether the value exists. If the asset
update matches data that is on the whitelist, the change is reconciled and the asset is
updated. Whitelisted asset data is applied globally for all domains.
You can use the Reference Set Management tool to edit the whitelist entries. For
informationaboutworkingwith reference sets, see JuniperSecureAnalyticsAdministration
Guide.
You can use asset whitelists to keep JSA asset data from inadvertently reappearing in
the asset blacklists.
Example Of aWhitelist Use Case
The whitelist is helpful if you have asset data that continues to show up in the blacklists
when it is a valid asset update. For example, youmight have a round robin DNS load
balancer that is configured to rotate across a set of five IP addresses. The Asset
ReconciliationExclusion rulesmight determine that themultiple IP addresses associated
with thesameDNShostnameare indicativeofanassetgrowthdeviation, and thesystem
Copyright © 2018, Juniper Networks, Inc.270
Juniper Secure Analytics Administration Guide

might add the DNS load balancer to the blacklist. To resolve this problem, you can add
the DNS host name to the Asset Reconciliation DNSWhitelist.
Mass Entries to the AssetWhitelist
An accurate asset databasemakes it easier to connect offenses that are triggered in
your system to physical or virtual assets in your network. Ignoring asset deviations by
adding mass entries to the asset whitelist is not helpful in building an accurate asset
database. Insteadofaddingmasswhitelist entries, review theassetblacklist todetermine
what is contributing to the deviating asset growth and then determine how to fix it.
Types Of AssetWhitelists
Each type of identity data is kept in a separate whitelist. The following table shows the
reference collection name and type for each type of identity asset data.
Table 62: Reference Collection Name for AssetWhitelist Data
Reference collection typeReference collection nameType of data
Reference Set [Set Type: IP]Asset Reconciliation IPv4WhitelistIP addresses
Reference Set [Set Type: ALNIC*]Asset Reconciliation DNSWhitelistDNS host names
Reference Set [Set Type: ALNIC*]Asset Reconciliation NetBIOSWhitelistNetBIOS host names
Reference Set [Set Type: ALNIC*]Asset Reconciliation MACWhitelistMAC addresses
* ALNIC is an alphanumeric type that can accommodate host name and MAC address values.
Updating the Asset Blacklists andWhitelists by Using Reference Set Utility
You can use the JSA reference set utility to add ormodify the entries that are on the asset
blacklists or whitelists.
Tomanage your reference sets, run the ReferenceSetUtil.sh utility from /opt/qradar/bin
on the JSA console.
The commands to add new values to each list are described in the following table. The
parameter values must exactly match the asset update values that are provided by the
originating asset data source.
Table 63: Command Syntax toModify Asset Blacklist andWhitelist Data
Command syntaxName
ReferenceSetUtil.sh add "Asset Reconciliation IPv4 Blacklist" IP
For example, this command adds IP address 192.168.3.56 to the blacklist:
ReferenceSetUtil.sh add "Asset Reconciliation IPv4 Blacklist" 192.168.3.56
AssetReconciliationIPv4 Blacklist
271Copyright © 2018, Juniper Networks, Inc.
Chapter 19: Asset Management

Table 63: Command Syntax toModify Asset Blacklist andWhitelist Data (continued)
Command syntaxName
ReferenceSetUtil.sh add "Asset Reconciliation DNS Blacklist"DNS
For example, this command adds domain name 'misbehaving.asset.company.com' to the blacklist:
ReferenceSetUtil.sh add "Asset Reconciliation DNS Blacklist" "misbehaving.asset.company.com"
AssetReconciliationDNS Blacklist
ReferenceSetUtil.sh add "Asset Reconciliation NetBIOS Blacklist"NETBIOS
For example, this command removesNetBIOShostname 'deviantGrowthAsset-156384' fromtheblacklist:
ReferenceSetUtil.sh delete "Asset Reconciliation NetBIOS Blacklist" "deviantGrowthAsset-156384"
AssetReconciliationNetBIOS Blacklist
ReferenceSetUtil.sh add "Asset ReconciliationMAC Blacklist"MACADDR
For example, this command adds MAC address '00:a0:6b:54:9f:0e' to the blacklist:
ReferenceSetUtil.sh add "Asset ReconciliationMAC Blacklist" "00:a0:6b:54:9f:0e"
AssetReconciliationMAC Blacklist
ReferenceSetUtil.sh add "Asset Reconciliation IPv4Whitelist" IP
For example, this command deletes IP address 10.1.95.142 from the whitelist:
ReferenceSetUtil.sh delete "Asset Reconciliation IPv4Whitelist" 10.1.95.142
AssetReconciliationIPv4Whitelist
ReferenceSetUtil.sh add "Asset Reconciliation DNSWhitelist"DNS
For example, this command adds domain name 'loadbalancer.company.com' to the whitelist:
ReferenceSetUtil.sh add "Asset Reconciliation DNSWhitelist" "loadbalancer.company.com"
AssetReconciliationDNSWhitelist
ReferenceSetUtil.sh add "Asset Reconciliation NetBIOSWhitelist"NETBIOS
For example, this command adds NetBIOS name 'assetName-156384' to the whitelist:
ReferenceSetUtil.sh add "Asset Reconciliation NetBIOSWhitelist" "assetName-156384"
AssetReconciliationNetBIOSWhitelist
ReferenceSetUtil.sh add "Asset ReconciliationMAC Blacklist"MACADDR
For example, this command adds MAC address '00:a0:6b:54:9f:0e' to the blacklist:
ReferenceSetUtil.sh add "Asset ReconciliationMAC Blacklist" "00:a0:6b:54:9f:0e"
AssetReconciliationMACWhitelist
Updating the Blacklists andWhitelists Using the RESTful API
Youmust specify the exact name of the reference set that you want to view or update.
• Asset Reconciliation IPv4 Blacklist
• Asset Reconciliation DNS Blacklist
• Asset Reconciliation NetBIOS Blacklist
• Asset Reconciliation MAC Blacklist
• Asset Reconciliation IPv4Whitelist
Copyright © 2018, Juniper Networks, Inc.272
Juniper Secure Analytics Administration Guide

• Asset Reconciliation DNSWhitelist
• Asset Reconciliation NetBIOSWhitelist
• Asset Reconciliation MACWhitelist
1. Type the following URL in your web browser to access the RESTful API interface:
https://ConsoleIPaddress/api_doc
2. In the navigation pane on the left, find 4.0>/reference_data >/sets > /{name}.
3. To view the contents of an asset blacklist or whitelist, follow these steps:
a. Click the GET tab and scroll down to the Parameters section.
b. In the Value field for the Name parameter, type the name of the asset blacklist or
whitelist that you want to view.
c. Click Try It Out and view the results at the bottom of the screen.
4. To add a value to an asset blacklist or whitelist, follow these steps:
a. Click the POST tab and scroll down to the Parameters section.
b. Type in the values for the following parameters:
Table 64: Parameters That Are Required to Add NewAsset Data
Parameter descriptionParameter name
Represents the name of the reference collection that you want to update.name
Represents the data item that you want to add to the asset blacklist or whitelist. Must exactlymatch the asset update values that are provided by the originating asset data source.
value
c. Click Try It Out to add the new value to the asset whitelist or asset blacklist.
For more information about using the RESTful API to change the reference sets, see the
Juniper Secure Analytics API Guide.
You can use the JSA RESTful API to customize the content of the asset blacklists and
whitelists.
Tuning the Asset Profiler Retention Settings
You can adjust the retention time based on the type of asset identity data that is in the
event. For example, ifmultiple IP addresses aremerging under one asset, you can change
the Asset IP Retention period from 120 days to a lower value.
When you change the asset retention period for a specific type of asset data, the new
retentionperiod is applied toall assetdata in JSA. Existingassetdata thatalreadyexceeds
the new threshold is removedwhen the deployment is complete. To ensure that you can
always identify named hosts even when the asset data is beyond the retention period,
273Copyright © 2018, Juniper Networks, Inc.
Chapter 19: Asset Management

the asset retention cleanup process does not remove the last known host name value
for an asset.
Before you determine howmany days that youwant to retain the asset data, understand
the following characteristics about longer retention periods:
• provides a better historical view of your assets.
• creates larger data volumes per asset in the asset database.
• increases the probability that stale data will contribute to asset growth deviation
messages.
1. Click the Admin tab.
2. On the navigation menu, click SystemConfiguration.
3. Click Asset Profiler Configuration.
4. Click Asset Profiler Retention Configuration.
5. Adjust the retention values and click Save.
6. Deploy the changes into your environment for the updates to take effect.
JSA uses the asset retention settings to manage the size of the asset profiles.
The default retention period for most asset data is 120 days after the last time it was
either passively or actively observed in JSA. User names are retained for 30 days.
Asset data that is addedmanually by JSA users does not usually contribute to asset
growth deviations. By default, this data is retained forever. For all other types of asset
data, the Retain Forever flag is suggested only for static environments.
Tuning the Number Of IP Addresses Allowed for a Single Asset
Setting the limit for the number of IP addresses too high prevents JSA from detecting
asset growthdeviationsbefore theyhaveanegative impacton the restof thedeployment.
Setting the limit too low increases the number of asset growth deviations that are
reported.
You can use the following guidelinewhen you tune theNumber of IPsAllowed for aSingle
Asset setting for the first time.
Number of IP addresses that are allowed for a single asset = (<retention time (days)> x
<estimated IP addresses per day>) + <buffer number of IP addresses>
Where
• <estimated IP addresses per day> is the number of IP addresses that a single asset
might accumulate in one day under normal conditions
Copyright © 2018, Juniper Networks, Inc.274
Juniper Secure Analytics Administration Guide

• <retention time (days)> is thepreferredamountof time to retain theasset IPaddresses
1. Click the Admin tab.
2. On the navigation menu, click SystemConfiguration.
3. Click Asset Profiler Configuration.
4. Click Asset Profiler Retention Configuration.
5. Adjust the configuration values and click Save.
6. Deploy the changes into your environment for the updates to take effect.
JSAmonitors the number of IP addresses that a single asset accumulates over time.
By default, JSA generates a systemmessage when a single asset accumulates more
than 75 IP addresses. If you expect assets to accumulatemore than 75 IP addresses, you
can tune the Number of IPs Allowed for a Single Asset value to avoid future system
messages.
Identity Exclusion Searches
Identity exclusion searches can be used to manage single assets that accumulate large
volumes of similar identity information for known, valid reasons.
For example, log sources can provide large volumes of asset identity information to the
asset database. They provide JSA with near real-time changes to asset information and
they can keep your asset database current. But log sources are most often the source of
asset growth deviations and other asset-related anomalies.
When a log source sends incorrect asset data to JSA, try to fix the log source so that the
data it sends is usable by the asset database. If the log source cannot be fixed, you can
build an identity exclusion search that blocks the asset information from entering the
asset database.
You can also use an identity exclusion search where Identity_Username+Is Any Of +
Anonymous Logon to ensure that you are not updating assets that are related to service
accounts or automated services.
Differences Between Identity Exclusion Searches and Blacklists
While identity exclusion searches appear to have similar functionality to asset blacklists,
there are significant differences.
Blacklists can specify only raw asset data, such asMAC addresses and host names, that
is to be excluded. Identity exclusion searches filter out asset data based on search fields
like log source, category, and event name.
275Copyright © 2018, Juniper Networks, Inc.
Chapter 19: Asset Management

Blacklists do not account for the type of data source that is providing the data, whereas
identity exclusion searches can be applied to events only. Identity exclusion searches
canblock asset updates basedon commonevent search fields, suchas event type, event
name, category, and log source.
Creating Identity Exclusion Searches
Toexcludecertain events fromprovidingassetdata to theassetdatabase, youcancreate
a JSA identity exclusion search.
The filters that you create for the search must match events that you want to exclude,
not the events that you want to keep.
Youmight find it helpful to run the search against events that are already in the system.
However, when you save the search, youmust select Real Time (streaming) in the
Timespan options. If you do not choose this setting, the searchwill notmatch any results
when it runs against the live stream of events that are coming into JSA.
When you update the saved identity exclusion search without changing the name, the
identity exclusion list that is usedby theAsset Profiler is updated. For example, youmight
edit the search to addmore filtering of the asset data that youwant to exclude. The new
values are included and the asset exclusion starts immediately after the search is saved.
1. On the Log Activity tab, click Search >NewSearch.
2. Create the search by adding search criteria and filters to match the events that you
want to exclude from asset updates.
3. In the Time Range box, select Real Time (streaming) and then click Filter to run the
search.
4. On the search results screen, click Save Criteria and provide the information for the
saved search.
You can assign the saved search to a search group. An Identity Exclusion search group
exists in the Authentication, Identity and User Activity folder.
Ensure that Real Time (streaming) is selected in the Timespan options.
5. ClickOK to save the search.
6. Click the Admin tab, and click Asset Profiler Configuration.
7. ClickManage Identity Exclusion at the bottom of the screen.
8. Select the identity exclusion search that you created from the list of searches on the
left and click the add icon (>).
If you can't find the search, type the first few letters into the filter at the top of the list.
Copyright © 2018, Juniper Networks, Inc.276
Juniper Secure Analytics Administration Guide

9. Click Save.
10. Deploy the changes into your environment for the updates to take effect.
Advanced Tuning Of Asset Reconciliation Exclusion Rules
You can tune the Asset Reconciliation Exclusion rules to refine the definition of deviating
asset growth in one or more of the rules.
For example, consider this normalized template from an Asset Reconciliation Exclusion
rule.
Apply AssetExclusion: Exclude DNS Name By IP on events which are detected by the Local system and NOT when any of Identity Host Name are contained in any of Asset Reconciliation DNS Whitelist - AlphaNumeric (Ignore Case),Asset Reconciliation DNS Blacklist - AlphaNumeric (Ignore Case) and when at least N1 events are seen with the same Identity Host Name and different Identity IP in N2
This table lists the variables in the rule template that can be tuned and the result of the
change. Avoid changing other variables in the template.
Table 65: Options for Tuning the Asset Reconciliation Rules
Tuning resultDefault valueVariable
Tuning this variable to a lower value results in more data being added to the blacklistbecause fewer events with conflicting data are needed for the rule to fire.
Tuning this variable to a higher value results in less data being added to the blacklistbecausemore events with conflicting data are needed for the rule to fire.
3N1
Tuning this variable to a lower value reduces thewindowof time inwhichN1 eventsmustbe seen for the rule to fire. The time required to observe matching data is decreased,which results in less data being added to the blacklist.
Tuning this variable to a higher value increases the time inwhich N1 eventsmust be seenfor the rule to fire. The time to observematching data is increased, which results inmoredata being added to the blacklist.
Increasing the time period might impact systemmemory resources as data is trackedover longer periods of time.
2 hoursN2
The Asset Reconciliation Exclusion rules are system-wide rules. Changes to the rules
affect the way that the rule behaves throughout the entire system.
Applying Different Tuning for Rules
It might be necessary to apply different tuning for rules in different parts of the system.
To apply different tuning for rules, youmust duplicate the Asset Reconciliation Exclusion
rules that you want to tune and add one or more tests to constrain the rules so that you
277Copyright © 2018, Juniper Networks, Inc.
Chapter 19: Asset Management

test only certain parts of the system. For example, youmight want to create rules that
test only networks, log sources, or event types.
Always be cautiouswhen you are adding new rules to the systembecause as some tasks
and CRE rules might impact system performance. It might be beneficial to add the new
rules to the top of each test stack to allow the system to bypass the remainder of the
test logic whenever an asset update matches the criteria for the new rule.
1. Duplicate the rule.
a. On theOffenses tab, click Rules and select the rule that you want to copy.
b. Click Actions >Duplicate.
It canbehelpful if thenameof thenew rule is indicativeof the reason for duplicating
it.
2. Add a test to the rule.
Determine a filter that you want to use to apply the rule only to a subset of system
data. For example, you can add a test that matches only events from a specific log
source.
3. Tune the variables of the rule to achieve the wanted behavior.
4. Update the original rule.
a. Add the same test that you added to the duplicate rule to the original rule, but this
time invert the rules AND and ANDNOT operators.
Inverting the operators prevents events from being triggered in both rules.
Example: Asset Exclusion Rules That Are Tuned to Exclude IP Addresses from the Blacklist
You can exclude IP addresses from being blacklisted by tuning the asset exclusion rules.
As the Network security administrator, you manage a corporate network that includes a
public wifi network segment where IP address leases are typically short and frequent.
The assets on this segment of the network tend to be transient, primarily notebooks and
hand-held devices that log in and out of the public wifi frequently. Commonly, a single
IP address is usedmultiple times by different devices over a short time.
In the rest of your deployment, you have a carefully managed network that consists only
of inventoried, well-named company devices. IP address leases are much longer in this
partof thenetwork, and IPaddressesareaccessedbyauthenticationonly.On thisnetwork
segment, you want to know immediately when there are any asset growth deviations
and you want to keep the default settings for the asset reconciliation exclusion rules.
Blacklisting IP Addresses
In this environment, thedefault asset reconciliationexclusion rules inadvertentlyblacklist
the entire network in a short time.
Copyright © 2018, Juniper Networks, Inc.278
Juniper Secure Analytics Administration Guide

Your security team finds the asset-related notifications that are generated by the wifi
segment are a nuisance. You want to prevent the wifi from triggering anymore deviating
asset growth notifications.
Tuning Asset Reconciliation Rules to Ignore Some Asset Updates
You review the Asset deviation by log source report in the last system notification. You
determine that the blacklisted data is coming from the DHCP server on your wifi.
The values in the Event Count column, Flow Count column and theOffenses column for
the row corresponding to the AssetExclusion: Exclude IP ByMACAddress rule indicate
that your wifi DHCP server is triggering this rule.
Youadda test to theexistingasset reconciliationexclusion rules to stop rules fromadding
wifi data to the blacklist.
Apply AssetExclusion:Exclude IP by MAC address on events which are detected by the Local system and NOT when the event(s) were detected by one or more of MicrosoftDHCP @ microsoft.dhcp.test.comand NOT when any of Domain is the key and any of Identity IP is the value in
any of Asset Reconciliation Domain IPv4 Whitelist - IP Asset Reconciliation Domain IPv4 Blacklist - IPand when at least 3 events are seen with the same Identity IP and different Identity MAC in 2 hours.
The updated rule tests only the events from the log sources that are not on your wifi
DHCP server. To prevent wifi DHCP events from undergoing more expensive reference
set and behavior analysis tests, you also moved this test to the top of the test stack.
RelatedDocumentation
Clean Up Asset Data After Growth Deviations on page 279•
• Updates to Asset Data on page 262
• Identification Of Asset Growth Deviations on page 264
Clean Up Asset Data After Growth Deviations
JSA uses the asset model to connect offenses in your deployment to physical or virtual
assets in your network. The ability to collect and view relevant data on how assets are
used is an important step in resolving security issues. It is important tomaintain the asset
database to ensure that the data is current and accurate.
Whether you fix the source of the problem or block the asset updates, youmust clean
up theassetdatabaseby removing the invalid assetdataand removing theassetblacklist
entries.
• Deleting Invalid Assets on page 280
• Deleting Blacklist Entries on page 280
279Copyright © 2018, Juniper Networks, Inc.
Chapter 19: Asset Management

RelatedDocumentation
Updates to Asset Data on page 262•
• Identification Of Asset Growth Deviations on page 264
• Prevention Of Asset Growth Deviations on page 268
Deleting Invalid Assets
After you fix the assets that contributed to the asset growth deviation, clean up your
asset artifacts by using selective clean up or rebuilding the asset database.
Selective clean up—This method is for asset growth deviations of limited scope.Selectively removing the affected assets is the least invasive way to clean up asset
artifacts, but if many assets were affected, it can also be themost tedious.
Rebuild the asset database—Rebuilding the asset database from scratch is the most
efficient and precise method of deleting assets when asset growth deviations are
pervasive.
Thismethod passively regenerates assets in your database based on the new tuning
that you configured to resolve the asset growth issues. With this approach, all scan
results and residual asset data are lost, but the data can be reclaimed by rerunning
a scan or re-importing scan results.
1. To selectively remove invalid artifacts in the asset database, perform these steps:
a. On the Log Activity tab, run the Deviating Asset Growth: Asset Report event search.
This search returns a report of assets that are affected by deviating asset growth
andmust be deleted.
b. On the Assets tab, click Actions >Delete Asset
There might be a delay before the asset no longer appears in JSA.
2. To rebuild the asset database from scratch, perform these steps:
a. Use SSH to log in to the JSA console as an administrator.
b. Run the /opt/qradar/support/cleanAssetModel.shscript fromtheconsolecommand
line and selectOption 1when prompted.
Rebuilding the asset database restarts the asset reconciliation engine.
Purging a blacklist removes all blacklist entries, including those entries that were added
manually. Blacklist entries that were manually addedmust be added again.
Deleting Blacklist Entries
After you fixed the cause of the blacklist entries, youmust clean up the remnant entries.
You can remove the individual blacklist entries, however it is better to purge all blacklist
entries and allow the blacklist values that are unrelated to the asset growth deviation
to regenerate.
Copyright © 2018, Juniper Networks, Inc.280
Juniper Secure Analytics Administration Guide

1. To purge a blacklist by using the JSA Console:
a. Click Admin >SystemConfiguration >Reference Set Management.
b. Select a reference set and then click Delete.
c. Use the quick search text box to search for the reference sets that you want to
delete, and then click Delete Listed.
2. To purge a blacklist by using the JSA console command-line interface:
a. Change directory to /opt/qradar/bin.
b. Run the following command.
./ReferenceDataUtil.sh purge "Reference Collection Name"
where Reference Collection Name is one of the following lists:
• Asset Reconciliation NetBIOS Blacklist
• Asset Reconciliation DNS Blacklist
• Asset Reconciliation IPv4 Blacklist
• Asset Reconciliation MAC Blacklist
Purging a blacklist removes all blacklist entries, including those entries that were added
manually. Blacklist entries that were manually addedmust be added again.
281Copyright © 2018, Juniper Networks, Inc.
Chapter 19: Asset Management

Copyright © 2018, Juniper Networks, Inc.282
Juniper Secure Analytics Administration Guide

CHAPTER 20
Configuring JSA to Forward Data to OtherSystems
• Configuring JSA to Forward Data to Other Systems on page 283
• Adding Forwarding Destinations on page 284
• Configuring Forwarding Profiles on page 285
• Configuring Routing Rules for Bulk Forwarding on page 286
• Configuring Selective Forwarding on page 288
• Viewing Forwarding Destinations on page 288
• Viewing and Managing Forwarding Destinations on page 289
• Viewing and Managing Routing Rules on page 290
Configuring JSA to Forward Data to Other Systems
You can configure JSA to forward data to one or more vendor systems, such as ticketing
oralertingsystems.Youcanalso forwardnormalizeddata toother JSA.The target system
that receives the data from JSA is known as a forwarding destination.
With exception of domain tagging, JSA systems ensure that all forwarded data is
unaltered. Domain information is removed from forwarded data. Events and flows that
contain domain information are automatically assigned to the default domain on the
receiving system.
To avoid compatibility problems when sending event and flow data, ensure that the
deployment receiving the data is the same version or higher than the deployment that
is sending the data.
1. Configure one or more forwarding destinations.
2. To determine what data you want to forward, configure routing rules, custom rules,
or both.
3. Configure the routing options to apply to the data.
For example, you can configure all data from a specific event collector to forward to a
specific ticketing system. You can also bypass correlation by removing the data that
matches a routing rule.
283Copyright © 2018, Juniper Networks, Inc.

Adding Forwarding Destinations
Before you can configure bulk or selective data forwarding, youmust add forwarding
destinations.
1. Click the Admin tab.
2. In the navigation pane, click SystemConfiguration.
3. Click the Forwarding Destinations icon.
4. On the toolbar, click Add.
5. In the Forwarding Destinationswindow, enter values for the parameters.
The following table describes some of the Forwarding Destinations parameters.
Table 66: Forwarding Destinations Parameters
DescriptionParameter
• Payload is the data in the format that the log source or flow source sent.
• Normalized is rawdata that is parsedandpreparedas readable information for theuser interface.
Event Format
The IP address or host name of the vendor system that you want to forward data to.Destination Address
Use the TCP protocol to send normalized data by using the TCP protocol. Youmust create anoff-site source at the destination address on port 32004.
Protocol
If a valid syslogheader is notdetectedon theoriginal syslogmessageand this checkbox is selected,the prefixed syslog header includes the originating IP address from the packet that JSA receivedin the Hostname field of the syslog header. If this check box is not selected, the data is sentunmodified.
When JSA forwards syslogmessages, the outboundmessage is verified to ensure that it has a validsyslog header.
Prefix a syslog header if itis missing or invalid
6. Click Save.
RelatedDocumentation
Configuring Forwarding Profiles on page 285•
• Configuring Routing Rules for Bulk Forwarding on page 286
• Configuring Selective Forwarding on page 288
Copyright © 2018, Juniper Networks, Inc.284
Juniper Secure Analytics Administration Guide

Configuring Forwarding Profiles
If youwant to specifywhichproperties to forward to the forwardingdestination, configure
a forwarding profile.
Youmust re-create JSON forwarding profiles that you created in JSA 2014.3 or earlier.
You can use forwarding profiles only when the event data is sent in JSON format.
You can select specific event or flow properties, including custom properties, to forward
toanexternal destination. Youcanenhance the readability of theeventdataby specifying
an alias name and default value for the attribute. Alias names and default values are
specific to the profile they are defined in. If the attributes are used in other profiles, the
alias names and default values must be redefined.
You can use a single profile that has multiple forwarding destinations. When you edit a
profile, ensure that the changes are appropriate for all forwarding destinations that the
profile is associated with.
When you delete a profile, all forwarding destinations that used the profile automatically
revert to using the default profile.
1. Click the Admin tab, and in the navigation pane, click SystemConfiguration.
2. Click the Forwarding Destinations icon.
3. On the toolbar, click Profile Manager.
4. To create a new profile, click New.
5. Type a name for the profile and select the check box beside the attributes that you
want to include in the event data set.
6. To change an existing profile, select the profile and click Edit or Delete.
7. Click Save.
RelatedDocumentation
Configuring Routing Rules for Bulk Forwarding on page 286•
• Configuring Selective Forwarding on page 288
• Viewing Forwarding Destinations on page 288
285Copyright © 2018, Juniper Networks, Inc.
Chapter 20: Configuring JSA to Forward Data to Other Systems

Configuring Routing Rules for Bulk Forwarding
After you added one ormore forwarding destinations, you can create filter-based routing
rules to forward large quantities of data.
You can configure routing rules to forward data in either online or offline mode:
• InOnlinemode, your data remains current because forwarding is performed in real
time. If the forwarding destination becomes unreachable, data can potentially be lost.
• InOfflinemode, all data is stored in the database and then sent to the forwarding
destination. This assures that no data is lost, however, there might be delays in data
forwarding.
The following table describes some of the Routing Rules parameters
Table 67: Routing RulesWindowParameters
DescriptionParameter
This option is displayed when you select theOnline option.
Specifies the Event Collector that you want this routing rule process data from.
Forwarding EventCollector
This option is displayed when you select theOffline option.
Specifies the Event Processor that you want this routing rule process data from.
NOTE: This option is not available if Drop is selected from the Routing Options pane.
Forwarding EventProcessor
• The Forward option specifies that data is forwarded to the specified forwarding destination. Data isalso stored in the database and processed by the Custom Rules Engine (CRE).
• The Drop option specifies that data is dropped. The data is not stored in the database and is notprocessed by the CRE. This option is not available if you select theOffline option.
• The Bypass Correlation option specifies that data bypasses CRE, but it is stored in the database. Thisoption is not available if you select theOffline option.
You can combine two options:
• Forward and Drop
Data is forwarded to the specified forwarding destination. Data is not stored in the database and isnot processed by the CRE.
• Forward and Bypass Correlation
Data is forwarded to the specified forwarding destination. Data is also stored in the database, but itis not processed by the CRE. The CRE at the forwarded destination processes the data.
If data matches multiple rules, the safest routing option is applied. For example, if data that matchesa rule that is configured to drop and a rule to bypass CRE processing, the data is not dropped. Instead,the data bypasses the CRE and is stored in the database.
All events are counted against the EPS license.
Routing Options
Copyright © 2018, Juniper Networks, Inc.286
Juniper Secure Analytics Administration Guide

1. Click the Admin tab.
2. In the navigation pane, click SystemConfiguration.
3. Click the Routing Rules icon.
4. On the toolbar, click Add.
5. In the Routing Ruleswindow, enter values for the parameters.
a. Type a name and description for your routing rule.
b. From theMode field, select one of the following options:Online orOffline.
c. From the Forwarding Event Collector or Forwarding Event Processor list, select the
event collector fromwhich you want to forward data.
d. From the Data Source field in the Event Filters section, select which data source
you want to route: Events or Flows.
If you select the Flow Filters option, the section title changes to Flow Filters and
theMatch All Incoming Events check box changes toMatch All Flows.
e. To forward all incoming data, select theMatch All Incoming Events orMatch All
Incoming Flows check box.
NOTE: If you select this check box, you cannot add a filter.
f. To add a filter, in the Event Filters or Flow Filters section, select a filter from the
first list and an operand from the second list.
g. In the text box, type the value that you want to filter for, and then click Add Filter.
h. Repeat the previous two steps for each filter that you want to add.
i. To forward log data thatmatches the current filters, select the Forward check box,
and then select the check box for each preferred forwarding destination.
NOTE: If you select the Forward check box, you can also select either
the Drop or Bypass Correlation check boxes, but not both of them.
If you want to edit, add, or delete a forwarding destination, click theManage
Destinations link.
6. Click Save.
RelatedDocumentation
Configuring Selective Forwarding on page 288•
• Viewing Forwarding Destinations on page 288
287Copyright © 2018, Juniper Networks, Inc.
Chapter 20: Configuring JSA to Forward Data to Other Systems

• Viewing and Managing Forwarding Destinations on page 289
Configuring Selective Forwarding
Use theCustomRulewizard toconfigurehighly selectiveeventdata forwarding.Configure
rules that forward event data to one or more forwarding destinations as a rule response.
The criteria that determines the event data that is sent to a forwarding destination is
based on the tests and building blocks that are included in the rule. When the rule is
configured and enabled, all event data that matches the rule tests are automatically
sent to the specified forwarding destinations. For more information about how to edit or
add a rule, see the Juniper Secure Analytics Users Guide for your product.
1. Click theOffenses Log Activity tab.
2. On the navigation menu, select Rules.
3. Edit or adda rule.On theRuleResponsepage in theRulewizard, ensure that you select
the Send to Forwarding Destinations option.
RelatedDocumentation
Viewing Forwarding Destinations on page 288•
• Viewing and Managing Forwarding Destinations on page 289
• Viewing and Managing Routing Rules on page 290
Viewing Forwarding Destinations
TheForwardingDestinationswindowprovidesvaluable informationabout your forwarding
destinations. Statistics for the data sent to each forwarding destination is displayed.
For example, you can see the following information:
• The total number events and flows that were seen for this forwarding destination.
• The number of events or flows that were sent to this forwarding destination.
• The number of events or flows that were dropped before the forwarding destination
was reached.
1. Click the Admin tab.
2. On the navigation menu, click SystemConfiguration.
3. Click the Forwarding Destinations icon.
4. View the statistics for your forwarding destinations.
Copyright © 2018, Juniper Networks, Inc.288
Juniper Secure Analytics Administration Guide

RelatedDocumentation
Viewing and Managing Forwarding Destinations on page 289•
• Viewing and Managing Routing Rules on page 290
Viewing andManaging Forwarding Destinations
Use the ForwardingDestinationwindow to view, edit, and delete forwarding destinations.
1. Click the Admin tab.
2. In the navigation pane, click SystemConfiguration.
3. Click the Forwarding Destinations icon.
Statistics for the data sent to each forwarding destination is displayed. For example,
you can see the following information:
• The total number events and flows that were seen for this forwarding destination.
• The number of events or flows that were sent to this forwarding destination.
• Thenumber of events or flows thatweredroppedbefore the forwardingdestination
was reached.
4. On the toolbar, click an action, as described in the following table.
Table 68: Description Of the Forwarding Destination Toolbar Actions
DescriptionAction
Resets the counters for the Seen, Sent, and Dropped parameters to zero, and the counters startaccumulating again.
TIP: Youcan reset thecounters toprovideamore targetedviewof theperformanceof your forwardingdestinations.
Reset Counters
Changes the configured name, format, IP address, port, or protocol.Edit
Deletes a forwarding destination
If the forwarding destination is associated with any active rules, youmust confirm that you want todelete the forwarding destination.
Delete
RelatedDocumentation
Viewing and Managing Routing Rules on page 290•
• Viewing Forwarding Destinations on page 288
289Copyright © 2018, Juniper Networks, Inc.
Chapter 20: Configuring JSA to Forward Data to Other Systems

Viewing andManaging Routing Rules
The Event Routing Ruleswindow provides valuable information about your routing rules.
You can view or manage configured filters and actions when data matches each rule.
Use the Event Routing Ruleswindow to edit, enable, disable, or delete a rule. You can
edit a routing rule to change the configured name, Event Collector, filters, or routing
options.
1. Click the Admin tab.
2. On the navigation menu, click SystemConfiguration.
3. Click the Routing Rules icon.
4. Select the routing rule you want to manage.
5. To edit the routing rule, on the toolbar, click Edit and update the parameters.
6. To remove the routing rule, on the toolbar, click Delete.
7. To enable or disable the routing rule, on the toolbar, click Enable/Disable.
If you enable a routing rule that is configured to drop events, a confirmationmessage
is displayed.
RelatedDocumentation
• Configuring Selective Forwarding on page 288
• Viewing Forwarding Destinations on page 288
• Viewing and Managing Forwarding Destinations on page 289
Copyright © 2018, Juniper Networks, Inc.290
Juniper Secure Analytics Administration Guide

CHAPTER 21
Event Store and Forward
• Event Store and Forward on page 291
• Store and Forward Overview on page 291
• Viewing the Store and Forward Schedule List on page 292
• Creating a New Store and Forward Schedule on page 294
• Editing a Store and Forward Schedule on page 295
• Deleting a Store and Forward Schedule on page 296
Event Store and Forward
Use the Store and Forward feature tomanage schedules for forwarding events from your
dedicatedEventCollectorappliances toEventProcessor components in yourdeployment.
The Store and Forward feature is supported on the Event Collector and Event Collector.
Formore information about these appliances, see the Juniper Secure Analytics Hardware
Guide.
A dedicatedEventCollector does not process events and it does not include anon-board
Event Processor. By default, a dedicated Event Collector continuously forwards events
to an Event Processor that youmust connect by using the Deployment Editor. Use the
StoreandForward feature to schedulea time range forwhenyouwant theEventCollector
to forward events. During the timewhen events are not forwarding, the events are stored
locally on the appliance. The events are not accessible in the JSA Console user interface.
Use the scheduling feature to store eventsduring yourbusinesshours. Forward theevents
to an Event Processor when the transmission does not negatively affect your network
bandwidth. For example, you can configure an Event Collector to forward events to an
Event Processor during non-business hours.
Store and Forward Overview
The Store and Forward feature is supported on the Event Collector and Event Collector
appliances. For more information on these appliances, see the Juniper Secure Analytics
Hardware Guide .
A dedicatedEventCollector does not process events and it does not include anon-board
Event Processor. By default, a dedicated Event Collector continuously forwards events
291Copyright © 2018, Juniper Networks, Inc.

to an Event Processor that youmust connect using the Deployment Editor. The Store
and Forward feature allows you to schedule a time range for when you want the Event
Collector to forward events. During the period of time when events are not forwarding,
the events are stored locally on the appliance and are not accessible using the Console
user interface.
This scheduling feature allows you to store events during your business hours and then
forward the events to an Event Processor during periods of time when the transmission
does not negatively affect your network bandwidth. For example, you can configure an
Event Collector to only forward events to an Event Processor during non-business hours,
such as midnight until 6 AM.
RelatedDocumentation
Viewing the Store and Forward Schedule List on page 292•
• Creating a New Store and Forward Schedule on page 294
• Editing a Store and Forward Schedule on page 295
Viewing the Store and Forward Schedule List
Use the Store and Forwardwindow to see a list of schedules. The schedules include
statistics that help youevaluate the status, performance, andprogressof your schedules.
Youmust create a schedule. By default, the first time that you access the Store and
Forwardwindow, no schedules are listed.
You can use options on the toolbar and the Display list box to change your view of the
schedule list. Change your view of the list to focus on the statistics from various points
of view. For example, if you want to view the statistics for a particular Event Collector,
you can select Event Collectors from the Display list. The list then groups by the Event
Collector column andmakes it easier for you to locate the Event Collector that you want
to investigate.
By default, the Store and Forward list is configured to display the list that is organized
by the schedule (Display >Schedules).
1. Click the Admin tab.
2. On the navigation menu, click SystemConfiguration.
3. Click the Store and Forward icon.
4. In the Store and Forwardwindow, view the parameters for each schedule.
The following table describes some of the parameters for the schedule.
Copyright © 2018, Juniper Networks, Inc.292
Juniper Secure Analytics Administration Guide

Table 69: Store and ForwardWindowParameters
DescriptionParameter
The Schedules option shows a hierarchy of the parent-child relationship between the schedules, eventprocessors, and the associated event collectors.
The Event Collectors option shows the lowest level in the hierarchy, which is a list of event collectors.
EventProcessorsoption showsahierarchy of theparent-child relationship between the event processorsand the associated event collectors.
Display
For the Schedules option, the Name column is displayed the following format.
• First Level represents the name of the schedule.
• Second Level represents the name of the event processor.
• Third Level represents the name of the event collector.
For the Event Processors option, the column is displayed in the following format
• First Level represents the name of the event processor.
• Second Level represents the name of the event collector.
TIP: You can use the plus symbol (+) andminus symbol (-) beside the name or options on the toolbarto expand and collapse the hierarchy tree. You can also expand and collapse the hierarchy tree by usingoptions on the toolbar.
Name
Displays the name of the schedule for the Event Collectors or Event Processors options.
If aneventprocessor is associatedwithmore thanoneschedule, theScheduleName shows<Multiple>n,where n is the number of schedules.
TIP: Click the plus symbol (+) to view the associated schedules.
Schedule Name
Displays the status of the Store and Forward process:
• Forwarding indicates that event forwarding is in progress.
• Forward Complete indicates that event forwarding is successfully completed and events are storedlocally on the event collector. The stored events are forwarded when the schedule indicates thatforwarding can start again.
• Warn indicates that the percentage of events that are remaining in storage exceeds the percentageof time that is remaining in the Store and Forward schedule.
• Error indicates that event forwarding was stopped before all stored events were forwarded.
• Inactive indicates that noevent collectors areassigned to the schedule, or theassignedevent collectorsare not receiving any events.
TIP: Move your mouse pointer over the Last Status column to view a summary of the status.
Last Status
Displays the number of events (in K, M, or G) forwarded in the current session.
TIP: Move your mouse pointer over the value in the Forwarded Events column to view the number ofevents.
Forwarded Events
Displays the number of events (in K, M, or G) remaining to be forwarded in the current session.
TIP: Move your mouse pointer over the value in the Remaining Events column to view the number ofevents.
Remaining Events
293Copyright © 2018, Juniper Networks, Inc.
Chapter 21: Event Store and Forward

Table 69: Store and ForwardWindowParameters (continued)
DescriptionParameter
Displays the average rate atwhich events are forwarding from the event collector to the event processor.
TIP: Move your mouse pointer over the value in the Average Event Rate column to view the averageevents per second (EPS).
Average Event Rate
Displays the rate at which events are forwarding from the event collector to the event processor.
TIP: Move yourmouse pointer over the value in theCurrent EventRate column to view the current eventsper second (EPS)
Current® Event Rate
The transfer rate limit is configurable.
The transfer rate limit can be configured to display in kilobytes per second (KBs), megabytes per second(MBs), or gigabytes per second (GBs).
Transfer Rate Limit
RelatedDocumentation
Creating a New Store and Forward Schedule on page 294•
• Editing a Store and Forward Schedule on page 295
• Deleting a Store and Forward Schedule on page 296
Creating a New Store and Forward Schedule
Use the Store and Forward Schedule wizard to create a schedule that controls when
your event collector starts and stops forwarding data to an event processor.
Youcancreateandmanagemultiple schedules tocontrol event forwarding frommultiple
JSA event collectors in a geographically distributed deployment.
Ensure that your dedicated event collector is added to your deployment and connected
toaneventprocessor. Theconnectionbetweenanevent collector andaneventprocessor
is configured in the Deployment Editor.
1. Click the Admin tab.
2. On the navigation menu, click SystemConfiguration.
3. Click the Store and Forward icon.
4. Click Actions >Create.
a. Click Next to move to the Select Collectors page.
b. On the Select Collectors page, configure the parameters.
Copyright © 2018, Juniper Networks, Inc.294
Juniper Secure Analytics Administration Guide

If the event collector that youwant to configure is not listed, it might not be added
to your deployment. If so, use theDeploymentEditor to add the event collector and
then proceed.
c. On the Schedule Options page, configure the parameters.
Toconfigure the forward transfer rate, theminimumtransfer rate is0.Themaximum
transfer rate is 9,999,999. A value of 0means that the transfer rate is unlimited.
d. Finish the configuration.
You can now view the schedule in the Store and Forwardwindow. After you create
a new schedule, it might take up to 10minutes for statistics to start displaying in
the Store and Forwardwindow.
RelatedDocumentation
Editing a Store and Forward Schedule on page 295•
• Deleting a Store and Forward Schedule on page 296
• Viewing the Store and Forward Schedule List on page 292
Editing a Store and Forward Schedule
You can edit a Store and Forward schedule to add or remove JSA event collectors and
change the schedule parameters. After you edit a Store and Forward schedule, the
statistics that are displayed in the Store and Forward list are reset.
1. Click the Admin tab.
2. On the navigation menu, click SystemConfiguration.
3. Click the Store and Forward icon.
4. Select the schedule that you want to edit.
5. Click Actions >Edit.
You can also double-click a schedule for editing.
6. Click Next to move to the Select Collectors page.
7. On the Select Collectors page, edit the parameters.
8. Click Next to move to the Schedule Options page.
9. On the Schedule Options page, edit the scheduling parameters.
295Copyright © 2018, Juniper Networks, Inc.
Chapter 21: Event Store and Forward

10. Click Next to move to the Summary page.
11. On the Summary page, confirm the options that you edited for this schedule.
After you edit a schedule, it might take up to 10minutes for statistics to update in the
Store and Forwardwindow.
RelatedDocumentation
Deleting a Store and Forward Schedule on page 296•
• Viewing the Store and Forward Schedule List on page 292
• Creating a New Store and Forward Schedule on page 294
Deleting a Store and Forward Schedule
You can delete a Store and Forward schedule.
1. On the navigation menu, click SystemConfiguration .
2. Click the Store and Forward icon.
3. Select the schedule that you want to delete.
4. Click Actions >Delete.
After the schedule is deleted, the associated JSA event collectors resume continuous
forwarding of events to their assigned event processor.
RelatedDocumentation
• Viewing the Store and Forward Schedule List on page 292
• Creating a New Store and Forward Schedule on page 294
• Editing a Store and Forward Schedule on page 295
Copyright © 2018, Juniper Networks, Inc.296
Juniper Secure Analytics Administration Guide

CHAPTER 22
Security Content
• Security Content on page 297
• Types Of Security Content on page 297
• Methods Of Importing and Exporting Content on page 298
• Content Type Identifiers for Exporting Custom Content on page 304
• Content Management Script Parameters on page 306
Security Content
You use the content management tools in JSA to import security content such as rules,
reports, dashboards and applications into JSA. Security content can come from other
JSA systems, or it can be developed independently to extend existing JSA capabilities.
Types Of Security Content
JSA content is bundled into two types: content packs and extensions.
Content packs—Security content packs contain enhancements to specific types ofsecurity content. Often, they include content for third-party integrations or operating
systems. For example, a security content pack for a third-party integration might
contain new custom event properties that make information in the event payload
searchable for the log source and available for reporting.
Extensions—Juniper andother vendorswrite security extensions that enhanceor extend
JSAcapabilities.Anextensioncancontainapps, content items, suchascustomrules,
report templates, saved searches, or contain updates to existing content items. For
example, an extension might include an app to add a tab in JSA that provides
visualizations for an offense.
Sources Of Security Content
JSA deployments—You export custom content from a JSA deployment as an extension
and then import it into another systemwhen you want to reuse the content. For
example, you can export content from your development environment to your
production environment. You can use the content management script to export all
content, or you can choose to export only some custom content.
297Copyright © 2018, Juniper Networks, Inc.

RelatedDocumentation
Methods Of Importing and Exporting Content on page 298•
• Content Type Identifiers for Exporting Custom Content on page 304
• Content Management Script Parameters on page 306
Methods Of Importing and Exporting Content
You can use the following tools to import and export content in your JSA deployment.
• Extensions Management Tool on page 298
• Content Management Script on page 298
• Exporting All Custom Content on page 298
• Exporting All Custom Content Of a Specific Type on page 299
• Searching for Specific Content Items to Export on page 300
• Exporting a Single Custom Content Item on page 302
• Exporting Custom Content Items Of Different Types on page 302
• Installing Extensions by Using Extensions Management on page 303
• Importing Content by Using the Content Management Script on page 303
• Updating Content by Using the Content Management Script on page 304
ExtensionsManagement Tool
Use the ExtensionsManagement tool to add extensions to your JSA deployment. When
you import content using the ExtensionsManagement tool, you can view the content
before it is installed. If the content items exist in your system, you can specify whether
to replace the content item or skip the update.
You cannot use the ExtensionsManagement tool to export content.
Content Management Script
Use thecontentmanagementscript toexport customcontent fromyour JSAdeployment
into an external, portable format. You can then use the script to import the custom
content into another JSA deployment. The script is useful when you want to automate
moving content between your JSA deployments.
The contentManagement.pl script is in the /opt/qradar/bin directory.
Youmust use the content management script to export content from the JSA source
deployment. You can use either the content management script or the Extensions
Management tool to import the content to the target deployment.
Exporting All CustomContent
You use the contentManagement.pl script to export all custom content in your JSA
deployment.
Copyright © 2018, Juniper Networks, Inc.298
Juniper Secure Analytics Administration Guide

1. Use SSH to log in to JSA as the root user.
2. Go to /opt/qradar/bin directory, and type the command to export all of the custom
content:
./contentManagement.pl -a export -c all
The content is exported to a compressed file, for example,
all-ContentExport-20151022101803.zip. Youcanmanually change the file nametoaname
that ismoredescriptive.Theexported filemightcontainmorecontent itemsthanexpected
because all dependencies are exported with the specified content items. For example,
if you export a report, the saved search that the report uses is also exported.
Exporting All CustomContent Of a Specific Type
You can export all custom content of a specific type in one action.
The contentmanagement script uses text identifiers or numeric identifiers to specify the
type of content that you want to export.
Table 70: Content Type Identifiers for Exporting CustomContent
Numeric identifierText identifierCustom content type
4dashboardDashboards
10reportReports
1searchSaved searches
12fgroupFGroups 1
13fgrouptypeFGroup types
3customruleCustom rules
6custompropertyCustom properties
17sensordeviceLog sources
24sensordevicetypeLog source types
18sensordevicecategoryLog source categories
16deviceextensionLog source extensions
28referencedataReference data collections
27qidmapCustomQIDmap entries
25historicalsearchHistorical correlation profiles
299Copyright © 2018, Juniper Networks, Inc.
Chapter 22: Security Content

Table 70: Content Type Identifiers for Exporting CustomContent (continued)
Numeric identifierText identifierCustom content type
77custom_functionCustom functions
78custom_actionCustom actions
100installed_applicationApplications
41dsmeventDSM event mapping
1An FGroup represents a group of content, such as a log source group, reporting group, or search group.
1. Use SSH to log in to JSA as the root user.
2. Go to the /opt/qradar/bin directory and type the command to export all content of
the specified type:
./contentManagement.pl -a export --content-type [content_type] --id all
The content is exported to a compressed file, for example,
reports-ContentExport-20151022101803.zip. You canmanually change the file name to
a name that is more descriptive. The exported file might contain more content items
than expected because all dependencies are exported with the specified content items.
For example, if you export a report, the saved search that the report uses is also exported.
Searching for Specific Content Items to Export
You use the content management script to search for specific content in your JSA
deployment. After you find the content, you can use the unique identifier to export the
content item.
The following table lists the identifiers to use when youwant to search for specific types
of content.
Table 71: Content Type Identifiers for Searching CustomContent
Numeric identifierText identifierCustom content type
4dashboardDashboards
10reportReports
1searchSaved searches
12fgroupFGroups 1
13fgrouptypeFGroup types
3customruleCustom rules
Copyright © 2018, Juniper Networks, Inc.300
Juniper Secure Analytics Administration Guide

Table 71: Content Type Identifiers for Searching CustomContent (continued)
Numeric identifierText identifierCustom content type
6custompropertyCustom properties
17sensordeviceLog sources
24sensordevicetypeLog source types
18sensordevicecategoryLog source categories
16deviceextensionLog source extensions
28referencedataReference data collections
27qidmapCustomQIDmap entries
25historicalsearchHistorical correlation profiles
77custom_functionCustom functions
78custom_actionCustom actions
100installed_applicationApplications
41dsmeventDSM event mapping
1An FGroup represents a group of content, such as a log source group, reporting group, or search group.
1. Use SSH to log in to JSA as the root user.
2. Go to the /opt/qradar/bin directory and type the following command to search for
custom content that matches a regular expression:
./contentManagement.pl -a search -c [content_type] -r [regex]
The search results list details, including the unique ID, for the content items that are
found.
[INFO] Search results:[INFO] - [ID] - [Name] - [Description] [INFO] - [67] - [Asset Profiler-2 :: hostname] - [Asset Profiler] [INFO] - [62] - [SIM Generic Log DSM-7 :: hostname] - [SIM Generic Log DSM]
[INFO] - [63] - [Custom Rule Engine-8 :: hostname] - [Custom Rule Engine] [INFO] - [71] - [Pix @ apophis] - [Pix device] [INFO] - [70] - [Snort @ wolverine] - [Snort device] [INFO] - [64] - [SIM Audit-2 :: hostname] - [SIM Audit] [INFO] - [69] - [Health Metrics-2 :: hostname] - [Health Metrics]
301Copyright © 2018, Juniper Networks, Inc.
Chapter 22: Security Content

Use theunique identifier to export specific content items from JSA. Formore information,
see “Exporting Custom Content Items Of Different Types” on page 302 and “Exporting a
Single Custom Content Item” on page 302.
Exporting a Single CustomContent Item
Export a single custom content item, such as a custom rule or a saved search, from JSA.
Youmust know theunique identifier for the customcontent item that youwant to export.
For information about finding the unique identifiers for content items, see “Creating a
Custom Property” on page 419.
1. Us SSH to log in to JSA as the root user.
2. Go to the /opt/qradar/bin directory and type the command to export the content:
./contentManagement.pl -a export -c [content_type] -i [content_identifier]
The content is exported to a compressed .zip file. The exported file might contain more
content items than expected because all dependencies are exported with the specified
content items. For example, if you export a report, the saved search that the report uses
is also exported. You canmanually change the file name to a name that is more
descriptive.
Exporting CustomContent Items Of Different Types
Export multiple custom content items from JSA, such as custom rules, or dashboards
and reports, by using the content management script.
Youmust know the unique identifiers for each custom content item that you want to
export. For informationabout finding theunique identifiers for content items, see “Creating
a Custom Property” on page 419.
1. Use SSH to log in to JSA as the root user.
2. Create a text file that lists the content that you want to export.
Each linemust include the custom content type followed by a comma-separated list
of unique IDs for that type.
3. Go to /opt/qradar/bin and type the command to export the content:
./contentManagement.pl -a export -c package -f [source_file]
The content is exported to a compressed .zip file. The exported file might contain more
content items than expected because all dependencies are exported with the specified
content items. For example, if you export a report, the saved search that the report uses
is also exported. You canmanually change the file name to a name that is more
descriptive.
Copyright © 2018, Juniper Networks, Inc.302
Juniper Secure Analytics Administration Guide

Installing Extensions by Using ExtensionsManagement
Use the ExtensionsManagement tool to add security extensions to JSA. The Extensions
Management tool lets youview thecontent items in theextensionandspecify themethod
of handling content updates before you install the extension.
Extensions must be on your local computer before you install them in JSA.
An extension is a bundle of JSA functionality. An extension can include content such as
rules, reports, searches, reference sets, and dashboards. It can also include applications
that enhance JSA functionality.
1. On the Admin tab, click ExtensionsManagement.
2. To upload a new extension to the JSA console, follow these steps:
a. Click Add.
b. Click Browse and navigate to find the extension.
c. Click Install immediately to install the extension without viewing the contents.
d. Click Add.
3. To view the contents of the extension, select it from the extensions list and clickMore
Details.
4. To install the extension, follow these steps:
a. Select the extension from the list and click Install.
b. If the extension does not include a digital signature, or it is signed but the signature
is not associatedwith the JSASecurityCertificateAuthority (CA), youmust confirm
that you still want to install it. Click Install to proceed with the installation.
c. Review the changes that the installation makes to the system.
d. SelectOverwrite or Keep existing data to specify how to handle existing content
items.
e. Click Install.
f. Review the installation summary and clickOK.
Importing Content by Using the Content Management Script
You can import custom content that you exported from another JSA system.
If youwant to import content fromanother JSA system, youmust first export the content
and copy it to the target system. For more information about exporting content, see
“Content Type Identifiers for Exporting Custom Content” on page 304.
When you import content that has log sources, confirm that DSM and protocol RPMs
are installed and current on the target system.
303Copyright © 2018, Juniper Networks, Inc.
Chapter 22: Security Content

Do not start multiple imports on the same system at the same time. The imports will fail
due to conflicts with shared resources.
1. Use SSH to log in to JSA as the root user.
2. Go to the directory where the export content file is located.
3. Type this command to import the content:
/opt/qradar/bin/contentManagement.pl -a import -f [source_file] -u [user]
The import script displays the following message when reference data is actively
collectedwhile it is being exported: Foreign key constraint violation. To avoid this issue,
run the export process when no reference data is being collected.
Updating Content by Using the Content Management Script
Use the update action to update existing JSA content or add new content to the system.
If you want to update content with content that was exported from another JSA system,
ensure that theexported file is on the target system.Formore informationaboutexporting
content, see “Content Type Identifiers for Exporting Custom Content” on page 304.
When you import content that has log sources, confirm that DSM and protocol RPMs
are installed and current on the target system.
Do not start multiple imports on the same system at the same time. The imports will fail
due to conflicts with shared resources.
1. Use SSH to log in to JSA as the root user.
2. To update content, type the following command:
/opt/qradar/bin/contentManagement.pl -a update -f [source_file]
Content Type Identifiers for Exporting CustomContent
Whenyouexporta specific typeof customcontent fromJSA, youmust specify thecontent
type. Youmust use either the text identifier or the numeric identifier for the content type.
When you export content from a JSA appliance, the content management script checks
content dependencies, and then includes associated content in the export.
For example, when the content management script detects that a saved search is
associated with a report that you want to export, the saved search is also exported. You
can't export offense, asset, or vulnerability saved searches.
You use the content type identifier when you want to export all custom content of a
specific type. If you want to export a specific content item from your JSA deployment,
Copyright © 2018, Juniper Networks, Inc.304
Juniper Secure Analytics Administration Guide

youmust know the unique identifier for that specific content item. Formore information,
see “Searching for Specific Content Items to Export” on page 300.
The following table describes the content type identifiers that are passed into the
contentManagement.pl script for the -c parameter.
Table 72: Content Type Identifiers for Exporting CustomContent
Numeric identifierText identifierCustom content type
Not applicableallAll custom content
Not applicablepackageCustom list of content
4dashboardDashboards
10reportReports
1searchSaved searches
12fgroupFGroups 1
13fgrouptypeFGroup types
3customruleCustom rules
6custompropertyCustom properties
17sensordeviceLog sources
24sensordevicetypeLog source types
18sensordevicecategoryLog source categories
16deviceextensionLog source extensions
28referencedataReference data collections
27qidmapCustomQIDmap entries
25historicalsearchHistorical correlation profiles
77custom_functionCustom functions
78custom_actionCustom actions
100installed_applicationApplications
41dsmeventDSM event mapping
1An FGroup is a group of content such as a log source group, reporting group, or search group.
305Copyright © 2018, Juniper Networks, Inc.
Chapter 22: Security Content

RelatedDocumentation
Content Management Script Parameters on page 306•
• Types Of Security Content on page 297
• Methods Of Importing and Exporting Content on page 298
Content Management Script Parameters
Use the contentManagement.pl script to export content from one JSA deployment and
import it to another deployment.
Table 73: ContentManagement.pl Script Parameters
DescriptionParameter
Required. Specifies the action.
Valid action types are export, search, import, and update.
The import action adds only content that does not exist in thedeployment.
-a[action_type]
or
--action[action_type]
Usedwith the export and search actions. Specifies the type of content.
When used with the export action, you can specify -c all or -c package,or you can type the “Content Type Identifiers for Exporting CustomContent” on page 304.When you use -c package, youmust specify the--file or --name parameters.
When usedwith the search action, youmust specify the “Content TypeIdentifiers for Exporting CustomContent” on page 304. You cannot use-c package or -c allwith the search action.
-c[content_type]
or
--content-type[content_type]
Used with all actions.
Usedebug level loggingwhen you run the contentManagement.pl scriptto seemore detailed information, such as logs for Juniper customersupport.
-d
or
--debug
Used with the export action.
Set this flag to include reference data keys and elements in the export.
Reference data keys and reference data elements are applicable to thereferencedata content type. This parameter is applicable onlywhen youexport referencedata, or content items thataredependenton referencedata.
-e
or
--include-reference-data-elements
Copyright © 2018, Juniper Networks, Inc.306
Juniper Secure Analytics Administration Guide

Table 73: ContentManagement.pl Script Parameters (continued)
DescriptionParameter
Used with export, import, and update actions.
When used with the export action, specifies the path and file name ofthe text file that contains the list of customcontent items that youwanttoexport. The first timeyouuse the --fileparameter, apackage templatefile iswritten to the /store/cmt/packagesdirectory so that youcan reuseit.
When used with the import or update action, specifies the file thatcontains the content items to import. Valid file types are zip, targz, andxml.
The filename and path are case-sensitive.
-f[file_path]
or
--file[file_path]
Used with the export action.
Includes accumulated data in the export.
-g
or
--global-view
Used with all actions.
Displays help that is specific to the action_type. When no action_type isspecified, displays a general help message.
-h[action_type]
or
--help[action_type]
Used with the export action.
Specifies “Creating a Custom Property” on page 419 such as a singlereport or a single reference set. You can specify all to “Exporting AllCustom Content Of a Specific Type” on page 299.
-i[content_identifier]
or
--id[content_identifier]
Used with the export action.
Specifies the name of the package template file that contains the listof custom content to export.
Thepackage template file is created the first time that you use the --fileparameter. The --nameparameter assumes that the package templatefile is in the /store/cmt/packages directory.
Youmust specify the --file or --name parameter when --content-typepackage is used.
-n[name]
or
--name[name]
Used with the export action.
Specifies the full path to the directory where the export file is written.
If no output directory is specified, the content is exported to the currentdirectory. If the specified output directory does not exist, it is created.
-o[filepath]
or
--output-directory[filepath]
Used with all actions. No output appears on the screen.-q
or
--quiet
307Copyright © 2018, Juniper Networks, Inc.
Chapter 22: Security Content

Table 73: ContentManagement.pl Script Parameters (continued)
DescriptionParameter
Used with the search action.
When searching, youmust use the --regex parameter to specify thecontent to search for. All content that matches the expression isdisplayed.
-r[regex]
or
--regex[regex]
Used with the export action.
Specifies the compression type of the export file. Valid compressiontypes are ZIP and TARGZ (case sensitive). If you do not specify acompression type, the default compression type is ZIP.
-t[compression_type]
or
--compression-type[compression_type]
Used with the import action.
Specifies the user that replaces the current owner when you importuser-specific data. The usermust exist on the target systembefore youimport the content.
-u[user]
or
--user[user]
Used with all actions.
Use when you log in to view default-level information for the contentmanagement tool.
-v
or
--verbose
RelatedDocumentation
• Types Of Security Content on page 297
• Methods Of Importing and Exporting Content on page 298
• Content Type Identifiers for Exporting Custom Content on page 304
Copyright © 2018, Juniper Networks, Inc.308
Juniper Secure Analytics Administration Guide

CHAPTER 23
SNMP Trap Configuration
• SNMP Trap Configuration on page 309
• Customizing the SNMP Trap Information Sent to Another System on page 309
• Customizing the SNMP Trap Output on page 311
• Adding a Custom SNMP Trap to JSA on page 312
• Sending SNMP Traps to a Specific Host on page 313
SNMP Trap Configuration
In JSA, you can configure a rule to generate a rule response that sends an SNMP trap
when configured conditions are met. JSA acts as an agent to send the SNMP traps to
another system.
ASimpleNetworkManagement Protocol (SNMP) trap is an event or offense notification
that JSA sends to a configured SNMP host for additional processing.
Customize the SNMP configuration parameters in the custom rules wizard andmodify
the SNMP traps that the custom rule engine sends to other software for management.
JSAprovides twodefault traps.However, youcanaddcustomtrapsormodify theexisting
traps to use new parameters.
For more information on SNMP, go to the The Internet Engineering Task Force
(http://www.ietf.org/) website and type RFC 1157 in the search field.
Customizing the SNMP Trap Information Sent to Another System
In JSA, you can edit the SNMP trap parameters to customize the information that is sent
to another SNMPmanaging systemwhen a rule condition is met.
NOTE: The SNMP trap parameters are displayed in the custom rules wizardonly if SNMP is enabled in the JSA system settings.
1. Use SSH to log in to JSA as the root user.
2. Go to the /opt/qradar/conf directory andmake backup copies of the following files:
309Copyright © 2018, Juniper Networks, Inc.

• eventCRE.snmp.xml
• offenseCRE.snmp.xml
3. Open the configuration file for editing.
• To edit the SNMP parameters for event rules, open the eventCRE.snmp.xml file.
• To edit the SNMP parameters for offense rules, open the offenseCRE.snmp.xml file.
4. Inside the <snmp> element and before the <creSNMPTrap> element, insert the
following section, updating the labels as needed:
<creSNMPResponse name=”snmp_response_1”> <custom name=”MyColor”> <string label=”What is your favorite color?”/></custom> <custom name=”MyCategory”> <list label=”Select a category”> <option label=”Label1” value=”Category1”/> <option label=”Label2” value=”Category2”/> </list> </custom></creSNMPResponse>
5. Save and close the file.
6. Copy the file from the /opt/qradar/conf directory to the
/store/configservices/staging/globalconfig directory.
7. Log in to the JSA interface.
8. On the Admin tab, select Advanced >Deploy Full Configuration.
When you deploy the full configuration, JSA restarts all services. Data collection for
events and flows stops until the deployment completes.
“Customizing the SNMP Trap Output” on page 311.
RelatedDocumentation
Customizing the SNMP Trap Output on page 311•
• Adding a Custom SNMP Trap to JSA on page 312
• Sending SNMP Traps to a Specific Host on page 313
Copyright © 2018, Juniper Networks, Inc.310
Juniper Secure Analytics Administration Guide

Customizing the SNMP Trap Output
JSA uses SNMP to send traps that provide information when rule conditions are met.
Bydefault, JSAuses the JSAmanagement informationbase (MIB) tomanage thedevices
in the communications network. However, you can customize the output of the SNMP
traps to adhere to another MIB.
1. Use SSH to log in to JSA as the root user.
2. Go to the /opt/qradar/conf directory andmake backup copies of the following files:
• eventCRE.snmp.xml
• offenseCRE.snmp.xml
3. Open the configuration file for editing.
• To edit the SNMP parameters for event rules, open the eventCRE.snmp.xml file.
• To edit the SNMP parameters for offense rules, open the offenseCRE.snmp.xml file.
4. To change the trap that is used for SNMP trap notification, update the following text
with the appropriate trap object identifier (OID):
-<creSNMPTrap version="3" OID="1.3.6.1.4.1.20212.1.1" name="eventCRENotification">
5. Use the following table to help you update the variable binding information:
EachvariablebindingassociatesaparticularMIBobject instancewith its current value.
Table 74: Value Types for Variable Binding
ExampleDescriptionValue type
Alphanumeric characters
You can configure multiplevalues.
<string>
name="ATTACKER_PORT" type="integer32">%ATTACKER_PORT%
A numerical value<integer32>
OID="1.3.6.1.4.1.20212.2.46"Each SNMP trap carries anidentifier that is assigned toan object within the MIB
<oid>
A numerical value range<gauge32>
A numerical value thatincrementswithinadefinedminimum andmaximumrange
<counter64>
311Copyright © 2018, Juniper Networks, Inc.
Chapter 23: SNMP Trap Configuration

6. For each of the value types, include any of the following fields:
Table 75: Fields for the Variable Bindings
ExampleDescriptionField
For more information aboutthese fields, see the/opt/qradar/conf/snmp.helpfile.
<Native>
Custom SNMP trapinformation that youconfigured for the customrules wizard
<Custom>
1Surround the field namewith percentage (%) signs. Within the percentage signs, fields must match the value type.
7. Save and close the file.
8. Copy the file from the /opt/qradar/conf directory to the
/store/configservices/staging/globalconfig directory.
9. Log in to the JSA interface.
10. On the Admin tab, select Advanced >Deploy Full Configuration.
When you deploy the full configuration, JSA restarts all services. Data collection for
events and flows stops until the deployment completes.
RelatedDocumentation
Adding a Custom SNMP Trap to JSA on page 312•
• Sending SNMP Traps to a Specific Host on page 313
• Customizing the SNMP Trap Information Sent to Another System on page 309
Adding a CustomSNMP Trap to JSA
In JSA products, you can create a new option for the SNMP trap selection in the custom
rules wizard. The trap names that are specified in the list box are configured in the
snmp-master.xmlconfiguration file.
1. Use SSH to log in to JSA as the root user.
2. Go to the /opt/qradar/conf directory.
3. Create an SNMP settings file for the new trap.
Copyright © 2018, Juniper Networks, Inc.312
Juniper Secure Analytics Administration Guide

TIP: Copy, rename, andmodify one of the existing SNMP settings files.
4. Make a backup copy of the snmp-master.xml file.
5. Open the snmp-master.xml file for editing.
6. Add a new <include> element.
The <include> element has the following attributes:
Table 76: Attributes for the <include> Element
DescriptionAttribute
Displayed in the list boxname
The name of the custom SNMP settings fileuri
<include name="Custom_Event_Name" uri="customSNMPdef01.xml"/>
The traps are displayed in the menu in the same order in which they are listed in the
snmp-master.xml file.
7. Save and close the file.
8. Copy the file from the /opt/qradar/conf directory to the
/store/configservices/staging/globalconfig directory.
9. Log in to the JSA interface.
10. On the Admin tab, select Advanced >Deploy Full Configuration.
When you deploy the full configuration, JSA restarts all services. Data collection for
events and flows stops until the deployment completes.
RelatedDocumentation
Sending SNMP Traps to a Specific Host on page 313•
• Customizing the SNMP Trap Information Sent to Another System on page 309
• Customizing the SNMP Trap Output on page 311
Sending SNMP Traps to a Specific Host
By default, in JSA products, SNMP traps are sent to the host that is identified in your
host.conf file. You can customize the snmp.xml file to send SNMP traps to a different
host.
313Copyright © 2018, Juniper Networks, Inc.
Chapter 23: SNMP Trap Configuration

1. Use SSH to log in to JSA as the root user.
2. Go to the /opt/qradar/conf directory andmake backup copies of the following files:
• eventCRE.snmp.xml
• offenseCRE.snmp.xml
3. Open the configuration file for editing.
• To edit the SNMP parameters for event rules, open the eventCRE.snmp.xml file.
• To edit the SNMP parameters for offense rules, open the offenseCRE.snmp.xml file.
4. Add nomore than one <trapConfig> element inside the <snmp> element inside the
<creSNMPTrap> element and before any other child elements.
<trapConfig> <!-- All attribute values are default --> <snmpHost snmpVersion="3" port="162" retries="2" timeout="500">HOST </snmpHost> <!-- Community String for Version 2 --> <communityString>COMMUNITY_STRING</communityString> <!-- authenticationProtocol (MD5 or SHA)securityLevel (AUTH_PRIV, AUTH_NOPRIV or NOAUTH_PRIV) --> <authentication authenticationProtocol="MD5"securityLevel="AUTH_PRIV">
AUTH_PASSWORD </authentication> <!-- decryptionProtocol (DES, AES128, AES192 or AES256) --> <decryption decryptionProtocol="AES256"> DECRYPTIONPASSWORD </decryption> <!-- SNMP USER--> <user> SNMP_USER </user> </trapConfig>
5. Use the following table to help you update the attributes.
Table 77: Attribute Values to Update in the <trapConfig> Element
DescriptionElement
The new host to which you want to send SNMP traps.
The value for thesnmpVersion attribute for <snmpHost> element must be 2 or 3.
</snmpHost>
The community string for the host<communityString>
An authentication protocol, security level, and password for the host.<authentication>
The decryption protocol and password for the host.<decryption>
SNMP user<user>
Copyright © 2018, Juniper Networks, Inc.314
Juniper Secure Analytics Administration Guide

6. Save and close the file.
7. Log in to the JSA interface.
8. On the Admin tab, select Advanced >Deploy Full Configuration.
When you deploy the full configuration, JSA restarts all services. Data collection for
events and flows stops until the deployment completes.
RelatedDocumentation
• Customizing the SNMP Trap Information Sent to Another System on page 309
• Customizing the SNMP Trap Output on page 311
• Adding a Custom SNMP Trap to JSA on page 312
315Copyright © 2018, Juniper Networks, Inc.
Chapter 23: SNMP Trap Configuration

Copyright © 2018, Juniper Networks, Inc.316
Juniper Secure Analytics Administration Guide

CHAPTER 24
Protect Sensitive Data
• Protect Sensitive Data on page 317
• How Does Data ObfuscationWork? on page 317
• Data Obfuscation Profiles on page 318
• Data Obfuscation Expressions on page 319
• Scenario: Obfuscating User Names on page 320
Protect Sensitive Data
Configure a data obfuscation profile to prevent unauthorized access to sensitive or
personal identifiable information in JSA.
Data obfuscation is the process of strategically hiding data from JSA users. You can hide
customproperties, normalizedproperties, suchasusernames, or youcanhide thecontent
of a payload, such as credit card or social security numbers.
The expressions in the data obfuscation profile are evaluated against the payload and
normalizedproperties. If thedatamatches theobfuscationexpression, thedata is hidden
in JSA. Users who try to query the database directly cannot see the sensitive data. The
datamust be reverted back to its original form, or deobfuscated, by uploading the private
key that was generated when the data obfuscation profile was created.
To ensure that JSA can still correlate on the hidden data values, the obfuscation process
is deterministic. It displays the same set of characters each time the data value is found.
HowDoes Data ObfuscationWork?
Before you configure data obfuscation in your JSA deployment, youmust understand
how it works for new and existing offenses, assets, rules, and log source extensions.
Existing Event Data
When a data obfuscation profile is enabled, the systemmasks the data for each event
as it is received by JSA. Events that are received by the appliance before data obfuscation
is configured remain in theoriginal unobfuscatedstate.Theolder eventdata isnotmasked
and users can see the information.
317Copyright © 2018, Juniper Networks, Inc.

Assets
When data obfuscation is configured, the assetmodel accumulates data that is masked
while the pre-existing asset model data remains unmasked.
To prevent someone from using unmasked data to trace the obfuscated information,
purge the assetmodel data to remove the unmasked data. JSAwill repopulate the asset
database with obfuscated values.
Offenses
To ensure that offenses do not display data that was previously unmasked, close all
existing offenses by resetting the SIMmodel. For more information, see “Resetting SIM”
on page 34.
Rules
Youmust update rules that depend on data thatwas previously unmasked. For example,
rules that arebasedonaspecific user namedonot firewhen theuser name isobfuscated.
Log Source Extensions
Log source extensions that change the format of the event payload can cause issues
with data obfuscation.
RelatedDocumentation
Data Obfuscation Profiles on page 318•
• Data Obfuscation Expressions on page 319
• Scenario: Obfuscating User Names on page 320
Data Obfuscation Profiles
The data obfuscation profile contains information about which data to mask. It also
tracks the keystore that is required to decrypt the data.
Enabled profiles—Enable a profile only when you are sure that the expressions correctlytarget the data that youwant to obfuscate. If youwant to test the regular expression
before youenable thedataobfuscationprofile, youcancreatea regex-basedcustom
property.
A profile that is enabled immediately begins obfuscating data as defined by the
enabled expressions in the profile. The enabled profile is automatically locked. Only
the user who has the private key can disable or change the profile after it is enabled.
To ensure that obfuscated data can be traced back to an obfuscation profile, you
cannot delete a profile that was enabled, even after you disable it.
Locked profiles—A profile is automatically locked when you enable it, or you can lock it
manually.
Copyright © 2018, Juniper Networks, Inc.318
Juniper Secure Analytics Administration Guide

A locked profile has the following restrictions:
• You cannot edit it.
• You cannot enable or disable it. Youmust provide the keystore and unlock the
profile before you can change it.
• You cannot delete it, even after it is unlocked.
• If a keystore is used with a profile that is locked, all other profiles that use that
keystore are automatically locked.
The following table shows examples of profiles that are locked or unlocked:
Table 78: Locked Profile Examples
ResultScenario
Profile B is automatically locked.Profile A is locked. It was created by using keystore A.
Profile B is also created by using keystore A.
Profile A is automatically locked.Profile A is created and enabled.
Profile A, Profile B, andProfile C are all unlocked.Profile A, Profile B, and Profile C are currently locked. All were created byusing keystore A.
Profile B is selected and Lock/Unlock is clicked.
RelatedDocumentation
Data Obfuscation Expressions on page 319•
• Scenario: Obfuscating User Names on page 320
• How Does Data ObfuscationWork? on page 317
Data Obfuscation Expressions
Data obfuscation expressions identify the data to hide. You can create data obfuscation
expressions that are based on field-based properties or you can use regular expressions.
Field-based Properties
Use a field-based property to hide user names, group names, host names, and NetBIOS
names. Expressions that use field-based properties obfuscate all instances of the data
string. The data is hidden regardless of its log source, log source type, event name, or
event category.
If the same data value exists in more than one of the fields, the data is obfuscated in all
fields that contain the data even if you configured the profile to obfuscate only one of
the four fields. For example, if you have a host name that is called JSAHost and a group
name that is called JSAHost, the value JSAHost is obfuscated in both the host name field
319Copyright © 2018, Juniper Networks, Inc.
Chapter 24: Protect Sensitive Data

and the group name field even if the data obfuscation profile is configured to obfuscate
only host names.
Regular Expressions
Use a regular expression to obfuscate one data string in the payload. The data is hidden
only if it matches the log source, log source type, event name, or category that is defined
in the expression.
You can use high-level and low-level categories to create a regular expression that is
more specific than a field-based property. For example, you can use the following regex
patterns to parse user names:
Table 79: Regex User Name Parsing
MatchesExample regex patterns
[email protected], [email protected],[email protected]
usrName=([0-9a-zA-Z]([-.\w]*[0-9a-zA-Z])*@([0-9a-zA-Z][-\w]*[0-9a-zA-Z]\.)+[a-zA-Z]{2,20})$
john.smith, John.Smith, john, jon_smithusrName=(^([\w]+[^\W])([^\W]\.?)([\w]+[^\W]$))
johnsmith, Johnsmith123, john_smith123,john123_smith, john-smith
usrName=^([a-zA-Z])[a-zA-Z_-]*[\w_-]*[\S]$|^([a-zA-Z])[0-9_-]*[\S]$|^[a-zA-Z]*[\S]$
Matches any non-white space after theequal, =, sign. This regular expression isnon-specific and can lead to systemperformance issues.
usrName=(/S+)
Matches users with IP address. Forexample, [email protected]
msg=([0-9a-zA-Z]([-.\w]*[0-9a-zA-Z]))*@\b(([01]?\d?\d|2[0-4]\d|25[0-5])\.){3}([01]?\d?\d|2[0-4]\d|25[0-5])\b
Matches IP address formats.src=\b(([01]?\d?\d|2[0-4]\d|25[0-5])\.){3}([01]?\d?\d|2[0-4]\d|25[0-5])\b
hostname.ibm.com, hostname.co.uk,host=^(([a-zA-Z0-9]|[a-zA-Z0-9][a-zA-Z0-9\-]*[a-zA-Z0-9])\.)*([A-Za-z0-9]|[A-Za-z0-9][A-Za-z0-9\-]*[A-Za-z0-9])$
RelatedDocumentation
Scenario: Obfuscating User Names on page 320•
• How Does Data ObfuscationWork? on page 317
• Data Obfuscation Profiles on page 318
Scenario: Obfuscating User Names
Youare an JSAadministrator. Your organization has anagreementwith theworkers union
that all personal identifiable information must be hidden from JSA users. You want to
configure JSA to hide all user names.
Copyright © 2018, Juniper Networks, Inc.320
Juniper Secure Analytics Administration Guide

Use theDataObfuscationManagement feature on theAdmin tab to configure JSA to hide
the data:
1. Create a data obfuscation profile and download the system-generated private key.
Save the key in a secure location.
2. Create the data obfuscation expressions to target the data that you want to hide.
3. Enable the profile so that the system begins to obfuscate the data.
4. To read the data in JSA, upload the private key to deobfuscate the data.
• Creating a Data Obfuscation Profile on page 321
• Creating Data Obfuscation Expressions on page 322
• Deobfuscating Data So That It Can Be Viewed in the Console on page 323
• EditingorDisablingObfuscationExpressionsCreated inPreviousReleasesonpage324
Creating a Data Obfuscation Profile
JSA uses data obfuscation profiles to determine which data to mask, and to ensure that
the correct keystore is used to unmask the data.
You can create a profile that creates a new keystore or you can use an existing keystore.
If you create a keystore, it must be downloaded and stored in a secure location. Remove
the keystore from the local system and store it in a location that can be accessed only
by users who are authorized to view the unmasked data.
Configuring profiles that use different keystores is useful when you want to limit data
access to different groups of users. For example, create two profiles that use different
keystores when you want one group of users to see user names and another group of
users to see host names.
1. Click the Admin tab.
2. On the navigation menu, click Data Sources >Data ObfuscationManagement.
3. To create a new profile, click Add and type a unique name and description for the
profile.
4. To create a new keystore for the profile, complete these steps:
a. Click System generate keystore.
b. In the Provider list box, select JSAJCE.
c. In the Algorithm list box, select JCE and select whether to generate 512-bit or
1024-bit encryption keys.
In the Keystore Certificate CN box, the fully qualified domain name for the JSA
server is auto-populated.
d. In the Keystore password box, enter the keystore password.
321Copyright © 2018, Juniper Networks, Inc.
Chapter 24: Protect Sensitive Data

The keystore password is required to protect the integrity of the keystore. The
passwordmust be at least 8 characters in length.
e. In the Verify keystore password, retype the password.
5. To use an existing keystore with the profile, complete these steps:
a. Click Upload keystore.
b. Click Browse and select the keystore file.
c. In the Keystore password box, type the password for the keystore.
6. Click Submit.
7. Download the keystore.
Remove the keystore from your system and store it in a secure location.
“Creating DataObfuscation Expressions” on page 322 that target the data that youwant
to hide.
Creating Data Obfuscation Expressions
After an expression is created, you cannot change the type. For example, you cannot
create a property-based expression and then later change it to a regular expression.
You cannot obfuscate a normalized numeric field, such as port number or an IP address.
Multiple expressions that obfuscate the same data cause data to be obfuscated twice.
To decrypt data that is obfuscatedmultiple times, each keystore that is used in the
obfuscation process must be applied in the order that the obfuscation occurred.
1. Click the Admin tab.
2. On the navigation menu, click Data Sources >Data ObfuscationManagement.
3. Click the profile that you want to configure, and click View Contents.
You cannot configure profiles that are locked.
4. To create a new data obfuscation expression, click Add and type a unique name and
description for the profile.
5. Select the Enabled check box to enable the profile.
6. To create a field-based expression, click Field Based and select the field type to
obfuscate.
Copyright © 2018, Juniper Networks, Inc.322
Juniper Secure Analytics Administration Guide

7. To create a regular expression, click RegEx and configure the regex properties.
8. Click Save.
The data obfuscation profile uses expressions to specify which data to hide. The
expressions can use either field-based properties or regular expressions.
Deobfuscating Data So That It Can Be Viewed in the Console
When data obfuscation is configured on an JSA system, the masked version of the data
is shown throughout the application. Youmust have both the corresponding keystore
and the password to deobfuscate the data so that it can be viewed.
Youmust have the private key and the password for the key before you can deobfuscate
data. The private key must be on your local computer.
Before you can see the obfuscated data, youmust upload the private key. After the key
is uploaded, it remains available on the system for the duration of the current session.
The session endswhen you log out of JSA, when the cache is cleared on the JSA console,
or when there is an extended period of inactivity.When the session ends, the private keys
that were uploaded in the previous session are no longer visible.
JSA can use the keys available in the current session to automatically deobfuscate data.
With auto-deobfuscation enabled, you do not have to repeatedly select the private key
on theObfuscation Session Keywindow each time that you want to view the data.
Auto-deobfuscate is automatically disabled when the current session ends.
1. On the Event Details page, find the data that you want to deobfuscate.
2. To deobfuscate identity-based data:
a. Click the lock icon next to the data that you want to deobfuscate.
b. In the Upload Key section, click Select File and select the keystore to upload.
c. In the Password box, type the password that matches the keystore.
d. Click Upload.
The Deobfuscationwindow shows the event payload, the profile names that are
associated with the keystore, the obfuscated text, and the deobfuscated text.
e. Click Toggle Auto Deobfuscate to enable auto-deobfuscation.
After you toggle the auto-deobfuscation setting, youmust refresh the browser
window and reload the event details page for the changes to appear.
3. To deobfuscate payload data that is not identity-based:
a. On the toolbar on the Event Details page, clickObfuscation >Deobfuscation keys.
b. In the Upload Key section, click Select File and select the private key to upload.
c. In the Password box, type the password that matches the private key and click
Upload.
323Copyright © 2018, Juniper Networks, Inc.
Chapter 24: Protect Sensitive Data

d. In thePayload informationbox, select andcopy theobfuscated text to theclipboard.
e. On the toolbar on the Event Details page, clickObfuscation >Deobfuscation.
f. Paste the obfuscated text in to dialog box.
g. Select the obfuscation profile from the drop-down list and click Deobfuscate.
Editing or Disabling Obfuscation Expressions Created in Previous Releases
To disable an old expression, youmust edit the xml configuration file that defines the
attributes for theexpression. Youcan then run theobfuscation_updater.sh script todisable
it.
Ensure that youdisableoldexpressionsbefore youcreatenewexpressions thatobfuscate
the same data. Multiple expressions that obfuscate the same data cause the data to be
obfuscated twice. To decrypt data that is obfuscatedmultiple times, each keystore that
is used in the obfuscation process must be applied in the order that the obfuscation
occurred.
1. Use SSH to log in to your JSA Console as the root user.
2. Edit the obfuscation expressions .xml configuration file that you created when you
configured the expressions.
3. For each expression that you want to disable, change the Enabled attribute to false.
4. Todisable theexpressions, run theobfuscation_updater.sh scriptby typing the following
command:
obfuscation_updater.sh [-p <path_to_private_key>] [-e<path_to_obfuscation_xml_config_file>]
The obfuscation_updater.sh script is in the /opt/qradar/bin directory, but you can run
the script from any directory on your JSA Console.
“Creating a Data Obfuscation Profile” on page 321 to obfuscate data andmanage
obfuscation expressions directly in JSA.
When you upgrade to JSA 2014.6, data obfuscation expressions that were created in
previous releases are automatically carried forward and continue to obfuscate data.
These expressions appear in a single data obfuscation profile, named
AutoGeneratedProperty.
Although you can see the expressions, you cannot edit or disable data obfuscation
expressions that were created in earlier versions. Youmust manually disable them and
create a data obfuscation profile that contains the revised expressions.
RelatedDocumentation
• How Does Data ObfuscationWork? on page 317
• Data Obfuscation Profiles on page 318
Copyright © 2018, Juniper Networks, Inc.324
Juniper Secure Analytics Administration Guide

• Data Obfuscation Expressions on page 319
325Copyright © 2018, Juniper Networks, Inc.
Chapter 24: Protect Sensitive Data

Copyright © 2018, Juniper Networks, Inc.326
Juniper Secure Analytics Administration Guide

CHAPTER 25
Log Files
• Log Files on page 327
• Audit Logs on page 327
Log Files
Operations performed in JSA are recorded in log files for tracking purposes. Log files can
help you troubleshoot problems by recording the activities that take place when you
work with a product.
The following log files can help you identify and resolve problems when they occur:
• /var/log/qradar.log
• /var/log/qradar.error
• /var/log/qradar-sql.log
• /opt/tomcat6/logs/catalina.out
• /var/log/qflow.debug
If you want to collect the JSA log files and review them later, see “Collecting Log Files”
on page 74.
Audit Logs
Changes that are made by JSA users are recorded in the audit logs.
Youcanview theaudit logs tomonitor changes to JSAand theuserswhochangesettings.
All audit logs are stored in plain text and are archived and compressed when the audit
log file reaches 200MB. The current log file is named audit.log. When the file reaches
200MB, the file is compressed and renamed to audit.1.gz. The file number increments
each time that a log file is archived. JSA stores up to 50 archived log files.
• Viewing the Audit Log File on page 328
• Logged Actions on page 329
327Copyright © 2018, Juniper Networks, Inc.

Viewing the Audit Log File
You can use Log Activity tab to view normalized audit log events.
Themaximum size of any audit message, excluding date, time, and host name, is 1024
characters.
Each entry in the log file displays by using the following format:
<date_time><hostname><user>@<IPaddress>(thread ID)[<category>][<sub-category>]
[<action>] <payload>
The following table describes the log file format options.
Table 80: Description Of the Parts Of the Log File Format
DescriptionFile format part
The date and time of the activity in the format: Month Date HH:MM:SSdate_time
The host name of the Console where this activity was logged.host name
The name of the user who changed the settings.user
The IP address of the user who changed the settings.IP address
The identifier of the Java thread that logged this activity.thread ID)
The high-level category of this activity.category
The low-level category of this activity.sub-categor
The activity that occurred.action
The complete record, whichmight include the user record or event rule, that changed.payload
1. Using SSH, log in to JSA as the root user:
2. User Name: root
3. Password: password
4. Go to the following directory:
/var/log/audit
5. Open and view the audit log file.
UseSecureShell (SSH) to log in to your JSA systemandmonitor changes to your system.
Copyright © 2018, Juniper Networks, Inc.328
Juniper Secure Analytics Administration Guide

Logged Actions
Understand the content of JSA audit log file in the /var/log/audit directory. The audit log
file contains logged actions.
The following list describes the categories of actions that are in the audit log file:
• Administrator Authentication
• Log in to the Administration Console.
• Log out of the Administration Console.
• Assets
• Delete an asset.
• Delete all assets.
• Audit Log Access—A search that includes events that have a high-level event category
of Audit.
• Backup and Recovery
• Edit the configuration.
• Initiate®the backup.
• Complete the backup.
• Fail the backup.
• Delete the backup.
• Synchronize the backup.
• Cancel the backup.
• Initiate®the restore.
• Upload a backup.
• Upload an invalid backup.
• Initiate®the restore.
• Purge the backup.
• Chart Configuration—Save flow or event chart configuration.
• Content Management
• Content export initiated.
• Content export complete.
• Content import initiated.
• Content import complete.
• Content update initiated.
329Copyright © 2018, Juniper Networks, Inc.
Chapter 25: Log Files

• Content update complete.
• Content search initiated.
• Applications added.
• Applications modified.
• Custom actions added.
• Custom actions modified.
• Ariel property added.
• Ariel property modified.
• Ariel property expression added.
• Ariel property expression modified.
• CRE rule added.
• CRE rule modified.
• Dashboard added.
• Dashboard modified.
• Device extension added.
• Device extension modified.
• Device extension association modified.
• Grouping added.
• Grouping modified.
• Historical correlation profile added.
• Historical correlation profile modified.
• QIDmap entry added.
• QIDmap entry modified.
• Reference data created.
• Reference data updated.
• Security profile added.
• Security profile modified.
• Sensor device added.
• Sensor device modified.
• Custom Properties
• Add a custom event property.
• Edit a custom event property.
• Delete a custom event property.
Copyright © 2018, Juniper Networks, Inc.330
Juniper Secure Analytics Administration Guide

• Edit a custom flow property.
• Delete a custom flow property.
• Custom Property Expressions
• Add a custom event property expression.
• Edit a custom event property expression.
• Delete a custom event property expression.
• Add a custom flow property expression.
• Edit a custom flow property expression.
• Delete a custom flow property expression.
• Flow Sources
• Add a flow source.
• Edit a flow source.
• Delete a flow source.
• Groups
• Add a group.
• Delete a group.
• Edit a group.
• Historical Correlation
• Add a historical correlation profile.
• Delete a historical correlation profile.
• Modify a historical correlation profile.
• Enable a historical correlation profile.
• Disable a historical correlation profile.
• Historical correlation profile is running.
• Historical correlation profile is canceled.
• High Availability
• Add a license key.
• Revert a license.
• Delete a license key.
• Log Source Extension
• Add an log source extension.
• Edit the log source extension.
331Copyright © 2018, Juniper Networks, Inc.
Chapter 25: Log Files

• Delete a log source extension.
• Upload a log source extension.
• Upload a log source extension successfully.
• Upload an invalid log source extension.
• Download a log source extension.
• Report a log source extension.
• Modify a log sources association to a device or device type.
• Offenses
• Hide an offense.
• Close an offense.
• Close all offenses.
• Add a destination note.
• Add a source note.
• Add a network note.
• Add an offense note.
• Add a reason for closing offenses.
• Edit a reason for closing offenses.
• Protocol Configuration
• Add a protocol configuration.
• Delete a protocol configuration.
• Edit a protocol configuration.
• QIDmap
• Add a QIDmap entry.
• Edit a QIDmap entry.
• JSA Vulnerability Manager
• Create a scanner schedule.
• Update a scanner schedule.
• Delete a scanner schedule.
• Start a scanner schedule.
• Pause a scanner schedule.
• Resume a scanner schedule.
• Reference Sets
Copyright © 2018, Juniper Networks, Inc.332
Juniper Secure Analytics Administration Guide

• Create a reference set.
• Edit a reference set.
• Purge elements in a reference set.
• Delete a reference set.
• Add reference set elements.
• Delete reference set elements.
• Delete all reference set elements.
• Import reference set elements.
• Export reference set elements.
• Reports
• Add a template.
• Delete a template.
• Edit a template.
• Generate a report.
• Delete a report.
• Delete generated content.
• View a generated report.
• Email a generated report.
• Retention Buckets
• Add a bucket.
• Delete a bucket.
• Edit a bucket.
• Enable or disable a bucket.
• Root Login
• Log in to JSA, as root user.
• Log out of JSA, as root user.
• Rules
• Add a rule.
• Delete a rule.
• Edit a rule.
• Scanner
• Add a scanner.
333Copyright © 2018, Juniper Networks, Inc.
Chapter 25: Log Files

• Delete a scanner.
• Edit a scanner.
• Scanner Schedule
• Add a schedule.
• Edit a schedule.
• Delete a schedule.
• Session Authentication
• Create an administration session.
• Terminate an administration session.
• Deny an invalid authentication session.
• Expire a session authentication.
• Create an authentication session.
• Terminate an authentication session.
• SIM
Clean a SIMmodel.
• Store and Forward
• Add a Store and Forward schedule.
• Edit a Store and Forward schedule.
• Delete a Store and Forward schedule.
• Syslog Forwarding
• Add a syslog forwarding.
• Delete a syslog forwarding.
• Edit a syslog forwarding.
• SystemManagement
• Shut down a system.
• Restart a system.
• User Accounts
• Add an account.
• Edit an account.
• Delete an account.
• User Authentication
• Log in to the user interface.
Copyright © 2018, Juniper Networks, Inc.334
Juniper Secure Analytics Administration Guide

• Log out of the user interface.
• User Authentication Ariel
• Deny a login attempt.
• Add an Ariel property.
• Delete an Ariel property.
• Edit an Ariel property.
• Add an Ariel property extension.
• Delete an Ariel property extension.
• Edit an Ariel property extension.
• User Roles
• Add a role.
• Edit a role.
• Delete a role.
• VIS
• Discover a new host.
• Discover a new operating system.
• Discover a new port.
• Discover a new vulnerability.
335Copyright © 2018, Juniper Networks, Inc.
Chapter 25: Log Files

Copyright © 2018, Juniper Networks, Inc.336
Juniper Secure Analytics Administration Guide

CHAPTER 26
Event Categories
• Event Categories on page 337
• High-level Event Categories on page 338
• Recon on page 339
• DoS on page 341
• Authentication on page 344
• Access on page 350
• Exploit on page 352
• Malware on page 354
• Suspicious Activity on page 355
• System on page 358
• Policy on page 363
• Unknown on page 364
• CRE on page 365
• Potential Exploit on page 365
• User Defined on page 366
• SIM Audit on page 368
• VIS Host Discovery on page 369
• Application on page 370
• Audit on page 390
• Risk on page 391
• Risk Manager Audit on page 392
• Control on page 393
• Asset Profiler on page 395
Event Categories
Event categories are used to group incoming events for processing by JSA. The event
categories are searchable and help youmonitor your network.
337Copyright © 2018, Juniper Networks, Inc.

Events thatoccur onyour networkareaggregated intohigh-level and low-level categories.
Each high-level category contains low-level categories and an associated severity level.
You can review the severity levels that are assigned to events and adjust them to suit
your corporate policy needs.
High-level Event Categories
Events in JSA log sources are grouped into high-level categories. Each event is assigned
to a specific high-level category.
Categorizing the incoming events ensures that you can easily search the data..
The following table describes the high-level event categories.
Table 81: High-level Event Categories
DescriptionCategory
Events that are related to scanning and other techniques that are used to identifynetwork resources, for example, network or host port scans.
“Recon” on page 339
Events that are related to denial-of-service (DoS) or distributed denial-of-service(DDoS) attacks against services or hosts, for example, brute force network DoSattacks.
“DoS” on page 341
Events that are related to authentication controls, group, or privilege change, forexample, log in or log out.
“Authentication” on page 344
Events resulting froman attempt to access network resources, for example, firewallaccept or deny.
“Access” on page 350
Events that are related to application exploits and buffer overflow attempts, forexample, buffer overflow or web application exploits.
“Exploit” on page 352
Events that are related to viruses, trojans, backdoor attacks, or other formsof hostilesoftware. Malware events might include a virus, trojan, malicious software, orspyware.
“Malware” on page 354
The nature of the threat is unknown but behavior is suspicious. The threat mightincludeprotocol anomalies thatpotentially indicateevasive techniques, for example,packet fragmentationor known intrusiondetectionsystem(IDS)evasion techniques.
“Suspicious Activity” on page 355
Events thatare related to systemchanges, software installation, or statusmessages.“System” on page 358
Events regarding corporate policy violations or misuse.“Policy” on page 363
Events that are related to unknown activity on your system.“Unknown” on page 364
Events that are generated from an offense or event rule.“CRE” on page 365
Events relate to potential application exploits and buffer overflow attempts.“Potential Exploit” on page 365
Events that are related to user-defined objects.“User Defined” on page 366
Copyright © 2018, Juniper Networks, Inc.338
Juniper Secure Analytics Administration Guide

Table 81: High-level Event Categories (continued)
DescriptionCategory
Events that are related to user interaction with the Console and administrativefunctions.
“SIM Audit” on page 368
Events that are related to the host, ports, or vulnerabilities that the VIS componentdiscovers.
“VIS Host Discovery” on page 369
Events that are related to application activity.“Application” on page 370
Events that are related to audit activity.“Audit” on page 390
Events that are related to risk activity in JSA Risk Manager.“Risk” on page 391
Events that are related to audit activity in JSA Risk Manager.“Risk Manager Audit” on page 392
Events that are related to your hardware system.“Control” on page 393
Events that are related to asset profiles.“Asset Profiler” on page 395
RelatedDocumentation
Recon on page 339•
• DoS on page 341
• Authentication on page 344
Recon
The Recon category contains events that are related to scanning and other techniques
that are used to identify network resources.
The following table describes the low-level event categories and associated severity
levels for the Recon category.
Table 82: Low-level Categories and Severity Levels for the Recon Events Category
Severitylevel (0 -10)DescriptionLow-level event category
2An unknown form of reconnaissance.Unknown Form of Recon
3Reconnaissance to applications on your system.Application Query
3Reconnaissance to a host in your network.Host Query
4Reconnaissance on your network.Network Sweep
3Reconnaissance on your mail system.Mail Reconnaissance
339Copyright © 2018, Juniper Networks, Inc.
Chapter 26: Event Categories

Table 82: Low-level Categories and Severity Levels for the Recon Events Category (continued)
Severitylevel (0 -10)DescriptionLow-level event category
3Reconnaissance for Windows operating system.Windows Reconnaissance
3Reconnaissance on your portmap or RPC request.Portmap / RPC r\Request
4Indicates that a scan occurred on the host ports.Host Port Scan
3Indicates that Remote Procedure Call (RPC) information isremoved.
RPC Dump
3Reconnaissance on the DNS server.DNS Reconnaissance
2Miscellaneous reconnaissance event.Misc Reconnaissance Event
3Web reconnaissance on your network.Web Reconnaissance
3Database reconnaissance on your network.Database Reconnaissance
3Reconnaissance on ICMP traffic.ICMP Reconnaissance
3Reconnaissance on UDP traffic.UDP Reconnaissance
3Reconnaissance on SNMP traffic.SNMP Reconnaissance
3Indicates an ICMP host query.ICMP Host Query
3Indicates a UDP host query.UDP Host Query
3Indicates NMAP reconnaissance.NMAP Reconnaissance
3Indicates TCP reconnaissance on your network.TCP Reconnaissance
3Reconnaissance on your UNIX network.UNIX Reconnaissance
3Indicates FTP reconnaissance.FTP Reconnaissance
RelatedDocumentation
DoS on page 341•
• Authentication on page 344
• Access on page 350
Copyright © 2018, Juniper Networks, Inc.340
Juniper Secure Analytics Administration Guide

DoS
The DoS category contains events that are related to denial-of-service (DoS) attacks
against services or hosts.
The following table describes the low-level event categories and associated severity
levels for the DoS category.
Table 83: Low-level Categories and Severity Levels for the DoS Events Category
Severitylevel (0 -10)DescriptionLow-level event category
8Indicates an unknown DoS attack.Unknown DoS Attack
9Indicates an ICMP DoS attack.ICMP DoS
9Indicates a TCP DoS attack.TCP DoS
9Indicates a UDP DoS attack.UDP DoS
8Indicates a DNS service DoS attack.DNS Service DoS
8Indicates a web service DoS attack.Web Service DoS
8Indicates amail server DoS attack.Mail Service DoS
9Indicates a distributed DoS attack.Distributed DoS
8Indicates amiscellaneous DoS attack.Misc DoS
8Indicates a UNIX DoS attack.UNIX DoS
8Indicates aWindows DoS attack.Windows DoS
8Indicates a database DoS attack.Database DoS
8Indicates an FTP DoS attack.FTP DoS
8Indicates a DoS attack on the infrastructure.Infrastructure DoS
8Indicates a Telnet DoS attack.Telnet DoS
8Indicates access to your system through unauthorizedmethods.Brute Force Login
8Indicates a high rate TCP DoS attack.High Rate TCP DoS
8Indicates a high rate UDP DoS attack.High Rate UDP DoS
8Indicates a high rate ICMP DoS attack.High Rate ICMP DoS
341Copyright © 2018, Juniper Networks, Inc.
Chapter 26: Event Categories

Table 83: Low-level Categories and Severity Levels for the DoS Events Category (continued)
Severitylevel (0 -10)DescriptionLow-level event category
8Indicates a high rate DoS attack.High Rate DoS
8Indicates amedium rate TCP attack.Medium Rate TCP DoS
8Indicates amedium rate UDP attack.Medium Rate UDP DoS
8Indicates amedium rate ICMP attack.Medium Rate ICMP DoS
8Indicates amedium rate DoS attack.Medium Rate DoS
8Indicates amedium rate DoS attack.Medium Rate DoS
8Indicates a low rate TCP DoS attack.Low Rate TCP DoS
8Indicates a low rate UDP DoS attack.Low Rate UDP DoS
8Indicates a low rate ICMP DoS attack.Low Rate ICMP DoS
8Indicates a low rate DoS attack.Low Rate DoS
8Indicates a distributed high rate TCP DoS attack.Distributed High Rate TCP DoS
8Indicates a distributed high rate UDP DoS attack.Distributed High Rate UDP DoS
8Indicates a distributed high rate ICMP DoS attack.Distributed High Rate ICMP DoS
8Indicates a distributed high rate DoS attack.Distributed High Rate DoS
8Indicates a distributedmedium rate TCP DoS attack.Distributed Medium Rate TCP DoS
8Indicates a distributedmedium rate UDP DoS attack.Distributed Medium Rate UDP DoS
8Indicates a distributedmedium rate ICMP DoS attack.Distributed Medium Rate ICMP DoS
8Indicates a distributedmedium rate DoS attack.Distributed Medium Rate DoS
8Indicates a distributed low rate TCP DoS attack.Distributed Low Rate TCP DoS
8Indicates a distributed low rate UDP DoS attack.Distributed Low Rate UDP DoS
8Indicates a distributed low rate ICMP DoS attack.Distributed Low Rate ICMP DoS
8Indicates a distributed low rate DoS attack.Distributed Low Rate DoS
8Indicates a high rate TCP scan.High Rate TCP Scan
Copyright © 2018, Juniper Networks, Inc.342
Juniper Secure Analytics Administration Guide

Table 83: Low-level Categories and Severity Levels for the DoS Events Category (continued)
Severitylevel (0 -10)DescriptionLow-level event category
8Indicates a high rate UDP scan.High Rate UDP Scan
8Indicates a high rate ICMP scan.High Rate ICMP Scan
8Indicates a high rate scan.High Rate Scan
8Indicates amedium rate TCP scan.Medium Rate TCP Scan
8Indicates amedium rate UDP scan.Medium Rate UDP Scan
8Indicates amedium rate ICMP scan.Medium Rate ICMP Scan
8Indicates amedium rate scan.Medium Rate Scan
8Indicates a low rate TCP scan.Low Rate TCP Scan
8Indicates a low rate UDP scan.Low Rate UDP Scan
8Indicates a low rate ICMP scan.Low Rate ICMP Scan
8Indicates a low rate scan.Low Rate Scan
8Indicates a VoIP DoS attack.VoIP DoS
8Indicates a Flood attack.Flood
8Indicates a TCP flood attack.TCP Flood
8Indicates a UDP flood attack.UDP Flood
8Indicates an ICMP flood attack.ICMP Flood
8Indicates a SYN flood attack.SYN Flood
8Indicates a flood attack with the urgent (URG) flag on.URG Flood
8Indicates a SYN flood attack with the urgent (URG) flag on.SYN URG Flood
8Indicates a SYN FIN flood attack.SYN FIN Flood
8Indicates a SYN ACK flood attack.SYN ACK Flood
RelatedDocumentation
Authentication on page 344•
343Copyright © 2018, Juniper Networks, Inc.
Chapter 26: Event Categories

• Access on page 350
• Exploit on page 352
Authentication
The authentication category contains events that are related to authentication, sessions,
and access controls that monitor users on the network.
The following table describes the low-level event categories and associated severity
levels for the authentication category.
Table 84: Low-level Categories and Severity Levels for the Authentication Events Category
Severitylevel (0- 10)DescriptionLow-level event category
1Indicates unknown authentication.Unknown Authentication
1Indicates a successful host login.Host Login Succeeded
3Indicates that the host login failed.Host Login Failed
1Indicates that the login sequence succeeded.Misc Login Succeeded
3Indicates that login sequence failed.Misc Login Failed
3Indicates that the privileged escalation failed.Privilege Escalation Failed
1Indicates that the privilege escalation succeeded.Privilege Escalation Succeeded
1Indicates that the mail service login succeeded.Mail Service Login Succeeded
3Indicates that the mail service login failed.Mail Service Login Failed
3Indicates that the authentication server login failed.Auth Server Login Failed
1Indicates that the authentication server login succeeded.Auth Server Login Succeeded
1Indicates that the web service login succeeded.Web Service Login Succeeded
3Indicates that the web service login failed.Web Service Login Failed
1Indicates that an administrative login was successful.Admin Login Successful
3Indicates the administrative login failed.Admin Login Failure
4Indicates that a user attempted to access the network by using anincorrect user name.
Suspicious Username
Copyright © 2018, Juniper Networks, Inc.344
Juniper Secure Analytics Administration Guide

Table 84: Low-level Categories and Severity Levels for the Authentication EventsCategory (continued)
Severitylevel (0- 10)DescriptionLow-level event category
4Indicates that a user accessed the network by using the default username and password.
Login with username/ password defaultssuccessful
4Indicates that a user was unsuccessful accessing the network byusing the default user name and password.
Login with username/ password defaultsfailed
1Indicates that the FTP login was successful.FTP Login Succeeded
3Indicates that the FTP login failed.FTP Login Failed
1Indicates that the SSH login was successful.SSH Login Succeeded
2Indicates that the SSH login failed.SSH Login Failed
1Indicates that user access to network resources was successfullygranted.
User Right Assigned
1Indicates that user access to network resources was successfullyremoved.
User Right Removed
1Indicates that a trusted domain was successfully added to yourdeployment.
Trusted Domain Added
1Indicates thata trusteddomainwas removed fromyourdeployment.Trusted Domain Removed
1Indicates that system security access was successfully granted.System Security Access Granted
1Indicates that system security access was successfully removed.System Security Access Removed
1Indicates that a policy was successfully added.Policy Added
1Indicates that a policy was successfully changed.Policy Change
1Indicates that a user account was successfully added.User Account Added
1Indicates a change to an existing user account.User Account Changed
3Indicates that an attempt to change an existing password failed.Password Change Failed
1Indicates that a password change was successful.Password Change Succeeded
1Indicates that a user account was successfully removed.User Account Removed
1Indicates that a groupmember was successfully added.Group Member Added
345Copyright © 2018, Juniper Networks, Inc.
Chapter 26: Event Categories

Table 84: Low-level Categories and Severity Levels for the Authentication EventsCategory (continued)
Severitylevel (0- 10)DescriptionLow-level event category
1Indicates that a groupmember was removed.Group Member Removed
1Indicates that a group was successfully added.Group Added
1Indicates a change to an existing group.Group Changed
1Indicates that a group was removed.Group Removed
1Indicates that a computer account was successfully added.Computer Account Added
1Indicates a change to an existing computer account.Computer Account Changed
1Indicates that a computer account was successfully removed.Computer Account Removed
1Indicates that access to the network by using a remote login wassuccessful.
Remote Access Login Succeeded
3Indicates that an attempt to access the network by using a remotelogin failed.
Remote Access Login Failed
1Indicates that the authentication processes was successful.General Authentication Successful
3Indicates that the authentication process failed.General Authentication Failed
1Indicates that the telnet login was successful.Telnet Login Succeeded
3Indicates that the telnet login failed.Telnet Login Failed
4Indicates that a user attempted to log in by using a suspiciouspassword.
Suspicious Password
1Indicates that a user successfully logged in by using Samba.Samba Login Successful
3Indicates a user failed to log in by using Samba.Samba Login Failed
1Indicates that a communication session with the authenticationserver was started.
Auth Server Session Opened
1Indicates that a communication session with the authenticationserver was closed.
Auth Server Session Closed
1Indicates that a firewall session was closed.Firewall Session Closed
1Indicates that a host successfully logged out.Host Logout
Copyright © 2018, Juniper Networks, Inc.346
Juniper Secure Analytics Administration Guide

Table 84: Low-level Categories and Severity Levels for the Authentication EventsCategory (continued)
Severitylevel (0- 10)DescriptionLow-level event category
1Indicates that a user successfully logged out.Misc Logout
1Indicates that the process to log out of the authentication serverwas successful.
Auth Server Logout
1Indicates that the process to log out of the web service wassuccessful.
Web Service Logout
1Indicates that the administrative user successfully logged out.Admin Logout
1Indicates that the process to log out of the FTP service wassuccessful.
FTP Logout
1Indicates that the process to log out of the SSH session wassuccessful.
SSH Logout
1Indicates that the process to log out using remote access wassuccessful.
Remote Access Logout
1Indicates that the process to log out of the Telnet session wassuccessful.
Telnet Logout
1Indicates that the process to log out of Samba was successful.Samba Logout
1Indicates that the SSH login session was initiated on a host.SSH Session Started
1Indicates the termination of an SSH login session on a host.SSH Session Finished
1Indicates that a login session was initiated on a host by anadministrative or privileged user.
Admin Session Started
1Indicates the terminationof anadministrator or privilegedusers loginsession on a host.
Admin Session Finished
1Indicates a successful VoIP service loginVoIP Login Succeeded
1Indicates an unsuccessful attempt to access VoIP service.VoIP Login Failed
1Indicates a user logout,VoIP Logout
1Indicates the beginning of a VoIP session.VoIP Session Initiated
1Indicates the end of a VoIP session.VoIP Session Terminated
1Indicates a successful database login.Database Login Succeeded
347Copyright © 2018, Juniper Networks, Inc.
Chapter 26: Event Categories

Table 84: Low-level Categories and Severity Levels for the Authentication EventsCategory (continued)
Severitylevel (0- 10)DescriptionLow-level event category
3Indicates a database login attempt failed.Database Login Failure
3Indicates a failed Internet Key Exchange (IKE) authentication wasdetected.
IKE Authentication Failed
1Indicates that a successful IKE authentication was detected.IKE Authentication Succeeded
1Indicates that an IKE session started.IKE Session Started
1Indicates that an IKE session ended.IKE Session Ended
1Indicates an IKE error message.IKE Error
1Indicates IKE status message.IKE Status
1Indicates that a RADIUS session started.RADIUS Session Started
1Indicates a RADIUS session ended.RADIUS Session Ended
1Indicates that a RADIUS session was denied.RADIUS Session Denied
1Indicates a RADIUS session status message.RADIUS Session Status
3Indicates a RADIUS authentication failure.RADIUS Authentication Failed
1Indicates a RADIUS authentication succeeded.RADIUS Authentication Successful
1Indicates a TACACS session started.TACACS Session Started
1Indicates a TACACS session ended.TACACS Session Ended
1Indicates that a TACACS session was denied.TACACS Session Denied
1Indicates a TACACS session status message.TACACS Session Status
1Indicates a TACACS authentication succeeded.TACACS Authentication Successful
1Indicates a TACACS authentication failure.TACACS Authentication Failed
1Indicates that the deauthentication of a host was successful.Deauthenticating Host Succeeded
3Indicates that the deauthentication of a host failed.Deauthenticating Host Failed
1Indicates that the station authentication was successful.Station Authentication Succeeded
Copyright © 2018, Juniper Networks, Inc.348
Juniper Secure Analytics Administration Guide

Table 84: Low-level Categories and Severity Levels for the Authentication EventsCategory (continued)
Severitylevel (0- 10)DescriptionLow-level event category
3Indicates that the station authentication of a host failed.Station Authentication Failed
1Indicates that the station association was successful.Station Association Succeeded
3Indicates that the station association failed.Station Association Failed
1Indicates that the station reassociation was successful.Station Reassociation Succeeded
3Indicates that the station association failed.Station Reassociation Failed
1Indicates that the disassociating a host was successful.Disassociating Host Succeeded
3Indicates that the disassociating a host failed.Disassociating Host Failed
5Indicates a Security Association (SA) error message.SA Error
3Indicates a Security Association (SA) creation failure.SA Creation Failure
1Indicates that a Security Association (SA) connection established.SA Established
3Indicates that a Security Association (SA) connection rejected.SA Rejected
1Indicates the deletion of a Security Association (SA).Deleting SA
1Indicates the creation of a Security Association (SA).Creating SA
3Indicates a certificate mismatch.Certificate Mismatch
3Indicates a credentials mismatch.Credentials Mismatch
2Indicates an admin login attempt.Admin Login Attempt
2Indicates a user login attempt.User Login Attempt
1Indicates a successful user login.User Login Successful
3Indicates a failed user login.User Login Failure
1Indicates a successful SSH File Transfer Protocol (SFTP) login.SFTP Login Succeeded
3Indicates a failed SSH File Transfer Protocol (SFTP) login.SFTP Login Failed
1Indicates an SSH File Transfer Protocol (SFTP) logout.SFTP Logout
349Copyright © 2018, Juniper Networks, Inc.
Chapter 26: Event Categories

RelatedDocumentation
Access on page 350•
• Exploit on page 352
• Malware on page 354
Access
The access category contains authentication and access controls that are used for
monitoring network events.
The following table describes the low-level event categories and associated severity
levels for the access category.
Table 85: Low-level Categories and Severity Levels for the Access Events Category
Severitylevel (0 -10)DescriptionLow-level event category
3Indicates an unknown network communication event.Unknown Network Communication Event
0Indicates that access to the firewall was allowed.Firewall Permit
4Indicates that access to the firewall was denied.Firewall Deny
5Indicates events from the Classification Engine in response to aSIM request.
Flow Context Response (JSA only)
3Indicates amiscellaneous communications event.Misc Network Communication Event
4Indicates Intrusion Prevention Systems (IPS) denied traffic.IPS Deny
0Indicates that the firewall session was opened.Firewall Session Opened
0Indicates that the firewall session was closed.Firewall Session Closed
0Indicates that dynamic address translation was successful.Dynamic Address Translation Successful
2Indicates that no translation group was found.No Translation Group Found
2Indicates that access was granted to amiscellaneousauthentication server.
Misc Authorization
0Indicates that an Access Control List (ACL) allowed access.ACL Permit
4Indicates that an Access Control List (ACL) denied access.ACL Deny
0Indicates that access was allowed.Access Permitted
4Indicates that access was denied.Access Denied
Copyright © 2018, Juniper Networks, Inc.350
Juniper Secure Analytics Administration Guide

Table 85: Low-level Categories andSeverity Levels for theAccess Events Category (continued)
Severitylevel (0 -10)DescriptionLow-level event category
1Indicates that a session was opened.Session Opened
1Indicates that a session was closed.Session Closed
3Indicates that a session was reset.Session Reset
4Indicates that a session was allowed.Session Terminated
5Indicates that a session was denied.Session Denied
1Indicates that a session is in progress.Session in Progress
3Indicates that a session was delayed.Session Delayed
1Indicates that a session was queued.Session Queued
1Indicates that a session is inbound.Session Inbound
1Indicates that a session is outbound.Session Outbound
6Indicates that an unauthorized access attempt was detected.Unauthorized Access Attempt
1Indicates that an application action was allowed.Misc Application Action Allowed
3Indicates that an application action was denied.Misc Application Action Denied
1Indicates that a database action was allowed.Database Action Allowed
3Indicates that a database action was denied.Database Action Denied
1Indicates that an FTP action was allowed.FTP Action Allowed
3Indicates that an FTP action was denied.FTP Action Denied
1Indicates that an object was cached.Object Cached
1Indicates that an object was not cached.Object Not Cached
4Indicates that the network rate-limits traffic.Rate Limiting
0Indicates that the network does not rate-limit traffic.No Rate Limiting
RelatedDocumentation
Exploit on page 352•
351Copyright © 2018, Juniper Networks, Inc.
Chapter 26: Event Categories

• Malware on page 354
• Suspicious Activity on page 355
Exploit
The exploit category contains events where a communication or an access exploit
occurred.
The following table describes the low-level event categories and associated severity
levels for the exploit category.
Table 86: Low-level Categories and Severity Levels for the Exploit Events Category
Severitylevel (0 -10)DescriptionLow-level event category
9Indicates an unknown exploit attack.Unknown Exploit Attack
9Indicates a buffer overflow.Buffer Overflow
9Indicates a DNS exploit.DNS Exploit
9Indicates a Telnet exploit.Telnet Exploit
9Indicates a Linux exploit.Linux Exploit
9Indicates a UNIX exploit.UNIX Exploit
9Indicates a Microsoft Windows exploit.Windows Exploit
9Indicates amail server exploit.Mail Exploit
9Indicates an infrastructure exploit.Infrastructure Exploit
9Indicates amiscellaneous exploit.Misc Exploit
9Indicates a web exploit.Web Exploit
9Indicates that a session in your network was interceded.Session Hijack
10Indicates an active worm.Worm Active
9Indicates that a user requested access to their passwordinformation from the database.
Password Guess/Retrieve
9Indicates an FTP exploit.FTP Exploit
9Indicates an RPC exploit.RPC Exploit
Copyright © 2018, Juniper Networks, Inc.352
Juniper Secure Analytics Administration Guide

Table86: Low-level Categories andSeverity Levels for the Exploit EventsCategory (continued)
Severitylevel (0 -10)DescriptionLow-level event category
9Indicates an SNMP exploit.SNMP Exploit
9Indicates an NOOP exploit.NOOP Exploit
9Indicates a Samba exploit.Samba Exploit
9Indicates a database exploit.Database Exploit
9Indicates an SSH exploit.SSH Exploit
9Indicates an ICMP exploit.ICMP Exploit
9Indicates a UDP exploit.UDP Exploit
9Indicates an exploit on your browser.Browser Exploit
9Indicates a DHCP exploitDHCP Exploit
9Indicates a remote access exploitRemote Access Exploit
9Indicates an exploit through an ActiveX application.ActiveX Exploit
9Indicates that an SQL injection occurred.SQL Injection
9Indicates a cross-site scripting vulnerability.Cross-Site Scripting
9Indicates a format string vulnerability.Format String Vulnerability
9Indicates that an input validation exploit attempt was detected.Input Validation Exploit
9Indicates that a remote code execution attempt was detected.Remote Code Execution
9Indicates that a memory corruption exploit was detected.Memory Corruption
9Indicates that a remote command execution attempt wasdetected.
Command Execution
RelatedDocumentation
Malware on page 354•
• Suspicious Activity on page 355
• System on page 358
353Copyright © 2018, Juniper Networks, Inc.
Chapter 26: Event Categories

Malware
Themalicioussoftware (malware)categorycontainsevents thatare related toapplication
exploits and buffer overflow attempts.
The following table describes the low-level event categories and associated severity
levels for the malware category.
Table 87: Low-level Categories and Severity Levels for theMalware Events Category
Severitylevel (0 - 10)DescriptionLow-level event category
4Indicates an unknown virus.UnknownMalware
9Indicates that a back door to the systemwas detected.Backdoor Detected
6Indicates a hostile mail attachment.Hostile Mail Attachment
6Indicates a virus.Malicious Software
6Indicates a hostile software download to your network.Hostile Software Download
8Indicates that a virus was detected.Virus Detected
4Indicates miscellaneous malicious softwareMisc Malware
7Indicates that a trojan was detected.Trojan Detected
6Indicates that spyware was detected on your system.Spyware Detected
3Indicates that an attempted scan of your content was detected.Content Scan
8Indicates that a scan of your content failed.Content Scan Failed
3Indicates that a scan of your content was successful.Content Scan Successful
3Indicates that a scan of your content is in progress.Content Scan in Progress
7Indicates that a key logger was detected.Keylogger
4Indicates that Ad-Ware was detected.Adware Detected
3Indicates that a quarantine action successfully completed.Quarantine Successful
8Indicates that a quarantine action failed.Quarantine Failed
RelatedDocumentation
Suspicious Activity on page 355•
• System on page 358
Copyright © 2018, Juniper Networks, Inc.354
Juniper Secure Analytics Administration Guide

• Policy on page 363
Suspicious Activity
The suspicious category contains events that are related to viruses, trojans, back door
attacks, and other forms of hostile software.
The following table describes the low-level event categories and associated severity
levels for the suspicious activity category.
Table 88: Low-level Categories andSeverity Levels for the Suspicious Activity Events Category
Severitylevel (0 -10)DescriptionLow-level event category
3Indicates an unknown suspicious event.Unknown Suspicious Event
3Indicates that a suspicious pattern was detected.Suspicious Pattern Detected
3Indicates that content wasmodified by the firewall.Content Modified By Firewall
3Indicates an invalid command or data.Invalid Command or Data
3Indicates a suspicious packet.Suspicious Packet
3Indicates suspicious activity.Suspicious Activity
3Indicates a suspicious file name.Suspicious File Name
3Indicates suspicious port activity.Suspicious Port Activity
3Indicates suspicious routing.Suspicious Routing
3Indicates potential web vulnerability.Potential Web Vulnerability
5Indicates an unknown evasion event.Unknown Evasion Event
5Indicates an IP spoof.IP Spoof
3Indicates IP fragmentation.IP Fragmentation
5Indicates overlapping IP fragments.Overlapping IP Fragments
5Indicates an IDS evasion.IDS Evasion
3Indicates a DNS protocol anomaly.DNS Protocol Anomaly
3Indicates an FTP protocol anomaly.FTP Protocol Anomaly
355Copyright © 2018, Juniper Networks, Inc.
Chapter 26: Event Categories

Table 88: Low-level Categories and Severity Levels for the Suspicious Activity EventsCategory (continued)
Severitylevel (0 -10)DescriptionLow-level event category
3Indicates amail protocol anomaly.Mail Protocol Anomaly
3Indicates a routing protocol anomaly.Routing Protocol Anomaly
3Indicates a web protocol anomaly.Web Protocol Anomaly
3Indicates an SQL protocol anomaly.SQL Protocol Anomaly
5Indicates that an executable code was detected.Executable Code Detected
3Indicates amiscellaneous suspicious event.Misc Suspicious Event
1Indicates an information leak.Information Leak
4Indicates a potential vulnerability in the mail server.Potential Mail Vulnerability
4Indicates a potential vulnerability in the JSA version.Potential Version Vulnerability
4Indicates a potential FTP vulnerability.Potential FTP Vulnerability
4Indicates a potential SSH vulnerability.Potential SSH Vulnerability
4Indicates a potential vulnerability in the DNS server.Potential DNS Vulnerability
4Indicates a potential SMB (Samba) vulnerability.Potential SMB Vulnerability
4Indicates a potential vulnerability in the database.Potential Database Vulnerability
3Indicates a potential IP protocol anomalyIP Protocol Anomaly
2Indicates that a suspicious IP address was detected.Suspicious IP Address
2Indicates an invalid IP protocol.Invalid IP Protocol Usage
4Indicates an invalid protocol.Invalid Protocol
2Indicates a suspicious event with a screen on your desktop.SuspiciousWindow Events
2Indicates suspicious ICMP activity.Suspicious ICMP Activity
4Indicates a potential network file system (NFS) vulnerability.Potential NFS Vulnerability
4Indicates a potential Network News Transfer Protocol (NNTP)vulnerability.
Potential NNTP Vulnerability
Copyright © 2018, Juniper Networks, Inc.356
Juniper Secure Analytics Administration Guide

Table 88: Low-level Categories and Severity Levels for the Suspicious Activity EventsCategory (continued)
Severitylevel (0 -10)DescriptionLow-level event category
4Indicates a potential RPC vulnerability.Potential RPC Vulnerability
4Indicates a potential Telnet vulnerability on your system.Potential Telnet Vulnerability
4Indicates a potential SNMP vulnerability.Potential SNMP Vulnerability
5Indicates that an invalid TCP flag combination was detected.Illegal TCP Flag Combination
4Indicates that a potentially invalid TCP flag combination wasdetected.
Suspicious TCP Flag Combination
5Indicates that an invalid use of the ICMP protocol was detected.Illegal ICMP Protocol Usage
4Indicates that a potentially invalid use of the ICMP protocol wasdetected.
Suspicious ICMP Protocol Usage
5Indicates that an invalid ICMP type was detected.Illegal ICMP Type
5Indicates that an invalid ICMP code was detected.Illegal ICMP Code
4Indicates that a potentially invalid ICMP type was detected.Suspicious ICMP Type
4Indicates that a potentially invalid ICMP code was detected.Suspicious ICMP Code
4Indicates a TCP packet uses a reserved port (0) for source ordestination.
TCP port 0
4Indicates a UDP packet uses a reserved port (0) for source ordestination.
UDP port 0
4Indicates the use of a known hostile IP address.Hostile IP
4Indicates theuseof an IPaddress fromawatch list of IPaddresses.Watch list IP
4Indicates the use of an IP address of a known offender.Known offender IP
4Indicates the use of an IP address from a private IP address range.RFC 1918 (private) IP
4Indicates a potential VoIP vulnerability.Potential VoIP Vulnerability
8Indicates that an IP address is on the black list.Blacklist Address
7Indicates that the IP address is on the list of IP addresses beingmonitored.
Watchlist Address
357Copyright © 2018, Juniper Networks, Inc.
Chapter 26: Event Categories

Table 88: Low-level Categories and Severity Levels for the Suspicious Activity EventsCategory (continued)
Severitylevel (0 -10)DescriptionLow-level event category
5Indicates that the IP address is part of a darknet.Darknet Address
7Indicates that the address is part of a botnet.Botnet Address
5Indicates that the IP address must bemonitored.Suspicious Address
7Indicates that bad content was detected.Bad Content
7Indicates that an invalid certificate was detected.Invalid Cert
7Indicates that user activity was detected.User Activity
5Indicates that suspicious protocol usage was detected.Suspicious Protocol Usage
5Indicates that suspicious Border Gateway Protocol (BGP) usagewas detected.
Suspicious BGP Activity
5Indicates that route corruption was detected.Route Poisoning
5Indicates that ARP-cache poisoning was detected.ARP Poisoning
5Indicates that a rogue device was detected.Rogue Device Detected
RelatedDocumentation
System on page 358•
• Policy on page 363
• Unknown on page 364
System
The system category contains events that are related to system changes, software
installation, or status messages.
The following table describes the low-level event categories and associated severity
levels for the system category.
Table 89: Low-level Categories and Severity Levels for the System Events Category
Severitylevel (0- 10)DescriptionLow-level event category
1Indicates an unknown system event.Unknown System Event
Copyright © 2018, Juniper Networks, Inc.358
Juniper Secure Analytics Administration Guide

Table89: Low-levelCategoriesandSeverity Levels for theSystemEventsCategory (continued)
Severitylevel (0- 10)DescriptionLow-level event category
1Indicates a system restart.System Boot
1Indicates a change in the system configuration.System Configuration
1Indicates that the systemwas halted.System Halt
6Indicates a system failure.System Failure
1Indicates any information event.System Status
3Indicates a system error.System Error
1Indicates amiscellaneous system event.Misc System Event
1Indicates that system services started.Service Started
1Indicates that system services stopped.Service Stopped
6Indicates a system failure.Service Failure
1Indicates that a modification to the registry was successful.Successful Registry Modification
1Indicates that a modification to the host policy was successful.Successful Host-Policy Modification
1Indicates that a modification to a file was successful.Successful File Modification
1Indicates that a modification to the stack was successful.Successful Stack Modification
1Indicates that a modification to the application was successful.Successful Application Modification
1Indicates that a modification to the configuration was successful.Successful Configuration Modification
1Indicates that a modification to a service was successful.Successful Service Modification
1Indicates that a modification to the registry failed.Failed Registry Modification
1Indicates that a modification to the host policy failed.Failed Host-Policy Modification
1Indicates that a modification to a file failed.Failed File Modification
1Indicates that a modification to the stack failed.Failed Stack Modification
1Indicates that a modification to an application failed.Failed Application Modification
1Indicates that a modification to the configuration failed.Failed Configuration Modification
359Copyright © 2018, Juniper Networks, Inc.
Chapter 26: Event Categories
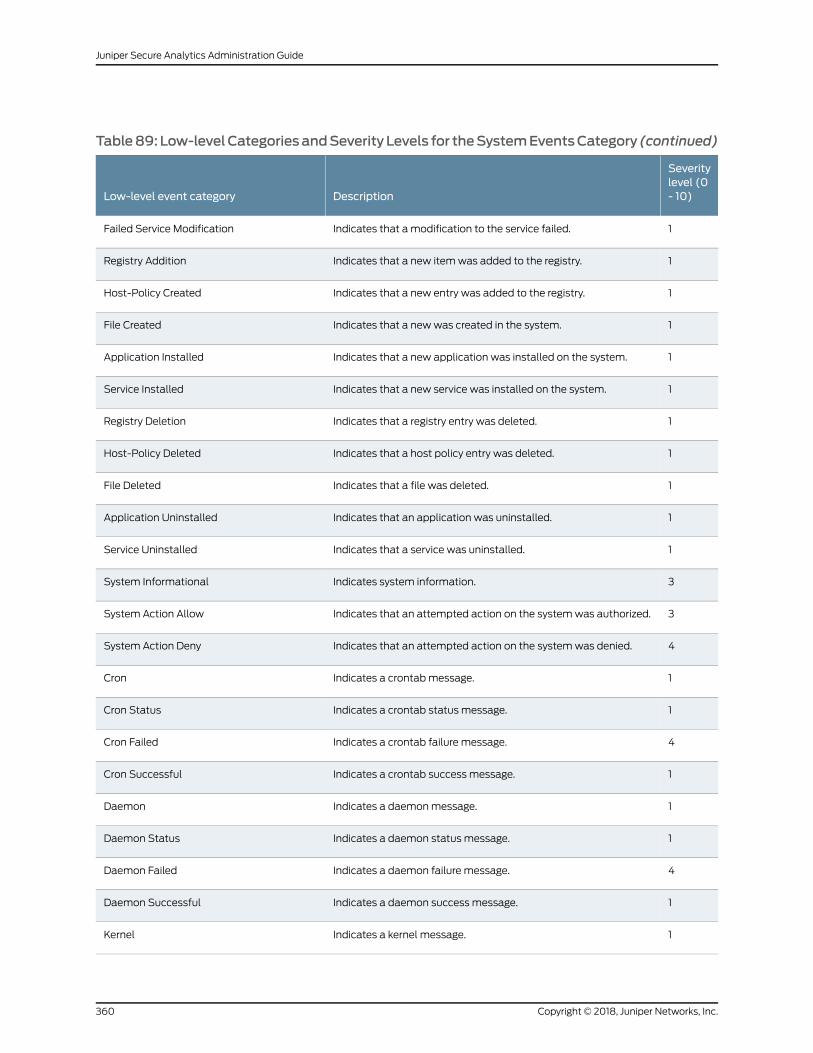
Table89: Low-levelCategoriesandSeverity Levels for theSystemEventsCategory (continued)
Severitylevel (0- 10)DescriptionLow-level event category
1Indicates that a modification to the service failed.Failed Service Modification
1Indicates that a new itemwas added to the registry.Registry Addition
1Indicates that a new entry was added to the registry.Host-Policy Created
1Indicates that a newwas created in the system.File Created
1Indicates that a new application was installed on the system.Application Installed
1Indicates that a new service was installed on the system.Service Installed
1Indicates that a registry entry was deleted.Registry Deletion
1Indicates that a host policy entry was deleted.Host-Policy Deleted
1Indicates that a file was deleted.File Deleted
1Indicates that an application was uninstalled.Application Uninstalled
1Indicates that a service was uninstalled.Service Uninstalled
3Indicates system information.System Informational
3Indicates that an attempted action on the systemwas authorized.System Action Allow
4Indicates that an attempted action on the systemwas denied.System Action Deny
1Indicates a crontabmessage.Cron
1Indicates a crontab status message.Cron Status
4Indicates a crontab failure message.Cron Failed
1Indicates a crontab success message.Cron Successful
1Indicates a daemonmessage.Daemon
1Indicates a daemon status message.Daemon Status
4Indicates a daemon failure message.Daemon Failed
1Indicates a daemon success message.Daemon Successful
1Indicates a kernel message.Kernel
Copyright © 2018, Juniper Networks, Inc.360
Juniper Secure Analytics Administration Guide

Table89: Low-levelCategoriesandSeverity Levels for theSystemEventsCategory (continued)
Severitylevel (0- 10)DescriptionLow-level event category
1Indicates a kernel status message.Kernel Status
Indicates a kernel failure message.Kernel Failed
1Indicates a kernel successful message.Kernel Successful
1Indicates an authentication message.Authentication
2Indicates an informational message.Information
3Indicates a notice message.Notice
5Indicates a warning message.Warning
7Indicates an error message.Error
9Indicates a critical message.Critical
1Indicates a debugmessage.Debug
1Indicates a generic message.Messages
3Indicates that privilege access was attempted.Privilege Access
9Indicates an alert message.Alert
9Indicates an emergency message.Emergency
1Indicates an SNMP status message.SNMP Status
1Indicates an FTP status message.FTP Status
1Indicates an NTP status message.NTP Status
3Indicates an access point radio failure.Access Point Radio Failure
3Indicates an encryption protocol configuration mismatch.Encryption Protocol Configuration Mismatch
5Indicates that a client device or authentication server was notconfigured properly.
Client Device or Authentication ServerMisconfigured
5Indicates a hot standby enable failure.Hot Standby Enable Failed
5Indicates a hot standby disable failure.Hot Standby Disable Failed
361Copyright © 2018, Juniper Networks, Inc.
Chapter 26: Event Categories

Table89: Low-levelCategoriesandSeverity Levels for theSystemEventsCategory (continued)
Severitylevel (0- 10)DescriptionLow-level event category
1Indicates that hot standby was enabled successfully.Hot Standby Enabled Successfully
5Indicates that a hot standby association was lost.Hot Standby Association Lost
5Indicates MainMode initiation failure.MainMode Initiation Failure
1Indicates that the MainMode initiation was successful.MainMode Initiation Succeeded
1Indicates a MainMode status message was reported.MainMode Status
5Indicates that the QuickMode initiation failed.QuickMode Initiation Failure
1Indicates that the QuickMode initiation was successful.Quickmode Initiation Succeeded
1Indicates a QuickMode status message was reported.Quickmode Status
3Indicates an invalid license.Invalid License
3Indicates an expired license.License Expired
1Indicates a new license applied.New License Applied
5Indicates a license error.License Error
1Indicates a license status message.License Status
5Indicates that a configuration error was detected.Configuration Error
5Indicates that a service disruption was detected.Service Disruption
3Indicates that the license capabilities were exceeded.License Exceeded
1Indicates that the performance status was reported.Performance Status
4Indicates that the performance is being degraded.Performance Degradation
5Indicates that an incorrect configuration was detected.Misconfiguration
RelatedDocumentation
Policy on page 363•
• Unknown on page 364
• CRE on page 365
Copyright © 2018, Juniper Networks, Inc.362
Juniper Secure Analytics Administration Guide

Policy
The policy category contains events that are related to administration of network policy
and themonitoring network resources for policy violations.
The following table describes the low-level event categories and associated severity
levels for the policy category.
Table 90: Low-level Categories and Severity Levels for the Policy Category
Severitylevel (0 -10)DescriptionLow-level event category
2Indicates an unknown policy violation.Unknown Policy Violation
2Indicates a web policy violation.Web Policy Violation
2Indicates a remote access policy violation.Remote Access Policy Violation
2Indicates an instant messenger policy violation.IRC/IM Policy Violation
2Indicates a Peer-to-Peer (P2P) policy violation.P2P Policy Violation
2Indicates an IP access policy violation.IP Access Policy Violation
2Indicates an application policy violation.Application Policy Violation
2Indicates a database policy violation.Database Policy Violation
2Indicates a network threshold policy violation.Network Threshold Policy Violation
2Indicates a porn policy violation.Porn Policy Violation
2Indicates a games policy violation.Games Policy Violation
2Indicates amiscellaneous policy violation.Misc Policy Violation
2Indicates a compliance policy violation.Compliance Policy Violation
2Indicates amail policy violation.Mail Policy Violation
2Indicates an IRC policy violationIRC Policy Violation
2Indicates a policy violation that is related to instant message(IM) activities.
IM Policy Violation
2Indicates a VoIP policy violationVoIP Policy Violation
1Indicates a policy successful message.Succeeded
363Copyright © 2018, Juniper Networks, Inc.
Chapter 26: Event Categories

Table 90: Low-level Categories and Severity Levels for the Policy Category (continued)
Severitylevel (0 -10)DescriptionLow-level event category
4Indicates a policy failure message.Failed
RelatedDocumentation
Unknown on page 364•
• CRE on page 365
• Potential Exploit on page 365
Unknown
The Unknown category contains events that are not parsed and therefore cannot be
categorized.
The following table describes the low-level event categories and associated severity
levels for the Unknown category.
Table 91: Low-level Categories and Severity Levels for the Unknown Category
Severity level(0 - 10)DescriptionLow-level event category
3Indicates an unknown event.Unknown
3Indicates an unknown Snort event.Unknown Snort Event
3Indicates an unknown Dragon event.Unknown Dragon Event
3Indicates an unknown Cisco Private Internet Exchange (PIX)Firewall event.
Unknown Pix Firewall Event
3Indicates an unknown HP TippingPoint event.Unknown Tipping Point Event
3Indicates an unknownWindows Auth Server event.UnknownWindows Auth Server Event
3Indicates an unknown Nortel event.Unknown Nortel Event
3Indicates an unknown stored event.Stored
3Indicates an unknown behavioral event.Behavioral
3Indicates an unknown threshold event.Threshold
RelatedDocumentation
CRE on page 365•
Copyright © 2018, Juniper Networks, Inc.364
Juniper Secure Analytics Administration Guide

• Potential Exploit on page 365
• User Defined on page 366
CRE
The custom rule event (CRE) category contains events that are generated fromacustom
offense, flow, or event rule.
The following table describes the low-level event categories and associated severity
levels for the CRE category.
Table 92: Low-level Categories and Severity Levels for the CRE Category
Severity level (0- 10)DescriptionLow-level event category
5Indicates an unknown custom rules engine event.Unknown CRE Event
5Indicates a single event rule match.Single Event Rule Match
5Indicates an event sequence rule match.Event Sequence Rule Match
5Indicates a cross-offense event sequence rule match.Cross-Offense Event Sequence Rule Match
5Indicates an offense rule match.Offense Rule Match
RelatedDocumentation
Potential Exploit on page 365•
• User Defined on page 366
• SIM Audit on page 368
Potential Exploit
The potential exploit category contains events that are related to potential application
exploits and buffer overflow attempts.
The following table describes the low-level event categories and associated severity
levels for the potential exploit category.
Table 93: Low-level Categories and Severity Levels for the Potential Exploit Category
Severitylevel (0 -10)DescriptionLow-level event category
7Indicates that a potential exploitative attack was detected.Unknown Potential Exploit Attack
7Indicates that a potential buffer overflow was detected.Potential Buffer Overflow
365Copyright © 2018, Juniper Networks, Inc.
Chapter 26: Event Categories

Table93:Low-levelCategoriesandSeverityLevels for thePotentialExploitCategory(continued)
Severitylevel (0 -10)DescriptionLow-level event category
7Indicates that apotentially exploitativeattack through theDNSserverwas detected.
Potential DNS Exploit
7Indicates that a potentially exploitative attack through Telnet wasdetected.
Potential Telnet Exploit
7Indicates thatapotentially exploitativeattack throughLinuxwasLinuxdetected.
Potential Linux Exploit
7Indicates that a potentially exploitative attack through UNIX wasdetected.
Potential UNIX Exploit
7Indicates that a potentially exploitative attack throughWindowsdetected.
Potential Windows Exploit
7Indicates that a potentially exploitative attack throughmail wasdetected.
Potential Mail Exploit
7Indicates that a potential exploitative attack on the systeminfrastructure was detected.
Potential Infrastructure Exploit
7Indicates that a potentially exploitative attack was detected.Potential Misc Exploit
7Indicates that a potentially exploitative attack through the web wasdetected.
Potential Web Exploit
6Indicates a potentially exploitative attack that uses botnet wasdetected.
Potential Botnet Connection
6Indicates a potential attack that uses worm activity was detected.Potential Worm Activity
RelatedDocumentation
User Defined on page 366•
• SIM Audit on page 368
• VIS Host Discovery on page 369
User Defined
The User Defined category contains events that are related to user-defined objects
The following table describes the low-level event categories and associated severity
levels for the User Defined category.
Copyright © 2018, Juniper Networks, Inc.366
Juniper Secure Analytics Administration Guide

Table 94: Low-level Categories and Severity Levels for the User Defined Category
Severitylevel (0 -10)DescriptionLow-level event category
3Indicates a low severity custom anomaly event.Custom Sentry Low
5Indicates amedium severity custom anomaly event.Custom Sentry Medium
7Indicates a high severity custom anomaly event.Custom Sentry High
1Indicates a custom anomaly event with a severity level of 1.Custom Sentry 1
2Indicates a custom anomaly event with a severity level of 2.Custom Sentry 2
3Indicates a custom anomaly event with a severity level of 3.Custom Sentry 3
4Indicates a custom anomaly event with a severity level of 4.Custom Sentry 4
5Indicates a custom anomaly event with a severity level of 5.Custom Sentry 5
6Indicates a custom anomaly event with a severity level of 6.Custom Sentry 6
7Indicates a custom anomaly event with a severity level of 7.Custom Sentry 7
8Indicates a custom anomaly event with a severity level of 8.Custom Sentry 8
9Indicates a custom anomaly event with a severity level of 9.Custom Sentry 9
3Indicates a custom policy event with a low severity level.Custom Policy Low
5Indicates a custom policy event with a medium severity level.Custom Policy Medium
7Indicates a custom policy event with a high severity level.Custom Policy High
1Indicates a custom policy event with a severity level of 1.Custom Policy 1
2Indicates a custom policy event with a severity level of 2.Custom Policy 2
3Indicates a custom policy event with a severity level of 3.Custom Policy 3
4Indicates a custom policy event with a severity level of 4.Custom Policy 4
5Indicates a custom policy event with a severity level of 5.Custom Policy 5
6Indicates a custom policy event with a severity level of 6.Custom Policy 6
7Indicates a custom policy event with a severity level of 7.Custom Policy 7
8Indicates a custom policy event with a severity level of 8.Custom Policy 8
367Copyright © 2018, Juniper Networks, Inc.
Chapter 26: Event Categories

Table 94: Low-level Categories and Severity Levels for the User Defined Category (continued)
Severitylevel (0 -10)DescriptionLow-level event category
9Indicates a custom policy event with a severity level of 9.Custom Policy 9
3Indicates a custom user event with a low severity level.Custom User Low
5Indicates a custom user event with a medium severity level.Custom User Medium
7Indicates a custom user event with a high severity level.Custom User High
1Indicates a custom user event with a severity level of 1.Custom User 1
2Indicates a custom user event with a severity level of 2.Custom User 2
3Indicates a custom user event with a severity level of 3.Custom User 3
4Indicates a custom user event with a severity level of 4.Custom User 4
5Indicates a custom user event with a severity level of 5.Custom User 5
6Indicates a custom user event with a severity level of 6.Custom User 6
7Indicates a custom user event with a severity level of 7.Custom User 7
8Indicates a custom user event with a severity level of 8.Custom User 8
9Indicates a custom user event with a severity level of 9.Custom User 9
RelatedDocumentation
SIM Audit on page 368•
• VIS Host Discovery on page 369
• Application on page 370
SIM Audit
The SIM Audit category contains events that are related to user interaction with the JSA
Console and administrative features.
The following table describes the low-level event categories and associated severity
levels for the SIM Audit category.
Copyright © 2018, Juniper Networks, Inc.368
Juniper Secure Analytics Administration Guide

Table 95: Low-level Categories and Severity Levels for the SIM Audit Category
Severitylevel (0 - 10)DescriptionLow-level event category
5Indicates a user login or logout on the Console.SIM User Authentication
3Indicates that a user changed the SIM configuration ordeployment.
SIM Configuration Change
3Indicates thatauser initiatedaprocess, suchas startingabackupor generating a report, in the SIMmodule.
SIM User Action
3Indicates that a user session was created.Session Created
3Indicates that a user session was destroyed.Session Destroyed
Indicates that an admin session was created.Admin Session Created
3Indicates that an admin session was destroyed.Admin Session Destroyed
5Indicates an invalid session authentication.Session Authentication Invalid
3Indicates that a session authentication expired.Session Authentication Expired
3Indicates thatauser changed the JSARiskManagerconfiguration.Risk Manager Configuration
RelatedDocumentation
VIS Host Discovery on page 369•
• Application on page 370
• Audit on page 390
VIS Host Discovery
When the VIS component discovers and stores new hosts, ports, or vulnerabilities that
are detected on the network, the VIS component generates events. These events are
sent to the Event Collector to be correlated with other security events.
The following table describes the low-level event categories and associated severity
levels for the VIS host discovery category.
Table 96: Low-level Categories and Severity Levels for the VIS Host Discovery Category
Severity level(0 - 10)DescriptionLow-level event category
3Indicates that the VIS component detected a new host.New Host Discovered
3Indicates that the VIS component detected a new open port.New Port Discovered
369Copyright © 2018, Juniper Networks, Inc.
Chapter 26: Event Categories

Table 96: Low-level Categories and Severity Levels for the VIS Host DiscoveryCategory (continued)
Severity level(0 - 10)DescriptionLow-level event category
3Indicates that the VIS component detected a new vulnerability.New Vuln Discovered
3Indicates that the VIS component detected a new operatingsystem on a host.
New OS Discovered
3Indicates that the VIS component detectedmany new hosts ina short period.
Bulk Host Discovered
RelatedDocumentation
Application on page 370•
• Audit on page 390
• Risk on page 391
Application
The application category contains events that are related to application activity, such
as email or FTP activity.
The following table describes the low-level event categories and associated severity
levels for the application category.
Table 97: Low-level Categories and Severity Levels for the Application Category
Severitylevel (0- 10)DescriptionLow-level event category
1Indicates that an email connection was established.Mail Opened
1Indicates that an email connection was closed.Mail Closed
3Indicates that an email connection was reset.Mail Reset
4Indicates that an email connection was terminated.Mail Terminated
4Indicates that an email connection was denied.Mail Denied
1Indicates that an email connection is being attempted.Mail in Progress
4Indicates that an email connection was delayed.Mail Delayed
3Indicates that an email connection was queued.Mail Queued
1Indicates that an email connection was redirected.Mail Redirected
Copyright © 2018, Juniper Networks, Inc.370
Juniper Secure Analytics Administration Guide

Table 97: Low-level Categories and Severity Levels for the Application Category (continued)
Severitylevel (0- 10)DescriptionLow-level event category
1Indicates that an FTP connection was opened.FTP Opened
1Indicates that an FTP connection was closed.FTP Closed
3Indicates that an FTP connection was reset.FTP Reset
4Indicates that an FTP connection was terminated.FTP Terminated
4Indicates that an FTP connection was denied.FTP Denied
1Indicates that an FTP connection is in progress.FTP In Progress
3Indicates that an FTP connection was redirected.FTP Redirected
1Indicates that an HTTP connection was established.HTTP Opened
1Indicates that an HTTP connection was closed.HTTP Closed
3Indicates that an HTTP connection was reset.HTTP Reset
4Indicates that an HTTP connection was terminated.HTTP Terminated
4Indicates that an HTTP connection was denied.HTTP Denied
1Indicates that an HTTP connection is in progress.HTTP In Progress
3Indicates that an HTTP connection was delayed.HTTP Delayed
1Indicates that an HTTP connection was queued.HTTP Queued
1Indicates that an HTTP connection was redirected.HTTP Redirected
1Indicates that an HTTP connection is being proxied.HTTP Proxy
1Indicates that an HTTPS connection was established.HTTPS Opened
1Indicates that an HTTPS connection was closed.HTTPS Closed
3Indicates that an HTTPS connection was reset.HTTPS Reset
4Indicates that an HTTPS connection was terminated.HTTPS Terminated
4Indicates that an HTTPS connection was denied.HTTPS Denied
1Indicates that an HTTPS connection is in progress.HTTPS In Progress
371Copyright © 2018, Juniper Networks, Inc.
Chapter 26: Event Categories

Table 97: Low-level Categories and Severity Levels for the Application Category (continued)
Severitylevel (0- 10)DescriptionLow-level event category
3Indicates that an HTTPS connection was delayed.HTTPS Delayed
3Indicates that an HTTPS connection was queued.HTTPS Queued
3Indicates that an HTTPS connection was redirected.HTTPS Redirected
1Indicates that an HTTPS connection is proxied.HTTPS Proxy
1Indicates that an SSH connection was established.SSH Opened
1Indicates that an SSH connection was closed.SSH Closed
3Indicates that an SSH connection was reset.SSH Reset
4Indicates that an SSH connection was terminated.SSH Terminated
4Indicates that an SSH session was denied.SSH Denied
1Indicates that an SSH session is in progress.SSH In Progress
1Indicates that a remote access connection was established.RemoteAccess Opened
1Indicates that a remote access connection was closed.RemoteAccess Closed
3Indicates that a remote access connection was reset.RemoteAccess Reset
4Indicates that a remote access connection was terminated.RemoteAccess Terminated
4Indicates that a remote access connection was denied.RemoteAccess Denied
1Indicates that a remote access connection is in progress.RemoteAccess In Progress
3Indicates that a remote access connection was delayed.RemoteAccess Delayed
3Indicates that a remote access connection was redirected.RemoteAccess Redirected
1Indicates that a VPN connection was opened.VPN Opened
1Indicates that a VPN connection was closed.VPN Closed
3Indicates that a VPN connection was reset.VPN Reset
4Indicates that a VPN connection was terminated.VPN Terminated
4Indicates that a VPN connection was denied.VPN Denied
Copyright © 2018, Juniper Networks, Inc.372
Juniper Secure Analytics Administration Guide

Table 97: Low-level Categories and Severity Levels for the Application Category (continued)
Severitylevel (0- 10)DescriptionLow-level event category
1Indicates that a VPN connection is in progress.VPN In Progress
3Indicates that a VPN connection was delayedVPN Delayed
3Indicates that a VPN connection was queued.VPN Queued
3Indicates that a VPN connection was redirected.VPN Redirected
1Indicates that an RDP connection was established.RDP Opened
1Indicates that an RDP connection was closed.RDP Closed
3Indicates that an RDP connection was reset.RDP Reset
4Indicates that an RDP connection was terminated.RDP Terminated
4Indicates that an RDP connection was denied.RDP Denied
1Indicates that an RDP connection is in progress.RDP In Progress
3Indicates that an RDP connection was redirected.RDP Redirected
1Indicates that a file transfer connection was established.FileTransfer Opened
1Indicates that a file transfer connection was closed.FileTransfer Closed
3Indicates that a file transfer connection was reset.FileTransfer Reset
4Indicates that a file transfer connection was terminated.FileTransfer Terminated
4Indicates that a file transfer connection was denied.FileTransfer Denied
1Indicates that a file transfer connection is in progress.FileTransfer In Progress
3Indicates that a file transfer connection was delayed.FileTransfer Delayed
3Indicates that a file transfer connection was queued.FileTransfer Queued
3Indicates that a file transfer connection was redirected.FileTransfer Redirected
1Indicates that a DNS connection was established.DNS Opened
1Indicates that a DNS connection was closed.DNS Closed
5Indicates that a DNS connection was reset.DNS Reset
373Copyright © 2018, Juniper Networks, Inc.
Chapter 26: Event Categories

Table 97: Low-level Categories and Severity Levels for the Application Category (continued)
Severitylevel (0- 10)DescriptionLow-level event category
5Indicates that a DNS connection was terminated.DNS Terminated
5Indicates that a DNS connection was denied.DNS Denied
1Indicates that a DNS connection is in progress.DNS In Progress
5Indicates that a DNS connection was delayed.DNS Delayed
4Indicates that a DNS connection was redirected.DNS Redirected
1Indicates that a chat connection was opened.Chat Opened
1Indicates that a chat connection was closed.Chat Closed
3Indicates that a chat connection was reset.Chat Reset
3Indicates that a chat connection was terminated.Chat Terminated
3Indicates that a chat connection was denied.Chat Denied
1Indicates that a chat connection is in progress.Chat In Progress
1Indicates that a chat connection was redirected.Chat Redirected
1Indicates that a database connection was established.Database Opened
1Indicates that a database connection was closed.Database Closed
5Indicates that a database connection was reset.Database Reset
5Indicates that a database connection was terminated.Database Terminated
5Indicates that a database connection was denied.Database Denied
1Indicates that a database connection is in progress.Database In Progress
3Indicates that a database connection was redirected.Database Redirected
1Indicates that an SMTP connection was established.SMTP Opened
1Indicates that an SMTP connection was closed.SMTP Closed
3Indicates that an SMTP connection was reset.SMTP Reset
5Indicates that an SMTP connection was terminated.SMTP Terminated
Copyright © 2018, Juniper Networks, Inc.374
Juniper Secure Analytics Administration Guide

Table 97: Low-level Categories and Severity Levels for the Application Category (continued)
Severitylevel (0- 10)DescriptionLow-level event category
5Indicates that an SMTP connection was denied.SMTP Denied
1Indicates that an SMTP connection is in progress.SMTP In Progress
3Indicates that an SMTP connection was delayed.SMTP Delayed
3Indicates that an SMTP connection was queued.SMTP Queued
3Indicates that an SMTP connection was redirected.SMTP Redirected
1Indicates that an authorization server connection was established.Auth Opened
1Indicates that an authorization server connection was closed.Auth Closed
3Indicates that an authorization server connection was reset.Auth Reset
4Indicates that an authorization server connection was terminated.Auth Terminated
4Indicates that an authorization server connection was denied.Auth Denied
1Indicates that an authorization server connection is in progress.Auth In Progress
3Indicates that an authorization server connection was delayed.Auth Delayed
3Indicates that an authorization server connection was queued.Auth Queued
2Indicates that an authorization server connection was redirected.Auth Redirected
1Indicates that a Peer-to-Peer (P2P) connection was established.P2P Opened
1Indicates that a P2P connection was closed.P2P Closed
4Indicates that a P2P connection was reset.P2P Reset
4Indicates that a P2P connection was terminated.P2P Terminated
3Indicates that a P2P connection was denied.P2P Denied
1Indicates that a P2P connection is in progress.P2P In Progress
1Indicates that a web connection was established.Web Opened
1Indicates that a web connection was closed.Web Closed
4Indicates that a web connection was reset.Web Reset
375Copyright © 2018, Juniper Networks, Inc.
Chapter 26: Event Categories

Table 97: Low-level Categories and Severity Levels for the Application Category (continued)
Severitylevel (0- 10)DescriptionLow-level event category
4Indicates that a web connection was terminated.Web Terminated
4Indicates that a web connection was denied.Web Denied
1Indicates that a web connection is in progress.Web In Progress
3Indicates that a web connection was delayed.Web Delayed
1Indicates that a web connection was queued.Web Queued
1Indicates that a web connection was redirected.Web Redirected
1Indicates that a web connection was proxied.Web Proxy
1Indicates that a Voice Over IP (VoIP) connection was established.VoIP Opened
1Indicates that a VoIP connection was closed.VoIP Closed
3Indicates that a VoIP connection was reset.VoIP Reset
3Indicates that a VoIP connection was terminated.VoIP Terminated
3Indicates that a VoIP connection was denied.VoIP Denied
1Indicates that a VoIP connection is in progress.VoIP In Progress
3Indicates that a VoIP connection was delayed.VoIP Delayed
3Indicates that a VoIP connection was redirected.VoIP Redirected
1Indicates an LDAP session started.LDAP Session Started
1Indicates an LDAP session ended.LDAP Session Ended
3Indicates that an LDAP session was denied.LDAP Session Denied
1Indicates that an LDAP session status message was reported.LDAP Session Status
4Indicates that an LDAP authentication failed.LDAP Authentication Failed
1Indicates that an LDAP authentication was successful.LDAP Authentication Succeeded
1Indicates that an Authentication, Authorization, and Accounting(AAA) session started.
AAA Session Started
Copyright © 2018, Juniper Networks, Inc.376
Juniper Secure Analytics Administration Guide

Table 97: Low-level Categories and Severity Levels for the Application Category (continued)
Severitylevel (0- 10)DescriptionLow-level event category
1Indicates that an AAA session ended.AAA Session Ended
3Indicates that an AAA session was denied.AAA Session Denied
1Indicates that an AAA session status message was reported.AAA Session Status
4Indicates that an AAA authentication failed.AAA Authentication Failed
1Indicates that an AAA authentication was successful.AAA Authentication Succeeded
4Indicates that an Internet Protocol Security (IPSEC) authenticationfailed.
IPSEC Authentication Failed
1Indicates that an IPSEC authentication was successful.IPSEC Authentication Succeeded
1Indicates that an IPSEC session started.IPSEC Session Started
1Indicates that an IPSEC session ended.IPSEC Session Ended
5Indicates that an IPSEC error message was reported.IPSEC Error
1Indicates that an IPSEC session status message was reported.IPSEC Status
1Indicates that an Instant Messenger (IM) session was established.IM Session Opened
1Indicates that an IM session was closed.IM Session Closed
3Indicates that an IM session was reset.IM Session Reset
3Indicates that an IM session was terminated.IM Session Terminated
3Indicates that an IM session was denied.IM Session Denied
1Indicates that an IM session is in progress.IM Session In Progress
3Indicates that an IM session was delayedIM Session Delayed
3Indicates that an IM session was redirected.IM Session Redirected
1Indicates that aWHOIS session was established.WHOIS Session Opened
1Indicates that aWHOIS session was closed.WHOIS Session Closed
3Indicates that aWHOIS session was reset.WHOIS Session Reset
377Copyright © 2018, Juniper Networks, Inc.
Chapter 26: Event Categories

Table 97: Low-level Categories and Severity Levels for the Application Category (continued)
Severitylevel (0- 10)DescriptionLow-level event category
3Indicates that aWHOIS session was terminated.WHOIS Session Terminated
3Indicates that aWHOIS session was denied.WHOIS Session Denied
1Indicates that aWHOIS session is in progress.WHOIS Session In Progress
3Indicates that aWHOIS session was redirected.WHOIS Session Redirected
1Indicates that a Traceroute session was established.Traceroute Session Opened
1Indicates that a Traceroute session was closed.Traceroute Session Closed
3Indicates that a Traceroute session was denied.Traceroute Session Denied
1Indicates that a Traceroute session is in progress.Traceroute Session In Progress
1TN3270 is a terminal emulation program, which is used to connectto an IBM® 3270 terminal. This category indicates that a TN3270session was established.
TN3270 Session Opened
1Indicates that a TN3270 session was closed.TN3270 Session Closed
3Indicates that a TN3270 session was reset.TN3270 Session Reset
3Indicates that a TN3270 session was terminated.TN3270 Session Terminated
3Indicates that a TN3270 session was denied.TN3270 Session Denied
1Indicates that a TN3270 session is in progress.TN3270 Session In Progress
1Indicates that a TFTP session was established.TFTP Session Opened
1Indicates that a TFTP session was closed.TFTP Session Closed
3Indicates that a TFTP session was reset.TFTP Session Reset
3Indicates that a TFTP session was terminated.TFTP Session Terminated
3Indicates that a TFTP session was denied.TFTP Session Denied
1Indicates that a TFTP session is in progress.TFTP Session In Progress
1Indicates that a Telnet session was established.Telnet Session Opened
1Indicates that a Telnet session was closed.Telnet Session Closed
Copyright © 2018, Juniper Networks, Inc.378
Juniper Secure Analytics Administration Guide

Table 97: Low-level Categories and Severity Levels for the Application Category (continued)
Severitylevel (0- 10)DescriptionLow-level event category
3Indicates that a Telnet session was reset.Telnet Session Reset
3Indicates that a Telnet session was terminated.Telnet Session Terminated
3Indicates that a Telnet session was denied.Telnet Session Denied
1Indicates that a Telnet session is in progress.Telnet Session In Progress
1Indicates that a syslog session was established.Syslog Session Opened
1Indicates that a syslog session was closed.Syslog Session Closed
3Indicates that a syslog session was denied.Syslog Session Denied
1Indicates that a syslog session is in progress.Syslog Session In Progress
1Indicates that a Secure Socket Layer (SSL) sessionwas established.SSL Session Opened
1Indicates that an SSL session was closed.SSL Session Closed
3Indicates that an SSL session was reset.SSL Session Reset
3Indicates that an SSL session was terminated.SSL Session Terminated
3Indicates that an SSL session was denied.SSL Session Denied
1Indicates that an SSL session is in progress.SSL Session In Progress
1Indicates that a Simple Network Management Protocol (SNMP)session was established.
SNMP Session Opened
1Indicates that an SNMP session was closed.SNMP Session Closed
3Indicates that an SNMP session was denied.SNMP Session Denied
1Indicates that an SNMP session is in progress.SNMP Session In Progress
1Indicates that a Server Message Block (SMB) session wasestablished.
SMB Session Opened
1Indicates that an SMB session was closed.SMB Session Closed
3Indicates that an SMB session was reset.SMB Session Reset
3Indicates that an SMB session was terminated.SMB Session Terminated
379Copyright © 2018, Juniper Networks, Inc.
Chapter 26: Event Categories

Table 97: Low-level Categories and Severity Levels for the Application Category (continued)
Severitylevel (0- 10)DescriptionLow-level event category
3Indicates that an SMB session was denied.SMB Session Denied
1Indicates that an SMB session is in progress.SMB Session In Progress
1Indicates that a Streaming Media session was established.Streaming Media Session Opened
1Indicates that a Streaming Media session was closed.Streaming Media Session Closed
3Indicates that a Streaming Media session was reset.Streaming Media Session Reset
3Indicates that a Streaming Media session was terminated.Streaming Media Session Terminated
3Indicates that a Streaming Media session was denied.Streaming Media Session Denied
1Indicates that a Streaming Media session is in progress.Streaming Media Session In Progress
1Indicates that a (Remote Users) RUSERS session was established.RUSERS Session Opened
1Indicates that a RUSERS session was closed.RUSERS Session Closed
3Indicates that a RUSERS session was denied.RUSERS Session Denied
1Indicates that a RUSERS session is in progress.RUSERS Session In Progress
1Indicates that a remote shell (rsh) session was established.Rsh Session Opened
1Indicates that an rsh session was closed.Rsh Session Closed
3Indicates that an rsh session was reset.Rsh Session Reset
3Indicates that an rsh session was terminated.Rsh Session Terminated
3Indicates that an rsh session was denied.Rsh Session Denied
1Indicates that an rsh session is in progress.Rsh Session In Progress
1Indicates that a Remote Login (RLOGIN) session was established.RLOGIN Session Opened
1Indicates that an RLOGIN session was closed.RLOGIN Session Closed
3Indicates that an RLOGIN session was reset.RLOGIN Session Reset
3Indicates that an RLOGIN session was terminated.RLOGIN Session Terminated
3Indicates that an RLOGIN session was denied.RLOGIN Session Denied
Copyright © 2018, Juniper Networks, Inc.380
Juniper Secure Analytics Administration Guide

Table 97: Low-level Categories and Severity Levels for the Application Category (continued)
Severitylevel (0- 10)DescriptionLow-level event category
1Indicates that an RLOGIN session is in progress.RLOGIN Session In Progress
1Indicates thata (RemoteExecution)REXECsessionwasestablished.REXEC Session Opened
1Indicates that an REXEC session was closed.REXEC Session Closed
3Indicates that an REXEC session was reset.REXEC Session Reset
3Indicates that an REXEC session was terminated.REXEC Session Terminated
3Indicates that an REXEC session was denied.REXEC Session Denied
1Indicates that an REXEC session is in progress.REXEC Session In Progress
1Indicates that a Remote Procedure Call (RPC) session wasestablished.
RPC Session Opened
1Indicates that an RPC session was closed.RPC Session Closed
3Indicates that an RPC session was reset.RPC Session Reset
3Indicates that an RPC session was terminated.RPC Session Terminated
3Indicates that an RPC session was denied.RPC Session Denied
1Indicates that an RPC session is in progress.RPC Session In Progress
1Indicates that a Network Time Protocol (NTP) session wasestablished.
NTP Session Opened
1Indicates that an NTP session was closed.NTP Session Closed
3Indicates that an NTP session was reset.NTP Session Reset
3Indicates that an NTP session was terminated.NTP Session Terminated
3Indicates that an NTP session was denied.NTP Session Denied
1Indicates that an NTP session is in progress.NTP Session In Progress
1Indicates that a Network News Transfer Protocol (NNTP) sessionwas established.
NNTP Session Opened
1Indicates that an NNTP session was closed.NNTP Session Closed
3Indicates that an NNTP session was reset.NNTP Session Reset
381Copyright © 2018, Juniper Networks, Inc.
Chapter 26: Event Categories

Table 97: Low-level Categories and Severity Levels for the Application Category (continued)
Severitylevel (0- 10)DescriptionLow-level event category
3Indicates that an NNTP session was terminated.NNTP Session Terminated
3Indicates that an NNTP session was denied.NNTP Session Denied
1Indicates that an NNTP session is in progress.NNTP Session In Progress
1Indicates that aNetwork File System(NFS) sessionwas established.NFS Session Opened
1Indicates that an NFS session was closed.NFS Session Closed
3Indicates that an NFS session was reset.NFS Session Reset
3Indicates that an NFS session was terminated.NFS Session Terminated
3Indicates that an NFS session was denied.NFS Session Denied
1Indicates that an NFS session is in progress.NFS Session In Progress
1Indicates that a Network Control Program (NCP) session wasestablished.
NCP Session Opened
1Indicates that an NCP session was closed.NCP Session Closed
3Indicates that an NCP session was reset.NCP Session Reset
3Indicates that an NCP session was terminated.NCP Session Terminated
3Indicates that an NCP session was denied.NCP Session Denied
1Indicates that an NCP session is in progress.NCP Session In Progress
1Indicates that a NetBIOS session was established.NetBIOS Session Opened
1Indicates that a NetBIOS session was closed.NetBIOS Session Closed
3Indicates that a NetBIOS session was reset.NetBIOS Session Reset
3Indicates that a NetBIOS session was terminated.NetBIOS Session Terminated
3Indicates that a NetBIOS session was denied.NetBIOS Session Denied
1Indicates that a NetBIOS session is in progress.NetBIOS Session In Progress
1Indicates that a MODBUS session was established.MODBUS Session Opened
Copyright © 2018, Juniper Networks, Inc.382
Juniper Secure Analytics Administration Guide

Table 97: Low-level Categories and Severity Levels for the Application Category (continued)
Severitylevel (0- 10)DescriptionLow-level event category
1Indicates that a MODBUS session was closed.MODBUS Session Closed
3Indicates that a MODBUS session was reset.MODBUS Session Reset
3Indicates that a MODBUS session was terminated.MODBUS Session Terminated
3Indicates that a MODBUS session was denied.MODBUS Session Denied
1Indicates that a MODBUS session is in progress.MODBUS Session In Progress
1Indicates that a Line Printer Daemon (LPD) sessionwas established.LPD Session Opened
1Indicates that an LPD session was closed.LPD Session Closed
3Indicates that an LPD session was reset.LPD Session Reset
3Indicates that an LPD session was terminated.LPD Session Terminated
3Indicates that an LPD session was denied.LPD Session Denied
1Indicates that an LPD session is in progress.LPD Session In Progress
1Indicates that a Lotus Notes® session was established.Lotus Notes® Session Opened
1Indicates that a Lotus Notes® session was closed.Lotus Notes® Session Closed
3Indicates that a Lotus Notes® session was reset.Lotus Notes® Session Reset
3Indicates that a Lotus Notes® session was terminated.Lotus Notes® Session Terminated
3Indicates that a Lotus Notes® session was denied.Lotus Notes® Session Denied
1Indicates that a Lotus Notes® session is in progress.Lotus Notes® Session In Progress
1Indicates that a Kerberos session was established.Kerberos Session Opened
1Indicates that a Kerberos session was closed.Kerberos Session Closed
3Indicates that a Kerberos session was reset.Kerberos Session Reset
3Indicates that a Kerberos session was terminated.Kerberos Session Terminated
3Indicates that a Kerberos session was denied.Kerberos Session Denied
1Indicates that a Kerberos session is in progress.Kerberos Session In Progress
383Copyright © 2018, Juniper Networks, Inc.
Chapter 26: Event Categories

Table 97: Low-level Categories and Severity Levels for the Application Category (continued)
Severitylevel (0- 10)DescriptionLow-level event category
1Indicates that an Internet Relay Chat (IRC) session was established.IRC Session Opened
1Indicates that an IRC session was closed.IRC Session Closed
3Indicates that an IRC session was reset.IRC Session Reset
3Indicates that an IRC session was terminated.IRC Session Terminated
3Indicates that an IRC session was denied.IRC Session Denied
1Indicates that an IRC session is in progress.IRC Session In Progress
1Indicates that an IEC 104 session was established.IEC 104 Session Opened
1Indicates that an IEC 104 session was closed.IEC 104 Session Closed
3Indicates that an IEC 104 session was reset.IEC 104 Session Reset
3Indicates that an IEC 104 session was terminated.IEC 104 Session Terminated
3Indicates that an IEC 104 session was denied.IEC 104 Session Denied
1Indicates that an IEC 104 session is in progress.IEC 104 Session In Progress
1Indicates that a TCP Client Identity Protocol (Ident) session wasestablished.
Ident Session Opened
1Indicates that an Ident session was closed.Ident Session Closed
3Indicates that an Ident session was reset.Ident Session Reset
3Indicates that an Ident session was terminated.Ident Session Terminated
3Indicates that an Ident session was denied.Ident Session Denied
1Indicates that an Ident session is in progress.Ident Session In Progress
1Indicates that an Inter-Control Center Communications Protocol(ICCP) session was established.
ICCP Session Opened
1Indicates that an ICCP session was closed.ICCP Session Closed
3Indicates that an ICCP session was reset.ICCP Session Reset
3Indicates that an ICCP session was terminated.ICCP Session Terminated
Copyright © 2018, Juniper Networks, Inc.384
Juniper Secure Analytics Administration Guide

Table 97: Low-level Categories and Severity Levels for the Application Category (continued)
Severitylevel (0- 10)DescriptionLow-level event category
3Indicates that an ICCP session was denied.ICCP Session Denied
1Indicates that an ICCP session is in progress.ICCP Session In Progress
1Indicates that a GroupWisesession was established.GroupWiseSession Opened
1Indicates that a GroupWise session was closed.GroupWiseSession Closed
3Indicates that a GroupWisesession was reset.GroupWiseSession Reset
3Indicates that a GroupWisesession was terminated.GroupWiseSession Terminated
3Indicates that a GroupWise session was denied.GroupWiseSession Denied
1Indicates that a GroupWise session is in progress.GroupWiseSession In Progress
1Indicates that a Gopher session was established.Gopher Session Opened
1Indicates that a Gopher session was closed.Gopher Session Closed
3Indicates that a Gopher session was reset.Gopher Session Reset
3Indicates that a Gopher session was terminated.Gopher Session Terminated
3Indicates that a Gopher session was denied.Gopher Session Denied
1Indicates that a Gopher session is in progress.Gopher Session In Progress
1Indicates that a General Inter-ORB Protocol (GIOP) session wasestablished.
GIOP Session Opened
1Indicates that a GIOP session was closed.GIOP Session Closed
3Indicates that a GIOP session was reset.GIOP Session Reset
3Indicates that a GIOP session was terminated.GIOP Session Terminated
3Indicates that a GIOP session was denied.GIOP Session Denied
1Indicates that a GIOP session is in progress.GIOP Session In Progress
1Indicates that a Finger session was established.Finger Session Opened
1Indicates that a Finger session was closed.Finger Session Closed
385Copyright © 2018, Juniper Networks, Inc.
Chapter 26: Event Categories

Table 97: Low-level Categories and Severity Levels for the Application Category (continued)
Severitylevel (0- 10)DescriptionLow-level event category
3Indicates that a Finger session was reset.Finger Session Reset
3Indicates that a Finger session was terminated.Finger Session Terminated
3Indicates that a Finger session was denied.Finger Session Denied
1Indicates that a Finger session is in progress.Finger Session In Progress
1Indicates that an Echo session was established.Echo Session Opened
1Indicates that an Echo session was closed.Echo Session Closed
3Indicates that an Echo session was denied.Echo Session Denied
1Indicates that an Echo session is in progress.Echo Session In Progress
1Indicates that a Remote .NET session was established.Remote .NET Session Opened
1Indicates that a Remote .NET session was closed.Remote .NET Session Closed
3Indicates that a Remote .NET session was reset.Remote .NET Session Reset
3Indicates that a Remote .NET session was terminated.Remote .NET Session Terminated
3Indicates that a Remote .NET session was denied.Remote .NET Session Denied
1Indicates that a Remote .NET session is in progress.Remote .NET Session In Progress
1Indicates that aDistributedNetworkProctologic (DNP3) sessionwasestablished.
DNP3 Session Opened
1Indicates that a DNP3 session was closed.DNP3 Session Closed
3Indicates that a DNP3 session was reset.DNP3 Session Reset
3Indicates that a DNP3 session was terminated.DNP3 Session Terminated
3Indicates that a DNP3 session was denied.DNP3 Session Denied
1Indicates that a DNP3 session is in progress.DNP3 Session In Progress
1Indicates that a Discard session was established.Discard Session Opened
1Indicates that a Discard session was closed.Discard Session Closed
Copyright © 2018, Juniper Networks, Inc.386
Juniper Secure Analytics Administration Guide

Table 97: Low-level Categories and Severity Levels for the Application Category (continued)
Severitylevel (0- 10)DescriptionLow-level event category
3Indicates that a Discard session was reset.Discard Session Reset
3Indicates that a Discard session was terminated.Discard Session Terminated
3Indicates that a Discard session was denied.Discard Session Denied
1Indicates that a Discard session is in progress.Discard Session In Progress
1Indicates thataDynamicHostConfigurationProtocol (DHCP)sessionwas established.
DHCP Session Opened
1Indicates that a DHCP session was closed.DHCP Session Closed
3Indicates that a DHCP session was denied.DHCP Session Denied
1Indicates that a DHCP session is in progress.DHCP Session In Progress
1Indicates that a DHCP lease was successfully obtainedDHCP Success
3Indicates that a DHCP lease cannot be obtained.DHCP Failure
1Indicates that a Concurrent Versions System (CVS) session wasestablished.
CVS Session Opened
1Indicates that a CVS session was closed.CVS Session Closed
3Indicates that a CVS session was reset.CVS Session Reset
3Indicates that a CVS session was terminated.CVS Session Terminated
3Indicates that a CVS session was denied.CVS Session Denied
1Indicates that a CVS session is in progress.CVS Session In Progress
1Indicates that aCommonUNIXPrinting System (CUPS) sessionwasestablished.
CUPS Session Opened
1Indicates that a CUPS session was closed.CUPS Session Closed
3Indicates that a CUPS session was reset.CUPS Session Reset
3Indicates that a CUPS session was terminated.CUPS Session Terminated
3Indicates that a CUPS session was denied.CUPS Session Denied
1Indicates that a CUPS session is in progress.CUPS Session In Progress
387Copyright © 2018, Juniper Networks, Inc.
Chapter 26: Event Categories

Table 97: Low-level Categories and Severity Levels for the Application Category (continued)
Severitylevel (0- 10)DescriptionLow-level event category
1Indicates that a Character Generator (Chargen) sessionwas started.Chargen Session Started
1Indicates that a Chargen session was closed.Chargen Session Closed
3Indicates that a Chargen session was reset.Chargen Session Reset
3Indicates that a Chargen session was terminated.Chargen Session Terminated
3Indicates that a Chargen session was denied.Chargen Session Denied
1Indicates that a Chargen session is in progress.Chargen Session In Progress
1Indicates that a miscellaneous VPN session was detectedMisc VPN
1Indicates that a DAP session was established.DAP Session Started
1Indicates that a DAP session ended.DAP Session Ended
3Indicates that a DAP session was denied.DAP Session Denied
1Indicates that a DAP session status request wasmade.DAP Session Status
1Indicates that a DAP session is in progress.DAP Session in Progress
4Indicates that a DAP authentication failed.DAP Authentication Failed
1Indicates that DAP authentication succeeded.DAP Authentication Succeeded
1Indicates that a TOR session was established.TOR Session Started
1Indicates that a TOR session was closed.TOR Session Closed
3Indicates that a TOR session was reset.TOR Session Reset
3Indicates that a TOR session was terminated.TOR Session Terminated
3Indicates that a TOR session was denied.TOR Session Denied
1Indicates that a TOR session is in progress.TOR Session In Progress
1Indicates that a game session was started.Game Session Started
1Indicates that a game session was closed.Game Session Closed
3Indicates that a game session was reset.Game Session Reset
Copyright © 2018, Juniper Networks, Inc.388
Juniper Secure Analytics Administration Guide

Table 97: Low-level Categories and Severity Levels for the Application Category (continued)
Severitylevel (0- 10)DescriptionLow-level event category
3Indicates that a game session was terminated.Game Session Terminated
3Indicates that a game session was denied.Game Session Denied
1Indicates that a game session is in progress.Game Session In Progress
2Indicates that an attempt to log in as an administrative user wasdetected.
Admin Login Attempt
2Indicates that an attempt to log in as a non-administrative user wasdetected.
User Login Attempt
1Indicates client/server activity.Client Server
1Indicates content delivery activity.Content Delivery
3Indicates a data transfer.Data Transfer
3Indicates data warehousing activity.DataWarehousing
2Indicates directory service activity.Directory Services
1Indicates file print activity.File Print
2Indicates file transfer.File Transfer
4Indicates game activity.Games
1Indicates healthcare activity.Healthcare
1Indicates inner system activity.Inner System
1Indicates Internet Protocol activity.Internet Protocol
1Indicates legacy activity.Legacy
1Indicates mail activity.Mail
2Indicates miscellaneous activity.Misc
2Indicates multimedia activity.Multimedia
Indicates network management activity.Network Management
4Indicates Peer-to-Peer (P2P) activity.P2P
389Copyright © 2018, Juniper Networks, Inc.
Chapter 26: Event Categories

Table 97: Low-level Categories and Severity Levels for the Application Category (continued)
Severitylevel (0- 10)DescriptionLow-level event category
3Indicates Remote Access activity.Remote Access
1Indicates routing protocol activity.Routing Protocols
2Indicates security protocol activity.Security Protocols
2Indicates streaming activity.Streaming
3Indicates uncommon protocol activity.Uncommon Protocol
1Indicates VoIP activity.VoIP
1Indicates web activity.Web
1Indicates ICMP activityICMP
RelatedDocumentation
Audit on page 390•
• Risk on page 391
• Risk Manager Audit on page 392
Audit
The audit category contains events that are related to audit activity, such as email or
FTP activity.
The following table describes the low-level event categories and associated severity
levels for the audit category.
Table 98: Low-level Categories and Severity Levels for the Audit Category
Severity level(0 - 10)DescriptionLow-level event category
1Indicates that a general audit event was started.General Audit Event
1Indicates that a built-in audit task was run.Built-in Execution
1Indicates that a bulk copy of data was detected.Bulk Copy
1Indicates that a data dumpwas detected.Data Dump
1Indicates that a data import was detected.Data Import
Copyright © 2018, Juniper Networks, Inc.390
Juniper Secure Analytics Administration Guide

Table 98: Low-level Categories and Severity Levels for the Audit Category (continued)
Severity level(0 - 10)DescriptionLow-level event category
1Indicates that a data selection process was detected.Data Selection
1Indicates that the data truncation process was detected.Data Truncation
1Indicates that the data update process was detected.Data Update
1Indicates that the database procedure or trigger execution wasdetected.
Procedure/Trigger Execution
1Indicates that the schema for a procedure or trigger execution wasaltered.
Schema Change
RelatedDocumentation
Risk on page 391•
• Risk Manager Audit on page 392
• Control on page 393
Risk
The risk category contains events that are related to JSA Risk Manager.
The following table describes the low-level event categories and associated severity
levels for the risk category.
Table 99: Low-level Categories and Severity Levels for the Risk Category
Severitylevel (0 -10)DescriptionLow-level event category
5Indicates that a policy exposure was detected.Policy Exposure
5Indicates that a compliance violation was detected.Compliance Violation
9Indicates that the network or device has an exposed vulnerability.Exposed Vulnerability
9Indicates that the network or device has a remote accessvulnerability.
Remote Access Vulnerability
7Indicates that the network or device has local access vulnerability.Local Access Vulnerability
5Indicates that the network or device has open wireless access.OpenWireless Access
5Indicates that the host or device has weak encryption.Weak Encryption
391Copyright © 2018, Juniper Networks, Inc.
Chapter 26: Event Categories

Table 99: Low-level Categories and Severity Levels for the Risk Category (continued)
Severitylevel (0 -10)DescriptionLow-level event category
3Indicates that a host or device is transmitting data that is notencrypted.
Un-Encrypted Data Transfer
3Indicates that the data store is not encrypted.Un-Encrypted Data Store
3Indicates that a rule is not configured properly.Mis-Configured Rule
3Indicates that a device on the network is not configured properly.Mis-Configured Device
3Indicates that a network host is not configured properly.Mis-Configured Host
5Indicates that the possibility of data loss was detected.Data Loss Possible
5Indicates that a host or device is susceptible to fraud.Weak Authentication
7Indicates that no password exists.No Password
7Indicates that a host or device is susceptible to fraud.Fraud
3Indicates a host or device is a possible DoS target.Possible DoS Target
3Indicates a host or device has a possible DoS weakness.Possible DoSWeakness
5Indicates that a loss of confidentially was detected.Loss of Confidentiality
1Indicates thatapolicymonitor risk scoreaccumulationwasdetected.Policy Monitor Risk Score Accumulation
RelatedDocumentation
Risk Manager Audit on page 392•
• Control on page 393
• Asset Profiler on page 395
Risk Manager Audit
The risk category contains events that are related to JSA Risk Manager audit events.
The following table describes the low-level event categories and associated severity
levels for the Risk Manager audit category.
Copyright © 2018, Juniper Networks, Inc.392
Juniper Secure Analytics Administration Guide

Table 100: Low-level Categories and Severity Levels for the Risk Manager Audit Category
Severity level (0 -10)DescriptionLow-level event category
3Indicates that a policy monitor wasmodified.Policy Monitor
3Indicates that a topology wasmodified.Topology
3Indicates that a simulation wasmodified.Simulations
3Indicates that administrative changes were made.Administration
RelatedDocumentation
Control on page 393•
• Asset Profiler on page 395
• Risk on page 391
Control
The control category contains events that are related to your hardware system.
The following table describes the low-level event categories and associated severity
levels for the control category.
Table 101: Low-level Categories and Severity Levels for the Control Category
Severitylevel (0 -10)DescriptionLow-level event category
1Indicates that a device was read.Device Read
1Indicates communication with a device.Device Communication
1Indicates that a device audit occurred.Device Audit
1Indicates that a device event occurred.Device Event
1Indicates that a ping action to a device occurred.Device Ping
1Indicates that a device was configured.Device Configuration
1Indicates that a device route action occurred.Device Route
1Indicates that a device import occurred.Device Import
1Indicates that a device information action occurred.Device Information
393Copyright © 2018, Juniper Networks, Inc.
Chapter 26: Event Categories

Table 101: Low-level Categories and Severity Levels for the Control Category (continued)
Severitylevel (0 -10)DescriptionLow-level event category
1Indicates that a warning was generated on a device.DeviceWarning
1Indicates that an error was generated on a device.Device Error
1Indicates a relay event.Relay Event
1Indicates a Network Interface Card (NIC) event.NIC Event
1Indicates an event on amobile device.UIQ Event
1Indicates an event on an Integrated Management Unit (IMU).IMU Event
1Indicates a billing event.Billing Event
1Indicates an event on the Database Management System (DBMS).DBMS Event
1Indicates that an import occurred.Import Event
1Indicates that a location import occurred.Location Import
1Indicates that a route import occurred.Route Import
1Indicates that an export occurred.Export Event
1Indicates remote signaling.Remote Signalling
1Indicates gateway status.Gateway Status
1Indicates that a job occurred.Job Event
1Indicates that a security event occurred.Security Event
1Indicates that the system detected a tamper action.Device Tamper Detection
1Indicates that a time event occurred.Time Event
1Indicates that suspicious behavior occurred.Suspicious Behavior
1Indicates that a power outage occurred.Power Outage
1Indicates that power was restored.Power Restoration
1Indicates that a heartbeat ping occurred.Heartbeat
1Indicates a remote connection to the system.Remote Connection Event
Copyright © 2018, Juniper Networks, Inc.394
Juniper Secure Analytics Administration Guide

RelatedDocumentation
Asset Profiler on page 395•
• Risk on page 391
• Risk Manager Audit on page 392
Asset Profiler
The asset profiler category contains events that are related to asset profiles.
The following table describes the low-level event categories and associated severity
levels for the asset profiler category.
Table 102: Low-level Categories and Severity Levels for the Asset Profiler Category
Severitylevel (0- 10)DescriptionLow-level event category
1Indicates that an asset was created.Asset Created
1Indicates that an asset was updated.Asset Updated
1Indicates that an asset was observed.Asset Observed
1Indicates that an asset wasmoved.Asset Moved
1Indicates that an asset was deleted.Asset Deleted
1Indicates that a host namewas cleaned.Asset Hostname Cleaned
1Indicates that a host namewas created.Asset Hostname Created
1Indicates that a host namewas updated.Asset Hostname Updated
1Indicates that a host namewas observed.Asset Hostname Observed
1Indicates that a host namewasmoved.Asset HostnameMoved
1Indicates that a host namewas deleted.Asset Hostname Deleted
1Indicates that a port was cleaned.Asset Port Cleaned
1Indicates that a port was created.Asset Port Created
1Indicates that a port was updated.Asset Port Updated
1Indicates that a port was observed.Asset Port Observed
1Indicates that a port wasmoved.Asset Port Moved
395Copyright © 2018, Juniper Networks, Inc.
Chapter 26: Event Categories

Table 102: Low-level Categories andSeverity Levels for theAsset Profiler Category (continued)
Severitylevel (0- 10)DescriptionLow-level event category
1Indicates that a port was deleted.Asset Port Deleted
1Indicates that a vulnerability instance was cleaned.Asset Vuln Instance Cleaned
1Indicates that a vulnerability instance was created.Asset Vuln Instance Created
1Indicates that a vulnerability instance was updated.Asset Vuln Instance Updated
1Indicates that a vulnerability instance was observed.Asset Vuln Instance Observed
1Indicates that a vulnerability instance wasmoved.Asset Vuln Instance Moved
1Indicates that a vulnerability instance was deleted.Asset Vuln Instance Deleted
1Indicates that an operating systemwas cleaned.Asset OS Cleaned
1Indicates that an operating systemwas created.Asset OS Created
1Indicates that an operating systemwas updated.Asset OS Updated
1Indicates that an operating systemwas observed.Asset OS Observed
1Indicates that an operating systemwasmoved.Asset OSMoved
1Indicates that an operating systemwas deleted.Asset OS Deleted
1Indicates that a property was cleaned.Asset Property Cleaned
1Indicates that a property was created.Asset Property Created
1Indicates that a property was updated.Asset Property Updated
1Indicates that a property was observed.Asset Property Observed
1Indicates that a property wasmoved.Asset Property Moved
1Indicates that a property wasmoved.Asset Property Deleted
1Indicates that an IP address was cleaned.Asset IP Address Cleaned
1Indicates that an IP address was created.Asset IP Address Created
1Indicates that an IP address was updated.Asset IP Address Updated
1Indicates that an IP address was observed.Asset IP Address Observed
Copyright © 2018, Juniper Networks, Inc.396
Juniper Secure Analytics Administration Guide

Table 102: Low-level Categories andSeverity Levels for theAsset Profiler Category (continued)
Severitylevel (0- 10)DescriptionLow-level event category
1Indicates that an IP address wasmoved.Asset IP Address Moved
1Indicates that an IP address was deleted.Asset IP Address Deleted
1Indicates that an interface was cleaned.Asset Interface Cleaned
1Indicates that an interface was created.Asset Interface Created
1Indicates that an interface was updated.Asset Interface Updated
1Indicates that an interface was observed.Asset Interface Observed
1Indicates that an interface wasmoved.Asset Interface Moved
1Indicates that an interface wasmerged.Asset Interface Merged
1Indicates that an interface was deleted.Asset Interface Deleted
1Indicates that a user was cleaned.Asset User Cleaned
1Indicates that a user was observed.Asset User Observed
1Indicates that a user wasmoved.Asset User Moved
1Indicates that a user was deleted.Asset User Deleted
1Indicates that a scanned policy was cleaned.Asset Scanned Policy Cleaned
1Indicates that a scanned policy was observed.Asset Scanned Policy Observed
1Indicates that a scanned policy wasmoved.Asset Scanned Policy Moved
1Indicates that a scanned policy was deleted.Asset Scanned Policy Deleted
1Indicates that aWindows application was cleaned.AssetWindows Application Cleaned
1Indicates that aWindows application was observed.AssetWindows Application Observed
1Indicates that aWindows application wasmoved.AssetWindows Application Moved
1Indicates that aWindows application was deleted.AssetWindows Application Deleted
1Indicates that a scanned service was cleaned.Asset Scanned Service Cleaned
1Indicates that a scanned service was observed.Asset Scanned Service Observed
397Copyright © 2018, Juniper Networks, Inc.
Chapter 26: Event Categories

Table 102: Low-level Categories andSeverity Levels for theAsset Profiler Category (continued)
Severitylevel (0- 10)DescriptionLow-level event category
1Indicates that a scanned service wasmoved.Asset Scanned Service Moved
1Indicates that a scanned service was deleted.Asset Scanned Service Deleted
1Indicates that aWindows patch was cleaned.AssetWindows Patch Cleaned
1Indicates that aWindows patch was observed.AssetWindows Patch Observed
1Indicates that aWindows patch wasmoved.AssetWindows Patch Moved
1Indicates that aWindows patch was deleted.AssetWindows Patch Deleted
1Indicates that a UNIX patch was cleaned.Asset UNIX Patch Cleaned
1Indicates that a UNIX patch was observed.Asset UNIX Patch Observed
1Indicates that a UNIX patch wasmoved.Asset UNIX Patch Moved
1Indicates that a UNIX patch was deleted.Asset UNIX Patch Deleted
1Indicates that a patch scan was cleaned.Asset Patch Scan Cleaned
1Indicates that a patch scan was created.Asset Patch Scan Created
1Indicates that a patch scan wasmoved.Asset Patch Scan Moved
1Indicates that a patch scan was deleted.Asset Patch Scan Deleted
1Indicates that a port scan was cleaned.Asset Port Scan Cleaned
1Indicates that a port scan was cleaned.Asset Port Scan Created
1Indicates that a patch scan wasmoved.Asset Port Scan Moved
1Indicates that a patch scan was deleted.Asset Port Scan Deleted
1Indicates that a client application was cleaned.Asset Client Application Cleaned
1Indicates that a client application was observed.Asset Client Application Observed
1Indicates that a client application wasmoved.Asset Client Application Moved
1Indicates that a client application was deleted.Asset Client Application Deleted
1Indicates that a patch scan was observed.Asset Patch Scan Observed
Copyright © 2018, Juniper Networks, Inc.398
Juniper Secure Analytics Administration Guide

Table 102: Low-level Categories andSeverity Levels for theAsset Profiler Category (continued)
Severitylevel (0- 10)DescriptionLow-level event category
1Indicates that a port scan was observed.Asset Port Scan Observed
RelatedDocumentation
• Risk on page 391
• Risk Manager Audit on page 392
• Control on page 393
399Copyright © 2018, Juniper Networks, Inc.
Chapter 26: Event Categories

Copyright © 2018, Juniper Networks, Inc.400
Juniper Secure Analytics Administration Guide

CHAPTER 27
Common Ports and Servers Used by JSA
• Common Ports and Servers Used by JSA on page 401
• JSA Port Usage on page 402
• Viewing IMQ Port Associations on page 410
• Searching for Ports in Use by JSA on page 411
• JSA Public Servers on page 411
Common Ports and Servers Used by JSA
JSA requires that certain ports are ready to receive information from JSA components
and external infrastructure. To ensure that JSA is using the most recent security
information, it also requires access to public servers and RSS feeds.
SSH Communication on Port 22
All the ports that are used by the JSA console to communicate with managed hosts can
be tunneled, by encryption, through port 22 over SSH.
The console connects to the managed hosts using an encrypted SSH session to
communicate securely. These SSH sessions are initiated from the console to provide
data to themanagedhost. For example, the JSAconsolecan initiatemultipleSSHsessions
to the Event Processor appliances for secure communication. This communication can
include tunneled ports over SSH, such as HTTPS data for port 443 and Ariel query data
for port 32006. JSA flow processor that use encryption can initiate SSH sessions to Flow
Processor appliances that require data.
Open Ports That Are Not Required by JSA
Installing additional software on your systemmay open ports that are not required by
JSA. For example, youmight find additional ports open in the following situations:
• When youmount or export a network file share, youmight see dynamically assigned
ports that are required for RPC services, such as rpc.mountd and rpc.rquotad.
• Whenyou install third-partybackupand recovery software, suchasVeritasNetBackup,
youmight see open ports that are required for processes such as bpcd and
pbx_exchange.
401Copyright © 2018, Juniper Networks, Inc.

If you see open ports on your system that are not listed in JSA documentation, refer to
the vendor documentation for the other software that is installed on your system.
JSA Port Usage
Review the list of commonports that JSA services and components use to communicate
across the network. You can use the port list to determine which ports must be open in
your network. For example, you can determine which ports must be open for the JSA
console to communicate with remote event processors.
WinCollect Remote Polling
WinCollect agents that remotely poll other MicrosoftWindows operating systemsmight
require additional port assignments.
For more information, see the JSAWinCollect User Guide.
JSA Listening Ports
The following table shows the JSA ports that are open in a LISTEN state. The LISTEN
ports are valid only when iptables is enabled on your system. Unless otherwise noted,
information about the assigned port number applies to all JSA products.
Table 103: Listening Ports That Are Used by JSA Services and Components
RequirementDirectionProtocolDescriptionPort
Remotemanagementaccess.
Adding a remote system asamanaged host.
Log source protocols toretrieve files from externaldevices, for example the logfile protocol.
Users who use thecommand-line interface tocommunicate fromdesktops to the Console.
High-availability (HA).
Bidirectional from the JSA consoleto all other components.
TCPSSH22
Emails from JSA to anSMTP gateway.
Delivery of error andwarning email messages toan administrative emailcontact.
From all managed hosts to theSMTP gateway.
TCPSMTP25
Time synchronizationbetween the JSA consoleandmanaged hosts.
All systems to the JSA console.
JSA console to the NTP or rdateserver.
UDP/TCPrdate (time)37
Copyright © 2018, Juniper Networks, Inc.402
Juniper Secure Analytics Administration Guide

Table 103: Listening Ports That Are Used by JSA Services and Components (continued)
RequirementDirectionProtocolDescriptionPort
Remote Procedure Calls(RPC) for required services,such as Network FileSystem (NFS).
Managed hosts that communicatewith the JSA console.
Users that connect to the JSAconsole.
TCP/UDPPort mapper111
This traffic is generated byWinCollect, MicrosoftSecurityEventLogProtocol,or Adaptive Log Exporter.
NOTE: DCOM typicallyallocates a random portrange for communication.YoucanconfigureMicrosoftWindows products to use aspecific port. For moreinformation, see yourMicrosoft Windowsdocumentation.
Bidirectional traffic betweenWinCollect agents andWindowsoperatingsystemsthatare remotelypolled for events.
Bidirectional traffic between JSAconsole components or JSA eventcollectors that use either MicrosoftSecurity Event Log Protocol orAdaptive Log Exporter agents andWindows operating systems thatare remotely polled for events.
TCPDCOM135 anddynamicallyallocatedports above1024 for RPCcalls.
This traffic is generated byWinCollect, MicrosoftSecurityEventLogProtocol,or Adaptive Log Exporter.
Bidirectional traffic betweenWinCollect agents andWindowsoperatingsystemsthatare remotelypolled for events.
Bidirectional traffic between JSAconsole components or JSA EventCollectors that use either MicrosoftSecurity Event Log Protocol orAdaptive Log Exporter agents andWindows operating systems thatare remotely polled for events.
UDPWindows NetBIOS nameservice
137
This traffic is generated byWinCollect, MicrosoftSecurityEventLogProtocol,or Adaptive Log Exporter.
Bidirectional traffic betweenWinCollect agents andWindowsoperatingsystemsthatare remotelypolled for events.
Bidirectional traffic between JSAconsole components or JSA EventCollectors that use either MicrosoftSecurity Event Log Protocol orAdaptive Log Exporter agents andWindows operating systems thatare remotely polled for events.
UDPWindowsNetBIOSdatagramservice
138
403Copyright © 2018, Juniper Networks, Inc.
Chapter 27: Common Ports and Servers Used by JSA

Table 103: Listening Ports That Are Used by JSA Services and Components (continued)
RequirementDirectionProtocolDescriptionPort
This traffic is generated byWinCollect, MicrosoftSecurityEventLogProtocol,or Adaptive Log Exporter.
Bidirectional traffic betweenWinCollect agents andWindowsoperatingsystemsthatare remotelypolled for events.
Bidirectional traffic between JSAconsole components or JSA EventCollectors that use either MicrosoftSecurity Event Log Protocol orAdaptive Log Exporter agents andWindows operating systems thatare remotely polled for events.
TCPWindows NetBIOS sessionservice
139
UDP port for the NetSNMPdaemon that listens forcommunications (v1, v2c,and v3) from external logsources. The port is openonly when the SNMP agentis enabled.
JSAmanagedhosts that connect tothe JSA console.
External log sources to JSA EventCollectors.
UDPNetSNMP162
TCP port for the NetSNMPdaemon that listens forcommunications (v1, v2c,and v3) from external logsources. The port is openonly when the SNMP agentis enabled.
JSAmanagedhosts that connect tothe JSA console.
External log sources to JSA EventCollectors.
TCPNetSNMP199
The IntegratedManagement Module usesthe port to find services ona LAN.
UDP/TCPService Location Protocol(SLP)
427
Configurationdownloads tomanaged hosts from theJSA console.
JSAmanaged hosts thatconnect to the JSA console.
Users to have log in accessto JSA.
JSA console that manageand provide configurationupdates for WinCollectagents.
Bidirectional traffic for securecommunications from all productsto the JSA console.
TCPApache/HTTPS443
Copyright © 2018, Juniper Networks, Inc.404
Juniper Secure Analytics Administration Guide

Table 103: Listening Ports That Are Used by JSA Services and Components (continued)
RequirementDirectionProtocolDescriptionPort
This traffic is generated byWinCollect, MicrosoftSecurityEventLogProtocol,or Adaptive Log Exporter.
Bidirectional traffic betweenWinCollect agents andWindowsoperatingsystemsthatare remotelypolled for events.
Bidirectional traffic between JSAconsole components or JSA EventCollectors that use the MicrosoftSecurity Event Log Protocol andWindows operating systems thatare remotely polled for events.
Bidirectional traffic betweenAdaptive Log Exporter agents andWindows operating systems thatare remotely polled for events.
TCPMicrosoft Directory Service445
External log sources to sendevent data to JSAcomponents.
Syslog traffic includesWinCollect agents, eventcollectors, and AdaptiveLog Exporter agentscapable of sending eitherUDP or TCP events to JSA.
External network appliances thatprovide TCP syslog events usebidirectional traffic.
External network appliances thatprovide UDP syslog events useuni-directional traffic.
Internal syslog traffic from JSAhosts to the JSA console.
UDP/TCPSyslog514
The Network File System(NFS)mount daemon,which processes requeststo mount a file system at aspecified location.
Connections between the JSAconsole and NFS server.
TCP/UDPNetwork File System (NFS)mount daemon (mountd)
762
Internal logging port forsyslog-ng.
Connectionbetweenthe localEventCollector component and localEvent Processor component to thesyslog-ng daemon for logging.
TCP/UDPSyslog-ng1514
The Network File System(NFS) protocol to sharefiles or data betweencomponents.
Connections between the JSAconsole and NFS server.
TCPNFS2049
NetFlow datagram fromcomponents, such asrouters.
Fromthemanagement interfaceonthe flow source (typically a router)to the JSA flow processor.
UDPNetFlow data2055
Used to manage JSAapplication frameworkresources.
Internal communications. This portis not available externally.
TCPDocker command port2375
405Copyright © 2018, Juniper Networks, Inc.
Chapter 27: Common Ports and Servers Used by JSA

Table 103: Listening Ports That Are Used by JSA Services and Components (continued)
RequirementDirectionProtocolDescriptionPort
If the Microsoft Windowsoperating system isconfigured to support RDPand Ethernet over USB, auser can initiate a sessionto the server over themanagementnetwork.Thismeans the default port forRDP, 3389must be open.
TCP/UDPRemote Desktop Protocol(RDP) and Ethernet overUSB is enabled
3389
Use this port to interactwith the JSA consolethrough the IntegratedManagement Module.
TCP/UDPIntegrated ManagementModule remote presenceport
3900
This port is assigned as aredirect port for AddressResolution Protocol (ARP)requests in JSA offenseresolution.
TCPRedirect port4333
Required for provisioningmanaged hosts from theAdmin tab.
Communication for the managedhost that is used to access the localdatabase instance.
TCPPostgres5432
External log sources to sendencryptedeventdata to JSAcomponents.
External network appliances thatprovide encrypted TCP syslogevents use bidirectional traffic.
TCPSyslog6514
Heartbeat ping from asecondaryhost toaprimaryhost in an HA cluster todetecthardwareornetworkfailure.
Bidirectional between thesecondary host and primary host inan HA cluster.
TCP/UDPHigh-availability heartbeat6543
Message queue broker forcommunications betweencomponentsonamanagedhost.
Ports 7676 and 7677 arestatic TCP ports, and fourextra connections arecreated on random ports.Formore informationaboutfinding randomly boundports, see “Viewing IMQPort Associations” onpage 410.
Message queue communicationsbetween components on amanaged host.
TCPMessaging connections(IMQ)
7676, 7677,and fourrandomlybound portsabove32000.
Copyright © 2018, Juniper Networks, Inc.406
Juniper Secure Analytics Administration Guide

Table 103: Listening Ports That Are Used by JSA Services and Components (continued)
RequirementDirectionProtocolDescriptionPort
JMX server (JavaManagement Beans)monitoring for all internalJSA processes to exposesupportability metrics.
Theseportsareusedby JSAsupport.
Internal communications. Theseports are not available externally.
TCPJMX server ports7777, 7778,7779, 7780,7781, 7782,7783, 7788,7790, 7791,7792, 7793,7795, 7799,and 8989.
Distributed ReplicatedBlock Device (DRBD) usedto keep drives synchronizedbetween the primary andsecondary hosts in HAconfigurations.
Bidirectional between thesecondary host and primary host inan HA cluster.
TCP/UDPHA Distributed ReplicatedBlock Device (DRBD)
7789
Real-time (streaming) forevents.
From the Event Collector to the JSAconsole.
TCPApache Tomcat7800
Real-time (streaming) forflows.
From the Event Collector to the JSAconsole.
TCPApache Tomcat7801
Anomaly detection engineport.
From the Event Collector to the JSAconsole.
TCPApache Tomcat7803
This port is used for JSARisk Manager only. It is notavailable externally.
Internal control communicationsbetween JSA processes and ARCbuilder.
TCPQRM Arc builder7804
Listening port for specificEvent Collection Service(ECS).
From the Event Collector to the JSAconsole.
TCPEvent Collection service(ECS)
8000
UDP listening port forexternal SNMP datarequests.
External SNMP systems thatrequest SNMP trap informationfrom the JSA console.
UDPSNMP daemon port8001
Open to control tomcat.
This port is bound and onlyaccepts connections fromthe local host.
Internal communications. Notavailable externally.
TCPApache Tomcat8005
Tomcat connector, wherethe request is used andproxied for the web service.
From the HTTP daemon (HTTPd)process to Tomcat.
TCPApache Tomcat8009
Tomcat connector, wherethe request is used andproxied for the web service.
From the HTTP daemon (HTTPd)process to Tomcat.
TCPApache Tomcat8080
407Copyright © 2018, Juniper Networks, Inc.
Chapter 27: Common Ports and Servers Used by JSA

Table 103: Listening Ports That Are Used by JSA Services and Components (continued)
RequirementDirectionProtocolDescriptionPort
This traffic is generated bytheWinCollect agent andcommunication isencrypted. It is required toprovide configurationupdates to theWinCollectagent and to useWinCollect in connectedmode.
Bidirectional traffic betweenWinCollect agent and JSA console.
TCPWinCollect agents8413
Used by Apache Tomcat toread RSS feeds from thehost that is running the JSAVulnerability Managerprocessor.
Unidirectional fromthe JSAconsoleto the appliance that is running theJSA Vulnerability Managerprocessor.
TCPApache Tomcat8844
Communications betweenJSA processes and theXForce Reputation IPdatabase.
Internal communications. Notavailable externally.
TCPXForce IP Reputationdatabase and server
9090
When the web applicationis registered, one additionalport is dynamicallyassigned.
Bidirectional Java Remote MethodInvocation (RMI) communicationbetween Java Virtual Machines
TCPWeb application container9913plusonedynamicallyassignedport
NetFlow datagram fromcomponents, such asrouters.
Fromthemanagement interfaceonthe flow source (typically a router)to the JSA flow processor.
UDPNetFlow data9995
Used for JSA VulnerabilityManager (QVM) commandinformation. The JSAconsole connects to thisport on the host that isrunning the JSAVulnerability Managerprocessor. This port is onlyusedwhenQVM is enabled.
Unidirectional from the scanner tothe appliance running the JSAVulnerability Manager processor
TCPJSA Vulnerability Managerprocessor
9999
In JSA V2014.5 and earlier,this port is used for serverchanges, such as the hostsroot password and firewallaccess.
Port 10000 is disabled in2014.6.
User desktop systems to all JSAhosts.
TCP/UDPJSA web-based, systemadministration interface
10000
Required to ensure that theHA nodes are still active.
Bidirectional traffic between theprimary and secondary HA nodes.
TCPHeartbeat command10101, 10102
Copyright © 2018, Juniper Networks, Inc.408
Juniper Secure Analytics Administration Guide

Table 103: Listening Ports That Are Used by JSA Services and Components (continued)
RequirementDirectionProtocolDescriptionPort
Used for JSA VulnerabilityManager (QVM)configuration and storage.This port is only used whenQVM is enabled.
Communication for the managedhost that is used to access the localdatabase instance.
TCPPostgres15433
SOAPweb server port fortheEventCollectionService(ECS).
TCPSOAPweb server23111
Normalized event data thatis communicated from anoff-site source or betweenJSA Event Collectors.
Bidirectional between JSAcomponents.
TCPNormalizedevent forwarding32004
Data flow communicationport between JSA EventCollectors when onseparate managed hosts.
Bidirectional between JSAcomponents.
TCPData flow32005
Communication portbetween the Ariel proxyserver and the Ariel queryserver.
Bidirectional between JSAcomponents.
TCPAriel queries32006
Events and flowscontributing to an offenseor involved in globalcorrelation.
Bidirectional between JSAcomponents.
TCPOffense data32007
Identity data that iscommunicated betweenthe passive VulnerabilityInformation Service (VIS)and the Event CollectionService (ECS).
Bidirectional between JSAcomponents.
TCPIdentity data32009
Flow listening port tocollect data from JSA FlowProcessor.
Bidirectional between JSAcomponents.
TCPFlow listening source port32010
Ariel listening port fordatabase searches,progress information, andother associatedcommands.
Bidirectional between JSAcomponents.
TCPAriel listening port32011
Data flows, such as events,flows, flow context, andevent search queries.
Bidirectional between JSAcomponents.
TCPData flow (flows, events,flow context)
32000-33999
409Copyright © 2018, Juniper Networks, Inc.
Chapter 27: Common Ports and Servers Used by JSA

Table 103: Listening Ports That Are Used by JSA Services and Components (continued)
RequirementDirectionProtocolDescriptionPort
Collecting incoming packetcapture (PCAP) data fromJuniper Networks SRXSeries appliances.
NOTE: The packet captureon your device can use adifferent port. For moreinformation aboutconfiguring packet capture,see your Juniper NetworksSRX Series appliancedocumentation.
From Juniper Networks SRX Seriesappliances to JSA.
UDPPCAP data40799
Testing the networkconnection between thesecondaryhostandprimaryhost in an HA cluster byusing Internet ControlMessage Protocol (ICMP).
Bidirectional traffic between thesecondary host and primary host inan HA cluster.
ICMPICMP
RelatedDocumentation
Viewing IMQ Port Associations on page 410•
• Searching for Ports in Use by JSA on page 411
• JSA Public Servers on page 411
Viewing IMQPort Associations
Severalportsusedby JSAallocateadditional randomportnumbers. Forexample,Message
Queues(IMQ)openrandomports forcommunicationbetweencomponentsonamanaged
host. You can view the random port assignments for IMQ using telnet to connect to the
local host and doing a look up on the port number.
Random port associations are not static port numbers. If a service is restarted, the ports
generated for the service are reallocated and the service is provided with a new set of
port numbers.
1. Using SSH, log in to the JSA console as the root user.
2. To display a list of associated ports for the IMQmessaging connection, type the
following command:
telnet localhost 7676
telnet localhost 7677
3. If no information is displayed, press the Enter key to close the connection.
Copyright © 2018, Juniper Networks, Inc.410
Juniper Secure Analytics Administration Guide

RelatedDocumentation
Searching for Ports in Use by JSA on page 411•
• JSA Public Servers on page 411
• JSA Port Usage on page 402
Searching for Ports in Use by JSA
Use thenetstat
command to determinewhich ports are in use on the JSA Console ormanaged host. Use
thenetstat
command to view all listening and established ports on the system.
1. Using SSH, log in to your JSA console, as the root user.
2. To display all active connections and the TCP and UDP ports on which the computer
is listening, type the following command:
netstat -nap
3. To search for specific information from the netstat port list, type the following
command:
netstat -nap | grep port
• To display all ports that match 199, type the following command:
netstat -nap | grep 199
• To display information on all listening ports, type the following command:
netstat -nap | grep LISTEN
RelatedDocumentation
JSA Public Servers on page 411•
• JSA Port Usage on page 402
• Viewing IMQ Port Associations on page 410
JSA Public Servers
To provide you with the most current security information, JSA requires access to a
number of public servers and RSS feeds.
411Copyright © 2018, Juniper Networks, Inc.
Chapter 27: Common Ports and Servers Used by JSA

Public Servers
Table 104: Public Servers That JSAMust Access
DescriptionIP address or hostname
JSA Vulnerability Manager DMZ scanner194.153.113.31
JSA Vulnerability Manager DMZ scanner194.153.113.32
JSA auto-update server.https://download.juniper.net/
JuniperX-Force®Threat IntelligenceThreat InformationCenterdashboard item
www.iss.net
X-Force® Threat Feed update serverupdate.xforce-security.com
X-Force® Threat Feed licensing serverlicense.xforce-security.com
RSS Feeds for JSA Products
Table 105: RSS Feeds
RequirementsURLTitle
JSA and an Internet connectionhttp://feeds.feedburner.com/SecurityIntelligenceSecurity Intelligence
JSA and an Internet connectionhttp://securityintelligence.com/topics/vulnerabilities-threats/feedSecurity IntelligenceVulns / Threats
JSA and an Internet connectionJuniper MyNotifications
JSA Vulnerability Manager processor isdeployed
http://IP_address_of_QVM_processor
:8844/rss/research/news.rss
Security News
JSA Vulnerability Manager processor isdeployed
http://IP_address_of_QVM_processor
:8844/rss/research/advisories.rss
Security Advisories
JSA Vulnerability Manager processordeployed
http://IP_address_of_QVM_processor
:8844/rss/research/vulnerabilities.rss
Latest PublishedVulnerabilities
JSA Vulnerability Manager processor isdeployed
http://IP_address_of_QVM_processor
:8844/rss/scanresults/completedScans.rss
Scans Completed
JSA Vulnerability Manager processor isdeployed
http://IP_address_of_QVM_processor
:8844/rss/scanresults/runningScans.rss
Scans In Progress
Copyright © 2018, Juniper Networks, Inc.412
Juniper Secure Analytics Administration Guide

RelatedDocumentation
• JSA Port Usage on page 402
• Viewing IMQ Port Associations on page 410
• Searching for Ports in Use by JSA on page 411
413Copyright © 2018, Juniper Networks, Inc.
Chapter 27: Common Ports and Servers Used by JSA

Copyright © 2018, Juniper Networks, Inc.414
Juniper Secure Analytics Administration Guide

CHAPTER 28
Getting Data Into JSA
• Getting Data Into JSA on page 415
• DSM Editor Overview on page 415
• Properties in the DSM Editor on page 417
• Custom Property Definitions in the DSM Editor on page 418
• Configuring a Log Source Type on page 419
• Creating an Event Map and Categorization on page 420
Getting Data Into JSA
Use the DSM Editor and capabilities to change existing parsing problems.
The DSM Editor provides real-time feedback so that you knowwhether the log source
extension that you are creating has problems.
DSMEditor Overview
Insteadofmanually creatinga logsourceextension to fixparsing issuesorextendsupport
for new log source types, use the DSM Editor. The DSM Editor provides different views
of yourdata. Youuse theDSMEditor toextract fields, define customproperties, categorize
events and define new QID definition.
The DSM Editor provides the following views:
• Workspace on page 415
• Log Activity Preview on page 416
• Properties Tab on page 416
• Event Mappings Tab on page 416
• Access the DSM Editor on page 416
Workspace
TheWorkspace shows you raw event data. You use sample event payloads to define the
behavior of the log source type. This feedback area shows you the data that you capture
in real time.
415Copyright © 2018, Juniper Networks, Inc.

All event data is sent from the workspace into the DSM, the output is retrieved and
QIDmap lookup is performed. Click the pencil icon to open in edit mode.
When you edit properties theworkspace highlightsmatches in the payload. Only system
properties that are overridden are highlighted in the workspace.
Log Activity Preview
The Log activity preview simulates how the payloads in the workspace appear in the Log
activity viewer. Every standard property that is supported displays. The items that are
marked with an asterisk (*), for example, Event name, Severity, Low-level category and
QID are populated from the QIDmap.
Click thewrench icon to open the preview columns screen and configure the log source
activity.
Properties Tab
The property list contains the combined set of system and custom properties thatmake
up a DSM's configuration. The configuration of a system property differs from that of a
custom property. You can override property, by selecting theOverride system behaviour
checkbox and entering the regex and format string.
Matches in thepayloadarehighlighted in theevent feed in theworkspace.Thehighlighting
is a two-toned in color, depending on what you capture. For example, the bright yellow
highlighting represents the capture group value, and the orange highlighting represents
the rest of the regex that you specified. The feedback in the workspace shows whether
you have the incorrect regex.
You canaddamultiple expressions to the sameproperty, and you canassign precedence
by dragging and dropping the expressions to the top of the list.
Awarningbesideanyof theproperties indicates that youdon't haveanexpressionadded.
Event Mappings Tab
The Eventmappings tab displays all the event ID category combinations that are already
in the system.
RelatedDocumentation
Properties in the DSM Editor on page 417•
• Custom Property Definitions in the DSM Editor on page 418
• Configuring a Log Source Type on page 419
Access the DSM Editor
You can access the DSM editor from either the Log activity tab or the Admin tab, so that
you can be proactive or reactive to changes in events.
Access the DSM Editor using one of the following methods:
Copyright © 2018, Juniper Networks, Inc.416
Juniper Secure Analytics Administration Guide

1. Click the Admin tab.
2. On the navigation menu, click Data Sources >DSM Editor.
OR
1. Click the Log Activity tab.
2. Highlight one or more events.
3. On the navigation menu, select Actions >DSM Editor
Properties in the DSM Editor
Normalized system properties are combined with custom properties and sorted
alphabetically.
Each property has a name that is unique to each DSM. Filter properties by name by using
the Filter textbox.
The configuration of a system property differs from that of a custom property.
SystemProperties
Systemproperties cannot bedeleted. You canonlyOverride thedefault behavior. System
properties fall into one of these categories:
• Normal SystemProperty
A normal system property displays the default JSA behavior that is used for the DSM.
A normal system property does not have theOverride checkbox selectedd and no
expressions are shown.
• Override SystemProperty
System properties that have an override configured (log source extension) show
Override in the status line. When a system property has an override, a log source
extension for that DSM uses the regular expressions that you entered for the
configuration.
CustomProperties
Custom properties show Custom in the status line.
Custom properties differ from system properties in a number of ways:
1. There is no override setting.
2. You can optimize Custom properties. The expressions are evaluated in the event
processing pipeline to provide better performance, and you can use them in reports
and searches.
3. A custom property must have at least one expression to be valid. The Expression
depends on the type of the property that youmodify.
417Copyright © 2018, Juniper Networks, Inc.
Chapter 28: Getting Data Into JSA

RelatedDocumentation
Custom Property Definitions in the DSM Editor on page 418•
• Configuring a Log Source Type on page 419
• Creating an Event Map and Categorization on page 420
CustomProperty Definitions in the DSM Editor
You can define a custom property and reuse the same property elsewhere in a separate
DSM. These properties can be used in searches, rules, while also allowing specific
user-defined behavior for parsing values into those fields.
Where relevant, each custom property has a set of configuration options that includes
conditionality and date parsing options. Each custom property definition within a DSM's
configuration is an ordered group of regular expressions. You can't modify the Name,
type, and any advanced options for a custom property in the DSM Editor.
A custom property is shared across all DSMs, while specific implementations for how to
read values from payloads are at the DSM level.
Selectivity is when you configure an expression to run only when certain conditions are
met.
• Selectivity on page 418
• Expressions on page 418
• Creating a Custom Property on page 419
RelatedDocumentation
Configuring a Log Source Type on page 419•
• Creating an Event Map and Categorization on page 420
• Properties in the DSM Editor on page 417
Selectivity
You can restrict running a custom property to certain criteria for better performance.
There are these types of restrictions:
By high-level category and low-level category—For example, a property is evaluatedonly when the event is known to have a high-level category of Authentication and a
low-level Category of Admin Logout.
By specific QID—A property is evaluated only when the event that is seenmaps to aspecificQID. For example,when theeventmaps toaQIDof LoginFailed, theproperty
is evaluated.
Expressions
Expressions thatdefine thebehaviourofaproperty.Themaincomponentofanexpression
is a valid regex. The data that making up an expression depends on the property type.
Copyright © 2018, Juniper Networks, Inc.418
Juniper Secure Analytics Administration Guide

The Format string is a combination of regex capture groups and delimiters. For example,
youmight want to parse an IP address and port to combine them both into a string. If
your regular expression had two capture groups, the format string you use to combine
themmight look something like this: $1:$2.
Creating a CustomProperty
Youcandefineacustompropertydefinition foroneormore logsource typeconfigurations.
Running the expression is restricted to events that match specific criteria.
1. Toaddacustomproperty, choose theAdd (+) icon in theProperties tabofDSMEditor.
2. To create a new custom property definition, use the following steps:
a. Select Create New on the Choose a CustomProperty Definition to Express page.
b. On the Create a newCustomProperty Definition page, enter a name, field type and
description.
c. If you want JSA to attempt to extract the property from events as they enter the
systemselect theEnable thisproperty foruse inRulesandSearch indexingcheckbox
d. Click Save to create the new custom property.
3. To use an existing custom property, use the following steps:
a. On the Choose a CustomProperty Definition to Express page search for an existing
Filter definition .
b. Click Select to add the custom property.
4. To addmultiple expressions and reorder them follow these steps:
a. Locate and select the custom property in the Properties tab. Custom properties
have theword Custom next to them, to differentiate them from systemproperties.
b. Add the regex and a capture group to the expression.
c. ClickEdit toaddselectivity to thecustompropertyandprovideahigh-level category
and low-level category.
d. SelectOK.
e. Addmore expressions by selecting the Add (+) icon at the top of the expressions
list.
f. Drag and drop expressions in the order that you want them to run.
Configuring a Log Source Type
You create a new log source type when JSA doesn't have a DSM for a log source (like in
the caseswhere you are using a custom app or we don't yet support the log source). You
create a log source type instead of using a uDSM. That way, you can associate the
incomingeventswith just that logsource type. If youuseauniversalDSM, thenall incoming
events that use uDSM are evaluated against the regex.
419Copyright © 2018, Juniper Networks, Inc.
Chapter 28: Getting Data Into JSA

The log source type configuration tool works on only one log source type at a time.
1. Click the Admin tab.
2. On the navigation menu, click Data Sources >DSM Editor.
3. Change an existing log source type or create a new log source type:
• You can create a new log source type, by selecting the Create New button and
following the prompts.
• Alternatively, you can choose a Filter to locate an existing log source type, and then
Select.
RelatedDocumentation
Creating an Event Map and Categorization on page 420•
• Properties in the DSM Editor on page 417
• Custom Property Definitions in the DSM Editor on page 418
Creating an Event Map and Categorization
You can create a new event mapping to map all unknown events to their equivalent in
the QIDmap. An event mapping is an event ID and category combination used to map
to a QID.
1. To add an event mapping, choose the Add (+) icon in the Event Mapping tab of DSM
Editor.
2. Enter an event ID, a category and an event.
3. To create a new event categorization, use the following steps:
a. From the Create a new Event Mapping page select Choose Event.
b. On the Event Categorizations page select Create New.
c. Enter a name, description and select a log source type, a high-level category, a
low-level category and a severity.
d. Click Save to create the new event categorization.
4. To use an existing event categorization, use the following steps:
a. From the Create a new Event Mapping page select Choose Event.
b. Search for an existing Event Categorization on the Event Categorization page.
c. Search on high-level category, low-level category, log source type andQID. Results
are shown in the Search Results pane.
d. ClickOK to add the event category.
Copyright © 2018, Juniper Networks, Inc.420
Juniper Secure Analytics Administration Guide

RelatedDocumentation
• Properties in the DSM Editor on page 417
• Custom Property Definitions in the DSM Editor on page 418
• Configuring a Log Source Type on page 419
421Copyright © 2018, Juniper Networks, Inc.
Chapter 28: Getting Data Into JSA

Copyright © 2018, Juniper Networks, Inc.422
Juniper Secure Analytics Administration Guide
Copyright © 2022 FDOKUMEN