Paragon Insights User Guide | Juniper Networks
317
Paragon Insights User Guide Release Published 2022-01-15 4.2.0
-
Upload
khangminh22 -
Category
Documents
-
view
4 -
download
0
Transcript of Paragon Insights User Guide | Juniper Networks

Paragon Insights User Guide
ReleasePublished
2022-01-154.2.0

Juniper Networks, Inc.1133 Innovation WaySunnyvale, California 94089USA408-745-2000www.juniper.net
Juniper Networks, the Juniper Networks logo, Juniper, and Junos are registered trademarks of Juniper Networks, Inc. inthe United States and other countries. All other trademarks, service marks, registered marks, or registered service marksare the property of their respective owners.
Juniper Networks assumes no responsibility for any inaccuracies in this document. Juniper Networks reserves the rightto change, modify, transfer, or otherwise revise this publication without notice.
Paragon Insights User Guide4.2.0Copyright © 2022 Juniper Networks, Inc. All rights reserved.
The information in this document is current as of the date on the title page.
YEAR 2000 NOTICE
Juniper Networks hardware and software products are Year 2000 compliant. Junos OS has no known time-relatedlimitations through the year 2038. However, the NTP application is known to have some difficulty in the year 2036.
END USER LICENSE AGREEMENT
The Juniper Networks product that is the subject of this technical documentation consists of (or is intended for use with)Juniper Networks software. Use of such software is subject to the terms and conditions of the EndUser License Agreement(“EULA”) posted at https://support.juniper.net/support/eula/. By downloading, installing or using such software, youagree to the terms and conditions of that EULA.
ii

Table of Contents
About the Documentation | xi
Documentation and Release Notes | xi
Documentation Conventions | xi
Documentation Feedback | xiv
Requesting Technical Support | xiv
Self-Help Online Tools and Resources | xv
Creating a Service Request with JTAC | xv
Introduction to Paragon Insights1Paragon Insights Overview | 17
Main Components of Paragon Insights | 17
Paragon Insights Health Monitoring | 18
Paragon Insights Root Cause Analysis | 18
Closed-Loop Automation | 20
Benefits of Paragon Insights | 21
Paragon Insights Concepts | 22
Paragon Insights Data Collection Methods | 23
Data Collection - ’Push’ Model | 23
Data Collection - ’Pull’ Model | 24
Paragon Insights Topics | 24
Paragon Insights Rules - Basics | 25
Paragon Insights Rules - Deep Dive | 27
Rules | 27
Sensors | 30
Fields | 30
Vectors | 32
Variables | 33
Functions | 33
Triggers | 34
Tagging | 38
iii

Rule Properties | 38
Multiple Sensors per Device | 38
Sensor Precedence | 40
Paragon Insights Playbooks | 44
Paragon Insights Tagging | 45
Overview | 46
Tagging Profile Terminology | 46
How do Tagging Profiles Work? | 51
Caveats | 52
Types of Tagging | 53
Static Tagging | 53
Dynamic Tagging | 56
Add a Tagging Profile | 61
Apply a Tagging Profile | 66
Paragon Insights Time Series Database (TSDB) | 68
Historical Context | 69
TSDB Improvements | 70
Database Sharding | 70
Database Replication | 71
Database Reads and Writes | 72
Manage TSDB Options in the Paragon Insights GUI | 73
Paragon Insights CLI Configuration Options | 75
Paragon Insights Machine Learning (ML) | 76
Paragon Insights Machine Learning Overview | 76
Understanding Paragon Insights Anomaly Detection | 77
Field | 77
Algorithm | 78
Learning period | 78
Pattern periodicity | 79
Understanding Paragon Insights Outlier Detection | 79
Dataset | 80
Algorithm | 80
Sigma coefficient (k-fold-3sigma only) | 82
iv
Sensitivity | 82
Learning period | 82
Understanding Paragon Insights Predict | 82
Field | 83
Algorithm | 83
Learning period | 83
Pattern periodicity | 83
Prediction offset | 83
Paragon Insights Rule Examples | 84
Paragon Insights Anomaly Detection Example | 84
Paragon Insights Outlier Detection Example | 93
Frequency Profiles and Offset Time | 98
Frequency Profiles | 98
Configuration Using Paragon Insights GUI | 99
Configuration Using Paragon Insights CLI | 101
Apply a Frequency Profile Using the Paragon Insights GUI | 101
Apply a Frequency Profile Using the Paragon Insights CLI | 103
Offset Time Unit | 103
Offset Used in Formulas | 104
Offset Used in References | 105
Offset Used in Vectors | 106
Offset Used in Triggers | 108
Offset Used in Trigger Reference | 109
Paragon Insights Management and Monitoring2Manage Paragon Insights Users and Groups | 114
Default User and First Login | 115
Default User Roles | 116
User Management | 116
Group Management | 120
LDAP Authentication in Paragon Insights | 122
Password Recovery | 125
v

Limitations | 126
Manage Devices, Device Groups, and Network Groups | 127
Adding a Device | 128
Editing a Device | 133
Adding a Device Group | 133
Editing a Device Group | 139
Configuring a Retention Policy for the Time Series Database | 139
Adding a Network Group | 140
Editing a Network Group | 142
Paragon Insights Rules and Playbooks | 143
Add a Pre-Defined Rule | 144
Create a New Rule Using the Paragon Insights GUI | 145
Rule Filtering | 147
Sensors | 148
Fields | 149
Vectors | 152
Variables | 153
Functions | 154
Triggers | 157
Rule Properties | 159
Edit a Rule | 160
Add a Pre-Defined Playbook | 160
Create a New Playbook Using the Paragon Insights GUI | 161
Edit a Playbook | 163
Clone a Playbook | 163
Manage Playbook Instances | 164
View Information About Playbook Instances | 165
Create a Playbook Instance | 167
Manually Pause or Play a Playbook Instance | 169
Create a Schedule to Automatically Play/Pause a Playbook Instance | 170
Monitor Device and Network Health | 172
Dashboard | 173
Health | 182
vi

Network Health | 190
Graphs Page | 190
Understand Resources and Dependencies | 206
Resources | 207
Resource Dependencies | 207
Use Cases | 208
About the Resources Page | 209
Tasks You Can Perform | 210
Fields in Resources Table | 211
Add Resources for Root Cause Analysis | 212
Configure Dependency in Resources | 215
Example Configuration: OSPF Resource and Dependency | 219
Edit Resources and Dependencies | 229
Edit a Resource | 230
Edit Resource Dependency | 231
Filter Resources | 232
Delete Resources and Dependencies | 233
Delete a Resource | 233
Delete Resource Dependency | 234
Grafana Overview | 235
Using the Grafana UI | 237
Back Up and Restore Grafana Data | 237
Understanding Action Engine Workflows | 238
Manage Action Engine Workflows | 239
vii

Alerts and Notifications | 247
Generate Alert Notifications | 247
Configure a Notification Profile | 248
Enable Alert Notifications for a Device Group or Network Group | 253
Manage Alerts Using Alert Manager | 254
Viewing Alerts | 254
Manage Individual Alerts | 256
Configure Alert Blackouts | 257
Stream Sensor and Field Data from Paragon Insights | 258
Configure the Notification Type for Publishing | 258
Publish Data for a Device Group or Network Group | 260
Generate Reports | 261
Manage Audit Logs | 272
Filter Audit Logs | 273
Export Audit Logs | 273
Paragon Insights Commands and Audit Logs | 274
Configure a Secure Data Connection for Paragon Insights Devices | 275
Configure Security Profiles for SSL and SSH Authentication | 276
Configure Security Authentication for a Specific Device or Device Group | 277
Configure Data Summarization | 278
Creating a Raw Data Summarization Profile | 279
Creating a Data Rollup Summarization Profile | 281
Applying Data Summarization Profiles to a Device Group | 285
Modify the UDA, UDF, and Workflow Engines | 288
Overview | 288
How it Works | 290
Usage Notes | 291
Configuration | 292
SIMULATE | 292
MODIFY | 293
ROLLBACK | 294
viii

Enable UDA Scheduler in Trigger Action | 294
Commit or Roll Back Configuration Changes in Paragon Insights | 295
Logs for Paragon Insights Services | 298
Configure Service Log Levels for a Device Group or Network Group | 298
Download Logs for Paragon Insights Services | 299
Troubleshooting | 300
Paragon Insights Self Test | 301
Overview | 301
Other Uses for the Self Test Tool | 301
Usage Notes | 301
How to Use the Self Test Tool | 302
Device Reachability Test | 303
Overview | 303
Usage Notes | 303
How to Use the Device Reachability Tool | 304
Ingest Connectivity Test | 305
Overview | 305
Usage Notes | 305
How to Use the Ingest Connectivity Tool | 306
Debug No-Data | 307
Overview | 307
Usage Notes | 308
How to Use the Debug No-Data Tool | 308
Paragon Insights Configuration – Backup and Restore | 309
Back Up the Configuration | 309
Restore the Configuration | 310
Backup or Restore the Time Series Database (TSDB) | 311
ix
License Management3Paragon Insights Licensing Overview | 314
View, Add, or Delete Paragon Insights Licenses | 314
Add a Paragon Insights License | 315
Delete a Paragon Insights License | 315
View Paragon Insights Licensing Features | 316
View Status and Details of Paragon Insights License | 316
x

About the Documentation
IN THIS SECTION
Documentation and Release Notes | xi
Documentation Conventions | xi
Documentation Feedback | xiv
Requesting Technical Support | xiv
Use this guide to understand the features you can configure and the tasks you can perform from theParagon Insights (formerly HealthBot) GUI.
Documentation and Release Notes
To obtain the most current version of all Juniper Networks® technical documentation, see the productdocumentation page on the Juniper Networks website at https://www.juniper.net/documentation/.
If the information in the latest release notes differs from the information in the documentation, follow theproduct Release Notes.
Juniper Networks Books publishes books by Juniper Networks engineers and subject matter experts.These books go beyond the technical documentation to explore the nuances of network architecture,deployment, and administration. The current list can be viewed at https://www.juniper.net/books.
Documentation Conventions
Table 1 on page xii defines notice icons used in this guide.
xi
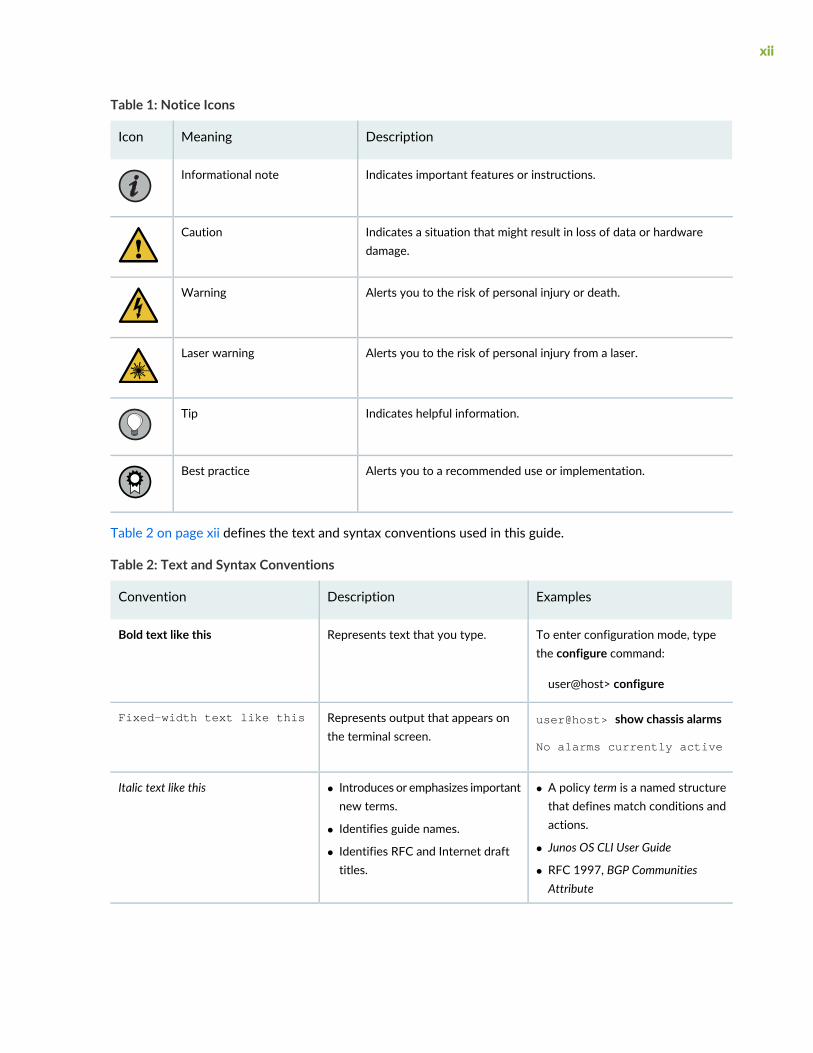
Table 1: Notice Icons
DescriptionMeaningIcon
Indicates important features or instructions.Informational note
Indicates a situation that might result in loss of data or hardwaredamage.
Caution
Alerts you to the risk of personal injury or death.Warning
Alerts you to the risk of personal injury from a laser.Laser warning
Indicates helpful information.Tip
Alerts you to a recommended use or implementation.Best practice
Table 2 on page xii defines the text and syntax conventions used in this guide.
Table 2: Text and Syntax Conventions
ExamplesDescriptionConvention
To enter configuration mode, typethe configure command:
user@host> configure
Represents text that you type.Bold text like this
user@host> show chassis alarms
No alarms currently active
Represents output that appears onthe terminal screen.
Fixed-width text like this
• A policy term is a named structurethat defines match conditions andactions.
• Junos OS CLI User Guide
• RFC 1997, BGP CommunitiesAttribute
• Introduces or emphasizes importantnew terms.
• Identifies guide names.
• Identifies RFC and Internet drafttitles.
Italic text like this
xii

Table 2: Text and Syntax Conventions (continued)
ExamplesDescriptionConvention
Configure the machine’s domainname:
[edit]root@# set system domain-namedomain-name
Represents variables (options forwhich you substitute a value) incommands or configurationstatements.
Italic text like this
• To configure a stub area, includethe stub statement at the [editprotocols ospf area area-id]hierarchy level.
• The console port is labeledCONSOLE.
Represents names of configurationstatements, commands, files, anddirectories; configuration hierarchylevels; or labels on routing platformcomponents.
Text like this
stub <default-metric metric>;Encloses optional keywords orvariables.
< > (angle brackets)
broadcast | multicast
(string1 | string2 | string3)
Indicates a choice between themutually exclusive keywords orvariables on either side of the symbol.The set of choices is often enclosedin parentheses for clarity.
| (pipe symbol)
rsvp { # Required for dynamic MPLSonly
Indicates a comment specified on thesame line as the configurationstatement to which it applies.
# (pound sign)
community name members [community-ids ]
Encloses a variable for which you cansubstitute one or more values.
[ ] (square brackets)
[edit]routing-options {static {route default {nexthop address;retain;
}}
}
Identifies a level in the configurationhierarchy.
Indention and braces ( { } )
Identifies a leaf statement at aconfiguration hierarchy level.
; (semicolon)
GUI Conventions
xiii

Table 2: Text and Syntax Conventions (continued)
ExamplesDescriptionConvention
• In the Logical Interfaces box, selectAll Interfaces.
• To cancel the configuration, clickCancel.
Represents graphical user interface(GUI) items you click or select.
Bold text like this
In the configuration editor hierarchy,select Protocols>Ospf.
Separates levels in a hierarchy ofmenu selections.
> (bold right angle bracket)
Documentation Feedback
We encourage you to provide feedback so that we can improve our documentation. You can use eitherof the following methods:
• Online feedback system—Click TechLibrary Feedback, on the lower right of any page on the JuniperNetworks TechLibrary site, and do one of the following:
• Click the thumbs-up icon if the information on the page was helpful to you.
• Click the thumbs-down icon if the information on the page was not helpful to you or if you havesuggestions for improvement, and use the pop-up form to provide feedback.
• E-mail—Send your comments to [email protected]. Include the document or topic name,URL or page number, and software version (if applicable).
Requesting Technical Support
Technical product support is available through the Juniper Networks Technical Assistance Center (JTAC).If you are a customer with an active Juniper Care or Partner Support Services support contract, or are
xiv

covered under warranty, and need post-sales technical support, you can access our tools and resourcesonline or open a case with JTAC.
• JTAC policies—For a complete understanding of our JTAC procedures and policies, review the JTACUserGuide located at https://www.juniper.net/us/en/local/pdf/resource-guides/7100059-en.pdf.
• Productwarranties—For productwarranty information, visit https://www.juniper.net/support/warranty/.
• JTAC hours of operation—The JTAC centers have resources available 24 hours a day, 7 days a week,365 days a year.
Self-Help Online Tools and Resources
For quick and easy problem resolution, Juniper Networks has designed an online self-service portal calledthe Customer Support Center (CSC) that provides you with the following features:
• Find CSC offerings: https://www.juniper.net/customers/support/
• Search for known bugs: https://prsearch.juniper.net/
• Find product documentation: https://www.juniper.net/documentation/
• Find solutions and answer questions using our Knowledge Base: https://kb.juniper.net/
• Download the latest versions of software and review release notes:https://www.juniper.net/customers/csc/software/
• Search technical bulletins for relevant hardware and software notifications:https://kb.juniper.net/InfoCenter/
• Join and participate in the Juniper Networks Community Forum:https://www.juniper.net/company/communities/
• Create a service request online: https://myjuniper.juniper.net
To verify service entitlement by product serial number, use our Serial Number Entitlement (SNE) Tool:https://entitlementsearch.juniper.net/entitlementsearch/
Creating a Service Request with JTAC
You can create a service request with JTAC on the Web or by telephone.
• Visit https://myjuniper.juniper.net.
• Call 1-888-314-JTAC (1-888-314-5822 toll-free in the USA, Canada, and Mexico).
For international or direct-dial options in countries without toll-free numbers, seehttps://support.juniper.net/support/requesting-support/.
xv

1CHAPTER
Introduction to Paragon Insights
Paragon Insights Overview | 17
Paragon Insights Concepts | 22
Paragon Insights Tagging | 45
Paragon Insights Time Series Database (TSDB) | 68
Paragon Insights Machine Learning (ML) | 76
Frequency Profiles and Offset Time | 98

Paragon Insights Overview
IN THIS SECTION
Main Components of Paragon Insights | 17
Closed-Loop Automation | 20
Benefits of Paragon Insights | 21
Paragon Insights (formerly HealthBot) is a highly automated and programmable device-level diagnosticsand network analytics tool that provides consistent and coherent operational intelligence across networkdeployments. Paragon Insights integrates multiple data collection methods (such as Junos TelemetryInterface (JTI), NETCONF, syslog, and SNMP) to aggregate and correlate large volumes of time-sensitivetelemetry data, thereby providing a multidimensional and predictive view of the network. Additionally,Paragon Insights translates troubleshooting, maintenance, and real-time analytics into an intuitive userexperience to give network operators actionable insights into the health of individual devices and of theoverall network.
Main Components of Paragon Insights
IN THIS SECTION
Paragon Insights Health Monitoring | 18
Paragon Insights Root Cause Analysis | 18
Paragon Insights consists of two main components:
• HealthMonitoring, to view an abstracted, hierarchical representation of device and network-level health,and define the health parameters of key network elements through customizable key performanceindicators (KPIs), rules, and playbooks. A playbook is a collection of rules. You can create a playbook andapply the playbook to a device group or a network group. For more information on rules and playbooks,see “Paragon Insights Rules and Playbooks” on page 143.
17

• Root Cause Analysis, which helps you find the root cause of a device or network-level issuewhen ParagonInsights detects a problem with a network element.
Paragon Insights Health Monitoring
The Challenge
With increasing data traffic generated by cloud-native applications and emerging technologies, serviceproviders and enterprises need a network analytics solution to analyze volumes of telemetry data, offerinsights into overall network health, and produce actionable intelligence. While although telemetry-basedtechniques have existed for years, the growing number of protocols, data formats, and KPIs from diversenetworking devices has made data analysis complex and costly. Traditional CLI-based interfaces requirespecialized skills to extract business value from telemetry data, creating a barrier to entry for networkanalytics
How Paragon Insights Health Monitoring Helps
By aggregating and correlating raw telemetry data from multiple sources, the Paragon Insights HealthMonitoring component provides a multidimensional view of network health that reports current status,as well as projected threats to the network infrastructure and its workloads.
Health status determination is tightly integrated with the Paragon Insights RCA component, which canmake use of system log data received from the network and its devices. Paragon Insights HealthMonitoringprovides status indicators that alert you when a network resource is currently operating outside auser-defined performance policy. Paragon Insights Health Monitoring does a risk analysis using historicaltrends and predicts whether a resourcemay be unhealthy in the future. Paragon Insights HealthMonitoringnot only offers a fully customizable view of the current health of network elements, but also automaticallyinitiates remedial actions based on predefined service level agreements (SLAs).
Defining the health of a network element, such as broadband network gateway (BNG), provider edge (PE),core, and leaf-spine, is highly contextual. Each element plays a different role in a network, with uniqueKPIs to monitor. Given that there is no single definition for network health across all use cases, ParagonInsights provides a highly customizable framework to allow you to define your own health profiles.
Paragon Insights Root Cause Analysis
The Challenge
For some network issues, it can be challenging for network operators to figure outwhat caused a networkingdevice to stop working properly. In such cases, an operator must call on a specialist (with knowledge builtfrom years of experience) to troubleshoot the problem and find the root cause.
How Paragon Insights RCA Helps
18

The Paragon Insights RCA component simplifies the process of finding the root cause of a network issue.Paragon Insights’s RCA captures the troubleshooting knowledge of specialists and has a knowledge basein the form of Paragon Insights rules. These rules are evaluated either on demand by a specific trigger orperiodically in the background to ascertain the health of a networking component, such as routing protocol,system, interface, or chassis, on the device.
To illustrate the benefits of Paragon Insights RCA, let us consider the problem of OSPF flapping.Figure 1 on page 19 highlights the workflow sequence involved in debugging OSPF flapping. A networkoperator troubleshooting this issue would need to perform manual debugging steps for each tile (step) oftheworkflow sequence in order to find the root cause of theOSPF flapping. On the other hand, theParagonInsights RCA application troubleshoots the issue automatically by using an RCA bot. The RCA bot tracksall of the telemetry data collected by the Paragon Insights and translates the information into graphicalstatus indicators (displayed in the Paragon InsightswebGUI) that correlate to different parts of theworkflowsequence shown in Figure 1 on page 19.
Figure 1: High-level workflow to debug OSPF-flapping
RPD – Infra Kernel – System Chassis Interfaces
PFE – Interface
RPD – OSPFControlPlane
HostPath
DataPlane
PPM – OSPF PFE – Ukern PFE – Host PathRE – Host Path
XM – ASIC LU – ASIC PFE – SystemPFE – jnh
g300
019
When you configure Paragon Insights, each tile of the workflow sequence (shown in Figure 1 on page 19)can be defined by one or more rules. For example, the RPD-OSPF tile could be defined as two ruleconditions: one to check if "hello-transmitted" counters are incrementing and the other to check if"hello-received" counters are incrementing. Based on these user-defined rules, Paragon Insights providesstatus indicators, alarm notifications, and an alarm management tool to inform and alert you of specificnetwork conditions that could lead to OSPF flapping.
By isolating a problem area in the workflow, Paragon Insights RCA proactively guides you in determiningthe appropriate corrective action to take to fix a pending issue or avoid a potential one.
19

Closed-Loop Automation
Paragon Insights offers closed-loop automation. The automation workflow can be divided into seven mainsteps (see Figure 2 on page 21):
1. Define—The user defines the health parameters of key network elements through customizable keyperformance indicators (KPIs), rules, and playbooks, by using the tools provided by Paragon Insights.
2. Collect—Paragon Insights collects rule-based telemetry data frommultiple devices using the collectionmethods specified for the different network devices.
3. Store—Paragon Insights stores time-sensitive telemetry data in a time-series database (TSDB). Thisallows users to query, perform operations on, and write new data back to the database, days, or evenweeks after the initial storage.
4. Analyze—Paragon Insights analyzes telemetry data based on the specified KPIs, rules, and playbooks.
5. Visualize—Paragon Insights provides multiple ways for you to visualize the aggregated telemetry datathrough its web-based GUI to gain actionable and predictive insights into the health of your devicesand the overall network.
6. Notify—Paragon Insights notifies you through the GUI and notification alarms when problems inindividual devices or in the network are detected.
7. Act—Paragon Insights performs user-defined actions to help resolve and proactively prevent networkproblems.
20

Figure 2: Paragon Insights Closed-Loop Automation Workflow
Rule Engine
g301
020
API Server
ProgrammableAccess
JunosManagement Daemon
Playbook
KPI Health Monitoring
Root Cause Analysis
Log File Analysis
Time SeriesDatabase
2 Collect
4 Analyze
Third PartyProvisioning / NMS
NETCONFREST API
Data Collection Layer
NETCONFOpenConfigJTI CLI Syslog SNMP NetFlow
TelemetryInfrastructure
3 Store
User-DefinedActions
7 Act
6 Notify
User Defined Functions/Actions
Notifications: Slack, Webhook, . . .
5 Visualize
1 Define
GUI Access
Benefits of Paragon Insights
• Customization—Provides a framework to define and customize health profiles, allowing truly actionableinsights for the specific device or network being monitored.
• Automation—Automates root cause analysis and log file analysis, streamlines diagnostic workflows, andprovides self-healing and remediation capabilities.
• Greater network visibility—Provides advanced multidimensional analytics across network elements,giving you a clearer understanding of network behavior to establish operational benchmarks, improveresource planning, and minimize service downtime.
• Intuitive GUI—Offers an intuitive web-based GUI for policy management and easy data consumption.
• Open integration—Lowers the barrier of entry for telemetry and analytics by providing open source datapipelines, notification capabilities, and third-party device support.
• Multiple data collectionmethods—Includes support for JTI, OpenConfig, NETCONF, CLI, Syslog, NetFlow,and SNMP.
21

RELATED DOCUMENTATION
Paragon Insights Getting Started Guide
Paragon Insights Concepts
IN THIS SECTION
Paragon Insights Data Collection Methods | 23
Paragon Insights Topics | 24
Paragon Insights Rules - Basics | 25
Paragon Insights Rules - Deep Dive | 27
Paragon Insights Playbooks | 44
Paragon Insights (formerly HealthBot) is a highly programmable telemetry-based analytics application.With it, you can diagnose and root cause network issues, detect network anomalies, predict potentialnetwork issues, and create real-time remedies for any issues that come up.
To accomplish this, network devices and Paragon Insights have to be configured to send and receive largeamounts of data, respectively. Device configuration is covered throughout this and other sections of theguide.
Configuring Paragon Insights, or any application, to read and react to incoming telemetry data requires alanguage that describes several elements that are specific to the systems and data under analysis. Thistype of language is called a Domain Specific Language (DSL), i.e., a language that is specific to one domain.Any DSL is built to help answer questions. For Paragon Insights, these questions are:
• Q: What components make up the systems that are sending data?
A: Network devices are made up of memory, cpu, interfaces, protocols and so on. In Paragon Insights,these are called “Paragon Insights Topics” on page 24.
• Q: How do we gather, filter, process, and analyze all of this incoming telemetry data?
A: Paragon Insights uses “Paragon Insights Rules - Basics” on page 25 that consist of information blockscalled sensors, fields, variables, triggers, and more.
• Q: How do we determine what to look for?
22

A: It depends on the problem you want to solve or the question you want to answer. Paragon Insightsuses “Paragon Insights Playbooks” on page 44 to create collections of specific rules and apply them tospecific groups of devices in order accomplish specific goals. For example, part of thesystem-kpis-playbook can alert a user when system memory usage crosses a user-defined threshold.
This section covers these key concepts and more, which you need to understand before using ParagonInsights.
Paragon Insights Data Collection Methods
In order to provide visibility into the state of your network devices, Paragon Insights first needs to collecttheir telemetry data and other status information. It does this using sensors.
Paragon Insights supports sensors that “push” data from the device to Paragon Insights and sensors thatrequire Paragon Insights to “pull” data from the device using periodic polling.
Data Collection - ’Push’ Model
As the number of objects in the network, and themetrics they generate, have grown, gathering operationalstatistics for monitoring the health of a network has become an ever-increasing challenge. Traditional ’pull’data-gatheringmodels, like SNMP and the CLI, require additional processing to periodically poll the networkelement, and can directly limit scaling.
The ’push’ model overcomes these limits by delivering data asynchronously, which eliminates polling.Withthis model, the Paragon Insights server can make a single request to a network device to stream periodicupdates. As a result, the ’push’ model is highly scalable and can support the monitoring of thousands ofobjects in a network. Junos devices support this model in the form of the Junos Telemetry Interface (JTI).
Paragon Insights currently supports five ‘push’ ingest types.
• Native GPB
• NetFlow
• sFlow
• OpenConfig
• Syslog
These push-model data collection—or ingest—methods are explained in detail in the Paragon Insights DataIngest Guide.
23

Data Collection - ’Pull’ Model
While the ’push’ model is the preferred approach for its efficiency and scalability, there are still cases wherethe ’pull’ data collection model is appropriate. With the ’pull’ model, Paragon Insights requests data fromnetwork devices at periodic intervals.
Paragon Insights currently supports two ‘pull’ ingest types.
• iAgent (CLI/NETCONF)
• SNMP
These pull-model data collection—or ingest—methods are explained in detail in the Paragon Insights DataIngest Guide.
Paragon Insights Topics
Network devices aremade up of a number of components and systems fromCPUs andmemory to interfacesand protocol stacks and more. In Paragon Insights, a topic is the construct used to address those differentdevice components. The Topic block is used to create name spaces that define what needs to be modeled.Each Topic block is made up of one ormoreRule blocks which, in turn, consist of the Field blocks, Functionblocks, Trigger blocks, etc. See “Paragon Insights Rules - Deep Dive” on page 27 for details. Each rulecreated in Paragon Insights must be part of a topic. Juniper has curated a number of these systemcomponents into a list of Topics such as:
• chassis
• class-of-service
• external
• firewall
• interfaces
• kernel
• linecard
• logical-systems
• protocol
• routing-options
• security
• service
• system
24

You can create sub-topics underneath any of the Juniper topic names by appending .<sub-topic> to thetopic name. For example, kernel.tcpip or system.cpu.
Any pre-defined rules provided by Juniper fit within one of the Juniper topics with the exception of external,The external topic is reserved for user-created rules. In the Paragon Insights web GUI, when you create anew rule, the Topics field is automatically populated with the external topic name.
Paragon Insights Rules - Basics
Paragon Insights’ primary function is collecting and reacting to telemetry data from network devices.Defining how to collect the data, and how to react to it, is the role of a rule.
Paragon Insights ships with a set of default rules, which can be seen on the Configuration > Rules pageof the Paragon Insights GUI, as well as in GitHub in the healthbot-rules repository. You can also createyour own rules.
The structure of a Paragon Insights rule looks like this:
To keep rules organized, Paragon Insights organizes them into topics. Topics can be very general, likesystem, or they can be more granular, like protocol.bgp. Each topic contains one or more rules.
As described above, a rule contains all the details and instructions to define how to collect and handle thedata. Each rule contains the following required elements:
• The sensor defines the parameters for collecting the data. This typically includes which data collectionmethod to use (as discussed above in “Paragon Insights Data Collection Methods” on page 23), some
25

guidance on which data to ingest, and how often to push or pull the data. In any given rule, a sensor canbe defined directly within the rule or it can be referenced from another rule.
• Example: Using the SNMP sensor, poll the network device every 60 seconds to collect all the devicedata in the Juniper SNMP MIB table jnxOperatingTable.
• The sensor typically ingests a large set of data, so fields provide a way to filter or manipulate that data,allowing you to identify and isolate the specific pieces of information you care about. Fields can also actas placeholder values, like a static threshold value, to help the system perform data analysis.
• Example: Extract, isolate, and store the jnxOperating15MinLoadAvg (CPU15-minute average utilization)value from the SNMP table specified above in the sensor.
• Triggers periodically bring together the fields with other elements to compare data and determine currentdevice status. A trigger includes one or more ’when-then’ statements, which include the parameters thatdefine how device status is visualized on the health pages.
• Example: Every 90 seconds, check the CPU 15min average utilization value, and if it goes above adefined threshold, set the device’s status to red on the device health page and display a messageshowing the current value.
The rule can also contain the following optional elements:
• Vectors allow you to leverage existing elements to avoid the need to repeatedly configure the sameelements across multiple rules.
• Examples: A rule with a configured sensor, plus a vector to a second sensor from another rule; a rulewith no sensors, and vectors to fields from other rules
• Variables can be used to provide additional supporting parameters needed by the required elementsabove.
• Examples: The string “ge-0/0/0”, used within a field collecting status for all interfaces, to filter thedata down to just the one interface; an integer, such as “80”, referenced in a field to use as a staticthreshold value
• Functions allow you to provide instructions (in the form of a Python script) on how to further interactwith data, and how to react to certain events.
• Examples: A rule that monitors input and output packet counts, using a function to compare the countvalues; a rule that monitors system storage, invoking a function to cleanup temp and log files if storageutilization goes above a defined threshold
NOTE: Rules, on their own, don’t actually do anything. To make use of rules you need to addthem to “Paragon Insights Playbooks” on page 44.
26

Paragon Insights Rules - Deep Dive
IN THIS SECTION
Rules | 27
Sensors | 30
Fields | 30
Vectors | 32
Variables | 33
Functions | 33
Triggers | 34
Tagging | 38
Rule Properties | 38
Multiple Sensors per Device | 38
Sensor Precedence | 40
A rule is a package of components, or blocks, needed to extract specific information from the network orfrom a Junos device. Rules conform to a specifically tailored domain specific language (DSL) for analyticsapplications. The DSL is designed to allow rules to capture:
• The minimum set of input data that the rule needs to be able to operate
• The minimum set of telemetry sensors that need to be configured on the device(s)
• The fields of interest from the configured sensors
• The reporting or polling frequency
• The set of triggers that operate on the collected data
• The conditions or evaluations needed for triggers to kick in
• The actions or notifications that need to be performed when a trigger kicks in
The details around rules, topics and playbooks are presented in the following sections.
Rules
Rules are meant to be free of any hard coding. Think of threshold values; If a threshold is hard coded, thereis no easy way to customize it for a different customer or device that has different requirements. Therefore,rules are defined using parameterization to set the default values. This allows the parameters to be left at
27

default or be customized by the operator at the time of deployment. Customization can be done at thedevice group or individual device level while applying the Paragon Insights Playbooks on page 44 in whichthe individual rules are contained.
Rules that are device-centric are called device rules. Device components such as chassis, system, linecards,and interfaces are all addressed as Paragon Insights Topics on page 24 in the rule definition. Generally,device rules make use of sensors on the devices.
Rules that span multiple devices are called network rules. Network rules:
• must have a rule-frequency configured
• must not contain sensors
• cannot be mixed with device rules in a playbook
To deploy either type of rule, include the rule in a playbook and then apply the playbook to a device groupor network group.
NOTE: Paragon Insights comes with a set of pre-defined rules.
Not all of the blocks that make up a rule are required for every rule. Whether or not a specific block isrequired in a rule definition depends on what sort of information you are trying to get to. Additionally,some rule components are not valid for network rules. Table 3 on page 28 lists the components of a ruleand provides a brief description of each one.
Table 3: Rule Components
Valid forNetworkRules?
Required in DeviceRules?What it DoesBlock
NoNo–Rules can be createdthat only use a fieldreference fromanother ruleor a vector with referencesfrom another rule. In thesecases, rule-frequencymustbe explicitly defined.
The Sensors block is like the access method for getting atthe data. There are multiple types of sensors available inParagon Insights: OpenConfig, NativeGPB, iAgent, SNMP,and syslog.
It defines what sensors need to be active on the devicein order to get to the data fields on which the triggerseventually operate. Sensor names are referenced by theFields.
OpenConfig and iAgent sensors require that a frequencybe set for push interval or polling interval respectively.SNMP sensors also require you to set a frequency.
“Sensors” onpage 30
28

Table 3: Rule Components (continued)
Valid forNetworkRules?
Required in DeviceRules?What it DoesBlock
YesYes-Fields contain the dataon which the triggersoperate. Starting inHealthBot Release 3.1.0,regular fields and key-fieldscan be added to rules basedon conditional taggingprofiles. See the “Tagging”on page 38 section below.
The source for the Fields block can be a pointer to asensor, a reference to a field defined in another rule, aconstant, or a formula. The field can be a string, integeror floating point. The default field type is string.
Fields onpage 30
YesNoThe Vectors block allows handling of lists, creating sets,and comparing elements amongst different sets. A vectoris used to hold multiple values from one or more fields.
“Vectors” onpage 32
NoNoThe Variables block allows you to pass values into rules.Invariant rule definitions are achieved throughmustache-style templating like {{<placeholder-variable>}}. The placeholder-variable value is set in the rule bydefault or can be user-defined at deployment time.
“Variables” onpage 33
NoNoThe Functions block allows you to extend fields, triggers,and actions by creating prototype methods in externalfiles written in languages like python. The functions blockincludes details on the file path, method to be accessed,and any arguments, including argument description andwhether it is mandatory.
“Functions” onpage 33
YesYes–Triggers enable rulesto take action.
The Triggers block operates on fields and are defined byone or more Terms. When the conditions of a Term aremet, then the action defined in the Term is taken.
By default, triggers are evaluated every 10 seconds, unlessexplicitly configured for a different frequency.
By default, all triggers defined in a rule are evaluated inparallel.
“Triggers” onpage 34
YesNoThe Rule Properties block allows you to specify metadatafor a Paragon Insights rule, such as hardwaredependencies, software dependencies, and version history.
“RuleProperties” onpage 38
29

Sensors
When defining a sensor, youmust specify information such as sensor name, sensor type and data collectionfrequency. As mentioned in Table 3 on page 28, sensors can be one of the following:
• OpenConfig—For information on OpenConfig JTI sensors, see the Junos Telemetry Interface User Guide.
• Native GPB—For information on Native GPB JTI sensors, see the Junos Telemetry Interface User Guide.
• iAgent—The iAgent sensors useNETCONFandYAML-based PyEZ tables and views to fetch the necessarydata. Both structured (XML) and unstructured (VTY commands and CLI output) data are supported.For information on Junos PyEZ, see the Junos PyEz Documentation.
• SNMP—Simple Network Management Protocol.
• syslog—system log
• BYOI—Bring your own ingest – Allows you to define your own ingest types.
• Flow—NetFlow traffic flow analysis protocol
• sFlow—sFlow packet sampling protocol
When different rules have the same sensor defined, only one subscription is made per sensor. A key,consisting of sensor-path for OpenConfig and Native GPB sensors, and the tuple of file and table for iAgentsensors is used to identify the associated rule.
When multiple sensors with the same sensor-path key have different frequencies defined, the lowestfrequency is chosen for the sensor subscription.
Fields
There are four types of field sources, as listed in Table 3 on page 28. Table 4 on page 31 describes thefour field ingest types in more detail.
30

Table 4: Field Ingest Type Details
DetailsField Type
Subscribing to a sensor typically provides access to multiple columns of data. For instance,subscribing to theOpenConfig interface sensor provides access to a bunch of information includingcounter related information such as:
/interfaces/counters/tx-bytes,
/interfaces/counters/rx-bytes,
/interfaces/counters/tx-packets,
/interfaces/counters/rx-packets,
/interfaces/counters/oper-state, etc.
Given the rather long names of paths in OpenConfig sensors, the Sensor definition within Fieldsallows for aliasing, and filtering. For single-sensor rules, the required set of Sensors for the Fieldstable are programmatically auto-imported from the raw table based on the triggers defined inthe rule.
Sensor
Triggers can only operate on Fields defined within that rule. In some cases, a Field might needto reference another Field or Trigger output defined in another Rule. This is achieved byreferencing the other field or trigger and applying additional filters. The referenced field or triggeris treated as a stream notification to the referencing field. References aren’t supported withinthe same rule.
References can also take a time-range option which picks the value, if available, from thetime-range provided. Field references must always be unambiguous, so proper attention mustbe given to filtering the result to get just one value. If a reference receives multiple data points,or values, only the latest one is used. For example, if you are referencing a the values containedin a field over the last 3minutes, youmight end upwith 6 values in that field over that time-range.Paragon Insights only uses the latest value in a situation like this.
Reference
A field defined as a constant is a fixed value which cannot be altered during the course ofexecution. Paragon Insights Constant types can be strings, integers, and doubles.
Constant
31

Table 4: Field Ingest Type Details (continued)
DetailsField Type
Raw sensor fields are the starting point for defining triggers. However, Triggers often work onderived fields defined through formulas by applying mathematical transformations.
Formulas can be pre-defined or user-defined (UDF). Pre-defined formulas include: Min, Max,Mean, Sum, Count, Rate of Change, Elapsed Time, Eval, Standard Deviation,Microburst, DynamicThreshold, Anomaly Detection, Outlier Detection, and Predict.
Rate of Change refers to the difference between current and previous values over their pointsof time. Packet transfer is an example use case where the Rate of Change formula can be used.The Hold Time field takes a threshold of time interval. The time interval between current andprevious values cannot exceed the specified Hold Time value. The Multiplication Factor field isused to convert the unit of the field value. If the field value is calculated in Bytes, specifying 1024as Multiplication Factor would convert the result into Kilobytes. Hold Time and MultiplicationFactor are not mandatory fields when you apply Rate of Change formula.
In Paragon Insights 4.0.0, you can get the current point time in Elapsed Time formula by using$time.
Some pre-defined formulas can operate on time ranges in order to work with historical data. Ifa time range is not specified, then the formula works on current data, specified as now.
Formula
Vectors
Vectors are useful in helping to gather multiple elements into a single rule. For example, using a vectoryou could gather all of the interface error fields. The syntax for Vector is:
vector <vector-name>{
path [$field-1 $field-2 .. $field-n];
filter <list of specific element(s) to filter out from vector>;
append <list of specific element(s) to be added to vector>;
}
$field-n can be field of type reference.
The fields used in defining vectors can be direct references to fields defined in other rules:
vector <vector-name>{
path [/device-group[device-group-name=<device-group>]\
/device[device-name=<device>]/topic[topic-name=<topic>]\
/rule[rule-name=<rule>]/field[<field-name>=<field-value>\
32

AND|OR ...]/<field-name> ...];
filter <list of specific element(s) to filter out from vector>;
append <list of specific element(s) to be added to vector>;
}
This syntax allows for optional filtering through the <field-name>=<field-value> portion of the construct.Vectors can also take a time-range option that picks the values from the time-range provided. Whenmultiple values are returned over the given time-range, they are all selected as an array.
The following pre-defined formulas are supported on vectors:
• unique @vector1–Returns the unique set of elements from vector1
• @vector1 and @vector2–Returns the intersection of unique elements in vector1 and vector2.
• @vector1 or @vector2–Returns the total set of unique elements in the two vectors.
• @vector1 unless @vector2–Returns the unique set of elements in vector-1, but not in vector-2
Variables
Variables are defined during rule creation on the Variables page. This part of variable definition createsthe default value that gets used if no specific value is set in the device group or on the device duringdeployment. For example, the check-interface-status rule has one variable called interface_name. Thevalue set on the Variables page is a regular expression (regex), .*, that means all interfaces.
If applied as-is, the check-interface-status rule would provide interface status information about all theinterfaces on all of the devices in the device group. While applying a playbook that contains this rule, youcould override the default value at the device group or device level. This allows you flexibility when applyingrules. The order of precedence is device value overrides device group value and device group value overridesthe default value set in the rule.
BEST PRACTICE: It is highly recommended to supply default values for variables defined indevice rules. All Juniper-supplied rules follow this recommendation. Default values must not beset for variables defined in network rules.
Functions
Functions are defined during rule creation on the Functions tab. Defining a function here allows it to beused in Formulas associated with Fields and in theWhen and Then sections of Triggers. Functions used
33

in the when clause of a trigger are known as user-defined functions. These must return true or false.Functions used in the then clause of a trigger are known as user-defined actions.
Triggers
Triggers play a pivotal role in Paragon Insights rule definitions. They are the part of the rule that determinesif and when any action is taken based on changes in available sensor data. Triggers are constructed in awhen-this, then-that manner. As mentioned earlier, trigger actions are based on Terms. A Term is builtwith when clauses that watch for updates in field values and then clauses that initiate some action basedon what changed. Multiple Terms can be created within a single trigger.
Evaluation of the when clauses in the Terms starts at the top of the list of terms and proceeds to thebottom. If a term is evaluated and nomatch is made, then the next term is evaluated. By default, evaluationproceeds in this manner until either a match is made or the bottom of the list is reached without a match.
Pre-defined operators that can be used in the when clause include:
NOTE: For evaluated equations, the left-hand side and right-hand side of the equation areshortened to LHS and RHS, respectively in this document.
• greater-than–Used for checking if one value is greater than another.
• Returns: True or False
• Syntax: greater-than <LHS> <RHS> [time-range <range>]
• Example: //Memory > 3000 MB in the last 5 minutes
when greater-than $memory 3000 time-range 5m;
• greater-than-or-equal-to–Same as greater-than but checks for greater than or equal to (>=)
• less-than
• Returns: True or False
• Syntax: less-than <LHS> <RHS> [time-range <range>]
• Example: //Memory < 6000 MB in the last 5 minutes
when less-than $memory 6000 time-range 5m;
• less-than-or-equal-to–Same as less-than but checks for less than or equal to (<=)
• equal-to–Used for checking that one value is equal to another value.
• Returns: True or False
• Syntax: equal-to <LHS> <RHS> [time-range <range>]
34

• Example: //Queue’s buffer utilization % == 0
when equal-to $buffer-utilization 0;
• not-equal-to–Same as equal-to but checks for negative condition (!=)
• exists–Used to check if some value exists without caring about the value itself. Meaning that some valueshould have been sent from the device.
• Returns: True or False
• Syntax: exists <$var> [time-range <range>]
• Example: //Has the device configuration changed?
when exists $netconf-data-change
• matches-with (for strings & regex)–Used to check for matches on strings using Python regex operations.See Syntax for more information.
NOTE: LHS, or left hand side, is the string in which we are searching; RHS, or right hand side,is the match expression. Regular expressions can only be used in RHS.
• Returns: True or False
• Syntax: matches-with <LHS> <RHS> [time-range <range>]
• Example: //Checks that ospf-neighbor-state has been UP for the past 10 minutes
when matches-with $ospf-neighbor-state “^UP$” time-range 10m;
Example 1: escape backslash '\’ with one more backslash '\’
escape \ with one more \
Expression: ^\\S+-\\d+/\\d+/\\d+$
Values that will match:
xe-1/0/0
et-1/0/1
fe-2/0/0
Values that will not match:
xe-1/0/0.1
fxp0
Example 2: escape \ with one more \
35

Expression: \\(\\S+\\)\\s\\(\\S+\\)
Values that will match:
(root) (mgd)
(user1) (ssh)
Values that will not match:
root mgd
(root) mgd
• does-not-match-with (for strings & regex)–Same as matches-with but checks for negative condition
• range–Checks whether a value, X, falls within a given range such as minimum and maximum (min <= X<= max)
• Returns: True or False
• Syntax: range <$var> min <minimum value> max <maximum value> [time-range <range>]
• Example: //Checks whether memory usage has been between 3000 MB and 6000 MB in the last 5minutes
when range $mem min 3000 max 6000 time-range 5m;
• increasing-at-least-by-value–Used to check whether values are increasing by at least the minimumacceptable rate compared to the previous value. An optional parameter that defines the minimumacceptable rate of increase can be provided. The minimum acceptable rate of increase defaults to 1 ifnot specified.
• Returns: True or False
• Syntax:
increasing-at-least-by-value <$var> [increment <minimum value of increase between successivepoints>]
increasing-at-least-by-value <$var> [increment <minimum value of increase between successivepoints>] time-range <range>
• Example: Checks that the ospf-tx-hello has been increasing steadily over the past 5 minutes.
when increasing-at-least-by-value $ospf-tx-hello increment 10 time-range 5m;
• increasing-at-most-by-value–Used to check whether values are increasing by nomore than themaximumacceptable rate compared to the previous value. An optional parameter that defines the maximumacceptable rate of increase can be provided. The maximum acceptable rate of increase defaults to 1 ifnot specified.
• Returns: True or False
• Syntax:
36

increasing-at-most-by-value <$var> [increment <maximum value of increase between successivepoints>]
increasing-at-most-by-value <$var> [increment <maximum value of increase between successivepoints>] time-range <range>
• Example: Checks that the error rate has not increased by more than 5 in the past 5 minutes.
when increasing-at-most-by-value $error-count increment 5 time-range 5m;
• increasing-at-least-by-rate–Used for checking that rate of increase between successive values is at leastgiven rate. Mandatory parameters include the value and time-unit, which together signify the minimumacceptable rate of increase.
• Returns: True or False
• Syntax:
This syntax compares current value against previous value ensuring that it increases at least by valuerate.
increasing-at-least-by-rate <$var> value <minimum value of increase between successive points> per<second|minute|hour|day|week|month|year> [time-range <range>]
This syntax compares current value against previous value ensuring that it increases at least bypercentage rate
increasing-at-least-by-rate <$var> percentage <percentage> per<second|minute|hour|day|week|month|year> [time-range <range>]
• Example: Checks that the ospf-tx-hello has been increasing strictly over the past five minutes.
when increasing-at-least-by-rate $ospf-tx-hello value 1 per second time-range 5m;
• increasing-at-most-by-rate–Similar to increasing-at-least-by-rate, except that this checks for decreasingrates.
Using these operators in the when clause, creates a function known as a user-defined condition. Thesefunctions should always return true or false.
If evaluation of a term results in a match, then the action specified in the Then clause is taken. By default,processing of terms stops at this point. You can alter this flow by enabling the Evaluate next term buttonat the bottom of the Then clause. This causes Paragon Insights to continue term processing to create morecomplex decision-making capabilities like when-this and this, then that.
The following is a list of pre-defined actions available for use in the Then section:
• next
• status
37

Tagging
Starting with Release 3.1.0, HealthBot supports tagging. Tagging allows you to insert fields, values, andkeys into a Paragon Insights rule when certain conditions are met. See “Paragon Insights Tagging” onpage 45 for details.
Rule Properties
The Rule Properties block allows you to specify metadata for a Paragon Insights rule, such as hardwaredependencies, software dependencies, and version history. This data can be used for informational purposesor to verify whether or not a device is compatible with a Paragon Insights rule.
Multiple Sensors per Device
Paragon Insights Release 4.0.0 allows you to add multiple sensors per rule that can be applied to all thedevices in a device group. In earlier releases, you could add only one sensor per rule. Each sensor per rulegenerates data in a field table. If you added the different sensors in multiple rules, it results in as manyfield tables as the number of rules.When you addmultiple types of sensors (such as OpenConfig or NativeGPB) in a single rule in Paragon Insights, data from the sensors is consolidated in a single field table thatis simpler to export or to visualize. The GUI support for multiple sensor configurations will be implementedin subsequent releases.
Guidelines
Sp-admins or users with create access privilege must note the following guidelines when configuringmultiple sensors.
• When adding multiple sensors to rules, you must ensure that there are no overlapping data or keysetsreceived from the sensors applied to a device. Overlapping keysets can result in duplicate data points,overwriting of data points, and inaccurate evaluation of data. To avoid this, you can use filter expressionssuch as the where statement in Fields.
• When you add multiple sensors in a rule in Paragon Insights GUI, you must set a common value for allsensors in the following fields:
• Frequency field in Sensors tab (sensor frequency)
• Field aggregation time-range field in Rules page.
• Frequency field in Triggers tab.
• Time range field used in triggers, formula, and reference.
For example, when multiple sensors are added in a rule, all sensors applied to a device must have thesame value for sensor frequency, irrespective of the type of sensors. If a rule has iAgent andOpenConfigsensors, the Frequency value in both sensors must be the same. This holds true for all the fields listedabove.
38

NOTE: We recommend you use offset values if you cannot match the time range values ondifferent sensors. For more information, see Frequency Profiles and Offset Time.
However, the frequency you set in a frequency profile will override the frequency values set in multiplesensors in a rule.
• A Rule with multiple sensors is applied on all devices added in a particular device group. It is assumedthat the devices in a device group support the types of sensors used in Paragon Insights rules.
Sometimes, not all devices in a device group can support the same type of sensor. For example, thedevice group DG1 has an MX2020 router with OpenConfig package installed and another MX2020router configuredwithout theOpenConfig package. The firstMX2020 router would support OpenConfigsensor whereas, the second MX2020 router would not support the same sensor.
To avoid such scenarios, youmust ensure that all devices in the same device group unanimously supportthe types of sensors used to collect information.
Configure Multiple Sensors in Paragon Insights GUI
To add multiple sensors in a rule:
1. Navigate to Configuration > Rules > Add Rule.
Rules page appears.
2. Enter the Paragon Insights topic and rule name, rule description, synopsis, and optionally, the fieldaggregation time-range and rule frequency. For more information on these fields in Rules page, see“Paragon Insights Rules and Playbooks” on page 143.
3. Click Add Sensor button in Sensors tab and fill in the necessary details based on the type of sensoryou choose.
Repeat step 3 to add as many sensors as you need for your use case.
4. Configure fields for the sensors in the Fields tab.
5. Configure sensors in Rule Properties tab to set multiple sensors active.
You must enter all the sensors, earlier configured in the rule, under the supported-devices hierarchyin Rule Properties. For example, if you configured sensors s1, s2, and s3 in a rule, the Rule Propertiesconfiguration must also include the same sensors:
rule-properties {
version 1;
39

contributor juniper;
supported-healthbot-version 4.0.0;
supported-devices {
sensors [s1 s2 s3];
You can also write and upload a new rule in the Paragon Insights GUI.
The rulemust follow the curly brackets format ( { ) and indentation for hierarchical structure. Terminatingor leaf statements in the configuration hierarchy are displayed with a trailing semicolon (;) to defineconfiguration details, such as supported version, sensors, and other configuration statements.
6. Click Save & Deploy to apply the new sensors in your network or click Save to save the configurationsof the new sensors and deploy them later.
Use Cases
The following scenarios illustrate use cases for multiple sensors in a rule:
• In Pathfinder Controller, there can be different native sensors that provide non-overlapping counterdetails for Segment Routing (SR) and Resource Reservation Protocol (RSVP) label switched paths (LSP).If the field table needs to be combined for the data collected from the LSPs, multiple sensors can bemade active for a device in the same rule.
• If you want to get data for ge interface using iAgent sensor and for fe interface using Native GPB sensor,then you could use multiple active sensor for a device. You need to ensure non-overlapping data in thiscase by using Field filtering expression to filter by the interface name. Instead of interfaces, an sp-adminor a user with create access privilege can consider any other key performance indicators too.
Sensor Precedence
Tomake data collection from a sensor effective, devices in a device groupmust support a particular sensoras an ingest method. Select devices in a device group running an older version of operating system, devicesfrom different vendors in a device group, or different products from the same vendor (such as EX, MX andPTX routers from Juniper) are all scenarios that can cause challenges to applying a sensor to a devicegroup. In such cases, you need to set a different sensor that is compatible with specific devices in a devicegroup.
Paragon Insights Release 4.0.0 enables you to set sensor precedence so that, you can configure differentsensors in each hierarchy of Rule Properties such as vendor name, operating system, product name,platform, and release version. This makes it possible to apply suitable sensors on multi-vendor devices ina heterogeneous device group. In Release 4.0.0, you can configure sensor precedence only through ParagonInsights CLI. Starting in Paragon Insights Release 4.2.0, you can configure more than one sensor for a rule.For more information, see “Paragon Insights Rules and Playbooks” on page 143.
40

Figure 3 on page 41 illustrates two rules each with multiple sensors. It is assumed that Rule Properties isconfigured for sensor precedence.
Figure 3: Representation of Sensor Precedence in Rules
Playbook1 Devicegroup1
For device1, pick sensor1 from rule1and sensor4 from rule2
For device2, pick sensor2 from rule1and sensor6 from rule2
For device3, pick sensor3 from rule1and sensor5 from rule2
For device4, pick sensor2 from rule1and sensor6 from rule2
Rule1
Rule2
Sensor1
Sensor2
Sensor3
Sensor4
Sensor5
Senso6
Device2
Device3
Device4
Device1
Deploy Playbook1 forDevicegroup1
g301
477
Let us suppose Sensor1 in Rule 1 is OpenConfig and Sensor4 in Rule 2 is iAgent and Device1 runs Junosoperating system (OS). If OpenConfig and iAgent were set as default sensors for Junos OS hierarchy inRule Properties then, Device1would receive data from Sensor1 and Sensor4when the Playbook is deployedfor the device group.
Before You Begin
In standalone deployment of Paragon Insights, before you configure sensor precedence, the devices in adevice group must be configured with the following fields:
• Vendor name: Paragon Insights Release 4.0.0 supports multiple vendors that include Juniper Networks,Cisco Systems, Arista Networks, and PaloAlto Networks.
• Operating system: Name of the operating system supported by vendors such as Junos, IOS XR, and soon.
• Product: Name of the family of products (devices) offered by a vendor. For example, MX routers, ACXrouters, PTX routers from Juniper Networks.
• Platform: Particular member device in a series of products. For example, MX2020, ACX5400 and so on.
• Release or version: release version of the platform selected.
The configuration of above fields in the device hierarchy must match the sensor precedence specified inthe Rule Properties. For example, if you include platform MX2020 in device configuration, the sensorprecedence hierarchy must also include MX2020.
41
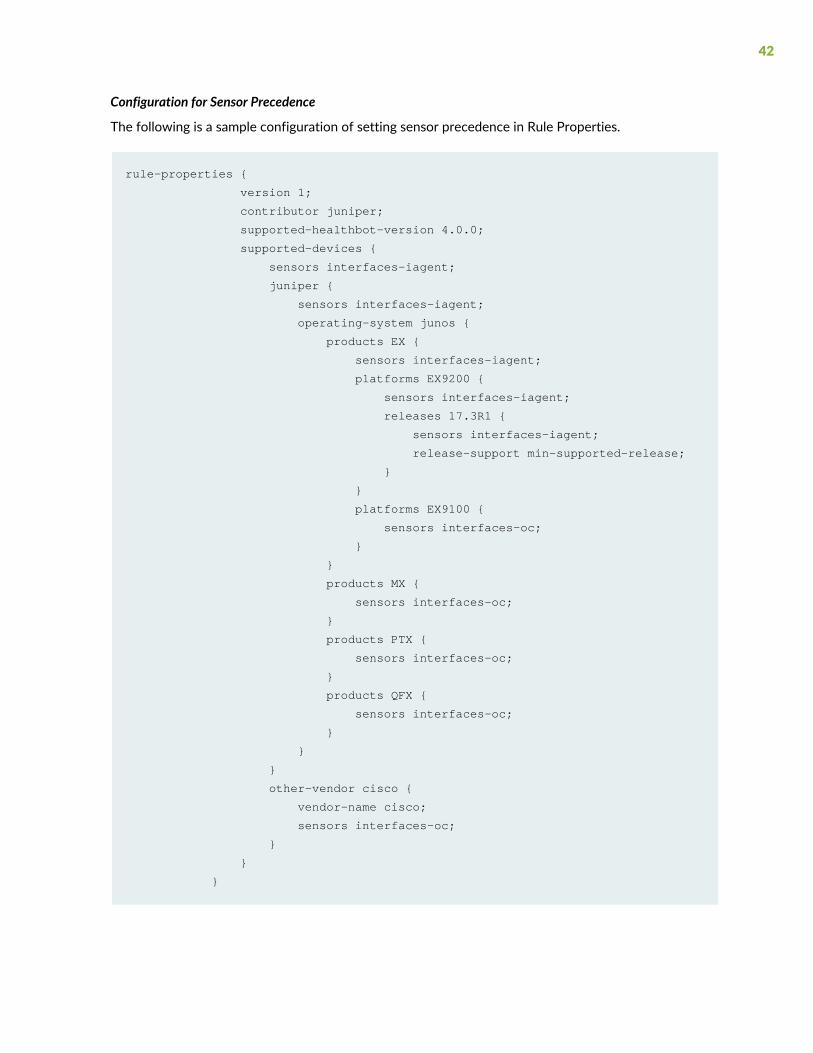
Configuration for Sensor Precedence
The following is a sample configuration of setting sensor precedence in Rule Properties.
rule-properties {
version 1;
contributor juniper;
supported-healthbot-version 4.0.0;
supported-devices {
sensors interfaces-iagent;
juniper {
sensors interfaces-iagent;
operating-system junos {
products EX {
sensors interfaces-iagent;
platforms EX9200 {
sensors interfaces-iagent;
releases 17.3R1 {
sensors interfaces-iagent;
release-support min-supported-release;
}
}
platforms EX9100 {
sensors interfaces-oc;
}
}
products MX {
sensors interfaces-oc;
}
products PTX {
sensors interfaces-oc;
}
products QFX {
sensors interfaces-oc;
}
}
}
other-vendor cisco {
vendor-name cisco;
sensors interfaces-oc;
}
}
}
42
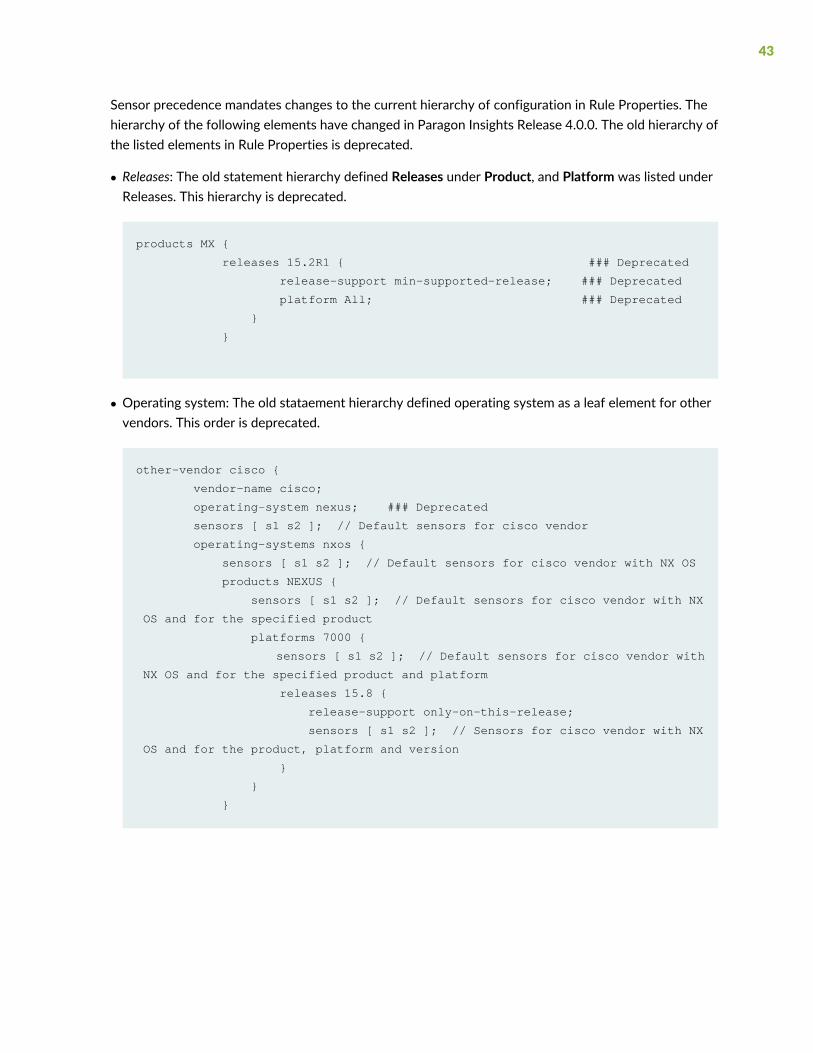
Sensor precedence mandates changes to the current hierarchy of configuration in Rule Properties. Thehierarchy of the following elements have changed in Paragon Insights Release 4.0.0. The old hierarchy ofthe listed elements in Rule Properties is deprecated.
• Releases: The old statement hierarchy defined Releases under Product, and Platform was listed underReleases. This hierarchy is deprecated.
products MX {
releases 15.2R1 { ### Deprecated
release-support min-supported-release; ### Deprecated
platform All; ### Deprecated
}
}
• Operating system: The old stataement hierarchy defined operating system as a leaf element for othervendors. This order is deprecated.
other-vendor cisco {
vendor-name cisco;
operating-system nexus; ### Deprecated
sensors [ s1 s2 ]; // Default sensors for cisco vendor
operating-systems nxos {
sensors [ s1 s2 ]; // Default sensors for cisco vendor with NX OS
products NEXUS {
sensors [ s1 s2 ]; // Default sensors for cisco vendor with NX
OS and for the specified product
platforms 7000 {
sensors [ s1 s2 ]; // Default sensors for cisco vendor with
NX OS and for the specified product and platform
releases 15.8 {
release-support only-on-this-release;
sensors [ s1 s2 ]; // Sensors for cisco vendor with NX
OS and for the product, platform and version
}
}
}
43

Paragon Insights Playbooks
In order to fully understand any given problem or situation on a network, it is often necessary to look ata number of different system components, topics, or key performance indicators (KPIs). Paragon Insightsoperates on playbooks, which are collections of rules for addressing a specific use case. Playbooks are theParagon Insights element that gets applied, or run, on your device groups or network groups.
Paragon Insights comes with a set of pre-defined Playbooks. For example, the system-KPI playbookmonitors the health of system parameters such as system-cpu-load-average, storage, system-memory,process-memory, etc. It then notifies the operator or takes corrective action in case any of the KPIs crosspre-set thresholds. Following is a list of Juniper-supplied Playbooks.
• bgp-session-stats
• route-summary-playbook
• lldp-playbook
• interface-kpis-playbook
• system-kpis-playbook
• linecard-kpis-playbook
• chassis-kpis-playbook
You can create a playbook and include any rules want in it. You apply these playbooks to device groups.By default, all rules contained in a Playbook are applied to all of the devices in the device group. There iscurrently no way to change this behavior.
If your playbook definition includes network rules, then the playbook becomes a network playbook andcan only be applied to network groups.
44

Release History Table
DescriptionRelease
Starting in Paragon Insights Release 4.2.0, you can configure more than one sensor for a rule.4.2.0
Paragon Insights Release 4.0.0 allows you to add multiple sensors per rule that can be appliedto all the devices in a device group.
4.0.0
Paragon Insights Release 4.0.0 enables you to set sensor precedence so that, you can configuredifferent sensors in each hierarchy of Rule Properties such as vendor name, operating system,product name, platform, and release version.
4.0.0
Starting in HealthBot Release 3.1.0, regular fields and key-fields can be added to rules basedon conditional tagging profiles.
3.1.0
Starting with Release 3.1.0, HealthBot supports tagging.3.1.0
RELATED DOCUMENTATION
Paragon Insights Rules and Playbooks | 143
Paragon Insights Tagging
IN THIS SECTION
Overview | 46
Types of Tagging | 53
Add a Tagging Profile | 61
Apply a Tagging Profile | 66
You can use the Paragon Insights (formerly HealthBot) graphical user interface (GUI) to create taggingprofiles. You can configure a tagging profile to insert fields, values, and keys into a Paragon Insights rule.You can also set conditions that are checked against values stored in the times series database (TSDB) orRedis database.
45

Overview
IN THIS SECTION
Tagging Profile Terminology | 46
How do Tagging Profiles Work? | 51
Caveats | 52
Tagging allows you to insert fields, values, and keys into a Paragon Insights rule when certain conditionsare met.
Paragon Insights supports the following types of tagging:
• Static Tagging
In static tagging, the tagging profile is applied to values stored in the time series data base (TSDB). Thesevalues do not vary a lot with time. In static tagging, you can avoid usingWhen statements, and you canadd Then statements individually to a row of the TSDB. You can add tags to all rows since no conditionsare present.
• Dynamic Tagging
Paragon Insights Release 4.0.0 supports dynamic tagging where conditions used in Paragon Insightstagging are checked against values that are stored in Redis database. This database acts like a cachememory that stores dynamic data. Dynamic data is real-time data that is stored in Redis database.
Tagging Profile Terminology
IN THIS SECTION
Policy | 47
Rules | 47
Terms | 47
When Statements | 48
Then Statements | 49
Example Configuration: Elements of a Tagging Profile | 49
46

The following list describes the tagging profile terminologies:
Policy
A policy is the top-level element in a tagging profile. You can add multiple policies within a single taggingprofile. Multiple policies that exist within a tagging profile can have their own rules and terms.
Usage Notes:
• Defining multiple policies within a single profile allows you to define terms for each rule in one profilerather than having to create one profile for each rule.
Rules
A rule is any defined Paragon Insights rule. The rule element type in a tagging profile is a list element. Youcan apply a specific policy profile to the rule(s) ([rule1, rule2]) included within the tagging profile.
Usage Notes:
You can describe the topic-name/rule-name requirement for the rules element in the following ways:
• To name specific rules within a tagging profile, use the form: topic-name/rule-name.
For example, protocol.bgp/check-bgp-advertised-routes. Navigate toConfiguration>Rules to view configuredrules.
• Use an asterisk (*) with no other value or brackets to match all rules.
• Use python-based fnmatch patterns to select all rules within a specific topic. For example, line-cards/*.
For more information, see fnmatch — Unix filename pattern matching.
Terms
The term section of the tagging profile is where the match conditions are set and examined, and actionsbased on those matches are set and carried out. Set the conditions for a match in a when statement. Setthe actions to be carried out upon completing a match in one or more then statements.
Usage Notes:
• Each term can contain a when statement but it is not mandatory.
• Each term must contain at least one then statement.
• Multiple terms can be set within a single policy.
• Terms are processed sequentially from top to bottomuntil amatch is found. If amatch is found, processingstops after completing the statements found in the then section. Other terms, if present, are not processedunless the next flag is enabled within the matched term. If the matched term has the next flag enabled,then subsequent terms are processed in order.
47

When Statements
When statements define the match conditions that you specify.When statements ultimately resolve to betrue or false. You can define a term without a when statement. This equates to a default term wherein thematch is assumed true and the subsequent then statement is carried out. Conversely, multiple conditionscan be checked within one when statement.
If one or more of the conditions set forth in a when statement are not met, the statement is false and theterm has failed to match; processing moves to the next term, if present.
Usage Notes:
When statements perform boolean operations on the received data to determine if it matches the criteriayou set. The supported operations are:
• Numeric Operations:
• equal-to
• not-equal-to
• greater-than
• greater-than-or-equal-to
• less-than
• less-than-or-equal-to
• String Operations:
• matches-with
• does-not-match-with
• Time Operations:
• matches-with-scheduler
NOTE: The matches-with-scheduler option requires that a discreet scheduler be configuredin the Administration > Ingest Settings > Scheduler page. The name of the scheduler can thenbe used in the matches-with-scheduler when statement
• Go Language Expressions:
• eval <simple-go-expression>
For example: eval a + b <= c.
48

Then Statements
Then statements implement the tagging instructions that you provide. This is done only after there is acomplete match of the conditions set forth in a when statement contained in the same term. Each termdefined must have at least one then statement. Each then statement must have one or more than oneaction(s) defined; the actions available in then statements are:
add-field—Adds a normal field to the rule(s) listed in the rule section.
Multiple fields can be addedwithin a then statement. The add-field action requires that you also definethe kind of field you are adding with the field-type parameter:
• string
• integer
• float
• unsigned integer
Starting in Paragon Insights Release 4.2.0, you can also select unsigned integer as a name field datatype.
NOTE: If you do not define a field type, the new field gets added with the default field-typeof string.
add-key—Adds a key field with string data type to the rule(s). Added key fields are indexed and can besearched for just like any other key field.
Usage Notes:
• You can set the next flag to true within a then statement. When this flag is set to true, the next term inthe policy gets evaluated if all of the conditions of the current term match.
Example Configuration: Elements of a Tagging Profile
Paragon Insights configuration elements are displayed as pseudo-config. This configuration resembles thehierarchical method used by Junos OS.
Elements of a Tagging Profile on page 49 shows how tagging profile elements are named and how theyare related to each other.
Elements of a Tagging Profile
healthbot {
ingest-settings {
data-enrichment {
49

tagging-profile <tagging-profile-name> {
policy <policy-name> {
rules [ List of Rules ];
term <term-name1>
{
when {
<condition1>
<condition2>
}
then {
add-field <field-name1>
{
value <field-value1>;
type <field-type>;
}
add-field <field-name2>
{
value <field-value2>;
type <field-type>;
}
add-key <key-field-name>
{
value <key-field-value>;
}
}
}
term <term-name2>
{
then {
add-field <field-name>
{
value <field-value>;
type <field-type>;
}
}
}
}
}
}
}
}
50

How do Tagging Profiles Work?
You can use tagging profiles to set the conditions, define new fields and keys, and insert values into thosefields. Tagging profiles are applied as part of ingest settings to allow the tags to be added to the incomingdata before Paragon Insights processes the data. Since one or more rules are defined within each profile,the rules are added to a playbook and applied to a device group when the tagging profile is applied to adevice.
Table 5 on page 51 shows an example application identification scenario based on source-port,destination-port, and protocol of traffic seen in a NetFlow stream.
Table 5: Fields in NetFlow Stream
derived-applicationprotocoldestination-portsource-port
NetChat6 (TCP)Any2541
6 (TCP)2541Any
MS-streaming17 (UDP)Any1755
netconf-ssh6 (TCP)830Any
vns-tp17 (UDP)Any7802
In Table 5 on page 51, you use three existing fields in a NetFlow stream to guess the application traffic inthe stream. You then create a new field called derived-application and populate it based on the values seenin the traffic.
You can apply tagging profiles at the device group level. See Example pseudo-configuration shown belowon page 52.
• When a device in a device group has a tagging profile applied to it, and the device group has anothertagging profile applied to the whole group of devices, the tagging profile of the device group is mergedwith the existing tagging profile of the device.
For example, D-A-Net is a device that is part of a device group called Group-D1. D-A-Net has a taggingprofile applied to it. There is another tagging profile applied on the device group, Group-D1, as well. Insuch a scenario, the tagging profile applied to the device group is merged with the tagging profile of thedevice, D-A-Net.
• When the tagging profile applied to the device group and the tagging profile applied to the device in thegroup renders the same output, the tagging profile of the device is preserved.
51

Example pseudo-configuration shown below
device r0 {
host r0;
tagging-profile [ profile1 ]
}
device r1 {
host r1
}
device-group core {
devices [ r0 r1 ];
tagging-profile [ profile2 ]
}
In this example, device r0 has tagging profile, profile1, assigned at the device level and tagging profile,profile2, assigned by its membership in the device- group (core).
Device r1 has tagging profile, profile2, assigned by its membership in device group, core.
In this scenario, profile1 and profile2 are merged on device r0. However, if profile1 and profile2 both definethe same fields but the fields contain different values, the value from profile1 takes precedence becauseit is assigned directly to the device.
Device r1 only gets tagging profile profile2.
Caveats
• Fields and keys added using tagging profiles cannot be used within periodic aggregation fields. This isbecause periodic aggregation must take place before any UDFCode function (reference, vector, UDF,ML) is applied.
• Tagging profiles can consist of only fields in add-key or add-field. Vectors cannot be added to a rule bya tagging profile.
• Vector comparison operations cannot be usedwithin tagging profile terms. Only field Boolean operationsare permitted.
• For tagging profile conditional operations within awhen statement, the used field must be of type sensor,constant, or reference.
This is applicable only in static tagging.
• If the field used within tagging profile Boolean operation is of type reference, then this reference fieldmust not depend on any user-defined-function or formula defined within the same rule.
52
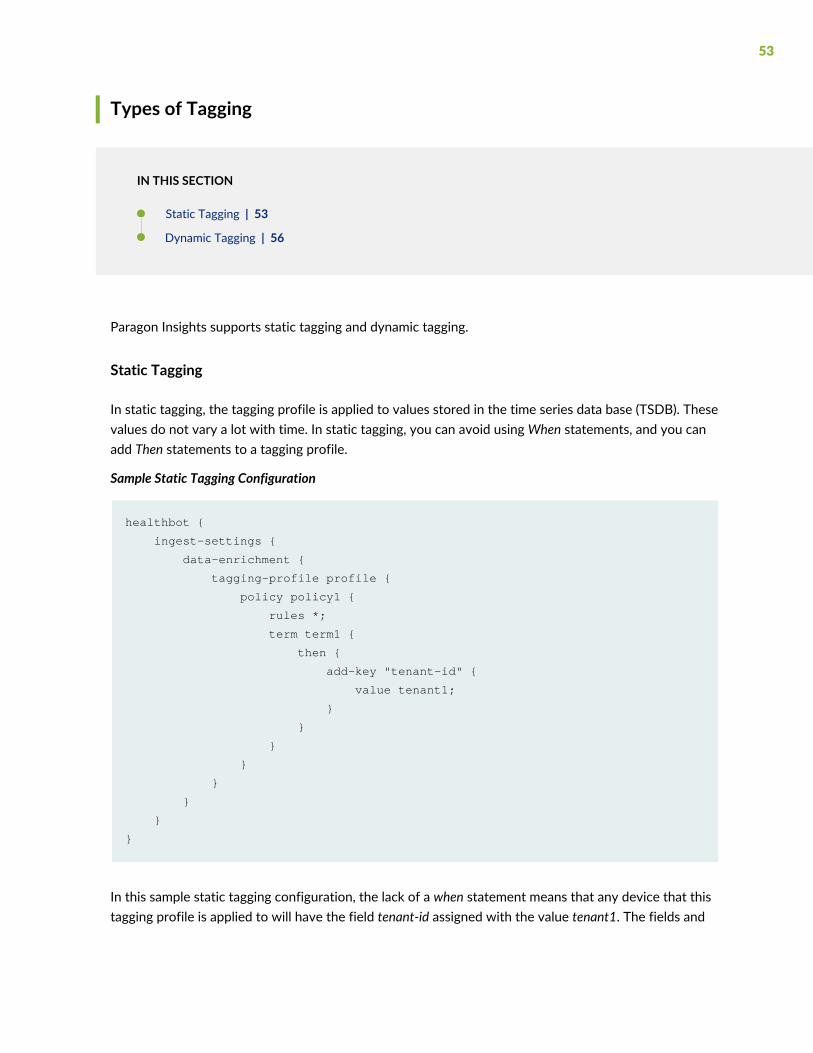
Types of Tagging
IN THIS SECTION
Static Tagging | 53
Dynamic Tagging | 56
Paragon Insights supports static tagging and dynamic tagging.
Static Tagging
In static tagging, the tagging profile is applied to values stored in the time series data base (TSDB). Thesevalues do not vary a lot with time. In static tagging, you can avoid usingWhen statements, and you canadd Then statements to a tagging profile.
Sample Static Tagging Configuration
healthbot {
ingest-settings {
data-enrichment {
tagging-profile profile {
policy policy1 {
rules *;
term term1 {
then {
add-key "tenant-id" {
value tenant1;
}
}
}
}
}
}
}
}
In this sample static tagging configuration, the lack of a when statement means that any device that thistagging profile is applied to will have the field tenant-id assigned with the value tenant1. The fields and
53

values defined in this profile are assigned to all rules that are applied to a device or device-group becauseof the * in the rules parameter.
You can also create a static tagging profile from the Paragon Insights graphical user interface (GUI). Navigateto Configuration > Sensor > Settings > Tagging Profile page to create a tagging profile.
Application Identification
Table 5 on page 51 shows an example application identification scenario based on source-port,destination-port, and protocol of traffic seen in a NetFlow stream.
To create the derived-application field as given in Table 5 on page 51 from the received data (data undersource-port, destination port, and protocol), you must use a tagging profile definition that looks like this:
healthbot {
ingest-settings {
data-enrichment {
tagging-profile profile1 {
policy policy1 {
rules *;
term term1 {
when {
matches-with "$source-port" "$netchat-source-port";
matches-with "$protocol" "6 (TCP)";
}
then {
add-key "application" {
value netchat;
}
}
}
term term2 {
when {
matches-with "$protocol" "6 (TCP)";
matches-with "$destination-port" "$netchat-dest-port";
}
then {
add-key "application" {
value netchat;
}
}
}
term term3 {
when {
matches-with "$source-port" "$ms-streaming-source-port";
54

matches-with "$protocol" "17 (UDP)";
}
then {
add-key "application" {
value ms-streaming;
}
}
}
term term4 {
when {
matches-with "$source-port" "$netconf-ssh-source-port";
matches-with "$protocol" "6 (TCP)";
}
then {
add-key "application" {
value netconf-ssh;
}
}
}
term term5 {
when {
matches-with "$source-port" "$vns-tp-source-port";
matches-with "$protocol" "17 (UDP)";
}
then {
add-key "application" {
value vns-tp;
}
}
}
}
}
}
}
}
55

Dynamic Tagging
IN THIS SECTION
Benefits of Dynamic Tagging | 56
Understanding Redis Database and Dynamic Tagging Configurations | 56
Paragon Insights supports dynamic tagging. In dynamic tagging, you can set conditions in a tagging profile,that in turn are checked against values that are stored in Redis database. When these conditions are met,they are applied to incoming data before Paragon Insights processes the data.
Benefits of Dynamic Tagging
• Values stored in Redis database are current and dynamic.
• Redis database can be used as a cache memory to store real-time data.
Understanding Redis Database and Dynamic Tagging Configurations
Understanding Redis Database and Dynamic Tagging Configurations
• Key structure is<Device-group-name>:<device-id>::key-name__network:<network-group-name>::key-name , where:: is the key separator.
Example key structures:
• Device Group
Syntax:
<Device-group-name>:<device-id>::key-name
Example:
Device GroupCore:r1::/components/
• Network Group
Syntax:
__network:<network-group-name>::key-name
Example:
56

network::net_check::topic/rule
• Values are stored in JSON string format <json dump as string> in Redis. However, values are providedin string, integer, and float formats.
Example value formats:
• Core:r1::/components/= value1
• Core:r1::/components/='{“key1”: value1, “key2”: value2}’
• Core:r1::/components/='{“key1”: {“key2”: value1, “key3”: value2}’
• Core:r1::/components/='{“key1”: {“key2”: ‘[list of values]’, “key3”: value1}’
• Sample tagging-profile configurations using when statement.•
"when" : {
"matches-with" : [
{
"left-operand" : "$field1",
"right-operand" : “/interfaces/.key1”,
“in-memory”: true
}
]
}
• Use a . operator between interfaces.
In the following example, key3 interface is nested within key2 interface in the right operand.
"when" : {
"matches-with" : [
{
"left-operand" : "$field1",
"right-operand" : “/interfaces/.key2.key3”,
}
]
}
• Sample tagging-profile configurations using then statement.•
"then" : {
"add-field" : [
57
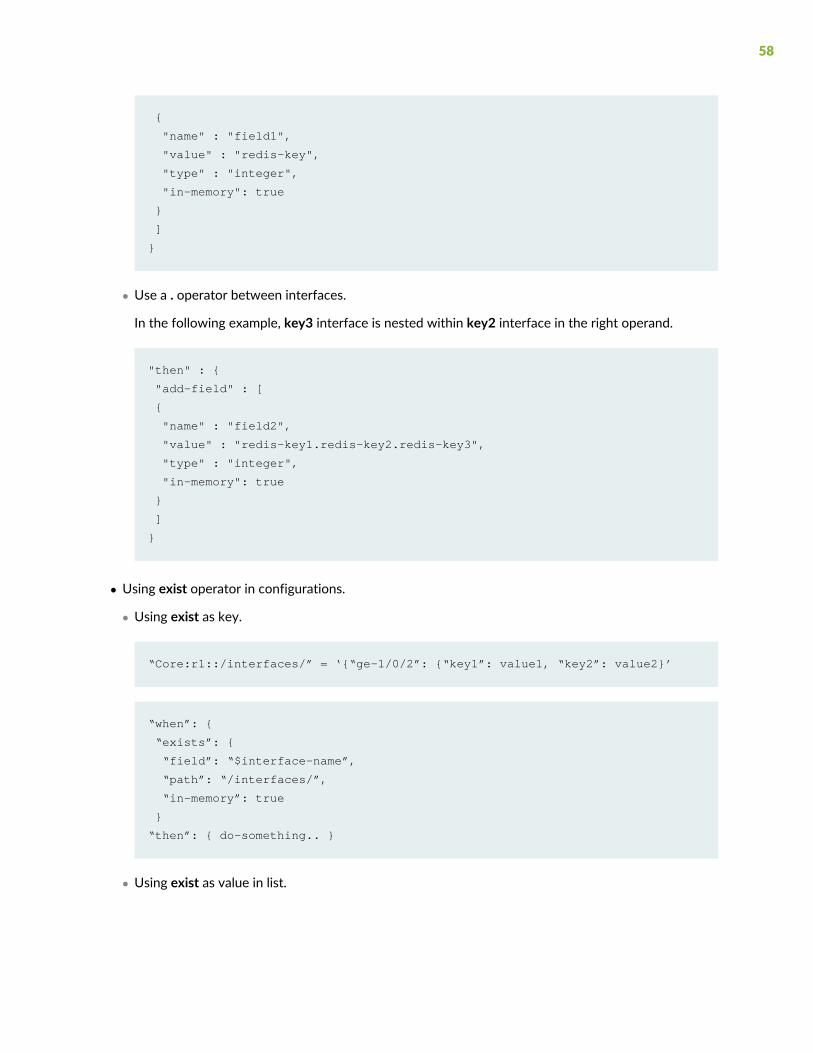
{
"name" : "field1",
"value" : "redis-key",
"type" : "integer",
"in-memory": true
}
]
}
• Use a . operator between interfaces.
In the following example, key3 interface is nested within key2 interface in the right operand.
"then" : {
"add-field" : [
{
"name" : "field2",
"value" : "redis-key1.redis-key2.redis-key3",
"type" : "integer",
"in-memory": true
}
]
}
• Using exist operator in configurations.
• Using exist as key.
“Core:r1::/interfaces/” = ‘{“ge-1/0/2”: {“key1”: value1, “key2”: value2}’
“when”: {
“exists”: {
“field”: “$interface-name”,
“path”: “/interfaces/”,
“in-memory”: true
}
“then”: { do-something.. }
• Using exist as value in list.
58

“Core:r1::/interfaces/” = ‘{“key1”: {“key2”: [‘ge-1/0/2’, ‘ge-1/0/3’], “key3”:
value1}}
“when”: {
“exists”: {
“field”: “$interface-name”,
“path”: “/interfaces/.key1.key2” ,
“in-memory”: true
}
},
“then”: {
“add-field”: [
“name”: “field1”,
“value”: “/interfaces/.key1.key3”,
“in-memory”: true
]
}
• Using $ in then statements.
When you use $<field-name> within a Redis key, $<field-name> is replaced with a value from thealready processed database value.
As an example, consider that ge-1/0/2 is present within Redis key.
“Core:r1::/interfaces/” = ‘{“ge-1/0/2”: {“key1”: value1, “key2”: value2},
“ge-1/0/3”: {“key1”: value1, “key2”: value2}’
“when”: {
“exists”: [
{
“field”: “$interface-name”,
“path”: “/interfaces/”,
“in-memory”: true
}
],
“greater-than”: [
{
“left-operand”: “30”,
“right-operand”: “/interfaces/.$interface-name.key1” ,
“in-memory”: true
59

}
]
},
“then”: {
“add-field”: [
“name”: “interface-meta-data”,
“value”: “/interfaces/.$interface-name.key2”,
“in-memory”: true
]
}
In this scenario, the tagging-profile checks if $interface-name is present in the Redis database, and ifkey1 value for the given interface name is greater than 30. If the statement is true, the tagging-profilefetches key2 value from name field. In this example tagging profile, the name value is interface-meta-data.
• To enable dynamic tagging, set in-memory value to true.
By default in-memory value is set to false.
“when”: {
“exists”: {
“field”: “$interface-name”,
“path”: “/interfaces/.key1.key2” ,
“in-memory”: true
}
}
“then”: {
“add-field”: [
“name”: “interface-meta-data”,
“value”: “/interfaces/.$interface-name.key2”,
“in-memory”: true
]
}
60

Add a Tagging Profile
You can use the Paragon Insights graphical user interface (GUI) to add static tagging and dynamic taggingprofiles.
Adding a Static Tagging Profile
To add a static tagging profile:
1. Navigate to Settings > Ingest.
The Ingest Settings page is displayed.
2. Click the Tagging Profile tab and then click the plus (+) icon to add a tagging profile.
The Create Tagging Profile page is displayed.
3. Enter the following information in the Create Tagging Profile page:
a. Enter a name for the tagging profile in the Profile Name text box.
The maximum length is 64 characters.
Regex pattern: “[a-zA-Z][a-zA-Z0-9_-]*”
b. Click the plus (+) icon under Policies to define a policy for this tagging profile.
You can define one or more policies.
The Policies section is displayed.
i. Enter a name for the new policy in the Policy Name text box.
The maximum length is 64 characters.
Regex pattern: “[a-zA-Z][a-zA-Z0-9_-]*”
ii. Enter a rule that you want to apply to this tagging profile. The rule can contain an fnmatchexpression.
You can apply one or more than one rule to a profile. A rule is any defined Paragon Insights rule.
c. Click the add (+) icon under Terms to define a list of conditions.
i. Enter a name for the match condition in the Term Name text box.
61
ii. Configure When and Then statements.
You can define tagging instructions in a Then statement. After the conditions that you set in aWhen statement aremet, the Then statement is implemented. Starting in Paragon Insights 4.2.0,When statements are mandatory in static tagging.
To configure a Then statement:
i. Click the plus (+) icon to add a key to the rules listed.
The Key Name and Value text boxes are displayed.
• Enter a name for the key in the Key Name text box.
The maximum length is 64 characters.
Regex pattern: “[a-zA-Z][a-zA-Z0-9_-]*”
This name is added as the key field for all rules configured within the tagging profile rulessection.
• Enter a value that you want to associate to the key, in the Value text box.
ii. Click the plus (+) icon to add a field to the rules listed.
The Field Name and Value text boxes, and the Type drop-down list are displayed.
• Enter the name in the Field Name text box.
• Enter a value in the Value text box.
• Select the field type from the Type drop-down list.
String type is selected by default.
Starting in Paragon Insights Release 4.2.0, you can also select unsigned integer as a namefield data type. An unsigned integer is a data type that can contain values from 0 through4,294,967,295.
• Click OK.
iii. Set the Evaluate next term flag to True to evaluate conditions in the next term. Evaluate nextterm only if the first condition is satisfied.
By default, the Evaluate next term flag is set to False.
4. Click Save to only save the configuration.
Click Save & Deploy to save and deploy the configuration immediately.
62

Adding a Dynamic Tagging Profile
To configure a dynamic tagging profile with Redis:
1. Navigate to Settings > Ingest.
The Ingest Settings page is displayed.
2. Click the Tagging Profile tab and then click the plus (+) icon to add a tagging profile.
The Create Tagging Profile page is displayed.
3. Enter the following information in the Create Tagging Profile page.
a. Enter a name for the tagging profile in the Profile Name text box.
The maximum length is 64 characters.
Regex pattern: “[a-zA-Z][a-zA-Z0-9_-]*”
b. Click the plus (+) icon under Policies to define a policy for this tagging profile.
You can define one or more policies.
The Policies section is displayed.
i. Enter a name for the new policy in the Policy Name text box.
The maximum length is 64 characters.
Regex pattern: “[a-zA-Z][a-zA-Z0-9_-]*”
ii. Enter a rule that you want to apply to this tagging profile. The rule can contain an fnmatchexpression.
You can apply one or more rules to a profile. A rule is any defined Paragon Insights rule.
c. Click the plus (+) icon under Terms to define a list of conditions.
i. Enter a name for the match condition in the Term Name text box.
ii. Configure When and Then statements:
You set conditions for a match in a when statement. To configureWhen statement,
i. Click the Edit (pencil) icon.
The When Condition page is displayed.
ii. Click + Add another when to view the Operator drop-down list.
63

iii. Select a boolean operation that you want to apply to incoming data from the Operatordrop-down list.
The Left Operand and Right Operand text boxes are displayed.
NOTE: + Add another when is automatically renamed to the operator conditionthat you selected.
• Enter the value of the left operand of assignment that you selected, in the Left Operandtext box.
You can use $ as prefix to populate database values. For example, $memory. However,using $ as prefix is not mandatory.
• Enter the value of the right operand of assignment that you selected, in the Right Operandtext box.
This value is populated from the Redis database.
• Set the Evaluate in Memory flag to True to populate data from the Redis database.
By default, the Evaluate in Memory flag is set to False. When the flag is set to false, datais populated from the TSDB.
• Click OK.
• Set the Evaluate next term flag to True to evaluate conditions in the next term. After thefirst condition is satisfied, the conditions in the next term are evaluated.
64

By default, the Evaluate next term flag is set to False.
You can define tagging instructions in a Then statement. After the conditions that you set in aWhen statement are met, the Then statement is implemented. Starting in Paragon InsightsRelease 4.2.0,When statements are mandatory in tagging profile.
To configure a Then statement:
i. Click the plus (+) icon to add a key to the rules listed.
The Key Name and Value text boxes are displayed.
• Enter a name for the key in the Key Name text box.
The maximum length is 64 characters.
Regex pattern: “[a-zA-Z][a-zA-Z0-9_-]*”
This name will be added as key field for all rules configured within the tagging profile rulessection.
• Enter a value that you want to associate with the key, in the Value text box.
ii. Click the plus (+) to add a text box to the rules listed.
The Field Name and Value text boxes, and the Type drop-down list are displayed.
• Enter the name in the Field Name text box.
• Enter a value in the Value text box.
• Select the field type from the Type drop-down list.
String type is selected by default.
Starting in Paragon Insights Release 4.2.0, you can also select unsigned integer as a namefield data type. An unsigned integer is a data type that can contain values from 0 through4,294,967,295.
iii. Set the Evaluate in Memory flag to True to populate data from the Redis database.
By default, the Evaluate in Memory flag is set to False.
iv. Click OK.
v. Set the Evaluate next term flag to True to evaluate conditions in the next term. The nextterm is evaluated only if the first condition is satisfied.
By default, the Evaluate next term flag is set to False.
4. Click Save to only save the configuration.
Click Save & Deploy to save and deploy the configuration immediately.
65
Apply a Tagging Profile
You can configure a tagging profile to insert fields, values, and keys into a Paragon Insights rule. You canalso set conditions that are checked against values stored in the times series database (TSDB) or Redisdatabase.
After you have created a tagging profile from the Paragon Insights graphical user interface (GUI), you canapply a tagging profile to:
• a new device
• to an existing device
• to a new device group
• to an existing device group
Follow these steps to apply a tagging profile.
To apply a tagging profile to a new device:
1. Navigate to Configuration > Device.
The Device Configuration page is displayed.
2. Click (+) icon to add a new device.
The Add Device(s) page is displayed.
3. After you have entered the necessary information to add a device, click the Tagging Profiles section.
4. Select the tagging profile you want to apply to the device, from the Tagging Profiles drop-down list.
5. Click Save to only save the configuration.
Click Save & Deploy to save and immediately deploy the new configuration.
To apply a tagging profile to an existing device:
1. Navigate to Configuration > Device.
The Device Configuration page is displayed.
2. Select the check box next to the name of the device and click Edit device.
The Edit “device” page is displayed.
3. Click the Tagging Profiles section to view the Tagging Profiles drop-down list.
66

4. Select the tagging profile you want to apply to the device, from the Tagging Profiles drop-down list.
5. Click Save to only save the configuration.
Click Save & Deploy to save and immediately deploy the new configuration.
To apply a tagging profile to a new device group:
1. Navigate to Configuration > Device Group.
The Device Group Configuration page is displayed.
2. Click the add (+) icon to add a new device group.
The Add Device Group page is displayed.
3. After you have entered the necessary information to add a device group, click the Tagging Profilessection.
4. Select the tagging profile you want to apply to the device, from the Tagging Profiles drop-down list.
5. Click Save to only save the configuration.
Click Save & Deploy to save and immediately deploy the new configuration.
To apply a tagging profile to an existing device group:
1. Navigate to Configuration > Device Group.
The Device Group Configuration page is displayed.
2. Select the check box next to the name of the device group and click the Edit device group icon.
The Edit “device” page is displayed.
3. Click the Tagging Profiles section to view the Tagging Profiles drop-down list.
4. Select the tagging profile you want to apply to the device group, from the Tagging Profiles drop-downlist.
5. Click Save to only save the configuration.
Click Save & Deploy to save and immediately deploy the new configuration.
67

NOTE:• When a device in a device group has a tagging profile applied to it, and the device group hasanother tagging profile applied to the whole group of devices, the tagging profile of the devicegroup is merged with the existing tagging profile of the device.
For example, D-A-Net is a device that is part of a device group called Group-D1. D-A-Net hasa tagging profile applied to it. There is another tagging profile applied on the device group,Group-D1, as well. In such a scenario, the tagging profile applied to the device group is mergedwith the tagging profile of the device, D-A-Net.
• When the tagging profile applied to the device group and the tagging profile applied to thedevice in the group renders the same output, the tagging profile of the device is preserved.
Release History Table
DescriptionRelease
Paragon Insights Release 4.0.0 supports dynamic tagging where conditions used in ParagonInsights tagging are checked against values that are stored in Redis database.
4.0.0
Paragon Insights Time Series Database (TSDB)
IN THIS SECTION
Historical Context | 69
TSDB Improvements | 70
Database Sharding | 70
Database Replication | 71
Database Reads and Writes | 72
Manage TSDB Options in the Paragon Insights GUI | 73
Paragon Insights CLI Configuration Options | 75
Paragon Insights (formerly HealthBot) collects a lot of data through its various ingest methods. All of thatdata is time sensitive in some context. This is why Paragon Insights uses a time series database (TSDB) to
68

store and manage all of the information received from the various network devices. This topic is providesan overview of the TSDB as well some guidance on managing it.
Historical Context
In releases earlier than HealthBot Release 3.0.0, there was one TSDB instance regardless of whether youran Paragon Insights as a single node or as amulti-node (Docker Ccompose) installation. Figure 4 on page 69shows a high-level view of what this looked like.
Figure 4: Single TSDB Instance - Releases earlier than HealthBot Release 3.0.0
g300
990
TSDB
Host 1
Service 1
Service n
Device-Group 1 Device-Group n
Host n
Service 1
Service n
Service 1
Service n
Service 1
Service n
Device-Group n+1 Device-Group n+n
This arrangement left no room for scaling or redundancy of the TSDB. Without redundancy, there is nohigh availability (HA); A failure left you with no way to continue operation or restore missing data. Addingmore Docker Compose nodes to this topology would only provide more Paragon Insights processingcapability at the expense of TSDB performance.
69

TSDB Improvements
To address these issues and provide TSDB high availability (HA), three new TSDB elements are introducedin HealthBot Release 3.0.0, along with clusters of Paragon Insights nodes* for the other Paragon Insightsmicroservices:
• “Database Sharding” on page 70– How many servers, or nodes, are available to store TSDB data andscale Paragon Insights?
• “Database Replication” on page 71– How many copies of your data do you want to keep?
• “Database Reads and Writes” on page 72– How is data written and read back from the TSDB? Whathappens when something goes wrong?
NOTE: *Paragon Insights uses Kubernetes for clustering its Docker-based microservices acrossmultiple physical or virtual servers (nodes). Kubernetes clusters consist of a primary node andmultiple worker nodes. During the healthbot setup portion of Paragon Insights multinodeinstallations, the installer asks for the IP addresses (or hostnames) of the Kubernetes primarynode and worker nodes. You can add as many worker nodes to your setup as you need, basedon the required replication factor for the TSDB databases. The number of nodes you deployshould be at least the same as the replication factor. (See the following sections for details).
For the purposes of this discussion, we refer to the Kubernetes worker nodes as Paragon Insightsnodes. The primary node is not considered in this discussion.
Database Sharding
Database sharding refers to selectively storing data on certain nodes. This method of writing data toselected nodes distributes the data among available TSDB nodes and permits greater scaling since eachTSDB instance then handles only a portion of the time series data from the devices.
To achieve sharding, Paragon Insights creates one database per device group/device pair and writes theresulting database to a specific (system determined) instance of TSDB hosted on one (or more) of theParagon Insights nodes.
For example, say we have two devices, D1 and D2 and two device groups, G1 and G2. If D1 resides ingroups G1 and G2, and D2 resides only in group G2, then we end up with 3 databases: G1:D1, G2:D1, andG2:D2. Each database is stored on its own TSDB instance on a separate Paragon Insights node as shownin Figure 5 on page 71 below.When a new device is on-boarded and placedwithin a device group, ParagonInsights chooses a TSDB database instance on which to store that device/device-group data.
70

Figure 5: Distributed TSDB
g300
991
Node n
Service 1 ... n
TSDB
Node 1
Service 1 ... n
TSDB
TSDBLoad
Balancer
MessageQueue
Node 2
Service 1 ... n
TSDB
MessageQueue
Figure 5 on page 71, above, shows 3 Paragon Insights nodes, eachwith a TSDB instance and other ParagonInsights services running.
NOTE:• A maximum of 1 TSDB instance is allowed on any given Paragon Insights node. Therefore, aParagon Insights node can have 0 or 1 TSDB instances at any time.
• A Paragon Insights node can be dedicated to running only TSDB functions. When this is done,no other Paragon Insights functions run on that node. This prevents other Paragon Insightsfunctions from starving the TSDB instance of resources.
• We recommend that you dedicate nodes to TSDB to provide the best performance.
• Paragon Insights and TSDB nodes can be added to a running system using the Paragon InsightsCLI.
Database Replication
As with any other database system, replication refers to storing the data in multiple instances on multiplenodes. In Paragon Insights, we establish a replication factor to determine howmany copies of the databaseare needed.
A replication factor of 1 only creates one copy of data, and therefore, provides no HA. When multipleParagon Insights nodes are available and replication factor is set to 1, then only sharding is achieved.
71

The replication factor determines the minimum number of Paragon Insights nodes needed. A replicationfactor of 3 creates three copies of data, requires at least 3 Paragon Insights nodes, and provides HA. Thehigher the replication factor, the stronger the HA and the higher the resource requirements in terms ofParagon Insights nodes. If you want to scale your system further, you should add Paragon Insights nodesin exact multiples of the replication factor, or 3, 6, 9, etc.
Consider an example where, based on device/device-group pairing mentioned earlier, Paragon Insightshas created 20 databases. The Paragon Insights system in question has a replication factor of 2 and has 4nodes running TSDB. Based on this, two TSDB replication groups are created; in our example they areTSDB Group 1 and TSDB Group 2. In Figure 6 on page 72 below, the data from databases 1-10 is beingwritten to TSDB instances 1 and 2 in TSDB group 1. Data from databases 11-20 is written to TSDBinstances 3 and 4 in TSDB group 2. The outline around the TSDB instances represents a TSDB replicationgroup. The size of the replication group is determined by the replication factor.
Figure 6: TSDB Databases
TSDB Instance 3 TSDB Instance 4TSDB Instance 1 TSDB Instance 2
g300
992
MessageQueue
TSDBLoad
Balancer
TSDB Group 1: Serving Databases 1-10
Database 1-10 Database 11-20
TSDB Group 2: Serving Databases 11-20
Database Reads and Writes
As shown in Figure 5 on page 71, Paragon Insights can make use of a distributed messaging queue. Incases of performance problems or errors within a given TSDB instance, this allows for writes to the databaseto be performed in a sequential manner ensuring that all data is written in proper time sequence.
All Paragon Insights microservices use standardized database query (read) and write functions that can beused even if the underlying database system is changed at some point in the future. This allows for flexibilityin growth and future changes. Other read and write features of the database system include:
72

• In normal operation, database writes are sent to all TSDB instances within a TSDB group.
• Database writes can be buffered up to 1GB per TSDB instance so that failed writes can be retried untilsuccessful.
• If problems persist and the buffer fills up, the oldest data is dropped in favor of new data.
• When buffering is active, databasewrites are performed sequentially so that new data cannot bewrittenuntil the previous write attempts are successful.
• Database queries (reads) are sent to the TSDB instance which has reported the fewest write errors inthe last 5 minutes. If all instances are performing equally, then the query is sent to a randomTSDBinstance in the required group.
Manage TSDB Options in the Paragon Insights GUI
TSDB options can be managed from within the Paragon Insights GUI. To do this, navigate to the Settings> System page from the left-nav bar, then select the TSDB tab from the left side of the page.
BEST PRACTICE: Adding, deleting, or dedicating TSDB nodes should be done during amaintenance window since some services will be restarted and the Paragon Insights GUI willlikely be unresponsive while the TSDB work is performed.
In Figure 7 on page 73 below, you can see that the current TSDB nodes and replication factor are shown.
Figure 7: TSDB System Settings
73
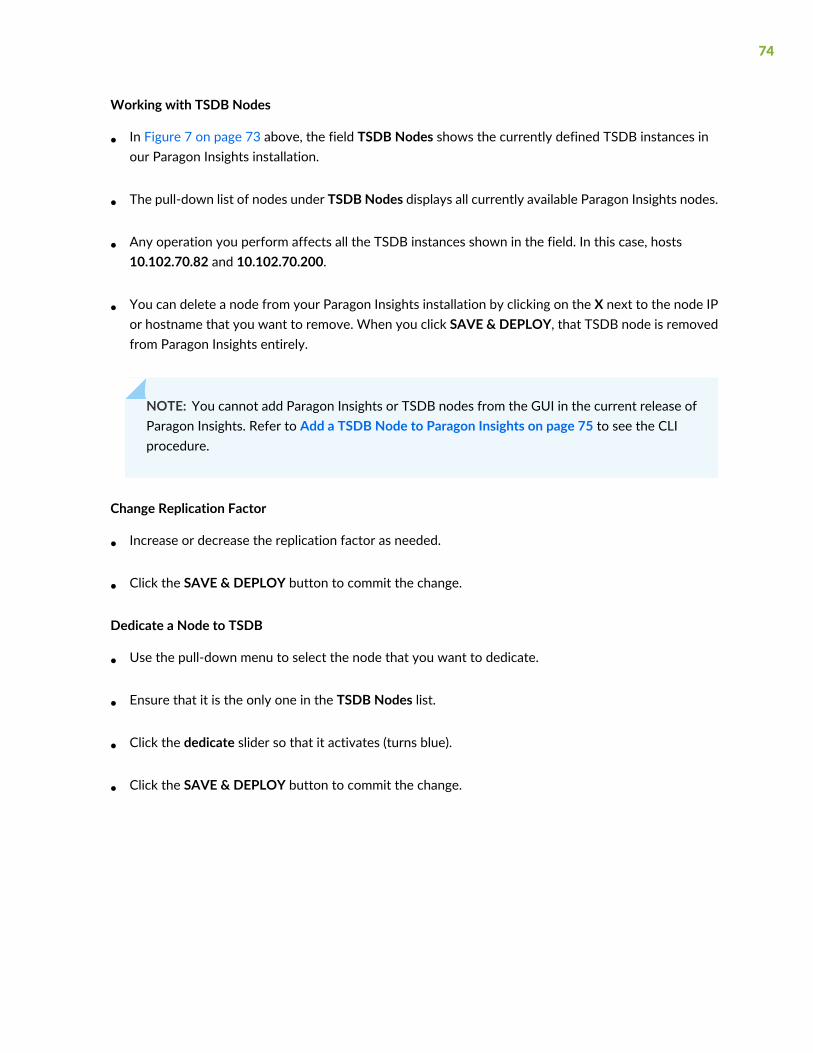
Working with TSDB Nodes
• In Figure 7 on page 73 above, the field TSDB Nodes shows the currently defined TSDB instances inour Paragon Insights installation.
• The pull-down list of nodes under TSDB Nodes displays all currently available Paragon Insights nodes.
• Any operation you perform affects all the TSDB instances shown in the field. In this case, hosts10.102.70.82 and 10.102.70.200.
• You can delete a node from your Paragon Insights installation by clicking on the X next to the node IPor hostname that you want to remove. When you click SAVE & DEPLOY, that TSDB node is removedfrom Paragon Insights entirely.
NOTE: You cannot add Paragon Insights or TSDB nodes from the GUI in the current release ofParagon Insights. Refer to Add a TSDB Node to Paragon Insights on page 75 to see the CLIprocedure.
Change Replication Factor
• Increase or decrease the replication factor as needed.
• Click the SAVE & DEPLOY button to commit the change.
Dedicate a Node to TSDB
• Use the pull-down menu to select the node that you want to dedicate.
• Ensure that it is the only one in the TSDB Nodes list.
• Click the dedicate slider so that it activates (turns blue).
• Click the SAVE & DEPLOY button to commit the change.
74
Force Option
Normally, a failure in a TSDB instance can be overcome using the buffering methods described above.
In the event of a catastrophic failure of the server or storage hosting a TSDB instance, you can rebuild theserver or damaged component. However, if the replication factor is 1, then the TSDB data for that instanceis lost. In that case, ou need to remove the failed TSDB node from Paragon Insights.
• Select the X next to the damaged node from the TSDB Nodes field.
• Click SAVE & DEPLOY.
• If a problem occurs and the removal is not successful, Click the force slider so that it activates (turnsblue).
This tells the system to ignore any errors encountered while adjusting the TSDB settings.
• Click the SAVE & DEPLOY button to commit the change.
Paragon Insights CLI Configuration Options
The Paragon Insights CLI provides a means to add and delete TSDB nodes from from the system and tochange the replication factor as a result.
Add a TSDB Node to Paragon Insights
# set healthbot system time-series-database nodes <IP address or hostname>
dedicate <true or false>
or
#set healthbot system time-series-database nodes [ space-separated list of
IP addresses or hostnames] dedicate <true or false>
Manage the Replication Factor
# set healthbot system time-series-database replication-factor
<replication-factor>
Set the replication factor to a multiple of the number of TSDB nodes present in the system. If you havetwo TSDB nodes, set the replication factor at 2, 4, 6, etc.
Usage Notes
75

• Paragon Insights performs a ping to determine if the new node(s) is reachable. A warning is shown if theping fails.
• The dedicate option specifies whether or not the TSDB nodes perform only TSDB functions.
RELATED DOCUMENTATION
Paragon Insights Installation Guide
Paragon Insights Machine Learning (ML)
IN THIS SECTION
Paragon Insights Machine Learning Overview | 76
Understanding Paragon Insights Anomaly Detection | 77
Understanding Paragon Insights Outlier Detection | 79
Understanding Paragon Insights Predict | 82
Paragon Insights Rule Examples | 84
Paragon Insights Machine Learning Overview
Paragon Insights (formerly HealthBot) uses machine learning to detect anomalies and outliers, and predictfuture device or network-level behavior. The machine learning-enabled Paragon Insights features include:
AnomalyDetection—Anomaly detection using the Paragon Insights Anomaly Detection algorithms involvescomparison of new data points with data points collected from the same device during a specificlearning period. Paragon Insights supports the following machine learning algorithms for anomalydetection:
• 3-sigma
• K-means
• Holt-Winters
76
Anomaly detection can be activated within Paragon Insights rules by setting a rule field’s ingest typeto formula, and then selecting anomaly detection. (Configuration > Rules > Fields tab > Ingest Type> Formula).
Outlier Detection—Outlier detection using the Paragon Insights Outlier Detection algorithms involvesanalysis of data from a collection of devices across your network during a specific learning period.Paragon Insights supports the following machine learning algorithms for outlier detection:
• Density-Based Spatial Clustering of Applications with Noise (DBSCAN)
• K-fold cross-validation using 3-sigma (k-fold/3-sigma)
Prediction—Prediction of future device or network-level behavior involves using the Paragon Insightsmedian prediction machine learning algorithm or, the Holt-Winters prediction algorithm.
Starting with HealthBot Release 3.1.0, you can choose the Holt-Winters prediction algorithm fromConfiguration > Rules > Fields > Ingest Type > Formula.
Understanding Paragon Insights Anomaly Detection
IN THIS SECTION
Field | 77
Algorithm | 78
Learning period | 78
Pattern periodicity | 79
This section describes the input parameters associated with Paragon Insights rules configured to detectanomalies using Anomaly Detection algorithms. Once the machine learning models are built, they can beused in production to classify new data points as normal or abnormal. The accuracy of the results increaseswith larger amounts of data.
Field
To apply a machine learning algorithm, you must first define the numeric data field on which to apply thealgorithm. For information on how to create a user-defined data field for a Paragon Insights rule, see theFields section in the Paragon Insights User Guide.
77

Algorithm
The Paragon Insights Anomaly Detection algorithms include Holt-Winters, 3-sigma and k-means:
Holt-Winters—The Holt-Winters algorithm uses traffic entropy measurements and seasonal variations intraffic to detect anomalous traffic flowing through an interface. The seasonality aspect provides ameans to de-emphasize normal increases and decreases in traffic that happen regularly over timeintervals. For example, network traffic in an enterprise network could be expected to have a weeklyseasonality since there would be significantly more traffic on the network during the work week thanon the weekend.
Since Holt-Winters can predict a traffic drop starting on Friday evening, an anomaly might be triggeredif traffic actually increased on Friday evening.
3-Sigma—The 3-sigma algorithm classifies a new data point as normal if it’s within 3 standard deviationsfrom the mean (average across all the data points in the data set). A new data point is classified asabnormal if it’s outside this range.
K-means—The Paragon Insights k-means algorithm uses k-means clustering and other building blocks tocreate a machine learning model for classifying new data points as normal or abnormal:
• K-means clustering splits n data points into k groups (called clusters), where k ≤ n. For ParagonInsights, k is set to 5 buckets.
• For forming the clusters, a 32-dimensional vector is considered for each point, thus taking intoaccount the trend (not just the current point, but its past 31 historical values).
• Each cluster has a center called the centroid. A cluster centroid is the mean of a cluster (averageacross all the data points in the cluster).
• All new data points are added to a cluster, however, if a data point is considered too far away fromthe centroid, it is classified as abnormal.
Learning period
The learning period specifies the time range to collect data from which the algorithm uses to build themachine learning models. Supported units of time for learning period include: seconds, minutes, hours,days, weeks, and years. Youmust enter the plural form of the time unit with no space between the numberand the unit. For example, a learning period of one hour must be entered as 1hours.
Paragon Insights builds machine learning models daily starting at midnight. For example, if the learningperiod is 5 days and triggered on 11th Feb 2019 00:00, then data collected from 6th Feb 2019 00:00 to11th Feb 2019 00:00 is used by Paragon Insights to build themachine learningmodels. For theHolt-Wintersprediction algorithm, the learning period must be at least twice the pattern periodicity to ensure there isenough of a pattern to learn.
78
Pattern periodicity
The pattern periodicity specifies the buckets for which data should be collected and used to build machinelearning models. Each bucket of data represents a user-defined time period and a specific pattern of data.A minimum number of data points is required for a machine learning algorithm to build a model:
• 3-sigma requires at least 10 data points per bucket of data.
• K-means requires at least 32 data points per bucket of data.
Supported units of time for pattern periodicity include: minutes, hours, days, weeks, andmonths. Youmustenter the plural form of the time unit with no space between the number and the unit.
For example:
• If the pattern periodicity is 1 day (entered as 1days), the data for each day of the week has a specificpattern. Paragon Insights creates 7 buckets of data and 7 different models, one for each day of theweek.
• If the pattern periodicity is 1 hour (entered as 1hours), regardless of the day, week, or month, the datafor every hour has a specific pattern. Paragon Insights creates 24 buckets of data and 24 differentmodels,one for each hour (00:00-00:59, 1:00-1:59, 2:00-2:59 … 23:00-23:59) of the day.
• If the pattern periodicity is 1 day 1 hour (entered as 1days 1hours), the data for every hour of each dayof theweek has a specific pattern. Paragon Insights creates 7 * 24 = 168 buckets of data and 168 differentmodels. 24 buckets for Monday (1 for every hour), 24 buckets for Tuesday (1 for every hour), and soon. In this case, it doesn’t matter from which month data is collected.
Understanding Paragon Insights Outlier Detection
IN THIS SECTION
Dataset | 80
Algorithm | 80
Sigma coefficient (k-fold-3sigma only) | 82
Sensitivity | 82
Learning period | 82
This section describes the input parameters associatedwith Paragon Insights rules used for outlier detectionalgorithms. Once the machine learning models are built, they can be used in production to identify timeseries data sets as outliers. The accuracy of the results increases with larger amounts of data.
79

The results of the Paragon Insights outlier detection algorithm are stored in a table in the times seriesdatabase. Each row in the table contains outlier detection output and metadata that is associated with aparticular time series. You can use the information in the table to configure Paragon Insights rule triggers.Each column in the table is identified by a unique name that starts with the user-defined outlier detectionfield name. For example, you can use the field-name-is-outlier and field-name-device column names toconfigure a trigger that detects outliers and produces a message that indicates which specific device wasdetermined to be the outlier. For more information, see the “Triggers” section of the “Paragon InsightsOutlier Detection Example” on page 93.
Dataset
For the outlier detection formula, input data is specified as a list of XPATHs from a variable. For informationon how to create a user-defined variable for a Paragon Insights rule, see the Variables section in the ParagonInsights User Guide.
The following is an example of a list of XPATHs:
/device-group[device-group-name=DG0]/device[device-name=D0]/topic[topic-name=T0]/
rule[rule-name=R0]/field[re=RE[01] AND hostname=1.1.1.*]/re-memory,/
device-group[device-group-name=DG0]/device[device-name=D1]/topic[topic-name=T0]/
rule[rule-name=R0]/field[re=RE[01] AND hostname=1.1.1.*]/re-memory
This path list specifies that on devices D0 and D1 in device-group DG0, get re-memory from topic T0 ruleR0, where the RE is either RE0 or RE1 and the hostname is in the 1.1.1.* block. This path allows for selectingdata at the field-key level, which is necessary because different field keys may have different purposes.
For example:
• On D0 and D1, with the field named “memory usage on routing engine,” keys RE0 and RE1 representtwo routing engines per device.
• There’s no guarantee that RE0 is a primary on all devices, therefore they might not be comparable whenchecking for outliers.
• This mechanism allows for selecting only the primaries: D0-RE0 and D1-RE1.
Algorithm
The outlier detection algorithms include k-fold, 3-sigma, and dbscan:
K-FoldCross-ValidationUsing 3-Sigma—K-fold cross-validation using the 3-sigma (k-fold 3-sigma) algorithmis used to create a machine learning model for identifying outliers. K-fold cross-validation splits theentire data set into k groups and uses the following general process to create the machine learningmodels:
80

• Each unique k group is used as a test data set.
• The k groups (that are not being used as a test data set) are used as the training data set to build amachine learning model.
• Each test data set is evaluated using its associated machine learning model.
• The test data set with themost outliers relative to their associatedmachine learningmodel is classifiedas an outlier.
For example, if k is the number of devices in a device group and the group has 4 devices, then k=4.For cross-validation, four machine learning models are built and the test data sets are evaluated asfollows:
• Model 1: Trained with the data points collected from device 1, device 2, and device 3, then testedwith the data points collected from device 4.
• Model 2: Trained with the data points collected from device 1, device 2, and device 4, then testedwith the data points collected from device 3.
• Model 3: Trained with the data points collected from device 1, device 3, and device 4, then testedwith the data points collected from device 2.
• Model 4: Trained with the data points collected from device 2, device 3, and device 4, then testedwith the data points collected from device 1.
Using the k-fold 3-sigma algorithm ismore applicable if it’s known that outliers will skew in one directionor another. If there are outliers on both sides of normal data points, or there are enough outlier datapoints to make the algorithm believe that nothing is outlying, then the k-fold 3-sigma algorithm willnot provide significant results.
DBSCAN—Density-Based Spatial Clustering of Applications with Noise (DBSCAN) is an unsupervisedmachine learning algorithm used to create a machine learning model for identifying time series datasets as outliers:
• Time series data sets are grouped in such a way that data points in the same cluster are more similarto each other than those in other clusters.
• Clusters are dense regions of time series data sets, separated by regions of lower density.
• If a time series data set belongs to a cluster, it should be near many other time series data sets inthat cluster.
• Time series data sets in lower density regions are classified as outliers.
Using the DBSCAN algorithm is more applicable if outliers appear inside the 3-sigma threshold of theother data points. DBSCAN can find outlying behavior that doesn’t appear as a significant deviationfrom the normal behavior at any given time step.
81

Sigma coefficient (k-fold-3sigma only)
The sigma coefficient is a thresholding argument (default value is 3). The thresholding argument determines,at each point in time for a series, how far away a value must be from the other values to be marked as anoutlier.
Sensitivity
Sensitivity is used to calculate the outliers, m, that the algorithm seeks to find in the data. Sensitivitydetermines the number of time series test data sets to return as outliers (the top m are returned):
• Sensitivity “low”: 0.03% of the number of sensors
• Sensitivity “medium”: 5% of the number of sensors
• Sensitivity “high”: 36% of the number of sensors
• Absolute percentage x: x*number of sensors (float, 0.0-1.0)
Learning period
See the “Learning period” on page 78 description of the “Understanding Paragon Insights AnomalyDetection” section.
Understanding Paragon Insights Predict
IN THIS SECTION
Field | 83
Algorithm | 83
Learning period | 83
Pattern periodicity | 83
Prediction offset | 83
This section describes the input parameters associated with Paragon Insights rules used for forecastingfuture values with the Paragon Insights median prediction machine learning algorithm or the Holt-Wintersprediction machine learning algorithm. Once the machine learning models are built, they can be used in
82
production to predict trends and forecast future values. The accuracy of the results increases with largeramounts of data.
Field
See the “Field” on page 77 description of the “Understanding Paragon Insights Anomaly Detection” section.
Algorithm
The Paragon Insights Predict feature uses either the median prediction algorithm, or the Holt-Wintersprediction algorithm.
The median value represents the midpoint for a range of values within a data sampling. For every patternperiodicity bucket, a median is calculated from the data samples available in the bucket.
Learning period
See the “Learning period” on page 78 description of the “Understanding Paragon Insights AnomalyDetection” section.
Pattern periodicity
See the “Pattern periodicity” on page 79 description of the “Understanding Paragon Insights AnomalyDetection” section. For the median prediction algorithm, we recommend a minimum number of 10 datapoints for building amachine learningmodel. For the Holt-Winters algorithm, the pattern periodicity shouldbe half or less of the learning period.
Prediction offset
The prediction offset value is a time in the future at which you want to predict a field value. For example,if the present time is 6th Feb 2019 10:00 and the prediction offset is set to 5 hours, then Paragon Insightswill predict a field value for 6th Feb 2019 15:00.
Supported units of time for prediction offset include: seconds, minutes, hours, days, weeks, and years. Youmust enter the plural form of the time unit with no space between the number and the unit. For example,a prediction offset of one hour must be entered as 1hours.
83

Paragon Insights Rule Examples
IN THIS SECTION
Paragon Insights Anomaly Detection Example | 84
Paragon Insights Outlier Detection Example | 93
The machine learning Paragon Insights rules described in this section are available for upload from theParagon Insights Rules and Playbooks GitHub repository.
Paragon Insights Anomaly Detection Example
IN THIS SECTION
Sensors (check-icmp-statistics) | 84
Fields (check-icmp-statistics) | 85
Variables (check-icmp-statistics) | 87
Functions (check-icmp-statistics) | 88
Triggers (check-icmp-statistics) | 88
Rule Properties (check-icmp-statistics) | 93
This example describes how the check-icmp-statistics Paragon Insights device rule is configured to sendICMP probes to user-defined destination hosts to detect anomalies when round trip average responsetime is above static or dynamic thresholds.
The following sections show how to configure the applicable input parameters for each Paragon Insightsrule definition block (such as, Fields, Variables, and Triggers) using the Paragon Insights GUI. For moreinformation about how to configure Paragon Insights rules, see Creating a New Rule using the ParagonInsights GUI.
Sensors (check-icmp-statistics)
Figure 8 on page 85 shows the general properties and iAgent sensor configured for the check-icmp-statisticsrule. For information about the count-var and host-var variables, see “Variables (check-icmp-statistics)”on page 87.
84

Figure 8: General properties (check-icmp-statistics) and Sensors definition (icmp)
Fields (check-icmp-statistics)
The following fields are configured for the check-icmp-statistics rule:
dt-response-time—(See Figure 9 on page 86) Configuration for anomaly detection using the k-meansalgorithm. When an anomaly is detected, Paragon Insights returns a value of 1.
rtt-average-ms—(See Figure 10 on page 86) Round trip average response time.
rtt-threshold—(See Figure 11 on page 87) Static threshold for the round trip average response time. Thertt-threshold variable populates this field.
85

Figure 9: Fields definition (dt-response-time)
Figure 10: Fields definition (rtt-average-ms)
86

Figure 11: Fields definition (rtt-threshold)
Variables (check-icmp-statistics)
The following three variables are configured for the check-icmp-statistics rule:
count-var—(See Figure 12 on page 87) ICMP ping count. Count is set to 1 by default.
host-var—(See Figure 13 on page 88) Destination IP address or host name where ICMP probes areperiodically sent.
rtt-threshold-var—(See Figure 14 on page 88) Static threshold value for round trip average response time.Threshold value is 1 ms by default. This variable populates the rtt-threshold field.
Figure 12: Variables definition (count-var)
87

Figure 13: Variables definition (host-var)
Figure 14: Variables definition (rtt-threshold-var)
Functions (check-icmp-statistics)
Figure 15 on page 88 shows the function configured for the check-icmp-statistics rule. This functionconverts the unit of measure for the round trip average response time frommicroseconds to milliseconds.
Figure 15: Functions definition (micro-milli)
Triggers (check-icmp-statistics)
The following triggers and terms are configured for the check-icmp-statistics rule:
• packet-loss — (See Figure 16 on page 89)
88

The following terms are configured for the packet-loss trigger:
is-device-not-reachable—(See Figure 17 on page 90) When the ICMP packet loss is 100%, the ParagonInsights health status severity level is set to major (red).
is-device-up—(See Figure 18 on page 90) When the packet loss is greater than 0, the severity level isset to minor (yellow).
no-packet-loss—(See Figure 19 on page 91) Otherwise, the severity level is set to normal (green).
• round-trip-time — (See Figure 20 on page 91)
The following terms are configured for the round-trip-time trigger:
is-rtt-fine—(See Figure 21 on page 92)When the host is not reachable or the round trip average responsetime is above the static threshold, the Paragon Insights health status severity level is set to major(red).
is-rtt-medium—(See Figure 22 on page 92) When an anomaly is detected using the anomaly detectionformula, Paragon Insights returns a value of 1 for the dt-response-time field, and the severity levelis set to minor (yellow). In this case, the response time is above the anomaly detection.
rtt-normal—(See Figure 23 on page 93) Otherwise, the severity level is set to normal (green).
Figure 16: Triggers definition (packet-loss)
89

Figure 17: Terms definition (is-device-not-reachable)
Figure 18: Terms definition (is-device-up)
90

Figure 19: Terms definition (no-packet-loss)
Figure 20: Triggers definition (round-trip-time)
91

Figure 21: Terms definition (is-rtt-fine)
Figure 22: Terms definition (is-rtt-medium)
92

Figure 23: Terms definition (rtt-normal)
Rule Properties (check-icmp-statistics)
Figure 24 on page 93 shows the rule properties configured for the check-icmp-statistics rule.
Figure 24: Rule Properties definition (check-icmp-statistics)
Paragon Insights Outlier Detection Example
IN THIS SECTION
Sensors (check-outlier) | 94
Fields (check-outlier) | 94
Variables (check-outlier) | 95
Triggers (check-outlier) | 95
Rule Properties (check-outlier) | 97
93
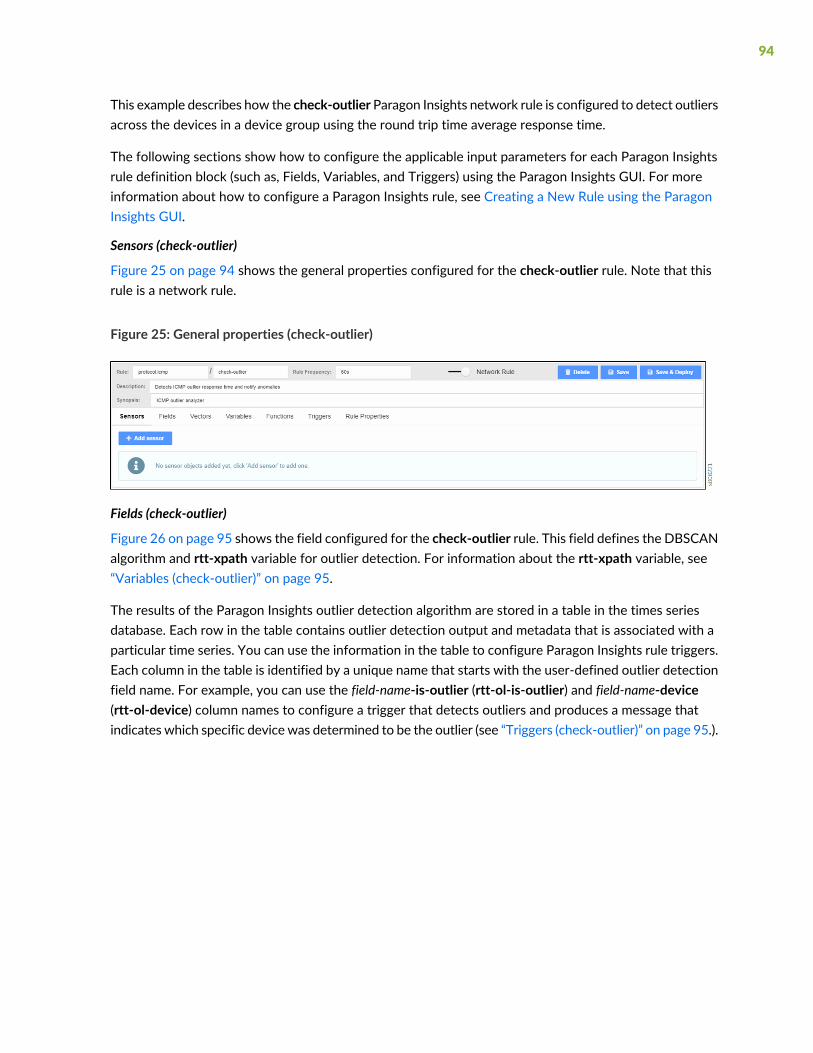
This example describes how the check-outlier Paragon Insights network rule is configured to detect outliersacross the devices in a device group using the round trip time average response time.
The following sections show how to configure the applicable input parameters for each Paragon Insightsrule definition block (such as, Fields, Variables, and Triggers) using the Paragon Insights GUI. For moreinformation about how to configure a Paragon Insights rule, see Creating a New Rule using the ParagonInsights GUI.
Sensors (check-outlier)
Figure 25 on page 94 shows the general properties configured for the check-outlier rule. Note that thisrule is a network rule.
Figure 25: General properties (check-outlier)
Fields (check-outlier)
Figure 26 on page 95 shows the field configured for the check-outlier rule. This field defines the DBSCANalgorithm and rtt-xpath variable for outlier detection. For information about the rtt-xpath variable, see“Variables (check-outlier)” on page 95.
The results of the Paragon Insights outlier detection algorithm are stored in a table in the times seriesdatabase. Each row in the table contains outlier detection output and metadata that is associated with aparticular time series. You can use the information in the table to configure Paragon Insights rule triggers.Each column in the table is identified by a unique name that starts with the user-defined outlier detectionfield name. For example, you can use the field-name-is-outlier (rtt-ol-is-outlier) and field-name-device(rtt-ol-device) column names to configure a trigger that detects outliers and produces a message thatindicates which specific device was determined to be the outlier (see “Triggers (check-outlier)” on page 95.).
94

Figure 26: Fields definition (rtt-ol)
Variables (check-outlier)
Figure 27 on page 95 shows the variable configured for the check-outlier rule. This variable defines thedevices in the network from which Paragon Insights collects round trip average response time data forthe outlier detection machine learning models.
Figure 27: Variables definition (rtt-xpath)
Triggers (check-outlier)
Figure 28 on page 96 shows the trigger configured for the check-outlier rule. The following terms areconfigured for the icmp-outlier-detection trigger:
is-outlier-detected—(see Figure 29 on page 96) When an outlier is detected, Paragon Insights returns avalue of 1 for the rtt-ol-is-outlier field, and the Paragon Insights health status severity level is set tomajor (red). This term also produces a message that indicates which specific device was determinedto be the outlier.
no-outlier—(See Figure 30 on page 97) Otherwise, Paragon Insights returns a value of 0, and the severitylevel is set to normal (green).
95

Figure 28: Triggers definition (icmp-outlier-detection)
Figure 29: Terms definition (is-outlier-detected)
96

Figure 30: Terms definition (no-outlier)
Rule Properties (check-outlier)
Figure 31 on page 97 shows the rule properties configured for the check-outlier rule.
Figure 31: Rule Properties definition (check-outlier)
Release History Table
DescriptionRelease
Starting with HealthBot Release 3.1.0, you can choose the Holt-Winters predictionalgorithm
3.1.0
97

Frequency Profiles and Offset Time
IN THIS SECTION
Frequency Profiles | 98
Offset Time Unit | 103
Frequency Profiles
Frequency profiles are a central location in which sensor and rule time frequencies can be managed. Tounderstand frequency profiles, consider the following.
When defining rules in Paragon Insights (formerly HealthBot) you can:
• Define multiple rules that use the same sensor
• Define different sensor frequencies for each of the rules
• Apply all of these rules to the same device group/devices
This creates complexity in rule application and frequency adjustments within the individual rules:
• A key, consisting of sensor-path for OpenConfig and Native GPB sensors, or the tuple of file and tablefor iAgent sensors is used to identify the specific rules.
• Paragon Insights takes the minimum defined frequency for that sensor from the applied rules and usesit to subscribe to, or fetch, data from the devices.
• This make it hard to identify what the data rate should be for that sensor. To do that, you would haveto go through the all the applied rules.
• A change in the sensor frequency of an applied rule might not take effect as intended.
To address these complexities, Paragon Insights needed a common place from which to control thesefrequencies.
Starting in HealthBot Release 3.0.0, frequency profiles can be created that allow you to manage sensorand rule frequencies from a single location and then apply the profiles in various locations in ParagonInsights. Application of these profiles allows for persistent and repeatable behavior in regard to frequenciesfor rules, sensors, triggers, formulas, references, learning periods, and hold times.
98

A sensor profile consists of a profile name and two optional sections: the sensors section and thenon-sensors section. In each section, an entry consists of a sensor or rule name and a frequency. Frequencyprofiles are applied to device groups or network groups.
The steps for configuration are shown below.
Configuration Using Paragon Insights GUI
Frequency profiles are configured and managed in the Paragon Insights GUI or in the Paragon InsightsCLI. In the GUI, they are managed by navigating to the Settings > Ingest Settings page and selecting theFrequency Profile tab from the left side of the page.
NOTE: While the sections of the frequency profile are both optional, at least one section mustbe filled out per frequency profile if you want the applied profile to be able to do anything.
Add a Frequency Profile
1. Click the + FREQUENCY PROFILE button
The Add Frequency Profile window appears.
2. Give the profile a name such as Profile1
3. (Optional) Click the + ADD SENSORS button.
4. In the Sensor Name field, enter the sensor name as per the following guidelines:
• OpenConfig Sensors: Enter the OpenConfig path for the desired sensor, such as /components or/interfaces.
• iAgent Sensors: Enter the table name used in the sensor definition, such as ChassisAlarmTable orREutilizationTable
• SNMP: Enter the sensor name such as npr_qmon_ext
• BYOI: Enter <topic-name/rule-name/sensor-name>, such as topic1/rule1/sensor1
5. In the Frequency field, enter the appropriate frequency, such as 30seconds, 1minute, 2hours, and soon.
6. (Optional) Click the + ADD NON-SENSORS button.
7. In the Rule Name field, enter the rule name such as check-chassis-alarms.
99

8. In the Frequency field, enter the appropriate frequency, such as 45seconds, 3minutes, 1hour, and soon.
Repeat steps 3 through 5 or 6 through 8 as desired for the profile.
An example result of the previous steps might look like:
Figure 32: Edit a Frequency Profile
9. Click the SAVE & DEPLOY button to save and deploy the profile.
The new sensor profile is added to the list.
To edit an existing frequency profile:
1. Click the <Profile Name> from the list.
2. Make the needed changes as shown in the previous section.
3. Click the SAVE button to save the profile for later deployment or the SAVE & DEPLOY button to saveand deploy immediately.
100

To delete an existing frequency profile:
1. Click the Trash Can icon to the right of the profile name.
2. Click the DELETE button to delete the profile but not deploy the change or the DELETE & DEPLOYbutton to delete and deploy immediately.
Usage Notes:
• Profile Entries–Multiple entries can be configured in each section as shown in Figure 32 on page 100.
• Override–Sensor or rule frequency defined within an applied frequency profile overrides those definedwithin the individual rule or sensor.
• Order of Precedence–If a sensor or rule is defined in multiple frequency profiles, each with differentfrequency settings, the minimum frequency value for the sensor or rule is used.
Configuration Using Paragon Insights CLI
In the Paragon Insights CLI, you can configure the same frequency profile described above. An exampleof the CLI configuration needed to complete the example above looks like:
user@mgd-69ab987fbc6-pt9sh> show configuration healthbot ingest-settings
frequency-profile Profile1
sensor /components {
frequency 60seconds;
}
sensor /interface {
frequency 30seconds;
}
non-sensor net-topic/net-rule {
frequency 2minutes;
}
Apply a Frequency Profile Using the Paragon Insights GUI
Frequency profiles are applied to Paragon Insights device groups or network groups. When you create oredit a device or network group, you apply frequency profiles by selecting them from the Ingest Frequencysection of the Device Group definition. Figure 33 on page 102 below shows an example of frequencyprofiles being applied to a device group.
101

Figure 33: Apply Frequency Profiles
Once you have applied the needed profiles, save and deploy the device group using the SAVE & DEPLOYbutton.
BEST PRACTICE: It is strongly recommended that you only apply frequency profiles to rulesthat make use of the Offset Time Unit feature.
102

Apply a Frequency Profile Using the Paragon Insights CLI
An example of a device group CLI configuration which includes a frequency profile and could be deployedin Paragon Insights is shown below.
user@mgd-69ab987fbc6-pt9sh> show configuration healthbot device-group lab-group
devices router1;
ingest-frequency Profile1;
Offset Time Unit
The Paragon Insights (formerly HealthBot) offset time unit is used in conjunction with the FrequencyProfiles to automatically manage time range calculations in various places within Paragon Insights rules.To understand the Paragon Insights offset function, consider the following scenario:
In Paragon Insights, you can define a rule which
• Uses a sensor to gather data with a frequency of 10 seconds
• Has a field that calculates the mean every 60 seconds
If you later decide to increase the frequency of the sensor to 60 seconds, then calculating the mean every60 seconds would not make any sense. The result is that you would have to manually update the fieldcalculation any time up want to change the sensor frequency.
Starting with HealthBot Release 3.0.0, you can set the time range for the mean calculation to a value of6o, or 6offset, rather than 60s, or 60 seconds. Using an offset time value rather than a static time valuetells Paragon Insights to automatically multiply the sensor frequency by the numeric value of the offset.Thus, any change to sensor frequency will automatically be included in the time range calculation for aformula.
An offset time unit can be used in place of standard time units in the following time range locations:
• Formulas
• References
• Vectors
• Trigger Frequency
• Trigger Term
Below we discuss GUI and CLI examples of how to configure the offset time unit in each of the locationsmentioned above.
103
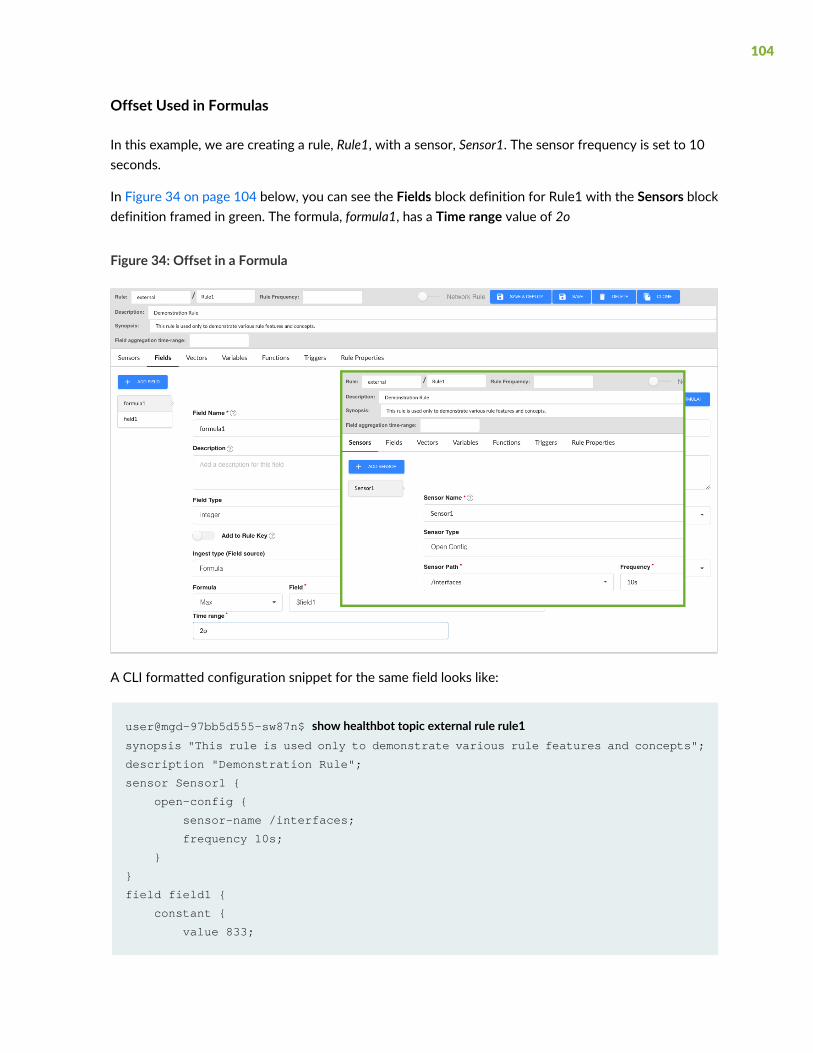
Offset Used in Formulas
In this example, we are creating a rule, Rule1, with a sensor, Sensor1. The sensor frequency is set to 10seconds.
In Figure 34 on page 104 below, you can see the Fields block definition for Rule1 with the Sensors blockdefinition framed in green. The formula, formula1, has a Time range value of 2o
Figure 34: Offset in a Formula
A CLI formatted configuration snippet for the same field looks like:
user@mgd-97bb5d555-sw87n$ show healthbot topic external rule rule1synopsis "This rule is used only to demonstrate various rule features and concepts";
description "Demonstration Rule";
sensor Sensor1 {
open-config {
sensor-name /interfaces;
frequency 10s;
}
}
field field1 {
constant {
value 833;
104

}
type integer;
}
field formula1 {
formula {
max {
field-name "$field1";
time-range 2o;
}
}
type integer;
}
Usage Notes for Offset Used in Formulas
• An offset value applied to the time range of a formula multiplies the rule, sensor, or trigger frequencyof that rule.
• The result of this example is that the time range for theMax formula is now 2 times the Sensor1 frequencyof 10 seconds, or 20 seconds (2 * 10s = 20s).
• If a frequency profile of 30 seconds is applied to the rule used in the example, then the resultingtime-range would be 60 seconds (2 * 30s = 60s).
• Offset time can be applied to the following formulas: latest, count, min, max, sum, mean, on-change, andstdev.
Offset Used in References
In this example, there are two rules in play, but only one is shown. The unseen rule, Rule1, is in the topicrouting-engines and is named routing-engines (routing-engines/routing-engines). Rule1 has a frequencyof 20 seconds. Rule1 is referenced .
Rule2, shown in Figure 35 on page 106, is a network rule which has a reference field named ref1. The field,ref1, references back to Rule1 through the Reference XPath Expression with a Time Range setting of3offset.
105

Figure 35: Offset Time Used in Reference Field
Usage Notes for Offset Used in References
• Offset values used in references multiply the frequency of the referenced rule by the offset value. Inthis case, the 20 second frequency of Rule1 is multiplied by 3, resulting in a 60 second time-range (3 *20s = 60s).
• If a frequency profile of 60 seconds (60s) was applied to Rule1, the time range for the reference wouldincrease to 180 seconds (3 * 60s = 180s).
Offset Used in Vectors
In this example, there are 3 rules at play. Rules Rule1 and Rule2 are not shown but are referenced by thevector.
Rule1 is in topic line-cards and is named line-cards (line-cards/line-cards) and has a frequency of 20 seconds(20s).
Rule2 is in topic routing-engines and is named routing-engines (routing-engines/routing-engines) and hasa frequency of 30 seconds (30s).
106

In Rule3 below, we have defined a vector, vector1 that consists of 2 path references and 1 field. The vectorhas a TimeRange defined as 3offset. Figure 36 on page 107 shows the vector block definition in the ParagonInsights GUI.
Figure 36: Offset Time Used in Vector Block
Usage Notes for Offset Used in Vectors
• An offset value defined in the time range of a vector multiplies the sensor or rule frequency of thereferenced rule or sensor. If a field from the same rule is used as the reference, then the frequency ofthe rule containing the vector is used.
• When multiple references or fields are defined for a vector and offset time is used, the offset value isapplied to each path independently. So, for this example in which our offset value is 3 (3offset):
• The path reference to Rule1: “/device-group[device-group-name='Core4']/device[device-id='R1']/topic[topic-name='line-cards']/rule[rule-name='line-cards']/memory” which has a frequency of 20seconds, would result in a time range of 60 seconds for the vector (3 * 20s = 60s).
• The path reference to Rule2: “/device-group[device-group-name='Core4']/device[device-id='R1']/topic[topic-name='routing-engines']/rule[rule-name='routing-engines']/field[slot='0']/ref1” whichhas a frequency of 30 seconds, would result in a time range of 90 seconds for the vector (3 * 30s =90s).
NOTE: There are no spaces or line breaks in the path references. They are added to thisdocument only to enhance readability.
107

• The field reference to formula1: Since formula1 is a normal field used within the vector block, the rulefrequency of the current rule is used as a basis. So, the time range for formula1 is 30 seconds (3 * 10s= 30s).
• If a frequency profile of 60 seconds is applied to Rule1 (line-cards/line-cards), then the time range forthat path in the vector would be 180 seconds (3 * 60s = 180s).
• If a frequency profile of 120 seconds is applied to Rule2 (routing-engines/routing-engines), then thetime range for that path in the vector would be 360 seconds (3 * 120s = 360s).
• The time range for the field reference, formula1, would remain the same as before at 30 seconds unlessa change is made to Rule3 or a frequency profile with a different time is applied to Rule3.
Offset Used in Triggers
In this example, we have one rule, Rule1. Figure 37 on page 108 below shows the trigger block definitionwith the sensor block definition overlaid with a green border.
The rule, Rule1, has a sensor frequency of 10 seconds (10s) applied.
The trigger itself, Trigger1, has an offset frequency of 2 (2o) applied.
The trigger term, term1, has its own time range offset of 2 (2o) applied as well.
Figure 37: Offset Time Used in Trigger Block
108

Usage Notes for Offset Time Used in Triggers
• An offset value defined in trigger frequency multiplies the sensor or rule frequency. So, the offset valueof 2 in trigger1 causes the trigger frequency to be interpreted as 20 seconds (2 * 10s = 20s) because thesensor frequency of the rule is used as the basis.
• An offset value defined in a trigger term multiplies the trigger frequency value. So, the offset value of2 in term1 causes the term frequency to be interpreted as 40 seconds (2 * 20s = 40s).
Offset Used in Trigger Reference
In this example, we have 2 rules in the topic external, and one frequency profile, prof1.
The rules are:
• external/test: The test rule has a sensor named components which is anOpenConfig sensor with a sensorpath of /components and a sensor frequency of 10 seconds.
It also has a trigger, trig1with a frequency of 2o or 2offset. The trigger has a term named Term_1, whichis not used in the example.
109

• external/ref: The ref rule is a non-sensor rule, which means that the rule uses a reference field,trigger_reference, to reference the sensor defined in another rule; in this case external/test.
And the frequency profile is:
110

• prof1: The prof1 profile sets the frequency for the /components sensor at 30 seconds.
111

2CHAPTER
Paragon Insights Management andMonitoring
Manage Paragon Insights Users and Groups | 114
Manage Devices, Device Groups, and Network Groups | 127
Paragon Insights Rules and Playbooks | 143
Monitor Device and Network Health | 172
Understand Resources and Dependencies | 206
About the Resources Page | 209
Add Resources for Root Cause Analysis | 212
Configure Dependency in Resources | 215
Example Configuration: OSPF Resource and Dependency | 219
Edit Resources and Dependencies | 229
Filter Resources | 232
Delete Resources and Dependencies | 233
Grafana Overview | 235

Understanding Action Engine Workflows | 238
Manage Action Engine Workflows | 239
Alerts and Notifications | 247
Generate Reports | 261
Manage Audit Logs | 272
Configure a Secure Data Connection for Paragon Insights Devices | 275
Configure Data Summarization | 278
Modify the UDA, UDF, and Workflow Engines | 288
Commit or Roll Back Configuration Changes in Paragon Insights | 295
Logs for Paragon Insights Services | 298
Troubleshooting | 300
Paragon Insights Configuration – Backup and Restore | 309

Manage Paragon Insights Users and Groups
IN THIS SECTION
Default User and First Login | 115
Default User Roles | 116
User Management | 116
Group Management | 120
LDAP Authentication in Paragon Insights | 122
Password Recovery | 125
Limitations | 126
HealthBot Release 3.0.0 employs role-based access control (RBAC) to control access to the user interface,and tools and objects. RBAC is applied to user groups that are made up of a list of users.
The use of access controls within Paragon Insights (formerly HealthBot) allows you to grant one group ofusers, like operators, read-only access to certain pages like Configuration > Device Configuration; whilegranting a different group of users, like administrators, read-write access to that same page.
Starting with Release 4.0.0, Paragon Insights executes user management, authentication, and authorizationthrough Identity and Access Management (IAM) service available in the 4.0.0 installation package.,
There are no changes in the installation process. See Paragon Insights Installation Guide for installation ormigration procedure.
In new installations of Paragon Insights Release 4.0.0, a user can be registered through e-mail. This modeof registration requires you to perform additional steps at the time of installation. For existing ParagonInsights installations, you can register new users with username, without including an e-mail address. Formore information on first login, see “Default User and First Login” on page 115.
NOTE: Starting from Paragon Insights Release 4.1.0, username is case insensitive.
In Paragon Insights, there are two administrators: one is the default admin user who first logs into Insightsafter a new installation. The admin user has complete control over all of Insight’s access controls. The otheris sp-admin user who is created in the Paragon Insights interface. To know more about roles in ParagonInsights, see “Default User Roles” on page 116.
114

Paragon Insights 4.0.0 also supports Lightweight Directory Access Protocol (LDAP) based authentication.The authorization data such as organizational ID, username, and password are stored andmanaged in IAM.For more information, see “LDAP Authentication in Paragon Insights” on page 122.
Default User and First Login
In standalone Paragon Insights installations, the default username and password are set as admin andAdmin123!, respectively. The admin user has complete control over all of Paragon Insights’ access controls.The credentials above are used for the first login at theURL https://<Paragon Insights hostnameor IP>:8080.
Upon successful first login and before the admin user is granted access to the GUI, they are required tocreate a new password. The Set Passwordwindow pops up and provides instructions regarding passwordlength, capitalization, special characters, and so on. Once you save this password, a pop-upwindow notifiesyou that the password has been changed. From this time forward, the admin user logs in with the newpassword.
If Paragon Insights is migrated from 3.x.x or earlier versions to 4.0.0 version, the admin user creates otherusers and assigns them roles and an initial password in the Administration > User Management page. Theusers created with sp-admin and sp-operator roles can login for the first time with their username byentering the initial password provided by the admin user.
NOTE: All users must change their password after the first login.
To change password:
1. Click the circle with the first letter of your username at the top right corner of the interface.
2. Click change password in the drop-down menu.
A Change Password window appears.
3. Enter your current password. Enter your new password and re-enter your new password to confirm.
Passwords must be at least 8 characters long and must contain uppercase letters, lowercase letters,numbers, and special characters.
4. Click OK.
A window notifies that your password is changed successfully.
115

Starting with standalone Paragon Insights 4.0.0 installations, the admin user can register a user with ane-mail address if Insights is configured for this registration method during installation. The registered usergets a login link in their inbox that expires after 24 hours. When they click on the link, a Set Passwordwindow appears where they can set a new password before they log into Paragon Insights.
Default User Roles
In Paragon Insights 4.0.0, the hbadmin group in earlier releases is converted to the sp-admin role whereasthe hbmonitor, hbconfig, and hboperator groups are merged into the sp-operator role.
Paragon Insights is shipped with two pre-defined user roles:
• sp-admin—The user gets read andwrite access to add resources such as device groups, network groups,rules and playbooks, configure data summarization profiles, create backup of Insights configuration ortime series database, and the ability to manage users and groups.
• sp-operator — Provides login capability and the ability to read-only access to read and observe anyconfigured entity in Insights.
None of the pre-defined user roles can be changed or removed.
User Management
The User Management page is the first page shown when you navigate to Administration > UserManagement from the left navigation bar. This page is used to:
• View a list of current Paragon Insights users
The list shows user details including username, role, status, and provider type. User status can be active(green) or inactive (red).
• Add new users
Click the + to bring up the Create User window. Enter the following details.
NOTE: In Paragon Insights Release 4.0.0, an sp-admin canmap a user to a role without creatinguser groups. The sp-admin can also create user groups, associate roles to user groups and then,add users to the user groups.
116

Table 6: Create User Fields for Installations without E-mail Registration
DescriptionFields
Enter a username ofmaximum32 characters. The username is used to log into the ParagonInsights portal.
NOTE: Starting from Paragon Insights Release 4.1.0, username is case insensitive.
Username
Enter the first name of the user. You cannot exceed 32 characters.First Name
Enter the last name of the user. You cannot exceed 32 characters.Last Name
Enable or disable the user. If you disable the user, they cannot log into the Paragon Insightsportal.
Status
There are two provider types — Local (IAM) and LDAP.
You can choose Local to configure users in IAM or choose LDAP to map user to LDAPuser group.
Provider Type
If you choose the provider type as LDAP, you can enter the LDAP user group name inthis field.
(Optional) MappingProvider Group
Enter a password for the user.
Passwordsmust be at least 8 characters long andmust contain uppercase letters, lowercaseletters, numbers, and special characters.
A password must be unique and must not be previously used passwords.
Password
Select multiple roles at the left-side panel and click the right arrow button to add the rolesto the user.
The roles are sp-admin, sp-operator, or a custom role with select create, read, update,and delete access permissions.
Role
If you configured Paragon Insights to register users using e-mail address, you must configure SMTPsettings in the portal before adding users.
To configure SMTP settings:
1. Select Administration > SMTP Settings.
The SMTP Settings page appears. Fill in the details described in Table 7 on page 118.
117

Table 7: Fields in SMTP Settings
DescriptionFields
Enter the SMTP server address.
For example, smtp.domain.com
Server Address
Toggle the switch on to enable TLS, if you want to encrypt the e-mails sent to yourusers’ account from Paragon Insights.
TLS
Enter the port number.
The standard port number is set to 25 if TLS is disabled and is set to 587 if you enableTLS in SMTP settings.
Port Number
SMTP Authentication
Enable SMTP authentication to allow only verified users to send e-mails to or receivee-mails from the Paragon Insights application.
SMTP Authentitcation(Optional)
Enter the username to be used for authentication. The username must not exceed32 characters.
NOTE: Starting from Paragon Insights Release 4.1.0, username is case insensitive.
Username
Enter a password.Password
Re-enter the password.Confirm Password
If you did not enable SMTP authentication, then you must enter this field.
This name appears as sender’s name to the e-mail recipients.
From Name
Enter the e-mail address from which messages from Paragon Insights must be sentto recipients.
The syntax is [email protected]
From Email Address
Test SMTP Settings
Enter your e-mail adress to check if SMTP settings configured in previous fields workas intended.
Click Send Test Email. If you receive an e-mail from Paragon Insights in the inbox ofthe e-mail address entered in this field, then you have successfully configured SMTPsettings.
Email Address
118
2. Click Save.
The SMTP Settings for Paragon Insights is complete. You can now register users using their e-mailaddress.
To register a user using e-mail address:
1. Select Administration > User Management > User in the left navigation bar.
The Users page appears.
2. Click on the + icon to add a new user.
The Create User page appears. Fill in the following details.
Table 8: Create User Fields for Installations with E-mail Registration
DescriptionsFields
Enter the first name of the user. You cannot exceed 32 characters.First Name
Enter the last name of the user. You cannot exceed 32 characters.Last Name
Enable or disable the user. If you disable the user, they cannot log into the ParagonInsights portal.
Status
Enter the e-mail address of the user that will be used to log into the Paragon Insightsportal.
Username (E-mail)
Select multiple roles at the left-side panel and click the right arrow button to add theroles to the user.
The roles are sp-admin, sp-operator, or a custom role with select create, read, update,and delete access permissions.
Role
3. Click OK.
The user you added is listed in the Users page.
• Edit existing users
Select an existing user by clicking anywhere on that user’s line in the list. Then click the Edit User (Pencil)icon to bring up the Edit User window. You can change any parameter except the username and theProvider Type.
• Delete a user
119

Select an existing user by clicking anywhere on that user’s line in the list. Then click the Delete User(Trash Can) icon. Confirm the action and the user is deleted.
NOTE:• If you set a user’s status to inactive or delete that user, they are immediately prevented fromlogging in to Paragon Insights through the login page.
You can also export (backup) user configurations and restore the configurations in Paragon Insights. Thebackup and restore feature is not applied to pre-canned roles. For more information, see “Paragon InsightsConfiguration – Backup and Restore” on page 309.
Group Management
A user group is a collection of roles to which a Paragon Insights user can be assigned. The roles within auser group define the access (read-only or read-write) that all members of the group have in common. Inother words, user groups are where RBAC controls are applied.
The User Groups page is accessed by navigating to Administration > User Management from the left-navand selecting User Groups on the left side of the User Management page.
• View a list of current Paragon Insights user groups
The list shows user group details including group name and description.
• Add new user groups
Click the + to bring up the Add Group window.
Starting in HealthBot Release 3.1.0, RBAC has been enhanced to include the roles selector helper. Theroles selector helper appears when you add or edit a user group. See Figure 38 on page 121.
120

Figure 38: Add User Group
• Edit existing user groups
Select an existing user group by clicking anywhere on that group’s line in the list. Then click the EditUser (Pencil) icon to bring up the Edit <groupname> window.
121

NOTE: When you add or edit a user group, the window has sections called System Roles andGUI Roles under the Selected Roles pull-down. These sections show the specific read-only(R) or read-write (W) permissions that are assigned to the group as a result of the selectionsmade in the ROLES SELECTOR HELPER.
• Delete a user group
Select an existing user group by clicking anywhere on that group’s line in the list. Then click the DeleteUser (TrashCan) icon. A confirmationwindow appears. Confirm the action (Save andDeploy) to completethe deletion. The pre-defined user groups hbdefault and hbadmin cannot be deleted.
WARNING: Adding and editing user groups in Paragon Insights is an advanced featurethat requires a deep understanding of the available roles and how they apply to RBAC.We recommend that you use only the Role Selector check-boxes to add or removepermissions. We do not recommend that you add or remove individual system or GUIroles.
LDAP Authentication in Paragon Insights
LDAP users can access Paragon Insights GUI after an sp-admin configures LDAP settings in Paragon Insightsand maps LDAP user group to Paragon Insights user group. In Paragon Insights Release 4.0.0, ActiveDirectory installed onWindows Server 2012 R2 and OpenLDAP version 2.4 as the protocol are validatedfor LDAP implementation.
A typical workflow of LDAP-based authentication involves the following steps.
1. An LDAP administrator configures LDAP group in an external server and adds users to the LDAP group.
2. Sp-admin creates user group for LDAP users in Paragon Insights Release 4.0.0 interface and assignsroles to the created user group.
NOTE: The Paragon Insights user group and LDAP user group must have the same name.
3. Sp-admin configures LDAP settings in Paragon Insights and maps the Paragon Insights user group tothe LDAP user group in the Paragon Insights GUI.
122

4. Upon successful authentication, the LDAP server produces a list of LDAP groups associated with theuser.
The IAM service checks for the corresponding group name in Paragon Insights and generates rolesassociated with the Paragon Insights user group.
5. The IAM service converts the roles into a JSONWeb Token (JWT) that is used for authorizing theLDAP user in Paragon Insights.
NOTE: If a user is configured both in LDAP and IAM (locally), then LDAP takes priority overIAM during authentication. When the user tries to login, Paragon Insights checks the userdetails first in LDAP and then in IAM.
To configure LDAP settings in Paragon Insights:
1. Click Administration > Authentication > LDAP Settings option in the left navigation bar.
2. Enter the necessary fields in the LDAP Settings page.
The following table describes the attributes in the LDAP Settings page.
Table 9: Configure LDAP to Integrate with Paragon Insights
DescriptionAttributes
LDAP Server
Enter the LDAP server url.
For example, ldap.example.net.
Server Address
Enable SSL to encrypt the LDAP channel.SSL
Enter the port number for the LDAP server.
The default port number if SSL is enabled is 636 and the default port without SSLis 389.
Port Number
LDAP Authentication
The authentication method is set to Simple. The password sent from the client tobind to the LDAP server is plain text.
Authentication Method
Enter the domain name that constitutes the search base for querying the LDAPserver.
For example: dc=mycompany, dc=net/com.
Base Domain Name
123

Table 9: Configure LDAP to Integrate with Paragon Insights (continued)
DescriptionAttributes
Enter the user name configured for LDAP authentication.
For example: [email protected].
Bind Domain Name
Enter a password for LDAP authentication.Bind Password
User Options (Optional)
Setting a user attribute is optional. This filter improves the search functionalityon the LDAP server using the specified attribute name.
User Attribute
Specify the objectClass attribute to filter the type of entities that can accessParagon Insights.
For example, Person as a user filter.
User Filter
3. Click Save.
The configuration settings of LDAP server in Paragon Insights is complete.
After configuring LDAP settings, the sp-admin must create an LDAP user group in Paragon Insights to mapthe users created in LDAP server to Paragon Insights. The LDAP group created in Paragon Insights allowsadministrators to map roles for LDAP users.
To map an LDAP group to Paragon Insights user group:
1. Click Administration > User Management > User Groups option in the left navigation bar.
The User Group page appears.
2. Click the plus icon to create a new user group.
The Create User Group page appears.
3. Enter a group name and select Provider Type as LDAP from the drop down menu.
TheMapping Provider Group section appears.
4. In theMapping Provider Group field, enter the LDAP group name.
5. Select the roles to be associated with the LDAP group in Paragon Insights and click OK.
The users configured in LDAP server can log into Paragon Insights by entering their LDAP credentials. Theresources and pages accessible to the LDAP user depends on the permissions granted in the role mappedthrough Paragon Insights.
124
Password Recovery
The default admin user does not require an e-mail address to access the interface in standalone deployment.If the initial password set by an admin user is lost, it can be recovered by a system administrator who hasaccess to the physical server or virtual machine that hosts the Paragon Insights application. The systemadministrator has to run the following curl command in any shell in one of the nodes in the Kubernetescluster.
Curl command to reset Paragon Insights admin user credential using IAM service token.
curl -k --request POST 'https://{{server-ip}}:{{port}}/iam/reset-password' --header 'x-service-token:'$(kubectl get secret -n {{namespace}} $(kubectl get sa -n {{namespace}} iam -o jsonpath='{.secrets[0].name}')-o jsonpath='{.data.token}' | base64 --decode)'' --header 'x-service-scope: {}' --header 'Content-Type:application/json' --data '{"user_name" : "{{username}}","new_password" : "{{password}}"}'
The IAM service validates the token and resets the password for the admin user.
NOTE: The port number for standalone Paragon Insights deployment is 8080 and the namespaceis healthbot.
There is currently no self-service type of lost password mechanism for users registered without an e-mailaddress. Password reset must be done manually by an administrator with read-write access to the UserManagement page. The administrator must edit the user, change the password, and then notify the userby appropriate means.
To recover password of user accounts registered with e-mail address:
1. Enter your username (e-mail address) in the Paragon Insights login page.
2. Place the cursor in the password field.
The Forgot Password? link appears beneath the Log in button.
3. Click on the Forgot Password? link.
A Forgot Password window appears displaying the message that an e-mail with link to reset passwordis sent to your account.
125

4. Click on the Reset your password button in your account recovery e-mail.
The reset password link expires after 24 hours.
5. In the Set Password window, enter a new password and enter the same password in the ConfirmPassword field.
Passwords must be at least 8 characters long and must contain uppercase letters, lowercase letters,numbers, and special characters.
A password must be unique and must not be previously used passphrases.
6. Click OK.
Youwill receive a second e-mail notifying you that your password is changed. Log into Paragon Insightsusing your latest password.
Limitations
In HealthBot Release 3.1.0, the RBAC implementation is limited in some ways:
• The available roles, such as R-Devices, W-Devices, R-Datastore, etc. are all pre-defined. There is noway to add new roles or delete existing roles.
• All roles are endpoint driven, not specific to any resource. This means that if you have read permissionfor devices, you can read all devices in the system. There is no means to restrict the read access to asubset of devices.
• Roles are permissive in nature. You cannot create a role that blocks access to any given endpoint suchas rules. If a user is created but not given any group membership, they will not be able to access theParagon Insights GUI.
• RBAC is currently limited to API service. This means that if you have read-only access to a page such asConfiguration >Devices, you can see the entire page and interact with all of its controls. You could evengo through the motions of creating a device in the GUI. However, when you click SAVE or SAVE &DEPLOY an API is called and it will recognize that you do not have the required permission to create adevice. Errors are displayed at that time.
• If you migrate data from your existing 2.1.X installation to your 3.0.0 or later installation, user data isnot migrated. Any existing users must be recreated manually, by the admin user, after migration.
126

Release History Table
DescriptionRelease
Starting with Release 4.0.0, Paragon Insights executes user management, authentication, andauthorization through Identity and Access Management (IAM) service available in the 4.0.0installation package.
4.0.0
Starting in HealthBot Release 3.1.0, RBAC has been enhanced to include the roles selectorhelper
3.1.0
HealthBot Release 3.0.0 employs role-based access control (RBAC) to control access to theuser interface, and tools and objects.
3.0.0
RELATED DOCUMENTATION
Paragon Insights API Guide
ManageDevices,DeviceGroups, andNetworkGroups
IN THIS SECTION
Adding a Device | 128
Editing a Device | 133
Adding a Device Group | 133
Editing a Device Group | 139
Configuring a Retention Policy for the Time Series Database | 139
Adding a Network Group | 140
Editing a Network Group | 142
Use the appropriate Configuration pages from the left-navigationmenu tomanage devices, device groups,and network groups. Paragon Insights (formerly HealthBot) supports both Junos devices by default andthird party vendor devices with the required license installed. Youmust add a device to one or more devicegroups or create a network group before you can apply Paragon Insights rules and playbooks to a device.
127
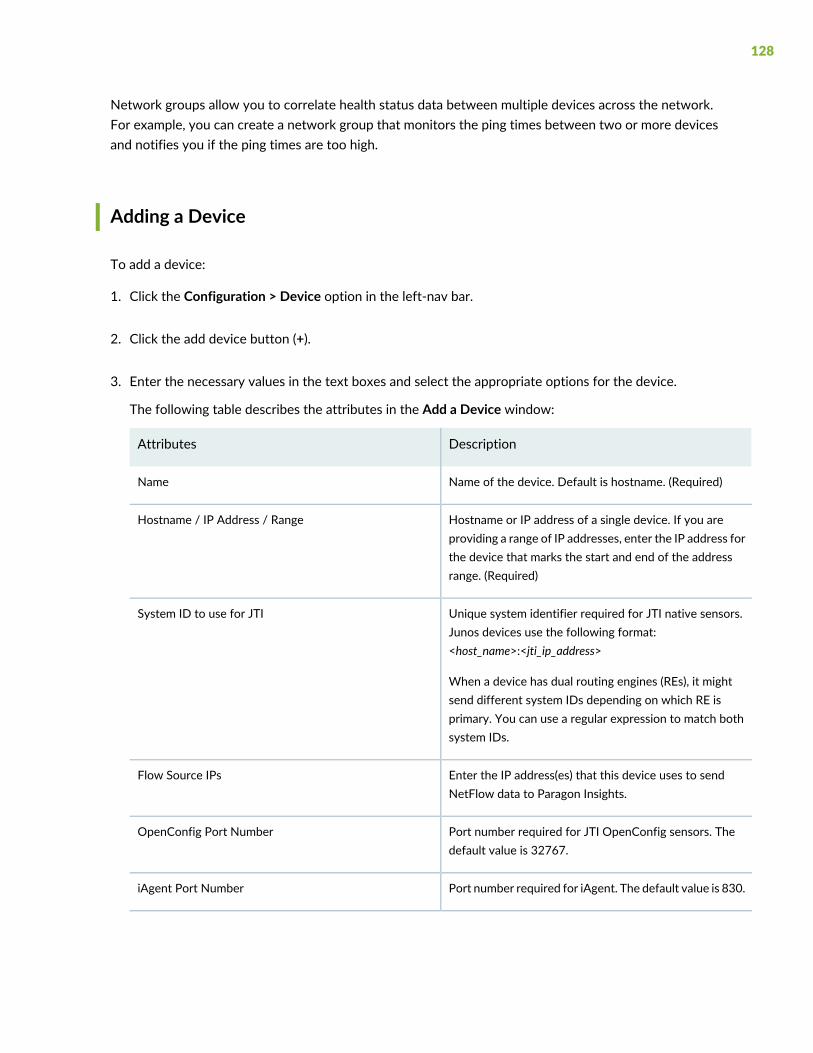
Network groups allow you to correlate health status data between multiple devices across the network.For example, you can create a network group that monitors the ping times between two or more devicesand notifies you if the ping times are too high.
Adding a Device
To add a device:
1. Click the Configuration > Device option in the left-nav bar.
2. Click the add device button (+).
3. Enter the necessary values in the text boxes and select the appropriate options for the device.
The following table describes the attributes in the Add a Device window:
DescriptionAttributes
Name of the device. Default is hostname. (Required)Name
Hostname or IP address of a single device. If you areproviding a range of IP addresses, enter the IP address forthe device that marks the start and end of the addressrange. (Required)
Hostname / IP Address / Range
Unique system identifier required for JTI native sensors.Junos devices use the following format:<host_name>:<jti_ip_address>
When a device has dual routing engines (REs), it mightsend different system IDs depending on which RE isprimary. You can use a regular expression to match bothsystem IDs.
System ID to use for JTI
Enter the IP address(es) that this device uses to sendNetFlow data to Paragon Insights.
Flow Source IPs
Port number required for JTI OpenConfig sensors. Thedefault value is 32767.
OpenConfig Port Number
Port number required for iAgent. The default value is 830.iAgent Port Number
128

DescriptionAttributes
Lists the vendor or supplier of the device you are using.
The operating system you can select from the OSdrop-down list depends on the vendor you select fromthe Vendor drop-down list.
The following are the list of options you can choose from.
• Select Juniper from the vendor drop-down list to selecteither Junos or Junos Evolved operating systems fromthe OS drop-down list.
• Select CISCO from theVendor drop-down list to selecteither IOSXR or NXOS operating systems from theOSdrop-down list.
With Paragon Insights Release 4.0.0, NXOS OS is alsosupported.
NOTE: If you plan to use Cisco IOS XR devices, youmust first configure the telemetry. Formore information,see Paragon Insights Installation Requirements
• Select Arista from the Vendor drop-down list to selectEOS operating system from the OS drop-down list.
• SelectPaloalto from theVendor drop-down list to selectPANOS operating system from the OS drop-down list.
• Select Linux from the Vendor drop-down list and youcan enter the name of the operating system in the OSfield.
• If you select Other Vendor, the Vendor Name and OSName fields are enabled. You can enter the name of thevendor of your choice in the VendorName field and thecorresponding operating system for the vendor in theOS field.
Consider the following example. If the operating systemof a vendor (listed in the Vendor drop-down list) is notlisted (in the OS drop-down list), you can select theOther Vendor option to enter name of the vendor andoperating system of your choice.
Starting with Paragon Insights Release 4.0.0, ParagonInsights supports Arista Networks, Paloalto Networks, andLinux vendors.
Vendor
Timezone for this device, specified as + or -hh:mm. Forexample, +07:00
Timezone
129

DescriptionAttributes
List of IP addresses for the device sending syslogmessagesto Paragon Insights. For example, 10.10.10.23,192.168.10.100.
Syslog Source IPs
List of hostnames for the device sending syslog messagesto Paragon Insights. For example, router1.example.com.
Syslog Hostnames
SNMP
Port number required for SNMP. The port number is setto the standard value of 161.
SNMP Port Number
Select either v2c or v3 in the drop-down menu.SNMP Version
This field appears if you selected v2c in SNMP Versionfield.
Enter an SNMP Community string if you configureSNMPv2c for traps and ingest.
In SNMPv2c, Community string is used to verify theauthenticity of the trap message issued by the SNMPagent (devices such as routers, switches, servers, and soon).
SNMP Community
This field appears if you selected v3 in SNMP Versionfield.
Enable this option on if you want to set SNMPv3authentication to None.
Authentication None
This field appears if you selected v3 in SNMP Versionfield.
Enable this option on if youwant to set SNMPv3 protocolto None.
Protocol None
130

DescriptionAttributes
This field appears if you selected v3 in SNMP Versionfield.
Enter a username for trap notifications. The username youenter here is checked against the SNMPv3 usersconfigured in Paragon Insights.
If there is a match, the trap message is further processedelse, the message is dropped.
SNMPv3 Username
This field appears if you selected v3 in SNMP Versionfield.
Enter the Engine ID of the device (SNMP agent) that sendsthe trap notification.
For inform notifications, the Engine IDmust be set to thatof Paragon Insights.
Context Engine ID
This field appears if you selected v3 in SNMPVersion fieldand disabled Authentication None.
Select an authentication protocol from the drop-downmenu.
SNMPauthentication protocol hashes the SNMP usernamewith the passphrase you enter. The hashed output is sentalong with the trap notificationmessage. Paragon Insightsagain hashes the username with the passphrase youentered for authentication. If the output matches, the trapnotification is further processed.
SNMPv3 Authentication Protocol
This field appears if you selected v3 in SNMPVersion fieldand disabled Privacy None.
Enter a passphrase for SNMPv3 authentication.
SNMPv3 Authentication Passphrase
Select a privacy protocol from the drop-down menu.
Privacy algorithm encrypts the trap notification messagewith the protocol passphrase so that the message cannotbe read by an unauthorized application in the network.
SNMPv3 Privacy Protocol
131

DescriptionAttributes
This field appears if you selected v3 in SNMPVersion fieldand disabled Privacy None.
Enter a passphrase to encrypt the trap notification.
SNMPv3 Privacy Passphrase
This field appears if you selected v3 in SNMP Versionfield.
Enter the source IP address of the device.
If you use NAT or an SNMP Proxy, the Context Engine IDcannot be used to identify the device that send trapnotifications. In such cases, the source IP address of thedevice is used to verify the source of trap notifications.
Source IP Address
Authentication (Required either here or at Device Group level)
Username—Authentication username.
Password—Authentication password.
Password
Server Common Name—Server name protected by theSSL certificate.
CAProfile*—Choose the applicable CA profile(s) from thedrop-down list.
Local Certificate*—Choose the applicable local certificateprofile(s) from the drop-down list.
SSL
SSHKeyProfile*—Choose the applicable SSH key profile(s)from the drop-down list.
Username—Authentication username.
SSH
Outbound SSH
The reset option is set by default. If you disabled outboundSSH for this device, you can enable it back by selectingReset in the dropdown menu.
Reset
You can disable outbound SSH connections for a deviceby selecting Disable from the dropdown menu.
Disable
132

*To edit or view details about saved security profiles, go to the Security page under the Settingsmenuin the left-navigation bar.
4. Click Save to save the configuration or click Save and Deploy to save and deploy the configuration.For information on how to use theDevices table, see “Monitor Device andNetworkHealth” on page 172.
Editing a Device
To edit a device:
1. Click the Configuration > Device option in the left-nav bar.
2. Click anywhere on the line that contains the device name in the table under DEVICES.
You can search and filter the device names in the table.
3. Click the Pencil (Edit Device) icon.
4. Modify the attributes, as needed.
See “Adding a Device” on page 128 for a description of each attribute.
5. Click Save to save the configuration or click Save and Deploy to save and deploy the configuration.For information on how to use theDevices table, see “Monitor Device andNetworkHealth” on page 172.
6. (Optional) A device can be deleted by clicking the Trash Can (Delete Device) icon with the deviceselected.
Adding a Device Group
To add a device group:
1. Click the Configuration > Device Group option in the left-nav bar.
2. Click the add group button (+).
The Add Device Group page appears.
133

3. Configure the device group with the details described in Table 10 on page 134.
4. Do one of the following:
• Click Save—Paragon Insights saves the configuration but does not initiate operations based on thesaved configuration.
You can use this option to savemakemultiple changes in Paragon Insights configurations and committhe changes in bulk or to roll back the changes. See “Commit or Roll Back Configuration Changes inParagon Insights” on page 295 for more information.
• Click Save & Deploy—Paragon Insights saves and deploys the configuration.
The configuration changes are applied to the IFA ingest service in Paragon Insights.
Table 10: Fields in Device Group Configuration
DescriptionAttributes
Name of the device group. (Required)Name
Description for the device group.Description
Add devices to the device group from the drop-down list. (Required)
Starting in Paragon Insights Release 4.0.0, you can add more than 50 devices per devicegroup. However, the actual scale of the number of devices you can add depends on theavailable system resources.
For example, consider that you want to create a device group of 120 devices. In releasesearlier than release 4.0.0, it is recommended that you create three device groups of 50, 50,and 20 devices respectively.With Paragon Insights Release 4.0.0, you just create one devicegroup.
Devices
(Native GPB sensors only) List the port numbers on which the Junos Telemetry Interface(JTI) native protocol buffers connections are established.
Native Ports
(NetFlow sensors only) List the port numbers on which the NetFlow data is received byParagon Insights. The port numbers must be unique across the entire Paragon Insightsinstallation.
Flow Ports
Specify the UDP port(s) on which syslog messages are received by Paragon Insights.Syslog Ports
Select a retention policy from the drop-down list for time series data used by root causeanaylsis (RCA). By default, the retention policy is 7 days.
Retention Policy
134

Table 10: Fields in Device Group Configuration (continued)
DescriptionAttributes
By default, this field is marked False because the option to add a UDA scheduler in TriggerAction page is enabled.
You can set this field to True if youwant to disable UDA scheduler settings in Trigger Actionpage.
Disable Trigger ActionScheduler (for aparticular device group)
In the Reports field, select one or more health report profile names from the drop-downlist to generate reports fo the device group. Reports include alarm statistics, device healthdata, as well as device-specific information (such as hardware and software specifications).
To edit or view details about saved health report profiles, go to the System page under theSettings menu in the left-nav bar. The report profiles are listed under Report Settings.
For more information, see “Alerts and Notifications” on page 247.
Reports
SNMP
Port number required for SNMP. The port number is set to the standard value of 161.SNMP Port Number
Select either v2c or v3 in the drop-down menu.
• If you select v2c, the SNMP Community name field appears. The string used in v2cauthentication is set to public by default. It is recommended that users change thecommunity string.
• If you select v3, you are given an option to set username, authentication and privacymethods, and authentication and privacy secrets.
SNMP Version
Enter notification ports separated by comma.
Paragon Insights listens on these notification ports for trap notification messages.
Notification Ports
Enter an SNMP Community string if you configure SNMPv2c for traps and ingest.
In SNMPv2c, Community string is used to verify the authenticity of the trapmessage issuedby the SNMP agent.
SNMP Community
This field appears if youselected v2c in SNMPVersion field.
This field appears if you selected v3 in SNMP Version field.
Enable this option on if you want to set SNMPv3 authentication to None.
Authentication None
This field appears if you selected v3 in SNMP Version field.
Enable this option on if you want to set SNMPv3 protocol to None.
Protocol None
135

Table 10: Fields in Device Group Configuration (continued)
DescriptionAttributes
This field appears if you selected v3 in SNMP Version field.
Enter a username for trap notifications. The username you enter here is checked againstthe SNMPv3 users configured in Paragon Insights.
If there is a match, the trap message is further processed else, the message is dropped.
SNMPv3 Username
This field appears if you selected v3 in SNMP Version field and disabled AuthenticationNone.
Select an authentication protocol from the drop-down menu.
SNMP authentication protocol hashes the SNMP usernamewith the passphrase you enter.The hashed output is sent along with the trap notification message. Paragon Insights againhashes the username with the passphrase you entered for authentication. If the outputmatches, the trap notification is further processed.
SNMPv3AuthenticationProtocol
This field appears if you selected v3 in SNMP Version field and disabled Privacy None.
Enter a passphrase for SNMPv3 authentication.
SNMPv3AuthenticationPassphrase
Select a privacy protocol from the drop-down menu.
Privacy algorithm encrypts the trap notification message with the protocol passphrase sothat the message cannot be read by an unauthorized application in the network.
SNMPv3 PrivacyProtocol
This field appears if you selected v3 in SNMP Version field and disabled Privacy None.
Enter a passphrase to encrypt the trap notification.
SNMPv3 PrivacyPassphrase
To improve the performance and disk space utilization of the Paragon Insights time seriesdatabase, you can configure data summarization methods to summarize the raw datacollected by Paragon Insights. Use these fields to configure data summarization:
Time Span—The time span (in minutes) for which you want to group the data points fordata summarization.
Summarization Profiles—Choose the data summarization profiles from the drop-down listfor which you want to apply to the ingest data. To edit or view details about saveddata summarization profiles, go to the Data Summarization Profiles page under theSettings menu in the left-nav bar.
For more information, see “Configure Data Summarization” on page 278.
Summarization
Select existing Ingest Frequency Profiles to override rule or sensor frequency settings.Ingest Frequency
136

Table 10: Fields in Device Group Configuration (continued)
DescriptionAttributes
Authentication(Required here or at Device level)
Username—Authentication user name.
Password—Authentication password.
Password
Server Common Name—Server name protected by the SSL certificate.
CA Profile*—Choose the applicable CA profile(s) from the drop-down list.
Local Certificate*—Choose the applicable local certificate profile(s) from the drop-downlist.
SSL
SSH Key Profile*—Choose the applicable SSH key profile(s) from the drop-down list.
Username—Authentication username.
SSH
• You can use the Alarm Manager feature to organize, track, and manage KPI event alarmnotifications received from Paragon Insights devices.
• To receive Paragon Insights alarm notifications for KPI events that have occurred on yourdevices, you must first configure the notification delivery method for each KPI eventseverity level (Major,Minor, andNormal). Select the deliverymethod from the drop-downlists.
To edit or view details about saved deliverymethod profiles, go to the System page underthe Settings menu in the left-nav bar. The delivery method profiles are listed underNotification Settings.
For more information, see “Alerts and Notifications” on page 247.
Notifications
You can collect different severity levels of logs for the running Paragon Insights servicesof a device group. Paragon Insights Release 4.0.0 supports collecting log data for SNMPnotification.
Use these fields to configure which log levels to collect:
Global Log Level—From the drop-down list, select the level of the log messages that youwant to collect for every running Paragon Insights service for the device group. Thelevel is set to error by default.
Log Level for specific services—Select the log level from the drop-down list for any specificservice that you want to configure differently from the Global Log Level setting. Thelog level that you select for a specific service takes precedence over the Global LogLevel setting.
For more information, see “Logs for Paragon Insights Services” on page 298.
Logging Configuration
137

Table 10: Fields in Device Group Configuration (continued)
DescriptionAttributes
You can configure Paragon Insights to publish sensor and field data for a specific devicegroup:
Destinations—Select the publishing profiles that define the notification type requirements(such as authentication parameters) for publishing the data.
To edit or view details about saved publishing profiles, go to the System page underthe Settings menu in the left-nav bar. The publishing profiles are listed underNotification Settings.
Field—Select the Paragon Insights rule topic and rule name pairs that contain the field datayou want to publish.
Sensor—(Device group only) Select the sensor paths or YAML tables that contain the sensordata you want to publish. No sensor data is published by default.
Publish
Outbound SSH
Enter one or more port numbers for outbound SSH connections for this device group.Ports
Enter IP address of the node where the IFA ingest must be deployed in Paragon Insights.IFA Deploy Nodes
Enter the UDP port number on which Paragon Insights receives IFA sensor data.
Range: 1 to 65,535.
IFA Ports
Root Cause Analysis
RCA is enabled by default. Disable RCA if you do not want the device group to be a partof root cause analysis.
RCA Support
Exclude Resources field allows you to select device resources that must be excluded fromresource and dependency formation.
Exclude Resources
138

Editing a Device Group
To edit a device group:
1. Click the Configuration > Device Group option in the left-nav bar.
2. Click on the device group name under DEVICE GROUPS.
3. Click on the Pencil (Edit Device Group) icon.
4. Modify the attributes, as needed.
See “Adding a Device Group” on page 133 for a description of each attribute.
5. Click Save to save the configuration or click Save and Deploy to save and deploy the configuration.For information on how to use the device group cards, see “Monitor Device and Network Health” onpage 172.
6. (Optional) A device group can be deleted by clicking the Trash Can (Delete Device Group) icon withthe device group selected.
Configuring a Retention Policy for the Time Series Database
To configure a retention policy for the time series data used for root cause analysis (RCA):
1. Click the Settings > System option in the left-nav bar.
2. Select Retention Policy Settings.
3. Click the + Retention Policy button.
4. Enter the necessary values in the text boxes for the retention policy.
The following table describes the attributes in the Add a Retention Policy window:
DescriptionAttributes
Name of the retention policy.Name
139

DescriptionAttributes
Amount of time the root cause analysis (RCA) data is retained in the Paragon InsightsRCA database. By default, data is retained for 7 days.
The data must be entered in hours or days. For example, 1 day is entered as 1d or 24h.
Duration
5. Click Save to save the configuration or click Save and Deploy to save and deploy the configuration.
You can now apply the retention policy to a device group. For information on how to apply a retentionpolicy to a device group, see “Adding a Device Group” on page 133.
Adding a Network Group
To add a network group:
1. Click the Configuration > Network option in the left-nav bar.
2. Click the + (Add Network) button.
3. Enter the necessary values in the text boxes and select the appropriate options for the network group.
The following table describes the attributes in the Add a Network Group window:
DescriptionAttributes
Name of the network group. (Required)Name
Description for the network group.Description
In the Reports field, select one or more health report profile names from the drop-down listto generate reports fo the network group. Reports include alarm statistics, device health data,as well as device-specific information (such as hardware and software specifications).
To edit or view details about saved health report profiles, go to the System page under theSettings menu in the left-nav bar. The report profiles are listed under Report Settings.
For more information, see “Alerts and Notifications” on page 247.
Reports
140

DescriptionAttributes
By default, this field is marked False because the option to add a UDA scheduler in TriggerAction page is enabled.
You can set this field to True if you want to disable UDA scheduler settings in Trigger Actionpage.
Disable TriggerAction Scheduler (fora particular networkgroup)
• You can use the Alarm Manager feature to organize, track, and manage KPI alarmnotifications received from Paragon Insights devices.
• To receive Paragon Insights alarm notifications for KPI events that have occurred on yourdevices, youmust first configure the notification deliverymethod for each KPI event severitylevel (Major,Minor, and Normal). Select the delivery method from the drop-down lists.
To edit or view details about saved delivery method profiles, go to the System page underthe Settings menu in the left-nav bar. The delivery method profiles are listed underNotification Settings.
For more information, see “Alerts and Notifications” on page 247.
Notifications
Select existing Ingest Frequency Profiles to override rule or sensor frequency settings.Ingest Frequency
You can collect different severity levels of logs for the running Paragon Insights services of anetwork group. Paragon Insights Release 4.0.0 supports collecting log data for SNMPnotification.
Use these fields to configure which log levels to collect:
Global Log Level—From the drop-down list, select the level of the logmessages that youwantto collect for every running Paragon Insights service for the network group. The level isset to error by default.
Log Level for specific services—Select the log level from the drop-down list for any specificservice that you want to configure differently from the Global Log Level setting. The loglevel that you select for a specific service takes precedence over the Global Log Levelsetting.
For more information, see “Logs for Paragon Insights Services” on page 298.
LoggingConfiguration
141

DescriptionAttributes
You can configure Paragon Insights to publish Paragon Insights sensor and field data for aspecific network group:
Destinations—Select the publishing profiles that define the notification type requirements(such as authentication parameters) for publishing the data.
To edit or view details about saved publishing profiles, go to the System page under theSettings menu in the left-nav bar. The publishing profiles are listed under NotificationSettings.
Field—Select the Paragon Insights rule topic and rule name pairs that contain the field datayou want to publish.
Publish
Root Cause Analysis
RCA is enabled by default. Disable RCA if you do not want the network group to be a part ofroot cause analysis.
RCA Support
Exclude Resources field allows you to select network resources that must be excluded fromresource and dependency formation.
Exclude Resources
4. Click Save to save the configuration or click Save and Deploy to save and deploy the configuration.For information on how to use the network, see “Monitor Device and Network Health” on page 172.
Editing a Network Group
To edit a network group:
1. Click the Configuration > Network option in the left-nav bar.
2. Click anywhere on the line that contains the group name in the table under NETWORK LIST.
3. Click on the Edit Network (Pencil) icon.
4. Modify the attributes, as needed.
See “Adding a Network Group” on page 140 for a description of each attribute.
142

5. Click Save to save the configuration or click Save and Deploy to save and deploy the configuration.For information on how to use the network group cards, see “Monitor Device and Network Health”on page 172.
6. (Optional) A network can be deleted by clicking the Delete Network (Trash Can) icon.
Release History Table
DescriptionRelease
Starting in Paragon Insights Release 4.0.0, you can add more than 50 devices per devicegroup.
4.0.0
Paragon Insights Release 4.0.0 supports collecting log data for SNMP notification.4.0.0
Paragon Insights Release 4.0.0 supports collecting log data for SNMP notification.4.0.0
RELATED DOCUMENTATION
Paragon Insights Rules and Playbooks | 143
Monitor Device and Network Health | 172
Paragon Insights Rules and Playbooks
IN THIS SECTION
Add a Pre-Defined Rule | 144
Create a New Rule Using the Paragon Insights GUI | 145
Edit a Rule | 160
Add a Pre-Defined Playbook | 160
Create a New Playbook Using the Paragon Insights GUI | 161
Edit a Playbook | 163
Clone a Playbook | 163
Manage Playbook Instances | 164
143

The device or network performance elements that are important to one company may not be importantto another. Paragon Insights (formerly HealthBot) uses Rules and Playbooks to define key performanceindicators (KPIs) and organize them into groups that are applied to network devices.
This document presents the tasks involved in creating, editing, and deleting Paragon Insights rules andplaybooks.
Add a Pre-Defined Rule
Juniper has created a set of pre-defined rules that you can use to gather information from various Junipercomponents and the networks they reside in. You can add these rules to Paragon Insights at any time.After installation, many default pre-defined rules appear in the Rules and Playbooks pages. Pre-definedrules cannot be changed or removed; however, you can clone any rule (pre-defined or user defined) simplyby clicking the CLONE button on the upper-right part of the rule definition. A cloned rule goes to theexternal topic and can be re-configured at will.
To upload additional pre-defined rules to Paragon Insights:
1. Using a browser, go to https://github.com/Juniper/healthbot-rules and download the pre-defined rulefile to your system.
2. In the Paragon Insights GUI, click the Configuration > Rules icon in the left-nav bar.
3. Click the ↑ Upload Rule Filesbutton.
4. Click the Choose Files button.
5. Navigate to the rule file and click Open.
6. Select one of the following options:
Upload the file and save the rule within the defined topic area but do not deploy theupdated configuration. You can use this option when, for example, you are makingseveral changes and want to deploy all your updates at the same time.
Upload
Upload the file, save the rule within the defined topic area, and immediately deploy theconfiguration.
Upload & Deploy
144
Create a New Rule Using the Paragon Insights GUI
IN THIS SECTION
Rule Filtering | 147
Sensors | 148
Fields | 149
Vectors | 152
Variables | 153
Functions | 154
Triggers | 157
Rule Properties | 159
To create a new rule using the Paragon Insights GUI, you’ll first fill out general descriptive informationabout the rule and then navigate through several rule definition blocks in the Rules page to provide thespecific configuration for the Paragon Insights rule.
To start creating a new Paragon Insights rule:
1. Click the Configuration > Rules icon in the left-nav bar. A list of Paragon Insights rules organized byParagon Insights topic is displayed along the left side of the Rules page.
2. Click the add rule button (+ Add Rule).
145

3. Enter general descriptive information about the rule using the following input parameters:
DescriptionParameter
For a new rule, this parameter is pre-populatedwith external / user_rule_randomcharacters, for example, external / user_rule_2p0ghk. The fields separated bythe slash (/) represent Paragon Insights topic name and Paragon Insights rulename, respectively.
external is the topic name used for user-defined topics. For the Paragon Insightsrules pre-defined by Juniper, Juniper has curated a set of pre-defined devicecomponent-based topic names. For more information about Paragon Insightstopics, see Paragon Insights Topics.
Replace the user_rule_random characters rule name with a name thatappropriately represents the rule’s description such as packets-in, packets-out,system_memory, etc.
Rule
(Network rule only) Specify how often data for the network rule is collected byParagon Insights. This setting is overridden if the rule is included in a frequencyprofile that is applied to a network group.
Rule frequency
(Optional) Enter a detailed description for the rule.Description
(Optional) Enter a brief description for the rule. The synopsis is displayed whenyou hover over the rule name listed along the left side of the Rules page.
Synopsis
This optional value defines how often Paragon Insights aggregates the datareceived by the sensor. This helps reduce the number of data point entries inthe time series database.
Field Aggregation Time Range
4. (Network rule only) If the new rule is a network rule, toggle the Network rule switch to the right.
5. Configure the rule definition blocks as needed.
Located directly below the Synopsis input parameter, you’ll find links to the following rule definitionblocks: Sensors, Fields, Vectors, Variables, Functions, Triggers, and Rule Properties. The followingsections describe the input parameters for each of these rule definition blocks.
6. Select one of the following options to save the new rule:
Save the rule within the defined topic area but do not deploy the updated configuration.You can use this option when, for example, you are making several changes and wantto deploy all your updates at the same time.
Save
146

Immediately deploy the configuration and save the rule within the defined topic area.Save & Deploy
The following sections describe the input parameters for each of the Paragon Insights rule definition blocks:
Rule Filtering
Starting in HealthBot Release 3.0.0, you can filter the Topics and Rules displayed on the left side of theRules page. This allows you to quickly find rules that you are looking for. The search function works fortopics, rules, sensor-types and other categories; working not only on titles, but also on the defined contentsof rules.
The following procedure explains this filtering feature.
1. Navigate to Configuration > Rules in the left-nav bar.
The Rules page is displayed. To the left of the rule definition area is a new section as shown inFigure 39 on page 147 below.
Figure 39: Rule Filtering
2. From the pull-down menu, select the type of search you want to perform.
3. In the search field, begin entering your search text.
147

The topic list below shrinks to display only topics and rules that match your search criteria.
Sensors
Start configuring the new rule using the Sensor block. Figure 40 on page 148 shows the sensor definitionfor the OpenConfig sensor pppoe-error-statistics.
Figure 40: A Sensor Definition
1. Click the add sensor button (+ Add Sensor).
A new sensor definition appears and is named Sensor_random characters, like Sensor_2kgf04.
2. Change the sensor name to something that makes sense for the rule you are defining.
3. From the drop-down list, choose the sensor type. You can choose one of: OpenConfig, Native GPB,iAgent, SNMP, Syslog, or NetFlow.
The required elements for defining the Sensor Type change depending on the selection you make. Thefrequency is expressed in #s, #m, #h, #d, #w, #y, or #o where # is a number and s, m, h, d, w, y specifiesseconds, minutes, hours, days, weeks, years, and offset respectively. The o expression is used fordefining an offset multiplier for use in formulas, references, triggers, learning periods, and hold-times.
The following list describes the elements that change based on your choice of Sensor Type. None ofthe other rule elements change because of a Sensor Type selection.
• OpenConfig—Sensor path is defined froma drop-down list of availableOpenConfig sensors. Frequencyrefers to how often, in seconds, the sensor reports to Paragon Insights. The frequency can beoverridden if the sensor is included in a frequency profile.
148

• Native GPB—Sensor path refers to the path for a Native GPB sensor. Port refers to the GPB portover which the sensor communicates with Paragon Insights.
• iAgent—File is the name of a YAML-formatted file that defines the NETCONF-accessible sensor.Table is defined from a drop-down list of available PyEZ tables and views in the YAML file.Frequency refers to how often the sensor is polled by Paragon Insights and can be overriddenby including the sensor in a frequency profile.
Based on the table you’ve selected, input fields for a target or dynamic arguments might also beprovided. For these additional fields, you can do one of the following:
• Leave the input field blank. No default value will be applied.
• Enter a fixed value that will remain constant.
• Enter a variable name enclosed in double curly/flower brackets (for example, {{test-variable}})The variable namemust belong to a variable that was previously defined in the Paragon Insightsrule, and the variable’s Type option must be set to Sensor Argument.
• SNMP—Table is defined from a drop-down list of available SNMP tables. Frequency refers to howoften, in seconds, Paragon Insights polls the device for data and can be overridden by includingthe sensor in a frequency profile.
• Syslog—Pattern set is a user-configured element that includes one or more patterns (you configurea pattern for each event you want to monitor). TheMaximum hold period is used in advancedcases and refers to the maximum time that the system will wait when correlating events usingmultiple patterns within a pattern set.
NOTE: The syslog sensor requires some pre-configuration. See Syslog Ingest for moredetails.
• Flow—Template Name is a Juniper-supplied built-in list of NetFlow v9 and IPFIX templates.
Fields
A sensorwill generally carry information aboutmultiple things. For example, a sensor thatwatches interfaceshas information about all of the interfaces on the device. In Paragon Insights, we call these things Fields.Now that you’ve defined a sensor, you’ll need to tell Paragon Insights which fields you’re interested in.
1. Click the Fields link.
The screen updates and shows the defined field objects.
2. Click the add field button (+ Add Field).
149

3. Replace the random field name with a name that make sense for the rule you are defining, such asinterface-name, configured-threshold, etc.
4. (Optional) Add descriptive text for the new field.
5. Set the appropriate Field Type. The options for field type are: string, integer, float, and unsigned integer.String is the default field type.
Starting in Paragon Insights Release 4.2.0, you can also select unsigned integer as a field type. Anunsigned integer is a data type that can contain values from 0 through 4,294,967,295.
6. (Optional) Toggle the Add to rule key switch.
The add rule to key switch tells Paragon Insights that this field should be indexed and searchable. Forexample, when you enable this switch, the field namewill be listed on the Devices page under theKeyscolumn.
7. Select the appropriate ingest type (Field source) from the pull-down menu.
The following list shows the options available for the Ingest type (Field source) menu.
• Sensor–Use this or another sensor definition.
• Path-Follow this Open Config or Netconf path within the sensor definition to gather specific datalike the names of the interfaces. For iAgent sensors the Path refers to the path defined in the YAMLfile.
• Where–Filter the available data to gather information about a specific element within, like a specificinterface. This field can reference theVariables defined elsewherewithin the rule.When referencingvariables, use moustache notation, enclosed in slashes, such as: {{interface_name}}.
• Zero suppression-For some sensors associated with devices running Junos OS, such as JunosTelemetry Interface Open Config and native GPB sensors, no field data is sent from the sensorwhen the data’s value is zero. Enable the zero suppression switch to set the field data value to zerowhenever no field data is sent from the sensor.
• Data if missing-Specify a value as the default data value whenever no data is sent from the sensor.The format of the specified value should match the defined field type (string, integer, or float). Ifthe zero suppression switch is also enabled, then the specified data-if-missing value is ignored, andthe default sensor data value is set to zero.
• Reference–A reference to a field or trigger value from another rule.
150

• Data if missing-Specify a value as the default data value whenever no reference data is fetched.The format of the specified value should match the defined field type (string, integer, or float).
• Constant–Use a constant when referring to a Variable defined within the rule, whose value doesn’tchange, such as IO_Drops_Threshold A constant can also be a string or numeric value that does notchange and is not a reference to a variable.
• Constant value–Usemoustache notation to reference the variable like this: {{IO_Drops_Threshold}}.
• Formula–Select the desired mathematical formula from the Formula pull-down menu.
8. (Optional) Set the Field aggregation time-range. Located above the Fields tab with the general ruleparameters, this periodic aggregation setting helps to reduce the number of data points entered in thedatabase. For example, if the sensor settings specify that Paragon Insights ingests data every 10 seconds,you could configure this setting to aggregate and record the relevant field data, say, every 60 seconds.Note that when using this setting, any field-specific time ranges must use the same value.
NOTE: Starting in HealthBot Release 3.1.0, you can add fields and keys to rules based onwhetherthe incoming data meets user-defined conditions defined in tagging profiles. Tagging profilesare defined in Paragon Insights under Settings > Ingest Settings on the left-nav. See“ParagonInsights Tagging” on page 45 for details.
151

Vectors
(Optional) Now that you have a sensor and fields defined for your rule, you can define vectors.
A vector is used when a single field has multiple values or when you receive a value from another field.
1. Click on the Vectors link.Figure 41 on page 152 shows the Vectors block for a newly added vector.
Figure 41: Vectors Block
2. Click the add vector button (+ Add Vector)
3. Replace the random vector name with a name that makes sense for your rule.
4. Select an ingest type from the drop-down list. The additional input fields will vary depending on theselection you make.
For path:
DescriptionParameter
Select a field from the drop-down list. The list of fields is derived from all of thedefined fields in this rule.
List of fields
Specify a time range from which the data should be collected. The time rangeis expressed in #s, #m, #h, #d, #w, #y where # is a number and s, m, h, d, w, yspecifies seconds, minutes, hours, days, weeks, and years respectively. Forexample, enter 7 days as 7d.
Time-range
152

For formula:
DescriptionParameter
Select a formula type from the drop-down list:
unique—Creates a vector with unique elements from another vector.
and—Compares two vectors and returns a vector with elements common toboth vectors.
or—Compares two vectors and returns a vectorwith elements fromboth vectors.
unless—Compares two vectors and returns a vector with elements from the leftvector but not the right vector.
Formula Type
(Unique formula type only) Select a vector name from the drop-down list. Thelist of vectors is derived from all of the defined vectors in this rule.
Vector name
Select a vector name from the drop-down list. The list of vectors is derived fromall of the defined vectors in this rule.
Left vector
Select a vector name from the drop-down list. The list of vectors is derived fromall of the defined vectors in this rule.
Right vector
Variables
(Optional) The Variables block is where you define the parts of the sensor that you are interested in. Forexample, a rule that monitors interface throughput needs to have a way to identify specific interfaces fromthe list of available interfaces on a device. The field details are discussed below.
1. Click on the Variables tab.
2. Click the add variable button (+ Add Variable)
3. Replace the random Variable name with a variable name that makes sense for your rule, such aspem-power-usage-threshold.
BEST PRACTICE: The accepted convention within Juniper for naming of elements withinParagon Insights is to always start with a lower-case letter and use hyphens to separatewords. Make sure that your variable names are unique, clearly named, and follow arecognizable pattern so that others can understandwhat the variable is for. Any abbreviationsshould be used consistently throughout.
153

4. Set an appropriate default value in the Default value field.
Default values vary depending on field type. Integer field types use numeric default values, while stringfield types use strings to set exact defaults and regular expressions that allow you to set the defaultfrom a list. Any default values set during rule definition can be overridden at apply-time at either thedevice or device group level.
5. Select the appropriate variable type from the Type drop-down list.
Available field types are: Integer, Floating Point, String, Boolean, Device, Device Group, and UnsignedInteger.
Starting in Paragon Insights Release 4.2.0, you can also select unsigned integer as a variable type. Anunsigned integer is a data type that can contain values from 0 through 4,294,967,295.
Functions
(Optional) Define any needed functions.
The Functions block allows users to create functions in a python file and reference the methods that areavailable in that file. The python file must be created outside of Paragon Insights. You must know aboutthe method names and any arguments because you will need those when defining the functions.
Starting with Paragon Insights 4.2.0 release, you can use a Python user-defined function to return multiplevalues.
For example, consider that you have a function example_function.py that has three return values. Whenyou call the example_function.py in a rule, the first return value in the user-defined functions (UDF) isstored in the rule field that calls the function. You only need to configure return fields, such as r2 and r3,for the remaining two return values. You can configure these fields for return values in the Return List ofthe Functions tab.
In the time-series database, the name of Return List fields are prefixed with the name of the rule field thatuses the UDF. For example, rule_field_name-r2.
Figure 42 on page 155 shows the Functions block for the chassis.power/check=pem-power-usage rule.The field details are discussed below.
154

Figure 42: The Functions Block
To configure a function:
1. Click on the Functions link.
2. Click + Add Function.
3. Enter a function name such as used-percentage.
4. In the Path to function field, enter the name of the python file that contains the functions. These filesmust be stored in the /var/local/healthbot/input/hb-default directory. The pull-down list is populatedwith all the Python (.py) files in that directory.
5. In theMethod Name field, enter the name of the method as defined in the python file. For example,used_percentage.
6. (Optional) Enter a description for the function in the description box.
7. (Optional) For each argument that the python function can take, click the add argument button (+ AddArgument).
155

Each time you click the add argument button, you’ll need to enter the name of the argument and setthe toggle switch as to whether the argument is mandatory or not. The default is that none of thearguments are mandatory.
8. (Optional) If there are more than one return value in the function, click +Add Return List.
9. Enter a name for the return value and the data type, such as an integer.
156

Triggers
A required element of rule definition that you’ll need to set is the trigger element. Figure 43 on page 157shows theTriggers block for the system.memory/check-system-memory rule. The field details are discussedbelow.
Figure 43: The Triggers Block
Setting up triggers involves creating terms that are used to set policy. If the terms within a trigger arematched, then some action is taken. Terms can evaluate the fields, functions, variables, etc that are definedwithin the rule against each other or in search of specific values. Terms are evaluated in order from thetop of the term list to the bottom. If no match is found, then the next term (if any) is evaluated until amatch is found or until the bottom of the term stack is reached.
1. Click on the Triggers link.
2. Click on the add trigger button (+ Add Trigger).
3. Replace the random trigger name with one that makes sense for the trigger you are defining, such asfoo-link-operation-state. We recommend using a name that is very unique to the rule and trigger toavoid having the same trigger name across two or more rules.
157

4. (Optional) Enter a value in the Frequency field. This value tells Paragon Insights how often the fielddata and triggers should be queried and evaluated. If no entry is made here, then the sensor frequencyis applied for this value. The frequency entered here can be entered as a multiple or, an offset, of thesensor frequency such as 2o. For example, if the sensor frequency is 10s and the trigger frequency is2o, then the trigger frequency would be 20s (2*10s).
5. Click the add term button (+ Add Term).
The Term area will expand and show an add condition button, (+ Add Condition) in theWhen sectionand Color andMessage fields in the Then section.
6. To define a condition that the term will evaluate, click the + Add Condition button.
TheWhen section expands to show Left operand, Operator, and Time range fields.
NOTE: Setting a condition is not required. If you want to guarantee that a Term takes aspecific action, don’t set a condition. This could be useful, for example, at the bottom of aterm stack if you want some indication that none of the terms in your trigger matched.
7. Select values from the pull-down menus for each of these fields.
Depending on which Operator is chosen, a new field, Right operand may appear in between theOperator and Time range fields.
The left and right operand pull-down menus are populated with the fields and variables defined in therule. The operator field determines what kind of comparison is done. The time range field allows thetrigger to evaluate things such as if there were any dropped packets in the last minute.
8. (Optional) Set values for the Color andMessage fields, and add Action Engine information in the Thensection.
These fields are the action fields. If a match is made in the condition set within the same term, thenwhatever action you define here is taken. A color value of green, yellow, or red can be set. A messagecan also be set and is not dependent on whether any color is set.
Starting in Paragon Insights Release 4.2.0, you link action workflows (Action Engine) to rules whilesetting up triggers. You can also add input arguments while linking action workflows. TheAction Enginesection is enabled only with a PIN-Advanced license. For more information, see “Paragon InsightsLicensing Overview” on page 314.
If color or message are set, a toggle button labelled Evaluate next term appears at the bottom of theThen section. The default value for this button is off (not active).
158

NOTE: If no match is made in theWhen section of a term, the Then section is ignored. If thishappens, the next term down, if any, is evaluated.
If a match is made in theWhen section, then the actions in the Then section, if any, are takenand processing of terms stops unless the Evaluate next term button is set to on (active).
Setting the Evaluate next term button allows you to have Paragon Insightsmakemore complexevaluations like ’if one condition and another condition are both true, then take this action’.
Rule Properties
(Optional) Specify metadata for your Paragon Insights rule in the Rule Properties block. Available optionsinclude:
DescriptionAttributes
Enter the version of the Paragon Insights rule.Version
Choose an option from the drop-down list.Contributor
Specify a valid e-mail address.Author
Choose a date from the pop-up calendar.Date
Specify the earliest Paragon Insights release for which the rule is valid.Supported Paragon InsightsVersion
Choose either Junos or Junos Evolved. Device metadata includes Product Name,Release Name, Release Support (drop-down list), and platform. You can addmetadatafor multiple devices, multiple products per device, and multiple releases per product.
Starting in Paragon Insights Release 4.2.0, you can select default sensors that youwant to apply to all supported devices. You also have the option to select defaultsensors that you want to apply to Juniper devices, and to Juniper devices that run aspecific OS.
Supported Device > JuniperDevices
159

DescriptionAttributes
Paragon Insights Release 4.1.0 and earlier—You can addmetadata formultiple devices.
Paragon Insights Release 4.2.0 and later—You can add vendor identifier, vendor name,product, platform, release, and operating system-related information for non-Junipervendors.
Starting in Paragon Insights Release 4.2.0, you can select default sensors that youwant to apply to all non-Juniper devices.
Supported Device > OtherVendor Devices
Specify files that are required by the Paragon Insights rule.Helper Files
Edit a Rule
To edit a rule:
1. Click the Rules icon in the left-nav bar.
2. Click the name of the rule listed along the left side of the Rules page.
3. Modify the necessary fields.
4. Select one of the following options:
Save your edits but do not deploy the updated configuration. You can use this optionwhen, for example, you aremaking several changes andwant to deploy all your updatesat the same time.
Save
Immediately deploy the configuration and save the rule.Save & Deploy
5. (Optional) Delete a rule by clicking the Delete button located to the right of the rule name.
Add a Pre-Defined Playbook
Juniper curates a set of pre-defined playbooks designed to address common use cases. You can add theseplaybooks to your Paragon Insights installation at any time. The default pre-defined playbooks cannot bechanged or removed.
160

To add a pre-defined playbook to Paragon Insights:
1. Using a browser, go to https://github.com/Juniper/healthbot-rules and download the pre-definedplaybook file to your computer.
2. In the Paragon Insights GUI, click the Configuration > Playbooks icon in the left-nav bar.
3. Click the upload playbook button (↑ Upload Playbook).
4. Click the Choose Files button.
5. Navigate to the playbook file and click Open.
6. Select one of the following options:
Upload the file and add the playbook but do not deploy the updated configuration.You can use this option when, for example, you are making several changes and wantto deploy all your updates at the same time.
Upload
Upload the file, add the playbook, and immediately deploy the configuration.Upload & Deploy
Create a New Playbook Using the Paragon Insights GUI
Paragon Insights operates on playbooks, which are a collection of rules for solving a specific customer usecase. For example, the system-kpi-playbook monitors the health of system parameters such assystem-cpu-load-average, storage, system-memory, process-memory, etc. and notifies the operator ortakes corrective action in case any of the KPIs cross pre-set thresholds. Any single rule can be a part of 0,1, or more playbooks. The playbook is the rule element that gets deployed on devices. Rules that are notincluded in any playbook will not be deployed to any device.
NOTE: Click the Name, Running, Paused, or Synopsis column headers in the Playbooks tableto organize the data in ascending or descending order.
Starting with Release 4.2.0, Paragon Insights supports splat operator in ICMP outlier detection playbook.The icmp-outlier playbook earlier required that you enter the round trip time (RTT) XPath for each device
161

(using device id). As the playbook is applied to all devices in a device group, you can enter the splat operator(*) in the regular expression format instead of device id of each device.
For example:
/device-group[device-group-name=core]/device[device-id=~/.*/]]/topic[topic-name=protocol.icmp]/rule[rule-name=check-icmp-statistics]/rtt-average-ms
NOTE: If you delete or add a device in a device group onwhich an ICMPoutlier playbook instanceruns, you must pause the playbook instance, modify the XPath configuration to reflect theaddition or deletion of devices, and re-apply the playbook instance for the device group.
To create a new playbook using the Paragon Insights GUI:
1. Click the Configuration > Playbooks icon in the left-nav bar.
2. Click the create playbook button (+ Create Playbook).
A new window appears with 4 fields: Name, Synopsis, Description, and Rules. We describe the use ofeach field below.
3. Enter a name for the playbook in the Name field.
4. Enter a short description for the playbook in the Synopsis field.
This text appears in the Synopsis column of the table on the Playbooks page.
5. (Optional) Enter a description of each of the rules that make up this playbook in the Description field.
This text can only be seen if you click on the playbook name on the Playbooks page.
6. From the rules drop-down list, select the rules that make up this playbook.
7. Select one of the following options:
Save and add the playbook but do not deploy the updated configuration. You can usethis option when, for example, you are making several changes and want to deploy allyour updates at the same time.
Save
Immediately deploy the configuration and save and add the playbook.Save & Deploy
162

Edit a Playbook
To edit a playbook:
1. Click the Configuration > Playbooks icon in the left-nav bar.
2. Click the name of the playbook.
3. Modify the necessary text boxes.
4. Select one of the following options:
Save your edits to the playbook but do not deploy the updated configuration. You canuse this option when, for example, you are making several changes and want to deployall your updates at the same time.
Save
Immediately deploy the configuration and save your edits to the playbook.Save & Deploy
5. (Optional) Delete a playbook by clicking the trash can icon in the Delete column.
NOTE: You cannot edit or delete a system defined (Juniper provided) playbook.
When you update a playbook, the new changes on the playbookwill not be applied to the existing instancesof the playbook. For example, a playbook instance that is associated to a device group will not be updatedwhen the playbook is edited or updated. You must delete the existing playbook instance and create a newone for updates to be applied.
Clone a Playbook
Starting with HealthBot Release 3.2.0, you can clone an existing playbook and modify configurations.
Follow these steps to clone a playbook by using the Paragon Insights UI.
1. Click Configuration>Playbooks in the left-nav bar.
The Playbooks page is displayed.
2. Click the Clone icon as show in Figure 44 on page 164.
163

Figure 44: Clone a Playbook
The Clone Playbook: <name of playbook> page is displayed.
You can now edit Name, Synopsis, and Description sections. You can also add new rules or removeexisting rules from the Rules drop-down list.
3. Click Save to save configurations and confirm cloning the playbook.
Alternatively, click Save & Deploy to save configurations, confirm cloning the playbook, and deploythe newly cloned playbook.
Manage Playbook Instances
IN THIS SECTION
View Information About Playbook Instances | 165
Create a Playbook Instance | 167
Manually Pause or Play a Playbook Instance | 169
Create a Schedule to Automatically Play/Pause a Playbook Instance | 170
164

The term playbook instance refers to a specific snapshot of a playbook that is applied to a specific devicegroup or network group. You canmanually play and pause playbook instances. Alternatively, you can applya customized schedule to a playbook instance that will automatically perform play and pause actions.
The following sections describe tasks that you can perform to manage playbook instances:
View Information About Playbook Instances
To view information about playbook instances:
1. Click the Configuration > Playbooks option in the left-nav bar.
The saved playbooks are listed in the table on the main Playbooks page.
• Playbooks that have been applied to a device group or network group are identified in the table bya right caret next to the playbook name.
• The Instances column in the table shows the number of playbook instances running and paused.
• Starting with HealthBot Release 3.1.0, some playbooks require the purchase and installation ofadvanced or premium licenses. These playbooks are identified by the green circle with a white starin it. As shown above, it tells you which license is required when you hover your mouse over theicon.
• The Live column (in the Action section of the table) shows a colored circle indicator that representsthe overall status of the playbook instances for each playbook. The following table provides the colordefinitions:
165

Table 11: Color Definitions for the Live Column
DefinitionColor
All instances associated with this playbook are currently running.Green
One or more instances associated with this playbook are paused.Yellow
There are no instances associated with this playbook, or an instance is associatedwith this playbook but the configuration has not been deployed yet.
Gray/Black
2. Click on the caret next to the playbook name to expand or collapse the playbook instance details. If nocaret is present, then the playbook has not been applied to any device groups or network groups.
The following playbook instance details are displayed:
DescriptionColumn Name or Widget
User-defined instance name.Instance Name
Name of the schedule profile applied to the playbook instance. Forinformation on how to configure a schedule profile, see “Create a Scheduleto Automatically Play/Pause a Playbook Instance” on page 170
Click on the name to display the schedule details.
Schedule
Device group or network group to which the schedule is applied.Device/Network Group
Number of devices on which this playbook instance is deployed. This isapplicable for device group instances only, not for network group instances.
No. of devices
Current status of the playbook instance. Status can be either Running orPaused. The Status column also indicateswhether the actionwas performedautomatically or manually.
Note: If the status of a playbook instance is Running (automatic), you canmanually pause the schedule for this instance using the Pause Schedulebutton. In this case, the status will change to Paused (manual). To resumerunning the schedule for this instance, you must manually run the instanceusing the Play Schedule button. In this case, the status will change back toRunning (automatic), and the play and pause actions associated with theschedule will resume.
Status
Date and time when the playbook instance was last started or paused. Thedate reflects local browser time zone.
Started/Paused at
166

DescriptionColumn Name or Widget
This column applies only to playbook instances associated with a schedule.It indicates whether the playbook instance is scheduled to automaticallypause or play in the future. This column is blank if no schedule is associatedwith the playbook instance or if the status of the instance is Paused (manual).
Next Action
Pauses or plays a playbook instance or the schedule for a playbook instance.
The Play/Pause button toggles between the two states. Formore information,see “Manually Pause or Play a Playbook Instance” on page 169.
Play/Pause button
Deletes the playbook instance.Trash can icon
Create a Playbook Instance
To create a playbook instance for a device group:
1. Click the Configuration > Playbooks option in the left-nav bar.
2. Click the Apply icon (in the Action section of the table) for the desired playbook.
A pane titled Run Playbook: <playbook-name> appears.
3. In the Name of Playbook Instance field, fill in an appropriate name for this instance of the playbook.This is a required field.
4. (Optional) In the Run on schedule field, choose the name of the schedule that you want to apply tothis playbook instance. You can apply only one schedule per playbook instance. If you want a specificplaybook instance to run onmultiple schedules, youmust create multiple versions of the instance, eachwith its own unique name and schedule.
For information on how to configure a schedule, see “Create a Schedule to Automatically Play/Pausea Playbook Instance” on page 170.
To view information about an existing schedule:
a. Click the Settings option in the left-nav bar.
b. In the Scheduler Settings section, a summary of the properties for each saved schedule is shownin the table. Click on a specific schedule name to view additional details.
5. In theDevice Group section under Rules, apply this playbook instance to the appropriate device groupusing the drop-down list.
The list of devices in the Devices section changes based on the device group selected.
167
NOTE: If your playbook contains network rules, the Device Group section does not appear.Instead, it is replaced with a Network Groups section (not shown).
6. Click one of the devices listed in the Devices section.
Here is where you can customize the variable values that will be set for this device when the playbookis run.
7. In the section titledVariable values forDevice<DeviceName>, the variables for each rule in the playbookcan be seen by clicking on the rule name. The default values for each variable are displayed as greytext in each field. You can leave these values as-is or override them by entering a new value.
Repeat steps 6 and 7 for each device in the device group, as needed.
8. When you are satisfied that all of the variable values are appropriate for all the devices in the devicegroup, select one of the following options.
Save your edits but do not deploy the updated configuration and do not run the instance.You can use this option when, for example, you are making several changes and wantto deploy all your updates at the same time.
Save Instance
Deploy the configuration, and, if no schedule profile was applied, immediately run theinstance. If a schedule profile was applied, the instance will run according to theconfiguration of the profile.
Run Instance
168
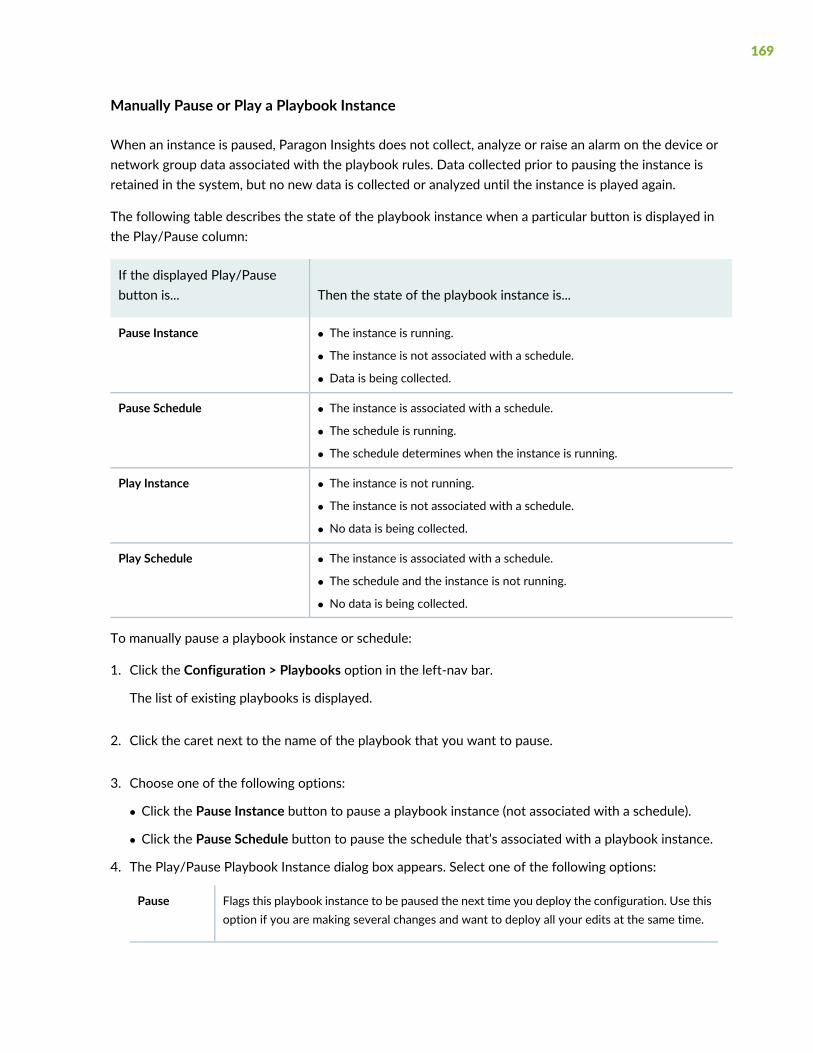
Manually Pause or Play a Playbook Instance
When an instance is paused, Paragon Insights does not collect, analyze or raise an alarm on the device ornetwork group data associated with the playbook rules. Data collected prior to pausing the instance isretained in the system, but no new data is collected or analyzed until the instance is played again.
The following table describes the state of the playbook instance when a particular button is displayed inthe Play/Pause column:
Then the state of the playbook instance is...If the displayed Play/Pausebutton is...
Pause Instance • The instance is running.
• The instance is not associated with a schedule.
• Data is being collected.
Pause Schedule • The instance is associated with a schedule.
• The schedule is running.
• The schedule determines when the instance is running.
Play Instance • The instance is not running.
• The instance is not associated with a schedule.
• No data is being collected.
Play Schedule • The instance is associated with a schedule.
• The schedule and the instance is not running.
• No data is being collected.
To manually pause a playbook instance or schedule:
1. Click the Configuration > Playbooks option in the left-nav bar.
The list of existing playbooks is displayed.
2. Click the caret next to the name of the playbook that you want to pause.
3. Choose one of the following options:
• Click the Pause Instance button to pause a playbook instance (not associated with a schedule).
• Click the Pause Schedule button to pause the schedule that’s associated with a playbook instance.
4. The Play/Pause Playbook Instance dialog box appears. Select one of the following options:
Flags this playbook instance to be paused the next time you deploy the configuration. Use thisoption if you are making several changes and want to deploy all your edits at the same time.
Pause
169

Immediately pause the playbook instance and deploy the configuration. It will take a few secondsfor the playbook table to update to show the instance is paused.
There is a slight delay in updating the table because the play and pause actions are asynchronousand run in the background, allowing you to perform other actions. The status of thisasynchronous activity can be tracked through the deploy icon located in the upper right cornerof the window (as indicated in the success message of deploy action). Once this action iscomplete, the status is reflected in the playbook table as well.
Pause &Deploy
Once the playbook table is refreshed, the playbook name shows a yellow icon in the Live column as avisual indicator that an instance is paused.
5. To resume a paused playbook instance, follow the same steps as above except choose one of thefollowing options for Step 3:
• Click the Play Instance button to resume running a playbook instance (not associatedwith a schedule).
• Click the Play Schedule button to resume running the schedule associated with a playbook instance.The schedule determines when the instance resumes playing.
Create a Schedule to Automatically Play/Pause a Playbook Instance
To automatically play/pause a playbook instance, you must first create a schedule and then apply theschedule to the playbook instance. You can apply only one schedule per playbook instance. If you want aspecific playbook instance to run on multiple schedules, you must create multiple versions of the instance,each with its own unique name and schedule.
To create a schedule for a playbook instance:
1. Click the Settings > System option in the left-nav bar.
2. Click the Scheduler tab.
3. In Scheduler Settings, click the add scheduler button (+ Scheduler).
4. Enter the necessary values in the text boxes and select the appropriate options for the playbook instanceschedule.
The following table describes the attributes in the Add a scheduler and Edit a scheduler panes:
DescriptionAttributes
Enter the name of the playbook instance schedule.Name
170

DescriptionAttributes
Choose discrete.
You can configure a discrete length of time to play the playbook instance using the Run for field.Once the run time has ended, Paragon Insights will automatically pause the instance. You can alsoconfigure Paragon Insights to automatically resume playing the instance using the Repeat field.
Scheduler Type
Use the pop-up calendar to select the date and time to play the playbook instance for the firsttime.
Start On
Configure a discrete length of time to play the playbook instance. First enter an integer value andthen choose the unit of measure (minute, hour, or day) from the drop-down list.
Once the run time has ended, Paragon Insights will automatically pause the instance. You can alsoconfigure Paragon Insights to automatically resume playing the instance using the Repeat field.
Run for
(Optional) Use the pop-up calendar to select the date and time to pause the playbook instanceindefintiely. Leave blank if you want the playbook instance to play indefinitely.
Note: If a playbook instance is associated with a schedule and is running when the End On timeis reached, then the instance will continue to run until the configured Run for length of time isreached. At this time, the instance will pause indefinitely.
End On
Configure the Run for field before configuring the Repeat field. The Repeat interval must be largerthan the configured Run for length of time.
In the drop-down list, choose one of the following:
• The frequency (every day, week, month, or year) at which you want the playbook instance toplay.
• The Never option if you want the playbook to play only once.
• The Custom option to specify a custom frequency at which you want the playbook instance toplay. Use the Repeat Every field to configure the custom frequency.
Repeat
(Optional) If you chose the Custom option for the Repeat field, enter the custom frequency atwhich you want the playbook instance to play. First enter an integer value and then choose theunit of measure (minute, hour, or day) from the drop-down list.
Repeat Every
5. Click Save to save the configuration or click Save and Deploy to save and deploy the configuration.
6. Now you’re ready to apply the schedule to a playbook instance. For more information, see “Create aPlaybook Instance” on page 167.
171

Release History Table
DescriptionRelease
Starting in HealthBot Release 3.1.0, you can add fields and keys to rules based on whether theincoming data meets user-defined conditions defined in tagging profiles.
3.1.0
Starting with HealthBot Release 3.1.0, some playbooks require the purchase and installationof advanced or premium licenses.
3.1.0
Starting in HealthBot Release 3.0.0, you can filter the Topics and Rules displayed on the leftside of the Rules page.
3.0.0
RELATED DOCUMENTATION
Paragon Insights Concepts | 22
Manage Devices, Device Groups, and Network Groups | 127
Monitor Device and Network Health
IN THIS SECTION
Dashboard | 173
Health | 182
Network Health | 190
Graphs Page | 190
172

Paragon Insights (formerly HealthBot) offers several ways to detect and troubleshoot device-level andnetwork-level health problems. Use the information provided by the following Paragon Insights GUI pagesto investigate and discover the root cause of issues detected by Paragon Insights:
Dashboard
Paragon Insights Release 4.0.0 introduces GUI enhancements brought about by the migration to a newframework. This change does not have an impact on existing functionality or resources in the GUI butintroduces the following changes in the interface:
• Favorites option
• Launchpad icon
• TSDB (time series database) dashlets
The Favorites option, denoted by a star button at top right corner of all pages, allows users to mark pagesunder the Favorites section for easier access.
In the top right corner of the UI, if you click the Launchpad button (rocket icon), you get a drop downmenu that takes you to the Sizing Tool and theGithub repository for Paragon Insights rules calledPlaybooks(github). Sizing Tool allows you to estimate the compute (vCPU), memory (RAM), and storage requirementsto deploy or scale Paragon Insights in your network. Visit the sizing tool app to estimate your requirements.
Starting with Paragon Insights Release 4.0.0, the Alarms option is renamed as Alerts. To access the Alertspage, go toMonitor > Alerts.
Use the Dashboard to create a custom view of what you’re most interested in. Paragon Insightspre-populates the dashboard with the Device List, Device Group List, and Netwok Group List dashletsand calls this viewMy Dashboard. You can create your own dashboard view by clicking the + to the rightofMy Dashboard. Custom views can be added, renamed, and deleted as you see fit.
The Dashboard also has a graphical list of pre-defined dashlets across the top that is initially hidden fromview. Click the cluster of 9 blue dots on the upper right part of the page to display or hide the availabledashlets. Each dashlet provides graphical information from a specific point of view. Many of the dashletscan be clicked on to drill down deeper into the information presented.
• Devices— Consists of devices dashlet, device vendor dashlet, and device status dashlet (see “DeviceDashlets” on page 174).
• Device Groups —Consists of device group dashlets (see “Device Group List Dashlet” on page 175).
• Network Groups—Consists of network group dashlets (see “Network Group List Dashlet” on page 177).
• Health Alert— Consists of health alert dashlets (see “Health Alert Dashlets” on page 178).
173

• TSDB (Time Series Database)—Consists of TSDB dashlets that have line charts for Buffer Bytes, BufferLength, and bar charts for Read Error for Last 5Minutes,Write Error for Last 5Minutes, and BufferLength (see “TSDB Dashlets” on page 180).
The Dashboard uses two types of colored objects to provide health status: halos and bars. The followingtable describes the meaning of the severity level colors displayed by the status halos and bars on theDashboard:
DefinitionColor
The overall health of the device, device group, or network group is normal. Noproblems have been detected.
Green
Theremight be a problemwith the health of the device, device group, or networkgroup. A minor problem has been detected. Further investigation is required.
Yellow
The health of the device, device group, or network group is severe. A majorproblem has been detected.
Red
No data is available.Gray
Device DashletsThe following table describes themain features of the Devices dashlet, Device Vendor dashlet, andDeviceStatus dashlet on the dashboard.
174

Figure 45: Devices Dashlets
DescriptionDashlets
Devices dashlet lists the status and hostname of all devices configured in Paragon Insights.
Click on the number under the Device Groups column in the dashlet to trace the device group towhich the device is added. It goes to the Device Group Configuration page.
Click the circular arrow at the top of the dashlet to refresh the dashlet.
Click the X at the top of the dashlet to remove the dashlet from the dashboard.
Devices
The half pie chart in this dashlet shows the total number of devices classified by vendor name. Eachvendor is distinguished by a unique color.
If you hover over the chart, the status halo displays the number of devices from a vendor and thepercentage share of the devices in the total.
The legend by the chart displays the names of the vendors. If you click on the name of a particularvendor, the devices from that vendor is filtered out from the data shown in the pie chart.
Device Vendor
The pie chart in this dashlet shows the total number of devices in the platform classified by healthstatus. Each health status is distinguished by a unique color.
If you hover over the chart, the status halo of each segment displays the number of devices withthe health status denoted by the segment color and the percentage share of the devices in the total.
The legend by the chart displays the health statuses of devices. If you click on the name of a particularstatus, the devices with that health status is filtered out from the pie chart.
Device Status
Device Group List Dashlet
175

The following table describes the main features of the Device Groups dashlet and Device Group Healthdashlet on the dashboard.
Figure 46: Device Group Dashlets
DescriptionDashlets
To edit device group properties, click the device group name. For information on device group properties,see “Manage Devices, Device Groups, and Network Groups” on page 127.
To display the list of devices that belong to a device group, click the integer number on this dashletthat represents the number of devices included in the device group.
To display the list of playbooks applied on a device group, click the integer number that representsthe number of playbooks applied on the device group.
To remove this dashlet from the dashboard, click the X button at the top corner of the dashlet.
The color of each segment in the pie chart represents the health status of the devices in the devicegroup. For example, if a chart has one half segment as green and the other half segment as yellow,then no problems are detected in the number of devices displayed in the green segment and minorproblems are detected in the number of devices displayed in the yellow segment.
Clicking on a segment takes you to theMonitor > Device Configuration page.
The coloring of the status halo in the pie chart segments represents the percentage of devices in thedevice group that have the health status defined by the color. For example, if the circle halo is all green,then the health of 100% of the devices in the device group is normal.
The legend by the pie chart displays the different health statuses of device groups. If you click on thename of a particular status such as healthy, the device groups with that status are filtered out fromthe pie chart.
DeviceGroups
176

DescriptionDashlets
The pie chart in this dashlet classifies all device groups in the platform by their health status. Eachhealth status is distinguished by a unique color.
If you hover over the chart, the status halo of each segment displays the number of devices in thedevice group with the health status denoted by the segment color and the percentage share of thedevices in the total.
The legend by the chart displays the device groups. If you click on the name of a particular devicegroup, the devices in that device group are filtered out from the pie chart.
DeviceGroupHealth
Network Group List DashletThe following table describes the main features of the Network Groups dashlet and Network Healthdashlet.
Figure 47: Network Group Dashlets
DescriptionDashlets
To edit network group properties, click the network group name. For information on network groupproperties, see “Manage Devices, Device Groups, and Network Groups” on page 127.
Click the X at the top of the dashlet to remove the dashlet from the dashboard.
Click the name of a network group in the dashlet to open the Network Health page of a particularnetwork group.
The status icons displayed against a network group name represents the overall health status ofthe network group. It can read no data or display an icon to indicate warning, alert, and healthystatus.
NetworkGroups
177

DescriptionDashlets
This dashlet shows a pie chart with several segments to classify the network groups based on theirnetwork health. The segment size denotes the number of network groups with the status of thatsegment. The segment color represents the overall health status of the network group(s) in thatsegment.
For example, if you hover over a red segment in the chart, it displays the name(s) of the networkgroup(s) with major alerts and the total count of network groups with major alerts.
The legend by the pie chart displays the names of all network groups. If you click on the name ofa particular network group, that group is filtered out from the pie chart.
NetworkHealth
Health Alert DashletsThe following table describes the properties of the Health Alert dashlets.
178
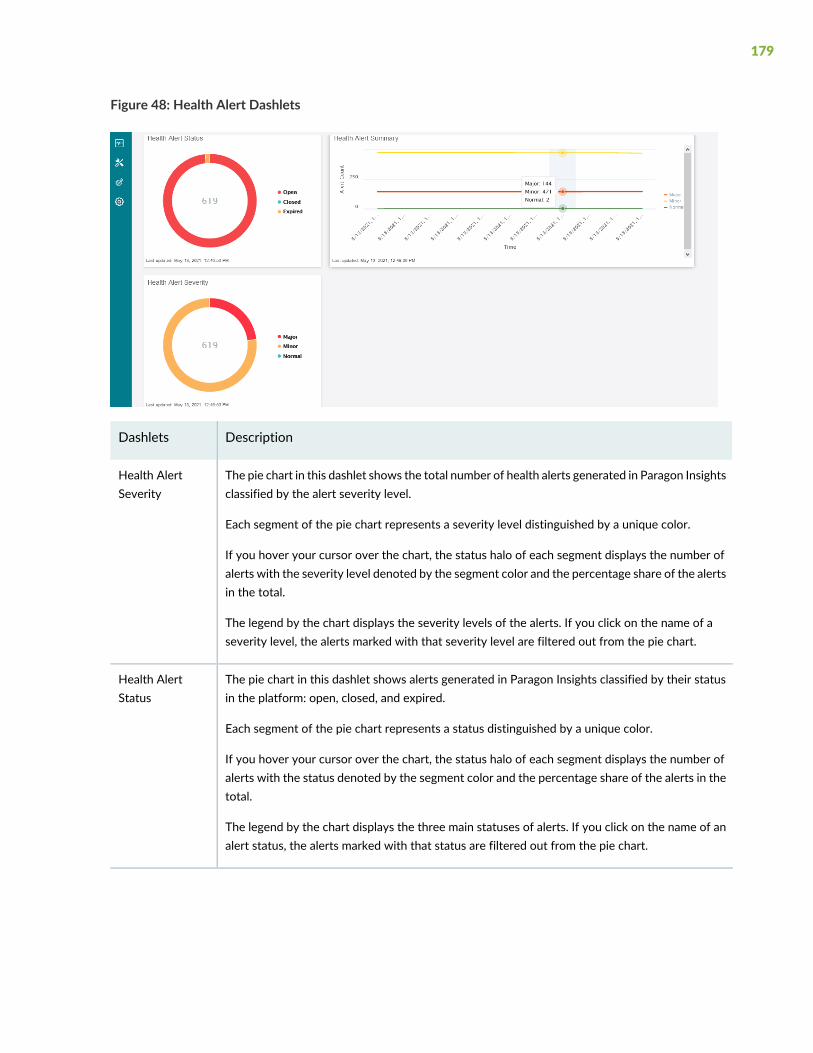
Figure 48: Health Alert Dashlets
DescriptionDashlets
The pie chart in this dashlet shows the total number of health alerts generated in Paragon Insightsclassified by the alert severity level.
Each segment of the pie chart represents a severity level distinguished by a unique color.
If you hover your cursor over the chart, the status halo of each segment displays the number ofalerts with the severity level denoted by the segment color and the percentage share of the alertsin the total.
The legend by the chart displays the severity levels of the alerts. If you click on the name of aseverity level, the alerts marked with that severity level are filtered out from the pie chart.
Health AlertSeverity
The pie chart in this dashlet shows alerts generated in Paragon Insights classified by their statusin the platform: open, closed, and expired.
Each segment of the pie chart represents a status distinguished by a unique color.
If you hover your cursor over the chart, the status halo of each segment displays the number ofalerts with the status denoted by the segment color and the percentage share of the alerts in thetotal.
The legend by the chart displays the three main statuses of alerts. If you click on the name of analert status, the alerts marked with that status are filtered out from the pie chart.
Health AlertStatus
179

DescriptionDashlets
The chart in this dashlet shows a time line view of alerts generated in Paragon Insights classifiedby their severity levels.
Each severity level in the chart is distinguished by a unique color.
If you hover your cursor over any time point in the chart, the number of alerts per severity levelis displayed for that time.
The legend by the chart displays the severity levels of alerts. If you click on the name of an alertseverity level, alerts marked with that severity are filtered out from the chart.
Health AlertSummary
TSDB DashletsEach TSDB table row, that is also known as a point, contains data for a particular key at a given time. InTSDB, write or read requests are executed by grouping multiple points into a batch point.
Buffer Length denotes the number of batch points that are buffered per node at a given time. BufferedBytes denotes the total size of the batch points buffered per TSDB node. In TSDB, a maximum of 1GB ofbatch point can be buffered per node.
Read or write errors occur when TSDB does not accept more requests as the buffer is full or because ofissues in Kubernetes clusters. Errors can be minimized through database sharding. For more information,see “Paragon Insights Time Series Database (TSDB)” on page 68.
Figure 49 on page 180 shows a sample TSDB dashboard.
Figure 49: Paragon Insights TSDB Dashlets
180
The following table describes the main features of the time series database dashlet on the Dashboard. Forinformation on how TSDB works, see “Paragon Insights Time Series Database (TSDB)” on page 68.
DescriptionDashlets
The chart in this dashlet shows a time line view of buffered bytes classified by the number ofnodes.
Each TSDB node in the chart is distinguished by a unique color.
If you hover your cursor over any time point in the chart, the total buffered bytes per nodefor that time is displayed.
The legend by the chart displays the nodes. If you click on the name of a node, buffered bytesdata of that node is filtered out from the chart.
When the chart refreshes, the vertical axis of buffered bytes is auto adjusted based on thedata. The data in vertical axis is in bytes.
To delete the dashlet, click the X at the top of the dashlet.
TSDB Buffer Bytes
The chart in this dashlet shows a time line view of buffer length classified by the number ofnodes.
Each TSDB node in the chart is distinguished by a unique color.
If you hover your cursor over any time point in the chart, the buffer length per node for thattime is displayed.
The legend by the chart displays the nodes. If you click on the name of a node, buffer lengthdata of that node is filtered out from the chart.
The vertical axis shows data of buffer length in terms of absolute number of batch points.
To delete the dashlet, click the X at the top of the dashlet.
TSDB Buffer Length
The bar chart in this dashlet shows the number of TSDB read errors collected every 5 minutesclassified by the number of nodes.
The legend displays the nodes. If you click on the name of a node, the read error data of thatnode is filtered out from the chart.
The horizontal axis shows read errors in absolute number.
To delete the dashlet, click the X at the top of the dashlet.
TSDB Read ErrorsLast 5 Minutes
181
DescriptionDashlets
The bar chart in this dashlet shows the number of TSDBwrite errors collected every 5minutesclassified by the number of nodes.
The legend displays the nodes. If you click on the name of a node, the write error data of thatnode is filtered out from the chart.
The horizontal axis shows write errors in absolute number.
To delete the dashlet, click the X at the top of the dashlet.
TSDB Write ErrorsLast 5 Minutes
The bar chart in this dashlet shows the number of TSDB buffer length classified by the numberof nodes.
The legend displays the nodes. If you click on the name of a node, the buffer length data ofthat node is filtered out from the chart.
The horizontal axis shows buffer length in absolute number.
To delete the dashlet, click the X at the top of the dashlet.
Latest TSDB BufferLength
Health
Use the Health page (Monitor > Health) to monitor and track the health of a single device, a device group,or a network. You can also troubleshoot problems. Select a device group using the entity type selectors(DEVICE, DEVICE GROUP, or NETWORK) located in the top left corner of the page. Once selected, youcan then select individual devices or all of the devices from the group by clicking the Select devicespull-down menu. The page is divided into the following three main views that, when used together, canhelp you investigate the root cause of problems detected on your devices:
• Timeline View on page 182
• Tile View on page 184
• Table View on page 186
• Time Inspector View on page 188
Timeline ViewIn timeline view, you can monitor real-time and past occurrences of KPI events flagged with a minor ormajor severity level health status. The general characteristics and behaviors of the timeline include (seeFigure 50 on page 183):
182

• Clicking on the right caret next to the Timeline View heading expands or collapses the timeline.
• Each dot or line in the timeline represents the health status of a unique KPI event (also known as aParagon Insights rule trigger) for a pre-defined KPI keywithwhich Paragon Insights has detected aminoror major severity level issue. The name of each event is displayed (per device) directly to the left of itsassociated health status dot or line.
• The health status dot or line for each unique KPI event in the timeline can consist of several differentKPI keys. Use tile view and table view to see the health status information for the individual KPI keys.
• Only minor or major severity level KPI events are displayed in the timeline. Yellow represents a minorevent, and red represents a major one.
• A KPI event that occurs once (at only one point in time) and does not recur continuously over time isrepresented as a dot.
• A KPI event that occurs continuously over time is represented as a horizontal line.
• Timeline data is displayed for a 2-hour customizable time range.
• The red vertical line on the timeline represents the current time.
• The blue vertical line on the timeline represents the user-defined point of time for which to display data.
Figure 50: Timeline view
The following table describes the main features of the timeline:
DescriptionFeature
Hover over the dot or horizontal line to display the associated KPI event name,device name, health status severity level, and event start and end times.
Additional health status information about the KPI event can be found in tileview. For information about tile view, see the “Tile View” on page 184 section.
Display information about a dot orhorizontal line in the timeline.
183

DescriptionFeature
Options:
• Click and drag the x-axis of the timeline to the left or to the right.
• Click the Zoom In or ZoomOut buttons in the top right corner of the timeline.
For the displayed data, change therange of time (x-axis) that is visibleon the page.
Use the blue vertical line to customize the time range of data to display. Optionsfor enabling the blue vertical line:
• Click inside the timeline grid at the particular point in time youwant to displaydata.
• In the date/time drop-down menu (located above the timeline), select theparticular point in time you want to display data ..
Data is generally displayed for 1 hour before and 1 hour after the blue line.Hover over the blue line to display the exact point in time that it represents.Drag the blue line left or right to adjust the time.
NOTE: Auto-refresh is disabledwhenever you enable the blue line. Re-enablingauto-refresh disables the blue line and resets the timeline to display the mostrecent 2-hour time range of data.
Choose a different 2-hour time rangeof data to display.
Toggle the auto-refresh switch to the left.Freeze the timeline (disableauto-refresh).
Toggle the auto-refresh switch to the right.Unfreeze the timeline (enableauto-refresh).
Tile ViewThe tile view uses colored tiles to allow you to monitor and troubleshoot the health of a device. The tilesare organized first by device group, then by device component topic, and lastly by unique KPI key (seeFigure 51 on page 185). By default, the tile view data corresponds to the most recent data collected. Tocustomize the point in time for which data is displayed in tile view, select a particular point in time fromthe date/time drop-down menu (located above the timeline) or enable the blue vertical line in timelineview. For information about how to enable the blue vertical line, see the “Timeline View” on page 182section. TheComposite toggle switch (not shown) at the upper right of the TILEVIEW, allows you to selectdata from more than one device component topic to be shown in the Table View and, thus, the TimeInspector View. This can be useful when topics must be combined to find root cause for an issue. Forexample, system memory usage could combine with output queue usage to create a performance issue inan overloaded system.
184
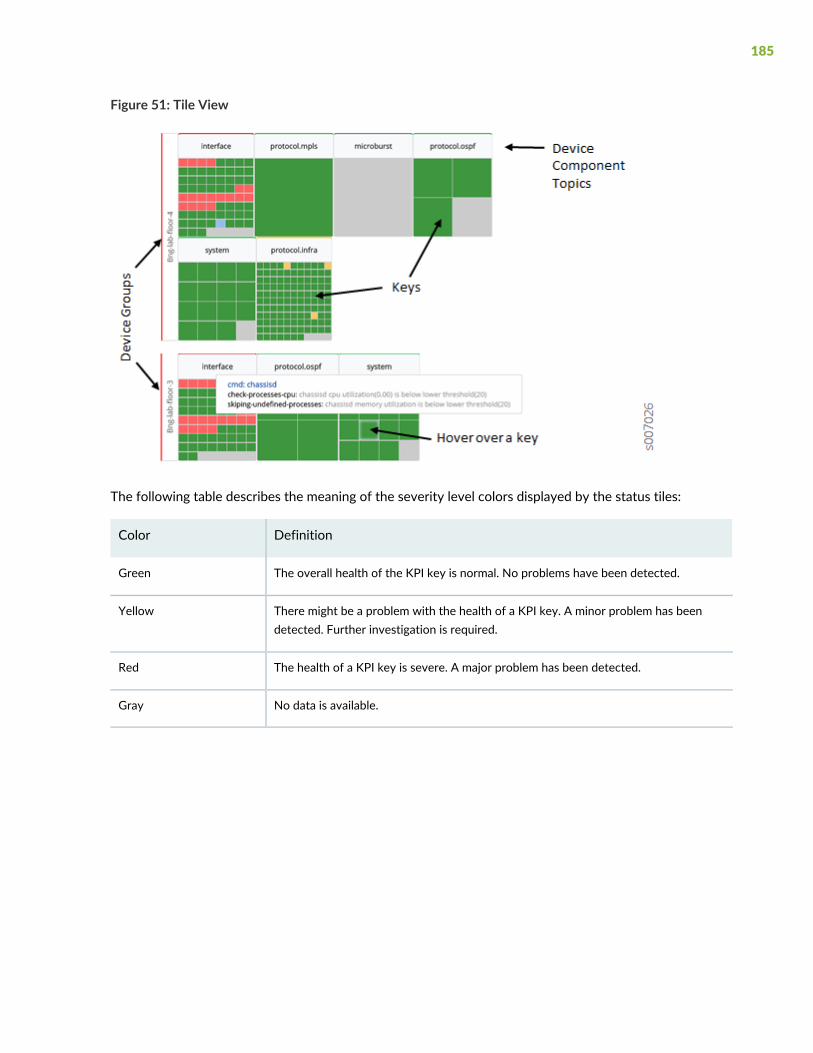
Figure 51: Tile View
The following table describes the meaning of the severity level colors displayed by the status tiles:
DefinitionColor
The overall health of the KPI key is normal. No problems have been detected.Green
There might be a problem with the health of a KPI key. A minor problem has beendetected. Further investigation is required.
Yellow
The health of a KPI key is severe. A major problem has been detected.Red
No data is available.Gray
185

The following table describes the main features of the tile view:
DescriptionFeature
Options:
• Hover over a status tile to display the name of the key, KPIs associatedwiththe key, and the status messages associated with the KPIs.
• Click on a status tile. Information about the status tile is displayed in tableview. For information about table view, see the “Table View” on page 186section.
Note: If the number of KPI keys exceeds 220, the keys are automaticallyaggregated and grouped.
Display information about a statustile.
Click on a device component topic name in tile view. For information abouttable view, see the “Table View” on page 186 section.
Display information in table viewabout the status tiles associated witha single device component topic.
When active, users can click on specific keys within the tile groups. This allowsyou to pass multiple KPIs to the Time Inspector View.
Composite Toggle
Table ViewThe table view allows you to monitor and troubleshoot the health of a single device based on ParagonInsights data provided in a customizable table. You can search, sort, and filter the table data to find specificKPI information, which can be especially useful for large network deployments. To select which attributesare displayed in the table, check the appropriate check box in the field selection bar above the table (seeFigure 52 on page 186). The checkbox on the left side of each row is used to help activate the Time Inspectorview. Multiple rows can be selected at one time.
Figure 52: Table View
186

The following table describes the Paragon Insights attributes supported in table view:
DescriptionAttributes
Time and date the event occurred.Time
Device name.Device
Device group name.Group
Rule topic name.Topic
Unique KPI key name.Keys
Key Performance Indicator (KPI) name associated with an event.KPI
Health status color. Each color represents a different severity level.Status
Health status message.Message
The following table describes the meaning of the severity level colors displayed by the Status column:
DefinitionColor
The overall health of the KPI key is normal. No problems have been detected.Green
There might be a problem with the health of a KPI key. A minor problem has beendetected. Further investigation is required.
Yellow
The health of a KPI key is severe. A major problem has been detected.Red
No data is available.Gray
The following table describes the main features of the table view:
DescriptionFeature
Click on the name of the data type at the top of the column by whichyou want to sort.
Sort the data by ascending or descendingorder based on a specific data type.
Enter the keyword in the text box under the name of a data type atthe top of the table (see Figure 52 on page 186).
Filter the data in the table based on akeyword.
187

DescriptionFeature
Options:
• At the bottom of the table, click the Previous or Next buttons.
• At the bottom of the table, select the page number using theup/down arrows (or bymanually entering the number) and then pressEnter.
Navigate to a different page of the table.
Options:
• Hover over the cell.
• Resize the column width of the cell by dragging the right side of thetitle cell of the column to the right.
If the data in a cell is truncated, view all ofthe data in a cell.
Make this row’s data available for Time Inspector view.Row selection checkbox
Time Inspector ViewStarting with HealthBot Release 3.2.0, a new view called Time Inspector is available. Time Inspector is acomposite view that is available only when the entity typeDEVICE GROUP is selected. It can be accessedby clicking the TIME INSPECTOR button located below the Timeline View pull-down menu.
This view allows you to drill down into which specific triggers within a given rule caused a sensor to displaygreen, yellow, or red status.
When the Health page is first accessed, the TIME INSPECTOR button is disabled. To activate the buttonand make the view available, you must:
• Select the Entity Type DEVICE GROUP in the top section of the Health page.
• Select at least one device from the Devices pull-down menu.
• Have valid data in at least one device component topic in TILE VIEW.
NOTE: Topics showing “no data” will not work for enabling the Time Inspector view.
• Have data appearing in the TABLE VIEW section. You can achive this by clicking the device componenttopic header in TILE VIEW.
• Select the checkbox to the left of at least one of the rows in TABLE VIEW.
When clicked, the TIME INSPECTOR button opens a pop-up window above the Health page.Figure 53 on page 189 below shows a time inspector window created from the system.storage usage topicfor a specific device.
188

Figure 53: Time Inspector Window
As you can see, the Time Inspector window has a mini timeline at the top, an incremented line chart below,and a chart selector section at the bottom. This particular chart was created as a composite (indicated bythe merging blue arrow) of a file-system-utilization in the check-storage rule of the system.storage topic.
Note that there are 3 fields in the check-storage rule: used-percentage, low-threshold, and high-threshold.Since the chart was created as a composite (fields charted together) there are three lines on the displayedchart. If the “chart fields separately” button (diverging arrows) were clicked instead, you would see 3single-line charts showing the same data.
The more rules you select with the TABLE VIEW checkboxes, the more charts you can create in the TimeInspector view.
189

Network Health
Use the Network Health page (Monitor > Network Health) to monitor and track the health of a NetworkGroup and troubleshoot problems. Select a Network Group using the drop-down list located in the topleft corner of the page. Comparable to theDevice GroupHealth page (see the “Health” on page 182 section),the Network Health page is divided into three main views: timeline, tile, and table. The Network Healthpage provides similar features and functionality for a network group as the Device Group Health pageprovides for a single device.
Graphs Page
You can use graphs tomonitor the status and health of your network devices. Graphs allow you to visualizedata collected by Paragon Insights from a device, showing the results of rule processing. Access the pagefrom the left-nav panelMonitor>Graphs>Charts
NOTE: Graphs are refreshed every 60 seconds.
Figure 54: Example of Multiple Graph Panels on a Single Canvas
Graph Types
190

Graph types include time series graphs, histograms, and heatmaps.
Time series graphs are the kind you are used to, showing the data in a ’2D’ format where the x-axis indicatestime while the y-axis indicates the value. Time series graphs are useful for real-time monitoring, and alsoto show historical patterns or trends. This graph type does not provide insight into whether a given valueis ’good’ or ’bad’, it simply reports ’the latest value’.
Histograms work quite differently. Rather than show a continuous stream of data based on when eachvalue occurred, histograms aggregate the data to show the distribution of the values over time. This resultsin a graph that shows ’how many instances of each value’. Histograms also show data in a ’2D’ format,however in this case the x-axis indicates the value while the y-axis indicates the number of instances ofthe given value.
Heatmaps bring together the elements above and provide a ’3D’ view to help determine the deviations inthe data. Like a time series graph, the x-axis indicates time, while the y-axis indicates the value. Then the’how many’ aspect of a histogram is added in. Finally, the third dimension—color—is added. It is commonto think of the colors as showing heath, i.e., red means ’bad, yellow means ’OK’, and green means ’good’.However, this is not correct; the color adds context. For each column, the bars indicate the various valuesthat occurred. The color then indicates how often the values occurred relative to the neighboring values.Within each vertical set of bars, the values that occurred more frequently show as ’hotter’ with orangeand red, while those values that occurred less frequently show as shades of green.
191

To help illustrate these graph types, consider the graphs shown below.
All three graphs are showing the same data—the running 1-minute average of CPU utilization on a deviceover the last 24 hours. However, the way they visualize the data varies:
• The time series graph provides the typical view; each minute it adds the latest data point to the end ofthe line graph. Time moves forward along the x-axis from left to right, and the data values are indicatedon the y-axis. What this graph doesn’t show is how often each data point has occurred.
• The histogram groups together the values to show how many of each data point there are. Notice thetallest bar is the one between 30 and 40, which means the most common 1-minute CPU average valueis in the 30-40% range. And how many times did this range of values occur? Based on the y-axis, therehave been over 350 instances of values in this range. The next most frequently occurring values are in
192

the 40-50% range (almost 300 occurrences), while the 0-10% range has almost no occurrences, suggestingthis CPU is rarely idle. What this graph doesn’t show is how many of each data point occurred within agiven time range.
• The heatmap makes use of elements from the other two graph types. Each small bar indicates that somenumber of instances occurred within the value range shown in the y-axis, at the given time show in thex-axis. The color indicateswhich value ranges, for each given time, occurredmore than others. To illustratethis, notice the vertical set of bars towards the right of the graph, at 18:00. In this example (at this zoomlevel), each column of vertical bars represents 12 minutes, and each small bar represents a bucket of 15values. So the first (lowest) bar indicates that within this time range there were some values in the 0-14range. The bar above indicates that within this time range there were some values in the 15-29 range,and so on. The color then indicates which bars have more values than others. In this example, the thirdbar is red indicating that for those 12minutes most of the values fell into the 30-44 range (in this examplethe count is 21). By contrast, the first bar is the most green indicating that for those 12 minutes the leastnumber of values fell into the 0-14 range (in this example the count is 1). This ’heat’ information is alsosupported by the histogram; the most frequently occurring values were those in the 30-40 range, whichindeed is the ’hotter’ range in the heatmap.
How to Create GraphsThe configuration model for graphs is to create graph panels and group them into one or more canvases.
To create a new graph panel on a canvas:
1. Click theMonitor > Graph option in the left-nav bar.
2. Choose one of the following two options:
• To create a graph in a new canvas, click the + New Canvas button.
• To create a graph within an existing canvas, select the desired canvas in the Saved Canvas and thenclick the Add Graph +button.
3. In the General section, provide the general descriptive information for the canvas (new canvas only)and graph:
DescriptionAttribute
Name of the canvasCanvas Name
(Optional) Description for the canvas.Description
Name of the graph panel.Graph Name
Options include Time Series, Histogram, and Heatmap.Graph Type
193

DescriptionAttribute
Choose the time range for the graph.
In real-time graphs, the time range sets the x-axis range. For example, selecting12 hrs means the x-axis shows the last 12 hours of data.
Time Range
4. Move down to the Query section. In the FROM section, define from where the data for the graph iscoming:
DescriptionAttribute
Choose the device group or network group.Group
Choose a device from the group.Device
Choose the Paragon Insights topic/rule name.
You can choose rolled-up measurements of fields you configured in rules. The rolled-upmeasurements are displayed in the list as topic/rule_roll-up-order. For example, my-rule_hourlyand my-rule_yearly.
The roll-upmeasurement’s fields are listed as original-field-name_aggregation-type. For example,field-name_count and field-name_mean.
Rolled-upmeasurements use aggregate functions on field data collected over a time to summarizethe data into a single data point. You can configure how frequently the field datamust be rolled-upor summarized. The default roll-up order (frequency) available in Paragon Insights are daily, hourly,monthly, weekly, or yearly.
Topic / Rule
5. In the SELECT section, select the data field and apply aggregation and transformation types to the data:
DescriptionAttribute
Choose a field name.
This list is derived based on the fields defined in the selected topic/rule.
Field
(Optional) In the drop-down list, choose a data aggregation type.Aggregation
(Optional) In the drop-down list, choose a data transformation type.Transformation
194

6. In theWHERE section, filter data based on field and KPI key:
DescriptionAttribute
(Optional) Choose a key or field. A key is an index field such as interface name.
This list is derived based on the keys and fields defined in the selected topic/rule.
Tag Key / Field
7. In the GROUP BY section, specify how to group the data based on time interval, fill, and KPI keys:
DescriptionAttribute
(Optional) Specify a time interval by which to group the data.$_interval
(Optional) Choose how to show a time interval when no data arrives from the device:
null—(default) Report the timestamp and null as the output value.
none—Report no timestamp and no output value.
0—Report 0 as the output value.
previous—Report the value from the previous time interval as the output value.
linear—Report the results of linear interpolation as the output value.
fill(null)
(Optional) Choose a tag by which to group the data. A key is an index field such as interfacename.
This list is derived based on the keys and fields defined in the selected topic/rule.
Tag Key (the + icon)
8. (Optional) Move down to the Visualization section, and define y-axis details.
9. Click Save to save the graph and display the data.
Managing Graphs• To edit a graph, click the pencil icon located in the top right corner of the graph itself.
• To delete a graph, click the trash can icon located in the top right corner of the graph itself.
• To delete a canvas, click the trash can icon located in the top right corner of the canvas.
Graph Tips and Tricks• To sort canvases on the Saved Canvas page, click on the column headings.
• To reorganize graphs on the screen, hover your mouse near the upper-left corner of a graph panel andclick-and-drag it to the desired position.
195

• To resize a graph, hover your mouse over the lower-right corner of the graph panel and click-and-dragit to the desired size.
• To change the color of graph elements, click the color bar for the desired line item under the graph.
• To zoom in on a graph, click and drag across the desired section of the graph; to zoom out, double-clickon the graph.
• To isolate an element on the graph, click its related line item under the graph; to view all elements again,click the same line item.
Use CasesHow do I monitor interface flaps for a single interface?
Playbook used: interface-kpis-playbook
Graph configuration
196

Graph panel
How do I monitor interface flaps for all ’ge’ interfaces on a device in a single graph?
Playbook used: interface-kpis-playbook
Graph configuration
197

Graph panel
How do I monitor system memory usage for all devices in a device group in a single graph?
Playbook used: system-kpis-playbook
198

Graph configuration
199

200

Graph panel
How do I monitor RE CPU usage for multiple devices in a single graph?
Playbook used: system-kpis-playbook
201

Graph configuration
202

Graph panel
How do I monitor RE CPU usage for multiple devices side by side?
Playbook used: system-kpis-playbook
203

Graph configuration
204

Graph panel
Release History Table
DescriptionRelease
Paragon Insights Release 4.0.0 introduces GUI enhancements brought about by themigration to a new framework.
4.0.0
Starting with HealthBot Release 3.2.0, a new view called Time Inspector is available3.2.0
205

RELATED DOCUMENTATION
Manage Devices, Device Groups, and Network Groups | 127
Paragon Insights Rules and Playbooks | 143
Understand Resources and Dependencies
IN THIS SECTION
Resources | 207
Resource Dependencies | 207
Use Cases | 208
Paragon Insights monitors network resources — such as devices, interfaces, protocols, label switched paths— through rules deployed in the network. A rule can capture specific information about a key performanceindicator (KPI) in a network and generate alerts when the KPI experiences an error event, but rules cannotdecipher the root cause of the error event. You require a network-wide view to correlate an error eventin one resource to a failure in another resource.
Paragon Insights tackles the need to connect events in a network through resources. A resource is a buildingblock that creates a wider network view by forming single-level dependencies vis-à-vis other resources.
The following list has frequently used terms and concepts connected with resources:
Resource— A resource is a specific component that constitute the network.
For example, chassis, line card, protocols, system memory, interfaces, and so on.
Resource instances—Resources such as an interface, Flexible PIC Concentrators (FPC), router ids, or virtualprivate networks can have many instances. An instance is a specific realization of the resource. Forexample, an interface includes instances such as ge-0/0/1, et-1/0/0, xe-2/0/1, and so on.
Property— Properties define characteristics of a resource. A property is comparable to fields in rules.
For example, neighbor-id andmaximum transmission unit (MTU) are characteristics of routing-optionsresource and interface resource, respectively.
Key properties in resources— A key property uniquely identifies all instances of a resource.
206

For example, interface-name property uniquely identifies interface resource instance with namege-0/0/0 from other instances. MTU cannot be a unique property.
Resource dependency— Defines the relationship between two resources.
Dependent resource— In a resource dependency, a dependent resource is the one that depends on anotherresource. In a single-level resource dependency, a dependent resource is a child resource of anotherresource.
Dependency resources— In a resource dependency, a dependency resource is the one that impacts anotherresource. In a single-level resource dependency, a dependency resource is a parent resource of anotherresource.
Resources
A resource can be part of a device or the network. Device resources can be an interface, line cards, chassis,OSPF, etc. Network resources are resources that spanmultiple devices in a network, such as IPSec tunnels,VPN, etc.
As with rules, you configure resources under the topic hierarchy in Paragon Insights. A resource and itsproperties are derived from rules. In this process, resources consolidate the following aspects in ruleconfigurations.
• A resource, such as interface, is configured in different rules depending on which aspect of interface therule monitors.
• Each rule has different field configuration for a resource property.
An interface name can be configured as interface-name in one rule and intf-name in another rule.
When you configure interface as a resource, you can choose the specific interface rules fromwhich ParagonInsights detects instances of interface resource. The exact rules you select to identify a resource dependon your use case.
A resource property aggregates instances from referenced rules.When you configure a resource property,you can refer multiple rules where the field configurations are different for that property.
Resource Dependencies
Resource dependency defines the relationship between a dependent resource (child resource) and adependency resource (parent resource). While configuring dependency, you begin with a dependent
207

resource and refer dependency resources that the child resource depends on. A dependency configurationalso has terms that contain the logic to map dependency between two resources.
There are three types of dependency based on the type of resources involved, as described inTable 12 on page 208. You can define dependencies between resources in the same device (Local Deviceand Network), between resources in different devices (Other Device), between a network resource toanother network resource (Other Network), and a network resource to a device resource (Other Device).
Table 12: Types of Resource Dependency
Other NetworkOther DeviceLocal Device and Network
virtual private network (VPN)→interface 1 (device 1)
Interface 1 (device 1) → interface 2(device 2)
Interface → line card
VPN → IPSec tunnelOSPF (device 1) → OSPF (device 2)Line card → chassis
You can configure multiple single-level dependencies for a resource. Consider the following chains ofdependencies:
• VPN→ LSP → interface → Line card
• VPN→ interface → Line card
When you configure VPN as a resource, you can define VPN’s dependency on Label Switched Paths (LSPs)as one dependency and VPN’s dependency on interface as a second dependency. For LSP as a resource,you can define its dependency on interface. For interface as a resource, you can define its dependencyon line card.
A dependency term logic can involve checking parts of a dependent resource property with parts ofdependency resource's property, checking all instances of the dependency resource, checking all devicesthat have dependency resource instances, checking all or specific device groups, and checking all or specificnetwork groups.
Paragon Insights supports matches-with and user-defined functions in the dependency condition.
As dependency configurations can involve complex operations, Paragon Insights also allows you to executesuch operations in a function. The function returns a Boolean value that can be used to check dependency.
Use Cases
Resource and dependency configurations serve the following use cases:
208

Root cause analysis—You can understand the root cause of a failure in your network. Refer the resourcedependencies and use the relationship between resources to diagnose alerts generated by triggers inrules.
Smart alarms—Through smart alarms, Paragon Insights links several resources that have a failure to anotherresource that is the cause of the failure.
RELATED DOCUMENTATION
About the Resources Page | 209
About the Resources Page
IN THIS SECTION
Tasks You Can Perform | 210
Fields in Resources Table | 211
209

You can access the Resources page from Configuration > Resources.
Figure 55: Resource Dependency Visual Panel
The Resources page displays a visual representation of default resources in the Paragon application. It alsoshows that a dependent (child) resource depends on the preceding dependency (parent) resource in themodel. The visualization is synchronous with Resources table so that you can work with resources fromeither the visual model or the table.
When you click on a resource on the visualization, Paragon Insights shows key properties of the resource,dependency resource (parent resource) of the current resource, and dependent resources of the currentresource (child resources).
When you click on the dependency arrow on the visualization, Paragon Insights shows the terms anddependency type configured in the child resource.
Tasks You Can Perform
You can perform the following tasks in the Resources page:
• Add a resource from the resource visualization or table. See “Add Resources for Root Cause Analysis”on page 212
• Configure dependency resource. See “Configure Dependency in Resources” on page 215
• Example Dependency Configuration of OSPF protocol. See “Example Configuration: OSPF Resourceand Dependency” on page 219
210

• Edit a resource from the resource visualization or table. See “Edit Resources and Dependencies” onpage 229
• Delete a resource from the resource visualization or table. See “Delete Resources and Dependencies”on page 233
• Filter a resource from the resource visualization or table. See “Filter Resources” on page 232
Fields in Resources Table
Table 13 on page 211 displays the fields on the Resource Dependency Model page.
Table 13: Fields on the Resource Dependency Model Page
DescriptionField
Names of topics that expands to resources within the respective topic.Name
Description you enter for the resource during resource configuration.Description
When you expand the topics, you can view key properties you configured for eachresource.
Keys
Parent resource that impacts the resource.Dependency
Shows Paragon for system-generated (default) resources.Generated
RELATED DOCUMENTATION
Understand Resources and Dependencies | 206
211

Add Resources for Root Cause Analysis
Resource configuration requires references to rules you want to link to the resource. Ensure that youconfigure the rules before you start resource configuration.
To configure a resource:
1. Select Configuration > Resources.
The Resources page appears.
2. Do one of the following:
• Click +Add Resource on the model map.
• Click + on the Resources table.
The Add Resource page appears.
3. Enter the details as described in Table 14 on page 212.
Table 14: Fields of Properties and Functions in Resource Configuration
DescriptionField
General Information
A resource, like rules, is defined under the topic hierarchy.
Enter name of the resource. The name can follow theregex pattern: [a-zA-Z][a-zA-Z0-9_-]* and can have up to64 characters.
For example, chassis, interface, or system.
Resource Name
Select the topic to which the resource belongs.
For example, interface, chassis, or protocol.
Topic
Enter a short description of the resource and the resourceson which this resource is dependent.
Description
Properties
Properties are characteristics such as name,MTU, neighbor-id etc. of a particular resource. A property of one resourcecan be matched with property of another resource to establish dependency.
212

Table 14: Fields of Properties and Functions in Resource Configuration (continued)
DescriptionField
Enter name of the resource property. The name can followthe regex pattern: [a-zA-Z][a-zA-Z0-9_-]* and can haveup to 64 characters.
For example, neighbor-id and interface-name.
Property name
Select the type of property input.
You can choose from string, integer, floating point, orunsigned.
Property type
If you enable a resource property as key, Paragon Insightsuses this property to uniquely identify multiple instancesof that property as a resource. You can mark more thanone property as key.
For example, in interface property that usesinterface-name as a key, Paragon Insights identifiesge-0/0/1, ge-1/2/0, ge-1/0/0 as unique instances ofinterface resource.
Add as a key
Source Configuration
Rules and fields are the sources from which Paragon Insights discovers a resource property.
Add a rule name in the topic/rule format.
For a resource property, you can add one or more rulesas sources.
Rule Name
Select a field configured in the rule.Field Name
(Optional) Functions
You can enter a function in conditional statements that check for resource dependency.
Enter a function name that follows the[a-zA-Z][a-zA-Z0-9_-]* pattern.
Function name
Select the file name where functions are defined.
Paragon Insights supports only Python functions.
Path to function
213

Table 14: Fields of Properties and Functions in Resource Configuration (continued)
DescriptionField
Select the name of the function youwant to execute fromthe given file.
Method name
Enter a description of the function.Description
Arguments (Add Item)
Add argument or parameters defined in the function.Name
Toggle the switch on if the function arguments you addedmust be includedwhen Paragon Insights calls the function.
Mandatory
4. Click Save & Exit.
The Save Resource Configuration dialog appears.
5. Do one of the following:
• Click Save and Deploy.
You can save the resource configuration and deploy it.
• Click Save.
You can only save the resource configuration but not deploy it.
If you save your configuration by only entering the details in the table, you complete the resourceconfiguration. You can see the new resource on the Resources page.
To connect the resource you add to another resource on the visual panel, youmust configure dependencyfor this resource.
RELATED DOCUMENTATION
Configure Dependency in Resources | 215
214

Configure Dependency in Resources
Before you configure dependency for a dependent (child) resource, you must complete configuring thedependency (parent) resources. See “Add Resources for Root Cause Analysis” on page 212 for moreinformation.
To configure a resource dependency:
1. Select Configuration > Resources.
The Resources page appears.
2. Select a resource from Resources table and click edit (pencil icon).
The Edit Resource page appears.
3. Click Next until you view the Dependency page.
4. Enter the details as described in Table 15 on page 216.
5. Click Save.
The Dependency page appears.
6. Click Next.
You can see a collapsed view of the resource and dependency configurations you added.
7. (Optional) Click View JSON to preview the JSON format of the configuration.
8. Click Save & Exit.
The Save Resource Configuration dialog appears.
9. Do one of the following:
• Click Save and Deploy.
Paragon Insights saves and deploys the configuration to form dependency between the resourcesand generate smart alarms.
• Click Save.
Paragon Insights saves the configuration to form dependency but does not generate smart alarms.
You can see the new resource and its dependency mapped in the Resources page.
215

Table 15: Fields in Dependency Configuration
DescriptionField
Dependent-resource-name depends on
Enter configuration details of dependency (parent) resource to establish dependency with dependent (child) resource.
Select the dependency resource that impacts your dependent (child) resource.Resource Name
Add Variables
Variables in this section are used to extract parts of the child resource’s property. Such variables are used to checkdependency using conditional statements.
Variables configured here can be used to check dependency in all terms.
Enter name for the variable. The name can follow the regex pattern:[a-zA-Z][a-zA-Z0-9_-]* and can have up to 64 characters.
For example, interface-name-split.
Name
Enter a regular expression to extract parts of a property value.
See regex package for more information.
For example, if you use the regular expression “.*(\d+)/(\d+)/\d+” on interface-nameproperty of interface resource, you can extract line card number and PIC number.
The example regex forms two capture groups to extract line card number and PICnumber. The first capture group, which is line card number, can be referred asinterface-name-split-1 and second capture group, which is PIC number, can bereferred as interface-name-split-2.
Expression
Select the name of the dependent (child) resource.Resource label
Select a property in the child resource on which regex expression should be applied.Field
Enable this field.
If you enable this field, Paragon Insights ignores the case of resource propertieswhen processing conditions.
Case sensitive
Add Terms (Terms > Add Item)
Terms contain the logic to check for a dependency relation between resources.
Enter a term name that follows the [a-zA-Z][a-zA-Z0-9_-]* pattern.Term Name
216

Table 15: Fields in Dependency Configuration (continued)
DescriptionField
Enable this field if your dependency logic involves checking if a child resourceproperty is dependent on multiple instances of a parent resource property.
For example, you configured Aggregated Ethernet (link aggregation group) as adependent (child) resource to interface resource. As AE depends on multiple links(interface resource), you must enable Depends on Multiple Instances knob.
Depends onMultiple Instances
Select the type of dependency.
Local Device and Network dependency is the default option.
If you select Other Device dependency, configure details in For Every Device section.
If you select Other Network dependency, configure details in For Every NetworkGroup section.
See “Understand Resources and Dependencies” on page 206 for more information.
Dependency Type
This field is disabled by default.
Enable this field if your dependency logic involves checking condition in other terms.
Evaluate Next Term
Enter the following details of a child resource property:
• Name
• Regular Expression
• Resource Name
• Resource Property Field
You can configure a variable for a child resource property. Variable you configurehere can only be used in conditional statements within the term.
(Optional) Add Variable
For Every Device
Selects a device from a list of devices in device groups.
Enter a name for the dependency (parent) resource instance that is selected. Thename must follow the [a-zA-Z][a-zA-Z0-9_-]* pattern.
Label As
Enable this field if you want Paragon Insights to check devices in all device groupsfor dependency.
Across all device groups
Enter the names of device groups. The child resource propertywill be checked againstdevices in the specified device groups for dependency.
In device groups
217

Table 15: Fields in Dependency Configuration (continued)
DescriptionField
For Every Network Group
Instructs Paragon Insights to perform the dependency logic in all or select network groups.
Enter a name for the dependency (parent) resource instance that is selected. Thename must follow the [a-zA-Z][a-zA-Z0-9_-]* pattern.
Label As
Enable this field if you want Paragon Insights to check all network groups fordependency.
Across all network groups
Enter the names of network groups. The child resource property will be checkedagainst instances of network resource property in the specified network groups.
In network groups
Locate Resource
The locate resource iterates through all instances of a given resource.
Select a resource.
If the resource type is Local Device & Network, the resource in the list is of theformat topic-name/resource-name.
If the resource type isOther Device orOther Network, then the resource in the listis of the format for every device/network label-as:topic-name/resource-name.
Resource Name
Enter a label name.
Paragon Insights stores each instance of the selected resource in the label. Forexample, instances such as interface instances or OSPF sessions.
Label As
Enter the following details of a resource property of the selected resource:
• Name
• Regular Expression
• Resource Name
• Resource Property Field
You can configure a variable for a property of the selected resource. Variable youconfigure here can only be used in conditional statements within the term.
(Optional) Add Variable
218

Table 15: Fields in Dependency Configuration (continued)
DescriptionField
Conditions in Locate Resource are used to identify if the selected resource is correctone or not. If the condition does not match for a particular instance it picks the nextinstance and checks the condition. This continues until we get an instance whereconditions matches, or all the instances of the resources are exhausted.
To check dependency, select a resource property in left-hand side (LHS), a remoteresource property in RHS and the operator to check for a condition.
Paragon Insights supports matches-with as a condition. You can also add functionsin the LHS field of the conditional statement.
Conditions
RELATED DOCUMENTATION
Add Resources for Root Cause Analysis | 212
Example Configuration: OSPF Resource and Dependency | 219
Understand Resources and Dependencies | 206
Example Configuration: OSPF Resource andDependency
Before you begin configuring the OSPF resource and dependency, you must deploy the followingconfigurations:
• Sub-interface as a resource with interface-name and sub-interface index as key properties.
• Routing options as a resource with router-id as a key property.
The example configurations create OSPF protocol dependency between two devices. The OSPF protocolruns on an interface between two devices. So, the protocol forms two types of dependencies in the exampleconfiguration. The first dependency is betweenOSPF and the device, known as Local Device andNetworkdependency in the configuration. The second dependency is between OSPF protocol and the remotedevice, known as Other Devices dependency in the configuration. Paragon Insights establishes the twodependencies using the following properties in device 1 and device 2 as shown in Figure 56 on page 220.
219

Figure 56: Resources and Properties Used for OSPF Dependencies
The sub-interface properties and OSPF interface names are used to create local dependency between alocal device and the OSPF session at one end and between the remote device and the OSPF session atthe other end.
The neighbor ID, designated router address and the device's router ID are used to create device-to-device(Other Device) dependency.
FIGURE2 shows how the iteration in locate resource configurations creates the device-to-devicedependency.
220

Figure 57: Locate Resource Flowchart of OSPF Other Device Dependency
To configure OSPF resource and its dependencies:
1. Select Configuration > Resources.
The Resources page appears.
2. Select OSPF resource from the Resources table and click edit (pencil icon).
The Edit Resource page appears.
221

3. Enter the details as described in Table 16 on page 222.
Table 16: Fields of Properties in OSPF Resource Configuration
DescriptionField
General Information
A resource, like rules, is defined under the topic hierarchy.
Enter ospf.
The name can follow the regular expression pattern:[a-zA-Z][a-zA-Z0-9_-]* and can have up to 64 characters.
For example, the name can also be Ospf-1.
Resource Name
Select protocol.Topic
Enter a short description of OSPF dependencies.Description
Property Designated Router Address
Properties are characteristics such as name,MTU, neighbor-id etc. of a particular resource. A property of one resourcecan be matched with the property of another resource to establish dependency.
Enter dr-address.
The name can follow the regular expression pattern:[a-zA-Z][a-zA-Z0-9_-]* and can have up to 64 characters.
Property name
Select String.Property type
Not applicable.
If you enable a resource property as key, ParagonAutomation uses this property to uniquely identifymultipleinstances of that property as a resource. You can markmore than one property as key.
For example, in interface property that uses the interfacename as a key, Paragon Insights identifies ge-0/0/1,ge-1/2/0, ge-1/0/0 as unique instances of the interfaceresource.
Add as a key
Source Configuration
Rules and fields are the sources from which Paragon Insights discovers a resource property.
222

Table 16: Fields of Properties in OSPF Resource Configuration (continued)
DescriptionField
Select protocol.ospf/check-ospf-neighbor-information.Rule Name
Select dr-address.Field Name
Property Interface Name
Properties are characteristics such as name,MTU, neighbor-id etc. of a particular resource. A property of one resourcecan be matched with the property of another resource to establish dependency.
Enter interface-name.
The name can follow the regex pattern:[a-zA-Z][a-zA-Z0-9_-]* and can have up to 64 characters.
Property name
Select String.Property type
Enable this option.
If you enable a resource property as key, ParagonAutomation uses this property to uniquely identifymultipleinstances of that property as a resource. You can markmore than one property as key.
For example, in interface property that uses the interfacename as a key, Paragon Insights identifies ge-0/0/1,ge-1/2/0, ge-1/0/0 as unique instances of the interfaceresource.
Add as a key
Source Configuration
Rules and fields are the sources from which Paragon Insights discovers a resource property.
Select protocol.ospf/check-ospf-neighbor-information.Rule Name
Select interface-name.Field Name
Property Neighbor ID
Properties are characteristics such as name,MTU, neighbor-id etc. of a particular resource. A property of one resourcecan be matched with the property of another resource to establish dependency.
223

Table 16: Fields of Properties in OSPF Resource Configuration (continued)
DescriptionField
Enter neighbor-id.
The name can follow the regular expression pattern:[a-zA-Z][a-zA-Z0-9_-]* and can have up to 64 characters.
Property name
Select String.Property type
Enable this option.
If you enable a resource property as key, ParagonAutomation uses this property to uniquely identifymultipleinstances of that property as a resource. You can markmore than one property as key.
For example, in interface property that uses the interfacename as a key, Paragon Insights identifies ge-0/0/1,ge-1/2/0, ge-1/0/0 as unique instances of the interfaceresource.
Add as a key
Source Configuration
Rules and fields are the sources from which Paragon Insights discovers a resource property.
Select protocol.ospf/check-ospf-neighbor-information.Rule Name
Select neighbor-id.Field Name
4. Click Next twice to go to the Dependency page.
The Dependency page appears.
5. Click + in the Dependency page.
A new Resource section appears.
6. Enter the details as described in Table 17 on page 224.
Table 17: Local Device and Network Dependency Configuration
DescriptionField
OSPF depends on
224

Table 17: Local Device and Network Dependency Configuration (continued)
DescriptionField
Select interfaces/sub-interfaces.Resource Name
Add Terms (Terms > Add Item)
Terms contain the logic to check for a dependency relation between resources.
Enter ifl-dependency
The name follows the [a-zA-Z][a-zA-Z0-9_-]* pattern.
Term Name
Enable this option.
Paragon Insights checks with multiple instances of the propertyinterface name and the property sub-interface index configured inresource sub-interface.
Depends on Multiple Instances
Select Local Device & Network.
See “Understand Resources andDependencies” on page 206 formoreinformation on dependency types.
Dependency Type
Name: Enter ospf-interface-split.
Expression: Enter (.*)\.(\d+)
Field: Enter $interface-name.
Add Variable
Locate Resource
Iterates over all instances of the interfaces and the sub-interface index in resource sub-interfaces to find localdependency.
Select interfaces/sub-interfacesResource Name
Enter ifl.
Paragon Insights stores each instance of the interface resource tocheck for dependency.
Label As
225

Table 17: Local Device and Network Dependency Configuration (continued)
DescriptionField
The first condition checks for a match between the OSPF resource’sinterface property and the interface resource’s interface instances.
In the left-hand side (LHS), select $ospf-interface-split-1.
Select matches-with as operator.
In the right-hand side (RHS), select $ifl:interface-name.
Click + to add a second condition that checks for a match betweenthe OSPF interface’s sub-interface index and the resource subinterface’s sub-interface index.
In the LHS, select $ospf-interface-split-2.
Select matches-with as operator.
In the RHS, select $ifl:sub-interface-index.
Conditions
Conditions in Locate Resource are used toidentify if the selected resource is the correctone or not. If the condition does not match aparticular instance, Paragon Insights picks thenext instance and checks for the condition.This continues until we get an instance wherethe condition matches, or all the instances ofthe resource are exhausted.
7. Click Save.
The Edit Resource page appears.
You can find the new term in Terms section. The OSPF's interface name and interface sub-index ischecked against the sub interface resource's interface name and sub-index. When Paragon Insightsfinds a match, the interface from the OSPF resource monitored in a device forms a local dependencywith the interface from the interface resource of the same device.
8. Click + in the Terms section.
You can add a second term to configure Other Device dependency for OSPF resource.
9. Enter the details as described in Table 15 on page 216.
Table 18: Other Device Term Configuration
DescriptionField
Add Terms (Terms > Add Item)
Terms contain the logic to check for a dependency relation between resources.
Enter ifl-remote-dependency.
The name must follow the [a-zA-Z][a-zA-Z0-9_-]* pattern.
Term Name
226

Table 18: Other Device Term Configuration (continued)
DescriptionField
Select Other Device dependency.
See “Understand Resources and Dependencies” on page 206for more information on dependency types.
Dependency Type
For Every Device
Selects a device from a list of devices in device groups.
Enter remote-device.
The name follows the [a-zA-Z][a-zA-Z0-9_-]* pattern.
Label As
Locate Resource
Define condition to check if the local device’s OSPF neighbor-id is the remote device’s router-id.
Enter remote-device:protocols/routing-instance.Resource Name
Enter remote-routing-instance.Label As
In the LHS, select $neighbor-id.
In the operator field, select matches-with.
In the RHS, select $remote-routing-instance:router-id.
Conditions
Conditions in Locate Resource are used to identify ifthe selected resource is the correct one or not. If thecondition does not match a particular instance,Paragon Insights picks the next instance and checksfor the condition. This continues until we get aninstance where the condition matches, or all theinstances of the resource are exhausted.
Locate Resource
Use resource Routing Instance to collect router-id of the local device.
Enter protocol/routing-instance.Resource Name
Enter label name as local-routing-instance.Label As
Locate Resource
Define condition to check if the remote device’s OSPF neighbor-id matches with the router-id of the local device.
Enter remote-device: protocols/ospf.Resource Name
227

Table 18: Other Device Term Configuration (continued)
DescriptionField
Enter remote-ospf.Label As
In the LHS, enter $local-routing-instance:router-id.
In the operator field, select matches-with.
In the RHS, enter $remote-ospf:neighbor-id.
Click + to add a second condition that checks for a matchbetween local device OSPF’s designated router address andremote OSPF’s designated router address.
In the LHS, enter $dr-address
In the operator field, select matches-with.
In the RHS, enter $remote-ospf:dr-address
Conditions
Conditions in Locate Resource are used to identify ifthe selected resource is the correct one or not. If thecondition does not match a particular instance,Paragon Insights picks the next instance and checksfor the condition. This continues until we get aninstance where the condition matches, or all theinstances of the resource are exhausted.
Locate Resource
Define a condition to check if interface name and sub-index in the remote OSPF matches with interface name andsub-index of the remote device’s interface.
Enter remote-device: interfaces/sub-interface.Resource Name
Enter remote-ifl.Label As
The first condition checks for a match between remote OSPFresource’s interface property and remote interface resource’sinterface instances.
In the LHS, select $ospf-remote-interface-split-1.
Select matches-with as operator.
In the RHS, select $remote-ifl:interface-name.
Click + to add a second condition that checks for a matchbetween remote OSPF interface’s sub interface index andremote interface instance’s sub interface index.
In the LHS, select $ospf-remote-interface-split-2.
Select matches-with as operator.
In the RHS, select $remote-ifl:sub-interface-index.
Conditions
Conditions in Locate Resource are used to identify ifthe selected resource is the correct one or not. If thecondition does not match a particular instance,Paragon Insights picks the next instance and checksfor the condition. This continues until we get aninstance where the condition matches, or all theinstances of the resource are exhausted.
228

10.Click Next.
You can see a collapsed view of the resource and the dependency configuration you added.
11. (Optional) Click View JSON to preview the JSON format of the configuration.
12.Click Save & Exit.
The Save Resource Configuration dialog appears.
Do one of the following:
1. Click Save and Deploy.
Paragon Insights saves and deploys the configuration to generate smart alarms.
2. Click Save.
Paragon Insights saves the configuration but does not generate smart alarms based on the newresource and dependency configuration you add.
You can see the OSPF resource and its dependency in the visual panel of the Resources page.
RELATED DOCUMENTATION
Configure Dependency in Resources | 215
Add Resources for Root Cause Analysis | 212
Edit Resources and Dependencies
IN THIS SECTION
Edit a Resource | 230
Edit Resource Dependency | 231
Users can edit Paragon Insights-generated (system) resources, user-generated resources, and dependenciesfrom the Resources page (Configuration > Resources). If you want to restore original configuration ofsystem resources, you can restore by uploading the configuration files. Configuration files for systemresources are available on Paragon Insights server and GitHub. You can upload resource configuration
229

from Rules page or Playbook page. See “Paragon Insights Rules and Playbooks” on page 143 for moreinformation.
NOTE: If you edit a system resource and later restore it to the original configuration, ParagonInsights continues to display the resource status as modified.
Edit a Resource
To edit a resource:
1. Select Configuration > Resources.
The Resources page appears.
2. Do one of the following:
• Select the resource from Resources table and click edit (pencil icon).
• Select the resource on the visual panel and click Edit in the information pane of the resource.
The Edit Resources page appears.
3. Make changes to the configuration.
See “Add Resources for Root Cause Analysis” on page 212 for editing resource configuration.
See “Configure Dependency in Resources” on page 215 for editing dependency configuration.
4. Click Save & Exit.
Do one of the following:
• Click Save and Deploy.
Paragon Insights saves and deploys the configuration to generate smart alerts.
• Click Save.
Paragon Insights saves the configuration but does not generate smart alerts based on the edits inresource configuration.
You can view changes in the information pane when you click on the edited resource.
230
SEE ALSO
Delete Resources and Dependencies | 233
Edit Resource Dependency
To edit a resource:
1. Select Configuration > Resources.
The Resources page appears.
2. Click on the arrow that shows dependency from the resource you want to edit to a parent resource.
The dependency page of the child resource appears.
3. Edit the dependency configuration.
See “Configure Dependency in Resources” on page 215 for editing dependency configuration.
4. Click Save & Exit.
Do one of the following:
• Click Save and Deploy.
Paragon Insights saves and deploys the configuration.
• Click Save.
Paragon Insights saves the configuration but does not deploy it.
If you changed the dependency type or Termname, you can view the changes in dependency informationwhen you hover over the arrow. If you changed the depends on (parent) resource, you can view theedited resource connected to the new parent resource.
RELATED DOCUMENTATION
Delete Resources and Dependencies | 233
231

Filter Resources
The Resource Dependency map (visual panel) has many system resources. The visual panel expands asyou add other resources. You can focus on select resources and their dependencies through a keywordsearch for a resource in the Resources page and by filtering resources.
When you filter or search a resource, the other resources gray out on the visual panel and in the Resourcestable.
To filter a resource:
1. Select Configuration > Resources.
The Resources page appears.
2. Click the filter icon (funnel) on the visual panel.
3. Click Add Filter in the menu.
The Add Criteria page appears.
4. Enter the details as described in Table 19 on page 232.
You can see the filtered resources in the visual panel and the resources table.
5. (If you added multiple criteria) Do one of the following:
1. Select AND if you want Paragon Insights to filter resources based on more than one criteria.
2. Select OR if you want Paragon Insights to filter resources based either criterion.
Table 19: Attributes in Add Criteria Page
DescriptionField
Select Topic Name, Resource Name, or Keys to filter the resources.Field
You can enter if the filter criterion includes, equal to, or not equal to your input in Valuefield.
Condition
Enter a topic's name, resource's name, or a key name.
The entry of Value depends on your selection in Field.
Value
232
RELATED DOCUMENTATION
Edit Resources and Dependencies | 229
Delete Resources and Dependencies
IN THIS SECTION
Delete a Resource | 233
Delete Resource Dependency | 234
NOTE: You cannot delete default (system-generated) resources.
Delete a Resource
To delete a resource:
1. Select Configuration > Resources.
The Resources page appears.
2. Do one of the following:
1. Select the resource from Resources table and click delete (trash icon).
2. Select the resource you want to delete on the resource visualization.
The information pane of the resource page appears.
• Click Delete.
A delete confirmation message appears.
3. Do one of the following:
1. Click Delete.
233

Paragon Insights deletes the resource.
2. Click Delete and Deploy.
Paragon Insights deletes the resource and deploy the configuration changes that occur as a resultof the deletion.
SEE ALSO
Edit Resources and Dependencies | 229
Delete Resource Dependency
To edit a resource:
1. Select Configuration > Resources.
The Resource Dependency Model page appears.
2. Click the resource dependency you want to delete on the resource visualization.
The information pane of the dependency appears.
3. Click Delete.
A delete resource dependency confirmation dialog appears.
4. Click OK.
Paragon Insights removes the dependency you selected.
RELATED DOCUMENTATION
Edit Resources and Dependencies | 229
234

Grafana Overview
Starting with Paragon Insights (formerly HealthBot) Release 4.1.0, you can use the Grafana user interface(UI) to view data of your network devices. Grafana UI renders data from Paragon Insights time seriesdatabase (TSDB). You can view this data in the form of charts, graphs, histograms, and heat maps. You canalso query data and view the results from the Grafana UI.
In releases earlier than Paragon Insights Release 4.1.0, you could only create and view graphs from theCharts page of the Paragon Insights UI.
Grafana is an open-source data visualization tool. You use Grafana to create and view charts, graphs, andother visuals to help organize and understand data. Paragon Insights uses Grafana to render graphs thatyou create from the Charts page of the UI. With Release 4.1.0, you can create graphs and other visualsdirectly from the Grafana.
When you create a chart, the data is rendered from the TSDB database, an open-source time seriesdatabase. Information sent to and received from the TSDB database is in the influxDB format.With Release4.1.0, Paragon Insights also supports Grafana's open-source influxDB plugin. After you run a query fromthe Grafana UI, the open-source influxDB sends a backend request to the Paragon Insights TSDB. TheParagon Insights TSDB sends the response in influxDB format.
In Paragon Insights Release 4.1.0, when you run a query from the Grafana UI using influxDB as a datasource, you can only view data of a specific device of a device group. You use syntax parameters such asFROM and SELECT that the influxDB recognizes. You cannot view aggregate data of a device group, orview aggregate data of multiple device groups using the influxDB plugin. However, with Release 4.2.0,Paragon Insights supports the Juniper Paragon Insights TSDB plugin.
The Juniper Paragon Insights TSDB plugin is based on the influxDB plugin but also supports the ability toview aggregate data of a device group, or view aggregate data of multiple device groups. You can viewaggregate data by using Syntax parameters such as DEVICE, DEVICE GROUPS, andMEASUREMENT.The default data source for Paragon Insights in Grafana is based on the Juniper Paragon Insights TSDBplugin.
For more information on supported syntax parameters, see Table 20 on page 236.
235
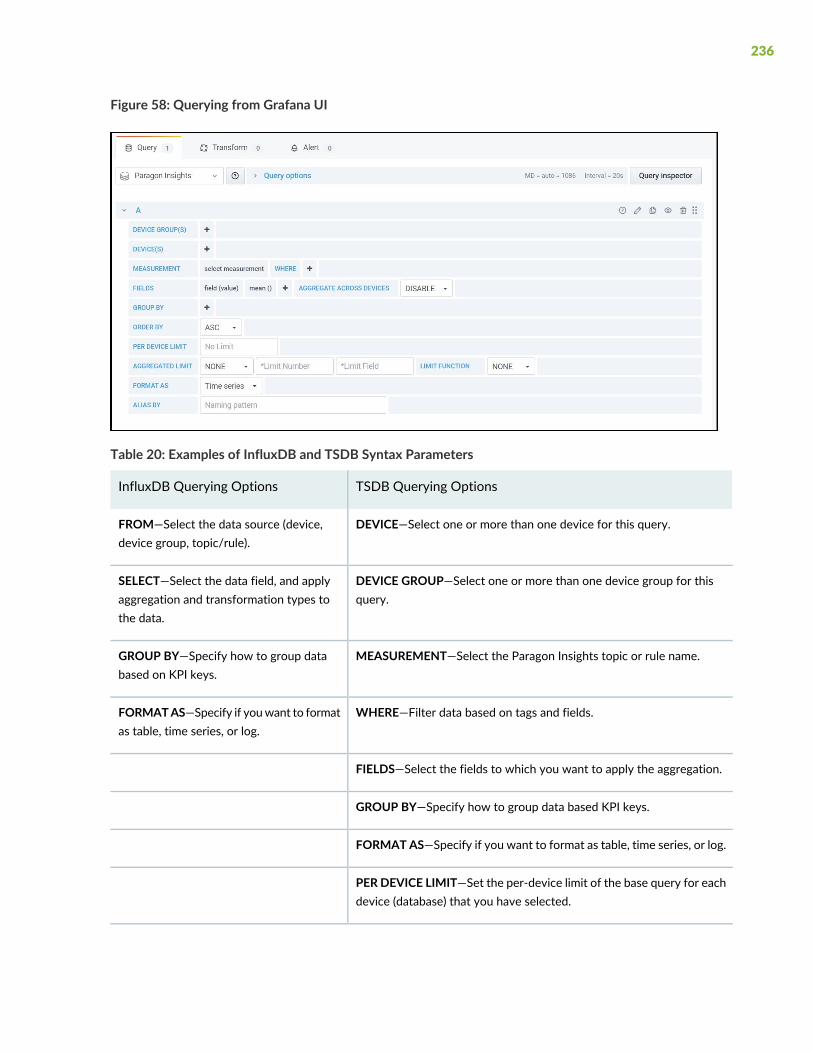
Figure 58: Querying from Grafana UI
Table 20: Examples of InfluxDB and TSDB Syntax Parameters
TSDB Querying OptionsInfluxDB Querying Options
DEVICE—Select one or more than one device for this query.FROM—Select the data source (device,device group, topic/rule).
DEVICE GROUP—Select one or more than one device group for thisquery.
SELECT—Select the data field, and applyaggregation and transformation types tothe data.
MEASUREMENT—Select the Paragon Insights topic or rule name.GROUP BY—Specify how to group databased on KPI keys.
WHERE—Filter data based on tags and fields.FORMATAS—Specify if youwant to formatas table, time series, or log.
FIELDS—Select the fields to which you want to apply the aggregation.
GROUP BY—Specify how to group data based KPI keys.
FORMATAS—Specify if you want to format as table, time series, or log.
PER DEVICE LIMIT—Set the per-device limit of the base query for eachdevice (database) that you have selected.
236

Table 20: Examples of InfluxDB and TSDB Syntax Parameters (continued)
TSDB Querying OptionsInfluxDB Querying Options
AGGREGATEDLIMIT—Set the aggregate limit for the device (databases)after the base query is run.
ALIAS BY—Rename a field. For example, if you select mean as anaggregation function for a field named bps, you can give it an alias namecalled mean_bps.
Using the Grafana UI
You can access Grafana UI by selectingMonitor > Graphs > Grafana from the Paragon Insights UI.
You can access Grafana by logging into the Paragon Insights UI. All logged in users can access and useGrafana and its features by clickingMonitor > Graphs > Grafana.
You use dashboards to monitor the status and health of devices. Follow these steps to view existingdashboards or create new dashboards from the Grafana UI:
• To create a new dashboard from the Grafana UI, click the plus (+) icon >Create > Dashboards > AddPanel from the right-nav panel.
• To view existing dashboards from the Grafana UI, click Dashboards from the right-nav panel.
Back Up and Restore Grafana Data
Back Up Grafana Data
1. Click Administration > Backup.
The Backup page appears.
2. Click Backup Grafana to backup Grafana data. The Confirm Backup pop-up appears.
3. Click Ok to confirm.
237

Restore Grafana Data
1. Click Administration > Restore. The Restore page appears.
2. ClickChoose file and select the backed-up Grafana data file from your local system; clickOk to confirmselection.
3. Click Restore Grafana to restore Grafana data.
4. Click Ok to confirm.
Release History Table
DescriptionRelease
Starting with Paragon Insights (formerly HealthBot) Release 4.1.0, you can use the Grafanauser interface (UI) to view data of your network devices.
4.1.0
RELATED DOCUMENTATION
Monitor Device and Network Health | 172
Understanding Action Engine Workflows
NOTE: Action engine workflow is a Beta feature for Paragon Insights Releases 4.1.0 and 4.2.0.
When creating rules, Paragon Insights includes the ability to run user-defined actions (UDAs) as part of atrigger. UDAs are Python scripts that can be configured to be triggered by a Paragon Insights rule.
You cannot track and manage UDAs, pause an action, retry a failed action, and resume a paused action.However, with Release 4.1.0, Paragon Insights supports action engine workflow monitoring. An actionengine workflow is an action engine that you can use to configure a set of tasks (instances). You canconfigure action engine workflows, monitor existing action engine workflows, and manage action engineworkflow instances from the Paragon Insights GUI.
238

You can view action engine workflows that you created by using the CLI in the Paragon Insights GUI. Youcan perform the following actions from the CLI:
• run NETCONF command
• run arbitrary executable files such as Python, Bash, Ruby
• run a command to send notification messages
RELATED DOCUMENTATION
Manage Action Engine Workflows | 239
Manage Action Engine Workflows
NOTE: Action engine workflow is a Beta feature for Paragon Insights Releases 4.1.0 and 4.2.0.
See “UnderstandingAction EngineWorkflows” on page238 formore information on action engineworkflows.
You can add new workflows from the Configuration > Action Engine page of the Paragon Insights GUI.You canmanage exisiting action engineworkflows, and action engineworkflow instances from theMonitor> Action Engine page.
Add an Action Engine Workflow
Follow these steps to add an action engine workflow:
1. Click Configuration > Action Engine.
TheWorkflows page apprears.
2. Click plus (+) icon to add an action engine workflow.
The Add NewWorkflow page appears. The General tabbed page is displayed by default.
3. Enter the following information in the General tabbed page :
a. Enter a name for the action engine workflow in the Name text box.
b. Enter a description for the action engine workflow in the Description text box.
c. Select an entry task from the Entry Task drop-down list.
239

NOTE: You have to add a task before you can select the task from the Entry Taskdrop-down list. To add a task, see Step 4.
An entry task is the first task that is executed when you run an action engine workflow.
d. Select an exit task from the Exit Task drop-down list.
NOTE: You have to add a task before you can select the task from the Exit Task drop-downlist. To add a task, see Step 4.
An exit task is the last task (for example, a clean up task) that is executed at the end of an actionengine workflow sequence.
4. Click Tasks to view the Task tabbed page.
5. Click (+) to add a task.
Enter the following information:
a. Enter a name for the task in the Name text box.
b. Enable or Disable the Parallel toggle button.
Enable the Parallel toggle button to run all steps in a task simultaneously.
c. Follow these steps for Paragon Insights Release 4.1.0:
a. Click (+) to add a new step.
The Add Step overlay page appears.
b. Enter a name for the step in the Name text box.
c. Enter a value for Command Tag and Command Field in the CLI Command Settings section.
d. Click Ok to confirm
Follow these steps for Paragon Insights Release 4.2.0:
a. Click the (+) icon to add a step.
240

A row is added to the Steps section.
In the row that is added,
i. Enter a name for the step in the Name text box.
ii. Enter a description for the step in the Description text box.
iii. Select dependencies from the Dependencies drop-down list.
iv. Select a step type from the Type drop-down list.
b. Click Edit Commands to add a new command.
The ADD/EDIT COMMANDS pop-up appears.
Enter the following information:
i. Click +Add New Command to add a new command.
The New Command section appears in the ADD/EDIT COMMANDS pop-up.
ii. Enter a value for the command tag in the Command Tag text box.
iii. Enter a value in the Commands list box. You can select more than one command.
Click X to remove the command that you selected.
iv. Enter a value in the Arguments list box. You can select more than one argument.
Click X to remove the argument that you selected.
v. Enter a value in the Device list box. You can select more than one device.
Click X to remove the device that you selected.
vi. Enter a value in the Device Group list box. You can select more than one device group.
Click X to remove the device group that you selected.
vii. Enter a value in the Environment list box.
viii. Select an output from the Output Type list box.
ix. Enable or Disable the Ignore toggle button.
Enable the Ignore toggle button to ignore steps.
241

x. Set repeat parameters in the Repeat field.
You can determine if you want to repeat a failed step or not.
xi. The default delay value displayed is 10 seconds.
After you have set repeat parameters to repeat a step that has failed, there is a delay of 10seconds before the step is repeated again.
xii. Click OK to confirm.
The new command is added.
c. Click Edit Conditions to add new conditions.
The ADD/EDIT CONDITIONS pop-up appears.
Follow this procedure to set conditions to run a step:
i. Enter the conditions in the Conditions text box.
ii. Select a condition type from the Conditions Type list box.
iii. Enter a description for the condition in the Condition Description text box.
iv. Click OK to confirm.
The new conditions are added
d. Click Edit Inputs to add new inputs.
The ADD/EDIT INPUTS pop-up appears.
Enter the following information:
i. Click the (+) icon to add new input.
ii. Enter a name for the input in the Name field.
iii. Enter a value for the input in the Value field.
iv. Click OK to confirm.
242

The operation is successful message is displayed in the ADD/EDIT INPUTS pop-up.
v. Click Close to close the ADD/EDIT INPUTS pop-up.
e. Click Edit Output to add new outputs.
The ADD/EDIT OUTPUT pop-up appears.
Enter the following information:
i. Click the (+) icon to add new input.
ii. Select a name for the output from the Name drop-down list.
iii. Enter a description for the output in the Description text box.
iv. Enter a value for the command tag in the Command Tag field.
v. Select output type from the Output Type drop-down list. See Table 21 on page 243.
vi. The field displayed depends on the output type that you have selected. SeeTable 21 on page 243.
Table 21: Output Type and Corresponding Fields
FieldOutput Type
PatternGrok
XPathXML
JQ pathJSON
PathArtifact
PatternRegex
Result
vii. Click OK to confirm.
243

The operation is successful message is displayed in the ADD/EDIT OUTPUT pop-up.
viii. Click Close to close the ADD/EDIT OUTPUT pop-up.
d. Click the √ icon to add this row to the Steps section.
6. Click the Arguments tab.
7. On the Arguments tabbed page, click the plus (+) icon to add a new argument.
Enter the following information:
• Enter a name for the argument in the Name text box.
• Click Ok to confirm.
8. Do any one of the following:
• Click Save to save the action engine workflow.
• Click Save & Deploy to save and deploy the action engine workflow.
You have now added and deployed an action engineworkflow. Tomonitor the action engineworkflowsthat you have added, seeMonitor > Action Engine.
Run an Action Engine Workflow
After you add an action engine workflow from the Configuration > Action Engine page of the UI, you canrun the action engine workflow by following these steps:
1. ClickMonitor > Action Engine.
TheWorkflows Monitor page apprears.
2. Select the action engine workflow you want to run by selecting the check box next to the name of theaction engine workflow.
3. Click RunWorkflow.
The RunWorkflow <workflow name> pop-up appears.
4. In the RunWorkflow <workflow name> pop-up that appears, you can:
• View the list of preconfigured arguments for the action engine workflow.
• Configure additional arguments.
To configure additional arguments:
a. Click (+).
244
The Additional Arguments fields that you can configure are displayed.
i. Enter a name in the Name text box to identify this additional argument.
The name you enter must be in the [a-zA-Z][a-zA-Z0-9_-]*$ regular expression format. Thisformat states that the first character of the name can start with a-z or A-Z. The name cannotstart with a number or a special character. However, you can use numbers, _, and - within thename. Maximum length is 64 characters.
ii. Select an additional argument type from the Type drop-down list.
Available options: string, list, password, device, device-group, network-group
iii. Select a value from the options available.
The options you can choose from depend on the additional argument Type that you haveselected. You can add one or more than one arguments.
5. Click OK to confirm settings and run the action engine workflow.
Stop an Action Engine Workflow Instance
You can stop an action engine workflow instance that is currently running.
NOTE: You cannot resume (restart) an instance that you have stopped.
To stop an instance:
1. ClickMonitor > Action Engine.
TheWorkflows Monitor page appears.
2. Click a action engine workflow to view the instances listed under it.
3. Select the instance that is currently running by selecting the check box next to the name of the instance.
4. Click Stop to stop the instance.
245
Resume a Suspended Action Engine Workflow Instance
You can resume (restart) an action Engine workflow instance that has been suspended. To resume asuspended instance:
1. ClickMonitor > Action Engine.
TheWorkflows Monitor page appears.
2. Click an action engine workflow to view the instances listed under it.
3. Select a suspended instance by selecting the check box next to the name of the instance.
4. Click Resume to restart the instance.
Filter Action Engine Workflow Instances
To filter action engine workflow instances within an action engine workflow:
1. ClickMonitor > Action Engine.
TheWorkflows Monitor page appears.
2. Click Filter, and then click Add Filter from the Filter drop-down list.
The Add Criteria pop-up appears.
3. Enter the following information in the Add Criteria pop-up.
a. Select the field that you want to apply the filter to, from the Field drop-down list .
b. Select the conditions that you want to apply to the field, from the Condition drop-down list .
c. Enter start and/or finish time that you want to apply to the filter, in the Value text box.
4. Click Add to apply the filter.
Delete an Action Engine Workflow
To delete an action engine workflow:
1. Click Configuration > Action Engine.
TheWorkflows page appears.
2. Select the action engine workflow you want to delete by selecting the check box next to the name ofthe instance.
246

3. Click the Delete icon.
The Delete Workflow pop-up appears.
4. In the Delete Workflow pop-up that appears, click Ok to delete the action engine workflow.
RELATED DOCUMENTATION
Understanding Action Engine Workflows | 238
Alerts and Notifications
IN THIS SECTION
Generate Alert Notifications | 247
Manage Alerts Using Alert Manager | 254
Stream Sensor and Field Data from Paragon Insights | 258
Generate Alert Notifications
IN THIS SECTION
Configure a Notification Profile | 248
Enable Alert Notifications for a Device Group or Network Group | 253
Paragon Insights (formerly HealthBot) generates alerts that indicate when specific KPI events occur onyour devices. To receive Paragon Insights notifications for these KPI events, you must first configure anotification profile. Once configured, you can enable alert notifications for specific device groups andnetwork groups.
Paragon Insights supports the following notification delivery methods:
247

• Web Hook
• Slack
• Kafka Publish
• Microsoft Teams (HealthBot Release 2.1.0 and later)
• Email (HealthBot Release 2.1.0 and later)
• Advanced Message Queuing Protocol (AMQP) Publish (Paragon Insights Release 4.0.0 and later)
This section includes the following procedures:
Configure a Notification Profile
A notification profile defines the delivery method to use for sending notifications.
1. Click the Settings > System option in the left-nav bar.
2. Click the Notification tab on the left of the window. click the add notification button (+ Notification).
3. Click the + Notification button
4. In the Add Notification window that appears, configure the notification profile:
DescriptionAttributes
Enter a name.Name
(Optional) Enter a description.Description
Select a notification type:
• Web Hook
• Slack
• Kafka Publish
• Microsoft Teams (HeathBot 2.1.0 and later)
• EMails (HeathBot 2.1.0 and later)
• Advanced Message Queuing Protocol (AMQP) Publish (Paragon Insights Release4.0.0 and later)
Notification type attributes vary based on notification type selected. See below fordetails.
Notification Type
5. Click Save and Deploy.
248

NOTIFICATION TYPE DETAILS
Web Hook
• URL—URL at which the Web Hook notification should be posted.
• Username—(Optional) Username for basic HTTP authentication.
• Password—(Optional) Password for basic HTTP authentication.
Slack
• URL—URL at which the Slack notification should be posted. Different from your Slack workspace URL.Go to https://slack.com/services/new/incoming-webhook and sign in to your Slack workspace tocreate a Slack API endpoint URL.
• Channel—Channel on which the notification should be posted.
Kafka Publish
• Bootstrap Servers—Add Kafka host:port pairs from the drop-down list to establish the initial connectionto the Kafka cluster.
• Topic—(Optional) Name of the Kafka topic to which data will be published. By default, the Kafka topicnaming convention for device group alert notifications is device-group.device-id.topic.rule.trigger.
Depending on the authentication protocols being used, the required authentication parameters are asfollows:
Required ParametersProtocol
Username, password and certificateSASL/SSL
Username and passwordSASL/Plaintext
CertificateSSL
NonePlaintext
• Username—Username for SASL/SSL or SASL/plaintext authentication.
• Password—Password for SASL/SSL or SASL/plaintext authentication.
• Certificate—Kafka server’s CA certificate. Choose file from the drop-down list.
• UploadCertificate—Location fromwhere the Kafka server’s CA certificate will be uploaded. ClickChoosefiles and navigate to the file location. File should be in Privacy Enhanced Mail (PEM) format.
249
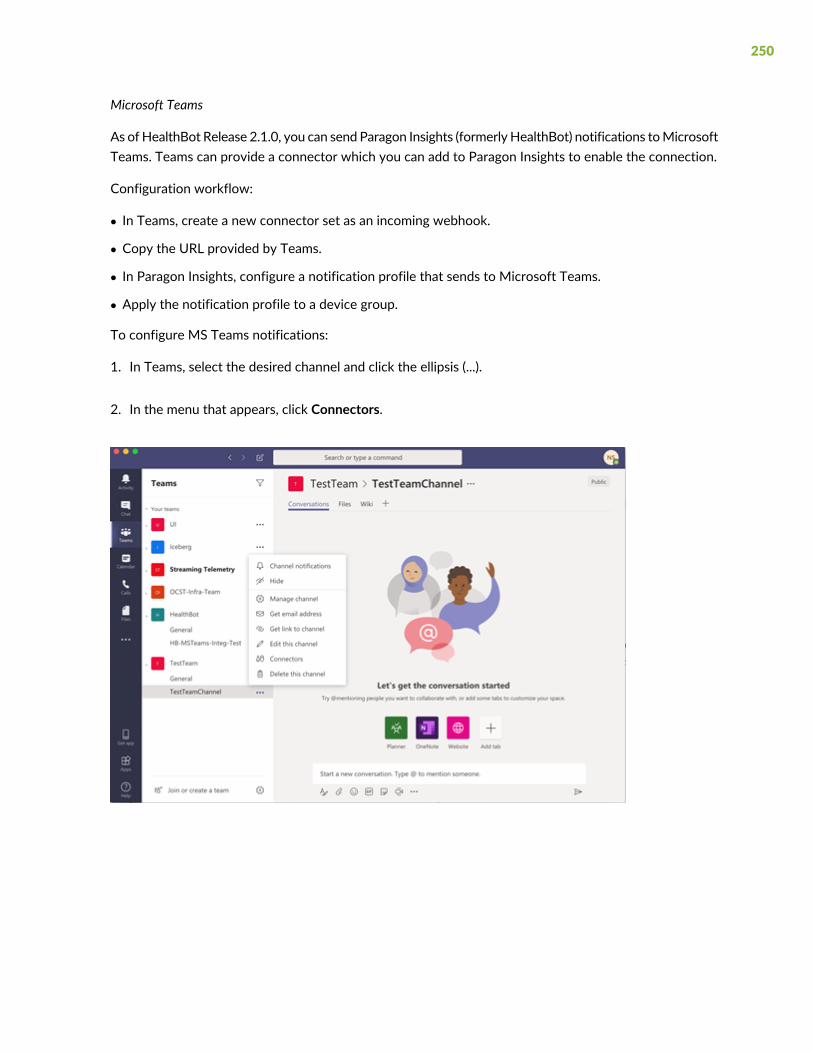
Microsoft Teams
As ofHealthBot Release 2.1.0, you can send Paragon Insights (formerlyHealthBot) notifications toMicrosoftTeams. Teams can provide a connector which you can add to Paragon Insights to enable the connection.
Configuration workflow:
• In Teams, create a new connector set as an incoming webhook.
• Copy the URL provided by Teams.
• In Paragon Insights, configure a notification profile that sends to Microsoft Teams.
• Apply the notification profile to a device group.
To configure MS Teams notifications:
1. In Teams, select the desired channel and click the ellipsis (...).
2. In the menu that appears, click Connectors.
250

3. Use the Incoming Webhook option and click Configure.
4. On the next page, click Create.
5. Once the web hook is successfully created, copy the provided URL.
6. In Paragon Insights, go to the Settings > System page select the Notification tab.
7. Click the + Notification button.
8. Configure the notification profile as follows:
• Name - Enter a profile name.
251

• Notification Type - selectMicrosoft Teams.
• Channel - Paste the URL provided by the Teams UI above.
9. Click Save and Deploy.
10.Apply the notification profile to a device group or network group as shown in “Enable Alert Notificationsfor a Device Group or Network Group” on page 253
EMails
As of HealthBot Release 2.1.0, you can send Paragon Insights (formerly HealthBot) notifications by email.By default, email notifications cover all running playbooks and rules for the device group or network groupto which they are applied, however you can narrow the focus by selecting specific rules.
NOTE: Paragon Insights includes its own mail transfer agent (MTA), so no other mail server isrequired.
Configuration workflow:
• In Paragon Insights, configure a notification profile that sends to email.
• Apply the notification profile to a device group.
To configure email notifications:
1. In Paragon Insights, go to the Settings > System page.
2. Select the Notification tab and click the the + Notification button.
3. Configure the notification profile as follows:
• Name - Enter a profile name.
• Notification Type - Select Emails.
• Email Addresses - Enter an email address and click Add <email-address>; repeat for more emailaddresses.
• (Optional) Rule filters - To narrow the scope of what triggers an email, define rule filters. Enter a filterand click Add <rule-filters>; repeat for more filters.
• Format is topic/rule; can use regular expressions
• Example: interface.statistics/check-interface-flaps sends notifications only for the rulecheck-interface-flaps.
• Example: system.processes/.* , system.cpu/.* , and interface.statistics/.* sends notifications forall rules under the topics system.processes, system.cpu, and interface.statistics.
252
4. Click Save and Deploy.
5. Apply the notification profile to a device group or network group as shown in “Enable Alert Notificationsfor a Device Group or Network Group” on page 253
AMQP Publish
If you select AMQP Publish as the notification type, you have to specify the following:
• Host (mandatory)—Specify a valid hostname or the IP address of the AMQP server.
• Port (mandatory)—Specify the listener port of the AMQP server.
• Exchange(mandatory)—Specify the name of the exchange or the routing agent of the AMQP server onwhich the connection must be instantiated.
• Virtual Host(optional)—Specify the virtual host of the AMQP server on which the connection must beinstantiated. If you do not specify, the default value(/) is used.
• Routing Key(optional)—Specify the routing key. The routing key is amessage attribute that the exchangerefers to when deciding how to route the message to the queue.
NOTE: If you have not configured the routing key, the following are the default value:
• For sensor or raw data, <device-group>.<device>.sensors
• For field data, <device/network-group>.<device>.<topic>.<rule>.fields
• For trigger/alert data, <device/network-group>.<device>.<topic>.<rule>.<trigger>
In case of a network group, <device> is rendered as “-”.
• Username—Specify the username for the Simple Authentication Security Layer (SASL) authentication.
• Password—Specify the password for the SASL authentication.
• CA Profile—Select the CA profile from the drop-down list. For more information on CA Profiles and localcertificates, see “Configure a Secure Data Connection for Paragon Insights Devices” on page 275.
• Local Certificate—Select the local certificate from the drop-down list. Formore information on CAProfilesand local certificates, see “Configure a SecureData Connection for Paragon Insights Devices” on page 275
• Server Common Name—Specify the server common name that is used while creating a certificate.
Enable Alert Notifications for a Device Group or Network Group
To enable alert notifications for a device group or network group:
253

1. For Device Groups, select the Configuration > Device Group page from the left-nav bar.
For Network Groups, select the Configuration > Network page from the left-nav bar.
2. Click the name of the device group or network group for which you want to enable alert notifications.
3. Click the Edit (Pencil) icon.
4. Scroll down to theNotification section in the pop-upwindow and click the caret to expand that section.
5. Select a destination for any alert level (Major, Minor, or Normal) that you want. Notification can besent to zero or more defined destinations for each alert level.
6. Click Save and Deploy.
Manage Alerts Using Alert Manager
IN THIS SECTION
Viewing Alerts | 254
Manage Individual Alerts | 256
Configure Alert Blackouts | 257
You can use the AlertManager feature to organize, track, andmanage KPI event alert notifications receivedfrom Paragon Insights devices. The Alert Manager does not track alerts by default; it is populated basedon which device groups or network groups are configured to send the notifications.
Viewing Alerts
To view the alerts report table, go to theMonitor > Alerts page in the left-nav bar. Note that AlertManagerconsolidates duplicate alerts into one table entry and provides a count of the number of duplicate alertsit has received.
Starting with release 4.2.0, Paragon Insights generates smart alerts if you configured resources anddependencies. To configure resources, click Resource Discovery at the top right corner of the Alerts page.
254

Smart alerts combine alerts from different rules into a collapsible tree structure. The main alert in the treedisplays the root cause that triggered the other alerts in the tree. See “Understand Resources andDependencies” on page 206 for more information.
The following table describes the alerts report table attributes.
DescriptionAttributes
Severity level of the alert. Options include:
• Major
• Minor
• Normal
Severity
Management status of the alert entry. Options are Open, Active, Shelved, Closed, andAck. The statuses available in the Status pull-down menu in the top row of the tableonly include statuses of alerts visible in the table and those allowed by the status filterabove the table.
Status
Time the alert was last received.Last Received
Duplicate count. Number of times an alert with the same event, resource, environment,and severity has been triggered.
Dupl.
Device component topic name.Topic
Device name.Resource
Name of the rule, trigger or field, and event with which the alert is associated.Event
Health status message.Text
The following table describes the main features of the alerts report table:
DescriptionFeature
Click on the name of the data type at the top of the column by which youwant to sort.
Sort the data by ascending or descendingorder based on a specific attribute.
In the drop-down list at the top left corner of the page, select a devicegroup by which to filter.
Filter the data based on the devicegroup.
255
DescriptionFeature
Two options:
1. In the drop-down list above the table at the top of the page, select oneormore status types onwhich to filter. Options are open, active, shelved,closed, and ack. You can filter on multiple status types.
2. In the drop-down list at the top of the Status column, select a statustype by which to filter. Note that if there are status types shown in thefilter list at the top of the report, then the status column can only showthose status types.
Filter the data based on the alert status.
In the associated drop-down list for each attribute at the top of the table,select an option by which to filter.
Filter the data based on the severity,topic, or resource
In the associated text box under the Event or Text attribute name at thetop of the table, enter the keyword on which to filter.
Filter the data based on a keyword.
In the Last Received field, enter a date and time in the format: <Day> <DD><Mon> <HH:MM>
Filter the data based on date or timereceived.
Two options:
1. At the bottom of the table, click the Previous or Next buttons.
2. At the bottom of the table, select the page number using the up/downarrows (or by manually entering the number) and then press Enter.
Navigate to a different page of the table.
At the bottom of the table, choose the number of rows to display in thedrop-down list. The table displays 20 rows by default.
Change the number of rows displayed.
Resize the column width of the cell by dragging the right side of the titlecell of the column to the right.
If the data in a cell is truncated, view allof the data in a cell.
Manage Individual Alerts
You can view detailed information about each alert in the alerts report table. You can also assign amanagement status (such as open, ack, and close), and apply simple actions (such as shelve and delete) toeach alert.
To manage individual alerts:
1. Go to theMonitor > Alerts page from the left-nav bar to open the alert report table.
2. Click on a single alert entry in the table. The Alert Details pane displays detailed information about thealert.
256

The following table describes the set of buttons at the top of the Alert Details pane:
DescriptionButton
Changes the status of the alert to Open.Open
Removes the alert from the table for a set amount of time. Time options are 1, 2, 4 and 8hours. Click Unshelve to disable this feature.
Shelve
Changes the status of the alert to Ack. The Ack status removes the alert from the table, butthe alert still remains active.
Ack
Changes the status of the alert to Closed. The Closed status indicates that the severity levelof the alert is now Normal.
Close
Deletes the alert from the table.Delete
Configure Alert Blackouts
You can configure blackout periods to suppress or mute alerts during, for example, scheduled downtimes.
To configure blackouts:
1. Click the Settings > System page from the left-nav bar.
2. Select the Alert tab on the left side of the page.
3. In Alert Blackout Settings, click the + Alert Blackout button.
4. Enter the necessary values in the text boxes for the blackout configuration.
The following table describes the attributes in the Add an Alert Blackout pane:
DescriptionAttributes
Select a start and end date and time for the blackout.Duration
Select a device group from the drop-down list to which to apply the blackout configuration.Device Group
(Optional) Specify an attribute from the drop-down list to which to apply the blackoutconfiguration.
Attribute
257

DescriptionAttributes
(Optional) If a blackout attribute is specified, provide an associated value (as shown in thealerts report table). Only the alerts that match this attribute value exactly will be suppressedfrom the alerts report table.
NOTE: For the Resource-Event attribute, you must specify a resource from the drop-downlist, as well as specify an Event value. Only the alerts generated by the specified resourcethat match this Event value exactly will be suppressed from the alerts report table.
Value
5. Click Save to save the configuration.
6. (Optional) Click the Delete button to delete a blackout configuration.
Stream Sensor and Field Data from Paragon Insights
IN THIS SECTION
Configure the Notification Type for Publishing | 258
Publish Data for a Device Group or Network Group | 260
You can configure Paragon Insights to publish Paragon Insights sensor and field data for a specific devicegroup or network group. You must first configure the notification type for publishing and then specify thefields and sensors that you want published.
Configure the Notification Type for Publishing
Paragon Insights supports Apache Kafka and AMQP for publishing sensor and field data.
You must first configure a Kafka publishing profile before you can start publishing sensor and field datafor a specific device group or network group.
To configure a Kafka publishing profile:
1. Select the Settings > System page from the left-nav bar.
2. Click the Notification tab on the left part of the page.
3. In Notification Settings, click the + Notification button.
258
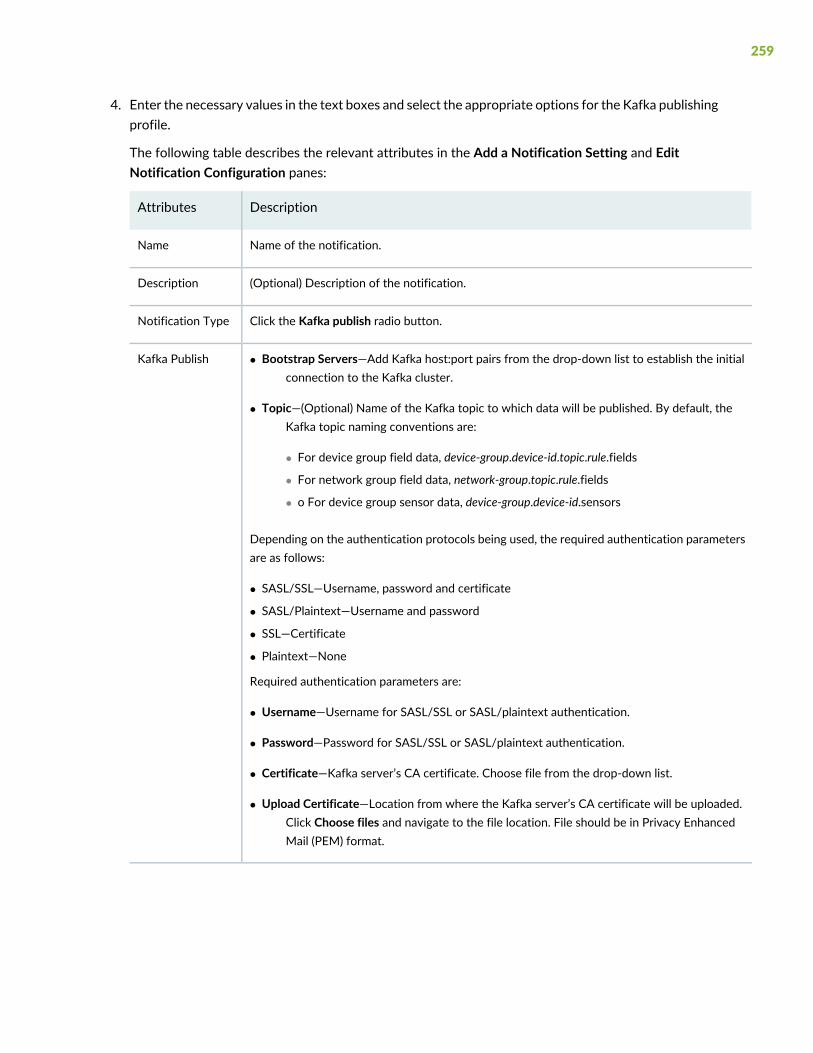
4. Enter the necessary values in the text boxes and select the appropriate options for the Kafka publishingprofile.
The following table describes the relevant attributes in the Add a Notification Setting and EditNotification Configuration panes:
DescriptionAttributes
Name of the notification.Name
(Optional) Description of the notification.Description
Click the Kafka publish radio button.Notification Type
• Bootstrap Servers—Add Kafka host:port pairs from the drop-down list to establish the initialconnection to the Kafka cluster.
• Topic—(Optional) Name of the Kafka topic to which data will be published. By default, theKafka topic naming conventions are:
• For device group field data, device-group.device-id.topic.rule.fields
• For network group field data, network-group.topic.rule.fields
• o For device group sensor data, device-group.device-id.sensors
Depending on the authentication protocols being used, the required authentication parametersare as follows:
• SASL/SSL—Username, password and certificate
• SASL/Plaintext—Username and password
• SSL—Certificate
• Plaintext—None
Required authentication parameters are:
• Username—Username for SASL/SSL or SASL/plaintext authentication.
• Password—Password for SASL/SSL or SASL/plaintext authentication.
• Certificate—Kafka server’s CA certificate. Choose file from the drop-down list.
• Upload Certificate—Location from where the Kafka server’s CA certificate will be uploaded.Click Choose files and navigate to the file location. File should be in Privacy EnhancedMail (PEM) format.
Kafka Publish
259

5. Click Save to save the configuration or click Save and Deploy to save and deploy the configuration.
6. Apply the Kafka publishing profile to a device group or network group. For more details, see the “PublishData for a Device Group or Network Group” on page 260 section.
Publish Data for a Device Group or Network Group
To publish Paragon Insights sensor or field data for a device group or network group:
1. For Device Groups, select the Configuration > Device Group page from the left-nav bar.
For Network Groups, select the Configuration > Network page from the left-nav bar.
2. Click the name of the device group or the network group to which you want to publish data.
3. Click the Edit (Pencil) icon.
4. Under Publish, select the appropriate Destinations, Field, or Sensor from the drop-down lists for thedata you want to publish. To publish field or sensor data, you must configure a destination.
DescriptionParameter
Select the publishing profiles that define the notification type requirements (such asauthentication parameters) for publishing the data.
To edit or view details about saved publishing profiles, go to the System page under the Settingsmenu option in the left-nav bar. The publishing profiles are listed under Notification Settings.
NOTE: Only Kafka and AMQP publishing are currently supported.
Destinations
Select the Paragon Insights rule topic and rule name pairs that contain the field data you wantto publish.
Field
(Device group only) Select the sensor paths or YAML tables that contain the sensor data youwant to publish. No sensor data is published by default.
Sensor
5. Click Save to save the configuration or click Save and Deploy to save and deploy the configuration.
Release History Table
DescriptionRelease
As of HealthBot Release 2.1.0, you can send Paragon Insights (formerly HealthBot)notifications by email.
2.1.0
260
RELATED DOCUMENTATION
Monitor Device and Network Health | 172
Generate Reports
You can generate Paragon Insights (formerly HealthBot) reports for device groups and network groups.These reports include alarm statistics, device or network health data, as well as device-specific information(such as hardware and software specifications).
Paragon Insights’s reporting functionality allows you to:
• Send reports by email, save them on the Paragon Insights server, or download them to your local machine
• Schedule reports to run at regular intervals, or for a specific time
• Generate reports on demand (HealthBot Release 2.1.0 and later)
• Compare (diff) two reports (HealthBot Release 2.1.0 and later)
• Capture a snapshot of a specific set of fields at a given point in time (HealthBot Release 3.1.0 and later)
This section includes the following procedures:
• Generate On-Demand Reports on page 261
• Generate Scheduled Reports on page 263
• View Reports on page 265
• Create a Field Snapshot on page 267
• Compare (Diff) Reports on page 269
Generate On-Demand ReportsYou can generate and download a report on demand for a device group or network group. As with regularreport generation, formats supported include HTML or JSON, and you can download the report or receiveit by email.
Once generated, you can re-download on-demand reports from the Reports page. These reports have thereport name HB_MANUAL_REPORT.
261

To generate an on-demand report:
1. For a device group, navigate to theConfiguration >DeviceGroup page from the left-nav bar and selectthe device group name from the list.
For a network group, navigate to the Configuration > Network page from the left-nav bar and selectthe network group name from the list.
2. Click the Report Snapshot (Page) icon in the upper right part of the page as shown in
Figure 59: Report Snapshot Button
3. On the page that appears, enter report generation details, including:
• Format - HTML or JSON
• Destination Type - save to your computer (disk) or send to email (which also saves to disk)
• If disk, specify the number of reports to save on the server before deleting older reports
• If email, add target email address(es)
• (Optional) Select graph canvases to include in the report.
• (Optional) Select the desired graph panels to include in the report.
262

4. Click Submit.
5. A dialog box appears allowing you to download the file. Additionally, if the destination is disk, ParagonInsights stores a copy of the report on the server. If the destination is email, Paragon Insights sendsthe report to the specified account.
Generate Scheduled ReportsThe workflow to configure and generate scheduled reports is as follows:
Create a Destination Profile
1. Select the Settings > System page from the left-nav bar.
2. Click the Destination tab on the left of the page.
3. In the Destination Settings section, click the + Destinationbutton.
4. Specify the destination profile settings as appropriate.
The following table describes the attributes in the Add a destination and Edit a destination panes:
DescriptionAttributes
Enter a name. The name cannot be changed once saved.Destination Name
Options include Email or Disk.Destination Type
Enter an email address to which the report will be sent.Email > Email Id
Specify howmany versions of this report will be stored on the server. Olderreports are deleted as newer reports are generated and saved.
Disk > Maximum Reports
NOTE: Using the email option also saves a copy of the report to disk.
5. Click Save and Deploy.
263

Create a Schedule Profile
1. Click the Scheduler tab on the left side of the page.
2. In the Scheduler Settings section, click the + Scheduler button.
3. Specify the schedule profile settings as appropriate.
The following table describes the attributes in the Add a scheduler and Edit a scheduler panes:
DescriptionAttributes
Enter a name .Name
Select continuous.Scheduler Type
Select the date and time for the first report to be generated.Start On
Not applicable.Run for
(Optional) Select the date and time to stop generating reports.
Leave blank to generate the report indefinitely.
End On
Select one of the following:
• The frequency (every day, week, month, or year) at which you want the report tobe generated.
• Never—generate the report only once.
• Custom—select and use the Repeat Every fields to configure a custom frequency.
Repeat
4. Click Save and Deploy.
Create a Report
1. Click the Report tab on the left side of the page.
2. In the Report Settings section, click + Reportbutton.
3. Specify the schedule profile settings as appropriate.
The following table describes the attributes in the Add a report setting and Edit a report setting panes:
DescriptionAttributes
Enter a name.Name
264
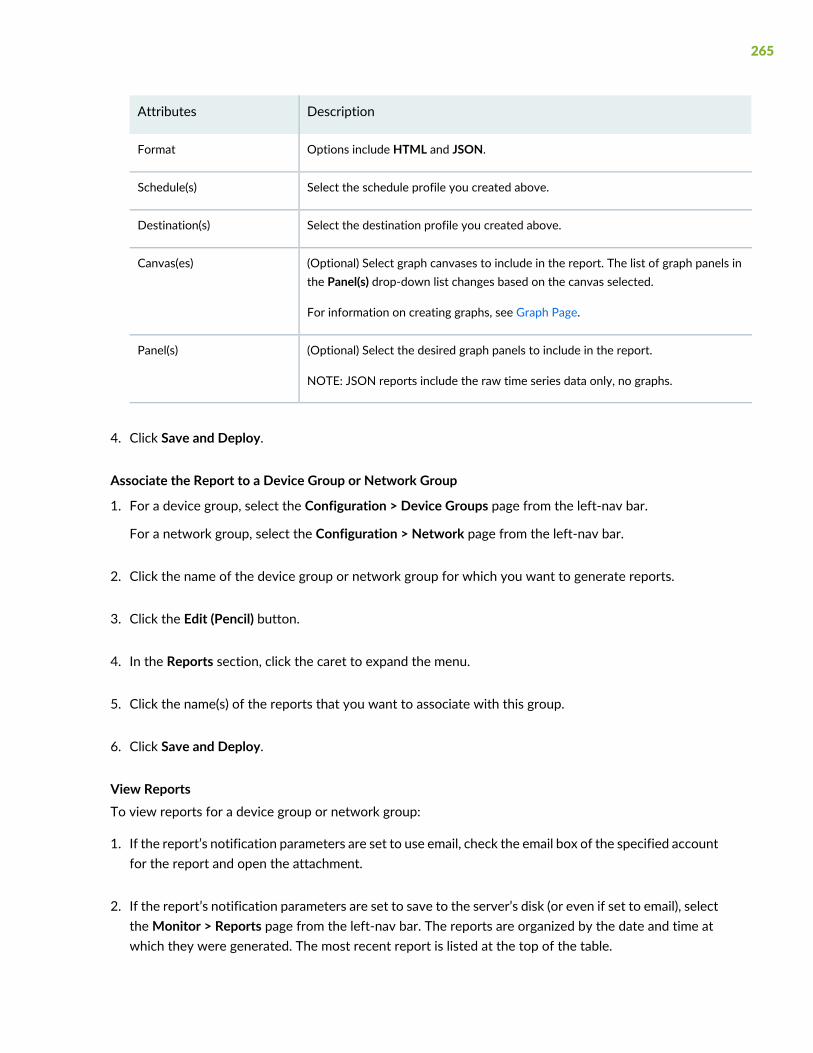
DescriptionAttributes
Options include HTML and JSON.Format
Select the schedule profile you created above.Schedule(s)
Select the destination profile you created above.Destination(s)
(Optional) Select graph canvases to include in the report. The list of graph panels inthe Panel(s) drop-down list changes based on the canvas selected.
For information on creating graphs, see Graph Page.
Canvas(es)
(Optional) Select the desired graph panels to include in the report.
NOTE: JSON reports include the raw time series data only, no graphs.
Panel(s)
4. Click Save and Deploy.
Associate the Report to a Device Group or Network Group
1. For a device group, select the Configuration > Device Groups page from the left-nav bar.
For a network group, select the Configuration > Network page from the left-nav bar.
2. Click the name of the device group or network group for which you want to generate reports.
3. Click the Edit (Pencil) button.
4. In the Reports section, click the caret to expand the menu.
5. Click the name(s) of the reports that you want to associate with this group.
6. Click Save and Deploy.
View ReportsTo view reports for a device group or network group:
1. If the report’s notification parameters are set to use email, check the email box of the specified accountfor the report and open the attachment.
2. If the report’s notification parameters are set to save to the server’s disk (or even if set to email), selecttheMonitor > Reports page from the left-nav bar. The reports are organized by the date and time atwhich they were generated. The most recent report is listed at the top of the table.
265

3. Find the report you wish to download. To help find the desired report:
• Click the column headings to sort based on that column.
• Search within a column using the text box under the column heading.
• Use the bottom of the page to view more rows or change pages.
4. Click on the name of the report to download it to your system.
266

The following is a sample report:
Create a Field Snapshot
267

You can capture fields (and their values) from rules applied to deployed devices. In the Paragon InsightsCLI, you identify the fields to capture by specifying an xpath as shown below (without spaces):
{
capture-fields: [
/device-group[device-group-name=’DevGrp1’]/device[device-id=/mx240-1/]/topic[topic-name=’system.cpu’]/rule[rule-name=’check-system-cpu’]/re-cpu-utilization,
/device-group[device-group-name=’DevGrp2’]/device[device-id=/mx240-1/]/topic[topic-name=’interface.statistics’]/rule[rule-name=’check-in-errors’]/in-errors-count
]
}
In the Paragon Insights GUI, you specify the fields during the creation of a report. Paragon Insights takescare of creating the xpath from your configuration in the Settings > System > Reports > Add a ReportSetting or the Settings > System>Reports > Edit Reportwindow as shown in Figure 60 on page 269 below:
268

Figure 60: Add/Edit Report Setting
Compare (Diff) ReportsYou can compare the differences between two reports for a device group or network group. The diff allowsyou to view added/removed/modified alerts, devices, health information, and graphs.
269

To generate a report diff:
1. On the Reports page, select two reports and click the Diff Reports button.
2. The diff opens as an HTML page in a new tab.
Sample Report Diff
A sample of a report diff for a device group is shown below.
270

A sample of a report diff for a network group is shown below.
271

Release History Table
DescriptionRelease
Capture a snapshot of a specific set of fields at a given point in time (HealthBot Release3.1.0 and later)
3.1.0
Generate reports on demand (HealthBot Release 2.1.0 and later)2.1.0
Compare (diff) two reports (HealthBot Release 2.1.0 and later)2.1.0
Manage Audit Logs
IN THIS SECTION
Filter Audit Logs | 273
Export Audit Logs | 273
Paragon Insights Commands and Audit Logs | 274
An audit log is a record of a sequence of activities that have affected a specific operation or procedure.Audit logs are useful for tracing events and for maintaining historical data.
Audit logs contain information about tasks initiated by using the Paragon Insights GUI or APIs. In additionto providing information about the resources that were accessed, audit log entries usually include detailsabout user-initiated tasks, such as the name of the user who initiated a task, the status of the task, anddate and time of execution.
Audit logs from microservices, such as healthbot command and config server are collected in the auditlog client library, and are stored in the Postgres SQL database. The audit log client library is installed withmicroservices during Paragon Insights installation.
NOTE: Device-driven tasks (tasks not initiated by the user) are not recorded in audit logs.
272
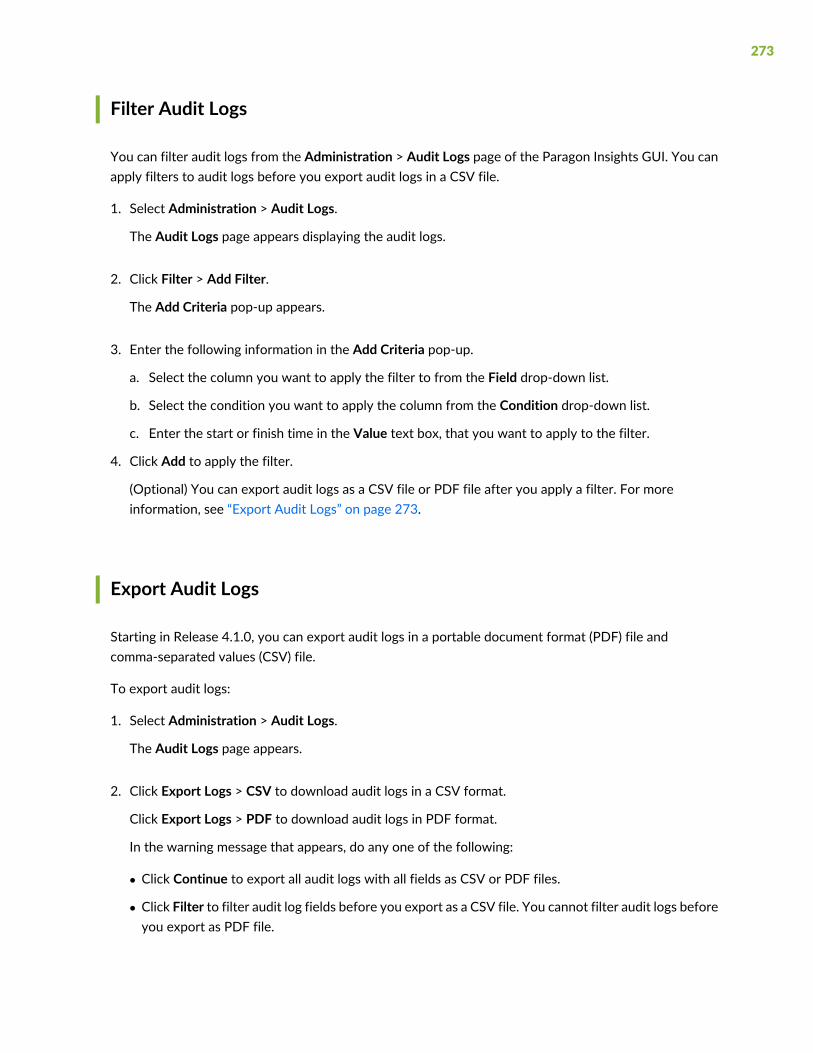
Filter Audit Logs
You can filter audit logs from the Administration > Audit Logs page of the Paragon Insights GUI. You canapply filters to audit logs before you export audit logs in a CSV file.
1. Select Administration > Audit Logs.
The Audit Logs page appears displaying the audit logs.
2. Click Filter > Add Filter.
The Add Criteria pop-up appears.
3. Enter the following information in the Add Criteria pop-up.
a. Select the column you want to apply the filter to from the Field drop-down list.
b. Select the condition you want to apply the column from the Condition drop-down list.
c. Enter the start or finish time in the Value text box, that you want to apply to the filter.
4. Click Add to apply the filter.
(Optional) You can export audit logs as a CSV file or PDF file after you apply a filter. For moreinformation, see “Export Audit Logs” on page 273.
Export Audit Logs
Starting in Release 4.1.0, you can export audit logs in a portable document format (PDF) file andcomma-separated values (CSV) file.
To export audit logs:
1. Select Administration > Audit Logs.
The Audit Logs page appears.
2. Click Export Logs > CSV to download audit logs in a CSV format.
Click Export Logs > PDF to download audit logs in PDF format.
In the warning message that appears, do any one of the following:
• Click Continue to export all audit logs with all fields as CSV or PDF files.
• Click Filter to filter audit log fields before you export as a CSV file. You cannot filter audit logs beforeyou export as PDF file.
273

To filter audit logs, see “Filter Audit Logs” on page 273.
After you have applied a filter, click Export Logs>CSV again to start the export.
NOTE: You can export audit logs for a maximum of 30 days prior to the current date and time.For example, if the current date is May 31, 2018, you can export the audit logs starting fromMay 1, 2018.
Depending on the settings of the browser that you are using, the CSV/PDF file containing the audit logsfor the specified time period is either downloaded directly, or you are asked to open or save the file.
Paragon Insights Commands and Audit Logs
Startingwith Paragon Insights Release 4.1.0, audit logs are generatedwhen you run the following commandsfrom the CLI:
• add-node
• remove-node
• modify-uda-engine
• modify-udf-engine
• modify-workflow-engine
• remove-plugin
• load-plugin
The audit log generated will include information on who initiated the job, node name, and status of thejob. You must enter credentials (username and password) to run the commands. If you have already set ausername (HB_USERNAME) and password (HB_PASSWORD), you are not prompted to enter credentialswhen you run a command.
Release History Table
DescriptionRelease
Starting in Release 4.1.0, you can export audit logs in a portable document format (PDF)file and comma-separated values (CSV) file.
4.1.0
274

Configure a Secure Data Connection for ParagonInsights Devices
Paragon Insights (formerly HealthBot) supports the following authentication methods to provide a securedata connection for Paragon Insights devices:
Required Paragon InsightsSecurity ParametersDescriptionSensor Type
AuthenticationMethod
• Local certificates (includes theclient certificate and client key)
• CA certificate
• Server common name
Client authenticates itself withthe server and the serverauthenticates itself with theclient.
OpenConfigMutual SSL
• CA certificate
• Server common name
Server authenticates itself withthe client.
OpenConfigServer-side SSL
• SSH key file
• Passphrase
• Username
Authenticates users withpassword-protected SSHkey files.
iAgentPublic key SSH
• Username
• Password
Authenticates users with apassword.
AllPassword
You can associate SSL or SSH certificates and keys with Paragon Insights devices through user-definedsecurity profiles:
• Configure Security Profiles for SSL and SSH Authentication on page 276
• Configure Security Authentication for a Specific Device or Device Group on page 277
275

Configure Security Profiles for SSL and SSH Authentication
To configure security profiles for SSL and SSH authentication:
1. Click the Settings > Security option in the left-nav bar.
2. Click the add profile button for one of the following profiles and enter the required information:
Description of ParametersSecurity Profile
Name—Enter profile name.
UploadCertificate—Choose the CA certificate file and then clickOpen. The supportedfile extension is CRT.
CA
Name—Enter profile name.
Upload Certificate—Choose the client certificate file and then click Open. Thesupported file extension is CRT.
Upload Key—Choose the client key file and then click Open. The supported fileextension is KEY.
Local Certificates
Name—Enter profile name.
Upload Key File—Choose the private key file generated by ssh-keygen and then clickOpen.
Passphrase—Enter the authentication passphrase.
SSH Keys
3. Click Save to save the configuration or click Save and Deploy to save and deploy the configuration.
4. Repeat Steps 4 and 5, as needed.
5. Apply the security profiles to a specific device or device group. For more details, see “Configure SecurityAuthentication for a Specific Device or Device Group” on page 277.
276

Configure Security Authentication for a Specific Device or Device Group
1. Click the Dashboard option in the left-nav bar.
2. Click the name of the device or device group for which you want to configure security authentication.The device or device group profile pane appears, respectively.
3. Under Authentication, enter the required parameters for each applicable authentication method:Password, SSL, or SSH. All methods can be configured together on a single device or device groupprofile.
Description of ParametersAuthentication Method
Username—Enter the authentication username.
Password—Enter the authentication password.
Password
Server Common Name—Enter the server name protected by the SSL certificate.
CA Profile*—Choose the applicable CA profile(s) from the drop-down list.
Local Certificate*—Choose the applicable local certificate profile(s) from the drop-downlist.
SSL
SSH Key Profile*—Choose the applicable SSH key profile(s) from the drop-down list.
Username—Enter the authentication username.
SSH
*To edit or view details about saved security profiles, go to the Settings > Security page in the left-navbar.
The following guidelines apply to the Authentication configuration:
• Paragon Insights decides which authentication method to apply to a device or device group basedon which of the required security parameters are configured.
• When more than one method is valid, Paragon Insights prioritizes SSL and SSH authentication overpassword-based authentication.
• Paragon Insights prioritizes device-level settings over device group-level settings.
4. Click Save to save the configuration or click Save and Deploy to save and deploy the configuration.
277

Configure Data Summarization
Data summarization refers to the process of creating a concise version of raw data and field data. Datacan be summarized as a function of time or when a change occurs. You can improve the performance anddisk space utilization of the Paragon Insights (formerlyHealthBot) time series database (TSDB) by configuringdata summarization methods to summarize the raw data and field data collected by Paragon Insights.
Paragon Insights collects data by using push or pull data collection methods. You can create ParagonInsights rules or use the available predefined rules to determine how and when data is collected. Thiscollected telemetry data provides information about the state of network devices and its components. Formore information on data collection methods, see Paragon Insights Data Ingest Guide.
You can create a raw data summarization profile to improve the performance and disk space utilization ofthe TSDB. Starting with Paragon Insights Release 4.0.0, you can create a rollup summarization profile tosummarize processed data that is stored in fields in the TSDB. Field data is processed data that is storedin fields in the TSDB. A field is a single piece of information that forms a record in a database. In TSDB,multiple fields of processed data make a record. In releases earlier than Paragon Insights Release 4.0.0,only raw data can be summarized.
Table 22 on page 278 provides a list of the supported data summarization algorithms and a description oftheir output:
Table 22: Descriptions of the Data Summarization Algorithms
Description of outputAlgorithm
Value of the last data point collected within the time span.Latest
Total number of data points collected within the time span.Count
Average value of the data points collected within the time span.Mean
Minimum value of the data points collected within the time span.Min
Maximum value of the data points within the time span.Max
Value of the data point whenever the value is different from the previous data point(occurs independently from the user-defined time span).
On-change
Standard deviation of the data points collected within the time span.Stddev
Sum of the data points collected within the time span.Sum
278

If no summarization algorithm is associated with the data, the following algorithms are used by default:
Data summarization algorithmData type
MeanFloat, integer, unsigned
On-changeBoolean, string
You can use data summarization profiles to apply specific summarization algorithms to raw data and fielddata collected by Paragon Insights for a specific device group:
These topics provide instructions on how to create a data summarization profile.
• Creating a Raw Data Summarization Profile on page 279
• Creating a Data Rollup Summarization Profile on page 281
After you have created a data summarization profile, you can apply the profile to a device group. For moreinformation, see “Applying Data Summarization Profiles to a Device Group” on page 285.
Creating a Raw Data Summarization Profile
To create a raw data summarization profile that can be applied to a device group:
1. Click Settings > Summarization Profiles link in the left-nav bar.
2. Select Raw Data from the Summarization Profiles list.
The Raw Data Summarization Profiles page is displayed.
3. Click (+) icon to add a summarization profile.
The Add Raw Data Summarization Profile page is displayed.
4. In the Name text box, enter the name of the profile.
5. Click Add Type Aggregate to add an aggregate type.
The Name and Function drop-down lists are displayed.
Follow these steps to select a name data type and associate it with a data summarization algorithm.
The algorithm configured for a specific sensor path name overrides the algorithm configured for thecorresponding data type.
a. Select a name data type from the Name drop-down list.
279

The available name data types to choose from are string, integer, boolean, float, and unsigned integer.
Starting in Paragon Insights Release 4.2.0, you can also select unsigned integer as a name data type.An unsigned integer is a data type that can contain values from 0 through 4,294,967,295.
b. After you have selected a name data type, you associate it with a data summarization function.
To associate a name data type with a data summarization function, select a function from theFunctions drop-down list.
The available functions to choose from are latest, count, mean, min, max, on-charge, stddev, andsum.
c. (Optional) To add another aggregate type, click Add Type Aggregate, and repeat step a and step b.
6. Click Add Path Aggregate to add an aggregate path.
The Name and Function drop-down lists are displayed.
To assign a sensor path name and associate it with a data summarization algorithm:
NOTE:
The algorithm configured for a specific sensor path name overrides the algorithm configuredfor the corresponding data type.
a. Enter a sensor path name in the Name text box.
You can enter a path name for a sensor that is not supported by Paragon Insights. For sensorssupported by Paragon Insights, the path name must be entered in the following format:
ExamplePath Name FormatSensor
/components/component/namesensor-pathOpen Config
jnpr_qmon_ext:queue_monitor_element_info.percentagesensor-name:sensor-pathNative GPB
REutilizationTable:15_min_cpu_idleyaml-table-name:sensor-pathiAgent
.1.3.6.1.2.1.2.2:jnxLED1Index
ospfNbrTable:ospfNbrIpAddr
snmp-table-name:sensor-pathSNMP
interface_link_down:operational-statuspattern-set: sensor-pathSyslog
hb-ipfix-ipv4-template:sourceIPv4Addresstemplate-name:sensor-pathFlow (NetFlow)
280

b. After you have entered a sensor path name, you associate it with a data summarization function.
To associate a sensor path name with a data summarization function, select a function from theFunctions drop-down list.
The available functions to choose from are latest, count, mean, min, max, on-charge, stddev, andsum.
c. (Optional) To add another aggregate path, click Add Path Aggregate, and repeat step a and step b.
7. Click Save to only save the configuration.
Click Save & Deploy to save and immediately deploy the configuration.
8. You can now apply the raw data summarization profile that you created to a specific device group. Formore information, see “Applying Data Summarization Profiles to a Device Group” on page 285.
Creating a Data Rollup Summarization Profile
Paragon Insights Release 4.0.0 supports data rollup summarization. You can create a rollup summarizationprofile to summarize processed data that is stored in fields in the TSDB. Field data is processed data thatprovides information on network devices and its components, and is stored in fields in the TSDB. A fieldis a single piece of information that forms a record in a database. In TSDB, multiple fields of processeddata make a record. Data rollup summarization enables efficient data storage and also ensures retainingof data for a longer duration.
You can create a data rollup summarization profile to apply to a device group from the:
• Paragon Insights graphical user interface (GUI)
• Command line interface (CLI)
Create a Data Rollup Summarization Profile by using Paragon Insights UI
To create a data rollup summarization profile:
1. Click Settings > Summarization Profiles link in the left-nav bar.
2. Select Data Rollup from the Summarization Profiles list.
The Data Rollup Summarization Profiles page is displayed.
3. Click (+) icon to add a summarization profile.
The Add Data Rollup Summarization Profile page is displayed.
281

4. Enter the name of the profile in the Name text box.
The maximum length is 64 characters.
Regex pattern: “[a-zA-Z][a-zA-Z0-9_-]*”
5. ClickAddRule to add an existing Paragon Insights rule for which rollup summarizationmust be applied.
The Name and Apply on Existing Data drop-down lists are displayed.
Follow these steps to select a rule, and to apply the rule to the profile. You can also apply the rule toexisting data.
a. Select an existing Paragon Insights from the Name drop-down list.
b. To apply the rule that you selected to existing data, select True from the Apply on Existing Datadrop-down list.
The default value is False.
c. Click Add Field to define fields of the rule configured for which data rollup summarization must beapplied.
To associate a field to an aggregate function:
i. Select a field from the Name drop-down list for which data must be aggregated.
ii. Select one or more aggregate functions from the Aggregate Function drop-down list that youwant to apply to a field.
d. (Optional) To add another rule to the profile, click Add Rule, and repeat step a through step c.
6. Click Add Data Rollup Order to define the frequency at which rollup summarization should occur.
The Name and Retention Policy drop-down lists, and the Rollup Interval text box are displayed.
To define a data rollup order:
a. Enter a name to identify the data rollup order in the Name text box.
The maximum length is 64 characters.
Regex pattern: “[a-zA-Z][a-zA-Z0-9_-]*”
b. Enter a value in the Rollup Interval text box to define the interval in which data is summarized.
Regex pattern: “[1-9][0-9]*[mhdw]”, where m is minutes, h is hours, d is days, and w is weeks.
Minimum value is 30m. Maximum value is 52w.
282

c. Select the retention policy for the rollup order from the Retention Policy drop-down list. A retentionpolicy defines how long you want to retain the rolled-up data.
Selecting a retention policy is optional. If you do not select a retention policy, the device groupretention policy is considered by default.
d. (Optional) To define another data rollup order, click Add Data Rollup Order, and repeat step athrough step c.
7. Click Save to only save the configuration.
Click Save and Deploy to save and immediately deploy the configuration.
8. You can now apply the data rollup summarization profile that you created to a specific device group.For more information, see “Applying Data Summarization Profiles to a Device Group” on page 285.
Create a Data Rollup Summarization Profile by using CLI
Figure 61 on page 284 is an example configuration of how you can configure a data rollup summarizationprofile from the CLI.
283

Figure 61: Example CLI Configuration of Creating a Data Rollup Summarization Profile
284

Applying Data Summarization Profiles to a Device Group
After you create a data summarization profile, you can apply the profile to a specific device group to startsummarizing TSDB data:
1. Click Configuration > Device Group in the left-nav bar.
The Device Group Configuration page is displayed.
2. Select the check box next to the name of the device group to which you want to apply the datasummarization profile.
3. Click the Edit Device Group icon to edit the device group.
The Edit <device-group-name> page is displayed.
285

4. Apply a raw data summarization profile.
To apply a raw data summarization profile to a device group:
a. Click Summarization.
The Time Span and Data Summarization text boxes are displayed.
b. Enter the Time Span in seconds (s), minutes (m), hours (h), days (d), weeks (w), or years (y).
c. Choose the data summarization profiles from the drop-down list to apply the ingest data. To editor view details about saved data summarization profiles, go to the Data Summarization page andclick the Settings menu option in the left-nav bar.
If you select two or more profiles, the following guidelines apply:
• If the same data type or sensor path name is configured in two or more profiles, the associatedalgorithms will be combined.
• The table that stores the summarization output includes columns of summarized data for eachalgorithm associated with each data field collected by Paragon Insights. The naming conventionfor each column is as follows:
Column name for the summarized outputNumber of algorithms associatedwith a data field
field-name
Example: 5_sec_cpu_idle
1
field-name_first-algorithm-name, field-name_ second-algorithm-name
Example: 5_sec_cpu_idle_MIN, 5_sec_cpu_idle_MAX
2
field-name_first-algorithm-name, field-name_ second-algorithm-name, field-name_third-algorithm-name...
3
286

Apply a data rollup summarization profile
Points to remember before you apply a data rollup summarization profile to a device group:
• Ensure that the rules present in the rollup profile are already associated with the device group.
• You can add one or more than one rollup summarization profile to a device group.
• Rules configured across all the profiles associated with the device group must be unique.
• While associating a rollup profile with a device group, the interval of the first data rollup order mustbe less then the device group retention policy to avoid data overflow. The device group retentionpolicy is set to 7 days by default.
• When you want to remove a rule that is associated to a device group, you must first remove the datarollup summarization profile.
To apply a data rollup summarization profile to a device group:
a. Click Rollup Summarization.
The Rollup Summarization Profiles drop-down list is displayed.
b. Select the rollup summarization profiles you want to associate to this device group from the RollupSummarization Profiles drop-down list.
c. (Optional) You can also deploy rollup configuration at the device group-level by using the CLI.
See Figure 62 on page 287 for an example CLI configuration.
Figure 62: Example CLI Configuration
287

5. Click Save to only save the configuration.
Click Save and Deploy to save and immediately deploy the configuration.
Release History Table
DescriptionRelease
Paragon Insights Release 4.0.0 supports data rollup summarization. You can create a rollupsummarization profile to summarize processed data that is stored in fields in the TSDB.
4.0.0
Modify the UDA, UDF, and Workflow Engines
IN THIS SECTION
Overview | 288
How it Works | 290
Usage Notes | 291
Configuration | 292
Enable UDA Scheduler in Trigger Action | 294
Overview
When creating rules, Paragon Insights (formerly HealthBot) includes the ability to run user-defined actions(UDAs) as part of a trigger. UDAs are essentially Python scripts that can be executed by a Paragon Insightsrule. For example, you might configure a rule with a trigger that reacts to some critical interface goingdown and responds to the event by calling a function to send an SMS alert. You can write the logic to sendthe SMS in a UDA python script.
Starting with Paragon Insights Release 4.1.0, you can schedule UDAs and notifications. This is useful whenyou deploy multiple parallel instances of Paragon Insights in different locations. You can schedule UDAsto run alternatively from UDA schedulers located in different regions. In the event of a node failure, theUDA scheduler running in a parallel instance continues to execute your UDAs and notifications. For moreinformation, see “Enable UDA Scheduler in Trigger Action” on page 294.
288

Paragon Insights also includes the ability to run user-defined functions (UDFs). Created as Python scripts,UDFs provide the ability to process incoming telemetry data from a device and store the processed valuein the time-series database for that device/device-group. For example, the device may be sending FPCtemperature in Celsius but you want to process it to be stored as Fahrenheit values in the database.
Starting with HealthBot Release 3.2.0, the processing of UDF/UDA fields has beenmoved tomicroservicescalled UDF farm. This approach allows for Paragon Insights to process multiple data points from multipledevices and fields at the same time (parallel processing). The result is a 4 to 5 times increase in processingperformance for UDA/UDF.
While UDAs and UDFs provide excellent additional capabilities to Paragon Insights, there can be caseswhere the scripts may be importing Python modules that are not included in the default Paragon Insightsinstallation. Given this, you need to be able to addmodules as needed to the engine that runs these scripts.Paragon Insights Release 2.1.0 and later solves this challenge by allowing you to modify the UDA, UDFand Workflow engines, using a bash script that contains the instructions to install any dependencies.
Global Variables in Python ScriptsTAND executes Python scripts that use global variables. Global variables retain a value across multipleUDFs.
The following is an example function to calculate cumulative sum and store the value in global variablesum.
sum = 0
def cumulative_sum (a, b):
global sum
sum = sum + a + b
return sum
Using global variables in UDFs can prevent you from availing the gains in processing performance ensuredby UDF farms.
Instead of global variables, you can use the Python construct **kwargs to capture values that must beretained across different functions. When Paragon Insights calls a function (defined in a UDF), it sendstopic name, rule name, device group, point time, and device ID that are captured using the construct**kwargs. In case of UDAs, Paragon Insights sends topic name and rule name while executing the Pythonscript.
Along with infrastructure values, Paragon Insights also sends a parameter called hb_store in **kwargs thatfetches the last computed value for a variable.
To illustrate how hb_store works in the cumulative addition example:
289

def sum(a, b, **kwargs):
if ’sum’ not in kwargs[hb_store]:
kwargs[hb_store][’sum’] = 0 #if ’sum’ is not present in kwargs,
declare the initial ’sum’ value as 0.
kwargs[hb_store][’sum’] = kwargs[hb_store][’sum’] + a + b #Store
cumulative addition value in ’sum’
return kwargs[hb_store][’sum’]
Each time a function with the above code is called, it performs addition of last stored value in ’sum’ withthe value of a and value of b. The new value of addition operation is displayed and stored in ’sum’.
How it Works
You can modify the UDA, UDF, or Workflow engine using the Paragon Insights CLI, as shown below.
user@HB-server:~$ healthbot modify-uda-engine --help
usage: healthbot modify-uda-engine [-h] (-s SCRIPT | --rollback) [--simulate]
optional arguments:
-h, --help show this help message and exit
-s SCRIPT, --script SCRIPT
Run script in UDA engine
--rollback, -r Rollback UDA engine to original state
--simulate Run script in simulated UDA engine and show output
user@HB-server:~$ healthbot modify-udf-engine --help
usage: healthbot modify-udf-engine [-h] (-s SCRIPT | --rollback) [--simulate]
[--service SERVICE]
optional arguments:
-h, --help show this help message and exit
-s SCRIPT, --script SCRIPT
Run script in UDF engine
--rollback, -r Rollback UDF engine to original state
--simulate Run script in simulated UDF engine and show output
--service SERVICE Modify specific service UDF
root@davinci-master:/var/local/healthbot# healthbot modify-workflow-engine --help
290

usage: healthbot.py modify-workflow-engine [-h] (-s SCRIPT | --rollback)
[--simulate]
optional arguments:
-h, --help show this help message and exit
-s SCRIPT, --script SCRIPT
Run script in WORKFLOW engine
--rollback, -r Rollback WORKFLOW engine to original state
--simulate Run script in simulated WORKFLOW engine and show output
The commands have three main options:
• Simulate—test a script (and view its output) in the simulated UDA/UDF/Workflow engine environmentwithout affecting the running Paragon Insights system
• Modify—modify the actual UDA/UDF/Workflow engine using a script
• Rollback—revert to the original version of the UDA/UDF/Workflow engine
Usage Notes
• The bash script will run in a container running Ubuntu OS Release 16.04 or 18.04; write the scriptaccordingly.
• The script must be non-interactive; any questionsmust be pre-answered. For example, use the ‘-y’ optionwhen installing a package using apt-get.
• If you prefer to copy the source packages of the dependency modules onto the Paragon Insights serverso the engine canmanually install them instead of downloading them from the Internet, place the requiredsource packages in the /var/local/healthbot/input directory. Then within your bash script, point to the/input directory. For example, to use a file placed in /var/local/healthbot/input/myfile.txt, set the bashscript to access it at /input/myfile.txt.
• Modifying the UDA/UDF/Workflow engine more than once is not an incremental procedure; use a newbash script that includes both the original and new instructions, and re-run the modify procedure usingthe new script.
• UDA/UDF/Workflow modifications are persistent across upgrades.
291

Configuration
As a best practice, we recommend that you use the following workflow:
This best-practice approach ensures that you first validate your script in the simulated environment beforemodifying the real engine.
NOTE: The examples below use the UDA engine; these procedures apply equally to the UDFand Workflow engines.
NOTE: The procedure below assumes your Paragon Insights server is installed, including runningthe sudo healthbot setup command.
SIMULATE
Use the simulate feature to test your bash script in the simulated environment, without affecting therunning Paragon Insights system.
To simulate modifying the UDA engine:
1. Enter the command healthbot modify-uda-engine -s /<path>/<script-file> --simulate.
2. The script runs and the output shows on screen, just as if you entered the script commands yourself.
user@HB-server:~$ healthbot modify-uda-engine -s /var/tmp/test-script.sh --simulate
Running /var/tmp/test-script.sh in simulated alerta engine..
Get:1 http://security.ubuntu.com/ubuntu xenial-security InRelease [109 kB]
...
Fetched 4296 kB in 15s (278 kB/s)
Reading package lists...
292

Building dependency tree...
Reading state information…
...
MODIFY
When you are satisfied with the simulation results, go ahead with the actual modification procedure.
To modify the UDA engine:
1. Load the desired bash script onto the Paragon Insights server.
2. If your Paragon Insights server is fully up and running, issue the command healthbot stop -s alerta tostop the running services.
3. Run the command healthbot modify-uda-engine -s /<path>/<script-file>.
user@HB-server:~$ healthbot modify-uda-engine -s /var/tmp/test-script.sh
Running /var/tmp/test-script.sh in simulated alerta engine..
Success! See /tmp/.alerta_modification.log for logs
Please restart alerta by issuing 'healthbot start --device-group healthbot -s
alerta'
4. (Optional) As noted in the output, you can check the log file to further verify the script was loadedsuccessfully.
5. Restart the alerta service using the command healthbot start -s alerta.
6. Once complete, verify that the alerta service is up and running using the command healthbot status.
7. To verify that the UDA engine has been updated, use the command healthbot version -s alerta andcheck that the healthot_alerta container is using the <version>-custom tag.
user@HB-server:~$ healthbot version -s alerta
{'alerta': 'healthbot_alerta:2.1.0-custom'}
The UDA engine is now running with the installed dependencies as per the bash script.
293

ROLLBACK
If you have a need or desire to remove the changes to the engine, you can revert the engine to its originalstate.
To rollback the UDA engine:
1. Enter the command healthbot modify-uda-engine --rollback.
user@HB-server:~$ healthbot modify-uda-engine --rollback
Rolling back alerta engine to original state..
Successfully rolled back alerta engine
Please restart alerta by issuing 'healthbot start --device-group healthbot -s
alerta'
Note that it is not necessary to restart the alerta service at this point.
2. Once complete, verify that the alerta service is up and running using the command healthbot status.
3. To verify that the UDA engine has reverted back, use the command healthbot version -s alerta andcheck that the healthot_alerta container is using the <version> tag.
user@HB-server:~$ healthbot version -s alerta
{'alerta': 'healthbot_alerta:2.1.0'}
The UDA engine is now running in its original state, with no additional installed dependencies.
Enable UDA Scheduler in Trigger Action
In Paragon Insights Release 4.1.0, you can schedule UDAs and notifications to be executed within a settime interval. To schedule UDAs, you must first create a discrete scheduler and then link the scheduler inthe Trigger Action page.
NOTE: You can link only one trigger action scheduler to a Paragon Insights instance.
To know more about creating a scheduler, see Create a Scheduler Profile.
294
The scheduler set in Trigger Action applies to all device groups and network groups. You can disable UDAscheduling in the device group or network group configuration. To know more, see “Manage Devices,Device Groups, and Network Groups” on page 127.
To enable a scheduler:
1. Go to Settings > System.
2. Click the Trigger Action tab.
The Trigger Action page appears.
3. Select a scheduler profile that you want to associate with Trigger Action.
4. Do one of the following:
• Click Save to save the scheduler profile.
The profile is not applied to device or network groups. This option enables you to commit or rollbackthe configuration changes in the platform.
• Click Save and Deploy to deploy the configuration in your Paragon Insights instance.
The UDAs and notifications are generated based on the time period and time interval configured inthe scheduler for the application instance.
You cannot rollback configuration changes applied through Save and Deploy. However. you canremove the scheduler profile and repeat the save and deploy option to cancel UDA scheduling.
Release History Table
DescriptionRelease
StartingwithHealthBot Release 3.2.0, the processing of UDF/UDA fields has beenmovedto microservices called UDF farm.
3.2.0
Commit orRoll BackConfigurationChanges inParagonInsights
In Paragon Insights, when youmake changes to the configuration, you can perform the following operations:
• Save
• Save and Deploy
295
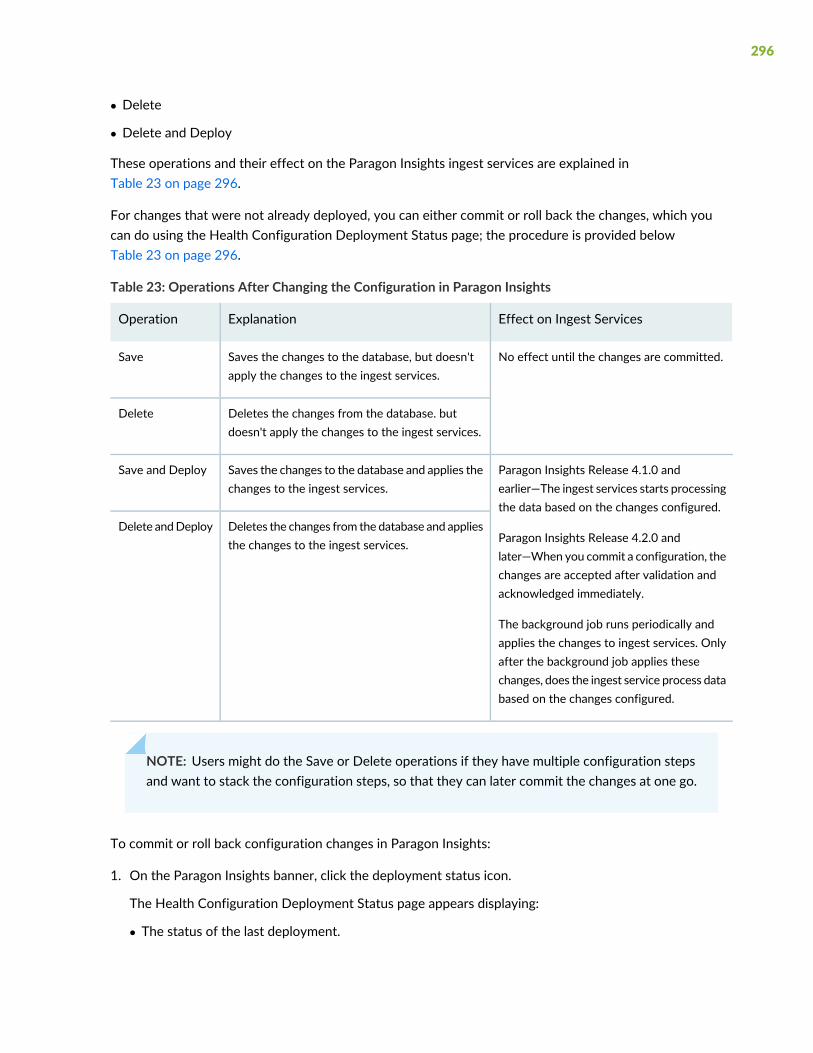
• Delete
• Delete and Deploy
These operations and their effect on the Paragon Insights ingest services are explained inTable 23 on page 296.
For changes that were not already deployed, you can either commit or roll back the changes, which youcan do using the Health Configuration Deployment Status page; the procedure is provided belowTable 23 on page 296.
Table 23: Operations After Changing the Configuration in Paragon Insights
Effect on Ingest ServicesExplanationOperation
No effect until the changes are committed.Saves the changes to the database, but doesn'tapply the changes to the ingest services.
Save
Deletes the changes from the database. butdoesn't apply the changes to the ingest services.
Delete
Paragon Insights Release 4.1.0 andearlier—The ingest services starts processingthe data based on the changes configured.
Paragon Insights Release 4.2.0 andlater—When you commit a configuration, thechanges are accepted after validation andacknowledged immediately.
The background job runs periodically andapplies the changes to ingest services. Onlyafter the background job applies thesechanges, does the ingest service process databased on the changes configured.
Saves the changes to the database and applies thechanges to the ingest services.
Save and Deploy
Deletes the changes from the database and appliesthe changes to the ingest services.
Delete andDeploy
NOTE: Users might do the Save or Delete operations if they have multiple configuration stepsand want to stack the configuration steps, so that they can later commit the changes at one go.
To commit or roll back configuration changes in Paragon Insights:
1. On the Paragon Insights banner, click the deployment status icon.
The Health Configuration Deployment Status page appears displaying:
• The status of the last deployment.
296

• The list of device groups and network groups for which pending changes have not been committed.
• The list of device groups and network groups for which pending deletions have not been committed.
2. You can do one of the following:
• Commit any changes that are pending deployment:
a. Click Commit.
Paragon Insights triggers the commit operation and the configuration changes are applied to theingest services. Depending on the number of configuration changes and number of device groupsand network groups affected, applying the configuration changes to the ingest services mighttake between a few seconds or a few minutes to complete.
After the operation completes, a confirmationmessage is displayed. Paragon Insights starts runningthe associated playbooks and starts ingesting the data.
b. Go to Step 3.
• Roll back any changes that are pending deployment:
a. Click Rollback to roll back any changes that are pending deployment. (The roll back operationdiscards the pending configuration changes that were previously saved in the database.)
Paragon Insights triggers the roll back operation and the configuration changes are rolled backalmost immediately. After the rollback is complete, a confirmation message is displayed.
b. Go to Step 3.
NOTE: After the roll back or commit operation is completed, the status of the last deploymentin the Health Configuration Deployment Status page displays the last operation that wascompleted.
3. Click Close to exit the page.
You are returned to the previous page fromwhich you accessed the Health Configuration DeploymentStatus page.
297

Logs for Paragon Insights Services
Paragon Insights (formerly HealthBot) runs various services (such as iAgent, jtimon, and Telegraf) tomonitorthe health of the network and individual devices. Each of these Paragon Insights services runs independentlyin a containerized environment and produces its own set of log messages that are categorized by severitylevel. You can configure different levels of logs to collect and download.
Table 24 on page 298 lists the severity levels of the Paragon Insights services logs. The severity levels arelisted in order from the highest severity (greatest effect on functionality) to the lowest. If you select alower severity level, the logs for each of the higher severity levels will also be collected. The log level forall services is set to error by default.
Table 24: Paragon Insights Service Log Message Severity Levels
DescriptionSeverity Level
(Highest level) Conditions that require correction.Error
Conditions that warrant monitoring.Warn
Non-error conditions of interest.Info
(Lowest level) Debug messages.Debug
This topic includes:
• Configure Service Log Levels for a Device Group or Network Group on page 298
• Download Logs for Paragon Insights Services on page 299
Configure Service Log Levels for a Device Group or Network Group
You can collect different severity levels of logs for the running Paragon Insights services of a device groupor network group. To configure which log levels to collect:
1. Click the Configuration > Device Group option in the left-nav bar.
2. For a device group, click on the device group name from the list of DEVICE GROUPS.
For a network group, click on the network group name from the list of NETWORK GROUPS.
3. For a Device Group, click the Edit Device Group (Pencil) icon
298

For a Network Group, click the Edit Network Group (Pencil) icon
4. In the edit window that pops up, click the caret next to the Logging Configuration heading to displaythe configuration fields.
5. From the drop-down list for Global Log Level, select the level of the log messages that you want tocollect for every running Paragon Insights service for the device or network group. SeeTable 24 on page 298 for a definition of the log severity levels. The level is set to error by default.
6. In the Log Level for specific services section, select the log level from the drop-down list for any specificservice that you want to configure differently from the Global log level setting. The log level that youselect for a specific service takes precedence over the Global log level setting.
7. Click Save to save the configuration or click Save and Deploy to save and deploy the configuration.
Download Logs for Paragon Insights Services
You can choose to download the collected logs for:
• Every running Paragon Insights service for a specific device group or network group.
• A specific running Paragon Insights service for a specific device group or network group.
• Common Paragon Insights services that are running by default for the Paragon Insights application.
To download the logs for Paragon Insights services:
1. Select the Administration > Log Collection option in the left-nav bar.
2. Select the Group Type, Group Name, and Service Name of the logs that you want to download:
DescriptionParameter
Options are:
device—Services running for a device group
network—Services running for a network group
common-services—Services running by default for the Paragon Insightsapplication.
Group Type
299

DescriptionParameter
• For device Group Type, select a device group name.
• For network Group Type, select a network group name.
• For common-services Group Type, select Paragon Insights.
Group Name
Select the specific Paragon Insights service for which you want to downloadthe logs.
Service Name
3. Click Download to download the logs to a file on your server. The filename is healthbot_logs.gzip bydefault.
Troubleshooting
IN THIS SECTION
Paragon Insights Self Test | 301
Device Reachability Test | 303
Ingest Connectivity Test | 305
Debug No-Data | 307
Starting with Release 2.1.0, HealthBot supports four verification and troubleshooting features:
• “Paragon Insights Self Test” on page 301: Verifies that Paragon Insights is working properly
• “Device Reachability Test” on page 303: Verifies that network devices are up and reachable via ping &SSH
• “Ingest Connectivity Test” on page 305: Validates which ingest types are supported for a given device
• “Debug No-Data” on page 307: Provides debugging when a device shows “No-data” in Paragon InsightsGUI
You can access these features by navigating to Administration > Debug from the left-nav panel.
300

Paragon Insights Self Test
Overview
When setting up basic functionality in Paragon Insights, it can be challenging to diagnose problems. Frominstallation, to device configuration, to adding devices and applying playbooks, when an issue occurs thereare many possible areas to investigate.
Starting with HealthBot Release 2.1.0, the self-test tool validates the core functionality of Paragon Insights.To perform the self test, the tool performs a typical set of tasks:
• Adds a simulated device to Paragon Insights
• Creates a device group, and adds the device
• Creates a rule
• Creates and deploys a playbook
• Streams data from the simulated device
• Displays ongoing status in the dashboard
The self-test instance essentially acts as a fully working setup, running entirely within the Paragon Insightssystem. When testing is complete, the tool provides a report.
Other Uses for the Self Test Tool
In addition to validating the Paragon Insights installation, the self-test feature also provides:
• An easyway to do a quick demo - the self test instance provides a simulated device connected to ParagonInsights, so you can demo Paragon Insights with no need to add a real device or apply playbooks.
• A good way for new users to get started - the self test auto-configures a simulated device connectedto Paragon Insights, thereby eliminating the complexity of adding devices, applying playbooks, and soon.
• A ‘running reference’ - if there is an issue with real devices, you can use a self-test instance to helpdetermine where the issue is; if the self-test instance is OK then the problem is not with the ParagonInsights system.
Usage Notes
• Currently this feature supports simulating devices to stream data for OpenConfig telemetry and iAgent(NETCONF).
• You can retain the self-test instance to act as a ‘running reference’, as noted above.
• The color coding for the test results is as follows:
301
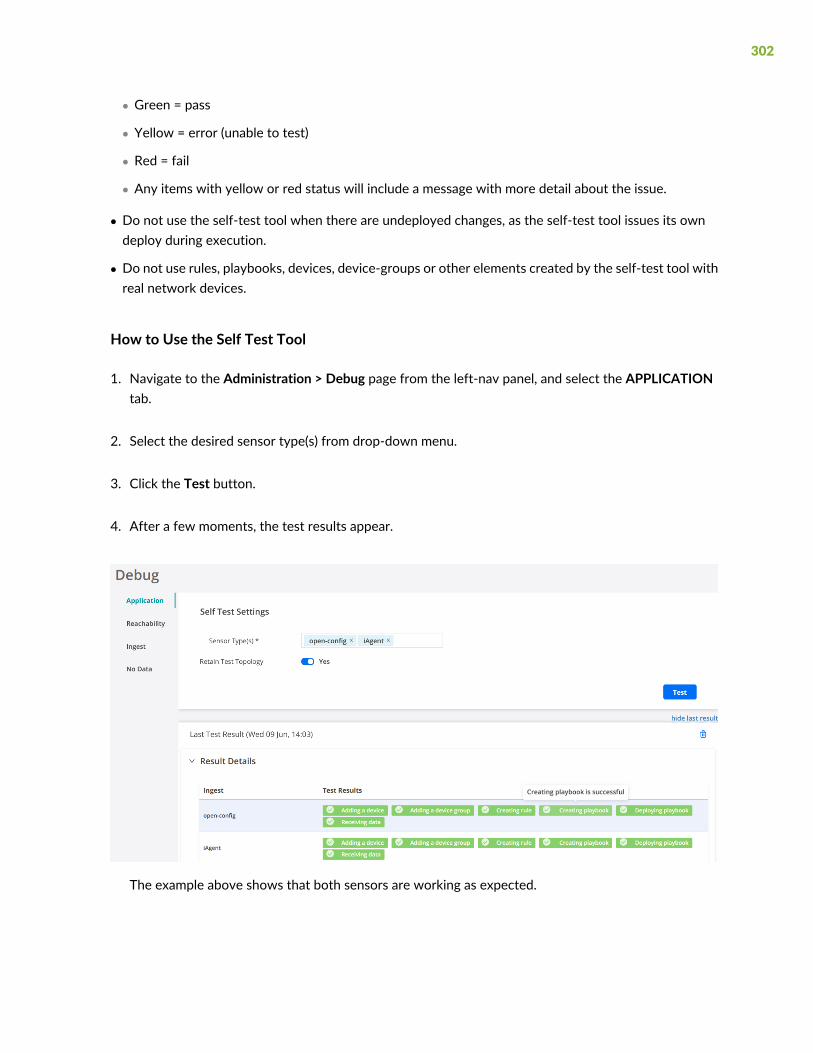
• Green = pass
• Yellow = error (unable to test)
• Red = fail
• Any items with yellow or red status will include a message with more detail about the issue.
• Do not use the self-test tool when there are undeployed changes, as the self-test tool issues its owndeploy during execution.
• Do not use rules, playbooks, devices, device-groups or other elements created by the self-test tool withreal network devices.
How to Use the Self Test Tool
1. Navigate to the Administration > Debug page from the left-nav panel, and select the APPLICATIONtab.
2. Select the desired sensor type(s) from drop-down menu.
3. Click the Test button.
4. After a few moments, the test results appear.
The example above shows that both sensors are working as expected.
302

Device Reachability Test
Overview
In early versions of Paragon Insights, there was noway to easily determine whether the devices you addedwere up and reachable; you would need to get through the entire setup procedure - add the device, setupa device group, apply playbooks, monitor devices - at which point the health pages would indicate “nodata” indicating that the setup did not work correctly. Furthermore, “no data” does not indicate whetherthe problem is a reachability issue or data streaming issue.
Starting with HealthBot Release 2.1.0, the device reachability tool can verify connectivity to a device. Thetool performs tests using ping and SSH. Paragon Insights uses the device’s IP address or host name, basedon what was configured when adding the device.
Usage Notes
• While this feature is generally intended to help troubleshoot device onboarding, you can use it any timeto check device reachability.
• The color coding for the test results is as follows:
• Green = pass
• Yellow = error (unable to test)
• Red = fail
• Any items with yellow or red status will include a message with more detail about the issue.
303

How to Use the Device Reachability Tool
1. To access the tool:
• Navigate to theAdministration >Debug page from the left-nav panel, and select theREACHABILITYtab.
• Or, on theDashboard page click the desired device in the device list widget, and in the pop-upwindowclick the REACHABILITY TEST button.
NOTE: The REACHABILITY TEST button does not appear when first adding the device.
2. In the Device Reachability tool, select the desired device from drop-down menu.
3. Click the Test button.
4. After a few moments, the test results appear.
The example above shows that the ping test was successful, but the SSH test failed.
304

Ingest Connectivity Test
Overview
In early versions of Paragon Insights, there was no way to easily determine which ingest methods weresupported for a given device; you also had no way to know whether the configured ingest methodsuccessfully established a connection with the network device.
StartingwithHealthBot Release 2.1.0, the ingest connectivity tool can verify ingestmethodswhere ParagonInsights initiates the connection, such as OpenConfig, iAgent, and SNMP. Paragon Insights does not testUDP-based ingest methods, such as syslog and Native GPB, as the UDP parameters are common to adevice group and not specific to a device.
Paragon Insights validates each supported ingest method in its own way:
• OpenConfig: Establishes a gRPC connection with the device using its IP/host name, gRPC port, andcredentials
• iAgent: Establishes a NETCONF session with the device using its IP/host name, NETCONF port, andcredentials
• SNMP: Executes a simple SNMP GET command; expects to get a reply from the device
This tool provides multiple benefits:
• It helps to identify when there might be missing configuration on the network device side.
• It helps you choose appropriate playbooks and rules that use sensors compatible with the supportedingest methods.
• It helps to identify ingest connectivity issues early on, rather than troubleshoot the “no-data” issuedescribed in the previous section.
Usage Notes
• While this feature is generally intended to help troubleshoot device onboarding, you can use it any timeto check ingest connectivity.
• The color coding for the test results is as follows:
• Green = pass
• Yellow = error (unable to test)
• Red = fail
• Any items with yellow or red status will include a message with more detail about the issue.
305

How to Use the Ingest Connectivity Tool
1. To access the tool:
• Navigate to the Administration > Debug page from the left-nav panel, and click the INGEST tab.
• Or, on theDashboard page click the desired device in the device list widget, and in the pop-upwindowclick the INGEST TEST button.
NOTE: The Ingest Test button does not appear when first adding the device.
2. In the Ingest Connectivity tool, select the desired device from drop-down menu
3. Click the Test button.
4. After a few moments, the test results appear.
The example above shows that iAgent is supported, OpenConfig is not supported, and SNMPencountered an error.
306

Debug No-Data
Overview
One of the most common problems that a Paragon Insights users face is “How to debug no-data?”.Determining the root cause is challenging as the issue can occur for a variety of reasons, including:
• Device not reachable
• Device not sending data
• Firewall blocking connections
• Ingest connectivity settings mismatch
• Rule frequency/trigger interval is configured less than the router response time
• Paragon Insights services not running
In early versions of Paragon Insights, you needed to manually look for the problem, checking add-deviceparameters, reviewing logs, checking the device configuration, and so on.
Starting with HealthBot Release 2.1.0, the debug no-data tool helps to determine why a device or rule isshowing a status of “no-data”. The tool takes a sequential, step-by-step approach to determine at whichstage incoming data is getting dropped or blocked, as follows:
• Paragon Insights Services
• Verify that all common and device group-related services are up and running
• Device Reachability
• Test connectivity to device using ping and SSH
• Ingest Connectivity
• Verify that the configured ingest session is established
• Raw Data Streaming
• Verify whether the ingest is receiving any raw data from the devices
• Likely to be OK if device connectivity is OK
• Field Processing
• Within rules, verify that the fields working properly, and that the field information is populated in thedatabase
• Trigger Processing
307

• Within rules, verify that the trigger settings working as intended, and status information is populatedin the database
• API Verification
• Check for API timeouts that might be affecting the GUI
Usage Notes
• The tool runs through the entire sequence of checks, regardless of any issues along the way.
• The test results provide root cause information and advise where to focus your troubleshooting efforts.
• While this feature is generally intended to debug a device when it is marked as no-data, you can use itany time to verify that deployed rules are receiving data.
• This tool does not support rules using a syslog sensor, as the sensor data is event driven and not periodic.
• The color coding for the test results is as follows:
• Green = pass
• Yellow = error (unable to test)
• Red = fail
• Any items with yellow or red status will include a message with more detail about the issue.
How to Use the Debug No-Data Tool
1. To access the tool:
• On any device health page, click a “no data” tile.
• Or, navigate to the Administration > Debug page from the left-nav panel, and select the NO DATAtab.
2. In the Debug No-Data tool, select the desired device group, device, and one or more rules from thedrop-down menu
308

3. Click the Debug button.
4. After a few moments, the test results appear.
The example above shows that one common services is not working properly.
Paragon Insights Configuration – Backup and Restore
IN THIS SECTION
Back Up the Configuration | 309
Restore the Configuration | 310
Backup or Restore the Time Series Database (TSDB) | 311
Back Up the Configuration
To back up the current Paragon Insights (formerly HealthBot) configuration:
1. Select the Administration > Backup option from the left-nav bar.
309

2. Check the check box for the configuration that you want to backup.
If you also want to back up any configuration changes that have not yet been deployed, toggle theBackup Undeployed Configuration switch to the right.
3. Click Backup.
Back Up Helper Files
Helper files are the python, yaml, or other externally created files whose tables are referenced in iAgentsensor definitions within rule definitions.
1. Select the Administration > Backup option from the left-nav bar.
2. Click the BACKUP HELPER FILE button.
Paragon Insights creates a tar archive that you can save to your computer.
Restore the Configuration
To restore the Paragon Insights configuration to a previously backed up configuration:
1. Select the Administration > Restore option from the left-nav bar.
2. Click the Choose File button.
3. Navigate to the backup file from which you want to restore the configuration, and click Open.
Once opened, a list of backup configuration sections appears as buttons under Select the configurationbackup file heading. By default, all configuration elements in the selected backup file are selected torestore.
4. (Optional) From the list of buttons, you can deselect (change the “-” to “+”) individual files from restoringby clicking on the button.
5. Click RESTORE CONFIGURATION & DEPLOY to restore and deploy the configuration.
310

Restore Helper File
To restore previously backed up helper file archives:
1. Select the Administration > Restore option from the left-nav bar.
2. Click the Choose File button directly above the second line, “Select the helper backup file”.
3. Locate the backed up helper file in the file browser and click Open.
4. Click the RESTORE CONFIGURATION button to restore the helper files to Paragon Insights, or theRESTORE CONFIGURATION & DEPLOY button to restore the helper files to their original locationwithin Paragon Insights.
Backup or Restore the Time Series Database (TSDB)
Starting with HealthBot Release 3.2.0, you can backup and restore the TSDB separately from otherconfiguration elements. The backup and restore operations for the TSDB are only available through theParagon Insights CLI. The backup and restore commands are invoked by using a predefined python script,healthbot.py. You must have root access to the CLI interface of the Paragon Insights server in order toissue these commands.
Use the following command to set the environment variable:
export HB_EXTRA_MOUNT1=/root/.kube/config
HB_EXTRA_MOUNT1 is a variable and user defined.
The generic command and the optional arguments (in square brackets) for performing backup and restoreis described here with examples.
healthbot tsdb (backup|restore) [-h] [--database DATABASE] [--all] --path
PATH
The required arguments for the healthbot tsdb command are:
• backup–perfom a backup operation
• restore–perform a restore operation
311

• --path PATH–create the backup file or restore the database(s) from the container at PATHwhere PATHis HB_EXTRA_MOUNT1.
• Starting with Paragon Insights Release 4.0.0, you can use the following commands.
• healthbot tsdb stop-services —stop service
• healthbot tsdb start-services --port <portnumber>—start service
NOTE: In Paragon Insights, the TSDB port is exposed by default. If you need to shut the TSDBport down for security reasons, you can use the healthbot tsdb stop-services command.External API queries to TSDB do not need the TSDB port to be exposed. However, if you useexternal tools such as Grafana, or you need run a query to the TSDB directly (and not throughAPIs), the TSDB port must be exposed.
Optional Arguments
-h, --help show this help message and exit--database DATABASE Takes backup (or restore) of the given list of databases. Eitherdatabase or all flag must be configured--all Takes backup (or restores) of all the databases. Either database orall flag must be configured
Example – Backup the TSDB and Store it in HB_EXTRA_MOUNT3
healthbot tsdb backup --path HB_EXTRA_MOUNT3
Example – Restore the TSDB from HB_EXTRA_MOUNT2
healthbot tsdb restore --path HB_EXTRA_MOUNT2
Release History Table
DescriptionRelease
Starting with HealthBot Release 3.2.0, you can backup and restore the TSDB separatelyfrom other configuration elements
3.2.0
312

3CHAPTER
License Management
Paragon Insights Licensing Overview | 314
View, Add, or Delete Paragon Insights Licenses | 314

Paragon Insights Licensing Overview
NOTE: This topic is relevant for Paragon Insights Releases 4.1.0 and 4.2.0.
Juniper Networks introduced the Juniper Flex Software Subscription Licensingmodel to provide an efficientway for you to manage licenses for hardware and software features. Paragon Insights uses this licensingmodel. For more information, see Paragon Insights Licensing topic in the Licensing Guide.
Starting from Paragon Insights Release 4.1.0, you need a license to activate the Paragon Insights graphicaluser interface (GUI).When you log in to the Paragon Insights GUI for the first time, the LicenseManagementpage appears. Depending on the type of license you add, you will have access to premium, advanced, orstandard features of Paragon Insights.
For more information on managing licenses from the Paragon Insights GUI, see “View, Add, or DeleteParagon Insights Licenses” on page 314.
View, Add, or Delete Paragon Insights Licenses
IN THIS SECTION
Add a Paragon Insights License | 315
Delete a Paragon Insights License | 315
View Paragon Insights Licensing Features | 316
View Status and Details of Paragon Insights License | 316
NOTE: This topic is relevant for Paragon Insights Releases 4.1.0 and 4.2.0.
For detailed information on licensing, see Paragon Insights Licensing topic in the Licensing Guide.
After you have obtained a Paragon Insights license through the Juniper Agile Licensing Portal, you canmanage your licenses from the Paragon Insights graphical user interface (GUI).
314

The Settings>License Management page enables you to:
Add a Paragon Insights License
To add a Paragon Insights license:
1. Navigate to Settings > License Management page.
The License Management page appears.
2. Click the plus (+) icon in the Licenses Added section to add a new license.
The Add License pop-up appears.
3. Click Browse and navigate to the location of the license file that you want to add.
Select the file and then click Open.
4. The license file is now added to the Add License page.
5. Click Ok to confirm.
The license you added is now listed in the Licenses Added section of the License Management page.
Delete a Paragon Insights License
To delete and existing Paragon Insights license:
1. Navigate to Settings>License Management page.
The License Management page is displayed.
2. From the Licenses Added section, click the option button (available in beginning the row) of the licenseyou want to delete, and then click Delete.
The Confirm Delete page appears.
3. Click Yes to delete the license.
315

View Paragon Insights Licensing Features
To view Paragon Insights licensing features, navigate to Settings > License Management page.
The Features Summary section, as given in Table 25 on page 316 provides information on the ParagonInsights feature licensing attributes.
Table 25: Feature License Attributes
DescriptionAttribute
View Paragon Insights license name.
• PIN-Advanced
• PIN-Standard
• PIN-Devices
Feature
Brief description of the Paragon Insights feature license.Description
The number of valid Paragon Insights licenses successfully added and available for use.License Limit
The number of available licenses that are currently in use in this instance of ParagonInsights.
Usage Count
Date and time when the license expires.Valid Until
Color definitions (dot indicator) that determine license compliance:
• Green—Feature licenses are in compliance with Juniper's End User License Agreement.
• Yellow—Device feature licenses are >= 90% of the limit. You are getting close to runningout of licenses. This status applies only to device feature licenses.
• Red—Feature licenses are not in compliancewith Juniper's EndUser License Agreement.Click the red dot to view details about the compliance issue.
Compliance
View Status and Details of Paragon Insights License
To view status and details of a Paragon Insights license, navigate to Settings > LicenseManagement page.The Licenses Added section provides information on the added Paragon Insights licenses. You can alsoclick the option button (available in beginning the row) of the license you want to view, and then clickMore > Details to view more information about the license.
316

Table 26: View Details of Licenses Added
DescriptionAttribute
View the Paragon Insights license identification number generated through theJuniper Agile Licensing Portal.
License ID
View the Paragon Insights software licensing package name.SKU Name
View the customer identification.Customer ID
View the order type (commercial, demo, education, emergency, lab, andunknown).
Order Type
View the validity type of a license (date-based or permanent).Validity Type
View the start date of the Paragon Insights license.Start Date
View the end date of the Paragon Insights license.End Date
Displays the state of the license.State
View the feature license identification number.Feature ID
View the Paragon Insights feature license name.Feature Name
View a brief description of the Paragon Insights feature license.Feature Description
View the entitled license count for this Paragon Insights feature.License Count
RELATED DOCUMENTATION
Paragon Insights Licensing Overview | 314
317