Adex BenchmArk 2012 - IAB France
52
ADEX BENCHMARK 2012 EUROPEAN ONLINE ADVERTISING EXPENDITURE Published 28th August 2013
-
Upload
khangminh22 -
Category
Documents
-
view
2 -
download
0
Transcript of Adex BenchmArk 2012 - IAB France
Adex BenchmArk
2012EUROPEAN ONLINE
ADVERTISING EXPENDITURE
Published 28th August 2013
IAB Europe AdEx Benchmark 20122
CONTENTS3 Introduction
4 About this report
5 Executive summary
Section 1 – AdEx Benchmark 2012 analysis
6 Online advertising growth over time
8 Online advertising in a macroeconomic context
10 26 markets in perspective
10 Volume
12 Growth
14 Share of total media
16 Ad spend per capita
18 Share of formats
Section 2 – Online advertising overview by sector
19 Display
22 Classifieds & Directories
25 Search
28 Mobile
30 Video
32 Video & Mobile
Section 3 – Overview by country
33 Top 10
35 Rest of Europe
Section 4 – Background market data
37 Top properties December 2012
42 Internet penetration in Europe 2012
Section 5 – Appendices
43 Appendix i: Definition of formats
44 Appendix ii: Participating IABs
45 Appendix iii: Methodology and adjusted data
45 Appendix iv: Adjustments by country
Section 6 – About us
49 Our research partners
50 About IAB Europe
51 And finally

© IAB Europe 3
IAB Europe in collaboration with IHS is pleased to publish the
7th edition of the AdEx Benchmark report, the definitive guide to
online advertising spend across Europe and reference point for
understanding the state and potential of the online advertising
market. This year’s report reveals that 2012 has been a
remarkable year for online which earned the best performer spot
in the advertising market, with an overall growth of 11.5 per cent.
In spite of macroeconomic volatility and high unemployment rates
in Europe, this strong upward trend continues with one in four
advertising Euros now being allocated to online.
The AdEx Benchmark report splits the online ad market into
three top level segments: Display, Classifieds and Directories and
Search. In 2012, the Display Ad market experienced a like-for-
like growth of 8.9 per cent giving it a total value of €7.9 billion,
mainly driven by mobile and online video. Spend on Classifieds
and Directories were underpinned by strong redistribution from
print to online and valued at €4.5 billion. While Search experienced
the strongest like-for-like growth of 15.5 per cent with a market
value of €11.9 billion.
Mobile display advertising continued an impressive surge growing
78.3 per cent to nearly €392m in total value – now accounting for
5 per cent of all online display spend in Europe. Meanwhile, online
video advertising has increasingly acted as a major draw for brand
advertisers, grabbing double-digit portion of display advertising
for the first time, with a share of 12.9 per cent. This is the first
time in Europe that online video has grabbed double-digit share of
display advertising.
The importance of neighbouring markets has also become more
obvious this year with Turkey, Russia and Slovakia registering the
biggest individual market growth (Slovakia 36.3 per cent, Russia
34.0 per cent, and Turkey 30.4 per cent). Russia also moved up a
notch to 4th position in the top ten largest online market rankings
falling behind the UK, Germany and France.
Since it was first published in 2006 the AdEx Benchmark report
has become a valuable tool for people seeking to navigate the
evolution of the online advertising sector. It is also extremely
relevant for companies seeking to make effective advertising
investment decisions, accurately access market opportunities
and maximise market potential.
IAB Europe remains committed to building its collaboration with
IHS and to delivering broader and deeper analysis in the years to
come. Next year in response to demand, we will extend our AdEx
reports to offer further data and analysis on a commercial basis.
INTrOduCTION
Digital advertising again shows its resilience in a year
of instability for the wider ad market. Whilst individual
markets have shown varying growth levels reflecting
economic pressures, the overall double-digit increase
confirms the sector’s ability to thrive on innovation, crea-
tivity and technology. Our contribution of over €24 billion
to the European economy grows ever more significant
and worthy of protection and development.
Constantine Kamaras, Vice-Chairman, 24 Media Group
Kimon Zorbas, CEO, IAB Europe

IAB Europe AdEx Benchmark 20124
ABOuT ThIS rEpOrT
The sources of the online advertising spend data contained within
this report are the annual industry benchmarking studies run by
each national Interactive Advertising Bureau (IAB) in Europe. The
national benchmarking studies represent the income of thousands
of websites and online advertising businesses.
The reported results are considered the closest measurement on
online advertising revenues across Europe as the data is compiled
directly by local IABs based on information supplied by companies
selling advertising online in each country. This year the AdEx
Benchmark covered 26 local IABs, double the amount since its
inception in 2006.
The data for this report is stated on the basis of actual gross
income (the amount of actual spend invoiced by the publisher
including any agency commission). To avoid any double-counting,
production costs and pan-regional ad spend are taken out of the
figures provided by the local IABs.
The report incorporated data from the following online
advertising formats:
• Display
• Classifieds&Directories
• Search
In 2012, the IAB Europe Research Committee in conjunction with
IHS held working groups to standardise and improve definitions
and measurement across markets for emerging formats. For the
first time, the AdEx Benchmark has systematically and consistently
incorporated data for spend on:
• Onlinevideoadvertisingdefinedasin-streamvideo
advertising (pre-rolls, mid-rolls, post-rolls) as agreed by the
IAB Europe AdEx Benchmark Video Working Group
• MobiledisplayadvertisingasagreedbytheIABEuropeAdEx
Benchmark Mobile Working Group
IAB Europe in partnership with IHS collates and aggregates the
data and makes the adjustments necessary to enable the data to
be comparable. Full details of this process for each country are
provided in Appendix iv.
The result is comparable data based on actual revenues from
across Europe. This is the seventh edition of the report and
therefore once again we are able to include year-on-year
comparisons for those countries that have provided data for at
least two years.
IHS does not audit the information or the data from local IABs and
provides no opinion or other form of assurance with respect to the
information. Only aggregate results are published and individual
company information is held in strict confidence by the audit
partners of local IAB studies.
2012: 26 countries
2008: 19 countries
2006: 13 countries

© IAB Europe 5
On an aggregate level across the 26 countries studied, Search
outperformed the other formats with a year-on-year increase in
spend of 15.5 per cent. It also is the largest single format in terms
of spend. Generating spend of €11.9 billion, it accounted for
48.8 per cent of all online advertising spend in 2012. As a purely
performance-driven format, Search has proven to be relatively
resilient to the weakening economy in Europe.
Display grew by 8.9 per cent year-on-year, underperforming
overall online advertising growth. In terms of spend, it generated
€7.9 billion, or 32.4 per cent of European online ad spend.
Display growth was fuelled by a burgeoning online video and
mobile advertising market. However, it was also held back by the
commoditisation of banner display advertising inventory, especially
in the long-tail, as well as exposure to economic headwinds which
cause brand advertising budgets to suffer.
The growth in both Search and Display spend slowed down in 2012
compared to the growth in 2011. For Classifieds and Directories,
the story is different. Although growth also underperformed
the overall rate of 11.5 per cent, the pace of growth picked up
nevertheless. Whereas spend on Classifieds and Directories grew
by 5.7 per cent in 2011, growth accelerated to 6.3 per cent in
2012. Growth came from the Classifieds component in particular,
outperforming Directories. Recent years have seen ongoing
consolidation in the online Classifieds markets, both on a national
and a pan-European level. This consolidation, driven by large print
publishers, was a key contributor to 2012 market growth.
The European online advertising market recorded spend of €24.3
billion in 2012. This is a year-on-year increase of 11.5 per cent
from €21.9 billion in 2011. In 2012, online advertising accounted
for 25.6 per cent of all advertising spend, surpassing newspapers
to become the second biggest media category in Europe after TV.
The 2012 double-digit growth took place despite weak
macroeconomic stimulus. Flat or declining GDP in most markets
had an adverse effect on the advertising market and most
traditional media suffered. Across Europe, total media advertising
revenue fell by 2.7 per cent, according to IHS estimates.
The 11.5 per cent growth for European online advertising is derived
from aggregated revenues across all 26 countries represented in
this study. Individual growth rates varied across countries. Eleven
markets grew above the European 11.5 per cent. Seven of these
markets were from Central and Eastern Europe (CEE). Russia,
Slovakia and Turkey grew fastest with rates above 30.0 per cent.
The fast-growing CEE markets are emerging markets with low
ad spend per capita and a low online share of advertising in a
European context. Yet, above-average growth also came from
some of the most mature online advertising markets in Europe
with high ad spend per capita. Online advertising spend grew by
12.5 per cent year-on-year in Denmark, by 13.3 per cent in the UK
and by 20.0 per cent in Sweden.
The variance in growth is not only reflected in different national
trends, it also varied across formats. This study tracks online
ad spend across Display (including video and mobile), Search
(including mobile) and Classifieds and Directories.
0
5
10
15
20
25
20122011
€bn
€21.9bn11.5%
€24.3bn
Online grows 11.5% in 2012
ExECuTIvE SummAry
European online advertising: year-on-year growth (%)
0
5
10
15
2040.0%
15.5%
%
Paid-for-search
2012
Display Classifieds &Directories
Total
8.9%
15.4%
6.3%5.7%
11.5%
14.5%
17.9%
2011
1. Year-on-year growth is calculated excluding the ‘Other’ category to maintain comparability across countries. The growth reported is also like-for-like and hence excludes online ad formats and market entrants newly introduced in 2012.
2. At constant 2012 exchange rates.

IAB Europe AdEx Benchmark 2012
Section 1 - AdEx Benchmark 2012 Analysis
6
Online advertising growth over time
Since IAB Europe began documenting the size of the European online advertising market in 2006, spend has grown every year. In 2006,
the value at the market stood at €9.4 billion, versus €24.3 billion in 2012. This is an increase in spend of €14.9 billion and translates into a
2012 GrOwTh IN CONTExT
Online ad spend in Europe over time (€bn)
0
5
10
15
20
25
30
2012201120102009200820072006
compound annual growth rate of 17.2 per cent, or €2.5 billion per annum. Growth rates, drivers and inhibitors varied between 2006 and
2012.
In 2007, spend was up 40 per cent year-on-year. Principal drivers were France, Germany and the UK as some of the earliest adopter
markets of online advertising and three largest overall advertising markets in Europe.
In 2008, the three biggest European markets matured and their growth clustered around the 20 per cent mark. The main impetus now
came from emerging markets in Poland and Slovenia. Yet, their absolute market size stood behind those of the big three and the European
effect of Polish and Slovenian developments were more modest in consequence.
2009 market conditions were characterised by the global economic recession. All media were affected, including online. Yet, 2009 also
demonstrated that online advertising was more resilient against economic volatility. Whereas all other media were flat or down, online ad-
vertising achieved 4.5 per cent growth across Europe. Some emerging markets saw drops in online advertising as the sector was still small
and underdeveloped. Advertisers chose to relocate budgets to traditional media channels which at that time were more tried and tested.
Search in particular stood out in 2009, growing by 10.8 per cent as advertisers were reassured by the return-on-investment provided by
search’s direct response pricing model.

7© IAB Europe
Section 1 - AdEx Benchmark 2012 Analysis
2012 GrOwTh IN CONTExT
Online advertising growth over time
0
5
10
15
20
25
30
35
40
201220112010200920082007
%
40.0%
20.2%
15.3% 14.5%
4.5%
11.5%
Europe’s online advertising market rebounded from the 2009 slump a year later. In 2010, growth was back at double-digit (15.3 per cent).
Display led this surge with growth of 21.3 per cent. Innovations in targeting, format standardisation, and the proliferation of online video
advertising increased confidence in the display format and triggered new spend from brand advertisers, especially the fast-moving con-
sumer goods sector.
Online advertising spend maintained double-digit growth in 2011, increasing by 14.5 per cent year-on-year. Display (+15.3 per cent) and
Search (+17.9 per cent) performed similarly.
Economically, 2012 was the toughest advertising year since 2009. Many European economies suffered both GDP and advertising spend
declines. In contrast, online advertising experienced double-digit growth for the third year in a row, up 11.5 per cent. This was primarily
helped by advertiser confidence in the performance-based nature of search, the brand-friendly online video format, as well as the increased
scalability of mobile advertising.

Online advertising in a macroeconomic context
Advertising markets are in general very susceptible to changes in the macroeconomic environment. 2012 has been a tough year for
European economies, and the Eurozone in particular. After the 2008 and 2009 recession, Eurozone GDP showed eight quarters of year-on-
year growth. Yet, after a Q1 2011 peak, growth rates have slowed down. Since Q1 2012, Eurozone GDP has been on a decline throughout
2012. In the context of the European sovereign debt crisis, high unemployment and cutbacks in consumer spending, advertising markets
suffered in 2012.
Total advertising across all media declined -0.4 per cent in Europe1 last year, but would have experienced a steeper fall at -4.0 per cent
without the contribution of online. In Western Europe, total advertising excluding online would have declined by -5.2 per cent but with
the 9.1 per cent surge in online ad markets, the region ended the year with a drop of -1.8 per cent. Online also lifted CEE markets from
what would have been a mere 2.9 per cent growth in ad markets excluding online to a 7.2 per cent total media advertising growth rate
year-on-year.
IAB Europe AdEx Benchmark 2011
Section 1 - AdEx Benchmark 2012 Analysis
8
2012 GrOwTh IN CONTExT
1 Europe entails only the 26 countries participating in the study
Real GDP growth in Europe (%)
-8
-6
-4
-2
0
2
4
6
2013
Q4
2013
Q3
2013
Q2
2013
Q1
2012
Q4
2012
Q3
2012
Q2
2012
Q1
2011
Q4
2011
Q3
2011
Q2
2011
Q1
2010
Q4
2010
Q3
2010
Q2
2010
Q1
2009
Q4
2009
Q3
2009
Q2
2009
Q1
2008
Q4
2008
Q3
2008
Q2
2008
Q1
2007
Q4
2007
Q3
2007
Q2
2007
Q1
2006
Q4
2006
Q3
2006
Q2
2006
Q1
2005
Q4
2005
Q3
2005
Q2
2005
Q1
2004
Q4
2004
Q3
2004
Q2
2004
Q1
Germany GDP Growth Italy GDP GrowthFrance GDP GrowthEurozone GDP Growth

9© IAB Europe
Section 1 - AdEx Benchmark 2012 Analysis
2012: economic & advertising growth (%)
-10
-5
0
5
10
15
20
25
30
Total EuropeCEEWE
%
0.2%
-5.2%
-1.8%
2.9%
7.2%
26.6%
9.1%
0.4%
-4.0%
11.5%
-0.4%
2.0%
Real GDPReal GDP All media advertisingexcl. online
Online advertising All media advertising
2012 GrOwTh IN CONTExT
Online advertising has been more resilient against macroeconomic turmoil than other media. This is due to a number of factors:
• Performance-based models of online advertising. Search advertising in particular has a clearly measureable return-on-
investment in form of the cost-per-click metric on which it is priced. Search spend usually comes from direct marketing budgets,
which focus on sales-driven advertising. This type of advertising is used especially when consumer budgets are tight. Search
prices, measured in cost-per-click, have been falling in 2012. However, this could be compensated by a growth in volume of search
advertising. This volume growth in 2012 mainly came from small and medium-sized business upping their search investments.
The rise of real-time-bidding trading mechanisms also improves the return-on-investment for performance-based online display
campaigns.
• The move of brand advertising spend online. Video advertising and premium display (e.g. large-scale banners) in particular are
increasingly attracting brand advertisers to online. Video advertising resembles TV advertising in terms of creative format, campaign
objectives and measurement metrics. European video advertising spend grew by 50.7 per cent in 2012 and is now 12.9 per cent of
all online display advertising spend.
• The use of data-driven targeting and automation. The increased use of demographic, behavioural and other types of consumer
data in online display advertising, paired with algorithmic processing, allows for more accurate and cost-efficient targeting.
IAB Europe AdEx Benchmark 2012
Section 1 - AdEx Benchmark 2012 Analysis
10
26 mArKETS IN pErSpECTIvE
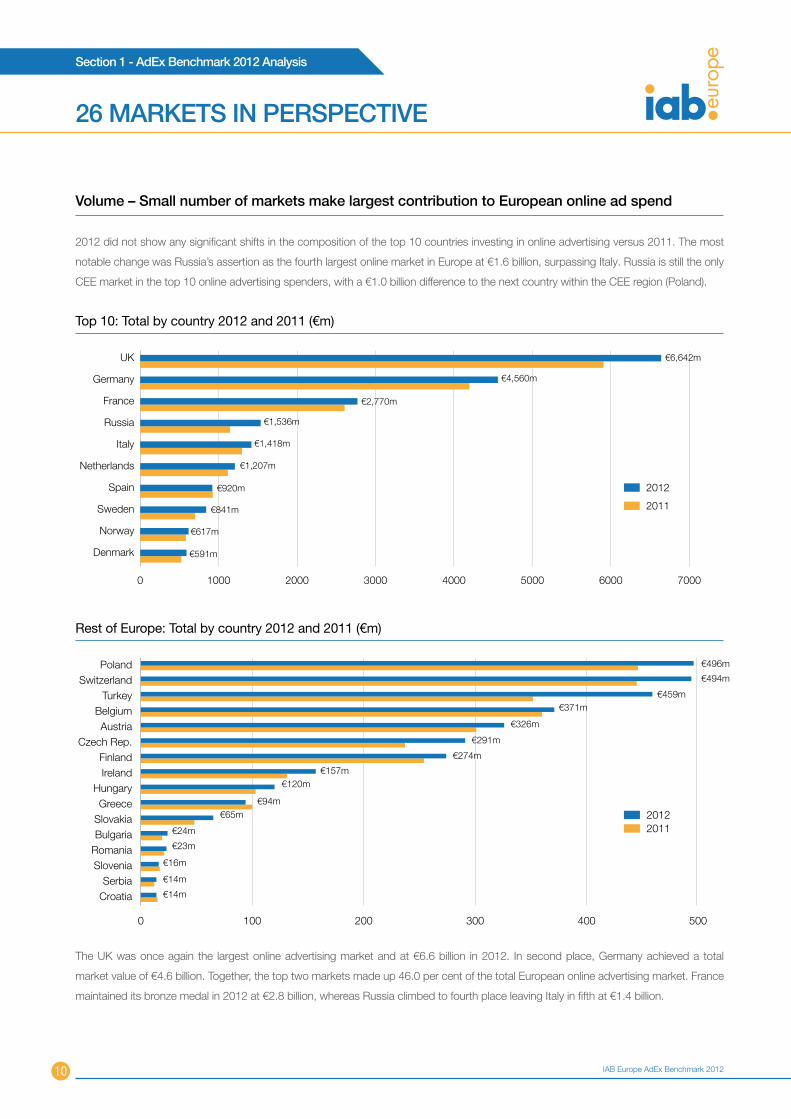
volume – Small number of markets make largest contribution to European online ad spend
2012 did not show any significant shifts in the composition of the top 10 countries investing in online advertising versus 2011. The most
notable change was Russia’s assertion as the fourth largest online market in Europe at €1.6 billion, surpassing Italy. Russia is still the only
CEE market in the top 10 online advertising spenders, with a €1.0 billion difference to the next country within the CEE region (Poland).
The UK was once again the largest online advertising market and at €6.6 billion in 2012. In second place, Germany achieved a total
market value of €4.6 billion. Together, the top two markets made up 46.0 per cent of the total European online advertising market. France
maintained its bronze medal in 2012 at €2.8 billion, whereas Russia climbed to fourth place leaving Italy in fifth at €1.4 billion.
Top 10: Total by country 2012 and 2011 (€m)
0 1000 2000 3000 4000 5000 6000 7000
Denmark
Norway
Sweden
Spain
Netherlands
Italy
Russia
France
Germany
UK
2012
2011
€6,642m
€4,560m
€2,770m
€1,418m
€1,536m
€1,207m
€920m
€841m
€617m
€591m
Rest of Europe: Total by country 2012 and 2011 (€m)
0 100 200 300 400 500
CroatiaSerbia
SloveniaRomaniaBulgariaSlovakiaGreece
HungaryIrelandFinland
Czech Rep.Austria
BelgiumTurkey
SwitzerlandPoland
20112012
€496m
€494m
€459m€371m
€326m
€291m
€274m
€157m€120m
€94m€65m
€24m
€23m
€16m
€14m
€14m

11© IAB Europe
Section 1 - AdEx Benchmark 2012 Analysis
26 mArKETS IN pErSpECTIvE
Share of European online ad revenue by market
0
20
40
60
80
100
Top 15Top 10Top 7Top 5Top 2
Source: IAB Europe/IHS Screen Digest
46.0%
69.5%
78.3%
86.7%
95.5%
The remaining countries of the European top 10 maintained their position in the ranking, with Italy followed by the Netherlands, Spain,
Sweden, Norway and Denmark. Similarly to 2011, it is still a small number of markets making the largest contribution. The top five markets
accounted for 69.5 per cent of all online ad revenue in Europe and the top 10 are responsible for 86.7 per cent of all online advertising in
Europe.

IAB Europe AdEx Benchmark 2012
Section 1 - AdEx Benchmark 2012 Analysis
12
26 mArKETS IN pErSpECTIvE
Growth: double-digit increase in emerging economies and mature online ad markets show the sustainability of the online medium
In 2012, CEE markets led growth with seven countries outpacing the European average of 11.5 per cent. Czech Republic and Bulgaria
experienced strong growth over 20 per cent and the online ad markets of Turkey, Slovakia and Russia rose above 30 per cent. This was
due to the fast expanding Search business in the CEE region, which grew 38.7 per cent year-on-year, but also to a strongly evolving Display
business, which saw a strong increase of 16.7 per cent from 2011 to 2012. As more households become connected in the region, the
addressable audience continues to increase, providing opportunity for further investment in the online medium by advertisers.
Year-on-year growth in 2012 (%)
-10
-5
0
5
10
15
20
25
30
35
40
36.3
%
34.0
%
30.4
%
23.2
%
22.8
%
20.0
%
16.9
%
16.5
%
13.3
%
12.5
%
12.3
%
11.5
%
11.1
%
11.1
%
9.2%
8.6%
-6.2
%
-4.6
%
-4.4
%
-0.6
%3.0%
5.8%6.3%8.
1%
8.1%8.5%9.
2%
Greece
Croati
a
Sloven
ia
Spain
Belgium
Norway
Fran
ce
Netherl
ands
Finlan
d
Austria
German
y
Roman
iaIta
ly
Poland
Switzerl
and
Total
Euro
pe
Irelan
d
DenmarkUK
Hunga
ry
Serbia
Sweden
Czech
Rep
ublic
Bulgari
a
Turke
y
Russia
Slovak
ia
In addition to the CEE markets, strong growth also came from the most mature markets in Europe. The UK, Sweden and Denmark
increased above the European average in 2012 experiencing a double-digit increase, despite being in the top five most mature markets
in Europe (as measured by online ad spend per capita). The relationship between ad growth and ad spend per capita is illustrated in the
bubble chart with emerging markets on the left of the graph and mature markets on the right. The size of the bubbles corresponds to the
size of the online ad market. Strong growth is observed on both sides of the growth demonstrating the sustainability and the continued
advertiser confidence in online as an advertising medium.

13© IAB Europe
Section 1 - AdEx Benchmark 2012 Analysis
26 mArKETS IN pErSpECTIvE
Benchmark: growth and maturity of online ad markets in Europe
UK
Turkey
Switzerland
Sweden
Slovenia
Serbia
Russia
Romania
Poland
Norway
Netherlands
Italy
Ireland
Hungary
Greece
Germany
France
Finland
Denmark
Czech Republic
Bulgaria
Austria
Spain
Croatia
20 40 60 80 100 120
-10
-5
0
5
10
15
20
25
30
35
40
Online ad spend per capita (€)
Onl
ine
ad g
row
th (%
)
Belgium

IAB Europe AdEx Benchmark 2012
Section 1 - AdEx Benchmark 2012 Analysis
14
Europe: online market share of total media ad spend
0
5
10
15
20
25
30
201220092006
%
Source: IAB Europe/IHS
10.3%
19.0%
25.6%
26 mArKETS IN pErSpECTIvE
Share of Total media: Online becomes second biggest media category in Europe
Pairing online advertising data provided in this report with IHS valuations for all other media (television, print, cinema, radio, and out-of-
home) reveals substantial variations in the online advertising market share across Europe.
Higher market share indicates a more developed market, where the majority of advertisers invest in online in some way, and where
advertisers have a wide variety of formats and online channels from which to choose. Low market share for online advertising suggests
that a market has headroom for growth, as it indicates that there are still plenty of advertisers in the market who have not yet devoted
themselves to the online medium.
Since the inception of the Adex Benchmark in 2006, online has more than doubled its share of all media revenue. From 10.3 per cent in
2006, online market share of total advertising spend in Europe reached 25.6 per cent in 2012.
The consistent growth of online during an adverse economic environment and a declining or flat traditional media market placed online in
second place in terms of ad spend in 2012. For the first time, online overtook newspapers at €24.3 billion trailing only behind TV.

15© IAB Europe
Section 1 - AdEx Benchmark 2012 Analysis
2012: European advertising market share by medium (€bn)
0 5 10 15 20 25 30
Cinema
Radio
OOH
Magazines
Newspapers
Online
TV
€0.6bn
€4.6bn
€8.7bn
€19.3bn
€24.3bn
€28.1bn
€6.3bn
Source: IAB Europe/IHS
Market shares calculated from IAB Europe and IHS data may vary from those published in the local markets by the national IABs. That is
because the national IABs have used a source other than IHS for the valuation of the total advertising market in that country.
26 mArKETS IN pErSpECTIvE

IAB Europe AdEx Benchmark 2011
Section 1 - AdEx Benchmark 2012 Analysis
16
Online ad spend per capita in 2012 (€)
0
20
40
60
80
100
120
Onl
ine
ad s
pend
/cap
ita (€
)
Roman
ia
Serbia
Bulgari
a
Turke
y
Croati
a
Russia
Slovak
ia
Greece
Hunga
ry
Poland
Sloven
iaSpa
inIta
ly
Czech
Rep
Irelan
d
Europe
an A
vg
Belgium
Austria
Fran
ce
Finlan
d
German
y
Switzerl
and
Netherl
ands
SwedenUK
Denmark
Norway
€117
.4
€93.
8
€93.
4
€73.
9
€66.
8
€55.
6
€51.
3
€47.
0
€41.
0
€35.
5
€33.
4
€30.
1
€28.
7
€22.
5
€21.
3
€19.
6
€11.
6
€10.
3
€8.9
€8.8
€8.1
€8.0
€4.7
€3.4
€2.6
€1.7
€1.0
Ad spend per capita: online shows linear growth trajectory
Using IHS population numbers, ad markets exhibit variation in online spend per capita across the region.
Online ad spend per capita is a metric that helps to evaluate the maturity and scope for development of a market. It shows how much an
online consumer is worth in terms of advertising in a given market. By use of population data, online ad spend per capita uses a normalised
basis and is therefore well-suited to compare and benchmark online advertising markets. It highlights the maturity of an online market
irrespective of its size or absolute revenues incurred.
The most mature online markets in Europe in 2012 continue to be the Scandinavian countries, the UK and the Netherlands. Norway led
at €117.4 per capita indicating the advanced development of the online medium as an advertising vehicle. Mature online markets typically
see single-digit growth rates year-on-year and are more susceptible to macroeconomic fluctuations. This is reflective in the 2012 online ad
markets in Norway and the Netherlands, which grew 5.8 and 8.1 per cent year-on-year, respectively.
The remaining top five most mature markets in Europe (the UK, Denmark and Sweden), in contrast to Norway and the Netherlands
experienced double-digit growth in 2012, above the European average. This demonstrates the sustainability of online advertising, which
continues to attract more spend and new advertisers.
26 mArKETS IN pErSpECTIvE
Monetisation lags behind in the CEE region, with online ad spend per capita ranging from €1.0 in Romania to €22.5 in the Czech Republic.
The average online ad spend per capita in Europe in 2012 was €30.1, below which value we find the high growth markets of Russia, Turkey
and Slovakia.

17© IAB Europe
Section 1 - AdEx Benchmark 2012 Analysis
Ad spend per capita by medium: Europe (€)
0
20
40
60
80
100
120
140
2012201120102009200820072006
Source: IHS based on IAB Europe data
40.0%
Online TV
Ad
spen
d/ca
pita
(€)
Total Media
Print and Online ad spend per capita: Europe
0
10
20
30
40
50
60
70
2012201120102009200820072006
40.0%
Online Print
Ad
spen
d/ca
pita
(€)
Source: IHS based on IAB Europe data
26 mArKETS IN pErSpECTIvE
In order to deepen understanding of the maturity of the online medium, it is important to place this metric in context of other media. Over
time in Europe, TV is resilient in its ad spend per capita, total media is volatile contingent on economic conditions and online shows a linear
growth trajectory. This points to an improved monetisation of online audiences over time.
In contrast, print advertising per capita has been consistently declining since 2006 from €57.2 to €38.9 in 2012, as online grew from just
over €10.0 in 2006 to €30.1 in 2012. Although it is erroneous to assume that online is absorbing all of print ad spend, budgets are migrating
from one medium to the other.

IAB Europe AdEx Benchmark 2012
Section 1 - AdEx Benchmark 2012 Analysis
18
ShArE OF FOrmATS
In 2012, in terms of composition of ad revenue, Search remained
the largest segment of online advertising. The performance-based
format increased its share of online advertising from 47.1 per
cent in 2011 to 48.8 per cent in 2012. Display was fairly stable,
decreasing 0.7 per cent from 33.1 per cent in 2011 to 32.4 per
cent in 2012. The small decline is due to the outperformance of
Search, which grew 15.5 per cent in 2012, compared to Display’s
8.9 per cent increase. Classifieds and Directories also decreased
its share of online ad spend at 18.5 per cent, from 19.3 per cent
in the previous year.
In Western Europe, the split is very similar to that of total Europe.
Search dominated online ad spend at 48.4 per cent, followed
by Display at 30.9 per cent and Classifieds & Directories at
20.3 per cent.
The CEE region appears to have a much stronger Search market
at 51.8 per cent of all online ad spend, with Display trailing at
42.6 per cent and Classifieds and Directories at 5.5 per cent. This
is however largely skewed by the strong Russian search market.
When excluding Russia, Search makes up only 37.7 per cent of
total online ad spend in CEE, with Display as the leading format
at 51.0 per cent.
Share of formats : Europe
Western Europe: Share of formats 2012
0102030405060708090
100
20122011Other
%
Classifieds & DirectoriesSearchDisplay
19.3%
33.1%
47.1%
18.5%
32.4%
48.8%
0.5% 0.3%
Display
SearchClassifieds & DirectoriesOther
Western Europe: share of formats in 2012 CEE: share of formats in 2012 CEE excl Russia: share of formats in 2012
42.6%
5.5%
51.8% 51.0%
11.1%
37.7%
30.9%
20.3%
48.4%
Display
SearchClassifieds & DirectoriesOther
Display
SearchClassifieds & DirectoriesOther
CEE excl. Russia: Share of formats 2012
CEE: Share of formats 2012
Display
SearchClassifieds & DirectoriesOther
Western Europe: share of formats in 2012 CEE: share of formats in 2012 CEE excl Russia: share of formats in 2012
42.6%
5.5%
51.8% 51.0%
11.1%
37.7%
30.9%
20.3%
48.4%
Display
SearchClassifieds & DirectoriesOther
Display
SearchClassifieds & DirectoriesOther
Display
SearchClassifieds & DirectoriesOther
Western Europe: share of formats in 2012 CEE: share of formats in 2012 CEE excl Russia: share of formats in 2012
42.6%
5.5%
51.8% 51.0%
11.1%
37.7%
30.9%
20.3%
48.4%
Display
SearchClassifieds & DirectoriesOther
Display
SearchClassifieds & DirectoriesOther
19© IAB Europe
Section 2 - AdEx Benchmark 2012 Analysis
dISplAy
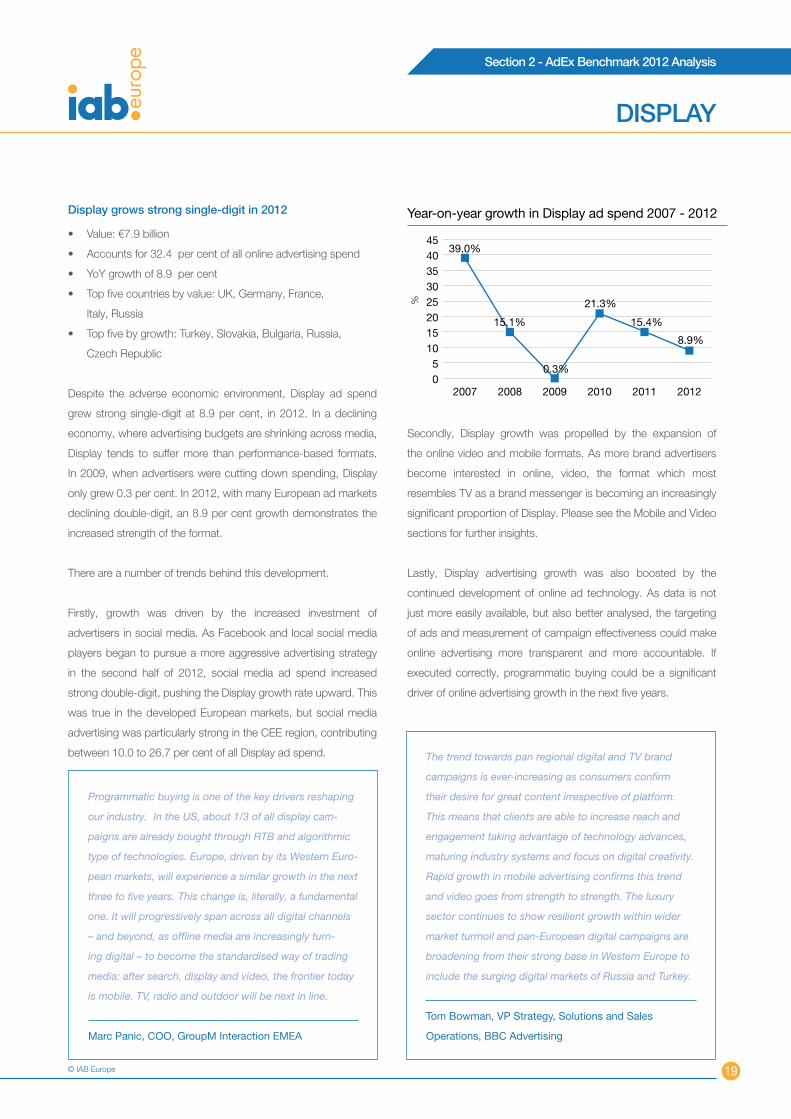
display grows strong single-digit in 2012
• Value:€7.9billion
• Accountsfor32.4percentofallonlineadvertisingspend
• YoYgrowthof8.9percent
• Topfivecountriesbyvalue:UK,Germany,France,
Italy, Russia
• Topfivebygrowth:Turkey,Slovakia,Bulgaria,Russia,
Czech Republic
Despite the adverse economic environment, Display ad spend
grew strong single-digit at 8.9 per cent, in 2012. In a declining
economy, where advertising budgets are shrinking across media,
Display tends to suffer more than performance-based formats.
In 2009, when advertisers were cutting down spending, Display
only grew 0.3 per cent. In 2012, with many European ad markets
declining double-digit, an 8.9 per cent growth demonstrates the
increased strength of the format.
There are a number of trends behind this development.
Firstly, growth was driven by the increased investment of
advertisers in social media. As Facebook and local social media
players began to pursue a more aggressive advertising strategy
in the second half of 2012, social media ad spend increased
strong double-digit, pushing the Display growth rate upward. This
was true in the developed European markets, but social media
advertising was particularly strong in the CEE region, contributing
between 10.0 to 26.7 per cent of all Display ad spend.
Year-on-year growth in Display ad spend 2007 - 2012
05
1015202530354045
201220112010200920082007
%
39.0%
15.1%
0.3%
21.3%
15.4%
8.9%
Secondly, Display growth was propelled by the expansion of
the online video and mobile formats. As more brand advertisers
become interested in online, video, the format which most
resembles TV as a brand messenger is becoming an increasingly
significant proportion of Display. Please see the Mobile and Video
sections for further insights.
Lastly, Display advertising growth was also boosted by the
continued development of online ad technology. As data is not
just more easily available, but also better analysed, the targeting
of ads and measurement of campaign effectiveness could make
online advertising more transparent and more accountable. If
executed correctly, programmatic buying could be a significant
driver of online advertising growth in the next five years.
The trend towards pan regional digital and TV brand
campaigns is ever-increasing as consumers confirm
their desire for great content irrespective of platform.
This means that clients are able to increase reach and
engagement taking advantage of technology advances,
maturing industry systems and focus on digital creativity.
Rapid growth in mobile advertising confirms this trend
and video goes from strength to strength. The luxury
sector continues to show resilient growth within wider
market turmoil and pan-European digital campaigns are
broadening from their strong base in Western Europe to
include the surging digital markets of Russia and Turkey.
Tom Bowman, VP Strategy, Solutions and Sales
Operations, BBC Advertising
Programmatic buying is one of the key drivers reshaping
our industry. In the US, about 1/3 of all display cam-
paigns are already bought through RTB and algorithmic
type of technologies. Europe, driven by its Western Euro-
pean markets, will experience a similar growth in the next
three to five years. This change is, literally, a fundamental
one. It will progressively span across all digital channels
– and beyond, as offline media are increasingly turn-
ing digital – to become the standardised way of trading
media: after search, display and video, the frontier today
is mobile. TV, radio and outdoor will be next in line.
Marc Panic, COO, GroupM Interaction EMEA

IAB Europe AdEx Benchmark 2012
Section 2 - Online advertising overview by sector
20
dISplAy
Rest of Europe: Display value by country 2012 and 2011 (€m)
0 50 100 150 200 250
Croatia
Serbia
Slovenia
Bulgaria
Romania
Slovakia
Greece
Ireland
Hungary
Switzerland
Belgium
Finland
Austria
Czech Rep.
Denmark
Norway
20112012
€208m
€203m
€168m
€124m
€107m
€113m
€84m
€60m
€59m
€34m
€31m
€22m
€19m
€10m
€8m
€7m
Top 10: Display value by country 2012 and 2011 (€m)
0 500 1000 1500 2000
Turkey
Poland
Sweden
Spain
Netherlands
Russia
Italy
France
Germany
UK
20112012
€1,514m
€1,608m
€847m
€639m
€526m
€370m
€387m
€281m
€229m
€224m

© IAB Europe
Section 2 - Online advertising overview by sector
21
Rest of Europe: 2012 Year-on-year Display growth by country
Top 10: 2012 Year-on-year Display growth by country
0 5 10 15 20 25 30 35
Sweden
Italy
Serbia
Hungary
UK
Czech Rep.
Russia
Bulgaria
Turkey
Slovakia
%
-15 -12 -9 -6 -3 0 3 6 9 12
Slovenia
Croatia
Spain
Switzerland
Greece
Netherlands
Norway
Belgium
Ireland
France
Austria
Germany
Denmark
Poland
Finland
Romania
%
dISplAy

IAB Europe AdEx Benchmark 2012
Section 2 - Online advertising overview by sector
22
ClASSIFIEdS & dIrECTOrIES
Classifieds & directories 1 sees an acceleration to its growth rate in 2012
• Value:€4.5billion
• Accountsfor18.5percentofallonlineadvertisingspend
• YoYgrowthof6.3percent
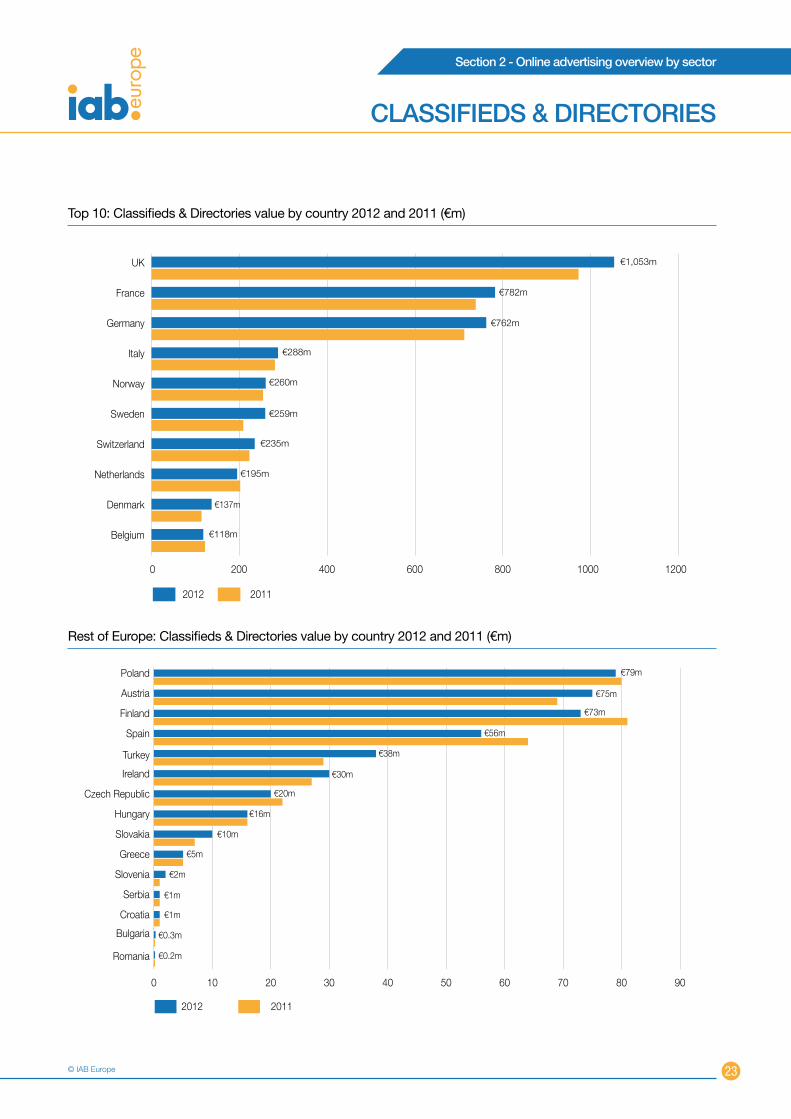
• Topfivecountriesbyvalue:UK,France,Germany,Italy,Norway
• Topfivebygrowth:Turkey,Slovenia,Slovakia,Sweden,Denmark
Classifieds and Directories grew 6.3 per cent in 2012. The format was the only one which saw an acceleration in its growth rate year-on-
year. In adverse economic conditions, this was unusual, as Classifieds and Directories are highly dependent on the state of the job, real-
estate and automotive markets and hence more at risk during economic downturns.
There were three forces acting on Classifieds and Directories in 2012 showing great discrepancy in growth rates across Europe.
Firstly, there has been an emergence of regional players who have invested and acquired into the Classifieds market across Europe.
Companies which traditionally operated in one or two countries are now becoming European ventures and operating transnationally.
Secondly and in conjunction with the first point, there is a continued shift of print ad spend to the online medium. As publishers move online
more systematically they are expanding their Classifieds and Directories ad business online.
Lastly, and counter to the previous two points, the weakening of the economy has had a negative effect on Classifieds and Directories as
there were fewer jobs, houses and cars to advertise. As a result, in seven markets Classifieds and Directories declined, with Spain and
Finland decreasing double-digit.
1. Classifieds & Directories ad spend is available for 25 countries. Russia has not been included in this category on instructions by IAB Russia.
© IAB Europe
Section 2 - Online advertising overview by sector
23
ClASSIFIEdS & dIrECTOrIES
Top 10: Classifieds & Directories value by country 2012 and 2011 (€m)
0 200 400 600 800 1000 1200
Belgium
Denmark
Netherlands
Switzerland
Sweden
Norway
Italy
Germany
France
UK €1,053m
€782m
€762m
€288m
€260m
€235m
€259m
€195m
€118m
€137m
20112012
Rest of Europe: Classifieds & Directories value by country 2012 and 2011 (€m)
0 10 20 30 40 50 60 70 80 90
Romania
Bulgaria
Croatia
Serbia
Slovenia
Greece
Slovakia
Hungary
Czech Republic
Ireland
Turkey
Spain
Finland
Austria
Poland €79m
€75m
€73m
€56m
€38m
€30m
€20m
€16m
€10m
€5m
2012 2011
€2m
€1m
€1m
€0.3m
€0.2m

IAB Europe AdEx Benchmark 2012
Section 2 - Online advertising overview by sector
24
Top 10: 2012 year-on-year Classifieds & Directories growth by country
Rest of Europe: 2012 year-on-year Classifieds & Directories growth by country
0 5 10 15 20 25 30 35 40
Germany
UK
Austria
Ireland
Serbia
Denmark
Sweden
Slovenia
Turkey
Slovakia
%
-15 -10 -5 0 5 10
Spain
Finland
Czech Republic
Belgium
Netherlands
Poland
Hungary
Croatia
Italy
Norway
Romania
Greece
Switzerland
France
Bulgaria
%
ClASSIFIEdS & dIrECTOrIES
© IAB Europe
Section 2 - Online advertising overview by sector
25
SEArCh
Top 10 : Search value by country 2012 and 2011 (€m)
0 500 1000 1500 2000 2500 3000 3500 4000
Turkey
Denmark
Sweden
Italy
Spain
Netherlands
Russia
France
Germany
UK €3,906m
€2,284m
€1,141m
€1,010m
€625m
€494m
€490m
€302m
€248m
€197m
2012 2011
Year-on-year growth in Search ad spend 2007-2012
05
1015202530354045
201220112010200920082007
%
39.0%36.0%
16.1% 17.9%
10.8%
15.5%
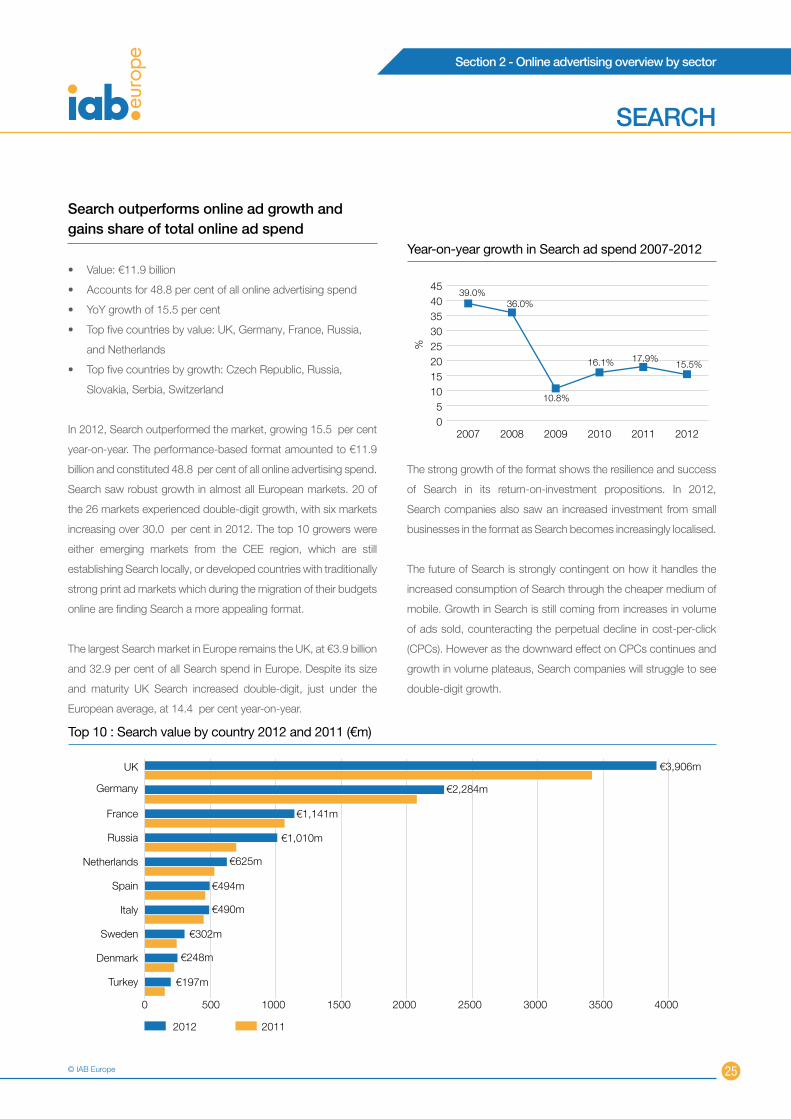
Search outperforms online ad growth and gains share of total online ad spend
• Value:€11.9billion
• Accountsfor48.8percentofallonlineadvertisingspend
• YoYgrowthof15.5percent
• Topfivecountriesbyvalue:UK,Germany,France,Russia,
and Netherlands
• Topfivecountriesbygrowth:CzechRepublic,Russia,
Slovakia, Serbia, Switzerland
In 2012, Search outperformed the market, growing 15.5 per cent
year-on-year. The performance-based format amounted to €11.9
billion and constituted 48.8 per cent of all online advertising spend.
Search saw robust growth in almost all European markets. 20 of
the 26 markets experienced double-digit growth, with six markets
increasing over 30.0 per cent in 2012. The top 10 growers were
either emerging markets from the CEE region, which are still
establishing Search locally, or developed countries with traditionally
strong print ad markets which during the migration of their budgets
online are finding Search a more appealing format.
The largest Search market in Europe remains the UK, at €3.9 billion
and 32.9 per cent of all Search spend in Europe. Despite its size
and maturity UK Search increased double-digit, just under the
European average, at 14.4 per cent year-on-year.
The strong growth of the format shows the resilience and success
of Search in its return-on-investment propositions. In 2012,
Search companies also saw an increased investment from small
businesses in the format as Search becomes increasingly localised.
The future of Search is strongly contingent on how it handles the
increased consumption of Search through the cheaper medium of
mobile. Growth in Search is still coming from increases in volume
of ads sold, counteracting the perpetual decline in cost-per-click
(CPCs). However as the downward effect on CPCs continues and
growth in volume plateaus, Search companies will struggle to see
double-digit growth.

IAB Europe AdEx Benchmark 2012
Section 2 - Online advertising overview by sector
26
Top 10: 2012 Year-on-year search growth by country
0 10 20 30 40 50 60
Finland
Sweden
Bulgaria
Hungary
Turkey
Switzerland
Serbia
Slovakia
Russia
Czech Rep.
%
Rest of Europe: Search value by country 2012 and 2011 (€m)
0 50 100 150 200
Romania
Serbia
Slovenia
Bulgaria
Croatia
Slovakia
Hungary
Greece
Ireland
Finland
Czech Rep.
Austria
Belgium
Norway
Switzerland
Poland €188m
€148m
€147m
€127m
€103m
€89m
€68m
€55m
€44m
€24m
2012 2011
€6m
€5m
€4m
€2m
€1m
€175m
SEArCh

© IAB Europe
Section 2 - Online advertising overview by sector
27
-30 -20 -10 0 10 20 30
Romania
Greece
Croatia
France
Spain
Italy
Germany
Belgium
Austria
Denmark
Slovenia
UK
Netherlands
Ireland
Poland
Norway
%
Rest of Europe: 2012 Year-on-year search growth by country
Online advertising continues to grow faster than any other advertising channel in Russia. More and more brands which had been
focused on TV start to pay more attention to the internet in order to reach and interact with their target audience. This trend
will continue, fuelled by the growth of the internet population - Russian having the largest now in Europe. Furthermore, Yandex
and other publishers are developing new targeting features to help advertisers reach very precise audiences, which could move
incremental AD budgets online.
Bernard Lukey, General Director, Yandex
SEArCh

IAB Europe AdEx Benchmark 2012
Section 2 - Online advertising overview by sector
28
mOBIlE
mobile ad spend still lags behind consumption
In 2012, the IAB Europe AdEx Benchmark received mobile advertising spend from 21 markets up from 14 in 2011. This indicates the
increasing prominence of the medium and its establishment as a legitimate medium for advertising. Mobile display advertising ranged in
volume across Europe from €0.1 million in Romania to €184.9 million in the UK, with mature markets investing more in mobile display than
the CEE region (with the exception of Russia).
0
25
50
75
100
125
150
175
200
€m
€184
.9m
€47.
8m
€43.
0m
€24.
0m
€20.
6m
€15.
0m
€13.
3m
€11.
9m
€8.7
m
€5.8
m
€5.6
m
€4.2
m
€3.3
m
€1.9
m
€1.5
m
€0.4
m
€0.3
m
€0.2
m
€0.2
m
€0.1
m
€0.1
m
UK
German
y
Fran
ceSpa
in
Russia Ita
ly
Sweden
Netherl
ands
Irelan
d
Denmark
Turke
y
Austria
Poland
Hunga
ry
Czech
Rep
ublic
Sloven
ia
Slovak
ia
Bulgari
a
Serbia
Croati
a
Roman
ia
Mobile display ad spend in 2012 (€m)
Mobile display as a share of online display in 2012
0
2
4
6
8
10
12
14
2011 2012
11.5
%
6.5%
5.1%
5.0%
4.7%
4.2%
3.9%
3.4%
3.2%
3.1%
3.1%
2.8%
2.5%
2.3%
1.9%
1.8%
1.4%
1.1%
0.9%
Czech
Rep
ublic
Bulgari
a
Poland
Croati
a
Serbia
Italy
Turke
y
Denmark
Netherl
ands
Hunga
ry
German
y
Austria
Russia
Sloven
ia
Sweden
Europe
Fran
ceSpa
inUK
A small number of markets also supplied data for mobile search advertising from both Western Europe and the CEE. In Western Europe,
mobile search was led by the UK at €450.0 million, followed by Germany at €109.6 million. In the CEE, Hungary reported a mobile search
figure of €1.2 million, followed by the Czech Republic at €0.4 million.

© IAB Europe
Section 2 - Online advertising overview by sector
29
Proliferation of devices and technology advances have
continued to grow digital audiences across Europe.
These increasingly sophisticated and empowered con-
sumers are constantly demanding content and services
which allow the digital industry to offer opportunities
for advertisers to reach and engage them in a variety of
innovative ways and with increased efficiency. At the
same time we see multi-screening confirm the need for
advertisers to increase the synergy between their offline
and digital campaigns. These factors are helping to drive
growth in digital spend.
Stephanie Hospital, Executive Vice President,
Orange Digital
Smartphone penetration Western Europe
2017
2016
2015
2014
2013
2012
2011
2010
2009
2008
2007
2006
2005
0
10
20
30
40
50
60
70
80
90
2017
2016
2015
2014
2013
2012
2011
2010
2009
2008
2007
2006
%
2005
Source: IHS
Mobile display advertising grew strongly in 2012 (with eight markets growing triple-digit), however it remains a small proportion of online
Display. In 2012, mobile made up 5.0 per cent of Display ad spend. With the exception of the UK, whose mobile share of Display is over
10.0 per cent, all European markets are still very small.
mOBIlE
0
100
200
300
400
500
600
700
580%
200%
150%
142%
135%
132%
114%
107%
83%
80%
61%
51%
33%
29%
25%
4% 1% -22%
Czech
Rep
.
Bulgari
a
Poland
Croati
a
Serbia
Italy
Turke
y
Denmark
Netherl
ands
Hunga
ry
German
y
Austria
Russia
Sloven
ia
Sweden
Fran
ceSpa
inUK
As smartphone penetration continues to rise and with it the addressable market for mobile advertising, investment will fol-
low. According to IHS, from 32.0 per cent in 2012, smartphone penetration is expected to grow to 77.0 per cent in Europe
by 2016.
Mobile display ad spend: 2012 year-on-year growth (%)

IAB Europe AdEx Benchmark 2012
Section 2 - Online advertising overview by sector
30
video accounts for 13 per cent of online display
AdEx Benchmark 2012 includes online video advertising figures for 19 markets. In 2012, we have standardised definitions across all
countries to include only in-stream advertising (pre-rolls, mid-rolls and post-rolls) as agreed by the IAB AdEx Benchmark Video Working
Committee. Where such a distinction was not provided in a local market, IHS modelled the figure based on local market knowledge and
regional averages.
On average, video represented 12.9 per cent of the total online Display market value in Europe in 2012, up from 9.7 per cent in 2011. In
many markets across the continent, broadcasters and publishers have expanded their online presence, offering more premium inventory
online. This has attracted traditional TV advertisers to the online medium and provides a good entry point for brand investment online.
vIdEO
Video as a share of online display in 2012
0
5
10
15
20
25
30
35
Bulgar
ia
Hunga
ry
Roman
ia
Slovak
ia
Denm
ark
Czech
Rep
.
Austri
a
Germ
any
Nethe
rland
s
Irelan
d
Turk
ey
Sweden
Russia
Finlan
dUK
Poland
Europ
e
Spain
Italy
Sloven
ia
31.6
%
20.0
%
17.3
%
12.9
%
11.6
%
10.5
%
9.1%
8.9%
8.9%
8.8%
8.8%
8.2%
7.3%
6.8%
3.2%
2.8%
2.4%
2.2%
1.6%
1.4%
%
Online video advertising grew 50.7 per cent in Europe in 2012. Seven markets grew triple-digit from 2011 and ten countries above the
European average. However, growth rates vary across markets. For instance, Spain saw an increase 204.0 per cent year-on-year largely
due to the undersupply of TV inventory. Online video was used for advertising to satisfy excess demand for TV advertising. In contrast,
the Netherlands experienced a decline of -0.6 per cent in video ad spend in 2012, due to decrease in prices of video ads, as the supply of
online video inventory increased year-on-year.
It is also important to note the difference in the volumes of online video ad spend. Most investment originates from Western Europe with
just Russia and Poland reporting double-digit online video ad spend in 2012, from the CEE region. The UK, Italy and Germany were the
only markets with online video ad spend above €100.0 million.

© IAB Europe
Section 2 - Online advertising overview by sector
31
2012 Year-on-year growth in Video by country
-50
0
50
100
150
200
250
Netherl
ands
Sloven
ia
Slovak
ia
Bulgari
a
Sweden
German
y
Finlan
d
Irelan
dUK
Europe
Czech
Rep
.
Poland
Italy
Russia
Turke
y
Roman
ia
Austria
Denmark
Hunga
ry
Spain
204.
0%
181.
1%
160.
0%
146.
8%
115.
6%
104.
5%
100.
0%
75.0
%
64.9
%
58.1
%
50.7
%
43.2
%
20.4
%
20.0
%
16.9
%
16.1
%
11.4
%
2.0%
-0.7
%
-10.
6%
%
Total Video ad spend in 2012 (€m)
0
20
40
60
80
100
120
140
160
180 €168
.5m
€128
.0m
€110
.0m
€64.
2m
€47.
0m
€31.
8m
€26.
4m
€25.
0m
€19.
8m
€10.
2m
€8.5
m
€5.6
m
€5.4
m
€5.2
m
€3.2
m
€1.0
m
€0.7
m
€0.5
m
€0.3
m
Netherl
ands
Sloven
ia
Slovak
ia
Bulgari
a
Sweden
German
yFin
land
Irelan
dUK
Czech
Rep
.
Poland
Italy
Russia
Turke
y
Roman
ia
Austria
Denmark
Hunga
ry
Spain
vIdEO
Online will obviously continue to grow, but the main drivers in the coming years will be the new digital channels. When we
exclude video or mobile we find that classical display advertising is only growing slowly and the continuing fragmentation of
media channels poses a significant challenge for the industry and how we measure their audience and effectiveness.
Arndt Groth, CEO, Publigroupe
IAB Europe AdEx Benchmark 2012
Section 2 - Online advertising overview by sector
32
Display ad spend: 2012 year-on-year growth (%)
-30
-20
-10
0
10
20
30
40
Sloven
ia
Croati
a
Spain
Netherl
ands
Austria
German
y
Denmark
Poland
Roman
ia
SwedenIta
ly
Hunga
ryUK
Czech
Rep
ublic
Russia
Bulgari
a
Turke
y
Display Display excl. Video
25.1
%
22.1
%
10.6
%
12.9
%
3.0%
10.9
%
4.1%
8.4% 9.9%
4.0% 6.
9%
5.6%
- 0.2
%
1.7%
-22.
9%
-12.
5%
-19.
4%
Display excl. Video & Mobile
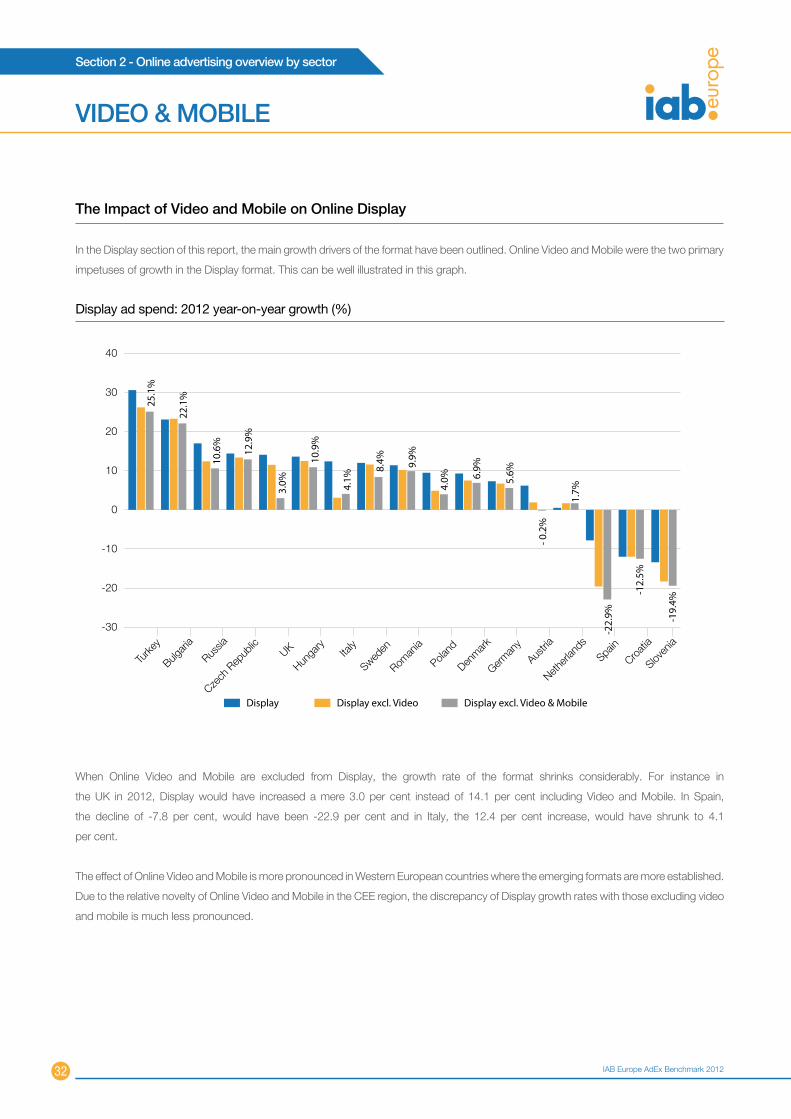
The Impact of video and mobile on Online display
In the Display section of this report, the main growth drivers of the format have been outlined. Online Video and Mobile were the two primary
impetuses of growth in the Display format. This can be well illustrated in this graph.
When Online Video and Mobile are excluded from Display, the growth rate of the format shrinks considerably. For instance in
the UK in 2012, Display would have increased a mere 3.0 per cent instead of 14.1 per cent including Video and Mobile. In Spain,
the decline of -7.8 per cent, would have been -22.9 per cent and in Italy, the 12.4 per cent increase, would have shrunk to 4.1
per cent.
The effect of Online Video and Mobile is more pronounced in Western European countries where the emerging formats are more established.
Due to the relative novelty of Online Video and Mobile in the CEE region, the discrepancy of Display growth rates with those excluding video
and mobile is much less pronounced.
vIdEO & mOBIlE

© IAB Europe
Section 3 - Overview by country
33
TOp 10
0
1000
2000
3000
4000
5000
6000
7000
Denmark
Norway
Sweden
Spain
Netherl
andsIta
ly
Russia
Fran
ce
German
yUK
OtherClassifieds & DirectoriesSearchDisplay
Spend by format and by country: Top 10 (€m)
Display 1,608 1,514 847 526 639 387 370 281 208 203
Classifieds 1,053 762 782 0 288 195 56 259 260 137
Search 3,906 2,284 1,141 1,010 490 625 494 302 148 248
Other 75 0 0 0 0 0 0 0 0 2
uK:
2012 Online Ad Spend €6,642m
2012 YoY growth 13.3%
Online ad spend per capita €93.4
Germany:
2012 Online Ad Spend €4,560m
2012 YoY growth 8.6%
Online ad spend per capita €51.3
France:
2012 Online Ad Spend €2,770m
2012 YoY growth 6.3%
Online ad spend per capita €41.0
russia:
2012 Online Ad Spend €1,536m
2012 YoY growth 34.0%
Online ad spend per capita €8.0
Italy:
2012 Online Ad Spend €1,418m
2012 YoY growth 9.2%
Online ad spend per capita €21.3
Netherlands:
2012 Online Ad Spend €1,207m
2012 YoY growth 8.1%
Online ad spend per capita €66.8

IAB Europe AdEx Benchmark 2012
Section 3 - Overview by country
34
Russia has the largest online audience in Europe, ac-
cording to some estimates up to 70 million people. Pen-
etration of 55 per cent of the audience will grow. High
and stable prices for oil and gas fuelled consumption in
Russia and stimulate the economy and the advertising
industry as a whole. Internet as a media in Russia is sec-
ond only to TV with a share of 19 per cent and is invest-
ing in infrastructure RTB, Big Data and On-line Video.
These factors explain why the Russian market for online
advertising in 2012, up more than 30 per cent and came
in fourth place in Europe and we expect continued
double-digit growth in the next 3-5 years.
Boris Omelnitskiy, President, IAB Russia
TOp 10
Spain:
2012 Online Ad Spend €920m
2012 YoY growth -0.6%
Online ad spend per capita €19.6
Sweden:
2012 Online Ad Spend €841m
2012 YoY growth 20.0%
Online ad spend per capita €73.9
Norway:
2012 Online Ad Spend €617m
2012 YoY growth 5.8%
Online ad spend per capita €117.4
denmark:
2012 Online Ad Spend €591m
2012 YoY growth 12.6%
Online ad spend per capita €93.8
In the UK, one in three Euros spent on advertising goes
online and on mobile. And it’s the mobile sector which
has experienced the most impressive year-on-year
growth - of +158 per cent - to reach one tenth of the
overall digital pie. The rise in smartphone ownership has
been exponential – ending the year at 64 per cent of
the entire population, and still growing fast. And we can
already see the tablet going mainstream in 2013. These
developments have major implications for advertisers,
agencies and publishers, as the majority of ad impres-
sions migrate to mobile devices in the short term!
The UK is, arguably, the most mature digital advertising
economy in the world, so it’s pleasing to see overall ad
spend growth two points ahead of the curve at +13.3 per
cent. The key UK market drivers in 2012 were undoubt-
edly search (+14.4 per cent), mobile (+158 per cent) and
video (+43 per cent) – with marketers increasingly turning
to online to enhance their brand campaigns. Indeed the
packaged goods sector consolidated its position as the
number one spender in display, accounting for 16 per
cent of the total. Forecasts for 2013 indicate that the UK’s
contribution to 2013 AdEx will easily surpass €7 billion.
Guy Phillipson, CEO, IAB UK

© IAB Europe
Section 3 - Overview by country
35
rEST OF EurOpE
0
100
200
300
400
500
600
Croati
a
Serbia
Sloven
ia
Roman
ia
Bulgari
a
Slovak
ia
Greece
Hunga
ry
Irelan
d
Finlan
d
Czech
Rep
ublic
Austria
Belgium
Turke
y
Switzerl
and
Poland
OtherClassifieds & DirectoriesPaid-for-searchDisplay
Spend by format and by country: Rest of Europe (€m)
Display 229 84 224 107 124 168 113 59 60 34 31 19 22 10 8 7
Classifieds 79 235 38 118 75 20 73 30 16 5 10 0 0 2 1 1
Search 188 175 197 147 127 103 89 68 44 55 24 5 1 4 2 6
Other 0 0 0 0 0 0 0 0 0 0 0 1 0 0 3 0
poland:
2012 Online Ad Spend €496m
2012 YoY growth 11.1%
Online ad spend per capita €11.6
Switzerland:
2012 Online Ad Spend €494m
2012 YoY growth 11.1%
Online ad spend per capita €55.6
Turkey:
2012 Online Ad Spend €459m
2012 YoY growth 30.4%
Online ad spend per capita €4.7
Belgium:
2012 Online Ad Spend €371m
2012 YoY growth 3.0%
Online ad spend per capita €33.4
Austria:
2012 Online Ad Spend €326m
2012 YoY growth 8.5%
Online ad spend per capita €35.5
Czech republic:
2012 Online Ad Spend €291m
2012 YoY growth 22.8%
Online ad spend per capita €22.5
Finland:
2012 Online Ad Spend €274m
2012 YoY growth 8.1%
Online ad spend per capita €47.0
Ireland:
2012 Online Ad Spend €157m
2012 YoY growth 12.3%
Online ad spend per capita €28.7

IAB Europe AdEx Benchmark 2012
Section 3 - Overview by country
36
In 2012 the composition of the top 10 digital advertising
spenders was very similar to the previous year. UK, Ger-
many and France retained their top three positions and
achieved again around two thirds of total top-10 value,
reaching €14 billion (~57 per cent of the European online
ad market). Russia overtook Italy and Netherlands, and
rose to the fourth spot as a result of the successive high
double-digit growth index. The order of other countries
completing top 10 remained the same, however growth
trends observed in 2012 may have a crucial impact on
potential shifts between bottom 4 of the top 10 spenders
in 2013.
Pawel Kolenda, Market Research Manager, IAB Poland
Digital media ad spend in Turkey has a growth rate of
30 per cent over the previous year. DigitalMedia has be-
come the third media in terms of advertising investment.
In media consumption digital media comes second when
ranked by reach and time spent. Digital media invest-
ments will soon catch up with print media and overtake
to assume second place behind TV.
There is a prominent growth in digital video and mobile
advertising matching the increasing time spent on those
platforms.
Neslihan Mesutoglu, General Manager, Turkuvaz Reklam
Pazarlama Danişmanlik/Dijital&Radio Reklam Satış / IAB
Turkey Board Member
rEST OF EurOpE
hungary:
2012 Online Ad Spend €120m
2012 YoY growth 16.5%
Online ad spend per capita €10.3
Greece:
2012 Online Ad Spend €94m
2012 YoY growth -6.2%
Online ad spend per capita €8.8
Slovakia:
2012 Online Ad Spend €65m
2012 YoY growth 36.3%
Online ad spend per capita €8.9
Bulgaria:
2012 Online Ad Spend €24m
2012 YoY growth 23.2%
Online ad spend per capita €2.6
romania:
2012 Online Ad Spend €23m
2012 YoY growth 9.2%
Online ad spend per capita €1.0
Slovenia:
2012 Online Ad Spend €16m
2012 YoY growth -4.4%
Online ad spend per capita €8.1
Serbia:
2012 Online Ad Spend €14m
2012 YoY growth 16.9%
Online ad spend per capita €1.7
Croatia:
2012 Online Ad Spend €14m
2012 YoY growth -4.6%
Online ad spend per capita €3.4

© IAB Europe
Section 4 - Background Data
37
TOp prOpErTIES dECEmBEr 2012
Austria
Top 20 Sites in Austria
Source: comScore mmx, december 2012
Total unique
visitors (000)% reach
Total Internet Audience: Age 15+ 5,027 100.0
1 Google Sites 4,763 94.7
2 Facebook.com 3,344 66.5
3 Microsoft Sites 2,612 52.0
4 Amazon Sites 2,437 48.5
5 Wikimedia Foundation Sites 2,193 43.6
6 Styria Media Group 1,635 32.5
7 Glam Media 1,602 31.9
8 eBay 1,575 31.3
9 Yahoo! Sites 1,560 31.0
10 Axel Springer AG 1,514 30.1
11 United-Internet Sites 1,485 29.5
12 Hubert Burda Media 1,342 26.7
13 ORF.at Network 1,260 25.1
14 VEVO 1,258 25.0
15 Ask Network 1,235 24.6
16 Apple Inc. 1,141 22.7
17 gutefrage.net GmbH 1,005 20.0
18 ProSiebenSat1 Sites 969 19.3
19 Deutsche Telekom 949 18.9
20 Herold Sites 947 18.8
Belgium
Top 20 Sites in Belgium
Source: comScore mmx, december 2012
Total unique
visitors (000)% reach
Total Internet Audience: Age 15+ 6,371 100.0 1 Google Sites 6,102 95.82 Microsoft Sites 5,432 85.33 Facebook.com 5,176 81.24 Wikimedia Foundation Sites 2,667 41.95 Corelio Publishing 2,451 38.56 Yahoo! Sites 2,341 36.77 VEVO 2,277 35.78 Belgacom Group 2,029 31.99 Apple Inc. 1,720 27.010 VRT Sites 1,646 25.811 Ask Network 1,538 24.112 Viacom Digital 1,506 23.613 De Persgroep 1,497 23.514 Amazon Sites 1,461 22.915 Groupe Rossel 1,393 21.916 eBay 1,380 21.717 Sanoma Group 1,373 21.618 Truvo International 1,333 20.919 2dehands 1,298 20.420 Telenet Sites 1,252 19.6
denmark
Top 20 Sites in denmark
Source: comScore mmx, december 2012
Total unique
visitors (000)% reach
Total Internet Audience: Age 15+ 3,772 100.0 1 Google Sites 3,533 93.72 Microsoft Sites 2,896 76.83 Facebook.com 2,733 72.54 JP Politiken Hus 1,362 36.15 Wikimedia Foundation Sites 1,292 34.26 DR.DK 1,229 32.67 Yahoo! Sites 1,160 30.78 TV2 Danmark 1,137 30.29 eBay 1,125 29.810 Apple Inc. 1,097 29.111 VEVO 1,076 28.512 Eniro Group 1,048 27.813 Amazon Sites 943 25.014 Berlingske Media 929 24.615 Spotify 842 22.316 Ask Network 768 20.417 Linkedin 754 20.018 Valve Corporation 751 19.919 Glam Media 739 19.620 Viacom Digital 714 18.9
Finland
Top 20 Sites in Finland
Source: comScore mmx, december 2012
Total unique
visitors (000)% reach
Total Internet Audience: Age 15+ 3,476 100.0
1 Google Sites 3,336 96.02 Sanoma Group 3,332 95.93 Microsoft Sites 2,839 81.74 Facebook.com 2,794 80.45 Alma Media 2,680 77.16 Yleisradio Oy 2,597 74.77 Otavamedia 2,548 73.38 MTV3 Internet 2,436 70.19 Wikimedia Foundation Sites 1,853 53.310 Aller Media 1,397 40.211 VEVO 1,234 35.512 Viacom Digital 1,173 33.713 Foreca 1,164 33.514 Glam Media 1,100 31.615 Yahoo! Sites 1,072 30.816 Kesko Sites 1,043 30.017 Rohea 999 28.718 Elisa Oyj 938 27.019 OP-Pohjola 921 26.520 Amazon Sites 920 26.5
Source: comScore

IAB Europe AdEx Benchmark 2012
Section 4 - Background Data
38
TOp prOpErTIES dECEmBEr 2012
France
Top 20 Sites in France
Source: comScore mmx, december 2012
Total unique
visitors (000)% reach
Total Internet Audience: Age 15+ 48,017 100.0
1 Google Sites 44,654 93.02 Microsoft Sites 37,048 77.23 Facebook.com 34,258 71.34 Orange Sites 22,062 45.95 Yahoo! Sites 21,289 44.36 CCM-Benchmark 20,876 43.57 Wikimedia Foundation Sites 20,765 43.28 Iliad - Free.fr Sites 18,567 38.79 Axel Springer AG 18,194 37.910 Amazon Sites 18,123 37.711 Kering 17,648 36.812 Solocal Group 17,423 36.313 Schibsted (Anuntis-Infojobs-20minutos) 17,400 36.214 Groupe Lagardere 16,868 35.115 Vivendi 16,062 33.516 Ebuzzing 15,187 31.617 DAILYMOTION.COM 13,836 28.818 Apple Inc. 13,662 28.519 Groupe M6 13,419 27.920 Groupe Casino 12,731 26.5
Germany
Top 20 Sites in Germany
Source: comScore mmx, december 2012
Total unique
visitors (000)% reach
Total Internet Audience: Age 15+ 57,389 100.0
1 Google Sites 53,610 93.42 Facebook.com 38,569 67.23 Amazon Sites 35,215 61.44 eBay 33,659 58.75 Microsoft Sites 32,374 56.46 Deutsche Telekom 29,252 51.07 Axel Springer AG 27,357 47.78 United-Internet Sites 26,974 47.09 Wikimedia Foundation Sites 26,436 46.110 Hubert Burda Media 23,800 41.511 ProSiebenSat1 Sites 21,021 36.612 Yahoo! Sites 19,912 34.713 gutefrage.net GmbH 19,481 33.914 RTL Group Sites 16,248 28.315 Glam Media 16,242 28.316 Otto Gruppe 15,352 26.817 Apple Inc. 13,911 24.218 Ask Network 11,181 19.519 Sparkassen-Finanzgruppe 10,440 18.220 METRO Group 10,318 18.0
Ireland
Top 20 Sites in Ireland
Source: comScore mmx, december 2012
Total unique
visitors (000)% reach
Total Internet Audience: Age 15+ 2,598 100.0 1 Google Sites 2,414 92.92 Yahoo! Sites 1,942 74.73 Facebook.com 1,876 72.24 Microsoft Sites 1,785 68.75 Distilled Media 1,346 51.86 Glam Media 1,277 49.27 RTE.IE 1,246 48.08 Ask Network 1,232 47.49 Amazon Sites 1,077 41.510 Wikimedia Foundation Sites 969 37.311 Independent News & Media 919 35.412 BBC Sites 878 33.813 AOL, Inc. 832 32.014 Apple Inc. 816 31.415 Irish Times Group 794 30.616 DoneDeal 785 30.217 VEVO 777 29.918 Viacom Digital 754 29.019 CBS Interactive 704 27.120 eBay 656 25.3
Italy
Top 20 Sites in Italy
Source: comScore mmx, december 2012
Total unique
visitors (000)% reach
Total Internet Audience: Age 15+ 28,722 100.0 1 Google Sites 26,902 93.72 Facebook.com 22,398 78.03 Microsoft Sites 17,827 62.14 Yahoo! Sites 17,277 60.25 ItaliaOnline 15,107 52.66 Telecom Italia 13,254 46.17 Wikimedia Foundation Sites 11,216 39.08 eBay 9,635 33.59 Banzai 8,636 30.110 Ask Network 8,455 29.411 Populis 8,328 29.012 ForumCommunity 7,662 26.713 VEVO 7,644 26.614 RCS Media Group 7,613 26.515 ALTERVISTA.ORG 7,425 25.916 Amazon Sites 6,322 22.017 Apple Inc. 6,001 20.918 Gruppo Mediaset 5,871 20.419 Gruppo Editoriale Espresso 5,624 19.620 Axel Springer AG 5,467 19.0
Source: comScore

© IAB Europe
Section 4 - Background Data
39
TOp prOpErTIES dECEmBEr 2012
Netherlands
Top 20 Sites in Netherlands
Source: comScore mmx, december 2012
Total unique
visitors (000)% reach
Total Internet Audience: Age 15+ 12,006 100.0
1 Google Sites 11,610 96.72 Microsoft Sites 10,671 88.93 Facebook.com 9,018 75.14 Sanoma Group 7,853 65.45 Telegraaf Media Groep 6,174 51.46 eBay 6,124 51.07 Wikimedia Foundation Sites 5,876 48.98 Publieke Omroep 5,403 45.09 RTL Group Sites 4,942 41.210 Ahold Sites 4,898 40.811 ING Group 4,046 33.712 Rabobank Group 4,013 33.413 VEVO 3,961 33.014 Apple Inc. 3,933 32.815 Yahoo! Sites 3,912 32.616 TWITTER.COM 3,805 31.717 Linkedin 3,631 30.218 KPN 3,231 26.919 Ask Network 3,165 26.420 De Persgroep 2,969 24.7
Norway
Top 20 Sites in Norway
Source: comScore mmx, december 2012
Total unique
visitors (000)% reach
Total Internet Audience: Age 15+ 3,336 100.0
1 Google Sites 3,020 90.52 Facebook.com 2,573 77.13 Microsoft Sites 2,552 76.54 Schibsted (Anuntis-Infojobs-20minutos) 2,244 67.35 A-Pressen Group 1,489 44.66 Wikimedia Foundation Sites 1,403 42.17 Spotify 1,264 37.98 AS Avishuset Dagbladet 1,247 37.49 Telenor 1,216 36.510 Yahoo! Sites 1,182 35.411 Eniro Group 1,142 34.212 NRK Sites 1,023 30.713 Edda Media 968 29.014 TV2 Sites 912 27.415 Amazon Sites 876 26.316 VEVO 873 26.217 Apple Inc. 859 25.718 YR.NO 855 25.619 Federated Media Publishing 807 24.220 Aller Media 790 23.7
poland
Top 20 Sites in poland
Source: comScore mmx, december 2012
Total unique
visitors (000)% reach
Total Internet Audience: Age 15+ 19,350 100.0
1 Google Sites 18,820 97.32 Facebook.com 15,697 81.13 MIH Limited 15,601 80.64 Gazeta.pl Group 14,344 74.15 Axel Springer AG 14,132 73.06 Orange Sites 14,101 72.97 Wikimedia Foundation Sites 10,968 56.78 Grupa o2 10,851 56.19 CHOMIKUJ.PL 9,326 48.210 Interia.pl SA 8,819 45.611 VEVO 8,219 42.512 NK.PL 7,894 40.813 Microsoft Sites 7,284 37.614 Polskapresse 6,501 33.615 DEMOTYWATORY.PL 6,137 31.716 Grupa Omnigence 5,956 30.817 KWEJK.PL 5,474 28.318 TVN S.A. 5,344 27.619 Groupe Edipresse 4,991 25.820 Murator SA 4,836 25.0
russia
Top 20 Sites in russia
Source: comScore mmx, december 2012
Total unique
visitors (000)% reach
Total Internet Audience: Age 15+ 61,345 100.0 1 Mail.ru Group 52,396 85.42 Yandex Sites 52,124 85.03 Google Sites 45,838 74.74 VK.COM 43,959 71.75 Microsoft Sites 27,370 44.66 Wikimedia Foundation Sites 25,750 42.07 Ucoz Web Services 23,900 39.08 RosBusinessConsulting 20,073 32.79 Rambler Media 18,383 30.010 AVITO.RU 16,402 26.711 SUP Media 15,891 25.912 Facebook.com 14,675 23.913 Gazprom Media 13,189 21.514 Technorati Media 13,133 21.415 Map Makers Sites 10,971 17.916 MIH Limited 10,851 17.717 KINOPOISK.RU 10,363 16.918 RUTOR.ORG 9,894 16.119 Zaycev Net 9,280 15.120 LiveInternet 9,159 14.9
Source: comScore

IAB Europe AdEx Benchmark 2012
Section 4 - Background Data
40
Spain
Top 20 Sites in Spain
Source: comScore mmx, december 2012
Total unique
visitors (000)% reach
Total Internet Audience: Age 15+ 25,146 100.0
1 Google Sites 23,663 94.12 Microsoft Sites 19,786 78.73 Facebook.com 17,069 67.94 Unidad Medios Digitales 14,855 59.15 Terra - Telefonica 14,409 57.36 Yahoo! Sites 12,380 49.27 Vocento 11,839 47.18 Prisa 11,642 44.49 Schibsted (Anuntis-Infojobs-20minutos) 10,200 40.610 Wikimedia Foundation Sites 9,327 37.111 Orange Sites 7,262 28.912 Ask Network 7,239 28.813 Federated Media Publishing 6,526 26.014 Softonic.com Sites 6,277 25.015 VEVO 6,018 23.916 Weblogs SL Sites 5,842 23.217 Twitter.com 5,671 22.618 Rtve.es 5,596 22.319 Amazon Sites 5,457 21.720 El Corte Ingles Group 5,201 20.7
Sweden
Top 20 Sites in Sweden
Source: comScore mmx, december 2012
Total unique
visitors (000)% reach
Total Internet Audience: Age 15+ 6,404 100.0
1 Google Sites 5,937 92.72 Microsoft Sites 4,866 76.03 Facebook.com 4,693 73.34 Schibsted (Anuntis-Infojobs-20minutos) 4,068 63.55 Bonnier Group 3,660 57.16 Spotify 2,655 41.57 Wikimedia Foundation Sites 2,555 39.98 Sveriges Television 2,058 32.19 Swedbank 1,927 30.110 Yahoo! Sites 1,845 28.811 Amazon Sites 1,707 26.712 Federated Media Publishing 1,604 25.013 Eniro Group 1,578 24.614 Stampen Media Group 1,570 24.515 Apple Inc. 1,530 23.916 CDON Group 1,520 23.717 VEVO 1,496 23.418 Ask Network 1,495 23.319 Nyheter24-Gruppen 1,478 23.120 eBay 1,411 22.0
Switzerland
Top 20 Sites in Switzerland
Source: comScore mmx, december 2012
Total unique
visitors (000)% reach
Total Internet Audience: Age 15+ 5,034 100.0
1 Google Sites 4,767 94.72 Microsoft Sites 3,573 71.03 Facebook.com 3,362 66.84 Wikimedia Foundation Sites 1,971 39.25 Apple Inc. 1,855 36.86 Yahoo! Sites 1,830 36.47 Swisscom Sites 1,747 34.78 VEVO 1,477 29.39 Tamedia Sites 1,174 23.310 Glam Media 1,164 23.111 Amazon Sites 1,162 23.112 Axel Springer AG 1,148 22.813 Viacom Digital 984 19.514 MIH Limited 983 19.515 Ask Network 868 17.216 BABYLON.COM 833 16.617 Deutsche Telekom 822 16.318 Schweizerische Post Sites 770 15.319 CCM-Benchmark 765 15.220 SBB CFF FFS Sites 759 15.1
Turkey
Top 20 Sites in Turkey
Source: comScore mmx, december 2012
Total unique
visitors (000)% reach
Total Internet Audience: Age 15+ 23,917 100.0 1 Google Sites 23,469 98.12 Facebook.com 21,914 91.63 Microsoft Sites 18,339 76.74 Nokta.com MEDYA 16,900 70.75 Mynet A.S. 16,745 70.06 Hurriyet Internet Group 15,258 63.87 Milliyet Gazetecilik Ve Yayincilik 14,681 61.48 SAHIBINDEN.COM 13,124 54.99 Yeni Medya 12,627 52.810 Turkuvaz Yayin 10,090 42.211 Dogan Online 10,073 42.112 DAILYMOTION.COM 9,961 41.613 Wikimedia Foundation Sites 9,372 39.214 TWITTER.COM 8,537 35.715 DONANIMHABER.COM 8,204 34.316 Ciner Medya Grubu 8,088 33.817 Dogan Gazetecilik 7,529 31.518 eBay 6,790 28.419 VEVO 6,765 28.320 Yandex Sites 6,737 28.2
TOp prOpErTIES dECEmBEr 2012
Source: comScore
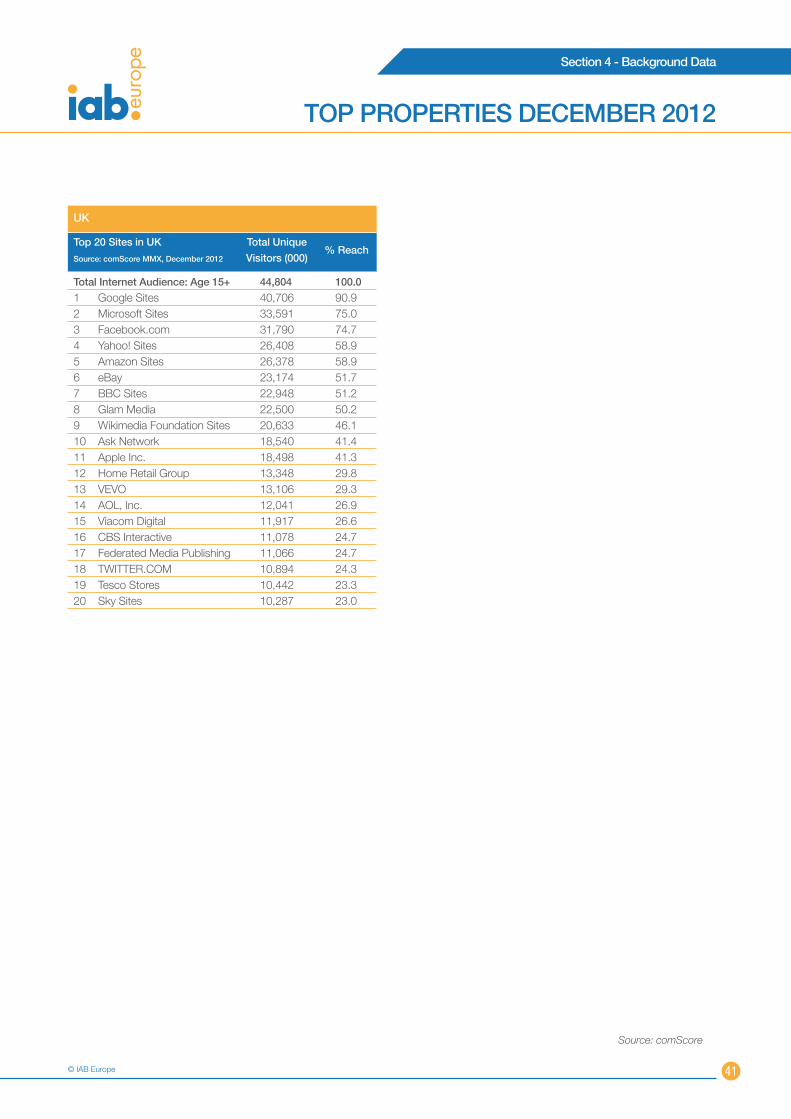
© IAB Europe
Section 4 - Background Data
41
uK
Top 20 Sites in uK
Source: comScore mmx, december 2012
Total unique
visitors (000)% reach
Total Internet Audience: Age 15+ 44,804 100.0
1 Google Sites 40,706 90.92 Microsoft Sites 33,591 75.03 Facebook.com 31,790 74.74 Yahoo! Sites 26,408 58.95 Amazon Sites 26,378 58.96 eBay 23,174 51.77 BBC Sites 22,948 51.28 Glam Media 22,500 50.29 Wikimedia Foundation Sites 20,633 46.110 Ask Network 18,540 41.411 Apple Inc. 18,498 41.312 Home Retail Group 13,348 29.813 VEVO 13,106 29.314 AOL, Inc. 12,041 26.915 Viacom Digital 11,917 26.616 CBS Interactive 11,078 24.717 Federated Media Publishing 11,066 24.718 TWITTER.COM 10,894 24.319 Tesco Stores 10,442 23.320 Sky Sites 10,287 23.0
TOp prOpErTIES dECEmBEr 2012
Source: comScore

IAB Europe AdEx Benchmark 2012
Section 4 - Background Data
42
INTErNET pENETrATION IN EurOpE 2012
AustriaInternet penetration by household 75.6%
BelgiumInternet penetration by household 73.0%
BulgariaInternet penetration by household 46.1%
CroatiaInternet penetration by household 60.3%
Czech republicInternet penetration by household 62.0%
denmarkInternet penetration by household 90.0%
Finland Internet penetration by household 76.0%
FranceInternet penetration by household 69.0%
GermanyInternet penetration by household 77.0%
GreeceInternet penetration by household 50.5%
IrelandInternet penetration by household 70.1%
hungaryInternet penetration by household 64.2%
ItalyInternet penetration by household 55.7%
NetherlandsInternet penetration by household 94.4%
NorwayInternet penetration by household 90.2%
polandInternet penetration by household 51.0%
romaniaInternet penetration by household 45.2%
russiaInternet penetration by household 46.4%
SlovakiaInternet penetration by household 61.9%
SerbiaInternet penetration by household 60.3%
uKInternet penetration by household 80.0%
SloveniaInternet penetration by household 72.3%
SwedenInternet penetration by household 81.5%
Spain Internet penetration by household 62.4%
Switzerland Internet penetration by household 86.1%
TurkeyInternet penetration by household 44.2%
Source: IHS

© IAB Europe
Section 5 - Appendices
43
Appendix i: definition of formats
Online display advertising
Banners, buttons, skyscrapers, overlays, interstitials, pop ups dis-
played on a website
Online video advertising
There are numerous definitions of online video advertising.
Principally included can be:
- in-stream video advertising (pre-rolls, mid-rolls, post-rolls)
- in-stream banner overlays
- out-of-stream video advertising (e.g. self-play video on social
network, not embedded in non-advertising video content)
- contextual video advertising
(e.g. branded video players, contextual banner advertising
sold against video content)
In the 2012 AdEx Benchmark, online video advertising is defined
as in-stream video advertising (pre-rolls, mid-rolls, post-rolls) as
agreed by the IAB Europe Video Working Group.
Affiliate marketing
Fees paid to third party (affiliate) for traffic generation (e.g. pay-
per-visit). Note: for the time being affiliate spend will be included
in display spend in the AdEx study (rather than reported as stand-
alone category)
Online classifieds
A fee is paid by an advertiser to display an ad or listing around
a specific vertical such as automotive, recruiting and real estate,
regardless of the outcome of the ad (i.e., the fee is paid even if
there is no ‘sale’)
Online directories
Online version of printed yellow pages (business listing paid for
by advertiser)
Search advertising
Advertising appearing on specific word requests on search en-
gines. This includes:
Search engine optimisation
(excluded from the AdEx Benchmark study)
Fees paid to a 3rd party to improve website ranking in
search engines
Integrated content
Advertising space without a direct link to the advertiser’s website,
including tenancies and sponsorships (see below for detailed defi-
nitions of these)
E-Mail marketing (excluded from the AdEx Benchmark study)
Where the body of the email is determined by the advertiser and is
sent on their behalf by an email list manager/owner
Newsletter advertising
Advertising (text or banner) that appears around the unrelated edi-
torial content of email newsletters
mobile advertising - display
Any display advertising viewed or read on a mobile phone includ-
ing rich media advertising. This could be browser-based as well
as in-app.
mobile advertising - search
Advertising appearing on specific word requests on search en-
gines, viewed on a mobile device
mobile advertising - SmS/mmS
3rd party ads in SMS and outbound SMS only - this includes ad-
vertising either within the body copy of an SMS / MMS message,
or outbound messaging
mobile advertising - other
All other mobile advertising (e.g. mobile classifieds)
Online auctions
The fees received by online auction houses, e.g. eBay, from suc-
cessful sales through their sites
In-game advertisingFees paid for advertising, sponsorship or product placements
within an online game
Tenancies
Long term partnership between advertiser and media owner.
Media owner benefits from content or service offered by ten-
ant to their customers, although media space may be paid for
in usual ways
Sponsorships
Advertiser sponsorships of content areas

IAB Europe AdEx Benchmark 2012
Section 5 - Appendices
44
Interruptive formats
A type of internet display advertising that interrupts the user expe-
rience with the page content e.g. pop ups, overlays
The following four formats are collated as part of this report:
- Display advertising: includes online display advertising,
online video advertising, affiliate marketing, integrated
content, newsletter advertising, interactive television, mobile
advertising – display, online auctions, in-game advertising,
tenancies, sponsorships, and interruptive formats as
described above and social media where reported
- Search advertising
- Classifieds & Directories: includes online classifieds and
online directories as described above
- ‘Other’ advertising: an umbrella category for ad spend which
could not be redistributed to the three formats above
Appendix ii: participating IABs
IAB Austria
www.iab-austria.atSource: Focus Media Research and Werbeplanung.at
IAB Belgium
www.iab-belgium.beSource: Mediaxim and IHS
IAB Chapter in Bulgaria (Interactive Association)
www.iabulgaria.bgSource: IAB Bulgaria and Ipsos Bulgaria
IAB Chapter in Croatia (INAmA)
www.inama.hr
IAB Chapter in denmark (FdIm)
www.fdim.dkSource: Danske Medier
IAB Finland
www.iab.fiPartner: TNS Gallup (for Display, Classifieds, Mobile and In-stream
video) and IAB Finland (for Search and Directories)
IAB France
www.iabfrance.comSource: France Pub
IAB Chapter in Germany (OvK in the Bvdw)
www.bvdw.orgPartner: Nielsen Media Research
IAB Greece
www.iab.gr
IAB hungary
www.iab.huPartner: PwC
IAB Ireland
www.iabireland.iePartner: PwC
IAB Italy
www.iab.itSource: Estimations on FCP/Nielsen Media Research
IAB Netherlands
www.iab.nlPartner: Deloitte
IAB Chapter in Norway
www.inma.noSource: IRM/INMA
IAB poland
www.iabpolska.plPartner: PwC
IAB romania
www.iab-romani.roPartner: PwC Romania
IAB russia
www.iabrus.ruPartner: AKAR (Russian Association of Communication Agencies)
IAB Serbia
www.iab.rs
IAB Slovakia
www.iabslovakia.sk
IAB Slovenia
www.soz.siSource: IAB SLO Founders
IAB Spain
www.iabspain.netPartner: Grupo Consultores
IAB Sweden
www.iabsvergie.seSource: IRM
IAB Switzerland
www.iabswitzerland.chPartner: MediaFocus
1. IAB Europe and IHS Electronics & Media do not provide a standardised definition of social media advertising as there is still no consensus on
this matter.

© IAB Europe
Section 5 - Appendices
45
IAB Turkey
www.iab-turkiye.org
IAB uK
www.iabuk.netPartner: PwC
Appendix iii: methodology and adjusted data
Each national IAB runs its own annual online advertising spend
benchmark study and as the methodology for the studies varies
by country, IHS standardises the data so that the findings in the
European report are comparable. This involves re-adjusting fig-
ures to allow for different original methodologies, adjusting curren-
cies where local data is not collected in €s and ensuring the year
average exchange rate at 2012 has been used. To provide data
for previous year growth rates, the prior year’s figures are also re-
calculated using the current report’s year-average exchange rate
in order to give transparency over the growth rate.
The next section shows the amount of actual, estimated and ad-
justed data included in the 2012 AdEx report.
Appendix iv: Adjustments by country
Austria
- Ratecard data provided for all formats by Focus Media
Research and Werbeplanung.at (an Austrian consulting
company) in coordination with IAB Austria
- In 2012, the Austrian methodology changed to fit the
German OVK model - Display combines CPM and CPX,
Search is a distinct category.
- 2011 data restated to ensure comparability by the
companies mentioned above
- 2012 discounts applied based on IHS estimates as follows:
o Display – 42.5%
o Classifieds & Directories – 19.5%
o Search – 0.0%
o Mobile Display – 35.0%
- 2011 discounts applied based on IHS estimates as follows:
o Display – 40.0%
o Classifieds & Directories –18.5%
o Paid-for-search – 0.0%
o Mobile Display – 32.5%
Belgium
- Ratecard data provided for Display market by Mediaxim
- Display discounted by 46.9%
- Classifieds & Directories and Search estimated based on
European averages
Bulgaria
- Net & gross data provided by IAB Bulgaria; Gross data used
for the report
- Search revenues based on estimated Bulgarian
Google revenues
- Display advertising includes traditional Display, Mobile
Display, Online video, CPC and CPA advertising, and
Social Media
- The “Other” category not redistributed in any of the above
formats as it was not possible to identify the type of
ad spend
Croatia
- Net data provided by IAB Croatia/INAMA
- Data grossed up as follows, based on local
IAB recommendations:
o Display – 20% on 100% of Display total
o Search – 0% on 100% of Search total
o Classifieds & Directories – 0% on 100% of Classifieds
& Directories total
o Mobile Display – 20% on 100% of Mobile Display total
Czech republic
- Ratecard data provided by SPIR ppi factum for Display and
Classifieds & Directories
- Search reduced by 10% of total to exclude
pan-European spend
- Online video figure reported included all definitions of video
advertising; in-stream online video (pre-rolls, mid-rolls, post-
rolls) estimated using European average for 2011 and 2012
- Data discounted by 43.0% in all categories apart from
Search, based on IHS estimations

IAB Europe AdEx Benchmark 2012
Section 5 - Appendices
46
denmark
- Net data provided by Danske Medier
- E-mail marketing excluded
- Data grossed up as follows:
o Display – 7% on 60% of Display total
o Online video – 7% on 100% of Display total
o Search – 7% on 40% of Search total
o Classifieds & Directories – 0% on 100% of Classifieds
& Directories total
o Mobile display – 7% on 100% of Mobile Display total
Finland
- Net data provided by TNS Gallup for Display, Online video,
Mobile Display and Classifieds; IAB Finland for Search
and Directories
- Data grossed up as follows based on local
IAB recommendations:
o Display – 15% to 100% of Display total
o Classifieds & Directories – 15% to 100% of Classifieds
& Directories total
o Paid-for-search – 15% to 50% of Paid-for-Search
France
- Gross data provided by IAB France and France Pub
- Newsletter advertising extracted from E-mail marketing
(estimated at 21% of E-mail marketing) and added
into Display
- E-mail marketing excluded
- Classifieds & Directories category
o Directories figure published by IREP
o Classifieds figure estimated by IHS for 2011 and 2012
Germany
- Ratecard data provided by OVK in the BVDW/Nielsen
- Data was discounted as follows based on IHS estimates:
o Display excl. video – 66.6%
o Affiliate marketing – 66.6%
- Online video figure based on IHS estimates
- Affiliate marketing and Online video added into
Display category
Greece
- Gross data provided by IAB Greece for Display
- Search and Classifieds & Directories estimated by IAB
Greece and IHS
hungary
- Gross data provided by IAB Hungary
- E-mail marketing excluded
- 2011 data restated
Ireland
- Gross data provided by IAB Ireland and PwC
- Unspecified spend distributed proportionally across formats:
o 34.2% into Display
o 45.8% into Search
o 19.9% into Classifieds & Directories
- Mobile advertising was not included in total growth rate as
2011 figures were not provided
Italy
- Net data provided by IAB and FCP/Nielsen
- E-mail marketing extracted from Newsletter Advertising
(estimated at 50%) and excluded
- Newsletter Advertising added into Display total
- Data grossed up as follows based on local
IAB recommendations:
o Display – 15% to 100% of total Display
o Classifieds & Directories – 15% to 100% of total
Classifieds & Directories
o Mobile advertising – 15% to 77.5% of Mobile
advertising
Netherlands
- Net data provided by IAB Netherlands and
Deloitte Netherlands
- Affiliate marketing redistributed as follows:
o 10% excluded as it was SEO
o 90% added into Display category
- E-mail marketing excluded
- Data grossed up as follows based on local
IAB recommendations:
o Display – 15%
o Mobile display – 15%
Norway
- Gross data provided by IRM/INMA
- No adjustments needed

© IAB Europe
Section 5 - Appendices
47
poland
- Gross data provided by IAB Poland and PwC
- E-mail marketing excluded
- Online video figure reported included all definitions of video
advertising; in-stream online video (pre-rolls, mid-rolls,
post-rolls) estimated using European average for 2011
and 2012
- Unspecified spend distributed among all categories based
on each category’s share of total online ad spend
romania
- Net data provided by IAB Romania and PwC Romania
- Affiliate marketing, integrated content, newsletter advertising,
contextual advertising, and all unspecified advertising added
into the Display category
- Display was grossed up by 5% based on local
IAB recommendations
russia
- Net data provided by IAB Russia/AKAR
- Data grossed up as follows based on local IHS Electronics &
Media estimates:
o Display – 15% on 100% of Display total
o Mobile Display – 15% on 100% of Display total
o Paid-for-search – 15% on 30% of Paid-for-Search total
- Classifieds & Directories not estimated because they are
negligible in Russia
Serbia
- Gross data provided by IAB Serbia
- SEO and e-mail marketing excluded
- The “Other” category not redistributed in any of the above
formats as it was not possible to identify the type of
ad spend
Slovakia
- Gross data provided by IAB Slovakia
- Online video figure reported included all definitions of video
advertising; in-stream online video (pre-rolls, mid-rolls, post-
rolls) estimated using European average for 2011 and 2012
- Sponsorships, Lead Generation, Slotting fees, and Video
included in Display category
- E-mail marketing excluded
- Mobile advertising was not included in total growth rate as
2011 figures were not provided
Slovenia
- Ratecard reported by IAB Slovenia
- 2012 discounts applied based on IHS estimates as follows:
o Display – 69.5%
o Classifieds & Directories – 15.0%
o Search – 0.0%
o Mobile Display – 67.0%
- 2011 discounts applied based on IHS estimates as follows:
o Display – 67.0%
o Classifieds & Directories –15.0%
o Paid-for-search – 0.0%
o Mobile Display – 69.5%
- Display and Mobile Display grossed up by 15.0%
Spain
- Net data provided by IAB Spain and Grupo Consultores
- Classifieds extracted from Display using IAB Europe estimate
and moved into Classifieds & Directories category
- Newsletter advertising extracted from E-mail marketing and
added into Display
- E-mail marketing excluded
- Video advertising, in-game advertising, and mobile display
advertising added into the Display category
- Mobile search added into the Search category
- Data grossed up as follows based on IHS Electronics &
Media estimates:
o Display – 10.0%
o Mobile Display – 10.0%
Sweden
- Net data provided by IRM
- E-mail marketing excluded
- Mobile advertising distributed as follows:
o Mobile Display into Display
o Mobile Search into Paid-for-search
o Mobile messaging into Other
- Reported Search reduced by 10.0% to exclude SEO revenue
- Display reduced by 10.0% to exclude transaction-
oriented payments

IAB Europe AdEx Benchmark 2012
Section 6 - About us
48
- Data was grossed up as follows based on local IAB
recommendations:
o Display – 6.0% on 75% of Display total for 2011 and
70% of Display total for 2010
o Mobile advertising – 1.8% on 100% of Mobile total
Switzerland
- Ratecard data provided by IAB Switzerland
- 2012 discounts applied based on IHS estimates as follows
to net figures:
o Display – 53.0%
o Affiliate marketing – 53.0%
- 2011 discounts applied based on IHS estimates as follows
to net figures:
o Display – 51.0%
o Affiliate marketing – 51%
- Display and Affiliate marketing grossed up by 15.0%
- Affiliate marketing category moved into Display
Turkey
- Net data provided by IAB Turkey
- E-mail marketing excluded
- Search is 87% of the sum of reported Paid-for-search and
Search engine advertising revenues
- Classifieds & Directories include only Classifieds
- Mobile Display and 13% of the sum of reported Paid-for-
search and Search engine advertising revenues ( which are in
fact display ads) added into the Display category
- Data grossed up as follows:
o Display – 15%
o Classifieds & Directories – 15%
o Search – 15%
o Mobile display – 15%
uK
- Display, Classifieds & Directories, and Search kept
as reported
- Email marketing excluded
- Other calculated as the difference of the Total reported and
Total of Display, Classifieds & Directories and Paid-for-search
(this includes Lead-generation, Social Media ad spend, Solus
Email, Audio)
- 2011 figures restated

Section 6 - About us
49IAB Europe AdEx Benchmark 2011
The IHS Electronics & Media product portfolio is the unique
combination of strong legacy brands (including Screen Digest) and
proven research methodologies. Leveraging proprietary market
data, forecasts, and expert analysis, IHS Electronics & Media
provides comprehensive coverage at every operational step of
increasingly complex technology, media and telecommunications
value chains, from strategy, planning and analysis to product
design, market development and supply chain management.
About IhS
IHS (NYSE: IHS) is the leading source of information and insight
in critical areas that shape today’s business landscape, including
energy and power; design and supply chain; defense, risk and
security; environmental, health and safety (EHS) and sustainability;
country and industry forecasting; and commodities, pricing and
cost. Businesses and governments around the globe rely on the
comprehensive content, expert independent analysis and flexible
delivery methods of IHS to make high-impact decisions and
develop strategies with speed and confidence. IHS has been in
business since 1959 and became a publicly traded company
on the New York Stock Exchange in 2005. Headquartered in
Englewood, Colorado, USA, IHS employs more than 6,000 people
in more than 31 countries around the world.
www.ihs.com
SPA Future Thinking is a leading, innovative research agency
with a global footprint, operating across seven key verticals.
We challenge and support our clients’ by providing clear and
actionable evidence bases that aid decision making. We deliver
a full range of products and services from ideation to visualisation.
This means we help organisations create ideas, test them, develop
them, price them, help develop best pack, find best media fit to
maximise sales, track customer experience and report all the
results back in infographics, portals and punchy reports. We love
a challenge, what’s yours?
www.spafuturethinking.com
comScore, Inc. (NASDAQ: SCOR) is a global leader in digital
measurement and analytics, delivering insights on web, mobile
and TV consumer behavior that enable clients to maximize the
value of their digital investments. Through its Audience Analytics,
Advertising Analytics, and Digital Enterprise Analytics product
suites, comScore provides its clients with a variety of on-demand
software, real-time analytics and custom solutions to succeed in a
multi-platform world. The proprietary comScore Census Network™
(CCN) leverages a world-class technology infrastructure to capture
trillions of digital interactions a month and power big data analytics
on a global scale for its more than 2,000 clients, which include
leading companies such as AOL, Baidu, BBC, Best Buy, Carat,
Deutsche Bank, ESPN, France Telecom, Financial Times, Fox,
LinkedIn, Microsoft, MediaCorp, Nestle, Starcom, Terra Networks,
Universal McCann, Verizon, ViaMichelin and Yahoo!.
www.comscore.com
Nielsen Holdings N.V. (NYSE: NLSN) is a global information
and measurement company with leading market positions
in marketing and consumer information, television and other
media measurement, online intelligence, mobile measurement,
trade shows and related properties. Nielsen has a presence in
approximately 100 countries, with headquarters in New York,
USA and Diemen, the Netherlands. For more information, visit
www.nielsen.com.
Our rESEArCh pArTNErS

IAB Europe AdEx Benchmark 2012
Section 6 - About Us
50
ABOuT IAB EurOpE
Our mission
IAB Europe is the voice of digital business. Its mission is to protect,
prove, promote and professionalise Europe’s online advertising,
media, research and analytics industries. Together with its
members – companies and national trade associations – IAB
Europe represents over 5,500 organisations.
Our research Strategy
IAB Europe ‘proves’ the value of the online advertising industry
through an ongoing programme of research. It initiates and
brings together the best of research available on the consumer
and the European online advertising market through its network
of members, national IABs and partners. In addition to our AdEx
Benchmark study current projects include:
Global Mobile Ad Revenue Report
IAB Europe, the U.S. IAB Mobile Marketing Center of Excellence,
and IHS in collaboration produce this report on an annual basis to
identify global figures and trends for mobile advertising revenue
The AdEx Barometer explores pan-European advertiser trends
and transnational media buying.
IAB Europe’s Mediascope Europe study is the industry standard
European piece of cross-media consumer research. Conducted
since 2003, Mediascope Europe’s main objective is to improve
the industry’s understanding of changing media consumption
patterns, the evolving consumer and e-commerce trends.
The Consumer Barometer is a global effort by IAB Europe in
partnership with TNS Infratest and Google to quantify the role of
online in the consumer journey from research to purchase.
IAB Europe encourages its members to use these assets to
support investment in digital media and inform business decisions
plus also to get involved in Its Research Committees to shape and
expand industry knowledge.
Alison Fennah
Vice-President, Research and Marketing, IAB Europe
Our Board
Made up of nine national IABs and nine corporate members,
the Board represents the wide-ranging interests of the many
stakeholders in the European digital marketing industry.
Chairman: Constantine Kamaras, IAB Greece
Vice-Chair: Stéphanie Hospital, Orange Digital
Corporate Members:
AB Inbev, Adconion Media Group, Adition, Adobe, ADTECH, AGOF
Services GmbH, AOL Advertising Europe, AudienceScience, BBC
Advertising, CNN, CoAdvertise, comScore Europe, Creafi Online
Media, Criteo, Deutsche Post, eBay International Advertising,
Emediate, Evidon, Expedia Inc, Fox Interactive Media, Gemius,
Goldbach Group, Google, GroupM, Hi-Media, Koan, Mediamind,
Meetic, Microsoft Europe, Millward Brown, News Corporation,
nugg.ad, Nielsen Online, OMD, Orange Advertising Network,
PHD, Prisa, Proxistore, Publicitas Europe, Pubmatic, Quisma,
Sanoma Digital, Selligent, Tradedoubler, Triton Digital, Truste,
United Internet Media, ValueClick, Verisign, Viacom International
Media Networks, Webtrekk, White & Case, Yahoo!, Yandex and
Zanox.
Country Members:
Austria, Belgium, Bulgaria, Croatia, Czech Republic, Denmark,
Finland, France, Germany, Greece, Hungary, Ireland, Italy,
Macedonia, Netherlands, Norway, Poland, Romania, Russia,
Serbia, Slovakia, Slovenia, Spain, Sweden, Switzerland, Turkey,
Ukraine and United Kingdom representing their 5,000 members.
The IAB network represents over 90 per cent of European digital
revenues and is acting as voice for the industry at National and
European level.

© IAB Europe
Section 6 - About Us
51
ANd FINAlly
Special thanks
With sincere thanks to all the contacts at the national IABs who
have supported the production of this report by supplying and ex-
plaining their data to IAB Europe.
Thanks to our member comScore for audience measurement
figures.
Over the past twelve months the AdEx Benchmark Task Force has
created specific Working Groups on Mobile and Video agreeing
scope of the research, methods and definitions. We would like to
thank the Task Force and Working Groups for their valuable input to
this process and their contribution to the production of this report.
AdEx Benchmark Taskforce:
Frederik Raviol, Business Analyst, United Internet Media
Endre Somogyi, General Manager, IAB Hungary
Tim Elkington, Director of Research and Strategy, IAB UK
Alexey Belyaev, Research Director, Video International and Chair of
IAB Russia Research Committee
Carola Lopez, General Manager & Head of Market Research, IAB
Germany/ BVDW
Thomas Duhr, Executive Vice-President Interactive, IP Deutschland
Eleni marouli,
Analyst, Advertising Research
IHS Electronics & Media
daniel Knapp,
Director of Advertising Research,
IHS Electronics & Media
Authors of the AdEx Benchmark 2012 report

Section 6 - Appendices
conTAcTIAB Europe
The EGG – Communication Nest
Rue Bara 175
1070 Brussels, Belgium
+32 (0) 2 526 55 74
AdEx Benchmark enquiries: [email protected]
General information: [email protected]
www.iabeurope.eu
IhS Electronics & media
133 Houndsditch
EC3A 7BX
London, United Kingdom
+44 (0) 2074242871