Deterioration in Frozen Pork As Related to Fat ... - CORE
67
APRIL, 19!i2 R&SEARCH BULLJ:.'TJN 49 2 UNIVERSITY OF MI SSOUR I COLLEGE OF AGRICUL TunE AGRICULTURAL EXPERIM ENT STATION 1. H. loNG WELl., Deterioration in Frozen Pork As Related to Fat Composition, Storage Temperature, Len g th of Storage Period and Packaging Tr eatment A. Z . P A L MEJI., D. E. BRADY, H. D. NA U )C ANN AN D L. N . T UCK ut tP ublieaUon authorized March 24, COLUMBIA, MI SSOURI
-
Upload
khangminh22 -
Category
Documents
-
view
0 -
download
0
Transcript of Deterioration in Frozen Pork As Related to Fat ... - CORE

APRIL, 19!i2 R&SEARCH BULLJ:.'TJN 492
UNIVERSITY OF MISSOUR I COLLEGE OF AGRICUL TunE
AGRICULTURAL EXPERIM ENT STATION
1. H. loNGWELl., Dir~IDr
Deterioration in Frozen Pork As Related to Fat Composition, Storage Temperature,
Length of Storage Period and Packaging Treatment
A. Z . P A LMEJI., D. E . BRADY, H . D. NAU )C ANN AN D L. N . T UCK ut
t P ublieaUon authorized March 24, 1~.52 )
COLUMBIA, MISSOURI

TABLE OF CONTENTS
Introduction .... " ........... ... _ .... " Review of Literature
Factors Influencing the Saturation of Pork Fat Methods of Measuring the Saturation of Pork F at
Fag. 3 1 1 1
Effect of Fat Saturat ion on Keeping Qualities of F rozen Pork ........... . 8 Effect of Storage Temperatur e and Length of Storage on Palat·
abilty ....... . .................. . ... ........... . ... .............................. . E ffect of Packaging Materials on Dete rioration of Frozen Pork Subjective Methods for Determining P roduct Acceptability Objective Methods of Determining Product Acceptability .
Experimentsl Design and Procedures
8 11
11
14
16 16 16 18
Animal!! Used Feeding Processing Storage .................. ....... .......... 19
Testing ..... .................... . Statistical Analysis
Ground Pork ............ . P ork Chops .... ........... _ .......... . Pork Loin FWasts ................. _ ......... .
Results and Discusllion Ground Pork ..... . .
Fat Saturation Effects ......... . Packaging Material Effects S torage Temperature E ffects Length of Storage Effects First Order Interactions Correlations ............................. ............................... .
P ork Chops Fat Saturation Effects Length of St orage Effects .
Pork Loin Roasts . Fat Saturation Effects ........ . Length of Storage Effects
Summary and Conclusions ................. .. Bibliography .. .............. . Appendix ..... _ ... ................................................. .
.........•..
2Q
22
22
22
23 23 23 23 25
.. ........... _ ........... 27
34 ....... ......... 36
45
" 51
" 54
54 55
" 59 63
Acknowledgm<!nt.._ The authon gratefully acknowledge the valuable "". $istance and &Ovice of OT. Charlea W. Gehrke. Associate Profea.or o t Agricul_ tural Chem.l.otry in the chemical analY$e$ and procedures Involved in IhllI study.

Deterioration in Frozen Pork As Re lated to Fat Composition, Storage Temperature,
Length of Storage Period and Packaging TreatmentOo
A. z. P .... L),{ER, D. E. BMOV, H. D. N .... U~UNN .... NO L. N. T UC KER
t. INTRODUCTION Ages ago, man did not know how to prevent meat from spoiling. Meat
was supplied by hunting or fishing and that beyond immediate needs was wasted. Today meat is preserved by curing, dehydration. canning, and refrigeration, the latter being the most universal method.
The preservation of foods by freczing was first commercialized-a step quite necessary to bring the process to the means of the consumer-ncar the tum of the century. The popularity of this method of preservation has increased phenomenally during the past decade. In 1950, there were 2,000,-000 freezers in the homes of the nation, and 11,000 locker plants were in operatlon."t
Obviously, the freezer storage method of preservation offers many advantages and hence its wide acceptance, but it also has its limitations.
Meat can be frozen and stored successfully although there are s number of factora which may influence the length of time it can be stored and still remain palatable. Meat contains a large amount of fat which makes it especially su~ptible to rancidity development during frC(!zer storage.
The storage life of por k is less than that of beef or Iamb not only because of its higher fat content but also because the fat of pork is more unsaturated and therefore more susceptible to rancidity development. Thus the degree of {at saturation is accountable for much of the difference in the keeping quality between por k, beef and lamb. With an increase in the proportion of unsaturated fatty acids, pork rat beeomes softer, and conversely, it becomes firmer with a decrease of unsaturated fatty acids. Feeds such aa soybeans and peanuta when comprising a substantial psrt of a ration produce soft pork because they are high in fat content and because that fat is quite unsaturated. Hogs are frequently fed soybeans and other soft fat producing feeds resulting in an increase in the softness of the carcass fat . Where such feeds are fed in a limited manner, as is usually the case. the change in the character of fat is not sufficient to cause a marked reduction in quality. There is considerable question, however, as to whether a decrease in the firmness of the pork fat is associated with a detectable and a proportional reduction in the s torage life of frozen pork.
*Th~ material In this buUetin has been taken largely from a thesis presented by the senior author to the Faculty of the Graduate School In partial fulftllment of the requirements for the degree Doctor of Philosophy.
fS~ list of numbered nferences in the Bibliography begtnning on page lI9.

4 MrS50UIU AGarCULTUItAL EXPERIMENT STATI O:'>"
I t is generally recognized that 8.8 rall become oxicfued lhey alao become r&neid in aroma and flavor. The oxidation rate of It rat is govemO!'li by the temperature and the availability of Dx,y,en, .a well as other (acto~ 8uch lIB organic and lnorcanlc catalysts, radiation and naturally O1:currlng anti-oxldants. It susceptibility to oxidation and hence rancidity development I. It function DC u.turatlon 50 that soft pork deteriorates more rapidly In (reeur Btorage than drm pork, t he use of optimum IItorage temperature. and e1fteient packaging material!! ill of paramount importance. There ill agreement in the literature as to the effect of atorage temperature and packaging in retarding the development of rancidity in firm por k. Information ill DOt available on IOrt pork which theoretically ahould be much more auaceptible to oxidative rancidity development. If fat saturation I, a facto r in the keeping qualitle, of frozen pork, then there Is need for information on the effect. of ,torage t emperature and packaging on t he keeping quality of frozen pork of varying firmness.
F ood acceptance ha, bftn determined, renerally, by tastlnr the food In qUelltion. Tht. method otten lacks reproducibility because it is lubjeet to error by the human element involved in it. Tbe evaluation of food by Ita odor has been proposed u a substitute fo r tasting because of Ita -.impllcity and because recovery from olfactory fatigue is 150 rapid that it allow. many more samples to be telted at a sitting.
It would be desirable to use objectlve methods In evaluating the quality of meat since they provide a permsnent reeord of reproducible re.ulta. T here a r e, however , only a few objective t este for meat quality and there Is consider able question at to their usefulneu.
Peroltlde values have been used to estimate rancidity but little II known as to their auitability. Free fatty scid valutl bave been taed to measure hydrolytic deterioration of the fat , although the r elationship between f ree fatty add values and palatability is not sutliciently tltablished.
OBJEC'rn'ES The prinCipal objective of thill investigation wu to determine the Inftu·
ence of fat astu ration on the keeping quallty of frozen pork. In addition, Informstion was desired on ;
1. The influence of the rate of gain, the etl'eet of the character and the pen:entage of fat In the ration and that of the length of the KOybean feeding period on the degree of tat saturation.
2. The effect of ltorq-e temperature, length of the storage period and packaging material efficiency on the quality o f ground pork, pork chopa and pork roailU.
3. The NlatioQhlp between objective and subjedive metho<k of eval· uating pork as to general desi r ability or acceptability in flavor and aroma.
DEFINITIONS O· F. O· F. referIJ to the temperature of a freeur storage room which
had an average daily temperature Nading of -o.l · F . l O· F. l O· F. refers to the temperature of a freeur storage room which
had an average dally temperature Nading of l O.S· F.

RESEARCH BULLETIN 492 5
O"· lO"F. Weekly. O"·lO"F. weekly refers to a temperature treatment in which samples were stored at O"F. and lO"F. on alternate weeks for t he duration of the experiment. The samples receiving the O· ·lO"F. weekly treatment were removed from the fluctuations and stored at O"F. for at least one week but not more than four weeks before they were tested. Samples stored for a period of three monti,s were held at O"F. until the last month of the period, and at that time the samples were fluctuated during the last month of the storage period. Samples stored six months were nuctusted for four months with the remsining time spent in O"F. storage. Those stored for nine montha were fluctusted seven months with the rest of the period spent at O"F.
One Derrosting. As used in this study, 1 defrosting is a temperature treatment in which the frozen samples were thawed and returned to O"F. for the remainder of the storage period. The fluctuations were carried out in a home freezer in order to simulate conditions otten experienced by users of rural eleetricity service, in which the current interruptions are n ot uncommon. Characteristics of the fluctuations are illustrated in Figure 1. The maximum temperature range was from 33.S"F. to 46.4°F. The average maximum temperature is plotted in the graph. The minimum temperature range was from -!l.S"F. to O"F. The average minimum temperature is plot· ted in the graph. T he average load of ground pork in the freez.er for each fluctuation was 40.:5 pounds.
Three Defrostings. In this study. 3 defrostings is a temperature treatment in which the frozen ground pork samples were thawed three times in the same manner and under conditions similar to those described above.
Laminated Paper . Laminated paper is a packsging material used to wrap ground pork samples. It consisted of wet strength cream·tint kraft laminated to wet strength. high gloss. plasticized glassine with a special low temperature laminant.
Waxed Paper. Waxed paper is a packaging material used to wr ap ground pork samples. It consists of 3:5·pound basis weight raw stock 24x 36.l5QO. on one side of which lS pounds of micro·crystalline wax reinforced with additives had been applied.
Fl B.\"or. Flavor is the combined and stimulating effects of the meat on the gustatory and olfactory nerves." · "
Odor. Odor is the stimulating effect of meat or its volatile components on the olfact ory nerves."· ""
'l'hree Months Storage. This term is used in reference to the average length of time that samples from each pig were stored.
Six &Ionths Storage, Nine Months St orage, and Tweh'e Mcnths Storage are terms used in refe rence to the actual length of the storage periods. All samples were tested within four days of the end of their respective storage periods.
Iodine Number. Iodine number may be defined as the number of grams of iodine absorbed by one hundred grams of fat."

• M ISSOURI A GRICULTURAL U PERUl tNT STATIO:;"
... .. AI. '" r-U. /
-- , ,- , " -- ,
-- , r / I
.h • , , , • , • • ,
I ............. • • • • ,
I , , >d' • • I
, • , , , ,
• • , • , , , , I
, ul".
, I
, , , \ , , , • , , , • , , • , , •. • • • , • " • .. .. .. -.
FIg. l._~tro~tlng char.eterl, tlel of Fro~en ground pork.
Free Fatty Acid Value. The f r ee fatty acid value may be defined as the number of roUligrarna of potassium hydroxide required to neutralize the free ratty acids present in one gram of fat. Value. are calculated on the oleic acid basis."
Deh,ydratiOP. DebydraUon is used in reference to t hat mobture 108t from samples during storage.
Peroxide Value. Peroxide value il expreued u mlltiequlvalenta peroxide per kilogram of fa t.

RtS£AII.CH B ULLtTlN 492 7
II. REVIEW OF UTERATURE* FACTORS L"FLUENCING THE SATURATION OF PORK FAT The saturation of pork fat is inftuenced by the percentage of fat in
the ration according to work of Hostetler, Halverson and Sherwood (1939). Hostetler and Halverson (1940). Helser et al. (1940), and Ellis and Iabell ( 1926) . Bull et al. ( 1931 ) noted that an increase in the percentage of ground lIOybeans in a ration was accompanied by a higher percentage of tat in the ration and conduded that the high fat content of lIOybeana was a cause for unsaturated pori[ fat depollition.
E llis and b bell (1926) report. that the saturation of the rat in the ration aifeel.ll the character of depot fat. Their wor k was suhstantiated by Bhattacharya aDd Hilditch (1931 ) who round that aa the unsaturation of ingested ration fata increaaed. there wa.a a corresponding Increased occur· rence in depot rat of the unsaturated fatty acids characteristic of 10ft fata.
More recent work of Brady, Smith and Tucker (1946) showed that the length of the feeding periods on ratlona high in unsaturated rat Influenced the saturation of pork fat-longer feeding periods Increased the unsaturation or the fat.
Ellis and Hankins (1925) and Hankins aDd Ellb ( 1926) reported that rUler gain ing pigs produce a firmer, more saturated rat than do slower gaining pig! . This finding has since been contirmed by Callow (1935) and Shorland and DeLaMore (1945). However, Bull et al. (1931 ) r eported that the rate of gain bad no effect on the firmness of pork produced by hogs fed soybeans. thlUl indicating that the character ot the rat in the ration aDd the per cent of fat in the ration exerted a greater inlluence on the saturation of pork fau than dOe! the .rate of gain.
Ellis and Hankins (1925) and Dean and Hilditch ( 1933) found that weight at ,laughter W8lI related 10 t he saturation of pork fat .
Hilditch (1940) and Lea (1938) reported that the soybean haa a high fat content and that the oil of the soybean Is highly unlaturated. The feed . Ing of soybeans to hop resul ts in 110ft and low quality pork according to RobillOn (1930) Godbey (1931) and Veatal and Shrewsbury (1932, 1935).
METHODS OF MEASURI NG THE SATURATION OF PORK FAT Firmnelll o r saturation of pork fat has been measured by various phy
sical and chemical methCKis. Gross differences in the saturation or firm ness of fau may be detected by the phys ical grading of carcasses or cuts according to recognized commercial s tandards. Hankins, Ellis and Zeller (1928) used the refractive index, the iodine value, and the melting point in measurin&" t he character of por k fat. Tbese values were calibrated against the physical grade provided by a carcass grading committee. Iodine value and refractive index were found to be satisfactory measures of firmness whereas the melting point was found to be a leu accurate measure of firmnesJil.
-All lnvut!gaton quoted In the Revtew of U terature are ltated alphabetically tn the Bibliography, beflnntng on i»-Ie :19.

8 MISSOURI AGRI CULTURAl. EXPERIM ENT ST.<TIO!"
According to Lea (1938) and Hilditch (1940) the firmness of fat depends upon the degree of IInturation of fatty acid components of the fat, and the relat ive proportion of unsaturated fatty acids to saturated fatty acids in the fat. Pork fat becomes firmer as the proportion of the unsat_ urated fatty acids dee~ase, and it becomes softer as the proportion of unsaturated fatty acids increase.
THE EFFECT OF FAT SA'rURATION ON THE KEEPING QUALITIES OF FROZEN PORK
Lea (193S) indicated that fat saturation influenced the rate at which pork becomes rancid under cer tain storage conditions. According to Lea (1938),
"Soft or oily careas~s f~quently appear to be abnOl'mally liable to rancidity, ,..~ Indeed mIght be expected from the Inc reasing SU!l(:~ptib!Uty to oxidation displayed by IndiVidual fatty adds as th~ degree ot unsaturation Increases."
E3rnicoat (1930) reported that the fat of pigs which had been fed considerable amounts of whale oil or low-grade fish-meal was soft and became rancid very quickly. Helser et a l. (1939, 1940) found tha t as the unsa turation of lard increased, the more rapidly the lard deteriorated. Peroxide values of lard stored 6 months increased as the amount of soybeans in experimental rations of the pigs incressed.
Shrewsbury et al. (1942) produced pork that varied considerably in saturation by the feeding of high and low fat rations. Chops and roasts of the hard and Soft fat carcasses were wrapped in moisture proof cellophane, frozen at - 26 ' F. and stored for periods up to 16 months at -6.3 ' , -S.4 ' . -S.2 ' F. From chemical and palatability data it was concluded that the fat from the soft carcasses showed no greater tendency to become rancid than the fat from the finn carcasses. Chops and roasts were in very satisfactory condition at the end of one year and were s t ill edible at the end of 16 months storage.
Recent work of Brady, Smith and Tucker (1946) e!early indicates that sott tats of cured por k are more subject to oxidative deterioration or rancidity development during storage than hard fats .
Vestal and Shrewsbury (1932) report that raw and cooked soybeans produce soft pork but that the quality of the cured and smoked hams and bacon was satisfactory.
THE EFFECT OF STORAGE T&\IPERATURE AND LENGTH OF STORAGE ON PALATABIUTY OF FROZEN PORK
It is generally recognized that fatty foods must be stored at low temperatures if rancidity development is to be delayed for an appreciable period of time.
The keeping quality of frozen pork fa t is a function of the storage temperature according to Novikova (1939) and Kiermeir and Heiss (1939). Cook and White (1941) showed that storage temperature was the p rimary factor governing the development of ra ncidity in frozen pork. PeroxIdes developed slowly below -lrC., noticeably between _17 ' C. and - 12' C., and rapidly between -12' C. and -6· C.

RCSEARCH BULLEnN 492 , Snyder (1939) ststed that pork should not be held longer than trom
4. to 6 months because the fat would often become ranc:id when held for longer periods. Novlkova (1938) , however, found that pork CXluJd be stored at -{l."F. up to one year without appreciable c:hange in the D.avor and odor and the chemical properties, but that 17.6 ' F. storage reaulted In inferior palatability at 6 months and an inedible produc:t at 12 months.
Watta and Peng (1947) stored unseasoned ground pork at O' F. Ground pork became rancid within 81h months in one teat and within 11 months In another: the pork wu c:onsidered to be ranc:ld when the peroxide value became 10 millimoles (or 20 mllliequivalents ) per kilogram of fat. Zeigler, Miller and Christian (19:10) CXlmpued the keeping qualitiu of aeuoned and unseasoned S8.uu.ge stored at 0 ' and 10' F. and found that seaeoned llausage would remain edible for 2 months at 10' F. or for 3 month, at O' F. Unseuoned sausage would remain edible for 6 months at 10' F. snd for slightly more than 6 months at O' F. Peroxide values of seasoned and un· seunned sausage stored at O' F. increased up to the fifth and sixth months and dec:reased thereafler.
Griswold and Blakeslee (1939) report that pork chops remain edible tor 6 months when atored. at 0', ~ ' . and l~·F., although significant dltrer' ences were found between organoleptic value. of the chops stored at the various temperature.. O' F. storage was the moat desirable and 1~ · F. the Jesst desirable. Of the seven wrapping materials studied in this Investip· tlon, none significantly Influenced palatability, although there was considerable variability in moisture vapor proof effiCiency as judged by weight laues.
DuBois, Tressler and Fenton (1940) studied the influence of storage temperature on the quality of frozen pork chope:. The por k chopa Wt.N: from a carcass whic:h had been hung ~ day. at 32' to 33' F. The chop. were wrapped three per pac:kage in moisture-proof veKt!table parchment and stored in waxed earton. at -40' , --8', 0' , 10', and l~ ' F. for perio<b up to H . months. Pork chol>' stored at....g' and -40' F. showed no .ign. of ran· cidity by organoieptic or acUve-oxygen te.ts at the end of 14 month.. At O' F. the chops were sl!ghtJy rancid by 12 monthe. The c:hop. became rancid wIthin 4 monttus when they were stored at 10 ' F. and within 2 months when s tored at 115 ' F.
Noble and Hardy (1941, 19~) report that the rate of change in palatabllltv of .pork routs is not influenced by .torage temperature. of 0', 10', and 115 ' F .; no one temperature preserved the palatability to a greater extent than the other. They found that high quality pork $tored at 0', 10' and l~ ·F .• hould not be held longer than 16 to 22 week •.
Wellington, Macklnto.h and Vail (1940) .tate that pork roalts etored between 7 and 18' F. should not be held longer than 5 months. Apparently this conclusion Wal drawn from data not reported beeause the rat from 4. of the 8 animals used lcored lower in palatability at the end of 1 month of .torage than at the end or ~ monthe storage.
Hall et al. (1949) reported that better preaen:ation or quality In pork stored at low temperaturea as compared to that .tond at high tempenturel

10 MISSOURI AGRICULTURAL EXP£R IME[';T STAnON
was indicated by high palatability scores, by the absence of peroxides, and by low fat acid numbers. Frozen pork loin roasts were stored for periods up to 72 weeks at 10' , 0 ' , and ~10 ·F. Other pork was s tored at 0 ' , - 10' , and - 20"F . After 24 weeks of storage, the superiority of - 10 ' and -20"F. over the higher storage temperatures for frozen pork was indicated.
Young and McIntosh (1943) detennined the effect of storage at O"F. for 1'12, 3 and 4'/z months upon t he quality of pork chapa and roasts by palatability tests and chemical measurements. The quality of the pork was not ~ppredably affected by storage up to 414 months although the int ensity of the Bavor o f t he fat increased with storage. The mean values of the tasting panel scores on the rancidity of fat factor in no single instance exceeded 0.44 on the basis that 0 was sweet and 4 rancid. Il was concluded that, "T he peroxide oxygen test seems to measure quantitatively the degree of rancidity in the fat."
Woodroof (1938), Guest (1939) and Christensen (1945) emphasize the point that temperature fluctuations should be minimized, because eltcessive desiccation may result and because fluctuations may lead to excessive growth of ice crystals in the food. None of t hese investigators provided data to substantiate their view or prove that food quality is impaired by fluctuating temperatures.
H ustrulid and Winters (1943) reported that the quality of a frozen product will not be noticeably changed by temperature fluctuations no greater than 3 ' F. to S' F. if a temperature of O' F. or less is maintained during most of the storage period.
Black (1945) reported that partial thawing, comparable to that thawing that might occur in. the transport and handling of commereis.lly frozen and packed meats, increases oxidation of the fat and r esults in tallowiness.
Finnegan (1939), in his study of the fsctors affecting desiccstion in frozen foods, found that fluctuating temperature was the primsry cause ot dehydration. Woodroof (1941) recognized the desiccation of frozen products as one of the major problems confronting the frozen (ood industry because it was accompanied by a loss in the weight and flavor of the prod.uct. Moran (1937) and Melhart (1939) report that desiccation results in a loss of the flavors of frozen food. Griffiths, Vickery, and Holmes (1932) observed that much of the color, bloom and freshness disappear ed from frozen meat with the development of freezer burn.
Gortner et 801. (1948) stored frozen pork rossts for periods up to one year at O' F., lO ' F. and at temperatures fluctuating between O'F. and 20' F. on a cycle allowing 20' F . storage for 36 hours of each six-day period with the rest of the period being O' F. The roasts stored at lO' F. and t he fluctuating temperature were in incipient rancidity by 4 months and were rancid at the 8- and 12-month testingB. Although palatabilit y scores dropped with the length of storage, roasts held at O' F. were rat ed significantly higher in ps.latability than the roasts stored s t l O' F. and at the fluctuating temperatures. Rancidity developed at about the same rate in roasts stored at IO' F. as it developed in the roasts stored at the fluctuating temperatures according to palatability and .peroxide vs.lues.
RtSEARCH B UI.I .. CTIN 492 11
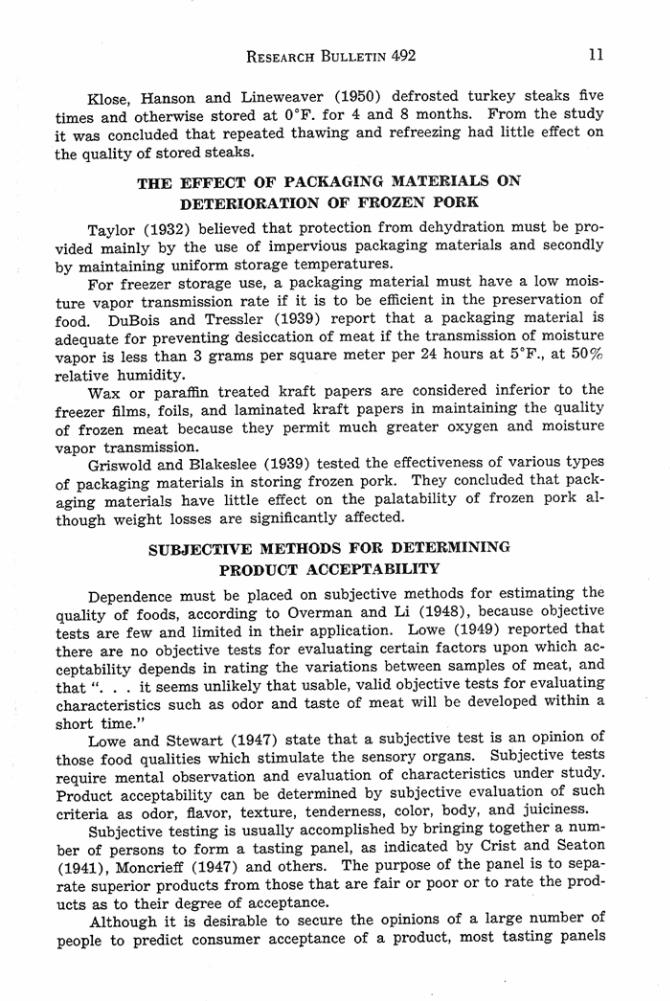
Klose, Hanson and Lineweaver (19150) defrosted t urkey IIteakll five times and othet'Wiae atored at O' F. for 4 and 8 months. From the study it waa concluded that repeated thawing and refree=ing had little effect on the quality of atored stuka.
THE EFFECT OF PACKAGIl\.-G ~rATERIALS ON DETERIORATION OF FROZEN PORK
Taylor (1932) believed that prot«tion from dehydration mUit be provided mainly by the Ulle of impervtOIa packaging materialll and secondly by maintaining unifonn _to rage temperatures.
For freezer storage Ulle, a packaging material must have a low moisture vapor transmission rate if it Is to be efficient in the prellervation of food. DuBob and Treuler (1939) report that a psekaging material is adequate fo r preventing duicca.tion of mut if the transmission of moisture vapor is leu than 3 grana per squsre meter per 24 hours at 15 ' F ., at 50% relative humidity.
Wax or psraffin treated kraft papers are considered inferior to the freezer Blmll, foilll, and laminated kraft papen in maintaining the quality o f f rozen meat becau.te they permit much greater oxygen and moisture vapor transmission.
Griawold and Blakulee (1939) te. ted the effeetivenesl; of various tyPE!-' of paekaginc material, in lltoring frozen pork. They concluded thal packaging materials have little effect on the palatabillty of frozen pork al· though weight losses are aigniBcantly affected.
SUBJECTIVE ~IETHODS FOR DETER.\lINING PRODUCT ACCEPTABILlTV
Dependence must be placed on aubjective methods for e~timating the quality of foods, according to Overman and Li ( l948), ilecaule objective teatll are few and limited In their application. Lowe (1919) reported that there are no objective teata for evaluating certain f~ctolll upon which acceptability depends in rating the variation~ betwe<!n aamplell of meat. and that " . . . It aeemll unlikely that usable, valid objective tests for evaluat ing characteriatlcs auch as odor and lute of meat will be developed wlthia ~ short time."
Lowe and Stewart (1947) stllte that a subjecdve te.t is an opinion of thOlile food qualities which .timulate the aensory organs. Subjeetive testa require menta l observation and evaluation of characteristics undcr ~tudy. Product acceptability can be determined by subjective evaluation of such criteria sa odor, flavor, texture, tenderneSB, color, body, and juiciness.
Subjective te~ting b usually accompl iahed by bringing togethe r a number of perllonll to form a taating panel, &II indicated by erillt and Seaton (194l ), Moncrieff (1947) and otherll. The purpose of the panel III to separate superior products from those that are fair or poor or t o rate the products as to thei r degree of acceptance.
Although It b desirable to secure the opinions of a large number of people to predict consumer acceptance of a product, mo&t tuting panel~
12 MIS$OUIU ACIUCULTUII .. L EXPERIMENT STATION
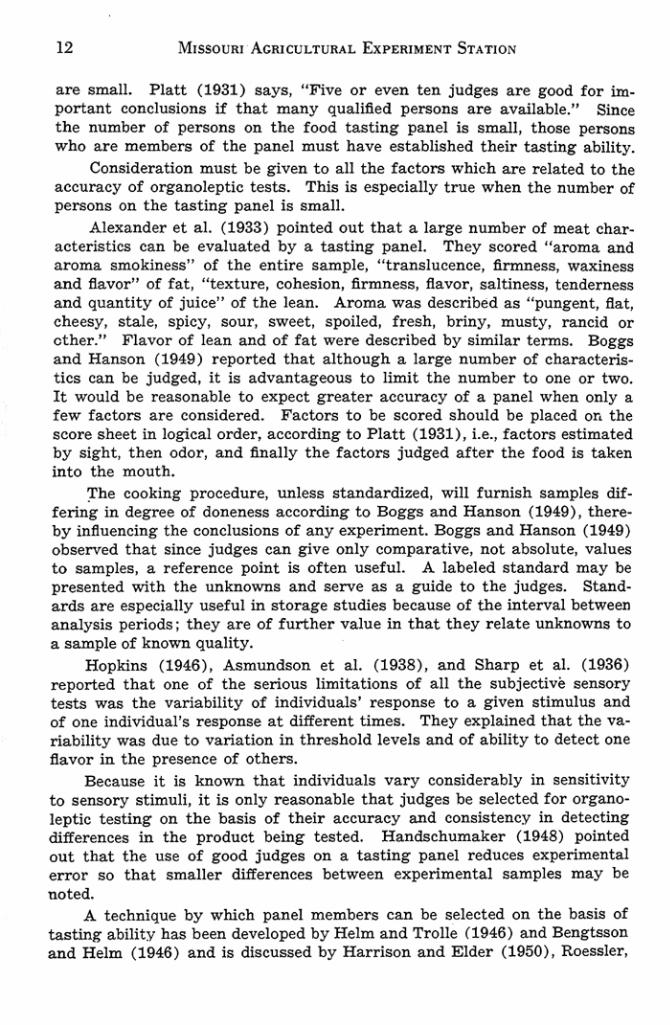
are small. Platt (1931) says, "Five or even ten judges are good for important conclusions if that many qualified persons are available." Since the number of persons on the food tasting panel is small, those persons who are members of the panel must have established their ta.sting ability.
Consideration must be given to all the factors which are related to the accuracy of organoleptic tests. This is especially true when the number of persons on the tasting panel is small.
Alexander et at (1933) pointed out that a large number of meat characteristics can be evaluated by a tasting panel. They seored "aroma and aroma smokiness" of the entire sample, " translucence, firmness, waxiness and flavor" of fat. "texture, cohesion, firmness. flavor, saltiness, tenderness and quantity of juice" of the lean. Aroma was described as "pungent, flat, cheesy, stale, spicy, sour, sweet, spoiled, fresh, briny, musty, rancid or ether." Flavor of lean and of fat were described by aimilar terms. Boggs and Hanson (1949) reported that although a large number of characteris· tics can be judged, it is advantageous to limit the number to one or two. It would be reasonable to expect greater accuracy of a panel when only a few factors are considered. Factors to be scored should be placed or. the score sheet in logical order, according to Platt (1931), i.e., factors estimated by sight, then odor, and finally the factors judged after the food is taken into the mouth.
The cooking procedure, unless standardized, will furnish samples dif· fering in degree of doneness according to Boggs and Hanson (1949), thereby influencing the conclusions of any experiment. Boggs and Hanson (1949) observed that since judges can give only comparative, not absolute, values to samples, a reference point is often useful. A labeled standard may be presented with the unknowns and serve as a guide to the judges. Standards are especially useful in storage studies because of the interval between analysis periods; they are of further value in that they relate unknowns to a sample of known quality.
Hopkins (1946) , Asmundson et al. (1938), and Sharp et al. (1936) reported that one of the serious limitations of all the subjective sensory tests was the variability of individuals' response to a given stimulus and of one individual's response at different times, They explained that the variability was due to variation in threshold levels and of ability to detect one flavor in the presence of others.
Because it is known that individuals vary considerably in sensitivity to sensory stimuli, it is only reasonable that judges be selected for organoleptic testing on the basis of their accuracy and consistency in detecting differences in the product being tested. H andschumaker (1948) pointed out that the use of good judges on a tasting panel reduces experimental error so that smaller differences between experimental samples may be noted.
A technique by which panel members can be selected on the basis of tasting ability has been developed by Helm and Trolle (1946) and Bengtsaon and Helm (1946) and is discussed by H arrison and Elder (1950), Roessler,

Rt.S£ARCH But.u;n~ 492 13
Warren and Guymon (1948) and Boggs and Hanson (1949). This technique, known as the Trianguiar Taste Test, requires that the taater correctly match the identical aamples ot the three pre!lented with a certain level of consistency. Chi-squar e a.nalys~ ot the data is used to determine whether a penon is sufficiently adept in d~tlnguishing differences in foods and in duplicating his own judgments.
The accuracy ot a panel in numerically evaluating samplea is influenced by the actual tiring of the !lense oraans and by p'ychologieal fatigue that resulta; if the panel is pre!lented 100 many sample. at one time or too often during a single day,
Monerieff (1946) ,reported that olfactory and gustatory hUgue is the result ot adaptation of receptors to t he stimulus or stimuli. The rate at which ol tactory and gustatory faUgue develops depends upon t he atrength and duration of the atimulus, although under most any practical circums tance fatl,"e develop' very rapidly.
Crocker (19( 5) atates that "The nose recoven its sensitivity rapidly afte r it haa been used for sme!ling, It the odor is not Irritating. It Is sensitive again in perhaps live seconds for the next smemng," Recovery trom .. tasting ~ a matter of minutes and therefore the interval between tasting of samples should be .. long all practical-perhaPi live minutes between strong tastes.
To retard the development of faUgue, some t allte rs insist on a certain proeedure between taalings such as nibbling on bread. crackers. or an apple, or rinsing the mouth with water. In testa conducted by t he Bureau ot Human Nutrition and Home Economics ( Anon. , 19(3) solutions were discaroed rather than swaUowed, since It waa reasoned t hat such a pr-actice would prevent fatigue.
Asmundson et al. (1938) eliminated the problem of fatigue by presenting only three or four samples of turkey at one time. MOIler et al. (1947) found that sensitivit y to oil Havor could be maintained best by the use of the paired method of comparing two samplCIJ. McCammon, Pittman, and Wilhelm (1934) found that judgea beeame unreliable after testing 10 to Hi samplea of egga at one time. Bengtason and Helm (1946) reported that the number ot samples to be eva1uated at one time should be limited to two or three. On t he other hand, Lowe (1949) states, "There is no delmite ru le in deciding upon the number of sampJea that can be llcored at one time. The senses of taste and smell tatigue easily, hence the number should not be large,"
Moncriet! (194.0) reported that the tastes commonly experienced are due not only to gustatory sensation. , but aIso to heat and cold and above all, t o olfactory sensaUona. Boggs and Hanson (1949) reported that Ilavor is a combination ot odor and taste and that theretore, aspects of Havor may be judged by 8nifting a tood as well ... taking it into the mouth. Handrtehumaker (1948) in a study of reverted. soybean oil , found that most dis. criminating judges succeeded in making their dec~ioIUI after .melling the aamples rather than taatlnr them, whereas the lta5 acute individuall of the

14 MISSOURI ACR1CULTURAI. EXPEHlMtNT STATIO);
panel found it necessary to taste the samples in order to increase the concentration of the tlavor studied to a distinguishable point.
McCammon, Pittman and Wilhelm (1934); Gaebe (1940); and Gray, Stone and Atkin (1947) found sample differences to be more consistent with judgments of odor than with ftavor. VaH and Conrad (1948) studying the palatability of frozen ehicken, favored the use of odor scores over "Flavor plus odor" scores in establishing differences between samples because within-sample variation was eliminated when all judges sniffed the entire casserole of chicken. Learning to score by !lavor was difficult because of the influence of such factors as juiciness snd tenderness.
Trelea.se and Koonz ( 1945) found that odor differences of cooked poultry were most pronounced immediately after the birds were removed from the oven. Vail and Conrad (1948) soored the odor of cooked chicken immediately after cooking, and 5 and 15 minutes after cooking but preferred the 5-minute interval between cooking and testing because it corresponded most nearly to conditions as they generally exist at the time of eating.
Dove (1947) noted that different temperatures of foods bring out different tastes. Moncrieff (1946) states that, "There is an optimum tempera_ ture of 2O ' -40' C. for taste." Bengtsson and Helm (1946) caution that at SO"C. the gustatory nerves cease to function and suggest 20· C. as the optimum temperature for pen:eption of taste.
OBJECTIVE METHODS OF DETE R:'IINING PRODUCT A CCEPTABILITY
The use of objedive methods in determining product acceptability is desirable, accot"ding to Hal!iday (1937), because they provide a permanent record of reproducible results. Organoleptic methods are slways subject to the variations of human judgment.
Wheeler (1932) reports that rancidity development is due to oxidation by the oxygen of the air.
J ensen and Grettie (1937) studying the action of micro-orgsnisms on fats, reoognized the catalytic effect of light, heat, metallic or organic com_ poundJs and Roentgen rays on the fst oxidation process. but stated that. "certain strains of bacteria producing two kinds of entymes-lipases and oxidases-appear to be responsible for the rapid development of free fatty acids and of oxidative products." The phenomenon of enzyme production by micro-organisms paralleled oxidative rancidity development.
Lea (1937), Dean (1941), and Fiedler (1940) concede that the primary change occurring during the storage of a fat or oil is a strictly chemical oxidation. The majority of investigators have therefore directed tbelr sttention toward means of IItudying tbe action of oxygen in fat and oil deterioration.
Bolton and Williamll (1930) l"(lport that oxygen undoubtedly attacks the double bonds of the unsaturated acids, which sre present as glycerol esters, thus fonning detectable organic peroxides in fats and oils which have been exposed to air. Later Bannore (1936) substantiated the work of Bolton and Williams (1930) with similar findings but added that peroxide

RU~"RCK BULL~TIN 492 15
fonnation wu accompanied by either spontaneous decompo;sition of per· oxides to aldehydes, ketones and fatly acids or the reaction of peroxides with water to form aldehydes, ketones and fatty acids.
Vintileseo and Popesco (19Ui) apparently were the lint to detect peroxide (also known lUI "active·' or "labile") oxygen. Very little attention Willi given toward the development of a quantitative determinstion of this oxygen until Lea (1931), in his studies on the effeet of ligbt on the oxida· tion of fats, used a method of determining active oxygen.
The peroxIde determination I. one of the rno&t widely used of the oh· jective mellllurea of rancidity of meat. Yet. it Is subject to several rather levere limitatIon •. A$ pointed out by Stansby (19{1 ), peroxide com pounds are intermediate compounds and as luch are not reaponsible fo r rancid lIavon snd odora. Stansby (19{1) believe. that peroxide values can be expected to be related to the development of rancid tlavof5 and odors only when the fate of peroxide formation exceeds the rate of peroxide decom· polIition. Stan,by (1941) further s tates that at higher temperatures per· oxide decompoaltlon proceeds more rapidly than peroxide formation be· cause that reaction has a higher temperature coefficient. Therefore as .tor· age temperatures Increase, the peroxide value becomes ll!$$ reliable a.s a measure of rancidity. RocklOl"OO<i, Ramsbottom and Mehlenbacher (1947) in theIr study of methods of preparing animal t iuue tata for peroxide deter· mlnation found that peroxides .hould be mea.ured by extractlng: the fat and making determinations on the extracted material to eliminate the pos· libiUty of water, protein and other lIubstances complicating the reactlon to give eITOneou8 re.ul~. Only mild extraction procedure should be f ollowed so that the ,""ults will not be Inlluenced. Complete extraction is ncceasary in order for ext['8cted fat to be representative.
In light of theM limitation. of the use of the peroxide value u a measure of rancidity, It 18 not surprising to tlnd little agreement In the literature as to their Interpretation in terms of rancidity of lIavor and odor.
King, Roachen, and Irwin (1933) found fat to be rancid when it had 20 mil1iequivalenta peroxide per klloe:ram of fat. Watts and Peng (1947 ) considered ground pork to be rancid when peroxides reached 20 milliequiva· lenta per kilog['8m of fat. Volz et ilL (194.9) repol"t that incipient ['8neid· Ity in frozen pork Is indicated by peroxide value. between 1 ~ and 20 mUli· equivalents per kilogram of fat.
Ramsoottom (1941) studied the effect of storage time and temperature on t he palatability of pork chop'. Peroxide formation was found to be a function of time and temperature. No evidence wu pre$<!nted to s h ow the relationship betw« n peroxide. and palatability although it wu con cluded that chops receiving the same stO['8ge treatment a. those with the highest peroxide value. were rancid in tlavor.
Zeigler , Miller and Christian (1950) studied the palatability and peroxide values of aeaaoned and unaea.soned sausage whIch wa.s stored at 10' and O' F. for periods of 1, 2, 3 and 6 montha. The inve.tigation did not reo veal a r eal relationship between peroxide values and palatability.
16 Mr!.SOURI AGRICU I.TURAL E :I(fJ;HIMENT S TATIO ....
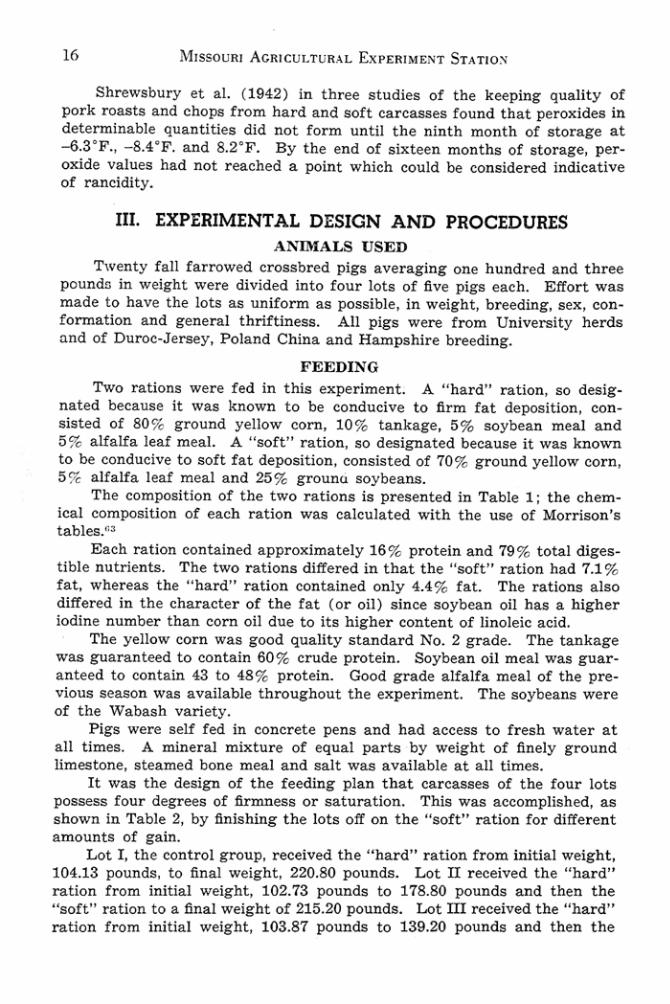
Shrewlbury et al. (194.2) in three atudies of the keeping quality of pork roasts and chopa from hard and soft eareaa.ea found that peroxides in determinable quantities did not form until the ninth month of Itorage at -a.3 ' F. , -S.4 ' F. and S.Z' F. By the end of alxteen months of s torage, per. oxide values had not reached a point which CQuid be considered Indicative of rancidity.
III. EXPERIMENTAL DESIGN AND PROCEDURES ANIMALS USED
Twenty Call farrowed crossbred pip averaging one hundred and three pound~ In weight were divided into four loU ot five pigs each. Effort was made to have the lou at uniform 18 possible, in weight, breeding, aex, conformation and general thriftiness. AI! pigs w en! from University herds lind of Durac-Jersey, Poland China and Hampshire breeding.
FEEDING Two rations were fed In this experiment. A "hard" ration, 80 de-ig
nated becaulle it wu known to be conducive to firm fat deposllion, consbted of 80 % ground yellow corn, 10% tankage, :i% $Oybean meal and :i % alfalfa leaf meal. A "$OCt" ration, so designated because it was known to be conducive to eoCt Cat depollition. consisted of 70% ground yellow corn, :i % alfalfa leaf meal and 2:i% grounu soybeal1ll .
The composition of the two rations ill p reunted in Table 1 ; the chemical composition of each raUon was caltulated with the use of Morri50n's tablel."
Each ration contained approximately 16 % protein and 79% total digestible nutrients. The two rations differed in that the " 50ft" ration had 7.1 % fat, whereu the " hard" ration contained only 4:" % rat. The ratlol1ll all50 differed in the charatter or t he fat (or 011) sloce soybean oil haa a higher Iodine number than com 011 due to ita higher content of linoleic acid.
The yellow corn waa good quality 6tandard No.2 grade. The tankage was guaranteed to contain 60 % crude protein. Soybean oil meal was guaranteed to contain 43 to 48% protein. Good grade alfalfa meal of the previous lelllOn was available throughout the experiment. The soybeans were ot the Wabash variety.
Pics were selt fed In tontrete pens and had access to rresh water at aU timea. A mine ral mixture of equal parta by weight of finely cround limestone, steamed bone meal and salt was available at all timel.
Yt was the design ot the feeding plan that carcasaes of the four Iota possess four degrees of flrmneu or saturation. This was accomplished, as shown In Table 2, by Ilnlshlng the lots off on the "soft" ration for different amounte oC gain.
Lot I , the control group. reteived the "hard" ration from initial weight, 104.13 poundll, to final weight , 220.80 pounds, Lot II reeeived. the "hard" ration from initial weight, 102.73 poundll to 178.80 pounds and then the "soft" ration to a final weicht of 215,20 pound ... Lot m re<:eived the "hard" ration from initial weight , 103.87 pounds to 139.20 pounds and then the

REStARCH BULLETIN 492 17
"soft" ration to final weight. 212.00 pounds. Lot IV nceived the "soft" ration from Initial weight. 101.74 pounda to final weight. 208.20 pounds.
F eedstuff
Gro...nd yellow eorn No.2
Tankage (60% Protein)
Soybean 011 Meal (43·48% Protein)
Alfilla Leal Meal (lS% Protein)
GroWld Soybeans
Chemical Composition
P rotein, % Fat,%
Fiber, % Mineral, % T.D.N. , %
80% 10%
•• ••
16.62
4.37
3.S6
3.66
79.12
70%
•• ". 16.56
7.12
4.08
2.66
79.82
• A mineral mixtllre of eqllal parts by weigbt of finely groWid Umestone, steamed bone meal and salt wu available at all times.
No. P igs
Av. Initial Weight. Lbs.
Av. Slallgbter Weight, Lbs.
A v. Soft Ration Gain, Lbs.
TABLE 2 •• FEEDING PROCEDURE
1 (Control)
• 104.13
Hard Ration
j 220.80
o
, •
102.73 I .,,'
Ration
t 178.80Iba . Av. Wt .
&lit Ration
j 215.20
36.40
3
• 103.87
I Hard
Ration
L 139 .201bs. Av. Wt. , SO"
Ration
t 212.00
72.80
• •
10l.74
"U Ration
j 208 .20
106.46

18 M ISSOURI ACRICULTURAL ExPERIMENT STATI O:'>
The elfe<:u of feeding the "..,ft" ration (or varying weight gains durIng the finishing period are presented in Table 3. Lot I pigs, the controls, made an average daily gain of 1.89 pounds; Lot II pigs, 1.61 pounds; Lot ill pig8. 1.51 pounds, and Lot rv pigs 1.30 pounds. Lot I required 459 pounds of feed per 100 pound, of gain wbeteu Lot II required 415 pounds, Lot ill, 492 pounds, and Lot IV, 4.18 pounds. Lot differences in rate of gain and eJficieney of feed utilization may be attributed to the relatively low palatability of the "110ft" ration lUI well u the fact that the "soft" ration did not contain protein of animal origin.
T ABLE 3 •• THE INFLUENCE OF A RATION WOH IN PER CENT OF FAT AND UNSATURAT ED F ATTY ACIDS ON R ATE OF GAIN, EFFICIENCY OF FEED UTIUlATION AND PORK
FAT SATURATION
Lo' Lo' Lo' Lo' I 2 3 •
Number of Pigs , , , , Avg. · soIt" raUOlI gain, lb •. 0 36.40 72.80 106.46
Avg.d.ally gain, lbll. 1.89 1.81 1.57 1.30
Lbs. feed required per 100 lb • . pin 4~9.41 475 .04 492.04 478.30
Avg. Iodine number 58.75 63.88 65.18 68.44
CarcllIIs rt r mness (lot avg.) Ha.rd Mo1l= M""= Medil,lm
'ud hard ~"
As the number of pounds gained on the "soft" ration increased from lot to lot, the carcasses beeame softer, and the iodine number of the ground pork fat increued. Lot I had an average Iodine number of .58.75 ; the carcaases graded "hard." Lot It had an averB..ie Iodine number of 63.68 and the eareaaaes graded "medium hard." Lot ill had an average iodine num_ ber of 65.18 and the can:aa~ graded "mediwu hard." Lot IV had an average iodine number of 68.44 and the carca.saes graded " medium soft."
PROCESSllW As the pip reached. de-.ired slaughter weights, they wer e taken oft
feed, faated for 24 hours and then slaughtered. Water was available duro ing the fasting period. The pigs were dres.sed Packer style except that the leaf fat W8lI Iooaened rather than removed. T he carcasses were chilled for 48 hours at 36"F. before they were graded aDd processed. The careasses were graded physically sa to drmneas sa follow.: Hard, Medium Hard, Me·

R ESEARCH BULL~TII1 492 19
dium Soft, Soft, and Oily. Ground pork was made from the sides, jowls and boned shoulden of each carcass. Two c~es did not yield sufficient total weight of these cuI.!! for the ground pork needs of the experiment, snd it was necessary to use In addition a corresponding ham of each carcass. The ground pork wsa p«!pared by grinding the cuI.!! through a % _inch plate, mixing thoroughly, and grinding through a 31l6-inch plate.
The chemical composition of the ground pork is given in Tsble 4. The ground pork of Lot I was 44.76% moisture, 42.69% fst and 11.48% protein. Lot II ground pork WllS 43.8:)% moisture, 44.15 % fat and 11.36% protein. Lot TIl ground pork was 40.40% moilltu«!, 48.39 % fat, and 10.86% protein. Lot IV waa 41.93% moisture, 45.97% fat and 11.35 % protein. It is true also that more variability in eomposition existed within lob than between Iota.
TABLE 4 -- AVERAGE CHEMICAL COMPOSITION OF GROUND PORK
"" C., "" "" , 2 3 • Per Cenl
Moisture 44.75 43.85 40040 41.93 F o< 42.59 44.15 48.39 45.97 Protein 11.48 11.36 10.36 11.35
Thirty-six samples of unseasoned ground pork from each pig were wrapped, eonfectioner's method. The samples were made as uniform in shspe as possible snd contained 454 ± 10 gru.ms of ground pork. The wrapped and unwropped weight of each sample was taken at the beginning and at the end of the storage period. Half of the samples were packaged in a glusine laminated to kraft locker paper and the other half in waxed locker paper. Pork chops were taken from the loins, which had been trimmed t o have approximately V2 inch of hackfat, beginning immediately behind the last or thirteenth rib and proceeding toward the ham end of the loin. Six I-inch thiek chop. were cut from each loin and numbered from front to rear. Loin end pork roasts were used in the experiment. The chops were wrapped three per paekage, confectioner's method in glassine laminated to kraft locker paper. The pork roasts were wrapped, confectioner's method in the glassine laminated to kraft locker paper.
STORAGE
All samples were rrozen for 24 hours on - lO' F. coils . Ground pork was stored at O' F., 10' F., and O-IO' F. weekly, one defrosting followed by O' F. storage and three defrostings followed by O' F. storage. The storage period!! were tor 3, 6, 9 and 12 months.
The pork chops were stored at O' F . for 3, 6, 9, and 12 months. Pork roaIIta were stored at O' F . for 6 and 12 months.

MISSOURI ACRICUI.TURAI. EXPERI)olE;>;T STATIO'"
XESXING The samples we~ tested organoleptically and chemically. The flavor
and the odor of the cooked sample was scored as to desirability, rancidity and intenaity. Peroxide and free fatty acid values were determined to supply information on the amount of oxidative and hydrolytic deterioration.
Approximately 24 hours prior to testing, all samples were removed from storage treatment snd weighed. To prevent errors due to moisture condensation on the sample, weighing was done in a room where the temperature was 10'F. The general appearnnce of each sample, considering color and the extent of freezer burn, was noted. The samples were thawed in a refrigerator where the temperature ranged from 38 to 40 ' F. The samples were placed at room temperature shortly before testing to facilitate thorough mixing of the ground pork and to insure complete defrosting of the roasts and chops.
The ground pork of each package was mixed by hand as completely as possible to insure that the aJiquots removed for organoleptic and chern. ical tests would be representative. Although it was re<:ognized that mixing of the ground pork samples would minimize certain effects of packaging materials and storage temp1':ratures on the quality of the product (oxidation and desiccation being most pronounced on the surface), this technique was used because it most nearly represented the manner in which meat is treated prior to consumption. The housewife ordinarily mixes ground pork in the process of seasoning. Many investigators taste only the outside part of the sample; their organoleptic scores, therefore, would be lower and the chemical tests indicative of greater deterioration than in this study.
A loo'gram aliquot from each ground pork sample was made into a patty one-half inch in thickness. The patty was placed in a small earthenware casserole covered with a lid and cooked in a preheated oven for 50 minutes at 3OO· F.
The two outside chops from each package of three were used for testing ; one chop was used for chemical analysis, the other was placed in a small earthenwsre casserole covl:red with a lid and cooked in a preheated oven for 50 minutes at 300' F. for organoleptic testing.
A l%-inch thick cross section was taken from the center of the pork roasts and prepared tor taste testing. The cooking prOQedure was the same as for the chops except that the cooking time was 90 minutes.
The use of covered earthenwar e casseroles in the cooking procedures is desirable because it provides the true flavor of the meat by minimizing the browning effect and because it provided a convenient means of sniffing the odor.
The cooking schedule was arranged to allow samples to be removed from the oven at five minute intervals. This interval made it possible to t est all samples with minimum temperature var iability.
The testing panel was made up of four members of the Meat Division of t he Animal Husbandry Department of the University of Missouri. The members of the panel were chosen because of their availability and int erest in the investigation. However , the members of the panel were tested, by

RtS£.4.RCH BULLETIN 492 21
the Triangle Taste Testing method of selecting judges, for their ability to detect established differences in the rancidity of pork. Results of this test indicated that all members of the panel were significantly (.01 level) !lc· curate in distinguishing between varying degrees of rancidity. In the Tri· angle Taste Test, samples of ground pork known to vary in degree of ran· cidity were presented to pane! members in sets of three with two of the three being duplicates and from the same sample. The judges were asked to match the duplicates by odor and flavor. These samples were cooked and examined by the judges in the same manner as the experimental pork. Three aets of three samples each were tested by the panel at each of the four sittings giving a total of twelve sets. Results were tabulated and an· alyzed for significance according to the following formula: b' = 1/3 (N-13.270N) where b' equals the number of identified duplicates needed for dgnifieance at the .01 level and N equals the total number of sets of sam· pies in the trial.' The number 13.270 is derived from the values of Chi· square at the .01 level of significance.
Preliminary tests indicated that the panel was capable of testing twelve samples without the members becoming appreciably fatigued . It is prob· able that fatigue was prevented by each member chewing up a piece of white bread, spitting it out and rinsing his mouth with water between each sample. All tasting was done two hours or more after mealtime to mini· mize the effects of prior eating.
The closed laboratory tasting panel was used to organoleptically eval· uate the samples. Each member of the panel was given a set of instructions to observe 90 that he might be as accurate as possible in scoring the samples.
The scoring chart· used in this investigation was designed for simplicity. Intentionally, the degree of product acceptabili ty was classified quite broadly in the organoleptic factors of the chart so the panel could devote itself to the detection of relatively large palatability differences. All organoleptic factors were given numerical values so that the data could be analyred statistically.
The samples were randomly assorted and coded when presented to the judges of organoleptic evaluation.
Odor evaluation began immediately after the sample was r emoved from the oven. Members of the testing panel sniffed the sample in the same order at each sitting. Each judge partially or entirely removed the lid of the casserole to allow the rise of the vapors from the meat and reo placed the lid after scoring the odor of the sample. Tasting was done after all judges had evaluated the odor.
The ground pork pattiea were cut into four pie-shaped wedges which were placed in paper cups-one piece was given to each judge for tasting. A control patty of fresh ground pork waa cooked in the same manner as experimental pork. The control patty, labeled "Fresh," was the first sample tested a t each sitting of the panel and it served as a standard upon
*See Appendix, beginning on page 63.

22 MISSOURI ACRlCUI.TURIIL ExPERlMENT ST.\.TIO~
which to evaluate the experimental samples. Only the fat and not the lean of the chops and roasts was tasted. Peroxide values were determined by the procedure of Stansby" with the extraction of the external fat of the chops and roasts modified accoming to Watts." Free fatty acids were determined according to the A.O.A.C. procedure and calculated on the oleic acid baais. Chemical snd organoleptic tests were made on sHquots of the same sample and on the same day.
IV. STATISTICAL ANALYSIS Statistical analysis was made of aU data. Analysis of variance was
calculated aceording to Snedecor"° and correlation coefficients determined as described by Mills. ' · The significance of differences between the means was ascertained by Snedecor's" T·test.
GROUND PORK Analysis of variance involved 600 samples of ground pork from fou r
lots of pigs (five pigs in each lot ) which were packaged in two packaging materials and sto~d at five temperatures for 3, 6 and 9 months.
The distribution of the samples made according to lot, packaging material, storage temperature or treatment, and length of the storage period is shown in Appendix Table I.
Main effect dift'erences, i e" those between lots, between psckaging materials, between storage treatments, and between storage periods were obtained by combining t he samples under one main grouping at a time for statistical analysis, For example, the gl'ound pork samples of Lot I were compared statistically to the ground por k samples of Lot II even though in each lot the pork was packaged in two materials and stored at five temperatures for three periods of time, Similarly, all the samples packaged in laminated paper were compared statistically to the samples packaged in the waxed paper even though in each packaging material the pork was from four different lots a nd had been stored at five temperatures for three periods of time.
Correlation coefficients involved 480 ssmples of ground pork that had been stored at O' F" 10 ' F " and 0-10' F , weekly for 3, 6, 9, and 12 months, The samples were packaged equally in laminated paper and waxed paper, The group of samples used in the calculation of correlation coefficients differed from the group of samples used in analysis of variance calculations in tbat it did not contain samples which had heen defrosted one and three times and in that it did contain samples stored for 12 months.
The distribution of the samples used in correlation coefficients is shown in Appendix Tahle II,
PORK CHOPS Eighty samples of pork chops from four lots of pigs (five pigs in each
lot) were packaged in the laminated paper and stored at O"F. for 3, 6, 9, and 12 months, Analysis of variance was used to determine between lot and between storage period differences.
The distribution of the pork chops is shown in Appendix Table m.

R ESURCff BuLLETIN 492 23
PORK LOtN ROASTS Forty samples at pork loin roasts from four lots of pigs (five piga in
each lot) were packaged In the laminated paper and stored at O· F. for 6 and 12 months. Analysis of variance wss appUed in determining the significance of differences between lots and between storage periods.
The distribution at the roasts is shown in Appendix Table IV.
V. RESULTS AND DISCUSSION
Tbe effects of fat saturation. packaging material , storage temperature and length of storage on frozen ground pork, pork chapa and pork loin roasts were determined organoleptically and chemically. The mesn values and standard errors ot the data are presented In graphs and tables.
GROUND PORK
1. Fat Saturation E ffects
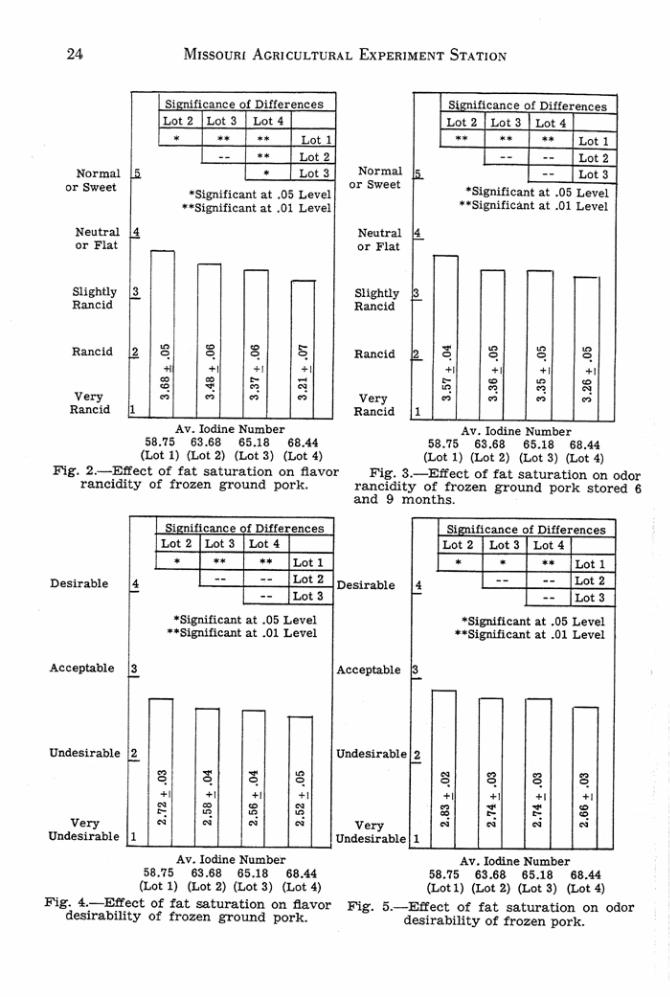
F1a\'or Rancidlty.-The effect of fat saturation on the rancidity of frozen ground pork as detected by flavor may be seen in Figure 2. Note tbat an increase in fat saturation was accompanied by a deereBlle in the palatability. Lot I had an aversge iodine number of ~8.7~ and was given sn average flavor score of 3.68. Lot II had an average iodine number ot 63.68 and flavor score. averaged 3.48. The iodine number of Lot m wu 65.18 and flavor scores averaged 3.37. Lot IV had the highest Iodine number of all the Iota, 68.440 , and wu the moat rancid in flavor witb an average leore of 3.21. Lot I differed l ignmCl.lltiy from Lot II (It tbe .05 level ), Lot m (at the .01 level), and Lot IV (at the .01 level). There wu no lignifleant difference between the rancidity of Lots II and m in flavor although Lot m bad a alightly more rancid flavor. A Ilgnmeant difference (at the .01 level) in rancidity wu found between Lots II and IV. Lot IV was signlfleantly (at the .05 level) more rancid in flavor than Lot m.
Odor Rancidity.- The effect of fat saturation on rancidity development in frozen ground pork as detected by odor i, Ihown in Figure 3. Lot I differed aign.i.6cantJy (at the .01 level) from Lou II, m. and IV. No other slpifteant differences were detectable by odor. Fewer difference. were found between lots when r ancidity was evaluated by odor than when rantldity was evaluated by flavor. In comparing figures 2 and 3 it will be noted that the differences between lou were not aa pronounced In the odor rancidity as flavor rancidity.
F lavor Desirabillty.-It was reeogni:red at the start ot the experimcnt that pork samples could be slightly rancid and yet neither objectionable nor unae<:eptable, t herefore, it wu felt desirable t o acore samples" to theIr derdrability of flavor and odor. The effect of Cat laturation on flavor delirability is shown in Figure 4. Lot I, the control lot , with an iodine number ot 58.75 had the moat dellrable Ilavor and differed significantly from Lot II (at the .~ level) and Lou m and IV (at the .01 level) . There were no Ilgnifleant differences between Lots II, m, and IV.
,. !'\'l lS50URI ACRICULTURAL ExP£II;lloltNT STAT IO:-;
Nor mal or Swel!1
Neutral Or F lat
Rancid.
,
" Heane , lf1er.""u .. " ... , .... • •• •• " .. •• " • .. "
·~Iflcll.llt at .05 t.evd " 91",lfleantat .01 1. .... 1
~ - -~
I; ~ ~ " • .. • • • • -• • .. " .. .. .. .. . "y. locI1M N~",bu
53.15 n.n 65.1 . n.44 (Lot I) (Lot 2) (Lot I ) (Lot 4)
Fl&'. 2._Etle<:t of ra t uwratlOll on flavor rancidity of froun ground pork.
, " mlunees .. " ... , ... .
• .. • • .. " Dulrabl" ~
.. .. .. " .. .. " °Slp.lllcatlt 11.1 .05 L evel
" 81InIftclU>t I I .01 LevII
Normol Qr S ..... t
Noutral or l'1.at
SlIlJhtl), Rancid
RancId
'SlJlliflC""~ ~ · · Stpd!!.""1 al .01 Llvel
~ - - r
1.1 I ~j " I;
. " Y. ~ I'umbtr 58.75 53 .68 85.l. n.44
(Lol l ) (Lot 2) (Lot I) (Lot 4)
Fig. 3.- Etre<:t of f at .MUtation On odor rancidity of I'rozen ground pork &to red , and 9 month •.
, lficanee 01 DlII ..... c .. .. " .. " .... • • •• .. "
• .. .. ..., .. ... ,
"S1lP'1fteant at .05 Levll " SilDlf\cut at .01 L ... , !
~ A ~
- r ~ r
, '! • • .. • • .. .. ..
v." .. • • .. ~
.. .. .. .. Undellnbl l ,
Av . Iodin. NumtHr 51.75 113.68 ' 5.18 ".44
CLot I) (LoI 2) (Lol I ) (Lot 4)
Fia". 4.-E1I'ec:t of tal ... tun-llon on fta,-or desirabUity ot froz,en C1"Ound pork.
r r r-
u nd<Isln.bI "
U
~ ~ ~ ~ • • .. .. ~ • " " Yo"
~dulrabl " .. .. .. :
"'<.
" ... lodlne N~mbtt 53.75 63.8& 65.18 68.44 (Lot I) (Lot I ) (Lot S) (Lot 4)
5.-Etrect of rat saturation on odor dealrabtUty ot fronn pork .

R£SLlIlCH B ULLETI N 492
Desirabil ity of Odor.- The ground pork ot Lot I had a more acceptable odor than Lota n , m, and IV. Lot I differed significantly from Loti II and m (at the ,05 level) and Lot IV (a t the .01 level).
Perox.ldes.- Fat aaturation had a pronounced effect upon the peroxide development in ground pork as shown In Figure 6 . As IIrmness of the fat deereased (or as the Iodine number increased) It became more susceptible 10 peroxide development. Lot I ground pork averaged 1.83 mllliequivalenu peroxide per kilogram at fat as compared to averag" of 2.31 in Lot II ; 3.83 in Lot m ; and 3.34 In Lot IV. There waa no algnillcant difference In per. oldde, between Loti I and II, although, Lot I differed significantly (at the .01 level) from Loti m and IV. Lot II differed .ignificantly from Lot m (at the .01 level) and from Lot IV (at the .05 level) . There was no sig· nificant difference In perox ides between Lota III and IV.
Free Fatty Aelds.- Figure 7 Bhows the etrect of fat saturation on the development of free fatty acids in frozen g!'(lund pork. Lot I dilfered slg. nifl.cantly (at the .01 level) f!'(lm Lota II . III. and IV and Lot II diffen!d .Ignifl.cantly (a t the .05 level) from Lot ITI. Although significant differ · encet: wen! found between lou tbey are small.
Deh.vdrat1on.-The n!lationahip between fat saturation a nd dehydra· tion of frozen ground pork I •• hoWD in Figure 8. As the degree of fat unsaturation increased from lot to lot. the per cent dehydration (weight 10 .. ) dec reased. This finding was entirely unexpected since there Is no mention made In the literature to the effect that a relationahip should exist between fat saturation and dehydration. Part of the difference. in per cent dehydration between the lou may be accounted for by the differencein chemical composition of the ground pork as .hown in Table 4. Lot I ground pork contained 44.7.5% moisture ; Lot IT. 43.8.5%; Lot m, oW.40%; and Lot IV, 41.93 %. It i. relUlOnable to uaume that ground pork sam· pies containing the moat moisture would lose the mGet moisture. Lot I dif· tered .ignificantly (at the .05 level) from Loti nand m. A licnillcant dlft'erence in the per cent dehydration (weight Ion) was found between Lot. I and rv (at the .01 level).
In th!. Investigation. fat saturation had a Significant effect on raneld· ity development in ground pork. AI> tbe unaaturatlon of the fat Increased, the more rapidly it beeame rancid. Thill finding supports the work of Lea (1938), who stated that, "Sort or oily C&ITUSCII freQuently appear to be abnormally liable to raneldity ... ," and Bamlcost (1930), who lound that soft pork fat became raneld very quickly. Helser (1939, 111-10) found that .. the unsaturation ot lard Increased, the mOn! rapidly the lard deteriorat· ed. Brady, Smith, and Tucker (1946) reported that aolt fats of cured pork were more .ubject to oxidative de terioration or raneldity than hard fata.
2. Packaging !\laterlal E tI'eoctB Two types of packaging materiala were tested in the ground por k
studies. The laminated paper because ol itl low moisture·vapor tra.namLs· alol1 rate was conaldered an acceptable packaging material whereas the waxed paper had a higher moillture·vapor tranam.luion rate and Itl deslr. ability sa a packaging material for frozen food$ waa questionable.

26
~
~
~
f'
"
r.; , ., '! -
fl.hSSOURI ACI\ ICULTUIIM. EXPERIMENT STAnON
Slptftcaaet 01 DlUuenc ... ~. ~, "''' -- •• •• "''' •• •
-- "''' ' SLcnlflcant at .05 Level
· · Sl.Jn1fIcant at .01 Level
r -
• • • • • • 5
1
1 • • • • • • • • "-¥. {odin. Nu ... ber
' SlPIil1<:ant lot .05 Leve) " S!lIIil1can! I.t .01 L ..... I
58." U.&a sua 88.'" 51.15 &!.ea '5.18 ea .... (Lot I) (Lot 2) (Lot S) (Lol 4)
F lJllre ' · · T h, ttl":l of fat II;lturaUon On ptlr_ Ollldt ~.velopment In Irazen ,round porI<.
(Lot 1) (Lot 1) (Lot S) (UI4) fipr. 'f- -The dlec! of lat s.atur:aUon on ilia
d..,. lopmeot of free fatly ~1" In lro~ ... ,round pork .
' SlpUlc&II1 at .05 L .... l ·'SIp1f1unt .. t .01 L ..,1lI.
A¥. Iod1oe Number 58.'15 n." 65.18 n.44
(Lot 1) (Lot 2) (Lot S) (LoI 4) Ftcur. B·_T" rtlaUo..ahlp bttw"" tat aatu.n.tton and
deby4nUoa of frozen VOWId por I<.

RESEARCH SUI-lETt'" 492 27
Flavor Rancidity.- FIaYor scores, graphically presented in Figure 9, indicate that the laminated paper gave much more protection against ran. cidity development in frozen ground pork than the waxed paper. There was a significant difference (at the .01 level) between average flavor scores of the ground pork wrapped in laminated paper and average flavor scores of the ground pork wrapped in wax paper.
Odor Raneldity.-The effect of packaging material on rancidity devel. opment in frozen ground pork as judged by odor is shown in Figure 10. The pork packaged in laminated paper had an average score of 3.50 whereas the pork packaged in waxed paper scored only 3.28, a difference which was significant (at the .01 level).
Desirability of Fla"or and Aroma.- Figures 11 and 12 show that the desirability of the flavo r and aroma of ground pork wrapped in laminated paper was signifi cant lY (at the .01 level) superior to that wrapped in the waxed paper.
Pcroxides.-In Figure 13, it will be noted that ground pork packaged in the laminated paper had an average of 2.44 milliequivalents peroxide per kilogram of fat, while ground pork packaged in the waxed paper had an average peroxide value of 3.22. Thus the packaging materials differed significantly (at the .01 level) in ability to retard peroxid'e development.
F ree Fatty Acids.- It may be seen in Figure 14 that packaging material had no significant effect on free fatty acid development in frozen ground pork .
Dehydration.- The effect of packaging material on the dehydration of ground por k for all storage treatments is shown in Figure 15. The ground pork packaged in the laminated paper was dehydrated an average of 0.61% at the time it was removed from storage whereas ground pork wrapped in the waxed paper was dehydrated an average of 3.06 %. This difference was signifi cant (at the .01 level) and could readily be de termined from the appearance of the meat.
Ground pork packaged in the laminated paper differed significantly trom the ground pork packaged in the wSJI:ed paper. The pork packaged in laminated paper was superior in Bavor and aroma; peroxide values were lower; dehydration was less. These findings are contradictory to the work of Griswold and Blakeslee (1939) who concluded that packaging materials have little effect on the palatabilit y of froMn pork.
S. Storage Tempera.ture Effects F lavor Rancidity.-The effect of storage temperature on the rancidity
of frozen ground pork as judged by Bavor is sbown in Figure 16. The most desirable storage temperature was O· F., with an average score of 3.70. The least desirable was 10· F. with an average score of 3.22. Storage at O· -10· F. weekly resulted in an average score of 3.60. Defrosting of ground pork one time lowered the aceeptab1lity of that product as evidenced by an average score of 3.39. Three defrostings of ground pork resulted in an average score of 3.27. It was interesting to note that there was little differ ence between the average scores of the ground pork stored at O· F. and the averal!"e scores of the ground pork st or ed at O· -10· F. weekly. The palatabilit y

MI S$OU ItI ACItI CULTUKAL ExPEIlIMENT S TATIO);
Norma.! ~ or S .... t
Neutrll ~ Or rl ... ,
....... , .~.
~,. • ,,~
R ..... oid ,
Pa~"" Ma.teriala OIllered Slplfu: ..... Uy a.t lIIe .01 L.vel
-
~ ~ ., ., ~ G .. ..
LamlN.ted Wued Paper Paper
r ip .. g··The elf",t o f ","e~ ",at.rial OIl. n l"" ,an<ldI..,. 01 lCOoeD IV"OUnII por I<.
Paekql"" l ..... te r lal. DUfered SiplfleanUy ... , the .01 Lenl
Desir&bll
- -
..
Packq1llc Mate . WI OIlIere<! Slplfleutly It III •. 01 lAvel
No.ma.! • Or Sw",
Nlutrll • Or ,.lat
r Sliptly , r .~.
.- • ~ • . , .. .. " .. .. , .. .. .,~
R ..... cld
Lam/U'N Wued Pape. Paper
~ 10_· n.. I ft .. t 01 pooekqlnc material On "odor r aneldl..,. of Iro"D 'IOtmd porI< ..ore<llc. elx and ntne ",,,,,1111
Pa.ctaatnc Mallr WI Difiore<! SlplfIeanUr .. lb •. 01 Lov.l
De.lrable
t'-r r
Undninbl 'I> .. .. .. .. • .. • •
. , . .", Very "! V' ''T
Undealrabl'"''--_"~''~;:;;--;t,''~;-__ ' Und.llubi " .. .. .. . Lull ... ,.... WUN
Pape. P ... pe. ".., .. 11·_TIw err .. , 01 po.~ ...... terial OA
fluo r dell .... blllty oI l.oze<t ,round pork,
.. I. ... mh .. '.-I W~
Paper Paper "cu." 12--Th •• ft.et 01 pecltaJ!nl_Irtll
OA odor d uirabliity of fro .... , round pork.

RESEARCH BUI.L£Th..- 492
PackllglnlO Mater ials O!fiertd No Slgnll!ean! Oilierence Bet_en s!gnlficantly at tile .01 Lev,,1 PackltJlnlO Material.
• &
• " • ~
-r ,-
~ -
0 " " " "" 0 0 ., • • ., • " • " • " N
• • ~ -• 0
w_ Laminated ed Lam!nated Pa l>"r Pal>"r Paper Paper
I' IJUu 13 --T~e eUect of paCkll101ni outerlal on peroxide development in I .... zen g r Ollnd p:;>rk.
Fi",re H __ T he effect 01 packllglng ma_ terial on the deoelopment o l lru fatty aCids In Iroz<:n vo~nd pork.
•
~ 1 • • ~ " Q ,
1 • 0
• • • ,
•
P aclo>i:\ng Malerlala Dillere<! Slpllleantly at the .01 Level
• • 0 ., ., - • • ,e- N
Laml .... ted P aper Paper
F~re 15 --The elleet of packaelne m aterial on the dehydration of lrozen ground pork .
29

30 MISSOURI ACRICULTURAL EXPERIMENT SUTtON
of the ground pork stored at O' -lO' F. weekly was expected to average more nearly between the average scores of the ground pork stored at O' F. and lO ' F, Ground pork stored at O' F. was significantly superior (at the .01 level) in fl.avor to the ground pork stored at IO' F" one defrosting and three defrostings. There was no significant dlfference between O· F. storage and storage at O· -lO· F. weekly. Storage at IO"F. differed significantly (at the .01 level) from storage at O· ·IO ' F. weekly and one defrosting. There was no difference between lO"F, and three defrostings. Storage at O' ,lO' F. weekly was significantly (at the .01 level) superior to the storage treatments of one defrosting and three defrostings. Ground pork defrosted onc time was significantly (at the .05 level) less rancid in flavor than the ground pork defrosted three times.
Odor Ra ncldity.- The effect of storage temperature on the rancidity of frozen ground pork as judged by odor is shown in Figure 17. According to average odor rancidity scor es, O· F. was tbe most desirable storage temperature with an average score of 3.50. The least desirable storage tern. perature was lO· F. with an average score of 3.28. The average score of ground pork stored at O' -lO' F. weekly was 3.49. One defrosting and three defrosting!! were deleterious to the acceptability of ground pork as evidenced by average scores of 3.37 and 3.29. respectively. Ground pork stored at O· F. was significantly (at the .01 level) superior to that stored at lO· F. There was no significant difference in degree of rancidity between ground pork stored at O· F. and O· -lO· F. weekly. Storage at O· F . was significantly superior to one defrosting (at the .05 level) and three defrostings (at the .01 level). A significant difference between the rancidity of ground pork stored at lO· F . and O· -lO· F. weekly existed at the .Ollevel. There was no significant difference in the rancidity of the ground pork stored at lO· F . and that which had been defrosted one and three times. The 0· ,10· F . weekly temperature differed significantly from one defrosting (at the .05 level) and three defrostings (at the .01 level). There was no significant difference between defrosting one and three times.
Flavor Desira.bili ty.- The effect of storage temperature on flavor desirability of the frozen ground pork is shown in Figure 18. Ground pork stored at O· F. was most desirable in flavor with an average scor e of 2.78. The least desirable flavor was found in ground pork stored at lO· F. with an average score of 2.40. Average flavor desirability scores of ground pork stored at O· -lO· F. weekly, one defrosting and three defrostings were 2.68, 2.53. and 2.46, respectively. Storage at O·F. was significantly superior (at the .Ollevel) to storage at 10· F., O· -lO·F. weekly. one defrosting and three defrosting!!. Storage at lO· F. differed significantly (at t he .01 level) from storage at O· -10·F. and one defrosting. There was no significant difference between three defrostings and lO· F . Storage at O' -10· F. weekly differed signiflcantly (at the .011evel) from the storage treatments of one defrosting and three de!rostings. There was no significant difference between one defrosting and three defrostings.
Odor Desirablllty.-The infiuence of storage temperature on the odor desirability of frozen ground pork is given in Figure 19. Differences be-

RESEARCH BULL~nN 492 31
No.",alor S .... t
Neutral or Flat
SUIJhUY Rucld
Rancid
Yo" Rancid
*stpflcanl al .05 Le vel **SlgnifiO&llI al .01 Lev.l
OOr. IDe- 3De-Wkly. frost. frolt.
r1il>ro l& -_The eflecl of ato rag. tempe .... tu .. 0l'I navw rancidity of f,..,un ,round pork.
Acceptabl.
*Slpl.f10&1l1 al .05 Level **SlpI.f1cant o.t .01 Level
e • " • -- •
O"F. l oCF 0_100 IDe- 3 DeWkly. troSt. Il"I»t.
Figure IS--noe elfe.t of storage le",pera=. 00 navor duirabllity of fro%en ,roWld pork.
Normlll. o r S ...... I
Neutral or no<
SHIJhUy ,~.
*SlpI.f1c""t at .05 Level ··SIif\Ifi.""t at .01 Llvel
1000r.0-IO" IDe- 30.-Wldy. frolt. 1,..,11.
F!g\lre 17 __ The eHeCI of ltorage te",peralUre on odor ranCidIty of f,..,zen ,,..,und pork atored for sl.:l and. zilile montha .
DeSirable
~
*SJ&nllicant al .05 Llvll · **Siplfi.""lo.t .01 Levd
• " ~ • ., • • •
oCF. lOOF.O-IO" I De_ 3DeWkly. troll. froat.
FIgure li--noe elfett of storage t."'pe .... =. en cdcr delltral>illty of f.""en ,rwnd porI<.

32 M1 SSOUltl AC~ICULTUIUI,. UPf;R1MENT STATI O:'>
tween the odor duirablUty of the ground pork lI tared at the various atoraie temperaturell were very . mall. Storage at O' F . differed airnldeantly from l O' F . ( at the .~ level), one dermating (a t the .05 level), and three defro.tInga (at the .01 level). There WM no signiftc&nt difference between O· F. and O' -l O' F . weekly, although, l O' F . di ffe red slgnlftcantly (at the .015 level) from O' · I O' F , weekly. There wu no algnifiCalI t difference det ectable by odo r between ground pork stored at lO ' F. and one and th~ defrosting&. Stanic al O' , IO' F. weekly dlft'ered alJ'lllftcantly (at the .0:5 level) (rom three defrosting.. There was no significant difference between one and three defrosting •.
Pe roxide!l.-T he elfect of atorage temperature on peroxide formation in frozen ground pork ill shown in Figure 20. Ground pork noted at O·F . contained 2.17 milliequivalent. peroxide per kilogram of fat whe~8.lI ground p(lrk !tored at 10' F . con tained 4.21 milliequivalent.. Ground pork stored at 0 ' ·10' F. weekly contained 1.89 mil llequivalen ts peroxide per kilogram of fat and ground pork with the s t orage temperatu~ treatment of one and tbree defrostinp had 2.39 and 3.48 mllllequ\vslenu, respectively. In peroxide values, O' F . differed significanUy (a t tbe .01 level) from 10' F _ and three defrostings and lO' F. differed significantly (at t he .01 level) from O' -lO' F . weekly and one and three defrosting!. Perox ide va lues on ground pork atored at 0 · -10' F . weekly differed aignl1leantly from the peroxide values of ground pork with the storage temperature treatment of one defroaUng (at tbe .015 level) and three defrostings (a t the .01 level). A aigniflcant difference (at t he .01 level) e" lated in the peroxide values of the ground pork stored with the storage temperature treatmenU of one de· frosting and three defroatlnga.
Free Fatty Aeids.- The influence of atorage t emperature on the devel· opment of free fatty acids In ground pork is presented in Figure 21. The solvent extracted fat of the ground pork atored at O' F. contained 0.151 % free fatty acid whereas the fat of the ,round pork atored at 10' F. contaln.ed 0.71 % free fatty acid. The free fatty acid contained in t he fat of tbe ground pork stored a t O' ·IO· F. weekly, one defroating and three defr06tinp was 0.i52 %, 0.i5i5%, and 0.80 %, respectively. T here was no algnifieant dUference between the free fatty acids of t be ground pork atored at O' F . and O' · IO' F . weekly. All othe r diffe rences between at orage temperatures or temperature treatment. in percentage of free fatty acid In the extracted fat of t he ground pork were significan t a t the .01 level.
Dehydratlon..- Flgure 22 , bows the e ffect of storage temperature on the debydration of froun ground pork. The dehydration of the ground por k stored at O' F. was 1.47%; at 10' F., 2.21% ; and at O' · lO"F. weekly, 1.32%. Debydration was 2.0.5% in ground pork defrosted one time and 2.13% In ground pork defrolted three times. A slgnillcant difference in per cent dehydration was found between the ground pork atored at O' F. and 10' F. (at the .01 level) , 0 · ·10' F . weekly (a t tbe .0.5 level), ODe defl'Ollting (at the .01 level) , and three defroatinga (at the .01 level). Storage at 10' F . differed lignlficantly f rom O' · l O' F . weekly (at the .01 level) Ind one de· frosting <at the .0.5 level). Storage a t O' ·10' F . weekly differed lIign ificantly
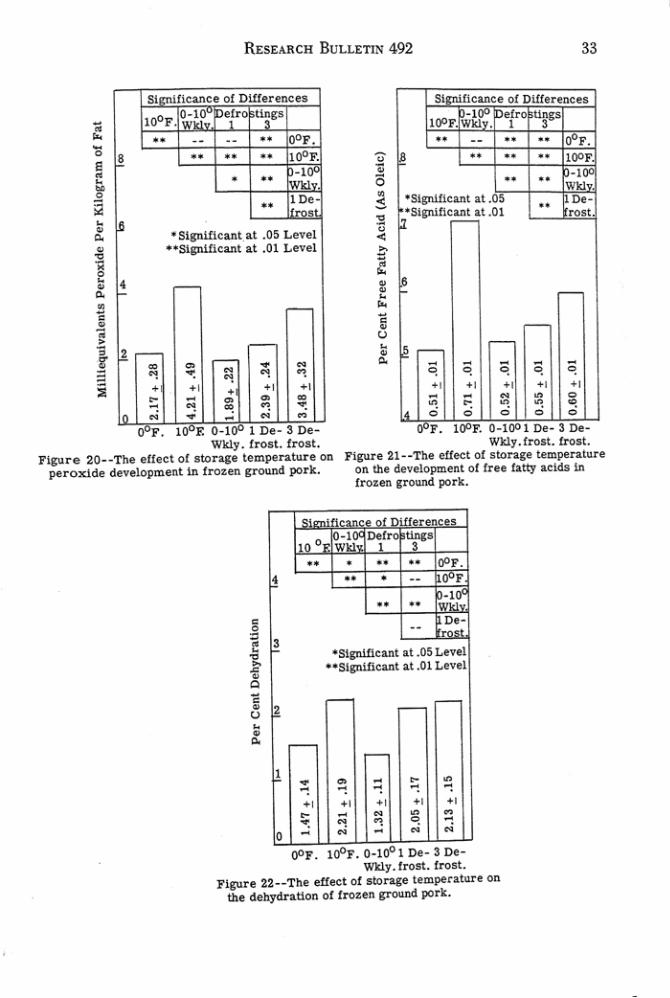
R £SEARCH B ULLETIN 492
' Slgnlf!cant a.t .05 ·'S1gn1llcant .. l .01 Level
Wldy. frost. frost. Figure 20- _The ef(ect 01 81Or>-ll8 te.nP<'r.l.ture on
peroxide development In froun groo.nd pork.
Figure 22 __ Tho the dehydrat10n of frozen
33
••

34 i\hSSOURI A CRICULTUIlA L ExPtRnf£NT STAno~
(at the .01 level) from one defrosting and three defrosting', There wu no s ignUl.cant difference of the pen:entage dehydration of the ground pork defrosted ODe and three times.
Storage temperature had a very s ignificant effec t upon the development of rancidity in ground pork. Novikova (1931), Klermeir and H eiss (1939), and Cook and White (1941 ) showed storage tempera ture to be a primuy factor governing the development of rancidity In frozen pork.
Zeigler, Miller and Christian (1950) found that unsea lOned II&taaa:e would remain edible for six months at lO· F. and for a slightly longer period at O' F.
Work of thil study brought out that lO"F . wu quite Interior to O' F.
Temperature fluctuations and defrostlnga had a pronounced deleterious e~ect on the storage life of ground pork according to chemical and organoleptic data. Desiccation wu exceasive and deteriDration rapid in t he ground pork otond at the 0· -10· E. weekly, 1 defrosting and 3 defro.tings compal"ed to the ground por k stol"ed a t O· F . The views Df Woodroof (1938), Guest (1939), and Christensen (19{S) in no. case accompanied hy evidence and the results of Black 's (1945) study Dn the harmful etfe<:ta of temperatun ductuation and product def rosting an supported by chemical and organDleptic da ta Df thill inveatlgatiDn.
KlDle, H anson, and L ineweaver <19!W) concluded, however , that n peated thawing and refree:cing had little etrect Dn the qua \!ty of turkey ateaka from their at udy in wbJch turkey s t eakll wen defrosted five timea and Dtberwille stDred a t O· F. fDr { and 8 mont h$!. It would be difficult to reconcile the tindinp Df thit atudy with conslderatiDn Df the dltfennces Df the two. producta. in turkey and pork.
4. Length ()f Storage E1fecUJ
Fia"()r Rancldlty.- T he effect Df stDrage Dn rancidity Df froun ground pork as detected by davDr may be seen in Figun 23. Afte r 3 mDnth$! ator age. the gr ound pork had an average flavor rancidity acore Df {.OS; after 6 montha, 3.38. and after 9 mDnths, 2.88. The davDr Df the ground pork atDnd 3 mDnths was aigniBcantly superiDr <at the .01 level) to the davDr of the JI"Ound pork which was atored fDr 6 Dr 9 m Dntlul. A IIIgnifiea.nt diff erence In HavDr rancidity exillted between the ground pork ato red 6 and 9 montha with the 9 mDnths g.round pork being the most rancid in Bavor.
Odor Rancldity.- The Intluence Df ato rage Dn the rancidity Df ground pork as detected by odDr ill given in f'iI'ure 24. Odor rancidity was not nDted in the ground pork atored Dnly 3 mDnths and. thenfDre. It I.s not included in Figure 2{. The ground pork which had been stDred for 6 monthl was significantly <at the .01 level) 8uperiDr in odor to. the ground pork which had been ItOred 9 mDot&". Ground pork ltored. fo r 6 mDntlul had an average rancidity score of 3.60 aa CDntrlUlted to a score Df 3.18 fDr the ground pork which had been ItDred 9 mDnths.
F I" 'or DesirablJlty.- The influence of atorage Dn the dellrabllity of froun ground pork .. detected by flavor Is given in Figure 25. Ground

N.utral or , tu
SllpU, Rancid
RESEA RCH BULl. ETlN 492 35
J)Uf1. _, SlpUICUlt "' u.. .Ot
· SlpUlc .... t II .M LHfIi " Slpiflc:llIt at .01 lAYll
., ~
~
~
1-
~
~.
r-
,-
~ ~ ., ., 0 • • -
"",.~" l!..-l=-L_J'::l __ L"JJ VII'}' II .... " , • •
, MO. 'liD. ' MO. SIO'", Stot.,.. Storql
FlIUT* n · ·Tht ln1l".~c. of lencth of 'torage liD /bV<l' tlJ'l<:l<!lty of frozen J round pork.
"" Uadellinbl.
· SI(l'\l1Icanl at .05 LeYOl " SlpUlunt AI .01 L .... I
Storage SIC ' '''' Flpre 15- -Tbe of l""lt/l o1 l\Grap ""
fi1Y1)r cIfllnbWty 01 frozell JI'OW'd po r k.
'MO. ' Mo. Stone- SIon&"
1'1 ...... 24- -Th. I.JdlQUCI of llncth o f oto • .,.. On odor uneldlty 01 fraull IroW>cI porI< .to tedl<>. all: &lad 111M """"tha ..
' SIgnl11c ... t at .05 Lenl " SI&ftlll"lUIt ot .01 Levlll
~ ~ , • • , " "
8 MO. 'MO. Sto • .,. Sto .... ,. 510.",.
r ...... 26 __ The ln1luene. of 11"J!ll 01 110.",. Oil odor dtllrabllltJ of fro .... cr<>W><I porI<.

36 MISSOURt ACRICULTURAL [xPEflIMtNT ST.<TIO~
pork stored tbree months had an average flavor desirability SCOn! of 2.9-4 whereas ground pork Btared 6 and 9 montla had average flavor delirability lCorea of 2.50 and 2.27, respectively. The flavor of the ground pork stored 3 months was aignl1l.cantly more acceptable (at the .01 level) in flavor than the ground pork stored 6 or 9 months. A significant difference existed in flavor desirabili ty of the (round pork stored 6 and 9 months.
Odor DesJrablllty.- Figure 26 shows the eft'eet of storage on odor de· .Irabillty of froun gn;Jund pork. Average flavor aeores were 2.90 fo r the ground por k stored 3 months; 2.75 for tbe ground pork stored 6 months; and 2.M for the ground pork stored 9 mont h.. A significant difference (at the .01 level) exated betw~n the average lIavoI' scores of all storage pe_ ri""_
PeroJddes.- Peroxlde development In frozen ground pork during ltorage il shown in Figure 27_ Peroxide values for the ground pork atored 3, 6 and 9 montha were 1.20; 2.1!i; and !i.22 mlHiequlvalent.a peroxide per kilo_ gram of fat, respl!(:tlvely. Peroxide values for the ground pork uored 3, 6 and 9 months differed .lgni1l.eantly (at the .01 level).
Free Fatty Aclds.- The development of free faUy acicb In frozen ground pork i. shown in Figure 28. Average free fatty acid values were 0.!i1 % for the ground pork atored 3 month,: 0.!i9% for the ground pork ,tored 6 montha; and 0.&8 % tor the ground pork _tored 9 month.. Average tree fatty acid value. of ground pork stored 3 months differed _Ignitl. cantly (at the .01 level) from average free fatty acid values of ground pork atored 6 and 9 month,. A aignitlcant difference (at the .01 level) exiated between the ground pork atored 6 montha and 9 months in percentage tree fatty acids..
DehydratloD.- The dfect of length of atorage OD the dehydration of frozen ground pork ia presented in Figure 29. Alter 3 montia .torage, ground pork had dehydrated 1 .07%. Alte r 6 months atorage, dehydration waa 1.96% and after 9 months, dehydration was 2.49 %. In percentage dehydration,3 months storage differed slgnlftcantly (at the .01 level) from the 6 or 9 months atorage and 6 months storage differed s ignitlcantly (at the .01 level) from the 9 months storage.
5. F1rst Order Interactions
Aa pointed out previoualy, the ground pork of each of the four Iota of the e:o::periment W&I wrapped In t"'·o packaging materiala and atored U O· F., O"-lO· F. weekly, lO"F .. one defrosting and three defrosting. for periods ot 3, 6, and 9 months. The laminated paper W8-1 considered an aceeptable packaging material tor the packaging of frozen meata, but the waxed paper waa considered a questionable material. At the time the experiment was designed, it was considered entirely pouible that lot differencea in keeping quality might not be detectable if the ground pork was packaged in a rna' terlal tbat was such an etfective barrier that it would minimize deterioration. Furthermore, it was considered po8llible that lot differences In keepIng qualities might not be detectable it ground pork was packaged In a material tbat wu such an ineffective barrier that it would offer only Blight

RESEAlICH B ULLETIN 492 " , • , •• ••
I •• "Sipl1ICUlI at .0' L ... e1
• " SIp1fIcUlt at .01 LIOnI
l
~ • • • • • -, .,
I 0
" -•
3 M o. & M O. g M O. 510.",' SID..." seo.",e
"!pra 27 · ·Tha a Uect 01 I'~ of ato...,a on peroxide dnelopmcnl In troUII IJ"OIInd port.
" , S • $
~ <
~ • • • , • 0 • l
' Slp;ltlc&tlt at .O~ Level ooSlllllflc&tl1 a l .01 Leyel
S Yo. • Mo. g lola. Sto...,a seo..... SCotace
F~e 28·-Tha Iftfluuce of lencth of ator",' OIl the development of free latty acid, 111 frozen 1' 0I1tId jXltk.
' Slp1f1o:a.n.t at .O~ 1...-.1 " SIplfIC&llt at .01 Leftl

38 M1UOURI ACII1 CULTU'U.L ExPtll.lMtNT STAno:\"
p rotection qaiDat deterioration. It waa ~UODed that it all ground pork kept well [n frozen 'torage ... a >uult ot a good packaging material or if all ground pork deteriorated to an. Inedlble point 8.lI a reau!t of a poor pack. &&Ing material, the etl'ect of tat saturation on keeping quality, If there wu a real ,,!'fect, .... Quld not haVI! an. o pportunity to develop. Therdore, the packaging mated.la were .elected amoDg commonly used material. with ~ point of view.
Since two vllrlablea may have independentJy and almultaneously Inllueneed the .eeeptablUty of the ground pork, it ""u de.irable to determiDe not only the dfect of each variable but al60 whether or not the two fa«on complimen ted each other by ealeuluhlg flnt order Interactioru:.
Sa. F at SaIU....uOD and r ad tl.c1ng Mate rials
F1avof Ra.ncldl ty.-The drecta of fat aaturation and packaging ma terial on the llavor rancidity of frozen ground pork are inphlc:ally preaented In Ftgure SO. It wu noted that while llavor rancidity ~o:ea declined with an Increa" in iodine number, regardless of packaging ma terial, the decline wu greatu t in the ground pork pu kaged in the waxed paper. The lint order interaction bet .... een fat llatuntlon and pukaging material wu not algnil!cant which meara Wt the lum of the elfect. of the two facton, fat ISatu ration and packaging material, wu lufllcient to account for practically aU of the variability in flavor rancidity scorea. In Lot I , the ground pork packaged In the lawnated paper bad an average flavor rancidity score of 3.79 and the ground pork packaged In the waxed paper had an avenlge .core of 3.117; the scorea differed algnificantly (at the .05 level). A algnlficant dif. ference (at the .Oli level ) wa.a (oWld between packaging materla.la in Lot n with the pork packared in the laminated paper having _ score of 3.59 and the pork packaged In the waxed paper having a 5COre of 3.36. PackaSing ma~ dilfered .Ignill.cantly (at the .01 level) in Lot. m and IV. In Lot ill, the ~und pork packaged in the laminated paper had an average IlCOre of 3.:18, whereaa, the ground pork packaged in the waxed paper had an aver· age IlCOre of 3.16. In Lot IV, the pork packaged In the laminated paper bad an average !ICOre of 3.41 u compared to 3.01 for the ground pork packaged in the waxed paper.
Peroxlde..-The Influence of fat aaturation and packaging material on peroxide development in frou n ground pork it .hown in Figure 31. Fint order interaction bet .... een fat aatuntion and packaging material wu inalg· nUlcant. In Lot t , the control lot with an average Iodine number of 58.7:1, there was no significant ditrerence between perol<ide values of the ground pork packaged in the laminated and the WlU<ed paper. Ground pork pack· aged in the laminated paper contained 1.67 milliequivalent. peroxide per kilogram of tat, whereas, the pork wrapped In the WlU<ed paper contained 1.99. Lot n ground pork with an average Iodine number of 63.68 contained 1.83 milliequivalent. peroxide per kilogram ot rat when packaced in the laminated paper and 2.79 " 'hen pack_Sed in the waxed paper ; a aigni.llcant dift'erence (at the .0!5 level) was found between packaging material. In Lot n The cround pork of Lot m, with an average iodine number of M.18

Normal or_t
Ntutral Qr FlU
Slightly RiI.I>cld
BetWiOtn Pac~ Mlteriall In:
~" "" , ~" ~"
D .. t .... ble
Acceptable
UJldealrUle
VO., UIIoCI •• lrabi.
RU[ARCH BULLETIN 492 39
Level of SlJnlftcance
." ." ." ."
: SlpLficance of Dillereacel , Betwn n PacbCini Ltyel of , Material, In: Significanci • ... , • J ~ ... , ." • ~" ." • ~" ." t • • • • ~ " " - , . ! -"I . ! :; • • . ' , • • "'!~ ., • • ., ., • • • •• - ~ .. • • !"! ,
! " •• • - , , • " • ~ ] • H • , , , 1 ~ ,
~ . j ! ! l ' ~! = -. • ' , • h j.
Ay. 100din Number U .1S &3.81 55.a SI.~
(Lot 1) (Lot 1) (Lot 3) (Lot 4) FLflUU '1- -Tile Influence of f.t aatlluliM
and pacl<q:l"l muerla! on per<;l:lid, cItyelopmnt In 11"01:"" (round porI<.
SlplllcanCt of DtlferellCti
I :.~,.c:;:;:.~~ Ltvel Oof Sipl!!ca"ee
Co" ~" Lot 3 C.O
." ." ."
58.15 n,os 05.18 n.44 (Lot I ) (Lot 2) (Lol a) (Lot 4)
Flpre 32- -Tu intIuence of (at latu.ratioa and pac.k&(lQc material Oll a .... !)r dtl irabl.lllJ of fr<;l&UI rroulloCl porI<.

40 MI SSOURI AGRICULT URAL E XPERIMEN T ST"TrO.-';
contained an average of 3.21 milliequivalents peroxide per kilogram of fat in laminated paper and 4.39 miJIiequivalents peroxide per kilogram of fat in waxed paper; a significant difference (at the .01 level) was found be. tween packaging materials in Lot m. Lot IV ground pork, with an average iodine number of 68.44, contained an average of 2.98 mil!iequivaJenb pero"iOO per kilogram of fat in laminated paper and 3.69 milliequivaJents peroxide per kilogram of fat in the waxed paper; a significant difference (at t he .05 level) was found between packaging materials in Lot IV.
Fhwor Des irabllity.- T he infiuence of fat saturation and packaging rna. terial on the desirability of flavor of frozen ground pork is shown in Figure 32. First order interaction between fat saturation and packaging material wa.s not significant. In Lot I, the ground pork packaged in the laminated paper and the waxed paper had average fiavor desirability scores of 2.75 and 2.68, respectively. There was no significant difference between the packaging materials in Lot I. In Lot II, the ground pork packaged in tbe laminated paper "and the waxed paper scored 2.66 and 2.50, respectively, and differed significantly (at the .05 level). Tbe ground pork of Lot III had an average fiavor desirability score of 2.7I when packaged in the laminated paper and 2.40 when packaged in the waxed paper. A significant difference (at the .01 level) wa.s found between packaging materials in Lot III. In Lot IV, the ground pork packaged in the laminated paper scored an average of 2.58 in desirability of flavor and the ground pork packaged In the waxed paper scored an average of 2.26. A significant difference (at the .01 level) wa.s found between packaging mater ials in Lot IV.
5b. Fat Saturation and Storage Temperature
Flavor Rancidity.- The effects of fat saturation and storage temperature on the development of rancidity, a.s detected by flavor, of the frooren ground pork are presented in Figure 33. First order interaction between fat saturation and storage temperature was not significant. Only the data of the g round pork stored at O· F., 10· F ., and three defrostings are pre. sented in Figure 33. It may be seen from this figure that the keeping qualities of the ground pork at a given storage temperature were influenced by the degree of fat saturation. The ground pork of Lot I had an iodine number of 58.78; Lot II, 63.68; Lot III, 65.18 ; and Lot IV, 68.44. At O"F. storage, the average flavor rancidity scores were: Lot I, 3.99; Lot II, 3.73; Lot III, 3.58; Lot IV, 3.51. Lot I differed significantly from Lot II (at the .05 level), Lot III and Lot IV (at the .01 level). Lot II differed significantly (at the .05 level) f rom Lot IV in degree of rancidity as judged by flavor. At 10"F. storage, Lots I, II, III, and IV had average flavor rancidity scores of 3.58, 3.23, 3.12, and 2.93. Lot I ditfered significantly (at the .01 level) from Lots II , III, and IV and Lot II differed significantly (at the .01 level) from Lot IV. At t hree defrostings, average flavor rancidity seores were: Lot I , 3.54 ; Lot II, 3.29; Lot ill, 3.17; and Lot IV, 3 .08. Lot I di ffered s ignificantly (at the .01 level) from Lots III and IV.
PeroJddes.-The influence of fat saturation and storage temperaturea on peroxide development in frozen ground pork is shown in Figure 34. First

N .... tral or Flal
Rancid
perk,
StpUlcaIIc. of DlUe._
rPF. Storace--B,I_a I..oc.t
I aM 2 .05 I and, .01 I :oDd 4 .01 ~ ... d 4 .OS
l()1>F. Storage--Between Lots ,
1 and 2 ,01 i I aDd.! .01 l w4 .01 2 &Ad. .01
S Odl'Olliinp-Betw_ Lots ,-, ,- ,
Acceptable
alpifie""'" 01 DlU,rtnc •• rPF.Slonp--
Bet_Lots I and 3 .05 1 and . ,0$
10"' . SIorap--811_ ... Lots
l&nllS .05 1&nd 4 .01 2 >nd 4 .O~
3 O,Ir<lst!nl:s- · 8ttween Lolol
I I.IId S .05 I and ' .01 :land 4 .01 Sand 4 ,05
A 'f. IodiDe No. Loll--sa." Lol 2·-63." Lot '--tUB Lol 4·..u.44
." ." ."
." ." ." ."

42 MTSSOlllI1 A CRICULTUIIIIL ExP£RIH £NT STATlG:"
orot r inte raction between rat aaturaUon and atorage temperature was not lignifleant. At O· F. atorage, Leu I. II, m , and IV contained 1.08, 1.89, 2.82, and 2.90 milliequlvalents pen»:ide per kilogram of fat, reapectively. A a.lgnl1I.eant ditre rence ( at the .01 level) wu found between Lou I and ill and I and IV. Lot II differed significantly (at the .05 level) from Lot IV. At lO"F. storage, Lots I, II , m , and IV contained 3.03, 3.10, 15.l53, and 5.14 milliequivalenu peroxide per kilogram of tat, reapecUvely. Lot I dif. fered a'rnl1lcan.tly (at the .01 le~l) from Lota m and IV and Lot II differed aigniflcantly (a t the .01 level) f rom Lots ill and IV. At three de. froet\np. Lola t , II, m , and IV conWned 2.41, 2.94. 3.79, and 3.36 milUequivalent8 peroxide per kilogram of fat, respectively. A aignidcant differ. ence (at t he .01 level) existed between Lots I and m .
F lavor Deslrablli ty.- T he influ ence of fat satura tion and I torage temperature on the desirability of flavor ot the frouD ground pork il given in. Figure 315. Regardlea of !ltorage temperature, the aeeeptability of t he ground pork declined u the degree ot fat u.turation decreued_ At O· F . • torage, Lola I , II , m , and IV had average flavor deJ5irability BC(lres of 2.90, 2.715, 2.73. and 2.72, respec tively. Lot I ditrered significantly (at the .05 level) f rom Lola m and IV. At 10"F. $toraa-e, Loa I, II , m , and IV had average !lavor delirability scorel of 2.57, 2.43. 2.36, and 2.2.5, respectively. Lot 1 differed algnitlcantly from Lot m (at the .O!i level) and Lot IV (at the .01 level). Lot II di.ll'ered Ilgniflcantly (at the .015 level) from Lot IV. At three defl"i)sUngs, Lola I, II, ill, and IV had average flavor desirability scoree of 2.63, 2.48, 2.415, and 2.26, reepectively. A algnificant difference wu found between Lola I and ill (a t the .0:; level ) and Loti! I and IV (at the .01 level). Lots II and IV di.ll'ered significantly (at the .01 level ) and Lots m and IV differed algnificantly (at the .O!i level).
~. Fat Sa.turatiOD and Length of Storage Period
Flavor Rancidity.-The influence of fat saturation and leng'th of storage period on the rancidity of the flavor of frozen ground pork is presented in. Figure 36. Fint order interaction between lot and lltorage period WIJI
aigni1l.cant (at the .0.5 level). This aignlficant firat order interaction mean, essentially that !5Ome Iota deteriorated more during , torage than what could be attrihuted 10 the Bum of the !lingle e.ll'ects, fat aaturaUon and length of ltorage.
Average Iodine numbera for Lola I, II, ill, and. IV were 158.715, 63.68, 65.18, and 68.44, re!lpectively. Alte r three monthl storage, flavor rancid· ity !lcorea for Lots I, II, ill, and IV wer e 4.20, 4.07, 3.89, and 4.02, Te!lpectively, whereu after 6 months storage, the flavor rancidity Bcorea of Lou I, II, ill, and IV averaged 3.66, 3.39, 3.153, and 2.96, reapectively. It appeara that the ground pork of Lot IV WIJI luperior to that of Lot m after 3 months lltorage, and that Lot ill ground pork WU luperior in flavor to the ground pork of Lot II after 6 month. storage. Yet in. neither cue were these differencea significant. Afte r 9 months storage, average fl.avor rancid_ ity IIeOre' were 3.19, 2.97, 2.69, and 2.66 for Lou I, II, ill, and IV, respectively.

. -.--. ~ ..... . _.
R&5URClI BULLEn"" 492 43
'~b:E@tl ' . p ' ........... ... ... p._ ....... , IA"" ...... _._-_ ....... _--- ' ...... .. , ......
A"~"_ f. ...... ...... ~ ... .... I·~." ............
. ....... -................... .... ,... •.. __ ...... _ .... _ .. _-..... __ ....... --.......... .
Afte r 3 month storage, ground pork 01 Lot I differed signlfleantly lrom Lot m (at the .01 level) and Lot IV (at the .O!S level). Lot II dl!, lered significantly (at the .O~ level) from Lot m. After 6 months s torage. the ground pork 01 Lot I diJfered signill.ca.nUy (at the .01 level) from Loa n and IV and Lot m cWrered lignificantly (at the .01 level) from Lot IV. Alter 9 montha storage. the ground pork 01 Lot I differed aignitlcantly (at the .01 level ) from the ground pork of Loa m and IV. Lot II cWrered

44 MISSOURI AGltlCULTtlIlA L UPt ltlMENT S T .. n O:-1
s ignificantly (at the .05 level) from Lots III and IV. There WIUI no aignUl.cant dlll'erenee between Lob ill and IV.
Perondes.- The influence of rat saturation and length of Ito rage ~_
riod on peroxide development In frozen ground pork ia shown by Figure 37. Firllt order interaction be tween rat aaturatlon and length of ltorage WIUI ,ignificant <at the .01 le~l). Alter 3 months I torage, Lot 1. n , ill, and IV contained an average of 0.46, 0.99, 1 .511, and 1.37 mi lliequivalent. peroxide per kilogram of fat, reape<:tively. Alter 6 monttt. ato rage, Lot. I, II, m. and IV contained 1.82, 2.04, 2.6:5, and 2.10 milllequivalents peroxIde per kilo_ gram of fat, relpectively. The ground pork of Lolli I. n. Ill, and IV after 9 IIlOnths atorat! contained 3.20, 3.91, 7.25 and 6.22 milliequiva lenta peroltide per kiiorram of fat , rupeetlvely. Lot ill bad It higher peroxide value than Lot IV after 3, 6, and 9 months atorage. No reasonable explanation is available for this ob3ervatlon.
Atter 3 mont ha stora&e, Lot I differed significantly (at the .01 level) from Lota ill t.lld IV. Alter 6 months storage, Lot I differed slgnllicantiy (at the .0:5 level ) from Lot ill. Atter 9 months storage, LotI di ffered sig· niflcantly from Lot n (at the .0:5 level) and Lota III and IV (at the .01 level) and Lot ill differed sipilleantly (s t the .0:5 level) from Lot IV.
Deslrablllty of F1&vor.-The Influence of fat .. turation and le~ of storage on th.e deam.bill ty of flavo r of frozen gro\lnd pork is s hoWl! in Fig. ure 38. Flnt order interaction be tween fat uturatlon &.lid storage period was aignl1leant (at tbe .05 level). The ground pork of Lots I, n , In, and IV had average tlavor desirability scores of 3.06, 2.98, 2.87, and 2.89. reo spectively, ..ner It had been ltor-ed for 3 months. Alte r 6 months storsge. average flavor scores were 2.6:1 , 2.47, 2.64, and 2.2:5 for Lots I , n , ill and IV, respe<:tlvely . Ground pork of Lots I , n , Ill , and IV after 9 montha storage had average tl&vor desirability scores of 2.47, 2.35, 2.1:5 and 2.11, respectively. Lot I differed significantly (at the .0:; leve l ) f rom Loll m and IV at 3 montha. Alte r 6 months storage, Lot I di ffered Bignifleantly (at thfl .0:5 level) from Lot il and from Lot IV (at t he .01 level ) , where .. , Lot n differed aicn1fleantly (at the .0:5 level ) f rom Lot III and f rom Lot IV (at tbe .01 level). Lot III differed Ial&nifleantly (at t he .01 level) from Lot IV. Alter 9 mont ha ltorage, Lot I differed aignillCintiy (at the .01 level) from Lots ill and IV. Lot il differed. ligniflcantly from Lot III (at the .0:; level) and from Lot IV (at the .01 level) . There WII no l igni!I.cant difference between Lots III and IV at 9 monthlil.
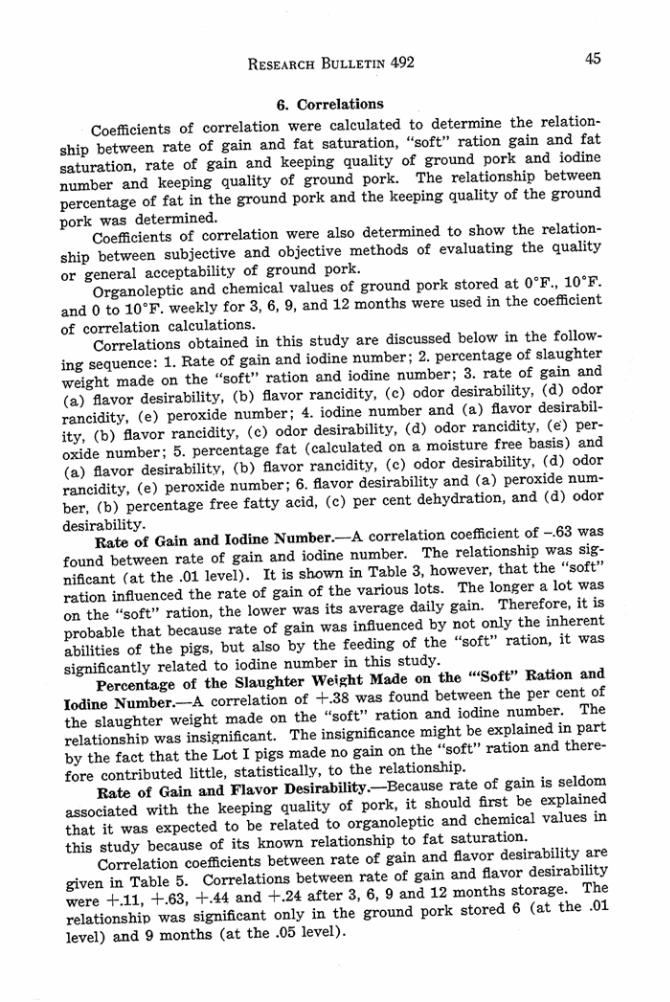
RESEARCH B ULLETI!\, 492 45
6. Correlations
Coefficients of correlation were caleulated to determine the relatlon
ahip between rate of gain and fat aatuntlon, "soft" ration gain and fal
saturation. rale ot gain and keeping quality of ground pork and iodine
number and keeping quality ot ground pork. The relationship between
pereentage of tat in the ground pork and the keeping quality of the ground
pork wu determined. Coefficients of con-elation were also determined to ahow the relatlon
ahip between ,ubjective and objective methoda of evaluating the quality
or general acceptability of ground pork.
OrgaDoleptic and chemieal value. of ground pork . tored at O' F ., 10' F.
and 0 to 10' F . weekly for 3, 6, 9, and 12 montha were ulled in the coeffielent
of eorrelation eakul.tioDI . Correlationl obtained in th;" study are discussed below in t he follow
ing IIII!quence: 1. Rate ot gain and iodine number ; 2. percentage of .!auchter
weight made on the "aoft" ration and Iodine number : 3. rate of gain and
(al ftavol" desirability. (b) flavor rancidity, (c) odor desirability, (d) odor
rancidity. (e) peroxide number ; 4. iodine number and (a) ftavor desirabil
It y. (b) lIavor rancidi ty, (e ) odor duirablllty. (d) odor rancidity, (e) per
o.xlde number; 1:). percentage rat (calculated on a mo;"ture free basis) and
(a ) Ilavor desirability. (b ) llavor rancidity, (c) odor desirability. (d) odor
raneidity. (e) peroxide number; 6. flavor desirability and (a) peroxide num
ber. (b) percentage free fatty acid, (c) per cent debydration, and (d ) odor
desirability. Rate of Galn and Iodine Number.- A correlation coefficient of -.63 was
found between rate of pin and iodiDe number. The relationahip W&!I aig
nl1leant Cal the .01 level). I t III. abown in Table 3, however, that the "soft"
ration inlluenced the rate of gain of the variOla lots. The longer a lot was
on the "soft" ration, the lower WIUI ibl average dally gain. Therefore, It is
probable that because rate of gain wu inIIueneed by not only the inherent
abilities of the pip, but also by the feeding ot the "soft" ration. it was
significantly related to iodine number In th;.. study.
Percentage of the Siaughur Welll:bt Made on the " 'Soft" RatIon n d
Iodine Number.-A con-elation of + .38 waa found between the per cent ot
the alaughter weight made on the "sol t" ration and Iodine number. The
relaUon.shlp w .. insiKnificant. The ineigrulicance might be explained in part
by the fact tha t the Lot I pigs made no gain on the "sof t" ration and there·
fore contributed little, statistically, to the relationship.
Rate of Galn and Flavor Deslrahility.- Beeauae rate of gain ;.. seldom
asaoeiated with the keeping quality of pork, it ahould finn be uplalned
that It was expected to be related to organoleptic and chemical valulI!$ in
th;" atudy because of its known relationship to fa t ntun-tion.
Correlation eoefllcients between rate ot gain and liavor deairabllity are
given in Table 1:). Correlations between rate of Cain and lIavor deairabiUty
were +.11, + .63, +.44 and + .24 after 3, 6, 9 and 12 montha storage. The
relatlonsbio waa signilieant only in the ground pork atored 6 <at the .01
level ) and 9 months <at the .05 level) .

46 MISSOURI ACRICLILTURAL ExPERIMENT STATION
Rate of Gain and Flavor Rancldlty.- The relationship between rate of gain and flavor raneidity Is shown in Table 5. After 3, 6, 9, and 12 monthlJ storage, coefficients of correla.tlon were + .05, +.69, + .54, and + .26, res~tively. The relatioDship was significant (at the .01 level) afte r 6 mont.h8 storage and (at the .05 level) after 9 months storage.
TABLE 5 -- COEFFICIENTS OF CORRELATION
r Value (Lot, Packaging Material and Storage Temp.
Groups Combl.ned) Three SiX Nine Twelve
Months Months Months Montlts
000< Odor rancidity PerOxide number
.... 11 +.05 ... 01
+.12
• SlgnUicant At .05 Level ** Signifielnt At .01 Level
... 63" +.69"* +.39 +.68" +. 11
+.44-.. . 54· ... 47" .. . 63" -.10
+.24 ... 26 +.48 ' +.50· ... 21
Rate of G&In and Odor Desira.biLity.-Coeffieients of correlation between rate of gain and odor desirability are given in Table 5. After 3, 6, 9, and 12 mOl1ths storage, coefficients of correlation were + .01, + .39, + .47, and + .48, respectively. The relatiOD.llhips were insignificant after 3 and 6 months storage, but were significant (at the .05 level) after 9 and 12 months storage.
Rate of Gain and Odor Rancldity.- The correlation coefficients of ra.te of gain and odor rancidity are shown in Table 5. The ground pork stored for 3 montha was not evaluated a.s to rancidity by odor. The coefficients of correlation for rate of gain and odor rancidity were +.68, + .63, and + .50 after 6, 9, and 12 months stora.ge, respectively. The relationship wa.s signiftC8.llt at 6 and 9 months (at the .01 level ) and at 12 months (at the .05 level).
Rate of Gain and P ero:.:ide Number.--COefficients of correlation of rate of gain and peroxide number are given in Table 5. After 3, 6, 9, and 12 months stora.ge, the correlations were + .12, + .11, - .10 and + .21. The relationships was not signifiC8.llt in any case.
Iodine Number IUId Flavor DesirabiIJty.- T he coefficients of correlation of iodine number and davor deairabillty are given in Table 6. After 3, 6, 9, and 12 months storage, the coefficients of correlation were -.24, - .56, ~48,
and -.19, respectively. The relationship wa.s si.gni.ftcant (at the .01 level) after 6 months storage and after 9 months IItorage (at the .05 level). The r elationship between iodine number and fl.avor . desirability was not signi.ftC8.llt at 3 and 12 months.
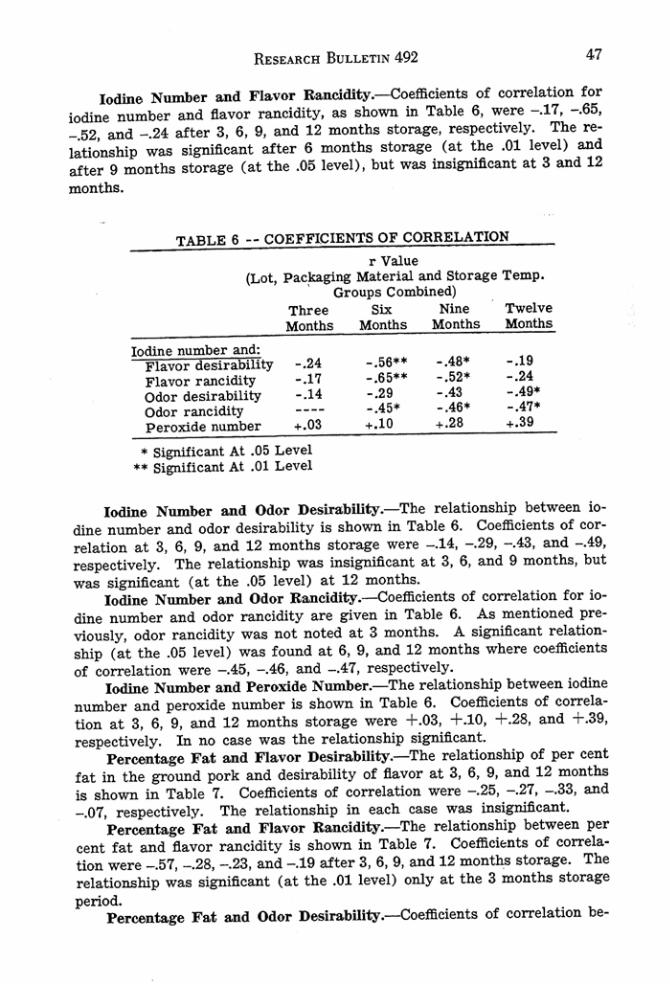
RESEARCH BULUTIN 492 47
IodiDe Number and f1.,·or Rancidlty.-Coefficlents of corrtlatian tor Iodine number and flavor rancidity, lUll ahown in Table 6, ~" -.17, -.6.5, - .ts2. and - .24 after 3, 6, 9, and 12 montha storage. "spectlvely. The relationship wu significant after 6 mont~ storage (at the .01 level) and after 9 monthl ltorage (at the .06 level) , but \I\'IUII I.n.sIgni6.eant It 3 and 12 IDOntlul.
TABLE IS -- COEFFICIENTS OF CORRELATION
r Value (Lot, p ac.kaging Material and Storage Temp.
Groups Combined) Threi! Six Nine Twelve Months Months Months Months
-.24 - .1 'I - .14
• SJ.&niflcant At .05 Level •• Slsnlflcant At .01 Level
IodiDe NllIIlber and Odor Des1rabllity.-The relationship between iodine nllDlber and odor desirability is shown in Table 6. Coetllclenta at cor· relation at 3. 6. 9. and 12 monthl storage were _.14, -.29, -.43, and - .49, reapectively. The relationship WIUII insignU'Icant at 3. 6. and 9 months. but was algni1leant (at the .Ots level) at 12 months.
Iodine Ntunber and Odor Ib .llcidity.-CoefficienLl ot corrtlatlan tar Iodine number and odor rancidity are given in Table 6. As mentioned previou.ly. odor rancidity was not noted. st 3 months. A signillea.nt relstlon· ship <at t he .05 level) was found at 6, 9. and 12 months wbere coefficients ot corrtlation were -.4!i. - .46. and _.47, rellpectively.
Iodine Number and Peroxide Number.- The re\atlOD!lhip betwei!n Iodine number and peroxide number UI sbown in Table 6. Coefficients of eorrtla· don at 3, 6, 9, and 12 mOllt~ storage ~n! +.03, +.10. +.28. and + .39. respectively. In no case was the relatiODllhip si.gD.illcant.
Peroont&ge Fa t and Flavor DesirablUty.- The relatiofllhlp of per ~nt tat In tbe ground pork and desirability of flavor at 3. 6, 9. and 12 months ill sbown in Table 7. Coefficients of correlation wen! -.25, -.27, _.33, aJld -.07, n!lpectively. The relatioDllbip in each case was inaignl1Icant.
Percent&ge Fat ~d F\a.vor Rancldity.-The relatiollllhip between per cent fat and lIavor rancidity b shown in Table 7. Coetlicitnta or correIa· tion wen! _.57. ~28. -.23. and -.19 after 3. 6, 9, and 12 moneM .tor age. The n!laUon.ship wu signifteant <at the .01 level) only at the 3 months storace period.
Percentage Fat and Odor Deslrabiilty.-Coetlielenta of correlation be·

MISSOURI ACRICULTURAL EXPtfuME~T STAnO:'1
tween per cent rat and odor delirability are given In Table: 7. After 3, 6. 9. and 12 monthl ltorage. corre:latiollll were -."5, -.18. -.30, and _.M. reo spectively. The relationship wu lignidcant (at the .05 level) only at the 3 montha period.
Pel'«lntage Fat and Odor Rancldlty.-Coetliclents or correlation of per cent rat and odor I'1U1cldity are given in Table: 7. Odor l"8.Ilcldity as mentioned previoU5ly. waa not noted at 3 montha. Correlations at 6. 9, and 12 motltha. - .29, -.27. and _.03. reapeetively, ".-ere itlalrn1ficant.
TABLE 7 -- COEFFICIENTS OF CORRELATION
r Value (Lot, Pac\r::agin&: Material and Storage Temp.
ON:lupS Combined) Three Six Nlne Twelve Months Months M onths Months
, Flavor rancidity Odor desirability Odor rancidity PeN:l:dde number
-.25 -.~7 · • -."5*
-.18
• Slgn1IIcant At .05 Level •• Significant At .01 Level
-.27 -.28 -.18 -.29 ... 15""
-.33 -.07 -.23 - .19 -.30 -." -.27 -.03 ... 13 ... 25
Percentage Fat and Peroxide N umber.-Tbe relation'hip of per cent tat and peroxide Dumber is Ibown in Table 7. Afte r 3, 6. 9 and 12 month. storage, ooeHlclenta of correlation were -.18, +.64.. +.13. and +.25, respee· tive:ly. The reLstioouhip wu ,1rn!1icant (at the .01 level) at the 6 month. period.
Flal'or De:slrablllty and PeN:lride Numbe:r._ The relatlonahlp between flavor desirability and peroxide number I, .hown In Table 8. Tbe relaUonahip 100''' insign.ill.ea.nt at 3 and 6 monthtl atorage, although after 9 and 12 monthtl atorage, a Ilgn.ill.ca.nt relationship exiated. ZeIgler. Miller and Chi'Utis.n ( ltM1O ) and Shrewsbury et at (l9f2) found no real relatinnahip be· tween palatabillty and peroxides. At 9 and 12 montha, tbe coeflleients of correlation. whieh t or the mOlt part were algniflcant at the .01 level, were too low to be used Int:erebangeably in the eV&!uation of ground pork a.a to acceptability.
Thil invO!!tlgaUon. does not IUpport the conelualon of Younlr and MaelntOlJb ( 1943) that, "The PeN:lxide Oxygen test aeerna to meaaure quanti · tatlvely tbe degree ot rancidity In the rat ."
A plauaib\e uplanation ror the low correlation between flavor and percmde number u; Indicated in Figure 39. Here the av'"'rage flavo r Icore is plotted ag9.i.ut tbe average peroxide V&!ue of the mut from four bog. for the three tuting perioo.. These bogs are from the same lot (Lot m)

~."
RUEARCH BuLLETIN 492
-' -_. -' ..... -.--~ -"' ...... _, _.-. .-,- -' .' - - ............. . ... -' ........ . .... ·r~- ·-·~ ··· · .. -
I ..•..•. •.•..
0/'--/
.-.,---.- ....• .... .-' ...... . ..... -.- , ." ," _ . .-' .... .... -' .... ... - -.- .... '!!Il"..:"-.-: ..• ......... :/. .•.......... •
-' -~
49
FIg. 39.-Avera.g. ortanoleptk Uld peroxide cbar..:terbUcl ot tl"Oun pork .sam· pie, from tour hogs.
and rece ived identical treatmtllts. Thtre i& II tendency for hoga to be pre· disposed to individual levelt of peroxide for any given degrte of rancidity. A comparison of hog No. 12 with hog No. 13 iIllatrates thi, point; while the ftavor scorea of these two hogs aN! very similar in the three teatin&' periods there ts, neverthele .. , a wide di.fference in their peroxide values for each of the respeeUve testing periods . . Thus the individual variaOon In sus«ptibility to rancidity may account (or much of the failure to secure II high over -all correlation between peroxide values and organoleptic 8oorea.
F1""or DesIrability and Per Cent Free Fatty Add.- Tbe relationship between 8avor desirability and per cent fr-ee fatty acid is sbown in Table 8. Coemclents of correlation were -.43, _.3~, and - .20 at 6, 9, and 12 montha, respectively, wbere packaging materials were combined. The relationship waa s lgnlfl.cant at tbe .01 level at 6 and 9 months but only at the .O:S level at 12 months. Although the above coefficients of correlation are a1gnUlcant, they are too low to be of practical value in. utility and therefore , IIhould not be used interchangeably:

50 MrSSOOfU A (;ItICULTUII"L EXI'ERIMtl>"T STATIOS
(Lot and Storage Temperatl1re Groups Combined)
Fluor Dnlrabil l!I and:
P eroxide Per cent Per cen t (1) 0"" Number F . F, A. Dehydration Desirabllity
-.03 -.05 ... 03 ~.40" Wued Paper •. 16 •• 06 -.14 ... 40" Pq. Materials
Combined ... 09 +.01 _.11 ... 40"
Paper -.14 -.71" -.24 ... 56" Paper -.H -.20 •• 02 ... 61"
Materials Combined -.05 -.43" _. l S' .... 59··
Paper - .32 ' -.11 -.12 +.84" Paper - .36" -.55" -.75" ... 64*"
Materials Combined - .35" -.35 0 .• -.49' • ... 74"
-.30' -. 11 -.01 +.52" Paper - .35" -.45" -.40" ... 55"
Materials Combined -.34" -.20' _. 44" +.58"
• Significant At .05 Level •• SIp1!lcant AI .01 Level
(1) _ Debrd .... tlon expressed as per cent loss In .... elght.
Flavor OulI1lbUity and Per Cent Dehydratlon.---Coeffieientt of colTtl.tlon of liavor d esirability I..Ild per !:ent dehydration are given In Tab le 8. It is interesting to note that in 110 eue w u there a aigni.fleB.llt ~Iationshlp
hetween 1I.svor desirability and the pereenta&,e dehydration In tbe ground pork packaged in tbe laminated paper.
Coetliclentl of eorn!l.atioll wen! -.75 and - .40 for 1I.svor de.ln.bility and per cent dehydratioll in the ground pork packaged In the waJ<ed paper and stored for 9 and 12 months, relpectively. These coefficlellta of correlation were algnifieB.llt (at the .01 level).
Flavor DeAlrabillty and Odor Oeslrabillty.--Cotffielenta of correlation between 1I.svor de.inbllity and odor desirability are given in Table 8. All of the coefficlenta of correlation obtained were lignltlcant <at the .01 level) but for the moat part were too low to recommend their U$t inttrebangta.bly. However, in the &'fOund pork Btored for 9 mollths, the eoetlicienta of correlation were +.84, + .64, and +.74 for ground pork packaged in the laminated paper, waxed paper, and packa.ginJ" materiall combined, respectively.

RESEARCH B Uu..U IN 492 51
PORK CHOPS
1. Fa t Saturation Etreetfl
The elrect or rat saturation on the deterioration or frozen pork chop' was determined by tasting the pork after 3, 6, 9, and 12 lI'Ionthi of ,torage at O' F. The flavor and odor of each llample wu .cored as to general desirability and degree of rancidity by membeta of the tasting panel. The Intensity ot t be flavor and the odor of each 68.Dlple WIll alao noted. Oxidative deterioration wtllI meuured by peroxide valuea. Hydrolytic deterioration was meuured by free fatty acid determinatio .....
A:I pointed out previously, only the trimmable fa t of the pork chopa was tasted and used t or chemical teat.: odor .corea were obtained by anitr· ing the entire chop after cooking.
TABLE 9 - - THE EFFECT OF FAT SATURATION ON THE KEEPING QUALITY OF PORK CHO PS
3 .91 3.99 3.96 3 .85 0.27 0.20 3.01 3.00 2.98 2.86 0.20 0. 15
Intenllity 3." 3.00 3.01 3.02 0 .08 0.06
0"'" ---"Rancidity 2.68 2.67 2.60 2.43 0.34 0.26 DesirabUity 2.78 2.77 2.78 2.65 0 .23 0.18 Inten,lty 3.11 3.11 3.08 3.10 0 .12 0.09
Peroxide Value 0.81 0.76 1.21 0.52 1.01 0.76
" F .F.A. (u'ol-;!c) 0.47 0.36 O.U 0.39 0.07 0.05
% Dehydr ation (WI. Lost) 0.91 0.90 0.78 0.82 0 .28 0.20
The effects of tat saturation on the keeping quality ot pork chopa are presen ted In Table 9. Lots I , II, m, and IV had average iodine number-a of ~.75, 63.68. 65.18, and 68.44. relpectively. The effect of t at .aturation upon the development of rancidity in the pork chops was alight according to ft.a.vor rancidit y IICOreII; there were no s ignificant differencea between the lots at either the .01 or the .05 level. There were no slgui.ftcant d ifference. at the .01 level between Lots I , II, m, and IV In dellrability of the flavor, although, Lot I differed significantly from Lot IV at the .0:5 level. In intensity ot flavor, there were no Bignlflcant differences between Iota at either the .01 o r the .0:5 level ot s ignificance. There were no significant diff .. .reneel between Iota in the rancidity, desirability and intefUlity of the odor of tbe pork chopa.
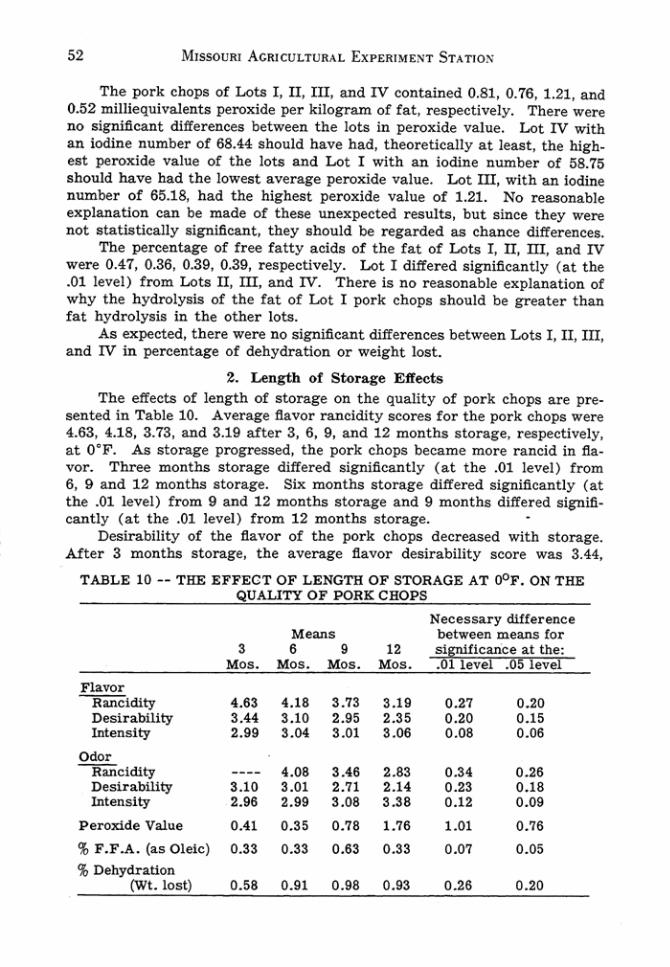
52 MISSOURI A CRICULT li flAL E XPERIME1'iT Surro:;
The pork chops of Lots I, II . III, and IV contained 0.81, 0.76, 1.21, and O.~2 milliequivalentJI peroxide per kilogram of {st, respectively. There were no significant differences between the lots in peroxide value. Lot IV with an iodine number of 68.44 $hould have had, thowretieaUy at lesst, the high_ est peroxide value of th e Iota and Lot I with Sn iodine number of .58.75 should have had the lowest average peroxide value. Lot ill, with an Iodine number of 65.18, had the highest peroxide value of 1.21. No reasonable explanation can be made of these unexpected resul ts, but lIinee they were not statistically significant . they should be regarded as chance differences.
The percentage of free fatty a cids ot the fat of Lots I. n, m , and IV weTe 0.47, 0.36, 0.39, 0.39, respe<:tively. Lot I differed significantly ( at the .01 leve\) from Lots II, ill, and IV. There is no reasonable explanation of why the hydrolysis of the fat of Lot I pork chops should be greate r than fa t hydrolysis in the other lots.
As expected, there were no significant differences between Lots I, II, III, and IV in percentage of dehydration or weight lost.
2. Length of Storage Effects The effecu of length of storage on t he quality of pork chops are pre·
sented in Table 10. Average fiavor rancidity scores for the pork chops were 4.63, 4,18, 3.73, and 3.19 after 3, 6, 9, and 12 months storage, respectively, a t O"F, AI! storage progressed, the por k chops became more rancid in fla_ vor, T hree months storage differed significantly (at the .01 level) from 6, 9 and 12 months storage. Six months storage differed significantly (at the .01 level) from 9 and 12 months storage and 9 months diffe red signifi· cantly (at the .01 level) from 12 months storage.
Desirability of the flavo r of the pork chops decreased with storage. After 3 months storage, the average flavor desirability score W8.$ 3 .44,
TABLE 10 · · THE EFFECT OF LENGTH OF STORAGE AT OOF. ON THE QUALITY OF PORK CHOPS
4.63 4.18 3.73 3.19 0.27 0.20 3.44 3.10 2 .95 2 .35 0 .20 0.15
Intensity 2.99 3." 3.01 3.00 0.08 0.06
Odor RanCidity 4.08 3.46 2.83 0.34 0.26 Desir ability 3.10 3.01 2.71 2.14 0.23 0 .18 Intensity 2.96 2.99 3.08 3.38 0.12 0.08
Peroxide Value 0.41 0.35 0.78 1.76 1.01 0.76
% F.F.A. (as Oleic) 0.33 0.33 0.63 0.33 0.07 0,05
% Dehydration (Wt. lost) 0.56 0.91 0.96 0.93 0.26 0.20
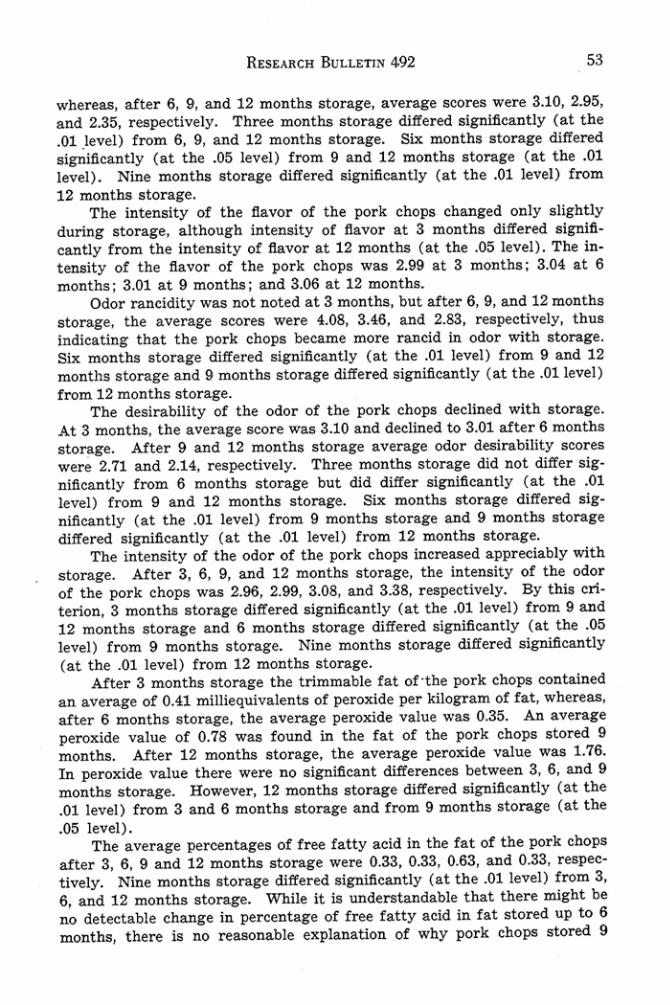
RESEARCH BULl'£l1N 4092 53
whereas, after 6, 9, and 12 month, atocage, averale aeores were 3.10, 2.9~, and 2.35, respectively. Three montia storage differed significantly (at the .01 .level) from 6. 9, and 12 month •• torage. Six months storage differed .ignificantly (at the .O~ level) from 9 and 12 montla etorage (at the .01 level). NiDe monw atorage differed aignificantly (at the .01 level) from 12 montla atorale.
The intenalty of the davor of the pork chopa changed only alightly during storale. although intenalty of flavor st 3 months differed airnil!.cantly from the In tensity of flavor at 12 montla ( st the .OS level). The intensity of the tlavor of the pork chops was 2.99 .t 3 montha; 3.04 .t 6 montla; 3.01 .t 9 montha; and 3.06 at 12 month •.
Odor rancidity was not noted at 3 months, but after 6 . 9, and 12 mont.hs atorage, the .verage ,cores were 4.08, 3.46, and 2.83, respectively, tbus Indicating that the pork chop, became more rancid in odor witb atorage. Six montha atocage differed aignll!.canUy (at the .01 level) from 9 and 12 months atorage and 9 months atorage differed significantly (at the .01 level) from 12 months atorage.
The desirability of the odor of the pork chopa dedined with storage. At 3 montla, the average aeore wu 3.10 and declined to 3.01 after 6 months storage. Afte r 9 snd 12 months storage average odor desirabllity aeores were 2.71 and 2.14, respectively. Th~ months atorage did not differ aign!lkantly from 6 months storage but did differ algnlflcantly (at the .01 level) from 9 .nd 12 montha ator'Rge. Six montha storage differed aignltlcanUy (at the .01 level) from 9 montha stor'R,e and 9 montlla Itorage dUfe red aignificantly (at the .01 level) from 12 montla stor'Rge.
The intensity of the odor of tbe por k chopa increased appreciably with ItO rage. After 3, 6, 9, and 12 montha storage, the intensity of the odor of the pork chopa wu 2.96, 2.99, 3.08, and 3.38. reapecUvely. By thia criterion, 3 montla Itorage differed IlgnificanUy (at the .01 level) from 9 and 12 months storage and 6 months atorage differed significantly (at the .05 level) from 9 months stor'Rge. Nine months storage differed lignificanUy (It the .01 level) from 12 montha Itorage.
After 3 months storage the t rimmahle fat of·tbe pork chopa contained In average of 0.41 milliequivalenta of peroxide per kilogram of fat. whereaa. after 6 months atorage. the s verage peroxide value waa 0.3~. An average peroxide value of 0.78 was found in the fat of the pork chopl atored 9 months. After 12 months atorage, the average peroxide value was 1.76. In peroxide value there were no 11gnidcant dift'erente. between 3, 6 , and 9 months storage. However, 12 months storage dilfered significantly (at the .01 level) from 3 and 6 montba atorage and from 9 months Ito""e (at the .05 level).
The average percentages of free fatty acid in the fat of tbe por k chops alter 3, 6. 9 and 12 months atorage were 0.33. 0.33, 0.63, and 0.33, respectively. Nine months atorage differed significantly (at the .01 level) from 3, 6. and 12 montha atorage. While it ia understandable that there migbt be no detectable change in pe~ntate of free fatty acid iD fat stored up to 6 montla, t here 1& no reasonable explanation of why pork chopa ltored 9
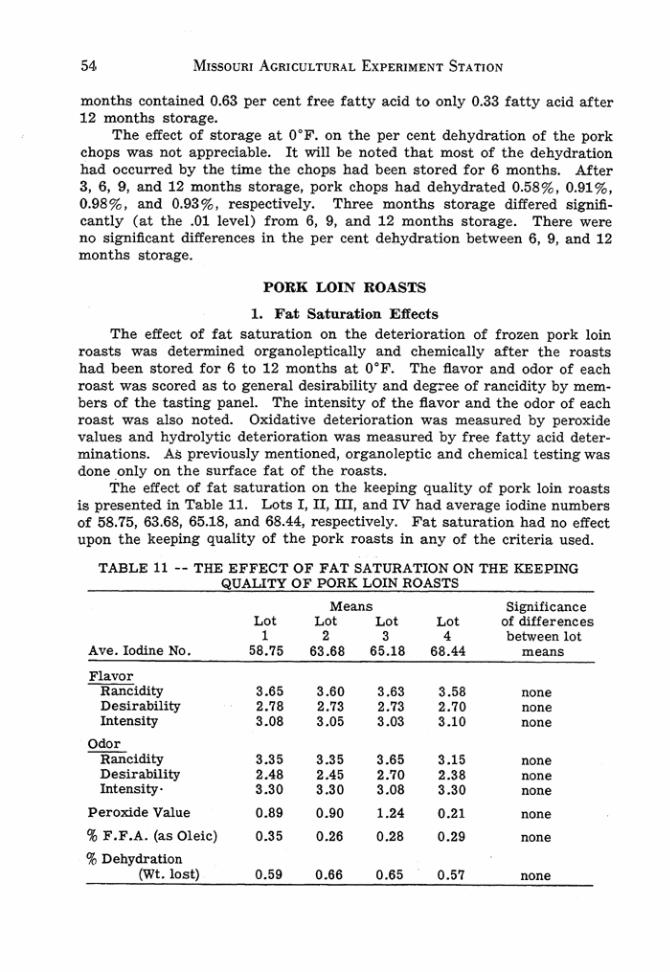
54 MISSOURI AGRICUl.TURAL EXPERIMENT STATION
montlu contained 0.63 per cent free latty add to only 0.33 fatty acid after 12 monthl! storage.
The effect of storage at O· F. on the per cent dehydration of tbe pork chopa was not appreciable. It win be noted that most of the dehydration had occurred by the time the cbops had been stored for 6 months. After 3,6,9, and 12 months storage, pork chops had dehydrated 0.58 %, 0.91%. 0.98% , and 0.93%, respectively. Threi! months storage difl'ered signifl.cantly (at the .01 level) from 6, 9, and 12 months storage. Thel'll were no significant differences in the per cent dehydration between 6, 9, and 12 months storage.
PORK LOIN ROASTS
1. Fat Sat uration E ffects The eirect of tat saturation on the deterioration of frozen pork loin
roasts was determined organoleptically and chemically after the roasts had been stored for 6 to 12 months at O°F. The flavor and odor of each roast was scored as to general desirability and deg;ee of rancidit y by mem_ bera of the tasting panel. The Intensity of the flavor and the odor of each roast was also noted. Oxidative deterioration was measured by peroxide values and hydrolytic deterioration was measured by free faUy acid determinations. All previously mentioned, organoleptic and chemical testing was done .only on the surface fat of the routs.
The eft'e<:t of fat saturation on the keeping quality of pork loin roasts is presented In Table 11. Lots I. II, m. and IV had average iodine numbers of :56.7:5. 63.68, 6:5.18. and 68.44. C(l$pe<:tlvely. Fat as.turation had no effect upon the keeping quality of the pork roasts in any of the criteria used.
TABLE 11 -- THE EFFECT OF FAT SATURATION ON THE KEEPING gUALlTY OF PORK LOIN ROASTS
M~' SIgn1f1cance eol Lo< Lo< eol ot differences 1 , 1 • between lot
Ave. Iodine No. 58.75 83.88 65.18 68.44 meanS
Flavor Rancidity 3.65 3 .60 3.63 3.58 none Desirability 2.78 2.73 2.73 2.70 ="' Intensity 3.08 3.05 1 .03 3.10 nOne
0"'' Rancidity 3.35 3.35 3.65 3.15 none DeSirability 2,48 2.45 2.70 2.38 none intensity· 3.30 3.30 3.08 3.30 none
P eroxide Value 0.89 0 .90 1.24 0.21 ,~.
'{ F.F .A. (as Oleic) 0.35 0 .26 0.28 0.28 =" '{ Dehydration
(Wt. lost) 0.58 0.66 0.65 0.57 nOne

RESEARCH BUll.£T11l 492 55
2. Length of Storage Effects
The effect of length of storage on the quality of the pork loin roasts is presented in Table 12. Average fiavor rancidity seores for the pork roasts, 4.09 and 3.14 after 6 and 12 months storage at O"F. , resJM"ctively, indicate the superiority of flavor of the roasts stored 6 months over the fiavor of the roasts stored 12 months. A significant difference (at the .01 level) was found between flavor rancidity scores of pork roasts stored 6 and 12 months. Tbe desi rahility of the flavor of the pork roasts seared an average of 3.10 after 6 months s torage and 2.36 after 12 montha storage. T he flavor of the pork loin roasts stored 12 months was significantly (at the .01 level) less desirable than the pork roasts scored 6 months. No significant difference existed in the intensity of the flavor of the pork loin roasts stored 6 and 12 months. Odor rancidity, desirability. and intensity scores ot the pork loin roasts were significantly superior (at the .01 level) at 6 months to the . seores obtained at 12 months.
After 6 months storage a t O"F., the fat of the pork loin roasts con· tained 0.38 milliequivalents of peroxide per kilogram of fat as compared to 1.23 milliequivalents of peroxide per kilogram of fat after 12 months star· age. Peroxide values were significantly higher (at the .05 level) after 12 months storage than the values obtained after 6 months storage.
The fat of the pork loin roasts contained 0.27% and 0.32% free fatty acid after 6 and 12 months storage, respectively. No significant difference existed in percentage free fatty acid between t he two storage periods.
The pork loin roasts dehydrated 0.S2% and 0.71% after 6 and 12 months storage, respectively. Dehydration was significantly greater (at the .01 level) in the roasts stored 12 months than in the roasts stored for 6 months.
TABLE 12 -- THE EFFECT OF LENGTH OF STORAGE AT oaF . ON THE QUALITY OF PORK LOIN ROASTS
Intensity
0<\0, Rancidity Desirability Intensity
Peroxide Value
% F.F .A. (as Oleic)
% Dehydration (WI. lost)
Means
• " Mos. "',. 4.09 3.14 3.10 2.36 3.01 3.11
3.96 2.79 2.&4 2.06 3.04 3.45
0.36 1.23
0.27 0.32
0.52 0.71
Level of significance of dllferences be
tween storage period means
." ."
."

56 ]\'1tSSOURI ACRICUUtJ RA L ExPERIMENT STATION
Fat .aturation had no aigniftcant effect on the development of rancidity In pork ehope and pork loin roa.st8 stored in laminated paper at O· F. It iI poeaible that rancidity might have developed in the chops and rout. had they been packaged ill a less etlicient packaiing material or etore<! at a higher temperature. Had there been appreciable development of rancidity in the chops Md roasts as there was In the ground pork, it is probable that rat ... turatlon would have influenced rancidity development.
Shrewahury et al. (1942) al80 found that chops and routs from hard a.nd 10ft carcasses had comparable keeping qualities when they atored the pork in mois ture prool cellophane at -6.3 ' , --8.01 . .. and --8.2·F. for periods up to 16 months.
It I, interesting to note the appan:mt discrepancy in the finding of this investigation that rat saturation influenced the keeping quality ot ground pork but not the cbops and routs. It sbould be pointed. out, however, that chops and roasts were stored. only in the laminated paper, the best paeka&,_ ing material uaed on the ground pork, and at O' F. , the best storage tern. perature for the ground pork. The chop. and routs did not bave the opportunity to ~me rancid that the ground pork did; thus lot cliffereneel in susceptibility to rancidity might have existed but were not allowed to develop.
The palatability of the pork chapa and roasta declined. during storage although they were acceptable in lIavor after 12 months storage at O'F. The chop.s were only slightly rancid aiter 12 months atorage. Griawold and Blakeslee (1939) considered pork chapa to be edible after 6 months storage at O' F.; DuBois, Tresaler, and Fenton (1940) found that at O' F . . chops became slightly rancid within 12 months. Young and Mclntolh (1943) reported. that the quality of pork chopt;l and roasts w .. not appreciably dected by storage up to 4~ months at O' F.
Wellington, Mackintosh and Vail (l9{O) reported that pork routs stored between 7' and IS' F . should not be held longer than S montla. On the other hand, the data of this investigation inclicate that pork roasts may be stored at lesst 6 months at O' F . when properly packaged without appreciable loas of tlavor .
. Noble and Hardy (1941, 19{5) , on the other hand, found 0 ' , 10' , and lS' F. equally effective in preserving the palatability of pork roasts but that high quality pork should not be stored at those temperatures for longer than 16 to 22 weeks. The pork chapa and roasts used. in thls investigation were certainly not of high quality and yet they were stin aceeptable after 12 montha stol"&Ie st O' F.
RtsEAIICH BULI"ErIN 492
VI. SUMMARY AND CONCLUSIONS
SUMMARY
57
1. Twenty pip: were divided into four equal loa and fed • 25% IIOYbean ration for varying amounts of gain prior to slaughter . The feeding of tbls ration (containing 25% lIOybeans) n:duced the rate of gain and elllciency of reed utilization and increaaed the unsaturation of the pork fat. Carcasses of the tour lot. varied In the degree of finnness.
2. Ground pork from these caree.sses was packaged in two materials and IJubjected to flve temperature treatmentIJ for 3, 6, 9, and 12 monthli. Pork chopt were ltored at O' F. for 3, 6, 9, and 12 montla. Pork loin rout. were stored at O' F, lor 6 and 12 months. Organoleptic and chemical 19111 were made for all I8mples.
3. The keeping quality of ground pork decreued. with an increase In the unsaturation·of pork tat, The Inlluence of tat .. turatlon on the deterioration of frozen ground pork was most marked In samplel that were packaged In the waxed psper, atored at 10' F . or defrosted. Fat saturation In.lluenoed I'1UIcidity development in frozen ground pork,
4. The keeping quality of pork cbope and pork Join rou1ll wu not greatly Inlluenced by the saturation ot the fat,
5, Tbe packaging materi.aJ.ll differed in their efficiency to prevent deterioration In frozen ground pork.
6. For ground pork, O' F. was the moat desirable atorage temperature. O' -10' F , weekly wu nearly u dealrable,
7, The 10' F. atorage temperature permitted the lDOIIt rapid deterioration on frozen ground pork,
8. Defrosting had an immediate and pronounced deleterious effect on I'round pork. Prolonged storage minimized thiB erred.
9. Pork cbopa and pork loin roastll were acceptable in flavor aDd aroma after 12 months storage regardless ot the degree of fat saturation.
10. The rel.atioOlihip between odor and Aavor wu too sms!! to allow the aublltitution ot odor evaluation for Bavor evaluation.
U . Peroxide values and ftavor rancidity were not cloaeJy related.
CONCLUSIONS
It may be concluded from this investigation that: Fat laturation had a Ilgnifican.t effect upon tbe keeping quality of
ground pork. Pork from plgl fed appreciable quantities of lIOybeana wu more sus«plible to I'1UIcidity development thaD pork from pip fed a llandan! corn belt ration.
It Ia ot paramount importance that pork lrom pigs fed ratioIll!l eonducive to 1I01t fat depoaition be packaged properly alId stored at O"F. or lower.
Palatability 1C0res were hlghut for ttm.e samples of ground pork from pig. ted only the standard eorn belt ration and which bad been pack. aged in the laminated paper alId ston:d at O' F.
Fat saturation had no significant ell'ect on the keeping quality of pork

58 M ISSO ti ltl A CAICULTURAL ExPERUlt.'lT STATION
ehoplil and route packaged in laminated paper and atored at O' F. Correlation coefficien~ between objective and subjective methods of
evaluating the quality of ground pork were too low to indicate that they could be used intcf"Changeably.

RtsURCH BuLLE:TI~ 492 " BlBIJOGRAPHY
1. Alexander, L. 1.£., N. O. Cluk, ... " P . E. Howe, " Methods of COoldn .. an" Tut.lng Meat for ~lllltablUty," S"ppl""",,,1I1 to Notiolla.l PTo~cl COOptNIIlw Me .. t l"vullgcllloM, U.S.D.iI.. HO'IIW BCOl"lOIIIIc ... nd Bllre .. " A"fmcU J-nd~tr)", RevlHd (mlmeo), 1933. pp.36.
2. Mnln """"", V. S., T. H. Juku, H. M. Fyler, ... d M. L. Maxwell, "The ~t of Certain FWt Mell. and Fiah 011 .. In the Ration on the F1nor of Tur· key," Pou.!hy B~, 11 :141, IS3&.
3. Barmore, Mark A.., "Re«nt Developmenta In the CbernLstry of F ooda," Food. a_rcA, 1 :388, 1838.
4. Bunl<:OAt, C. ft., ' 'Tllnt In Pork Interim Report," N"", z..alolld Jovnw>/ 8~ Tec .... 'olo9ll, 12:32, 1930.
IS. Bengt.aaon, J{. and Erick Helm. ''Princlple.- of Tllte-testlng," Wolle-rlt.iII LoIxI .... t<:>riU Com",,,,,/cafio(m,,, 8:111, lU6.
6. Bhllttacharya, R., ... d T. P. Hilditch, "F atty Aclda ... d Component Gly. ceridea of Indian Ghee," AMl1l31, 56 :161.70, 1831.
7. Bl&ek, H. C .• "A Study of the Reilltionahip of Peroxide Values to Fllt Deterioration In Mellt Prodl,lcta," QlI<Jrtll1"tOl4lfotr C..,.,.. M .. "ttol, 17-7:146, lfU:I.
8. Borg'l, Mildred M. and Helen L. Hanton, "AnalyaII of Foodl by Sensory Dur.renc. Tuta," AdvollCft ;" Pood RueorcA, 2 :2~243. 19-18.
8. Bolton, E. R, and It. A. WlUiamI, '''I'lle Grol,lplna: of Fatty 0111 with Sped.al Reference to Ollv, 00," AIIGlII.tI, 5:i::i-ll, 1830,
10. Brady, D. E ., F . H . Smith, and L. N . Tucker, "Control of R&neld.lty In SOy· bean·Fed Pork," Jaw ...... l of A"lm.>/ 8~, :I:3-&I-3M. 1946.
11. £lull, S., W, E. C&n-oU, F. C. Olaon, G. E. Hunt, and J . H. Longwell, "Uect of Soybeans and. Soybe ... 011 Meal On Quality of Pork," lllillOis Agr. B.,p. 8t ... Bulletin, 366:80. 183!.
12. Callow. E. H., "Qu&Hty In the Pfr's Care .... ," ~p. 'ood hlw'l. Bd. Lolldon, 19M. pp.4.5.
13. Chmten.ten, F. B., ''TIle Wanhousinl" of Fro~n Foocb," Pood h1IuI .. g, 1:2:1.1114:1.
l4.. COok. w. a and W . H. White, "€ft"ect of Temperature ... d Humidity on Color of Lean and Dtvalopment of R ... cldlty In Fat of Pork DIIrinK Froun Stor...-e," C .... ..., ..... }OMnoGl of ~l!Grc1l .• 180:M, 184.1.
U . Crbt, John W . and H. L. Seaton, ~Reliabillty o f OrT&n<>I.ptic Te.ta," 'ood a"~/ircA, 8 ::l28-M6, 1841.
18. Crocku, E. C. '''wor. New York: McGraw- Hill Book Compe.ny. Inc ., 184.5. pp. 89-&0.
17. , ... d W. P Il.tt, "Food F1l.vO.--A Crttlcal Review of Recent Literature," F ool! R~"/ircA, 2 :18-1, 1937.
18. Dean, H. It., "Soap," P~r/"lMTI/ C08tII<Itiu, 14 :807, 1941. 18. , and T. P . Hilditch, "Some Further Observationa on Factors
Whl<:h InfIUen«l the Component F atty Aclch of 8u.tter," Bioc!oem. JOIInw>/. 21:888-897,1933.
20. Dove, W, F" ' 'Food Aec:eptabillty-lta Determination an" Evaluation," Pood Tee",1lOlo91l. 1 :38, 184.7.
U . 0ulI01.t. C. W. and K. D. Tru&ler, ''Mobture--Vl.pOr Proofneu of Wrllpplnl" Materiale Ut.ed o n Frozen Food&," Pa._ Trade JO''"ItII, 109 :1:1. 1838.
22. DuBole, Clarenc:e W ., It. Donald Tressler, ... d Faith F enton, ''In.!Iuene. of Rate of Freerilll" and Temperatl,lre of Storage o n Q!1a1ltv of Frozen Meat," l...,tlt"le of '004 T tCA .. ologut, Proceed;ng8, 167.188, 1840.
23. Em .. N . R. and O. G. HUlklna, "Sott Pork Studle. I . FOmllltion of Filt In the PI&"" on I. Ration Moderately Low in 1'1.1," Jcmnw>/ Bioi. Clletn*-'tl"l/, 88:101, 182.5.
24. , and H. S. lebell, "Soft Pork Studln n . The In1Iuenc. '" the Chu&eter of the Ration UpOn the Oompo&lUon of the 80dy F l.t of Hop." J""..-.....l 01 B ioi. C!oemiftTv, 88:219.238, 1828.
25. Fiedler. a, ''Uber de. Verderben del Fette. in Nahrungmnitteln," 'ette ... 8tril_, 47:113, 1$40.
28. Flnne~, W . J ., "Dul«atlon of Fro~en Fooda," R e/rig. 8 .. g. 38:223-22:1, 1838.

60
" ". ". ". ". ,. ". <0.
". ". .,. H .
". ...
00.
!\1ISSOUIlI ACRlctJLTUJV.L [xP[AI!otIENT STATION
GUM, O. F ., "A Compan,Uve ()(lor -.nd Flavor Study or Err. Stored In Aven1:u1d pd Unaven1zed Filler. and Flau," U. S. B gg POlo/I"" MClgWlb •• , 48 :348, l~O.
Godbey, E. C., ''Ratio ... ror F attenln&' Hogs on Soybean For .... ," 8011/11 Ca~· oli .... Sq. 8t .... B IIll<IU .. , 87 :9, 1$$1.
Gartner, W. A •• Faith F enton, France .. E. VOll, &nd Ella Gleim, "Meet of Fluetuating Tempe .... tures on Quallty of F rozen Foods," I t1d. and Eng. a~"I"". 40:1423-215, 1I14S.
Gray, P . P. , I. Stone, and L. Atkin, "Systematic Study of the Intluence ot Oxidation on Beer Flavor," WCl~'t"' .. Loborolo'1l Co"' ... ""IcoUo .... , 10: 1803, l~T.
Grlftltha, N., J . R. Vickery. and N . E . Holmu, ''The Freez:ln&". Storace. and -rran.port ot New Zealand Lamb," 'cod h vutlgoU .. " Speckll Rep<>re No. 41, ~rt""""l 8~ """" 1104 .... 'ry &uarcll, London : H . M. Stat. otftc •• 1932.
Griswold, R. M. and L. H . Blakulee, "The Effect ot Dllferent Wrapping, Tempe .... tu ..... an(!. Le~ ot Storage on Keeping Qualltln of Frozen Pork Chopa," PrOC<ledh.g. A_rico .. S(lC(elll 01 A.,jm(l.l Pt>oduclloa, 1939, pp. ~.
Quut, W . E.. uSome Probl~ In PnJ)Uadon. Pl'OCtaalng at\d DI.tribution o f Froun Food PnXIucts. Tee colld Rflfrig .• 96 :339, 1939.
Hall, J . L.. June Kal ... Beulah D. WfI.ternman. O. L. Mackintosh. and Glady. D. Vall. "Keep the Temper alul"fI Low When St.ortnl' P ork," Ref"g. 8 .. g., !:i7 :2(7-1:10. 1949.
Halliday. Evelyn G .• "Objective Telta fo r Cooked Foods," Food. Ruearcll , 2 :287-288. 1937.
H &n<bcb"""lker , E., "A Teehnlque for Tetltlng the Reversion Propertlell of Hydroa'enated Soybean Oil Shortenlnp." JOIInt.CLl A1'IWrlocI .. OU Cil<lmill" S0ci4ll1, 2lS :~, 1948.
H at\klnl. O. G. and N. R. Em.,. "Some Ruults or Sott-Pork Invntl,atlona." U.S.D.A. B .. u..Un1407:67. 1926.
H anklna. O. G .• N. R. Eill •. and E . H . Zeller. "Some Results ot Soft_Pork In· "",U".UOllI n;' U.S.D.A. Build!", 1492..:;0, 1928. Harri .. n, S. and L. W. Elder, "Some Applle.lIo .... of StAlI.tleI to Ll.bora
tory T ute T MtIn .. :· Food. T«II11olo9J/, 4 :43 ...... '9. 1950. Hfllm, Erick and Bt .... er TroUe. "S'lection of a TUl<I Panel." W..u .... 3ttln
Laborat""'" C""' ....... lcati""-', 9:181.194, 1948. Helser . M. D., 11". J. Beard. C. C. CUlbertson. and B. H. Thorn .... "Inlluenee
of Difl'enonl AmounLi ot Soybeat\1 and Their Produets Upon the Quality of Pork and tho Character and Keeping Quality of Lard." 10""" Agr. Erp. Bt ... A .... 1KIl RfiporC , 1939. pp. 91-92.
H eaer . ~L D .• F . J. a.ard. C. C. CUlbertson, and B. H. Thom .... u1nlIuen"" of DltI'ennt AmounLi of Soybe.all.l and Their Prod~ Upon the Quality of P o rk and the Character and Keeping Quality of Lard." I<NXJ A gr. E%fl. SIG. An .. 1UJJ Rel'orl, 1940. PI'. 118-119.
H1ld!\.I:h . T. P., Th, Chemical eo .... utuUon of Natural Fall, New York : WHey. 1940.
Hopkin., J, W .• ·'Pre.elslon of Aaleument of PalatabUltv of Food-atutfs by LabQrat.ory Panel.;' 00 .. 044 JOIInt.CLl Rf/uoTdl, ZtF :203, 1946.
Ha.tetle r . Earl H. and J . O. Hal"" .... n, "F eedln, Soybe.all.l to PI.... The Elreet on Gains and a Method of Producing FIrm euc ... su," NOTIII CoroIIna A gr. Erp. 8111. T~eh. B"u..lin, 6Z:23, 1940.
Hoatetler. Earl H., :t. O. Halv,rson. and F. W . Sherwood. "'Production of FIrm Pork fi"om Peanut F<!d PI .... " North Ccorolitlco A gr. 1J!rp. SIll. Tee/I. B .. lletin, 63:23. 1939.
HU.ttruIld. A. and:t. D. Winter . "Tho Elfec:t of Fhu:tueUn .. Sto .. , •• Temperaturu On Frozen Fru!ts and Ve&".tabIu,~ Agr. S"9" U:fl6, 1943.
J ensen. L. B. and O. P . GreWe. "Aetlon o f Mlero-orpnlgna on F all." Food R ueGrc:II, 2 :97-120, 1931.
Klermelr, F. and R. H el ... "Experiments On the KeeplllJl" Qu"Utv of Beef and Pork Fat at Low TemperJ\ture," O/lemlca l ANlroce" 33 :9"69. 1 9~9.
KinK. A. E., H. L. Ro.chen, and W , H . Irwin. "An Aecelerated Stabllt tyTest; · OU olld Soop, 10 :10lS. 19,5-
".
RESEAIICH BULL£nN 492 61
KlOI!e, A. A., H. L. Hanson. and Hans Llneweawr, "The Freezing P...,,,,,rva. tion ot Turkey Meat $teiLQ," Food T echlloloQ!l, 4:71_14, 19M.
Lea. C. H.. "EtI'eet ot LIght on the Oxidation ot Fats." Proceedmgs Roy.,. SocU>ly, London, BI08:17:1-189, 1931 .
• R<>lLCidltl/ I" E,lIbl<! 1I'IJls , New York: Ch~leal PubllM!ng Company, 1931.
, ''Rancidity In Ed!ble Fab," Food l"ve,tt;ga tion Special R epot't No. ~8, l)q>art....,,,t 01 Smell tift<; and 1?1d .... tri..z Ruearch, London: Hi. Majesty's Stationery ome' .. , 1938.
511. Lowe, Belle, "Organoleptic Tests Developed for Measuring the Pa.1atabmty or Meat," Procudi"g8 Second Am,,",] ReciprOC<>l Meol COtlf~e, 1949, pp. 111-115.
". Lowe, Belle and George F. StAlwart, "Subjective and ObjecUve Teats U Food ReseaTCh Toola with Special Reference to Poultry Meat," Food Tecll'llolo911, 1:30-38.1947.
57. Mann. L. B., "Problem ' and Opportunities In the Lo<:ker FIeld," Q"ick 11'",%. e1I Food8, 13:185-187, 1951.
Melhar't, R. P., "Freezing Foods In Small Contain",""," Q .. ick 1"1"<;Izell 1'o0d4, I , 9 :1l1-32, 1939.
lI9. Mills. Frederic C., Staf~tlcal Met"0d4. New York: Htnry Holt lU!d Compa.ny, 1938. pp. 32l1-380.
60. Moncrlelf, R. W., T M OMmica./ 3e",,". New York: Jolm WHey and Sons, Inc., 1946. pp. 12l1. 95, 82.
, "The ChoIce of Flavor," Food M"""loct .. re, 22:113-118, 19n. Moran, T. a.nd N. L. Wright, "Store Burn In Frozen Meat and Poultry," Food
M ...... lact .. re, 12:lIU -34l1, 1937. 63. MOrrison, F. B., Feed.! .. nd Feedi"g. Ithaca, New York: The Morrison Pub
llshlng Compa.ny, 19-48. pp. 964-993.
". M()3er, H. A., C. M. Jaeger. J. C. Cowa.n, and H. J. Dutton, "The Flavor
Problem Of S<:>ybea.n Oil n. Organoltptic Evaluation,"' J""mol A ...... rican Oil Cheml.tt.t' Society, 24 :291, 19-47.
McClLfIImoll, R. B., M. S. Pittman, and L. A. Wilhelm, "The Odor &lid Flavor ot Eggs," POliltry Science, 13:95.1934.
66 . Noble, Isabel I1Id Francea H ardy, ''The ElIect or Storage Time a.nd Tem_ perature Upon the Palatablllty or Pork Rolllltll Preserve<! by Fr~z.!ng." '01<rn.al 01 Home EcOtlomlc.l, 33 :lIlr7. 1941.
os. , "Etrect ot Storage Temperature and Time Upon QuaUty ot
Pork Preserved by Fren ing,"' Food Re8~ .. rc", 10:16:1--17:5, 19-4:5. Novlkova. E. I .. "Changes In Fat ot Frozen Pork In Prolonged Storage,"
Klwlodil .... y .. F'l-oml/,,,z..,, .. od, 16 ( 4), 30, 1938, Abstracted In Food Indll&tries,l1 (8)' 1939.
-,--,---,--, "Changes In Fat ot Frozen Pork in P rolonged Storage," CMm"",,I A b.!-troct" 33 :8841. 1939. Overman, Andrea and Jerome, &lid C. R. W, "~pendabmty of Food Judges
as Indl<:ated by an Analysis or Scores ot a Food Tasting Panel," Food &.leorc", 13:441 .449.1948.
71. PiaU, Washington, "Rational Method. of Scoring Food Productll," Food 111-dll$trU', 3:108-111, 1931 .
n.
• "Some FundlLfllentai Assumptions Ptrtalnlng to the Judgment ot Food Flavors," Food Reu .. rch, 2:237, 1937.
Ramsbottom, J. M., "Freezer Storage €ft"ect on Fresh Meat Quality," Relrlg. Eng., 53:19-23, 1947.
Roblson. W . L .• "Soybeans and Soybean Oil Me al tor Pigs." OMo Agr. Hzp. Sf ... BlIlletin, 4:52 :41, 1930.
75. Rockwood, D. N., J . M. Ram_bottom, and V. C. Mehlt nba<:htr, "Preparation of Animal TIss ue Fats tor ~termlnsUon ot Peroxide, and Fret Fatty Adds," A""lytical Chem~try, 19:8l!3, 1&47.
76. Roessler, €. B .. J . Wuren. and J . F. Guymon, "Slgnlllcance in Trlangular Tillite Tests, .. Food Releorc", 13 :503-rolI, 1948.
77. Sh..", P. F., G. F. Stewart, and :1. C. Huttar, '"E:tI'ect of Packing Materials on the Flavor ot Storage Egp," Ne'" Y ork Agr. Exp. SfO. Ithaca Mem<>ir No. 189:26, 1936.

62
".
eo.
". .,. .,. ... ". ... n.
...
... eo.
' L
". ... ... ... 96.
".
MISSOURI A GR ICU LTURAL U:P£Rli\I£NT STATION
Shorl-.nd, F. B. and P . B. D. DeLaM ..... , "Slud lu on the F au or the Bacon P ig with Refennce to Cal"Cua Quality. The Relatlon Bf,tween the Crowth Rate and Chemical ComposlUon of PlI' Depol F at." J ovnLtll Agr. Scle"ce ( Eneland ) ~. 1 :39-t3, 194~.
Shl"l!wabury. C. L., L. W . Horne, W . Q. Braun, Ruth Jordan, Opal MlHlgan, C. M. VesW, and N. E . Weitkamp, "ChemIcal, HIstolOgical, and P alat abll_ ll y Changu In Pork Ourlns: Freezing ...,(1. Storage In the F roun State," [ " d llmll A fIT. E:.;p. St(J.. Bulldin 412, 1942.
Sl\edecor, George W .o S rIJtilficGl MdhO<b, Amu, Iow a: T he 10"''' 8 10le College PTeu, 1946. pp. 21.-318, and pp. U -lI3.
Snyder , R. W ., "Cutting Me.a for the Locker Plant:' &f'rl.g. E~S1., 37:391_ 392, 1939,
SUlUIby, Maurice E., "Detenn;na tlon ot P erox ide Valu"," fo r Rancldl t y In Fish ons," / "d. and E"g. CII,""ist~. 13 :627-631, 1941.
T aylor. Harden F ., "Advanc ... In the P ruervaUon of F ish by Freninl"," h ,d. " "d 8 "9. e ll ",,!,!1")', 24 :679·692, 1932.
T rele ..... , R. D., and C. H. Koonz. "Quality of Eviscerated Poultry Obtained from Defrosted. Dre.led Stock." Food Re!~o.rcll, 10 :373, 19t 6.
T rlebo!d. Howard 0 .. QII,,"tJrotltle A"o.l!ls/.t, New York: D. Van Nostrand Company. Inc .. 19(6 .
Vall, C. E .. and R. M . Conrad . "Determination of Palatab!!ty Chancel Occur • ring in Froun P oultry." F ood R~8eo.rell., 13:347 . 19(8.
Vut.a.1. C. M .• and C. L. Shrewsbury. "Nutritive Value of Soybearuo with P'NUmlnary ObMrvations on the Quality of Pork Produoed," Americca" Society A.d"llll Prodwo::tlo .. P roceedlNg8, 1932 . pp. 127-130.
Ve.tal, C. M., and C. L. Shrewsbury. "Th. EtI'ect of SoybellNl. Soybean 0 11 Meal. and T anka,e on the Quality of Pork," I NdIo" " A gr. Ezp. S fa.. B.dLefill, 400 :31.1936.
VlnUle.sco. J . and A. P opeae<l, "Biochemical Reacllon for Rancid Fatl." J o,,",al Phann. Olle m l.tt.,.., 12 :318, 1916.
Volz. F. E .• W . A. Cortner. E. W. Pltz. and J . I . Miller, "The ElI'ect of UltraViolet L ight In th Meat Cooler on the Keeping Quality of F rozen Lard:' Food Teclll<ology. 3 :4_7. 1949.
W atb. B. M. and D. H . Peng, "Rancldlty Development In Raw Versus P'Ncooked Frozen Pork Sausage," J"",",al 01 H ome Ecollomln, 311:88-92. 19(7.
WelUn~n, C. H .• D. L. Mac:kintosh. and O. E . Viii. " Pork Stor.,.e In Freez· Ir Locke ...... 7"r ... " •. Ka ... o.t Acad. SCfellCfl, 4!I:313-317, 19(0.
\Vb .... ler. D. H ., Peroxide F ormation u a Meuure for Antoxidativi Deterioration." 011 olld Soop, 9 :89. 1932.
Woodroof, J . C., "De'lccation of Product.a Sto~ at Low T emper'tures." Re!rlg. EIIg ., 42:383-387.1941 .
. "Microscopic Studies of Frozen F rult.a and Vegetablu." G~o,... /7;" .tOT. E :zp. S tu. Bul~t/" 201. 1938.
YounK. E. J. and J . A. Mclnto!!h. "Effect ot Loe.ke~ Storage on the Quality o f Pork." ReJTig. ZIIg .• ,(:1 : 100-1 03. 1943.
Zell[ler. P. T., R. C. Mlller. and J . A. Christian. " P rel'!I"'ltion o f Meat and Meat Product.a In Frozen Storage." P e'tfN'1Il\l(lIIiIJ A!I". Z:zp, Sta. Bullet/II, 630. 1900.

APPENDIX Tables I, 1I, III and IV, supplementing the report. on testing and uatiatlcal
analyslll appearing on pages 20 to 23 ineluaive.

I " "' ; , ;1 , , 21 ., .rl •• 'r • .. ! -rl ,. -1-1
" .I --' '.' -
, -, -, ! , Ih
l
, , ! ;
9~1
.:I ti "i' . , , , , I' LI H
I •• U
I ~ :1 ;
If>>~'''~~~~
;If,>>~~
;;;'''';;;';;;' ~
----------!! ----------'!! ----------£ ----------'!! ----------'!! ---------_ ... ----------.. ----------!! _
__
__
__
__
_ ...
__
__
__
__
__
0
~~~
I »~.ll-~~
----------'!! ----------~
----------0 __________ !! ----------,!! ----------s ----------~ ----------<> ----------~ ----------...
~~
I ;;"»";;.,)r~~~
----------e ----------e ----------~ ----------<> ,-
----------e ----------. ----------
~ --
--------~
__________ ~ ----------0
... ~»~ ;;a,..~~~
,
----------. ----------, ----------~ ----------2 ----------e ----------"" ,-----------... ,-iiiii:!
1:~~~.l'~:1:~;:~<
II ~llli.i h
li.y ~,. _.!!_l_o._i!:_", h
hh
hh
HH
HH
H
• ! <
i f , ~
, , •
, •
• •
, -, •
----------" ----------" ----------..
f , j • ~ , I
, !
• ;.
~
• -.. ~ •
, , I
... .ll-;;.~»;;.~;;.:.rit ~
----------~ ~
I-
----------~ ~
-----------..
~
----------::;! ., -, _
__
__
__
__
_ ·0
""
,-"
~.ll-~~
!l ----------i!
'if! ----------E
" ----------~
'il
" " • ,-' ----------"
::!,I ----------:;
"I
__
__
__
__
__
0 ~
----------~ ~ ----------,0 :it ~~~
11 ----------, f ::::::::::~ I: ----------2
0;:1, ----
__
__
__
0 :;;
• , I
, • •
j j , ~
, • '.
;. ;.
• -
, ., •

, l~ , • •
l~ •
l~ • • •
iF • •
RE
SE
AR
CH
BU
ll_n
Il' 49
2
! :::
::: .lU
12
22
21
22
22
:<;21
U2
U2
1
~~----
------------
------------
------------
------------
------------
------
------------
------------
------------
------------
------------
------------
------------
------------
------------
------------
------------
------------
------------
------------
------------
------------
------------
------------
ill .! .l ,
! . ..: t . , "0
_ .;
.! , " •

66 • •
~
~
• <
• 8
<
g m
0
0 m
Z
0
0 0
0 "
N
" N
;;" ;;"
;;" •
ffi 0
--
-~
N
-a -
----
~
§F -
---
~,
• ~
--
---
G
--
-~
--
• •
m
;;" ;;"
;;" ffi
'b •
• 0
-• :
1l u
m
~
--
---
8~
• •
~
~ ·3
-
----
~
~f ~
~~
----~
• • 8~
N
--
--~
&
h -
• ~
• --
-- --
1l .z
-
.0
ffi
• .~
;;" ;;"
;;" m
•
<~
, m
0
~
• -
--- -
-~
~
• ~ 3~
---
-~
, 5
-~
• A
-- -
-~
• •
--
--
&
G
---
-""
0 • • ;;"
~,
;;" ~
ffi , 0 •
~,
0
• --- -
,
~t -
-- -~
, •
---
-~
, .. ,
--- -
"" • •
---- -
"" 0
~
• •
0 •
0 •
• •
• •
-t(l-
.... 5
5 5
5 c,-Q,.s
• 0 o.
,. , 0
0 0
• •
• Z
~o
0 0
0 0
• •• •
9~ .-• • • •
<1:1.,<
1.1
., ~
o·
~o.~o.
_0
~
G
0 N
•• -
•

APPENDIX TABLE IV DISTRIBUTION OF PORK LOIN ROASTS-
LOT Lot 1 Lot 2 Lot 3 Lot 4 PIG NO. 1 2 3 4 5 6 7 « 9 10 11 12 13 14 15 16 17 18 19 20 NO . SAMPLES
Storage Period
6 Months
12 Months
No. Samples
11111yl1111 y l1111 Y ll111 Y 20
111115/ 11111 5/ 11111 5/ 111115/ 20
P"PI, Y'1 YYY ;/ YYYY 'i Y Y Y Y Y Y '1 Y Y No. Samples
P er Lot .!QI .!.Q/ .!.Q/ .!.Q/
• All Roas ts were wrapped in the Laminated Paper and stored at OOF.
40 TOTAL
~ ~