Early Deterioration and Its Detection of Natural Monoester ...
134
Early Deterioration and Its Det Natural Monoester Type Insulati Transformer 著者 Abdul Rajab その他のタイトル 変圧器用天然モノエステル絶縁油の早期劣化とその 検出 学位授与年度 平成28年度 学位授与番号 17104甲工第429号 URL http://hdl.handle.net/10228/00006326
-
Upload
khangminh22 -
Category
Documents
-
view
2 -
download
0
Transcript of Early Deterioration and Its Detection of Natural Monoester ...

Early Deterioration and Its Detection ofNatural Monoester Type Insulating Oil Used forTransformer
著者 Abdul Rajabその他のタイトル 変圧器用天然モノエステル絶縁油の早期劣化とその
検出学位授与年度 平成28年度学位授与番号 17104甲工第429号URL http://hdl.handle.net/10228/00006326

EARLY DETERIORATION AND ITS DETECTION OF
NATURAL MONOESTER TYPE INSULATING OIL USED
FOR TRANSFORMER
変圧器用天然モノエステル絶縁油の早期劣化とその検出
ABDUL RAJAB
DEPARTMENT OF ELECTRICAL AND ELECTRONIC
ENGINEERING
GRADUATE SCHOOL OF ENGINEERING
KYUSHU INSTITUTE OF TECHNOLOGY
February 2017


EARLY DETERIORATION AND ITS DETECTION OF
NATURAL MONOESTER TYPE INSULATING OIL USED
FOR TRANSFORMER
変圧器用天然モノエステル絶縁油の早期劣化とその検出
BY
ABDUL RAJAB
(Student ID: 13589503)
Supervisor: Prof. Masayuki HIKITA
Thesis
Submitted to the Graduate School of Engineering
Kyushu Institute of Technology
In fulfillment of the requirements for the Degree of
Philosophy Doctoral Degree (Ph.D.) in Electrical Engineering
In the
DEPARTMENT OF ELECTRICAL AND ELECTRONIC
ENGINEERING
GRADUATE SCHOOL OF ENGINEERING
KYUSHU INSTITUTE OF TECHNOLOGY
February 2017


iii
Dedication
I dedicate this thesis to my mother Indaratia, whose prayers always accompany me
for the whole of my life. I also dedicate this thesis to my late father. May Allah
enlarges his graves, forgives his entire mistakes, bestows His Mercy on him and
grants him the paradise. I also dedicate this thesis to my beloved family; my wife
Lia Yuliania, my children Umar Zaid Abdullah, Ali Ahsan Abdullah, and Naila
Mumtaz Abdullah for all their sacrifices and understanding during the period of
study, and to my brothers and sisters.


iv
Acknowledgment
In the name of Allah, the Most Gracious, the Most Merciful. I am deeply indebted to my research advisor, Professor Dr. Masayuki Hikita,
Department of Electrical and Electronics Engineering, Kyushu Institute of Technology, for
all his insightful guidance, valuable discussion, patience and great encouragement. As a
student who should also take care of a family in addition to conducting experimental works,
having him as the advisor is a special gift. A great appreciation I would like to express to
Associate Professor Dr. Masahiro Kozako, Electrical and Electronics Engineering, Kyushu
Institute of Technology, and Dr. Motoo Tshucie for their generous advice, discussions and
technical assistance throughout this research work.
I would like to express my sincere gratitude to Professor Dr. Yasunori Mitani,
Professor Dr. Youichi Shimizu, and Professor Dr. Kazuhiro Toyoda, Kyushu Institute of
Technology for their valuable time, helpful comments, and encouragement in completing
this thesis.
I would like also to express special thanks to LION Corporation for a collaborative
research by providing materials, and to Dr. Takashi Suzuki, the person in charge of LION
Corporation, for all his valuable discussion and helpful comment to succeed this research.
I would also like to thank Assistant professor Imakire, all secretaries, my friend
Kyunghoon Jang, and all members of Professor Hikita & Kozako’s Laboratory, who have
offered generous support and gave full cooperation during the doctoral course period. In
addition, I also would like to thank all Indonesian and moslem communities in Kitakyushu
for all assistances and supports before and during my stay in Kitakyushu.
I would also like to thank Matsuoka sensei, the international student counselor of
Kyushu Institute of Technology for all of her assistance during the doctoral course period.
My high appreciation also goes to Ueha sensei, Mitsuhashi sensei and all senseis of
Ayamegaoka shogakko and Tobitaha chugakko for all attentions and assistances for my
children at their schools.
Last but not least, I would like to thank the Directorate General of Resources for
Research, Technology, and Higher Education, Ministry of Research, Technology, and
Higher Education, the Republic of Indonesia for the opportunity and financial support that
have been given to pursue the doctoral degree in Kyushu Institute of Technology.
Abdul Rajab


v
Abstract
Oil-filled transformers have been widely used for many decades, and proven to be
more efficient than transformers of dry type. Oil is used as an insulation, in conjunction
with solid insulation, in addition to its other function as a cooling medium. Mineral oil is
still the most popular oil, but there has been an emerging interest in using natural ester
(vegetable) oil during the last two decades. The main reasons are that natural esters are
readily biodegradable, non-toxic, and possess low fire risk due to their high flash and fire
points, hence, the oils are environmentally friendly. Moreover, the depletion of the resource
is not the case since vegetable oils are plentiful available in nature. In Japan, the Lion
Corporation developed a natural ester of monoester type insulating oil called palm fatty
acid ester (PFAE). The viscosity of PFAE is 0.6 times less than mineral oil makes the
cooling efficiency of the PFAE-immersed transformer better than that of mineral oil. The
oil can be expected to have better oxidation stability than that of the triglyceride type since
the oil contains only saturated fatty acid chains. However, the flash point of the PFAE is
lower than that of the triglyceride type.
This thesis deals with the investigation research on the early deterioration and its
detection methods of PFAE and other monoesters. The gas generations of the oils under
low temperature overheating and under partial discharge (PD) are investigated. The effect
of moisture content on the gas generation of PFAE and PD behavior of the oils are also
explored.
The low temperature overheating is conducted by heating the oils locally at
temperatures ranging from 200 to 300 oC. Local heating is realized using two ceramic
heaters immersed in the oil sample, fed by two DC power supplies. It is shown that natural
monoesters, in general, produce a higher amount of carbon monoxide (CO), but less amount
of methane (CH4) than the mineral oil does. It is also revealed that natural monoesters
having C=C bond in their hydrocarbon chain produce remarkable amount of ethane,
whereas those without C=C bond, and mineral oil of naphthenic type do not. It is then
disclosed that ethane generation, which is previously regarded as the key gas to distinguish
natural esters from mineral oil under thermal fault, is now clear as the difference between
oil having C=C bond in their hydrocarbon chains and those without C=C bond, irrespective
of the oil types. None of the existing DGA fault interpretation methods can be used to
interpret the low temperature overheating fault. Instead, the ratio of CO/CH4 is proposed.

vi
The gas generation under PD is investigated by applying an AC high voltage of 20
kV on a needle-plane electrode configuration immersed in the oil sample. PD pulses are
detected using RC detector, and the detector is connected to an oscilloscope for
measurement. It is found that PFAE does not produce hydrogen, or produce hydrogen in
not significant amount. This differs from that in mineral oil stressed with PD at which
hydrogen is usually found, as mentioned in the literature. It is also obtained that the change
in relative moisture content up to 17 % does not cause a significant difference in PD
behavior of the oil, but the change in PD number does. Among existing DGA fault
interpretation methods, only Duval Triangle method can be used, resulting mainly in the
overestimated interpretation. PD faults mainly considered as the discharge of high energy.
The effect of moisture content on PD behavior of PFAE is studied using two PFAE
samples of different conditions, dry and moist samples. The needle-plane electrode
configuration is still used, but the PD detector used to detect PD pulses is a combination of
R detector, detecting impedance (DI) and a PD monitoring device (CD6). It is observed
that the presence of moisture intensifies PD activities of PFAE oil. The PD number
increases drastically, and occurs mainly at the negative polarity of the AC applied voltage.
The positive PDs still occur, but with a drastic decrease in PD number and with a slight
decrease in PD charge. It is proposed that the change in PD behavior is due to the electronic
affinity of water molecules. A mechanism is then proposed, and the schematic
representation is presented.

vii
Table of Contents
Abstract ............................................................................................................................... v Table of Contents .............................................................................................................. vii List of Figures .................................................................................................................... xi List of Tables .................................................................................................................... xv Chapter 1 ............................................................................................................................. 1 Introduction ......................................................................................................................... 1
1.1 Background ......................................................................................................... 1 1.2 Problem Statement .............................................................................................. 4 1.3 Objectives of the Research .................................................................................. 5 1.4 Thesis Outline ..................................................................................................... 6
References ........................................................................................................................... 8 Chapter 2 ........................................................................................................................... 11 Literature Review .............................................................................................................. 11
2.1 Introduction ....................................................................................................... 11 2.2 Classification of Oil Insulation ......................................................................... 11
2.2.1 Mineral Oil ................................................................................................ 12 2.2.2 Synthetic Oils ............................................................................................ 14 2.2.3 Vegetable (Natural Ester) Oil .................................................................... 15
2.3 Research and Development of Vegetable (natural ester)-Based Oil Insulation 17 2.3.1 Tri-ester (Triglyceride) .............................................................................. 17 2.3.2 Natural Monoester ..................................................................................... 20
2.4 Dissolved Gas Analysis of Natural Ester Oil .................................................... 22 2.5 Moisture Effect on Dielectric Properties of Oil Insulation ............................... 27
References ......................................................................................................................... 29 Chapter 3 ........................................................................................................................... 33 Gas Generation of Monoesters under Low Temperature Overheating ............................. 33
3.1 Introduction ....................................................................................................... 33 3.2 Experiment ........................................................................................................ 33
3.2.1 Samples ..................................................................................................... 33 3.2.2 Experimental Arrangement ....................................................................... 35 3.2.3 Sampling Procedure .................................................................................. 39 3.2.4 Experimental Procedure ............................................................................ 40
3.3 Results and Discussion ...................................................................................... 41

viii
3.3.1 Gases Generation Tendency ...................................................................... 41 3.3.2 Ethane Generation Phenomena ................................................................. 45 3.3.3 Hydrogen – Accompanying Gas ............................................................... 47
3.4 Fault Interpretation: CO/CH4 Ratio................................................................... 48 3.5 Summary ........................................................................................................... 49
References ......................................................................................................................... 50 Chapter 4 ........................................................................................................................... 53 Gas Generation of PFAE under Partial Discharge ............................................................ 53
4.1 Introduction ....................................................................................................... 53 4.2 Experiment ........................................................................................................ 53
4.2.1 Experimental Arrangement ....................................................................... 53 4.2.2 Oil Sampling Procedure ............................................................................ 56 4.2.3 Experimental Procedure ............................................................................ 57
4.3 Results and Discussion ...................................................................................... 58 4.3.1 Gas Generation under Different Moisture Content ................................... 58 4.3.2 Gas Generation under Different PD Number ............................................ 61
4.4 Fault Interpretation: Duval Triangle 3 (DT3) ................................................... 62 4.4.1 Gas Generation under Different Moisture Content ................................... 63 4.4.2 Gas Generation under Different PD Number ............................................ 64 4.4.3 Estimation of the Discharge Temperature ................................................. 65
4.5 Summary ........................................................................................................... 66 References ......................................................................................................................... 67 Chapter 5 ........................................................................................................................... 69 PD Behavior of PFAE under Different Moisture Content ................................................ 69
5.1 Introduction ....................................................................................................... 69 5.2 Preliminary Consideration ................................................................................ 69
5.2.1 PD Inception Voltage (PDIV) ................................................................... 70 5.2.2 PD Number and PD Charge versus Applied Voltage................................ 73
5.3 Experiment ........................................................................................................ 75 5.3.1 Experimental Arrangement ....................................................................... 75 5.3.2 Experimental Procedure ............................................................................ 76
5.4 Results ............................................................................................................... 77 5.4.1 PD Pulse Shape ......................................................................................... 77 5.4.2 Voltage Dependence of PD Number and PD Charge in Dry and Moist
Samples ..................................................................................................... 78 5.4.3 Phase Distribution of PD Pulses................................................................ 81
5.5 Discussion ......................................................................................................... 82

ix
5.5.1 Mechanism ................................................................................................ 83 5.5.2 Practical Implication ................................................................................. 85
5.6 Summary ........................................................................................................... 85 References ......................................................................................................................... 87 Chapter 6 ........................................................................................................................... 89 Conclusions ....................................................................................................................... 89
6.1 Significant Findings .......................................................................................... 89 6.2 Future Works ..................................................................................................... 90
Appendix A ....................................................................................................................... 93 Temperature Control of Heaters ........................................................................................ 93 Appendix B ....................................................................................................................... 95 Gas Sampling Procedure ................................................................................................... 95 Appendix C ....................................................................................................................... 98 Gas Amount Calculation ................................................................................................... 98 Appendix D ..................................................................................................................... 101 Charge Calibration for PD Measurement ........................................................................ 101 Appendix E ..................................................................................................................... 104 Matlab Codes .................................................................................................................. 104 Appendix F ...................................................................................................................... 109 Flowcharts of Investigation Procedures .......................................................................... 109 Publications ..................................................................................................................... 111

x

xi
List of Figures
Figure 1. 1 The percentages of failure number and the corresponding costs of the
transformer's losses in the USA from 1997 to 2001 [3]. ................................ 2
Figure 1. 2 The number of distribution transformers filled with natural ester
worldwide [10]. .............................................................................................. 3
Figure 2. 1 Chemical structures of the paraffinic hydrocarbons .................................... 12
Figure 2. 2 Chemical structures of the naphthenic hydrocarbons .................................. 13
Figure 2. 3 Chemical structures of the aromatic hydrocarbons ...................................... 13
Figure 2. 4 Chemical structure of silicon oil .................................................................. 14
Figure 2. 5 Chemical structure of synthetic ester [1] ..................................................... 15
Figure 2. 6 Timeline of events and the development of synthetic ester insulating oil
[3]. ................................................................................................................ 15
Figure 2. 7 Chemical structure of vegetable (natural ester) oil [1] ................................ 16
Figure 2. 8 Biodegradation rate of some insulation oils [9] [10] ................................... 16
Figure 2. 9 Timeline of events and the development of natural ester insulating oil [3] . 18
Figure 2. 10 Chemical Structures of Natural Esters ......................................................... 21
Figure 2. 11 Key gases and their percentages .................................................................. 23
Figure 2. 12 Duval Triangle 1 (Classical Duval Triangle) ............................................... 24
Figure 2. 13 The Duval Triangle 3 which is specially developed for Biotemp ................ 25
Figure 3. 1 Chemical structure of monoesters; (a) M12, (b) 2H-08, and (c) M182 ....... 34
Figure 3. 2 Experimental setup for low temperature overheating .................................. 35
Figure 3. 3 DC power supplies ....................................................................................... 36
Figure 3. 4 Photograph of Controller ............................................................................. 36
Figure 3. 5 Oil chamber used for low temperature overheating experiment. ................. 37
Figure 3. 6 Heating element, consist of two ceramic heaters (white color) which are
clamped with two copper plates; Thermocouple is inserted between two
ceramics for heater’s temperature measurement; (a) photographic view,
(b) schematic view ....................................................................................... 38
Figure 3. 7 Graph recorder ............................................................................................. 38
Figure 3. 8 Gas chromatograph (GC-2014 model, Shimazu Corp. Japan) ..................... 39
Figure 3. 9 Schematic diagram for oil filling in process ................................................ 40

xii
Figure 3. 10 Generation rates of combustible gases of natural monoesters and mineral
oil under low thermal faults. ........................................................................ 41
Figure 3. 11 How the carbon monoxide present in (mineral) oil [14] .............................. 42
Figure 3. 12 Generation rates of carbon monoxide of natural monoesters and mineral
oil under low thermal faults. ........................................................................ 43
Figure 3. 13 Generation rates of methane of natural monoesters and mineral oil under
low thermal faults ........................................................................................ 44
Figure 3. 14 Generation rates of ethane of natural monoesters and mineral oil under
low thermal faults ........................................................................................ 46
Figure 3. 15 The simplest omega-3 unsaturated fatty acid, linolenic acids (C18:3); (a)
Chemical structure, (b) Carbon atom numbering in its structure. ................ 47
Figure 3. 16 Generation rates of hydrogen of natural monoesters and mineral oil under
low thermal faults ........................................................................................ 48
Figure 3. 17 The variations of CO/CH4 ratio against temperature change for different
kinds of oils. ....................................................................................... 49
Figure 4. 1 Experimental setup for PD measurement..................................................... 54
Figure 4. 2 The high voltage transformer and the resistor used for PD measurement. .. 54
Figure 4. 3 The coupling capacitor ................................................................................. 55
Figure 4. 4 Oil chamber used for PD measurement (a), and electrode configuration
(b). ................................................................................................................ 55
Figure 4. 5 RC detector for detecting PD pulse, (a) photographic view, (b) equivalent
circuit ........................................................................................................... 56
Figure 4. 6 Oscilloscope, Tektronix, DPO 7504 type .................................................... 56
Figure 4. 7 Schematic diagram of oil filling process...................................................... 57
Figure 4. 8 Generated combustible gases in PFAE samples of different moisture
content levels by PD at 20 kV with PD number of 8000.. ........................... 59
Figure 4. 9 Generated combustible gases by PD at 17 in various natural monoesters
and mineral oil. The graph was reproduced from [5]. ................................. 60
Figure 4. 10 Generated combustible gases by PD at 25 kV in two kinds of natural
monoesters. The graph was reproduced from [6]. ....................................... 60
Figure 4. 11 Generated combustible gases/pC in PFAE samples of different moisture
content levels by PD at 20 kV with PD number of 8000 ............................. 61
Figure 4. 12 Generated combustible gases by PD at 20 kV under different PD number
in three PFAE samples having relatively constant moisture content ........... 62

xiii
Figure 4. 13 Fault interpretation of PFAE samples of different moisture content,
stressed by PD at 20 kV with PD number of 8000, using Duval Triangle
3 (DT3) method. .......................................................................................... 63
Figure 4. 14 Fault interpretation of PFAE samples, stressed by PD at 20 kV with
different PD number, using Duval Triangle 3 (DT3) method. ..................... 64
Figure 4. 15 The total and the average PD charge produced by discharge in PFAE
samples stressed with different number of PD. ............................................ 65
Figure 5. 1 Addition of water into the oil sample to realize the moist sample;
Photographic view, (b) the chamber containing a stirrer. ............................ 70
Figure 5. 2 PDIV of PFAE under various moisture content levels ................................ 72
Figure 5. 3 Breakdown Voltage of clean insulating oils under various relative
moisture contents reproduced from [6]. ....................................................... 72
Figure 5. 4 Comparison between PDIV and BDV of PFAE oil. BVD curve is
reproduced from [7]. .................................................................................... 73
Figure 5. 5 Relationship between PD number and applied voltage for 2 minutes in
PFAE of different moisture content ............................................................. 74
Figure 5. 6 The relationship between PD charge and applied voltage for 2 minutes in
PFAE of different moisture content. ............................................................ 74
Figure 5. 7 Experimental setup for PD measurement..................................................... 75
Figure 5. 8 PD detectors; (a) R detector, (b) Detecting impedance, and (c) CD6 .......... 76
Figure 5. 9 Examples of PD current pulse shape and integrated PD charge in dry
PFAE sample, taken at 15 kVrms; (a) Negative PD, and (b) Positive PD; .. 78
Figure 5. 10 Relationship between PD number and applied voltage for two minutes in
PFAE; (a) dry sample, (b) moist sample ...................................................... 79
Figure 5. 11 Relationship between PD charge and applied voltage for two minutes in
PFAE; (a) dry sample, (b) moist sample. ..................................................... 80
Figure 5. 12 Phase distribution of PD pulses in dry PFAE sample for 120 cycles of
applied voltage, taken at 20 kVrms. ............................................................. 81
Figure 5. 13 Phase distribution of PD pulses in moist PFAE sample for 120 cycles of
applied voltage, taken at 20 kVrms. ............................................................. 82
Figure 5. 14 Schematic demonstration of the mechanism of the effect of water
molecules on PD behavior of PFAE oils. Fef and Fen represent forces
due to the electric field application and due to the electronic affinity of
water molecule. ............................................................................................ 84

xiv
Figure 5. 15 Schematic demonstration of the movement tendency of water molecule
under influence of electric field. Attraction forces of water molecules
under electric field are aligned that lead to the enhancement of resultant
force (FenR). ................................................................................................ 85

xv
List of Tables
Table 1. 1 Characteristics of monoester (PFAE), tri-ester, and synthetic ester, and
comparison with mineral oil [19]. .................................................................. 4
Table 2. 1 The use of insulating oils in different transformer types [3] ........................ 12
Table 2. 2 Overview of properties of transformer insulating fluids [3]. ....................... 17
Table 2. 3 As-Received new fluid property requirements [13] ..................................... 19
Table 2. 4 Some properties of PFAE (monoester) and the corresponding values of
FR3 (trimester) and mineral oil .................................................................... 22
Table 2. 5 Fault interpretation according to IEC 60599 method ................................... 24
Table 3. 1 Some properties of tested oils ...................................................................... 35
Table 3. 2 The temperature of oils at the end of thermal test at various temperature
levels of the heater ....................................................................................... 44
Table 4. 1 PD charge of PFAE samples of different moisture content levels. .............. 61
Table 4. 2 The percentage of Duval gases in PFAE samples having different
moisture content stressed with PD at 20 kV, with 8000 PD number. .......... 63
Table 4. 3 The percentage of Duval gases in PFAE samples stressed with three
different number of PDs .............................................................................. 64
Table 4. 4 Generated gases, CO/CH4 ratio, and the estimated temperature of PD
stressed PFAE samples ................................................................................ 66
Table 5. 1 Moisture content of PFAE samples ............................................................. 70
Table 5. 2 PDIV of PFAE samples of different moisture content. ............................... 71

xvi

Chapter 1: Introduction
Kyushu Institute of Technology, Dept. of Electrical and Electronics Engineering 1
Chapter 1
Introduction
1.1 Background The transformer is one of the most important and valuable components in electric
power system as it plays a vital role in transmitting and distributing electric power from
generating unit to the electric load. Keeping them work at normal condition and preventing
them from early ended life are important since the loss of a critical unit can cause a large
impact on safety, reliability, and cost of the electric energy supply [1].
The reliability of a power transformer is largely determined by its insulation system
condition [2]. An investigation result on losses of transformers rated at 25 MVA and above,
for the period of 1997 through 2001 in the USA show that 24 out of 94 cases are due to the
insulation failures. The cost of insulation failure corresponds to the amount of
$149,967,277 out of $ 286,628,811, or about 52.3 % of total failure costs. If the failures
caused by oil contamination and by moisture are included then the number of insulation
failures becomes 29 cases, with the cost of $161,978,644, which corresponds to 30.9% of
total failure cases, and 56.5% of total failure costs. Figure 1.1 shows the percentage of
losses of the transformer due to the different causes of failure and the corresponding
percentage of failure costs [3]. The conditions monitoring and diagnostic of insulation
system of a transformer are, therefore, important issues to tackle with [4].
Oil-filled transformers have been widely used for a wide range of voltages and
power rating applications for many decades, and proven to be more efficient than
transformers of dry type. They have been implemented from medium voltage levels of
distributions to the ultrahigh voltage levels of transmissions systems [5]. Oil is used as
insulation, in conjunction with solid insulation, in oil filled transformer, in addition to its
other function as the cooling medium. Mineral oil is still the most popular oil [6], but there
has been an emerging interest in using natural ester (vegetable) oil during the last two
decades. The main reasons are that natural esters are nontoxic, readily biodegradable, and
possess low fire risk due to their high flash and fire points. Moreover, the depletion of the
resource is not the case since vegetable oils are plentiful available in nature [7] [8] [9]. The
distribution transformer filled with vegetable oil was installed for the first time in 1996,

Chapter 1: Introduction
Kyushu Institute of Technology, Dept. of Electrical and Electronics Engineering 2
and then followed by the first installation of vegetable oil filled power transformer in 2002
[10]. However, the main application of natural esters is still in distribution transformer, and
the number of distribution transformers filled with natural ester until 2009 is shown in
Figure 1.2. The natural esters that have been successfully implemented in transformers are
of triglyceride form, which is the original structure of the oils [5] [11].
Following the successful application of natural ester of triglyceride type as
insulation liquid in the transformer, the natural ester of monoester type was introduced for
the same purpose [12]. The Japanese chemical company Lion Corporation developed a new
type of insulating oil. It is palm fatty acid ester (PFAE), a monoester type insulating oil,
synthesized from palm oil [13]. The viscosity of PFAE is 0.6 times less than mineral oil
makes the cooling efficiency of a PFAE immersed-transformer better than that of mineral
oil. With the dielectric constant 1.3 times higher, the insulation characteristics of PFAE in
paper-and-oil composite insulation systems is better, resulting in size reduction in
comparison to the mineral oil immersed transformers. Having higher flash point causes the
PFAE safer from fire risk than mineral oil. Since the PFAE is synthesized from natural
ester it has high-level biodegradability and nontoxicity [14] [15]. PFAE shows a better
performance than mineral oil under both electrical aging and thermal aging [16] [17].
Figure 1 1 The percentages of failure number and the corresponding costs of the transformer's losses in the USA from 1997 to 2001 [3].

Chapter 1: Introduction
Kyushu Institute of Technology, Dept. of Electrical and Electronics Engineering 3
Oxidation stability tests performed based on Japanese Industrial Standard (JIS) C2101
showed that breakdown voltage and total acid value of PFAE after aging remained
unchanged at about 80 kV and 0.005 mg KOH/g, respectively. Minor negative effects of
aging on PFAE oil were found in moisture content which slightly rose from 15 ppm to
about 50 ppm, volume resistivity slightly decreased from 1012 - 1013 Ω・cm, and tan δ rose
to about 2% [18].
In comparison with other esters, the natural ester of tri-ester type (tri-ester) and
synthetic ester, PFAE has some advantages and disadvantages, as indicated in Table 1.1.
The PFAE has the same levels of biodegradability as that of tri-ester and synthetic ester,
which is superior to mineral oil, but the prices of all esters are also at the same levels, which
is inferior to mineral oil. The naturalness of PFAE is comparable with tri-ester, and is better
than that of synthetic ester, whereas its oxidation stability is comparable with synthetic
ester, and is better than tri-ester. The cooling property of the PFAE is better, but its fire
resistance is lower than other two esters.
Figure 1 2 The number of distribution transformers filled with natural ester worldwide [10].

Chapter 1: Introduction
Kyushu Institute of Technology, Dept. of Electrical and Electronics Engineering 4
1.2 Problem Statement During the operation, the transformer insulations are exposed to the stresses like
thermal, electrical, mechanical, and chemical stresses that can degrade the insulations [20].
Combustible gases like hydrogen, methane, ethane, ethylene, acetylene, and carbon
monoxide, as well as carbon dioxide, are usually produced during the degradation process
and these degradation products are left in oil transformer. The oil can then be used as a
diagnostic tool, in addition to its main functions as insulation and as cooling medium [21].
One of the widely used methods to diagnose transformer insulation condition is Dissolved
Gas Analysis (DGA) and associated interpretation techniques [1]. The concentration, the
generation rate, and ratio of various generated gases are used to estimate the type and the
severity of fault which took place [22] [23].
Natural monoester has been implemented in oil filled distribution transformer and
is intended to extend their application to the higher voltage of power transformer [23]. The
need for diagnosis method to assess their performance in service becomes very important.
This is the motivation of the research works presented in this thesis. Generated gases by
thermal and electrical stresses in natural monoesters are investigated. Particular attention
is paid to the early stage of deterioration of the oil, i.e. the deteriorations due to the low
temperature overheating, the low thermal faults having temperatures range up to 300 oC,
and due to the partial discharge. Detection at the early stage of deterioration will help to
prevent insulation from being damage which could lead to the early end of equipment's life.
Table 1. 1 Characteristics of monoester (PFAE), tri-ester, and synthetic ester, and comparison with mineral oil [19].
Property PFAE Tri-ester Synthetic Ester
Biodegradability ◎ ◎ ◎ Naturalness ◎ ◎ ○ Oxidation stability ◎ ○ ◎ Fire resistance ○ ◎ ◎ Cooling property ○ △ △ Price △ △ △
◎: Superior to mineral oil ○: Comparable with mineral oil △: Inferior to mineral oil

Chapter 1: Introduction
Kyushu Institute of Technology, Dept. of Electrical and Electronics Engineering 5
It is a common field practice in Japan that moisture content of an oil is not strictly
controlled before being used in distribution transformers. It is also well known that
moisture content of transformer oil in service increases over the time. Water is one of a
degradation product of oxidized oil as well as that of paper insulation [24] [25]. Moisture
ingression could also happen when insufficient dry air entering the transformer’s tank, or
when there was a leakage on the gasket [26]. In addition, natural ester was reported to
attract more moisture than mineral oil from cellulose in oil/paper insulating system under
thermally aged condition [27] [28]. The presence of moisture in the transformer is known
to decrease both mechanical and electrical strengths of transformer insulation, thus degrade
the overall performance of the transformer [29]. The effect of moisture content on the
partial discharge (PD) behavior of PFAE is then important to be investigated.
Based on the above explanations, then the problems need to be answered in this
thesis are:
1. Can the mineral oil-based DGA fault interpretation methods be implemented for
interpreting low temperature overheating fault in natural monoester type insulating
oil?
2. Can the mineral oil-based DGA fault interpretation methods be implemented for
interpreting partial discharge fault in natural monoester type insulating oil?
3. Does the presence of moisture in relatively high concentration affect PD behavior of
monoester type insulating oil?
1.3 Objectives of the Research The investigations are conducted to answer the problems stated in the problem
statement above, and the objectives of this research can be broken down as follows:
1. To study gasses generated by natural monoesters type oil insulation under low
temperature overheating and under partial discharge.
2. To evaluate the applicability of mineral oil-based DGA fault interpretation methods
under low temperature overheating and partial discharge for natural monoester type
insulating oil.
3. To study moisture content effect on PD behavior of natural monoester type insulating
oil.

Chapter 1: Introduction
Kyushu Institute of Technology, Dept. of Electrical and Electronics Engineering 6
1.4 Thesis Outline The contents of this thesis are organized in six chapters, and the explanations of
each chapter are as follows:
Chapter 1: Contains a brief description of the research background, the problem statement,
the objective of the research, and the outline of the thesis.
Chapter 2: Contains a brief description of a literature review. It covers the classification of
insulation oils, research and development of vegetable (natural ester) oil-based
insulating liquid. Particular attention is paid on the natural esters of monoester
type, which is the main sample used throughout the experimental research. The
dissolved gas analysis (DGA) fault interpretation methods, as well as the effect
of moisture content on dielectric properties of insulations oil are also reviewed.
Chapter 3: Contains a brief explanation of the low temperature overheating. This includes
the experimental setup and procedures used in the experiment, the distribution
of generated gases, the main gases generated by each type of investigated oils,
and comparison of generated gases by group of oils with different molecular
structure, as well as that with the results reported in literature. Particular
attentions are paid on the results which significantly differ from those found in
the literature. The proposal of the use of CO/CH4 ratio to estimate heating
temperature in insulation oils under low temperature overheating is presented
in this chapter.
Chapter 4: Contains a brief description of the experimental setup, results and discussion on
generated gases by PD in monoester type oil insulation. This includes the
distribution of generated gases, the main generated gases, and comparison with
other experimental results reported in literatures. The DGA interpretation
methods, which are well established for mineral oil, are evaluated in terms of
their applicability for monoester type insulation oil in this chapter. The CO/CH4
ratio, which is previously developed for estimating the temperature of localized
overheating, is used to predict the equivalent temperature of partial discharge.
Chapter 5: Provides firstly an explanation of preliminary consideration on the experimental
method used for detecting PD behavior under different moisture content. The
chapter then continues with a brief description of the experimental setup, results
and discussion on the effect of moisture content on PD behavior of monoester
oil, including partial discharge inception voltage (PDIV), PD charge, PD

Chapter 1: Introduction
Kyushu Institute of Technology, Dept. of Electrical and Electronics Engineering 7
number, and phase distribution of PD pulses. A mechanism of how water
molecules affect PD behavior, as well as the schematic demonstration of the
mechanism is also proposed in this chapter.
Chapter 6: Contains conclusions drawn from the investigation results. It includes the
significant findings obtained in this research, and provides suggestion for future
work in related topic.

Chapter 1: Introduction
Kyushu Institute of Technology, Dept. of Electrical and Electronics Engineering 8
References [1] Abdul Rajab, Motoo Tsuchie, Masahiro Kozako and Masayuki Hikita, "Study on low
temperature overheating and Thermal Properties of Natural ester Oils," in JPI, Kyoto, pp. 6-11, 2014.
[2] A. Raymon, P. S. Pakianathan, M. P. E. Rajam and R. Karthik, "Enhancing the Critical Characteristics of Natural Esters with Antioxidants for Power Transformer Applications," IEEE Transactions on Dielectrics and Electrical Insulation, vol. 20, no. 3, pp. 899-912, 2013.
[3] W. H. Bratley, "Analysis of Transformer Failures," in The 36th Annual Conference of International association of Engineering Insurers, Stockholm, pp. 1-12, 2003.
[4] Motoo Tsuchie, Masahiro Kozako, Masayuki Hikita and Ei Sasaki, "Modeling of Early Stage Partial Discharge and Overheating Degradation of Paper-oil Insulation," IEEE Transactions on Dielectrics and Electrical Insulation, vol. 21, no. 3, pp. 1342-1349, 2014.
[5] C. P. McShane, "Vegetable Oil Based Dielectric Coolant," IEEE Industrial Magazine, pp. 34-41, 2002.
[6] H. M. Wilhelm, L. Tulio, R. Jasinski and G. Almeida, "Aging Markers for In-service Natural Ester-based Insulating Fluids," IEEE Transactions on Dielectrics and Electrical Insulation, vol. 18, no. 3, pp. 714-719, 2011.
[7] Daniel Martin, Nick Lelekakis, Wenyu Guo and Yuriy Odarenko, "Further Studies of a Vegetable-Oil-Filled Power Transformer," IEEE Electrical Insulation Magazine, vol. 27, no. 5, pp. 6-13, 2011.
[8] T.V. Oommen, "Vegetable Oils for Liquid-Filled Transformers," IEEE Electrical Insulation Magazine, vol. 18, no. 1, pp. 6-11, 2002.
[9] M. Rafiq, Y. Z. Lv , Y. Zhou, K.B. Maa, W. Wang, C. R. Li and Q. Wang, "Use of Vegetable Oils as Transformer oils – a Review," Renewable and Sustainable Energy Reviews, vol. 52, pp. 308-324, 2015.
[10] CIGRE W. G. A2.35, "Experience in Service with New Insulating Liquid," CIGRE , 2010. [11] T. V. Oommen, C. C. Claiborne , E. J. Walsh and J. P. Baker, "A New Vegetable OilL Based
Transformer Fluid: Development and Verification," in Conference on Electrical Insulation and Dielectric Phenomena, Victoria, pp. 308-312, 2000.
[12] Abdul Rajab, Motoo Tsuchie, Masahiro Kozako, Masayuki Hikita and Takashi Suzuki, "PD Properties and Gases Generated by Palm Fatty Acids Esters (PFAE) Oil," in International Conference on Dielectric, Montpellier, pp. 816-819, 2016.
[13] Y. Ohki, "Development of High-Performance Environmentally Friendly Palm Fatty Acid Ester Insulating Oil for Transformers," IEEE Electrical Insulation Magazine, vol. 27, no. 3, pp. 55-57.
[14] T. Kanoh , H. Iwabuchi , Y. Hoshida , J. Yamada and T. Hikosaka, "Analyses of Electro-Chemical Characteristics of Palm Fatty Acid Esters as Insulating Oil," in ICDL, pp. 1-4, 2008.
[15] T. Suzuki, R. Oba, A. Kanetani, T. Kano, T. Tamur, M. Kato, S. Watanabe, Y. Kasahara and M. Iwahashi, "Consideration on the Relationship between Dielectric Breakdown Voltage and Water Content in Fatty Acid Esters," in ICDL, pp. 1-4, 2011.
[16] Yanuar Z. A., M. H. Ahmad, K. Y. Lau, Noor Khairin M. , Lim W. H. and Yeong S. K., "A Comparative Study on the Effect of Electrical Ageing on Electrical Properties of Palm Fatty Acid Ester (PFAE) and FR3 as Dielectric Materials," in IEEE International Conference Power & Energy (PECON), pp. 128-133, 2014.
[17] T. Suzuki, T. Kana, F. Kurihara, A. Kanetani and S. Hatada, "Comparative Study of the Insulation Paper Aging in Palm Fatty Acid Ester (PF AE) and Mineral Oil," in ICDL, pp. 1-4, 2014.
[18]
T. Kano, T. Suzuki, R.Oba, A. Kanetani and H.Koide, "Study on the Oxidative Stability of Palm Fatty Acid Ester (PFAE) as an Insulating Oil for Transformers," in ISEI, pp. 22-28, 2012.

Chapter 1: Introduction
Kyushu Institute of Technology, Dept. of Electrical and Electronics Engineering 9
[19] Takaaki Kano, Seiichi Nishikawa, “Report on the Activity in Sub-committee of Standard Specification for Esters Insulating Oil” the 35th JPI Technical Meeting on Insulating Oil Section, p. 58, 2015.
[20] Ruijin Liao, Jian Hao, George Chen, Zhiqin Ma and Lijun Yang, "A Comparative Study of Physicochemical, Dielectric and Thermal Properties of Pressboard Insulation Impregnated with Natural Ester and Mineral Oil," IEEE Transactions on Dielectrics and Electrical Insulation, vol. 18, no. 5, pp. 1626-1637, 2011.
[21] I. Höhlein-Atanasova and Rainer Frotscher, "Carbon Oxides in the Interpretation of Dissolved Gas Analysis in Transformers and Tap Changers," IEEE Electrical Insulation Magazine, vol. 26, no. 6, pp. 22-26, 2010.
[22] Dongjin K. and Kyosun K., "The Criteria of Dissolved Gas Analysis in Natural ester Fluid," in CMD, pp. 901-904, 2012.
[23] D. Martin, N. lelekakis, V. Davidov and Y. Odarenko, "Preliminary Results for Dissolved Gas Levels in a Vegetable Oil-Filled Power Transformer," IEEE Electrical Insulations Magazine, vol. 26, no. 5, pp. 41-47, 2010.
[24] S. Singha, R. Asano Jr., G. Frimpong, C. C. Claiborne and D. Cherry, "Comparative Aging Characteristics between a High Oleic Natural Ester Dielectric Liquid and Mineral Oil," IEEE Transactions on Dielectrics and Electrical Insulation, vol. 21, no. 1, pp. 149-158, 2014.
[25] C. Perrier, M.-L. Coulibaly and M. Marugan, "Efficiency of ageing markers for different transformer insulation systems," in IEEE International Conference on Dielectric, pp. 824-827, Montpellier, 2016.
[26] Z. Liu, Q. Liu, Z. D. Wang, P. Jarman, Ch. Krause, P. W. R. Smith and A. Gyore, "Partial Discharge Behavior of Transformer Liquids and Influence of Moisture Content," in IEEE International Conference on Liquid Dielectrics, pp. 1-4, Bled, 2014.
[27] C. P. McShane, K. J. Rapp, J. L. Corkran, G. A. Gauger and J. Luksich, "Aging of Kraft Paper in Natural ester Dielectric Fluid," in IEEE International Conference on Dielectric Liquids, pp. 173-177, Graz, 2002.
[28] R. K.J., McShane and Luksich, "Interaction Mechanism of Natural Ester Dielectric Fluid and Kraft paper," in IEEE Conference on Dielectric Liquids, pp. 393-396, Coimbra, 2005.
[29] Y. Du, V. Mamishev, B. C. Lesieutre, M. Zahn and S. H. Kang, "Moisture Solubility for Differently Conditioned Transformer Oils," IEEE Transactions on Dielectrics and Electrical Insulation, vol. 8, no. 5, pp. 805-811, 2001.

Chapter 1: Introduction
Kyushu Institute of Technology, Dept. of Electrical and Electronics Engineering 10
Chapter 2: Literature Review
Kyushu Institute of Technology, Dept. of Electrical and Electronics Engineering 11
Chapter 2
Literature Review
2.1 Introduction This chapter is intended to provide an overview of the development of researches
related to the topics studied in this thesis and the position of this research in the research
constellation in the worlds. It begins with the classification of the oil insulation by including
natural ester as a new entity and ends with the review of the specific topics related to those
addressed in this thesis.
2.2 Classification of Oil Insulation The idea of using mineral oil as insulator and coolant that could make transformers
smaller in size and more efficient was patented by Elihu Thomson in 1882. The idea was
then realized in 1892 when General Electric produced the first known mineral oil-filled
transformer [1]. Up to this day, mineral oil derived from petroleum products is still the
most widely used oil as insulation in the oil filled transformer. The oil provides the best
compromise between cost and performance [1]. The oil also has a good compatibility with
other materials used in the construction of transformer. In addition, other alternatives to
mineral were used for special applications. Silicone oils and high molecular weight
hydrocarbons (HMWH) were preferable for applications that require fire safety property.
Synthetic ester dielectric fluids, most commonly aliphatic polyol esters, are used mainly in
special applications such as traction and mobile transformers, due to their high cost
compared to other less-flammable fluids. Moreover, synthetic esters are more readily
biodegradable than mineral oil and HMWH fluids [2]. The summary of main application
of insulating oils is listed in Table 2.1 [3].

Chapter 2: Literature Review
Kyushu Institute of Technology, Dept. of Electrical and Electronics Engineering 12
In general, insulation oils can be classified into three main groups: mineral,
synthetic and natural ester (vegetable) oils [4].
2.2.1 Mineral Oil Mineral oils are extracted from petroleum crude oils through a vacuum distillation
process. The distillate is then subjected to one or more number of processes such as solvent
extraction, sulfuric acid extraction, earth filtration, hydrogenation, re-distillation, filtration,
and dehydration. The intent is to remove waxes, sulfur, nitrogen, and oxygen containing
compounds and aromatic compounds. Sufficient aromaticity must remain, however, to
maintain satisfactory gas absorbing capability and oxidation stability [5]. They are mostly
composed of hydrocarbon compounds and other minor compounds like sulfur compounds,
nitrogen, and oxygen. In general, mineral oils can be split into three major groups:
paraffinic, naphthenic and aromatic hydrocarbons [5].
(1) Paraffinic Hydrocarbons
The paraffinic hydrocarbons are saturated hydrocarbon compounds, which can be
linear or branched hydrocarbon chains, and have a chemical formula of CnH2n+2. Figure
2.1 shows the chemical structure of the paraffinic oils [5].
Table 2. 1 The use of insulating oils in different transformer types [3]
Application Mineral Oil
Silicon Oil
Synthetic Ester
Natural Ester
Power transformers ◎ △ ○ ○ Traction transformers ◎ ◎ ◎ △ Distribution transformers ◎ ◎ ◎ ◎ Instrument transformers ◎ △ △ △
◎: Largely used ○: Used but less common △: Currently not used
(a) Linear type (b) Branched type.
Figure 2. 1 Chemical structures of the paraffinic hydrocarbons

Chapter 2: Literature Review
Kyushu Institute of Technology, Dept. of Electrical and Electronics Engineering 13
(2) Naphthenic Hydrocarbons
The naphthenic hydrocarbons have a saturated cyclic structure. These materials vary
in complexity from cyclohexane to multiple fused ring structures, which can also
contain alkyl substitution. Figure 2.2 shows the chemical structure of naphthenic
hydrocarbons [5].
(3) Aromatic Hydrocarbons
The forms are very similar to naphthenic hydrocarbon, but aromatic type contains C=C
bond within their cyclical structures and having a chemical formula of CnHn. Figure
2.3 shows the chemical structure of aromatic hydrocarbons [5].
(a) Single ring type. (b) Alkyl substituted type.
Figure 2. 2 Chemical structures of the naphthenic hydrocarbons
(a) Single ring type. (b) Alkyl substituted type.
Figure 2. 3 Chemical structures of the aromatic hydrocarbons

Chapter 2: Literature Review
Kyushu Institute of Technology, Dept. of Electrical and Electronics Engineering 14
2.2.2 Synthetic Oils A variety of oils such as organohalogenated oils like askarel (hexachlorobiphenyl),
(C4F9)3N and (C4F9)2O, silicon and synthetic ester oils can be grouped into the synthetic
oils. Organohalogen oils are considered as hazardous materials, and together with silicon
oil are listed as the non-environmentally friendly liquid, so as their application for electrical
apparatus are not preferable [1].
(1) Silicon Oil.
Silicon oil is composed of polydimethylsiloxane. The main component is silicon atom
bonded to the oxygen atom (Si-O) and organic groups which are mainly methyl
compounds, as shown in Figure 2.4. The value of n determines the molecular weight
of oil, as well as its viscosity. It varies from 0 to 2000 which correspond to the viscosity
variation between 0.65 to 2.5000.000 mm2/s [6].
Having a high flash point and self-extinguishing capability, the silicon oil possesses
lower fire risk compared to the conventional transformer oils. Silicon oil has a high
thermal stability, even when it comes in contact with the surrounding air. The
weaknesses are that viscosity of the oil is high, even at relatively higher temperatures,
and the tendency to form a gel under long exposure to arcing. In addition, the
biodegradability of the oil is low [6].
(2) Synthetic Ester.
Synthetic ester is composed of pentaerythritol-tetraester, as shown in Figure 2.5. The
oil is synthesized from pentaerythritol and fatty acids, having the chemical formula of
C(CH2CO2R)4. R is a group of alkyl containing 5 to 18 number of carbon atoms [1] [7].
The oil was used in a distribution transformer for the first time in 1978 and has been
used at 230 kV power transformer in 2003. Figure 2.6 shows the timeline of the
development and application of the synthetic ester in transformer [3].
Figure 2. 4 Chemical structure of silicon oil

Chapter 2: Literature Review
Kyushu Institute of Technology, Dept. of Electrical and Electronics Engineering 15
2.2.3 Vegetable (Natural Ester) Oil Vegetable (natural ester) oils, having the chemical structure shown in Figure 2.7,
are a new entity in oil insulation classification. Vegetable (natural ester) oil is known to
have very high rate of biodegradability [8]. In its original form, the vegetable oil is fully
biodegradable, but an addition of some additives to improve viscosity and oxidation
stability reduces its biodegradation rate to the levels of 95 – 97% [9] [10]. Figure 2.8 shows
Figure 2. 5 Chemical structure of synthetic ester [1]
Figure 2. 6 Timeline of events and the development of synthetic ester insulating oil [3].

Chapter 2: Literature Review
Kyushu Institute of Technology, Dept. of Electrical and Electronics Engineering 16
biodegradation rate of some insulation oils. It is shown that the biodegradation rate of
vegetable oil is at the same rate as that of the polyol (synthetic) ester.
An overview of the properties of the four different types of insulating oils is
presented in Table 2.2.
Figure 2. 7 Chemical structure of vegetable (natural ester) oil [1]
Figure 2. 8 Biodegradation rate of some insulation oils [9] [10]

Chapter 2: Literature Review
Kyushu Institute of Technology, Dept. of Electrical and Electronics Engineering 17
2.3 Research and Development of Vegetable (natural ester)-Based Oil Insulation
2.3.1 Tri-ester (Triglyceride) The environmentally friendly transformer oil became very desirable since the US
Environmental Protection Agency (EPA) released strict regulations regarding oil spills and
cleanup. Any large spill must be reported, particularly in water where the spill leaves sheen.
Synthetic ester which is highly biodegradable appears first [10]. The research and the
development of vegetable (natural ester) oil for oil filled transformer application had just
re-caught researcher's interest since the decade of the 90s [7], and had been successfully
implemented in small distribution transformer since the late 1990s [2] [3] (see Figure 2.9).
The emergence of this new insulation oil is motivated by the fact that the conventional
insulation oils such as mineral and synthetic oils are not environmentally friendly due to
their low rate of biodegradation. Some of them are even considered as hazardous chemical
material [1].
Table 2. 2 Overview of properties of transformer insulating fluids [3].
Name Mineral Oil Silicon Oil Synthetic
Ester Natural ester
Type Refined crude oil based distillate
Synthetic Synthetic Refined vegetable oil
Principal component
mixture of hydrocarbons
di-alkyl silicone polymer
Pentaerythritol tetra ester Triglyceride
source Purified from oil
Made from chemicals
Made from chemicals
Extracted from crops
Biodegradability Slow to biodegrade
Very slow to biodegrade
Readily biodegradable
Readily biodegradable
Oxidation stability Good stability Excellent Excellent
Oxidation susceptible
Water saturation at ambient (ppm)
55 220 2600 1100
Flash point, oC 160 – 170 >300 >250 >300 Fire point, oC 170 – 180 >350 >300 >350 Fire classification O K K K

Chapter 2: Literature Review
Kyushu Institute of Technology, Dept. of Electrical and Electronics Engineering 18
The original form of natural esters or vegetable oils is triglyceride, and the
chemical structure of the oils is shown in Figure 2.7. R1, R2, and R3 are fatty acids chains
of the same or different type. They can be saturated or unsaturated hydrocarbons [7]. In the
past, the natural esters in triglyceride form were not an interesting choice due to the intrinsic
disadvantages owned by the oils. The oils generally are more susceptible to oxidation, made
them less desirable compared to the mineral oil, though both oils were examined for
insulation purpose around the same time [1]. The higher viscosity and pour point of
triglyceride type natural esters and the plentiful availability of mineral oil at that time were
other factors affecting the choice of mineral oils rather than natural esters of triglyceride
type [10]. The higher viscosity and pour point are resulted from natural ester containing a
higher percentage of saturated fatty acid, which, on the other side, exhibit less vulnerable
to the oxidation. Contrarily, natural esters having a higher percentage of unsaturated fatty
acids have benefit due to the lower viscosity, but they are more susceptible to the oxidation
[11] [12]. However, since the environmental consideration becomes an important aspect in
selecting oil insulation in last two decades, the interest in natural esters was renewed. The
weaknesses of the oils were overcome by optimal selection of fatty acids composing the
three branches of triglyceride structures (R1, R2, and R3 in Figure 2.6), and proper choices
of additives added into the oils [11].
Vegetable (natural ester) oil which differs chemically from mineral oil requires
specification standard to ensure its use in the transformer or other electrical apparatus.
ASTM D6871, released in 2003, was the first specification standard available for unused
vegetable oil [13]. Table 2.3 lists the properties and the corresponding limit values of the
standard. In triglyceride form, natural ester typically has high flash and fire points [14] [7],
Figure 2. 9 Timeline of events and the development of natural ester insulating oil [3]

Chapter 2: Literature Review
Kyushu Institute of Technology, Dept. of Electrical and Electronics Engineering 19
and they are reflected by high threshold values in specification standard, 275 and 300 oC,
respectively. High viscosity is also typical for vegetable oil [15], and it is represented by
high specification limits of 50 and 15 mm2/s at 40 and 100 oC, respectively. As the
vegetable oil can hold much high water [16] [17] [18] [19], the water content is allowed up
to 200 ppm. In addition, vegetable oils have higher acidity than mineral oil [20], and the
acid number of the oil is tolerated up to 0.06 mg KOH/g. Natural ester also has a higher
dielectric constant compared to mineral oil [14] [19].
Table 2. 3 As-Received new fluid property requirements [13]
Property Limit ASTM Test
Method Physical Color, max 1.0 D 1500 Fire point, min, oC 300 D 92 Flash point, min, oC 275 D 92 Pour point, max, oC -10 D 97 Relative density, (specific gravity), 15 oC/15
oC, max 0.96 D 1298
Viscosity, max, mm2/s, at: D 445 or D 88 100 oC 15 40 oC 50 0 oC 500
Visual examination Bright & clear D 1254 Electrical Dielectric breakdown voltage at 60 Hz
Disc electrode, kV 30 D 877 VDE electrode, kV at D 1816
1 mm (0.04 in.) 20 2 mm (0.08 in.) 35
Breakdown voltage impulse condition, 25 oC, kV, needle-sphere, 25.4 mm (1 in)
130 D 3300
Dissipation factor at 60 Hz, max, % D 924 25 oC 0.20 100 oC 4.0
Gassing tendency, max, mL/min 0 D 2300 Chemical Corrosive sulfur Not Corrosive D 1275 Neutralization number, total acid number,
max, mg KOH/g 0.06 D974
PCB content, ppm Not detectable D 4059 Water content, max, mg/kg 200 D 1533

Chapter 2: Literature Review
Kyushu Institute of Technology, Dept. of Electrical and Electronics Engineering 20
Basic investigation on natural esters show that the AC breakdown voltage of the
oils is equal to or higher than mineral oils [17], but lightning impulse breakdown voltage
of the natural ester oil is lower [21]. However, a test on a sample containing 30 % relative
moisture content results in the similar lightning impulse breakdown voltage of both oil
types [21].
An accelerated thermal aging test also revealed that the breakdown voltage, flash
point and fire point of aged natural esters remained close to the new oil values [2], whereas
the breakdown voltage of aged mineral oil is lower than the new one [17] [22]. Kraft paper
aged in natural ester oil was found to take 5-8 times longer to reach the end of life point as
that aged in mineral oil at 170 oC, and about 2.5 times at 110 oC [23]. These imply that
natural esters have sufficient safety factors for use in a natural ester-filled transformer.
Moisture content, neutralization number, DC leakage, interfacial tension, and dissipation
factor were also higher in aged natural ester than those found in mineral oils, but these
values are typical for the oils and do not have a significant impact on transformer
performance [2].
Streamer inception voltages of esters, under needle plane electrode configuration
utilizing lightning impulse voltage, are comparable to [24], or lower than that of mineral
oils [25], and it applies for both polarities [24] [25]. At the same voltage levels after
inception, streamer in esters propagates faster and further, with more branches, thus induces
lower breakdown voltage in both polarities, than in mineral oil [24]. The inception voltages
of negative and positive streamer are very close, and the negative streamer appears at a
little lower voltage compared to the positive streamer [24], [25]. The conductivity of
positive streamers are higher, propagates faster and further, than those of negative
streamers [26]. At relatively small gaps lightning breakdown voltages of esters are
generally not less than 65% of that of mineral oil under both positive and negative polarities.
However, at large gaps (1000 mm), the positive lightning breakdown voltage of natural
ester is only about 40% of that of mineral oil, whereas negative lightning breakdown
voltage of natural ester is about 50% of that of mineral oil [24].
2.3.2 Natural Monoester
Although the optimal selection of fatty acids composition and the proper choice of
additives have been achieved, the viscosity and pour point of natural esters in triglyceride
form is still significantly high compared to that of mineral oils. The typical viscosity value
of triglyceride form natural ester-based insulating oils that have been commercially

Chapter 2: Literature Review
Kyushu Institute of Technology, Dept. of Electrical and Electronics Engineering 21
available, and mineral oils at 40 oC, measured based on ASTM D445 standard, are 33 and
9.2 mm2/s, respectively [1].
In order to obtain the less viscous natural ester-based insulating oil, natural
monoesters synthesized from fatty acids which are derived from palm oil, and other
vegetable oils are introduced. The chemical structure of the oils is shown in Figure 2.10.
R4 is fatty acid chains of saturated or unsaturated type, whereas R5 is alkyl of low molecular
weight, which is mostly of methyl (CH3) or ethyl (C2H5). The production of monoesters for
insulation purpose involves fatty acid methyl ester as an intermediate product based on the
equation (1). The methyl group is then substituted with the desired alkyl group through a
trans-esterification reaction based on equation (2). The appropriate selection of R4 and R5
further resulted in the oils having lower viscosities, and thus higher fluidity [27]. The
viscosity of commercially available natural monoester, PFAE, is 5.1 mm2/s, which is lower
than the typical viscosity value of mineral oils. The viscosities and other properties of
PFAE and a commercially available triglyceride type natural ester based-insulating liquid,
as well as those of mineral oil, are listed in Table 2.4. In addition, moisture content, acid
number and pour point also improve.
(1) Fat and Oil methanol Fatty acid methyl ester Glycerin
R4COOCH3 + R5OH R4COOR5 + CH3OH (2) Fatty acid methyl ester Alkyl alcohol Fatty acid alkyl ester Methanol
Fortunately, the change in chemical structure of natural esters from tri-ester to
monoester does not cause a significant decrease in the breakdown voltage of the oils. The
Figure 2. 10 Chemical Structures of Natural Esters
Chapter 2: Literature Review
Kyushu Institute of Technology, Dept. of Electrical and Electronics Engineering 22
breakdown voltages of one of the commercially available triglycerides natural ester-based
insulating oil, Envirotemp FR3, is 73 kV, whereas that of the commercially available
natural monoester, PFAE, is 81 kV (2.5 mm gap electrode) [28].
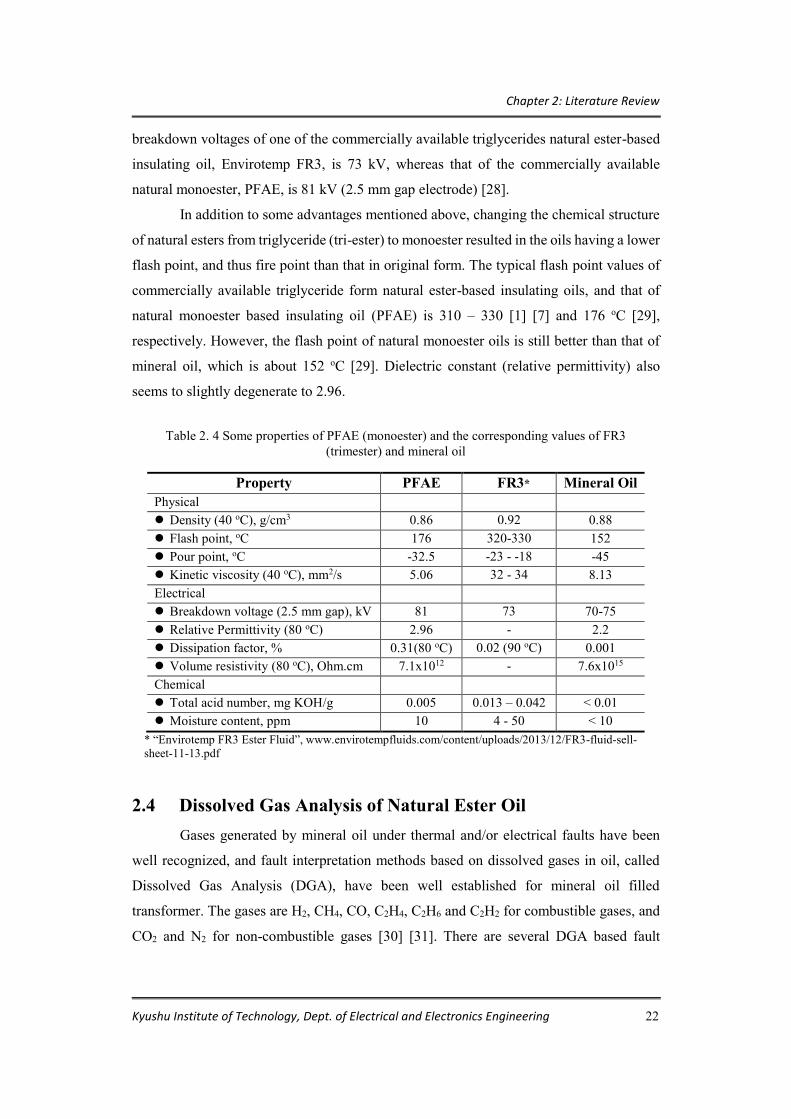
In addition to some advantages mentioned above, changing the chemical structure
of natural esters from triglyceride (tri-ester) to monoester resulted in the oils having a lower
flash point, and thus fire point than that in original form. The typical flash point values of
commercially available triglyceride form natural ester-based insulating oils, and that of
natural monoester based insulating oil (PFAE) is 310 – 330 [1] [7] and 176 oC [29],
respectively. However, the flash point of natural monoester oils is still better than that of
mineral oil, which is about 152 oC [29]. Dielectric constant (relative permittivity) also
seems to slightly degenerate to 2.96.
2.4 Dissolved Gas Analysis of Natural Ester Oil Gases generated by mineral oil under thermal and/or electrical faults have been
well recognized, and fault interpretation methods based on dissolved gases in oil, called
Dissolved Gas Analysis (DGA), have been well established for mineral oil filled
transformer. The gases are H2, CH4, CO, C2H4, C2H6 and C2H2 for combustible gases, and
CO2 and N2 for non-combustible gases [30] [31]. There are several DGA based fault
Table 2. 4 Some properties of PFAE (monoester) and the corresponding values of FR3
(trimester) and mineral oil
Property PFAE FR3* Mineral Oil Physical Density (40 oC), g/cm3 0.86 0.92 0.88 Flash point, oC 176 320-330 152 Pour point, oC -32.5 -23 - -18 -45 Kinetic viscosity (40 oC), mm2/s 5.06 32 - 34 8.13 Electrical Breakdown voltage (2.5 mm gap), kV 81 73 70-75 Relative Permittivity (80 oC) 2.96 - 2.2 Dissipation factor, % 0.31(80 oC) 0.02 (90 oC) 0.001 Volume resistivity (80 oC), Ohm.cm 7.1x10¹² - 7.6x10¹⁵ Chemical Total acid number, mg KOH/g 0.005 0.013 – 0.042 < 0.01 Moisture content, ppm 10 4 - 50 < 10
* “Envirotemp FR3 Ester Fluid”, www.envirotempfluids.com/content/uploads/2013/12/FR3-fluid-sell-sheet-11-13.pdf

Chapter 2: Literature Review
Kyushu Institute of Technology, Dept. of Electrical and Electronics Engineering 23
interpretation methods available, but the most commonly used methods are IEC 60599 ratio,
Duval triangle and the key gas methods [32]:
(1) Key Gas Method.
Each type of fault is identified by the key gas which is obtained from the percentage of
the gas based on total combustible gas dissolved in the oil. For instance, partial
discharge (PD) in mineral oil mainly produces H2, accompanied by a trace amount of
other hydrocarbon gases, so the key gas for PD is H2. The occurrence of PD in mineral
oil can be predicted if the percentage of the amount of hydrogen reaches 85 % of the
total combustible gases dissolved in the oil. The key gases for each type of faults and
the percentage of gas amount are summarized in Figure 2.11 [33].
(2) IEC 60599 Ratio Method.
Three different gas ratios are used as can be seen in Table 2.5. For each set interval of
ratio, the type of fault causing the generation of such gases can be obtained.
(a) Principal gas: ethylene (b) Principal gas: Carbon monoxide
(c) Principal gas: Hydrogen (d) Principal gas: Acetylene
Figure 2. 11 Key gases and their percentages

Chapter 2: Literature Review
Kyushu Institute of Technology, Dept. of Electrical and Electronics Engineering 24
(3) Duval Triangle Method.
The classical Duval Triangle or DT1 is shown in Figure 2.12. Each zone in the triangle
represents the fault type, and the interpretation plot is defined by the percentage of the
amount of three gases, CH4, C2H2, and C2H4. Recently, Duval developed a new triangle
version called Duval triangle 3 (DT3) to accommodate the application of non-mineral
oil. DT3 for biotemp is shown in Figure 2.13 [34].
Table 2. 5 Fault interpretation according to IEC 60599 method
Fault Type C2H2/C2H4 C2H4/H2 C2H4/C2H6 Partial discharge (PD) NS < 0.1 < 0.2 Discharge of low energy (D1) >1 0.1 – 0.5 >1 Discharge of high energy (D2) 0.5 – 2.5 0.1 – 1.0 >2 Thermal fault of low Temperature (T1) NS >1 <1 Thermal fault of medium Temperature (T2) <0.1 >1 1-4 Thermal fault of high Temperature (T3) 0.2 >1 >4
NS: Not specified
Figure 2. 12 Duval Triangle 1 (Classical Duval Triangle)

Chapter 2: Literature Review
Kyushu Institute of Technology, Dept. of Electrical and Electronics Engineering 25
Legend: PD : Partial discharge T1 : Thermal fault, temperature less than 300 oC T2 : Thermal fault, temperature between 300 oC and 700 oC T3 : Thermal fault, temperature greater than 700 oC D1 : Low energy discharge (sparking) D2 : High energy discharge (arcing) DT : Mix of Thermal and electrical faults
Legend:
PD : Partial discharge T1 : Thermal fault, temperature less than 300 oC T2 : Thermal fault, temperature between 300 oC and 700 oC T3 : Thermal fault, temperature greater than 700 oC D1 : Low energy discharge (sparking) D2 : High energy discharge (arcing) DT : Mix of Thermal and electrical faults
Investigation on the gases generated by natural ester oils to anticipate the use of
DGA method to diagnose the presence of faults in natural ester immersed transformer in
service has caught the interest of many researchers. The differences in the type of atom
composing oil molecule and in chemical structure with mineral oil could lead to the
difference in the type and the concentration of gases generated by vegetable oil under
thermal and/or electrical faults.
Figure 2. 13 The Duval Triangle 3 which is specially developed for Biotemp

Chapter 2: Literature Review
Kyushu Institute of Technology, Dept. of Electrical and Electronics Engineering 26
Thermal decomposition of vegetable oil produce the similar gases to that of mineral
oil [9]. The gases are hydrogen (H2) and hydrocarbon gases, in addition to carbon monoxide
(CO) and carbon dioxide (CO2) [32] [35]. Vegetable oil produces a larger amount of CO
and CO2, which is due to the presence of –COO- link in its molecular structure [7]. Carbon
monoxide and carbon dioxide are the key gases for thermal fault involving cellulose
degradation [36]. The higher the temperature, the smaller the ratio of CO2/CO is [37].
Nevertheless, another literature report that the amount of carbon dioxide developed in
natural esters is comparable to the amounts developing from mineral oil [38], while other
reports show a lower tendency of natural ester than mineral oils in the development of CO
[38] [39]. Moreover, natural ester was reported as generating less amount of methane than the
mineral oil does [32] [38] [39] [40]. Ethylene and acetylene start to appear at a higher
temperature (>400 oC) [37].
Differing from [7] and [9], instead of excessive amount of CO and CO2, other
literature report a higher amount of ethane (C2H6) produced by vegetable oil than that by
mineral oil under thermal faults [36] [37] [39] [41] [42] [43] [44]. Reference [37] claims
that a consensus has been achieved that ethane is produced in a higher amount by the natural
ester compared to that of the mineral oil under thermal fault. The ethane was then suggested
to be the key gas for natural ester under thermal fault [36] [39]. For mineral oil, the key gas
is methane under low temperature [41] [45], and ethylene at higher temperature [45].
Ethane is also found in the higher amount in the natural ester filled transformer in service
[43] [44], which is commonly developed according to peroxidation of lipids of omega-3
unsaturated fatty acid type [38]. However, natural ester develops higher amounts of
hydrogen and ethane than mineral oils under a normal operation condition of transformer
[39] [43] [46].
For electrical faults, the generation rate of fault gases was much higher in ester oil
than in mineral oil due to the much higher repetition rate of PD in natural ester oil, but the
generation rate per-unit energy is comparable [47]. Hydrogen is the key gas for partial
discharge, and acetylene for low energy discharge [36] [47]. The patterns of gases
generated under sparking fault using a lightning impulse waveform were also similar,
except carbon monoxide which is detected in significant amount in natural ester oil but
absent in mineral oil [35]. Hydrogen was the key gas in both liquids, followed by acetylene
[47]. The different results are reported in [40]. Although producing the same gases type,
the natural ester oils produce smaller quantities of dissolved gases than the mineral oil does.

Chapter 2: Literature Review
Kyushu Institute of Technology, Dept. of Electrical and Electronics Engineering 27
Acetylene was generated in the highest quantities, followed by hydrogen gas, ethylene, and
methane [40].
When interpreting the DGA results, the interpretation methods generally
underestimate thermal faults as low temperature fault, thus need adjustment to get the
correct fault interpretation [35]. In the classical Duval triangle, for example, the thermal
fault that should be in the region of T2 was diagnosed to be in the T1 region. Only Rogers
Ratios correctly places the faults into the thermal fault of medium temperature, T2 [35].
The different interpretation results are reported in [36]. There, the temperature range of the
fault is overestimated for the tests involving the ester. However, Duval triangle and IEC
methods, generally, are more applicable than the key gas method [36].
Hydrogen and acetylene are the main gases detected by the natural ester oil under
low energy discharges, confirming the applicability of key gases method [32]. The classical
Duval Triangle (DT1) method correctly identifies the low-energy arcing fault in [32] [36].
The application of IEC 60599 method also shows that the natural ester oils had equal
diagnoses, coherent with the type of stress applied to the oils [40]. The Dornenburg, Rogers
Ratios, Duval Triangle, Muller-Schliesing-Soldner, and IEC 60599 also correctly diagnose
sparking type gas as the discharge of low energy (D1), so no specific adjustment should be
made [35]. In general, it can be said that most of the DGA interpretation methods can be
used to detect electrical faults in natural ester oils.
2.5 Moisture Effect on Dielectric Properties of Oil Insulation It is well known that the presence of moisture up to a certain level degrades the
dielectric capability of insulating liquid. The moisture decreases both AC breakdown
voltage [3] [48] [49] [50] [51] [52] and lightning breakdown voltage [53], decreases the
resistivity [52], and increases the electrical conductivity of insulating liquids [51]. The
combination with particles enhances the degradation effect of moisture on the capability of
the insulating liquid [49]. The moisture effect firstly takes place when an emulsion of
moisture is formed in the oil [51], by providing charge carriers [48].
However, the literature discussing the effect of moisture on PD activities in the
insulating liquid are still rare. Moisture content is believed to alter the PD behavior of
insulating oil, although its effect, whether the increase in moisture content intensifies PD
activities or vice versa, has not been concluded [54]. The apparent charge was reported to
decrease slightly with the increase in moisture content of mineral oil due to the shorter

Chapter 2: Literature Review
Kyushu Institute of Technology, Dept. of Electrical and Electronics Engineering 28
duration of PD pulses in moist oil, whereas PD number increases significantly [55].
However, the different results were reported in [56]. There, PD number was found to
decrease as the moisture content rose, although the PDIV decreased. The remarkable
reduction in PDIV was observed in the sample with the presence of water droplet [56]. It
is clear from the mentioned literature that there has not been a consensus about how the
presence of moisture influences PD activities of insulating oil.

Chapter 2: Literature Review
Kyushu Institute of Technology, Dept. of Electrical and Electronics Engineering 29
References [1] C. P. McShane, "Vegetable Oil Based Dielectric Coolant," IEEE Industry Application
Magazine, vol. 8, no. 3, pp. 34-41, 2002. [2] C. P. McShane, G. A. Gauger and G. Luksich, "Fire Resistant Natural Ester Dielectric Fluid
and Novel Insulation System for Its Use," in IEEE/PES Transmission and Distribution Conference, pp. 890-894, 1999.
[3] CIGRE W. G. A2.35, "Experience in Service with New Insulating Liquid," CIGRE, 2010. [4] B. Pahlavanpour, G. Wilson and R. Heywood, "Environmentally Friendly Insulating Oil," in
The Institution of Electrical Engineer, pp. 1-4, 1999. [5] R. Bartnikas, Engineering Dielectrics, Volume III - Electrical Insulating Liquids,
Philadelphia: ASTM, 1994. [6] T. Manual, "Dow Corning 561 Silicone Transformer Liquid," Dow Corning, 2006. [7] T. V. Oommen, "A New Vegetable Oil Based Transformer Fluid: Development and
Verification," in Conference on Electrical Insulation and Dielectric Phenomena, pp. 308-312, 2002.
[8] C. P. McShane, J. Corkran, K. Rapp and J. Luksickh, "Natural Ester Dielectric Fluid Development," in IEEE/PES Transmission & Distribution Conference & Exposition, pp. 18-22, 2006.
[9] C. C. Claiborne, E. J. Walsh and T. V. Oommen, "An Agriculturally Based Biodegradable Dielectric Fluid," in IEEE/PES T&D Conference, pp. 876-881, New Orleans, 1999.
[10] T. V. Oommen, C. C. Claiborne and J. T. Mullen, "Biodegradable Electrical Insulation Fluids," in Electrical Insulating Conference, pp. 465-468, Chicago, 1997.
[11] P. Boss and T. V. Oommen, "New Insulating Fluids for Transformers based on Biodegradable High Oleic Vegetable Oil and Ester Fluid," in IET Conference, pp. 1-10, 1999.
[12] Y. Bertrand and P. Lauzevis, "Development of a Low Viscosity Insulating Liquid Based on Natural Esters for Distribution Transformers," in 22nd International Conference on Electricity Distribution, pp. 1-4, 2013.
[13] D 6871 – 03, "Standard Specification for Natural (Vegetable Oil) Ester Fluids Used in Electrical Apparatus," ASTM International, 2003.
[14] K. Nakamura, K. Kato, H. Koide, Y. Hatta and H. Ukubo, "Fundamental Property of Electric Field in Rapeseed Ester Oil based on Kerr Electro-Optic Measurement," IEEE Transactions on Dielectrics and Electrical Insulation, vol. 13, no. 3, pp. 601-607, 2006.
[15] J. Viertel, K. Ohlsson and S. Singha, "Studies of the Improvement of the Viscosity of Natural Ester Liquids," in ICDL, pp. 1-4, 2014.
[16] C. P. McShane, "Relative Properties of the New Combustion-Resistant Vegetable-Oil-Based Dielectric Coolants for Distribution and Power Transformers," IEEE Transactions on Industry Applications, vol. 37, no. 4, pp. 1132-1139, 2001.
[17] S. Tenbohlen, M. Koch, D. Vukovic, A. Weinläder, J. Baum, J. Harthun, M. Schäfer, S. Barker, R. Frotscher, D. Dohnal and P. Dyer, "Application of vegetable oil-based insulating fluids to hermetically sealed power transformers," in CIGRE, Paper C2-102, pp. 1-8, 2008.
[18] R. Liao, S. Liang, C. Sun, L. Yang and H. Sun, "A comparative study of thermal aging of transformer insulation paper impregnated in natural ester and in mineral oil," Euro. Trans. Electr. Power, vol. 20, p. 518–533, 2010.
[19] Z. H. Shah and Q. A. Tahir, "Dielectric Properties of Vegetable Oils," Journal of Scientific research, vol. 3, no. 3, pp. 481-492, 2011.
[20] R. Liao, J. Hao, G. Chen, Z. Ma and L. Yang, "A Comparative Study of Physicochemical, Dielectric and Thermal Properties of Pressboard Insulation Impregnated with Natural Ester and Mineral Oil," IEEE Transactions on Dielectrics and Electrical Insulation, vol. 18, no. 5, pp. 1626-1637, 2011.

Chapter 2: Literature Review
Kyushu Institute of Technology, Dept. of Electrical and Electronics Engineering 30
[21] D. Martin and Z. D. Wang, "A Comparative Study of the Impact of Moisture on the Dielectric Capability of Esters for Large Power Transformers," in CEIDP, pp. 409-412, 2006.
[22] C. Perrier and A. Beroual, "Experimental Investigations on Insulating Liquids for Power Transformers: Mineral, Ester, and Silicone Oils," IEEE Electrical Insulation Magazine, vol. 25, no. 6, pp. 6-13, 2009.
[23] C. P. McShane, K. J. Rapp, J. L. Corkran, G. A. Gauger and J. Luksich, "Aging of Paper Insulation in Natural Ester Dielectric Fluid," in 2001 IEEE/PES Transmission & Distribution Conference & Exposition, Atlanta, pp. 675-679, 2001.
[24] Q. Liu and Z. D. Wang, "Streamer Characteristic and Breakdown in Synthetic and Natural Ester Transformer Liquids and Natural Ester Transformer Liquids," IEEE Transactions on Dielectrics and Electrical Insulation, vol. 18, no. 1, pp. 285-294, 2011.
[25] Viet-Hung Dang and A. Beroual, "Investigations on Streamers Phenomena in Mineral, Synthetic and Natural Ester Oils under Lightning Impulse Voltage," IEEE Transactions on Dielectrics and Electrical Insulation, vol. 19, no. 5, pp. 1521-1527, 2012.
[26] C. Tran Duy, O. Lesaint, A. Denat and N. Bonifaci, "Streamer Propagation and Breakdown in Natural Ester at High Voltage," IEEE Transactions on Dielectrics and Electrical Insulation, vol. 16, no. 6, pp. 1582-1594, 2009.
[27] T. Kanoh, H. Iwabuchi, Y. Hoshida, J. Yamada, T. Hikosaka, A. Yamazaki, Y. Hatta and H. Koide, "Analyses of Electro-Chemical Characteristics of Palm Fatty Acid Esters as Insulating Oil," in The 16th ICDL, pp. 1-4, 2008.
[28] M. Hikita, J. Tokiyoshi, M. Tsuchie, M. Kozako, T. Suzuki, A. Kanetani and T. Kano, "Partial Discharge Properties of Ester Oils Having Different Molecular Structures," in IEEE International Symposium on Electrical Insulation, pp. 26-29, 2012.
[29] T. Suzuki, R. Oba, A. Kanetani, T. Kano, T. Tamura, M. Kato, S. Watanabe, Y. Kasahara and M. Iwahashi, "Consideration on the Relationship between Dielectric Breakdown Voltage and Water Content in Fatty Acid Esters," in ICDL, pp. 1-4, 2011.
[30] P. Verma, M. Roy, A. Verma and V. Bhanot, "Assessment of Transformer Insulation System by Evaluating Partial Discharge and Dissolved Gas Analysis," Journal of Scientific and Industrial Research, vol. 64, pp. 262-267, 2005.
[31] Shaban K., El-Hag A. and Matveev A., "Predicting Transformers Oil Parameters," in IEEE Electrical Insulation Conference, Montreal, pp. 196-199, 2009.
[32] C. Perrier, M. Marugan and A. Beroual, "DGA Comparison Between Ester and Mineral Oils," IEEE Transaction on Dielectric and Electrical Insulation, vol. 19, no. 5, pp. 1609-1614, 2012.
[33] IEEE Std C57.104, "IEEE Guide for the Interpretation of Gases Generated in Oil-Immersed Transformers," IEEE Power & Energy Society, 2009.
[34] M. Duval, "The Duval Triangle for Load Tap Changers, Non-Mineral Oils and Low Temperature Faults in Transformers," IEEE Electrical Insulation Magazine, vol. 24, no. 6, pp. 22-29, 2008.
[35] M. Jovalekic, D. Vucovic and S. Tembohlen, "Dissolved gas Analysis of Alternative Dielectric Fluid under Thermal and Electrical Stress," in IEEE International Conference on Dielectric Liquids, pp. 1-4, 2011.
[36] Khan I, Wang Z. D. and Cotton I., "Dissolved gas Analysis of Alternative Fluids for Power Transformers," IEEE Electrical Insulation Magazine, Vol. 23, No. 5, pp. 5-14, 2007.
[37] Z. Wang, X. Yi, J. Huang, J. V. Hinshaw and J. Noakhes, "Fault Gas generation in Natural-Ester Fluid under Localized Thermal Faults," IEEE Electrical Insulation Magazine, vol. 28, no. 6, pp. 45-56, 2012.
[38] I. A. Hohlein and R. Frotscher, "Carbon Oxides in the Interpretation of Dissolved Gas Analysis in Transformers and Tap Changers," IEEE Electrical Insulation Magazine, vol. 26, no. 6, pp. 22-26, 2010.

Chapter 2: Literature Review
Kyushu Institute of Technology, Dept. of Electrical and Electronics Engineering 31
[39] I. A. Hohlein, C. Rehorek and T. Hammer, "Gassing and Oxidation Behaviour of Insulating Fluids under Thermal Stress," in CIGRE the 6th Southern Africa Regional Conference, Paper C-107, pp. 1-5, 2009.
[40] H. M. Wilhelm, M. B. C. Stocco, L. Tulio, W. Uhren and S.G. Batista, Jr., "Edible Natural Ester Oils as Potential Insulating Fluids," IEEE Transactions on Dielectrics and Electrical Insulation, vol. 20, no. 4, pp. 1395-1401, 2013.
[41] N. A. Muhamad, B. T. Phung and T. R. Blackburn, "Dissolved Gas Analysis of Overheating fault in Bio-degradable Transformer Oil," in AUPEC'08, pp. 1-4, 2008.
[42] I. A. Hohlein, "Stray Gassing of Insulating Liquids - Manifestation and Influence on Diagnostics," in IEEE International Conference on Liquid Dielectrics, pp. 1-3, 2014.
[43] M. Duval and R. Baldiga, "Stray Gassing of FR3 Oils in Transformer in Service," in 76th Annual International Doble Client Conference, pp. 1-6, 2009.
[44] D. Martin, N. lelekakis, W. Guo and Y. Udarenko, "Further Studies of a Vegetable Oil Filled Power Transformer," IEEE Electrical Insulation Magazine, vol. 27, no. 5, pp. 6-13, 2011.
[45] Y. Liu, J. Li and Z. Zhang, "Gases Dissolved in Natural ester Fluids under Thermal Faults in Transformer," in IEEE International Symposium on Electrical Insulation, pp. 223-226, 2012.
[46] D. Martin, N. Lelekakis and V. Davydov, "Preliminary Results for Dissolved Gas levels in a Vegetable Oil-filled Power Transformer," IEEE Electrical Insulation Magazine, vol. 26, no. 5, pp. 41-47, 2010.
[47] Z. D. Wang, X. Wang, X. Yi and S. Li, "Gas Generation in Natural ester and Mineral Oil under Partial Discharge and Spark Faults," IEEE Electrical Insulation Magazine, vol. 29, no. 5, pp. 62-70, 2013.
[48] M. Koch, M. Fischer and S. Tenbohlenieh, "The Breakdown Voltage of Insulation Oil under the Influences of Humidity, Acidity, Particles and Pressure," in International Conference APTADM, pp. 1-6, Wroclaw, 2007.
[49] X. Wang and Z. D. Wang, "Particle Effect on Breakdown Voltage of Mineral," in Annual Report Conference on Electrical Insulation Dielectric Phenomena, pp. 598-602, 2008.
[50] R. Liao, J. Hao, J. Chen, Z. Ma and L. Yang, "A Comparative Study of Physicochemical, Dielectric and Thermal Properties of Pressboard Insulation Impregnated with Natural Ester and Mineral Oil," IEEE Transactions on Dielectrics and Electrical Insulation, vol. 18, no. 5, pp. 1626-1637, 2011.
[51] I. L. Hosier, J. Gu, W. Chotchuangchutchavel and A. S. Vaughan, "Effect of viscosity and water content on the breakdown strength of vegetable oils," in IEEE International Conference on Liquid Dielectrics, Bled, pp. 1-4, 2014.
[52] Suwarno and M. H. Prakoso, "Effects of Water Content on Dielectric Properties of Mineral Transformer Oil," International Journal of Electrical, Computer, Energetic, Electronic and Communication Engineering, vol. 9, no. 10, pp. 1142-1146, 2015.
[53] W. Lu, Q. Liu and Z. D. Wang, "Combined Effect of Cellulose Particle and Moisture on Lightning Impulse Breakdown Voltages of Ester," in International Symposium on High Voltage Engineering, pp. 1326-1331, Seoul, 2013.
[54] Z. Liu, Q. Liu, Z. D. Wang, P. Jarman, Ch. Krause, P. W. R. Smith and A. Gyore, "Partial Discharge Behavior of Transformer Liquids and Influence of Moisture Content," in IEEE International Conference on Liquid Dielectrics, pp. 1-4, Bled, 2014.
[55] H. Borsi and U. Schroder, "Initiation and Formation of Partial Dischargea in Mineral-based Insulating Oil," IEEE Transactions on Dielectrics and Electrical Insulation, vol. 1, no. 3, pp. 419-425, 1994.
[56] A. Cavallini, G. C. Montanari and F. Ciani, "Analysis of Partial Discharge Phenomena in Paper-Oil Insulation System as a Basis for Risk Assessment Evaluation," in IEEE International Conference on Dielectric Liquids, pp. 241-244, Coimbra, 2005.

Chapter 2: Literature Review
Kyushu Institute of Technology, Dept. of Electrical and Electronics Engineering 32

Chapter 3: Gas Generation of Monoesters under Low Temperature Overheating
Kyushu Institute of Technology, Dept. of Electrical and Electronics Engineering 33
Chapter 3
Gas Generation of Monoesters under Low Temperature
Overheating
3.1 Introduction
Gases generated by natural esters under thermal faults have been a topic of
investigation of many researchers [1] [2] [3] [4] [5] [6] [7]. It is widely accepted that ethane
is produced in higher amount by the natural ester than by the mineral oil under thermal
fault [2]. Natural ester immersed transformer in service was also reported to generate ethane,
accompanied by hydrogen, in high amount [3] [4]. The ethane was then suggested to be the
key gas of natural ester for thermal faults [5]. Moreover, natural ester was reported as
generating less amount of methane [5] [6], and higher amount of carbon monoxide than the
mineral oil does [7].
However, most of the previous results were obtained from the investigation on
natural esters of triglyceride form. The results on natural ester which is monoester type are
still rare. This paper presents gas generation under low thermal fault of PFAE and other
fatty acid monoesters as well as mineral oil. The differences of generated gases between
fatty acid mono esters having C=C bond in their molecular structure and those without C=C
bond are discussed. Comparison of the gas generation tendency between tested oils and
commercially available natural ester insulation oil reported in the previous literature, as
well as mineral oil are also elaborated. The possibility of generating gas ratio method to
expect the overheating temperature is also evaluated.
3.2 Experiment 3.2.1 Samples
Study on natural ester oils having different molecular structure is important as the
difference in molecular structure could lead to the difference in gas generation behaviors
of the oils. For instance, under PD stress, hydrocarbon gases are more likely to be produced
by monoester oils without C=C bond in their hydrocarbon chains than those by monoesters
having C=C bond [8]. Samples used in the experiment were natural monoesters synthesized

Chapter 3: Gas Generation of Monoesters under Low Temperature Overheating
Kyushu Institute of Technology, Dept. of Electrical and Electronics Engineering 34
from palm oil (PFAE, M12, 2H-08, and M182) and rice bran methyl ester oils. PFAE stands
for palm fatty acids esters and was developed to be used for oil filled transformer, M12 is
made of lauric acid methyl ester, 2H-08 consists of caprylic acid 2ethyl-hexyl ester,
whereas M182 consists of stearic/oleic/linoleic acids methyl esters. The chemical structure
of PFAE and rice brand oils is shown in Figure 2.8. The chemical structures of M12, 2H-
02 and M182 oils are depicted in Figure 3.1. All monoester oils were manufactured and
supplied by LION Co., Ltd. Japan. Mineral oil of naphthenic type was also used for
comparison. Some properties of the natural monoester oils are listed in Table 3.1. Iodine
value is often used to determine the amount of unsaturation in fatty acids and their
derivatives. The higher the iodine value, the more C=C bonds are present in the fats and
their derivatives. Accordingly, rice bran and M182 oils contain significant number of C=C
bond, whereas PFAE, M12, and 2H-08 do not.
(a). Lauric acid methyl ester (M12)
(b) Caprylic acid 2ethyl-hexyl ester (2H-08)
(c).i. Stearic acid methyl ester (M182)
(c).ii. Oleic acid methyl ester (M182)
(c).iii. Linoleic acid methyl ester (M182)
Figure 3 1 Chemical structure of monoesters; (a) M12, (b) 2H-08, and
(c) M182
CH3-(CH2)10-C-O-CH3=
O
CH3-(CH2)6-C-O-C8H17=
O
CH3-(CH2)16-C-O-CH3=
O
CH3 -(CH2)7CH=CH(CH2)7-C-O-CH3=
O
CH3-(CH2)3(CH2CH=CH)2(CH2)7-C-O-CH3=
O

Chapter 3: Gas Generation of Monoesters under Low Temperature Overheating
Kyushu Institute of Technology, Dept. of Electrical and Electronics Engineering 35
The molecular weight of PFAE is not known, but it can be approached using
equation (3):
η = KMα, (3)
where η is viscosity, K and α, are constants, and M is molecular weight of a compound.
The relationship between the viscosity and the molecular weight of a natural monoester can
be obtained by using four sets of data in Table 3.1 (exclude PFAE), as follows:
η = 0.00004 M2.038
The molecular weight of PFAE is obtained by substituting its viscosity value, and
the calculated value is 329 gram.
3.2.2 Experimental Arrangement Figure 3.2 shows photographic and schematic views of the equipment used in the
experiment. They consist of two DC power supplies, temperature and time controller, oil
chamber and a graph recorder [9] [10].
Table 3. 1 . Some properties of tested oils
Properties Palm Oil Rice bran PFAE M12 2H-08 M182
Iodine value (g/100g) Kinematic viscosity at 40 oC (mm2/s) Molecular weight (gram) Breakdown voltage (kV/2.5 mm) Flash point (oC)
0 5.1 -
81 176
0 2.4 214 84
126
0 2.8 256 91
153
91 4.6 296 91
184
107 4.3 292 89 -
Figure 3 2 Experimental setup for low temperature overheating
Ceramic heaters
18 V, 2.5 A
18 V, 2.5 A
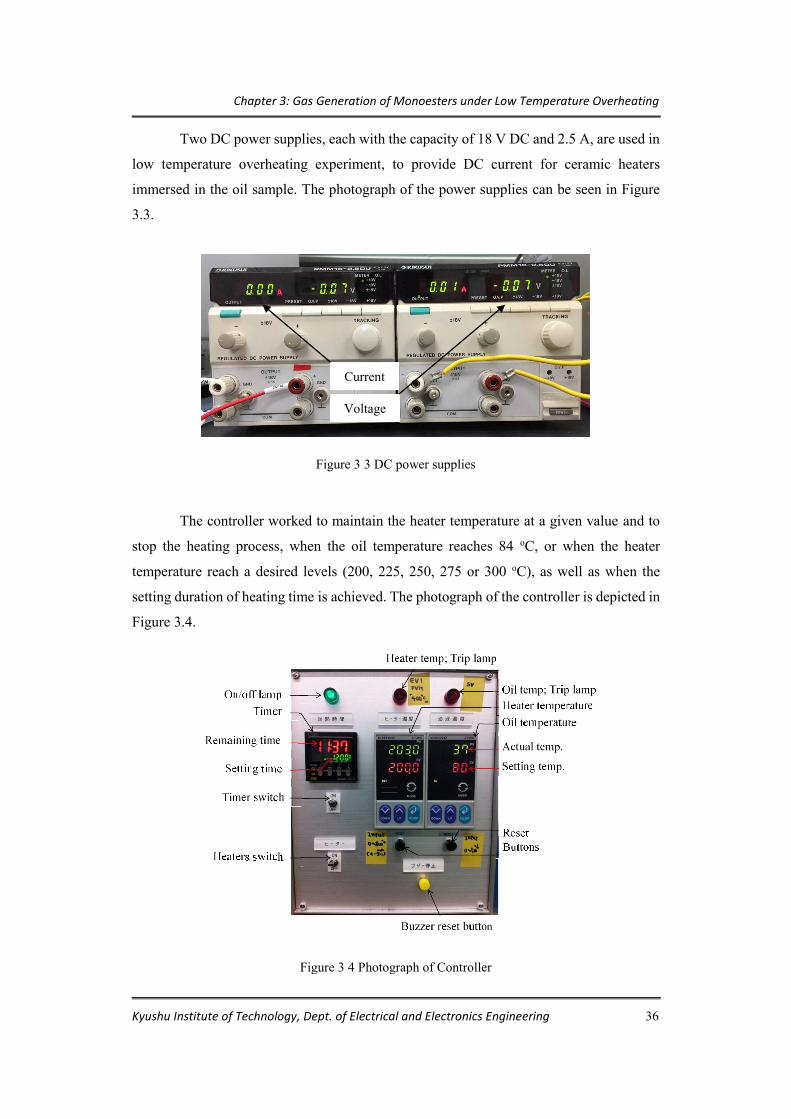
Chapter 3: Gas Generation of Monoesters under Low Temperature Overheating
Kyushu Institute of Technology, Dept. of Electrical and Electronics Engineering 36
Two DC power supplies, each with the capacity of 18 V DC and 2.5 A, are used in
low temperature overheating experiment, to provide DC current for ceramic heaters
immersed in the oil sample. The photograph of the power supplies can be seen in Figure
3.3.
The controller worked to maintain the heater temperature at a given value and to
stop the heating process, when the oil temperature reaches 84 oC, or when the heater
temperature reach a desired levels (200, 225, 250, 275 or 300 oC), as well as when the
setting duration of heating time is achieved. The photograph of the controller is depicted in
Figure 3.4.
Figure 3 3 DC power supplies
Figure 3 4 Photograph of Controller
Current
Voltage

Chapter 3: Gas Generation of Monoesters under Low Temperature Overheating
Kyushu Institute of Technology, Dept. of Electrical and Electronics Engineering 37
The oil sample was placed in a cylindrically shaped chamber made of acrylic in
which heater element was immersed. The cover and the base of the chamber are made of
stainless steel and acrylic, respectively. O-rings made of nitrile butadiene rubber were used
at the interface of cylindrical acrylic and the cover, and at the interface of cylindrical acrylic
and its base, to realize a tightly sealed chamber system. The photograph of the chamber is
shown in Figure 3.5. Heating element consists of two ceramic heaters which are clamped
with two copper plates. A thermocouple sensor was inserted in the middle of two adjacent
ceramics for heater’s temperature measurement. The photographic view of the heating
element is shown in Figure 3.6. Another thermocouple immersed in the oil sample, floating
at about 1/4 of oil’s height, was used for oil’s temperature measurement.
(a) Assembled chamber
(b) Disassemble chamber
Figure 3 5 Oil chamber used for low temperature overheating experiment.
Heating element
Thermocouple for oil temperature measurement

Chapter 3: Gas Generation of Monoesters under Low Temperature Overheating
Kyushu Institute of Technology, Dept. of Electrical and Electronics Engineering 38
The graph recorder was used to continuously monitor and record heater and oil
temperatures. The photograph of the graph recorder is shown in Figure 3.7.
Gas analysis was conducted using a gas chromatograph (GC-2014 model, Shimazu
Corp. Japan), as depicted in Figure 3.8.
(a) (b)
Figure 3 6 Heating element, consist of two ceramic heaters (white color) which are clamped
with two copper plates; Thermocouple is inserted between two ceramics for heater’s temperature measurement; (a) photographic view, (b) schematic view
Figure 3. 7 Graph recorder
Ceramic Heaters
Copper Plates
Thermocouple

Chapter 3: Gas Generation of Monoesters under Low Temperature Overheating
Kyushu Institute of Technology, Dept. of Electrical and Electronics Engineering 39
3.2.3 Sampling Procedure The photographic view of sampling procedure is shown in Figure 3.9. The oil
sample was firstly placed in a stainless steel container (A). A vacuum pump is connected
to the oil chamber through an oil trap (C) so that the oil sample is resisted from entering
the pump during the operation. The air inside the chamber was firstly evacuated before the
oil sample was introduced using a vacuum pump. After about ten minutes evacuation, the
oil sample was withdrawn into the chamber without interrupting the vacuum pump
operation, and the filling process was stopped when the volume of oil reach 1000 ml. The
oil sample was filtered while being inserted into the chamber using a glass filter attached
on the ceiling of the chamber. With this system, the most part of the oil mist, moisture, and
air dissolved in sample oil can be removed [11]. After degassing the oil, argon gas was
introduced to occupy the space above the oil and bring the oil system to the ambient
pressure, so that contamination by surrounding air can be minimized.
Figure 3. 8 Gas chromatograph (GC-2014 model, Shimazu Corp. Japan)

Chapter 3: Gas Generation of Monoesters under Low Temperature Overheating
Kyushu Institute of Technology, Dept. of Electrical and Electronics Engineering 40
3.2.4 Experimental Procedure Low temperature overheating experiment was performed, in laboratory scale, to
simulate local heating which is usually the case in the transformer. In order to obtain the
more stable heater temperature, an ON/OFF automatic control was changed to the manual
control in the current heating experiment. This procedure differs from that utilized in [12]
where the ON/OFF automatic control was used. The detail explanation of the ON/OFF and
the manual controls of temperature controller is placed in Appendix A. The DC current
from the DC power supplies is manually adjusted to suit a desired setting temperature of
the heater. Based on this operation, the heating durations of each oil sample are not uniform.
Consequently, the term of generation rate (µl/hour) is used in presenting generated gases
in the next results and discussion section, instead of concentration in mL or ppm.
Two gas samples were prepared for analysis. The first one was taken from the gas
part, the oil-free space on the upper part of the chamber, whereas, another one was taken
from the oil part. Dissolved gas in the oil was extracted using the so-called headspace
method. Gas sampling procedures are explained in more detail in Appendix B. Gas samples
were then analyzed using a gas chromatograph (GC-2014 model, Shimazu Corp. Japan).
Figure 3 9 Schematic diagram for oil filling in process
A
C

Chapter 3: Gas Generation of Monoesters under Low Temperature Overheating
Kyushu Institute of Technology, Dept. of Electrical and Electronics Engineering 41
3.3 Results and Discussion 3.3.1 Gases Generation Tendency
Among combustible gases, ethylene and acetylene were not found in all tested oils
under low thermal faults within the temperatures from 200 to 300 oC. Therefore, the gases
to be discussed are carbon monoxide, methane, ethane, and hydrogen, and the typical graph
of the distribution of combustible gases generated by natural monoesters and mineral oil,
taken at the temperature of 250 oC, is shown in Figure 3.10. Gas generation tendency of
PFAE and other natural monoesters containing only C-C single bond in their hydrocarbon
chains such as M12 and 2H-08 oils are more similar to that of mineral oil, rather than to
that of natural monoesters having C=C bond like M182 and rice bran oils. Both natural
monoesters containing only C-C single bond in their hydrocarbon chains and mineral oil
only produced methane and carbon monoxide, or in some rare cases generated hydrogen in
not significant amount [13]. The remarkable difference between groups of oils having C=C
bond and those without C=C bond as well as mineral oil is ethane generation. A small, but
distinguishable amount of hydrogen was also found in oils having C=C bond [12]. Ethane
phenomenon and hydrogen generation will be discussed further in the next sections.
Carbon monoxide was the most dominant combustible gas generated by all tested
oils. The presence of carbon monoxide in oils is due to ingression by surrounding air, and/or
Figure 3 10 Generation rates of combustible gases of natural monoesters and mineral oil under low thermal faults.

Chapter 3: Gas Generation of Monoesters under Low Temperature Overheating
Kyushu Institute of Technology, Dept. of Electrical and Electronics Engineering 42
the oxidation of oil molecule, as schematically shown in Figure 3.11 [14]. Comparing the
carbon monoxide generation between natural monoesters and mineral oil (Figure 3.12), in
spite of deviations found in PFAE at 250 to 300 oC, it is quite clear that natural monoesters,
in general, produce a larger amount of carbon monoxide than the mineral oil does. The
difference in carbon monoxide generation between both oils is due to the existence of –
COO- group in natural monoester oils [7]. The thermal energy inserted into the oil firstly
breaks the weakest bond of oil molecules, namely -COO- bond in fatty acid monoester oils.
The existence of oxygen atom, which have higher electronegativity than carbon atom, cause
the depletion of electrons around -COO- bond and hence, the -COO- bond is more likely
to be cut than C-C bond in oil molecule [12].
The effect of the –COO- group can be seen in the generation of carbon monoxide
by M12, 2H-08, and PFAE. These three oils belong to a group of monoesters without C=C
bond in their structures, and are derived from the same source, palm oil. The difference
among the oils is the number of C atoms present in their hydrocarbon chains, which are
indicated by their viscosity and molecular weight, as listed in Table 3.1. The less number
of C atoms are present in oil’s molecule, the lower its viscosity and molecular weight, thus
the smaller its molecule size is [15]. Hence, the ratio of –COO-/1000 mL sample oils in
Figure 3 11 How the carbon monoxide present in (mineral) oil [14]
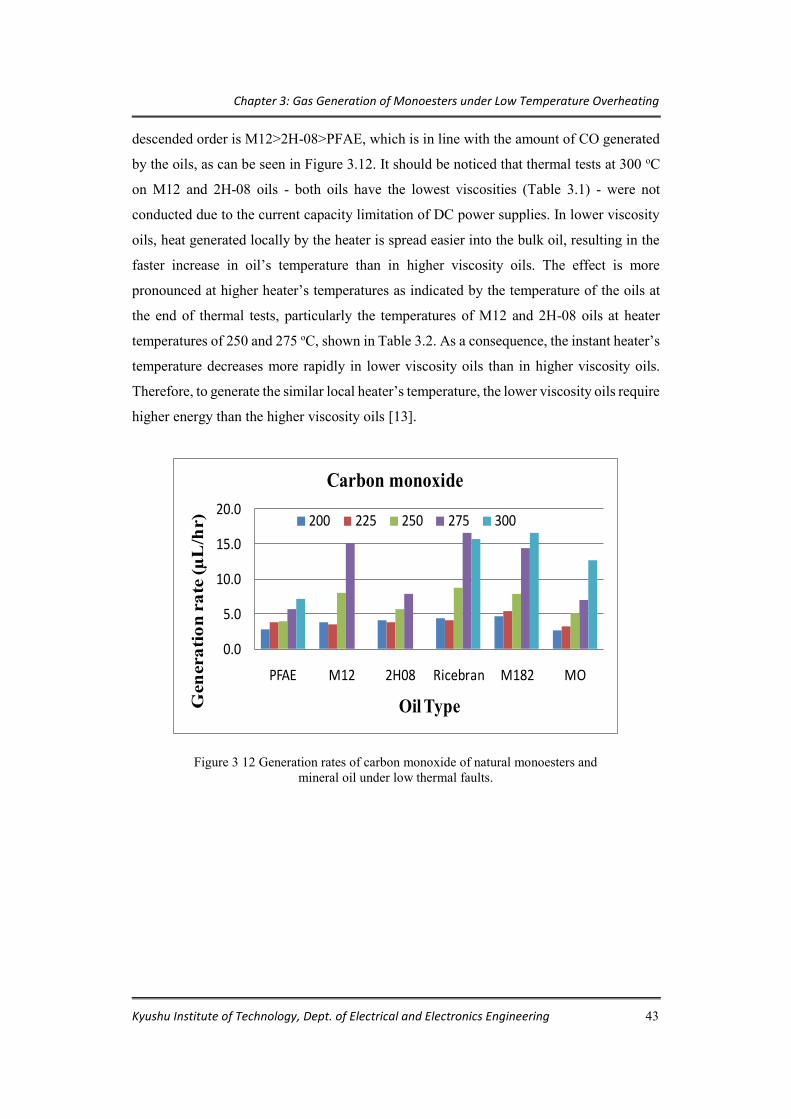
Chapter 3: Gas Generation of Monoesters under Low Temperature Overheating
Kyushu Institute of Technology, Dept. of Electrical and Electronics Engineering 43
descended order is M12>2H-08>PFAE, which is in line with the amount of CO generated
by the oils, as can be seen in Figure 3.12. It should be noticed that thermal tests at 300 oC
on M12 and 2H-08 oils - both oils have the lowest viscosities (Table 3.1) - were not
conducted due to the current capacity limitation of DC power supplies. In lower viscosity
oils, heat generated locally by the heater is spread easier into the bulk oil, resulting in the
faster increase in oil’s temperature than in higher viscosity oils. The effect is more
pronounced at higher heater’s temperatures as indicated by the temperature of the oils at
the end of thermal tests, particularly the temperatures of M12 and 2H-08 oils at heater
temperatures of 250 and 275 oC, shown in Table 3.2. As a consequence, the instant heater’s
temperature decreases more rapidly in lower viscosity oils than in higher viscosity oils.
Therefore, to generate the similar local heater’s temperature, the lower viscosity oils require
higher energy than the higher viscosity oils [13].
Figure 3 12 Generation rates of carbon monoxide of natural monoesters and mineral oil under low thermal faults.
0.0
5.0
10.0
15.0
20.0
PFAE M12 2H08 Ricebran M182 MO
Gen
erat
ion
rat
e (µ
L/h
r)
Oil Type
Carbon monoxide
200 225 250 275 300

Chapter 3: Gas Generation of Monoesters under Low Temperature Overheating
Kyushu Institute of Technology, Dept. of Electrical and Electronics Engineering 44
Methane generation by all tested oils is shown in Figure 3.13. In spite of deviations
found in mineral oil samples heated at 225 and 275 oC, it can be seen that, in general,
methane is produced by mineral oil in a higher amount than that by natural monoesters oils,
confirming earlier results [6] [12]. Mineral oil composed of hydrocarbon such as paraffinic,
naphthenic and aromatic hydrocarbons. The most vulnerable point where the hydrocarbon
would be cut by inserted thermal energy is at the end of carbon chain in the oil molecule.
Then, CH4 is produced by combining with H2 after cleavage at the end of carbon chain [12].
Table 3. 2 The temperature of oils at the end of thermal test at various
temperature levels of the heater
Oil Type End Oil Temperature at Heater
Temperatures 200 oC 225 oC 250 oC 275 oC 300 oC
PFAE M12 2H-08 M182 Rice bran Mineral oil
71 70 71 72 70 67
77 77 77 -
78 72
80 83 -
81 81 77
81 83 83 -
81 80
81 - -
81 82 77
Figure 3 13 Generation rates of methane of natural monoesters and mineral oil under low thermal faults
0.000.200.400.600.801.001.201.40
PFAE M12 2H08 Ricebran M182 MO
Gen
erat
ion
rat
e (µ
L/h
r)
Oil Type
Methane
200 225 250 275 300

Chapter 3: Gas Generation of Monoesters under Low Temperature Overheating
Kyushu Institute of Technology, Dept. of Electrical and Electronics Engineering 45
3.3.2 Ethane Generation Phenomena It is mentioned in our previous report [12] that natural monoesters of different
molecular structures exhibited different behavior related to the ethane generation under low
thermal faults within the temperature range of 200 to 300 oC. Natural monoesters having
C=C bond in their hydrocarbon chains like Soybean and Rice bran produced ethane in
remarkable amount, whereas those without C=C bond like PFAE, M12, and 2H-08, did not
generate ethane, or in some rare cases generated ethane in not significant amount. Mineral
oil of naphthenic type, heated under the similar temperature range also did not generate
ethane at all temperature levels. These results lead us to a conclusion that the difference in
ethane generation phenomenon among insulating oils under low thermal faults was due to
the difference between oils having and without C=C bond in their hydrocarbon chains. This
slightly differs from the conclusion found in the literature that the difference in ethane
generation was about the difference between natural esters and mineral oils [1] [2] [4] [5]
[6] [14]. If the ethane will be adopted as the key gas for thermal faults in natural esters,
then it can only be used for oils having C=C bond in their structure.
The ethane generation mechanisms from oils having C=C bond in their
hydrocarbon chains under thermal faults have not been well understood yet. The ethane
generation, according to [5] [14], is strongly related to the oxidation. They suggested that
the ethane is developed according to the peroxidation process of lipids which commonly
takes place in omega-3 unsaturated fatty acids [14]. Their experimental results demonstrate
the coincidence of the change in the amount of generated ethane, as well as other stray
gassing phenomena, with the change in the amount of oxygen in oil in a reverse way, which
can be interpreted that the oxygen was consumed during the process [2]. The phenomenon
is not uniquely owned by ester oils, because some mineral oils were also reported to
generate a significant amount of ethane either from simulated low thermal fault in
laboratory experiment [2] or from the transformer in service [16]. However, they found that
ethane generation is more pronounced in natural esters than in mineral oil. These
observation results led them to the suggestion of using ethane as the key gas for natural
esters under thermal fault [5] [14]. To put these into the same perspective with our
experimental results, and thus with our claim regarding the ethane generation phenomenon,
it should be noticed that the commonly used natural esters in the previous studies were FR3
or Biotemp which are known to be in triglyceride form. In triglyceride structure, fatty acid
chains occupying three branches of triglyceride are a random combination of saturated and
unsaturated hydrocarbons.

Chapter 3: Gas Generation of Monoesters under Low Temperature Overheating
Kyushu Institute of Technology, Dept. of Electrical and Electronics Engineering 46
Nevertheless, our experimental results on M182 provide quite distinct evidence
that the ethane is not only produced by the oils containing C=C bond of omega-3
unsaturated fatty acids type (Figure 3.14). Namely, M182 oil which is synthesized from
stearic/oleic/linoleic acids methyl esters evidently produced ethane in remarkable amount
although the oil does not contain unsaturated fatty acids of omega-3 type [13].
The omega-3 type unsaturated fatty acids are the fatty acids containing C=C bond
located at the third carbon atom counted from the omega end side of hydrocarbon chains.
The simplest omega-3 unsaturated fatty acid is linolenic acid (C18:3), and the chemical
structure of the acid is shown in Figure 3.15a, and the numbering of C atoms in its
hydrocarbon chain is shown in Figure 3.15b.
Figure 3 14 Generation rates of ethane of natural monoesters and mineral oil under low thermal faults
0.0
2.0
4.0
6.0
8.0
10.0
PFAE M12 2H08 Ricebran M182 MO
Gen
erat
ion
rat
e (µ
L/h
r)
Oil Type
Ethane
200 225 250 275 300

Chapter 3: Gas Generation of Monoesters under Low Temperature Overheating
Kyushu Institute of Technology, Dept. of Electrical and Electronics Engineering 47
3.3.3 Hydrogen – Accompanying Gas Another alternative mechanism is reported to explain how the ethane is generated
from natural esters having C=C bond in their hydrocarbon chains [17]. There, it is
suggested that the ethane generation is due to recombination process between intermediate
products of ethylene and hydrogen during the thermal cracking process. Although their
experimental setup differs from ours and also differs from those mentioned in literature,
they also found the higher amount of ethane, accompanied by hydrogen, generated in
natural ester oils than that in mineral oil.
Based on our experimental result, hydrogen is also generated in natural monoester
oils having C=C bond in their hydrocarbon chains (Figure 3.16). Although the generation
rate of hydrogen is small in the overall results, it is clearly distinguishable from the oils
without C=C bond in their structure. This evidence could possibly be used to support the
mechanism proposed in [17]. Nevertheless, the fact that no ethylene generation was
observed in all tested oils leads us to a question: “Can the proposed mechanism be justified
by assuming that the oils having C=C bond in their hydrocarbon chains initially produce
ethylene, and then the ethylene completely recombines with excessive amount of hydrogen,
producing ethane, and leaving the hydrogen in small amount?” It is still doubtful because
ethylene and hydrogen are found to coexist in many DGA results.
(a)
(b)
Figure 3 15 The simplest omega-3 unsaturated fatty acid, linolenic acids (C18:3); (a) Chemical
structure, (b) Carbon atom numbering in its structure.

Chapter 3: Gas Generation of Monoesters under Low Temperature Overheating
Kyushu Institute of Technology, Dept. of Electrical and Electronics Engineering 48
3.4 Fault Interpretation: CO/CH4 Ratio Several fault interpretation methods, based on DGA data, have been developed to
diagnose the presence of thermal or electrical faults in mineral oil filled transformer [18].
Ratio methods, such as IEC 60599, Rogers, Doernenberg, and Duval Triangles 1 and 3,
were evaluated their applicability for natural ester oils in [19] and found that Duval Triangle
3 (DT3) shows the best performance based on the number of correct predictions on
overheating and electrical faults. It was an expected result since the DT3 is a modified
method to be used for natural ester oils, particularly Envirotemp FR3 and Biotemp [20].
However, under the low thermal faults where the amount of generated gases is very
low, the conventional gas ratio methods cannot be applied. Instead, an alternative gas ratio
is sometimes used to expect the heating temperatures. For instance, the ratio of C2H6/CH4
was used in [21] to estimate the overheating temperature within the range of 100 to 200 oC.
Based on our results, it is indicative from Figures 3.12 and 3.13 that an activation energy
for generating methane is larger than that of carbon monoxide. Thus, it seems possible to
use the ratio of CO/CH4 to estimate the temperature within the range of 200 to 300 oC
(Figure 3.17). For instance, the ratio greater than 10 and 16 for PFAE and Rice bran oils,
respectively, indicates the temperatures of less than 300 oC. For mineral oil, the
temperature-dependent of CO/CH4 ratio can be neglected. However, further investigations
Figure 3 16 Generation rates of hydrogen of natural monoesters and mineral oil under low thermal faults
0.00
0.50
1.00
1.50
2.00
2.50
PFAE M12 2H08 Ricebran M182 MO
Gen
erat
ion
rat
e (µ
L/h
r)
Oil Type
Hydrogen
200 225 250 275 300

Chapter 3: Gas Generation of Monoesters under Low Temperature Overheating
Kyushu Institute of Technology, Dept. of Electrical and Electronics Engineering 49
are required to obtain a more comprehensive understanding of how the ratio of CO/CH4
varies to the change in the overheating temperature [13].
3.5 Summary Gases generated by various natural monoesters having and without C=C bond in
their molecular structures, as well as mineral oil have been investigated under the low
thermal faults. Some conclusions can be made as follows:
1. Types of gases produced by natural monoesters without C=C bond in their structures
are more similar to those produced by mineral oil, rather than those produced by natural
monoesters having C=C bond.
2. In general, the natural monoesters studied here tend to produce a higher amount of
carbon monoxide, but less amount of methane than the mineral oil does.
3. The natural monoesters having C=C bond tend to generate noticeable amount of ethane,
accompanied by small amount of hydrogen, whereas those without C=C bond and
mineral oil do not.
4. If the ethane would be used as the key gas for the low thermal faults in natural ester
oils, then it is only applied for the oils having C=C bond in their structures.
5. It seems that the ratio of CO/CH4 could possibly be used to estimate the temperature
of the low thermal faults.
Figure 3 17 The variations of CO/CH4 ratio against temperature change for different kinds of oils.
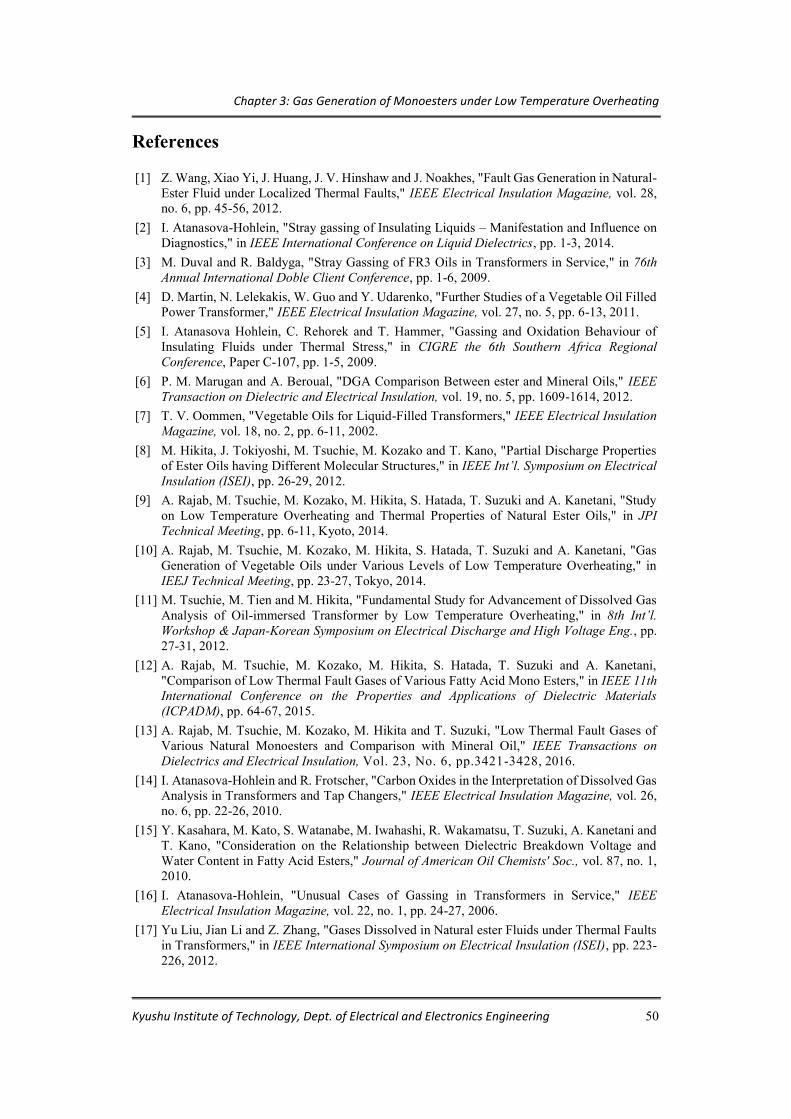
Chapter 3: Gas Generation of Monoesters under Low Temperature Overheating
Kyushu Institute of Technology, Dept. of Electrical and Electronics Engineering 50
References [1] Z. Wang, Xiao Yi, J. Huang, J. V. Hinshaw and J. Noakhes, "Fault Gas Generation in Natural-
Ester Fluid under Localized Thermal Faults," IEEE Electrical Insulation Magazine, vol. 28, no. 6, pp. 45-56, 2012.
[2] I. Atanasova-Hohlein, "Stray gassing of Insulating Liquids – Manifestation and Influence on Diagnostics," in IEEE International Conference on Liquid Dielectrics, pp. 1-3, 2014.
[3] M. Duval and R. Baldyga, "Stray Gassing of FR3 Oils in Transformers in Service," in 76th Annual International Doble Client Conference, pp. 1-6, 2009.
[4] D. Martin, N. Lelekakis, W. Guo and Y. Udarenko, "Further Studies of a Vegetable Oil Filled Power Transformer," IEEE Electrical Insulation Magazine, vol. 27, no. 5, pp. 6-13, 2011.
[5] I. Atanasova Hohlein, C. Rehorek and T. Hammer, "Gassing and Oxidation Behaviour of Insulating Fluids under Thermal Stress," in CIGRE the 6th Southern Africa Regional Conference, Paper C-107, pp. 1-5, 2009.
[6] P. M. Marugan and A. Beroual, "DGA Comparison Between ester and Mineral Oils," IEEE Transaction on Dielectric and Electrical Insulation, vol. 19, no. 5, pp. 1609-1614, 2012.
[7] T. V. Oommen, "Vegetable Oils for Liquid-Filled Transformers," IEEE Electrical Insulation Magazine, vol. 18, no. 2, pp. 6-11, 2002.
[8] M. Hikita, J. Tokiyoshi, M. Tsuchie, M. Kozako and T. Kano, "Partial Discharge Properties of Ester Oils having Different Molecular Structures," in IEEE Int’l. Symposium on Electrical Insulation (ISEI), pp. 26-29, 2012.
[9] A. Rajab, M. Tsuchie, M. Kozako, M. Hikita, S. Hatada, T. Suzuki and A. Kanetani, "Study on Low Temperature Overheating and Thermal Properties of Natural Ester Oils," in JPI Technical Meeting, pp. 6-11, Kyoto, 2014.
[10] A. Rajab, M. Tsuchie, M. Kozako, M. Hikita, S. Hatada, T. Suzuki and A. Kanetani, "Gas Generation of Vegetable Oils under Various Levels of Low Temperature Overheating," in IEEJ Technical Meeting, pp. 23-27, Tokyo, 2014.
[11] M. Tsuchie, M. Tien and M. Hikita, "Fundamental Study for Advancement of Dissolved Gas Analysis of Oil-immersed Transformer by Low Temperature Overheating," in 8th Int’l. Workshop & Japan-Korean Symposium on Electrical Discharge and High Voltage Eng., pp. 27-31, 2012.
[12] A. Rajab, M. Tsuchie, M. Kozako, M. Hikita, S. Hatada, T. Suzuki and A. Kanetani, "Comparison of Low Thermal Fault Gases of Various Fatty Acid Mono Esters," in IEEE 11th International Conference on the Properties and Applications of Dielectric Materials (ICPADM), pp. 64-67, 2015.
[13] A. Rajab, M. Tsuchie, M. Kozako, M. Hikita and T. Suzuki, "Low Thermal Fault Gases of Various Natural Monoesters and Comparison with Mineral Oil," IEEE Transactions on Dielectrics and Electrical Insulation, Vol. 23, No. 6, pp.3421-3428, 2016.
[14] I. Atanasova-Hohlein and R. Frotscher, "Carbon Oxides in the Interpretation of Dissolved Gas Analysis in Transformers and Tap Changers," IEEE Electrical Insulation Magazine, vol. 26, no. 6, pp. 22-26, 2010.
[15] Y. Kasahara, M. Kato, S. Watanabe, M. Iwahashi, R. Wakamatsu, T. Suzuki, A. Kanetani and T. Kano, "Consideration on the Relationship between Dielectric Breakdown Voltage and Water Content in Fatty Acid Esters," Journal of American Oil Chemists' Soc., vol. 87, no. 1, 2010.
[16] I. Atanasova-Hohlein, "Unusual Cases of Gassing in Transformers in Service," IEEE Electrical Insulation Magazine, vol. 22, no. 1, pp. 24-27, 2006.
[17] Yu Liu, Jian Li and Z. Zhang, "Gases Dissolved in Natural ester Fluids under Thermal Faults in Transformers," in IEEE International Symposium on Electrical Insulation (ISEI), pp. 223-226, 2012.
Chapter 3: Gas Generation of Monoesters under Low Temperature Overheating
Kyushu Institute of Technology, Dept. of Electrical and Electronics Engineering 51
[18] N. A. Muhamad, B. T. Pung, T. R. Blackburn and K. X. Lai, "Comparative Study and Analysis of DGA Methods for Transformer Mineral Oil," in IEEE Conf. Power Tech., pp. 45-50, 2007.
[19] N. A. Gomez, H. M. Wilhelm, C. C. Santos and G. B. Stocco, "Dissolved Gas Analysis (DGA) of Natural Ester Insulating Fluids with Different Chemical Compositions," IEEE Transaction on Dielectric and Electrical Insulation, vol. 21, no. 3, pp. 1071-1077, 2014.
[20] M. Duval, "The Duval Triangle for Load Tap Changers, Non-Mineral Oils and Low Temperature Faults in Transformers," IEEE Electrical Insulation Magazine, Vol. 24, No. 6, pp. 22-29, 2008, vol. 24, no. 6, pp. 22-29, 2008.
[21] M. Tsuchie, M. Kozako, Ei Sasaki and M. Hikita, "Modelling of Early Stage Partial Discharge and Overheating Degradation of Paper-oil Insulation," IEEE Transaction on Dielectric and Electrical Insulation, vol. 21, no. 3, pp. 1342-1349, 2014.

Chapter 3: Gas Generation of Monoesters under Low Temperature Overheating
Kyushu Institute of Technology, Dept. of Electrical and Electronics Engineering 52

Chapter 4: Gas Generation of PFAE under Partial Discharge
Kyushu Institute of Technology, Dept. of Electrical and Electronics Engineering 53
Chapter 4
Gas Generation of PFAE under Partial Discharge
4.1 Introduction Monoester type insulation oil has been widely implemented in distribution
transformer in Japan. The implementation of the oil is intended to be extended to the higher
voltage of power transformer. The need for diagnosis method to assess their performance
is important. Particular attention is important to be paid on the early stage of deterioration
of the oil molecules due to the partial discharge. This chapter deals with the investigation
results on the gas generation of PFAE oil under partial discharge. The generated gases by
three PFAE samples having similar moisture content condition under different number of
PD is investigated. The effects of moisture content up to 188 ppm or about 17% relative
moisture content on generated combustible gases of PFAE are also discussed. The
applicability of the Duval triangle 3 method to interpret PD fault in oil samples is also
evaluated. The CO/CH4 ratio which is previously developed for estimating the temperature
of localized overheating, is used to predict the temperature of partial discharge.
4.2 Experiment 4.2.1 Experimental Arrangement
The Schematic diagram of PD experimental setup is depicted in Figure 4.1. It
consists of a high voltage transformer, RC detector, coupling capacitor, oil chamber, and
oscilloscope [1].
The high voltage transformer was a single phase two winding transformer, with the
capacity of 25 kVA and the photograph of the transformer is depicted in Figure 4.2a. The
voltage ratio of primary and secondary windings are 100 (200) V and 50 kV. The primary
winding was connected to the power source of 100 V, whereas the secondary winding was
connected to the oil chamber through the resistor of 100 kΩ(Figure 4.2b). No phase shift
between voltage waveforms of primary and secondary windings was observed during the
calibration process.

Chapter 4: Gas Generation of PFAE under Partial Discharge
Kyushu Institute of Technology, Dept. of Electrical and Electronics Engineering 54
A hand made coupling capacitor used in the experiment was constructed from two
capacitors of 2000 pF connected in series, thus resulting in a 1000 pF capacitance. The
photograph of the coupling capacitor is shown Figure 4.3. The coupling capacitor is
important to provide a path for a discharge current to flow, and together with 100 kΩ
resistor to prevent the current from entering the transformer [2].
Figure 4. 1 Experimental setup for PD measurement
100 V/50 kV
Oscilloscope
1000 pF
50 kΩ
RC
(a) (b)
Figure 4. 2 The high voltage transformer and the resistor used for
PD measurement.
Resistor, 100 kΩ
Transformer, 15 kVA
100 kΩ

Chapter 4: Gas Generation of PFAE under Partial Discharge
Kyushu Institute of Technology, Dept. of Electrical and Electronics Engineering 55
The oil sample was placed in a cylindrically shaped chamber made of acrylic in
which electrode pairs of needle-plane configuration were immersed. The cover and the base
of the chamber were made of stainless steel and acrylic, respectively. O-rings made of
nitrile butadiene rubber were used at the interface of cylindrical acrylic and the cover, and
at the interface of the cylindrical acrylic and its base, to realize a tightly sealed chamber
system. The photograph of the chamber is shown in Figure 4.4a. The needle having the tip
radius of 10 µm was used in conjunction with a plane electrode having diameter and
thickness of 68 mm and 5 mm, respectively. With an acrylic of 5mm thick on the plane
electrode surface, the gap between the needle and acrylic was 5 mm. The schematic view
of electrode configuration is shown in Figure 4.4b.
Figure 4. 3 The coupling capacitor
(a) (b)
Figure 4. 4 Oil chamber used for PD measurement (a), and electrode configuration (b).
5mm
5mm
Acrylic

Chapter 4: Gas Generation of PFAE under Partial Discharge
Kyushu Institute of Technology, Dept. of Electrical and Electronics Engineering 56
An RC impedance was used to detect PD signal. The output of the detector
corresponds to the apparent charge transfer of the discharge. The photographs and the
equivalent circuit of the RC detector are shown in Figures 4.5a and 4.5b, respectively.
An oscilloscope of Tektronix DPO 7504 type was used to display and to record the
PD waveform. The oscilloscope has 4 channels with the bandwidth up to 500 MHz, and
the sampling rate up to 5 GS/s. The photograph of the oscilloscope is shown in Figure 4.6.
4.2.2 Oil Sampling Procedure Gas generation by PD is studied under two different conditions. The first one is to
study gas generation by three kinds of PFAE samples having different moisture content,
stressed at the same level of voltage, and the same number of PD. The second one is to
(a) (b)
Figure 4. 5 RC detector for detecting PD pulse, (a) photographic view, (b) equivalent circuit
Figure 4. 6 Oscilloscope, Tektronix, DPO 7504 type
1000 pF
1000
pF
4.7
kΩ
4.7
kΩ
Arr
este
r
3.4 kΩ

Chapter 4: Gas Generation of PFAE under Partial Discharge
Kyushu Institute of Technology, Dept. of Electrical and Electronics Engineering 57
study gas generation by three PFAE samples having similar moisture condition, stressed at
the same level of voltage, but with different number of PD. The first sample (S1) was
prepared by degassing the sample in the way as that mentioned in section 3.2.3; the
differences are only in the type of chamber (Figure 4.4a) and the volume of oil used (this
time 350 mL). The photographic view of sampling procedure is shown in Figure 4.7. The
second sample (S2) was prepared by mixing 50 % degassed oil and 50% as-received oil;
The sample was firstly degassed until the volume of oil reaches 50% of required oil volume,
and the remaining 50% oil volume was withdrawn into the chamber while the vacuum
pump was turned off. The third sample (S3) was an as-received sample; the chamber was
firstly vacuumed for about 10 minutes, and then followed by introducing the oil into the
chamber while the vacuum pump was turned off. For all sampling procedures, argon gas
was introduced to occupy the oil-free space on the top oil inside the chamber.
4.2.3 Experimental Procedure Partial discharge (PD) was generated in each oil sample by applying an AC high
voltage on the electrode pairs of the needle plane configuration immersed in the oil. To
generate enough amounts of combustible gases in the oil sample, the AC voltage of 20 kV
Figure 4. 7 Schematic diagram of oil filling process.

Chapter 4: Gas Generation of PFAE under Partial Discharge
Kyushu Institute of Technology, Dept. of Electrical and Electronics Engineering 58
was applied. PD pulses were detected using RC integrated circuit, and PD measurement
was conducted using an oscilloscope (Tektronix, DPO 7504 type).
Two kinds of procedures were conducted. The first one was stressing three kinds
of PFAE samples having different moisture content with constant PD number of 8000. The
8000 number of PDs was achieved by utilizing the fast frame mode operation of the
oscilloscope. The second one used three different samples of the same condition (thus the
same moisture content), and varying the PD number applied to the oils, 5000, 8000 and
12000.
Two gas samples for each oil were prepared for gas analysis. The first one was
taken from the gas part, the oil-free space on the upper part of the chamber, whereas another
one, was taken from the oil part. Dissolved gas in the oil was extracted using the headspace
method. Gas samples were then analyzed using a gas chromatography (Shimazu Corp.
Japan, GC-2014 model).
4.3 Results and Discussion 4.3.1 Gas Generation under Different Moisture Content
The types of combustible gases generated by 8000 number of PD, stressed at 20
kV under the needle plane electrode configuration, in PFAE samples of three different
moisture content levels are found to be methane, ethylene, acetylene, and carbon monoxide,
as depicted in Figure 4.8 [3]. It is interesting that methane is dominant gas produced by the
oils for all moisture content levels. Ethane, on the other hand, was not found in all oil
samples. Carbon monoxide, which is expected to be generated in a higher amount due to
the existence of –COO- link in PFAE’s structure, was found to be even lower than the
amount of generated ethylene.

Chapter 4: Gas Generation of PFAE under Partial Discharge
Kyushu Institute of Technology, Dept. of Electrical and Electronics Engineering 59
Another interesting point that can be drawn from Figure 4.8 is that hydrogen is
produced by PFAE oil in not significant amount, and this behavior applies for all tested
samples with different levels of moisture content. These results differ from those usually
found in mineral oil under PD stress. It is well known that hydrogen is the key gas
indicating the presence of PD stress in mineral oil. Hydrogen was also reported to be
dominant in concentration found in a vegetable oil-based insulating liquid of triglyceride
type, FR3, under PD stresses [4].
Our results are similar in tendency, except ethane generation, to those reported in
[5], but quite distinct from those in [6], although the samples used in our experiment and
experimental conditions have a lot of similarities to those in [5] and [6]. Figures 4.9 and
4.10 show combustible gases generated by various natural monoester and mineral oil,
reproduced from [5] and [6], respectively. PFAE (used in our experiment and in [5]), Pastell
2H-08 (used in [5] and [6], and Pastell M12 (used in [6]) are of natural monoester type (see
Figure 2.8), and these oils do not have C=C double bond in their hydrocarbon chains.
Therefore, PFAE, M12, and 2H-08 possess the same chemical structure. Moreover, all oil
types are derived from the same source, palm oil. All sample oils were stressed by PD under
AC high voltage utilizing the needle-plane electrode configuration. The significant
differences to be noted are the applied voltage levels being experienced by the oils during
the PD stresses, and their durations. The applied voltage level in our case was 20 kV,
whereas those in [5] and [6] are 17 and 25 kV, respectively. The duration of applied voltage
Figure 4. 8 Generated combustible gases in PFAE samples of different moisture content levels by PD at 20 kV with PD number of 8000.

Chapter 4: Gas Generation of PFAE under Partial Discharge
Kyushu Institute of Technology, Dept. of Electrical and Electronics Engineering 60
in our case was about 30 minutes, whereas that in [5] was 120 minutes. The duration of
voltage application in [6] is unknown. Hence, the difference in gas generation mentioned
above is attributed to the differences in the applied voltage levels and their application
durations.
The average magnitude of 8000 number of PD pulses detected in PFAE samples
with three different moisture content levels are listed in Table 4.1. The amount of generated
combustible gases per PD magnitude is shown in Figure 4.11. No moisture dependence of
Figure 4. 9 Generated combustible gases by PD at 17 in various natural monoesters and mineral oil. The graph was reproduced from [5].
Figure 4. 10 Generated combustible gases by PD at 25 kV in two kinds of natural monoesters. The graph was reproduced from [6].

Chapter 4: Gas Generation of PFAE under Partial Discharge
Kyushu Institute of Technology, Dept. of Electrical and Electronics Engineering 61
generated combustible gases of PFAE can be seen in Figure 4.11. This is the consequence
of the independency of PD behavior of PFAE oil on the change of moisture content up to
188 ppm (17%), as will be seen later in chapter 5.
4.3.2 Gas Generation under Different PD Number The types and the patterns of combustible gases generated by PD stresses at 20 kV
in three similar PFAE sample conditions, but different in PD number, are similar to those
found in previous results, as depicted in Figure 4.12. No ethane generation was observed;
hydrogen is found in not significant amount, and methane was observed to be the main gas.
However, it is clear from the Figure 4.12 that the increase in the number of PD greatly
influences the amount of generated combustible gases.
Table 4. 1 PD charge of PFAE samples of different
moisture content levels.
Moisture Content (ppm)
PD Charge (pC) Min Max Average
102 2408 42691 24539 144 1532 42691 21840 188 1970 39188 22659
Figure 4. 11 Generated combustible gases/pC in PFAE samples of different moisture content levels by PD at 20 kV with PD number of 8000

Chapter 4: Gas Generation of PFAE under Partial Discharge
Kyushu Institute of Technology, Dept. of Electrical and Electronics Engineering 62
4.4 Fault Interpretation: Duval Triangle 3 (DT3) Duval Triangle (DT) 1, which is also called classical Duval Triangle, is a well-
established method used to interpret electrical and thermal faults in mineral oil filled
transformer. The increase in the usage of non-mineral oils motivates the appearance of
Duval Triangle (DT) 3. Two types of DT3 were developed to accommodate two natural
ester-based insulating liquids, Envirotemp and Biotemp [7], but only the DT3 for
Envirotemp is used to evaluate its applicability for PFAE oil in this paper.
Three kinds of gases (Duval triangle gases) are required in implementing DT3
method; CH4, C2H4, and C2H2 [7], and all of these gases are found to be dissolved in the
PD stressed PFAE samples. To interpret a fault occurring in the sample oil, the percentage
of the amount of each gas to the total amount of Duval triangle gases must be firstly
calculated based on the equations (4) – (6).
%[C H4] =[C H4]
[C H4]+[C2H4]+[C2H2]x 100 % (4)
%[C2H4] =[C2H4]
[C H4]+[C2H4]+[C2H2]x 100 % (5)
%[C2H2] =[C2H2]
[C H4]+[C2H4]+[C2H2]x 100 % (6)
Figure 4. 12 Generated combustible gases by PD at 20 kV under different PD number in three PFAE samples having relatively constant moisture content

Chapter 4: Gas Generation of PFAE under Partial Discharge
Kyushu Institute of Technology, Dept. of Electrical and Electronics Engineering 63
4.4.1 Gas Generation under Different Moisture Content The percentages of Duval triangle gases of the three PFAE samples having
different moisture content, stressed at 20 kV with PD number of 8000, calculated based on
equations (4) – (6) are tabulated in Table 4.2, and the plots in Duval Triangle 3 are depicted
in Figure 4.13. It can be seen that DT3 incorrectly interprets all PD fault cases. The samples
with moisture contents of 102 and 188 ppm are diagnosed to be the discharge of high energy
type (D2), whereas the sample with the moisture content of 144 is mistakenly put into the
combined thermal and electrical faults area in DT.
Table 4. 2 The percentage of Duval gases in PFAE samples
having different moisture content stressed with PD at 20 kV, with 8000 PD number.
Gas Type Percentage 102 ppm 144 ppm 188 ppm
CH4 55.5 42.3 44.1 C2H4 25.0 41.3 38.2 C2H2 19.5 16.4 17.7
Figure 4. 13 Fault interpretation of PFAE samples of different moisture content, stressed by PD at 20 kV with PD number of 8000, using Duval
Triangle 3 (DT3) method.
: S1 (102 ppm); : S2 (144 ppm); : S3 (188 ppm).

Chapter 4: Gas Generation of PFAE under Partial Discharge
Kyushu Institute of Technology, Dept. of Electrical and Electronics Engineering 64
4.4.2 Gas Generation under Different PD Number The percentages of Duval triangle gases for the three PFAE samples, stressed at 20
kV with different number of PDs, 5000, 8000, and 12000, calculated based on equations
(4) – (6) are listed in Table 4.3, and the plots in Duval Triangle 3 are depicted in Figure
4.14. It can be seen that DT3 incorrectly interprets all PD fault cases. The samples stressed
with 8000 and 12000 number of PDs are diagnosed to be the discharge of high energy type
(D2), whereas the sample stressed with 5000 number of PDs is mistakenly put into the low
thermal fault region in T1. The absence of C2H2 in the sample stressed with 5000 number
of PDs is attributed to a low total energy dissipated by discharge, and it is indicated by its
total PD charge which is much lower than other cases [8]. The total and average PD charge
produced by the oils is shown in Figure 4.15.
Table 4. 3 The percentage of Duval gases in PFAE samples
stressed with three different number of PDs
Gas Type Percentage 5000 N 8000 N 12000 N
CH4 79.3 55.5 31.4 C2H4 20.7 25.0 40.3 C2H2 0.0 19.5 28.3
Figure 4. 14 Fault interpretation of PFAE samples, stressed by PD at 20 kV with different PD number, using Duval Triangle 3 (DT3) method.
: 5000 N; : 8000 N; : 12000 N.

Chapter 4: Gas Generation of PFAE under Partial Discharge
Kyushu Institute of Technology, Dept. of Electrical and Electronics Engineering 65
4.4.3 Estimation of the Discharge Temperature The mechanism of gas generation in oil under PD differs from that under low
temperature overheating. However, during the discharge the temperature of the oil rises
locally at the discharge site. This temperature is estimated using the CO/CH4 ratio which
was previously proposed to estimate localized overheating in section 3.4. The relationship
between CO/CH4 ratio and temperature for PFAE (see Figure 3.16) can be expressed by
the equation (7):
CO/CH4 Ratio (PFAE) = 543.03 exp (-0.015T), (7)
where T is the temperature of discharge area (in this case, the temperature of the needle
electrode). Using the gas generation data of PFAE samples stressed by PD with PD
numbers of 5000, 8000, and 12000, then the temperatures of discharge are estimated, and
the results are listed in Table 4.4. It can be seen from the Table 4.4 that the estimated
temperatures of the discharges are about 500 oC. It should be noticed that the estimated
temperature is equivalent temperature not the real temperature increase. This is because PD
and local heating are different phenomena.
Figure 4. 15 The total and the average PD charge produced by discharge in PFAE samples stressed with different number of PD.

Chapter 4: Gas Generation of PFAE under Partial Discharge
Kyushu Institute of Technology, Dept. of Electrical and Electronics Engineering 66
4.5 Summary The gases generated by the oil under PD have been investigated. Some conclusions
can be drawn as follows:
1. Hydrogen, which is considered as the main gases for triglyceride type natural ester
under PD stress, is not observed in PFAE oil.
2. IEC method for DGA cannot be used to interpret PD in PFAE oil.
3. DT3 method overestimates PD faults with PD numbers of 8000 and 12000 by put them
into the discharge of high energy (D2) area. For sample stressed with 5000 PD number,
DT3 mistakenly interprets it as a low thermal fault (T1).
4. Variation of moisture content does not cause a significant difference in generated
combustible gases, but the variation of PD number does.
Table 4. 4 Generated gases, CO/CH4 ratio, and the estimated temperature
of PD stressed PFAE samples
5000 N 8000 N 12000 N CH4 3.2 µL/hr. 4.05µL/hr. 4.02µL/hr. CO 1.92µL/hr. 2.03µL/hr. 3.69µL/hr.
CO/CH4 0.6 0.5 0.92 Estimated
Temperature 523.27 oC 537.1 oC 490.56 oC
Chapter 4: Gas Generation of PFAE under Partial Discharge
Kyushu Institute of Technology, Dept. of Electrical and Electronics Engineering 67
References [1] A. Rajab, M. Tsuchie, M. Kozako, M. Hikita and T. Suzuki, "Study on PD Properties of Palm
Fatty Acids Esters Oil," in International Symposium on Ecotopia Science, Nagoya, 2015. [2] E. Kuffel, W.S. Zaengl and J. Kuffel, High Voltage Engineering, Fundamental, Oxford:
Butterworth-Heinemann, 2000. [3] A. Rajab, M. Tsuchie, M. Kozako, M. Hikita and T. Suzuki, "PD Properties and Gases
Generated by Palm Fatty Acid Esters (PFAE) Oils," in IEEE International Conference on Dielectric, pp. 816-819, Montpellier, 2016.
[4] Imad-U-Khan, "Dissolved Gas Analysis of Alternative Fluids for Power Transformers," IEEE Electrical Insulation Magazine, vol. 23, no. 5, pp. 5-14, 2007.
[5] Umar Khayam, Suwarno, Achmad Susilo, Joko Muslim, Yanuar Z. Arif and Masayuki Hikita, "Partial Discharge Characteristics and Dissolved Gas Analysis of Vegetable Oil," in ISEIM, pp. 330-333, 2014.
[6] Motoo tsuchie, "Study on Partial Discharge and Generated Gasses of Natural Ester Oils Having Different Molecular Structures," in 18th International Symposium on High Voltage Engineering, pp. 787-791, 2013.
[7] M. Duval, "The Duval Triangle for Load Tap Changers, Non-Mineral Oils and Low Temperature Faults in Transformers," IEEE Electrical Insulation Magazine, vol. 24, no. 6, pp. 22-29, 2008.
[8] A. Rajab, M. Tsuchie, M. Kozako and M. Hikita, "Early Deterioration of Palm Fatty Acid ester (PFAE) Oils," in International Workshop on High Voltage Engineering & J-K Symposium, Miyasaki, pp. 37-40, 2016.
[9] C. Perrier, M.-L. Coulibaly and M. Marugan, "Efficiency of ageing markers for different transformer insulation systems," in IEEE International Conference on Dielectric, pp. 824-827, Montpellier, 2016.
[10] Z. Liu, Q. Liu, Z. D. Wang, P. Jarman, Ch. Krause, P. W. R. Smith and A. Gyore, "Partial Discharge Behavior of Transformer Liquids and Influence of Moisture Content," in IEEE International Conference on Liquid Dielectrics, pp. 1-4, Bled, 2014.
[11] S. Singha, R. Asano Jr., G. Frimpong, C. C. Claiborne and D. Cherry, "Comparative Aging Characteristics between a High Oleic Natural Ester Dielectric Liquid and Mineral Oil," IEEE Transactions on Dielectrics and Electrical Insulation, vol. 21, no. 1, pp. 149-158, 2014.
[12] Y. Du, V. Mamishev, B. C. Lesieutre, M. Zahn and S. H. Kang, "Moisture Solubility for Differently Conditioned Transformer Oils," IEEE Transactions on Dielectrics and Electrical Insulation, vol. 8, no. 5, pp. 805-811, 2001.
[13] C. P. McShane, K. J. Rapp, J. L. Corkran, G. A. Gauger and J. Luksich, "Aging of Kraft Paper in Natural ester Dielectric Fluid," in IEEE International Conference on Dielectric Liquids, pp. 173-177, Graz, 2002.
[14] R. K.J., McShane and Luksich, "Interaction Mechanism of Natural Ester Dielectric Fluid and Kraft paper," in IEEE Conference on Dielectric Liquids, pp. 393-396, Coimbra, 2005.
[15] N. U. Muhamad, B. T. Phung, T. R. Blackburn and K. X. lai, "Comparative Study and Analysis of DGA Methods for Transformer Mineral Oil," in IEEE International Conference on Power Tech, pp. 45-50, 2007.
[16] M. Tsuchie, M. Tien and M. Hikita, "Fundamental Study for Advancement of Dissolved Gas Analysis of Oil-immersed Transformer by LTOH," in 8th Int’l. Workshop & Japan-Korean Symposium on Electrical Discharge and High Voltage Eng., pp. 27-31, 2012.

Chapter 4: Gas Generation of PFAE under Partial Discharge
Kyushu Institute of Technology, Dept. of Electrical and Electronics Engineering 68

Chapter 5: PD Behavior of PFAE under Different Moisture Content
Kyushu Institute of Technology, Dept. of Electrical and Electronics Engineering 69
Chapter 5
PD Behavior of PFAE under Different Moisture Content
5.1 Introduction The investigation on the effect of moisture content on PD behavior has been made
on mineral oil [1] [2], and on natural ester [3]. It has not been concluded whether the
increase in moisture content intensifies PD activities in insulation oils, or vice versa [3].
Since the application of monoester type insulation oil is still limited at the
distribution transformer, and the moisture content of the oil is not strictly controlled under
distribution transformer implementation, then the effect of moisture content on PD
behavior of the oil need to be investigated. This chapter deals with the investigation results
of PD behaviors of PFAE sample oils under of two different moisture content conditions,
dry and moist samples. PD properties like partial discharge inception voltage (PDIV), as
well as PD number and average PD charge at different applied voltage levels, are
investigated and analyzed. The polarity of applied voltage at which PD pulses have
occurred is discriminated and explored. A mechanism of the water molecules effect on PD
behavior is proposed and demonstrated schematically.
5.2 Preliminary Consideration At first trial in investigating the effect of moisture content on PD behavior of PFAE,
five kinds of PFAE samples with different moisture contents were used. The first sample
(S1) was prepared by degassing the sample in the way as that mentioned in section 4.2.2.
The third sample (S3) was an as-received sample, the sample without pre-treatment before
being used as the experimental specimen. The second sample (S2) was prepared by mixing
50 % of S1 and 50% of S3. The fifth sample (S5) was prepared by adding a 5 ml of water
into a 1000 ml of the oil sample, and then mixing the sample at 500 rpm at the temperature
of 40 oC for about 12 hours using a magnetic stirrer as shown in Figure 5.1. The fourth
sample (S4) was a mixture of 50 % of S3 and 50 % of S5. The procedures of filling-in for
samples S4 and S5 are similar to those of S2 and S3, respectively, as mentioned in chapter 4.
The moisture content of all samples is listed in Table 5.1.

Chapter 5: PD Behavior of PFAE under Different Moisture Content
Kyushu Institute of Technology, Dept. of Electrical and Electronics Engineering 70
It should be noticed that at first trial, PD measurement was conducted by
considering only the positive PD, and the PD pulses were measured using solely RC
detector connected in series with the oil chamber, instead of a combination of R detector,
detecting impedance (DI) and CD6. The experimental arrangement and procedure are
described in section 4.2. This based on the previous report explaining that the PD charge
of negative PD is much lower than that of positive PD [4].
5.2.1 PD Inception Voltage (PDIV) PDIV is defined as the lowest applied voltage at which the first PD with the
magnitude of equal to or greater than 100 pC, according to IEC61294, takes place. Using
(a) Photograph (b) Chamber and magnetic stirrer
Figure 5. 1 Addition of water into the oil sample to realize the moist sample; Photographic view, (b) the chamber containing a stirrer.
Table 5. 1 Moisture content of PFAE samples
Sample Condition Moisture Content Actual (ppm) Relative* (%)
S1 100 % Degassed (DG) 102 9.27 S2 50 % DG + 50 % Non-DG 144 13.09 S3 100 % Non-DG 188 17.09 S4 50 % NDG + 50 % water added 333 30.27 S5 100 % water added sample 463 42.09
*Assuming water solubility of PFAE is 1100 ppm

Chapter 5: PD Behavior of PFAE under Different Moisture Content
Kyushu Institute of Technology, Dept. of Electrical and Electronics Engineering 71
this definition, then the PDIV of five different oil samples having moisture content levels
of 102, 144, 188, 333, and 463 ppm are found to be 12, 10, 12, 9 and 7 kV, respectively, as
listed in Table 5.2. The change of PDIV levels against moisture content change is depicted
in Figure 5.2. The PDIV levels of oil with the moisture content up to 188 ppm seem to be
independent of the moisture content levels [5]. The 10 kV PDIV of oil sample containing
moisture of 144 ppm is more likely to be due to the existence of a weak point in the oil at
the time of voltage application. It could be a small bubble inclusion during the oil filling
process which was failed to be completely removed. However, the PDIVs decrease to 9
and 7 kV when the moisture content of the oils increases to 333 and 463 ppm, respectively.
These results are in line with the results in mineral oil, as reported in [2].
From the PDIV viewpoint, it is indicative that moisture affects PD activities in a
similar way to that of a total breakdown in insulating oil. Namely, it is reported that the
moisture content up to 300 ppm does not cause a decrease in breakdown voltage (BDV) of
the natural ester. In general, it is concluded that the relative moisture content up to about
10% and 30% of unclean and clean insulation oils, respectively, do not significantly affect
the breakdown voltage of oils, irrespective of oil type [6]. Figure 5.3 shows the moisture
content dependence of breakdown voltage of clean natural ester, synthetic ester, and
mineral oils [6]. The figure closely resembles with the Figure 5.2. Since the oil samples
were filtered before being subjected to PD, they were considered to be clean oil. With the
moisture solubility of PFAE at room temperature is 1100 ppm (assumed), it is reasonable
to state that relative moisture content up to about 17% do not have a significant effect on
PDIV of PFAE, but moisture content of equal to or larger than 30 % remarkably change
PDIV levels of the oils. Figure 5.4 shows a direct comparison between PDIV and BDV of
PFAE oil as a function of moisture content, from which the similar tendency of the
Table 5. 2 PDIV of PFAE samples of different moisture
content.
Moisture Content PDIV (kV) Actual (ppm) Relative (%)*
102 9.27 12 144 13.09 10 188 17.09 12 333 30.27 9 463 42.09 7

Chapter 5: PD Behavior of PFAE under Different Moisture Content
Kyushu Institute of Technology, Dept. of Electrical and Electronics Engineering 72
dependency of both parameters on moisture content can be seen. Data for constructing
BDV curve are taken from [7].
Figure 5. 2 PDIV of PFAE under various moisture content levels
Figure 5. 3 Breakdown Voltage of clean insulating oils under various relative moisture contents reproduced from [6].

Chapter 5: PD Behavior of PFAE under Different Moisture Content
Kyushu Institute of Technology, Dept. of Electrical and Electronics Engineering 73
5.2.2 PD Number and PD Charge versus Applied Voltage Figures 5.5 and 5.6 show relations between, respectively, PD number and average
PD charge (from now on called PD charge) and applied voltage. It can be seen that the
change in PD number and PD charge of oils against applied voltage variation under
different moisture contents up to 188 ppm (17 %) is not significantly different [8]. Further
increase in moisture content up to 333 ppm (30.27 %) and 463 ppm (42.09 %) reveals an
interesting phenomenon. Both oil samples show a similar PD behaviors; PD charge of both
samples decrease slightly, and their PD number reduce drastically and almost disappear.
The reason for these will be discussed later in discussion section.
Figure 5. 4 Comparison between PDIV and BDV of PFAE oil. BVD curve is reproduced from [7].
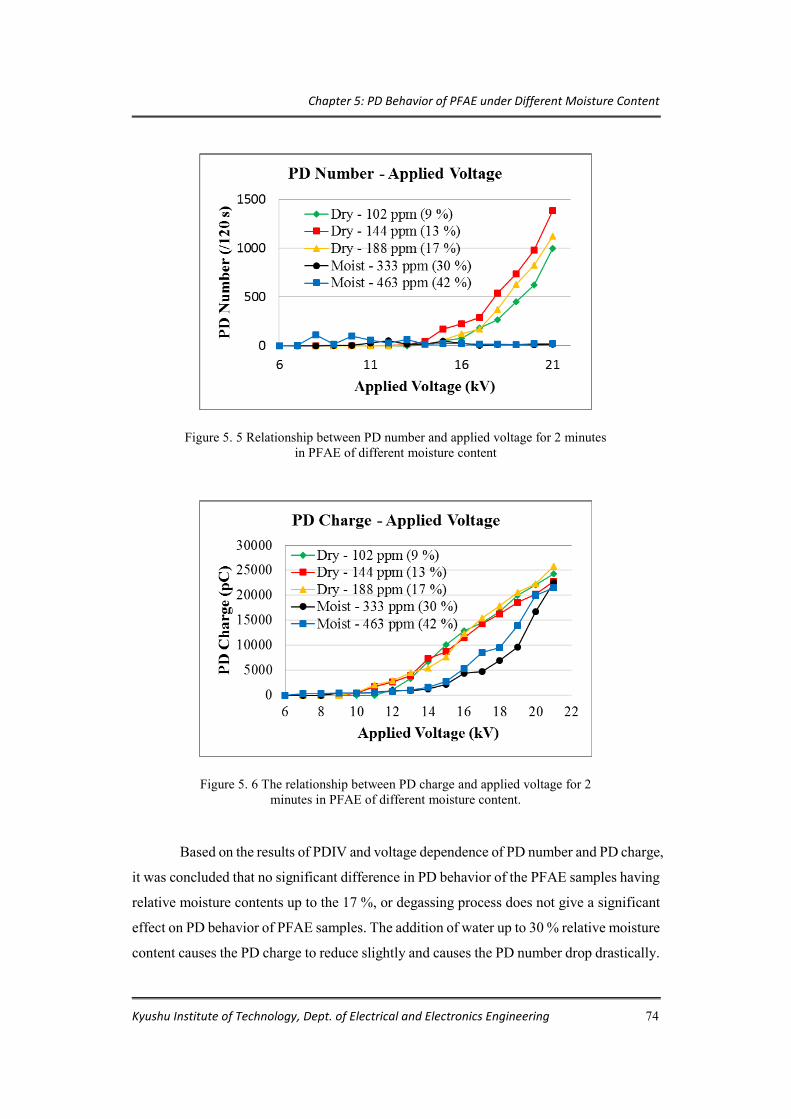
Chapter 5: PD Behavior of PFAE under Different Moisture Content
Kyushu Institute of Technology, Dept. of Electrical and Electronics Engineering 74
Based on the results of PDIV and voltage dependence of PD number and PD charge,
it was concluded that no significant difference in PD behavior of the PFAE samples having
relative moisture contents up to the 17 %, or degassing process does not give a significant
effect on PD behavior of PFAE samples. The addition of water up to 30 % relative moisture
content causes the PD charge to reduce slightly and causes the PD number drop drastically.
Figure 5. 5 Relationship between PD number and applied voltage for 2 minutes in PFAE of different moisture content
Figure 5. 6 The relationship between PD charge and applied voltage for 2 minutes in PFAE of different moisture content.

Chapter 5: PD Behavior of PFAE under Different Moisture Content
Kyushu Institute of Technology, Dept. of Electrical and Electronics Engineering 75
This seems to be an anomaly. The PDIV decreased, but both PD charge and PD number
also decreased. The investigation was then carried on by taking the negative PD into the
consideration in addition to the positive PD, and only examined the PD behaviors of dry
and moist samples. The dry sample was represented by the as-received oil (S3), whereas
moist sample was represented by the sample with additional 5 ml of water (S5).
5.3 Experiment 5.3.1 Experimental Arrangement
Schematic diagram of experimental setup to measure PD is depicted in Figure 5.7.
It consists of a high voltage transformer, resistor, coupling capacitor, oil chamber, PD
detectors, and oscilloscope. All of the equipment used in this experiment are of the same
as those described in chapter 4 section 4.2.1, except PD detectors.
There were two detectors used in the experiment, R detector and detecting
impedance (DI). DI was used in combination with a PD monitoring device (CD6) whose
output corresponds to the apparent charge transfer of the discharge. The photographs of R
detector, DI and CD6 are shown in Figure 5.8.
Figure 5. 7 Experimental setup for PD measurement
100 kΩ

Chapter 5: PD Behavior of PFAE under Different Moisture Content
Kyushu Institute of Technology, Dept. of Electrical and Electronics Engineering 76
5.3.2 Experimental Procedure Partial discharge (PD) was generated in each oil sample by applying an AC high
voltage on electrode pairs of needle plane configuration. PD measurement was performed
using a combined resistor (R), detecting impedance (DI) and the PD detection system
(CD6) to compare PD magnitude and PD phase distribution of PFAE at both positive and
negative polarities of AC voltage application. The schematic diagram of the PD
measurement is shown in Figure 5.7. R detector was used to discriminate the polarity of
PD pulses, whereas combined DI and CD6 detectors were used to measure the charge of
PD pulses by integrating PD current using the capacitor of DI.
To investigate voltage dependence of PD charge and PD number, the experiment
was conducted by varying applied voltage. The application of voltage (Va) was started at 7
kV, and increased with the increment of 1 kV up to 21 kV. At each voltage level, the applied
voltage was kept for about 2 minutes for conducting the measurement. PD measurement
was conducted by utilizing the fast frame mode operation of the oscilloscope.
To study phase distribution of PD pulses R detector was removed and the PD pulses
were detected by the combined DI and CD6 detector. The 60 Hz AC voltage waveform
(a) R detector (b) Detecting Impedance (DI)
(c) CD-6
Figure 5. 8 PD detectors; (a) R detector, (b) Detecting impedance, and (c) CD6

Chapter 5: PD Behavior of PFAE under Different Moisture Content
Kyushu Institute of Technology, Dept. of Electrical and Electronics Engineering 77
taken from the primary winding of transformer was also detected for reference. A voltage
probe having a voltage ratio of 10:1 was used to step down the amplitude of AC voltage
before being connected to the oscilloscope. The PD pulses occurring within 30 cycles of
applied voltage wave were captured using the “single” mode operation. The PD phase
distribution for 120 cycles is constructed by combining 4 measurement results.
5.4 Results 5.4.1 PD Pulse Shape
The formation mechanisms of negative and positive PD in insulating oil are
different, and it also applies for those in PFAE oil. When the needle is negative initial
electrons required to trigger PD are injected from the field enhancement site at the tip of
the needle electrode, resulting in PD pulse burst which contains one to several discreet PD
pulses [9]. An example of negative PD pulse burst which contains 4 discrete pulses and the
corresponding integrated charge, obtained in dry PFAE sample at 15 kV, is shown in Figure
5.9a. When the needle is positive, the initial electron comes from the oil side through a field
ionization mechanism [10], resulting in a more irregular and erratic PD pulses [9], having
a duration between 0.5 to 6 µs. An example of positive PD pulse and the corresponding
integrated charge, obtained at the same condition as that of negative one, is shown in Figure
5.9b. It can be seen that magnitude of positive PD is much larger than the negative one.
This behavior applies to both dry and moist samples, as will be further elaborated in the
next section.
Time (µs)
a. Negative PD
PD current - R
PD Charge – CD6
PD C
urre
nt (m
V/5
0)
PD C
harg
e (V
x55.
38)

Chapter 5: PD Behavior of PFAE under Different Moisture Content
Kyushu Institute of Technology, Dept. of Electrical and Electronics Engineering 78
5.4.2 Voltage Dependence of PD Number and PD Charge in Dry and Moist Samples Figures 5.10.a and 5.10.b show the dependency of PD number on applied voltage
in dry and moist samples, respectively. Under dry condition (Figure 5.10a), PD numbers
of both polarities increase with applied voltage, and the increase of positive PD number
(red color) is much larger than the negative one (blue color). The situation is changed under
moist sample (Figure 5.10b) PD number of positive polarity falls drastically, whereas that
of negative polarity increases drastically. This will be elaborated later in discussion section.
Time (µs)
(b) Positive PD
Figure 5. 9 Examples of PD current pulse shape and integrated PD charge in dry PFAE sample, taken at 15 kVrms; (a) Negative PD, and (b) Positive PD; Horizontal scale (time), 5 µs/div.; Vertical scale: blue - 100 mV/div., Yellow - 2 V/div, (attn.: 10)
PD current - R PD Charge – CD6
PD C
urre
nt (m
V/5
0)
PD C
harg
e (V
x55.
38)

Chapter 5: PD Behavior of PFAE under Different Moisture Content
Kyushu Institute of Technology, Dept. of Electrical and Electronics Engineering 79
Figures 5.11a and 5.11b show the dependency of PD charge on applied voltage in
dry and moist samples, respectively. PD charge of both polarities increase with applied
voltage, and again, the increase of positive PD charge (red color) is much larger than the
negative one (blue color). No polarity reversal tendency of PD charge was obtained when
the moisture content of the sample increased. The change only affects PD charge in the
way that the increase in positive PD charge is slightly less in the moist sample than that in
the dry sample, while negative PD charge in both dry and moist samples increase to a
(a) Dry sample (188 ppm, 17 %)
(b) Moist sample (463 ppm, 42.09 %)
Figure 5. 10 Relationship between PD number and applied voltage for two
minutes in PFAE; (a) dry sample, (b) moist sample

Chapter 5: PD Behavior of PFAE under Different Moisture Content
Kyushu Institute of Technology, Dept. of Electrical and Electronics Engineering 80
comparable level, confirming results in [11]. The results of PD charge are in line with the
observation on mineral oil reported in [1]. There, it is stated that the increase in moisture
content leads to a slight reduction in PD charge of mineral oil, which is due to the decrease
in PD pulse duration [1].
(a) Dry sample (188 ppm, 17 %)
(b) Moist sample (463 ppm, 42.09 %)
Figure 5. 11 Relationship between PD charge and applied voltage for two minutes in
PFAE; (a) dry sample, (b) moist sample.
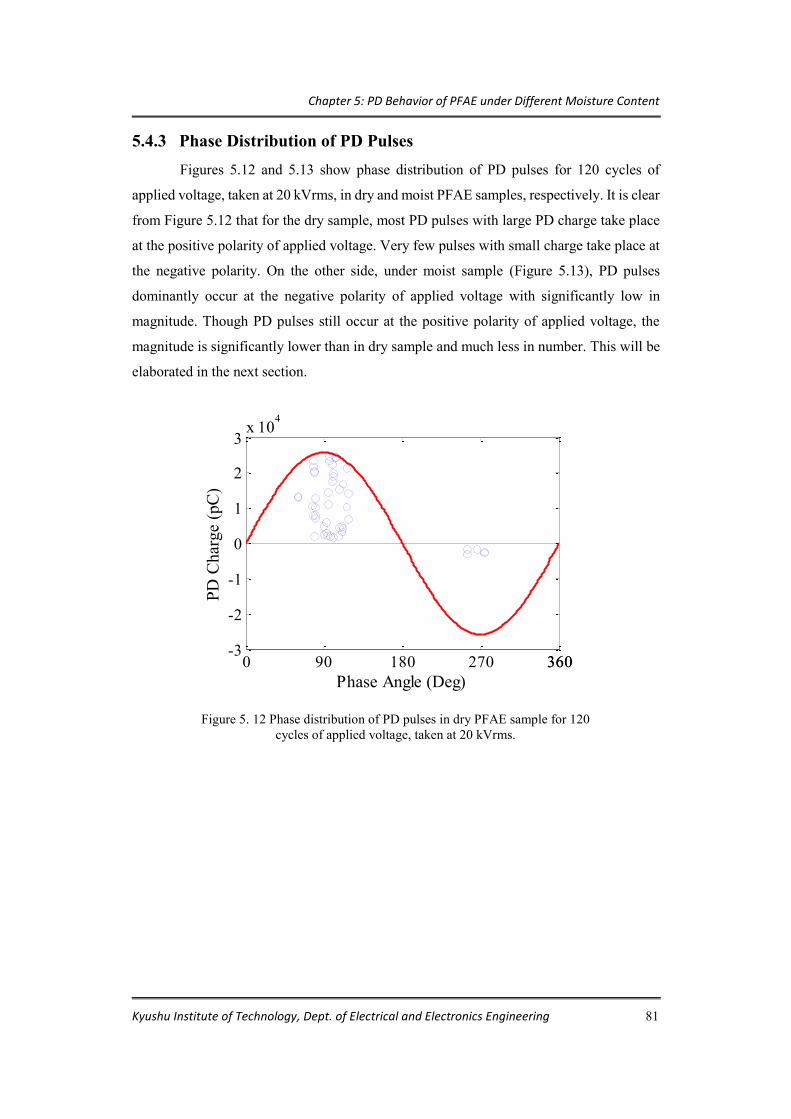
Chapter 5: PD Behavior of PFAE under Different Moisture Content
Kyushu Institute of Technology, Dept. of Electrical and Electronics Engineering 81
5.4.3 Phase Distribution of PD Pulses Figures 5.12 and 5.13 show phase distribution of PD pulses for 120 cycles of
applied voltage, taken at 20 kVrms, in dry and moist PFAE samples, respectively. It is clear
from Figure 5.12 that for the dry sample, most PD pulses with large PD charge take place
at the positive polarity of applied voltage. Very few pulses with small charge take place at
the negative polarity. On the other side, under moist sample (Figure 5.13), PD pulses
dominantly occur at the negative polarity of applied voltage with significantly low in
magnitude. Though PD pulses still occur at the positive polarity of applied voltage, the
magnitude is significantly lower than in dry sample and much less in number. This will be
elaborated in the next section.
Figure 5. 12 Phase distribution of PD pulses in dry PFAE sample for 120 cycles of applied voltage, taken at 20 kVrms.
0 90 180 270 360360-3
-2
-1
0
1
2
3x 10⁴
Phase Angle (Deg)
PD C
harg
e (p
C)

Chapter 5: PD Behavior of PFAE under Different Moisture Content
Kyushu Institute of Technology, Dept. of Electrical and Electronics Engineering 82
5.5 Discussion Far below saturation level, under dry condition, water molecules present in the
form of being bonded to esteric and etheric oxygen atoms of ester molecules, or are trapped
between two ester molecules [12]. At this level, the presence of water does not give a
significant effect on the dielectric behavior of ester oils [6]. Moisture content up to 188
ppm or about 17% relative moisture content does not cause a significant difference in PD
properties of PFAE [13]. When the concentration of water is high, water molecules are
distributed randomly in oil, or join together forming water clusters. Under this condition,
PD activities are enhanced, which are indicated by the decrease in PDIV, and the drastic
increase in the number of PD. These intense PD activities mostly occur at the negative
polarity of applied voltage. PD pulses still occur at the positive polarity of applied voltage
under moist condition, but the PD charge of positive PD is significantly lower than in dry
sample and much less in number.
It was mentioned in literature review (section 2.5) that researchers who deals with
PD in insulating oil have not come to a consensus about how the presence of moisture
affects PD behaviour of the oil. Hence, the argument to explain our experimental result on
PD behavior of PFAE samples of different misture content is picked up from the argument
used to explain streamer in the oil. The reasons for this come from the conclusions in [13]
that the PD observed in dielectric fluids are associated with the appearance of streamers
Figure 5. 13 Phase distribution of PD pulses in moist PFAE sample for 120 cycles of applied voltage, taken at 20 kVrms.
0 90 180 270 360-1
-0.5
0
0.5
1x 10⁴
Phase Angle (Deg)
PD C
harg
e (p
C)

Chapter 5: PD Behavior of PFAE under Different Moisture Content
Kyushu Institute of Technology, Dept. of Electrical and Electronics Engineering 83
and represent discharges occurring within these streamers, and in [14] that PDIV and
streamer inception voltage (SIV) are interrelated.
From literature study conducted on the streamer in insulating oil, it was found that
the existence of fluorine atom having high electron affinity in Galden D-40 fluid was
suspected to be the main reason for the different behavior of Galden D-40 from Ugilec C
101 and Baylectrol 4900 liquids. Unlike two other fluids, PDIV and SIV of Galden D-40
are lower and took place at the negative polarity of applied voltage [13]. In cyclohexane,
an addition of electron-attaching additives was proven to increase the negative streamer
velocity [15]. In mineral oil, the addition of electron scavenger additives accelerate
negative streamer. Polyaromatic components of the mineral oil increase velocities of both
positive and negative streamers. The effect on negative streamer is due to their electron
scavenger property, whereas the effect on positive streamer is due to the low ionization
potential characteristic of aromatic compounds [10]. The existence of oxygen atom which
is highly electronegative is suspected to be the reason of the faster and the further
propagation of negative streamer in esters than in mineral oil at the same level of applied
voltage [16]. Finally, it is highlighted in [17] that molecular structure has a significant
effect on the streamer propagation. The main parameter affecting streamer propagation is
the electronic affinity of the liquid molecules.
Terms electron affinity, electron-attaching property, and electron scavenger
property, as well as electronegativity, are interchangeable terms used by different
researchers to designate the tendency of a substance to attract electrons. Hence, referring
to our experimental results, the difference in PD behavior of PFAE samples of dry and
moist conditions is attributed to the electronic affinity of the water molecule (water
molecule contains oxygen atom which has high electron affinity).
5.5.1 Mechanism Based on our experimental results and the literature review, then a mechanism of
the effect of water molecules on PD behaviors of PFAE oil is proposed, as shown
schematically in Figure 4.14. Under the dry condition, free water, and water cluster does
not exist in the oil. The move of electrons is merely influenced by forces due to the electric
field, and restriction by oil molecules.
Under the moist condition, neglecting the restriction force by oil molecules, the
move of the electron is controlled by two types of forces, namely, the force resulted from
electric field (Fef), and the force resulted from the attraction of water molecules due to their

Chapter 5: PD Behavior of PFAE under Different Moisture Content
Kyushu Institute of Technology, Dept. of Electrical and Electronics Engineering 84
electronic affinity (Fen). When the needle is negative, electrons are injected from the needle
electrode through a field emission process. The electrons are accelerated into the oil side
due to the superposition of Fef and Fen (Figure 5.14a). This acceleration enhances PD
activities of moist oil under negative polarity. When the needle is positive, electrons are
extracted from the oil side through a field ionization process. The electrons are decelerated
toward the needle electrode since accelerating force (Fef) was diminished by water
molecules attractions (Fen) (Figure 5.14b). This deceleration reduces PD activities of moist
oil under positive polarity.
Moreover, since the relative permittivity of water (80) is much larger than that of
oil (2.9), water molecules under high voltage tend to move into the high electric field area
between the needle and the plane electrodes, as schematically shown in Figure 5.15. This
will enhance the effect mentioned in the previous paragraph.
(a) Negative polarity (b) Positive polarity
Figure 5. 14 Schematic demonstration of the mechanism of the effect of water molecules on
PD behavior of PFAE oils. Fef and Fen represent forces due to the electric field application and due to the electronic affinity of water molecule.
The direction of forces. The direction of the electron's move.
Fef
Fen
electron
Water molecules
Fef
Fen
electron
Water molecules

Chapter 5: PD Behavior of PFAE under Different Moisture Content
Kyushu Institute of Technology, Dept. of Electrical and Electronics Engineering 85
5.5.2 Practical Implication It has been shown that the increase in moisture content intensifies PD activities in
PFAE sample which are indicated by the significant decrease in PDIV and the drastic
increase in PD number. The PD pulses in moist sample mostly took place at the negative
polarity of applied voltage. The average charge of these negative PDs is remarkably lower
than that of positive ones. The positive PD pulses still occurred, but with the significant
reduction in the PD charge and with the drastic reduction in PD numbers.
It can be said that the increase in moisture content, under our experimental
conditions, does not aggravate the PFAE oil performance. The drastic increase in PD
number at negative polarity in moist oil is compensated by the remarkably lower PD charge
compared to that at positive polarity under dry condition.
5.6 Summary PD behaviors of PFAE sample oils under the dry and moist conditions have been
investigated. The effect of moisture content can be summarized as follows:
1. Under positive polarity, both PD charge and PD number reduce significantly and
drastically, respectively.
(a) wihtout electric field (b) with applied electric field (-)
Figure 5. 15 Schematic demonstration of the movement tendency of water molecule under
influence of electric field. Attraction forces of water molecules under electric field are aligned that lead to the enhancement of resultant force (FenR).
Fen,R Fen,R

Chapter 5: PD Behavior of PFAE under Different Moisture Content
Kyushu Institute of Technology, Dept. of Electrical and Electronics Engineering 86
2. Under negative polarity, PD charge remains constant, but PD number increases
drastically.
3. The reason is due to the electronic affinity property of water molecules which in
negative polarity accelerate electrons triggering PD, whereas in positive polarity
decelerate them.
4. The drastic increase in PD number under negative polarity is compensated by the small
average PD charge. As a consequence, the change in the moisture content does not
aggravate the PFAE oil performance.
5. From the industrial viewpoint, PFAE can be used without degassing for the moisture
content below 200 ppm.

Chapter 5: PD Behavior of PFAE under Different Moisture Content
Kyushu Institute of Technology, Dept. of Electrical and Electronics Engineering 87
References [1] H. Borsi and U. Schroder, "Initiation and Formation of Partial Dischargea in Mineral-based
Insulating Oil," IEEE Transactions on Dielectrics and Electrical Insulation, vol. 1, no. 3, pp. 419-425, 1994.
[2] A. Cavallini, G. C. Montanari and F. Ciani, "Analysis of Partial Discharge Phenomena in Paper-Oil Insulation System as a Basis for Risk Assessment Evaluation," in IEEE International Conference on Dielectric Liquids, pp. 241-244, Coimbra, 2005.
[3] Z. Liu, Q. Liu, Z. D. Wang, P. Jarman, Ch. Krause, P. W. R. Smith and A. Gyore, "Partial Discharge Behavior of Transformer Liquids and Influence of Moisture Content," in IEEE International Conference on Liquid Dielectrics, pp. 1-4, Bled, 2014.
[4] Y. Abe, M. Kozako, H. Toda, M. Tsuchie, M. Hikita and Ei Sasaki, "Dissolved Gas Analysis of Transformer Oil under the Conditions of Partial Discharge and Overheating," in International Conference on the Condition Monitoring and Diagnosis, pp. 131-134, Tokyo, 2010.
[5] A. Rajab, M. Tsuchie, M. Kozako, M. Hikita and T. Suzuki, "PD Properties and Gases Generated by Palm Fatty Acid Esters (PFAE) Oils," in IEEE International Conference on Dielectric, pp. 816-819, Montpellier, 2016.
[6] C. W. A2.35, "Experience in Service with new Insulating Liquids," CIGRE, 2010. [7] T. Kano, T. Suzuki, R.Oba, A. Kanetani and H.Koide, "Study on the Oxidative Stability of
Palm Fatty Acid Ester (PFAE) as an Insulating Oil for Transformers," in ISEI, pp. 22-25, 2012. [8] A. Rajab, M. Tsuchie, M. Kozako, M. Hikita and T. Suzuki, "Study on PD Properties of Palm
Fatty Acids Esters Oil," in International Symposium on Ecotopia Science, Nagoya, 2015. [9] M. Pompili, C. Mazzetti and R. Bartnikas, "Partial Discharge Pulse Sequence Patterns and
Cavity Development Times in Transformer Oils under ac Conditions," IEEE Transactions on Dielectrics and Electrical Insulation, vol. 12, no. 2, pp. 395-403, 2005.
[10] John C. Devins, Stevan J. Rzad and Robert J. Schwabe, "Breakdown and Prebreakdown Phenomena in Liquids," Journal of Applied Physics, vol. 52, no. 7, pp. 4531-4545, 1981.
[11] A. Rajab, M. Tsuchie, M. Kozako and M. Hikita, "Early Deterioration of Palm Fatty Acid ester (PFAE) Oils," in International Workshop on High Voltage Engineering & J-K Symposium, pp. 37-40, Miyasaki, 2016.
[12] Yasutoshi Kasahara, Masashi Kato, Satashi Watanabe, Makio Iwahashi, Rieke Wakamatsu, Takashi Suzuki, Akinori Kanetani and Takaaki kano, "Consideration on the Relationship Between Dielectric Breakdown," Journal of the American Oil Chemists, vol. 87, no. 1, 2010.
[13] E. O. Forster, "Partial Discharges and Streamers in Liquid Dielectrics," IEEE Transactions on Electrical Insulation, vol. 28, no. 6, pp. 941-946, 1993.
[14] C. Mazzetti, M. Pompili, H. Yamashita and E. O. Forster, "A Comparison of Streamer and Partial Discharge Inception Voltage in Liquid Dielectrics," in Sixth International Conference on Dielectric Materials, Measurements, and Applications, pp. 93-95, Mancester, 1992.
[15] S. Ingebrigsten, H. S. Smale, P. O. Astrand and L. E. Lundgaard, "Effect of Electron-Attaching and Electron-Releasing additives on Streamers in Liquid Cyclohexane," IEEE Transactions on Dielectrics and Electrical Insulation, vol. 16, no. 6, pp. 1524-1535, 2009.
[16] Q. Liu and Z. D. wang, "Streamer Characteristic and Breakdown in Synthetic and Natural Ester Transformer Liquids under Standard Lightning Impulse Voltage," IEEE Transactions on Dielectric and Electrical Insulation, vol. 18, no. 1, pp. 285-294, 2011.
[17] A. Beroual, M. Zahn, A. badent, K. Kist, A. J. Schwabe, H. Yamashita, K. Yamazawa, M. Danikas, W. G. Chadband and Y. Torshin, "Propagation and Structure of Streamers in Liquid Dielectrics," IEEE Electrical Insulation Magazine, vol. 14, no. 2, pp. 6-17, 1998.

Chapter 5: PD Behavior of PFAE under Different Moisture Content
Kyushu Institute of Technology, Dept. of Electrical and Electronics Engineering 88

Chapter 6: Conclusions
Kyushu Institute of Technology, Dept. of Electrical and Electronics Engineering 89
Chapter 6
Conclusions
6.1 Significant Findings In this thesis, the gas generations under low temperature overheating, gas
generation under PD and PD behavior under different moisture contents of natural
monoester, with special emphasis on PFAE have been investigated. The significant
findings obtained in this work are as follows:
1. Ethane generation phenomenon under thermal fault, which is previously regarded as
the key gas to distinguish natural esters from mineral oil, is now clear as the difference
between oil having C=C bond in their hydrocarbon chains and those without C=C bond,
irrespective of the oil types. Namely, it was found that ethane is generated from oils
having C=C bond in its chemical structure.
2. It is revealed from the ethane generation of M182 that the existence of unsaturated fatty
acids of the omega-3 type in the chemical structure of oil is not a condition required
for the oil having C=C bond to generate a noticeable amount of ethane under low
thermal faults. M182 does not contain fatty acids of omega-3 type, but the oil generates
a remarkable amount of ethane. It is said in the literature that ethane generation by
natural ester under thermal fault is commonly due to the peroxidation of unsaturated
fatty acids of omega-3 type.
3. None of the existing mineral oil based DGA interpretation methods can be used to
interpret low temperature overheating fault in natural monoester. Instead, the ratio of
CO/CH4 is proposed.
4. For Gas generation under PD, among the existing DGA interpretation methods, only
Duval Triangle method can be evaluated, and the method generally overestimates the
PD faults as discharges of low energy, instead of PD.
5. As the PFAE has a lower viscosity, thus has better cooling property compared to
mineral oil and other kinds of ester oils, thermal diffusion from a hot spot (heaters for
LTOH and top of the needle for PD) in the PFAE is better than that in mineral oil and
other kinds of ester oils. Hence, the conventional diagnostic methods cannot be used
for PFAE.

Chapter 6: Conclusions
Kyushu Institute of Technology, Dept. of Electrical and Electronics Engineering 90
6. The presence of moisture in significant amount (up to 33% relative moisture content)
intensifies PD activities in natural monoester (PFAE at this moment). These intense
PD activities mostly occur at the negative polarity of applied voltage with small PD
charge. The positive PD still occur, but with a slight reduction in PD magnitude, and a
drastic decrease in PD number.
7. The moisture effect on PD behavior of PFAE oil is attributed to the electronic affinity
of the water molecule, and the graphical representation of water molecules effect on
PD behavior is proposed.
6.2 Future Works In order to get a better understanding of the subject studied in this research, future
works on the following items would be valuable:
1. For gas generation under thermal fault, the clarifications of ethane phenomenon and
the applicability of CO/CH4 ratio at higher levels of temperature up to 700 oC or more
are important to be performed. In addition, the mechanism of ethane generation by oils
having C=C bond in their structures but do not have omega-3 type unsaturated fatty
acids, such as M182, under thermal fault would be a great challenge to deal with.
2. For gas generation under electrical fault, the comparison with other natural monoesters,
as well as with mineral oil would be an interesting work, before moves to an
investigation on gas generations by monoesters under the discharge of low energy and
discharge of high energy.
3. The moisture effect on PD behavior of other monoesters as well as mineral oil needs
to be performed to clarify the proposed mechanism that has been made on PFAE oil.
4. To approach the real condition in the transformer, repeating all works by incorporating
paper insulation in the investigations are also important.

Chapter 6: Conclusions
Kyushu Institute of Technology, Dept. of Electrical and Electronics Engineering 91

Chapter 6: Conclusions
Kyushu Institute of Technology, Dept. of Electrical and Electronics Engineering 92

Appendix A
Kyushu Institute of Technology, Dept. of Electrical and Electronics Engineering 93
Appendix A
Temperature Control of Heaters
There were two ceramic heaters used in the low temperature overheating
experiment, and each of the heaters is fed by one DC power supply. One of the power
supply is connected directly to the ceramic heater, whereas another one is connected to the
ceramic heater through a temperature controller. The temperature control of the heaters can
be performed in two ways. The first one is to let the controller work automatically (ON/OFF
operation mode) resulting in a fluctuated temperature profile. It took about 3 minutes to for
the heater to reach a prescribed temperature. An example of the temperature profile is
shown in Figure A.1. The second one is manual operation mode. Under this mode of
operation, the temperature of the heater is continuously adjusted to suit the desired heater
temperature. Figure A.2 shows an example of temperature profile operated manually.
Figure A.1. Example of temperature profile resulted from automatic ON/OFF
operation of the controller at 300 oC
120
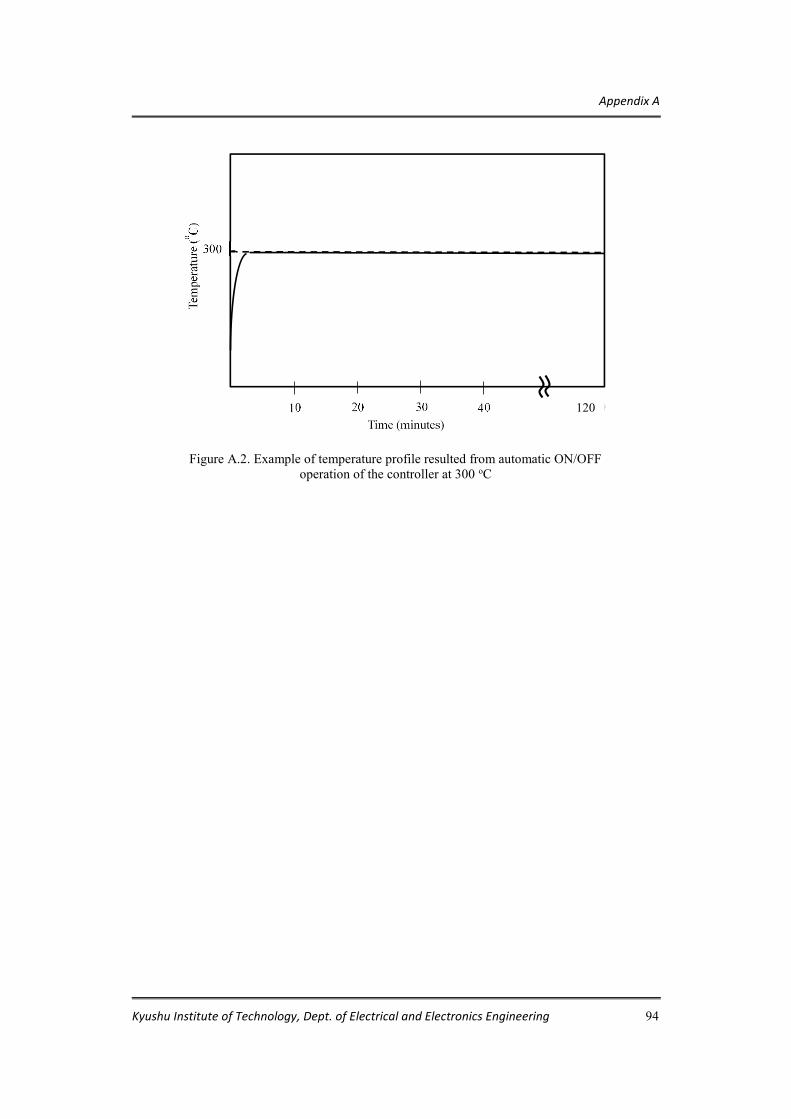
Appendix A
Kyushu Institute of Technology, Dept. of Electrical and Electronics Engineering 94
Figure A.2. Example of temperature profile resulted from automatic ON/OFF
operation of the controller at 300 oC
120

Appendix B
Kyushu Institute of Technology, Dept. of Electrical and Electronics Engineering 95
Appendix B
Gas Sampling Procedure
B.1. Introduction When the oil sample is inserted into the chamber, some part of the chamber is left
unoccupied by the oil called the gas phase. Gas samples prepared for gas analysis are taken
from two different part of the chamber, the oil phase, and the gas phase, as indicated in
Figure B.1.
B.2. Sampling from the Oil Preparation of gas sample from the oil phase was conducted in the way as
demonstrated in Figure B.2. About 11 mL of oil was taken from the bottom channel of the
chamber using a syringe (Figure B.2a). The oil was inserted into a small vial, and about 12
mL of argon gas is inserted to occupy space on the upper part of the vial (Figure B.2b). The
vial was shaken for about 5 minutes before gases accumulated on the upper part of the vial
was taken using another syringe (Figure B.2c).
Figure B.1. Illustration of oil phase and gas phase inside the oil chamber
Gas Phase
Oil Phase Gas molecules

Appendix B
Kyushu Institute of Technology, Dept. of Electrical and Electronics Engineering 96
B.3. Sampling from the Gas Phase Figure B.3 shows the procedure for sampling the gas from the gas phase of the
chamber. The left aluminum bag in Figure B.3a was firstly filled with argon gas. When the
aluminum bag was pressed, the argon gas flows into the chamber, and this flow forces the
Figure B.2. Sampling procedure of gas from the oil phase.
12 mL Ar gas
11 mL Oil
(b) The oil is inserted into the small vial
(a) The oil sample is taken from the bottom of the chamber
(c) Gas sample is taken from the vial after shaking the vial for about 5 minutes

Appendix B
Kyushu Institute of Technology, Dept. of Electrical and Electronics Engineering 97
generated fault gases to escape and the gases were collected in another aluminum bag
(right-hand side). The gas sample was then taken using another syringe (B.3b).
(a) Gas sample was collected in an aluminum bag (b) Gas sample was taken using a syringe
Figure B.3. Sampling procedure of gas from the oil phase.

Appendix C
Kyushu Institute of Technology, Dept. of Electrical and Electronics Engineering 98
Appendix C
Gas Amount Calculation
C.1 Introduction Figure C.1 shows examples of chromatogram resulted from gas analysis using gas
a chromatograph (GC-2014 model, Shimizu Corp. Japan). The chromatogram provides
information of peak area values of each gas, which is further converted into the amount of
each gas.
(a) Gas phase
Time: 4.416
Time Peak Area 4.422 2723 8.732 159817 15.218 523979
Time: 8.726
Time: 15.358
H2
N2
O2

Appendix C
Kyushu Institute of Technology, Dept. of Electrical and Electronics Engineering 99
C.2 Calculation for Gas taken from Gas Phase The amount of each gases are calculated based on the equation (C1):
Ggp (µL) = Gc x Pa x Vg x 10-3, (C1)
where Ggp is the amount of gas in the gas phase, Gc is the gas coefficient of each gas
(Table C.1), and Pa is the peak area read from the chromatogram. Vg is the volume of oil-
free space inside the chamber in mL.
(b) Oil phase
Figure C.1. Examples of resulted chromatogram. Peak at the retention time of about 4.4 represent hydrogen.
H2 Time: 4.422
Time Peak Area 4.422 2723 8.732 159817 15.218 523979
Time: 8.732
Time: 15.218
O2
N2

Appendix C
Kyushu Institute of Technology, Dept. of Electrical and Electronics Engineering 100
C.3 Calculation for Gas taken from Oil phase The first step is to calculate the gas amount taken from the gas phase in the vial
(Ggp) using equation (C1) with Vg = 12 mL (the volume of oil-free space inside the vial).
The next step is converting the value resulted from the first step to the volume of gas in oil
using equation (C2):
Gop (µL) = Ggp x 11/12 x Vi x Gec-1 x 10⁻³, (C2)
where Gop is the amount of gas in oil, Vi is the volume oil sample inside the chamber in
mL, and Gec is the gas extraction coefficient of each gases (Table C.2).
C.4 Calculation of Total amount of generated Gas The total amount of generated gas or amount of generated gas is a sum of generated
gas detected in the gas phase and generated gas detected in the oil phase (equation C3):
Gg (µL) = Ggp (µL) + Gop (µL) (C3)
Table C.1. Gas coefficient of each gases.
Gas Type Coefficient
H2 0.000245 CH4 0.001400 C2H6 0.000701 C2H4 0.000656 C2H2 0.000723 CO 0.001410
Table C.2. Gas extraction coefficient of each gases.
Gas Type Extraction Coefficient
H2 0.862 CH4 0.527 C2H6 0.198 C2H4 0.306 C2H2 0.431 CO 0.717

Appendix D
Kyushu Institute of Technology, Dept. of Electrical and Electronics Engineering 101
Appendix D
Charge Calibration for PD Measurement
D.1 Introduction The relationship between an apparent charge transfer by a partial discharge and the
measured voltage displayed on the screen of the oscilloscope is usually obtained first before
the real PD measurement is conducted. The relationship is developed by injecting a set of
known charges into the oil chamber without energizing the transformer, and determining
the set of the corresponding voltages displayed on the oscilloscope.
D.2 Calibration of RC detector The schematic diagram of RC calibration system is depicted in Figure D.1. The
relationship between the calculated charge and the measured voltage is shown in Figure
D.2.
Figure D.1. Schematic diagram of charge calibration of the RC detector.
Pulse generator 1000 pC
Oscilloscope RC

Appendix D
Kyushu Institute of Technology, Dept. of Electrical and Electronics Engineering 102
D.3 Calibration of CD6 detector The schematic diagram of RC calibration system is depicted in Figure D.3. The
relationship between the calculated charge and the measured voltage is shown in Figure
D.4.
Figure D.2. Relationship between the calculated charge and the measured voltage for RC detector.
Figure D.3. Schematic diagram of charge calibration of combined R, DI, and CD6 PD detection system.
Pulse generator 1000 pC Oscilloscope
R
DI
CD6

Appendix D
Kyushu Institute of Technology, Dept. of Electrical and Electronics Engineering 103
Figure D.4. Relationship between the calculated charge and the measured voltage for R-DI-CD6 PD detection system.

Appendix E
Kyushu Institute of Technology, Dept. of Electrical and Electronics Engineering 104
Appendix E
Matlab Codes
E.1 Introduction The sizes of .csv files recorded by oscilloscope are very big, hence, Matlab codes
were developed to read the files, analyzing them, and then returning them to the excel file
to make the uniform graph format.
E.2 Voltage Dependence of PD Charge and PD number for RC Detector
clear; clc; PDIV = input('Please input PDIV: '); HV = input('The highest applied voltage: '); for j= PDIV:HV; [coba1] = uigetfile('*.csv'); A=dlmread(coba1, ',', 0, 4); [m,n] = size (A); m=m/1000; for i = 1:m; B(1:1000,i) = A(1000*(i-1)+1:1000*i); end; C = (max (B)); D = (min (B)); clear i; clear A; clear B; clear coba1; for i = 1:m; if C(i) >= 2*(abs (D(i))); Pos(i) = C(i); else Pos(i) = 0; end; end; Pos = Pos*6101; PPDNu = nnz(Pos); if PPDNu == 0; PPDMa = 0; PPDMi = 0; PPDAv = 0; else PPDMa = max(nonzeros(Pos)); PPDMi = min(nonzeros(Pos));

Appendix E
Kyushu Institute of Technology, Dept. of Electrical and Electronics Engineering 105
PPDAv = mean(nonzeros(Pos)); end; Result(j,:) = [j,PPDNu, PPDMa, PPDAv, PPDMi]; clear i; clear C; clear D; clear Pos; clear PPDNu; clear PPDMa; clear PPDMi; clear PPDAv; end; %xlswrite('RC-Result.xlsx', Result); x = 7:HV; plot(x,Result(x,2:5)); xlabel('Applied Voltage (kV)'), ylabel('PD Charge (pC)'); E.3 Voltage Dependence of PD Charge and PD number for
R-CD6 Detector clear; clc; PDIV = input('PDIV ? : '); HV = input('The last measured voltage ? : '); for j = PDIV: HV; [coba1] = uigetfile('*.csv'); A=dlmread(coba1, ',', 0, 4); clear coba1; [m,n] = size (A); m=m/1000; for i = 1:m; B(1:1000,i) = A(1000*(i-1)+1:1000*i); end; C = (max (B)); D = (min (B)); clear A; clear B; clear i; clear n; [coba2] = uigetfile('*.csv'); E=dlmread(coba2, ',', 0, 4); clear coba2; for i = 1:m; F(1:1000,i) = E(1000*(i-1)+1:1000*i); end; G = (max (F)); att = input('Attenuation ? : '); G = G*att*55.38; clear E; clear F; clear i; for i = 1:m; if C(i) > abs (D(i));

Appendix E
Kyushu Institute of Technology, Dept. of Electrical and Electronics Engineering 106
Pos(i) = G(i); Neg(i) = 0; elseif C(i) < abs (D(i)); Pos(i) = 0; Neg(i) = G(i); else Pos(i) = 0; Neg(i) = 0; end; end; PPDNu = nnz(Pos); if PPDNu == 0; PPDMa = 0; PPDMi = 0; PPDAv = 0; else PPDMa = max(nonzeros(Pos)); PPDMi = min(nonzeros(Pos)); PPDAv = mean(nonzeros(Pos)); end; NPDNu = nnz(Neg); if NPDNu == 0; NPDMa = 0; NPDMi = 0; NPDAv = 0; else NPDMa = max(nonzeros(Neg)); NPDMi = min(nonzeros(Neg)); NPDAv = mean(nonzeros(Neg)); end; Result(j,:) = [PPDNu,PPDAv,NPDNu,NPDAv]; % Hapus tanda '%' kalau mau hasil di excel xlswrite('RDC6Result.xlsx', Result); clear i; clear m; clear C; clear D; clear G; clear Pos; clear Neg; clear PPDNu; clear PPDMa; clear PPDMi; clear PPDAv; clear NPDNu; clear NPDMa; clear NPDMi; clear NPDAv; end; x = 7:HV; plot(x,Result(x,:)); xlabel('Applied Voltage (kV)'), ylabel('PD Charge (pC)');

Appendix E
Kyushu Institute of Technology, Dept. of Electrical and Electronics Engineering 107
E.4 PD Pattern clear; clc; cycle = input('Number of Cycle ? = '); input('Select file of Sine wave !'); [coba1] = uigetfile('*.csv'); %Open file containing sine wave A=dlmread(coba1, ',', 0, 4); [m,n] = size (A); period = m/cycle; % period is length of 1 cycle sine wave period1 = ceil(period); % round up the period length B = A(1:period1); % B is one sine wave at any starting point % ------- % [C,Ind] = min(abs(B)); % Detecting indeces for set "0" point E = [B(Ind(1):period1,:);B(1:Ind(1)-1,:)]; % E is one sine wave starting at point 0 % Distribusi PD input('Select file of PD Signal !'); [coba2] = uigetfile('*.csv'); % Open file containing PD Pulses F=dlmread(coba2, ',', 0, 4); Att = input('Attenuation ? = '); for i = 1:cycle; if floor(period*i) - floor(period*(i-1)) < period1; G(period1,i) = 0; G(1:period1-1,i) = F(floor(period*(i-1))+1:floor(period*i)); else G(1:period1,i) = F(floor(period*(i-1))+1:floor(period*i)); end; end; H =[G(Ind(1):period1,:);G(1:Ind(1)-1,:)]; %Change the 0 point based on sine wave AHA = abs(min(nonzeros(H))); % absolute value of min of nonzero H elemen for i = 1:period1; %Deleting noises for j = 1:cycle; if H(i,j) <= 1.5*AHA; H(i,j) = 0; % 0 changes to NaN” end; end; end; for i = 1:period1; % Reverse negative polarity of PD if E(i) < 0; HA(i,:) = - H(i,:); else HA(i,:) = H(i,:); end; end; HA = HA*Att*55.38; % Change mearused voltage to real V, then pC Em = max(max(abs(HA))); % - Create Sine Wave - % z = 1:period1; y(z) = 0; w(z) = z*360/period1; Ei(z) = 1.05*Em*sin(w(z)*pi/180); % - DELETE or PUT "%" in front of HA if the PD and sine wave different - % %HA =[HA(ceil((1+period)/2):period1,:);HA(1:floor((1+period)/2),:)];

Appendix E
Kyushu Institute of Technology, Dept. of Electrical and Electronics Engineering 108
% ---------------------------------------------------------------------- % EH = [y',Ei',HA]; x = 1:period1; plot(x,EH(x,:)); xlabel('Time (ms)'), ylabel('PD Charge (pC)'); xlswrite('Singgah.xlsx', HA); % ---------------------------------------------------------------------- % %PD Pattern: Taken from the Excel clear; clc; H=xlsread('Singgah.xlsx'); [m,n] = size (H); for i = 1:m; %Deleting noises for j = 1:n; if H(i,j) == 0; H(i,j) = NaN; % Change 0 to NaN end; end; end; % - Create Sine Wave - % Em = max(max(abs(H))); z = 1:m; y(z) = 0; w(z) = z*360/m; Ei(z) = 1.05*Em*sin(w(z)*pi/180); % ---------------------------------------------------------------------- % EH = [y',Ei',H]; x = 1:m; %plot(x,EH(x,:)); plot(w(x),EH(x,:)); xlabel('Phase Angle (Deg)'), ylabel('PD Charge (pC)');
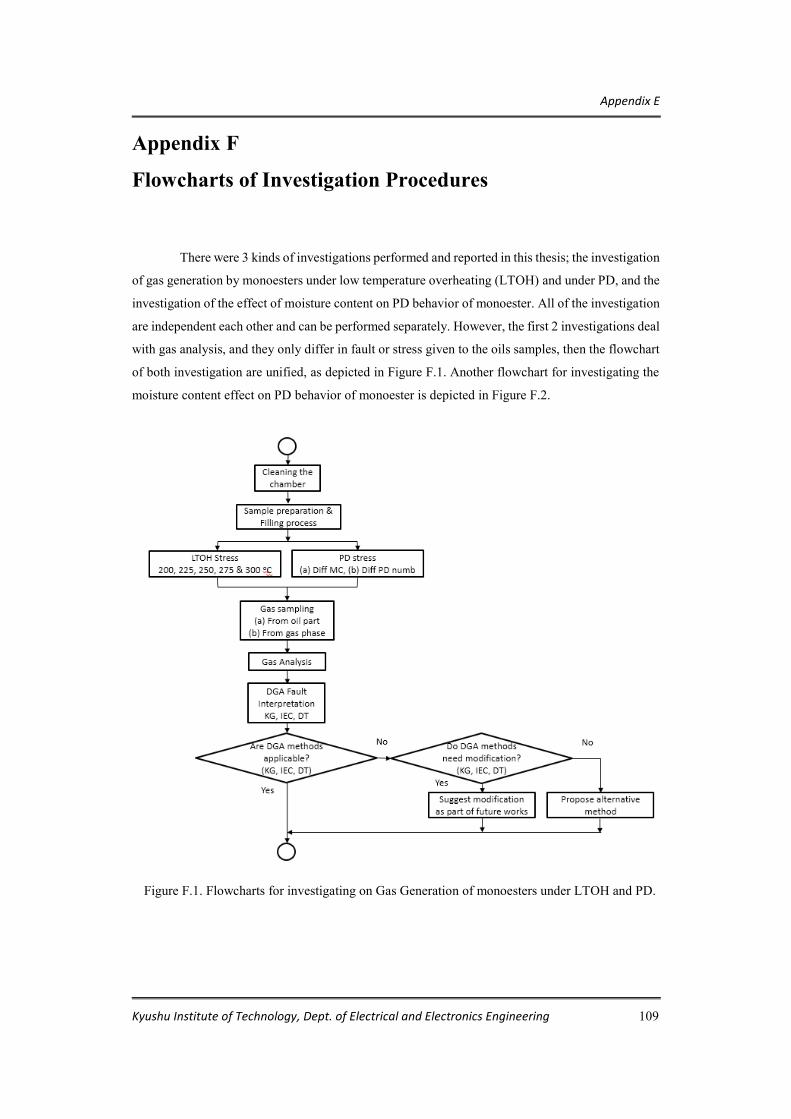
Appendix E
Kyushu Institute of Technology, Dept. of Electrical and Electronics Engineering 109
Appendix F
Flowcharts of Investigation Procedures
There were 3 kinds of investigations performed and reported in this thesis; the investigation
of gas generation by monoesters under low temperature overheating (LTOH) and under PD, and the
investigation of the effect of moisture content on PD behavior of monoester. All of the investigation
are independent each other and can be performed separately. However, the first 2 investigations deal
with gas analysis, and they only differ in fault or stress given to the oils samples, then the flowchart
of both investigation are unified, as depicted in Figure F.1. Another flowchart for investigating the
moisture content effect on PD behavior of monoester is depicted in Figure F.2.
Figure F.1. Flowcharts for investigating on Gas Generation of monoesters under LTOH and PD.

Appendix E
Kyushu Institute of Technology, Dept. of Electrical and Electronics Engineering 110
Figure F.2. Flowchart for investigating moisture content effect on PD behavior of PFAE oil.
Publications
Kyushu Institute of Technology, Dept. of Electrical and Electronics Engineering 111
Publications
D.1. Journal
1. Low Thermal Fault Gases of Various Natural Monoesters and Comparison with
Mineral Oil.
IEEE Transactions on Dielectrics and Electrical Insulation, Vol. 23, No. 6, pp. 3421-
3428, 2016.
Authors: Abdul Rajab, Motoo Tsuchie, Masahiro Kozako, Masayuki Hikita and
Takashi Suzuki.
D.2. Conference Proceedings
2. Study on Low Temperature Overheating and Thermal Properties of Natural Ester Oils
Japan Petroleum Institute Technical Meeting, Kyoto, 2014.
Authors: Abdul Rajab, Motoo Tsuchie, Masahiro Kozako, Masayuki Hikita, S. Hatada,
Takashi Suzuki and A. Kanetani.
3. Gas Generation of Vegetable Oils under Various Levels of Low Temperature
Overheating
IEEJ Technical Meeting, Tokyo, 2014
Authors: Abdul Rajab, Motoo Tsuchie, Masahiro Kozako, Masayuki Hikita, S. Hatada,
Takashi Suzuki and A. Kanetani.
4. Comparison of Low Thermal Fault Gases of Various Fatty Acid Mono Esters.
IEEE 11th International Conference on the Properties and Applications of Dielectric
Materials (ICPADM), 2015.
Authors: Abdul Rajab, Motoo Tsuchie, Masahiro Kozako, Masayuki Hikita, S. Hatada,
Takashi Suzuki and A. Kanetani.
Publications
Kyushu Institute of Technology, Dept. of Electrical and Electronics Engineering 112
5. Study on Static Electrification of Palm Fatty Acid Ester (PFAE) Oil Using
Mini Static Tester.
Proceeding of the 5 th ICEEI, Bali 2015.
Authors: Harry Gumilang, Abdul Rajab, Suwarno, Umar Khayam, Motoo Tsuchie,
Masahiro Kozako, Masayuki Hikita, Takashi Suzuki, Satoshi Hatada,
Akinori Kanetani, H. Futakuchi
6. Study on PD Properties of Palm Fatty Acids Esters Oil.
International Symposium on Ecotopia Science, Nagoya, 2015
Authors: Abdul Rajab, Motoo Tsuchie, Masahiro Kozako, Masayuki Hikita and
Takashi Suzuki.
7. PD Properties and Gases Generated by Palm Fatty Acid Esters (PFAE) Oils.
IEEE International Conference on Dielectric, Montpellier, 2016.
Authors: Abdul Rajab, Motoo Tsuchie, Masahiro Kozako, Masayuki Hikita and
Takashi Suzuki.
8. Study on streaming electrification properties of palm fatty acid ester (PFAE) oil due to
aging.
Proceedings of the International Conference on Dielectrics, Montpellier, 2016.
Authors: Hendrik Maryono, Abdul Rajab, Umar Khayam, Suwarno; Motoo Tsuchie;
Masahiro Kozako; Masayuki Hikita; Takashi Suzuki
9. Early Deterioration of Palm Fatty Acid ester (PFAE) Oils.
International Workshop on High Voltage Engineering & J-K Symposium, Miyasaki,
2016.
Authors: Abdul Rajab, Motoo Tsuchie, Masahiro Kozako, Masayuki Hikita and
Takashi Suzuki.

Publications
Kyushu Institute of Technology, Dept. of Electrical and Electronics Engineering 113