Assessing the deterioration behaviour of mild steel in 2 M ...
13
INTERNATIONAL JOURNAL OF APPLIED ENGINEERING RESEARCH, DINDIGUL Volume 2, No 2, 2011 © Copyright 2010 All rights reserved Integrated Publishing Association REVIEW ARTICLE ISSN - 0976-4259 406 Assessing the deterioration behaviour of mild steel in 2 M sulphuric acid using Bambusa glauscescens Olugbenga A. Omotosho 1 , Oluseyi O. Ajayi 1 , Ojo S. Fayomi 1,2 , Vincent O. Ifepe 1 1- Mechanical Engineering Department, Covenant University, P.M.B. 1023, Ota, Nigeria 2- Department of Chemical and Metallurgical Engineering, Tshwane University of Technology, Pretoria, South Africa [email protected] ABSTRACT The study investigated the deterioration of mild steel in 2 M sulphuric acid solution in the presence of Bambusa glauscescens extract using gasometric technique. Steel coupons measuring 4 cm by 1.5 cm were immersed in test solutions of uninhibited acid and also those containing extract concentrations of 60,100 and 140 cm 3 at a temperature of 333K for 60 minutes. The volumes of hydrogen gas evolved from the reaction were documented and analyzed. The analysis showed that while extract concentration was increasing, H 2 evolution and % I.E increased. There was also a corresponding reduction in corrosion rate as extract concentration increased. The decrease in corrosion rate was observed to follow in order of increasing extract concentration. Phytochemical-metal interaction mechanism was best described by Freundlich isotherm, with the 4 and 12 minutes curve becoming the best and worst contact time for the extract phytochemicals to suitably adsorb to metal surface for all concentrations used. An expression suitable for calculating corrosion rate values once concentration is known was also deduced. Furthermore, the microstructural studies revealed that increasing the extract concentration resulted in significant reduction in the dominant coarsening of the oxide of iron phase, while the pearlite and ferrite phases became finely dispersed. Keywords: Mild steel deterioration, green inhibitors, hydrogen evolution, mild steel, regression analysis, adsorption isotherm, corrosion rate. 1. Introduction Damage of mechanical components through corrosion is still a major concern in most industry today. These damages result in direct and indirect costs which translate to productivity losses, interruptions, breakdowns, environmental pollution and in some cases legal action. Developed countries of the world have conducted several studies on corrosion related cost issues and the outcome suggests that improved steps need to be taken to eliminate or reduce these costs. Corrosion mitigation techniques in the form of organic and metallic coatings, cathodic protection, plastics and polymers, corrosion resistant alloys and corrosion inhibitors have frequently been used to achieve these reductions (Ajayi et al, 2011a and Ajayi et al, 2011b). However, the use of inorganic inhibitors in industrial operations of acid pickling, descaling, oil well acidizing and cleaning of steel and ferrous alloys which reduce effective size of mechanical components has become an issue of concern because quite a number of synthetic inhibitors are harmful and toxic to the environment. The toxic effects not only affect living organisms but also poison planet earth. Most harmful effects are reversible and do not cause permanent damage but complete recovery may require time (Yin, 2004 and
-
Upload
khangminh22 -
Category
Documents
-
view
0 -
download
0
Transcript of Assessing the deterioration behaviour of mild steel in 2 M ...
INTERNATIONAL JOURNAL OF APPLIED ENGINEERING RESEARCH, DINDIGUL
Volume 2, No 2, 2011
© Copyright 2010 All rights reserved Integrated Publishing Association
REVIEW ARTICLE ISSN - 0976-4259
406
Assessing the deterioration behaviour of mild steel in 2 M sulphuric acid
using Bambusa glauscescens Olugbenga A. Omotosho
1, Oluseyi O. Ajayi
1, Ojo S. Fayomi
1,2, Vincent O. Ifepe
1
1- Mechanical Engineering Department, Covenant University, P.M.B. 1023, Ota, Nigeria
2- Department of Chemical and Metallurgical Engineering, Tshwane University of
Technology, Pretoria, South Africa
ABSTRACT
The study investigated the deterioration of mild steel in 2 M sulphuric acid solution in the
presence of Bambusa glauscescens extract using gasometric technique. Steel coupons
measuring 4 cm by 1.5 cm were immersed in test solutions of uninhibited acid and also those
containing extract concentrations of 60,100 and 140 cm3 at a temperature of 333K for 60
minutes. The volumes of hydrogen gas evolved from the reaction were documented and
analyzed. The analysis showed that while extract concentration was increasing, H2 evolution
and % I.E increased. There was also a corresponding reduction in corrosion rate as extract
concentration increased. The decrease in corrosion rate was observed to follow in order of
increasing extract concentration. Phytochemical-metal interaction mechanism was best
described by Freundlich isotherm, with the 4 and 12 minutes curve becoming the best and
worst contact time for the extract phytochemicals to suitably adsorb to metal surface for all
concentrations used. An expression suitable for calculating corrosion rate values once
concentration is known was also deduced. Furthermore, the microstructural studies revealed
that increasing the extract concentration resulted in significant reduction in the dominant
coarsening of the oxide of iron phase, while the pearlite and ferrite phases became finely
dispersed.
Keywords: Mild steel deterioration, green inhibitors, hydrogen evolution, mild steel,
regression analysis, adsorption isotherm, corrosion rate.
1. Introduction
Damage of mechanical components through corrosion is still a major concern in most
industry today. These damages result in direct and indirect costs which translate to
productivity losses, interruptions, breakdowns, environmental pollution and in some cases
legal action. Developed countries of the world have conducted several studies on corrosion
related cost issues and the outcome suggests that improved steps need to be taken to eliminate
or reduce these costs. Corrosion mitigation techniques in the form of organic and metallic
coatings, cathodic protection, plastics and polymers, corrosion resistant alloys and corrosion
inhibitors have frequently been used to achieve these reductions (Ajayi et al, 2011a and Ajayi
et al, 2011b). However, the use of inorganic inhibitors in industrial operations of acid
pickling, descaling, oil well acidizing and cleaning of steel and ferrous alloys which reduce
effective size of mechanical components has become an issue of concern because quite a
number of synthetic inhibitors are harmful and toxic to the environment. The toxic effects not
only affect living organisms but also poison planet earth. Most harmful effects are reversible
and do not cause permanent damage but complete recovery may require time (Yin, 2004 and
INTERNATIONAL JOURNAL OF APPLIED ENGINEERING RESEARCH, DINDIGUL
Volume 2, No 2, 2011
© Copyright 2010 All rights reserved Integrated Publishing Association
REVIEW ARTICLE ISSN - 0976-4259
407
Omotosho et al, 2010). On the other hand some can cause irreparable permanent damage. For
these reasons efforts have been made by several researchers to replace these toxic inhibitors
with environmental friendly inhibitors.
Green inhibitors are known to be cheaply available, easily applicable and disposable without
contaminating the environment. Thus, research efforts and studies (Ajayi et al, 2011a; Ajayi
et al, 2011b; Oguzie, 2008; Okafor et al, 2005; Valek and Martinez, 2007; Singh et al, 2010;
Raja and Sethuraman, 2008; Singh et al, 2010, Obot and Egbedi, 2009; Buchweishaijia and
Mhinzi, 2008; El-Etre, 2003; Saratha et al, 2009 ; Oguzie, 2009 and De-Souza and Spinelli,
2009) geared towards green inhibitors have become increasingly relevant because of the need
to preserve the environment. Of the several studies considered none seemed to have
specifically investigated the effect of 2M sulphuric acid on mild steel in the presence of
extracts of Bambusa glauscescens (BG) at a temperature of 333K. The focus of this work is
therefore to ascertain the degradation behaviour of mild steel at a temperature of 333K and
correlate it with extract concentration, metal-phytochemical extract adsorption interaction
mechanism and photomicrograph examination of the mild steel coupon. Also, inhibitor
efficiency was determined by the method adopted elsewhere (Ajayi et al, 2011a, Okafor et al,
2010).
2. Materials and Method
Specimens of mild steel measuring 4 x 1.5 cm were employed for the determination of
corrosion inhibition of BG extract in 2 M sulphuric acid (H2SO4). Samples were prepared by
degreasing and cleaning in ethanol and acetone respectively. They were then allowed to dry.
Chemical composition of the samples was analyzed using Optical Emission Spectrometer
(OES) and the result is shown in Table 1. Extracts of BG were made from its fresh leaves by
drying and grinding into powder. Powder was then weighed, from which 10g of the powder
was then put into a 200 cm3 flat bottom flask containing 100ml of 2 M H2SO4 solution. The
solution obtained was refluxed for 2 hours and left over night. The refluxed solution was then
filtered. The concentrations of the extract used for the study were 60,100 and 140 cm3/l and
they were prepared by serial dilution. The set up of the experiment was similar to the
technique adopted elsewhere (Ajayi et al, 2011a; Ajayi et al, 2011b and Ajayi et al, 2011c).
Each sample was put into the mylius cell containing 50 cm3 of test solution and the
experiments were conducted at a temperature of 333K. The volume of Hydrogen (H2) gas
evolved per 4 minutes interval was recorded for 60 minutes in a calibrated tube by downward
displacement of water and the graph of volume of hydrogen evolved against time interval was
plotted and is represented in Figure 1. Determination of the inhibition efficiency was carried
out using Equation 1 (Okafor et al, 2010; Ajayi et al, 2011a; Ajayi et al, 2011b and Ajayi et
al, 2011c):
( ) ( )IV-VI.E % = × 100
V (1)
Where V and V1, are the volumes of H2 evolved from solutions without inhibitor (i.e. control
experiment) and with inhibitor respectively.
INTERNATIONAL JOURNAL OF APPLIED ENGINEERING RESEARCH, DINDIGUL
Volume 2, No 2, 2011
© Copyright 2010 All rights reserved Integrated Publishing Association
REVIEW ARTICLE ISSN - 0976-4259
408
Because hydrogen is released when metals react with acids, it is correct to correlate reaction
rate of corrosion deterioration of the mild steel in H2SO4 using BG extract with H2 evolution.
The technique adopted elsewhere (Ajayi et al, 2011a; Ajayi et al, 2011b and Ajayi et al,
2011c) was used in this investigation to also model the corrosion rate which translates to the
hydrogen evolution rate. The hydrogen evolution rate has a direct relationship with the rate at
which the weight of the metal is lost. Therefore, according to Ajayi et al (2011c) corrosion
rate modeling from the path of H2 gas evolution rate is implicitly a means of modeling weight
loss rate when the connection between the weight loss and H2 gas evolved is established.
Thus, Equation 2 was obtained (Ajayi et al, 2011a; Ajayi et al, 2011b and Ajayi et al, 2011c):
dW dVR α α
dt dt (2)
Where α = proportionality sign.
V = volume of H2 gas evolved
W = metal weight loss due to corrosion reaction
R = rate of corrosion
t = time
Table 1: Composition of mild steel sample employed for the investigation
Element %Content Element %Content Element %Content
Bi 0.0024 Cu 0.035 Sn < 0.001
Ca 0.017 Co 0.0057 Zn 0.022
Ce < 0.0040 Ti 0.001 As 0.0059
Zr 0.0016 Nb 0.0046 C 0.131
La 0.0018 V 0.0075 Si 0.028
Fe 99.4 W < 0.010 Mn 0.397
Ni 0.025 Pb < 0.0020 P 0.0066
Mo < 0.0020 Mg 0.002 S 0.018
Al 0.125 B 0.0009 Cr 0.0075
INTERNATIONAL JOURNAL OF APPLIED ENGINEERING RESEARCH, DINDIGUL
Volume 2, No 2, 2011
© Copyright 2010 All rights reserved Integrated Publishing Association
REVIEW ARTICLE ISSN - 0976-4259
409
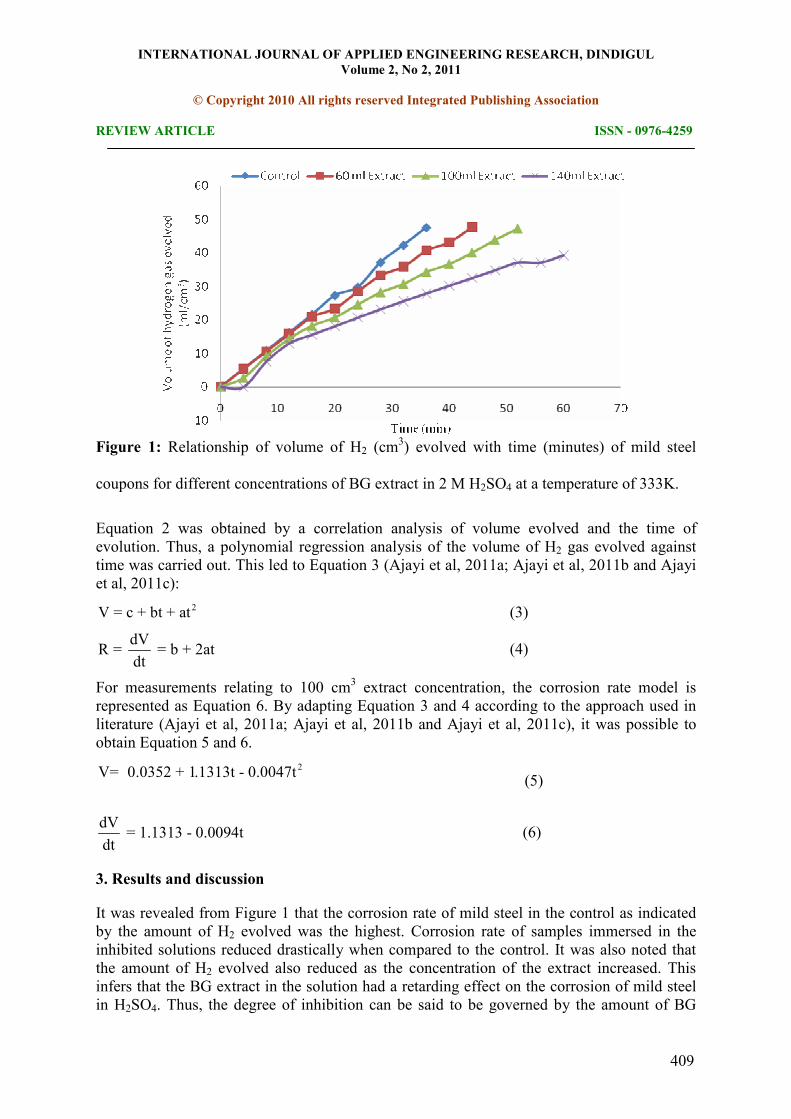
Figure 1: Relationship of volume of H2 (cm
3) evolved with time (minutes) of mild steel
coupons for different concentrations of BG extract in 2 M H2SO4 at a temperature of 333K.
Equation 2 was obtained by a correlation analysis of volume evolved and the time of
evolution. Thus, a polynomial regression analysis of the volume of H2 gas evolved against
time was carried out. This led to Equation 3 (Ajayi et al, 2011a; Ajayi et al, 2011b and Ajayi
et al, 2011c):
2V = c + bt + at (3)
dVR = = b + 2at
dt (4)
For measurements relating to 100 cm3 extract concentration, the corrosion rate model is
represented as Equation 6. By adapting Equation 3 and 4 according to the approach used in
literature (Ajayi et al, 2011a; Ajayi et al, 2011b and Ajayi et al, 2011c), it was possible to
obtain Equation 5 and 6.
2V= 0.0352 + 1.1313t - 0.0047t
(5)
dV = 1.1313 - 0.0094t
dt (6)
3. Results and discussion
It was revealed from Figure 1 that the corrosion rate of mild steel in the control as indicated
by the amount of H2 evolved was the highest. Corrosion rate of samples immersed in the
inhibited solutions reduced drastically when compared to the control. It was also noted that
the amount of H2 evolved also reduced as the concentration of the extract increased. This
infers that the BG extract in the solution had a retarding effect on the corrosion of mild steel
in H2SO4. Thus, the degree of inhibition can be said to be governed by the amount of BG
INTERNATIONAL JOURNAL OF APPLIED ENGINEERING RESEARCH, DINDIGUL
Volume 2, No 2, 2011
© Copyright 2010 All rights reserved Integrated Publishing Association
REVIEW ARTICLE ISSN - 0976-4259
410
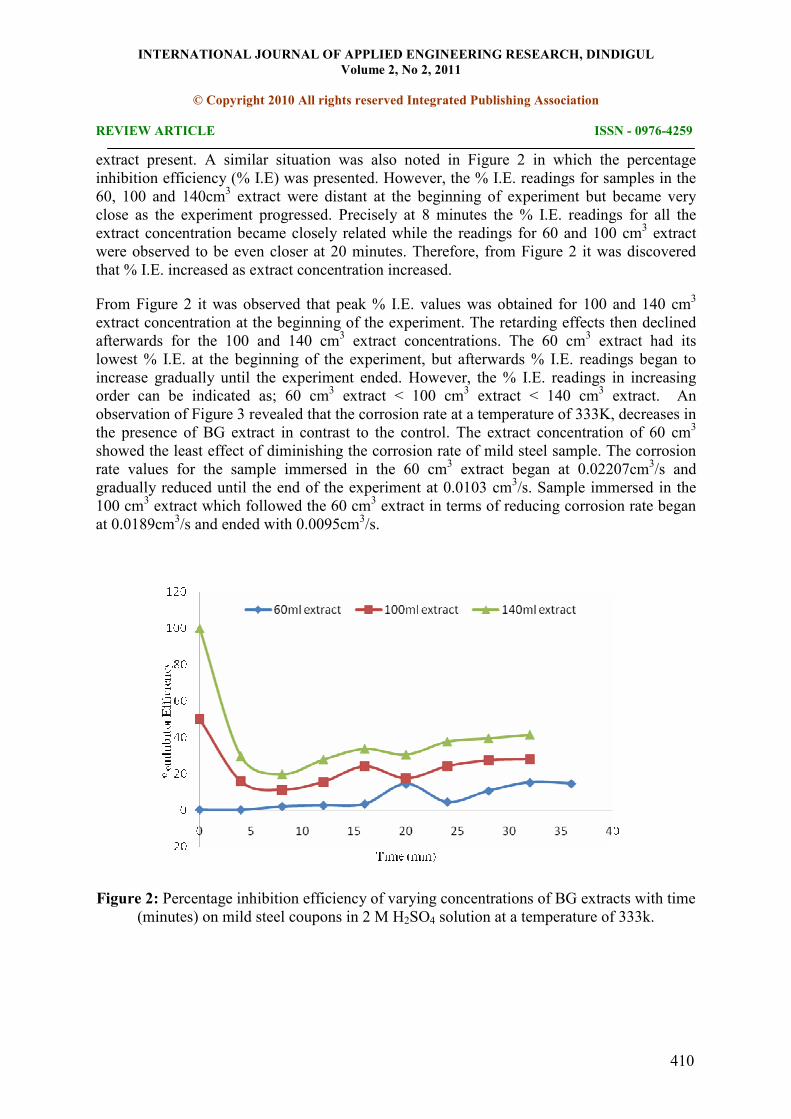
extract present. A similar situation was also noted in Figure 2 in which the percentage
inhibition efficiency (% I.E) was presented. However, the % I.E. readings for samples in the
60, 100 and 140cm3 extract were distant at the beginning of experiment but became very
close as the experiment progressed. Precisely at 8 minutes the % I.E. readings for all the
extract concentration became closely related while the readings for 60 and 100 cm3 extract
were observed to be even closer at 20 minutes. Therefore, from Figure 2 it was discovered
that % I.E. increased as extract concentration increased.
From Figure 2 it was observed that peak % I.E. values was obtained for 100 and 140 cm3
extract concentration at the beginning of the experiment. The retarding effects then declined
afterwards for the 100 and 140 cm3 extract concentrations. The 60 cm
3 extract had its
lowest % I.E. at the beginning of the experiment, but afterwards % I.E. readings began to
increase gradually until the experiment ended. However, the % I.E. readings in increasing
order can be indicated as; 60 cm3 extract < 100 cm
3 extract < 140 cm
3 extract. An
observation of Figure 3 revealed that the corrosion rate at a temperature of 333K, decreases in
the presence of BG extract in contrast to the control. The extract concentration of 60 cm3
showed the least effect of diminishing the corrosion rate of mild steel sample. The corrosion
rate values for the sample immersed in the 60 cm3 extract began at 0.02207cm
3/s and
gradually reduced until the end of the experiment at 0.0103 cm3/s. Sample immersed in the
100 cm3 extract which followed the 60 cm
3 extract in terms of reducing corrosion rate began
at 0.0189cm3/s and ended with 0.0095cm
3/s.
Figure 2: Percentage inhibition efficiency of varying concentrations of BG extracts with time
(minutes) on mild steel coupons in 2 M H2SO4 solution at a temperature of 333k.
INTERNATIONAL JOURNAL OF APPLIED ENGINEERING RESEARCH, DINDIGUL
Volume 2, No 2, 2011
© Copyright 2010 All rights reserved Integrated Publishing Association
REVIEW ARTICLE ISSN - 0976-4259
411
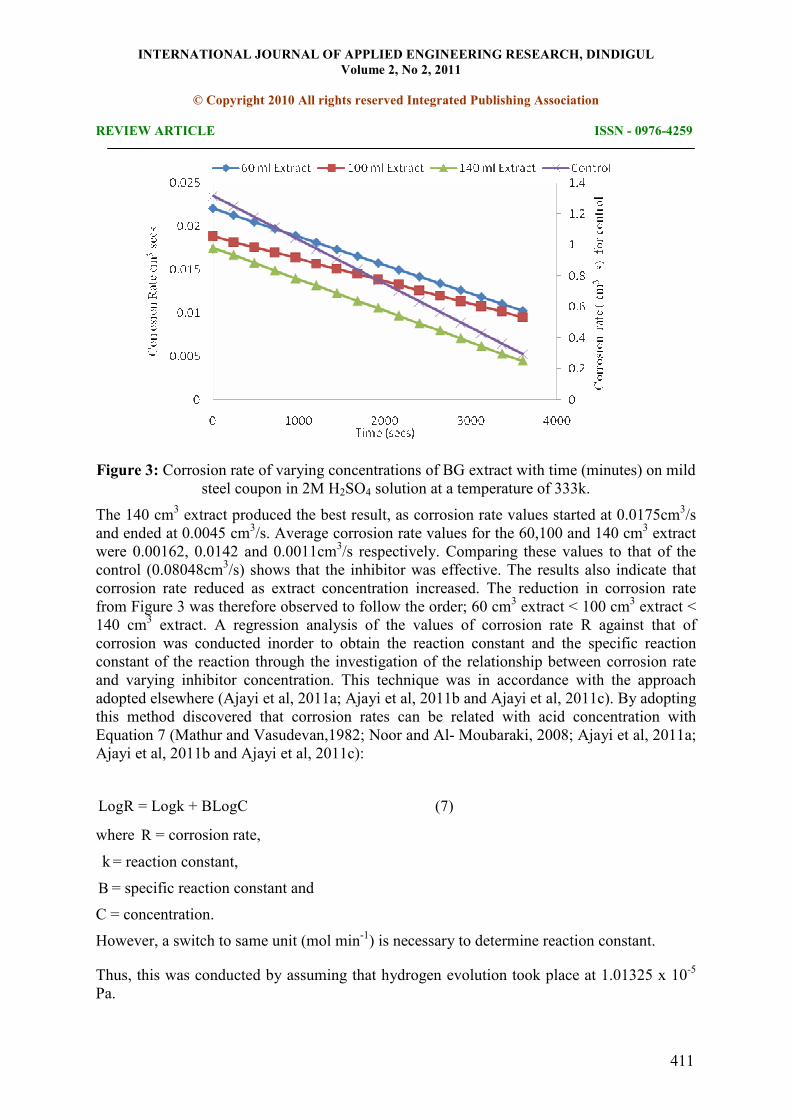
Figure 3: Corrosion rate of varying concentrations of BG extract with time (minutes) on mild
steel coupon in 2M H2SO4 solution at a temperature of 333k.
The 140 cm3 extract produced the best result, as corrosion rate values started at 0.0175cm
3/s
and ended at 0.0045 cm3/s. Average corrosion rate values for the 60,100 and 140 cm
3 extract
were 0.00162, 0.0142 and 0.0011cm3/s respectively. Comparing these values to that of the
control (0.08048cm3/s) shows that the inhibitor was effective. The results also indicate that
corrosion rate reduced as extract concentration increased. The reduction in corrosion rate
from Figure 3 was therefore observed to follow the order; 60 cm3 extract < 100 cm
3 extract <
140 cm3 extract. A regression analysis of the values of corrosion rate R against that of
corrosion was conducted inorder to obtain the reaction constant and the specific reaction
constant of the reaction through the investigation of the relationship between corrosion rate
and varying inhibitor concentration. This technique was in accordance with the approach
adopted elsewhere (Ajayi et al, 2011a; Ajayi et al, 2011b and Ajayi et al, 2011c). By adopting
this method discovered that corrosion rates can be related with acid concentration with
Equation 7 (Mathur and Vasudevan,1982; Noor and Al- Moubaraki, 2008; Ajayi et al, 2011a;
Ajayi et al, 2011b and Ajayi et al, 2011c):
LogR = Logk + BLogC (7)
where R = corrosion rate,
k = reaction constant,
B = specific reaction constant and
C = concentration.
However, a switch to same unit (mol min-1
) is necessary to determine reaction constant.
Thus, this was conducted by assuming that hydrogen evolution took place at 1.01325 x 10⁻⁵
Pa.
INTERNATIONAL JOURNAL OF APPLIED ENGINEERING RESEARCH, DINDIGUL
Volume 2, No 2, 2011
© Copyright 2010 All rights reserved Integrated Publishing Association
REVIEW ARTICLE ISSN - 0976-4259
412
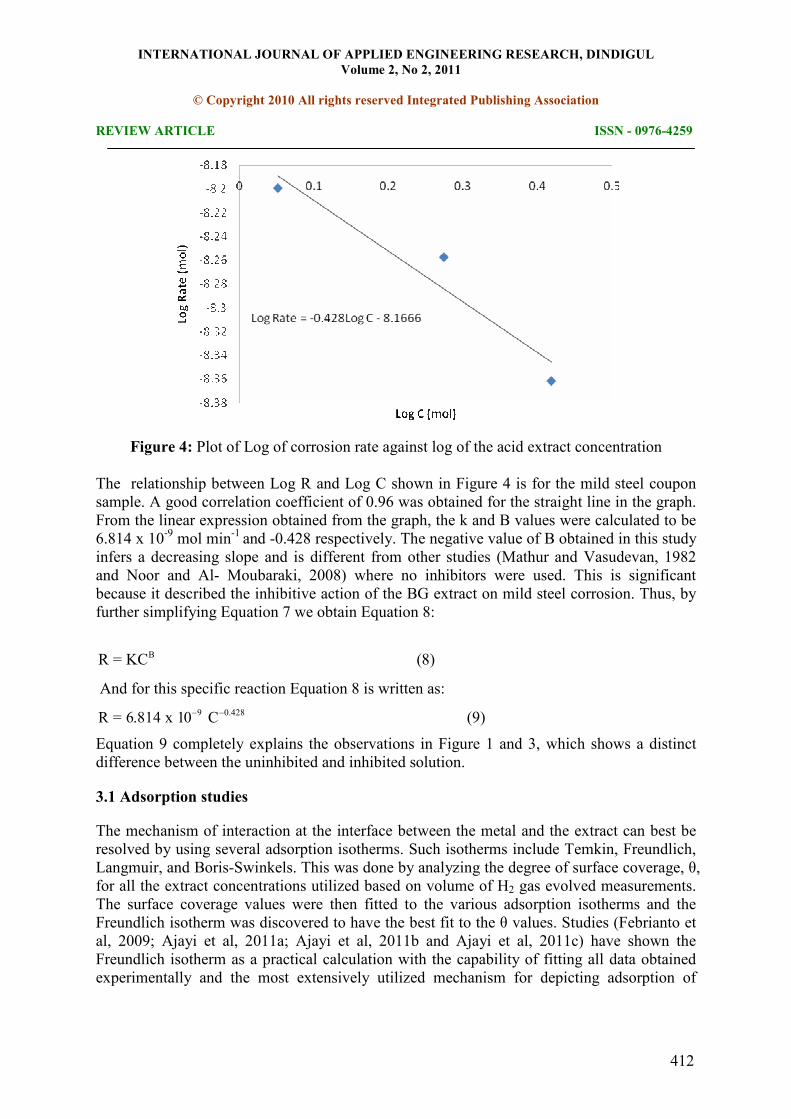
Figure 4: Plot of Log of corrosion rate against log of the acid extract concentration
The relationship between Log R and Log C shown in Figure 4 is for the mild steel coupon
sample. A good correlation coefficient of 0.96 was obtained for the straight line in the graph.
From the linear expression obtained from the graph, the k and B values were calculated to be
6.814 x 10⁻⁹
mol min-1
and -0.428 respectively. The negative value of B obtained in this study
infers a decreasing slope and is different from other studies (Mathur and Vasudevan, 1982
and Noor and Al- Moubaraki, 2008) where no inhibitors were used. This is significant
because it described the inhibitive action of the BG extract on mild steel corrosion. Thus, by
further simplifying Equation 7 we obtain Equation 8:
BR = KC (8)
And for this specific reaction Equation 8 is written as:
9 0.428R = 6.814 x 10 C− − (9)
Equation 9 completely explains the observations in Figure 1 and 3, which shows a distinct
difference between the uninhibited and inhibited solution.
3.1 Adsorption studies
The mechanism of interaction at the interface between the metal and the extract can best be
resolved by using several adsorption isotherms. Such isotherms include Temkin, Freundlich,
Langmuir, and Boris-Swinkels. This was done by analyzing the degree of surface coverage, θ,
for all the extract concentrations utilized based on volume of H2 gas evolved measurements.
The surface coverage values were then fitted to the various adsorption isotherms and the
Freundlich isotherm was discovered to have the best fit to the θ values. Studies (Febrianto et
al, 2009; Ajayi et al, 2011a; Ajayi et al, 2011b and Ajayi et al, 2011c) have shown the
Freundlich isotherm as a practical calculation with the capability of fitting all data obtained
experimentally and the most extensively utilized mechanism for depicting adsorption of
INTERNATIONAL JOURNAL OF APPLIED ENGINEERING RESEARCH, DINDIGUL
Volume 2, No 2, 2011
© Copyright 2010 All rights reserved Integrated Publishing Association
REVIEW ARTICLE ISSN - 0976-4259
413
organic compounds. The equation is thus expressed as (Ajayi et al, 2011a; Ajayi et al, 2011b
and Ajayi et al, 2011c):
1/H
cθ = D C (10)
and in linearized logarithmic form as:
c
1logθ = logD + logC (11)
H
Where
θ = surface coverage
cD = characteristic constant related to the adsorption capacity
C = concentration
H = characteristic constant related to adsorption intensity or degree of favourability of
adsorption.
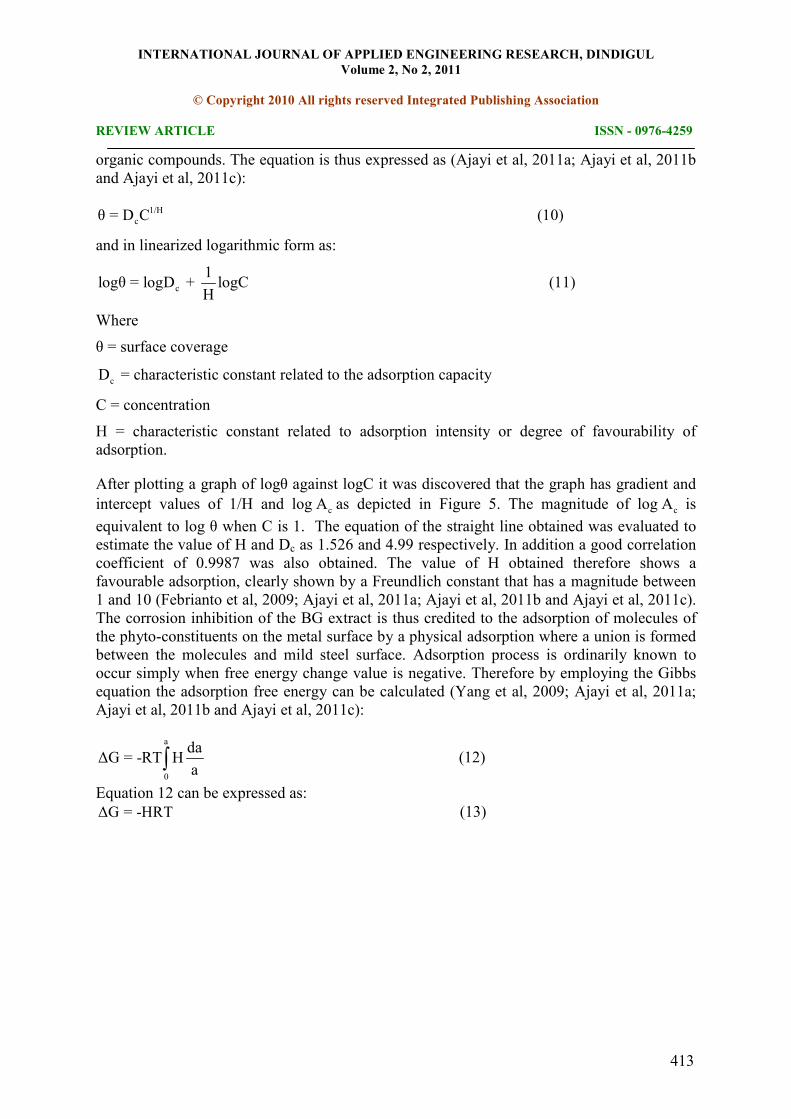
After plotting a graph of logθ against logC it was discovered that the graph has gradient and
intercept values of 1/H and log cA as depicted in Figure 5. The magnitude of log cA is
equivalent to log θ when C is 1. The equation of the straight line obtained was evaluated to
estimate the value of H and Dc as 1.526 and 4.99 respectively. In addition a good correlation
coefficient of 0.9987 was also obtained. The value of H obtained therefore shows a
favourable adsorption, clearly shown by a Freundlich constant that has a magnitude between
1 and 10 (Febrianto et al, 2009; Ajayi et al, 2011a; Ajayi et al, 2011b and Ajayi et al, 2011c).
The corrosion inhibition of the BG extract is thus credited to the adsorption of molecules of
the phyto-constituents on the metal surface by a physical adsorption where a union is formed
between the molecules and mild steel surface. Adsorption process is ordinarily known to
occur simply when free energy change value is negative. Therefore by employing the Gibbs
equation the adsorption free energy can be calculated (Yang et al, 2009; Ajayi et al, 2011a;
Ajayi et al, 2011b and Ajayi et al, 2011c):
a
0
da∆G = -RT H
a∫ (12)
Equation 12 can be expressed as:
∆G = -HRT (13)
INTERNATIONAL JOURNAL OF APPLIED ENGINEERING RESEARCH, DINDIGUL
Volume 2, No 2, 2011
© Copyright 2010 All rights reserved Integrated Publishing Association
REVIEW ARTICLE ISSN - 0976-4259
414
Figure 5: Plot of logarithm of surface coverage with logarithm of concentration of acid
extract showing agreement with Freundlich isotherm.
The free energy change, parameter of the Freundlich equation, gas constant and temperature
are represented as ∆G , H, R and T. The negative value of ∆G (-4.225 KJ mol-1
) depicts the
adsorption of BG extract on the mild steel surface as a spontaneous process.
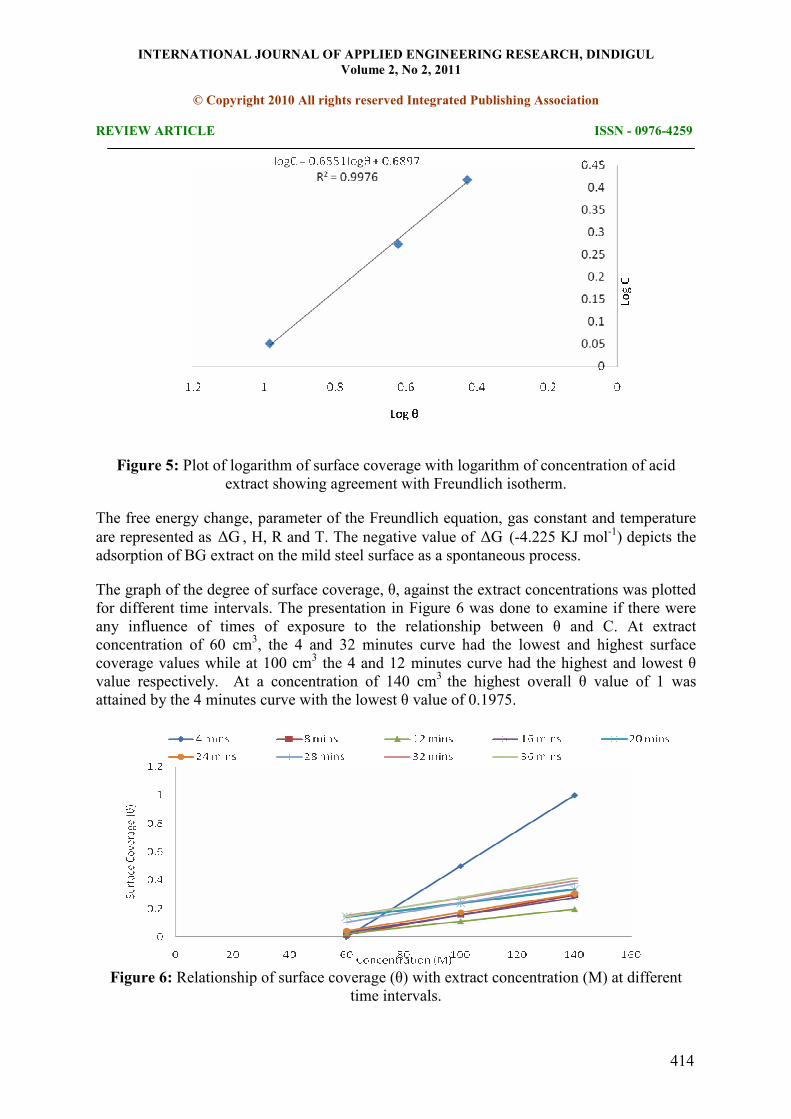
The graph of the degree of surface coverage, θ, against the extract concentrations was plotted
for different time intervals. The presentation in Figure 6 was done to examine if there were
any influence of times of exposure to the relationship between θ and C. At extract
concentration of 60 cm3, the 4 and 32 minutes curve had the lowest and highest surface
coverage values while at 100 cm3 the 4 and 12 minutes curve had the highest and lowest θ
value respectively. At a concentration of 140 cm3
the highest overall θ value of 1 was
attained by the 4 minutes curve with the lowest θ value of 0.1975.
Figure 6: Relationship of surface coverage (θ) with extract concentration (M) at different
time intervals.
INTERNATIONAL JOURNAL OF APPLIED ENGINEERING RESEARCH, DINDIGUL
Volume 2, No 2, 2011
© Copyright 2010 All rights reserved Integrated Publishing Association
REVIEW ARTICLE ISSN - 0976-4259
415
The 4 and 12 minutes curve displayed the overall best and worst surface coverage values
respectively across all concentrations utilized. This infers that the 4 minutes time frame was
the best exposure time for the phytochemicals to adsorb to the steel surface and inhibit
corrosion effectively. However, the other time frames showed closely related θ values
throughout the experiment.
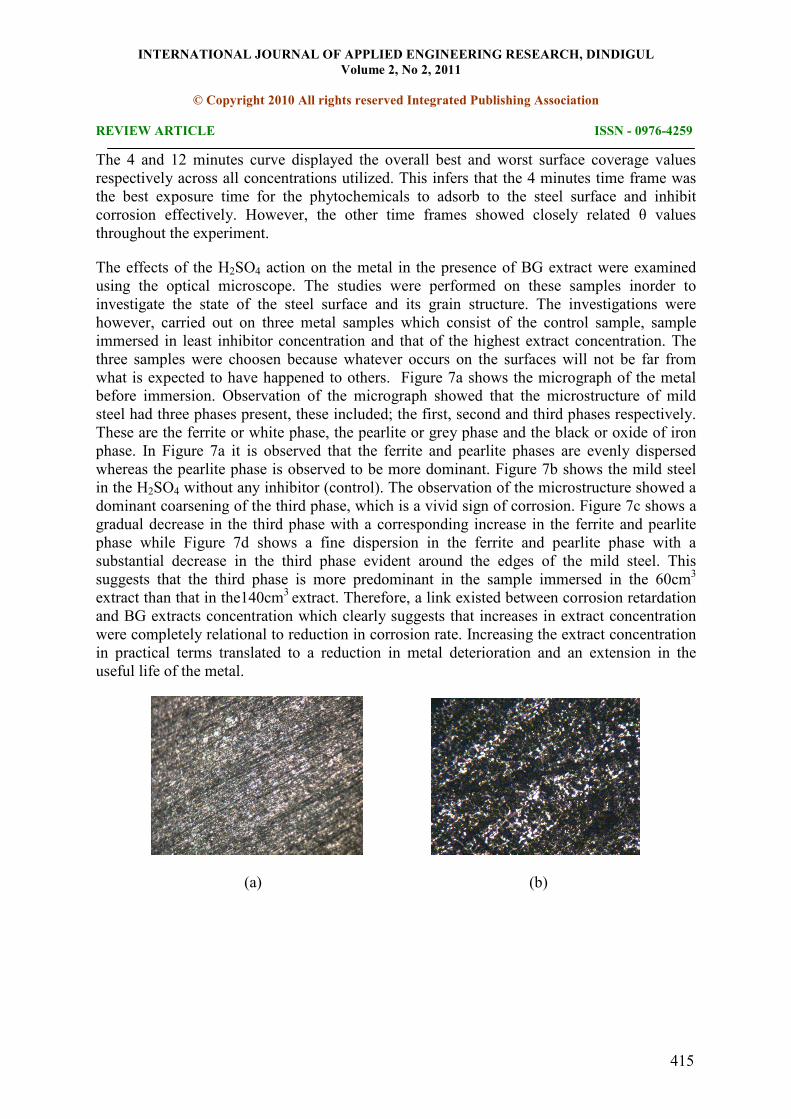
The effects of the H2SO4 action on the metal in the presence of BG extract were examined
using the optical microscope. The studies were performed on these samples inorder to
investigate the state of the steel surface and its grain structure. The investigations were
however, carried out on three metal samples which consist of the control sample, sample
immersed in least inhibitor concentration and that of the highest extract concentration. The
three samples were choosen because whatever occurs on the surfaces will not be far from
what is expected to have happened to others. Figure 7a shows the micrograph of the metal
before immersion. Observation of the micrograph showed that the microstructure of mild
steel had three phases present, these included; the first, second and third phases respectively.
These are the ferrite or white phase, the pearlite or grey phase and the black or oxide of iron
phase. In Figure 7a it is observed that the ferrite and pearlite phases are evenly dispersed
whereas the pearlite phase is observed to be more dominant. Figure 7b shows the mild steel
in the H2SO4 without any inhibitor (control). The observation of the microstructure showed a
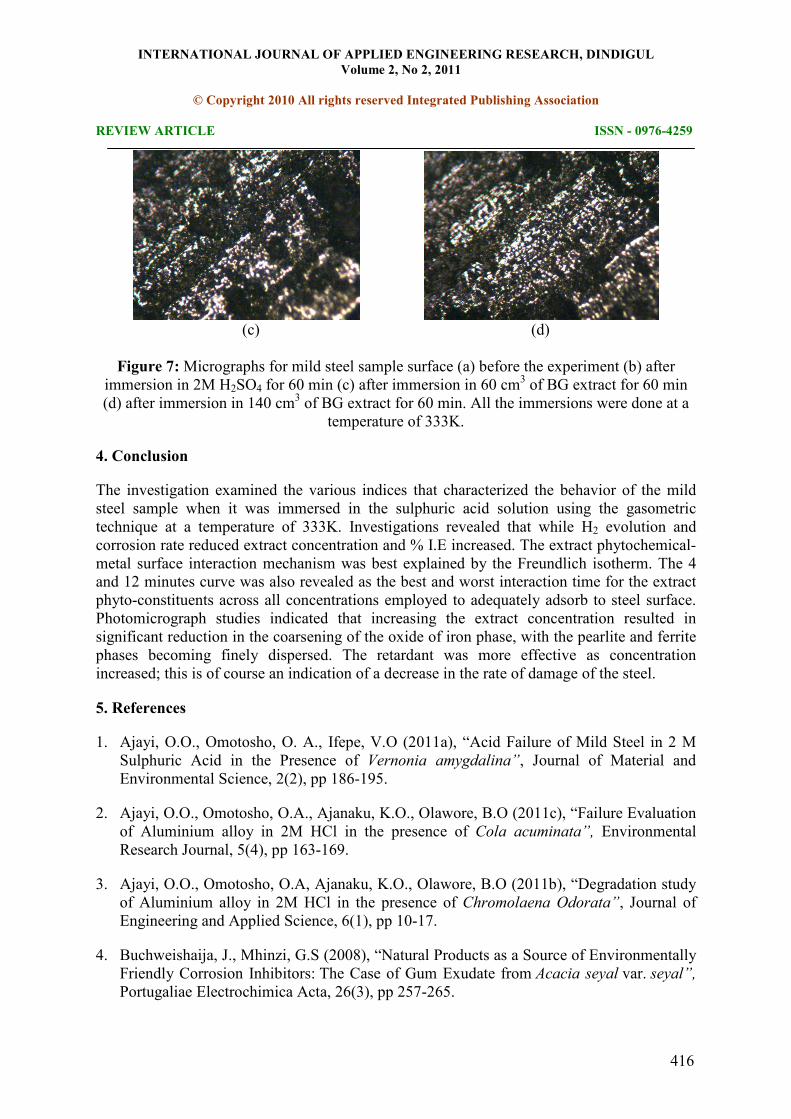
dominant coarsening of the third phase, which is a vivid sign of corrosion. Figure 7c shows a
gradual decrease in the third phase with a corresponding increase in the ferrite and pearlite
phase while Figure 7d shows a fine dispersion in the ferrite and pearlite phase with a
substantial decrease in the third phase evident around the edges of the mild steel. This
suggests that the third phase is more predominant in the sample immersed in the 60cm3
extract than that in the140cm3
extract. Therefore, a link existed between corrosion retardation
and BG extracts concentration which clearly suggests that increases in extract concentration
were completely relational to reduction in corrosion rate. Increasing the extract concentration
in practical terms translated to a reduction in metal deterioration and an extension in the
useful life of the metal.
(a) (b)
INTERNATIONAL JOURNAL OF APPLIED ENGINEERING RESEARCH, DINDIGUL
Volume 2, No 2, 2011
© Copyright 2010 All rights reserved Integrated Publishing Association
REVIEW ARTICLE ISSN - 0976-4259
416
(c) (d)
Figure 7: Micrographs for mild steel sample surface (a) before the experiment (b) after
immersion in 2M H2SO4 for 60 min (c) after immersion in 60 cm3 of BG extract for 60 min
(d) after immersion in 140 cm3 of BG extract for 60 min. All the immersions were done at a
temperature of 333K.
4. Conclusion
The investigation examined the various indices that characterized the behavior of the mild
steel sample when it was immersed in the sulphuric acid solution using the gasometric
technique at a temperature of 333K. Investigations revealed that while H2 evolution and
corrosion rate reduced extract concentration and % I.E increased. The extract phytochemical-
metal surface interaction mechanism was best explained by the Freundlich isotherm. The 4
and 12 minutes curve was also revealed as the best and worst interaction time for the extract
phyto-constituents across all concentrations employed to adequately adsorb to steel surface.
Photomicrograph studies indicated that increasing the extract concentration resulted in
significant reduction in the coarsening of the oxide of iron phase, with the pearlite and ferrite
phases becoming finely dispersed. The retardant was more effective as concentration
increased; this is of course an indication of a decrease in the rate of damage of the steel.
5. References
1. Ajayi, O.O., Omotosho, O. A., Ifepe, V.O (2011a), “Acid Failure of Mild Steel in 2 M
Sulphuric Acid in the Presence of Vernonia amygdalina”, Journal of Material and
Environmental Science, 2(2), pp 186-195.
2. Ajayi, O.O., Omotosho, O.A., Ajanaku, K.O., Olawore, B.O (2011c), “Failure Evaluation
of Aluminium alloy in 2M HCl in the presence of Cola acuminata”, Environmental
Research Journal, 5(4), pp 163-169.
3. Ajayi, O.O., Omotosho, O.A, Ajanaku, K.O., Olawore, B.O (2011b), “Degradation study
of Aluminium alloy in 2M HCl in the presence of Chromolaena Odorata”, Journal of
Engineering and Applied Science, 6(1), pp 10-17.
4. Buchweishaija, J., Mhinzi, G.S (2008), “Natural Products as a Source of Environmentally
Friendly Corrosion Inhibitors: The Case of Gum Exudate from Acacia seyal var. seyal”,
Portugaliae Electrochimica Acta, 26(3), pp 257-265.
INTERNATIONAL JOURNAL OF APPLIED ENGINEERING RESEARCH, DINDIGUL
Volume 2, No 2, 2011
© Copyright 2010 All rights reserved Integrated Publishing Association
REVIEW ARTICLE ISSN - 0976-4259
417
5. De Souza, F.S., Spinelli, A (2009), “Caffeic acid as a green corrosion inhibitor for mild
steel”, Corrosion Science, 51(3), pp 642-649.
6. El-Etre, A.Y (2003), “Inhibition of aluminium corrosion using Opuntia extract”.
Corrosion Science, 45(11), pp 2485-2495.
7. Febrianto, J., Kosasih, A.N., Sunarsob, J., Ju, Y., Indraswati, N., Ismadji, S (2009),
“Equilibrium and kinetic studies in adsorption of heavy metals using biosorbent: A
summary of recent studies.” Journal of Hazardous Materials, 162(2-3), pp 616-645.
8. Mathur, P. B., Vasudevan, T (1982), “Reaction rate studies for the corrosion of metals in
acids. I. Iron in mineral acids.” Corrosion (NACE), 38(3), pp 171-178.
9. Noor, E.A., Al-Moubaraki, A.H (2008), “Corrosion behavior of mild steel in hydrochloric
acid solutions.” International Journal of Electrochemical Science, 3, pp 806-818.
10. Obot, I. B., Obi-Egbedi, N. O (2009), “Ipomoea involcrata as an ecofriendly inhibitor for
Aluminum in alkaline medium.” Portugaliae Electrochimica Acta, 27(4), pp 517-524.
11. Oguzie, E. E (2006), “Studies on the inhibitive effect of Occimum viridis extract on the
acid corrosion of mild steel.” Material Chemistry and Physics, 99(2/3), pp 441 – 446.
12. Oguzie, E.E (2008), “Evaluation of the inhibitive effect of some plant extracts on the acid
corrosion of mild steel.” Corrosion Science, 50(11), pp 2993-2998.
13. Okafor, P.C., Ebenso, E. E., Ekpe, U.J (2010), “Azadirachta indica extracts as corrosion
inhibitor for mild steel in acid medium.” International Journal of Electrochemical
Science, 5, pp 978-993.
14. Okafor, P.C., Ikpi, M.E., Uwaha, I.E., Ebenso, E.E., Ekpe, U.J., Umoren, S.A (2008),
“Inhibitory action of Phyllanthus amarus extracts on the corrosion of mild steel in acidic
media.” Corrosion Science, 50(8), pp 2310-2317.
15. Omotosho, O.A., Okeniyi, J.O., Ajayi, O.O (2010), “Performance evaluation of
potassium dichromate and potassium chromate inhibitors on concrete steel rebar
corrosion.” Journal of Failure Analysis And Prevention, 10(5), pp 408-415.
16. Raja, P.B., Sethuraman, M.G (2008), “Atropine Sulphate as Corrosion Inhibitor for Mild
Steel in Sulphuric Acid Media.” Material Letters, 62, pp 1602-1604.
17. Saratha, R., Priya, S.V., Thilagavathy, P (2009), “Investigation of Citrus aurantiifolia
leaves extract as corrosion inhibitor for mild steel in 1 M HCl.” E-Journal of Chemistry,
6(3), pp 785-795.
18. Singh, A., Ahamad, I., Singh V. K., Quraishi, M.A (2010), “The effect of
environmentally benign fruit extract of Shahjan (Moringa Oleifera) on the corrosion of
mild steel in sulphuric acid solution.” J.S.E.L., JSEL-D-10-00143R2.
INTERNATIONAL JOURNAL OF APPLIED ENGINEERING RESEARCH, DINDIGUL
Volume 2, No 2, 2011
© Copyright 2010 All rights reserved Integrated Publishing Association
REVIEW ARTICLE ISSN - 0976-4259
418
19. Singh, A., Singh, V. K, Quraishi, M. A (2010), “Effect of fruit extracts of some
environmentally benign green corrosion inhibitors on corrosion of mild steel in
hydrochloric acid solution.” Journal of Material and Environmental Science, 1(3), pp
162-174.
20. Valek, L., Martinez, S (2007), “Copper corrosion inhibition by Azadirachta indica leaves
extract in 0.5 M sulphuric acid.” Material Letters, 61, pp 148-151.
21. Yang, L., Zhang, H., Tan, T., Rahman, A. U (2009), “Thermodynamic and NMR
investigations on the adsorption mechanism of puerarin with oligo-β-cyclodextrin-
coupled polystyrene-based matrix.” Journal of Chemical Technology and Biotechnology,
84, pp 611-617.
22. Yin, J.Y (2004), “Green inhibitors for corrosion control: A Study on the Inhibitive Effects
of Extracts of Honey and Rosmarinus officinalis L. (Rosemary)”, Master’s Thesis,
University of Manchester Institute of Science and Technology, Manchester.