![A distinct [18F]MPPF PET profile in amnestic mild cognitive impairment compared to mild Alzheimer's disease](https://static.fdokumen.com/doc/165x107/63361f3bb5f91cb18a0bb07c/a-distinct-18fmppf-pet-profile-in-amnestic-mild-cognitive-impairment-compared.jpg)
Poly(p-Phenylenediamine) as an Inhibitor for Mild Steel in Hydrochloric Acid Medium
14
Portugaliae Electrochimica Acta 2012, 30(1), 67-80 DOI: 10.4152/pea.201201067 PORTUGALIAE ELECTROCHIMICA ACTA ISSN 1647-1571 Poly(p-Phenylenediamine) as an Inhibitor for Mild Steel in Hydrochloric Acid Medium S.S Abd El Rehim, a S.M. Sayyah b and R.E. Azooz b,* a Chemistry Department, Faculty of Science, Ain Shams University, Abbassia, Cairo,Egypt. b Polymer Research Laboratory, Chemistry Department, Faculty of Science, Beni-Suef University, 62514 Beni-Suef, Egypt. Received 7 March 2011; accepted 28 February 2012 Abstract The corrosion behavior of mild steel (MS) in HCl solution containing various concentrations of electropolymerized P(p-phenylenediamine), P(pPD), has been investigated using weight loss and potentiodynamic polarization techniques. The data obtained from the two techniques are comparable and showed that the presence of P(pPD) in the acid solutions suppresses the corrosion rate of MS indicating that these polymers act as corrosion inhibitors (predominantly as anodic inhibitors). The inhibition efficiency (IE%) of the polymer enhances with increasing their concentrations and decrease with an increase in temperature. The inhibition occurs through adsorption and formation of barrier film on the metal surface which separates the metal from direct contact with the corrosive medium and hence protects the metal against the corrosion. The adsorption followed the Langmuir isotherm. The thermodynamic functions of the adsorption and dissolution processes were evaluated. Keywords: corrosion; inhibition; protection efficiency; mild steel; Langmuir isotherm. Introduction The uniform corrosion is the main problem in using mild steel (MS) in acidic solution. To protect MS from acidic environment corrosion inhibitors or coatings are used. The most effective factors for the inhibiting effects of organic polymers are: the electronegative atoms (such as, N, S, P, O, etc.), the unsaturated bonds (such as, double bonds or triple bonds, etc.), the plane conjugated systems including all kinds of aromatic cycles, molecular area and molecular weight of the inhibitor molecule [2- 10]. * Corresponding author. E-mail: [email protected]
Transcript of Poly(p-Phenylenediamine) as an Inhibitor for Mild Steel in Hydrochloric Acid Medium
Portugaliae Electrochimica Acta 2012, 30(1), 67-80
DOI: 10.4152/pea.201201067
PORTUGALIAE
ELECTROCHIMICA
ACTA ISSN 1647-1571
Poly(p-Phenylenediamine) as an Inhibitor for Mild Steel in
Hydrochloric Acid Medium
S.S Abd El Rehim,a S.M. Sayyah
b and R.E. Azooz
b,*
a Chemistry Department, Faculty of Science, Ain Shams University, Abbassia, Cairo,Egypt.
b Polymer Research Laboratory, Chemistry Department, Faculty of Science, Beni-Suef
University, 62514 Beni-Suef, Egypt.
Received 7 March 2011; accepted 28 February 2012
Abstract
The corrosion behavior of mild steel (MS) in HCl solution containing various
concentrations of electropolymerized P(p-phenylenediamine), P(pPD), has been
investigated using weight loss and potentiodynamic polarization techniques. The data
obtained from the two techniques are comparable and showed that the presence of
P(pPD) in the acid solutions suppresses the corrosion rate of MS indicating that these
polymers act as corrosion inhibitors (predominantly as anodic inhibitors). The inhibition
efficiency (IE%) of the polymer enhances with increasing their concentrations and
decrease with an increase in temperature. The inhibition occurs through adsorption and
formation of barrier film on the metal surface which separates the metal from direct
contact with the corrosive medium and hence protects the metal against the corrosion.
The adsorption followed the Langmuir isotherm. The thermodynamic functions of the
adsorption and dissolution processes were evaluated.
Keywords: corrosion; inhibition; protection efficiency; mild steel; Langmuir isotherm.
Introduction
The uniform corrosion is the main problem in using mild steel (MS) in acidic
solution. To protect MS from acidic environment corrosion inhibitors or coatings
are used.
The most effective factors for the inhibiting effects of organic polymers are: the
electronegative atoms (such as, N, S, P, O, etc.), the unsaturated bonds (such as,
double bonds or triple bonds, etc.), the plane conjugated systems including all
kinds of aromatic cycles, molecular area and molecular weight of the inhibitor
molecule [2- 10].
* Corresponding author. E-mail: [email protected]
S.S. Abd El Rehim et al. / Port. Electrochim. Acta 30 (2012) 67-80
68
According to the type of inhibitor species (anodic or cathodic) and the nature of
metal or alloy, adsorption may be chemical or physical adsorption. In many
cases, the efficiency of an organic compound as an inhibitor is due to its
adsorption on the metal surface forming a barrier layer which separates the metal
from the corrosive media [10].
Some phenylenediamines are used as corrosion inhibitors of MS; p-
phenylenediamine, pPD, as a monomer was found to be less effective compared
with other isomers o- or/and m- phenylenediamine [11]. Also, poly
phenylenediamines are used; P(oPD) with concentration 15 ppm gives inhibition
efficiency (IE%) of 95% [12], P(pPD) with concentration 50 ppm gives
inhibition efficiency (IE%) of 73% [13] and P(mPD) after 168 H give 80%
efficiency [14].
In this paper we report the inhibitive action of an electro synthetic p(pPD) on
corrosion of mild steel in HCl solutions. The inhibition has been evaluated by
weight loss and potentiodynamic polarization measurements. It is also the
purpose of this work to test the experimental data obtained from the two
techniques with Langmuir isotherm at different temperatures, in order to
determine the thermodynamic functions for the adsorption process.
Experimental
Chemicals P(pPD) was obtained by the electropolymerized of reagent grade p-
phenylenediamine ( Merck- Darmstadt, Germany) in aqueous acidic HCl
(Riedel-de-Haën, Germany) by cyclic voltammetry technique [12].
Characterization is done by using FTIR- spectroscopy, UV spectroscopy, TGA
and element analysis. The proposed structure of this polymer using these tools is
represented in Scheme (1). DMF were provided by El-Naser Pharmaceutical
Chemical Company (Egypt).
Scheme 1. Structure of P(pPD).
Methodology
For the weight loss measurements, rectangular specimens of mild steel (MS) (wt.
%: 98.5% Fe, 0.33% C, 0.24% Si, 0.52% Mn, 0.04% Cr and 0.02% S) of size 3
cm x 4 cm x 0.2 cm were used. The working electrode was polished
mechanically with silicon carbide (SiC) belts, 200 to 600 grit (Buehler, Ltd.), and
1 µm α-alumina (Buehler, Ltd.), washed with distilled water, then with acetone,
and finally with double distilled water and dried. The weight loss, expressed in
mgcm-2
, was determined by weighing the cleaned samples before and after
immersion in HCl solution for 1 h. Weight loss was determined in the absence or
presence of various concentrations of P(pPD), which was prepared previously in
the same manner as [12].
S.S. Abd El Rehim et al. / Port. Electrochim. Acta 30 (2012) 67-80
69
The UV-vis.- spectrum for P(pPD) (at room temperature in the range 200-900 nm
using dimethylformamide as a solvent and reference) consists of the following
absorption peaks:
λmax = 290 and 263 for π-π* transition;
λmax = 312 nm for polaron-π* transition and;
λmax = 440 nm for π-polaron transition.
The IR-spectra, show the following bands:
νmax = 3415, 3150 cm−1
for NH2 stretching vibration or OH strong hydrogen
bonded group in H2O molecules of hydration in polymer;
νmax = 3015 cm−1
for CH stretching vibration of aromatic amine:
νmax = 1115 cm−1
for CH bending vibration of quinoid ring;
νmax = 1509 cm−1
for CN stretching vibration of quinod;
νmax = 1288 cm−1
for CN stretching vibration of radical cation;
νmax = 1509 cm−1
for CN stretching vibration benzene ring.
A weighted 0.01g of polymer was dissolved in solution (DMF: H2O mix (2:98
v/v)) to give a stock solution containing 100 ppm of inhibitor.
For polarization measurements, the electrolytic cell was filled with 100 mL of
1.0 M HCl solution. The working electrode (MS), auxiliary electrode (Platinum
wire) and the Luggin- prob were introduced into the cell containing the test
solution (H2O/DMF (98:2 v/v) and the polymer with different concentrations.
Potentiodynamic polarization measurements were performed using the
Potentiostat / Galvanostat Wenking PGS 95 connected with PC computer.
The working electrode is a MS specimen in the form of rod. The rod was weld
from one side to a copper wire used for electrical connection. The rod was
embedded in a glass tube and epoxy resin was used to stick the sample to the
glass tube. This also ensured that a constant cross-section area of 2 cm2 would be
exposed to the solution through the experiments. The exposed area was ground
by different emery papers in the normal way as described above, washed with
distilled water, then with acetone, and again with distilled water, just before
insertion in the cell. All the potentials were measured relative to the saturated
calomel electrode (SCE). The i-E curves were recorded by computer software
(Model ECT). For each run, a freshly prepared solution as well as a cleaned set
of electrodes was used. Each run was conducted at constant temperature ±1oC
with using a circular water thermostat.
P(pPD) [12] has the structure shown in scheme (1).~
Results and discussion
Weight loss and polarization measurements The inhibition (protection) efficiency, IE%, of P(pPD) was calculated for MS
sample in the acid solutions in the presence of different concentrations of P(pPD)
at 303 K using equation [13]:
where, W
o and W are the weight loss of MS sample in the absence and presence
of P(pPD), respectively. The relation between IE% and the logarithm of the
S.S. Abd El Rehim et al. / Port. Electrochim. Acta 30 (2012) 67-80
70
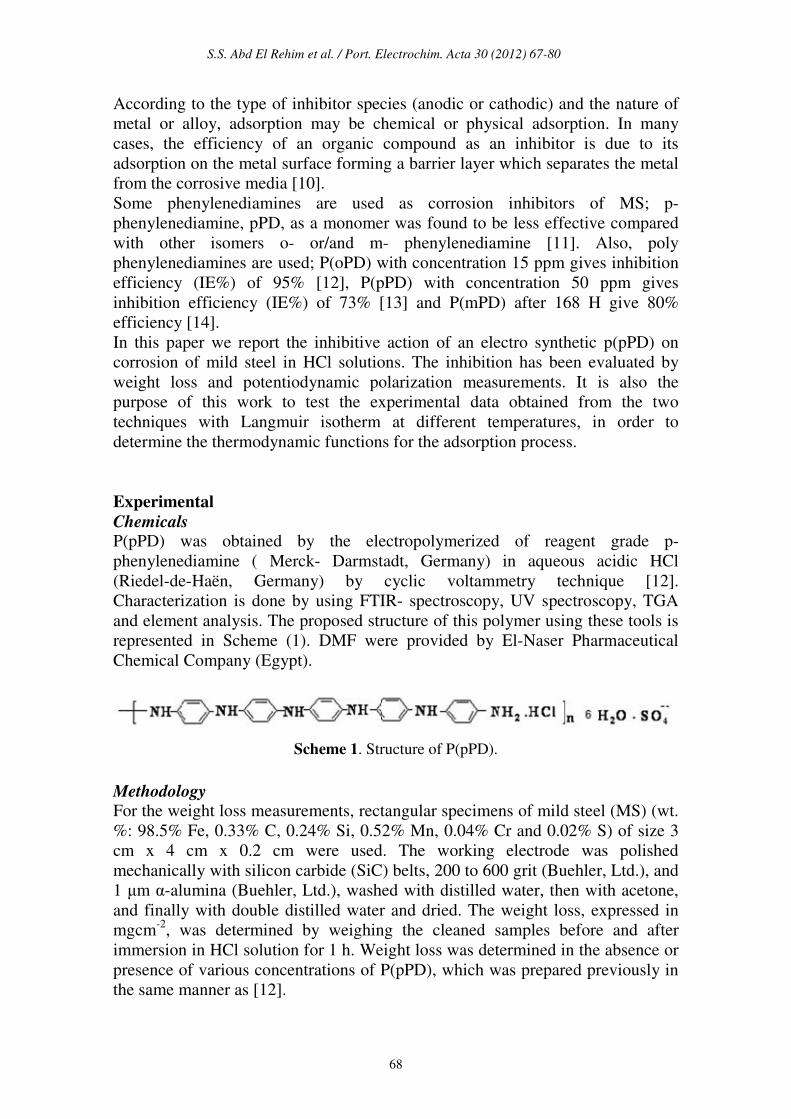
concentration of the inhibitor in the three acid solutions at 303 K is shown in Fig.
(1). From the figure, The P(pPD) species seems to function as inhibitor by being
adsorbed on the metal surface from the corroding medium.
Figure 1. Relation between IE% and log of the concentration of P(pPD) in different
HCl concentrations at 303 K.
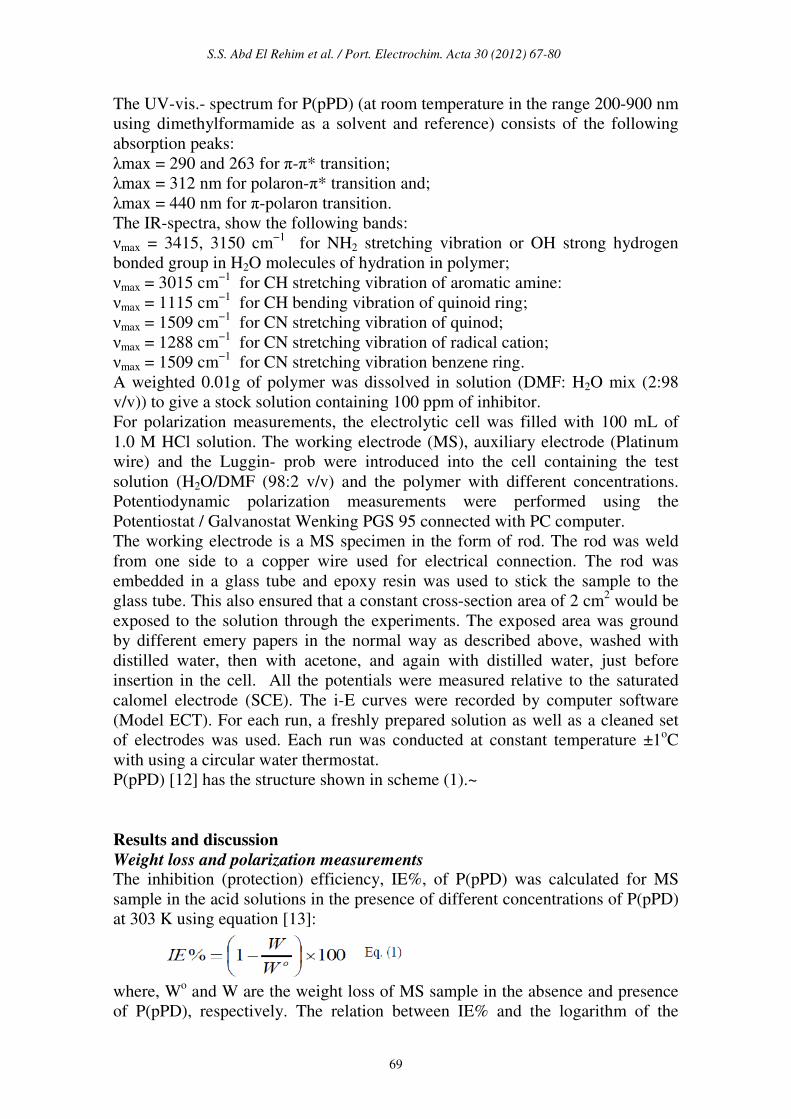
Figure 2. Relation between IE% and the log of the concentration of P(pPD) in 1.0 M
HCl at 298, 303 and 308 K.
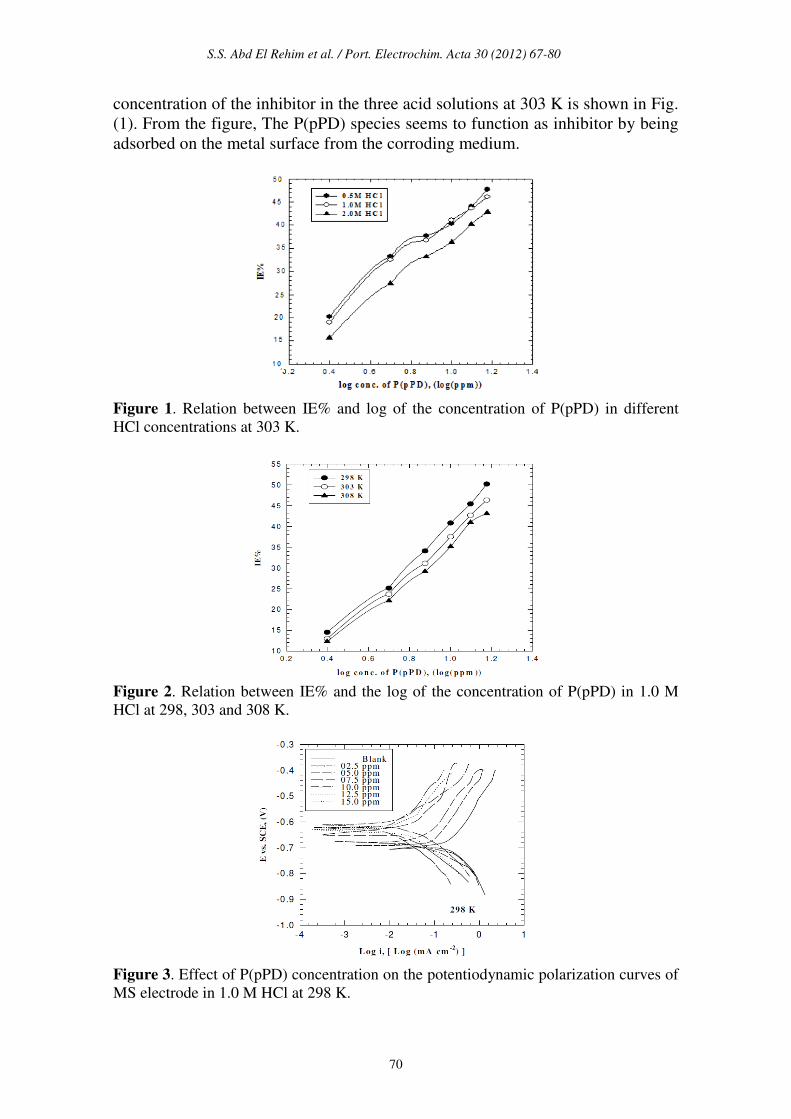
Figure 3. Effect of P(pPD) concentration on the potentiodynamic polarization curves of
MS electrode in 1.0 M HCl at 298 K.
S.S. Abd El Rehim et al. / Port. Electrochim. Acta 30 (2012) 67-80
71
To verify the nature of adsorption and the effect of temperature on the corrosion
behaviour of MS sample in 1 M HCl with and without different concentrations of
P(pPD) inhibitor, weight loss studies were undertaken. The selected temperatures
tested were 298, 303 and 308 K. The inhibition efficiency, IE%, under the
prevailing conditions was calculated using equation (1) and the dependence of
the IE% on the logarithm of the inhibitor concentration of P(pPD) at the three
tested temperatures was shown in Fig. (2).
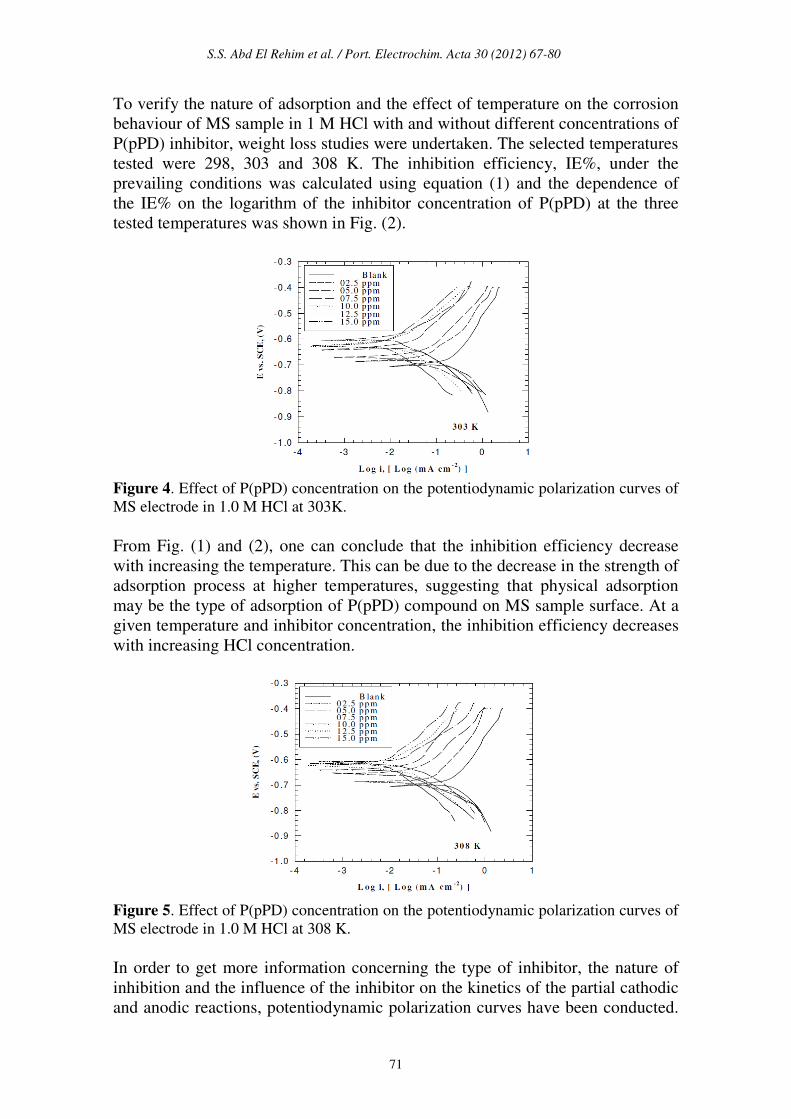
Figure 4. Effect of P(pPD) concentration on the potentiodynamic polarization curves of
MS electrode in 1.0 M HCl at 303K.
From Fig. (1) and (2), one can conclude that the inhibition efficiency decrease
with increasing the temperature. This can be due to the decrease in the strength of
adsorption process at higher temperatures, suggesting that physical adsorption
may be the type of adsorption of P(pPD) compound on MS sample surface. At a
given temperature and inhibitor concentration, the inhibition efficiency decreases
with increasing HCl concentration.
Figure 5. Effect of P(pPD) concentration on the potentiodynamic polarization curves of
MS electrode in 1.0 M HCl at 308 K.
In order to get more information concerning the type of inhibitor, the nature of
inhibition and the influence of the inhibitor on the kinetics of the partial cathodic
and anodic reactions, potentiodynamic polarization curves have been conducted.

S.S. Abd El Rehim et al. / Port. Electrochim. Acta 30 (2012) 67-80
72
This was achieved by investigating the inhibitor concentration and solution
temperature dependences of the corrosion current density (icorr) and on the
corrosion potential (Ecorr), obtained using the Tafel extrapolation method.
Fig. (3), (4) and (5) represent the influence of P(pPD) concentration on the
potentiodynamic cathodic and anodic polarization curves for MS electrode in 1.0
M HCl at scan rate of 10 mVs-1
and at 298, 303 and 308 K, respectively. The data
clearly show that the addition of P(pPD) enhances both the anodic and cathodic
overpotentials (but mainly the anodic) and decreases the corrosion current
density. These results confirm the suggestion that P(pPD) functions as inhibitor
for the acid corrosion of MS electrode. This inhibitor is classified mainly as
anodic inhibitor. In all cases, the polarization curves exhibited Tafel type
behavior around the corrosion potential, Ecorr, the electrochemical kinetic
parameters associated the polarization curves (icorr, Ecorr, βc and βa) for MS in
1.0M HCl in the absence and presence of various concentrations of P(pPD) and
at different temperatures have been simultaneously determined (in the potential
rang ±50 mV from Ecorr) and are given in Tables (1), (2) and (3).
Table 1. Electrochemical kinetic parameters (icorr, Ecorr, βc and βa) and inhibition
efficiency (IE%) obtained from polarization curves of MS electrode in 1.0 M HCl at
298 K.
P(pPD) conc. (ppm) icorr
(mA cm-2
)
-Ecorr
(mV)
βc
(mV dec-1
)
Βa
(mV dec-1
) IE%
Blank 400 692 1.36 0.300 --
2.5 332 675 0.220 1.00 17.00
5.0 296 650 0.400 0.907 26.00
7.5 253.6 634 0.140 0.778 36.60
10.0 206 312 0.100 0.510 48.50
12.5 200 321 0.111 0.612 50.00
15.0 190 316 0.105 0.614 52.50
Table 2. Electrochemical kinetic parameters (icorr, Ecorr, βc and βa) and inhibition
efficiency (IE%) obtained from polarization curves of MS electrode in 1.0 M HCl at
303 K.
P(pPD) conc. (ppm) icorr
(mA cm-2
)
-Ecorr
(mV)
βc
(mV dec-1
)
Βa
(mV dec-1
) IE%
Blank 473.2 708 1.43 0.306 --
2.5 410 672 0.226 1.00 13.35
5.0 356 652 0.407 0.907 24.77
7.5 325 641 0.144 0.778 31.32
10.0 271 632 0.104 0.510 42.74
12.5 260 612 0.112 0.612 45.05
15.0 250 610 0.110 0.619 47.17
S.S. Abd El Rehim et al. / Port. Electrochim. Acta 30 (2012) 67-80
73
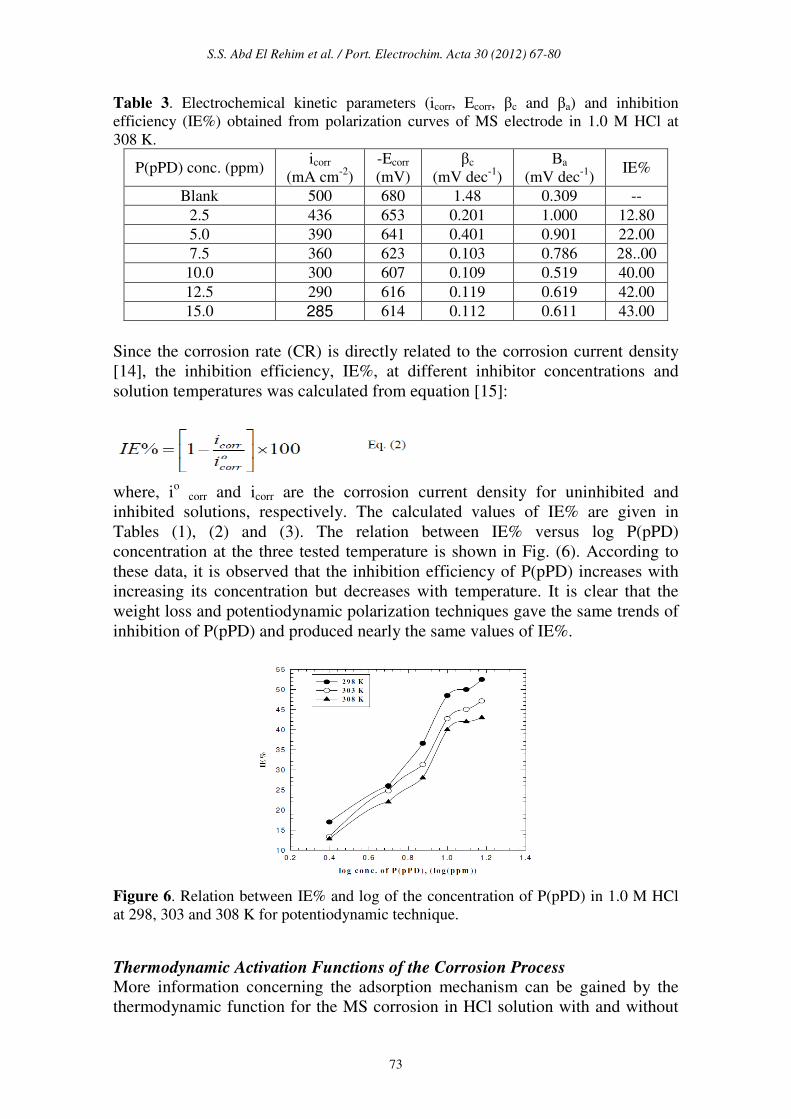
Table 3. Electrochemical kinetic parameters (icorr, Ecorr, βc and βa) and inhibition
efficiency (IE%) obtained from polarization curves of MS electrode in 1.0 M HCl at
308 K.
P(pPD) conc. (ppm) icorr
(mA cm-2
)
-Ecorr
(mV)
βc
(mV dec-1
)
Βa
(mV dec-1
) IE%
Blank 500 680 1.48 0.309 --
2.5 436 653 0.201 1.000 12.80
5.0 390 641 0.401 0.901 22.00
7.5 360 623 0.103 0.786 28..00
10.0 300 607 0.109 0.519 40.00
12.5 290 616 0.119 0.619 42.00
15.0 285 614 0.112 0.611 43.00
Since the corrosion rate (CR) is directly related to the corrosion current density
[14], the inhibition efficiency, IE%, at different inhibitor concentrations and
solution temperatures was calculated from equation [15]:
where, i
o corr and icorr are the corrosion current density for uninhibited and
inhibited solutions, respectively. The calculated values of IE% are given in
Tables (1), (2) and (3). The relation between IE% versus log P(pPD)
concentration at the three tested temperature is shown in Fig. (6). According to
these data, it is observed that the inhibition efficiency of P(pPD) increases with
increasing its concentration but decreases with temperature. It is clear that the
weight loss and potentiodynamic polarization techniques gave the same trends of
inhibition of P(pPD) and produced nearly the same values of IE%.
Figure 6. Relation between IE% and log of the concentration of P(pPD) in 1.0 M HCl
at 298, 303 and 308 K for potentiodynamic technique.
Thermodynamic Activation Functions of the Corrosion Process
More information concerning the adsorption mechanism can be gained by the
thermodynamic function for the MS corrosion in HCl solution with and without
S.S. Abd El Rehim et al. / Port. Electrochim. Acta 30 (2012) 67-80
74
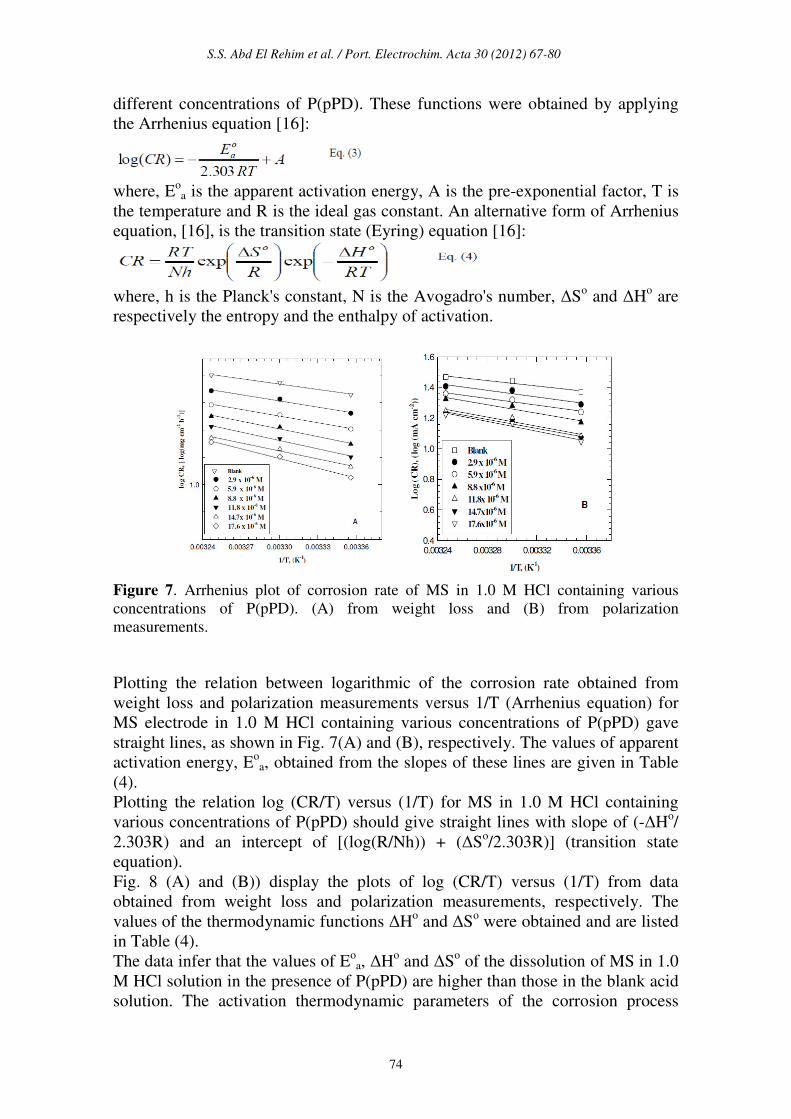
different concentrations of P(pPD). These functions were obtained by applying
the Arrhenius equation [16]:
where, E
oa is the apparent activation energy, A is the pre-exponential factor, T is
the temperature and R is the ideal gas constant. An alternative form of Arrhenius
equation, [16], is the transition state (Eyring) equation [16]:
where, h is the Planck's constant, N is the Avogadro's number, ∆S
o and ∆H
o are
respectively the entropy and the enthalpy of activation.
Figure 7. Arrhenius plot of corrosion rate of MS in 1.0 M HCl containing various
concentrations of P(pPD). (A) from weight loss and (B) from polarization
measurements.
Plotting the relation between logarithmic of the corrosion rate obtained from
weight loss and polarization measurements versus 1/T (Arrhenius equation) for
MS electrode in 1.0 M HCl containing various concentrations of P(pPD) gave
straight lines, as shown in Fig. 7(A) and (B), respectively. The values of apparent
activation energy, Eoa, obtained from the slopes of these lines are given in Table
(4).
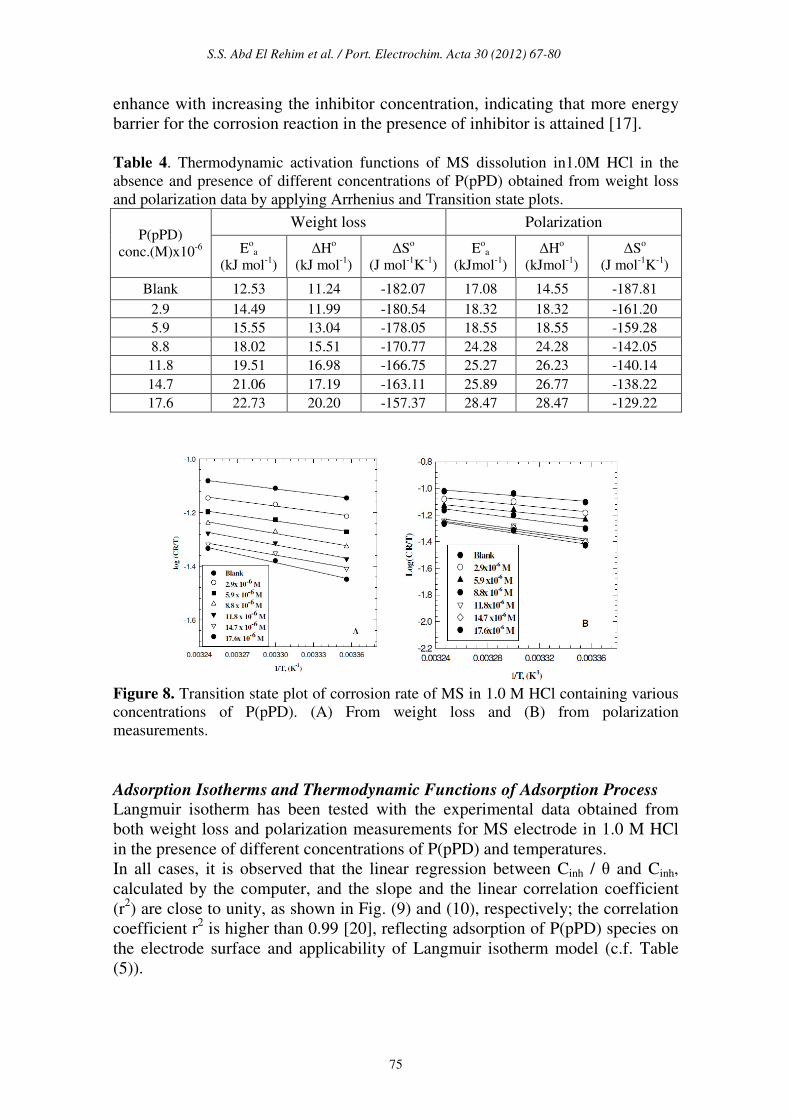
Plotting the relation log (CR/T) versus (1/T) for MS in 1.0 M HCl containing
various concentrations of P(pPD) should give straight lines with slope of (-∆Ho/
2.303R) and an intercept of [(log(R/Nh)) + (∆So/2.303R)] (transition state
equation).
Fig. 8 (A) and (B)) display the plots of log (CR/T) versus (1/T) from data
obtained from weight loss and polarization measurements, respectively. The
values of the thermodynamic functions ∆Ho and ∆S
o were obtained and are listed
in Table (4).
The data infer that the values of Eoa, ∆H
o and ∆S
o of the dissolution of MS in 1.0
M HCl solution in the presence of P(pPD) are higher than those in the blank acid
solution. The activation thermodynamic parameters of the corrosion process
S.S. Abd El Rehim et al. / Port. Electrochim. Acta 30 (2012) 67-80
75
enhance with increasing the inhibitor concentration, indicating that more energy
barrier for the corrosion reaction in the presence of inhibitor is attained [17].
Table 4. Thermodynamic activation functions of MS dissolution in1.0M HCl in the
absence and presence of different concentrations of P(pPD) obtained from weight loss
and polarization data by applying Arrhenius and Transition state plots.
P(pPD)
conc.(M)x10-6
Weight loss Polarization
Eo
a
(kJ mol-1
)
∆Ho
(kJ mol-1
)
∆So
(J mol-1
K-1
)
Eo
a
(kJmol-1
)
∆Ho
(kJmol-1
)
∆So
(J mol-1
K-1
)
Blank 12.53 11.24 -182.07 17.08 14.55 -187.81
2.9 14.49 11.99 -180.54 18.32 18.32 -161.20
5.9 15.55 13.04 -178.05 18.55 18.55 -159.28
8.8 18.02 15.51 -170.77 24.28 24.28 -142.05
11.8 19.51 16.98 -166.75 25.27 26.23 -140.14
14.7 21.06 17.19 -163.11 25.89 26.77 -138.22
17.6 22.73 20.20 -157.37 28.47 28.47 -129.22
Figure 8. Transition state plot of corrosion rate of MS in 1.0 M HCl containing various
concentrations of P(pPD). (A) From weight loss and (B) from polarization
measurements.
Adsorption Isotherms and Thermodynamic Functions of Adsorption Process
Langmuir isotherm has been tested with the experimental data obtained from
both weight loss and polarization measurements for MS electrode in 1.0 M HCl
in the presence of different concentrations of P(pPD) and temperatures.
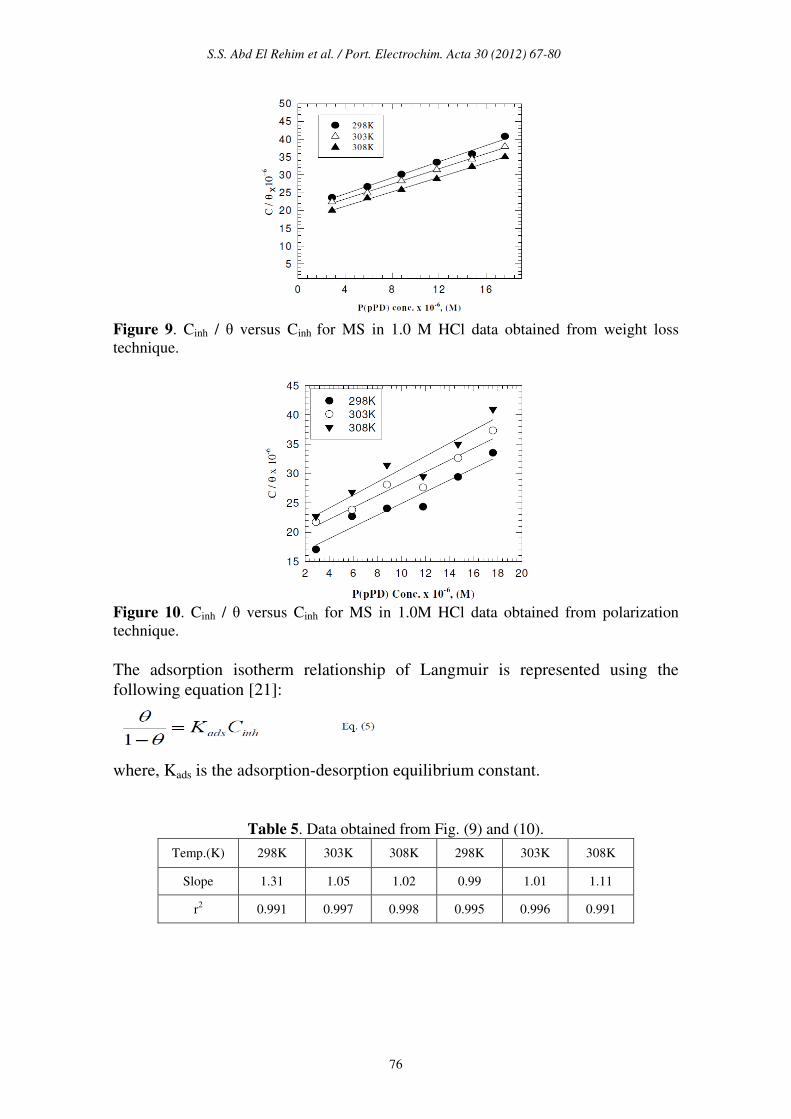
In all cases, it is observed that the linear regression between Cinh / θ and Cinh,
calculated by the computer, and the slope and the linear correlation coefficient
(r2) are close to unity, as shown in Fig. (9) and (10), respectively; the correlation
coefficient r2 is higher than 0.99 [20], reflecting adsorption of P(pPD) species on
the electrode surface and applicability of Langmuir isotherm model (c.f. Table
(5)).
S.S. Abd El Rehim et al. / Port. Electrochim. Acta 30 (2012) 67-80
76
Figure 9. Cinh / θ versus Cinh for MS in 1.0 M HCl data obtained from weight loss
technique.
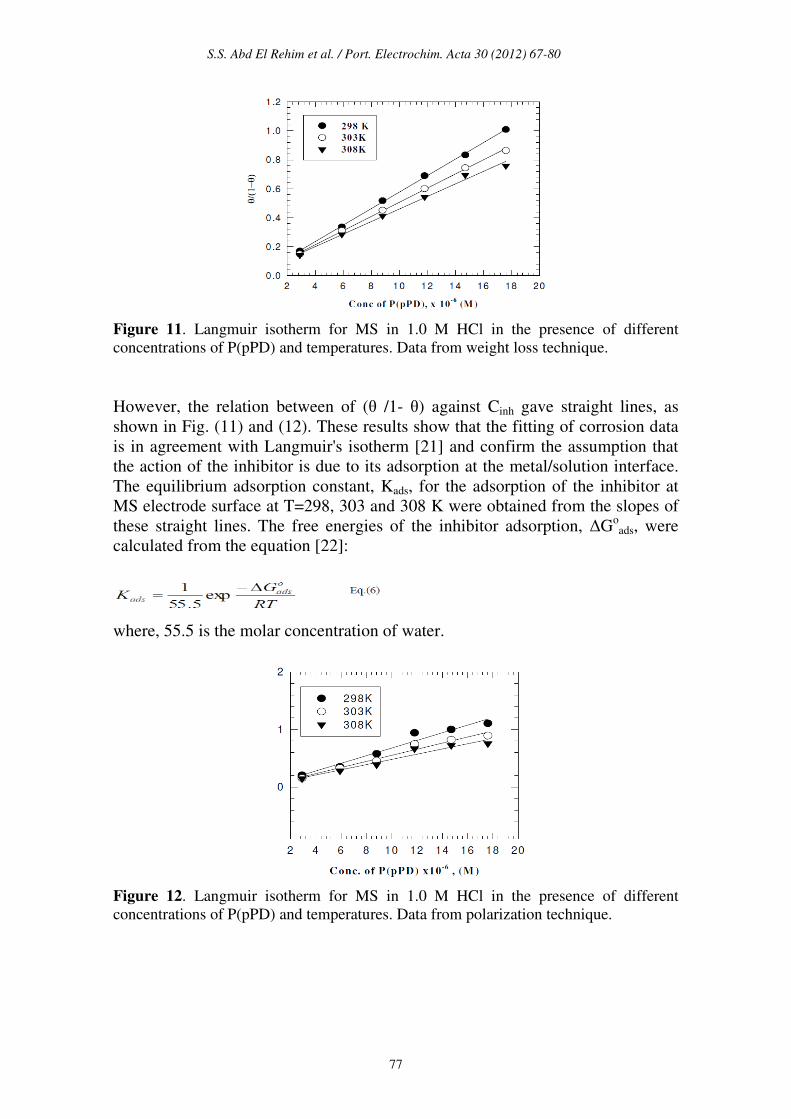
Figure 10. Cinh / θ versus Cinh for MS in 1.0M HCl data obtained from polarization
technique.
The adsorption isotherm relationship of Langmuir is represented using the
following equation [21]:
where, Kads is the adsorption-desorption equilibrium constant.
Table 5. Data obtained from Fig. (9) and (10).
Temp.(K) 298K 303K 308K 298K 303K 308K
Slope 1.31 1.05 1.02 0.99 1.01 1.11
r2 0.991 0.997 0.998 0.995 0.996 0.991
S.S. Abd El Rehim et al. / Port. Electrochim. Acta 30 (2012) 67-80
77
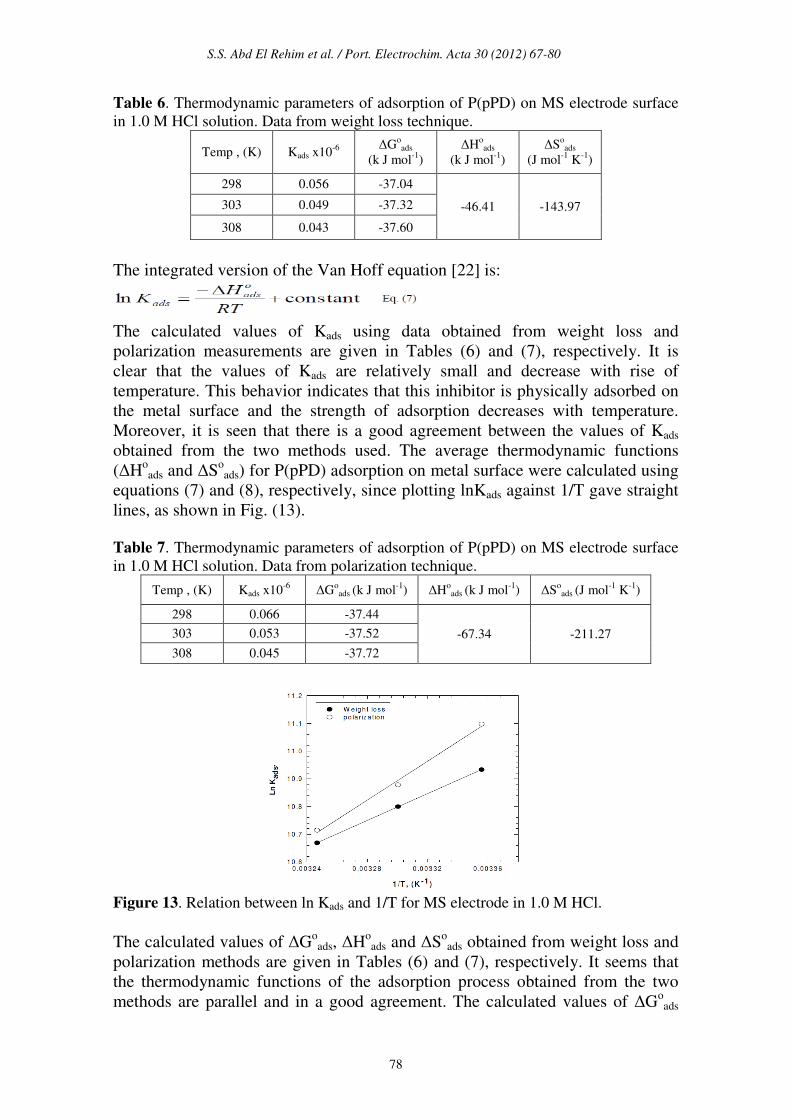
Figure 11. Langmuir isotherm for MS in 1.0 M HCl in the presence of different
concentrations of P(pPD) and temperatures. Data from weight loss technique.
However, the relation between of (θ /1- θ) against Cinh gave straight lines, as
shown in Fig. (11) and (12). These results show that the fitting of corrosion data
is in agreement with Langmuir's isotherm [21] and confirm the assumption that
the action of the inhibitor is due to its adsorption at the metal/solution interface.
The equilibrium adsorption constant, Kads, for the adsorption of the inhibitor at
MS electrode surface at T=298, 303 and 308 K were obtained from the slopes of
these straight lines. The free energies of the inhibitor adsorption, ∆Goads, were
calculated from the equation [22]:
where, 55.5 is the molar concentration of water.
Figure 12. Langmuir isotherm for MS in 1.0 M HCl in the presence of different
concentrations of P(pPD) and temperatures. Data from polarization technique.
S.S. Abd El Rehim et al. / Port. Electrochim. Acta 30 (2012) 67-80
78
Table 6. Thermodynamic parameters of adsorption of P(pPD) on MS electrode surface
in 1.0 M HCl solution. Data from weight loss technique.
Temp , (K) Kads x10-6
∆G
oads
(k J mol-1
)
∆Ho
ads
(k J mol-1
)
∆So
ads
(J mol-1
K-1
)
298 0.056 -37.04
-46.41 -143.97 303 0.049 -37.32
308 0.043 -37.60
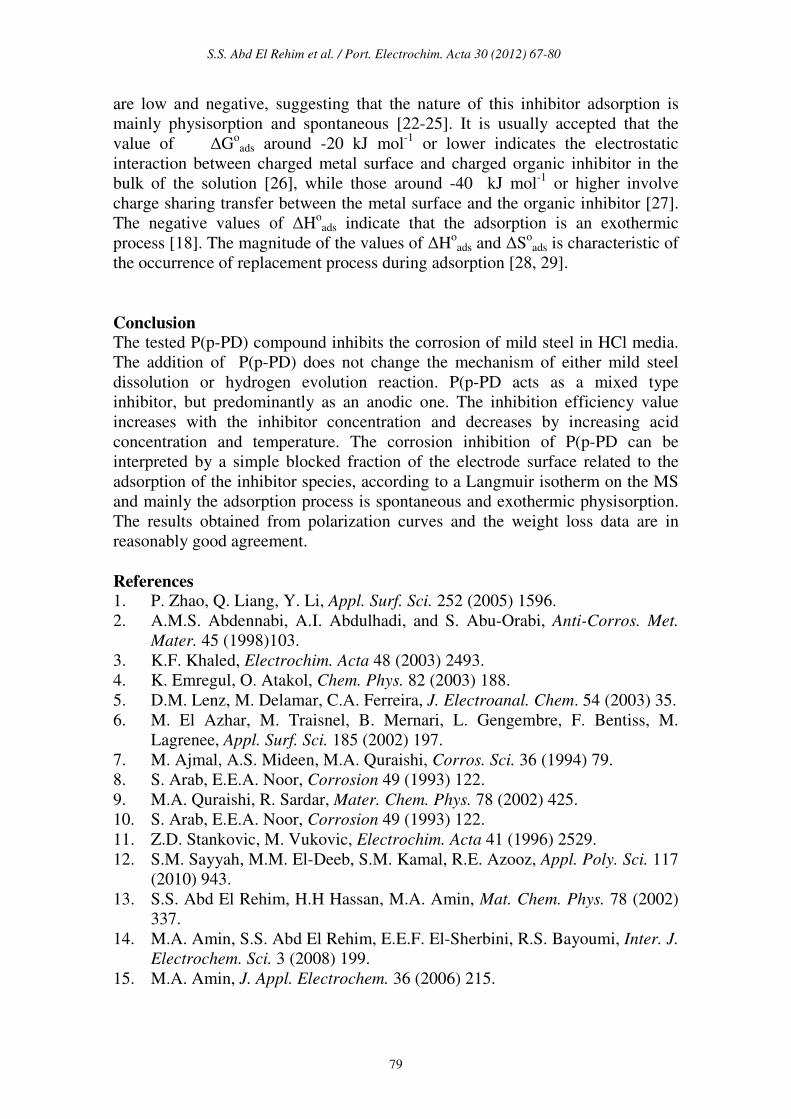
The integrated version of the Van Hoff equation [22] is:
The calculated values of Kads using data obtained from weight loss and
polarization measurements are given in Tables (6) and (7), respectively. It is
clear that the values of Kads are relatively small and decrease with rise of
temperature. This behavior indicates that this inhibitor is physically adsorbed on
the metal surface and the strength of adsorption decreases with temperature.
Moreover, it is seen that there is a good agreement between the values of Kads
obtained from the two methods used. The average thermodynamic functions
(∆Hoads and ∆S
oads) for P(pPD) adsorption on metal surface were calculated using
equations (7) and (8), respectively, since plotting lnKads against 1/T gave straight
lines, as shown in Fig. (13).
Table 7. Thermodynamic parameters of adsorption of P(pPD) on MS electrode surface
in 1.0 M HCl solution. Data from polarization technique.
Temp , (K) Kads x10-6
∆Go
ads (k J mol-1
) ∆Ho
ads (k J mol-1
) ∆So
ads (J mol-1
K-1
)
298 0.066 -37.44
-67.34 -211.27 303 0.053 -37.52
308 0.045 -37.72
Figure 13. Relation between ln Kads and 1/T for MS electrode in 1.0 M HCl.
The calculated values of ∆Goads, ∆H
oads and ∆S
oads obtained from weight loss and
polarization methods are given in Tables (6) and (7), respectively. It seems that
the thermodynamic functions of the adsorption process obtained from the two
methods are parallel and in a good agreement. The calculated values of ∆Goads
S.S. Abd El Rehim et al. / Port. Electrochim. Acta 30 (2012) 67-80
79
are low and negative, suggesting that the nature of this inhibitor adsorption is
mainly physisorption and spontaneous [22-25]. It is usually accepted that the
value of ∆Goads around -20 kJ mol
-1 or lower indicates the electrostatic
interaction between charged metal surface and charged organic inhibitor in the
bulk of the solution [26], while those around -40 kJ mol-1
or higher involve
charge sharing transfer between the metal surface and the organic inhibitor [27].
The negative values of ∆Hoads indicate that the adsorption is an exothermic
process [18]. The magnitude of the values of ∆Hoads and ∆S
oads is characteristic of
the occurrence of replacement process during adsorption [28, 29].
Conclusion
The tested P(p-PD) compound inhibits the corrosion of mild steel in HCl media.
The addition of P(p-PD) does not change the mechanism of either mild steel
dissolution or hydrogen evolution reaction. P(p-PD acts as a mixed type
inhibitor, but predominantly as an anodic one. The inhibition efficiency value
increases with the inhibitor concentration and decreases by increasing acid
concentration and temperature. The corrosion inhibition of P(p-PD can be
interpreted by a simple blocked fraction of the electrode surface related to the
adsorption of the inhibitor species, according to a Langmuir isotherm on the MS
and mainly the adsorption process is spontaneous and exothermic physisorption.
The results obtained from polarization curves and the weight loss data are in
reasonably good agreement.
References 1. P. Zhao, Q. Liang, Y. Li, Appl. Surf. Sci. 252 (2005) 1596.
2. A.M.S. Abdennabi, A.I. Abdulhadi, and S. Abu-Orabi, Anti-Corros. Met.
Mater. 45 (1998)103.
3. K.F. Khaled, Electrochim. Acta 48 (2003) 2493.
4. K. Emregul, O. Atakol, Chem. Phys. 82 (2003) 188.
5. D.M. Lenz, M. Delamar, C.A. Ferreira, J. Electroanal. Chem. 54 (2003) 35.
6. M. El Azhar, M. Traisnel, B. Mernari, L. Gengembre, F. Bentiss, M.
Lagrenee, Appl. Surf. Sci. 185 (2002) 197.
7. M. Ajmal, A.S. Mideen, M.A. Quraishi, Corros. Sci. 36 (1994) 79.
8. S. Arab, E.E.A. Noor, Corrosion 49 (1993) 122.
9. M.A. Quraishi, R. Sardar, Mater. Chem. Phys. 78 (2002) 425.
10. S. Arab, E.E.A. Noor, Corrosion 49 (1993) 122.
11. Z.D. Stankovic, M. Vukovic, Electrochim. Acta 41 (1996) 2529.
12. S.M. Sayyah, M.M. El-Deeb, S.M. Kamal, R.E. Azooz, Appl. Poly. Sci. 117
(2010) 943.
13. S.S. Abd El Rehim, H.H Hassan, M.A. Amin, Mat. Chem. Phys. 78 (2002)
337.
14. M.A. Amin, S.S. Abd El Rehim, E.E.F. El-Sherbini, R.S. Bayoumi, Inter. J.
Electrochem. Sci. 3 (2008) 199.
15. M.A. Amin, J. Appl. Electrochem. 36 (2006) 215.
S.S. Abd El Rehim et al. / Port. Electrochim. Acta 30 (2012) 67-80
80
16. J.O’M. Bockris, A.K.N. Reddy, “Modern Electrochemistry” Vol. 2,
Platinum Press, N.Y. 1977.
17. F. Mansfeld, “Corrosion Mechanism” p. 119, Marcel Dakkar, N.Y. 1987.
18. J. March: Advanced Organic Chemistry: 3rd. ed., Will Eastern, New Delhi,
1988.
19. E. McCaaffery, “Corrosion Control by Coating”, Science Press, Princeton,
1979.
20. Y. Yan, W. Li, L. Caiand and B. Hou, Electrochim Acta 53 (2008) 5953.
21. I. Langmuir, J. Am. Chem. Soc. 39 (1947) 1848.
22. D. Do, “Adsorption Analysis: Equilibria and Kinetics”, Imperial Collage
Press, London, 1998.
23. E. Khamis, I. Mellucci, R.M. Lantanision, E.S.H. El-Ashry, Corros. Sci. 47
(1991) 677.
24. F.M. Donahue, k. Noble, J. Electrochem. Soc. 112 (1965) 886.
25. P.W. Atkins, Physical Chemistry, 6th. Ed., Oxford Univ. Press 1999, p857.
26. H. Keles, M. Keles, I. Dehri, O. Serindag, Colloids surf. A: Physicochem.
Eng. Aspects 320 (2008)138.
27. A.K. Singh, M.A. Quraishi, Corrosion Sci. 51 (2009) 2752.
28. B.A. Abdel Nabey, E. Khamis, M. Sh. Ramadan, A. El-Gidy, 8th Eur.
Symp. Corros. Inhibitors, Ann Univ. Ferrara, NS Sez. 10 (1995) 299.
29. M.J. Lampinen and M. Fomino, J. Electrochem. Soc. 140 (1993) 3537.