An MEG compatible system for measuring skin conductance responses
Upload
khangminh22Category
view
0download
0
Analysis of Spontaneous MEG Activity in Mild Cognitive Impairment using the Wavelet Turbulence
Jesús Poza1, Carlos Gómez1, María García1, Alberto Fernández2 and Roberto Hornero1 1Biomedical Engineering Group, Dept. of Signal Theory and Communications, University of Valladolid, Valladolid, Spain
2Departmento de Psiquiatría y Psicología Médica, Complutense University of Madrid, Madrid, Spain {jespoz, cargom, margar}@tel.uva.es, [email protected], [email protected]
Keywords: Mild Cognitive Impairment, Magnetoencephalogram, Continuous Wavelet Transform, Wavelet Turbulence, Irregularity.
Abstract: Mild cognitive impairment (MCI) is usually considered a pre-clinical stage of Alzheimer’s disease (AD). An appropriate characterization of MCI is crucial to achieve an early diagnosis of AD. Over the last few years, much effort has been devoted to identifying new diagnostic tests; tough further research is still required. In this study, we analyzed the spontaneous magnetoencephalographic (MEG) activity from 18 MCI subjects and 27 healthy controls to characterize the irregularity patterns in MCI. For that purpose, the wavelet turbulence (WT) was calculated from the time-scale representation provided by the continuous wavelet transform (CWT). Our results revealed that the mean values and the standard deviation of WT for MCI subjects were significantly higher and lower (p < 0.05) than for controls, respectively. These findings support the notion that MCI is associated with a significant decrease in irregularity and variability when compared to normal aging. A Receiver Operating Characteristic (ROC) analysis with a leave-one-out cross-validation procedure was applied to assess the diagnostic ability of WT. We obtained an accuracy of 66.7% and an area under ROC curve of 0.704. We conclude that the WT extends the concept of irregularity and provides potential descriptors of spontaneous MEG activity in MCI.
1 INTRODUCTION
Alzheimer’s disease (AD) is a neurodegenerative disorder that represents the leading form of dementia in western countries (Blennow et al., 2006). In order to optimize treatments, an intervention in early stages is required, even before the appearance of the first clinical symptoms (Reitz et al., 2011). For that purpose, the understanding of mild cognitive impairment (MCI) is a key point.
MCI is usually considered as an important risk factor, since the probability of developing AD among MCI subjects is about 5 to 10 times higher than for healthy subjects (Petersen and Morris, 2003). No definite diagnostic test is currently available to detect MCI (Albert et al., 2011). Therefore, more research is required to address the gaps in our understanding of MCI.
Scientific evidence suggests that MCI and AD affect several regions in the cortex (Reitz et al., 2011).Therefore, brain activity will be modified to some extent. Electroencephalographic (EEG) and magnetoencephalographic (MEG) recordings are
useful to describe abnormal neurooscillatory activity. There exist some differences between EEG and MEG oscillations. MEG recordings are reference free and are less affected by the volume conduction when compared to EEG rhtyms (Stam, 2010). Even some studies suggest that MEG might be more sensitive to measure the cortical activity than scalp EEG (Stam, 2010). As a consequence, they reflect slightly different features (Rampp and Stefan, 2007).
Several MEG studies have addressed the characterization of spontaneous brain oscillations in AD (Stam, 2010). Nevertheless, only a few studies have focused on MCI. Spectral and non-linear MEG studies found subtle differences between MCI and control subjects (Bruña et al., 2012; Escudero et al., 2011; Fernández et al., 2006, 2010; Gómez et al., 2009). Their results showed that MCI subjects exhibit intermediate abnormalities between AD patients and elderly controls. However, further efforts are needed to appropriately characterize abnormal brain dynamics in MCI.
721
In this study, we applied a new method to characterize MEG rhythms in MCI. The proposed parameter is based on the continous wavelet transform (CWT), which provides an alternative description to conventional spectral and non-linear measures. Thus, the wavelet turbulence (WT) was used to explore the irregularity of MEGs in terms of the degree of similarity among adjacent wavelet decompositions. The WT provides an alternative way to characterize the irregularity in comparison to previously applied spectral and non-linear methods. Therefore, the aims of this study were: (i) to analyze the irregularity patterns based on a new parameter, (ii) to describe the abnormalities of MCI in comparison to cognitive decline in normal aging, and (iii) to introduce an alternative framework to understand brain dynamics.
2 MATERIALS
2.1 Subjects
MEG signals from forty-five subjects were recorded at the “Centro de Magnetoencefalografía Dr. Pérez-Modrego” (Complutense University of Madrid, Spain). Eighteen subjects (8 men and 10 women, age = 74.9 ± 5.6 years, mean ± standard deviation M ± SD) were MCI patients derived from the “Asociación de Familiares de Enfermos de Alzheimer”. Diagnoses were made following Petersen’s criteria (Petersen et al., 2001). The cognitive and functional deficits were assessed using the Mini-Mental State Examination (MMSE) and the Functional Assessment Staging (FAST). MCI subjects obtained mean scores of 25.7 ± 1.8 and 3.0 ± 0.0 on the MMSE and FAST, respectively. None of these MCI patients suffered from any other significant medical, neurological or psychiatric disorder.
Twenty-seven healthy subjects (11 men and 16 women, age = 71.5 ± 6.2 years, M ± SD) participated in the study as a control group. They were cognitively normal elderly controls with no history of neurological or psychiatric disorders. Mean MMSE and FAST scores were 29.0 ± 1.2 and 1.6 ± 0.5, respectively.
None of the subjects was taking drugs that could affect MEG activity at the recording time. Mean age and gender were not significantly different for MCI subjects and controls (p > 0.05, Mann-Whitney U-test). All healthy volunteers and caregivers of patients accepted to participate in the study and gave their written informed consent. The research was
approved by the Research Ethics Committee of the center.
2.2 Meg Recording
MEG signals were obtained using a 148-channel whole-head magnetometer (MAGNES 2500 WH, 4D Neuroimaging, San Diego, CA), placed in a magnetically shielded room in the “Centro de Magnetoencefalografía Dr. Pérez Modrego”. During recordings participants were asked to remain awake, relaxed and with their eyes closed, in order to minimize the presence of artifacts. Five minutes of spontaneous MEG activity were acquired for each subject with a sampling rate of 678.17 Hz. A 0.1-200 Hz hardware band-pass filter and a 50 Hz notch filter were applied. Each MEG recording was downsampled by a factor of four to reduce the data length. Artifact-free epochs of 10 s (26.6 ± 5.8 artifact-free epochs per channel and subject, M ± SD) were selected for further analysis. Prior to calculation of parameters, MEG signals were processed using a finite impulse response (FIR) filter designed with a Hamming window and cut-off frequencies at 1 and 70 Hz.
3 METHODS
3.1 Continuous Wavelet Transform
Electromagnetic brain signals are non-stationary biomedical recordings (Blanco et al., 1995). In order to accurately characterize their spectral time-varying properties, non-stationary signal analysis techniques are required. There exist different time-frequency representations, like the widely used short-time Fourier transform (STFT). However, electromagnetic brain signals show high frequency and short time patterns, or low frequency and long time oscillations (Figliola and Serrano, 1997). Therefore, it should be appropriate to use time-frequency representations with a variable time-frequency resolution. This is the case of the wavelet transform, which provides a good time resolution at high frequencies and a good frequency resolution at low frequencies (Figliola and Serrano, 1997).
In this study, the time-frequency (or time-scale) maps were computed for each 10 s MEG epoch (x(t)) using the CWT with the real Morlet wavelet as,
,1
),(
dts
kttx
sskCWT (1)
IJCCI�2012�-�International�Joint�Conference�on�Computational�Intelligence
722
where ψ(k) is the “mother” wavelet, s is the scaling factor and * denotes the complex conjugate. The wavelet analysis was carried out for scales [1:128] to include the 1-70 Hz frequency range. Scales 1 and 128 were discarded from analysis, since they are out of the considered bandwidth.
As previously mentioned, the “mother” wavelet was the real Morlet wavelet. Previous EEG studies have recommended the use of the complex Morlet wavelet (Vialatte et al., 2011). Nevertheless, in this preliminary analysis we selected the simplest Morlet wavelet as a first step to characterize the spectral content of MEG recordings. Its definition can be read as,
,5cos22
kekk
(2)
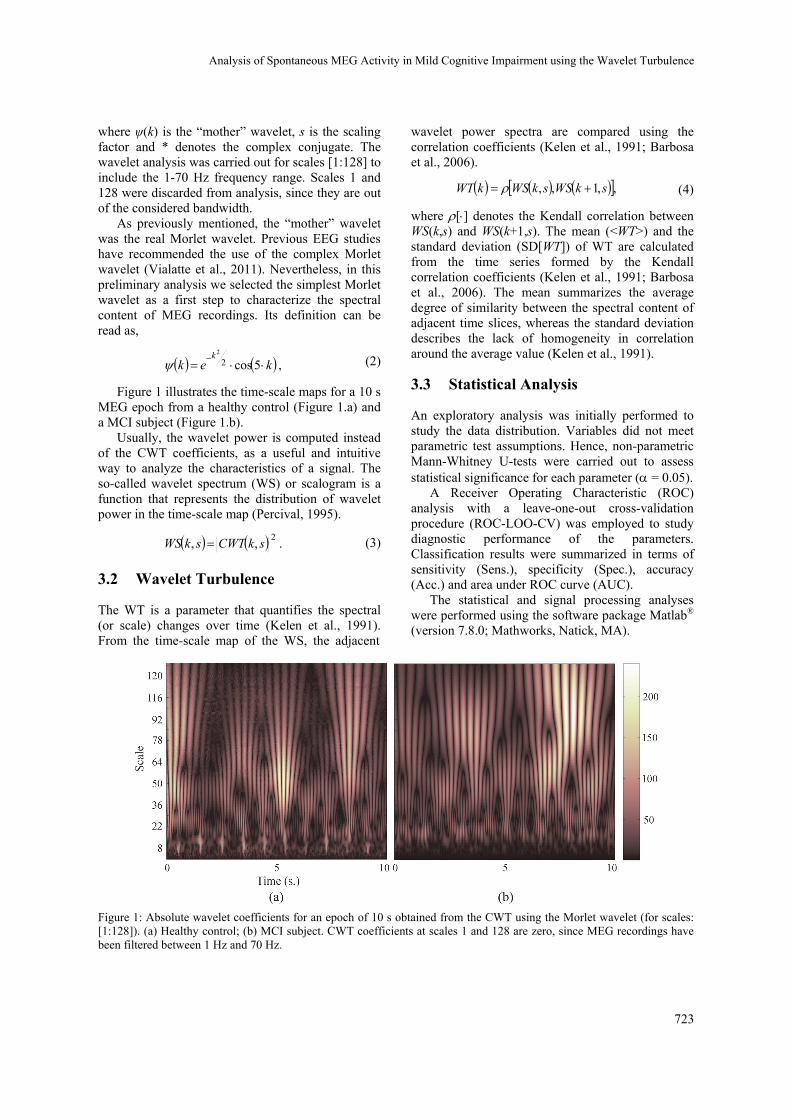
Figure 1 illustrates the time-scale maps for a 10 s MEG epoch from a healthy control (Figure 1.a) and a MCI subject (Figure 1.b).
Usually, the wavelet power is computed instead of the CWT coefficients, as a useful and intuitive way to analyze the characteristics of a signal. The so-called wavelet spectrum (WS) or scalogram is a function that represents the distribution of wavelet power in the time-scale map (Percival, 1995).
.,,2
skCWTskWS (3)
3.2 Wavelet Turbulence
The WT is a parameter that quantifies the spectral (or scale) changes over time (Kelen et al., 1991). From the time-scale map of the WS, the adjacent
wavelet power spectra are compared using the correlation coefficients (Kelen et al., 1991; Barbosa et al., 2006).
,,1,, skWSskWSkWT (4)
where [] denotes the Kendall correlation between WS(k,s) and WS(k+1,s). The mean (<WT>) and the standard deviation (SD[WT]) of WT are calculated from the time series formed by the Kendall correlation coefficients (Kelen et al., 1991; Barbosa et al., 2006). The mean summarizes the average degree of similarity between the spectral content of adjacent time slices, whereas the standard deviation describes the lack of homogeneity in correlation around the average value (Kelen et al., 1991).
3.3 Statistical Analysis
An exploratory analysis was initially performed to study the data distribution. Variables did not meet parametric test assumptions. Hence, non-parametric Mann-Whitney U-tests were carried out to assess statistical significance for each parameter ( = 0.05).
A Receiver Operating Characteristic (ROC) analysis with a leave-one-out cross-validation procedure (ROC-LOO-CV) was employed to study diagnostic performance of the parameters. Classification results were summarized in terms of sensitivity (Sens.), specificity (Spec.), accuracy (Acc.) and area under ROC curve (AUC).
The statistical and signal processing analyses were performed using the software package Matlab® (version 7.8.0; Mathworks, Natick, MA).
Figure 1: Absolute wavelet coefficients for an epoch of 10 s obtained from the CWT using the Morlet wavelet (for scales: [1:128]). (a) Healthy control; (b) MCI subject. CWT coefficients at scales 1 and 128 are zero, since MEG recordings have been filtered between 1 Hz and 70 Hz.
Analysis�of�Spontaneous�MEG�Activity�in�Mild�Cognitive�Impairment�using�the�Wavelet�Turbulence
723
4 RESULTS AND DISCUSSION
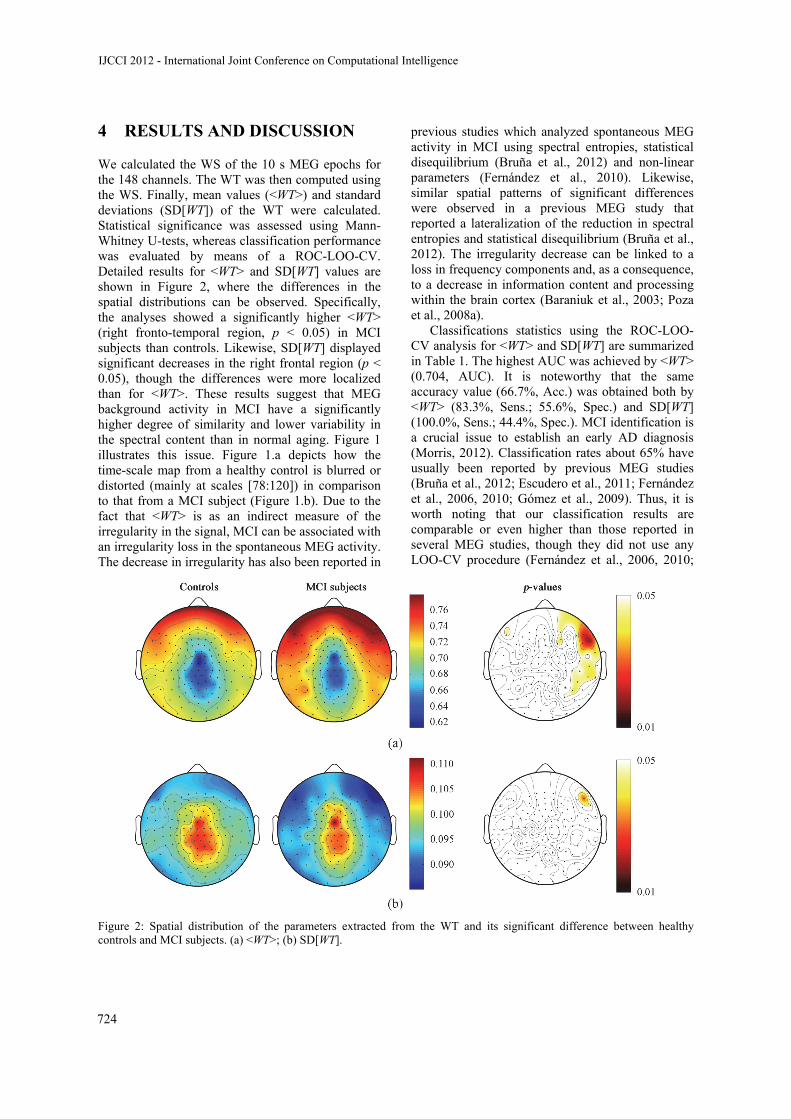
We calculated the WS of the 10 s MEG epochs for the 148 channels. The WT was then computed using the WS. Finally, mean values (<WT>) and standard deviations (SD[WT]) of the WT were calculated. Statistical significance was assessed using Mann-Whitney U-tests, whereas classification performance was evaluated by means of a ROC-LOO-CV. Detailed results for <WT> and SD[WT] values are shown in Figure 2, where the differences in the spatial distributions can be observed. Specifically, the analyses showed a significantly higher <WT> (right fronto-temporal region, p < 0.05) in MCI subjects than controls. Likewise, SD[WT] displayed significant decreases in the right frontal region (p < 0.05), though the differences were more localized than for <WT>. These results suggest that MEG background activity in MCI have a significantly higher degree of similarity and lower variability in the spectral content than in normal aging. Figure 1 illustrates this issue. Figure 1.a depicts how the time-scale map from a healthy control is blurred or distorted (mainly at scales [78:120]) in comparison to that from a MCI subject (Figure 1.b). Due to the fact that <WT> is as an indirect measure of the irregularity in the signal, MCI can be associated with an irregularity loss in the spontaneous MEG activity. The decrease in irregularity has also been reported in
previous studies which analyzed spontaneous MEG activity in MCI using spectral entropies, statistical disequilibrium (Bruña et al., 2012) and non-linear parameters (Fernández et al., 2010). Likewise, similar spatial patterns of significant differences were observed in a previous MEG study that reported a lateralization of the reduction in spectral entropies and statistical disequilibrium (Bruña et al., 2012). The irregularity decrease can be linked to a loss in frequency components and, as a consequence, to a decrease in information content and processing within the brain cortex (Baraniuk et al., 2003; Poza et al., 2008a).
Classifications statistics using the ROC-LOO-CV analysis for <WT> and SD[WT] are summarized in Table 1. The highest AUC was achieved by <WT> (0.704, AUC). It is noteworthy that the same accuracy value (66.7%, Acc.) was obtained both by <WT> (83.3%, Sens.; 55.6%, Spec.) and SD[WT] (100.0%, Sens.; 44.4%, Spec.). MCI identification is a crucial issue to establish an early AD diagnosis (Morris, 2012). Classification rates about 65% have usually been reported by previous MEG studies (Bruña et al., 2012; Escudero et al., 2011; Fernández et al., 2006, 2010; Gómez et al., 2009). Thus, it is worth noting that our classification results are comparable or even higher than those reported in several MEG studies, though they did not use any LOO-CV procedure (Fernández et al., 2006, 2010;
Figure 2: Spatial distribution of the parameters extracted from the WT and its significant difference between healthy controls and MCI subjects. (a) <WT>; (b) SD[WT].
IJCCI�2012�-�International�Joint�Conference�on�Computational�Intelligence
724
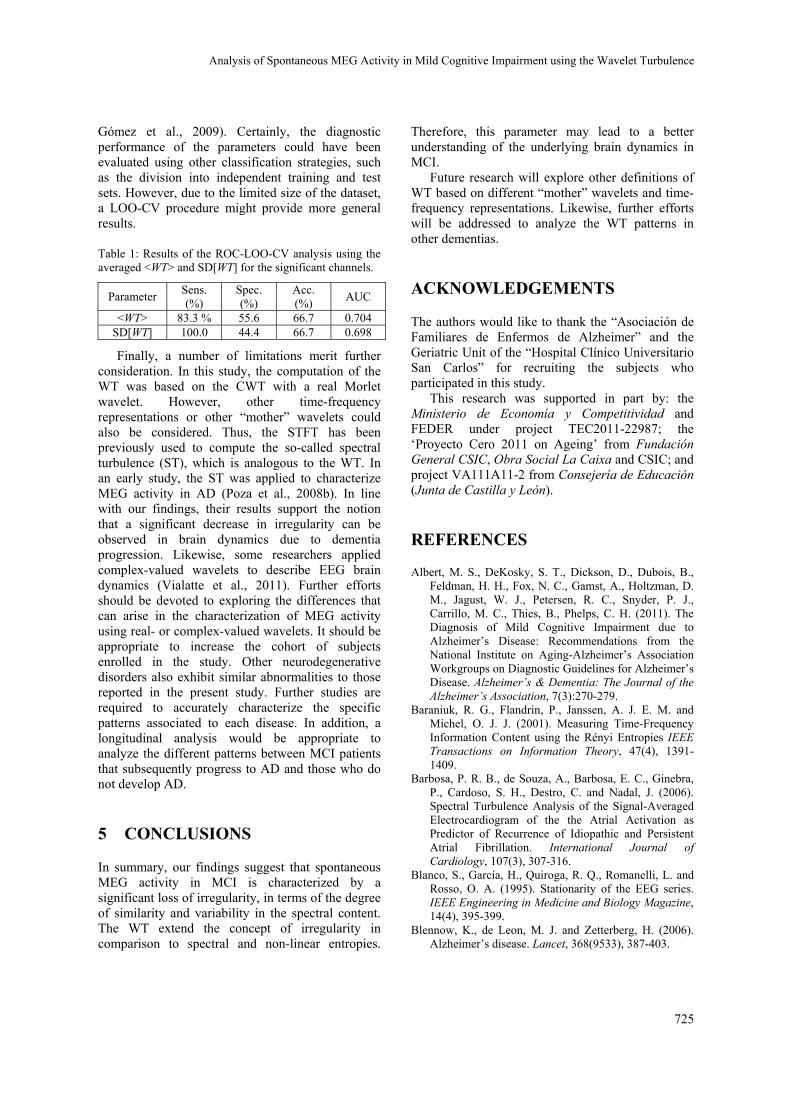
Gómez et al., 2009). Certainly, the diagnostic performance of the parameters could have been evaluated using other classification strategies, such as the division into independent training and test sets. However, due to the limited size of the dataset, a LOO-CV procedure might provide more general results.
Table 1: Results of the ROC-LOO-CV analysis using the averaged <WT> and SD[WT] for the significant channels.
Parameter Sens. (%)
Spec. (%)
Acc. (%)
AUC
<WT> 83.3 % 55.6 66.7 0.704 SD[WT] 100.0 44.4 66.7 0.698
Finally, a number of limitations merit further consideration. In this study, the computation of the WT was based on the CWT with a real Morlet wavelet. However, other time-frequency representations or other “mother” wavelets could also be considered. Thus, the STFT has been previously used to compute the so-called spectral turbulence (ST), which is analogous to the WT. In an early study, the ST was applied to characterize MEG activity in AD (Poza et al., 2008b). In line with our findings, their results support the notion that a significant decrease in irregularity can be observed in brain dynamics due to dementia progression. Likewise, some researchers applied complex-valued wavelets to describe EEG brain dynamics (Vialatte et al., 2011). Further efforts should be devoted to exploring the differences that can arise in the characterization of MEG activity using real- or complex-valued wavelets. It should be appropriate to increase the cohort of subjects enrolled in the study. Other neurodegenerative disorders also exhibit similar abnormalities to those reported in the present study. Further studies are required to accurately characterize the specific patterns associated to each disease. In addition, a longitudinal analysis would be appropriate to analyze the different patterns between MCI patients that subsequently progress to AD and those who do not develop AD.
5 CONCLUSIONS
In summary, our findings suggest that spontaneous MEG activity in MCI is characterized by a significant loss of irregularity, in terms of the degree of similarity and variability in the spectral content. The WT extend the concept of irregularity in comparison to spectral and non-linear entropies.
Therefore, this parameter may lead to a better understanding of the underlying brain dynamics in MCI.
Future research will explore other definitions of WT based on different “mother” wavelets and time-frequency representations. Likewise, further efforts will be addressed to analyze the WT patterns in other dementias.
ACKNOWLEDGEMENTS
The authors would like to thank the “Asociación de Familiares de Enfermos de Alzheimer” and the Geriatric Unit of the “Hospital Clínico Universitario San Carlos” for recruiting the subjects who participated in this study.
This research was supported in part by: the Ministerio de Economía y Competitividad and FEDER under project TEC2011-22987; the ‘Proyecto Cero 2011 on Ageing’ from Fundación General CSIC, Obra Social La Caixa and CSIC; and project VA111A11-2 from Consejería de Educación (Junta de Castilla y León).
REFERENCES
Albert, M. S., DeKosky, S. T., Dickson, D., Dubois, B., Feldman, H. H., Fox, N. C., Gamst, A., Holtzman, D. M., Jagust, W. J., Petersen, R. C., Snyder, P. J., Carrillo, M. C., Thies, B., Phelps, C. H. (2011). The Diagnosis of Mild Cognitive Impairment due to Alzheimer’s Disease: Recommendations from the National Institute on Aging-Alzheimer’s Association Workgroups on Diagnostic Guidelines for Alzheimer’s Disease. Alzheimer’s & Dementia: The Journal of the Alzheimer’s Association, 7(3):270-279.
Baraniuk, R. G., Flandrin, P., Janssen, A. J. E. M. and Michel, O. J. J. (2001). Measuring Time-Frequency Information Content using the Rényi Entropies IEEE Transactions on Information Theory, 47(4), 1391-1409.
Barbosa, P. R. B., de Souza, A., Barbosa, E. C., Ginebra, P., Cardoso, S. H., Destro, C. and Nadal, J. (2006). Spectral Turbulence Analysis of the Signal-Averaged Electrocardiogram of the the Atrial Activation as Predictor of Recurrence of Idiopathic and Persistent Atrial Fibrillation. International Journal of Cardiology, 107(3), 307-316.
Blanco, S., García, H., Quiroga, R. Q., Romanelli, L. and Rosso, O. A. (1995). Stationarity of the EEG series. IEEE Engineering in Medicine and Biology Magazine, 14(4), 395-399.
Blennow, K., de Leon, M. J. and Zetterberg, H. (2006). Alzheimer’s disease. Lancet, 368(9533), 387-403.
Analysis�of�Spontaneous�MEG�Activity�in�Mild�Cognitive�Impairment�using�the�Wavelet�Turbulence
725
Bruña, R., Poza, J., Gómez, C., Fernández, A., García, M. and Hornero, R. (2012). Analysis of Spontaneous MEG Activity in Mild Cognitive Impairment and Alzheimer’s Disease using Spectral Entropies and Statistical Complexity Measures. Journal of Neural Engineering, 9(3), 036007.
Escudero, J., Sanei, S., Jarchi, D., Abásolo, D. and Hornero, R. (2011). Regional Coherence Evaluation in Mild Cognitive Impairment and Alzheimer’s Disease based on Adaptively Extracted Magnetoencephalogram Rhythms. Physiological Measurement, 32(8), 1163-1180.
Fernández, A., Hornero, R., Mayo, A., Poza, J., Gil-Gregorio, P. and Ortiz, T. (2006). MEG Spectral Profile in Alzheimer’s Disease and Mild Cognitive Impairment. Clinical Neurophysiology, 117(2), 306-314.
Fernández, A., Hornero, R., Gómez, C., Turrero, A., Gil-Gregorio, P., Matías-Santos, J. and Ortiz, T. (2010). Complexity Analysis of Spontaneous Brain Activity in Alzheimer’s Disease and Mild Cognitive Impairment: an MEG Study. Alzheimer Disease and Associated Disorders, 24(2) 182-189.
Figliola, A. and Serrano, E. (1997). Analysis of Physiological Time Series using Wavelet Transforms. IEEE Engineering in Medicine and Biology Magazine, 16(3), 74-79.
Gómez, C., Stam, C. J., Hornero, R., Fernández, A. and Maestú, F. (2009). Disturbed Beta Band Functional Connectivity in Patients with Mild Cognitive Impairment: an MEG Study. IEEE Transactions on Biomedical Engineering, 56(6), 1683-1690.
Kelen, G. J., Henkin, R., Starr, A. M., Caref, E. B., Bloomfield, D. and el-Sherif, N. (1991). Spectral Turbulence Analysis of the Signal-Averaged Electrocardiogram and its Predictive Accuracy for Inducible Sustained Monomorphic Ventricular Tachycardia. American Journal of Cardiology, 67(11), 965-975.
Morris, J. C. (2012). Revised Criteria for Mild Cognitive Impairment May Compromise the Diagnosis of Alzheimer Disease Dementia. Achives of Neurology, 69(6), 700-708.
Percival, D. B. (1995). On Estimation of the Wavelet Variance. Biometrika, 82(3), 619-631.
Petersen, R. C., Doody, R., Kurz, A., Mohs, R. C., Morris, J. C., Rabins, P. V., Ritchie, K., Rossor, M., Thal, L. and Winblad, B. (2001). Current Concepts in Mild Cognitive Impairment. Archives of Neurology, 58(12), 1985-1992.
Petersen, R. C. and Morris, J. C. (2003). Conceptual Overview. In Petersen, R. C. (Ed.), Mild Cognitive Impairment: Aging to Alzheimer’s Disease (pp. 1-14). New York: Oxford University Press.
Poza, J., Escudero, J., Hornero, R., Fernández, A. and Sanchez, C. I. (2008a). Regional Analysis of Spontaneous MEG Rhythms in Patients with Alzheimer’s Disease using Spectral Entropies. Annals of Biomedical Engineering, 36(1), 141-152.
Poza, J., Hornero, R., Escudero, J., Fernández, A. and Gómez, C. (2008b). Analysis of Spontaneous MEG Activity in Alzheimer’s Disease using Time-Frequency Parameters. In IEEE-EMBC’08 30th Annual International Conference of the IEEE Engineering in Medicine and Biology Society, pp. 5712-5715.
Rampp, S. and Stefan, H. (2007). On the Opposition of EEG and MEG. Clinical Neurophysiology, 118(8), 1658-1659.
Reitz, C., Brayne, C. and Mayeux, R. (2011). Epidemiology of Alzheimer Disease. Nature Reviews. Neurology, 7(3), 137-52.
Stam, C. J. (2010). Use of Magnetoencephalography (MEG) to Study Functional Brain Networks in Neurodegenerative Disorders. Journal of the Neurological Sciences, 289(1-2), 128–134.
Vialatte, F. B., Dauwels, J., Maurice, M., Musha, T. and Cichocki, A. (2011) Improving the Specificity of EEG for diagnosing Alzheimer’s Disease. International Journal of Alzheimer’s Disease, 2011, 259069.
IJCCI�2012�-�International�Joint�Conference�on�Computational�Intelligence
726
Copyright © 2022 FDOKUMEN