An MEG compatible system for measuring skin conductance responses
10
Journal of Neuroscience Methods 212 (2013) 114–123 Contents lists available at SciVerse ScienceDirect Journal of Neuroscience Methods journa l h omepa g e: www.elsevier.com/locate/jneumeth Basic Neuroscience An MEG compatible system for measuring skin conductance responses Charalampos Styliadis a,1 , Christos Papadelis b,∗,1 , Evdokimos Konstantinidis a , Andreas A. Ioannides c , Panagiotis Bamidis a a Laboratory of Medical Informatics, School of Medicine, Aristotle University of Thessaloniki, P.O. Box 323, 54124 Thessaloniki, Greece b Department of Neurology, Children’s Hospital Boston, Harvard Medical School, 9 Hope Av., 02453 Waltham, USA c Laboratory for Human Brain Dynamics, AAI Scientific Cultural Services Ltd., Office 501, Galaxias Building Block A, 33 Arch. Makarios III Avenue, 1065 Nicosia, Cyprus h i g h l i g h t s Magnetoencephalography compati- ble low-cost system for monitoring skin conductance responses in the magnetically shielded room. The system allows high quality simultaneous recordings of SCRs and MEG signals. Its implementation calls for limited knowledge in electronics due to its simplicity. g r a p h i c a l a b s t r a c t a r t i c l e i n f o Article history: Received 15 May 2012 Received in revised form 18 September 2012 Accepted 22 September 2012 Keywords: Skin conductance response (SCR) system Magnetoencephalography (MEG) Magnetically shielded room (MSR) a b s t r a c t We present the design of a low-cost system for recording galvanic skin conductance responses (SCRs) from humans in a magnetically shielded room (MSR) simultaneously to magnetoencephalography (MEG). Such a system was so far not available to the MEG community. Its availability is of utmost importance for neuroscience, since it will allow the concurrent assessment of the autonomic and central nervous system activity. The overall system design optimizes high signal to noise ratio (SNR) of SCRs and achieves minimal distortion of the MEG signal. Its development was based on a fiber-optic transformer, with voltage to optical transduction inside the MSR and demodulation outside the MSR. The system was calibrated and tested inside the MEG environment by using a 151-channel CTF whole head system (VSM MedTech Ltd.). MEG measurements were recorded simultaneously to SCRs from five healthy participants to test whether the developed system does not generate artifacts in the MEG data. Two measurements were performed for each participant; one without the system in the MSR, and one with the system in the MSR, connected to the participant and in operation. The data were analyzed using the time and frequency domains in separate statistical analysis. No significant differences were observed between the two sessions for any statistic index. Our results show that the system allows high quality simultaneous recordings of SCRs and MEG signals in the MSR, and can therefore be used as routine addendum to neuroscience experiments. © 2012 Elsevier B.V. All rights reserved. Abbreviations: SCRs, skin conductance responses; MSR, magnetically shielded room; SNS, sympathetic nervous system; ERPs, event-related potentials; MR, magnetic resonance; RF, radio-frequency; PSD, Power Spectral Density; SK, spectral kurtosis; VCO, voltage-controlled oscillator; EOG, Electrooculographic; ECG, electrocardiographic; MTM, Multitaper Method; GFP, global field power; IAPS, International Affective Picture System; PHA, pleasant and high arousing; PLA, pleasant and low arousing; UHA, unpleasant and high arousing; ULA, unpleasant and low arousing; SAM, Synthetic Aperture Magnetometry; IPF, inferior parietal lobule; TP, temporal pole; MNI, Montreal Neurological Institute. ∗ Corresponding author at: Baby MEG/EEG Facility, Department of Neurology, Children’s Hospital Boston, Harvard Medical School, 9 Hope Av., 02453 Waltham, USA. Tel.: +1 781 216 1128; fax: +1 781 216 1172. E-mail address: [email protected] (C. Papadelis). 1 Shared first authorship. 0165-0270/$ – see front matter © 2012 Elsevier B.V. All rights reserved. http://dx.doi.org/10.1016/j.jneumeth.2012.09.026
Transcript of An MEG compatible system for measuring skin conductance responses

B
A
CAa
b
c
h
�
�
�
a
ARR1A
KSMM
rMuN
U
0h
Journal of Neuroscience Methods 212 (2013) 114– 123
Contents lists available at SciVerse ScienceDirect
Journal of Neuroscience Methods
journa l h omepa g e: www.elsev ier .com/ locate / jneumeth
asic Neuroscience
n MEG compatible system for measuring skin conductance responses
haralampos Styliadisa,1, Christos Papadelisb,∗,1, Evdokimos Konstantinidisa,ndreas A. Ioannidesc, Panagiotis Bamidisa
Laboratory of Medical Informatics, School of Medicine, Aristotle University of Thessaloniki, P.O. Box 323, 54124 Thessaloniki, GreeceDepartment of Neurology, Children’s Hospital Boston, Harvard Medical School, 9 Hope Av., 02453 Waltham, USALaboratory for Human Brain Dynamics, AAI Scientific Cultural Services Ltd., Office 501, Galaxias Building Block A, 33 Arch. Makarios III Avenue, 1065 Nicosia, Cyprus
i g h l i g h t s
Magnetoencephalography compati-ble low-cost system for monitoringskin conductance responses in themagnetically shielded room.The system allows high qualitysimultaneous recordings of SCRs andMEG signals.Its implementation calls for limitedknowledge in electronics due to itssimplicity.
g r a p h i c a l a b s t r a c t
r t i c l e i n f o
rticle history:eceived 15 May 2012eceived in revised form8 September 2012ccepted 22 September 2012
eywords:kin conductance response (SCR) systemagnetoencephalography (MEG)agnetically shielded room (MSR)
a b s t r a c t
We present the design of a low-cost system for recording galvanic skin conductance responses (SCRs)from humans in a magnetically shielded room (MSR) simultaneously to magnetoencephalography (MEG).Such a system was so far not available to the MEG community. Its availability is of utmost importance forneuroscience, since it will allow the concurrent assessment of the autonomic and central nervous systemactivity. The overall system design optimizes high signal to noise ratio (SNR) of SCRs and achieves minimaldistortion of the MEG signal. Its development was based on a fiber-optic transformer, with voltage tooptical transduction inside the MSR and demodulation outside the MSR. The system was calibrated andtested inside the MEG environment by using a 151-channel CTF whole head system (VSM MedTech Ltd.).MEG measurements were recorded simultaneously to SCRs from five healthy participants to test whether
the developed system does not generate artifacts in the MEG data. Two measurements were performedfor each participant; one without the system in the MSR, and one with the system in the MSR, connectedto the participant and in operation. The data were analyzed using the time and frequency domains inseparate statistical analysis. No significant differences were observed between the two sessions for anystatistic index. Our results show that the system allows high quality simultaneous recordings of SCRs andand c
MEG signals in the MSR,Abbreviations: SCRs, skin conductance responses; MSR, magnetically shielded roomesonance; RF, radio-frequency; PSD, Power Spectral Density; SK, spectral kurtosis; VCO, vTM, Multitaper Method; GFP, global field power; IAPS, International Affective Picture
npleasant and high arousing; ULA, unpleasant and low arousing; SAM, Synthetic Aperteurological Institute.∗ Corresponding author at: Baby MEG/EEG Facility, Department of Neurology, ChildrenSA. Tel.: +1 781 216 1128; fax: +1 781 216 1172.
E-mail address: [email protected] (C. Papadelis).1 Shared first authorship.
165-0270/$ – see front matter © 2012 Elsevier B.V. All rights reserved.ttp://dx.doi.org/10.1016/j.jneumeth.2012.09.026
an therefore be used as routine addendum to neuroscience experiments.
© 2012 Elsevier B.V. All rights reserved.; SNS, sympathetic nervous system; ERPs, event-related potentials; MR, magneticoltage-controlled oscillator; EOG, Electrooculographic; ECG, electrocardiographic;
System; PHA, pleasant and high arousing; PLA, pleasant and low arousing; UHA,ure Magnetometry; IPF, inferior parietal lobule; TP, temporal pole; MNI, Montreal
’s Hospital Boston, Harvard Medical School, 9 Hope Av., 02453 Waltham,

scienc
1
ppocchSisas2o
abbrt
taft2Mbrmp(ersd
wToaaMioTBaposaEsrpctt
crTp
C. Styliadis et al. / Journal of Neuro
. Introduction
In response to different kinds of stimuli, part of the human sym-athetic nervous system (SNS) is activated filling up the palmar andlantar sweat glands and as a consequence resulting in alterationsf the human skin electrical properties (Boucsein, 1992). These skinonductance changes, termed skin conductance responses (SCRs),an easily be recorded via a pair of electrodes usually placed on theand digits of a human participant. The temporal features of theCR are well characterized with an onset latency of 1.5 s and a risen skin conductivity thereafter that is proportional to the degree ofynchronization of sweat gland secretions (Lim et al., 2003). SCRsre frequently used in neuroscience research as an indirect mea-ure of human’s emotional arousal (Bernat et al., 2006; Ohira et al.,006; Lithari et al., 2010), level of attention (Critchley et al., 2000),r learning (MacIntosh et al., 2007).
Neuroscience studies of concurrent central and autonomicctivity are considered useful in elucidating the relationshipetween central and autonomic responses. Traditionally, SCRs haveeen studied in conjunction with event-related potentials (ERPs)ecorded by electroencephalography (EEG) that provide excellentemporal but limited spatial resolution.
Over the years, magnetoencephalography (MEG) has proveno be a reliable neuroimaging tool in studying electro-magneticctivity in the cortex (Hamalainen et al., 1993) offering – underavorable circumstances – a good spatial resolution of few millime-ers (Yamamoto et al., 1988; Moradi et al., 2003; Papadelis et al.,009, 2011) in addition to its sub-millisecond temporal resolution.EG measures the weak (10 fT–1 pT) magnetic fields produced
y neuronal currents in the human brain. Since the brain neu-omagnetic signals are extremely weak compared with ambientagnetic-field variations, MEG requires the measurements to be
erformed within specially designed magnetically shielded roomsMSRs). This technical requirement makes problematic the use oflectrical devices placed in the MSR and thus the simultaneousecording of MEG signal and SCRs. Electronic devices need to behielded, since otherwise will generate severe technical artifactsistorting the MEG signal.
Since now, there is no well-established methodological frame-ork allowing the simultaneous acquisition of SCR with MEG.
he literature reporting such kind of measurements is limited tonly a single study (Seth et al., 2006), in which technical issuesre not addressed in detail. This article addresses the technicalspects of monitoring SCR on human participants in the MSR duringEG measurements. The work presented here realizes in part the
deas and directions set in collaboration between the Laboratoryf Medical Informatics, School of Medicine, Aristotle University ofhessaloniki and the Laboratory for Human Brain Dynamics at therain Science Institute, RIKEN (1998–2009) and its continuationt the AAI Scientific Cultural Services Ltd. in Cyprus. The princi-al goal of this collaboration was the design and implementationf a cheap and accurate measure of SCR that can be used both intudies with expensive state of the art MEG and fMRI equipmentnd in studies with simpler instrumentation, notably few-channelEG. The system is therefore ideal for studies of affect and emotion,erves the growing battery of neurophysiological measurementsequired and the human–computer interaction that may accom-any it (Bamidis et al., 2004). It is also ideal for measurements withhildren and patients under stressful tests where subtle features ofhe EEG response (Ioannides and Sargsyan, 2012) must be studiedogether with indices of arousal and anxiety levels.
To achieve these goals, we developed a low cost MEG-
ompatible system able to record SCRs with high signal to noiseatio (SNR) while not adversely distorting the MEG recordings.he design of our system was partially based on a device pro-osed by Shastri et al. (2001) for monitoring SCRs in a clinicale Methods 212 (2013) 114– 123 115
magnetic resonance (MR) scanner during functional imaging. Thisfunctional magnetic resonance imaging (fMRI)-compatible devicewas initially built and tested in a MEG experimental setup. It wasfound to be non-MEG compatible, since it generated severe techni-cal artifacts in the recorded MEG signal. To overcome this problem,a second MEG-compatible unit was designed and built employ-ing an optical isolation serving to the signal transduction betweenthe recording unit placed inside and the transforming unit placedoutside the MSR. The special feature of our system is the opticalisolation between the two units one placed inside and the otheroutside the MSR, which does not allow radio-frequency (RF) arti-facts to pass through the acquisition cable and interfere with theMEG recordings. A fiber-optic system for recording skin conduc-tance – similar to ours – was first proposed by Lagopoulos et al.(2005). However, this system was designed for use in fMRI servingits needs and not in an MEG setup. The main problem somebodyfaces when attempts to record electrophysiological data inside theMRI room and transmits these data outside, is the powerful alter-nating magnetic field environment that prohibits placing metalliccables and electrical components in close proximity to the magneticbore (Lagopoulos et al., 2005). Powerful RFs, which are present inthe MRI room, affect severely any conductive cable placed insidethe room that acts as a RF antenna. By placing a conductive cable inthe MRI scanner room in order to simultaneously record SCR, you(i) introduce artifacts in the MRI scanner, that severely compromisethe quality of the acquired images, and (ii) introduce strong artifactsto the recorded SCR signal from the magnetic gradients. The difficul-ties somebody faces when he/she would like to record SCR signalssimultaneously with MEG recordings are different. The presenceof a conductive cable inside the MSR that transmits the data inan external computer can bring RFs inside the room canceling themain purpose of the MSR to eliminate RFs radiation, which woulddegrade SQUID performance. Yet, the presence of any metallic andelectrical component in close proximity to the SQUIDs can severelyaffect the quality of the recorded MEG signal. In both setups, theoptical isolation will not allow RF artifacts to pass through theacquisition cable and interfere with the MEG recordings and dis-tort the MRI images respectively. Additionally, the optical fiber inthe MRI setup – compared to metallic cabling – is insensitive to themagnetic field of the scanner that may generate severe artifacts inthe SCR signal.
The development, calibration, and testing of our system aredescribed and discussed here by using techniques such as skewnessand kurtosis, Power Spectral Density (PSD) and the average spectralkurtosis (SK). Once the overall operation reached the required per-formance level the system was used in an experimental paradigmassessing the emotional processing of healthy human participants.
2. Materials and methods
2.1. Design of the MEG-compatible SCR system
The principal idea for measuring SCRs is to impose a constant DCvoltage across two Ag/AgCl electrodes and to measure the changesin the flow of current as a result of the skin conductivity alterations.The MEG-compatible SCR system consists of five integrated cir-cuits (Fig. 1). These were implemented within two separate units:the main recording unit placed inside the MSR and the demodu-lator unit that is placed outside the MSR. The main recording unitrecords, amplifies, filters and finally modulates the SCR data to opti-cal signal, while the demodulator unit converts the optical signal
to voltage. Both units are powered by batteries. The two units areconnected through a fiber optic connection in order to eliminatethe transfer of RF from outside the MSR inside distorting the MEGsignal with technical artifacts. The fiber-optic cable exits the MSR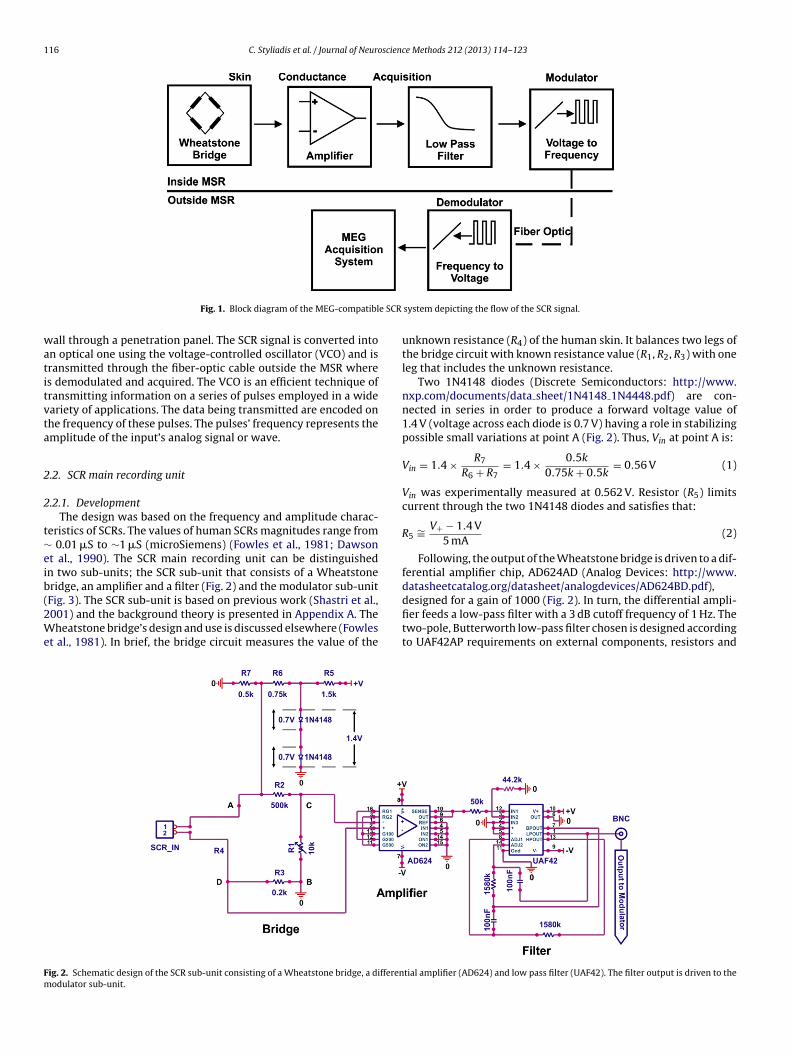
116 C. Styliadis et al. / Journal of Neuroscience Methods 212 (2013) 114– 123
e SCR
watitvta
2
2
t∼eib(2We
Fm
Fig. 1. Block diagram of the MEG-compatibl
all through a penetration panel. The SCR signal is converted inton optical one using the voltage-controlled oscillator (VCO) and isransmitted through the fiber-optic cable outside the MSR wheres demodulated and acquired. The VCO is an efficient technique ofransmitting information on a series of pulses employed in a wideariety of applications. The data being transmitted are encoded onhe frequency of these pulses. The pulses’ frequency represents themplitude of the input’s analog signal or wave.
.2. SCR main recording unit
.2.1. DevelopmentThe design was based on the frequency and amplitude charac-
eristics of SCRs. The values of human SCRs magnitudes range from 0.01 �S to ∼1 �S (microSiemens) (Fowles et al., 1981; Dawsont al., 1990). The SCR main recording unit can be distinguishedn two sub-units; the SCR sub-unit that consists of a Wheatstoneridge, an amplifier and a filter (Fig. 2) and the modulator sub-unit
Fig. 3). The SCR sub-unit is based on previous work (Shastri et al.,001) and the background theory is presented in Appendix A. Theheatstone bridge’s design and use is discussed elsewhere (Fowlest al., 1981). In brief, the bridge circuit measures the value of the
ig. 2. Schematic design of the SCR sub-unit consisting of a Wheatstone bridge, a differenodulator sub-unit.
system depicting the flow of the SCR signal.
unknown resistance (R4) of the human skin. It balances two legs ofthe bridge circuit with known resistance value (R1, R2, R3) with oneleg that includes the unknown resistance.
Two 1N4148 diodes (Discrete Semiconductors: http://www.nxp.com/documents/data sheet/1N4148 1N4448.pdf) are con-nected in series in order to produce a forward voltage value of1.4 V (voltage across each diode is 0.7 V) having a role in stabilizingpossible small variations at point A (Fig. 2). Thus, Vin at point A is:
Vin = 1.4 × R7
R6 + R7= 1.4 × 0.5k
0.75k + 0.5k= 0.56 V (1)
Vin was experimentally measured at 0.562 V. Resistor (R5) limitscurrent through the two 1N4148 diodes and satisfies that:
R5 ∼= V+ − 1.4 V5 mA
(2)
Following, the output of the Wheatstone bridge is driven to a dif-ferential amplifier chip, AD624AD (Analog Devices: http://www.datasheetcatalog.org/datasheet/analogdevices/AD624BD.pdf),
designed for a gain of 1000 (Fig. 2). In turn, the differential ampli-fier feeds a low-pass filter with a 3 dB cutoff frequency of 1 Hz. Thetwo-pole, Butterworth low-pass filter chosen is designed accordingto UAF42AP requirements on external components, resistors andtial amplifier (AD624) and low pass filter (UAF42). The filter output is driven to the

C. Styliadis et al. / Journal of Neuroscience Methods 212 (2013) 114– 123 117
n of th
cu(
qSl(chEcpp(LoQ
caci(oluutc
Ft
Fig. 3. Schematic desig
apacitors (Texas Instruments: http://www.ti.com/lit/ds/symlink/af42.pdf). Finally, the filter output is driven to the modulatorFig. 3).
The modulator sub-unit is actually an oscillator whose fre-uency is determined by a control voltage. The filter output of theCR sub-unit serves as the control voltage. The core of the modu-ator sub-unit is the integrator circuit that consists of U1 (CA3140)Intersil: http://www.intersil.com/data/fn/fn957.pdf) and theapacitor C1 (Fig. 3). The MOSFET Q1 (BF245) (Micro-Electronics:ttp://pdf1.alldatasheet.com/datasheet-pdf/view/75218/MICRO-LECTRONICS/BF245.html) is responsible for discharging theapacitor C1 and when combined with the integrator circuit, itroduces at the output stage a saw-tooth wave with a frequencyroportional to the input voltage level. The final stage U2 (LM709)National Semiconductor: http://www.ee.nsysu.edu.tw/lab/F6027/M709%20Operational%20Amplifiers.pdf) serves the pulse waveutput by modulating the saw-tooth wave output of the U1 and1 network.
Fig. 4 illustrates the SCR main recording unit that houses theircuits previously discussed. SCR signal inputs this unit through
separate electronic plate that consists of two electrodes that areonnected to the main unit via a Hi-Flex cable (combination of coax-al and twisted paired cables). There is one on/off switch. Two ledsred and green) on the top of the unit indicate the power conditionf the batteries. Moreover, a potentiometer (Fig. 2, R1) located at theeft side is used for the system’s calibration. The SCR main recording
nit has two outputs: one is a BNC output of the SCR that does notndergo voltage-to-frequency conversion; and the other output ishe modulator unit’s output that undergoes voltage-to-frequencyonversion and serves as input to the demodulator circuit. The twoig. 4. SCR main recording unit. The external view on the left depicts the actual unit as dhe components in use.
e modulator sub-unit.
outputs served the testing procedure so as to examine the effect ofthe modulation and demodulation on the SCR signal.
2.2.2. CalibrationIt is considered that the response of the skin and muscle tissue to
external and internal stimuli varies the conductance by several �S.Thus, correct calibration is required so as to ensure that the systemcan measure such subtle differences. The skin has electric proper-ties that change on the relatively short time scale of seconds andare closely related to psychological processes. Specifically, in orderto have this variable suppression calibrated, a 10-turn calibratedpotentiometer (R1) is used (Fig. 2). The purpose of the potentiome-ter is to balance the Wheatstone bridge according to the equation
R1
R2= R4
R3(3)
The background theory for the calibration is presented inAppendix B. Estimated values presented in Table B.1, highlight thatthe system’s main recording unit operates at good accuracy for themeans of measuring SCRs.
2.3. Demodulator unit
The design of the demodulator (Fig. 5) is based on theLM2917 Frequency to Voltage Converter (National Semiconductor:http://www.jaycar.com.au/images uploaded/LM2907.PDF). The
external components (C1 = 4.7 nF and R1 = 68 k) affect the outputvoltage (Vout) according to the input frequency (Fin) as followsVout = V+ × Fin × C1 × R1 × K (4)
eveloped, tested and used for our purposes. On the right, the internal view depicts

118 C. Styliadis et al. / Journal of Neuroscience Methods 212 (2013) 114– 123
Fig. 5. Schematic design of t
Fig. 6. Demodulator unit. The internal view depicts the components in use.
wtwo
scefcc
monitor participants’ eye movements, we placed one pair of EOGelectrodes 1 cm above and below the left eye (vertical movement)
Fmit
here V+ is the power voltage, Fin is the frequency of the pulsesransmitted by the main recording unit and K is the gain constanthich is usually 1.0 according to ICs specifications. The output stage
f the demodulator (CA3140) is considered as a buffer stage.Fig. 6 illustrates the demodulator unit. The unit has one on/off
witch and a led on the side of the unit that indicates the powerondition of the batteries. The unit has a fiber optic input adaptor forstablishing connection to the main recording unit and an outputor connecting the unit to the MEG acquisition system. The cable
onnecting the unit with the acquisition system is a shielded coaxialable with braided copper sheath.ig. 7. Configuration for the MEG/SCR system. (A) The participant sits comfortably in aniddle fingers are placed onto the sensors’ plate. (C) and (D) The SCR signal travels via the
nput of the optic transformation device. (E) Finally, the transformed signal is fed into tho make the data collection.
he demodulator unit.
3. Experimental
3.1. Testing and results
SCR testing took place at the Laboratory for Human BrainDynamics (1998–2009), Brain Science Institute (BSI), RIKEN, Japan.Magnetic fields were recorded using a 151-channel CTF whole headsystem (VSM MedTech Ltd., B.C., Canada) inside the MSR. The CTFMEG system is equipped with synthetic 3rd gradient balancing, anactive noise cancelation technique that uses a set of reference chan-nels to subtract background interference. For the means of testingour system in the MSR, five male participants were recruited.
MEG measurements were recorded simultaneously to SCRs soas to ensure that the developed MEG-compatible SCR system doesnot generate unacceptable high levels of noise in these measure-ments. Two measurements were performed for each participant;one without the unit in the MSR room, and one with the unit in theMSR room. In both measurements, participants were resting witheyes open fixating on a cross. Electrooculographic (EOG) and elec-trocardiographic (ECG) electrodes were placed on participants. To
and another pair 1 cm lateral to the left and right outer canthus ofthe eyes (horizontal movement).
upright position under the helmet-shaped base of the dewar. (B) The index and fiber-optic cable and as it is passed through the penetration panel it is fed into the
e external channel of the MEG acquisition system which allows the host computer
C. Styliadis et al. / Journal of Neuroscience Methods 212 (2013) 114– 123 119
Fa
pwlttwtuttp
qfiMb
tmaMtjOpiAtawasnS
StdtfM
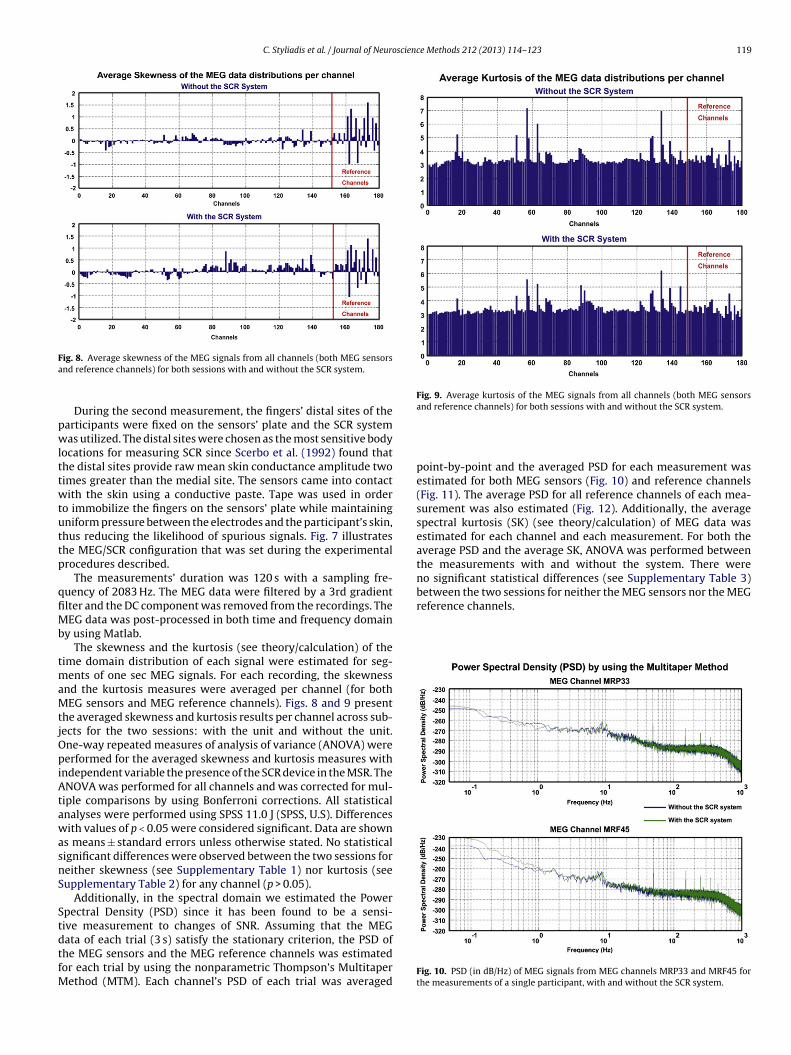
Fig. 9. Average kurtosis of the MEG signals from all channels (both MEG sensorsand reference channels) for both sessions with and without the SCR system.
ig. 8. Average skewness of the MEG signals from all channels (both MEG sensorsnd reference channels) for both sessions with and without the SCR system.
During the second measurement, the fingers’ distal sites of thearticipants were fixed on the sensors’ plate and the SCR systemas utilized. The distal sites were chosen as the most sensitive body
ocations for measuring SCR since Scerbo et al. (1992) found thathe distal sites provide raw mean skin conductance amplitude twoimes greater than the medial site. The sensors came into contactith the skin using a conductive paste. Tape was used in order
o immobilize the fingers on the sensors’ plate while maintainingniform pressure between the electrodes and the participant’s skin,hus reducing the likelihood of spurious signals. Fig. 7 illustrateshe MEG/SCR configuration that was set during the experimentalrocedures described.
The measurements’ duration was 120 s with a sampling fre-uency of 2083 Hz. The MEG data were filtered by a 3rd gradientlter and the DC component was removed from the recordings. TheEG data was post-processed in both time and frequency domain
y using Matlab.The skewness and the kurtosis (see theory/calculation) of the
ime domain distribution of each signal were estimated for seg-ents of one sec MEG signals. For each recording, the skewness
nd the kurtosis measures were averaged per channel (for bothEG sensors and MEG reference channels). Figs. 8 and 9 present
he averaged skewness and kurtosis results per channel across sub-ects for the two sessions: with the unit and without the unit.ne-way repeated measures of analysis of variance (ANOVA) wereerformed for the averaged skewness and kurtosis measures with
ndependent variable the presence of the SCR device in the MSR. TheNOVA was performed for all channels and was corrected for mul-
iple comparisons by using Bonferroni corrections. All statisticalnalyses were performed using SPSS 11.0 J (SPSS, U.S). Differencesith values of p < 0.05 were considered significant. Data are shown
s means ± standard errors unless otherwise stated. No statisticalignificant differences were observed between the two sessions foreither skewness (see Supplementary Table 1) nor kurtosis (seeupplementary Table 2) for any channel (p > 0.05).
Additionally, in the spectral domain we estimated the Powerpectral Density (PSD) since it has been found to be a sensi-ive measurement to changes of SNR. Assuming that the MEGata of each trial (3 s) satisfy the stationary criterion, the PSD of
he MEG sensors and the MEG reference channels was estimatedor each trial by using the nonparametric Thompson’s Multitaperethod (MTM). Each channel’s PSD of each trial was averaged
point-by-point and the averaged PSD for each measurement wasestimated for both MEG sensors (Fig. 10) and reference channels(Fig. 11). The average PSD for all reference channels of each mea-surement was also estimated (Fig. 12). Additionally, the averagespectral kurtosis (SK) (see theory/calculation) of MEG data wasestimated for each channel and each measurement. For both theaverage PSD and the average SK, ANOVA was performed betweenthe measurements with and without the system. There wereno significant statistical differences (see Supplementary Table 3)between the two sessions for neither the MEG sensors nor the MEGreference channels.
Fig. 10. PSD (in dB/Hz) of MEG signals from MEG channels MRP33 and MRF45 forthe measurements of a single participant, with and without the SCR system.

120 C. Styliadis et al. / Journal of Neuroscien
Fig. 11. PSD (in dB/Hz) of MEG signals from reference channels BG1 and BP1 for themeasurements of a single participant, with and without the SCR system.
Ft
4
macd1(s(tsy
s
ig. 12. Average PSD (in dB/Hz) of MEG signals from all the reference channels, forhe measurements of a single participant, with and without the SCR system.
. Theory/calculation
Usually, the characterization of a data set relies on estimates ofean and variance and it can be further characterized by skewness
nd kurtosis. Skewness is a measure of symmetry, or more pre-isely, the lack of symmetry. Kurtosis is a measure of whether theata are peaked or flat relative to a normal distribution (Mendel,991). Kurtosis provides a measure of distance to GaussianityCohen, 1986). Skewness and kurtosis are used to demonstratetatistical differences in the presence of high noise in a signal (SNR)Cohen, 1986). Based on these characteristics for the time domain,he effect of the SCR main recording unit interference in the MEGensors and reference signals was estimated. For univariate data y1,
2, y3, . . ., yn the formula of skewness (Brillinger, 1981) iskewness =∑N
i=1(yi − y)3
(N − 1)s3, (5)
ce Methods 212 (2013) 114– 123
where y is the mean of the data, s is the standard deviation, and Nis the number of samples. For univariate data y1, y2, y3, . . ., yn theformula of kurtosis (Brillinger, 1981) is
kurtosis =∑N
i=1(yi − y)4
(N − 1)s4, (6)
where y is the mean of the data, s is the standard deviation, and Nis the number of samples.
A fourth order spectral analysis tool named spectral kurtosis(SK) was also used in order to compare the harmonic content ofthe MEG signals obtained with and without the system. This toolprovides additional information with respect to classical secondorder spectral quantities (Dwyer, 1984). In the frequency domain,the spectral kurtosis (SK) of a signal is defined as the kurtosis of itsfrequency components. It is a powerful tool of detecting “randomlyoccurring” signals (Vrabie et al., 2003). In the case of finite lengthrandom process, the spectral kurtosis (SK) can be defined as
SKNx (m) = Cum[Xn(m), XN(m), X∗
N(m)X∗N(m)]
(Cum[XN(m), X∗N(m)])2
(7)
where XN(m) is a complex random variable given by the N-pointsDiscrete Fourier Transform (DFT) of XN(n)
The global field power (GFP) was estimated for each experi-mental condition and each participant allowing estimation of themajor components. GFP is a global and well-established quantifierof scalp field strength (Lehmann and Skrandies, 1980, 1984). It isestimated as the square root of the sum of squares of the magneticmeasurements over the sensors for each data point in the filteredand averaged epoch:
GFP = 1N
∗√
(sx2 ) (8)
where N is the number of sensors which measure the fields and Sx
is the mean magnetic field of all sensors.
5. Affective experiment
Simultaneous MEG/SCR recordings took place at the Laboratoryfor Human Brain Dynamics (1998–2009), Brain Science Institute(BSI), RIKEN, Japan using the same materials as those for its testing(see Section 3.1).
Our SCR system was tested within an affective experiment oftwelve healthy participants with normal or corrected to normalvisual acuity (7 males, mean age 30.8 ± 5.3, range 23–40 years, 5females mean age 27.8 ± 5.3, range 21–35 years). The study wasapproved by the host’s ethics committee and all participants gavewritten informed consent prior to participation. The methods andresults of this study will be published elsewhere.
Participants passively viewed pictures from the InternationalAffective Picture System (IAPS) collection (Lang et al., 1993) cate-gorized within four sets (pleasant and high arousing (PHA), pleasantand low arousing (PLA), unpleasant and high arousing (UHA) andunpleasant and low arousing (ULA)) that manipulated the level ofarousal within pleasant and unpleasant pictures (Cuthbert et al.,1996). The stimuli were presented centered on the screen in amixed fashion for 1 s after the appearance of a fixation cross cen-tered on the screen for a pseudo-randomized interval of 1.5 ± 0.2 s.
MEG recordings were filtered by a 3rd gradient filter and the DCcomponent was removed from the measurements. Also, these werefiltered by high-pass filtering at 2 Hz, low-pass filtering at 30 Hz,power-line notch filtering at 50 Hz and its harmonics. Following
was segmentation into epochs, each one lasting 1 s after the onsetof the stimuli according to the four conditions’ events (PHA, PLA,UHA, ULA), removal of the baseline for −0.3 to 0 s and averaging inrespect to the stimulus onset from −0.3 to 1 s.
C. Styliadis et al. / Journal of Neuroscienc
Faa
nVeg
ortc
a
FaNm
ig. 13. Simultaneous SCR and MEG recordings. (A) Grand average of SCRs for highnd low arousal. Stimulus onset was at 0 s. (B) Averaged MEG GFP activity for highnd low arousal. Stimulus onset was at 0 s.
Source activity was estimated by using a beamforming tech-ique, the Synthetic Aperture Magnetometry (SAM) (Robinson andrba, 1998; Singh et al., 2002, 2003; Cheyne et al., 2006; Hillebrandt al., 2005) at the target frequency. SAM images were used toenerate a group SAM image (Singh et al., 2002, 2003).
SCR recordings were filtered using low-pass filter with cut-ff frequency at 2.5 Hz. Following was segmentation into epochs,emoval of the baseline for −0.3 to 0 s and averaging in respect to
he stimulus onset from −0.3 to 1 s. The grand average was alsoalculated across all participants.After the closure of the BSI MEG laboratory the data werenonymized and transferred to the Laboratory for Human Brain
ig. 14. Group SAM image for arousal main effect. Arousal correlated to decreases on rightt least 6 mm from the midline. The brain region is superimposed with orthogonal sectioneurological Institute (MNI) space. The corresponding t-values are shown in the color sinimum is ten contiguous voxels.
e Methods 212 (2013) 114– 123 121
Dynamics, at AAI Scientific Cultural Services Ltd., in Nicosia, Cyprusfor follow up research and data analysis.
6. Results
Fig. 13 depicts the grand average of the SCRs for high and lowarousal for 2.5 Hz (Fig. 13A) as well as the GFP of grand-averagedERFs for a wideband of 2–30 Hz (Fig. 13B). Fig. 14 presents the local-ization results of the main arousal effect for a wideband of 2–30 Hzacross participants. Significant differences (p < 0.001, uncorrected)between high and low arousing images were observed on rightinferior parietal lobule (IPF) (Fig. 14, left-middle side) at MNI coor-dinates x: 46, y: −30, z: 30; cluster size: 358 voxels; t-values foreach peak: 3.37. Also differences in arousing images were localizedon the right temporal pole (TP) (Fig. 14, middle-right side) at MNIcoordinates x: 54, y: 8, z: −14; cluster size: 327 voxels; t-values foreach peak: 3.37.
7. Discussion
Our work addressed important economic and compatibilityissues by introducing a low-cost MEG-compatible SCR system thatallows simultaneous recordings of SCR and MEG which assess theautonomic and the central nervous system activity respectively.The challenge in these simultaneous recordings is to obtain arti-fact free MEG recordings, while introducing into the MSR electricalequipment for the recording of SCR. In order to produce a systemcompatible to the MEG environment, we followed previous sug-gestions (Shastri et al., 2001; Lagopoulos et al., 2005) and extendedthem based on the biomagnetism principles. The special featureof our system is the optical isolation between the two units oneplaced inside and the other outside the MSR, which does not allowRF artifacts to pass through the acquisition cable and interfere withthe MEG recordings.
The system was designed for continuous monitoring of SCR andspecifically for neuroscience experiments that focus on emotionalprocessing as the one reported here. To the best of our knowl-edge, such a system is not available in the MEG community andthis may explain the fact that the literature reporting such kindof measurements is limited to a single study. There are alterna-tive but expensive solutions and some may indeed be available inother MEG laboratories. MEG-compatible commercial EEG systemsthat include an SCR recording module are expensive (>$70,000). Thedesign of our system is simple allowing its implementation by neu-
roscientists who do not have specialized knowledge in electronics,and its implementation costs <$200.The results of testing our system demonstrate no significant dif-ferences in any of the statistical indices we computed between the
inferior parietal lobule and right temporal lobe. Points counted as left or right weres (sagittal, coronal, and axial) of an anatomical scan rendered in standard Montrealcale for all contrasts. Uncorrected p < 0.001 was adopted as the height threshold;
1 science Methods 212 (2013) 114– 123
tMdrs
cTbs
A
ooIwLSmER
A
(C
V
wa5tt
R
R
V
w
it
�
�
�
w
ˇ
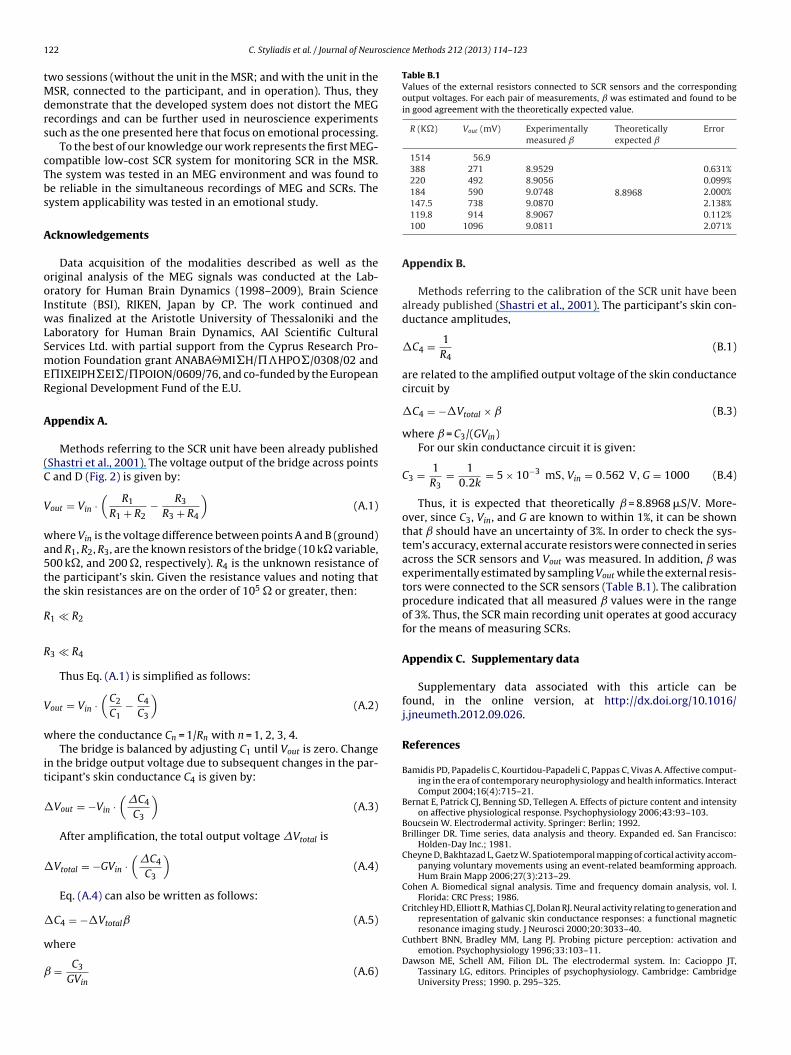
Table B.1Values of the external resistors connected to SCR sensors and the correspondingoutput voltages. For each pair of measurements, was estimated and found to bein good agreement with the theoretically expected value.
R (K�) Vout (mV) Experimentallymeasured ˇ
Theoreticallyexpected ˇ
Error
1514 56.9
8.8968
388 271 8.9529 0.631%220 492 8.9056 0.099%184 590 9.0748 2.000%147.5 738 9.0870 2.138%
22 C. Styliadis et al. / Journal of Neuro
wo sessions (without the unit in the MSR; and with the unit in theSR, connected to the participant, and in operation). Thus, they
emonstrate that the developed system does not distort the MEGecordings and can be further used in neuroscience experimentsuch as the one presented here that focus on emotional processing.
To the best of our knowledge our work represents the first MEG-ompatible low-cost SCR system for monitoring SCR in the MSR.he system was tested in an MEG environment and was found toe reliable in the simultaneous recordings of MEG and SCRs. Theystem applicability was tested in an emotional study.
cknowledgements
Data acquisition of the modalities described as well as theriginal analysis of the MEG signals was conducted at the Lab-ratory for Human Brain Dynamics (1998–2009), Brain Sciencenstitute (BSI), RIKEN, Japan by CP. The work continued and
as finalized at the Aristotle University of Thessaloniki and theaboratory for Human Brain Dynamics, AAI Scientific Culturalervices Ltd. with partial support from the Cyprus Research Pro-otion Foundation grant ANABA�MI�H/��HPO�/0308/02 and
�IXEIPH�EI�/�POION/0609/76, and co-funded by the Europeanegional Development Fund of the E.U.
ppendix A.
Methods referring to the SCR unit have been already publishedShastri et al., 2001). The voltage output of the bridge across points
and D (Fig. 2) is given by:
out = Vin ·(
R1
R1 + R2− R3
R3 + R4
)(A.1)
here Vin is the voltage difference between points A and B (ground)nd R1, R2, R3, are the known resistors of the bridge (10 k� variable,00 k�, and 200 �, respectively). R4 is the unknown resistance ofhe participant’s skin. Given the resistance values and noting thathe skin resistances are on the order of 105 � or greater, then:
1 � R2
3 � R4
Thus Eq. (A.1) is simplified as follows:
out = Vin ·(
C2
C1− C4
C3
)(A.2)
here the conductance Cn = 1/Rn with n = 1, 2, 3, 4.The bridge is balanced by adjusting C1 until Vout is zero. Change
n the bridge output voltage due to subsequent changes in the par-icipant’s skin conductance C4 is given by:
Vout = −Vin ·(
�C4
C3
)(A.3)
After amplification, the total output voltage �Vtotal is
Vtotal = −GVin ·(
�C4
C3
)(A.4)
Eq. (A.4) can also be written as follows:
C4 = −�Vtotal (A.5)
here
= C3
GVin(A.6)
119.8 914 8.9067 0.112%100 1096 9.0811 2.071%
Appendix B.
Methods referring to the calibration of the SCR unit have beenalready published (Shastri et al., 2001). The participant’s skin con-ductance amplitudes,
�C4 = 1R4
(B.1)
are related to the amplified output voltage of the skin conductancecircuit by
�C4 = −�Vtotal × (B.3)
where = C3/(GVin)For our skin conductance circuit it is given:
C3 = 1R3
= 10.2k
= 5 × 10⁻³ mS, Vin = 0.562 V, G = 1000 (B.4)
Thus, it is expected that theoretically = 8.8968 �S/V. More-over, since C3, Vin, and G are known to within 1%, it can be shownthat ˇ should have an uncertainty of 3%. In order to check the sys-tem’s accuracy, external accurate resistors were connected in seriesacross the SCR sensors and Vout was measured. In addition, wasexperimentally estimated by sampling Vout while the external resis-tors were connected to the SCR sensors (Table B.1). The calibrationprocedure indicated that all measured values were in the rangeof 3%. Thus, the SCR main recording unit operates at good accuracyfor the means of measuring SCRs.
Appendix C. Supplementary data
Supplementary data associated with this article can befound, in the online version, at http://dx.doi.org/10.1016/j.jneumeth.2012.09.026.
References
Bamidis PD, Papadelis C, Kourtidou-Papadeli C, Pappas C, Vivas A. Affective comput-ing in the era of contemporary neurophysiology and health informatics. InteractComput 2004;16(4):715–21.
Bernat E, Patrick CJ, Benning SD, Tellegen A. Effects of picture content and intensityon affective physiological response. Psychophysiology 2006;43:93–103.
Boucsein W. Electrodermal activity. Springer: Berlin; 1992.Brillinger DR. Time series, data analysis and theory. Expanded ed. San Francisco:
Holden-Day Inc.; 1981.Cheyne D, Bakhtazad L, Gaetz W. Spatiotemporal mapping of cortical activity accom-
panying voluntary movements using an event-related beamforming approach.Hum Brain Mapp 2006;27(3):213–29.
Cohen A. Biomedical signal analysis. Time and frequency domain analysis, vol. I.Florida: CRC Press; 1986.
Critchley HD, Elliott R, Mathias CJ, Dolan RJ. Neural activity relating to generation andrepresentation of galvanic skin conductance responses: a functional magneticresonance imaging study. J Neurosci 2000;20:3033–40.
Cuthbert BNN, Bradley MM, Lang PJ. Probing picture perception: activation andemotion. Psychophysiology 1996;33:103–11.
Dawson ME, Schell AM, Filion DL. The electrodermal system. In: Cacioppo JT,Tassinary LG, editors. Principles of psychophysiology. Cambridge: CambridgeUniversity Press; 1990. p. 295–325.

scienc
D
F
H
H
I
L
L
L
L
L
L
M
M
2003;19:1589–601.
C. Styliadis et al. / Journal of Neuro
wyer RF. Use of the kurtosis statistic in the frequency domain as an aid in detectingrandom signals. IEEE J Oceanic Eng OE 1984;9(2):85–92.
owles DC, Christie MJ, Edelberg R. Publication recommendations for electrodermalmeasurements. Psychophysiology 1981;18:232–9.
amalainen MS, Hari R, Ilmoniemi RJ, Knuutila J, Lounasmaa OV. Magnetoen-cephalography – theory, instrumentation, and applications to noninvasivestudies of the working human brain. Rev Mod Phys 1993;65:413–98.
illebrand A, Singh KD, Holliday IE, Furlong PL, Barnes GR. A new approachto neuroimaging with magnetoencephalography. Hum Brain Mapp 2005;25:199–211.
oannides AA, Sargsyan A. Rhythmogram-based analysis for continuous elec-trographic data of the human brain. IEEE Trans Inform Technol Biomed2012;16:205–11.
agopoulos J, Malhi G, Shnier R. A fiber-optic system for recording skin conductancein the MRI scanner. Behav Res Methods 2005;37(4):657–64.
ang PJ, Greenwald MK, Bradley MM, Hamm AO. Looking at pictures: affective, facial,visceral and behavioral reactions. Psychophysiology 1993;30:261–73.
ehmann D, Skrandies W. Reference-free identification of components ofcheckerboard-evoked multichannel potential fields. Electroencephalogr ClinNeurophysiol 1980;48(6):609–21.
ehmann D, Skrandies W. Spatial analysis of evoked potentials in man – a review.Prog Neurobiol 1984;23(3):227–50.
im CL, Seto-Poon M, Clouston PD, Morris JG. Sudomotor nerve conduction velocityand central processing time of the skin conductance response. Clin Neurophysiol2003;114:2172–80.
ithari C, Frantzidis CA, Papadelis C, Vivas AB, Klados MA, Kourtidou-Papadeli C,Pappas C, Ioannides AA, Bamidis PD. Are females more responsive to emotionalstimuli? A Neurophysiological study across arousal and valence dimensions.Brain Topogr 2010;23:27–40.
acIntosh J, Mraz R, McIlroy WE, Graham SJ. Brain activity during a motor learn-
ing task: an fMRI and skin conductance study. Hum Brain Mapp 2007;28:1359–67.endel TM. Tutorial on higher-order statistics (spectra) in signal processingand system theory: theoretical results and some applications. Proc IEEE1991;79:277–305.
e Methods 212 (2013) 114– 123 123
Moradi F, Liu LC, Cheng K, Waggoner RA, Tanaka K, Ioannides AA. Consistent andprecise localization of brain activity in human primary visual cortex by MEGand fMRI. Neuroimage 2003;18:595–609.
Ohira H, Nomura M, Ichikawa N, Isowa T, Iidaka T, Sato A, et al. Association of neuraland physiological responses during voluntary emotion suppression. Neuroim-age 2006;29:721–33.
Papadelis C, Eickhoff SB, Zilles K, Ioannides AA. BA3b and BA1 activate in a serialfashion after median nerve stimulation: direct evidence from combining sourceanalysis of evoked fields and cytoarchitectonic probabilistic maps. Neuroimage2011;54:60–73.
Papadelis C, Poghosyan V, Fenwick CPBC, Ioannides AA. MEG’s ability to localise accu-rately weak transient neural sources. Clin Neurophysiol 2009;120(11):1958–70.
Robinson SE, Vrba J. Functional neuroimaging by synthetic aperture magnetometry(SAM). In: Yoshimoto T, Kotani M, Kuriki S, Karibe H, Nakasato N, editors. Recentadvances in biomagnetism. Sendai: Tohuku University Press; 1998. p. 302–5.
Scerbo AS, Freedman LW, Raine A, Dawson ME, Venables PH. A major effectof recording site measurement of electrodermal activity. Psychophysiology1992;29:241–6.
Seth AK, Iversen JR, Edelman GM. Single trial discrimination of truthful from decep-tive responses during a game of financial risk using alpha-band MEG signals.Neuroimage 2006;32(1):465–76.
Shastri A, Lomarev MP, Nelson SJ, George MS, Holzwarth MR, Bohning DE. A low-costsystem for monitoring skin conductance during functional MRI. J Magn ResonImaging 2001;193(14):187.
Singh KD, Barnes GR, Hillebrand A, Forde EM, Williams AL. Task-related changesin cortical synchronization are spatially coincident with the hemodynamicresponse. Neuroimage 2002;16:103–14.
Singh KD, Barnes GR, Hillebrand A. Group imaging of task-related changes in cor-tical synchronisation using non-parametric permutation testing. Neuroimage
Vrabie V, Granjon P, Serviere C. Spectral kurtosis: from definition to application. In:Workshop on nonlinear signal and image processing; 2003, NSIP03.
Yamamoto T, Williamson SJ, Kaufman L, Nicholson C, Llinas R. Magnetic localisationof neuronal activity in the human brain. Proc Natl Acad Sci U S A 1988;85:8732–6.