
Transitional Justice Processes, Shared Narrative Memory about pass collective violence
Upload
khangminh22Category
view
1download
0
Caroline Kussé
Functional interactions between memory processes
and spontaneous brain activityBehavioral, EEG and fMRI studies
PhD thesis submitted to the University of Liège in partial fulfillment of the in partial fulfillment of the requirements for the degree of
doctor in biomedical and pharmaceutical sciences


Cyclotron Research Center
University of Liège
Belgium
FUNCTIONAL INTERACTIONS
BETWEEN MEMORY PROCESSES
AND SPONTANEOUS BRAIN ACTIVITY
BEHAVIORAL, EEG AND FMRI STUDIES
Caroline Kussé
Promotor: Pierre Maquet
PhD thesis submitted to the University of Liège in partial fulfillment of the
requirements for the degree of doctor in biomedical and pharmaceutical sciences
September 2014
Liège, Belgium


i
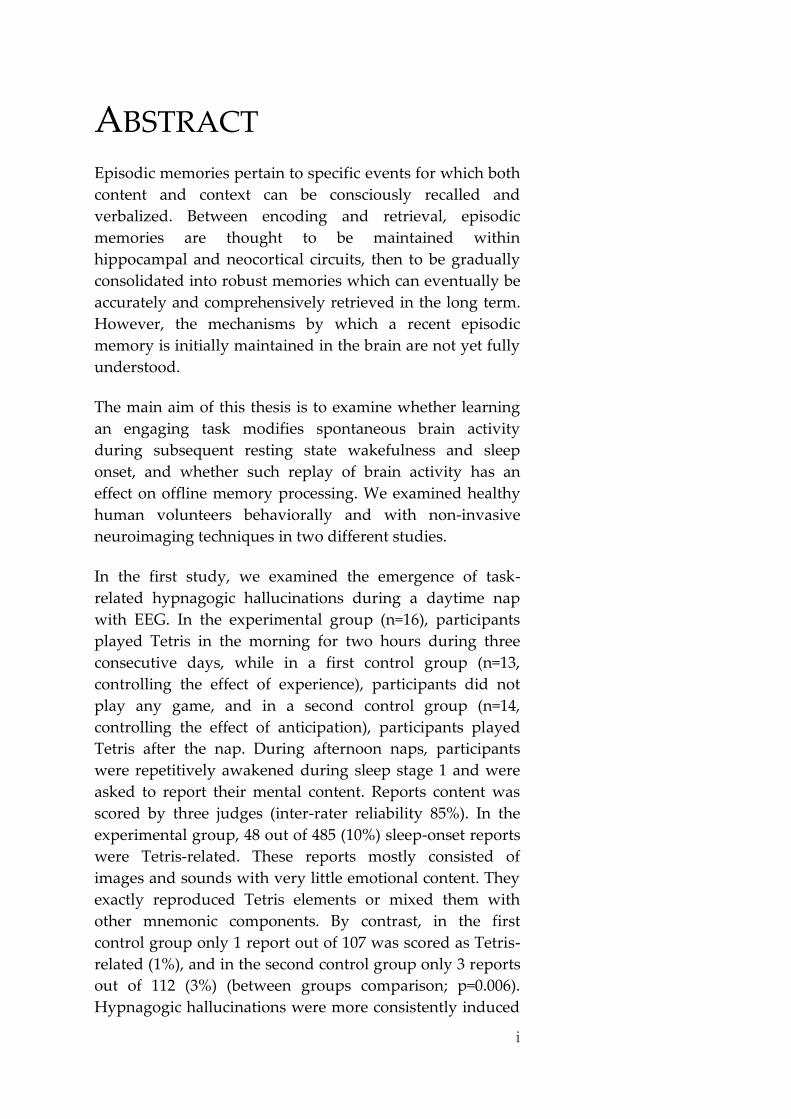
ABSTRACT Episodic memories pertain to specific events for which both
content and context can be consciously recalled and
verbalized. Between encoding and retrieval, episodic
memories are thought to be maintained within
hippocampal and neocortical circuits, then to be gradually
consolidated into robust memories which can eventually be
accurately and comprehensively retrieved in the long term.
However, the mechanisms by which a recent episodic
memory is initially maintained in the brain are not yet fully
understood.
The main aim of this thesis is to examine whether learning
an engaging task modifies spontaneous brain activity
during subsequent resting state wakefulness and sleep
onset, and whether such replay of brain activity has an
effect on offline memory processing. We examined healthy
human volunteers behaviorally and with non-invasive
neuroimaging techniques in two different studies.
In the first study, we examined the emergence of task-
related hypnagogic hallucinations during a daytime nap
with EEG. In the experimental group (n=16), participants
played Tetris in the morning for two hours during three
consecutive days, while in a first control group (n=13,
controlling the effect of experience), participants did not
play any game, and in a second control group (n=14,
controlling the effect of anticipation), participants played
Tetris after the nap. During afternoon naps, participants
were repetitively awakened during sleep stage 1 and were
asked to report their mental content. Reports content was
scored by three judges (inter-rater reliability 85%). In the
experimental group, 48 out of 485 (10%) sleep-onset reports
were Tetris-related. These reports mostly consisted of
images and sounds with very little emotional content. They
exactly reproduced Tetris elements or mixed them with
other mnemonic components. By contrast, in the first
control group only 1 report out of 107 was scored as Tetris-
related (1%), and in the second control group only 3 reports
out of 112 (3%) (between groups comparison; p=0.006).
Hypnagogic hallucinations were more consistently induced

ii
by experience than by anticipation (p=0.039) and they were
predominantly observed during the transition of
wakefulness to sleep. The observed attributes of experience-
related hypnagogic hallucinations are consistent with the
particular organization of regional brain activity at sleep
onset, characterized by high activity in sensory cortices and
in the default mode network.
In the second study, we tested if brain activity generated
during learning is spontaneously repeated during
subsequent resting wakefulness. Healthy participants (n=11)
were scanned in a randomized within-subject cross-over
design composed of two conditions in which fMRI rest
sessions flanked an active fMRI session. We applied
machine learning based multivariate pattern analysis on
these fMRI time series to calculate the percentages of task-
related scans before and after a memory task (encoding a
two dimensional trajectory of face, building and animal
pictures) and before and after a control task (an auditory
oddball). Activity patterns elicited by visual stimuli were
spontaneously expressed in the visual ventral stream before
any cognitive challenge. We found that 1.11% more scans
were task-related after learning than before, and that the
larger the difference between the proportions of
spontaneous brain activity linked to a task before and after
this task, the better the memorization of task features by the
subject, suggesting that reactivations during post-task rest
are linked to the memorization of the task. On the other
hand, 0.26% less scans were related to the memory task
after a control task than before, suggesting that the control
task had a repressive effect on the scans related to the
memory task. Memory encoding modulated the temporal
organization of the spontaneous activity in episodes of
longer duration (4 to 6 seconds). Our results show that
human memories are maintained during resting
wakefulness by temporally organized repetitions of
regional brain activity. However, because our other
analyses (dynamic causal modeling, cross-correlations and
explained variance, and spatial networks based on
independent component analysis) could not confirm these
findings, we suggest that fMRI might not be the most
appropriate methodology to further characterize memory
consolidation directly.

iii
Our results add to the growing body of evidence suggesting
that offline processing of explicit memories occurs during
wakefulness. They extend our understanding of human
spontaneous brain activity and its relationship to offline
memory processing, although more research is warranted to
further explore the details of the memory consolidation
process. Interesting perspectives would be to pursue this
work during sleep or with other neuroimaging methods
such as high density EEG or simultaneous fMRI and EEG.

iv

v
ACKNOWLEDGEMENTS Doing a PhD means a huge amount of work. It’s not only
about collecting data, interpreting results and writing
articles, but also about learning how to manage your time,
deal with deadlines, working in a team, and maybe most of
all it is about personal growth. Of course I couldn’t do all
this by myself. Many helpful and interesting people have
crossed my path during the last five years and I would like
to express my thanks to them in this (far too short) chapter
of my thesis.
I’m very fortunate to have Professor Pierre Maquet as
supervisor of my thesis. Pierre, you’re not only an excellent
scientist and teacher (of Matlab programming, EEG and
MRI equipment, structuring thoughts and writing them
down in a logical order); you’re also a warm and
understanding human being. Many thanks for all your
constructive feedback and valuable advice during the
numerous meetings! I also would like to thank Luca
Matarazzo for supervising my first project and explaining
me all I needed to know about working in the lab. Thanks
go to Mélanie Boly as well for supervising a DCM side
project which urged me to dig deep into the codes of the
SPM toolbox and taught me a lot about time management.
Without the fantastic Jessica Schrouff, who paired with me
on the main project, this thesis would still not be ready.
Jessica, you’re such a hard worker, you’ve got a scientific
mind and I’m sure you will make it.
All my colleagues at the lab made the hard work a pleasant
time. Vincenzo Muto, Mathieu Jaspar, Olivia Gosseries,
Christelle Meyer, Audrey Maudoux, Ariane Foret, Laura
Mascetti, Christina Schmidt, Sarah Chellappa, Athena
Demertzi, and all others. I would like thank especially
Anahita Shaffii-Le Bourdiec for the many philosophical
talks and refreshing insights at unbelievably early morning
hours. You’re absolutely the best!
I love computers… if they work properly. However,
computers have the nasty habit of crashing at crucial
moments, for example while examining a volunteer in the

vi
MRI scanner or when a complex Matlab analysis is running
for weeks. Thanks also to the lab IT specialist Christian
Degueldre for sorting out such computer issues.
When I arrived at the lab a few years ago, I barely knew the
name of that powerful program Matlab. That I’m now able
to write code for an experiment and its complete analysis
from scratch and that I’m starting to understand some of the
mysteries of the SPM toolbox, is thanks to Pierre Maquet,
Christophe Phillips, and certainly Karel Crombecq and
Jessica Schrouff who both very patiently answered all my
questions and taught me how to code more efficiently. Also
Peter Temmerman, although not a Matlab specialist, helped
me a lot with understanding more about programming. I’m
neither a programmer nor an engineer and never will be,
but thanks to you I can now create and manage my own
scripts that are working, although not always very
beautifully coded.
Of course, I had to collect a lot of data. I am grateful to my
sister Veronique Kussé, brother-in-law Stefan Temmerman
and several friends for volunteering very patiently as pilot
subjects so I could thoroughly test my experimental
designs. And without cooperation of my motivated
volunteers, this thesis would not even exist. Being woken
up constantly while falling asleep is not the nicest pastime,
neither hearing the monotonous Tetris tune for hours…
Thank you all very much for tolerating such annoying
experiments!
Nothing in life is for free. Therefore, I have to acknowledge
my funding: the Fonds National de la Recherche
Scientifique (FRS-FNRS and FRIA) for paying my salary, a
fast computer and conference expenses, and also the Queen
Elisabeth Medical Foundation, the Research Fund of the
University of Liège, the PAI/IAP Interuniversity Pole of
Attraction and the BIAL Foundation for project funding,
equipment, scanning hours, etc.
I would like to thank my family and family-in-law for being
enthousiastic about conferences and published papers, for
babysitting so many times, and for our countless nice
moments together. Special thanks go to my mother Wanda

vii
Driesen: mama, thank you for just being there when I
needed a listening ear and helping with too many things to
list, such as translations, valuable feedback on proofreading
my manuscripts, babysitting, and keeping me up-to-date
with what happens on planet Earth. I also would like to
thank my sensei, Danny Celis, for teaching me to have the
strength to never give up.
During my studies, I have encountered many friends I
would like to thank for the entertaining moments: Leen Sas
and Sofie Willemen for the inspirational insights and many
contagious laughs; Sanne Crombecq, Ilse Crombecq, Mawa
Nikiel and Stephanie Engelder for the girly chitchat; Karel
Crombecq for sharing his great enthusiasm and take-life-
easy attitude; and many others. Special thanks go to (semi-)
native speakers Ilse and Stephanie for proofreading this
thesis on typographical and grammatical errors.
Last but not least, I would like to thank my husband Peter
Temmerman for being at my side. You are truly my
superman! Thank you for all your support, day and night,
everywhere across the globe, even in China. Thank you for
listening to my complaints about Matlab programming and
non-existing results (even without yawning), and for your
fantastic ability to make me laugh when I’m stressing out.
Thanks to you, I have not thrown my computer out of the
window. I am very grateful for what we have, and I’m
looking forward to our future together. I also owe special
thanks to our beautiful baby girl Lyanna for reminding me
that there are more important things to life than work, by
smiling so lovely and heartwarmingly at me. I love you!
Caroline

viii

ix
TABLE OF CONTENTS Abstract i
Acknowledgements v
Table of contents ix
Acronyms xii
1. Introduction 1
1.1. Spontaneous brain activity 3
1.2. Mentation 5
Mental imagery 6 1.2.1.
Dreams 6 1.2.2.
Hypnagogic hallucinations 6 1.2.3.
1.2.3.1. Behavioral correlates 8
1.2.3.2. Electrophysiological correlates 8
1.2.3.3. Subjective perceptions 11
1.2.3.4. Research methodology 14
1.3. Memory consolidation 16
Memory systems 17 1.3.1.
Encoding, consolidation and retrieval 18 1.3.2.
Replay 23 1.3.3.
Limitations and challenges 26 1.3.4.
1.4. Functional brain specialization 28
2. Objectives 35
3. Research study 1: sleep onset 39
3.1. Objectives 40
3.2. Material & methods 42
Ethics 42 3.2.1.
Population 42 3.2.2.
Experimental design 43 3.2.3.
3.2.3.1. General overview 43
3.2.3.2. Assessment of sleepiness and alertness 44
3.2.3.3. Tetris 46
3.2.3.4. Awakenings 47
Polysomnography 48 3.2.4.
3.2.4.1. Methodological considerations 48
3.2.4.2. Sleep scoring of the naps 50
Data analysis 53 3.2.5.

x
3.2.5.1. Content of the sleep-onset reports 53
3.2.5.2. Software and statistical testing 56
3.3. Results 56
Population 56 3.3.1.
Sleep-onset mentation reports 57 3.3.2.
3.3.2.1. Database 57
3.3.2.2. Group differences 57
Effect of repeated training, interval and vigilance state 62 3.3.3.
Characterization of mental reports 63 3.3.4.
Sleep-onset reports and performance 65 3.3.5.
Alertness 67 3.3.6.
Content of hypnagogic hallucinations 68 3.3.7.
3.4. Discussion 71
3.5. Conclusion and perspectives 74
4. Research study 2: resting state 79
4.1. Objectives 80
4.2. Material & methods 83
Ethics 83 4.2.1.
Population 83 4.2.2.
Experimental design 84 4.2.3.
fMRI data acquisition 90 4.2.4.
Data analysis 91 4.2.5.
4.2.5.1. Preprocessing 91
4.2.5.2. Univariate analysis 93
4.2.5.3. Stochastic DCM 94
4.2.5.4. Explained variance 96
4.2.5.5. Spatial networks identification 97
4.2.5.6. Multivariate pattern analysis 99
4.2.5.7. Software and statistical testing 109
4.3. Results 110
Population 110 4.3.1.
Performance 110 4.3.2.
Stochastic DCM 112 4.3.3.
Explained variance 116 4.3.4.
Spatial networks identification 120 4.3.5.
Multivariate pattern analysis 127 4.3.6.
4.4. Discussion 137
4.5. Conclusion and perspectives 150
5. Conclusion & perspectives 153

xi
6. Annexes 159
6.1. Examples PSG recordings 159
6.2. Examples Tetris reports 165
Tetris-related content 165 6.2.1.
Sensory classes 168 6.2.2.
6.3. Curriculum vitae 169
6.4. Bibliography 172
7. References 177

xii
Acronyms
A animals
AA animal area
AUD auditory network
B buildings
BOLD blood oxygen level dependent
BW bandwidth
CNR contrast-to-noise ratio
CORSICA correction of structured noise using spatial independent
component analysis
CSF cerebro-spinal fluid
CV cross-validation
dATT dorsal attentional network
DCM dynamic causal modeling
DD daydreaming
df degrees of freedom
DM default mode network
ECOC error-correcting output code
ECoG electrocorticography
EEG electroencephalography
EMG electromyography
EOG electrooculography
EPI echo-planar imaging
EV explained variance
F faces
FA flip angle
FASST fMRI artefact rejection and sleep scoring toolbox
FFA fusiform face area
FFX fixed effects analysis
fMRI functional magnetic resonance imaging
FoV field of view
FTT finger tapping task
FWE family-wise error
FWHM full width at half maximum
GLM general linear model
GP Gaussian processes
HRF hemodynamic response function
Hz Hertz
IC(A) independent component (analysis)
IDPC integrated difference in partial correlation
IID independent and identically distributed
IPI imaginal process inventory
xiii
KSS Karolinska sleepiness scale
L distance
LSD post hoc least significant differences
LSDQ London sleep and dream questionnaire
LTP long-term potentiation
max maximum
MDEFT modified driven equilibrium Fourier transform
med median
MEG magnetoencephalography
min minimum
mm millimeter
MNI Montreal neurological institute
MOT sensorimotor network
ms millisecond
MVPA multi-variate pattern analysis
µs microsecond
N number of included subjects
NEDICA network detection using ICA
NOI(s) network(s) of interest
NREM non-rapid eye movement
NS non significant
PET positron emission tomography
PPA parahippocampal place area
Pr proportion
PSG polysomnography
PSQI Pittsburgh sleep quality index
PVT psychomotor vigilance task
px pixel, picture element in a 2D image
REM rapid eye movement
RFA recursive feature addition
RFX random effects analysis
RM-ANOVA repeated measures analysis of variance
ROI(s) region(s) of interest
RSC retrosplenial cortex
s second
S1 sleep stage 1
S2 sleep stage 2
S3 sleep stage 3
S4 sleep stage 4
SD standard deviation
SEM slow eye movement
SMP sleep midpoint
SNR signal-to-noise ratio
xiv
SPM statistical parametric mapping
SRTT serial reaction time task
SVM support vector machines
TA acquisition time
TE echo time
TI inversion time
TR repetition time
vATT ventral attentional network
VIS visual network
VOI(s) voxel(s) of interest
vx voxel, volume element in a 3D image
W wakefulness
y year

xv

xvi
1
1. INTRODUCTION This chapter is based on:
- Shaffii-Le Bourdiec A, Muto V, Mascetti L, Foret A,
Matarazzo L, Kussé C, Maquet P (2010) Contribution of
sleep to memory consolidation. Future Neurology 5(2):
325-338. (Shaffii-Le Bourdiec et al, 2010)
- Kussé C, Shaffii-Le Bourdiec A, Schrouff J, Matarazzo L,
Maquet P (2012) Experience-dependent induction of
hypnagogic images during daytime naps: a combined
behavioural and EEG study. J Sleep Res 21(1): 10-20. (Kussé et al, 2012)
- Schrouff* J, Kussé* C, Wehenkel L, Maquet P, Phillips C
(2012) Decoding semi-constrained brain activity from
FMRI using support vector machines and gaussian
processes. PLoS One 7(4): e35860. (Schrouff* et al, 2012)
- Schrouff J, Kussé C, Wehenkel L, Maquet P, Phillips C
(2012) Decoding spontaneous brain activity from fMRI
using gaussian processes: tracking brain reactivation. In:
PRNI, London, doi 10.1109/PRNI.2012.19. (Schrouff et al, 2012)
- Schrouff* J, Kussé* C, Wehenkel L, Luxen A, Maquet P,
Phillips C (Submitted) Temporally structured memory
replay during resting wakefulness in humans. (Kussé et al, In progress)
2
This thesis work covers spontaneous brain activity during
different vigilance stages in healthy humans, examined
behaviorally and with macroscopic neuroimaging
techniques such as EEG and fMRI. I was particularly
interested in memory processes during wakefulness and
sleep and their potential behavioral (conscious) and neural
correlates. How does the human brain process information
related to past experiences?
In a first study, I assessed the learning-dependency of
hypnagogic hallucinations, a curious dream-like
phenomenon occurring at the onset of sleep. In particular,
we examined behaviorally whether an engaging task
(playing the computer game Tetris) would be able to elicit
task-related hypnagogic hallucinations during a daytime
nap, while brain activity was continuously monitored with
EEG. Although hypnagogic hallucinations are an
omnipresent phenomenon, their origin and function remain
very poorly understood.
In a second study, I aimed at characterizing the neural
correlates of memory maintenance during post-learning
resting state wakefulness. Brain activity of volunteers was
measured with fMRI while they were learning a trajectory
of pictures (of human faces, buildings and animals) and
during pre- and post-learning rest sessions. Data was
analyzed using several techniques, namely dynamic causal
modeling, explained variance, identification of spatial
networks using independent component analysis, and
multivariate decoding which is based on multivoxel pattern
analysis. We examined also whether a higher amount of
task-related replay would be correlated with better memory
performance afterwards.
Both experiments require a theoretical introduction about
several topics, which will be dealt with in the following
sections:
- Spontaneous brain activity during different vigilance
states and its role in memory consolidation; stages and
consciousness in the sleep wake/cycle. Spontaneous
brain activity is the red line through this thesis: both
studies assess the purpose of spontaneous brain activity.

1. Introduction
3
Moreover, an important aspect of the first study is to
detect the exact vigilance stage in which hypnagogic
hallucinations occur.
- Various forms of conscious and spontaneous mentation
during wakefulness and sleep in order to set the context
of the first experiment. In this study, it is important to
differentiate correctly between hypnagogic
hallucinations and e.g. mental imagery and dreams. In
the introduction, the behavioral (subjective) differences
will be described, while a more detailed description of
the characteristics on EEG recordings (objective) can be
found in the material and methods chapter of the
considered study.
- Different memory systems, an overview of the crucial
steps in memory maintenance (encoding, consolidation
and retrieval) and replay mechanisms underlying
memory consolidation. This section is necessary as the
novelty of the second experiment is to characterize
memory consolidation directly, without confounding
influences of retrieval.
- Functional brain specialization and integration. Because
the second study is crucially based on the characteristic
specialization of visual areas, we summarize the most
well-known category-specific visual brain areas and
different theories about processing strategies: are these
regions really important in processing one category of
stimuli, or do they represent levels of expertise?
An explanation of the neuroimaging techniques (EEG and
fMRI) and analyzing methods (scoring of the naps for the
first study; dynamical causal modeling, explained variance,
spatial networks and multivariate decoding for the second
study) can be found in the material and methods section of
each research chapter.
1.1. Spontaneous brain activity
The first part of the introduction deals with spontaneous
brain activity during different vigilance states and its role in
memory consolidation. Spontaneous brain activity is the
main theme of this thesis.
4
The classic view of brain functioning posits that the brain is
mainly reflexive, driven by environmental demands and
external stimuli in order to interpret incoming information
and program motor output (Raichle, 2006). However, recent
neuroimaging results suggest that the majority of brain
activity is intrinsic, spontaneous, and involved in
maintaining information for interpretation, responding to,
and even predicting environmental demands.
Indeed, even in the absence of sensory input neuronal
networks remain very active, as already shown by many
functional studies searching for a baseline brain activity
(Gusnard and Raichle, 2001; Raichle and Mintun, 2006; Fox
and Raichle, 2007; Fox et al, 2007; Boly et al, 2008).
Moreover, cost-based analyses suggest spontaneous
intrinsic activity is an important aspect of normal brain
functioning, far more significant than evoked activity in
terms of overall brain function (Raichle, 2006; Raichle and
Mintun, 2006).
In humans, this spontaneous brain activity is expressed as a
variety of rhythms on electroencephalographic recordings
(Buzsaki and Draguhn, 2004) and intrinsic fluctuations of
the functional magnetic resonance imaging signal (Fox and
Raichle, 2007).
Role in memory consolidation
Although the exact purpose of spontaneous brain activity is
still largely unknown, it is thought to underlay intertrial
variability (Arieli et al, 1996), modulate behavior (Fox et al,
2007), perception (Boly et al, 2007), consciousness (Fox et al,
2006) and memory consolidation (Wagner et al, 1998;
Tsodyks et al, 1999; Kenet et al, 2003). It is often assumed
that this spontaneous activity is related to the treatment of
several types of information: personal thoughts, memories,
emotions, intentions, etc. Indeed, even in the absence of
external input, the brain is capable of generating
representations or images, as occurs in dreams and
hallucinations (Llinás, 2001; Hobson, 2002). Furthermore,
spontaneous thoughts during wakefulness are an
omnipresent phenomenon, occupying as much as one third
Hypnagogia (Maury,
1848) is derived
from the Greek
word hypnos,
which means sleep,
and agogos, which
means introducing
or leading to.
Please note that
sometimes the term
hypnagogia is
used in a more
Functional neuroimaging
techniques allow in
vivo measurements of
an aspect of brain
function, often to
understand the
relationship between
activity in certain
brain areas and specific
mental functions.
Functional magnetic
resonance imaging
(fMRI) and positron
emission tomography
(PET) measure
hemodynamic changes
induced by regional
changes in neuronal
activity with high
spatial resolution (i.e. a
few millimeters).
Electroencephalo-
graphy (EEG) and
magneto-
encephalography
(MEG) measure
respectively the
neuronal electrical or
magnetic activity with
high temporal
resolution (i.e.
milliseconds).
1. Introduction
5
of our waking time, which underlines the importance of the
spontaneous activity of the brain (Christoff et al, 2011).
Evidence exists that relates spontaneous brain activity to
consolidation of memory traces. For example, during sleep
following a spatial learning, firing sequences have been
observed that are similar to encoding sequences in
hippocampal neuronal populations (Wilson and
McNaughton, 1994; Skaggs and McNaughton, 1996; Hirase
et al, 2001; Louie and Wilson, 2001; Lee and Wilson, 2002; Ji
and Wilson, 2007; Peyrache et al, 2009) and in the cortex
(Qin et al, 1997; Euston et al, 2007; Peyrache et al, 2009;
Eagleman and Dragoi, 2012; Mohajerani et al, 2013). It
seems that these reactivations are not strictly limited to
sleep, as similar modifications of neocortical activity have
been registered during resting state wakefulness (Hoffman
and McNaughton, 2002; Eagleman and Dragoi, 2012;
Mohajerani et al, 2013).
1.2. Mentation
Intrinsic or spontaneous brain activity is sometimes
reflected in spontaneous mentation. Depending on the state
of consciousness, many types of spontaneous mental
activity can be observed such as thoughts, intentions,
memories, emotions, illusions, dreams and hypnagogic
hallucinations. To clarify the object of the present work, we
explain operational definitions in this chapter. As there is
no consensus on the definition of dreams, for instance, the
aim is only to set the stage for this particular study. Mental
imagery, hypnagogia and dreams are subjective experiences,
while the wake state, sleep stage 1, and rapid eye
movement sleep (REM sleep) in which they can occur
respectively, are physiologically defined states of
consciousness. Therefore, the subjective experiences will be
defined by their psychological features and the states of
consciousness will be defined by their objective
physiological characteristics in 3.2.4.2.
Hypnagogia (Maury,
1848) is derived from
the Greek word
hypnos, which means
sleep, and agogos,
which means
introducing or leading
to. Please note that
sometimes the term
hypnagogia is used in
a more general sense to
describe both
hypnagogic and
hypnopompic
hallucinations ,
occurring at the onset
to and awakening from
sleep, respectively, as
the experience of both
types of hypnagogia is
largely the same (Ellis,
1897). However, in this
thesis the term
hypnagogia will be
used only to describe
the experiences
occurring while
drifting off to sleep, as
originally meant
(Maury, 1848; Myers,
1892).
6
Mental imagery 1.2.1.
Imagery is a subjective phenomenon, including mental
representations that are mostly visual or auditory of
modality. Imagery, whether voluntary (e.g. mental imagery)
or involuntary (e.g. hypnagogic imagery), resembles the
inner experience of perceiving something that is not present
to the senses (McKellar, 1957). Mental imagery is assumed
to play a role in memory, thinking and motivation, as
imagery experiences are often understood as echoes or
reconstructions of past actual perceptual experiences.
Dreams 1.2.2.
Dreams are mental representations occurring while one is
sound asleep, especially during REM sleep (Dement and
Kleitman, 1957b) which is also called paradoxical sleep
(Jouvet et al, 1959a, 1959b, 1959c), as brain activity during
this sleep stage resembles awake activity. Dream content is
vivid and very much story-like, often with the dreamer as
actor. Complex objects (people, buildings, etc.) and rapidly
changing series of images, sounds and feelings (especially
fear, elation and anger, more than sadness, shame and guilt)
play an important role in the plot, which has often a high
degree of bizarreness or improbability of time, place, person
and actions and lacks orientation stability (Hobson et al,
1987; Hobson, 1988), although it is experienced as waking
reality. The sensory modalities accounting for the major
part of dreams are visual and motor (Hobson, 1988; Zadra
et al, 1998). Memory for even very vivid dreams is
evanescent and tends to fade quickly upon awakening
(Hobson et al, 2003).
Hypnagogic hallucinations 1.2.3.
Hallucinations in general are involuntary false sensory
perceptions in the absence of an actual external stimulus.
They occur concurrently with actual observations in a
conscious and awake or somnolent state (i.e. excluding
dreams), and have qualities of real sensations such as
vividness, substantiality, and location in external objective
space (Mullen, 1979). Hallucinations can occur in any
sensory modality. Hallucinations can occur in a variety of
Because of the
resemblances in the
EEG, pioneers in
sleep research
suggested that
stage 1 and REM
sleep represent the
same sleep stage.
However, some
already described
differences in
mental imagery
(Baillarger, 1846)
between what they
called stage 1 with REMs
which corresponds
to dreams in REM
sleep, and stage 1 without REMs
which corresponds
to hypnagogic
hallucinations
occurring in stage 1
of NREM sleep
(Dement and
Kleitman, 1957a).
Differences between
hallucinations and other
perceptions (Chiu, 1989):
- Dreams occur during
REM sleep and contain
a story-like plot in
which the dreamer is
involved as an actor.
- Illusions involve
distorted or
misinterpreted real
perception.
- Mental imagery does
not mimic real
perception and is
under voluntary
control.
- Pseudohallucinations
do not mimic real
perception but are not
under voluntary
control.
1. Introduction
7
different situations: auras preceding migraine attacks or
epilepsy, psychosis in paranoid schizophrenia (e.g. hearing
voices), drug induced hallucinations, delirium tremens,
sensory deprivation, or in more common conditions like
after seeing a bright flickering light, sleep deprivation, or
while waking up or falling asleep (James, 1890). For our
study, we are interested in the latter category which will be
described in more detail in this chapter.
Hypnopompic hallucinations (Myers, 1892, 1903) occur
while waking up from sleep.
Hypnagogic hallucinations, our main interest, occur while
falling asleep and are usually described as short visual
percepts like faces, landscapes, and natural or social scenes,
sometimes related to previous daytime experience. They are
usually without narrative content and almost never contain
a story-like plot, although some very short and simple
exceptions may occur. Specific sensations such as floating,
visions of flashing light, out of body experiences, numbness
of the legs and changes in perceived body size and
proportions are frequently reported (Mavromatis, 1987).
These percepts may be of pseudohallucinatory (i.e. with
preserved insight of unreality) or truly hallucinatory
character (i.e. experienced as if real). Hypnagogic images
are an isolated appearance in the air, appearing to be
located just a few inches away at reading distance from the
eye, but not surrounded by a complete imaginary world
(Sartre, 1940; Siegel, 1977). As soon as they are attentively
focused on or tried to be consciously controlled, they
disappear immediately (Maury, 1865). Hypnagogic
hallucinations are a common phenomenon occurring in the
whole population (Richardson et al, 1981; Ohayon et al,
1996; Ohayon, 2000).
Although hypnagogic states are highly variable with large
individual differences (Rechtschaffen, 1994), they have
unique behavioral, electrophysiological and subjective
characteristics which have been examined with inventive
techniques. These topics will be dealt with in the following
paragraphs.
Synonyms of hypnagogic
hallucinations are sleep-
onset mentation,
presomnal or
anthypnic sensations,
visions of half-sleep,
oneirogogic images,
the borderland of
sleep,
praedormitorium
(Mavromatis, 1987),
half-dream state,
predream condition,
sleep onset dreams,
dreamlets (Schacter,
1976), wakefulness-
sleep transition state
(Bodizs et al, 2005;
Bodizs et al, 2008).

8
1.2.3.1. Behavioral correlates
Behavioral correlates of hypnagogic hallucinations are
sparse. Typical are a decreased awareness of observing
one’s mental content and loss of volitional control over
mentation, inaccurate time perception, reduced awareness
of the environment, and reduced reality testing (Foulkes and
Vogel, 1965; Mavromatis and Richardson, 1984;
Rechtschaffen, 1994).
Hypnic jerks in arms or leg muscles can be associated with
vivid kinesthetic hallucinations or illusionary body
movements. The muscle twitch may for example resemble
the startle reflex when experiencing a falling sensation
(Nielsen, 1992; Germain and Nielsen, 2001; Askenasy, 2003).
Another feature includes the hypnagogic/hypnopompic
speech phenomenon, which occurs when a person hears
himself uttering words, often nonsensical or irrelevant, just
as they are falling asleep or waking from sleep (McKellar,
1989).
1.2.3.2. Electrophysiological correlates
EEG recordings can be used to reliably detect the state in
which hypnagogic images can occur (Hori, 1985; Hori et al,
1994; Germain and Nielsen, 1997; Vaitl et al, 2005): they
occur in a state of somnolence, more precisely sleep stage 1.
In this stage, the low voltage EEG pattern shows a
fragmentation and a progressive disappearance of alpha
rhythm (Davis et al, 1937; Foulkes and Vogel, 1965; Foulkes
and Schmidt, 1983) and an appearance of theta rhythm.
EOG recordings show slow, rolling eye movements, mainly
in the horizontal direction, and the EMG is characterized by
a diminished muscle relaxation, sometimes with hypnic
jerks.
Nine detailed stages of sleep onset have been described to
identify more precisely the EEG state which accompanies
hypnagogic imagery, according to the proportion of alpha
rhythm (stages 1-3), suppression of low amplitude waves
less than 20 μV or EEG flattening (stage 4), theta ripples
(stage 5) proportions of vertex sharp waves (stages 6 and 7)
Hypnic jerks, also called
sleep starts or sleep
twitches, are
involuntary muscle
twitches in various
skeletal muscles,
predominantly in the
limbs, which occur
when falling asleep.
They may cause
arousal.
Reality testing is the
capacity to distinguish
what is occurring in
one’s own mind from
what is occurring in
the external world.
1. Introduction
9
and presence of spindles (stages 8 and 9), and also the
amount of hypnagogic images occurring in each of the
stages (Hori et al, 1994). These findings were supported by
others, who found that spontaneous hypnagogic imagery
occurred mostly during Hori’s stage 4 and 5, respectively
EEG flattening and theta ripples (Germain and Nielsen,
1997). Early research already showed that in sleep stage 2
the occurrence of hypnagogic hallucinations decreases
dramatically, although in these days it was not yet called
stage 2 (Davis et al, 1937).
An association between short flashes of dreamlike imagery
and drop-offs in alpha EEG activity has been observed
(Davis et al, 1937). Flattened or decelerated alpha and/or
slow theta EEG activity are mostly associated with
nonemotional visual and auditory impressions of varying
complexity, mostly experienced as unreal (Kuhlo and
Lehmann, 1964).
Prominent theta activity appears to be associated with a
cognition pattern consisting of mainly visual (Germain and
Nielsen, 1997) and emotional experiences of good recall
quality with low body perception and orientation, whereas
slower frequencies are associated with lower recall quality
(Lehmann et al, 1995). EEG source localization techniques
revealed that abstract thoughts are generally associated
with more anterior and deeper sources than those of visual
imagery, particularly in the delta/theta band (Lehmann et
al, 1993).
Unimodal visual and kinesthetic images (apparent self-
movements) are characterized by decreases in all frequency
bands except delta, which increases. Kinesthetic
hallucinations are accompanied by prefrontal and frontal
delta activation, and visual by delta activation in more left-
central and temporal regions. The documented spread of
anterior to posterior delta power may be associated with
sense-specific imagery processes (Germain and Nielsen,
2001).
Alpha and beta frequency bands appear to be associated
with predominantly acoustic experiences, the subjects
uninvolved in the narrative, while visual and tactile modes

10
are almost absent (Lehmann et al, 1995). These
hallucinations are void of emotional connotations but with
high body perception, orientation and vigilance.
Auditory thresholds to elicit a response from the subject
during stage 1 sleep are much lower than in REM sleep
(Davis et al, 1939). On EEG recordings, an elevated response
to sounds can be observed at sleep onset (Ornitz et al, 1967),
paralleling the high receptiveness for suggestion during
stage 1 and ready incorporation of external stimuli into
hypnagogic hallucinations (Hollingworth, 1911).
As for physiological correlates, hypnic jerks or other bodily
sensations often are accompanied in the EEG by a vertex
sharp wave or small K-complex (Vaitl et al, 2005),
corresponding to Hori’s EEG stages 8 and 9 (Hori et al,
1994), an electrical event which is commonly attributed to
an arousal. They can be due to a temporary re-excitation of
some part of the reticular formation of the brain stem, while
the associated hypnagogic hallucinations could then be due
to arousal in some other part of this system (Anonymous,
1959; Oswald, 1959). Sleep paralysis on the other hand, may
be attributed to a delayed arousal in some part of the same
system.
Changes in abdominal-thoracic respiratory patterns have
also been noted with progressive loss of wakefulness
(Timmons et al, 1972): abdominal-dominant breathing was
associated with relaxed wakefulness, abdominal-thoracic
equality with drowsiness, and thoracic-dominant breathing
with sleep onset. During drowsiness, variations in
amplitude of abdominal movements were closely related to
vacillations between alpha and theta activity in the EEG. In
addition, a low level of frontalis muscle activity may be
related to sleep onset (Budzynski, 1972; Stoyva, 1973).
1. Introduction
11
1.2.3.3. Subjective perceptions
Sensory modalities
Although hypnagogic hallucinations can occur in any
sensory modality, visual imagery seems to occur most
frequently, followed by auditory and tactile-kinesthetic
perceptions (Maury, 1865; Foulkes and Vogel, 1965; Green
et al, 1970; Schacter, 1976). Just as in waking, different
sensory modalities can be engaged in the same event
(sometimes synesthetic hallucinations are reported), and can
range from very clear and concrete hallucinations to vague
and barely perceptible imagery which is difficult to describe
precisely (Mavromatis, 1987).
The best researched hypnagogic phenomena are those of the
visual modality. In general, they are characterized by
externality, autonomy, brevity of duration, sometimes
clarity of detail and vividness of color or sometimes not at
all, internality, and the sense of reality. One of the visual
features of hypnagogic hallucinations are phosphenes
(Nicholson, 1996). They are typically fleeting and changing
very rapidly.
Auditory hypnagogic hallucinations occur also frequently.
They can vary in intensity from faint impressions to loud
noises, such as a bomb explosion or a clash of cymbals (such
as exploding head syndrome). Common experiences are
hearing a telephone ringing, neologisms, irrelevant
sentences containing unrecognizable names or nonsense
words, meaningful responses to one’s thought of the
moment, someone calling their own name, or a music tune
or poem (Mavromatis, 1987).
Common examples of kinesthetic and proprioceptive
experiences are numbness and changes in perceived body
size and proportions (e.g. swelling of one of the limbs), as
well as tactile sensations such as paresthesia and formication.
Vestibulo-motor hallucinations of floating, flying, falling,
bobbing, illusory movements and out of body experiences
are also commonly reported (Mavromatis, 1987).
Phosphenes are the
experience of seeing
light without light
actually entering the
eye. They are perceived
as flashes of light,
random speckles, lines
or geometrical
patterns, still or
moving,
monochromatic or
richly colored.
Paresthesia is a
sensation of tingling,
pricking or burning
with no physical effect.
Common examples are
pins and needles, a
limb falling asleep, or
formication (insects
crawling on the skin).
Synesthesia is a
phenomenon in which
stimulation in one
sensory modality
induces an experience
in another sensory
modality, e.g.
associating music with
colors.
Exploding head
syndrome, also known
as auditory sleep starts,
is a parasomnia in
which the patient
experiences a loud
bang in the head that
seems to originate from
inside the head,
although it is usually
not accompanied by
pain.

12
Although gustatory, olfactory and thermal sensations have
all been reported (e.g. a sense of heat or cold coursing
through the body), these modalities are less frequently
experienced (Mavromatis, 1987).
Cognitive processes
Emotions are also a common characteristic of hypnagogic
hallucinations and range from euphoria and bliss to fear
and nightmarish, frightening experiences (Cheyne, 2000;
Revonsuo, 2003).
Cognitive processes in hypnagogia differ from those of
other states of consciousness, characterized by openness,
receptivity and susceptibility to suggestion (Ellis, 1897;
Schacter, 1976), readiness to incorporate external and
internal stimuli into hypnagogic mentation (Hollingworth,
1911), internalization of the physical and mental
environment, and an illogic and fluid association of ideas
(Mavromatis, 1987). Anticipatory warning experiences,
insight and problem-solving phenomena have been reported.
It has been suggested that hypnagogia and REM sleep are
involved in semantic memory consolidation (Stickgold,
1998; Stickgold and Walker, 2005) although this has been
disputed (Vertes and Eastman, 2003). Hypnagogic
hallucinations are often replaying previous waking
experiences from that day or from older related memories
(Stickgold et al, 2001b). Recent experimental evidence exists
of seeing falling blocks after Tetris gaming (Stickgold et al,
2000) and skiing experiences after playing Alpine Racer
(Emberger, 2001; Stickgold et al, 2001a; Wamsley et al,
2010).
Many inventors, artists
and scientists have
reported moments of
enhanced creativity or
insight into a problem
during hypnagogic
hallucinations (Barrett,
2001), such as chemist
August Kekulé (Figure
1), inventor Thomas
Edison, painter
Salvador Dalí (Figure
3), composers
Beethoven and Richard
Wagner, scientists
Nikola Tesla and Isaac
Newton.

1. Introduction
13
Figure 1. Chemist August Kekulé
discovered the cyclic structure of
benzene in 1865, a milestone in
chemistry history, in a hypnagogic
hallucination of an ouroboros (a snake
swallowing its own tail): "...I was sitting
writing on my textbook, but the work did
not progress; my thoughts were elsewhere.
I turned my chair to the fire and dozed.
Again the atoms were gamboling before my
eyes. This time the smaller groups kept
modestly in the background. My mental
eye, rendered more acute by the repeated
visions of the kind, could now distinguish
larger structures of manifold conformation;
long rows sometimes more closely fitted
together all twining and twisting in snake-
like motion. But look! What was that? One
of the snakes had seized hold of its own tail, and the form whirled mockingly before my eyes. As if by a
flash of lightning I awoke; and this time also I spent the rest of the night in working out the
consequences of the hypothesis." (Roberts, 1989)
Sleep paralysis
Sleep paralysis is a temporal muscle atonia, a transient
heaviness or inability to perform voluntary movements, at
the transition between wakefulness and sleep (Thorpy,
1990; Medicine, 2001). The person usually regains muscular
control within a short time, one to several minutes. The
paralysis is frequently accompanied by hypnagogic
hallucinations in three main categories (Cheyne and Girard,
2007):
- Intruder experiences are sensory hallucinations which
can be visual, auditory or tactile, often with fear. The
feeling of a presence is also possible to occur.
- Incubus experiences on the other hand involve breathing
difficulties, feelings of suffocation, smothering or
choking, sensations of pressure or being crushed (for
example, a weight pressure on the chest), and sometimes
also pain and thoughts of death.
- Vestibulo-motor hallucinations are less associated with
feelings of fear. They include sensations of floating,
flying and falling, as well as feelings of bliss or euphoria.
14
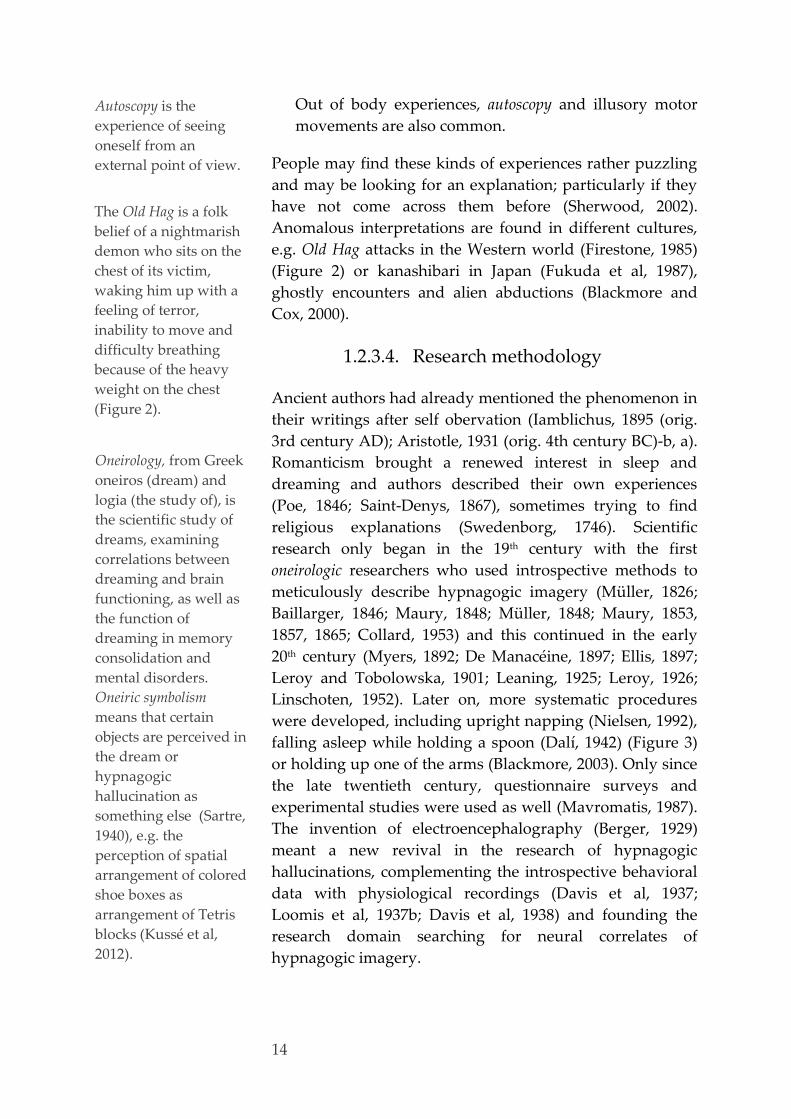
Out of body experiences, autoscopy and illusory motor
movements are also common.
People may find these kinds of experiences rather puzzling
and may be looking for an explanation; particularly if they
have not come across them before (Sherwood, 2002).
Anomalous interpretations are found in different cultures,
e.g. Old Hag attacks in the Western world (Firestone, 1985)
(Figure 2) or kanashibari in Japan (Fukuda et al, 1987),
ghostly encounters and alien abductions (Blackmore and
Cox, 2000).
1.2.3.4. Research methodology
Ancient authors had already mentioned the phenomenon in
their writings after self obervation (Iamblichus, 1895 (orig.
3rd century AD); Aristotle, 1931 (orig. 4th century BC)-b, a).
Romanticism brought a renewed interest in sleep and
dreaming and authors described their own experiences
(Poe, 1846; Saint-Denys, 1867), sometimes trying to find
religious explanations (Swedenborg, 1746). Scientific
research only began in the 19th century with the first
oneirologic researchers who used introspective methods to
meticulously describe hypnagogic imagery (Müller, 1826;
Baillarger, 1846; Maury, 1848; Müller, 1848; Maury, 1853,
1857, 1865; Collard, 1953) and this continued in the early
20th century (Myers, 1892; De Manacéine, 1897; Ellis, 1897;
Leroy and Tobolowska, 1901; Leaning, 1925; Leroy, 1926;
Linschoten, 1952). Later on, more systematic procedures
were developed, including upright napping (Nielsen, 1992),
falling asleep while holding a spoon (Dalí, 1942) (Figure 3)
or holding up one of the arms (Blackmore, 2003). Only since
the late twentieth century, questionnaire surveys and
experimental studies were used as well (Mavromatis, 1987).
The invention of electroencephalography (Berger, 1929)
meant a new revival in the research of hypnagogic
hallucinations, complementing the introspective behavioral
data with physiological recordings (Davis et al, 1937;
Loomis et al, 1937b; Davis et al, 1938) and founding the
research domain searching for neural correlates of
hypnagogic imagery.
The Old Hag is a folk
belief of a nightmarish
demon who sits on the
chest of its victim,
waking him up with a
feeling of terror,
inability to move and
difficulty breathing
because of the heavy
weight on the chest
(Figure 2).
Oneirology, from Greek
oneiros (dream) and
logia (the study of), is
the scientific study of
dreams, examining
correlations between
dreaming and brain
functioning, as well as
the function of
dreaming in memory
consolidation and
mental disorders.
Oneiric symbolism
means that certain
objects are perceived in
the dream or
hypnagogic
hallucination as
something else (Sartre,
1940), e.g. the
perception of spatial
arrangement of colored
shoe boxes as
arrangement of Tetris
blocks (Kussé et al,
2012).
Autoscopy is the
experience of seeing
oneself from an
external point of view.

1. Introduction
15
Figure 2. Painting “The nightmare” by Henry Fuseli (1781) is a classic depiction of sleep
paralysis perceived as a demonic visitation: it portrays simultaneously a dreaming woman
and the content of her nightmare. The incubus and the horse’s head refer to contemporary
belief and folklore about nightmares.
A difficulty in studying hypnagogia lies in amnesia and the
fleeting nature of hypnagogic experiences. These problems
have been tackled by experimenters in a number of ways,
including voluntary or induced interruptions (Germain and
Nielsen, 1997), training introspection to heighten
observation and attention (Blackmore, 2003) and techniques
inducing or prolonging the duration of the hypnagogic state
(Silberer, 1909; West, 1962; Green et al, 1970; Budzynski,
1972; Stoyva, 1973; Braud et al, 1975). However, it should be
noted that these techniques may yield different brain
functional states than in the natural transition to sleep
(Schacter, 1976), although the subjective phenomena may
seem very similar.

16
Figure 3. Painting “The persistence of memory” by Salvador Dalí, who was intrigued with
the images which occur at the boundary between sleeping and waking. He experimented
with various ways of generating and capturing these fantastical images. His favorite method
was that he would put a tin plate on the floor and fall asleep while sitting on a chair with a
spoon in his hand. As soon as he dozed off, he would drop the spoon. The loud clang on the
plate would immediately wake him up to sketch the surreal images on a canvas. He called
this a paranoiacritical method, in which he accessed his subconscious for greater artistic
creativity.
1.3. Memory consolidation
To clarify our study about memory replay during resting
state wakefulness, I will describe the basics of memory
systems and memory maintenance in this chapter because
the novelty of this experiment is to characterize memory
consolidation directly, without confounding influences of
retrieval.
The mental ability to store, retain, and recall information
memories as long as years later is one of the most important
aspects of human behavior. Humans are able to acquire
new knowledge and we use our memories and in a way

1. Introduction
17
that affects our lives every day. In fact, being able to
memorize and access information is vital for survival.
However, little is known about how new memories are
formed, stored and accessed. The theory of memory
consolidation states that patterns of brain activity generated
during learning are spontaneously replayed afterwards,
which has been examined with invasive techniques in
animals and neuroimaging and computational methods in
humans.
Memory systems 1.3.1.
A major distinction can be made between sensory memory,
short-term and long-term memory. In humans, we can
further differentiate working memory, which is the capacity
of holding information for very short periods of time (in the
order of a few seconds or less) in the mind in order to
complete complex tasks involving attention and executive
aspects (Baddeley and Hitch, 1974; Baddeley, 2000).
Sensory memory includes separate stores for each modality:
sight, hearing, smell, touch, and taste. These stores are
assumed to serve as temporary buffers from which
information can be accessed for a very short time, namely
the initial 200 - 500 milliseconds after an item is perceived
through one of the senses (Jiang, 2004), after which they are
lost due to decay or to interference from more recent stimuli
(Winkler and Cowan, 2005). The short time window of
sensory memory is just long enough for the information to
be transferred to short-term memory. The capacity of
sensory memory is approximately 12 items, degrading very
quickly. This type of memory cannot be prolonged via
rehearsal.
In short-term memory, memories are stored for a very small
duration, ranging from seconds to a minute, without
rehearsal, and with a very limited capacity, usually 4 or 5
items (Miller, 1956) although this can be enhanced by
chunking.
On the other hand, in the long-term, memories are available
for retrieval after months or years, up to a whole life span,
with a huge storage capacity. Long-term memory can be
Chunking is a process
whereby responses are
grouped to more
effectively perform a
memory task. An
example is recalling a
telephone number in
groups, e.g. the area
code 04, and the
chunks 366 and 23 and
03.
18
differentiated further into different memory systems
(Anderson, 1976) (Figure 4):
- The declarative or explicit memory system stores
information that can be consciously recalled, such as
autobiographical memories, textbook knowledge, facts,
events, places and dates. For instance, semantic
memories pertain to common knowledge (e.g. what is
the capital of Belgium) and episodic memories pertain to
specific individual life events for which both content and
context can be consciously recalled and verbalized (e.g.
the first date with your husband or wife) (Schacter and
Tulving, 1994). The hippocampus in the medial temporal
lobe is essential for integrating new episodic
information, as has been found in patient HM.
- The non-declarative or implicit memory system, also
called procedural memory, contains information which
cannot be consciously recalled and verbalized, such as
skills, habits, procedures, abilities (e.g. how to ride a
bike or playing piano).
Encoding, consolidation and retrieval 1.3.2.
In the study about memory replay, we aim at visualizing
memory consolidation in a direct manner without
confounding influences of retrieval of that information or
concurrent encoding of new material. Therefore, in this
section I will first clarify the three main stages of memory
processing. Then, consolidation, which is our main point of
interest, will be described more in detail.
Henry Gustav
Molaison, known as
patient HM, was a
widely investigated
memory disorder
patient after his
hippocampi,
parahippocampal gyri
and amygdalae were
removed in an
experimental brain
surgery attempting to
cure epilepsy. His case
gave important
insights into memory
function and the
underlying neural
structures (Scoville and
Milner, 1957).

1. Introduction
19
Declarative, explicit
Non-declarative, implicit
Behavioral:
verbal paired
associate learning
tasks (i.e. word-
pairs and cued-
recall; nonsense
syllables; objects
location; short
stories; and word
lists
- conscious
- based on facts
- flexible
- readily acquired
during relatively few
exposures to events
or facts
- non-conscious
- less flexible
- requires much
longer exposure and
repetition of actions
Motor memory:
FTT; SRTT;
perceptual skills;
visual texture
discrimination;
sensory skills;
mirror tracing;
others: visuo-
motor
discrimination
Episodic
- events of
individual’s past (e.g.
spatio-temporal
recollection)
Procedural
- learning of skills
- habits
- actions
Semantic
- general knowledge
not related to events
(but related to facts)
Implicit
- exposure
- perceptual learning
- priming
Figure 4. Memory systems with examples of tasks, often used in research, recruiting one
specific memory system. FTT: finger tapping task; SRTT: serial reaction time task. Figure
adapted from (Shaffii-Le Bourdiec et al, 2010).
Three main processes are always underlying the
establishment of permanent memories, regardless of their
type (Squire et al, 1984):
- Encoding or registration includes the acquisition,
processing and combining of incoming information at
first encounter, which depends on motivation and
attention. The new information enters the brain along
pathways between neurons in the appropriate brain
area.
- Consolidation or storage, refers to the processes during
which the labile encoded information is altered by the
hippocampus to create a more permanent cortical record
which can be stored over a longer time period.
- Retrieval or recall refers to the processes that permit
calling back the information on purpose in response to
some cue, for use in a process or activity. We can
Memory consolidation
has been proposed
already a century ago
(Müller and Pilzecker,
1900). Moreover,
ancient rhetoricians
already noted that “The
interval will greatly
increase the strength of
the memory… the power
of recollection, which is
the most important
element of memory,
undergoes a process of
ripening and maturing
during the time which
intervenes, as to
strengthen the memory”
(Quintilian, 1st century
AD).
20
distinguish passive recognition (whether the subject has
encountered a stimulus before) and active recall memory
(requiring the subject to reproduce previously learned
information). The more frequently the information is
accessed, the easier it is to retrieve it.
Although most researchers agree on the exposed framework
for treatment of memory traces, many details of this process
are still unknown, especially regarding mnemonic
consolidation (Miller, 2012). Nowadays, we know that the
time course of memory consolidation consists of several
dynamic processes after initial encoding of new information
(for a review, see (Frankland and Bontempi, 2005)): synaptic
consolidation, which occurs within the first few minutes to
hours following acquisition; system consolidation, which
occurs over weeks to years, or alternatively the synaptic
downscaling theory; and recently a third process of
reconsolidation has been suggested. These processes will
now be described in more detail.
First, synaptic or cellular, local consolidation occurs,
necessary for the initial stabilization of memories. This
process is marked by altered protein synthesis, the growth
of new synaptic connections as well as the restructuring of
existing synapses. They depend on a cascade that is
initiated by synaptic activation, which leads to the
recruitment of second messenger systems, activation of
transcription factors and, ultimately, synthesis of new
proteins required for the structural changes (long-term
potentiation (Frankland et al, 2001; Hayashi et al, 2004)). Any
manipulation that interferes with any part of this cascade
will block memory formation. This synaptic reorganization
takes place in the minutes and hours following encoding
(Squire and Kandel, 2000; Dudai, 2004).
Second, occurring on a larger timescale (over a period of
weeks to years), system consolidation takes place during
which the memories are reorganized. Initially, declarative
memories are stored in cortical areas whereas the
hippocampus integrates this information (Eichenbaum,
2004). During system consolidation, spontaneous
reactivation of these hippocampo-cortical circuits will
progressively transfer all information to the cortical areas
Long-term potentiation
(LTP) is a prolonged
strengthening of
synaptic transmission
between neurons,
resulting from
synchronous
stimulation. LTP can be
thought of as a neural
correlate of memory
(Cooke and Bliss,
2006).
The synaptic
downscaling hypothesis
assumes a progressive
synaptic potentiation
throughout the brain
during wakefulness
(Tononi and Cirelli,
2006). Slow oscillations
during subsequent
NREM sleep are
generated in
proportion to local
neuronal work (Kattler
et al, 1994) and
learning during
previous wakefulness
(Huber et al, 2004), and
their decline during
sleep would reflect the
recalibration of
synaptic efficacy
(Vyazovskiy et al,
2009).

1. Introduction
21
which, by firing together, will progressively connect
(Figure 5) (Hebb’s rule). The memories would eventually be
stored mainly (Nadel et al, 2000) or exclusively (Frankland
and Bontempi, 2006) in neocortical areas, depending on the
memory system (Figure 6), and would thus become
relatively independent of the hippocampus. It has been
suggested that the medial prefrontal cortex would take over
the integrating function of the hippocampus (Takashima et
al, 2006). Spontaneous reactivations of these memory traces
can occur both during wakefulness (Hoffman and
McNaughton, 2002) and sleep (Ribeiro et al, 2004), which
will be further elaborated in the next chapter.
Third, reconsolidation may happen, in which previously
consolidated memories can be turned back into a labile state
through recalling the memory trace (Walker et al, 2003).
Reconsolidation can be considered as a never ending
process of consolidation and reorganization of memory
traces: new memories hence become integrated and
interleaved within a large network of relevant pre-existing
knowledge (McKenzie and Eichenbaum, 2011).
Importantly, during consolidation, memories are labile and
easily perturbed. Therefore, the events between encoding
and recall will influence the quality of the recollection. Such
interfering processes can range from pharmacological
administrations (e.g. protein synthesis blockers or receptor
antagonists (Gais et al, 2008)), physiological stimulations
such as transcranial magnetic stimulation (Ruzzoli et al,
2010), or simply behavioral interference with newly
encoded information (Ellenbogen et al, 2006).
Hebb’s rule explains the
adaptation of neurons
in the brain during the
learning process: “Let
us assume that the
persistence or repetition
of a reverberatory activity
(or trace) tends to induce
lasting cellular changes
that add to its stability....
When an axon of cell A is
near enough to excite a
cell B and repeatedly or
persistently takes part in
firing it, some growth
process or metabolic
change takes place in one
or both cells such that A's
efficiency, as one of the
cells firing B, is
increased” (Hebb, 1949).
It is often summarized
as "Cells that fire
together, wire
together.”
22
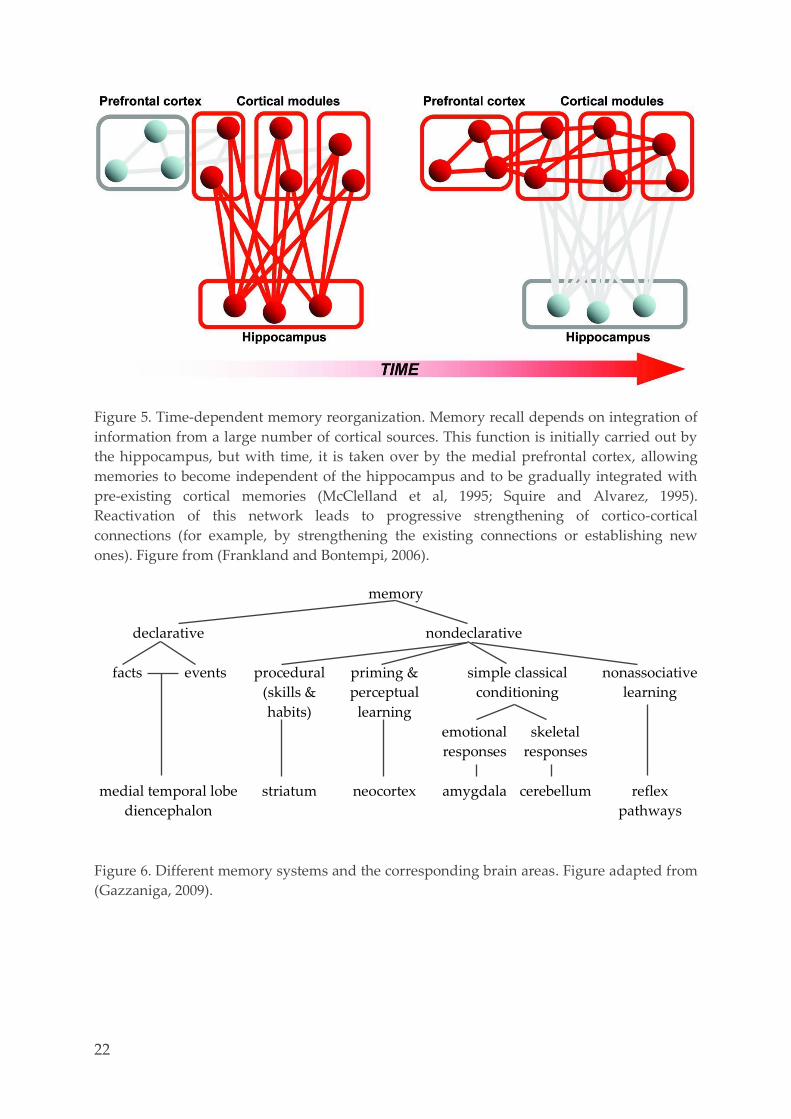
Figure 5. Time-dependent memory reorganization. Memory recall depends on integration of
information from a large number of cortical sources. This function is initially carried out by
the hippocampus, but with time, it is taken over by the medial prefrontal cortex, allowing
memories to become independent of the hippocampus and to be gradually integrated with
pre-existing cortical memories (McClelland et al, 1995; Squire and Alvarez, 1995).
Reactivation of this network leads to progressive strengthening of cortico-cortical
connections (for example, by strengthening the existing connections or establishing new
ones). Figure from (Frankland and Bontempi, 2006).
memory
declarative nondeclarative
facts events procedural
(skills &
habits)
priming &
perceptual
learning
simple classical
conditioning
nonassociative
learning
emotional
responses
skeletal
responses
medial temporal lobe
diencephalon
striatum neocortex amygdala cerebellum reflex
pathways
Figure 6. Different memory systems and the corresponding brain areas. Figure adapted from
(Gazzaniga, 2009).

1. Introduction
23
Replay 1.3.3.
Although the mechanisms by which a recent labile episodic
memory trace is consolidated to a long-lasting trace are not
yet fully understood (McGaugh, 2000), it has been
suggested that offline processing and spontaneous
repetitions of brain activity patterns could play a role in
consolidating recently formed memory traces. The neural
correlates of memory consolidation remain to be
characterized directly, and this is the aim of our second
study.
Multi-unit recordings in animals show that neural activity
during post-task wakefulness or sleep indeed tends to
repeat cell firing patterns recorded during training. Such
reactivation of mnemonic traces has been detected in rats
during slow wave sleep (Pavlides and Winson, 1989; Ji and
Wilson, 2007), rapid eye movement sleep (Louie and
Wilson, 2001) and wakeful resting state (Foster and Wilson,
2006) and in primates during rest (Hoffman and
McNaughton, 2002). Using voltage-sensitive dye-imaging,
activity motifs are replayed spontaneously during light
anesthesia and wakefulness in mice (Mohajerani et al, 2013).
These neural activities are deemed spontaneous, as they are
elicited in the absence of relevant external stimuli or cues.
The information given by these animal studies would be
nearly impossible to obtain in healthy humans, given the
invasive nature of the protocols such as single or multi-cell
intracranial recordings, histological marking, etc., although
task learning is not as rapidly achieved in rodents and other
primates as in humans. Because our study population
consists of healthy human participants, we will now have a
look at the properties of memory replay in humans in more
detail.
In humans, it is known that spatial activity patterns are
correlated with functional organization of preceding
wakefulness (Ramot et al, 2013) and that declarative
memories can be reactivated by cues (Rasch et al, 2007;
Diekelmann et al, 2011; Staresina et al, 2013) and by
associations (van Dongen et al, 2012).
An important factor in
the consolidating
process is that it takes
place when no further
information has to be
processed, i.e.
predominantly when
the cortex is offline
during sleep and
resting state
wakefulness, in order
to prevent
interferences.
Concurrent competing
retrieval of older
memories impairs
retrieval of newer
memories (Kuhl et al,
2012a).
24
During post-task wakefulness, task-learning modulates
regional brain responsiveness to other incoming stimuli
(Peigneux et al, 2006) and influences spontaneous brain
activity (Tambini et al, 2010; Deuker et al, 2013; Tambini
and Davachi, 2013). Moreover, replay of brain activity has
been detected immediately after encoding (Jafarpour et al,
2014). In other experiments, imagery of complex everyday
experiences could be reliably decoded from brain activity in
the human hippocampus (Chadwick et al, 2010; Deuker et
al, 2013). Although these studies only brought indirect
insight in the mechanism of memory consolidation, they
confirm the animal studies.
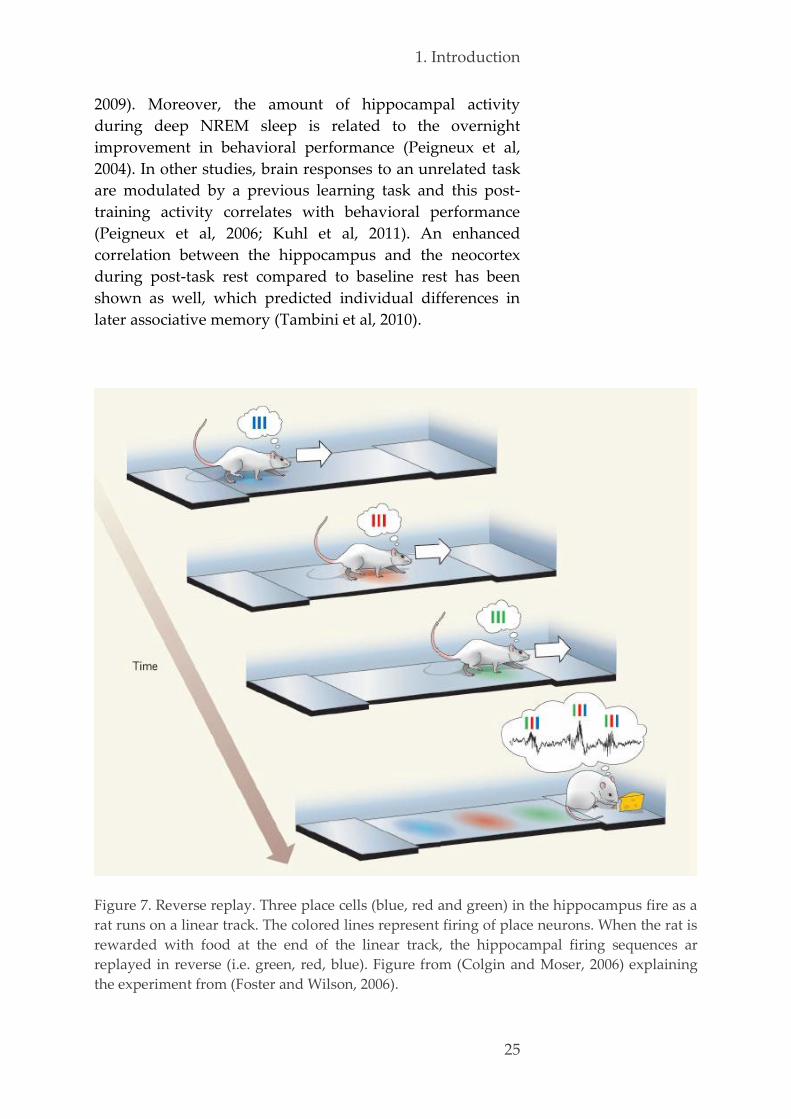
Temporally sequenced information seems to be conserved
during replay suggesting that the structure of the learning
material (the phase information) has to be maintained
during consolidation of memories. Likewise, during post-
learning periods, rodent multi-unit recordings showed that
neurons tend to fire following similar temporal sequences
as during learning, thereby preserving the temporal
configuration associated with the learned material across
cells either in a forward (Siapas and Wilson, 1998;
Kudrimoti et al, 1999; Nadasdy et al, 1999; Louie and
Wilson, 2001; Lee and Wilson, 2002; Diba and Buzsaki, 2007;
Euston et al, 2007) or backward sequence (Foster and
Wilson, 2006; Diba and Buzsaki, 2007) (Figure 7).
It seems that the temporal order of activation should be
preserved at the macroscopic level, namely across brain
areas, if the material to be learned imposed such a strict
temporal structure. In support of this, associative learning
memory of a temporal sequence is characterized by both
forward and backward associations among the stored items
of the sequence, with forward associations showing
stronger bonds (Kahana, 1996; Howard et al, 2005;
Drosopoulos et al, 2007).
Furthermore, the strength of the reactivations seems to be
linked to behavioral performance (Peigneux et al, 2004;
Peigneux et al, 2006; Girardeau et al, 2009; Tambini et al,
2010). Indeed, a disruption of memory consolidation during
post-training sleep by hippocampal stimulation resulted in
impaired behavioral task performance (Girardeau et al,
1. Introduction
25
2009). Moreover, the amount of hippocampal activity
during deep NREM sleep is related to the overnight
improvement in behavioral performance (Peigneux et al,
2004). In other studies, brain responses to an unrelated task
are modulated by a previous learning task and this post-
training activity correlates with behavioral performance
(Peigneux et al, 2006; Kuhl et al, 2011). An enhanced
correlation between the hippocampus and the neocortex
during post-task rest compared to baseline rest has been
shown as well, which predicted individual differences in
later associative memory (Tambini et al, 2010).
Figure 7. Reverse replay. Three place cells (blue, red and green) in the hippocampus fire as a
rat runs on a linear track. The colored lines represent firing of place neurons. When the rat is
rewarded with food at the end of the linear track, the hippocampal firing sequences ar
replayed in reverse (i.e. green, red, blue). Figure from (Colgin and Moser, 2006) explaining
the experiment from (Foster and Wilson, 2006).
26
Finally, animal studies showed that reactivations of
previously active cell assemblies occur preferentially during
the first half hour after exploration (Kudrimoti et al, 1999;
Girardeau et al, 2009) with a decay constant of 12 (Wilson
and McNaughton, 1994) à 13 (Kudrimoti et al, 1999) to
30 minutes after the encoding (Ji and Wilson, 2007). On the
other hand, human studies found no effect of time on seed
correlations in a 10 minute rest period (Tambini et al, 2010).
The time frame of the repeated patterns also seems to be
scaled, as several experiments have yielded a variable
compression factor in SWS from 5-10 times compression (Ji
and Wilson, 2007), 6 to 7 fold (Euston et al, 2007) to a 20 fold
compression in SWS (Lee and Wilson, 2002). In REM sleep,
replayed activity patterns were reported on a similar
timescale (Louie and Wilson, 2001).
Limitations and challenges 1.3.4.
Although the animal studies in the previous paragraphs
support the theory of memory consolidation and give hints
on its temporal aspect, they do not allow a non-invasive and
direct characterization of mnemonic traces during resting
state wakefulness in humans.
Behavioral challenge: characterizing consolidation
In humans, memories are usually probed either during
encoding (Kuhl et al, 2012b; Jafarpour et al, 2014) or during
retrieval (Polyn et al, 2005; Chadwick et al, 2010; Kuhl et al,
2011; Staresina et al, 2013) with non-invasive neuroimaging
techniques but their latent status between these two steps,
consolidation, is more difficult to examine because this is a
spontaneous phenomenon of which the temporal and
spatial distributions are not yet understood. Usually, this
problem is avoided by asking the subject to recollect the
learned information. However, in this case the
characterization of the memory trace is contaminated by
processes engaged in retrieval of the learned item (Gais et
al, 2007; Sterpenich et al, 2007; Albouy et al, 2008). In order
to avoid such confounding effect, experimental protocols
have been developed during which the cerebral responses
to a probe task are modified by previous learning
experiences (Peigneux et al, 2006; Kuhl et al, 2011).

1. Introduction
27
Nevertheless, although no retrieval effort is asked from the
volunteers, the characterization of the memory trace stays
indirect.
Methodological challenges
Examining spontaneous activity in resting state, eyes closed
and not submitted to any external stimulation, is a better
option but this methodology represents other challenges,
namely the huge dimensionality of the data and the absence
of a ground truth. Up to now, typical research designs
aimed at reducing the dimensionality of the data (Margulies
et al, 2010), for example by computing activation maps in a
standard GLM analysis or by selecting regions of interest.
Although mass univariate analysis (Friston et al, 2007)
brought indirect insight on regionally specific inferences on
brain function and structure (Peigneux et al, 2006; Tambini
et al, 2010), confirming what was shown in animals using
intracranial recordings, there are limitations on examining
voxels in a mass univariate fashion.
In order to characterize memory consolidation directly on a
macroscopic level, brain decoding or mind reading
techniques are the most appropriate techniques. These
techniques consist in predicting the individual mental
representations, conscious or not, based on an objective
measurement of brain activity (Haynes and Rees, 2006)
(Figure 8).
Limitations of mass
univariate analysis:
- Spatially distributed
sets of voxels
considered outside the
peak areas that are
labeled as non-
significant by the SPM
analysis of an
experimental
condition, might still
carry information, and
hence contribute to a
more accurate
classification.
Including only the
peak category-selective
regions of interest has
been shown to yield a
less sensitive
classification (Polyn et
al, 2005).
- The independent and
identically distributed
(IID) assumption of
SPM is often not met
because neighboring
voxels are not
independent of each
other.
- Classic mass
univariate analyses are
mainly designed to
perform group-wise
comparisons and
would therefore be
unsuitable to evaluate
the mental state of an
individual.
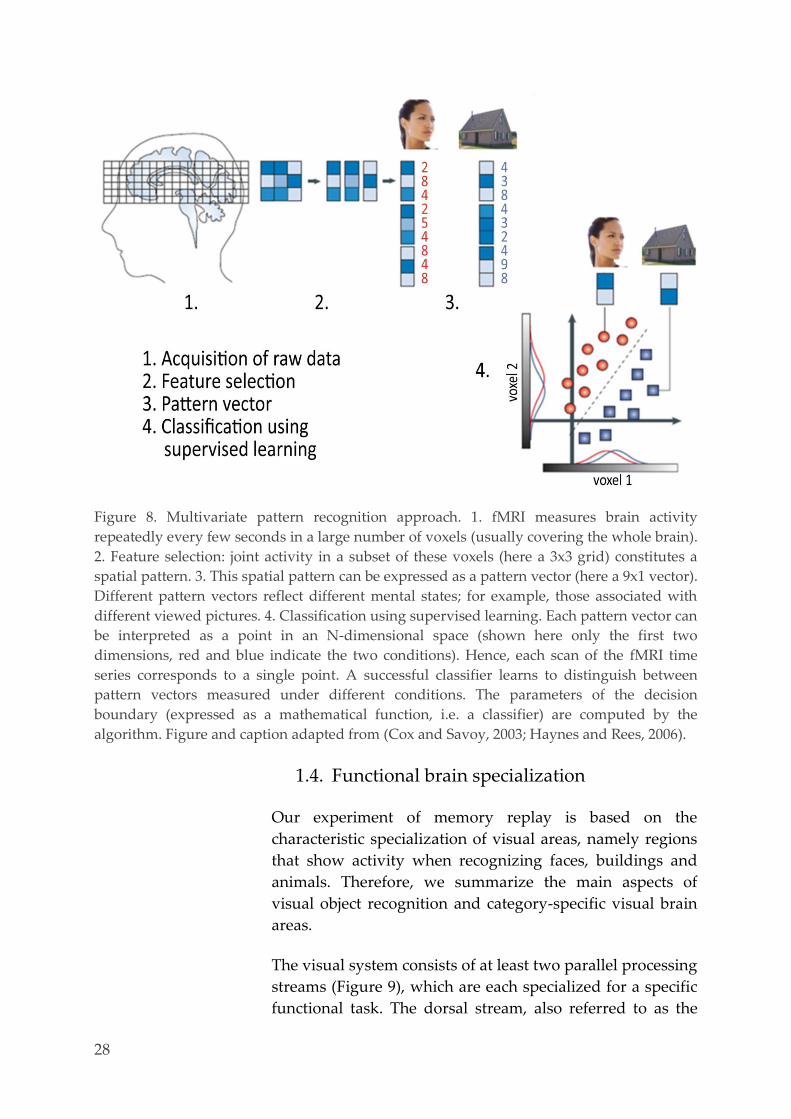
28
Figure 8. Multivariate pattern recognition approach. 1. fMRI measures brain activity
repeatedly every few seconds in a large number of voxels (usually covering the whole brain).
2. Feature selection: joint activity in a subset of these voxels (here a 3x3 grid) constitutes a
spatial pattern. 3. This spatial pattern can be expressed as a pattern vector (here a 9x1 vector).
Different pattern vectors reflect different mental states; for example, those associated with
different viewed pictures. 4. Classification using supervised learning. Each pattern vector can
be interpreted as a point in an N-dimensional space (shown here only the first two
dimensions, red and blue indicate the two conditions). Hence, each scan of the fMRI time
series corresponds to a single point. A successful classifier learns to distinguish between
pattern vectors measured under different conditions. The parameters of the decision
boundary (expressed as a mathematical function, i.e. a classifier) are computed by the
algorithm. Figure and caption adapted from (Cox and Savoy, 2003; Haynes and Rees, 2006).
1.4. Functional brain specialization
Our experiment of memory replay is based on the
characteristic specialization of visual areas, namely regions
that show activity when recognizing faces, buildings and
animals. Therefore, we summarize the main aspects of
visual object recognition and category-specific visual brain
areas.
The visual system consists of at least two parallel processing
streams (Figure 9), which are each specialized for a specific
functional task. The dorsal stream, also referred to as the
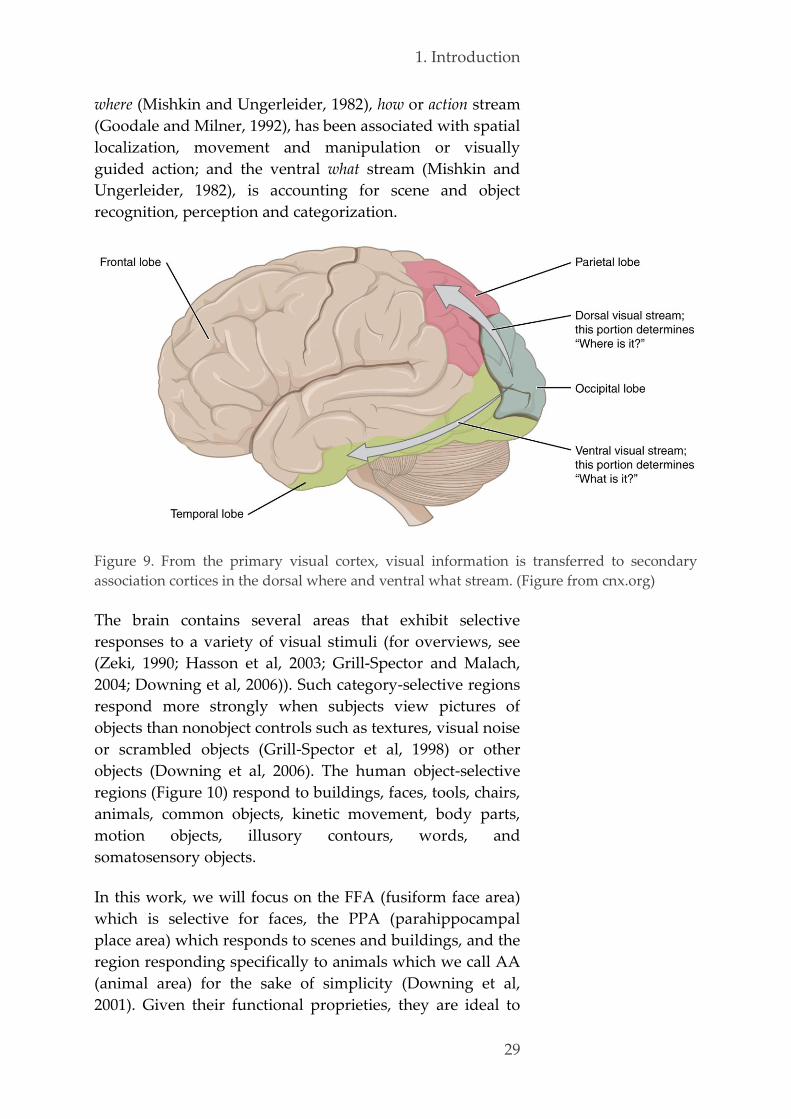
1. Introduction
29
where (Mishkin and Ungerleider, 1982), how or action stream
(Goodale and Milner, 1992), has been associated with spatial
localization, movement and manipulation or visually
guided action; and the ventral what stream (Mishkin and
Ungerleider, 1982), is accounting for scene and object
recognition, perception and categorization.
Figure 9. From the primary visual cortex, visual information is transferred to secondary
association cortices in the dorsal where and ventral what stream. (Figure from cnx.org)
The brain contains several areas that exhibit selective
responses to a variety of visual stimuli (for overviews, see
(Zeki, 1990; Hasson et al, 2003; Grill-Spector and Malach,
2004; Downing et al, 2006)). Such category-selective regions
respond more strongly when subjects view pictures of
objects than nonobject controls such as textures, visual noise
or scrambled objects (Grill-Spector et al, 1998) or other
objects (Downing et al, 2006). The human object-selective
regions (Figure 10) respond to buildings, faces, tools, chairs,
animals, common objects, kinetic movement, body parts,
motion objects, illusory contours, words, and
somatosensory objects.
In this work, we will focus on the FFA (fusiform face area)
which is selective for faces, the PPA (parahippocampal
place area) which responds to scenes and buildings, and the
region responding specifically to animals which we call AA
(animal area) for the sake of simplicity (Downing et al,
2001). Given their functional proprieties, they are ideal to
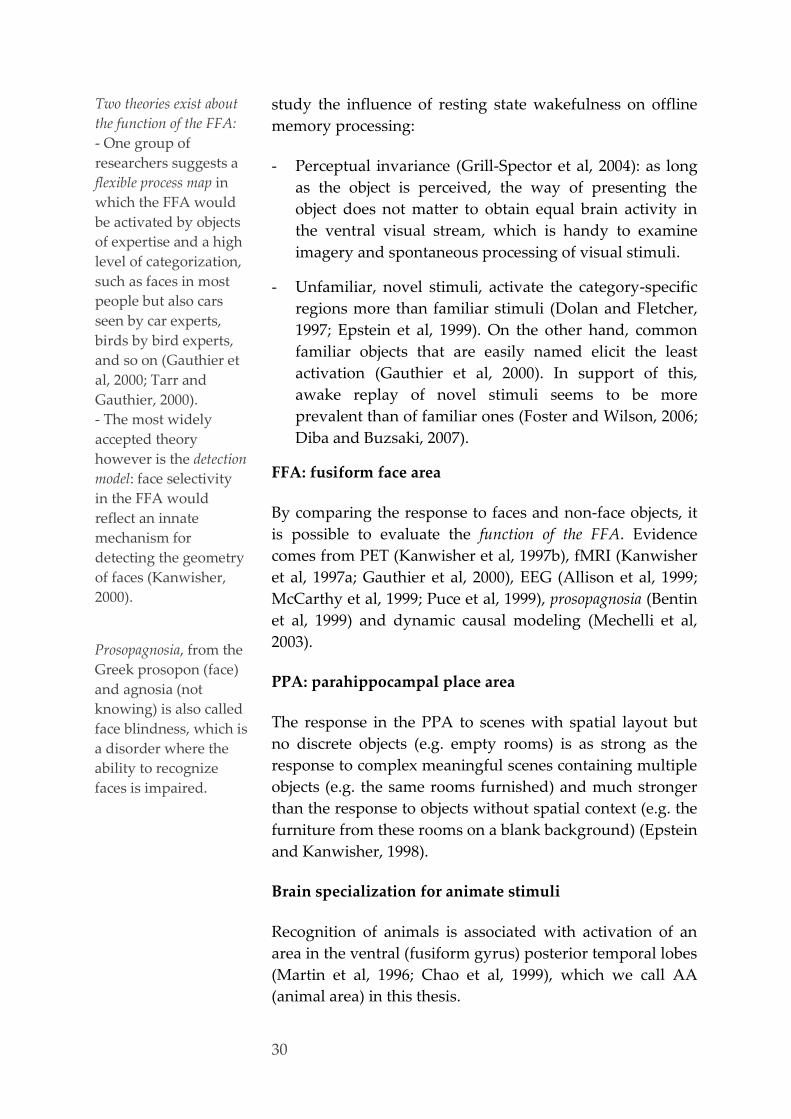
30
study the influence of resting state wakefulness on offline
memory processing:
- Perceptual invariance (Grill-Spector et al, 2004): as long
as the object is perceived, the way of presenting the
object does not matter to obtain equal brain activity in
the ventral visual stream, which is handy to examine
imagery and spontaneous processing of visual stimuli.
- Unfamiliar, novel stimuli, activate the category-specific
regions more than familiar stimuli (Dolan and Fletcher,
1997; Epstein et al, 1999). On the other hand, common
familiar objects that are easily named elicit the least
activation (Gauthier et al, 2000). In support of this,
awake replay of novel stimuli seems to be more
prevalent than of familiar ones (Foster and Wilson, 2006;
Diba and Buzsaki, 2007).
FFA: fusiform face area
By comparing the response to faces and non-face objects, it
is possible to evaluate the function of the FFA. Evidence
comes from PET (Kanwisher et al, 1997b), fMRI (Kanwisher
et al, 1997a; Gauthier et al, 2000), EEG (Allison et al, 1999;
McCarthy et al, 1999; Puce et al, 1999), prosopagnosia (Bentin
et al, 1999) and dynamic causal modeling (Mechelli et al,
2003).
PPA: parahippocampal place area
The response in the PPA to scenes with spatial layout but
no discrete objects (e.g. empty rooms) is as strong as the
response to complex meaningful scenes containing multiple
objects (e.g. the same rooms furnished) and much stronger
than the response to objects without spatial context (e.g. the
furniture from these rooms on a blank background) (Epstein
and Kanwisher, 1998).
Brain specialization for animate stimuli
Recognition of animals is associated with activation of an
area in the ventral (fusiform gyrus) posterior temporal lobes
(Martin et al, 1996; Chao et al, 1999), which we call AA
(animal area) in this thesis.
Prosopagnosia, from the
Greek prosopon (face)
and agnosia (not
knowing) is also called
face blindness, which is
a disorder where the
ability to recognize
faces is impaired.
Two theories exist about
the function of the FFA:
- One group of
researchers suggests a
flexible process map in
which the FFA would
be activated by objects
of expertise and a high
level of categorization,
such as faces in most
people but also cars
seen by car experts,
birds by bird experts,
and so on (Gauthier et
al, 2000; Tarr and
Gauthier, 2000).
- The most widely
accepted theory
however is the detection
model: face selectivity
in the FFA would
reflect an innate
mechanism for
detecting the geometry
of faces (Kanwisher,
2000).
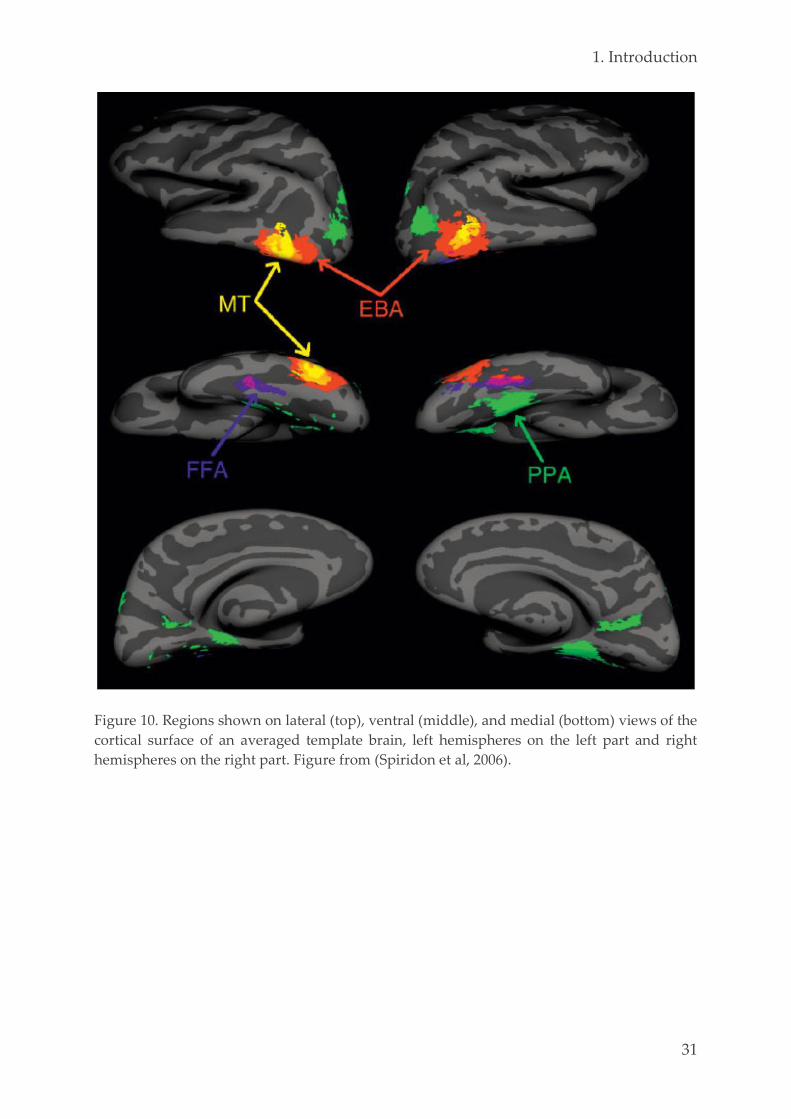
1. Introduction
31
Figure 10. Regions shown on lateral (top), ventral (middle), and medial (bottom) views of the
cortical surface of an averaged template brain, left hemispheres on the left part and right
hemispheres on the right part. Figure from (Spiridon et al, 2006).

32

33

34

35
2. OBJECTIVES In this work, we aim to investigate human spontaneous
brain activity and its relationship to early memory
processing, using multimodal techniques. To this end, we
have conducted two main studies:
- A behavioral study of hypnagogic hallucinations at sleep
onset during daytime naps after task practice, while
volunteers were online monitored with
polysomnography consisting of electrooculography,
electromyography and a basic electroencephalogram.
Behavioral questionnaires and verbal reports of the
hypnagogic hallucinations were recorded and further
investigated.
- A study of resting state wakefulness after task learning,
while participants were scanned continuously with
functional magnetic resonance imaging. Time series
were meticulously explored with four state-of-the-art
techniques (dynamic causal modeling, correlations and
explained variance, identification of spatial networks
based on independent component analysis, and
multivoxel pattern analysis based on machine learning
techniques).
Our first goal is to examine whether explicit learning would
lead to an increase in task-related brain activity. It needs to
be confirmed whether learning of a visuospatial task can
induce task-related spontaneous reactivations immediately
afterwards and whether these reactivations contain the
same modalities as the task itself. It will be interesting to see
whether these spontaneous reactivations can reach the level
of consciousness, namely as hypnagogic hallucinations at
sleep onset or thoughts during resting wakefulness.
The second important objective is to relate reactivation to
memory performance. If spontaneous reactivations of task-
related brain activity play a role in offline memory
processing, it would be logical that they improve
subsequent performance, and this only in the memory
condition, not in the control condition.

36
The third aim is to see if the temporal structure of the
encoding events is preserved during reactivation, if the
learned task imposes a strict temporal sequence of brain
activity patterns.

37

38

39
3. RESEARCH STUDY 1: SLEEP ONSET
This chapter is based on:
Kussé C, Shaffii-Le Bourdiec A, Schrouff J, Matarazzo L,
Maquet P (2012) Experience-dependent induction of
hypnagogic images during daytime naps: a combined
behavioural and EEG study. J Sleep Res 21(1): 10-20. (Kussé et al, 2012)
Significance
This study characterizes hypnagogic hallucinations
reported during a polygraphically recorded daytime nap
following or preceding a task (the computer game Tetris).
We found that task-related hypnagogic hallucinations were
more consistently induced by experience than by
anticipation, incorporating the same modalities of the task,
and they were predominantly observed during the
transition of wakefulness to sleep.
40
3.1. Objectives
The aim of this study is to characterize at a behavioral level
the spontaneous processing of visuospatial learning, via the
appearance of task related hypnagogic hallucinations.
The present study is conducted in the framework of a
broader research effort which attempts to characterize the
cerebral correlates of conscious processes like thoughts,
hypnagogic hallucinations and dreams during the different
states of consciousness. However, studying the stream of
consciousness using objective methods like EEG or fMRI is
difficult for two reasons: it is unconstrained and
unpredictable. In this context, studying hypnagogic
hallucinations is an interesting model because their content
and timing can be experimentally constrained.
Hypnagogic hallucinations are conscious mental
representations that emerge spontaneously at sleep onset.
Early observations dating back to the XIXth century
suggested that stereotypical hypnagogic imagery can be
related to the sensory stimuli during previous waking
activities (Maury, 1865; Ward, 1883; Myers, 1892; Leroy,
1926; Vihvelin, 1948; Hanawalt, 1954; McKellar, 1957; Hebb,
1968). Recent studies experimentally confirmed that
incorporation of stereotypical images into nighttime sleep-
onset mentation can be induced by prior practice of video
games, such as Tetris (Rowley et al, 1998; Stickgold et al,
2000), or Alpine Racer, a downhill skiing game (Emberger,
2001; Stickgold et al, 2001a; Wamsley et al, 2010). However,
several features of this intriguing phenomenon are still
incompletely characterized.
First, experience-related hypnagogic hallucinations were
exclusively reported during nighttime sleep onset
(Stickgold et al, 2000; Wamsley et al, 2010). However, it was
not known whether this phenomenon was restricted to
nocturnal sleep and whether naps would be as efficient in
eliciting it. Although it is known that other sleep-related
spontaneous mental experiences, such as dreams, follow a
circadian modulation (Chellappa et al, 2009), and daytime
sleep is usually shorter and shallower and with longer
sleep-onset latency (Carskadon and Dement, 1977;
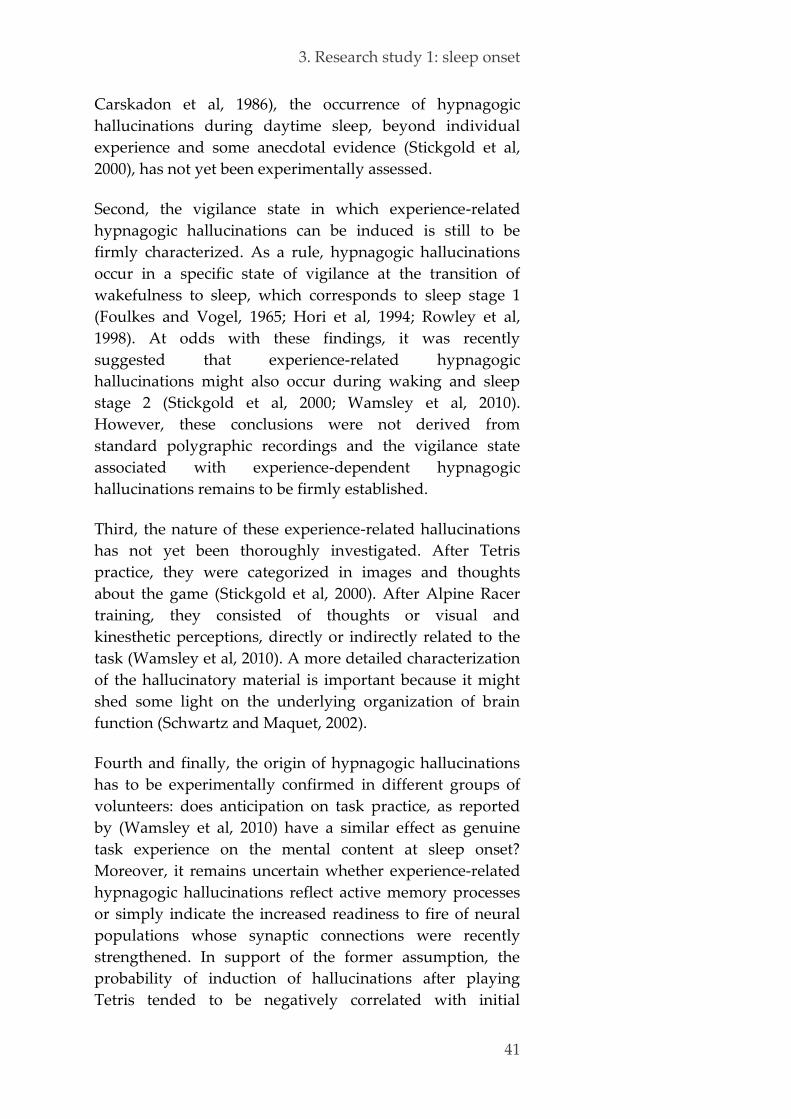
3. Research study 1: sleep onset
41
Carskadon et al, 1986), the occurrence of hypnagogic
hallucinations during daytime sleep, beyond individual
experience and some anecdotal evidence (Stickgold et al,
2000), has not yet been experimentally assessed.
Second, the vigilance state in which experience-related
hypnagogic hallucinations can be induced is still to be
firmly characterized. As a rule, hypnagogic hallucinations
occur in a specific state of vigilance at the transition of
wakefulness to sleep, which corresponds to sleep stage 1
(Foulkes and Vogel, 1965; Hori et al, 1994; Rowley et al,
1998). At odds with these findings, it was recently
suggested that experience-related hypnagogic
hallucinations might also occur during waking and sleep
stage 2 (Stickgold et al, 2000; Wamsley et al, 2010).
However, these conclusions were not derived from
standard polygraphic recordings and the vigilance state
associated with experience-dependent hypnagogic
hallucinations remains to be firmly established.
Third, the nature of these experience-related hallucinations
has not yet been thoroughly investigated. After Tetris
practice, they were categorized in images and thoughts
about the game (Stickgold et al, 2000). After Alpine Racer
training, they consisted of thoughts or visual and
kinesthetic perceptions, directly or indirectly related to the
task (Wamsley et al, 2010). A more detailed characterization
of the hallucinatory material is important because it might
shed some light on the underlying organization of brain
function (Schwartz and Maquet, 2002).
Fourth and finally, the origin of hypnagogic hallucinations
has to be experimentally confirmed in different groups of
volunteers: does anticipation on task practice, as reported
by (Wamsley et al, 2010) have a similar effect as genuine
task experience on the mental content at sleep onset?
Moreover, it remains uncertain whether experience-related
hypnagogic hallucinations reflect active memory processes
or simply indicate the increased readiness to fire of neural
populations whose synaptic connections were recently
strengthened. In support of the former assumption, the
probability of induction of hallucinations after playing
Tetris tended to be negatively correlated with initial

42
performance, suggesting that individuals who reported
most hallucinations at sleep onset were those with the
largest potential learning range (Stickgold et al, 2000).
Here we address these different issues and characterize
hypnagogic hallucinations in a between-subjects design, in
three groups of volunteers who practiced Tetris
(experimental and anticipation groups) or not (control
group) using iterative awakenings during polygraphically-
monitored daytime naps.
3.2. Material & methods
Ethics 3.2.1.
This study was approved by the Ethics Committee of the
Faculty of Medicine of the University of Liège. During
recruitment, all participants of all groups were fully
informed about the protocol and EEG. This information was
repeated on arrival at the lab. All gave their written
informed consent.
Population 3.2.2.
The participants were mainly recruited through the forum
of the website of the University of Liège (www.ulg.ac.be)
and were paid for their participation. They were young (age
18-33), non-smoking, right-handed healthy volunteers. The
absence of medical, traumatic, psychiatric or sleep disorders
was established in a semi-structured interview using
standardized questionnaires.
None complained of excessive daytime sleepiness as
assessed by the Epworth Sleepiness Scale ((Johns, 1991);
scores ≤ 10), nor of sleep disturbances as determined by the
Pittsburgh Sleep Quality Index Questionnaire ((Buysse et al,
1989); score ≤ 6). All participants had normal scores on the
Beck Anxiety Inventory ((Beck et al, 1988); score ≤ 7) and the
Beck Depression Inventory II ((Steer et al, 1997);
scores ≤ 13). They were right-handed as indicated by the
Edinburgh Inventory (Oldfield, 1971). Extreme chronotypes
according to the Horne and Ostberg morningness-
eveningness questionnaire were excluded ((Horne and
Ostberg, 1976); scores < 30 and > 70). They were moderate

3. Research study 1: sleep onset
43
caffeine and alcohol consumers and none was on
medication (except oral contraceptives for women). None
had worked on night shifts or traveled across more than one
time zone during the last two months. Participants did not
have extensive prior experience in computer games (e.g.
Tetris). The amount and content of their dreams was
examined with the Waterloo unusual sleep experiences
scale, London sleep and dream questionnaire, and dream
diary.
Subjects were instructed to eat normally but to abstain from
stimulants (such as coffee, tea, coca cola, red bull, etc.) and
cigarettes. They were asked to maintain a regular sleep-
wake rhythm without daytime naps in the seven days
before and during the experiment. During this period, their
sleep-wake cycle was assessed by a sleep agenda and wrist
actigraphy (Actiwatch, Cambridge Technology, UK).
Volunteers who showed deviations for more than
15 minutes from the habitual sleep-wake schedule, were
excluded. All questionnaires were presented in the
volunteer's native language, i.e. French, Dutch or English.
Experimental design 3.2.3.
3.2.3.1. General overview
Three groups were examined (Figure 11):
1) Tetris group (Figure 11 top): The experiment was run on
three consecutive days. In the morning of each experimental
day, six hours after sleep midpoint (SMP), the volunteers
were asked to play Tetris.
2) Control group (Figure 11 middle): A separate control
group of volunteers followed exactly the same protocol as
the Tetris group, except that the experiment was run on a
single day and that volunteers did not practice Tetris at all.
They stayed in the laboratory and were allowed to read but
not play card or computer games.
3) Anticipation group (Figure 11 bottom): A third separate
group of volunteers was examined during one single day
and again followed exactly the same protocol as the Tetris

44
group, except that the Tetris practice session was scheduled
after the afternoon nap.
At noon, the volunteers received a light meal and were
prepared for polygraphic recordings, which included EEG,
EOG and EMG (for details, see 3.2.4.1). Ten hours after
individual sleep midpoint, volunteers were asked to sleep
in a quiet room at the laboratory under constant
polygraphic monitoring. They could interact with the
experimenter through an intercom, and were wearing a
headset.
In all groups, subjective sleepiness and vigilance were
measured four times throughout the experimental day:
before and after task practice in the morning, and before
and after the afternoon nap. The latter PVT was conducted
after the removal and cleaning of the electrodes to avoid
post-sleep drowsiness.
3.2.3.2. Assessment of sleepiness and
alertness
A psychomotor vigilance task (PVT) was used to estimate
vigilance for 5 minutes by measuring the motor reaction
time (pressing a response button with the thumb of the
dominant hand) to a visual stimulus which was presented
using random interstimulus intervals ranging from 1 to 9
seconds (Dinges and Powell, 1985; Kribbs and Dinges, 1994;
Loh et al, 2004; Kaida et al, 2006). The PVT was conducted
before and after the Tetris practice sessions, and before and
after the 90 minute afternoon nap.
The Karolinska Sleepiness Scale (KSS) (Akerstedt and
Gillberg, 1990; Akerstedt et al, 1994) is a subjective ranking
of alertness by the subject itself (on a 9 point scale; 1 being
very alert, 3 normal level of alertness, 5 neither alert nor
sleepy, 7 sleepy but not fighting sleep, 9 very sleepy and
fighting sleep), and was asked before and after the Tetris
practice sessions, after each completed Tetris game, before
and after the 90 minute afternoon nap, and at every
awakening during the nap.
45
Group SMP + 6.00h Lunch SMP + 10.00h SMP + 11.30h
Tetris KSS
PVT
Tetris
8x15’
KSS
PVT
Calibrated snack
Electrodes PSG
KSS
PVT
Recording during nap + awakenings at KSS
PVT
/
15”
KSS
45”
KSS
75”
KSS
120”
KSS
180”
KSS
Control KSS
PVT
/ KSS
PVT
Calibrated snack
Electrodes PSG
KSS
PVT
Recording during nap + awakenings at KSS
PVT
/
15”
KSS
45”
KSS
75”
KSS
120”
KSS
180”
KSS
Anticipation KSS
PVT
/ KSS
PVT
Calibrated snack
Electrodes PSG
KSS
PVT
Recording during nap + awakenings at KSS
PVT
Tetris
8 x 15’ 15”
KSS
45”
KSS
75”
KSS
120”
KSS
180”
KSS
Figure 11. Time schedule of the study design for one experimental day. The same protocol was followed across three days in the experimental
Tetris group.
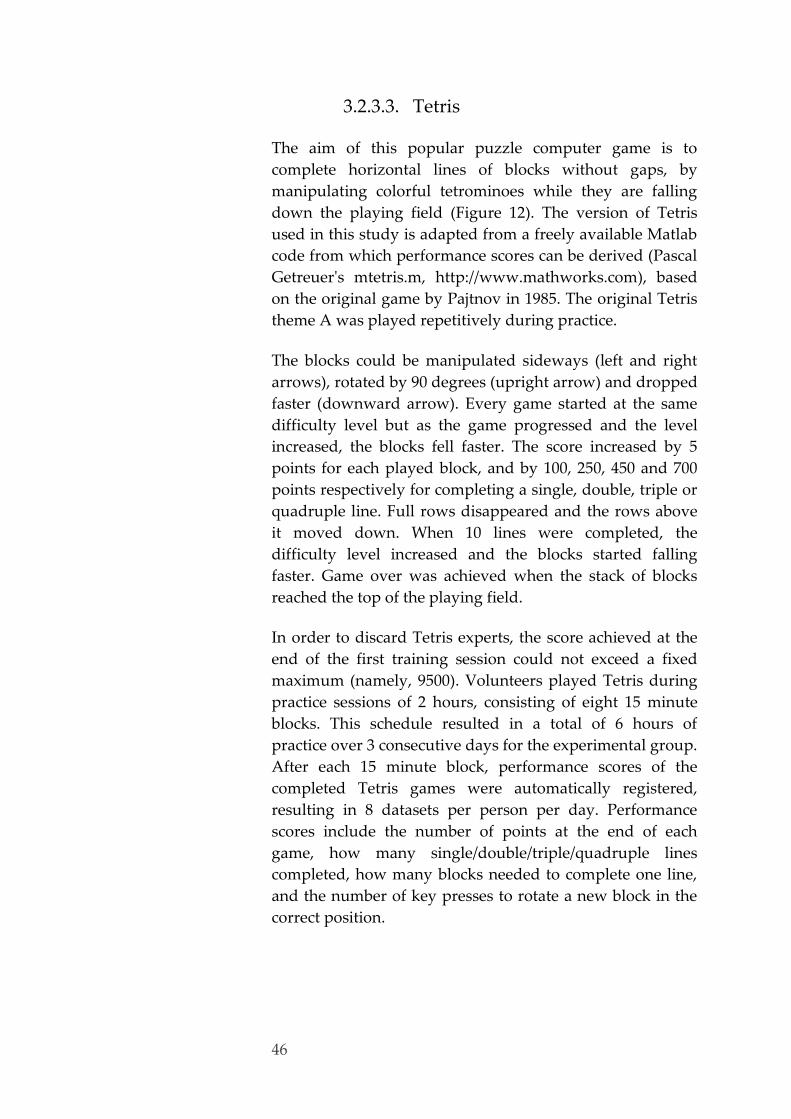
46
3.2.3.3. Tetris
The aim of this popular puzzle computer game is to
complete horizontal lines of blocks without gaps, by
manipulating colorful tetrominoes while they are falling
down the playing field (Figure 12). The version of Tetris
used in this study is adapted from a freely available Matlab
code from which performance scores can be derived (Pascal
Getreuer's mtetris.m, http://www.mathworks.com), based
on the original game by Pajtnov in 1985. The original Tetris
theme A was played repetitively during practice.
The blocks could be manipulated sideways (left and right
arrows), rotated by 90 degrees (upright arrow) and dropped
faster (downward arrow). Every game started at the same
difficulty level but as the game progressed and the level
increased, the blocks fell faster. The score increased by 5
points for each played block, and by 100, 250, 450 and 700
points respectively for completing a single, double, triple or
quadruple line. Full rows disappeared and the rows above
it moved down. When 10 lines were completed, the
difficulty level increased and the blocks started falling
faster. Game over was achieved when the stack of blocks
reached the top of the playing field.
In order to discard Tetris experts, the score achieved at the
end of the first training session could not exceed a fixed
maximum (namely, 9500). Volunteers played Tetris during
practice sessions of 2 hours, consisting of eight 15 minute
blocks. This schedule resulted in a total of 6 hours of
practice over 3 consecutive days for the experimental group.
After each 15 minute block, performance scores of the
completed Tetris games were automatically registered,
resulting in 8 datasets per person per day. Performance
scores include the number of points at the end of each
game, how many single/double/triple/quadruple lines
completed, how many blocks needed to complete one line,
and the number of key presses to rotate a new block in the
correct position.

3. Research study 1: sleep onset
47
Figure 12. The computer game Tetris in progress from left to right, as used in this study.
Volunteers have to manipulate the orientation of the falling tetrominoes to obtain solid rows
of blocks without gaps. Solid rows of blocks disappear and the rows above this line each
move down one row.
3.2.3.4. Awakenings
During the nap, volunteers were monitored online with
polysomnography (see 3.2.4 for details) and repetitively
woken up by an auditory stimulus delivered 15, 45, 75, 120
or 180 seconds after the onset of sleep stage 1, in a
pseudorandom order (see Figure 53 and following figures
in annex 6.1 for examples of the online monitoring). On
each awaking, volunteers were instructed to report their
level of sleepiness according to the KSS and any "thoughts,
images, feelings, sensations or anything else going through their
mind". All verbal reports were recorded. According to the
sleep stage at the moment of the report, several conditions
were possible:
- If S1 latency exceeded 10 minutes, a wake report was
requested 10 minutes after the last report.
- If subjects woke up spontaneously within the last
seconds of the foreseen interval, a wake report was
asked.
- If they descended to sleep stage 2 within the foreseen
interval, they received the auditory wake-up stimulus at
the planned interval. If they woke up and reported, the

48
experiment was continued. However, if they did not
wake up to report their mental content within
30 seconds, a new auditory stimulus was sent
immediately. If this new auditory stimulus was still
insufficient, the experimenter went into the room to
wake up the participant.
Polysomnography 3.2.4.
3.2.4.1. Methodological considerations
Polysomnography (PSG) is a multiparametric test used in
sleep studies, measuring brain activity with
electroencephalography, EEG (Davis et al, 1937; Loomis et al,
1937a; Loomis et al, 1937b; Roth, 1961), horizontal and
vertical eye movements with electrooculography, EOG
(Dement and Kleitman, 1957a), and muscle activity with
electromyography, EMG (Foulkes and Vogel, 1965).
For our basic sleep EEG (Rechtschaffen and Kales, 1968; Iber
et al, 2007), we located 13 electrodes according to the 10-20
system, an internationally recognized method to apply
scalp EEG electrodes to ensure standardized reproducibility
over time and over subjects (Figure 13) (Niedermeyer and
da Silva, 2004). We used Fz, Cz, Pz and Oz, referenced to
the mean of A1 and A2, vertical and horizontal EOG, chin
EMG, and a ground electrode on the midline of the
forehead. The EEG allows us to detect K-complexes which
are prominent on frontal areas (Happe et al, 2002), sleep
spindles which predominate on the midline, and occipital
alpha rhythm which wanes away at sleep onset.
We applied a four-channel EOG. Two electrodes to detect
horizontal eye movements were placed 1cm lateral to the
outer cantus of both eyes, and two electrodes for vertical
movements were placed infraorbital and supraorbital
(Rechtschaffen and Kales, 1968), allowing the detection of
horizontal movements of both eyes and vertical movements
of one eye. The EOG helps to detect wakefulness (saccades),
the beginning of sleep stage 1 (slow rolling eye movements
(SEM) in the range of 0.25-0.5Hz, mainly horizontally), sleep
stage 2 (disappearance of SEMs) and rapid eye movement
sleep (REM sleep, brusque movements in all directions).
Electroencephalography
is a recording of
electrical activity along
the scalp, based on
voltage fluctuations
resulting from ionic
current flows caused
by neuronal activity
(Baillet et al, 2001). A
high sampling rate (in
the order of
milliseconds) allows
for an accurate
recording of high
frequency brain
oscillations. Scalp EEG
activity shows
oscillations at a variety
of signals, with
frequencies and spatial
distributions that are
characteristic for the
different sleep-wake
states. A typical adult
human scalp EEG
signal has amplitudes
of about 10 to 100 µV.
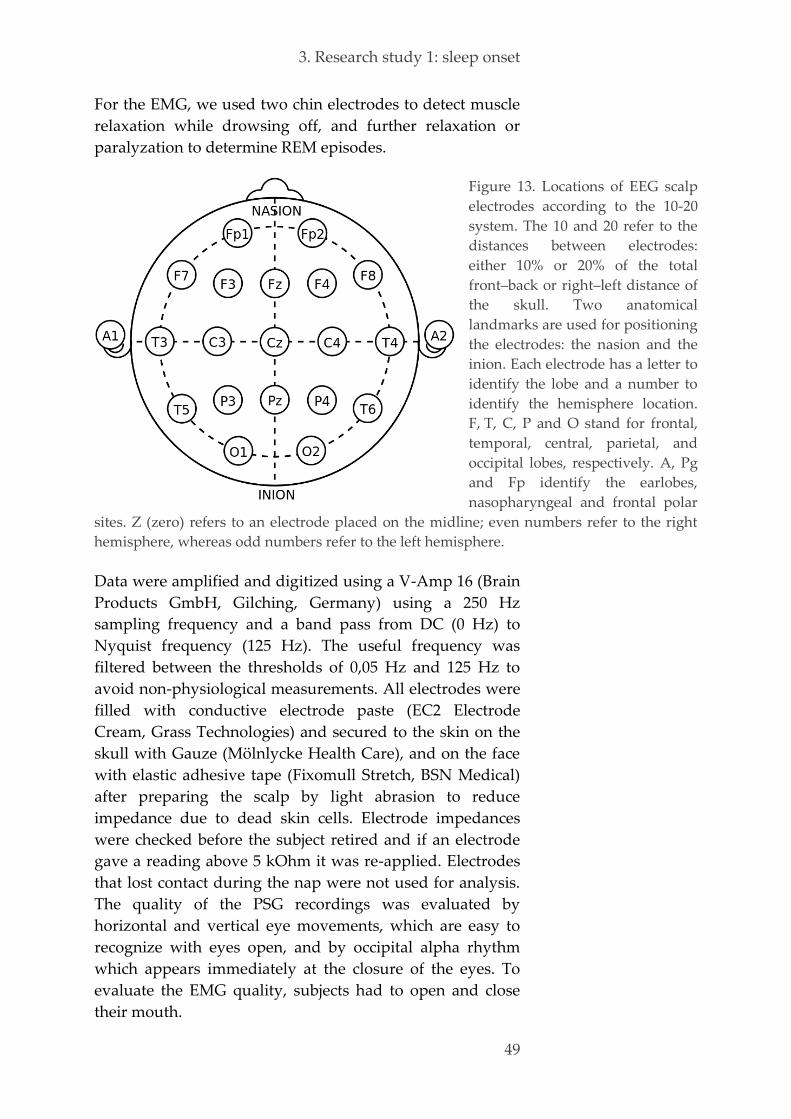
3. Research study 1: sleep onset
49
For the EMG, we used two chin electrodes to detect muscle
relaxation while drowsing off, and further relaxation or
paralyzation to determine REM episodes.
Figure 13. Locations of EEG scalp
electrodes according to the 10-20
system. The 10 and 20 refer to the
distances between electrodes:
either 10% or 20% of the total
front–back or right–left distance of
the skull. Two anatomical
landmarks are used for positioning
the electrodes: the nasion and the
inion. Each electrode has a letter to
identify the lobe and a number to
identify the hemisphere location.
F, T, C, P and O stand for frontal,
temporal, central, parietal, and
occipital lobes, respectively. A, Pg
and Fp identify the earlobes,
nasopharyngeal and frontal polar
sites. Z (zero) refers to an electrode placed on the midline; even numbers refer to the right
hemisphere, whereas odd numbers refer to the left hemisphere.
Data were amplified and digitized using a V-Amp 16 (Brain
Products GmbH, Gilching, Germany) using a 250 Hz
sampling frequency and a band pass from DC (0 Hz) to
Nyquist frequency (125 Hz). The useful frequency was
filtered between the thresholds of 0,05 Hz and 125 Hz to
avoid non-physiological measurements. All electrodes were
filled with conductive electrode paste (EC2 Electrode
Cream, Grass Technologies) and secured to the skin on the
skull with Gauze (Mölnlycke Health Care), and on the face
with elastic adhesive tape (Fixomull Stretch, BSN Medical)
after preparing the scalp by light abrasion to reduce
impedance due to dead skin cells. Electrode impedances
were checked before the subject retired and if an electrode
gave a reading above 5 kOhm it was re-applied. Electrodes
that lost contact during the nap were not used for analysis.
The quality of the PSG recordings was evaluated by
horizontal and vertical eye movements, which are easy to
recognize with eyes open, and by occipital alpha rhythm
which appears immediately at the closure of the eyes. To
evaluate the EMG quality, subjects had to open and close
their mouth.
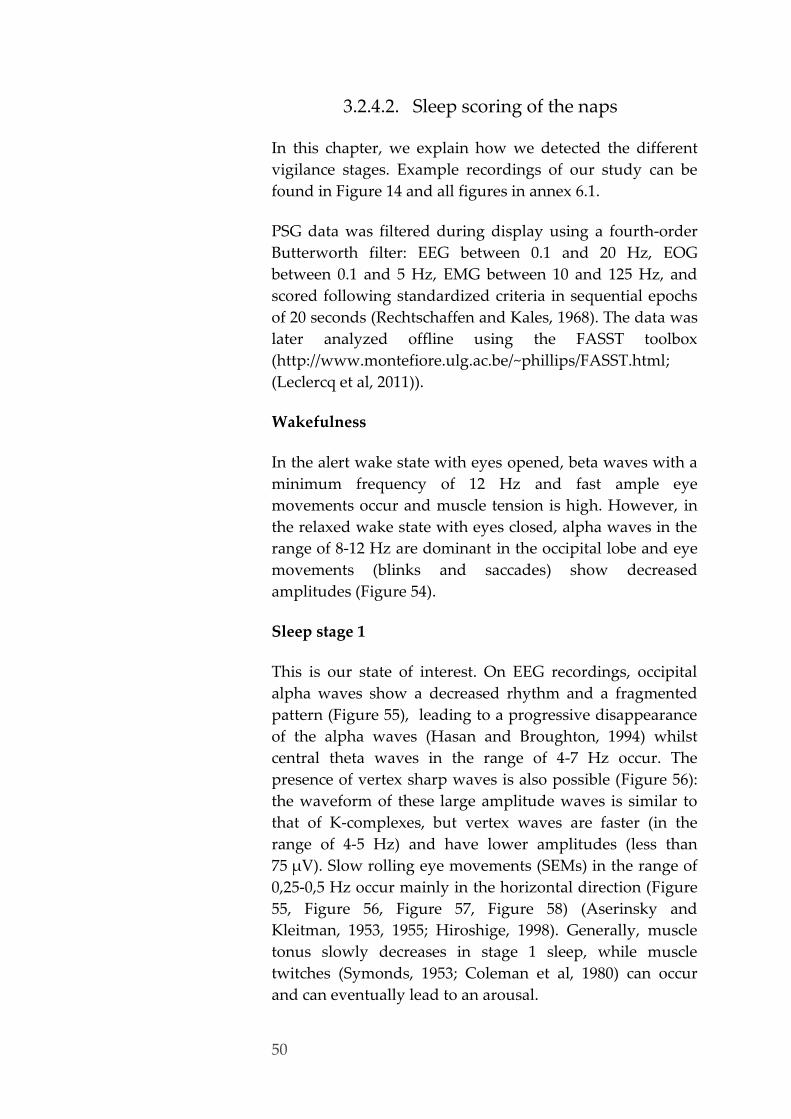
50
3.2.4.2. Sleep scoring of the naps
In this chapter, we explain how we detected the different
vigilance stages. Example recordings of our study can be
found in Figure 14 and all figures in annex 6.1.
PSG data was filtered during display using a fourth-order
Butterworth filter: EEG between 0.1 and 20 Hz, EOG
between 0.1 and 5 Hz, EMG between 10 and 125 Hz, and
scored following standardized criteria in sequential epochs
of 20 seconds (Rechtschaffen and Kales, 1968). The data was
later analyzed offline using the FASST toolbox
(http://www.montefiore.ulg.ac.be/~phillips/FASST.html;
(Leclercq et al, 2011)).
Wakefulness
In the alert wake state with eyes opened, beta waves with a
minimum frequency of 12 Hz and fast ample eye
movements occur and muscle tension is high. However, in
the relaxed wake state with eyes closed, alpha waves in the
range of 8-12 Hz are dominant in the occipital lobe and eye
movements (blinks and saccades) show decreased
amplitudes (Figure 54).
Sleep stage 1
This is our state of interest. On EEG recordings, occipital
alpha waves show a decreased rhythm and a fragmented
pattern (Figure 55), leading to a progressive disappearance
of the alpha waves (Hasan and Broughton, 1994) whilst
central theta waves in the range of 4-7 Hz occur. The
presence of vertex sharp waves is also possible (Figure 56):
the waveform of these large amplitude waves is similar to
that of K-complexes, but vertex waves are faster (in the
range of 4-5 Hz) and have lower amplitudes (less than
75 μV). Slow rolling eye movements (SEMs) in the range of
0,25-0,5 Hz occur mainly in the horizontal direction (Figure
55, Figure 56, Figure 57, Figure 58) (Aserinsky and
Kleitman, 1953, 1955; Hiroshige, 1998). Generally, muscle
tonus slowly decreases in stage 1 sleep, while muscle
twitches (Symonds, 1953; Coleman et al, 1980) can occur
and can eventually lead to an arousal.
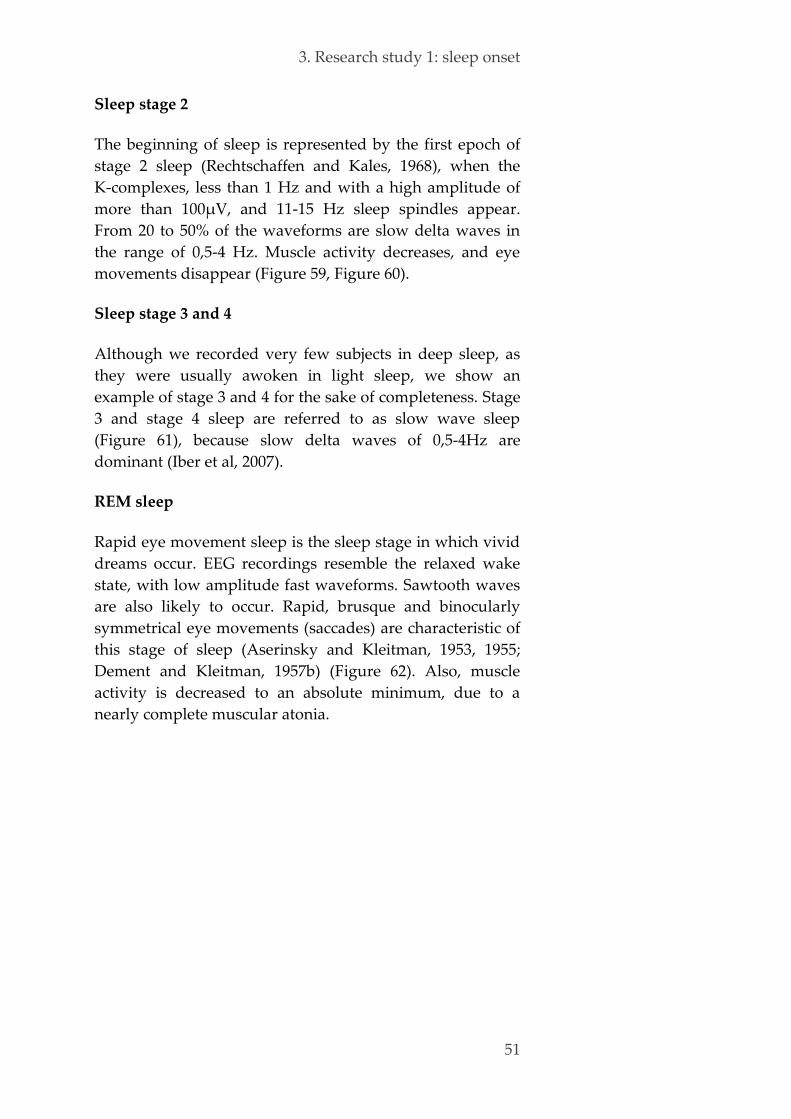
3. Research study 1: sleep onset
51
Sleep stage 2
The beginning of sleep is represented by the first epoch of
stage 2 sleep (Rechtschaffen and Kales, 1968), when the
K-complexes, less than 1 Hz and with a high amplitude of
more than 100μV, and 11-15 Hz sleep spindles appear.
From 20 to 50% of the waveforms are slow delta waves in
the range of 0,5-4 Hz. Muscle activity decreases, and eye
movements disappear (Figure 59, Figure 60).
Sleep stage 3 and 4
Although we recorded very few subjects in deep sleep, as
they were usually awoken in light sleep, we show an
example of stage 3 and 4 for the sake of completeness. Stage
3 and stage 4 sleep are referred to as slow wave sleep
(Figure 61), because slow delta waves of 0,5-4Hz are
dominant (Iber et al, 2007).
REM sleep
Rapid eye movement sleep is the sleep stage in which vivid
dreams occur. EEG recordings resemble the relaxed wake
state, with low amplitude fast waveforms. Sawtooth waves
are also likely to occur. Rapid, brusque and binocularly
symmetrical eye movements (saccades) are characteristic of
this stage of sleep (Aserinsky and Kleitman, 1953, 1955;
Dement and Kleitman, 1957b) (Figure 62). Also, muscle
activity is decreased to an absolute minimum, due to a
nearly complete muscular atonia.
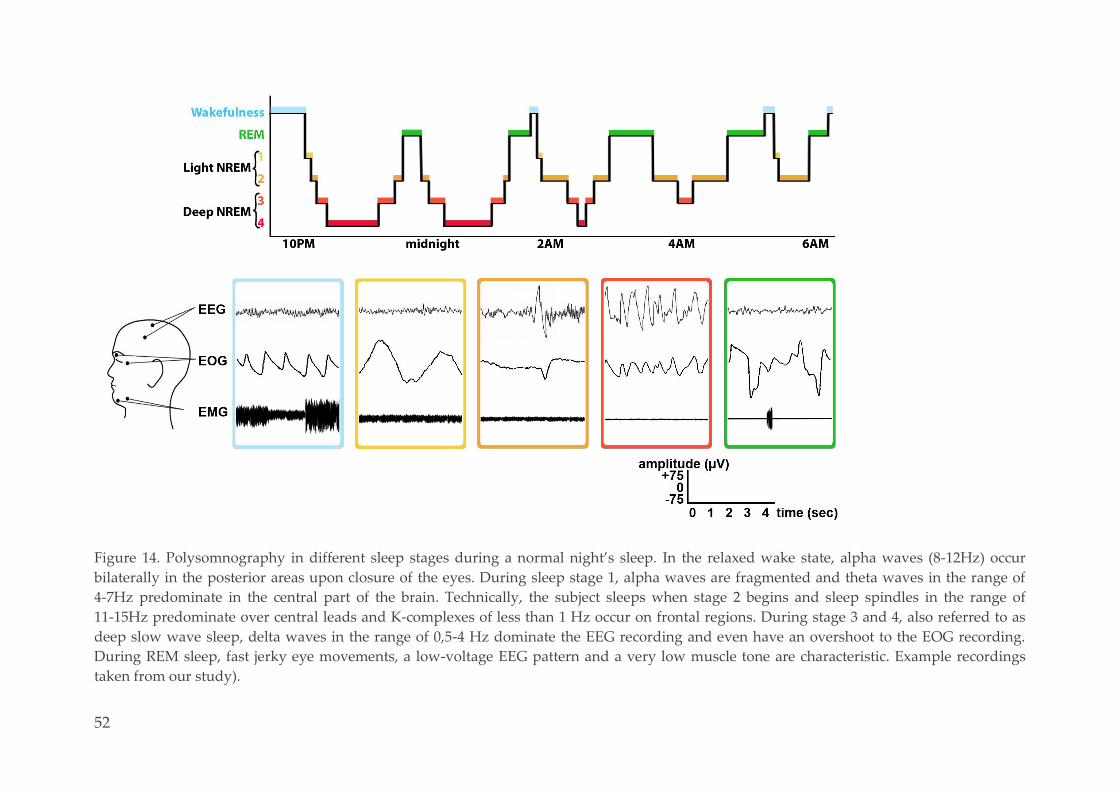
52
Figure 14. Polysomnography in different sleep stages during a normal night’s sleep. In the relaxed wake state, alpha waves (8-12Hz) occur
bilaterally in the posterior areas upon closure of the eyes. During sleep stage 1, alpha waves are fragmented and theta waves in the range of
4-7Hz predominate in the central part of the brain. Technically, the subject sleeps when stage 2 begins and sleep spindles in the range of
11-15Hz predominate over central leads and K-complexes of less than 1 Hz occur on frontal regions. During stage 3 and 4, also referred to as
deep slow wave sleep, delta waves in the range of 0,5-4 Hz dominate the EEG recording and even have an overshoot to the EOG recording.
During REM sleep, fast jerky eye movements, a low-voltage EEG pattern and a very low muscle tone are characteristic. Example recordings
taken from our study).

3. Research study 1: sleep onset
53
Data analysis 3.2.5.
3.2.5.1. Content of the sleep-onset reports
Sleep-onset reports consisted of the level of sleepiness
according to the KSS and the mental content at that
particular moment. The content of all reports was classified
according to whether it was related or not to Tetris. If
related to Tetris, it was further categorized according to the
nature of hypnagogic hallucinations (visual, auditory,
kinesthetic imagery of Tetris, thoughts of Tetris, emotions
related to Tetris, other games related to Tetris). Reports
containing multiple themes could be assigned to multiple
categories. The following categories were considered as
directly related to Tetris:
- Visual imagery of Tetris. These include all reports in
which the subject explicitly mentioned seeing elements
of the Tetris game. The reports could be exclusively
visual (unimodal) or mix elements of various modalities
(multimodal). Example: "And I was just seeing the game in
my head and I had the impression that I was really playing
[…] It was just a mental image in which I saw blocks falling."
- Auditory imagery of Tetris. These reports contain
sounds of Tetris with or without other mental
representations and could be uni- or multimodal.
Examples of both types: "I've still been thinking about the
Tetris music and uh… That's it, yes." or "I had the music of
Tetris in my mind, but at the same time I was thinking about
other things with the music as background."
- Tetris-related kinesthetic hallucinations. These include
bodily feelings and kinesthetic content related to the
position and weight of the body, movements of the
muscles, tendons and joints clearly related to Tetris
practice. Example: “I’ve got the impression of feeling
heartbeats… I don’t know very well... in a cubic place with
blue tatamis on the ground.”
- Thoughts about Tetris. These are typically thoughts
about the score achieved at Tetris. Example: "I've been
thinking about the scores I have achieved at Tetris."
54
- Emotions related to Tetris. These can consist of any
primary emotion (anger, fear, sadness, disgust, surprise,
anticipation, trust, and joy) or any of their combinations
(excitement, curiosity, happiness, boredom, frustration,
disappointment, etc.). Example: "That one with four blocks,
that orange one […] always when you need that block in one
direction, you get a block in the different direction. That's very
irritating."
The following categories were considered as being
indirectly related to Tetris practice:
- Visual imagery of elements with spatial arrangements
or movements characteristic of Tetris. These elements
are ordered as Tetris blocks and can include any kind of
object such as boxes, bottles, cars, circles, crosses, beds,
curtains, beehives with honeycombs, pieces of wood,
snakes, eggs, balls, snow, etc. Example: "I was ordering
everything that is in my wardrobe. I have put everything in
shoe boxes, but in my dream there were other shoe boxes. […]
In my dream the shoe boxes were of different colors."
- Auditory imagery of melodies explicitly related to the
Tetris theme. These melodies are different from that of
the Tetris game, and are not heard during the practice
sessions. However, the volunteer explicitly claims that
they are induced by the Tetris theme. Example: " I was
hearing the music 'Nous aimons vivre au fond des bois'. […] I
think it's the same music as the Tetris game in fact. But, but
it's instrumental music in fact." It should be noted that
both the Tetris melody and the song 'Nous aimons vivre
au fond des bois' are Russian folk songs, and their
melodies are indeed quite similar.
- Images, sounds, thoughts or emotions of another game,
with a mention to Tetris. These include reports about
games with a goal similar to that of Tetris: video games
(e.g. Pac-man), TV games (e.g. word games and quizzes)
and party games (e.g, chess, downfall, connect four,
battleship, card games, dice, etc.). Example: "I was
thinking about Tetris, and I was also thinking about a game,
downfall, in which you have to turn and align four disks of the
same color."
3. Research study 1: sleep onset
55
Finally, three further classes of hallucinations were not
considered as related to Tetris:
- Images, sounds, thoughts or emotions related to the
experimental settings, tasks or questionnaires or sleep-
related concerns. These include all reports about the
PVT, scales, sleeping or sleep stages, beds, clocks,
monitoring, actigraphy, questionnaires, the experimental
room, the laboratory, the experimenter, the
announcement of the experiment, the informed consent,
etc. Although not related to the practice of Tetris, they
are obviously related to the experiment. Example: "A
blurred image about someone who talks about his sleep."
- Content not related to Tetris. This category is a very
broad one which includes all reports which could not be
assigned to any of the previous categories. These reports
consist of images, sounds, thoughts or emotions without
explicit relationship with Tetris. They also include
references to games other than Tetris when the subject
mentioned having played the game recently. Example: "I
was thinking of a game of chess I’ve been playing with a friend
Tuesday evening."
- Nothing in mind, forgotten content. As hypnagogic
hallucinations tend to disappear immediately when they
are focused on, it was expected that subjects often would
forget their mental content. For instance, sometimes they
just mentioned the KSS score, said they had nothing
going on in their mind, or mentioned they had forgotten
their mental content. Example: "It's really very blurred, I
don't know anymore."
Sleep-onset reports were given scores by three independent
judges, blind to the experimental conditions, performance
data and time of the recording. Only those reports which
1) were assigned the same score by all three judges; 2) were
obtained during the predefined sleep durations of 15, 45, 75,
120 or 180 seconds after S1 onset; 3) could be fully
transcribed; and 4) contained at least one spoken word,
were included in statistical analyses.
Thematic consistency was defined by the recurrence of
similar images in several reports of the same volunteer,
56
either across awakenings within a single experimental day
or across days. For instance, one volunteer reported “I’ve
been thinking about Tetris, about the green blocks and uhm it’s
difficult to place them correctly.” and 40 minutes later he
reported “I’ve been thinking about the Tetris game, how to
complete a line.”
3.2.5.2. Software and statistical testing
Statistical analyses were conducted with SPSS 16.0. As a
rule, nonparametric tests were preferred given the small
sample sizes: Kruskal Wallis and post hoc Mann Whitney U
tests for between-group comparisons, Friedman and post
hoc Wilcoxon Matched Pairs tests within the experimental
group, Spearman’s Bivariate Correlation tests for
calculating correlations. Otherwise, parametric tests were
considered when applicable (Tetris performance, alertness):
Repeated Measures Analysis of Variance (RM-ANOVA)
and post hoc Least Significant Differences (LSD).
3.3. Results
Population 3.3.1.
A total of 43 volunteers aged between 18 and 33 years were
assigned in the Tetris (n=16; 8 female), control (n=13;
8 female) and anticipation group (n=14; 6 female).
Volunteers who deviated for more than 15minutes from
their habitual sleep-wake schedule were excluded (see
Figure 15 for an example of actigraphic data). Kruskal
Wallis tests did not demonstrate any demographic
difference between groups (Table 1).
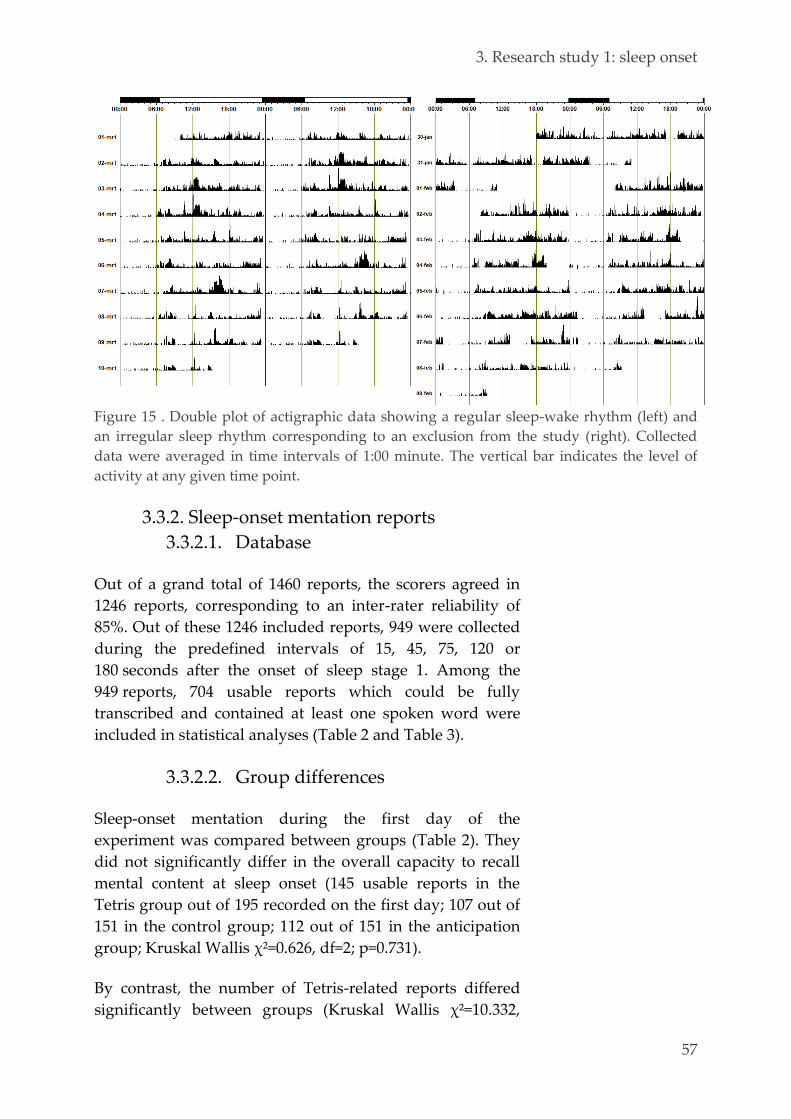
3. Research study 1: sleep onset
57
Figure 15 . Double plot of actigraphic data showing a regular sleep-wake rhythm (left) and
an irregular sleep rhythm corresponding to an exclusion from the study (right). Collected
data were averaged in time intervals of 1:00 minute. The vertical bar indicates the level of
activity at any given time point.
Sleep-onset mentation reports 3.3.2.
3.3.2.1. Database
Out of a grand total of 1460 reports, the scorers agreed in
1246 reports, corresponding to an inter-rater reliability of
85%. Out of these 1246 included reports, 949 were collected
during the predefined intervals of 15, 45, 75, 120 or
180 seconds after the onset of sleep stage 1. Among the
949 reports, 704 usable reports which could be fully
transcribed and contained at least one spoken word were
included in statistical analyses (Table 2 and Table 3).
3.3.2.2. Group differences
Sleep-onset mentation during the first day of the
experiment was compared between groups (Table 2). They
did not significantly differ in the overall capacity to recall
mental content at sleep onset (145 usable reports in the
Tetris group out of 195 recorded on the first day; 107 out of
151 in the control group; 112 out of 151 in the anticipation
group; Kruskal Wallis χ²=0.626, df=2; p=0.731).
By contrast, the number of Tetris-related reports differed
significantly between groups (Kruskal Wallis χ²=10.332,

58
df=2; p=0.006). In the experimental group, 13 out of
145 reports were related to Tetris. On the other hand, in the
control group, 1 usable report out of 107 was scored as
Tetris-related while in the anticipation group there were
3 Tetris-related reports out of 112 usable reports (Table 2
and Figure 16). Post hoc Mann Whitney tests revealed that
Tetris-related reports were significantly more frequent in
the Tetris than in the control group (U=7134.5; p=0.006) and
anticipation group (U=7609.5; p=0.039). No significant
difference could be found between the control and
anticipation group (U=5887.5; p=0.336).
Figure 16. Percentages of usable (dark
gray) and tetris-related (lighter gray)
mentation reports. a. The first day in
experimental, control and anticipation
group. b. The first, second and third
day in the experimental group.

59
Table 1. Demographic data. Median and range (minimum and maximum) is shown for each group. Kruskal Wallis tests did not show any
difference between the experimental groups (p>0.05 for all parameters). Med: median; min: minimum; max: maximum; SMP: Sleep midpoint;
PSQI: Pittsburgh sleep quality index; LSDQ: London sleep and dreaminess questionnaire
Tetris group control group anticipation group Kruskal Wallis
med min max med min max med min max χ² df p
sex 0.933 2 0.627
SMP 3:37 3:00 4:30 3:15 2:45 7:00 3:30 1:30 7:00 0.210 2 0.900
age 22 18 28 23 18 26 25 19 33 5.882 2 0.053
Epworth 5 0 9 3 0 12 5 1 11 2.368 2 0.306
chronotype 54 43 62 55 40 61 51.5 39 66 1.185 2 0.553
PSQI 3 1 5 3 1 6 4 1 6 4.470 2 0.107
anxiety 2.5 0 6 3 0 8 2 0 14 0.899 2 0.638
depression 2 0 7 2 0 10 2.5 0 9 1.527 2 0.466
LSDQ 93.5 72 104 87 68 141 86 6 141 2.745 2 0.253
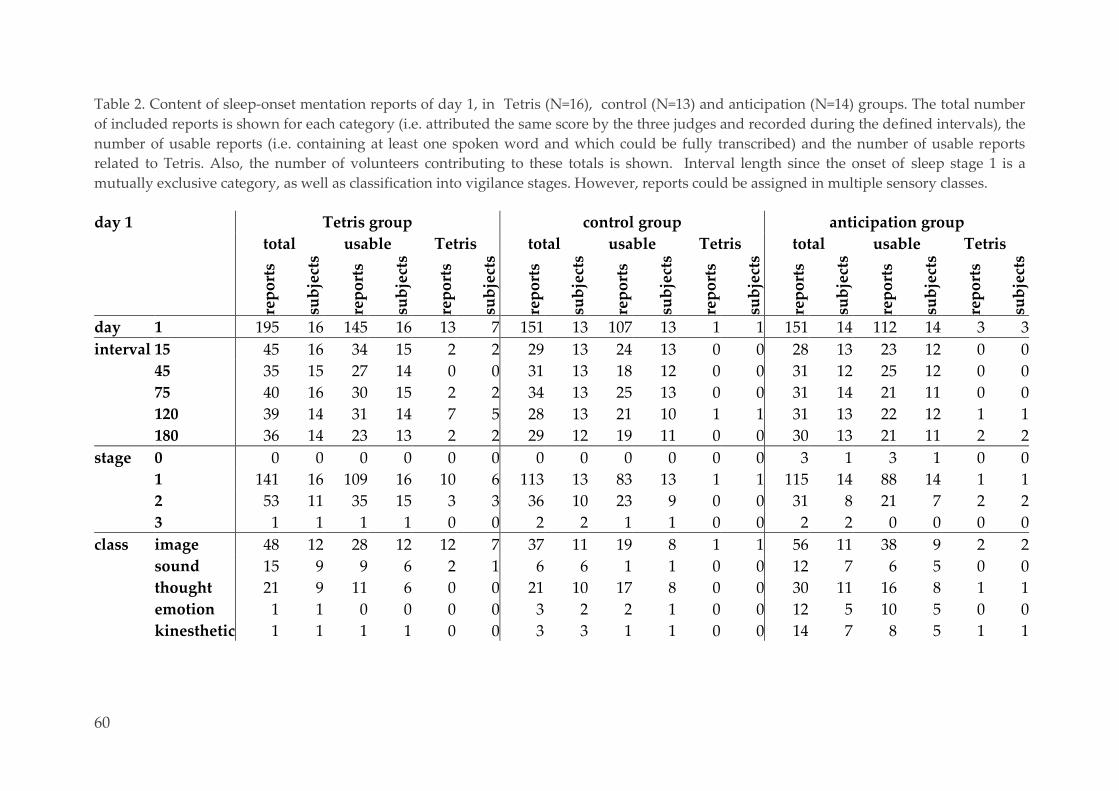
60
Table 2. Content of sleep-onset mentation reports of day 1, in Tetris (N=16), control (N=13) and anticipation (N=14) groups. The total number
of included reports is shown for each category (i.e. attributed the same score by the three judges and recorded during the defined intervals), the
number of usable reports (i.e. containing at least one spoken word and which could be fully transcribed) and the number of usable reports
related to Tetris. Also, the number of volunteers contributing to these totals is shown. Interval length since the onset of sleep stage 1 is a
mutually exclusive category, as well as classification into vigilance stages. However, reports could be assigned in multiple sensory classes.
day 1 Tetris group control group anticipation group
total usable Tetris total usable Tetris total usable Tetris
rep
ort
s
sub
ject
s
rep
ort
s
sub
ject
s
rep
ort
s
sub
ject
s
rep
ort
s
sub
ject
s
rep
ort
s
sub
ject
s
rep
ort
s
sub
ject
s
rep
ort
s
sub
ject
s
rep
ort
s
sub
ject
s
rep
ort
s
sub
ject
s
day 1 195 16 145 16 13 7 151 13 107 13 1 1 151 14 112 14 3 3
interval 15 45 16 34 15 2 2 29 13 24 13 0 0 28 13 23 12 0 0
45 35 15 27 14 0 0 31 13 18 12 0 0 31 12 25 12 0 0
75 40 16 30 15 2 2 34 13 25 13 0 0 31 14 21 11 0 0
120 39 14 31 14 7 5 28 13 21 10 1 1 31 13 22 12 1 1
180 36 14 23 13 2 2 29 12 19 11 0 0 30 13 21 11 2 2
stage 0 0 0 0 0 0 0 0 0 0 0 0 0 3 1 3 1 0 0
1 141 16 109 16 10 6 113 13 83 13 1 1 115 14 88 14 1 1
2 53 11 35 15 3 3 36 10 23 9 0 0 31 8 21 7 2 2
3 1 1 1 1 0 0 2 2 1 1 0 0 2 2 0 0 0 0
class image 48 12 28 12 12 7 37 11 19 8 1 1 56 11 38 9 2 2
sound 15 9 9 6 2 1 6 6 1 1 0 0 12 7 6 5 0 0
thought 21 9 11 6 0 0 21 10 17 8 0 0 30 11 16 8 1 1
emotion 1 1 0 0 0 0 3 2 2 1 0 0 12 5 10 5 0 0
kinesthetic 1 1 1 1 0 0 3 3 1 1 0 0 14 7 8 5 1 1
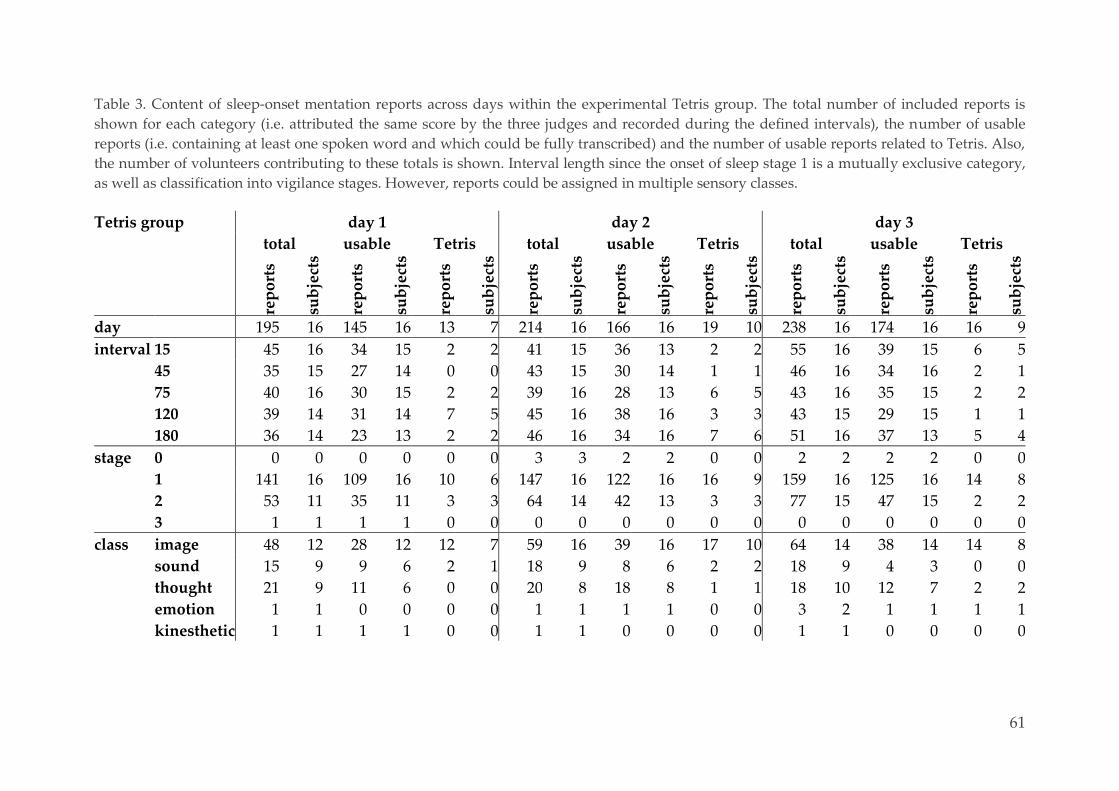
61
Table 3. Content of sleep-onset mentation reports across days within the experimental Tetris group. The total number of included reports is
shown for each category (i.e. attributed the same score by the three judges and recorded during the defined intervals), the number of usable
reports (i.e. containing at least one spoken word and which could be fully transcribed) and the number of usable reports related to Tetris. Also,
the number of volunteers contributing to these totals is shown. Interval length since the onset of sleep stage 1 is a mutually exclusive category,
as well as classification into vigilance stages. However, reports could be assigned in multiple sensory classes.
Tetris group day 1 day 2 day 3
total usable Tetris total usable Tetris total usable Tetris
rep
ort
s
sub
ject
s
rep
ort
s
sub
ject
s
rep
ort
s
sub
ject
s
rep
ort
s
sub
ject
s
rep
ort
s
sub
ject
s
rep
ort
s
sub
ject
s
rep
ort
s
sub
ject
s
rep
ort
s
sub
ject
s
rep
ort
s
sub
ject
s
day 195 16 145 16 13 7 214 16 166 16 19 10 238 16 174 16 16 9
interval 15 45 16 34 15 2 2 41 15 36 13 2 2 55 16 39 15 6 5
45 35 15 27 14 0 0 43 15 30 14 1 1 46 16 34 16 2 1
75 40 16 30 15 2 2 39 16 28 13 6 5 43 16 35 15 2 2
120 39 14 31 14 7 5 45 16 38 16 3 3 43 15 29 15 1 1
180 36 14 23 13 2 2 46 16 34 16 7 6 51 16 37 13 5 4
stage 0 0 0 0 0 0 0 3 3 2 2 0 0 2 2 2 2 0 0
1 141 16 109 16 10 6 147 16 122 16 16 9 159 16 125 16 14 8
2 53 11 35 11 3 3 64 14 42 13 3 3 77 15 47 15 2 2
3 1 1 1 1 0 0 0 0 0 0 0 0 0 0 0 0 0 0
class image 48 12 28 12 12 7 59 16 39 16 17 10 64 14 38 14 14 8
sound 15 9 9 6 2 1 18 9 8 6 2 2 18 9 4 3 0 0
thought 21 9 11 6 0 0 20 8 18 8 1 1 18 10 12 7 2 2
emotion 1 1 0 0 0 0 1 1 1 1 0 0 3 2 1 1 1 1
kinesthetic 1 1 1 1 0 0 1 1 0 0 0 0 1 1 0 0 0 0

62
Effect of repeated training, interval and 3.3.3.
vigilance state
Within the Tetris group, Tetris-related hypnagogic
hallucinations were reported by 13 of the 16 experimental
subjects (Figure 17A and Table 3). Out of 485 usable reports
across the three experimental days, 48 reports contained
Tetris-related content, corresponding to a proportion of 10%
of Tetris-related hypnagogic hallucinations after Tetris
practice. Out of these 13 volunteers, 2 subjects reported one
Tetris-related hallucination, 4 had two reports and 2 had
three reports. Five further volunteers reported respectively
four, five, six, eight and nine Tetris-related hallucinations
(Figure 17A and Table 3).
The propensity to recall mental content at sleep onset did
not significantly differ across days in the Tetris group
(Friedman χ²=4.246; df=2; p=0.120). The rate of Tetris-related
reports did neither significantly differ across days (χ²=1.542;
df=2; p=0.463; Figure 17B) nor across intervals (χ²=6.912;
df=4; p=0.141; Figure 17C). Out of the 48 task-related
reports, 13 were obtained during the first day (13/48=27%),
19 during the second day (19/48=40%) and 16 during the
third day (16/48=33%). A total of 10 reports was obtained
after the interval of 15 sec (10/48=21%), 3 after 45 sec
(3/48=6%), 10 after 75 sec (10/48=21%), 11 after 120 sec
(11/48=23%) and 14 after 180 seconds after the onset of S1
(14/48=29%).
By contrast, the rate of Tetris-related reports significantly
varied with respect to vigilance stage (Friedman χ²=25.727;
df=3; p<0.001; Figure 17D). There were significantly more
reports after awakening from stage 1 (40/356=11%) than
stage 3 sleep (0/1=0%; post hoc Wilcoxon Signed Ranks
p=0.001) and from stage 2 (8/124=6%) than stage 3 (p=0.018).
Whenever present, sleep stage 3 was almost never
associated with mental content. There were also more
reports obtained following awakenings from sleep stage 1
(p=0.001) and stage 2 (p=0.018) than in the wake state
(0/4=0%). No significant difference between sleep stage 1
and 2 could be found in this study (p=0.650).
3. Research study 1: sleep onset
63
The state of vigilance also significantly influenced the
proportion of both indirect (33 out of 48 Tetris-related
reports across all stages; Friedman χ²=27.690; df=3; p<0.001;
Figure 17D gray) and direct incorporations (16 out of 48;
χ²=12.000; df=3; p=0.007; Figure 17D black). Post hoc
Wilcoxon tests confirmed significantly less indirect reports
during wake (0/0) compared to stage 1 (25/41=61%; p=0.001)
and stage 2 (8/8=100%; p=0.008) and less during stage 3 (0/0)
than during stage 1 (p=0.001) and stage 2 (p=0.008). Again,
no significant difference was found between stage 1 and
stage 2 (p=0.112). Despite the significant overall effect of
vigilance state on direct reports, none of the post hoc
pairwise comparisons were significant.
Characterization of mental reports 3.3.4.
The rate of Tetris-related reports varied significantly across
sensory classes (Friedman χ²=31.141; df=4; p<0.001; Figure
17E). Relative to the number of usable reports in each
sensory class, visual hallucinations (39/101=39%) occurred
more frequently than auditory (4/21=19%; post hoc
Wilcoxon p=0.009), thoughts (1/39=3%; p=0.019), emotions
(1/2=50%; p=0.003), and kinesthetic reports (0/1=0%;
p=0.001). Interestingly, indirect visual Tetris imagery (N=14)
appeared as frequent as direct visual hallucinations of the
original Tetris tetrominoes (N=13). Very few reports
actually consisted of Tetris-related thoughts (N=3) or
included an explicit emotional reference (N=1).
Thematic consistency in Tetris-related reports was
infrequently reported, either over days (Figure 18A) or over
successive awakenings during one day (Figure 18B). Over
days, thematic consistency was observed in 6 volunteers out
of 16 in the experimental group (subjects a-f, Figure 18A):
4 volunteers reported thematically consistent Tetris-related
hallucinations on all three days (a-d) while 2 reported only
the second and third day (e and f). Over repeated
awakenings on a given day, 4 volunteers reported related
Tetris content (subjects a,b,c,g; Figure 18B). Namely, on day
one, the 13 Tetris reports were provided by 7 different
subjects without any thematic persistency. On day two, the
19 Tetris hallucinations were reported by 10 different
subjects of whom 3 subjects each had 2 related reports
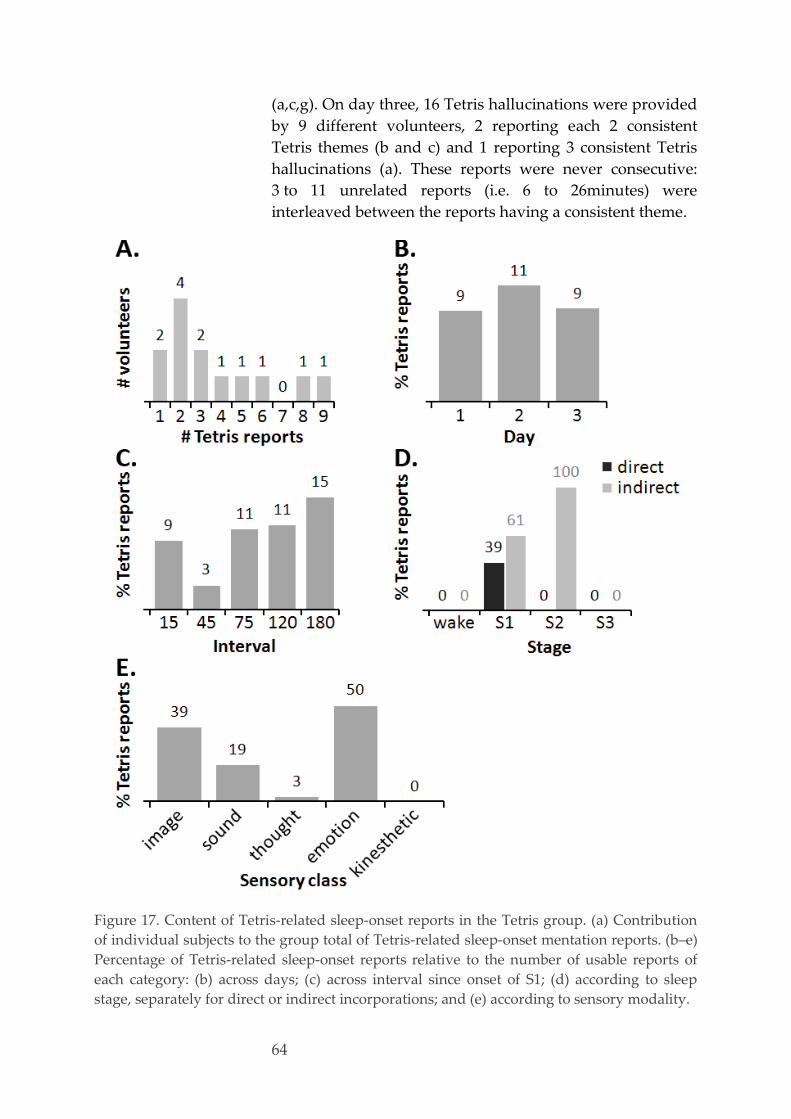
64
(a,c,g). On day three, 16 Tetris hallucinations were provided
by 9 different volunteers, 2 reporting each 2 consistent
Tetris themes (b and c) and 1 reporting 3 consistent Tetris
hallucinations (a). These reports were never consecutive:
3 to 11 unrelated reports (i.e. 6 to 26minutes) were
interleaved between the reports having a consistent theme.
Figure 17. Content of Tetris-related sleep-onset reports in the Tetris group. (a) Contribution
of individual subjects to the group total of Tetris-related sleep-onset mentation reports. (b–e)
Percentage of Tetris-related sleep-onset reports relative to the number of usable reports of
each category: (b) across days; (c) across interval since onset of S1; (d) according to sleep
stage, separately for direct or indirect incorporations; and (e) according to sensory modality.
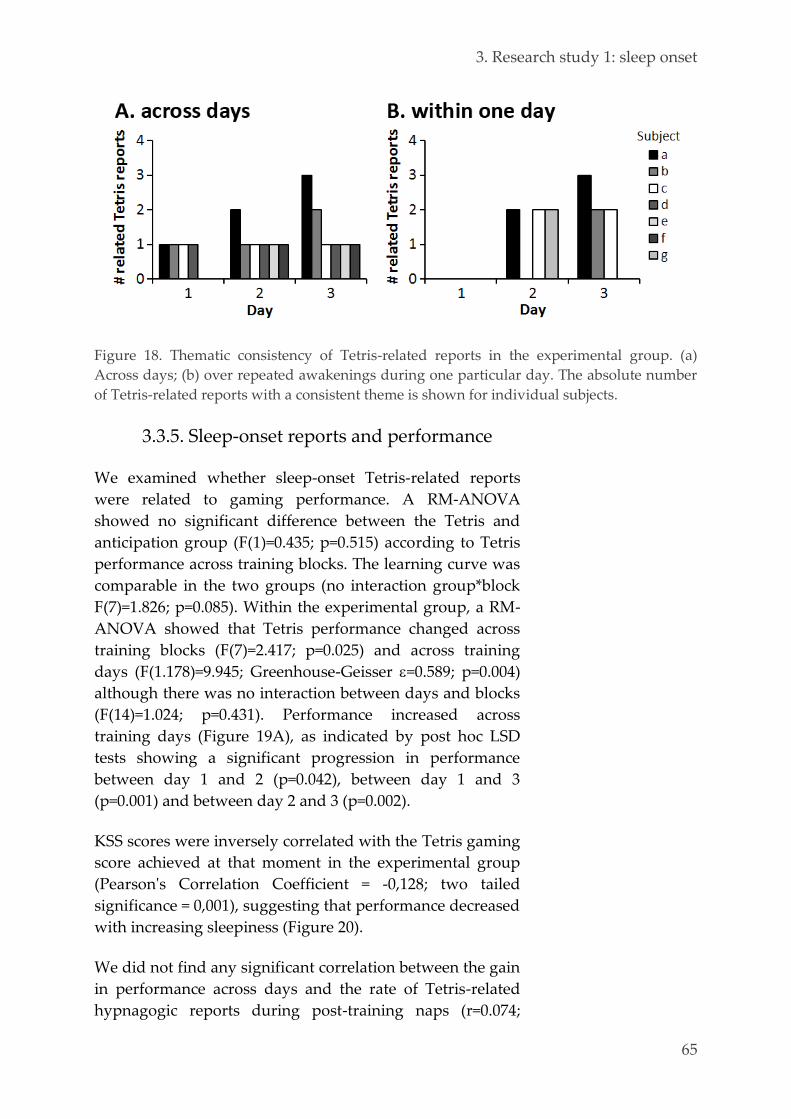
3. Research study 1: sleep onset
65
Figure 18. Thematic consistency of Tetris-related reports in the experimental group. (a)
Across days; (b) over repeated awakenings during one particular day. The absolute number
of Tetris-related reports with a consistent theme is shown for individual subjects.
Sleep-onset reports and performance 3.3.5.
We examined whether sleep-onset Tetris-related reports
were related to gaming performance. A RM-ANOVA
showed no significant difference between the Tetris and
anticipation group (F(1)=0.435; p=0.515) according to Tetris
performance across training blocks. The learning curve was
comparable in the two groups (no interaction group*block
F(7)=1.826; p=0.085). Within the experimental group, a RM-
ANOVA showed that Tetris performance changed across
training blocks (F(7)=2.417; p=0.025) and across training
days (F(1.178)=9.945; Greenhouse-Geisser =0.589; p=0.004)
although there was no interaction between days and blocks
(F(14)=1.024; p=0.431). Performance increased across
training days (Figure 19A), as indicated by post hoc LSD
tests showing a significant progression in performance
between day 1 and 2 (p=0.042), between day 1 and 3
(p=0.001) and between day 2 and 3 (p=0.002).
KSS scores were inversely correlated with the Tetris gaming
score achieved at that moment in the experimental group
(Pearson's Correlation Coefficient = -0,128; two tailed
significance = 0,001), suggesting that performance decreased
with increasing sleepiness (Figure 20).
We did not find any significant correlation between the gain
in performance across days and the rate of Tetris-related
hypnagogic reports during post-training naps (r=0.074;
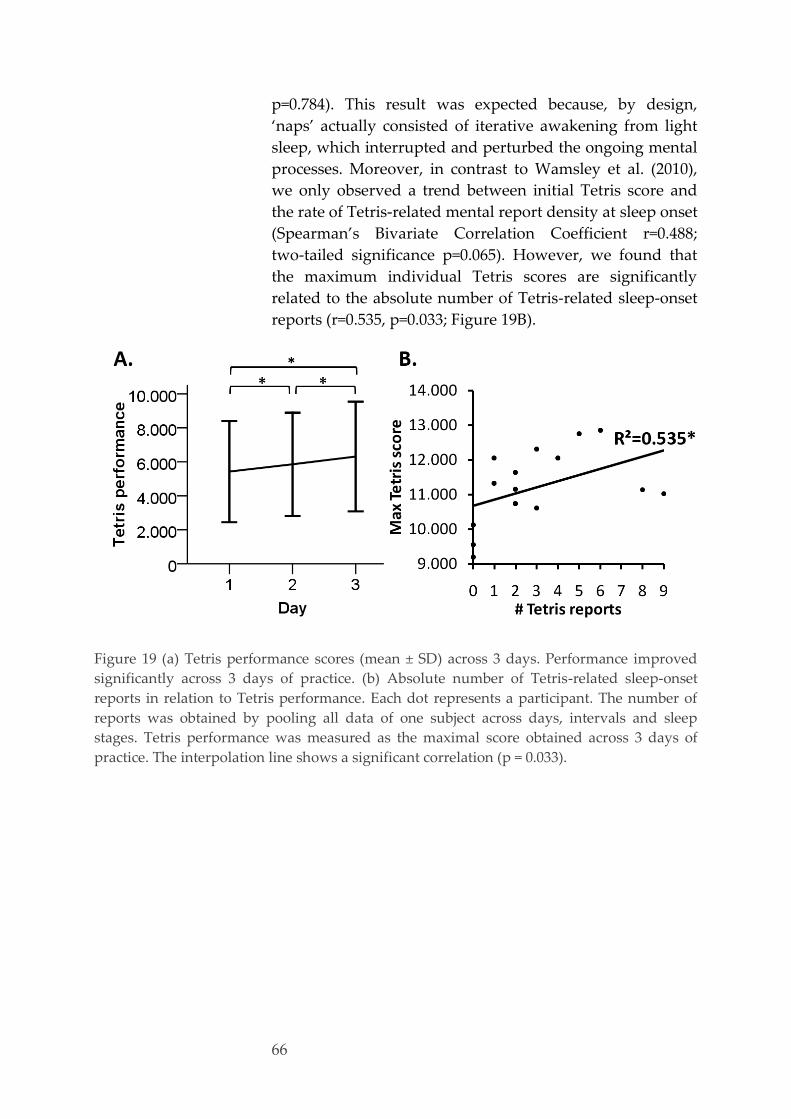
66
p=0.784). This result was expected because, by design,
‘naps’ actually consisted of iterative awakening from light
sleep, which interrupted and perturbed the ongoing mental
processes. Moreover, in contrast to Wamsley et al. (2010),
we only observed a trend between initial Tetris score and
the rate of Tetris-related mental report density at sleep onset
(Spearman’s Bivariate Correlation Coefficient r=0.488;
two-tailed significance p=0.065). However, we found that
the maximum individual Tetris scores are significantly
related to the absolute number of Tetris-related sleep-onset
reports (r=0.535, p=0.033; Figure 19B).
Figure 19 (a) Tetris performance scores (mean ± SD) across 3 days. Performance improved
significantly across 3 days of practice. (b) Absolute number of Tetris-related sleep-onset
reports in relation to Tetris performance. Each dot represents a participant. The number of
reports was obtained by pooling all data of one subject across days, intervals and sleep
stages. Tetris performance was measured as the maximal score obtained across 3 days of
practice. The interpolation line shows a significant correlation (p = 0.033).

3. Research study 1: sleep onset
67
Figure 20. Tetris performance scores in the experimental group (gray blocks) and their
corresponding level of alertness according to the KSS scale (black curve) across 15 minute
blocks of practice show that performance is inversely correlated with level of alertness.
Alertness 3.3.6.
The difference in content of sleep-onset reports between
groups could not be attributed to difference in alertness. A
RM-ANOVA showed that there was no difference between
groups neither according to average reaction times during
PVT (F(2)=2.592; p=0.088) nor KSS scores (F(2)=0.351;
p=0.706) (Figure 21). Likewise, the RM-ANOVA across the
three training days of the experimental group showed no
significant effect of day on the PVT reaction times
(F(1.356)=0.068; Greenhouse-Geisser ε=0.678; p=0.867).
Similarly, there was no significant difference in any sleep
parameter that might account for the difference in content
of sleep-onset reports between groups (Kruskal Wallis tests;
p>0.05 for most parameters, Table 4) nor across days in the

68
Tetris group (Friedman tests; p>0.05 for most parameters,
Table 5). These negative results were expected as the
experimental design essentially relied on awakenings from
sleep stage 1.
Content of hypnagogic hallucinations 3.3.7.
The content of all reports was classified regarding relation
to Tetris (see annex 6.2.1) and sensory class (see
annex 6.2.2).
ctrl
ant
exp
day 1 day 2 day 3
Figure 21. Mean PVT reaction times (in milliseconds) with its standard deviations, and mean
KSS scores during the four sessions across the day of the control group (upper part),
anticipation group (middle part) and experimental group (lower part) during the first,
second and third day (left, middle and right panel respectively).
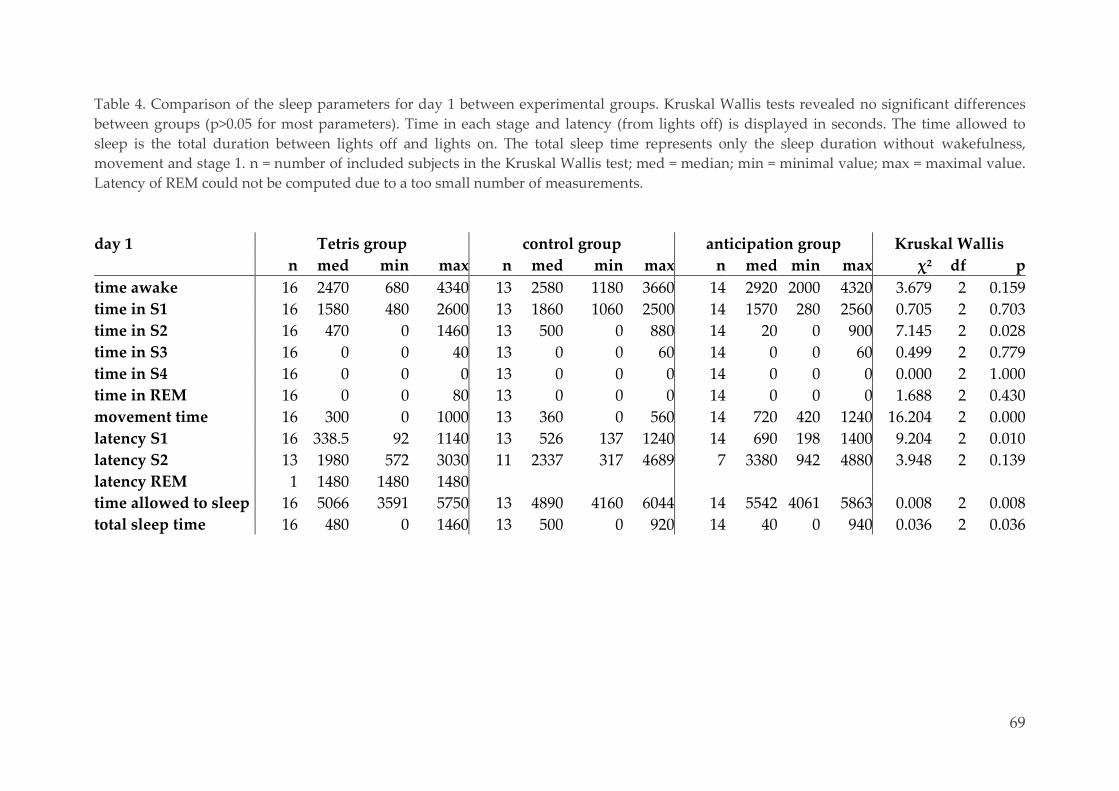
69
Table 4. Comparison of the sleep parameters for day 1 between experimental groups. Kruskal Wallis tests revealed no significant differences
between groups (p>0.05 for most parameters). Time in each stage and latency (from lights off) is displayed in seconds. The time allowed to
sleep is the total duration between lights off and lights on. The total sleep time represents only the sleep duration without wakefulness,
movement and stage 1. n = number of included subjects in the Kruskal Wallis test; med = median; min = minimal value; max = maximal value.
Latency of REM could not be computed due to a too small number of measurements.
day 1 Tetris group control group anticipation group Kruskal Wallis
n med min max n med min max n med min max χ² df p
time awake 16 2470 680 4340 13 2580 1180 3660 14 2920 2000 4320 3.679 2 0.159
time in S1 16 1580 480 2600 13 1860 1060 2500 14 1570 280 2560 0.705 2 0.703
time in S2 16 470 0 1460 13 500 0 880 14 20 0 900 7.145 2 0.028
time in S3 16 0 0 40 13 0 0 60 14 0 0 60 0.499 2 0.779
time in S4 16 0 0 0 13 0 0 0 14 0 0 0 0.000 2 1.000
time in REM 16 0 0 80 13 0 0 0 14 0 0 0 1.688 2 0.430
movement time 16 300 0 1000 13 360 0 560 14 720 420 1240 16.204 2 0.000
latency S1 16 338.5 92 1140 13 526 137 1240 14 690 198 1400 9.204 2 0.010
latency S2 13 1980 572 3030 11 2337 317 4689 7 3380 942 4880 3.948 2 0.139
latency REM 1 1480 1480 1480
time allowed to sleep 16 5066 3591 5750 13 4890 4160 6044 14 5542 4061 5863 0.008 2 0.008
total sleep time 16 480 0 1460 13 500 0 920 14 40 0 940 0.036 2 0.036

70
Table 5. Comparison of the sleep parameters within the Tetris group across the three days. Friedman tests revealed no significant differences
between the three days (p>0.05 for most parameters). Time in each stage and latency (from lights off) is displayed in seconds. Latency for stage
1, 2 and REM is also displayed in seconds. The time allowed to sleep is the total duration between lights off and lights on. The total sleep time
represents only the sleep duration without wakefulness, movement and stage 1. n = number of included subjects in the Friedman test; med =
median; min = minimal value; max = maximal value. Latency of REM could not be computed due to a too small number of measurements.
Tetris group day 1 day 2 day 3 Friedman
n med min max n med min max n med min max χ² df p
time awake 16 2470 680 4340 16 2320 560 3840 16 1910 540 4140 1.125 2 0.570
time in S1 16 1580 480 2600 16 1540 820 2660 16 1360 640 2840 0.125 2 0.939
time in S2 16 470 0 1460 16 590 0 2180 16 740 0 1640 8.414 2 0.015
time in S3 16 0 0 40 16 0 0 320 16 0 0 100 3.600 2 0.165
time in S4 16 0 0 0 16 0 0 100 16 0 0 0 2.000 2 0.368
time in REM 16 0 0 80 16 0 0 80 16 0 0 680 2.000 2 0.368
movement time 16 300 0 1000 16 340 0 920 16 500 0 1120 0.833 2 0.659
latency S1 16 338.5 92 1140 16 230 106 1021 16 193 75 1707 1.625 2 0.444
latency S2 13 1980 572 3030 13 1097 667 1864 15 1169 310 2527 4.167 2 0.125
latency REM 1 1480 1480 1480 3 1206 780 5020 2 1211 980 1442
time allowed to sleep 16 5066 3591 5750 16 4933.5 3414 5405 16 5269 3474 5740 7.125 2 0.028
total sleep time 16 480 0 1460 16 630 0 2640 16 800 0 1680 8.742 2 0.013
3. Research study 1: sleep onset
71
3.4. Discussion
Our data show that it is possible to reliably induce
stereotypical hypnagogic hallucinations of Tetris during
daytime naps in participants who have been playing the
game during the preceding hours. The induced hypnagogic
hallucinations are stable over training days. They
preferentially occur during sleep stage 1 and 2 and much
less frequently during full-blown wakefulness or deep
NREM sleep. Their nature is mainly visual and auditory,
consistent with the task modalities, and occurrence rate is
related to the best behavioral performance achieved over
3 days of practice.
The content of the hallucinations and their association to
sleep onset allows some testable predictions about the
organization of brain activity which they are associated
with.
Hypnagogic hallucinations can be induced during a nap
following training
Despite the strict rating by 3 independent judges, we
recorded 48 Tetris-related reports at sleep onset out of
485 usable awakenings, i.e. a 10% rate of incorporation in
the experimental group across three days. This contrasts
with the 1% probability of reporting a Tetris-related
hallucination in an independent group of volunteers who
followed exactly the same procedures except for the practice
of Tetris (1 report out of 107 during one experimental day)
and the 3% probability when subjects anticipated on Tetris
practice (3 reports out of 112 during one day). These data
are strikingly similar to those reported following
awakenings from nighttime sleep after Tetris practice
(Stickgold et al, 2000): 12% of all reports were task-related in
the experimental groups (novices 17%, experts 10%) and 1%
in the control group.
It should be noted that a between-subjects design was
preferred to a within-subjects protocol in order to avoid
Tetris incorporation into hypnagogic mental activity due to
anticipation inherent to the latter (Wamsley et al, 2010).
72
Experience-induced hypnagogic hallucinations are
associated with sleep stage 1 and 2
Based on standard polygraphic recordings, our data
indisputably show that experience-dependent hypnagogic
hallucinations are closely related to sleep stage 1 and early
stage 2 sleep, as is classically reported for hypnagogic
hallucinations in general (Hori et al, 1994; Germain and
Nielsen, 1997). This result is important because this
transitory and unstable state of vigilance is associated with
consistent changes in the regional organization of brain
activity. During sleep onset, coherent spontaneous
fluctuations in activity persist in the default-mode network
(Horovitz et al, 2008). This network consists of a set of
densely connected brain areas (medial frontal, posterior
cingulate, precuneus, inferior parietal lobule; (Damoiseaux
et al, 2006; Fox and Raichle, 2007), in which the activity
increases when subjects are asked to rest (Gusnard and
Raichle, 2001), a condition promoting self-referential
thoughts (D'Argembeau et al, 2008), mind wandering
(Mason et al, 2007) and the unfocused monitoring of the
environment (Gilbert et al, 2007), akin to sleep-onset
mentation. Accordingly, activity in the medial prefrontal
cortex and precuneus increases at sleep onset, relative to
full blown wakefulness (Olbrich et al, 2009). Beyond the
recruitment of this anatomo-functional backbone, sleep
onset is mainly characterized by increased activity in
sensory cortices (visual, auditory, somatomotor; (Kjaer et al,
2002; Horovitz et al, 2008; Larson-Prior et al, 2009; Olbrich
et al, 2009)), which potentially underlies hallucinatory
sensory experience at sleep onset.
Variety of experience-induced hypnagogic hallucinations
Among all Tetris-related reports, 33% of the hallucinations
corresponded to actual Tetris stimuli (16 out of 48). In
keeping with their classical description (Foulkes and Vogel,
1965; Schacter, 1976; Mavromatis, 1987), these
hallucinations were mostly visual and auditory. This was
expected, given the visual and auditory nature of Tetris.
The conspicuous absence of kinesthetic hallucinations
contrasts with their high frequency after training to Alpine
Racer (37% of imagery reports; (Wamsley et al, 2010)).
3. Research study 1: sleep onset
73
Again, this difference speaks for the tuning of hallucinatory
content to the preceding waking experience.
Anticipation and experimental demand are not likely to
explain the results. Indeed, significantly less Tetris-related
reports were recorded in volunteers who knew they would
practice Tetris after the nap, in contrast to (Wamsley et al,
2010) who reported an increased number of task-related
reports on the baseline night. In addition, in the group who
practiced Tetris before the nap, a large proportion of
hallucinations could hardly be explained by experimental
demand because they were not identified as Tetris elements
by the volunteers themselves. Far from being mere
reproductions of Tetris stimuli, these representations
included associations with mnemonic components and
transformations of actual Tetris elements into novel
elements. Finally, similar proportions of Tetris-related
reports were previously observed in amnesic patients (8%;
(Stickgold et al, 2000)).
A substantial proportion of Tetris-related reports included
mnemonic components: similar musical pieces heard in a
different context, other board games, familiar objects
spatially arranged as in Tetris. This finding suggests that
Tetris-related memory traces interact with older memories
and induce their spontaneous retrieval at sleep onset. Being
preserved in amnesic patients (Stickgold et al, 2000), these
representations potentially emerge from neocortical areas,
mainly unimodal associative areas of the ventral (object
identification) and dorsal visual streams (spatial
arrangement, movements), unimodal auditory cortices or
multimodal sensory cortices (Kjaer et al, 2002; Horovitz et
al, 2008; Larson-Prior et al, 2009; Olbrich et al, 2009). The
absence of affective content in Tetris-related hypnagogic
hallucination speaks for the lack of recruitment of emotion-
processing structures such as the amygdala and the reward
system.
The mental images occurred without any reference to time
or place and appeared, rather, to be extracted from the
actual experience. This lack of temporal and spatial
associations can be explained by the absence of
hippocampal involvement in image construction, as
74
demonstrated in amnesic patients having the same Tetris-
related hypnagogic imagery without remembering having
played the game (Stickgold et al, 2000).
Experience-induced hypnagogic hallucinations and
learning
Although obviously related to recent experience, the
present data do not provide strong evidence that
experience-dependent sleep-onset hallucinations are
quantitatively associated with critical steps in memory
processing. We could not confirm the correlation between
initial performance and sleep-onset task-related imagery
reported by others (Stickgold et al, 2000; Wamsley et al,
2010). We found that improvement in performance does not
correlate with the frequency of imagery (Emberger, 2001)
but, by contrast, that the rate of sleep-onset reports
correlates with the maximal individual Tetris performance.
However, the latter parameter does not selectively probe
memory processes as it also heavily depends on other
cognitive functions as alertness, focused attention and
motivation during practice.
Multiple awakenings did not affect the mental content
It might be argued that repeated awakenings could produce
an artificially high rate of Tetris-related hallucinations
because multiple awakenings might change the volunteers’
expectation about the experiment. This is not consistent
with the data: thematic consistency in Tetris-related reports
(either across days or over repeated awakenings within one
day) appeared in a minority of reports only. They never
occurred consecutively and were always interspersed
among thematically unrelated reports. Therefore, although
it remains possible that multiple awakenings affect the
incorporation of Tetris elements, mental content did not
seem to be systematically biased by prior Tetris-reports.
3.5. Conclusion and perspectives
Hypnagogic hallucinations, induced during daytime naps
by prior practice of Tetris, occur predominantly at the
transition between wakefulness and sleep, especially in
3. Research study 1: sleep onset
75
stage 1 and early stage 2 sleep. They mainly consist of visual
and auditory hallucinations, consistent with the modalities
of the task, often incorporating mnemonic components.
These features predict that hypnagogic hallucinations may
be associated with the state-dependent recruitment of
mesial frontal and parietal areas and other components of
the default mode network as well as with a persistent
activity in neocortical unimodal or multimodal sensory
areas previously recruited during prior wakefulness and in
which recent experience can interact with previously
encoded memories.
However, in the view of studying the cerebral correlates of
memory consolidation using an objective method such as
fMRI, hypnagogic hallucinations during daytime naps are
not an optimal study design because only 10% of the reports
consisted of task-related content, reported only by 13 out of
the 16 volunteers. Therefore, we preferred to change our
protocol to spontaneous brain activity during resting state
wakefulness instead of sleep onset, which is described in
the next research chapter of this thesis.

76

77

78

79
4. RESEARCH STUDY 2: RESTING STATE
This chapter is based on:
- Schrouff* J, Kussé* C, Wehenkel L, Maquet P, Phillips C
(2012) Decoding semi-constrained brain activity from
FMRI using support vector machines and gaussian
processes. PLoS One 7(4): e35860. (Schrouff* et al, 2012)
- Schrouff J, Kussé C, Wehenkel L, Maquet P, Phillips C
(2012) Decoding spontaneous brain activity from fMRI
using gaussian processes: tracking brain reactivation. In:
PRNI, London, doi 10.1109/PRNI.2012.19. (Schrouff et al, 2012)
- Schrouff* J, Kussé* C, Wehenkel L, Luxen A, Maquet P,
Phillips C (Submitted) Temporally structured memory
replay during resting wakefulness in humans. (Schrouff* et al, Submitted)
- Kussé C, Schrouff J, Phillips C, Maquet P (In progress)
Dynamic causal modeling reveals temporally structured
memory replay during resting wakefulness in humans. (Kussé et al, In progress)
Significance
Memory consolidation is thought to depend on the
reactivation of patterns of brain activity that characterize
recent experience. Although reactivation has been identified
and well-described in the animal hippocampus, the
persistence of cortical activity remains to be described in
humans using non-invasive neuroimaging methods. Using
multivoxel pattern analysis of fMRI data, we found that
patterns of task-related brain activity in the ventral visual
stream persist into immediate rest periods and that this
persistence seems to be related to memory performance,
suggesting that postlearning persistent activity patterns
may contribute to memory consolidation. However, other
analyzing techniques could not confirm these findings.
80
4.1. Objectives
The aim of this study is to characterize directly the neural
correlates of memory consolidation during resting state
wakefulness in healthy human volunteers, by examining
the spontaneous processing of a visuospatial learning task
with fMRI.
Memory consolidation is an unconscious process during
which initially labile encoded memory traces are converted
into more stable, long lasting memories which can later be
recalled consciously (Squire et al, 1984). Although most
researchers agree on the exposed framework for treatment
of memory traces, many details of the initial stages of
memory maintenance are still unknown (Miller, 2012).
First, we had to test whether or not we could detect
memory traces in fMRI resting state subjects. It has been
suggested that spontaneous repetitions of brain activity
patterns, predominantly when the cortex is offline, could
play a role in consolidating recently formed memory traces.
Although animal and human studies support the theory of
memory consolidation and give hints on its temporal
aspect, they do not allow a non-invasive and direct
characterization of memory traces during resting state
wakefulness in humans.
Second, most studies examining memory processing in
humans rely on memory retrieval (Polyn et al, 2005;
Chadwick et al, 2010; Kuhl et al, 2011) or on the encoding
phase (Kuhl et al, 2012b). Moreover, some studies are not
immune to confounds such as concurrent practice or
rehearsal of the learned material (Kuhl et al, 2013; Jafarpour
et al, 2014). An experimental protocol allowing the direct
characterization of memory consolidation without the
confounding effect of memory retrieval needs to be
established.
Third, some studies did not control for order effects.
Therefore, it remains to be experimentally confirmed in
different groups of volunteers that anticipation on task
learning does not induce any modulation of brain activity.
4. Research study 2: resting state
81
Fourth, the temporal order of the reactivations remains
unclear. A reactivation of temporally sequenced
information has been reported, suggesting that the structure
of the learning material, referred to as the phase
information, has to be maintained during consolidation. The
conclusions for individual neurons need to be verified for
large neuronal populations, in particular for the phase
information: do firing sequences of large neuronal
populations mimic the discharges of individual neurons,
which follow the sequence imposed by previous waking
activity? Moreover, it remains unclear whether this
reactivation occurs in the same or the reversed order as
during the task. Moreover, it has to be confirmed if the
reactivation of mnemonic cortical traces decreases over time
and whether they are compressed in time.
Fifth and finally, it remains to be experimentally confirmed
if the strength of the reactivations is linked to behavioral
performance.
We address these questions using fMRI data of healthy
human volunteers in a randomized within-subject cross-
over experimental design. Volunteers were scanned during
learning of a visuospatial task and pre- and post-task
wakeful resting state periods. The same volunteers were
also examined during a control task (an auditory oddball)
with pre- and post-control resting states, the order of both
tasks being randomized across participants. In order to
unravel as much information as possible and obtain a
complete overview of the ongoing brain processes, we
resorted to four different state-of-the-art techniques:
- Dynamic Causal Modeling (DCM) (Friston et al, 2003)
is a modeling approach that allows the analysis of
effective connectivity patterns between distinct regions
of interest (ROIs) within the cortical network (Friston et
al, 2003). The advantage of DCM is that the measure of
cortical connectivity is directional, allowing us to
investigate the temporal aspect of activity in the three
category-specific regions. Connectivity is important to
examine because the functional role of any component of
the brain, e.g. cortical area, sub-area, neuronal
population or neuron, is defined largely by its
82
connections (Friston and Price, 2001). While DCM has
been shown powerful to study the differences between
consciousness states such as anesthesia (Moran et al,
2011), coma (Boly et al, 2011), sleep (Jahnke et al, 2012)
and examining category-specific effects (Mechelli et al,
2003), it has not yet been applied to investigate memory
processing.
- Cross-correlations and explained variance assess how
much of the variance of the BOLD signal after learning
can be explained by the signal during the task, after
taking into account the baseline activity already present
before the task. Such analyses have been applied to
examine task-related replay of brain activity between
simultaneously recorded neuron pairs in rodents, which
found an explained variance of 5% during slow wave
sleep before a specific behavior that augmented to 10% à
15% during sleep afterwards in rat hippocampus
(Kudrimoti et al, 1999), ~10% in rat ventral striatum
(Pennartz et al, 2004), 11% in rat prefrontal cortex, and 5
à 11% in monkey cortex (Hoffman and McNaughton,
2002). The reasoning is that cells that fire together when
the animal is learning a task, show an increased
tendency to fire together during subsequent sleep,
consistent with an underlying associative synaptic
modification.
- Spatial networks identification, based on Independent
Component Analysis (ICA), allow automatic
identification of the functional brain networks and
measure the functional interactions within and between
the networks by computing correlation coefficients
between all possible pairs of ROIs. An advantage of this
technique is that integration measures can be computed
at the level of the whole brain, network and ROI. It has
been applied for example to examine subcortical resting
state networks (Malherbe C et al, 2010).
- MultiVariate Pattern Analysis (MVPA) is an innovative
machine learning application which leads to the
decoding of spontaneous brain activity: it is based on a
classifier which is trained to link specific patterns of
brain activity to a particular cognitive, behavioral,
perceptual or medical state (Haynes and Rees, 2006;
4. Research study 2: resting state
83
Norman et al, 2006) (Figure 8). Neither the spatial nor
temporal dimensions of the data are reduced, which is
an important advantage when searching for spatially
distributed and transient events of memory replay. The
temporal aspect can be investigated as well. Application
of these methods in the context of memory processing
made it possible to predict the actually presented
stimulus (Haynes and Rees, 2005a, 2005b) and the
relation of encoding strength to memory performance
(Kuhl et al, 2012b), but also, in the absence of any
stimulus, decoding the mental content: the category of a
mentally retrieved object (Polyn et al, 2005; Hassabis et
al, 2009; Schrouff* et al, 2012), the category of perceived
objects (Spiridon and Kanwisher, 2002; Cox and Savoy,
2003; Shinkareva et al, 2008), orientation of patterns
(Kamitani and Tong, 2005; Haynes and Rees, 2005a),
mental states related to memory retrieval (Polyn et al,
2005; Chadwick et al, 2010; Kuhl et al, 2013) or even
hidden intentions (Haynes et al, 2007).
4.2. Material & methods
Ethics 4.2.1.
This study was approved by the Ethics Committee of the
Faculty of Medicine of the University of Liège. Regarding
safety concerns, patients were informed about the large
magnetic field and safety precautions of the MRI scan. They
had to complete a written metal check questionnaire, which
was double checked orally. Moreover, the absence of any
metal was triple checked by a portable metal scan. All
participants were fully informed about the protocol, gave
their written informed consent and were paid for their
participation.
Population 4.2.2.
All included volunteers were young (19-29), non-smoking,
right-handed healthy students with normal or corrected-to-
normal vision. They were non-smoking, moderate caffeine
and alcohol consumers, and none was on medication
(except for oral contraceptives for women). None had been
working night shifts or travelled across more than one time
zone during the last 2 months. The absence of medical,
84
traumatic, psychiatric or sleep disorders was established in
a semi-structured interview.
The volunteers were screened with standardized
questionnaires for excessive daytime sleepiness (Epworth
Sleepiness Scale score ≤ 10; (Johns, 1991)), sleep quality
(Pittsburgh Sleep Quality Index Questionnaire score ≤ 8;
(Buysse et al, 1989)), chronotype (Horne and Ostberg
morningness-eveningness questionnaire score >30 and <70
(Horne and Ostberg, 1976)), anxiety (Beck Anxiety
Inventory score ≤ 8; (Beck et al, 1988)), depression (Beck
Depression Inventory II score ≤ 13; (Steer et al, 1997)) and
laterality (right-handed according to the Edinburgh
Inventory; (Oldfield, 1971)).
The amount and content of their dreams was examined
with the London Sleep and Dreaminess Questionnaire (not
yet validated), Waterloo Sleep Experiences Scale (Cheyne et
al, 1999), dream diary, and the amount and content of their
daydreams with the Imaginal Process Inventory
(http://www.neuroinfo.org/w/public/images/5/55/Ipi.pdf).
During the 7 days preceding the experiment, volunteers
followed a regular sleep schedule, verified by a sleep diary
and wrist actigraphy (Actiwatch, Cambridge Technology,
UK). Subjects were instructed to eat normally but to abstain
from stimulants (such as coffee, tea, coca cola, red bull, etc.)
and cigarettes. All questionnaires were presented in the
volunteer's native language, i.e. French, Dutch or English.
Experimental design 4.2.3.
All volunteers underwent two main conditions (Figure 22):
a control condition and a memory condition, their order
being randomized across participants to avoid time effects.
Half of the volunteers (6 of which 3 women) first underwent
the memory condition while the other half (5 of which 2
women) first underwent the control condition.

4. Research study 2: resting state
85
fMRI fMRI
memory
condition
localizer
5’
rest 1
10’
exploration
24’
encoding
rest 2
10’
imagery
± 25’
retrieval
memory test
± 20’
retrieval
control
condition
rest 1
10’
oddball
24’
rest 2
10’
Figure 22. Experimental protocol. In the fMRI scan, subjects underwent a visual encoding
task, flanked by two rest sessions and followed by a retrieval session (upper part in black
text), as well as an auditory control task flanked by two rest sessions (lower part in gray
text). A functional localizer preceded the memory condition to avoid novelty effects.
Performance was checked after scanning in a memory test.
Memory condition
The core of the experiment consisted of four fMRI sessions:
a visuospatial task (encoding) flanked by two rest sessions
and followed by a mental imagery session (retrieval)
(Figure 22, bold text in the upper part).
Preceding these four sessions was a functional localizer
session (Figure 23) during which the images involved in the
learning task were presented at the center of the screen in a
random order, in an event-related design. They represented
neutral photographs in color on a white background. The
purpose of this session was both to identify brain areas
responding to the image categories and to eschew novelty
effects during subsequent sessions, ensuring an optimal
stability of the BOLD response during task learning.
Figure 23. Functional localizer.
Images of faces, buildings and
animals were presented to the
subject for 500ms with an inter-
stimulus interval of 1500ms. In total,
81 different images were used.
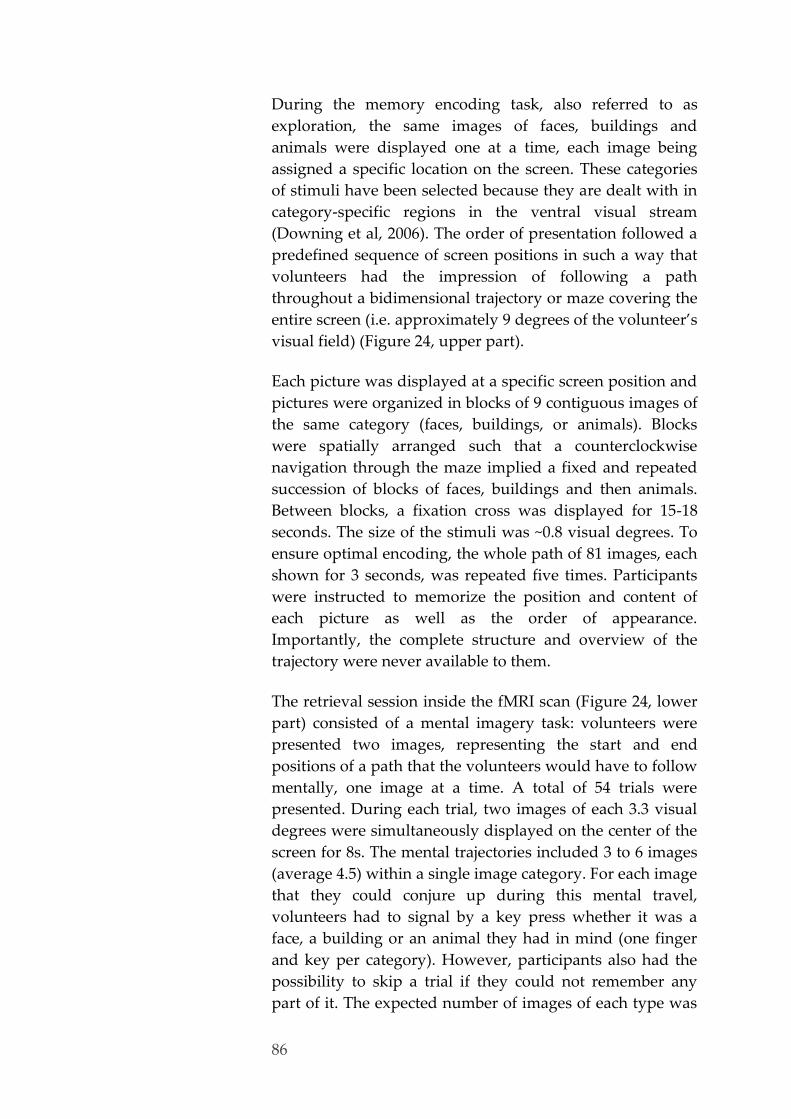
86
During the memory encoding task, also referred to as
exploration, the same images of faces, buildings and
animals were displayed one at a time, each image being
assigned a specific location on the screen. These categories
of stimuli have been selected because they are dealt with in
category-specific regions in the ventral visual stream
(Downing et al, 2006). The order of presentation followed a
predefined sequence of screen positions in such a way that
volunteers had the impression of following a path
throughout a bidimensional trajectory or maze covering the
entire screen (i.e. approximately 9 degrees of the volunteer’s
visual field) (Figure 24, upper part).
Each picture was displayed at a specific screen position and
pictures were organized in blocks of 9 contiguous images of
the same category (faces, buildings, or animals). Blocks
were spatially arranged such that a counterclockwise
navigation through the maze implied a fixed and repeated
succession of blocks of faces, buildings and then animals.
Between blocks, a fixation cross was displayed for 15-18
seconds. The size of the stimuli was ~0.8 visual degrees. To
ensure optimal encoding, the whole path of 81 images, each
shown for 3 seconds, was repeated five times. Participants
were instructed to memorize the position and content of
each picture as well as the order of appearance.
Importantly, the complete structure and overview of the
trajectory were never available to them.
The retrieval session inside the fMRI scan (Figure 24, lower
part) consisted of a mental imagery task: volunteers were
presented two images, representing the start and end
positions of a path that the volunteers would have to follow
mentally, one image at a time. A total of 54 trials were
presented. During each trial, two images of each 3.3 visual
degrees were simultaneously displayed on the center of the
screen for 8s. The mental trajectories included 3 to 6 images
(average 4.5) within a single image category. For each image
that they could conjure up during this mental travel,
volunteers had to signal by a key press whether it was a
face, a building or an animal they had in mind (one finger
and key per category). However, participants also had the
possibility to skip a trial if they could not remember any
part of it. The expected number of images of each type was
4. Research study 2: resting state
87
perfectly balanced between categories. Event duration was
not fixed and depended entirely on the speed at which each
subject recalled the requested images, resulting in event
durations varying between 200 ms and 4000 ms with most
events during less than 2000 ms.
Ten-minute rest sessions, during which participants stayed
immobile, eyes closed, were scheduled immediately before
and after encoding. Importantly, participants were
instructed only to relax, let their mind wander and stay
awake. These rest sessions were our state of interest: we
reasoned that changes in spontaneous brain activity
between the two rest sessions should reflect changes
induced by learning, i.e. the neural correlates of recent
memories.
Performance
At the end of the experiment, a memory retrieval test was
performed outside the scanner, in order to behaviorally
assess the accuracy of the spatial and content knowledge
acquired by the volunteers. They were presented with the
81 previously seen pictures from the maze and 48 novel
images of the same categories in random order. For each
trial, an image was displayed on the screen at a specific
location. Participants first had to specify whether this image
was part of the maze and, if they believed it was, if it was
displayed at its correct location. To this end, a two-
dimensional grid was displayed both during the learning
session and this task. The behavioral performance was
based on discrimination ability d’ of image content (Green
and Swets, 1966). Note that this behavioral recognition test
relies on different memory systems than the retrieval
session inside the fMRI: the latter involves binding of
multiple items into a sequence of events.
d = (probability of hits)
(probability of false alarms)
Participants were also asked at the end of the scanning
session whether they had mentally rehearsed the learning
task during the following rest sessions. If so, they had to
estimate the number of mentally rehearsed pictures during
Sensitivity index or
discrimination index d’ is
derived from signal
detection theory.
Higher values of d’
indicate better
discrimination ability,
i.e. a better
performance.
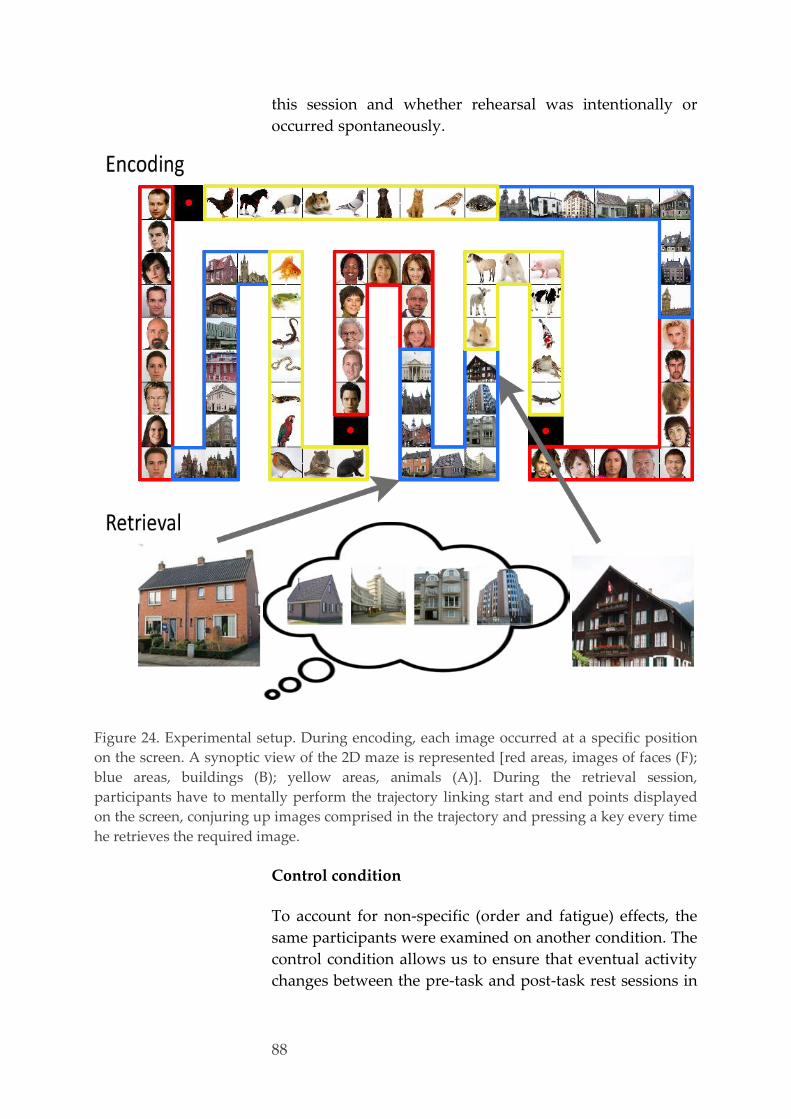
88
this session and whether rehearsal was intentionally or
occurred spontaneously.
Figure 24. Experimental setup. During encoding, each image occurred at a specific position
on the screen. A synoptic view of the 2D maze is represented [red areas, images of faces (F);
blue areas, buildings (B); yellow areas, animals (A)]. During the retrieval session,
participants have to mentally perform the trajectory linking start and end points displayed
on the screen, conjuring up images comprised in the trajectory and pressing a key every time
he retrieves the required image.
Control condition
To account for non-specific (order and fatigue) effects, the
same participants were examined on another condition. The
control condition allows us to ensure that eventual activity
changes between the pre-task and post-task rest sessions in
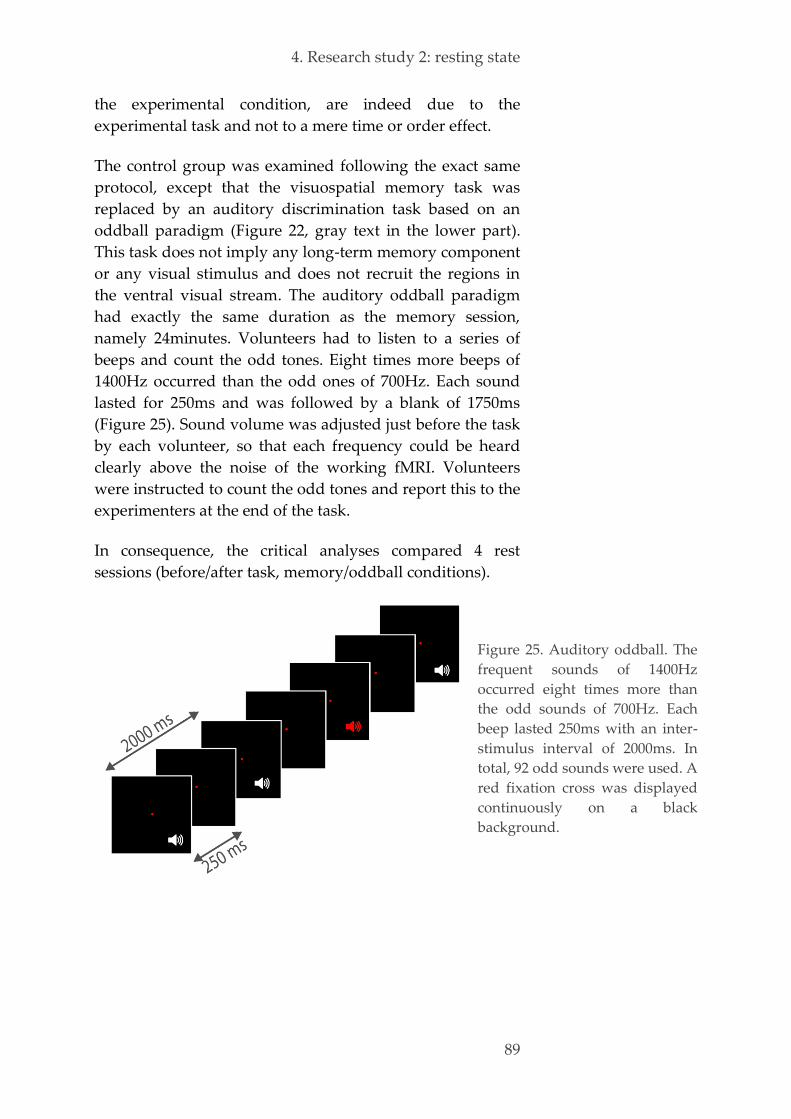
4. Research study 2: resting state
89
the experimental condition, are indeed due to the
experimental task and not to a mere time or order effect.
The control group was examined following the exact same
protocol, except that the visuospatial memory task was
replaced by an auditory discrimination task based on an
oddball paradigm (Figure 22, gray text in the lower part).
This task does not imply any long-term memory component
or any visual stimulus and does not recruit the regions in
the ventral visual stream. The auditory oddball paradigm
had exactly the same duration as the memory session,
namely 24minutes. Volunteers had to listen to a series of
beeps and count the odd tones. Eight times more beeps of
1400Hz occurred than the odd ones of 700Hz. Each sound
lasted for 250ms and was followed by a blank of 1750ms
(Figure 25). Sound volume was adjusted just before the task
by each volunteer, so that each frequency could be heard
clearly above the noise of the working fMRI. Volunteers
were instructed to count the odd tones and report this to the
experimenters at the end of the task.
In consequence, the critical analyses compared 4 rest
sessions (before/after task, memory/oddball conditions).
Figure 25. Auditory oddball. The
frequent sounds of 1400Hz
occurred eight times more than
the odd sounds of 700Hz. Each
beep lasted 250ms with an inter-
stimulus interval of 2000ms. In
total, 92 odd sounds were used. A
red fixation cross was displayed
continuously on a black
background.
90
fMRI data acquisition 4.2.4.
Functional time series
All fMRI time series were acquired on a 3T head-only
scanner (Magnetom Allegra, Siemens Medical Solutions,
Erlangen, Germany) operated with the standard transmit-
receive quadrature head coil. Multislice T2*-weighted
functional images were acquired with a gradient-echo echo-
planar imaging sequence (EPI) using axial slice orientation
and covering the whole brain: 34 slices, FoV 192x192mm²,
voxel size 3x3x3mm³, 25% interslice gap, matrix size
64x64x34, TR per slice 60ms, TR per volume 2040ms,
TE 30ms, TA 1980ms, FA 90°, 220 µs echo spacing,
bandwidth 3551 Hz/Px, slices acquired in ascending order
with the 17th slice as reference.
Field mapping sequence
For unwarping purposes, static field inhomogeneities were
measured immediately after the EPI time series in order to
be in the same conditions regarding shimming and head
position, using a field mapping sequence with the same
brain coverage and slice orientation. This gradient-recalled
sequence acquired two complex images with different echo
times (TE 4.92 and 7.38ms respectively, TR 367ms,
FoV 230x230mm², 64x64 matrix, 34 transverse slices, 3mm
thickness, 25% interslice gap, 3.6x3.6x3mm³ voxel size,
FA 90°, bandwidth 260 Hz/Px) and was used to generate
field maps for distortion correction of the functional images.
Structural image
Finally, for anatomical reference, a high-resolution
T1-weighted image was acquired for each subject using a
3D MDEFT sequence (Modified Driven Equilibrium Fourier
Transform) with 1 mm isotropic spatial resolution. FoV was
slightly increased (93.8%) in the phase-encoding direction to
avoid aliasing of the nose in the visual cortex (176 sagittal
slices of 1 mm thickness, 3D phase-encoded, TR 7.92ms,
TE 2.4 ms, TI 910 ms, FA 15°, FoV 256x240x176mm³,
BW 195Hz/Px, TA 12:51). This sequence is optimized
(Deichmann et al, 2004) in order to get a higher contrast-to-
In T2 or T2* weighted
imaging, cerebral white
matter (containing fat)
appears darker than
gray matter;
cerebrospinal fluid and
blood (containing
water) appear bright.
fMRI is a non-invasive
way to measure
regional changes in
cerebral metabolism,
cerebral blood flow
and blood volume in
response to neural
activity, using a
method based on the
blood oxygenation
level dependent or
BOLD signal (Ogawa
et al, 1990).
In T1 weighted imaging,
tissues efficient in
exchanging energy,
such as fat, cerebral
white matter and bone,
have high signal
intensity.
Cerebrospinal fluid,
water and blood,
appear dark.
If a high resolution is
needed, whole brain
coverage takes much
longer than the EPI
sequences, in the order
of minutes instead of
seconds. For structural
images, slices are
usually thinner than
functional images, for
example 1 mm.

4. Research study 2: resting state
91
noise ratio between white matter and gray matter with
better homogeneity through the whole brain (compensation
for B1 inhomogeneities).
Data analysis 4.2.5.
Our complex dataset presents challenges that are difficult to
solve using standard neuroimaging analyzing techniques
such as univariate models. Therefore, we apply several
state-of-the-art techniques in order to obtain as much
information as possible about the distributed cortical
network for perception of faces, buildings and animals in
resting state: dynamic causal modeling, cross-correlations
and explained variance, spatial networks identification, and
multivoxel pattern analysis.
4.2.5.1. Preprocessing
Before data analysis, the functional time series had to
undergo several preprocessing steps (Figure 26, left panels).
First, the three initial volumes of each EPI time series were
discarded to avoid T1 saturation effects.
In the next step, the images were corrected for differences in
slice acquisition timing: slices were acquired in ascending
order, and corrected to the middle slice.
Spatial distortions or deformations caused by static field
inhomogeneities were now estimated in a voxel
displacement map using the Fieldmap toolbox (Hutton et al,
2002). They were simultaneously realigned and unwarped
(Andersson et al, 2001) to account for the subject
movements in the scanner and for the interaction between
these movements and the spatial deformations.
Then, all functional time-series were coregistered to the
subject’s own structural image.
In a further preprocessing step, the images were segmented
in white matter, gray matter and cerebrospinal fluid, and
functional images and high resolution structural images
were normalized to a standard space in order to allow

92
between-subject comparisons. We used the MNI template
(Collins, 1994).
Finally, the images were smoothed using a Gaussian
function with an 4 mm full-width at half-maximum kernel
in order to reduce slightly the high frequency spatial noise
in the images, while keeping a good spatial accuracy (Cukur
et al, 2013), and hence improve the signal-to-noise ratio.
Residual interindividual differences are minimized (Friston,
2004), making them suitable for statistical analyses.
Figure 26. Schematic representation of the preprocessing and conventional statistical analysis
of fMRI data using SPM.
The MNI template is an
EPI template of the
Montreal Neurological
Institute, an average
image of 305
anatomical images.
4. Research study 2: resting state
93
4.2.5.2. Univariate analysis
We applied a GLM, a multiple regression model which
considers the voxels in a mass univariate way (Kiebel and
Holmes, 2004), to the maze learning session in order to
identify the anatomical locations of the ROIs of the 3
stimulus types, based on stimulus onsets (Figure 26, middle
and right panels). In the model specification, the time series
were high-pass filtered to eliminate low-frequency
components (cutoff: 1/128Hz) and adjusted for estimated
movements using multiple regressors (the realignment
parameters), effects that would not be convolved with the
hemodynamic response and hence may confound the data.
Exploration session
We first applied an F-test to determine the main activation
of the task irrespective of the category of images, i.e. all the
voxels whose activity was statistically significantly
correlated with any of the three conditions. The statistical
map was thresholded at p<.001 voxel level (not corrected for
multiple comparisons) and the ensuing mask was further
used for time series extraction.
The first level within-subject FFX each category of stimuli is
compared to the average of the other two, producing 3
contrast images per subject. At the second level between-
subject RFX, 3 separate T-tests are used to find the main
effect of each category, i.e. those voxels that are more active
when all volunteers viewed one category than the mean
activity when seeing the two other categories. The main
effect of each category was further used for ROI selection.
The anatomical locations of the ROIs were defined by
superimposing the RFX statistical maps on the high
resolution structural image. We used the mean of our
dataset instead of the MNI template in order to estimate
more accurately the exact location of the ROIs. The center of
the responses were defined as the global maximum of
responsive voxels with a significance threshold set to
p<0.001 (not corrected for family-wise errors, FWE).
A T-test is any
statistical test in which
the test statistic follows
a T distribution if the
null hypothesis is
supported. A T-test is
either positive or
negative.
An F-test is any
statistical test in which
the test statistic has an
F distribution under
the null hypothesis. An
F-test can be viewed as
testing for the
additional variance
explained by a larger
model.
In the first level FFX
(fixed effects analysis),
it is assumed that all
subjects correspond to
the same model. Only
within-subject variance
is used in this kind of
test. The purpose of the
FFX is to find only
those areas that are
activated on the
average across
volunteers.
In the second level RFX
(random effects
analysis), it is assumed
that different subjects
might correspond to
different models. RFX
considers both within-
and between-subject
variance. The purpose
of the RFX is hence to
find areas that are
activated in the same
way in all volunteers.
94
Rest sessions
For the rest sessions, the extracted signal was adjusted for
realignment parameters through a GLM.
4.2.5.3. Stochastic DCM
In order to examine the effective connectivity and causal
influences between the 3 category specific regions during
resting state, we used stochastic DCM.
First, we determined the ROIs from the exploration session
(see previous section): spheres containing 27 voxels were
selected for each ROI in the right hemisphere. Then, we
extracted the signal of these voxels during the rest sessions
and summarized them into a single time series per region,
per session and per subject, using a principal component
decomposition (the 1st component is kept).
Second, we defined the model space (Figure 27). Because of
the absence of any driving or modulatory input in the
resting state sessions, a stochastic DCM was employed
(Daunizeau et al, 2009). We applied DCM on the extracted
time series of the rest sessions in two different approaches:
- For one approach, we explored every possible model, i.e.
models containing all possible combinations of
connections.
- For the other approach, we explored also subsets of
models, i.e. three families of models of interest (Figure
28). Our model selection was based upon two
experimental evidences of memory consolidation: replay
in the learned order (i.e. a first family with forward
connections in the direction from FFA to PPA to AA,
back to the FFA) or inverse order (i.e. a second family
with backward connections from FFA to AA to PPA,
back to the FFA). The third and last family contained the
fully connected model, which could not be excluded
because anatomical connections are not yet explored for
this brain area.
Third, Bayesian model selection (random effects inference)
was applied to select the (family of) model(s) with the best
Bayesian probability
measures a degree of
belief in a hypothesis.
For testing model
evidence, i.e. finding
the model or the family
of similar models with
the most likely
connections and best
explaining the
measures responses,
this means that
Bayesian inference is
relying on prior
knowledge about the
connectivity
parameters.
Stochastic DCM extracts
patterns of effective
connectivity from
resting state brain
activity. This
parametric statistic
approach examines
how the endogenous
activity of one region
drives that of another
region (Wertz et al,
2006; Daunizeau et al,
2009).

4. Research study 2: resting state
95
evidence, i.e. best explaining the observed data (Friston and
Penny, 2011).
Next, we examined the parameters of the models on
connection strength (Friston and Penny, 2011), namely the
intrinsic coupling between regions, changes in coupling due
to external input, and direct influences of inputs on the
regions. Correlations with the number of rehearsed images
and d’ were tested using the Spearman rank correlation
coefficient.
Figure 27. DCM models. Forward
connections (F-B-A, gray arrows)
and backward connections (A-B-F,
black arrows) between FFA (red F),
PPA (blue B) and animal area
(yellow A).
Figure 28. DCM model specification. The 14 DCM’s used for Bayesian model comparison in
the second approach. Upper part: family of models with only forward connections (gray
arrows). Middle part: family of models with only backward connections (black arrows).
Lower part: family with the fully connected model. Intrinsic connections are always present.

96
4.2.5.4. Explained variance
To quantify the dynamics of memory trace reactivation
during post-task rest, we computed how much of the
variance of the BOLD signal during the post-task rest
session could be explained statistically by their signal
during the learning task, after taking into account the
baseline activity already present in the pre-task resting
session.
First, we selected 3 ROIs for each volunteer and for each
category separately (faces, buildings and animals), similar
as for DCM analysis, see 4.2.5.3.
Second, to continue the analysis with only one timecourse
per ROI, per session and per subject, we employed a
principal component analysis and used the first component.
The signal was detrended in order to remove linear and
nonlinear trends. Scaling was checked, enforcing a
maximum change of 4%, in line with DCM processing.
Next, the signal was filtered with a butterworth filter: a
bandpass filter of order 4 with a high and low cutoff
frequency of 0.008 TR and 0.16 TR, which corresponds to
0.0163 Hz and 0.3264 Hz respectively.
Third, we tested three different strategies for extracting data
from the time series. For all strategies, the complete 10
minutes of resting state were used:
- For the first strategy, the complete timecourse of the
exploration task and the rest sessions were extracted for
the three ROIs.
- For the second strategy, only epochs of 8 scans at the
transition from one stimulus to another were considered.
The pauses between blocks were simply excluded from
further analysis.
- For the third strategy, we flipped the transition epochs
in time and compared them with the normal epochs.
Next, the explained variance (EV) of the correlation pattern
during post-task rest, caused by the learning task, was
An explained variance of
100% would mean that
the activity during the
task and post-task rest
were identical.

4. Research study 2: resting state
97
computed using the square of the partial correlation
coefficient, as in (Kudrimoti et al, 1999):
EV = r ² task, post | pre
where r task, post | pre reflects the effects of the learning task on
the activity correlations in the post-task rest, after
controlling for any pre-existing relationship that might have
been present in the pre-task rest.
We tested the significance level of the differences in EV with
the Mann Whitney U test. All p-values were Bonferroni
corrected for multiple comparisons.
4.2.5.5. Spatial networks identification
In order to study the functional interactions between the
resting state networks in the brain at the group level, we
used NEDICA (network detection using ICA) of
NetBrainWork, which is a Matlab toolbox for processing
resting state fMRI datasets using independent component
analysis (ICA) ((Perlbarg et al, 2009),
sites.google.com/site/netbrainwork).
First, images were registered into the MNI standardized
space before performing a hierarchical clustering on the IC.
A group T-map was associated with each category (Perlbarg
et al, 2008b). Functional resting state networks, known from
the literature (Damoiseaux et al, 2006), were selected from
the T-map and used for subsequent analysis as the main
networks of interests (NOIs, Figure 29).
Second, ROIs of 20 voxels were selected around the peaks of
each group T-map, at least 4 cm apart. Since they were
detected on the rest sessions, these nodes were not the
activated areas during the learning task. We therefore
manually added two networks with regions based on the
GLM analysis of the task learning: one hippocampal
network, and one maze network comprising the FFA, PPA
and AA.
Third, CORSICA was employed to identify and remove
components related to physiological noise (Perlbarg et al,
2007). The functional interactions within and between the
Spatial networks
combine automatic
identification of the
functional large-scale
brain networks at the
group level, and ROI-
based analyses to
measure functional
interactions within and
between networks
(Figure 29). This allows
comparing the
interaction at different
brain scales between
groups of subjects or
different experimental
conditions (Perlbarg
and Marrelec, 2008a;
Perlbarg et al, 2008b).
CORSICA (correction
of structured noise
using spatial
independent
component analysis)
uses prior information
on the spatial
localization of the main
physiological
fluctuations in fMRI
data. The technique
includes 3 steps:
- spatial ICA
decomposition
- selection of noise-
related components
using specific masks of
interest comprising the
ventricles, brainstem
and basilar arteries
- removal of these
noise components.

98
NOIs were quantified with hierarchical integration and
partial correlation. In this study, integration was estimated
1000 times and presented as the mean and its standard
deviation.
Fourth, since hierarchical integration provides a global
measure of interaction, it is unable to quantify pairwise
functional connectivity. To do so in a given network, we
resorted to partial correlation (Marrelec et al, 2009; Smith et
al, 2011) which was computed using the 1000 samples of the
Bayesian numerical sampling scheme (Marrelec et al, 2009).
The density of connections at a given threshold was
computed as the number of ROI pairs for which partial
correlation was above the threshold. A connectivity curve
was obtained by computing the density of connections
across a range of thresholds. Finally, the integrated
difference in partial correlations (IDPC) was computed,
which is independent from the threshold and quantitatively
estimates the differences in connectivity between
conditions.
Functional integration is
the analysis of effective
connectivity: how did
the experimental
manipulation
propagate through the
network? (Marrelec et
al, 2008).
Functional specialization
or segregation on the
other hand is the
localization of brain
activity: where in the
brain did the
experimental
manipulation have
effect?
Partial correlation
measures the degree of
association between
two random variables,
with the effect of a set
of controlling random
variables removed.
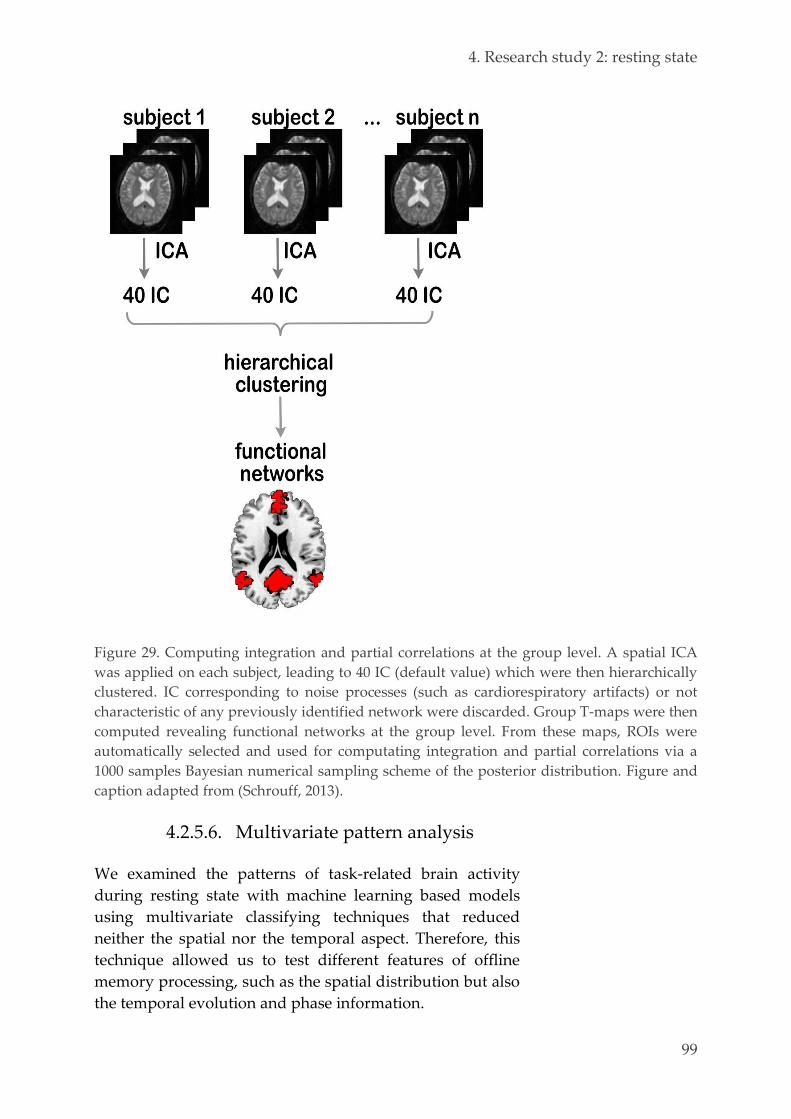
4. Research study 2: resting state
99
Figure 29. Computing integration and partial correlations at the group level. A spatial ICA
was applied on each subject, leading to 40 IC (default value) which were then hierarchically
clustered. IC corresponding to noise processes (such as cardiorespiratory artifacts) or not
characteristic of any previously identified network were discarded. Group T-maps were then
computed revealing functional networks at the group level. From these maps, ROIs were
automatically selected and used for computating integration and partial correlations via a
1000 samples Bayesian numerical sampling scheme of the posterior distribution. Figure and
caption adapted from (Schrouff, 2013).
4.2.5.6. Multivariate pattern analysis
We examined the patterns of task-related brain activity
during resting state with machine learning based models
using multivariate classifying techniques that reduced
neither the spatial nor the temporal aspect. Therefore, this
technique allowed us to test different features of offline
memory processing, such as the spatial distribution but also
the temporal evolution and phase information.
100
First, in order to test which machine learning-based model
would be optimal for our experiment, two classifiers (SVM
and GP) using different univariate and multivariate feature
selection steps (GLM and/or SVM) were applied on the task
learning (encoding) and mental imagery (retrieval) sessions.
Note that this part of the experiment was a preparatory
step, necessary for the next part which is the main goal of
this thesis, and will not be further described here. For
supplementary information about the methodology and the
results, we refer the reader to the design optimization paper
(Schrouff* et al, 2012).
Then, the classifier with the highest accuracy (GP, because
this technique tended to be more robust than SVM to model
unbalanced data sets) was trained on the mental imagery
session and applied to each rest session. This part of the
experiment is the goal of this thesis and will be described in
detail in this chapter, namely: what is the signal of interest
(signal extraction), where is it located (feature selection) and
how are patterns defined (classification procedure). The
retrieval session was chosen as training set because
1) cognitive processes are less controlled than during
encoding; 2) it has an increased variance because the
duration of the session was self-paced; and 3) it implied an
activation of recent memories in the absence of visual input,
i.e. the condition closest to potential spontaneous replay
during resting sessions.
Signal extraction
After pre-processing, the signal was extracted and adjusted.
For the sessions considered for further modeling (i.e. the
retrieval session and the 4 rest sessions for each subject), the
whole time series of all voxels were used (i.e. without
consideration of experimental design). The data matrix was
then adjusted for movement effects (estimated by
realignment parameters) and low frequency drifts (cutoff:
1/128 Hz) using a GLM (Friston et al, 2007).
For the retrieval session, the signal corresponding to
stimulus onsets was then extracted, considering a
hemodynamic response function (HRF) delay of 6 seconds.
To avoid decoding the signal linked to motor activity, the
MVPA decoding
techniques are based
on distributions or
patterns of responsive
voxels. MVPA methods
require at least two
separate datasets:
- In the training phase,
the classifying model is
built and trained on a
large dataset. All scans
of the time series
receive a label to which
category they belong
(F,B, or A in our
experiment) and the
model hence learns, i.e.
builds a mathematical
algorithm, to
discriminate between
the patterns of activity
of the different
categories in order to
classify them in the
correct category,
helped by the labels.
- In the test phase, this
model is applied to a
test set, which does not
contain any label. The
model hence has to
predict to which
category the test set
corresponds, based
solely on the pattern of
brain activity.

4. Research study 2: resting state
101
scans selected for further classification were the ones
preceding the key presses (after correction for HRF delay).
The signal was finally averaged over specific time-windows
to increase the signal-to-noise ratio (Kamitani and Tong,
2005; Mourao-Miranda et al, 2006). For the retrieval session,
this average was performed over the interval between two
key presses, with a maximum of 2 scans (i.e. 4080 ms) to
avoid the inclusion of episodes of task-unrelated thoughts.
For rest sessions, each scan was considered as a sample and
the adjusted data matrix directly entered the test phase of
the classification without any further processing.
Feature selection
In this work we considered a univariate filter based on the
results of a GLM analysis followed by a multivariate
wrapper, selecting features according to the accuracy of SVM
classifiers (Guyon and Elisseeff, 2003). For a detailed
description of this procedure, we refer the reader to the
paper of (Schrouff* et al, 2012) and Figure 30.
The univariate filter determined, from a GLM analysis, the
subset of active voxels (i.e. whose activity was statistically
significantly correlated with the three conditions) (Mitchell
et al, 2004). From the resulting F-maps, the 1000 voxels with
the highest F-values were selected (Shinkareva et al, 2008).
The multivariate feature selection was based on binary SVM
classifiers using linear kernels to rank the voxels according
to their discriminating power, which was computed from
their specific weights (Mitchell et al, 2004). In order to
differentiate between the 3 categories of stimuli (faces,
buildings and animals), we used 3 binary classifiers. The
voxels with the largest absolute weights were selected for
further modeling. The number of selected voxels
systematically varied from 5 (per condition and binary
comparison) to 130 at most, by increments of 25.
At each iteration, the sum of the accuracy of the three
binary models on a left-out block was taken as a global
accuracy measure (Table 6), the selected subset of features
corresponding to the maximum of global accuracy. Features
were thus added recursively following a recursive feature
GP (Gaussian processes)
is based on the concept
that all datapoints have
normal (Gaussian)
distributions. As
opposed to SVM, the
number of support
vectors in each
category in GP is not
related to the number
of data points per
category (Rasmussen
and Williams, 2006),
and for each input
datapoint, there is a
classifying output and
an associated
probability, which
might carry important
information. An
advantage is that GP is
more suitable for
classifying imbalanced
categories. A
disadvantage is the risk
of overfitting, i.e. when
the model begins to fit
noise.
SVM (support vector
machine) uses a cost
function for defining a
decision boundary in
order to assign a label
to each datapoint
(Burges, 1998). SVM is
a sparse method
because only a few
support vectors (i.e. the
nearest datapoints to
the hyperplane) are
used to define the
separating hyperplane.
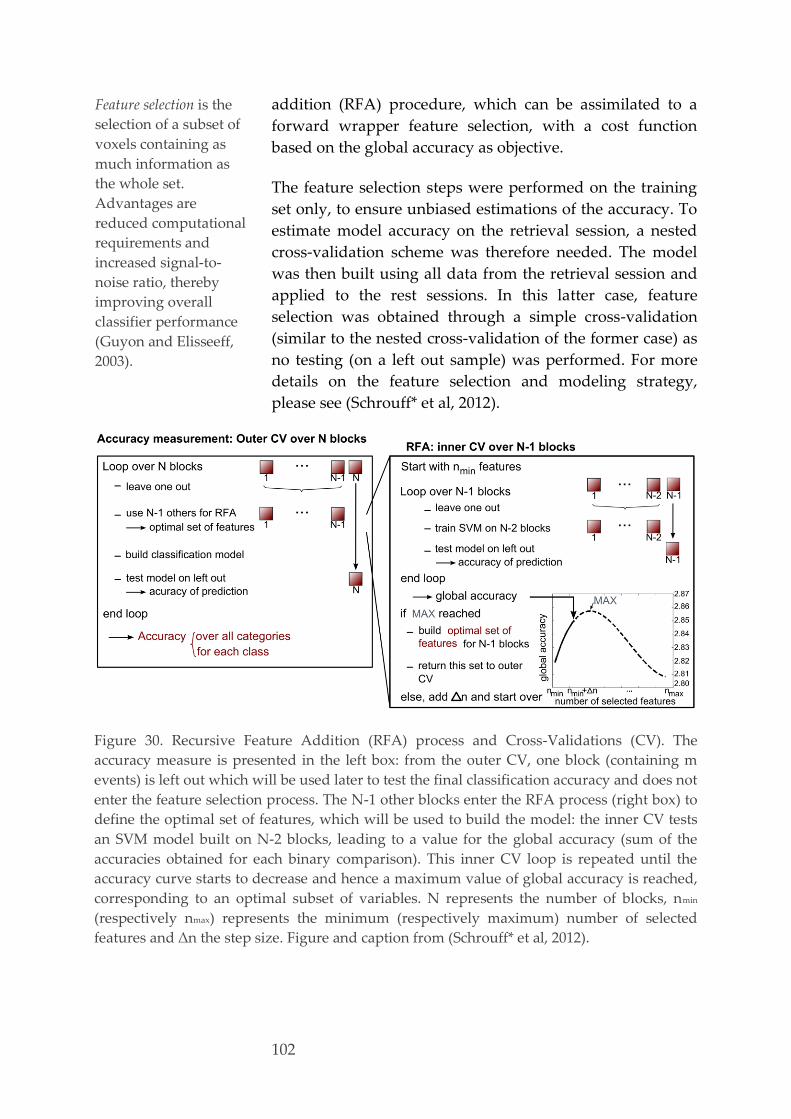
102
addition (RFA) procedure, which can be assimilated to a
forward wrapper feature selection, with a cost function
based on the global accuracy as objective.
The feature selection steps were performed on the training
set only, to ensure unbiased estimations of the accuracy. To
estimate model accuracy on the retrieval session, a nested
cross-validation scheme was therefore needed. The model
was then built using all data from the retrieval session and
applied to the rest sessions. In this latter case, feature
selection was obtained through a simple cross-validation
(similar to the nested cross-validation of the former case) as
no testing (on a left out sample) was performed. For more
details on the feature selection and modeling strategy,
please see (Schrouff* et al, 2012).
Figure 30. Recursive Feature Addition (RFA) process and Cross-Validations (CV). The
accuracy measure is presented in the left box: from the outer CV, one block (containing m
events) is left out which will be used later to test the final classification accuracy and does not
enter the feature selection process. The N-1 other blocks enter the RFA process (right box) to
define the optimal set of features, which will be used to build the model: the inner CV tests
an SVM model built on N-2 blocks, leading to a value for the global accuracy (sum of the
accuracies obtained for each binary comparison). This inner CV loop is repeated until the
accuracy curve starts to decrease and hence a maximum value of global accuracy is reached,
corresponding to an optimal subset of variables. N represents the number of blocks, nmin
(respectively nmax) represents the minimum (respectively maximum) number of selected
features and Δn the step size. Figure and caption from (Schrouff* et al, 2012).
Feature selection is the
selection of a subset of
voxels containing as
much information as
the whole set.
Advantages are
reduced computational
requirements and
increased signal-to-
noise ratio, thereby
improving overall
classifier performance
(Guyon and Elisseeff,
2003).

4. Research study 2: resting state
103
Classification procedure
After feature extraction and selection, the retrieval session
was modeled using binary Gaussian Processes classification
(GP (Rasmussen and Williams, 2006)). In order to obtain
multiclass predictions from the three binary classifiers, an
error-correcting output code scheme (ECOC (Dietterich and
Bakiri, 1995)) was used to assign a prediction (F, B or A) to
each trial, based on the binary one-versus-one Gaussian
Processes classifiers ((Schrouff* et al, 2012), Table 6). Model
performance was assessed in terms of balanced accuracy
(i.e. average of the class accuracies) and tested for
significance using 1000 permutations.
Table 6. ECOC based on the probabilities of the three binary classifiers, one for each possible
pair of categories, using predictions (left panel) or probabilities (right panel). Rows
correspond to the considered categories and columns to the different binary comparisons (F
faces, B buildings and A animals). An example is given in the last row, with the
corresponding Euclidean distance Lk (and how it is calculated in detail) between the
codewords of each class and the binary predictions for the example data point. The class
leading to the smallest distance Lk is associated to the data point (in our example buildings,
in bold text). k ranges from 1 to K, the number of classes.
Category Prediction
codeword
Probability
codeword
Example Lk and computation
F-B F-A B-A F-B F-A B-A
Faces 1 1 0 1 1 0.5 L1 = 1.4 = |1-0.2|+|1-0.6|+|0.5-0.7|
Buildings -1 0 1 0 0.5 1 L2 = 0.6 = |0-0.2|+|0.5-0.6|+|1-0.7|
Animals 0 -1 -1 0.5 0 0 L3 = 1.6 = |0.5-0.2|+|0-0.6|+|0-0.7|
Example
values
0.2 0.6 0.7
The model was then applied to the 4 rest sessions, in order
to compute the proportions of scans during which task-
specific activity patterns were reinstated. Modeling
spontaneous brain activity, i.e. rest sessions, is a challenge
for two main reasons.
The first challenge is the absence of a ground truth: there
are no means of checking the accuracy of the predicted
output. To solve this issue, we used the confidence of the
classifier rather than its predictions. We indeed assumed
that if a scan was strongly linked to the task the model was
104
built for, the classifier would be more confident about its
prediction than about a random prediction. This confidence
measure allowed assessing scans which were significantly
linked to the task. The confidence of the classifier was
assessed by the distance (named L) between the two most
probable categories, in terms of distances to the codewords
(Dietterich and Bakiri, 1995). Finally, to compare the
memory and control conditions, each rest session was
summarized by only one number.
The second challenge is finding a baseline to compare with.
We solved this issue also by permuting confidence
measures. More specifically, the model built on the retrieval
session (i.e. the three binary GP classifiers computed from
the retrieval session) was applied to each scan of the rest
sessions. Thereby, each scan was classified as being closer to
either the pattern of retrieving a picture of a face, of a
building or of an animal. No other choice is possible in view
of how our model was defined (i.e. no comparison with a
rest condition). Since each scan is associated with a label
(i.e. face, building or animal), we needed to distinguish the
scans that were classified randomly (i.e. each binary
classifier led to a low probability associated with the
prediction, probably close to 50%) from those that were
classified more confidently (i.e. each binary classifier led to
a high probability associated with the prediction).
In this sense, the ECOC approach was used to associate a
label to each scan and also to assess the confidence of the
prediction by taking the distance between the two most
probable classes (in terms of distance to the ECOC table,
Table 6). A unique measure, referred to as L, is therefore
attributed to each scan and is computed as:
L = Lk1 – Lk2
with Lk1 = max k=1...K Lk and Lk2 = max k=1...K\k1 Lk, the difference
between the two most probable classes, with k being the
number of classes. In the example of Table 6, L = |1.4-0.6| =
0.8. For each prediction, the baseline level of L was then
computed using 1000 permutations of the true training
labels.

4. Research study 2: resting state
105
The labels of the training set were then randomly shuffled,
resulting in one value of L per scan and permutation (Li). As
in the correction for multiple comparisons, the maximum
value of L was then selected for each permutation (Lp)
which allowed comparing the L value of each scan (Li) to
the 1000 L values of the permutations (Figure 31).
The proportion of scans linked to the memory task, further
referred to as Pr, was then computed as the percentage of
scans for which the associated p-value was <0.05. The
classification procedure of the retrieval and rest sessions is
illustrated in Figure 32.
Figure 31. Assessing the significance of L. L was first computed for each scan using the true
labels. The labels of the training set were then randomly shuffled, resulting in one value of L
per scan and permutation (Li). As in the correction for multiple comparisons, the maximum
value of L was then selected for each permutation (Lp) and compared to the L values
obtained from the true labels
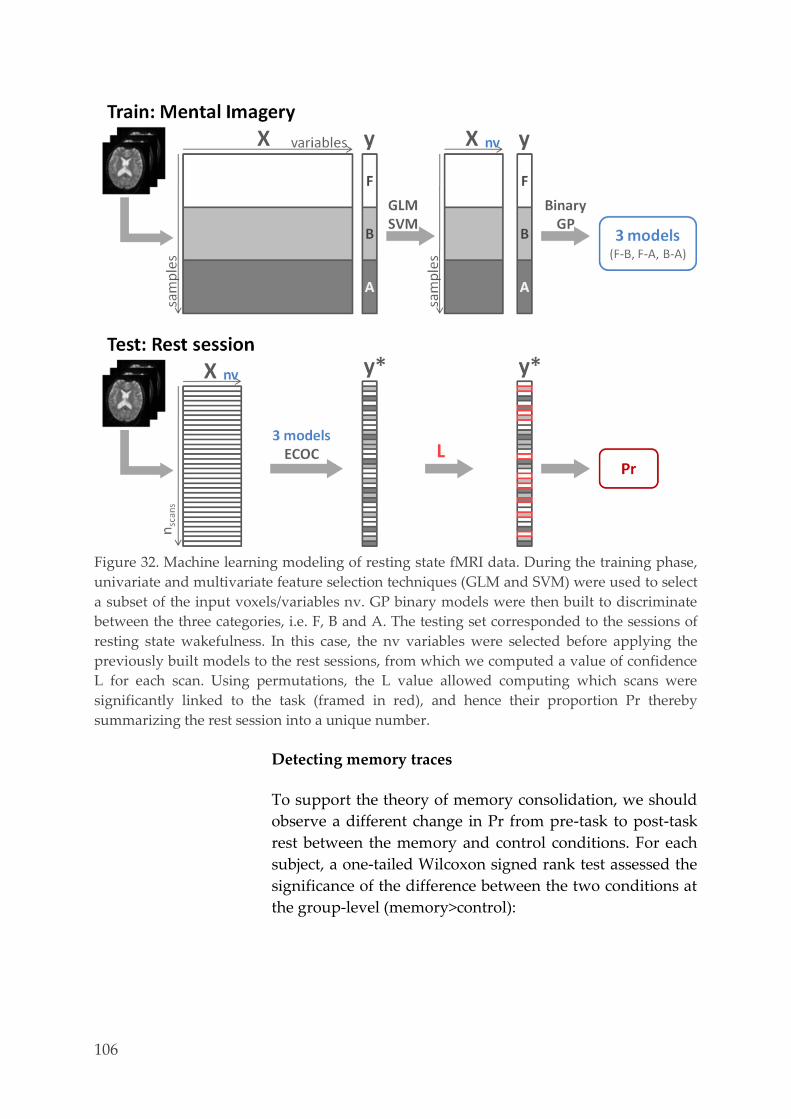
106
Figure 32. Machine learning modeling of resting state fMRI data. During the training phase,
univariate and multivariate feature selection techniques (GLM and SVM) were used to select
a subset of the input voxels/variables nv. GP binary models were then built to discriminate
between the three categories, i.e. F, B and A. The testing set corresponded to the sessions of
resting state wakefulness. In this case, the nv variables were selected before applying the
previously built models to the rest sessions, from which we computed a value of confidence
L for each scan. Using permutations, the L value allowed computing which scans were
significantly linked to the task (framed in red), and hence their proportion Pr thereby
summarizing the rest session into a unique number.
Detecting memory traces
To support the theory of memory consolidation, we should
observe a different change in Pr from pre-task to post-task
rest between the memory and control conditions. For each
subject, a one-tailed Wilcoxon signed rank test assessed the
significance of the difference between the two conditions at
the group-level (memory>control):

4. Research study 2: resting state
107
ΔPrm - ΔPro > 0
with ΔPrm = PrR2m - PrR1m and ΔPro = PrR2o - PrR1o the
difference in Pr from pre-task (PrR1m and PrR1o) to post-task
rest (PrR2m and PrR2o), respectively.
We also checked whether task-related reactivations were
not related to active rehearsing of the learned material
during resting fMRI sessions, despite the experimental
instructions.
Relationship with behavioral measure
The subjects’ behavioral performance d’ (Green and Swets,
1966) in terms of content of the images (derived from the
recognition task following the experiment) was correlated
with the increase in Pr from pre-task to post-task rest
session (ΔPr) in both the memory and control conditions.
We hypothesized that a positive correlation in the memory
condition would be in support of the memory consolidation
theory: the higher the proportion of scans significantly
related to the task Prm, the higher the performance d’ would
be.
The values obtained for the correlation rho, as well as their
difference, were then compared to correlation coefficients
obtained from random permutations of d' across subjects.
1000 Permutations were performed, giving a null
distribution for correlation coefficients in the memory and
control conditions as well as for their difference.
Temporal evolution
We also assessed the duration of reactivations. We defined
an episode as one or more successive scans which are
significantly linked to the task. This made it possible to
compute their duration and their proportion (compared to
the total number of scans linked to the task). The threshold
of minimum duration was varied from 1 to 10. The
proportion of episodes with a minimum duration equal or
larger than the threshold could then be computed, as well
as their average duration. To reveal population effects, the
proportion and average duration of the episodes were
averaged across subjects. Finally, a Friedman test assessed

108
the significance of the difference between the memory and
control conditions (by subtracting the pre-task from the
post-task value).
The order of the memory and control condition was
counterbalanced across participants, which could affect the
spontaneous activity during the rest sessions of the control
condition. This was tested as well.
Phase information
Finally, we estimated whether the phase structure
implemented in the experimental design influenced the
temporal organization of the reactivations during post-
learning resting wakefulness. Studying the phase
information using machine learning modeling required the
use of the labels associated to each scan. More specifically,
we identified which transitions of the labels (i.e. from face F
to building B for example) led to a scan significantly linked
to the task. Using this concept, a matrix of transitions could
be built for each subject and rest session. To account for the
different number of scans included in the rest sessions, the
number of transitions was converted into proportions of
transitions, i.e. the number of transitions divided by the
length of the time-series.
We then defined the forward cycle as the transitions in
accordance with the temporal structure imposed during the
encoding session, i.e. F-B-A-F. As a control, we also defined
the reverse cycle, i.e. F-A-B-F (Figure 27 in section 4.2.5.3).
The transitions following the forward or reverse cycles were
then summed, to obtain two measures per subject and per
rest session (Table 7), corresponding to the proportions of
transitions following the forward or reverse cycle. The
increases in transitions from pre-task to post-task rest
sessions were then computed for both the forward and
reverse cycles. We therefore obtained four values: ΔPr for
the forward and reverse cycles, in both the memory and
control conditions. According to our hypothesis, we should
observe a significant effect of the condition on the forward
cycle, but not on the reverse cycle and this should be
noticeable in the memory condition. These hypotheses were
tested using Wilcoxon ranked sum test.

4. Research study 2: resting state
109
Table 7. Illustration of our transition matrix. Columns represent the labels associated to the
scans significantly linked to the task whilst rows represent the labels associated to the scans
preceding them. The transitions can then be identified in 3 categories: identical transitions (i),
transitions following the forward cycle (f) and transitions following the reverse cycle (r).
Scan t sign. linked to the task
F B A
Scan t-1 (sign. or not sign.) F i f r
B r i f
A f r i
Effect of the significance threshold
In this work, most analyses result from the choice of scans
defined as significantly linked to the task. More specifically,
we defined a threshold to which a scan is considered as
significantly linked to the task (p<0.05) that might affect
interpretation. To ensure that our results do not spuriously
result from the choice of this threshold, we computed the
increases in Pr for each condition, as well as its correlation
with the behavioral performance when varying the
threshold from 0.01 to 0.1.
4.2.5.7. Software and statistical testing
Most analyses were carried out with Matlab 7.12.0 (R2011a)
(Mathworks). The experimental design was coded in
Cogent 2000 and Cogent Graphics (http://www.vislab.
ucl.ac.uk/cogent.php). Preprocessing and univariate
analysis of the images was performed using SPM8
(www.fil.ion.ucl.ac.uk/spm). Dynamic causal modeling was
done with the DCM toolbox of SPM8. Cross-correlations
and explained variance were coded in Matlab. Spatial
networks were examined using NEDICA ((Perlbarg et al,
2008b) sites.google.com/site/netbrainwork). The SVM
implementation used is the LIBSVM toolbox ((Chang and
Lin, 2013) www.csie.ntu.edu.tw/~cjlin/libsvm) with a
PROBID interface ((Marquand and Mourão-Miranda, 2013)
www.brainmap.co.uk). The GP implementation
(www.gaussianprocess.org/gpml (Rasmussen and Williams,
2006)) is also interfaced in PROBID.

110
Statistical tests were performed with Matlab 7.12.0 (R2011a)
and SPSS 16.0. As a rule, nonparametric statistical tests were
used, given the size of the dataset. Friedman tests were
applied when comparing the three categories, and Wilcoxon
ranked sum tests were used as binary post hoc
comparisons. Correlations were verified with Spearman
rank tests. Model performance was tested for significance
using permutations.
4.3. Results
Population 4.3.1.
Sixteen healthy, right-handed participants participated in
the study (8 female, age range 19-29y). After discarding
behavioral outliers, 11 participants were included in fMRI
analyses (5 female, age range 21-27y, median 25; Table 8).
Five participants were excluded because of high anxiety
(Beck anxiety inventory >8) and depression (Beck
depression inventory >6) and because they did not comply
with total abstinence from caffeine and tobacco. Moreover,
one of them had a bad sleep quality (PSQI >8, sometimes
taking sleeping medication); for another, some data was
missing; and one participant who was an outlier on
performance scores (d’), used an alphabetic code (instead of
images) to mentally represent maze items. Moreover, after
the debriefing, these volunteers appeared to have
consciously rehearsed the task during the post-learning rest
session the whole time. To avoid any confound of active
rehearsal instead of memory consolidation or increased
noise in the dataset, we had to exclude them.
One volunteer preferred not to complete all parts of the IPI
because of personal reasons. Because all his other data was
normal, he was not excluded.
Performance 4.3.2.
All participants had an excellent retention of the
experimental material in terms of discrimination index d’
(Green and Swets, 1966). None had rehearsed any image in
the pre-task rest session, contrary to the post-task rest
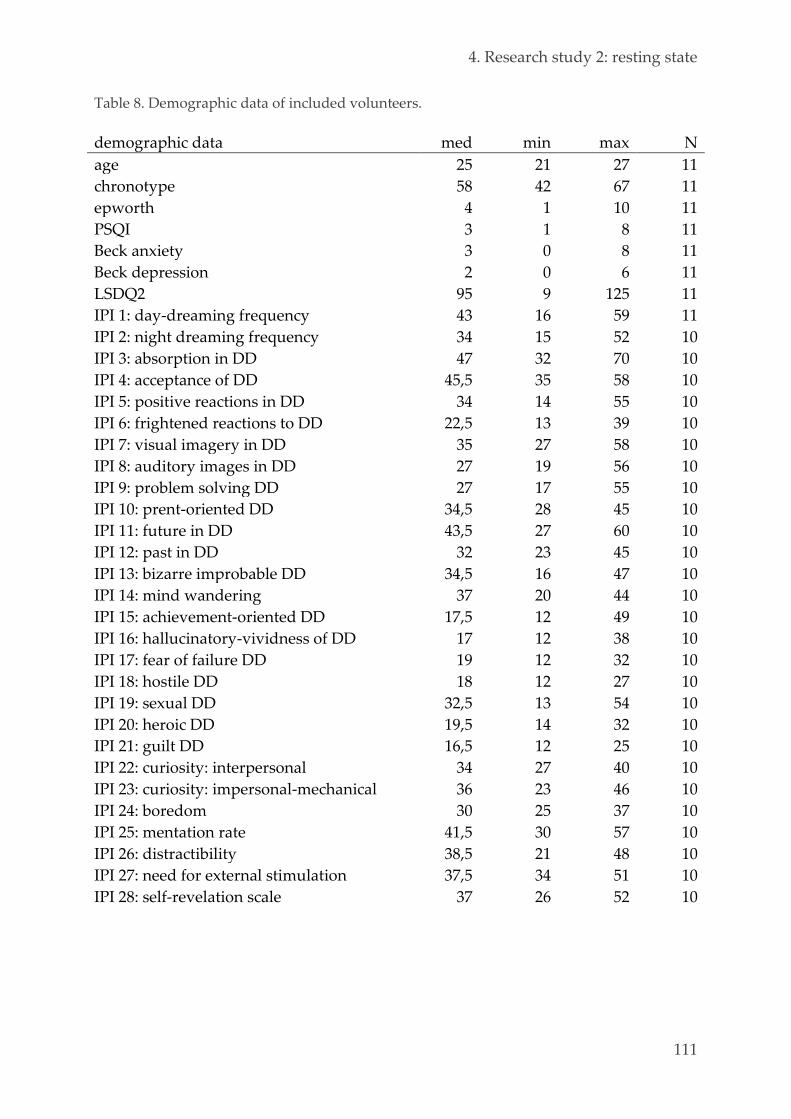
4. Research study 2: resting state
111
Table 8. Demographic data of included volunteers.
demographic data med min max N
age 25 21 27 11
chronotype 58 42 67 11
epworth 4 1 10 11
PSQI 3 1 8 11
Beck anxiety 3 0 8 11
Beck depression 2 0 6 11
LSDQ2 95 9 125 11
IPI 1: day-dreaming frequency 43 16 59 11
IPI 2: night dreaming frequency 34 15 52 10
IPI 3: absorption in DD 47 32 70 10
IPI 4: acceptance of DD 45,5 35 58 10
IPI 5: positive reactions in DD 34 14 55 10
IPI 6: frightened reactions to DD 22,5 13 39 10
IPI 7: visual imagery in DD 35 27 58 10
IPI 8: auditory images in DD 27 19 56 10
IPI 9: problem solving DD 27 17 55 10
IPI 10: prent-oriented DD 34,5 28 45 10
IPI 11: future in DD 43,5 27 60 10
IPI 12: past in DD 32 23 45 10
IPI 13: bizarre improbable DD 34,5 16 47 10
IPI 14: mind wandering 37 20 44 10
IPI 15: achievement-oriented DD 17,5 12 49 10
IPI 16: hallucinatory-vividness of DD 17 12 38 10
IPI 17: fear of failure DD 19 12 32 10
IPI 18: hostile DD 18 12 27 10
IPI 19: sexual DD 32,5 13 54 10
IPI 20: heroic DD 19,5 14 32 10
IPI 21: guilt DD 16,5 12 25 10
IPI 22: curiosity: interpersonal 34 27 40 10
IPI 23: curiosity: impersonal-mechanical 36 23 46 10
IPI 24: boredom 30 25 37 10
IPI 25: mentation rate 41,5 30 57 10
IPI 26: distractibility 38,5 21 48 10
IPI 27: need for external stimulation 37,5 34 51 10
IPI 28: self-revelation scale 37 26 52 10

112
session in the memory condition (Table 9). Buildings were
more difficult to remember (Friedman p=0.0346) than faces
(post hoc Wilcoxon tests, Bonferroni corrected, p=0.0404)
and animals (p=0.0066) as was also reported by the
volunteers in the debriefing; however, no difference was
found between faces and animals (p=1.000). In terms of the
number of rehearsed items, there was a difference between
categories (Friedman p=0.0116, post hoc Wilcoxon binary
comparisons did not survive Bonferroni correction: FB p=
0.6261; BA p=1.000; FA p=1.000).
Table 9. Behavioral performance d’ (in terms of the content of the images and of the position
on the screen) of all participants for every category separately and all categories confounded,
and the number of reported mentally rehearsed images during the post-task rest session.
Qualitative reports were translated as: all=27, most=20, less=10, few=2 and are marked by
asterisks (*).
subject d’ content d’ position # rehearsed
F B A total F B A total F B A total
1 2,73 2,4 3,56 3,61 1,19 0,99 2,06 1,34 3 0 2 5
2 4,92 1,99 3,88 3,17 0,90 0,61 2,99 1,32 20* 10* 5 35*
3 4,92 3,88 3,56 4,69 4,00 0,65 2,96 1,96 2* 2* 2* 6*
4 4,92 2,08 3,88 3,23 2,27 2,29 3,31 2,69 20* 5 10* 35*
5 4,92 2,44 4,92 3,57 4,00 1,29 3,41 2,45 20 15 20 55
6 3,56 3,19 3,88 4,29 2,92 1,96 3,08 2,57 12 6 10 28
7 2,36 3,05 2,60 2,55 2,18 0,96 0,86 1,10 5 3 0 8
8 3,19 1,68 2,47 3,18 2,41 -1,52 1,79 1,13 20 18 15 53
9 2,44 0,94 3,14 1,94 2,58 1,69 1,21 1,77 0 0 1 1
10 2,36 1,99 3,88 2,56 2,06 0,00 2,26 1,20 2* 2* 2* 6*
11 2,60 2,64 4,92 3,01 2,56 1,32 1,45 1,70 27 15 27 69
Stochastic DCM 4.3.3.
We selected 3 ROIs in the right hemisphere. The xyz
coordinates of the center of the spheres, each containing 27
voxels, were respectively 40,-50,-22 for the FFA; 20,-44,-14
for the PPA; and 50,-68,2 for the AA (Figure 33).
Testing all models
First, we tested all models with all possible connections.
Bayesian model selection (random effects inference)
revealed that the fully connected model was significantly
the best in all rest sessions (Figure 34).

4. Research study 2: resting state
113
Figure 33. GLM of the exploration task on the structural template of our 11 subjects. For
display purposes, the XY coordinates are X = +10 and Y= 0, uncorrected at p = 0.001. Red =
faces (Z coordinate of this slice = -22), blue = buildings (Z = -14), yellow = animals (Z = +2).
Testing families of models
Second, the models of interest were specified into three
families (Figure 28 in section 4.2.5.3). Model selection
revealed that the forward model, mimicking the order that
is imposed by the memory task, had the greatest evidence
only during the post-learning rest session in the memory
condition (Figure 35), suggesting spontaneous replay of
brain activity after task learning. The backward model was
the most probable during all other rest sessions (before the
memory task, before and after the control task).
Correlation with rehearsal and performance
Third, we checked whether the connective strength between
the three brain regions was related to participants
rehearsing the learned material during resting fMRI
sessions, despite the experimental instructions. No
significant correlation was found between the number of
mentally rehearsed images during the memory condition
and the model parameters of the fully connected model
(pre-task rho=0.4890, p=0.0760, post-task rho=0.2247,
p=0.4400), nor with the forward (pre-task rho=-0.0463,
p=0.8752, post-task rho=-0.2775, p=0.3367), or backward
models (pre-task rho=0.0463, p=0.8752, post-task rho=0.2775,
p=0.3367).
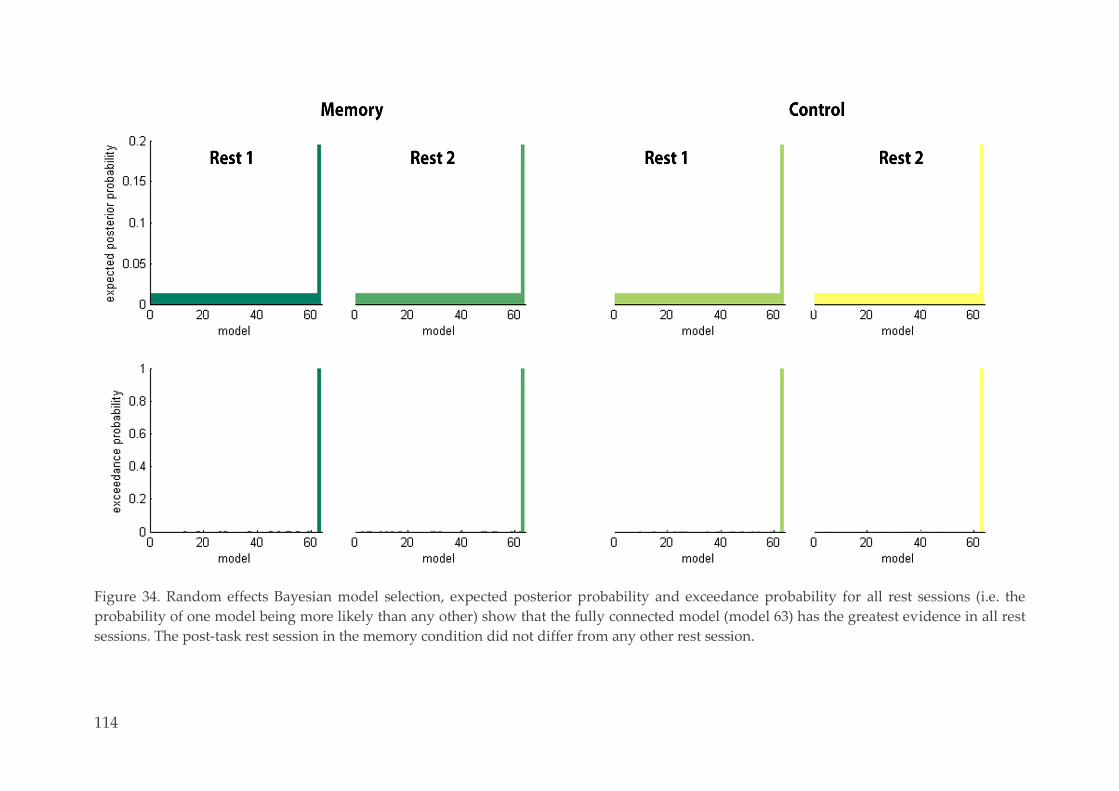
114
Figure 34. Random effects Bayesian model selection, expected posterior probability and exceedance probability for all rest sessions (i.e. the
probability of one model being more likely than any other) show that the fully connected model (model 63) has the greatest evidence in all rest
sessions. The post-task rest session in the memory condition did not differ from any other rest session.

4. Research study 2: resting state
115
Figure 35. Familywise Bayesian model selection was used to establish the neuronal network
architecture. Family expected probability and exceedance probability for all rest sessions.
The backward family wins in the pre-task rest, before and after the control task (black
circles). The forward family wins only in the post-task rest (gray circle).
In addition, we tested the same parameters during the
control auditory task. Similar results were found (fully
connected model (pre-control rho=-0.0154, p=0.9464, post-
control rho=0.0749, p=0.8343), forward (pre-control
rho=-0.2115, p=0.4680, post-control rho=-0.2203, p=0.4490)
and backward models (pre-control rho=0.2216, p=0.4464,
post-control rho=0.2203, p=0.4492)). Therefore, importantly,
the increase in forward connectivity in the post-task rest
session does not appear to result from active rehearsal by
participants.
We then checked whether memory performance d’ was
related to the connective strength of the winning model in
each rest session. No correlation was observed in the
memory condition with the fully connected model (pre-task
rho=0.0770, p=0.7936 and post-task rho=0.1540, p=0.5991),
the forward model (pre-task rho=-0.0946, p=0.7477 and post-
task rho=0.0132, p=0.9643) or backward model (pre-task
rho=0.0946, p=0.7477 and post-task rho=-0.0132, p=0.9643).
We found no correlation in the control condition with the
fully connected model (pre-control rho=0.0198, p=0.9464
and post-control rho=-0.0616, p=0.8343), forward model
(pre-task rho=-0.0682, p=0.8168 and post-task rho=0.4642,

116
p=0.0945) and backward model (pre-task rho=0.0727,
p=0.8050 and post-task rho=-0.4642, p=0.0945).
The difference between the correlations was not significant
either. In the memory condition there was neither a
significant correlation between the number of rehearsed
images and the fully connected model (rho=-0.3414,
p=0.2322), forward (rho=-0.1101, p=0.7078) or backward
model (rho=0.1101, p=0.7078), nor between d’ and the fully
connected model (rho=0.0242, p=0.9345), forward
(rho=0.2860, p=0.3215) or backward model (rho=-0.2860,
p=0.3215).
In the control condition, no correlation was found between
the rehearsed images and the fully connected model
(rho=-0.1123, p=0.7022), forward (rho=-0.1740, p=0.5519) or
backward model (rho=0.1740, p=0.5519). Correlations with
the discrimination index were nonsignificant as well: with
the fully connected model (rho=-0.1122, p=0.7025), forward
(rho=0.0902, p=0.7591) or backward model (rho=-0.0902,
p=0.7591).
These results do not support a strong relationship between
memory reactivation and later task performance.
Explained variance 4.3.4.
Voxels of interest
We selected the same ROIs as for the DCM analysis,
see 4.3.3.
Explained variance of full time courses
We extracted the timecourse of the 3 ROIs (Figure 36) and
calculated the partial correlation and explained variance.
During resting state after the memory task, 0.39% of the
BOLD signal in the FFA could be explained by the task,
0.50% in the PPA and 0.49% in the AA (Figure 37).

4. Research study 2: resting state
117
Figure 36. Example of the timecourse of one subject during maze exploration (filtered,
detrended mean across all voxels in each ROI). FFA is shown in red, PPA in blue and AA in
green. Bold lines indicate the theoretical BOLD signal in each region, in corresponding
colors.
First, we tested whether the explained variance (EV) of the
signal after task learning was significantly different from
zero. Expectedly, this was the case during post-task rest
(p<0.001). However, this was also the case during all other
rest sessions (p<0.001 for each).
Second, we found that EV post-task rest (which is already
taking into account the pre-task rest) was not different from
the pre-task rest, neither in the memory condition
(p(F)=0.9476; p(B)=0.8438; p(A)=0.0356), nor in the control
condition (p(F)=0.7928; p(B)=0.3579; p(A)=0.2122).
Third, we examined if there was a difference between EV in
the memory and control condition. This was not the case in
the post-task rest sessions (p(F)=0.8438; p(B)=0.1679;
p(A)=0.3579), and not in the pre-task rest sessions

118
(p(F)=1.000; p(B)=0.5994; p(A)=0.8438). Note that all values
are only significant at p=0.0167 after Bonferroni correction
for multiple comparisons.
Figure 37. Explained variance and its standard deviation for the three stimulus categories
(faces, buildings and animals).
Explained variance of transition epochs
We also considered short epochs of eight scans at the
transition from one stimulus category to another. During
the rest session following task learning, EV of the transition
from faces to buildings was 0.95%, from buildings to
animals the EV was 0.93% and from animals to faces the EV
was 0.95% (Figure 38).
First, we tested whether EV of the signal after task learning
was significantly different from zero. This was the case
during postlearning rest (p<0.001) but also during all other
rest sessions (p<0.001 for each).

4. Research study 2: resting state
119
Second, we found that EV post learning was not different
from before learning, neither in the memory condition
(p(FB)=0.7692; p(BA)=0.8973; p(AF)=0.1848), nor in the
control condition (p(FB)=0.8419; p(BA)=0.3418;
p(AF)=0.8053).
Third, we examined if there was a difference between EV in
the memory and control condition. This was neither the
case in the post-task rest sessions (p(FB)=0.6138;
p(BA)=0.4047; p(AF)=0.0357), nor in the pre-task rest
sessions (p(FB)=0.8787; p(BA)=0.9159; p(AF)=0.5812).
Explained variance of flipped transition epochs
Our third strategy consisted in computing the mirrored
timecourse of the transition epochs. EV during post task rest
was 0.96% for the flipped transition from faces to buildings,
0.93% for the flipped transition from buildings to animals,
and 0.96% for the flipped transition from animals to faces.
We tested whether these flipped epochs were different from
the normal epochs, but this was neither the case for the
memory condition (p(FB)=0.9626; p(BA)=0.9532;
p(AF)=0.9906) nor for the control condition (p(FB)=0.9532;
p(BA)=1.000; p(AF)=1.000).
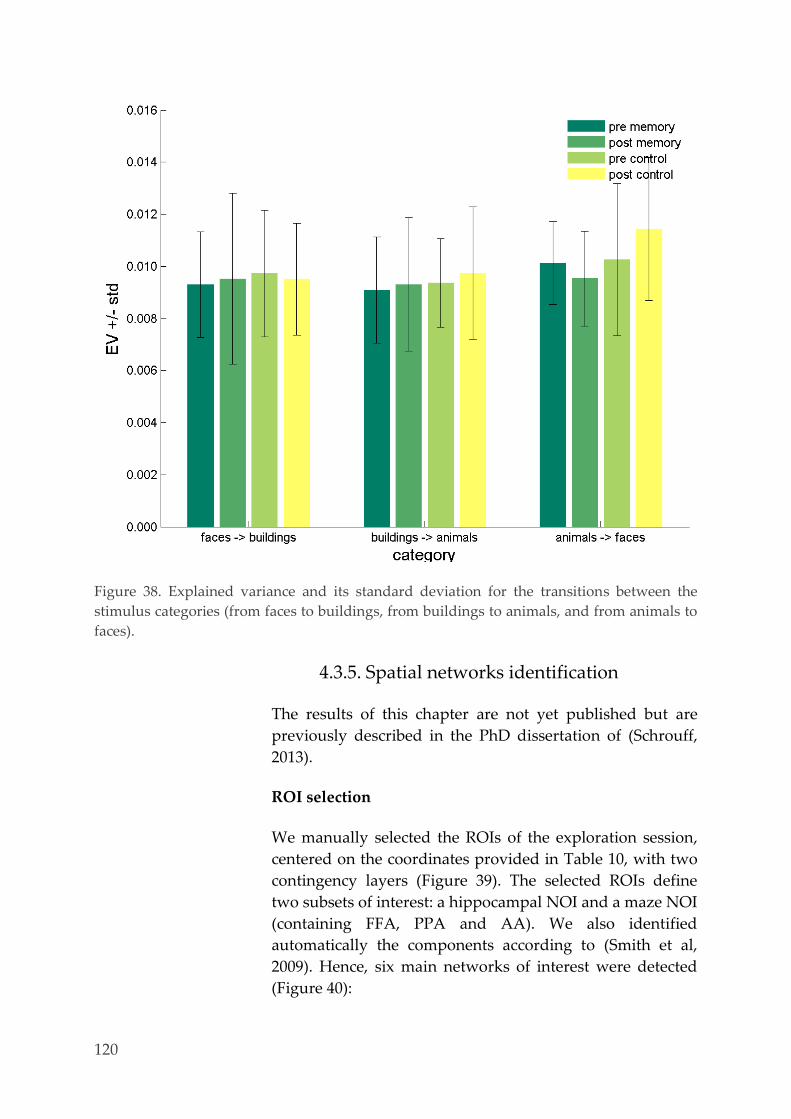
120
Figure 38. Explained variance and its standard deviation for the transitions between the
stimulus categories (from faces to buildings, from buildings to animals, and from animals to
faces).
Spatial networks identification 4.3.5.
The results of this chapter are not yet published but are
previously described in the PhD dissertation of (Schrouff,
2013).
ROI selection
We manually selected the ROIs of the exploration session,
centered on the coordinates provided in Table 10, with two
contingency layers (Figure 39). The selected ROIs define
two subsets of interest: a hippocampal NOI and a maze NOI
(containing FFA, PPA and AA). We also identified
automatically the components according to (Smith et al,
2009). Hence, six main networks of interest were detected
(Figure 40):

4. Research study 2: resting state
121
- Visual network (VIS): a first medial and lateral
component was detected and added to the occipital
component.
- Ventral attentional network (vATT): this network was
found in its lateralized components (left and right),
which were then merged.
- Dorsal attentional network (dATT)
- Auditory network (AUD)
- Sensori-motor network (MOT)
- Default mode network (DM)
The ROIs were then automatically selected from the
thresholded t-maps. In total, 48 ROIs were considered for
further analysis (57 with the manually selected ROIs).
Table 10. Coordinates of the center of the manually selected regions in the MNI space as well
as their attributed names. The first three regions form the hippocampal NOI, while the six
others correspond to regions activated during the display of the images (“ma e” NOI).
“sym” refers to the symmetry in the definition of the ROIs.
Region
Name x y z
Left Hippocampal 1 L-Hipp1 -316.800 -68.203 -198.439
Left Hippocampal 2 L-Hipp2 -178.200 -143.187 -144.224
Right Hippocampal R-Hipp 297.000 -128.849 -245.867
Left FFA L-FFA -376.200 -522.694 -158.875
Right FFA (sym) R-FFA 396.000 -493.630 -160.329
Left PPA L-PPA -217.800 -432.144 -96.122
Right PPA (sym) R-PPA 198.000 -432.144 -96.122
Left Animals L-AA -435.600 -491.111 -109.992
Right Animals R-AA 495.000 -657.856 51.343
Figure 39. Manually selected regions of interest from the statistical peaks of a GLM of the
exploration session. Three regions were selected in the hippocampus and six in the
neocortex.
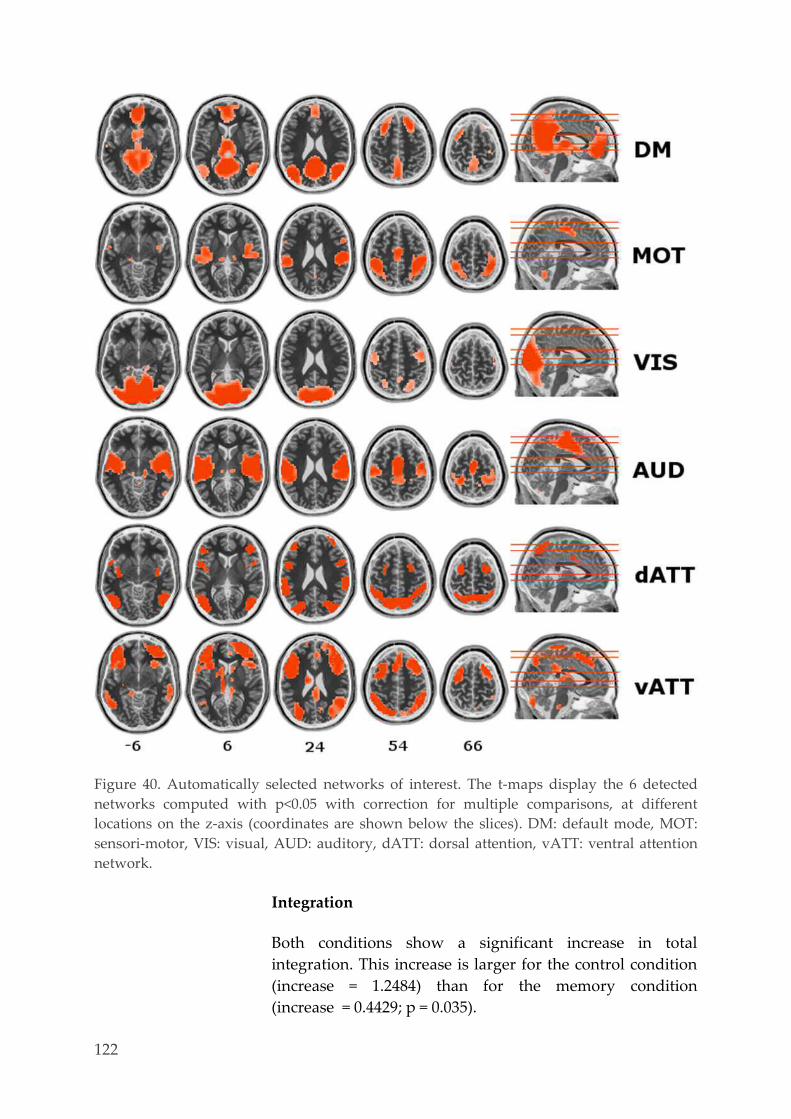
122
Figure 40. Automatically selected networks of interest. The t-maps display the 6 detected
networks computed with p<0.05 with correction for multiple comparisons, at different
locations on the z-axis (coordinates are shown below the slices). DM: default mode, MOT:
sensori-motor, VIS: visual, AUD: auditory, dATT: dorsal attention, vATT: ventral attention
network.
Integration
Both conditions show a significant increase in total
integration. This increase is larger for the control condition
(increase = 1.2484) than for the memory condition
(increase = 0.4429; p = 0.035).
4. Research study 2: resting state
123
With respect to within-network integration, significant
increases were observed for the VIS and AUD NOIs for the
memory condition. For the control condition, significant
increases were found for the DM, dATT and MOT NOIs
(marked by black asterisks in Figure 41). Please note that
the only significant differences between conditions were
found for the DM and MOT NOIs (marked by yellow
asterisks in Figure 41). An interesting and unexpected result
is that no increase in within-NOI integration could be found
for the Hipp and Maze NOIs in the memory condition as
compared to the control condition.
All pairwise between-NOI integrations are reported in
Figure 42 (significant differences between pre-task to post-
task rest sessions being marked by an asterisk). The results
show that the vATT and dATT NOIs were the most affected
by the tasks. Although this could have been expected
(Smith et al, 2009), increases in integration between the
Hipp and Maze NOIs were also expected, or between the
Hipp and VIS NOIs in the memory condition, which are not
present. Furthermore, some results are surprising, such as
the significant increases in integration between the DM and
vATT NOIs, and between the DM and Hipp NOIs for the
memory condition. According to (Smith et al, 2009), the DM
network should not be affected by any of the considered
tasks.
We were not only interested in the differences between the
pre-task and post-task rest sessions. A second important
point is the difference between conditions, i.e. are the
increases in between-NOIs integration larger for the
memory or the control condition? The p-values of these
comparisons are represented in Table 11.
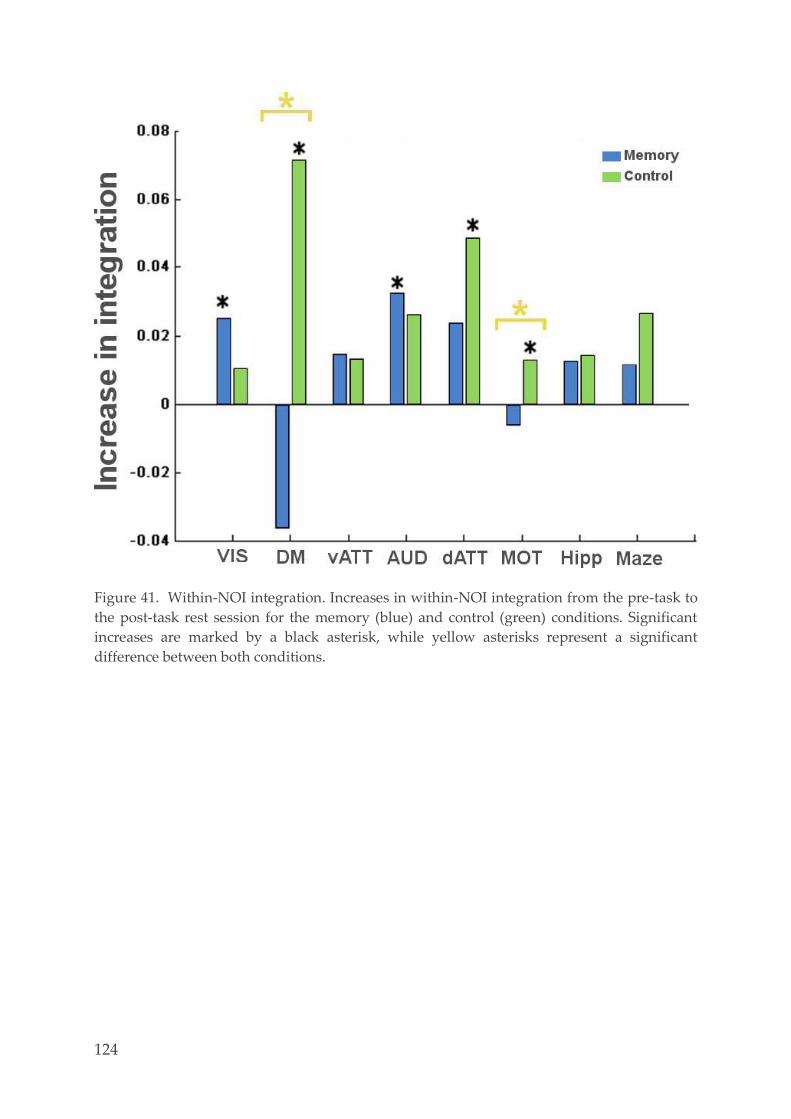
124
Figure 41. Within-NOI integration. Increases in within-NOI integration from the pre-task to
the post-task rest session for the memory (blue) and control (green) conditions. Significant
increases are marked by a black asterisk, while yellow asterisks represent a significant
difference between both conditions.
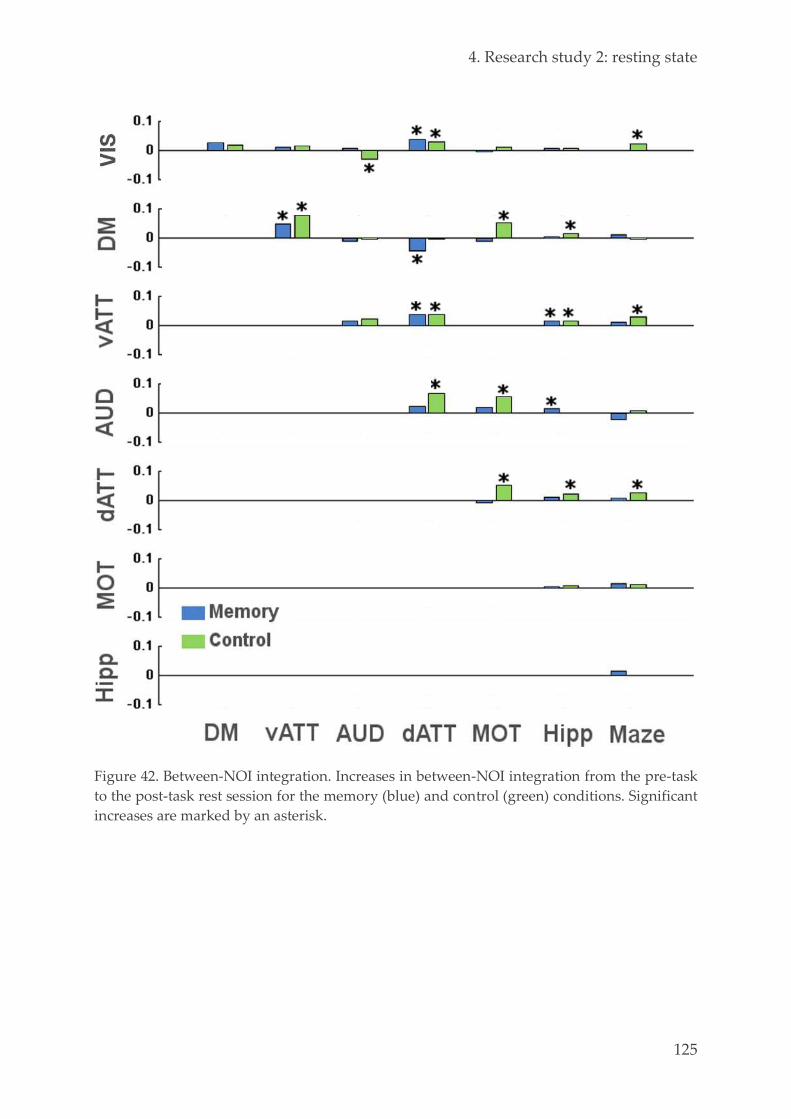
4. Research study 2: resting state
125
Figure 42. Between-NOI integration. Increases in between-NOI integration from the pre-task
to the post-task rest session for the memory (blue) and control (green) conditions. Significant
increases are marked by an asterisk.
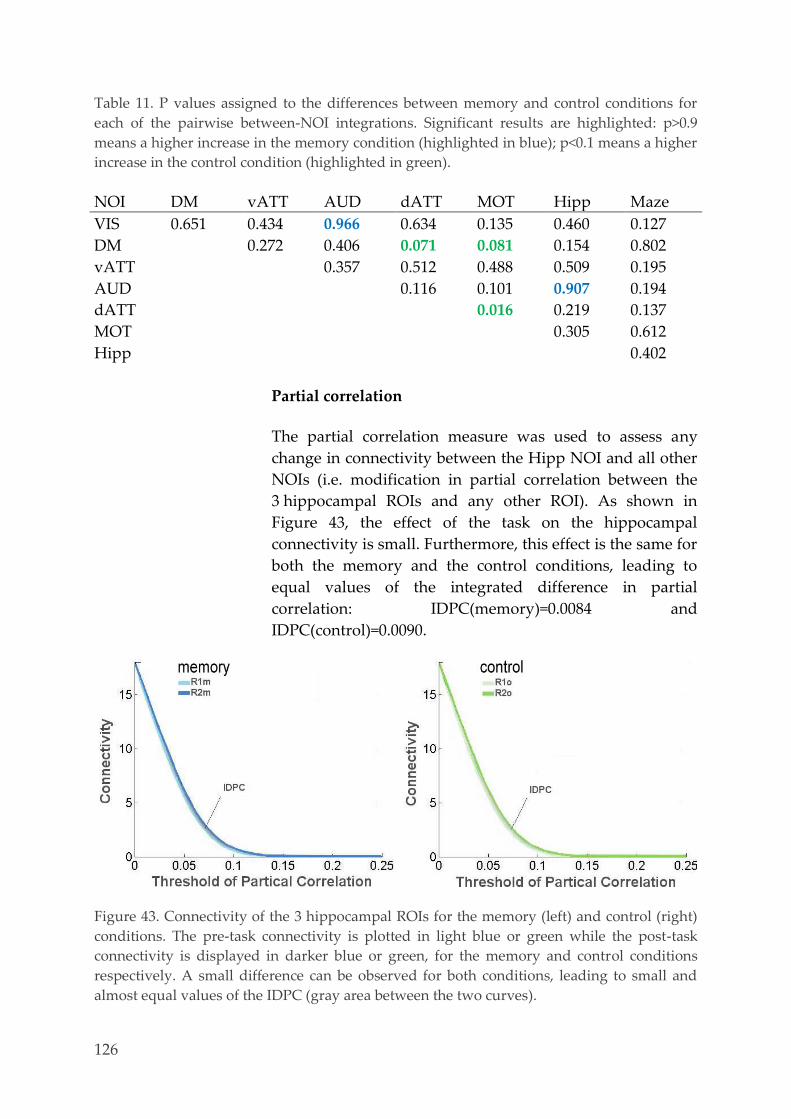
126
Table 11. P values assigned to the differences between memory and control conditions for
each of the pairwise between-NOI integrations. Significant results are highlighted: p>0.9
means a higher increase in the memory condition (highlighted in blue); p<0.1 means a higher
increase in the control condition (highlighted in green).
NOI DM vATT AUD dATT MOT Hipp Maze
VIS 0.651 0.434 0.966 0.634 0.135 0.460 0.127
DM
0.272 0.406 0.071 0.081 0.154 0.802
vATT
0.357 0.512 0.488 0.509 0.195
AUD
0.116 0.101 0.907 0.194
dATT
0.016 0.219 0.137
MOT
0.305 0.612
Hipp
0.402
Partial correlation
The partial correlation measure was used to assess any
change in connectivity between the Hipp NOI and all other
NOIs (i.e. modification in partial correlation between the
3 hippocampal ROIs and any other ROI). As shown in
Figure 43, the effect of the task on the hippocampal
connectivity is small. Furthermore, this effect is the same for
both the memory and the control conditions, leading to
equal values of the integrated difference in partial
correlation: IDPC(memory)=0.0084 and
IDPC(control)=0.0090.
Figure 43. Connectivity of the 3 hippocampal ROIs for the memory (left) and control (right)
conditions. The pre-task connectivity is plotted in light blue or green while the post-task
connectivity is displayed in darker blue or green, for the memory and control conditions
respectively. A small difference can be observed for both conditions, leading to small and
almost equal values of the IDPC (gray area between the two curves).

4. Research study 2: resting state
127
Multivariate pattern analysis 4.3.6.
Signal extraction
The number of extracted events from the mental imagery
session and their corresponding duration were variable
depending on the volunteers’ ability to retrieve the different
images forming the requested mental path (Table 12). These
findings were consistent with the participants’ performance
d’: the number of events is significantly lower for the
buildings category than for the other two categories
(Friedman test p=0.0054, Post hoc Wilcoxon tests, p<0.05,
Bonferroni corrected for multiple comparisons) whereas no
significant difference was detected between the number of
events in the faces and animals categories (p=0.0347, does
not survive the Bonferroni correction). This result
potentially affects the classification based on fMRI data as it
relies on binary comparisons. It should be noted that no
direct interaction could be detected between the
performances of the participant and the number of events in
each category (correlations p>0.05).
Table 12. Number of extracted events for the mental imagery session. Percentages are in
brackets and show the possible imbalances between categories.
subject F B A total
1 69 (44.23%) 30 (19.23%) 57 (36.54%) 156
2 76 (55.07%) 11 (07.97%) 51 (36.96%) 138
3 47 (30.32%) 58 (37.42%) 50 (32.29%) 155
4 74 (39.36%) 42 (22.34%) 72 (38.30%) 188
5 70 (41.42%) 36 (21.30%) 63 (37.28%) 169
6 67 (38.29%) 44 (25.14%) 64 (36.57%) 175
7 18 (21.69%) 32 (38.55%) 33 (39.76%) 83
8 37 (45.68%) 20 (24.69%) 24 (29.63%) 81
9 69 (41.07%) 31 (18.45%) 68 (40.48%) 168
10 55 (32.54%) 58 (34.32%) 56 (33.14%) 169
11 77 (38.89%) 53 (26.77%) 68 (34.34%) 198
mean 59.29 (39.17%) 38.50 (25.44%) 53.57 (35.39%) 151.36
Feature selection
The mean number of extracted features was 268.79,
standard deviation 179.79. The number for each participant

128
separately is displayed in Table 13. The high standard
deviations in the number of selected voxels indicate a high
variability across blocks for the retrieval session, which is
caused by the design of the session.
The selected voxels were located in occipito-temporal areas
(from primary areas to lingual and fusiform gyri),
parahippocampal gyri and hippocampus as well as medial
parietal regions (Figure 44). This was expected because
activation in these areas represented properly the different
aspects of the task (visual properties, spatial features and
navigation).
Table 13. Number of RFA selected features for
the mental imagery session. The optimal
subset of variables is represented for each
participant by its mean size and standard
deviation across the number of features
obtained after each cross-validation step. The
last row gives the mean and standard
deviation across all participants.
Figure 44. Voxels selected after the univariate and multivariate feature selection steps during
the encoding of the memory task (top) and during the retrieval task (bottom), for one
participant. Z-coordinates of the slices are displayed below the slices.
subject mean SD
1 254 173
2 258 150
3 272 185
4 297 163
5 278 204
6 306 190
7 148 185
8 304 222
9 294 183
10 326 227
11 205 165
mean 268.79 179.79
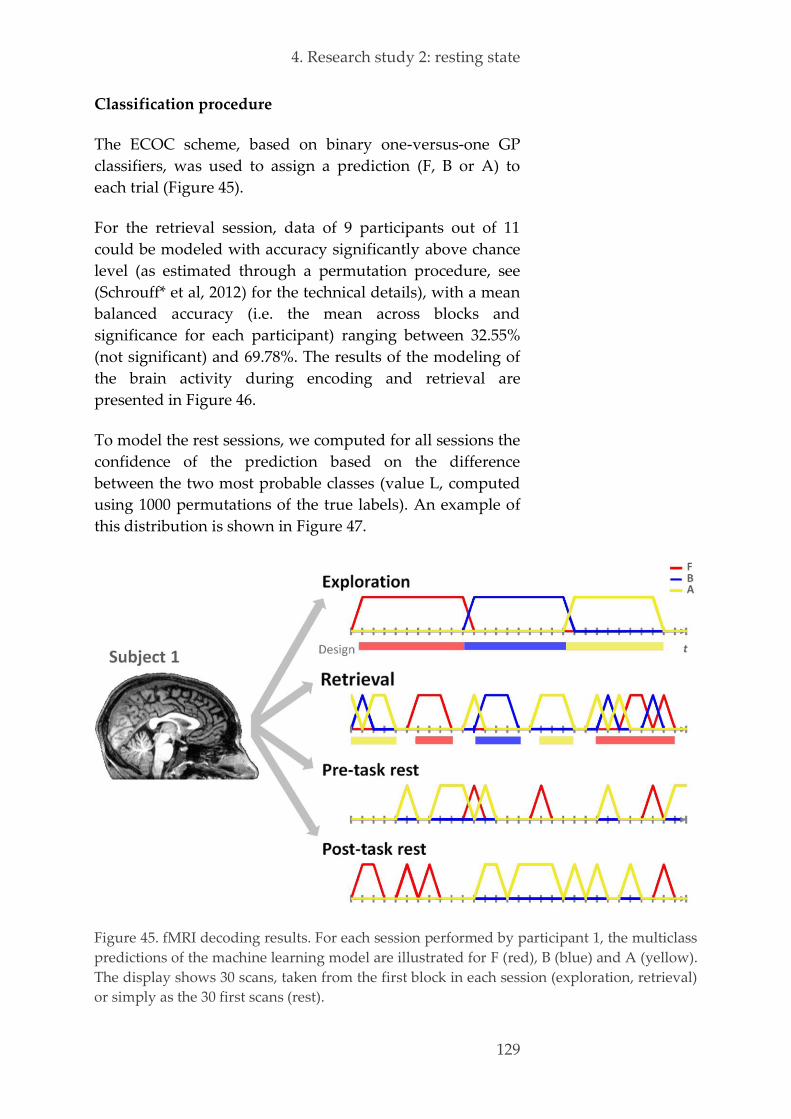
4. Research study 2: resting state
129
Classification procedure
The ECOC scheme, based on binary one-versus-one GP
classifiers, was used to assign a prediction (F, B or A) to
each trial (Figure 45).
For the retrieval session, data of 9 participants out of 11
could be modeled with accuracy significantly above chance
level (as estimated through a permutation procedure, see
(Schrouff* et al, 2012) for the technical details), with a mean
balanced accuracy (i.e. the mean across blocks and
significance for each participant) ranging between 32.55%
(not significant) and 69.78%. The results of the modeling of
the brain activity during encoding and retrieval are
presented in Figure 46.
To model the rest sessions, we computed for all sessions the
confidence of the prediction based on the difference
between the two most probable classes (value L, computed
using 1000 permutations of the true labels). An example of
this distribution is shown in Figure 47.
Figure 45. fMRI decoding results. For each session performed by participant 1, the multiclass
predictions of the machine learning model are illustrated for F (red), B (blue) and A (yellow).
The display shows 30 scans, taken from the first block in each session (exploration, retrieval)
or simply as the 30 first scans (rest).

130
Figure 46. Balanced accuracies for brain activity during encoding and retrieval. Averages
across blocks of the balanced accuracy of within-subject modeling of constrained
(encoding, a) and semi-constrained (retrieval, b) brain activity. Significant results, as assessed
by permutations, are marked by stars *.
Figure 47. Example of the results of machine learning modeling of resting state fMRI data.
Histogram of Lp for rest session 1 (R1m) and subject 1 using 1000 permutations, showing the
non-normal distribution of the data. If L (computed using the true labels) was larger than
0.57 in this example, the corresponding scan was assessed as significantly (p<0.05) linked to
the memory task and accounted for in the computation of Pr.
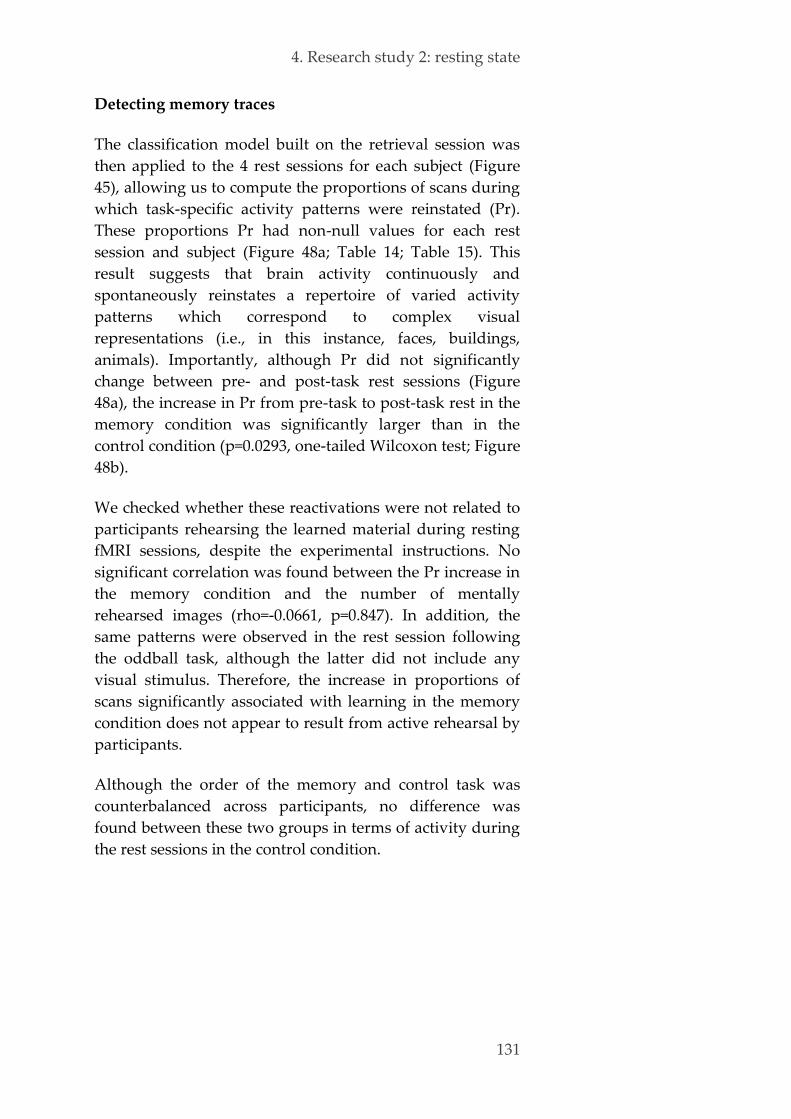
4. Research study 2: resting state
131
Detecting memory traces
The classification model built on the retrieval session was
then applied to the 4 rest sessions for each subject (Figure
45), allowing us to compute the proportions of scans during
which task-specific activity patterns were reinstated (Pr).
These proportions Pr had non-null values for each rest
session and subject (Figure 48a; Table 14; Table 15). This
result suggests that brain activity continuously and
spontaneously reinstates a repertoire of varied activity
patterns which correspond to complex visual
representations (i.e., in this instance, faces, buildings,
animals). Importantly, although Pr did not significantly
change between pre- and post-task rest sessions (Figure
48a), the increase in Pr from pre-task to post-task rest in the
memory condition was significantly larger than in the
control condition (p=0.0293, one-tailed Wilcoxon test; Figure
48b).
We checked whether these reactivations were not related to
participants rehearsing the learned material during resting
fMRI sessions, despite the experimental instructions. No
significant correlation was found between the Pr increase in
the memory condition and the number of mentally
rehearsed images (rho=-0.0661, p=0.847). In addition, the
same patterns were observed in the rest session following
the oddball task, although the latter did not include any
visual stimulus. Therefore, the increase in proportions of
scans significantly associated with learning in the memory
condition does not appear to result from active rehearsal by
participants.
Although the order of the memory and control task was
counterbalanced across participants, no difference was
found between these two groups in terms of activity during
the rest sessions in the control condition.
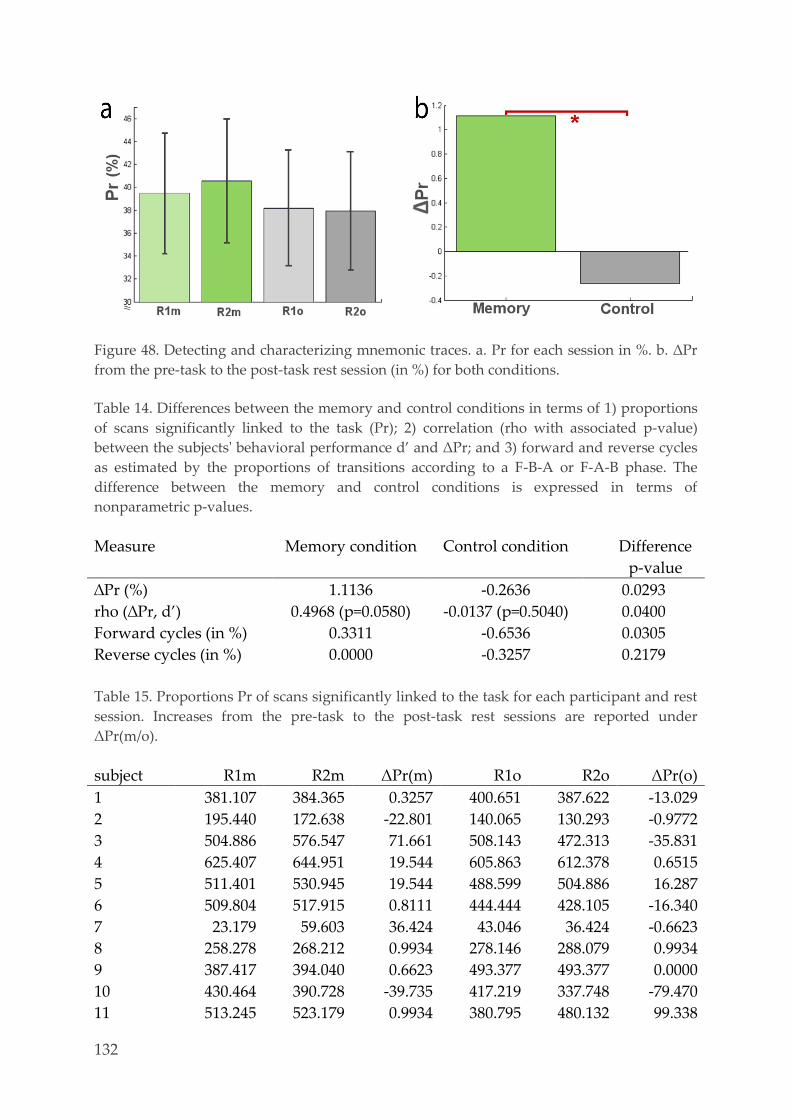
132
Figure 48. Detecting and characterizing mnemonic traces. a. Pr for each session in %. b. ΔPr
from the pre-task to the post-task rest session (in %) for both conditions.
Table 14. Differences between the memory and control conditions in terms of 1) proportions
of scans significantly linked to the task (Pr); 2) correlation (rho with associated p-value)
between the subjects' behavioral performance d’ and ΔPr; and 3) forward and reverse cycles
as estimated by the proportions of transitions according to a F-B-A or F-A-B phase. The
difference between the memory and control conditions is expressed in terms of
nonparametric p-values.
Measure Memory condition Control condition Difference
p-value
∆Pr (%) 1.1136 -0.2636 0.0293
rho (∆Pr, d’) 0.4968 (p=0.0580) -0.0137 (p=0.5040) 0.0400
Forward cycles (in %) 0.3311 -0.6536 0.0305
Reverse cycles (in %) 0.0000 -0.3257 0.2179
Table 15. Proportions Pr of scans significantly linked to the task for each participant and rest
session. Increases from the pre-task to the post-task rest sessions are reported under
ΔPr(m/o).
subject R1m R2m ΔPr(m) R1o R2o ΔPr(o)
1 381.107 384.365 0.3257 400.651 387.622 -13.029
2 195.440 172.638 -22.801 140.065 130.293 -0.9772
3 504.886 576.547 71.661 508.143 472.313 -35.831
4 625.407 644.951 19.544 605.863 612.378 0.6515
5 511.401 530.945 19.544 488.599 504.886 16.287
6 509.804 517.915 0.8111 444.444 428.105 -16.340
7 23.179 59.603 36.424 43.046 36.424 -0.6623
8 258.278 268.212 0.9934 278.146 288.079 0.9934
9 387.417 394.040 0.6623 493.377 493.377 0.0000
10 430.464 390.728 -39.735 417.219 337.748 -79.470
11 513.245 523.179 0.9934 380.795 480.132 99.338

4. Research study 2: resting state
133
Relationship with behavioral measure
We then checked whether memory performance, as
assessed by the discrimination index d’, was related to the
increase in proportions of scans linked to the task. A
positive correlation was observed in the memory condition
and a negative correlation in the control condition, the
difference between the two correlations being significant
(p=0.04, non-parametric permutation test; Figure 49, Table
14). Moreover, the correlation tended to be significant in the
memory condition (p=0.058) but not in the control condition
(p=0.504). These results do not support a strong relationship
between memory reactivation and later task performance,
although reactivations are associated with a weak
enhancement of later memory performance.
Figure 49. Null distribution obtained by permutations of correlation between ΔPr and
behavioral performance (d’) in memory (green) and control (gray) conditions. The actual
correlations are displayed as circles for the memory and control tasks.
Temporal evolution
We also assessed the duration of reactivations. A larger
proportion of episodes were observed for durations of at

134
least 4 scans in the post-task rest session, as compared to
other rest sessions (Wilcoxon signed rank test, Figure 50a
and b, Table 16). In addition, on average, the episodes were
longer during the post-learning session than during any of
the other sessions (Table 16), with significantly more
episodes lasting 2 scans or more (p=0.0493, Wilcoxon signed
rank test) and 3 scans or more (p=0.0293, Wilcoxon signed
rank test; Figure 50c). This result suggests that after
learning, scans significantly reinstating learned patterns are
clustered into episodes lasting between 2 and 3 scans on
average, i.e. 4 to 6 seconds.
Figure 50. a. Average proportions of episodes lasting at least as long as the threshold (1 to 10
scans). b. Differences in proportions of episodes of scans, between pre-task and post-task
(p<0.05 for episodes lasting at least 4 scans). c. Increase in episode duration between pre-task
and post-task rest session is significant for episodes lasting 2 to 4 scans (p<0.05 for episodes
lasting at least 2 or 3 scans). Averages over subjects, with normalized standard deviation.
The memory and control condition are displayed in green and gray, respectively. Significant
differences between conditions p<0.05 are marked with red asterisks.

4. Research study 2: resting state
135
Table 16. Proportions (pr) and average duration (dur) of episodes with a minimal duration
varied from 1 to 10 scans, for each rest session. Some subjects did not show long episodes,
and were counted as duration = 0 in the averages, resulting in underestimation of long
episode durations (from about 6 scans).
Minimal
duration
R1m R2m R1o R2o
pr dur pr dur pr dur pr dur
1 1.0000 1.8367 1.0000 1.9829 1.0000 1.8046 1.0000 1.8296
2 0.3926 2.7888 0.4315 3.1441 0.4080 2.8158 0.4292 2.7849
3 0.1961 3.7584 0.2485 4.0847 0.1806 3.6124 0.2171 3.3593
4 0.1007 4.5361 0.1385 4.9259 0.0973 4.1431 0.0919 4.0019
5 0.0645 5.0664 0.0665 5.3833 0.0500 4.0978 0.0531 4.4978
6 0.0366 5.8227 0.0330 4.0515 0.0255 4.1591 0.0219 3.5606
7 0.0237 5.1061 0.0166 3.4924 0.0154 4.5909 0.0076 2.8788
8 0.0103 4.1364 0.0097 4.0455 0.0129 4.0000 0.0038 2.3636
9 0.0037 3.0000 0.0084 3.3182 0.0065 4.3636 0.0024 1.6364
10 0.0037 3.0000 0.0070 3.3636 0.0026 1.9091 0.0000 0.0000
Phase information
Finally, we estimated whether the phase structure
implemented in the experimental design influenced the
temporal organization of the reactivations during post-
learning resting wakefulness through the estimation of
transitions according to the forward and reverse cycles. Our
results show that the proportions of transitions according to
the forward cycle increase from pre-task to post-task rest
sessions in the memory condition but decrease in the
oddball condition (p<0.05, Wilcoxon ranked sum test;
Figure 51).
Within the memory condition, the increase in proportions of
forward transitions was not large enough to induce a
significant difference between forward and reverse cycles
(Figure 51). Regarding the reverse cycle, the memory and
control conditions were not significantly different.
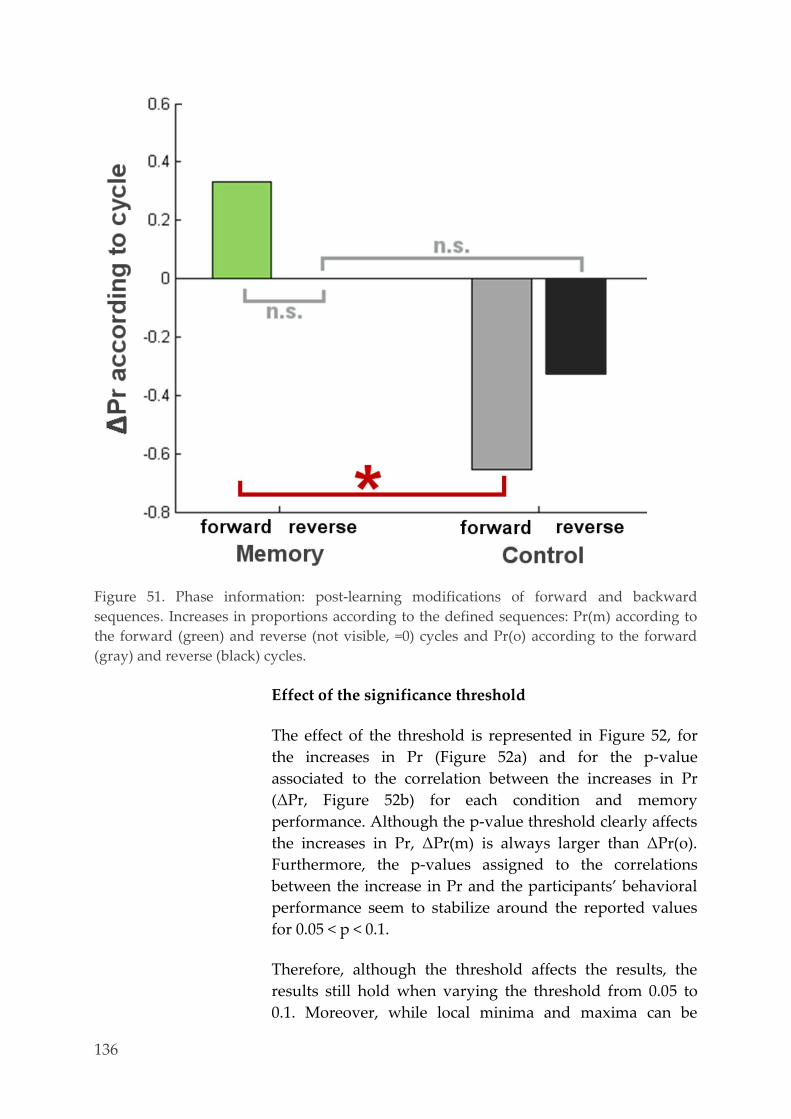
136
Figure 51. Phase information: post-learning modifications of forward and backward
sequences. Increases in proportions according to the defined sequences: Pr(m) according to
the forward (green) and reverse (not visible, =0) cycles and Pr(o) according to the forward
(gray) and reverse (black) cycles.
Effect of the significance threshold
The effect of the threshold is represented in Figure 52, for
the increases in Pr (Figure 52a) and for the p-value
associated to the correlation between the increases in Pr
(ΔPr, Figure 52b) for each condition and memory
performance. Although the p-value threshold clearly affects
the increases in Pr, ΔPr(m) is always larger than ΔPr(o).
Furthermore, the p-values assigned to the correlations
between the increase in Pr and the participants’ behavioral
performance seem to stabilize around the reported values
for 0.05 < p < 0.1.
Therefore, although the threshold affects the results, the
results still hold when varying the threshold from 0.05 to
0.1. Moreover, while local minima and maxima can be
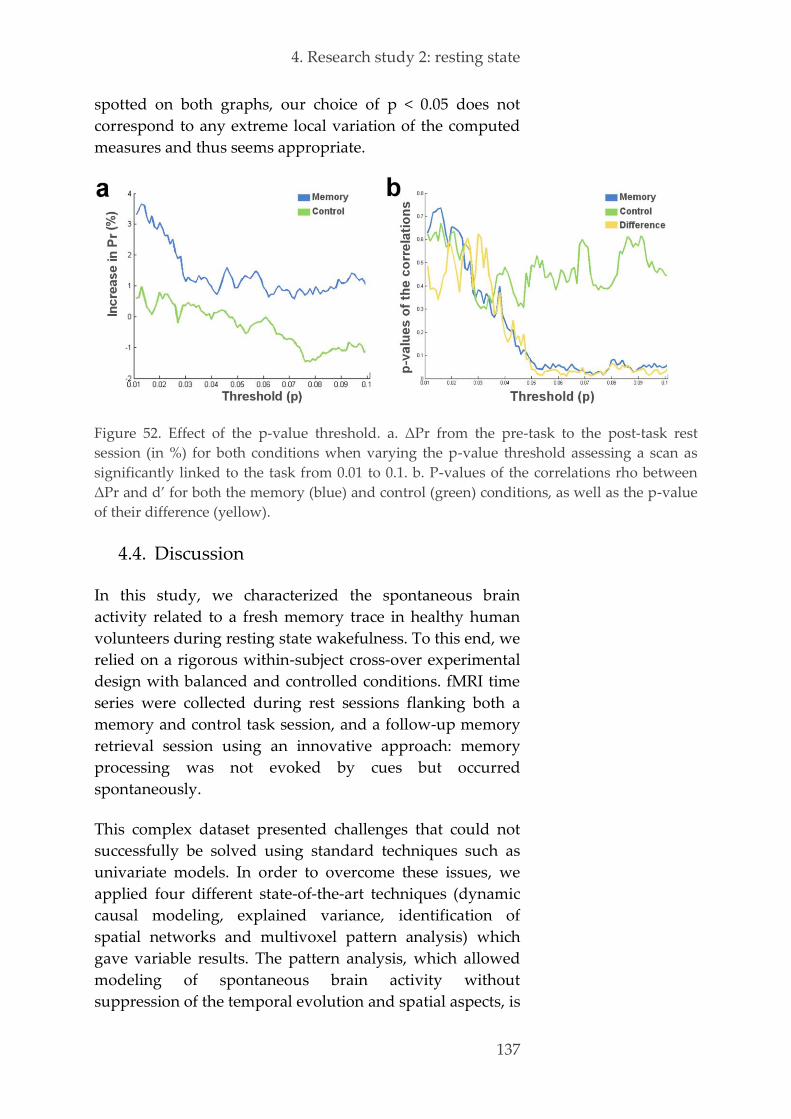
4. Research study 2: resting state
137
spotted on both graphs, our choice of p < 0.05 does not
correspond to any extreme local variation of the computed
measures and thus seems appropriate.
Figure 52. Effect of the p-value threshold. a. ΔPr from the pre-task to the post-task rest
session (in %) for both conditions when varying the p-value threshold assessing a scan as
significantly linked to the task from 0.01 to 0.1. b. P-values of the correlations rho between
ΔPr and d’ for both the memory (blue) and control (green) conditions, as well as the p-value
of their difference (yellow).
4.4. Discussion
In this study, we characterized the spontaneous brain
activity related to a fresh memory trace in healthy human
volunteers during resting state wakefulness. To this end, we
relied on a rigorous within-subject cross-over experimental
design with balanced and controlled conditions. fMRI time
series were collected during rest sessions flanking both a
memory and control task session, and a follow-up memory
retrieval session using an innovative approach: memory
processing was not evoked by cues but occurred
spontaneously.
This complex dataset presented challenges that could not
successfully be solved using standard techniques such as
univariate models. In order to overcome these issues, we
applied four different state-of-the-art techniques (dynamic
causal modeling, explained variance, identification of
spatial networks and multivoxel pattern analysis) which
gave variable results. The pattern analysis, which allowed
modeling of spontaneous brain activity without
suppression of the temporal evolution and spatial aspects, is
138
based on an innovative machine learning approach:
the classifier was trained on brain activity during memory
retrieval rather than encoding, we used a confidence metric
to assess replay events during resting state, and we
investigated the temporal evolution of significant
reactivations related to the temporal course of the learned
task (encoding).
Summary of main findings
We found that 1.11% more scans were task-related after task
learning than before. In addition, the difference in
proportion of resting scans linked to the memory task
between pre- and post-task sessions tended to predict later
memory performance, suggesting that the post-task
spontaneous brain activity patterns were related to memory
processing. By contrast, the proportion of scans related to
the memory session after a control task was 0.26% lower
than before the control task, suggesting that this task had a
repressive effect on activity patterns related to the memory
session. The proportion of scans containing task-related
brain activity was non-null for all subjects during all rest
sessions, even before task learning, implying that
spontaneous activity in the ventral visual stream is an
omnipresent phenomenon.
Our results extend the understanding of human
spontaneous brain activity and its relationship to early
memory processing. They add to the growing body of
evidence showing that human memory processing can
indeed be investigated with fMRI, is not exclusively linked
to sleep but occurs during resting state as well, and is
related to behavioral measures of memory performance.
Spontaneous on-going activity in higher order brain areas
A first important finding was that activity patterns
spontaneously emerge in unimodal associative areas of the
visual ventral stream during resting wakefulness, in the
absence of any visual stimuli, even before any experimental
treatment (i.e. during pre-task rest sessions). These activity
patterns correspond to those elicited by complex visual
4. Research study 2: resting state
139
stimuli such as faces, buildings or animals during the
functional localizer and task encoding sessions.
This finding extends previous results recorded in animals
showing spontaneous reinstatement of visual patterns in
primary visual cortex (Arieli et al, 1996; Tsodyks et al, 1999;
Kenet et al, 2003) and indicates that spontaneous brain
activity patterns also occur in higher order areas of the
ventral visual stream (fusiform face area, parahippocampal
place area, and an animal-specific region). This result is in
agreement with a previous study which demonstrated an
enhanced functional connectivity between the hippocampus
and a portion of the lateral occipital complex during post-
task resting wakefulness (Tambini et al, 2010), although we
could only find hippocampal activation during post-task
rest in one volunteer. On the contrary, we could confirm
large activations in the parahippocampal gyrus and
perirhinal cortex in most participants (Staresina et al, 2013).
We also found stable and firm evidence supporting
previous memory consolidation studies in humans (Deuker
et al, 2013; Staresina et al, 2013; Tambini and Davachi, 2013).
Memory offline processing can be detected during
wakeful resting state using fMRI
The second contribution of the current experiment consisted
of characterizing the genuine neural correlates of a fresh
memory without altering it by retrieval processes but solely
by decoding spontaneous brain activity in the ventral visual
stream during post-task resting state wakefulness. Our
results confirm that offline processing of explicit memories
can indeed be investigated during resting state wakefulness
in healthy human volunteers with fMRI, a macroscopic,
non-invasive neuroimaging technique, by establishing a
rigorous state-of-the-art methodology based on multivoxel
pattern analysis.
Moreover, the density of visual activity patterns during
post-task rest session, but not during the rest session after
the auditory task, tended to predict later memory
performance. This result suggests to the very least that the
repetition in post-learning spontaneous activity related to
recent memories participates in their maintenance.

140
Methodological strengths
Third, the current design is based on a randomized within-
subject crossover design which accounts for two main
confounding factors, order effect and task-selectivity. These
factors are seldom taken into account in the literature
(Hassabis et al, 2009; Chadwick et al, 2010; Kuhl et al, 2012a;
Kuhl et al, 2013) while some studies are not immune to
confounds such as concurrent practice or rehearsal (Kuhl et
al, 2013; Jafarpour et al, 2014).
This methodological aspect is of critical importance when
trying to decipher spontaneous brain activity. Indeed, it is
known that resting state brain activity can spontaneously
express activation patterns similar to those observed during
processing of external stimuli (Tambini et al, 2010; Deuker
et al, 2013; Tambini and Davachi, 2013). Accordingly, we
observed a significant spontaneous activity in both the
memory and control tasks. However, the changes in the rate
at which activation patterns specific to the memory task are
re-expressed after the memory task strongly suggests that
they reflect further processing of the encoded information.
Our analysis consisted of training of the classifier on the
retrieval session (instead of the encoding session) because
this was the condition closest to the potential spontaneous
replay during resting state: 1) cognitive processes during
memory retrieval are less constrained than during the
completely controlled encoding session; 2) duration of the
retrieval session was subject-dependent which increases
variance of the fMRI signal; and 3) during retrieval, the
memories are activated in the absence of any visual input.
Moreover, we used a large number of controls at both the
design (the order of the memory and control condition
being randomized across participants) and methodology (a
confidence metric to assess replay events during resting
state, as no ground truth exists in this condition).
One of the methodological strengths is that we extensively
explored the optimal classification method. We did this
because excellent classifier accuracy was an important
prerequisite in our study. Our preparatory study showed

4. Research study 2: resting state
141
that for complex, unbalanced time series containing self-
generated mental states, best accuracies are obtained by a
feature selection combining a specific GLM and a recursive
feature addition, in terms of balanced accuracy, and
classification by binary one-versus-one Gaussian processes
(Schrouff* et al, 2012). We found that GP seems more
appropriate for markedly unbalanced data sets than SVM
and is thus preferable for a realistic experimental setup, as
in our study. This preparatory step moves beyond previous
studies which used a one-way ANOVA for feature selection
and a standard linear support vector machine for
classification (Deuker et al, 2013). Moreover, we estimated
the chance level through a permutation procedure, meaning
that the chance level varied across participants.
Due to this rigorous experimental design, the interpretation
of our results is also immune from non-specific effects. For
instance, the increased duration of the repeated activity
after the memory task cannot be simply accounted for by
the autocorrelation of the fMRI signal. Indeed, if this were
the case, the same effect should be observed with the
control oddball task and it is not.
In addition to the rigorous experimental design, our results
were derived from state-of-the-art modeling strategies and
were strictly controlled for false positives and multiple
comparisons. These modeling procedures first involved the
automatic selection of a spatial pattern, i.e. the 1000 most
informative voxels, through a two-step feature selection
technique (Schrouff* et al, 2012). This is an asset compared
to an observer-dependent selection of regions of interest
(Tambini et al, 2010; Staresina et al, 2013) because 1) it
allows for variability across subjects; 2) it is not biased by
observer interventions; and 3) previous work indicated that
information in other areas was nonetheless associated with
highly reliable classifier-based evidence for category
representation (Haynes and Rees, 2006). Such bias might
emphasize the role of the entorhinal cortex and the
retrosplenial cortex in offline memory processing (Staresina
et al, 2013) while visual sensory areas (e.g. FFA, PPA,
hippocampal place cells) might be neglected despite their
implication in memory offline processing in animal (Ji and
142
Wilson, 2007) and in human experiments (Tambini et al,
2010).
One of the major concerns with pattern classification is that
classifiers might be overfitted to the dataset. We reduced
this risk by limiting the feature space to the 1000 most active
voxels, by using the optimal classifier for our dataset
(Schrouff* et al, 2012), and by the good classification
performance in all sessions. Namely, overfitting would have
substantially reduced classification accuracy.
Furthermore, care was taken to perform feature selection
without using the category-specific information outside a
nested cross-validation. This is a common flaw in various
machine-learning based analyses, and can take multiple
forms such as subtracting category-specific averages of the
signal (Jafarpour et al, 2014) or selecting features based on
T- or F-tests performed on the whole data set (Deuker et al,
2013). In our work, we therefore present unbiased data-
driven feature selection.
Another challenging aspect of the present work is the
classification of resting periods, in which a ground truth is
not available. Previous works have performed similar
analyses (Deuker et al, 2013; Horikawa et al, 2013; Staresina
et al, 2013). However, they usually assumed that the
predictions obtained for each time point were true,
although it is highly unlikely that brain activity is
permanently linked to the limited set of classes of the
encoding/recall task. In our work, we present a novel
approach, based on the confidence of the classifier, to assess
whether one time point is significantly linked to the memory
task or not. Furthermore, significance was assessed in a
conservative way, first by considering 1000 permutations of
the labels to obtain the null distribution of the confidence
measure, and second by correcting this distribution for
multiple comparisons (i.e. multiple time points). Therefore,
it is important to note that, although the results presented in
this work might seem less strong than in other related
studies, they were obtained using a stricter methodology
and conservative significance assessment.

4. Research study 2: resting state
143
Temporal organization of spontaneous brain activity is
different during reactivations
Our fourth main finding is that learning a spatiotemporal
array of complex pictures significantly alters the temporal
organization of spontaneous brain activity. During a resting
session following encoding, task-related activity patterns
are clustered in episodes of longer duration (4 to 6 seconds)
and tend to follow the phase structure imposed by the
memory task. This result echoes the preservation of
temporal patterning of neural ensembles within and
between cortical regions observed during post training
wakefulness in monkeys (Hoffman and McNaughton, 2002).
This suggests either a reactivation of on average two images
of our task, or a temporal compression of more reactivated
images. Indeed, previous studies found that the time frame
of the repeated patterns is scaled in sleep (Louie and
Wilson, 2001; Lee and Wilson, 2002; Euston et al, 2007; Ji
and Wilson, 2007). However, in our study it was not
possible to derive the true number of rehearsed images and
therefore we cannot draw a conclusion about a possible
scaling factor.
Task-related activity patterns during post-learning resting
state tend to follow the same phase structure imposed by
the memory task. Unexpectedly, however, multivoxel
pattern analysis revealed that the increased phase structure
was a nonsignificant trend in the memory condition and
was mainly driven by a rather puzzling decreased phase
structure in the control condition. Although only a trend,
this result echoes the preservation of temporal patterning of
neural ensembles within and between cortical regions
observed during post training wakefulness in monkeys
(Hoffman and McNaughton, 2002).
The functional importance of the maintained temporal
organization of regional brain activity can be variably
appreciated. To some, it may seem trivial that neural
populations recruited following a given order during
encoding would continue to do so afterwards. By contrast,
others may consider that the very maintenance of this
temporal information is central to the memory that has just
144
been generated. The repressive effect of the control task
remains currently unclear.
Although we did not test other durations than the
10 minute rest sessions immediately following task
learning, our results confirm that spontaneous reactivations
in humans occur within a short timeframe after task
learning. A decrease across time of the proportion of scans
linked to the task in the post-task rest session for the
memory condition could not be found. This is in agreement
with others who found no effect of time on seed correlations
in a 10 minute rest period either (Tambini et al, 2010),
although animal studies using rest longer periods found a
decrease of the strength of correlations (Wilson and
McNaughton, 1994; Kudrimoti et al, 1999). Our result
indicates that enhanced correlations in the post-task rest
were generally consistent and present throughout the entire
rest scan. Another possibility is that a period of only 10
minutes is too small to detect a significant effect of time.
As (Tambini and Davachi, 2013) already suggested, it will
be critical for future studies to determine whether these
findings relate to extended measures of long-term memory,
and examine how long these neural measures of persistence
are detectable, incorporating longer rest periods, as in
(Harmelech et al, 2013).
Anatomical connections in the ventral visual stream need
to be untangled
At the microscopic network level, the temporal order
following which two connected neurons are activated is an
important aspect of synaptic plasticity (Bi and Poo, 1999).
We report here that the temporal order of brain activity on a
larger scale, measured by the amount of transitions between
categories, tends to be maintained after task learning, but
tends to be reversed after a control task. These results
suggest that the increase in proportion of scans reinstating
learned activity patterns is organized according to the
forward cycle, i.e. transitions imposed by the structure of
learned material, a situation reminiscent of time-dependent
synaptic plasticity.
4. Research study 2: resting state
145
The current results are not consistent with the reverse
sequential replay reported in the rat hippocampus during
awake periods following spatial experience (Foster and
Wilson, 2006). However, beyond the difference in the level
of description (activity of neurons versus activity patterns
of brain areas), the present experimental conditions
considerably differ from those reported in rodents. To the
least, the current results suggest that reverse order replay
may be considered neither selectively related to resting
wakefulness, nor a general mechanism of learning and
memory in mammals.
Another concern was the model selection of the dynamic
causal modeling analysis. Model selection of the forward
and backward models was based on previous experiments
(Louie and Wilson, 2001; Foster and Wilson, 2006).
However, we could not exclude the fully connected model
because anatomical connections are not yet described for
this brain region. Bayesian model selection consistently
revealed greater evidence in favor of the fully connected
model, more than the forward or backward families, in all
rest sessions, and no correlations with behavioral
performance could be found at all. However, the lack of
evidence in favor of the forward or backward connections
does not reflect the complete absence of information flow in
this direction, but rather implies a bidirectional modulatory
influence. Our results do not exclude the forward or
backward models per se but suggest that these connections
play a minor role in the observed hemodynamic response
during viewing of faces, buildings and animals.
It can be argued that baseline spontaneous brain activity
always moves in the forward order, or that the ventral
visual pathway from the primary visual cortex to higher
order areas, the limbic system and the prefrontal cortex,
travels in this direction (Fairhall and Ishai, 2007). Previous
studies found a stronger anatomical input from the
parahippocampal to the perirhinal cortex than vice versa
(Suzuki and Amaral, 1994). Indeed, category specific effects
in the occipitotemporal cortex can be mediated by bottom-
up mechanisms, by inputs from early visual cortex
(Mechelli et al, 2003).

146
Connectivity at the regional and network level needs to be
unraveled
To address this question, we employed independent
component analysis in order to investigate the connectivity
within and between regions. Our results confirm previous
research that the attention networks (ventral and dorsal)
were the most affected by the tasks (Smith et al, 2009).
However, increases in integration between the hippocampal
and maze networks were also expected, or between the
hippocampal and visual networks in the memory condition,
and this was not the case. This is not in agreement with
(Tambini et al, 2010), who found an enhanced functional
connectivity between the hippocampus and a portion of the
lateral occipital complex during rest following a task with
high subsequent memory compared to pre-task baseline
resting connectivity. Furthermore, they found that this
enhance in connectivity was not present during rest
following a control task with poor subsequent memory.
According to (Smith et al, 2009), the connectivity of the
default mode network should not be affected by a task.
Therefore, some of our results were unexpected, such as the
significant increases in integration between the default
mode and ventral attention networks, and between the
default mode and hippocampal networks for the memory
condition.
Spontaneous activity can be repressed by an unrelated
task
Our fifth interesting finding was that spontaneous brain
activity during resting state wakefulness can be also be
negatively modulated by prior cognitive tasks.
Unexpectedly, the visual memory task using relevant
stimuli did not significantly modify the abundance of
spontaneous visual activity as compared to before learning,
whereas the unrelated control task (an auditory attention
task) considerably reduced this spontaneous activity,
during at least 10 minutes. These results provide an
objective evidence that unrelated cognitive tasks may
interfere with early memory processing, a situation
reminiscent of the interactions observed between
4. Research study 2: resting state
147
procedural and explicit memory consolidation (Brown and
Robertson, 2007). Although previous research showed that
concurrent competing retrieval of other memories impairs
retrieval of newer memories (Kuhl et al, 2012a), the
functional significance of these transmodal modulations is
currently unclear.
An alternative explanation could be that the temporal
resolution of fMRI would be not sufficient to detect
transient spontaneous reactivations. Further studies using
techniques such as electroencephalography or intracranial
electrocorticography should further examine this
possibility.
Inter-subject variability
A high inter-subject variability was an important limiting
factor in our studies. In the interest of studying cerebral
correlates of memory consolidation with objective
neuroimaging methods, we concluded in the previous
chapter that hypnagogic hallucinations were not an optimal
study design because only a minority of all hypnagogic
hallucinations was task-related and they were not
consistently reported by every volunteer.
However, memory processing during resting state
wakefulness instead of sleep onset turned out to be even
less reliable across subjects. Indeed, the classifying model
for brain activity was not consistent across volunteers. A
further issue was the large variability in proportions of task-
related scans during the pre-task rest session in the memory
condition. These differences in cortical activation likely
reflect subject-specific variations in signal-to-noise ratio
rather than variations in functional architecture. First,
volunteers might have used different learning strategies,
which affected the sensitivity of the decoding technique and
decreased our ability to model the corresponding rest
sessions. Second, some volunteers have mentally rehearsed
the images during the post-task rest session in the memory
condition, as we found out during the debriefing
afterwards. It is known that such memory retrieval recruits
frontal regions (Nyberg et al, 1996) as well as medial
temporal lobe structures (Kuhl et al, 2013) and distributed

148
patterns representing various features of the event (Johnson
et al, 2009). This would elicit a higher level of noise in the
dataset compared to our effect of interest, making it more
difficult to classify correctly.
Alertness
Differences in drowsiness and alertness can have an
important influence on mental processes (Tagliazucchi and
Laufs, 2014), as we confirmed in our study of hypnagogic
imagery. A recent study revealed a reliable loss of
wakefulness in a third of all volunteers in resting state
experiments within 3 minutes (Tagliazucchi and Laufs,
2014). However, this factor is unlikely to contribute to our
resting state findings because precautions were taken that
our volunteers maintained full wakefulness during the
complete experiment. A break was included between both
conditions, volunteers were instructed that it was critical to
maintain wakefulness at all times, task order was
counterbalanced across participants, and memory
performance between both groups of participants did not
differ. Besides, a study which combined fMRI with EEG to
objectively quantify the amount of occipital alpha activity,
found no difference in drowsiness-related EEG activity
between memory and control tasks (Deuker et al, 2013).
However, despite our precautions, we cannot 100% exclude
the possibility that some volunteers drifted off to sleep stage
one, because we did not objectively monitor the vigilance
state with EEG.
Baseline level
When we computed the explained variance during resting
state immediately following the memory task,
approximately 0.50% of the BOLD signal in a category-
specific region could be explained by the task, and on
average 0.95% could be explained by the transition from
one category to another. Unexpectedly, these percentages
were not significantly different from the other rest sessions.
We hence could not confirm previous animal studies which
found an explained variance of 5% during pre-task sleep
that augmented to 10% à 15% during post-task sleep
4. Research study 2: resting state
149
(Kudrimoti et al, 1999; Hoffman and McNaughton, 2002;
Pennartz et al, 2004).
It can be argued that the baseline level of “random” brain
activity is not 5% but much lower. A logical question would
be whether the explained variance after and before the
memory task were different (which was not the case for our
study). However, a more correct question would be
whether the EV after the memory task was different from
zero, as this measure already takes into account the activity
before the task. We found that this was indeed the case.
Unexpectedly, no difference could be found between the
memory and control condition.
Hippocampal replay?
Hippocampal replay is hypothesized to contribute to
memory consolidation (Buzsaki, 1989; Sutherland and
McNaughton, 2000; Rasch and Born, 2007). In line with this
prediction, previous work in rodents has shown that
multivariate patterns of hippocampal activity are
reactivated in sleep (Wilson and McNaughton, 1994;
Nadasdy et al, 1999; Lee and Wilson, 2002) and awake
periods (Davidson et al, 2009; Karlsson and Frank, 2009).
The extent of hippocampal reactivation in rodents has been
related to spatial memory improvements (Dupret et al,
2010). Prior work in humans using fMRI has shown that
resting connectivity between the hippocampus and
encoding-related cortical areas can be modulated by an
associative encoding experience (Tambini et al, 2010; van
Kesteren et al, 2010; Tambini and Davachi, 2013) and that
these experience-related changes are correlated with later
memory (Groen et al, 2011). In the present study, we did not
focus on hippocampal activity but this may be an
interesting path to explore.
It can be questioned whether we are examining memory
consolidation per se, immediately following the task during
resting state. First, importantly, our data suggest that
conscious retrieval of the learned material during post-task
rest does not account for the activity patterns detected by
our decoding scheme, suggesting that these activity
patterns are truly spontaneous. Second, we discarded

150
volunteers that consciously rehearsed the task the whole
time, despite the experimental instructions. The included
volunteers rehearsed only a few images, sometimes
voluntarily, but sometimes the images appeared
spontaneously in their mind. Even with these precautions,
we cannot completely exclude the possibility that we
detected rather memory retrieval than offline consolidation.
4.5. Conclusion and perspectives
Present data, analyzed with multivoxel pattern analysis,
show that initial maintenance of human episodic memories
involves the spontaneous reinstatement of regional activity
patterns which respects the temporal structure of the
learned material. However, the high inter-subject variability
and the absence of results from our other analyses (dynamic
causal modeling, explained variance and identification of
spatial networks) suggest that this effect is small and that
fMRI may not be the most suitable technique to detect and
characterize directly a fresh memory trace. The detailed
temporal dynamics of the coupling between the three
investigated category-specific regions could not be
examined with fMRI. Moreover, the scaling factor of
mnemonic traces was not possible to investigate due to the
limited temporal resolution of the hemodynamic response.
High density electroencephalography and
electrocorticography, which have an excellent temporal
resolution, could provide more insight in this problem and
might be more appropriate for future investigations.
However, the classification of such datasets would present a
new challenge due to the low signal-to-noise ratio.

151

152
153
5. CONCLUSION & PERSPECTIVES
Memory processing can be described as brain activity which
adapts to the environment in order to update information.
Such subtle changes in brain activity and connections are
difficult to detect with non-invasive macroscopic
neuroimaging methods in healthy humans. We have tested
two different designs to probe the maintenance of recent
memories in spontaneous brain activity (sleep onset and
resting state) using multimodal techniques (behavioral, EEG
and fMRI). Although our two experiments were quite
different with respect to experimental setup, dependent
variables and implied memory systems, in this last chapter
we list some of the main findings, advances and limitations
of both studies and some future perspectives.
Summary of main findings
Our first sleep onset EEG experiment gave encouraging
results:
- We were able to show the incorporation of task-related
mental content into hypnagogic hallucinations during
daytime sleep, conform to other studies of hypnagogic
imagery during nighttime sleep (Stickgold et al, 2000;
Emberger, 2001; Stickgold et al, 2001a; Wamsley et al,
2010).
- We could confirm with standardized recording
techniques that these hypnagogic hallucinations occur
only during sleep stage one and the beginning of stage
two.
Nevertheless, this behavioral sleep onset experiment did
not appear as a useful paradigm due to the low proportion
of recall and the difficulties inherent to the condition, such
as multiple awakenings per subject and memory loss.
For our second experiment using fMRI, we developed a
rigorous design that allows for testing memory
maintenance during resting state wakefulness, which takes
into account order- and task-specific effects. These fMRI
data were analyzed with multivariate decoding techniques
and also led to some promising findings:
154
- We were able to demonstrate spontaneous activation of
stimulus-related activity patterns, even before training,
and in both the memory and control condition. An
important detail is that this is the case even when the
volunteers were not instructed to mentally retrieve the
task.
- We showed a change in the temporal organization of
reactivation.
Limitations and improvements of our studies
A first limitation of the resting state study was that we
could not confirm the findings of the multivariate pattern
analysis with other techniques, which underlines the
importance of using a robust and very strict multivariate
analysis. A second important restraint was that we were not
able to robustly show a replay during post-learning resting
state. Instead, we showed that an unrelated task repressed
the spontaneous task-related brain activity. Based on the
animal literature and recent human EEG and fMRI
experiments (Tambini et al, 2010; Deuker et al, 2013;
Staresina et al, 2013; Tambini and Davachi, 2013) which
definitely show evidence for offline memory replay, we
surmise this is essentially due to the limited temporal
resolution of the fMRI BOLD signal.
The main advantage of studying spontaneous replay is that
it is unlikely to introduce any cue-related effects, e.g.
through sensory stimulation. However, it also complicates
the analysis because the signal-to-noise ratio is lower than
voluntary brain activity. As we noticed, this might lead to
some unexpected effects, especially in the very short task-
adjacent resting periods.
EEG, ECoG and MEG might be more suitable techniques
than fMRI to further investigate offline processing of
explicit memories, although these techniques present new
methodological challenges such as a poorer spatial
resolution. Simultaneous fMRI and EEG would be another
option if the technical limitations can be tackled, such as the
degradation of the signal and image quality due to the
interference between both recording techniques (Huster et
al, 2012) and the low signal-to-noise ratio of the EEG signal
(Gutierrez and Escalona-Vargas, 2010).
5. Conclusion & perspectives
155
In line with previous work, we found that the strongest
encoding patterns (i.e. faces and animals) preferentially
persisted into postlearning rest periods and could be
classified with higher accuracy. This underlines the
importance of a motivating, engaging task. A possible
option to improve this would be the opportunity to earn a
bonus money reward depending on the recall accuracy at
testing (Kuhl et al, 2012a).
It would be interesting to further examine task-related
hypnagogic hallucinations and their contribution to
memory processing. The emergence of subliminal
presentations in sleep-onset imagery would be a possible
way to examine offline memory processing. Relevant for
such experimental design, a recent study showed that
subliminal presentation of acoustic cues that had previously
been paired with image associations, improved later recall
performance of these associations after sleep (Rudoy et al,
2009).
Perspectives
From a methodological point of view, decoding
spontaneous brain activity is still a challenge and probably
it will stay a challenge for the next decade(s). We attempted
to tackle this by using a very strict task, robust analyzing
methods, and by pushing the analysis to its limits. With the
current scientific knowledge, we could not derive any more
information from our fMRI dataset. Therefore we suggest
that future research studies should continue with
electrophysiological and more direct neurological
measurements. In the far future, brain decoding might
become a useful clinical tool to examine neurological and
psychiatric disorders, for example intrusive thoughts of
depressed patients, hallucinations of schizophrenics, and it
might provide insight in therapies in neurology and
psychology. In research, decoding of dream content might
be an interesting path to explore.
Examining spontaneous brain activity, and especially
decoding ongoing offline brain activity, is still a largely
unexplored area. This makes it a very interesting and
challenging domain to discover.

156

157

158

159
6. ANNEXES 6.1. Examples PSG recordings
Arousal
Figure 53. PSG showing an awakening by an auditory stimulus in sleep stage 1, which
evoked a spike in the EEG, followed by alpha rhythm, saccades and muscle activity.
(Recordings from high to low: blue EEG electrodes Fz, Cz, Pz and Oz, green horizontal and
vertical EOG measurements, and green chin EMG)

160
Wakefulness
Figure 54. PSG during wakefulness. This figure shows nice alpha rhythm at Oz and fast
horizontal eye movements, which are typical of the relaxed wake state with closed eyes.
(Recordings from high to low: blue EEG electrodes Fz, Cz, Pz and Oz, green horizontal and
vertical EOG, and green chin EMG)

6. Annexes
161
Stage 1
Figure 55. PSG during sleep stage 1, with slow horizontal rolling eye movements and
fragmented alpha rhythm, which are the first indicators of sleep stage 1. (Recordings from
high to low: blue EEG electrodes Fz, Cz, Pz and Oz, green horizontal and vertical EOG, and
green chin EMG)
Figure 56. PSG during sleep stage 1, showing slow horizontal rolling eye movements, a
progressive disappearance of alpha rhythm and appearance of theta rhythm and a central
vertex sharp wave, which are the first indicators of sleep stage 1. (Recordings from high to
low: blue EEG electrodes Fz, Cz, Pz and Oz, green horizontal and vertical EOG, and green
chin EMG)
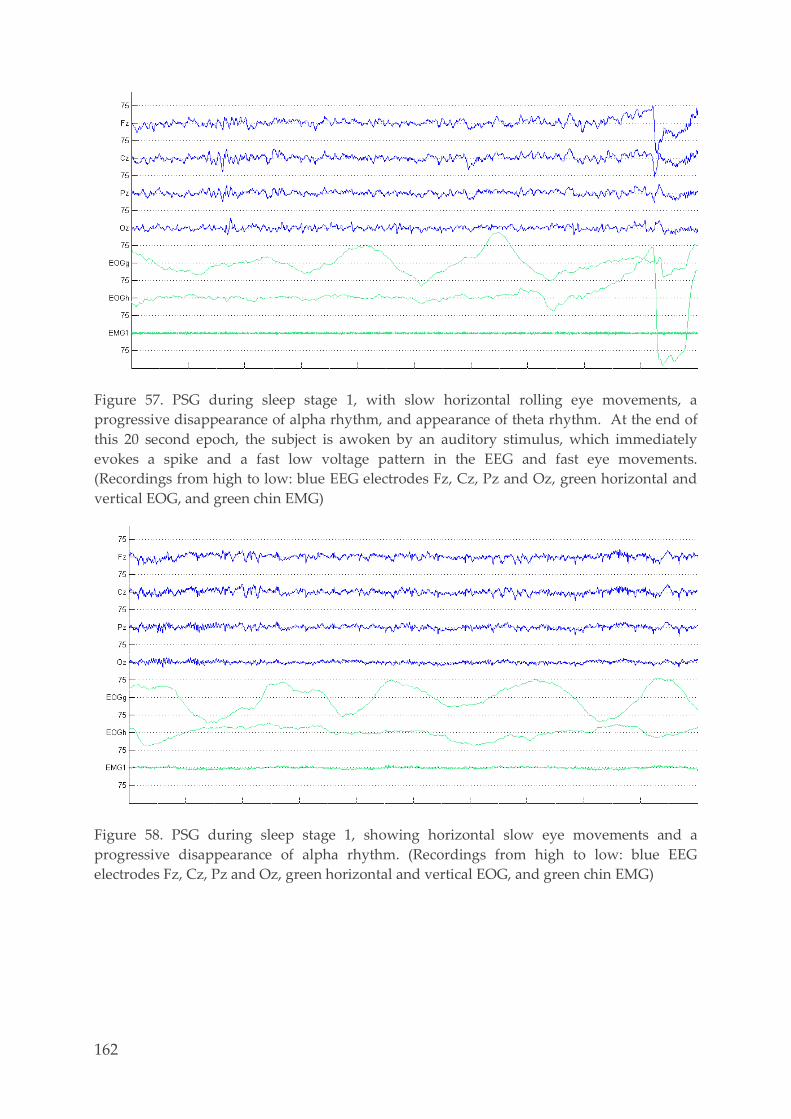
162
Figure 57. PSG during sleep stage 1, with slow horizontal rolling eye movements, a
progressive disappearance of alpha rhythm, and appearance of theta rhythm. At the end of
this 20 second epoch, the subject is awoken by an auditory stimulus, which immediately
evokes a spike and a fast low voltage pattern in the EEG and fast eye movements.
(Recordings from high to low: blue EEG electrodes Fz, Cz, Pz and Oz, green horizontal and
vertical EOG, and green chin EMG)
Figure 58. PSG during sleep stage 1, showing horizontal slow eye movements and a
progressive disappearance of alpha rhythm. (Recordings from high to low: blue EEG
electrodes Fz, Cz, Pz and Oz, green horizontal and vertical EOG, and green chin EMG)
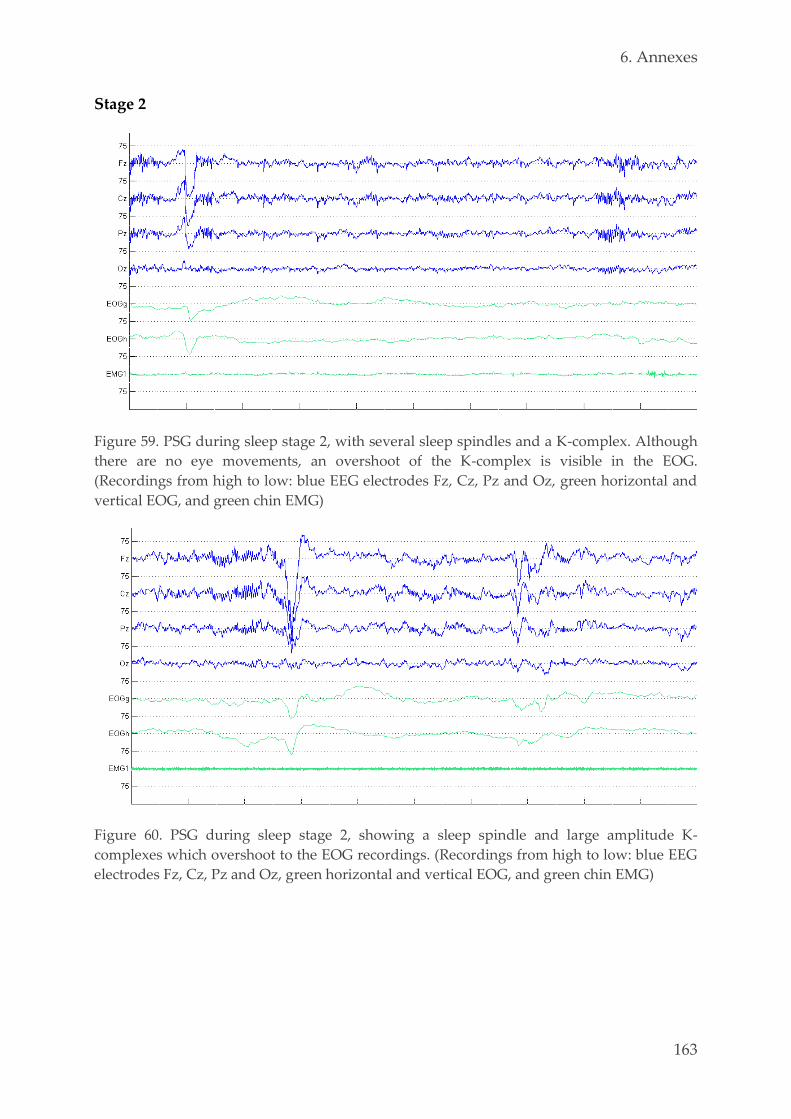
6. Annexes
163
Stage 2
Figure 59. PSG during sleep stage 2, with several sleep spindles and a K-complex. Although
there are no eye movements, an overshoot of the K-complex is visible in the EOG.
(Recordings from high to low: blue EEG electrodes Fz, Cz, Pz and Oz, green horizontal and
vertical EOG, and green chin EMG)
Figure 60. PSG during sleep stage 2, showing a sleep spindle and large amplitude K-
complexes which overshoot to the EOG recordings. (Recordings from high to low: blue EEG
electrodes Fz, Cz, Pz and Oz, green horizontal and vertical EOG, and green chin EMG)
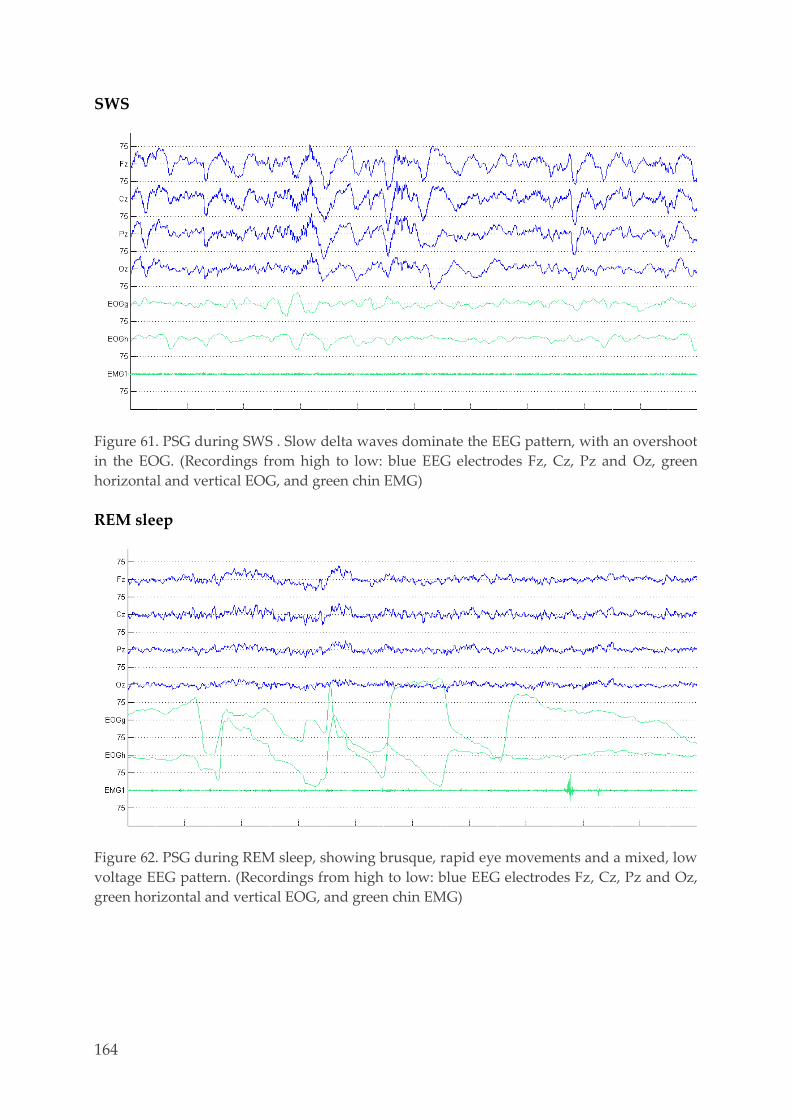
164
SWS
Figure 61. PSG during SWS . Slow delta waves dominate the EEG pattern, with an overshoot
in the EOG. (Recordings from high to low: blue EEG electrodes Fz, Cz, Pz and Oz, green
horizontal and vertical EOG, and green chin EMG)
REM sleep
Figure 62. PSG during REM sleep, showing brusque, rapid eye movements and a mixed, low
voltage EEG pattern. (Recordings from high to low: blue EEG electrodes Fz, Cz, Pz and Oz,
green horizontal and vertical EOG, and green chin EMG)
6. Annexes
165
6.2. Examples Tetris reports
This section contains examples of the sleep-onset reports of our first study. On each
awaking, volunteers were instructed to report their level of sleepiness according to
the Karolinska sleepiness scale (a subjective scale between 1 and 9) and any
"thoughts, images, feelings, sensations or anything else going through their mind".
Reports which began with a delay of more than 30 seconds after the auditory
stimulus, reports which could not be completely transcribed, and moments when the
subject did not respond at all, were not used in analyses.
Tetris-related content 6.2.1.
Images of Tetris included all reports where the subject explicitly mentioned seeing
the Tetris game. One subject said: "Level five. And euh I've been thinking about Tetris,
about the green blocks, and euh it's difficult to put them in the right place." Another subject
had hypnagogic hallucinations about other versions of Tetris he made up in his
mind: "Level eight… I've been thinking at Tetris, but euhm I'm seeing it horizontally… In
fact, with blocks arriving at the right, and I have to complete vertical lines." Another
example of another version: "Level seven… and I was thinking about the music of Tetris,
and also about a faster version in which the blocks are falling faster… That's it."
Images of spatial arrangement and movements which are perceived as ordering
Tetris blocks include all kinds of objects such as boxes, bottles, cars, circles, crosses,
beds, curtains, beehives with honeycombs, pieces of wood, snakes, eggs, balls, snow,
etc. "Euhm… seven, and I was ordering lots of beds, and putting the sheets on the beds and
stuff like that. I was playing Tetris with the beds." "Euhm seven. Otherwise I was ordering
everything that is in my wardrobe. I have put everything in shoe boxes, but in my dream
there were other shoe boxes. […] In my dream the shoe boxes were of different colors." "Five,
and I was seeing a lot of snakes, but with structure in it. Quite weird… Tetris style structure,
really weird." "I was dreaming about bees and their beehive, the place in which the bees live.
In fact, it was not really the beehive, but especially the honeycombs inside the beehive. That
made me think about the forms of the Tetris blocks." "Euh level of sleepiness five. I was seeing
myself in euh… nearby a tree trunk, I was busy cutting pieces of wood, which didn't have the
same form euh. That's it. […] Then, I don't know why, but the moment when I was seeing
myself cutting pieces of wood, I was thinking about Tetris." "Euh eight. And I was still
seeing little luminous circles of different colors interweaving. […] Little circles who were
interweaving like this, tjoep tjoep tjoep. Little circles, little discs. And they had, they had the
same colors as the blocks."
Unimodal reports containing the sound of Tetris are for example those containing the
Tetris song without other mental representations: "Level four euh… I've still been
thinking about the Tetris music and euh… That's it, yes."

166
More often, reports containing the melody of the Tetris theme were multimodal.
"Hm… between seven and eight. And I was opening and closing the rolling shutters, on the
melody of Tetris." "I had the music of Tetris in my mind, but at the same time I was thinking
about other things with the music as background." "Level eight. Euh… I was thinking about
the music of Tetris. And I was imagining there were people dancing on that music, people I
didn't recognize."
Other melodies related to the Tetris theme were, for example, other themes of the
Tetris game which were not heard during the practice sessions, other Russian folk
songs, or songs of which the subject explicitly says they are induced by the Tetris
theme. "Euh seven… and… and I was in a waiting cue for a concert and I was hearing the
music 'Nous aimons vivre au fond des bois'. […] It's a song I have been singing when I was
young, euhm in the youth movement, and I think it's the same music like the Tetris game in
fact. But, but it's instrumental music in fact, you should check it. The Tetris melody has its
origin somewhere, and I think it is derived from that song, but you should check it." It
should be noted that both the Tetris melody and the song 'Nous aimons vivre au
fond des bois' are Russian folk songs, and their melodies are quite similar. "Seven and
that song (Tetris) was irritating me. Therefore I started thinking at another song, that of
Pocahontas, I suppose at the waterfall with the boat… and that euh… raccoon. […] I have
been thinking at the melody of Tetris, lalala, and then it started to annoy and then I switched
to that other song."
Plain thoughts of the Tetris game are for example thoughts about the high score.
"Level six. I've been thinking about the scores I have achieved at Tetris and euh… that's all at
this moment." "Level five… and I've been thinking about the maximum score I've achieved,
euh… and also about the red descending blocks, that's all."
Emotions related to the Tetris game included excitement, curiosity, happiness,
boredom, frustration and disappointment. "Multiple short dreams like that, and euh I've
seen myself playing Tetris. It was a moment when I lost a game and that was frustrating
me!" "Yes and in the beginning I would say it was very funny! It was completely dark, and
there were several purple and red Tetris blocks or Duplo blocks. In fact it was 3D, and they
like tjoep tjoep, formed a little path, tjoep tjoep tjoep. It was very cute!" "That one with four
blocks, that orange one. You always need the tail, the long tail of that block euh, and you have
to fit that tail in the other blocks. And always when you need a block in one direction, you get
a block in the different direction. That's very irritating."
Images, sounds, thoughts or emotions of another game included reports about video
games (for example pac-man), TV games (for example word games and quizzes) and
party games (for example chess, downfall, connect four, battleship, card games, dice,
pétanque, poker, monopoly, etc.). "Nine, and I was thinking about a horse of chess."
"Level six. I was thinking about Tetris, and I was also thinking about a game “Downfall",
where you have to turn and align four disks of the same color." "I've been thinking about
6. Annexes
167
another game, more or less the same… It's not really the same objective, it's more or less the
colors of Tetris." "Seven… level of sleepiness seven. And euh I have been thinking about a
video game." "I was thinking about a game I know, and that made me think of Tetris, I
suppose. Pac-man two."
Images, sounds, thoughts or emotions related to the experimental settings, one of the
experimental tasks or questionnaires, sleep related concerns include all reports about
the PVT, scales, sleeping or sleep stages, beds, clocks, monitoring, actimetry,
questionnaires, the experimental room, the laboratory, the experimenter, the
announcement of the experiment, signing the informed consent, etc. "Eight. I was
thinking that it's very annoying, being awoken when you fall asleep." "Seven euh…
something about nine o'clock but I don't remember." Also the laboratory and the
university campus occurred in the reports: "Seven and euhm… I was at the Cyclotron,
which wasn't here at Sart Tilman, but which was at the Place de Vingt Août." "I think… in
fact, I think I was dreaming I was awoken and I had to answer your questions." "Euh six and
a half, and I was imagining taking a nap." "Seven, and I was thinking about, just at the
different stages of sleep… one two three four five six seven." "Euh still five or six, and I
believe that I thought about… about this experience, with the electrodes." "Euh level four.
And euh… I think I was filling out a questionnaire, maybe there was someone with me. I
don't remember what the questionnaire was about. It was a questionnaire on sheets of paper."
"I, I believe I was looking at a poster. I was wondering if it was a poster which, which showed
the different levels of sleepiness. That would be funny." "Euh seven. Euh a male who's
looking for volunteers for studies at the Cyclotron." "Level eight. And euhm. A blurred image
about someone who talks about his sleep."
As hypnagogic hallucinations tend to disappear immediately when they are
concentrated on, subjects often forgot their mental content. Sometimes they just
mentioned the KSS score, said they had nothing going on in their mind, or
mentioned they forgot. "Euh six and euh… pff I don't know euh, yes, I'm feeling tired."
"Euh I don't know, six. And it's really very blurred, I don't know anymore." "Level still
number nine… Hm."
The category with other images, sounds, thoughts or emotions not related to Tetris is
a very broad one, as it includes all reports which could not be assigned to any of the
previous categories. Also, thoughts of other games which were not related to Tetris,
when the subject mentioned having played the game recently, were included here.
"Level of sleepiness euhm… seven. And I suppose I was thinking about euh… the poker game
of yesterday with a friend." "Seven, eight, and I forgot what I was thinking about…
Something related to the university, I think." "Eight. I was thinking about the citytrip I've
made with my girlfriend to Paris, about ten days ago." "Level six. Euh I was thinking about
what I'm going, euh what I'm going to do during the weekend."

168
Sensory classes 6.2.2.
Visual hypnagogic hallucinations included for example: "Level of sleepiness seven…
and I was thinking about a landscape of the sea, that I was looking at." "Seven, and euh an
image of a, a road, with cars." "Sleepiness seven, and I was ordering the bottles with herbs
and oils, in the cupboard, at home." "My level of sleepiness is four, and I had an image in my
mind with euh lots of people, some people I know, others I don't recognize. And euh they were
having a party. I had the impression that I was watching the party."
Auditory hypnagogic images included all reports were the subject mentions hearing
a sound. "Level six… and I was thinking about the music of the Tetris game, and I was
thinking also about a computer game I have been playing ten years ago." "Euhm seven… and
my alarm clock went off but if was not at the same place in my room like usual." "Euhm six
and a half… in the streets was music, which was very loud and very fast, and people were
marching very fast." "Level eight. And euh I had a song in my mind, a song I have been
listening to this morning when I woke up."
Plain thoughts included for example: "Six or seven. I was thinking… what I should buy
when I'm going to live on my own. Little things like… detergent, soap, like that." "Level five.
No precise sensations… euh I, I am thinking what I'm going to do euh next week."
Bodily feelings and kinesthetic content, which is related to the position of the body,
weight, movements of the muscles, tendons and joints are categorized together. "Euh
seven… I would wake up anyway, because I was falling." "Euhm my level of sleepiness is
four. I've had a strange sensation… It was about making a movement, but I don't know if I
really made the movement. It was a movement that I wanted to make, and in the mean time I
wanted to stop it." "Level eight… I had the impression that my arms were slightly moving."
"Euh I'm cold… yes I'm very cold, I don’t know why. It's okay." "Level eight. I've had some
shivers… and euh I imagined the Tetris blocks like they were animals."
Emotions were not a common type of content during this experiment. However,
some reports contained emotions: "Between seven and eight… I'm very startled by your
voice. I don't remember what I was thinking about, but I do remember the sound of… of the
music of Tetris." "Euhm my level of sleepiness… four. I've seen something euh, in fact I felt
very angry or something like that." "Eight. And I'm scared."
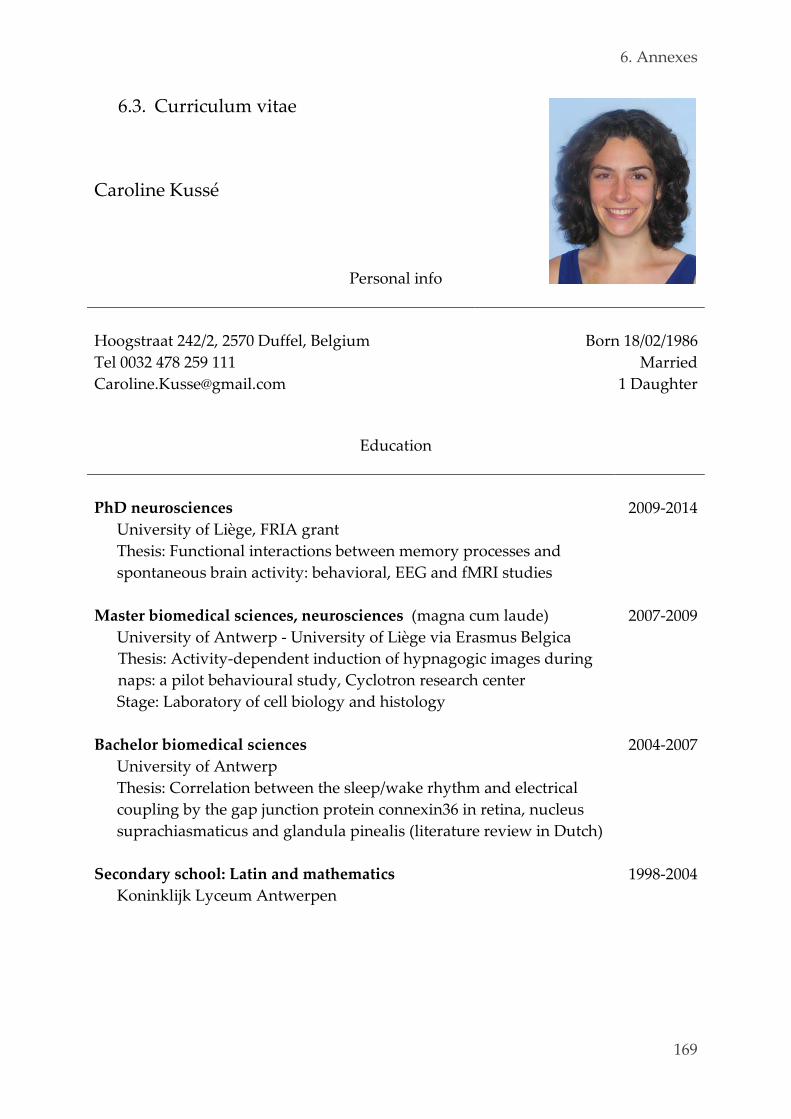
6. Annexes
169
6.3. Curriculum vitae
Caroline Kussé
Personal info
Hoogstraat 242/2, 2570 Duffel, Belgium
Tel 0032 478 259 111
Born 18/02/1986
Married
1 Daughter
Education
PhD neurosciences
University of Liège, FRIA grant
Thesis: Functional interactions between memory processes and
spontaneous brain activity: behavioral, EEG and fMRI studies
2009-2014
Master biomedical sciences, neurosciences (magna cum laude)
University of Antwerp - University of Liège via Erasmus Belgica
Thesis: Activity-dependent induction of hypnagogic images during
naps: a pilot behavioural study, Cyclotron research center
Stage: Laboratory of cell biology and histology
2007-2009
Bachelor biomedical sciences
University of Antwerp
Thesis: Correlation between the sleep/wake rhythm and electrical
coupling by the gap junction protein connexin36 in retina, nucleus
suprachiasmaticus and glandula pinealis (literature review in Dutch)
2004-2007
Secondary school: Latin and mathematics
Koninklijk Lyceum Antwerpen
1998-2004

170
Working experience as jobstudent
Research, CRC, University of Liège
September 2009
Library clerk, University of Antwerp May 2005 – June 2009
Moving library collection, University of Antwerp October 2007 – March 2008
Cashier, GB Schilde July 2005 & 2006
Babysitting, Goyvaerts Zoersel July 2002 & 2003
Skills
Functional neuroimaging
EEG & signal processing
fMRI & image analysis
Histological preparation of sections & examining with light-, electron- and
confocal laser scanning microscopy
Computer knowledge
Matlab, Cogent: basics
SPM, DCM, FASST: very good
MS office: word, powerpoint, excel: very good
SPSS: moderate
Photoshop: basics
Language knowledge
Dutch: native language
English: fluent written scientific literature, good everyday language
French: good written and spoken language
Driver’s licence B
First aid basics, Rode Kruis Vlaanderen
Hobbies
Gym group workouts
Judo
Outside walking, running and cycling
Playing classical piano
6. Annexes
171
Research experience
Tetris
2008-2011
Hypnagogic hallucinations are conscious mental representations that emerge
spontaneously at sleep onset. We found that task-related hypnagogic
hallucinations during a daytime nap were more consistently induced by
experience than by anticipation, incorporating the same modalities of the task.
Techniques: questionnaires, polysomnography (basic EEG, EOG, EMG), sleep
scoring in FASST, SPM, Matlab, SPSS
Sponmem 1 2009-2014
Memory consolidation is thought to depend on the reactivation of patterns of
brain activity that characterize recent experience. Using multivoxel pattern
analysis, we found that patterns of task-related brain activity in the ventral visual
stream persist into immediate rest periods and that this persistence seems to be
related to memory performance, suggesting that replay of brain activity
contributes to memory processing. However, other analyzing techniques could
not confirm these findings.
Techniques: questionnaires, fMRI, sMRI, Cogent, Matlab, SPM, DCM for fMRI,
SPSS
Sponmem 2 2011-onwards
Idem
Techniques: questionnaires, EGI (high density EEG), sMRI, Cogent, Matlab
PER 3 2010-2011
Interindividual differences in sleep-wake regulation are associated with a
polymorphism in the gene PERIOD3: people homozygous for the longer allele
(PER3 5/5) generate more slow wave activity during NREM sleep and theta
activity during wakefulness and are morning types, relative to individuals with
the shorter allele (PER3 4/4) who are evening types. We found that PER3 5/5
individuals are more vulnerable to sleep loss in the period just before the wake
maintenance zone, under 42h of sustained wakefulness.
Techniques: behavioral tasks, EEG during constant routine, fMRI, sMRI
DCM sleep 2010-2012
The fundamental rhythm of human NREM sleep is the slow wave activity, large
amplitude delta waves between 1 and 4 Hz. We used DCM to investigate changes
in effective connectivity in default mode network areas involved in the generation
of slow wave activity. We found that the increased cortico-cortical
synchronization during NREM sleep is mediated through cortico-thalamo-cortical
interactions rather than through a substantial change in long-distance cortico-
cortical connections.
Techniques: DCM for EEG, SPM, Matlab

172
6.4. Bibliography
Research papers
- Kussé C, Shaffii-Le Bourdiec A, Schrouff J, Matarazzo L, Maquet P (2012)
Experience-dependent induction of hypnagogic images during daytime naps: a
combined behavioural and EEG study. J Sleep Res 21(1): 10-20. (Kussé et al, 2012)
- Schrouff* J, Kussé* C, Wehenkel L, Maquet P, Phillips C (2012) Decoding semi-
constrained brain activity from FMRI using support vector machines and
gaussian processes. PLoS One 7(4): e35860. (Schrouff* et al, 2012)
- Schrouff J, Kussé C, Wehenkel L, Maquet P, Phillips C (2012) Decoding
spontaneous brain activity from fMRI using gaussian processes: tracking brain
reactivation. In: PRNI, London, doi 10.1109/PRNI.2012.19. (Schrouff et al, 2012)
- Schrouff* J, Kussé* C, Wehenkel L, Luxen A, Maquet P, Phillips C (Submitted)
Temporally structured memory replay during resting wakefulness in humans. (Schrouff* et al, Su bmitted)
- Kussé C, Schrouff J, Phillips C, Maquet P (In progress) Dynamic causal modeling
reveals temporally structured memory replay during resting wakefulness in
humans. (Kussé et al, In progress)
6. Annexes
173
Reviews and book chapters
- Shaffii-Le Bourdiec A, Muto V, Mascetti L, Foret A, Matarazzo L, Kussé C, Maquet
P (2010) Contribution of sleep to memory consolidation. Future Neurology 5(2):
325-338. (Shaffii-Le Bourdiec et al, 2010)
- Kussé C, Muto V, Mascetti L, Matarazzo L, Foret A, Bourdiec AS, Maquet P (2010)
Neuroimaging of dreaming: state of the art and limitations. Int Rev Neurobiol 92:
87-99. (Kussé et al, 2010)
- Foret A, Shaffii-Le Bourdiec A, Muto V, Mascetti L, Matarazzo L, Kussé C, Maquet
P (2011) Chapter 6 - Neural correlates of human NREM sleep oscillations. In:
Sleep and anesthesia - Neural correlates in theory and experiment (Hutt A, ed),
pp 127-136. Springer, New York. (Foret et al, 2011)
- Mascetti L, Foret A, Bourdiec AS, Muto V, Kussé C, Jaspar M, Matarazzo L, Dang-
Vu T, Schabus M, Maquet P (2011) Spontaneous neural activity during human
non-rapid eye movement sleep. Prog Brain Res 193: 111-118. (Mascetti et al, 2011)
- Muto V, Mascetti L, Matarazzo L, Kussé C, Foret A, Shaffii-Le Bourdiec A,
Vandewalle G, Dijk DJ, Maquet P (2011) Reciprocal interactions between
wakefulness and sleep influence global and regional brain activity. Curr Top Med
Chem 11(19): 2403-2413. (Muto et al, 2011)
- Jedidi Z, Rikir E, Muto V, Mascetti L, Kussé C, Foret A, Shaffii-Le Bourdiec A,
Vandewalle G, Maquet P (2011) Functional neuroimaging of the reciprocal
influences between sleep and wakefulness. Pflugers Arch 463(1): 103-109. (Jedidi et al, 2011)
- Kussé C, Maquet P (2012) Functional neuroimaging during human sleep. In:
Encyclopedia of sleep and dreams: the evolution, function, nature and mysteries
of slumber (McNamara P, Barrett D, eds), pp 293-297. Greenwood, USA. (Kussé and Maquet, 2012)
- Meyer C, Muto V, Jaspar M, Kussé C, Foret A, Mascetti L, Maquet P (2012) Neural
correlates of human sleep and sleep-dependent memory processing. In: Sleep and
brain activity (Frank M, ed), pp 165-186. Elsevier. (Meyer et al, 2012)
- Foret A, Mascetti L, Kussé C, Jaspar M, Muto V, Shaffii-Le Bourdiec A, Matarazzo
L, Maquet P (2012) Sleep, memory and the hippocampus. In: Clinical
Neurobiology of the Hippocampus (T B, ed), pp 144-151. University Press,
Oxford. (Foret et al, 2012)
- Meyer C, Jedidi Z, Muto V, Kussé C, Jaspar M, Mascetti L, Foret A, Maquet P
(2013) Functional neuroimaging of human REM sleep. In: Neuroimaging of sleep
and sleep disorders (Nofzinger E, Maquet P, Thorpy M, eds), pp 114-120.
University Press, Cambridge. (Meyer et al, 2013)

174
Conferences
- Kussé C, Shaffii‐Le Bourdiec A, Schrouff J, Matarazzo L, Maquet P: Experience-
dependent induction of hypnagogic images during daytime naps: a combined
behavioral and EEG study. Talk at ASSC, Kyoto, Japan, June 9-12th 2011
- Schrouff* J, Kussé* C, Wehenkel L, Maquet P, Phillips C: Decoding directed brain
activity in fMRI using support vector machines and Gaussian processes. Poster at
OHBM, Quebec, Canada, June 26-30th 2011
- Kussé C, Lehembre R, Foret A, Mascetti L, Maquet P, Boly M: Increase in cortico-
thalamo-cortical connectivity during human sleep slow wave activity. Poster at
OHBM, Beijing, China, June 10-14th 2012
- Schrouff J, Kussé C, Wehenkel L, Maquet P, Phillips C: Decoding spontaneous
brain activity from fMRI using Gaussian Processes: tracking brain reactivation.
Talk at PRNI, London, UK, July 2-4th 2012
- Kussé C, Lehembre R, Foret A, Mascetti L, Maquet P, Boly M: Increase in cortico-
thalamo-cortical connectivity during human sleep slow wave activity. Poster at
ESRS, Paris, France, September 4-8th 2012
- Muto V, Meyer C, Jaspar M, Shaffii-Le Bourdiec A, Kussé C, Foret A, Chellappa
SL, Vandewalle G, Collette F, Archer S, Dijk DJ, Maquet P: Influence of sleep
homeostasis and circadian rhythm on waking EEG oscillations during a constant
routine. Poster at ESRS, Paris, France, September 4-8th 2012
- Shaffii-Le Bourdiec A, Muto V, Jaspar M, Kussé C, Foret A, Archer S, Le Bourdiec
F, Vandewalle G, Collette F, Dijk DJ, Maquet P: Differences in neural correlates of
discrimination during sleep deprivation in PER3 homozygous. Talk at ESRS,
Paris, France, September 4-8th 2012
- Jaspar M, Meyer C, Muto V, Shaffii-Le Bourdiec A, Kussé C, Chellappa SL,
Vandewalle G, Collette F, Archer S, Dijk DJ, Maquet P: Influence of sleep
homeostasis and circadian rhythm on executive discriminative ability during a
constant routine. Poster at ESRS, Paris, France, September 4-8th 2012
- Kussé C, Lehembre R, Foret A, Mascetti L, Maquet P, Boly M: Increase in cortico-
thalamo-cortical connectivity during human sleep slow wave activity. Poster at
“Conference on Resting State Brain Connectivity”, Magdeburg, Germany,
September 5-7th 2012
- Kussé C, Lehembre R, Foret A, Mascetti L, Maquet P, Boly M: Increase in cortico-
thalamo-cortical connectivity during human sleep slow wave activity. Poster at
BBC, Liège, Belgium, October 27th 2012

6. Annexes
175
- Schrouff J, Kussé C, Wehenkel L, Maquet P, Phillips C: Decoding semi-constrained
brain activity from fMRI using SVM and GP. Workshop on Mathematical
Modeling and Computational Neuroscience of UFABC, São Paulo, Brazil,
November 21-22th 2012

176
177
7. REFERENCES
Akerstedt T, Gillberg M (1990) Subjective and objective sleepiness in the active
individual. Int J Neurosci 52(1-2): 29-37.
Akerstedt T, Hume K, Minors D, Waterhouse J (1994) The subjective meaning of
good sleep, an intraindividual approach using the Karolinska Sleep Diary.
Percept Mot Skills 79(1 Pt 1): 287-296.
Albouy G, Sterpenich V, Balteau E, Vandewalle G, Desseilles M, Dang-Vu T, Darsaud
A, Ruby P, Luppi PH, Degueldre C, Peigneux P, Luxen A, Maquet P (2008) Both
the hippocampus and striatum are involved in consolidation of motor sequence
memory. Neuron 58(2): 261-272.
Allison T, Puce A, Spencer DD, McCarthy G (1999) Electrophysiological studies of
human face perception. I: Potentials generated in occipitotemporal cortex by face
and non-face stimuli. Cereb Cortex 9(5): 415-430.
Anderson JR (1976) Language, memory, and thought. Lawrence Erlbaum Associates,
Hillsdale, New Jersey.
Andersson JL, Hutton C, Ashburner J, Turner R, Friston K (2001) Modeling geometric
deformations in EPI time series. Neuroimage 13(5): 903-919.
Anonymous (1959) Jerks on falling asleep. British Medical Journal 2(5140): 44.
Arieli A, Sterkin A, Grinvald A, Aertsen A (1996) Dynamics of ongoing activity:
explanation of the large variability in evoked cortical responses. Science 273(5283):
1868-1871.
Aristotle (1931 (orig. 4th century BC)-a) De somno et vigilia. In: The works of
Aristotle (Ross W, ed). Oxford University Press, London.
Aristotle (1931 (orig. 4th century BC)-b) De somniis. In: The works of Aristotle (Ross
W, ed). Oxford University Press, London.
Aserinsky E, Kleitman N (1953) Regularly occurring periods of eye motility, and
concomitant phenomena, during sleep. Science 118(3062): 273-274.
Aserinsky E, Kleitman N (1955) Two types of ocular motility occurring in sleep. J
Appl Physiol 8(1): 1-10.
Askenasy JJ (2003) Sleep disturbances in parkinsonism. J Neural Transm 110(2): 125-
150.
Baddeley A (2000) The episodic buffer: a new component of working memory?
Trends Cogn Sci 4(11): 417-423.
Baddeley AD, Hitch GJ (1974) Working memory. In: The psychology of learning and
motivation (Bower GA, ed), pp 47–89. Academic Press.
178
Baillarger JGF (1846) De l'influence de l'état intermédiaire à la veille et au sommeil
sur la production et la marche des hallucinations. Mem Acad-Roy Méd 12: 476-
516.
Baillet S, Mosher JC, Leahy RM (2001) Electromagnetic brain mapping. Signal
Processing Magazine, IEEE 18(6): 14-30.
Barrett D (2001) The committee of sleep: how artists, scientists, and athletes use
dreams for creative problem-solving - and how you can too. Crown Publishers,
New York.
Beck AT, Epstein N, Brown G, Steer RA (1988) An inventory for measuring clinical
anxiety: psychometric properties. J Consult Clin Psychol 56(6): 893-897.
Bentin S, Deouell LY, Soroker N (1999) Selective visual streaming in face recognition:
evidence from developmental prosopagnosia. Neuroreport 10(4): 823-827.
Berger H (1929) Uber das Elektroenkephalogramm des Menschen. Arch Psychiatr
Nervenkr 87: 527-570.
Bi G, Poo M (1999) Distributed synaptic modification in neural networks induced by
patterned stimulation. Nature 401(6755): 792-796.
Blackmore S, Cox M (2000) Alien abductions, sleep paralysis and the temporal lobe.
European Journal of UFO and Abduction Studies 1(113-118).
Blackmore S (2003) Consciousness: an introduction. Hodder & Stoughton, London.
Bodizs R, Sverteczki M, Lazar AS, Halasz P (2005) Human parahippocampal activity:
non-REM and REM elements in wake-sleep transition. Brain Res Bull 65(2): 169-
176.
Bodizs R, Sverteczki M, Meszaros E (2008) Wakefulness-sleep transition: emerging
electroencephalographic similarities with the rapid eye movement phase. Brain
Res Bull 76(1-2): 85-89.
Boly M, Balteau E, Schnakers C, Degueldre C, Moonen G, Luxen A, Phillips C,
Peigneux P, Maquet P, Laureys S (2007) Baseline brain activity fluctuations
predict somatosensory perception in humans. Proc Natl Acad Sci USA 104(29):
12187-12192.
Boly M, Phillips C, Balteau E, Schnakers C, Degueldre C, Moonen G, Luxen A,
Peigneux P, Faymonville ME, Maquet P, Laureys S (2008) Consciousness and
cerebral baseline activity fluctuations. Hum Brain Mapp 29(7): 868-874.
Boly M, Garrido MI, Gosseries O, Bruno MA, Boveroux P, Schnakers C, Massimini
M, Litvak V, Laureys S, Friston K (2011) Preserved feedforward but impaired top-
down processes in the vegetative state. Science 332(6031): 858-862.
Braud WG, Wood R, Braud LW (1975) Free-response GESP performance during an
experimental hypnagogic state induced by visual and acoustic ganzfeld
techniques: A replication and extension. . Journal of the American Society for
Psychical Research 69: 105–113.

7. References
179
Brown RM, Robertson EM (2007) Off-line processing: reciprocal interactions between
declarative and procedural memories. J Neurosci 27(39): 10468-10475.
Budzynski TH (1972) Some applications of biofeedback induced twilight states.
Fields within fields within fields 5: 105-114.
Burges CJC (1998) A tutorial on support vector machines for pattern recognition.
Data Mining and Knowledge Discovery 2: 121-167.
Buysse DJ, Reynolds CF, 3rd, Monk TH, Berman SR, Kupfer DJ (1989) The Pittsburgh
sleep quality index: a new instrument for psychiatric practice and research.
Psychiatry Res 28(2): 193-213.
Buzsaki G (1989) Two-stage model of memory trace formation: a role for "noisy"
brain states. Neuroscience 31(3): 551-570.
Buzsaki G, Draguhn A (2004) Neuronal oscillations in cortical networks. Science
304(5679): 1926-1929.
Carskadon MA, Dement WC (1977) Sleep tendency: an objective measure of sleep
los. Sleep Research 6: 200.
Carskadon MA, Dement WC, Mitler MM, Roth T, Westbrook PR, Keenan S (1986)
Guidelines for the multiple sleep latency test (MSLT): a standard measure of
sleepiness. Sleep 9(4): 519-524.
Chadwick MJ, Hassabis D, Weiskopf N, Maguire EA (2010) Decoding individual
episodic memory traces in the human hippocampus. Curr Biol 20(6): 544-547.
Chang CC, Lin CJ (2013) www.csie.ntu.edu.tw/~cjlin/libsvm.
Chao LL, Haxby JV, Martin A (1999) Attribute-based neural substrates in temporal
cortex for perceiving and knowing about objects. Nat Neurosci 2(10): 913-919.
Chellappa SL, Munch M, Blatter K, Knoblauch V, Cajochen C (2009) Does the
circadian modulation of dream recall modify with age? Sleep 32(9): 1201-1209.
Cheyne JA, Newby-Clark IR, Rueffer SD (1999) Relations among hypnagogic and
hypnopompic experiences associated with sleep paralysis. J Sleep Res 8(4): 313-
317.
Cheyne JA (2000) Play, dreams, and simulation (a brief commentary on Revonsuo).
Behavioral and Brain Science 23: 918-919.
Cheyne JA, Girard TA (2007) Paranoid delusions and threatening hallucinations: a
prospective study of sleep paralysis experiences. Conscious Cogn 16(4): 959-974.
Chiu LPW (1989) Differential diagnosis and management of hallucinations. Journal
of the Hong Kong Medical Association 41(3): 292-297.
Christoff K, Gordon A, Smith R (2011) The role of spontaneous thought in human
cognition. In: Neuroscience of decision making (Vartanian O, Mandel DR, eds),
pp 259-284. Psychology Press, New York.
Coleman RM, Pollak CP, Weitzman ED (1980) Periodic movements in sleep
(nocturnal myoclonus): relation to sleep disorders. Ann Neurol 8(4): 416-421.

180
Colgin LL, Moser EI (2006) Neuroscience: rewinding the memory record. Nature
440(7084): 615-617.
Collard P (1953) Hypnagogic visions. Light 73: 233-235.
Collins L (1994) 3D Model-based segmentation of individual brain structures from
magnetic resonance imaging data. Department of Biomedical Engineering, McGill
University, Montreal, Canada.
Cooke SF, Bliss TV (2006) Plasticity in the human central nervous system. Brain
129(Pt 7): 1659-1673.
Cox DD, Savoy RL (2003) Functional magnetic resonance imaging (fMRI) "brain
reading": detecting and classifying distributed patterns of fMRI activity in human
visual cortex. Neuroimage 19(2 Pt 1): 261-270.
Cukur T, Huth AG, Nishimoto S, Gallant JL (2013) Functional subdomains within
human FFA. J Neurosci 33(42): 16748-16766.
D'Argembeau A, Feyers D, Majerus S, Collette F, Van der Linden M, Maquet P,
Salmon E (2008) Self-reflection across time: cortical midline structures
differentiate between present and past selves. Social cognitive and affective
neuroscience 3(3): 244-252.
Dalí S (1942) The secret life of Salvador Dalí. Dial Press., New York City.
Damoiseaux JS, Rombouts SA, Barkhof F, Scheltens P, Stam CJ, Smith SM, Beckmann
CF (2006) Consistent resting-state networks across healthy subjects. Proc Natl
Acad Sci USA 103(37): 13848-13853.
Daunizeau J, Friston KJ, Kiebel SJ (2009) Variational Bayesian identification and
prediction of stochastic nonlinear dynamic causal models. Physica D Nonlinear
phenomena 238(21): 2089-2118.
Davidson TJ, Kloosterman F, Wilson MA (2009) Hippocampal replay of extended
experience. Neuron 63(4): 497-507.
Davis H, Davis PA, Loomis AL, Harvey EN, Hobart G (1937) Changes in human
brain potentials during the onset of sleep. Science 86(2237): 448-450.
Davis H, Davis PA, Loomis AL, Harvey EN, Hobart G (1938) Human brain potentials
during the onset of sleep. Journal of Neurophysiology 1: 24-28.
Davis H, Davis PA, Loomis AL, Harvey EN, Hobart G (1939) Electrical reations of
human brain to auditory stimulation during sleep. J Neurophysiol 2: 500-514.
De Manacéine M (1897) Sleep, its physiology, pathology, hygiene, and psychology.
Walter Scott, London.
Deichmann R, Schwarzbauer C, Turner R (2004) Optimisation of the 3D MDEFT
sequence for anatomical brain imaging: technical implications at 1.5 and 3 T.
Neuroimage 21(2): 757-767.
7. References
181
Dement W, Kleitman N (1957a) Cyclic variations in EEG during sleep and their
relation to eye movements, body motility, and dreaming. Electroencephalogr Clin
Neurophysiol 9(4): 673-690.
Dement W, Kleitman N (1957b) The relation of eye movements during sleep to
dream activity: an objective method for the study of dreaming. J Exp Psychol
53(5): 339-346.
Deuker L, Olligs J, Fell J, Kranz TA, Mormann F, Montag C, Reuter M, Elger CE,
Axmacher N (2013) Memory consolidation by replay of stimulus-specific neural
activity. J Neurosci 33(49): 19373-19383.
Diba K, Buzsaki G (2007) Forward and reverse hippocampal place-cell sequences
during ripples. Nat Neurosci 10(10): 1241-1242.
Diekelmann S, Buchel C, Born J, Rasch B (2011) Labile or stable: opposing
consequences for memory when reactivated during waking and sleep. Nat
Neurosci 14(3): 381-386.
Dietterich TG, Bakiri G (1995) Solving multiclass learning problem via
errorcorrecting output codes. Journal of Artificial Intelligence Research 2: 263-286.
Dinges DI, Powell JW (1985) Microcomputer analysis of performance on a portable,
simple visual RT task sustained operations. Behavioral Research Methods,
Instrumentation, and Computers 17: 652-655.
Dolan RJ, Fletcher PC (1997) Dissociating prefrontal and hippocampal function in
episodic memory encoding. Nature 388(6642): 582-585.
Downing PE, Jiang Y, Shuman M, Kanwisher N (2001) A cortical area selective for
visual processing of the human body. Science 293(5539): 2470-2473.
Downing PE, Chan AW, Peelen MV, Dodds CM, Kanwisher N (2006) Domain
specificity in visual cortex. Cereb Cortex 16(10): 1453-1461.
Drosopoulos S, Windau E, Wagner U, Born J (2007) Sleep enforces the temporal order
in memory. PLoS One 2(4): e376.
Dudai Y (2004) The neurobiology of consolidations, or, how stable is the engram?
Annu Rev Psychol 55: 51-86.
Dupret D, O'Neill J, Pleydell-Bouverie B, Csicsvari J (2010) The reorganization and
reactivation of hippocampal maps predict spatial memory performance. Nat
Neurosci 13(8): 995-1002.
Eagleman SL, Dragoi V (2012) Image sequence reactivation in awake V4 networks.
Proc Natl Acad Sci USA.
Eichenbaum H (2004) Hippocampus: cognitive processes and neural representations
that underlie declarative memory. Neuron 44(1): 109-120.
Ellenbogen JM, Hulbert JC, Stickgold R, Dinges DF, Thompson-Schill SL (2006)
Interfering with theories of sleep and memory: sleep, declarative memory, and
associative interference. Curr Biol 16(13): 1290-1294.

182
Ellis H (1897) A note on hypnagogic paramnesia. Mind 6: 283-287.
Emberger KM (2001) To sleep perchance to ski: The involuntary appearance of visual
and kinesthetic imagery at sleep onset following play on the Alpine Racer II.
Harvard University, Cambridge, MA.
Epstein R, Kanwisher N (1998) A cortical representation of the local visual
environment. Nature 392(6676): 598-601.
Epstein R, Harris A, Stanley D, Kanwisher N (1999) The parahippocampal place area:
recognition, navigation, or encoding? Neuron 23(1): 115-125.
Euston DR, Tatsuno M, McNaughton BL (2007) Fast-forward playback of recent
memory sequences in prefrontal cortex during sleep. Science 318(5853): 1147-1150.
Fairhall SL, Ishai A (2007) Effective connectivity within the distributed cortical
network for face perception. Cereb Cortex 17(10): 2400-2406.
Firestone M (1985) The "Old Hag": sleep paralysis in Newfoundland. The Journal of
Psychoanalytic Anthropology 10: 47-66.
Foret A, Shaffii-Le Bourdiec A, Muto V, Mascetti L, Matarazzo L, Kussé C, Maquet P
(2011) Chapter 6 - Neural correlates of human NREM sleep oscillations. In: Sleep
and anesthesia - Neural correlates in theory and experiment (Hutt A, ed), pp 127-
136. Springer, New York.
Foret A, Mascetti L, Kussé C, Jaspar M, Muto V, Shaffii-Le Bourdiec A, Matarazzo L,
Maquet P (2012) Sleep, memory and the hippocampus. In: Clinical Neurobiology
of the Hippocampus (T B, ed), pp 144-151. University Press, Oxford
Foster DJ, Wilson MA (2006) Reverse replay of behavioural sequences in
hippocampal place cells during the awake state. Nature 440(7084): 680-683.
Foulkes D, Vogel G (1965) Mental activity at sleep onset. J Abnorm Psychol 70: 231-
243.
Foulkes D, Schmidt M (1983) Temporal sequence and unit composition in dream
reports from different stages of sleep. Sleep 6(3): 265-280.
Fox MD, Snyder AZ, Zacks JM, Raichle ME (2006) Coherent spontaneous activity
accounts for trial-to-trial variability in human evoked brain responses. Nature
Neurosci 9: 23-25.
Fox MD, Raichle ME (2007) Spontaneous fluctuations in brain activity observed with
functional magnetic resonance imaging. Nat Rev Neurosci 8(9): 700-711.
Fox MD, Snyder AZ, Vincent JL, Raichle ME (2007) Intrinsic fluctuations within
cortical systems account for intertrial variability in human behavior. Neuron
56(1): 171-184.
Frankland PW, O'Brien C, Ohno M, Kirkwood A, Silva AJ (2001) Alpha-CaMKII-
dependent plasticity in the cortex is required for permanent memory. Nature
411(6835): 309-313.
7. References
183
Frankland PW, Bontempi B (2005) The organization of recent and remote memories.
Nat Rev Neurosci 6(2): 119-130.
Frankland PW, Bontempi B (2006) Fast track to the medial prefrontal cortex. Proc
Natl Acad Sci USA 103(3): 509-510.
Friston K, Penny W (2011) Post hoc Bayesian model selection. Neuroimage 56(4):
2089-2099.
Friston KJ, Price CJ (2001) Dynamic representations and generative models of brain
function. Brain Res Bull 54(3): 275-285.
Friston KJ, Harrison L, Penny W (2003) Dynamic causal modelling. Neuroimage
19(4): 1273-1302.
Friston KJ (2004) Experimental design and statistical parameter mapping. In: Human
brain function, 2nd Edition (Frackowiak RSJ, Friston KJ, Frith CD, Dolan RJ, Price
CJ, Zeki S, Ashburner J, Penny W, eds), pp 599-632. Academic Press, London.
Friston KJ, Ashburner JT, Kiebel SJ, Nichols TE, Penny WD (2007) Statistical
parametric mapping: the analysis of functional brain images. Elsevier Academic
Press, London.
Fukuda K, Miyasita A, Inugami M, Ishihara K (1987) High prevalence of isolated
sleep paralysis: kanashibari phenomenon in Japan. Sleep 10(3): 279-286.
Gais S, Albouy G, Boly M, Dang-Vu TT, Darsaud A, Desseilles M, Rauchs G, Schabus
M, Sterpenich V, Vandewalle G, Maquet P, Peigneux P (2007) Sleep transforms
the cerebral trace of declarative memories. Proc Natl Acad Sci USA 104(47): 18778-
18783.
Gais S, Rasch B, Wagner U, Born J (2008) Visual-procedural memory consolidation
during sleep blocked by glutamatergic receptor antagonists. J Neurosci 28(21):
5513-5518.
Gauthier I, Skudlarski P, Gore JC, Anderson AW (2000) Expertise for cars and birds
recruits brain areas involved in face recognition. Nat Neurosci 3(2): 191-197.
Gazzaniga MS (2009) The cognitive neurosciences. MIT Press, Cambridge,
Massachusetts.
Germain A, Nielsen TA (1997) Distribution of spontaneous hypnagogic images
across Hori's EEG stages of sleep onset. Sleep Research 26: 243.
Germain A, Nielsen TA (2001) EEG power associated with early sleep onset images
differing in sensory content. Sleep Research Online 4(2): 83-90.
Gilbert SJ, Dumontheil I, Simons JS, Frith CD, Burgess PW (2007) Comment on
"Wandering minds: the default network and stimulus-independent thought".
Science 317(5834): 43.
Girardeau G, Benchenane K, Wiener SI, Buzsaki G, Zugaro MB (2009) Selective
suppression of hippocampal ripples impairs spatial memory. Nat Neurosci 12(10):
1222-1223.
184
Goodale MA, Milner AD (1992) Separate visual pathways for perception and action.
Trends Neurosci 15(1): 20-25.
Green DM, Swets JA (1966) Signal detection theory and psychophysics. Wiley New
York.
Green E, Green A, Walters D (1970) Voluntary control of internal states:
psychological and physiological. Journal of transpersonal psychology 1: 1-26.
Grill-Spector K, Kushnir T, Hendler T, Edelman S, Itzchak Y, Malach R (1998) A
sequence of object-processing stages revealed by fMRI in the human occipital
lobe. Hum Brain Mapp 6(4): 316-328.
Grill-Spector K, Knouf N, Kanwisher N (2004) The fusiform face area subserves face
perception, not generic within-category identification. Nat Neurosci 7(5): 555-562.
Grill-Spector K, Malach R (2004) The human visual cortex. Annu Rev Neurosci 27:
649-677.
Groen G, Sokolov AN, Jonas C, Roebling R, Spitzer M (2011) Increased resting-state
perfusion after repeated encoding is related to later retrieval of declarative
associative memories. PLoS One 6(5): e19985.
Gusnard DA, Raichle ME (2001) Searching for a baseline: functional imaging and the
resting human brain. Nat Rev Neurosci 2(10): 685-694.
Gutierrez D, Escalona-Vargas DI (2010) EEG data classification through signal spatial
redistribution and optimized linear discriminants. Computer methods and
programs in biomedicine 97(1): 39-47.
Guyon I, Elisseeff A (2003) An introduction to variable and feature selection. Journal
of Machine Learning Research 3: 1157-1182.
Hanawalt NG (1954) Recurrent images: new instances and a summary of the older
ones. Amer J Psychol 67: 170-174.
Happe S, Anderer P, Gruber G, Klosch G, Saletu B, Zeitlhofer J (2002) Scalp
topography of the spontaneous K-complex and of delta-waves in human sleep.
Brain Topogr 15(1): 43-49.
Harmelech T, Preminger S, Wertman E, Malach R (2013) The day-after effect: long
term, Hebbian-like restructuring of resting-state fMRI patterns induced by a
single epoch of cortical activation. J Neurosci 33(22): 9488-9497.
Hasan J, Broughton R (1994) Quantitative topographic EEG mapping during
drowsiness and sleep onset. In: Sleep onset: normal and abnormal processes
(Ogilvie RD, Harsh JR, eds). American Psychological Association, Washington
DC.
Hassabis D, Chu C, Rees G, Weiskopf N, Molyneux PD, Maguire EA (2009) Decoding
neuronal ensembles in the human hippocampus. Curr Biol 19(7): 546-554.
Hasson U, Harel M, Levy I, Malach R (2003) Large-scale mirror-symmetry
organization of human occipito-temporal object areas. Neuron 37(6): 1027-1041.

7. References
185
Hayashi ML, Choi SY, Rao BS, Jung HY, Lee HK, Zhang D, Chattarji S, Kirkwood A,
Tonegawa S (2004) Altered cortical synaptic morphology and impaired memory
consolidation in forebrain- specific dominant-negative PAK transgenic mice.
Neuron 42(5): 773-787.
Haynes JD, Rees G (2005a) Predicting the orientation of invisible stimuli from activity
in human primary visual cortex. Nat Neurosci 8(5): 686-691.
Haynes JD, Rees G (2005b) Predicting the stream of consciousness from activity in
human visual cortex. Curr Biol 15(14): 1301-1307.
Haynes JD, Rees G (2006) Decoding mental states from brain activity in humans. Nat
Rev Neurosci 7(7): 523-534.
Haynes JD, Sakai K, Rees G, Gilbert S, Frith C, Passingham RE (2007) Reading hidden
intentions in the human brain. Curr Biol 17(4): 323-328.
Hebb DO (1949) Organization of behavior: a neuropsychological theory. John Wiley,
New York.
Hebb DO (1968) Concerning imagery. Psychol Rev 75(6): 466-477.
Hirase H, Leinekugel X, Czurko A, Csicsvari J, Buzsaki G (2001) Firing rates of
hippocampal neurons are preserved during subsequent sleep episodes and
modified by novel awake experience. Proc Natl Acad Sci USA 98(16): 9386-9390.
Hiroshige Y (1998) The effects of time constant on electrooculographic recording of
slow eye movements during the wake-sleep transition. Psychiatry Clin Neurosci
52(2): 163-164.
Hobson JA, Hoffman SA, Helfand R, Kostner D (1987) Dream bizarreness and the
activation-synthesis hypothesis. Hum Neurobiol 6(3): 157-164.
Hobson JA (1988) The dreaming brain. Basic Books, New York.
Hobson JA (2002) I of the vortex: from neurons to self (book review). Perspectives in
Biology and Medicine 45(3): 466-468.
Hobson JA, Pace-Schott EF, Stickgold R (2003) Dreaming and the brain: toward a
cognitive neuroscience of conscious states. In: Sleep and dreaming: scientific
advances and reconsiderations (Pace-Schott EF, Solms M, Blagrove M, Harnad S,
eds), pp 1-50. University Press, Cambridge.
Hoffman KL, McNaughton BL (2002) Coordinated reactivation of distributed
memory traces in primate neocortex. Science 297(5589): 2070-2073.
Hollingworth H (1911) The psychology of drowsiness, an introspective and analytical
study. Amer J Psychol 22: 99-111.
Hori T (1985) Spatiotemporal changes of EEG activity during waking-sleeping
transition period. Int J Neurosci 27(1-2): 101-114.
Hori T, Hayashi M, Morikawa T (1994) Topographical EEG changes and the
hypnagogic experience. In: Sleep onset: normal and abnormal processes (Ogilvie
RD, Harsh JR, eds). American Psychological Association, Washington DC.

186
Horikawa T, Tamaki M, Miyawaki Y, Kamitani Y (2013) Neural decoding of visual
imagery during sleep. Science 340(6132): 639-642.
Horne JA, Ostberg O (1976) A self-assessment questionnaire to determine
morningness-eveningness in human circadian rhythms. Int J Chronobiol 4(2): 97-
110.
Horovitz SG, Fukunaga M, de Zwart JA, van Gelderen P, Fulton SC, Balkin TJ, Duyn
JH (2008) Low frequency BOLD fluctuations during resting wakefulness and light
sleep: a simultaneous EEG-fMRI study. Hum Brain Mapp 29(6): 671-682.
Howard MW, Fotedar MS, Datey AV, Hasselmo ME (2005) The temporal context
model in spatial navigation and relational learning: toward a common
explanation of medial temporal lobe function across domains. Psychol Rev 112(1):
75-116.
Huber R, Ghilardi MF, Massimini M, Tononi G (2004) Local sleep and learning.
Nature 430(6995): 78-81.
Huster RJ, Debener S, Eichele T, Herrmann CS (2012) Methods for simultaneous
EEG-fMRI: an introductory review. J Neurosci 32(18): 6053-6060.
Hutton C, Bork A, Josephs O, Deichmann R, Ashburner J, Turner R (2002) Image
distortion correction in fMRI: A quantitative evaluation. Neuroimage 16(1): 217-
240.
Iamblichus (1895 (orig. 3rd century AD)) The epistle of porphyry to the Egyptian
Anebo. In: Iamblichus on the mysteries of the Egyptians, Chaldeans and
Assyrians. Dobell, and Reeves & Turner, London.
Iber C, Ancoli-Israel S, Chesson AL, Quan SF (2007) The AASM manual for the
scoring of sleep and associated events: Rules, terminology and technical
specifications. AASM Manual for Scoring Sleep: 3-59.
Jafarpour A, Fuentemilla L, Horner AJ, Penny W, Duzel E (2014) Replay of very early
encoding representations during recollection. J Neurosci 34(1): 242-248.
Jahnke K, von Wegner F, Morzelewski A, Borisov S, Maischein M, Steinmetz H,
Laufs H (2012) To wake or not to wake? The two-sided nature of the human K-
complex. Neuroimage 59(2): 1631-1638.
James W (1890) Chapter 27 Hypnotism. Modes of operating and susceptibility. In:
The principles of psychology. Holt, New York.
Jedidi Z, Rikir E, Muto V, Mascetti L, Kussé C, Foret A, Shaffii-Le Bourdiec A,
Vandewalle G, Maquet P (2011) Functional neuroimaging of the reciprocal
influences between sleep and wakefulness. Pflugers Arch 463(1): 103-109.
Ji D, Wilson MA (2007) Coordinated memory replay in the visual cortex and
hippocampus during sleep. Nat Neurosci 10(1): 100-107.
Jiang Y (2004) Time window from visual images to visual short-term memory:
consolidation or integration? Experimental psychology 51(1): 45-51.

7. References
187
Johns MW (1991) A new method for measuring daytime sleepiness: the Epworth
sleepiness scale. Sleep 14(6): 540-545.
Johnson JD, McDuff SG, Rugg MD, Norman KA (2009) Recollection, familiarity, and
cortical reinstatement: a multivoxel pattern analysis. Neuron 63(5): 697-708.
Jouvet M, Michel F, Courjon J (1959a) Sur la mise en jeu de deux mécanismes à
expression électroencephalographique différente au cours du sommeil
physiologique chez le chat. C R Hebd Seances Acad Sci 248(21): 3043-3045.
Jouvet M, Michel F, Courjon J (1959b) Activité électrique du rhinencéphale au cours
du sommeil chez le chat. C R Seances Soc Biol Fil 153(1): 101-105.
Jouvet M, Michel F, Courjon J (1959c) Sur un stade d'activité électrique cérébrale
rapide au cours du sommeil physiologique. C R Seances Soc Biol Fil 153: 1024-
1028.
Kahana MJ (1996) Associative retrieval processes in free recall. Mem Cognit 24(1):
103-109.
Kaida K, Takahashi M, Akerstedt T, Nakata A, Otsuka Y, Haratani T, Fukasawa K
(2006) Validation of the Karolinska sleepiness scale against performance and EEG
variables. Clin Neurophysiol 117(7): 1574-1581.
Kamitani Y, Tong F (2005) Decoding the visual and subjective contents of the human
brain. Nat Neurosci 8(5): 679-685.
Kanwisher N, McDermott J, Chun MM (1997a) The fusiform face area: a module in
human extrastriate cortex specialized for face perception. J Neurosci 17(11): 4302-
4311.
Kanwisher N, Woods RP, Iacoboni M, Mazziotta JC (1997b) A locus in human
extrastriate cortex for visual shape analysis. J Cogn Neurosci 9(1): 133-142.
Kanwisher N (2000) Domain specificity in face perception. Nat Neurosci 3(8): 759-
763.
Karlsson MP, Frank LM (2009) Awake replay of remote experiences in the
hippocampus. Nat Neurosci 12(7): 913-918.
Kattler H, Dijk DJ, Borbely AA (1994) Effect of unilateral somatosensory stimulation
prior to sleep on the sleep EEG in humans. J Sleep Res 3(3): 159-164.
Kenet T, Bibitchkov D, Tsodyks M, Grinvald A, Arieli A (2003) Spontaneously
emerging cortical representations of visual attributes. Nature 425(6961): 954-956.
Kiebel SJ, Holmes AP (2004) The general linear model. In: Human Brain Function,
2nd Edition (Frackowiak RSJ, Friston KJ, Frith CD, Dolan RJ, Price CJ, Zeki S,
Ashburner J, Penny W, eds). Academic Press, London.
Kjaer TW, Law I, Wiltschiotz G, Paulson OB, Madsen PL (2002) Regional cerebral
blood flow during light sleep - a H(2)(15)O-PET study. J Sleep Res 11(3): 201-207.
188
Kribbs NB, Dinges D (1994) Vigilance decrement and sleepiness. In: Sleep onset:
normal and abnormal processes (Ogilvie RD, Harsh JR, eds). American
Psychological Association, Washington DC.
Kudrimoti HS, Barnes CA, McNaughton BL (1999) Reactivation of hippocampal cell
assemblies: effects of behavioral state, experience, and EEG dynamics. J Neurosci
19(10): 4090-4101.
Kuhl BA, Rissman J, Chun MM, Wagner AD (2011) Fidelity of neural reactivation
reveals competition between memories. Proc Natl Acad Sci USA 108(14): 5903-
5908.
Kuhl BA, Bainbridge WA, Chun MM (2012a) Neural reactivation reveals mechanisms
for updating memory. J Neurosci 32(10): 3453-3461.
Kuhl BA, Rissman J, Wagner AD (2012b) Multi-voxel patterns of visual category
representation during episodic encoding are predictive of subsequent memory.
Neuropsychologia 50(4): 458-469.
Kuhl BA, Johnson MK, Chun MM (2013) Dissociable neural mechanisms for goal-
directed versus incidental memory reactivation. J Neurosci 33(41): 16099-16109.
Kuhlo W, Lehmann D (1964) Experience during the onset of sleep and its
neuropohysiological correlates. Arch Psychiatr Nervenkr 205: 687-716.
Kussé C, Muto V, Mascetti L, Matarazzo L, Foret A, Bourdiec AS, Maquet P (2010)
Neuroimaging of dreaming: state of the art and limitations. Int Rev Neurobiol 92:
87-99.
Kussé C, Maquet P (2012) Functional neuroimaging during human sleep. In:
Encyclopedia of sleep and dreams: the evolution, function, nature and mysteries
of slumber (McNamara P, Barrett D, eds), pp 293-297. Greenwood, USA.
Kussé C, Shaffii-Le Bourdiec A, Schrouff J, Matarazzo L, Maquet P (2012) Experience-
dependent induction of hypnagogic images during daytime naps: a combined
behavioural and EEG study. J Sleep Res 21(1): 10-20.
Kussé C, Schrouff J, Phillips C, Maquet P (In progress) Dynamic causal modeling
reveals temporally structured memory replay during resting wakefulness in
humans.
Larson-Prior LJ, Zempel JM, Nolan TS, Prior FW, Snyder AZ, Raichle ME (2009)
Cortical network functional connectivity in the descent to sleep. Proc Natl Acad
Sci USA 106(11): 4489-4494.
Leaning FE (1925) Hypnagogic phenomena. Journal of the SPR 22: 146-154.
Leclercq Y, Schrouff J, Noirhomme Q, Maquet P, Phillips C (2011) FMRI artefact
rejection and sleep scoring toolbox. In: Computational Intelligence and
Neuroscience, doi 10.1155/2011/598206, 11 pages.
Lee AK, Wilson MA (2002) Memory of sequential experience in the hippocampus
during slow wave sleep. Neuron 36(6): 1183-1194.
7. References
189
Lehmann D, Henggeler B, Koukkou M, Michel CM (1993) Source localization of brain
electric field frequency bands during conscious, spontaneous, visual imagery and
abstract thought. Brain Res Cogn Brain Res 1(4): 203-210.
Lehmann D, Grass P, Meier B (1995) Spontaneous conscious covert cognition states
and brain electric spectral states in canonical correlations. Int J Psychophysiol
19(1): 41-52.
Leroy EB, Tobolowska J (1901) Sur les relations qui existent entre certaines
hallucinations du rêve et les images du langage intérieur. Bull Instit Psychol
Internat 5: 241-248.
Leroy EB (1926) Les visions du demi-sommeil. Librairie Felix-Alcan, Paris.
Linschoten J (1952) Over het inslapen. Tijdschrift voor Philisophie 14: 80-117.
Llinás RR (2001) I of the vortex: from neurons to self. The MIT Press, Cambridge,
MA.
Loh S, Lamond N, Dorrian J, Roach G, Dawson D (2004) The validity of psychomotor
vigilance tasks of less than 10-minute duration. Behav Res Methods Instrum
Comput 36(2): 339-346.
Loomis AL, Harvey EN, Hobart GA (1937a) Cerebral states during sleep, as studied
by human brain potentials. Journal of experimental psychology 21: 127-144.
Loomis AL, Harvey EN, Hobart GA (1937b) Cerebral processes during sleep as
studied by human brain potentials. Science 85: 443-444.
Louie K, Wilson MA (2001) Temporally structured replay of awake hippocampal
ensemble activity during rapid eye movement sleep. Neuron 29(1): 145-156.
Malherbe C, Pélégrini-Issac M, Perlbarg V, Lehéricy S, Marrelec G, H B (2010)
Identification of functional cortico-subcortical networks in resting-state FMRI: a
combined NEDICA and GLM analysis. In: IEEE ISBI international conference on
Biomedical imaging: from nano to Macro, pp 1169-1172, Rotterdam, Netherlands.
Margulies DS, Bottger J, Long X, Lv Y, Kelly C, Schafer A, Goldhahn D, Abbushi A,
Milham MP, Lohmann G, Villringer A (2010) Resting developments: a review of
fMRI post-processing methodologies for spontaneous brain activity. MAGMA
23(5-6): 289-307.
Marquand A, Mourão-Miranda J (2013) www.brainmap.co.uk.
Marrelec G, Bellec P, Krainik A, Duffau H, Pelegrini-Issac M, Lehericy S, Benali H,
Doyon J (2008) Regions, systems, and the brain: hierarchical measures of
functional integration in fMRI. Med Image Anal 12(4): 484-496.
Marrelec G, Kim J, Doyon J, Horwitz B (2009) Large-scale neural model validation of
partial correlation analysis for effective connectivity investigation in functional
MRI. Hum Brain Mapp 30(3): 941-950.
Martin A, Wiggs CL, Ungerleider LG, Haxby JV (1996) Neural correlates of category-
specific knowledge. Nature 379(6566): 649-652.
190
Mascetti L, Foret A, Bourdiec AS, Muto V, Kussé C, Jaspar M, Matarazzo L, Dang-Vu
T, Schabus M, Maquet P (2011) Spontaneous neural activity during human non-
rapid eye movement sleep. Prog Brain Res 193: 111-118.
Mason MF, Norton MI, Van Horn JD, Wegner DM, Grafton ST, Macrae CN (2007)
Wandering minds: the default network and stimulus-independent thought.
Science 315(5810): 393-395.
Maury LFA (1848) Des hallucinations hypnagogiques, ou des erreurs des sens dans
l'etat intermediaire entre la veille et le sommeil. Annales Medico-Psychologiques
du système nerveux 11: 26-40.
Maury LFA (1853) Nouvelles observations sur les analogies des phénomènes du rêve
et de l'aliénation mentale. Annales Médico Psychologiques 2ème série tome 5:
404-421.
Maury LFA (1857) De certains faits observés dans les rêves et dans l'état
intermédiaire entre le sommeil et la veille. Annales Médico Psychologiques, 3ème
série tome 3: 157-176.
Maury LFA (1865) Chapitre IV: Des hallucinations hypnagogiques. In: Le sommeil et
les rêves: études psychologiques sur ces phénomènes et les divers états qui s'y
rattachent, suivies de recherches sur le developpement de l'instinct et de
l'intelligence dans leur rapports avec le phénomène du sommeil. Didier, Paris.
Mavromatis A, Richardson JTE (1984) Hypnagogic imagery. International Review of
Mental Imagery 1: 159-189.
Mavromatis A (1987) Hypnagogia: the unique state of consciousness between
wakefulness and sleep. Routledge & Kegan Paul Ltd, London.
McCarthy G, Puce A, Belger A, Allison T (1999) Electrophysiological studies of
human face perception. II: Response properties of face-specific potentials
generated in occipitotemporal cortex. Cereb Cortex 9(5): 431-444.
McClelland JL, McNaughton BL, O'Reilly RC (1995) Why there are complementary
learning systems in the hippocampus and neocortex: insights from the successes
and failures of connectionist models of learning and memory. Psychol Rev 102(3):
419-457.
McGaugh JL (2000) Memory - a century of consolidation. Science 287(5451): 248-251.
McKellar P (1957) Imagination and thinking. Cohen & West, London.
McKellar P (1989) Abnormal psychology: its experience and behaviour. Routledge,
London.
McKenzie S, Eichenbaum H (2011) Consolidation and reconsolidation: two lives of
memories? Neuron 71(2): 224-233.
Mechelli A, Price CJ, Noppeney U, Friston KJ (2003) A dynamic causal modeling
study on category effects: bottom-up or top-down mediation? J Cogn Neurosci
15(7): 925-934.
7. References
191
Medicine AAoS (2001) International classification of sleep disorders, revised
diagnostic and coding manual. American Academy of Sleep Medicine, Chicago,
Illinois.
Meyer C, Muto V, Jaspar M, Kussé C, Foret A, Mascetti L, Maquet P (2012) Neural
correlates of human sleep and sleep-dependent memory processing. In: Sleep and
brain activity (Frank M, ed), pp 165-186. Elsevier.
Meyer C, Jedidi Z, Muto V, Kussé C, Jaspar M, Mascetti L, Foret A, Maquet P (2013)
Functional neuroimaging of human REM sleep. In: Neuroimaging of sleep and
sleep disorders (Nofzinger E, Maquet P, Thorpy M, eds), pp 114-120. University
Press, Cambridge
Miller G (2012) Mysteries of the brain. How are memories retrieved? Science
338(6103): 30-31.
Miller GA (1956) The magical number seven plus or minus two: some limits on our
capacity for processing information. Psychol Rev 63(2): 81-97.
Mishkin M, Ungerleider LG (1982) Contribution of striate inputs to the visuospatial
functions of parieto-preoccipital cortex in monkeys. Behav Brain Res 6(1): 57-77.
Mitchell TM, Hutchinson R, Niculescu RS, Pereira F, Wang X, Just M, Newman S
(2004) Learning to decode cognitive states from brain images. Machine Learning
57: 145-175.
Mohajerani MH, Chan AW, Mohsenvand M, Ledue J, Liu R, McVea DA, Boyd JD,
Wang YT, Reimers M, Murphy TH (2013) Spontaneous cortical activity alternates
between motifs defined by regional axonal projections. Nat Neurosci 16(10): 1426-
1435.
Moran RJ, Jung F, Kumagai T, Endepols H, Graf R, Dolan RJ, Friston KJ, Stephan KE,
Tittgemeyer M (2011) Dynamic causal models and physiological inference: a
validation study using isoflurane anaesthesia in rodents. PLoS One 6(8): e22790.
Mourao-Miranda J, Reynaud E, McGlone F, Calvert G, Brammer M (2006) The impact
of temporal compression and space selection on SVM analysis of single-subject
and multi-subject fMRI data. Neuroimage 33(4): 1055-1065.
Mullen P (1979) Phenomenology of disordered mental function. In: Essentials of
Postgraduate Psychiatry (Hill P, Murray R, Thorley A, eds). Academic Press /
Grune & Stratton, London / New York.
Müller GE, Pilzecker A (1900) Experimentelle Beiträge zur Lehre vom Gedächtnis. Z
Psychol Ergänzungsband 1: 1-300.
Müller JP (1826) Ueber die phantastische Gesichtserscheinungen: eine physiologische
Untersuchung mit einer physiologischen Urkune des Aristoteles über den Traum,
den Philosophen, une Aertzen gewidmet. J. Hölscher, Koblenz.
Müller JP (1848) The physiology of the senses, voice, and muscular motion, together
with the mental faculties. Taylor & Walton & Maberly, London.
192
Muto V, Mascetti L, Matarazzo L, Kussé C, Foret A, Shaffii-Le Bourdiec A,
Vandewalle G, Dijk DJ, Maquet P (2011) Reciprocal interactions between
wakefulness and sleep influence global and regional brain activity. Curr Top Med
Chem 11(19): 2403-2413.
Myers FWH (1892) Sensory automatism and induced hallucinations. Proc SPR 8: 436-
536.
Myers FWH (1903) Human personality and its survival of bodily death (Studies in
consciousness). Longmans, Green & Co., London.
Nadasdy Z, Hirase H, Czurko A, Csicsvari J, Buzsaki G (1999) Replay and time
compression of recurring spike sequences in the hippocampus. J Neurosci 19(21):
9497-9507.
Nadel L, Samsonovich A, Ryan L, Moscovitch M (2000) Multiple trace theory of
human memory: computational, neuroimaging, and neuropsychological results.
Hippocampus 10(4): 352-368.
Nicholson PT (1996) Phosphene images of thalamic sleep rhythms induced by self-
hypnosis. Subtle Energies & Energy Medicine 7(2): 111.
Niedermeyer E, da Silva FL (2004) Electroencephalography: basic principles, clinical
applications, and related fields. Lippincott Williams & Wilkins.
Nielsen TA (1992) A self-observational study of spontaneous hypnagogic imagery
using the upright napping procedure. Imagination, Cognition and Personality
11(4): 353-366.
Norman KA, Polyn SM, Detre GJ, Haxby JV (2006) Beyond mind-reading: multi-
voxel pattern analysis of fMRI data. Trends Cogn Sci 10(9): 424-430.
Nyberg L, McIntosh AR, Cabeza R, Habib R, Houle S, Tulving E (1996) General and
specific brain regions involved in encoding and retrieval of events: what, where,
and when. Proc Natl Acad Sci USA 93(20): 11280-11285.
Ogawa S, Lee TM, Nayak AS, Glynn P (1990) Oxygenation-sensitive contrast in
magnetic resonance image of rodent brain at high magnetic fields. Magnetic
Resonance in Medicine 14(1): 68-78.
Ohayon MM, Priest RG, Caulet M, Guilleminault C (1996) Hypnagogic and
hypnopompic hallucinations: pathological phenomena? Br J Psychiatry 169(4):
459-467.
Ohayon MM (2000) Prevalence of hallucinations and their pathological associations
in the general population. Psychiatry Res 97(2-3): 153-164.
Olbrich S, Mulert C, Karch S, Trenner M, Leicht G, Pogarell O, Hegerl U (2009) EEG-
vigilance and BOLD effect during simultaneous EEG/fMRI measurement.
Neuroimage 45(2): 319-332.
Oldfield RC (1971) The assessment and analysis of handedness: the Edinburgh
inventory. Neuropsychologia 9(1): 97-113.

7. References
193
Ornitz EM, Ritvo ER, Carr EM, La Franchi S, Walter RD (1967) The effect of sleep
onset on the auditory averaged evoked response. Electroencephalogr Clin
Neurophysiol 23(4): 335-341.
Oswald I (1959) Sudden bodily jerks on falling asleep. Brain 82(1): 92-103.
Pavlides C, Winson J (1989) Influences of hippocampal place cell firing in the awake
state on the activity of these cells during subsequent sleep episodes. J Neurosci
9(8): 2907-2918.
Peigneux P, Laureys S, Fuchs S, Collette F, Perrin F, Reggers J, Phillips C, Degueldre
C, Del Fiore G, Aerts J, Luxen A, Maquet P (2004) Are spatial memories
strengthened in the human hippocampus during slow wave sleep? Neuron 44(3):
535-545.
Peigneux P, Orban P, Balteau E, Degueldre C, Luxen A, Laureys S, Maquet P (2006)
Offline persistence of memory-related cerebral activity during active wakefulness.
PLoS Biol 4(4): e100.
Pennartz CM, Lee E, Verheul J, Lipa P, Barnes CA, McNaughton BL (2004) The
ventral striatum in off-line processing: ensemble reactivation during sleep and
modulation by hippocampal ripples. J Neurosci 24(29): 6446-6456.
Penny WD, Stephan KE, Mechelli A, Friston KJ (2004) Comparing dynamic causal
models. Neuroimage 22(3): 1157-1172.
Perlbarg V, Bellec P, Anton JL, Pelegrini-Issac M, Doyon J, Benali H (2007) CORSICA:
correction of structured noise in fMRI by automatic identification of ICA
components. Magnetic resonance imaging 25(1): 35-46.
Perlbarg V, Marrelec G (2008a) Contribution of exploratory methods to the
investigation of extended large-scale brain networks in functional MRI:
methodologies, results, and challenges. Int J Biomed Imaging 2008: 218519.
Perlbarg V, Marrelec G, Doyon J, Pélégrini-Issac M, Lehéricy S, Benali H (2008b)
NEDICA: Detection of group functional networks in fMRI using spatial
independent component analysis. In: IEEE International Symposium on
Biomedical Imaging: From Nano to Macro (ISBI’08), 1247-1250.
Perlbarg V, Marrelec G, Bellec P, Coynel D, Pélégrini-Issac M, Benali H (2009)
NetBrainWork: a toolbox for studying functional interactions in large-scale brain
networks in fMRI. In: Proceedings of the 15th International Conference on
Functional Mapping of the Human Brain, San Francisco, Californie, USA.
Peyrache A, Khamassi M, Benchenane K, Wiener SI, Battaglia FP (2009) Replay of
rule-learning related neural patterns in the prefrontal cortex during sleep. Nat
Neurosci 12(7): 919-926.
Poe EA (1846) Marginalia. Graham's American Monthly Magazine 28(3).
Polyn SM, Natu VS, Cohen JD, Norman KA (2005) Category-specific cortical activity
precedes retrieval during memory search. Science 310(5756): 1963-1966.
194
Puce A, Allison T, McCarthy G (1999) Electrophysiological studies of human face
perception. III: Effects of top-down processing on face-specific potentials. Cereb
Cortex 9(5): 445-458.
Qin YL, McNaughton BL, Skaggs WE, Barnes CA (1997) Memory reprocessing in
corticocortical and hippocampocortical neuronal ensembles. Philos Trans R Soc
Lond B Biol Sci 352(1360): 1525-1533.
Quintilian MF (1st century AD) Book XI. In: Institutio Oratoria, pp 41-44.
Raichle ME (2006) Neuroscience. The brain's dark energy. Science 314(5803): 1249-
1250.
Raichle ME, Mintun MA (2006) Brain work and brain imaging. Annu Rev Neurosci
29: 449-476.
Ramot M, Fisch L, Davidesco I, Harel M, Kipervasser S, Andelman F, Neufeld MY,
Kramer U, Fried I, Malach R (2013) Emergence of sensory patterns during sleep
highlights differential dynamics of REM and non-REM sleep stages. J Neurosci
33(37): 14715-14728.
Rasch B, Born J (2007) Maintaining memories by reactivation. Curr Opin Neurobiol
17(6): 698-703.
Rasch B, Buchel C, Gais S, Born J (2007) Odor cues during slow-wave sleep prompt
declarative memory consolidation. Science 315(5817): 1426-1429.
Rasmussen CE, Williams CKI (2006) Gaussian processes for machine learning. The
MIT Press, London.
Rechtschaffen A, Kales A (1968) A manual of standardized terminology, techniques
and scoring system for sleep stages of human subjects. UCLA Brain Information
Service/Brain Research Institute, Washington DC.
Rechtschaffen A (1994) Sleep onset: conceptual issues. In: Sleep onset: normal and
abnormal processes (Ogilvie RD, Harsh JR, eds). American Psychological
Association, Washington DC.
Revonsuo A (2003) The reinterpretation of dreams: an evolutionary hypothesis of the
function of dreaming. In: Sleep and dreaming: scientific advances and
reconsiderations (Pace-Schott EF, Solms M, Blagrove M, Harnad S, eds), pp 85-
109. University Press, Cambridge.
Ribeiro S, Gervasoni D, Soares ES, Zhou Y, Lin SC, Pantoja J, Lavine M, Nicolelis MA
(2004) Long-lasting novelty-induced neuronal reverberation during slow-wave
sleep in multiple forebrain areas. PLoS Biol 2(1): E24.
Richardson JTE, Mavromatis A, Mindel T, Owens AC (1981) Individual differences in
hypnagogic and hypnopompic imagery. J Mental Imagery 5(2): 91-96.
Roberts RM (1989) Serendipidty, accidental discoveries in science. John Wiley and
Sons, New York.
7. References
195
Roth B (1961) The clinical and theoretical importance of EEG rhythms corresponding
to states of lowered vigilance. Electroencephalogr Clin Neurophysiol 13: 395-399.
Rowley JT, Stickgold R, Hobson JA (1998) Eyelid movements and mental activity at
sleep onset. Conscious Cogn 7(1): 67-84.
Rudoy JD, Voss JL, Westerberg CE, Paller KA (2009) Strengthening individual
memories by reactivating them during sleep. Science 326(5956): 1079.
Ruzzoli M, Marzi CA, Miniussi C (2010) The neural mechanisms of the effects of
transcranial magnetic stimulation on perception. J Neurophysiol 103(6): 2982-
2989.
Saint-Denys Hd (1867) Les rêves et les moyens de les diriger; observations pratiques.
In. Librairie d'Amyot, Paris.
Sartre J-P (1940) L'imaginaire: psychologie-phénoménologique de l'imagination.
Librairie Gallimard, Paris.
Schacter DL (1976) The hypnagogic state: a critical review of the literature. Psychol
Bull 83(3): 452-481.
Schacter DL, Tulving E (1994) Memory systems. MIT Press, Massachusetts Institute
of Technology.
Schrouff J, Kussé C, Wehenkel L, Maquet P, Phillips C (2012) Decoding spontaneous
brain activity from fMRI using gaussian processes: tracking brain reactivation. In:
PRNI, London, doi 10.1109/PRNI.2012.19.
Schrouff J (2013) Pattern recognition in neuroimaging. What can machine learning
based models bring to the analysis of functional brain imaging? Cyclotron
Research Center, University of Liège, Liège, Belgium.
Schrouff* J, Kussé* C, Wehenkel L, Maquet P, Phillips C (2012) Decoding semi-
constrained brain activity from FMRI using support vector machines and
gaussian processes. PLoS One 7(4): e35860.
Schrouff* J, Kussé* C, Wehenkel L, Luxen A, Maquet P, Phillips C (Submitted)
Temporally structured memory replay during resting wakefulness in humans.
Schwartz S, Maquet P (2002) Sleep imaging and the neuro-psychological assessment
of dreams. Trends Cogn Sci 6(1): 23-30.
Scoville WB, Milner B (1957) Loss of recent memory after bilateral hippocampal
lesions. J Neurol Neurosurg Psychiatry 20(1): 11-21.
Shaffii-Le Bourdiec A, Muto V, Mascetti L, Foret A, Matarazzo L, Kussé C, Maquet P
(2010) Contribution of sleep to memory consolidation. Future Neurology 5(2):
325-338.
Sherwood SJ (2002) Relationship between the hypnagogic/hypnopompic states and
reports of anomalous experiences. The journal of parapsychology 66(2).
196
Shinkareva SV, Mason RA, Malave VL, Wang W, Mitchell TM, Just MA (2008) Using
FMRI brain activation to identify cognitive states associated with perception of
tools and dwellings. PLoS One 3(1): e1394.
Siapas AG, Wilson MA (1998) Coordinated interactions between hippocampal
ripples and cortical spindles during slow-wave sleep. Neuron 21(5): 1123-1128.
Siegel RK (1977) Hallucinations. Scientific American 237(4): 132-140.
Silberer H (1909) Bericht ueber eine Methode, gewisse symbolische Halluzinations-
Erscheinungen hervorzurufen und zu beobachten. Jahrbuch für
psychoanalytische Forschungen 1(2): 513-525.
Skaggs WE, McNaughton BL (1996) Replay of neuronal firing sequences in rat
hippocampus during sleep following spatial experience. Science 271(5257): 1870-
1873.
Smith SM, Fox PT, Miller KL, Glahn DC, Fox PM, Mackay CE, Filippini N, Watkins
KE, Toro R, Laird AR, Beckmann CF (2009) Correspondence of the brain's
functional architecture during activation and rest. Proc Natl Acad Sci USA
106(31): 13040-13045.
Smith SM, Miller KL, Salimi-Khorshidi G, Webster M, Beckmann CF, Nichols TE,
Ramsey JD, Woolrich MW (2011) Network modelling methods for FMRI.
Neuroimage 54(2): 875-891.
Spiridon M, Kanwisher N (2002) How distributed is visual category information in
human occipito-temporal cortex? An fMRI study. Neuron 35(6): 1157-1165.
Spiridon M, Fischl B, Kanwisher N (2006) Location and spatial profile of category-
specific regions in human extrastriate cortex. Hum Brain Mapp 27(1): 77-89.
Squire LR, Cohen NJ, Nadel L (1984) The medial temporal region and memory
consolidation: a new hypothesis. In: Memory consolidation (Weingartner G,
Parker E, eds), pp 185-210. Erlbaum, Hillsdale.
Squire LR, Alvarez P (1995) Retrograde amnesia and memory consolidation: a
neurobiological perspective. Curr Opin Neurobiol 5(2): 169-177.
Squire LR, Kandel ER (2000) Memory: from mind to molecules. WH Freeman, New
York.
Staresina BP, Cooper E, Henson RN (2013) Reversible information flow across the
medial temporal lobe: The hippocampus links cortical modules during memory
retrieval. J Neurosci 33(35): 14184-14192.
Steer RA, Ball R, Ranieri WF, Beck AT (1997) Further evidence for the construct
validity of the Beck depression inventory-II with psychiatric outpatients. Psychol
Rep 80(2): 443-446.
Sterpenich V, Albouy G, Boly M, Vandewalle G, Darsaud A, Balteau E, Dang-Vu TT,
Desseilles M, D'Argembeau A, Gais S, Rauchs G, Schabus M, Degueldre C, Luxen

7. References
197
A, Collette F, Maquet P (2007) Sleep-related hippocampo-cortical interplay during
emotional memory recollection. PLoS Biol 5(11): e282.
Stickgold R (1998) Sleep: off-line memory processing. Trends Cogn Sci 2(12): 484-492.
Stickgold R, Malia A, Maguire D, Roddenberry D, O'Connor M (2000) Replaying the
game: hypnagogic images in normals and amnesics. Science 290(5490): 350-353.
Stickgold R, Hobson JA, Emberger KM (2001a) Experimental manipulation of dream
content (Poster nr 849.1). In: Society for Neuroscience. Neuroscience Meeting
Planner, San Diego, CA.
Stickgold R, Hobson JA, Fosse R, Fosse M (2001b) Sleep, learning, and dreams: off-
line memory reprocessing. Science 294(5544): 1052-1057.
Stickgold R, Walker MP (2005) Sleep and memory: the ongoing debate. Sleep 28(10):
1225-1227.
Stoyva J (1973) Biofeedback techniques and the conditions for hallucinatory activity.
In: The psychophysiology of thinking (McGuigan FJ, Schoonover RA, eds).
Academic Press, New York.
Sutherland GR, McNaughton B (2000) Memory trace reactivation in hippocampal
and neocortical neuronal ensembles. Curr Opin Neurobiol 10(2): 180-186.
Suzuki WA, Amaral DG (1994) Perirhinal and parahippocampal cortices of the
macaque monkey: cortical afferents. The Journal of comparative neurology 350(4):
497-533.
Swedenborg E (1746) The word of the Old Testament explained. Academy of the new
church, Bryn Athyn, Pennsylvania.
Symonds CP (1953) Nocturnal myoclonus. J Neurol Neurosurg Psychiatry 16(3): 166-
171.
Tagliazucchi E, Laufs H (2014) Decoding wakefulness levels from typical fMRI
resting-state data reveals reliable drifts between wakefulness and sleep. Neuron
82(3): 695-708.
Takashima A, Petersson KM, Rutters F, Tendolkar I, Jensen O, Zwarts MJ,
McNaughton BL, Fernandez G (2006) Declarative memory consolidation in
humans: a prospective functional magnetic resonance imaging study. Proc Natl
Acad Sci USA 103(3): 756-761.
Tambini A, Ketz N, Davachi L (2010) Enhanced brain correlations during rest are
related to memory for recent experiences. Neuron 65(2): 280-290.
Tambini A, Davachi L (2013) Persistence of hippocampal multivoxel patterns into
postencoding rest is related to memory. Proc Natl Acad Sci USA 110(48): 19591-
19596.
Tarr MJ, Gauthier I (2000) FFA: a flexible fusiform area for subordinate-level visual
processing automatized by expertise. Nat Neurosci 3(8): 764-769.

198
Thorpy MJ (1990) Sleep paralysis. ICSD-international classification of sleep disorders:
diagnostic and coding manual. American Sleep Disorders Association, Rochester,
Minnesota.
Timmons B, Salamy J, Kamiya J, Girton D (1972) Abdominal-thoracic respiratory
movements and levels of arousal. Psychonomic Science 27: 173-175.
Tononi G, Cirelli C (2006) Sleep function and synaptic homeostasis. Sleep Med Rev
10(1): 49-62.
Tsodyks M, Kenet T, Grinvald A, Arieli A (1999) Linking spontaneous activity of
single cortical neurons and the underlying functional architecture. Science
286(5446): 1943-1946.
Vaitl D, Birbaumer N, Gruzelier J, Jamieson GA, Kotchoubey B, Kubler A, Lehmann
D, Miltner WH, Ott U, Putz P, Sammer G, Strauch I, Strehl U, Wackermann J,
Weiss T (2005) Psychobiology of altered states of consciousness. Psychol Bull
131(1): 98-127.
van Dongen EV, Takashima A, Barth M, Zapp J, Schad LR, Paller KA, Fernandez G
(2012) Memory stabilization with targeted reactivation during human slow-wave
sleep. Proc Natl Acad Sci USA 109(26): 10575-10580.
van Kesteren MT, Fernandez G, Norris DG, Hermans EJ (2010) Persistent schema-
dependent hippocampal-neocortical connectivity during memory encoding and
postencoding rest in humans. Proc Natl Acad Sci USA 107(16): 7550-7555.
Vertes RP, Eastman KE (2003) The case against memory consolidation in REM sleep.
In: Sleep and dreaming: scientific advances and reconsiderations (Pace-Schott EF,
Solms M, Blagrove M, Harnad S, eds), pp 75-84. University Press, Cambridge.
Vihvelin H (1948) On the differentiation of some typical forms of hypnagogic
hallucinations. Acta Psychiat Neurologica 23: 359-389.
Vyazovskiy VV, Olcese U, Lazimy YM, Faraguna U, Esser SK, Williams JC, Cirelli C,
Tononi G (2009) Cortical firing and sleep homeostasis. Neuron 63(6): 865-878.
Wagner AD, Schacter DL, Rotte M, Koutstaal W, Maril A, Dale AM, Rosen BR,
Buckner RL (1998) Building memories: remembering and forgetting of verbal
experiences as predicted by brain activity. Science 281(5380): 1188-1191.
Walker MP, Brakefield T, Hobson JA, Stickgold R (2003) Dissociable stages of human
memory consolidation and reconsolidation. Nature 425(6958): 616-620.
Wamsley EJ, Perry K, Djonlagic I, Reaven LB, Stickgold R (2010) Cognitive replay of
visuomotor learning at sleep onset: temporal dynamics and relationship to task
performance. Sleep 33(1): 59-68.
Ward J (1883) Psychology. Encyclopedica Britannica 20: 37-85.
Wertz AT, Ronda JM, Czeisler CA, Wright KP, Jr. (2006) Effects of sleep inertia on
cognition. Journal of the American Medical Association 295(2): 163-164.
7. References
199
West LJ (1962) A general theory of hallucinations and dreams. In: Hallucinations
(West LJ, ed). Grune & Stratton, New York.
Wilson MA, McNaughton BL (1994) Reactivation of hippocampal ensemble
memories during sleep. Science 265(5172): 676-679.
Winkler I, Cowan N (2005) From sensory to long-term memory: evidence from
auditory memory reactivation studies. Experimental psychology 52(1): 3-20.
Zadra AL, Nielsen TA, Donderi DC (1998) Prevalence of auditory, olfactory, and
gustatory experiences in home dreams. Percept Mot Skills 87(3 Pt 1): 819-826.
Zeki S (1990) Parallelism and functional specialization in human visual cortex. Cold
Spring Harbor symposia on quantitative biology 55: 651-661.

200


Copyright © 2022 FDOKUMEN