Amplified Spontaneous Emission and Thermal Management ...
242
HAL Id: tel-00504915 https://pastel.archives-ouvertes.fr/tel-00504915 Submitted on 21 Jul 2010 HAL is a multi-disciplinary open access archive for the deposit and dissemination of sci- entific research documents, whether they are pub- lished or not. The documents may come from teaching and research institutions in France or abroad, or from public or private research centers. L’archive ouverte pluridisciplinaire HAL, est destinée au dépôt et à la diffusion de documents scientifiques de niveau recherche, publiés ou non, émanant des établissements d’enseignement et de recherche français ou étrangers, des laboratoires publics ou privés. Amplified Spontaneous Emission and Thermal Management on a High Average-Power Diode-Pumped Solid-State Laser – The Lucia Laser System Daniel Albach To cite this version: Daniel Albach. Amplified Spontaneous Emission and Thermal Management on a High Average-Power Diode-Pumped Solid-State Laser – The Lucia Laser System. Atomic Physics [physics.atom-ph]. Ecole Polytechnique X, 2010. English. tel-00504915
-
Upload
khangminh22 -
Category
Documents
-
view
0 -
download
0
Transcript of Amplified Spontaneous Emission and Thermal Management ...

HAL Id: tel-00504915https://pastel.archives-ouvertes.fr/tel-00504915
Submitted on 21 Jul 2010
HAL is a multi-disciplinary open accessarchive for the deposit and dissemination of sci-entific research documents, whether they are pub-lished or not. The documents may come fromteaching and research institutions in France orabroad, or from public or private research centers.
L’archive ouverte pluridisciplinaire HAL, estdestinée au dépôt et à la diffusion de documentsscientifiques de niveau recherche, publiés ou non,émanant des établissements d’enseignement et derecherche français ou étrangers, des laboratoirespublics ou privés.
Amplified Spontaneous Emission and ThermalManagement on a High Average-Power Diode-Pumped
Solid-State Laser – The Lucia Laser SystemDaniel Albach
To cite this version:Daniel Albach. Amplified Spontaneous Emission and Thermal Management on a High Average-PowerDiode-Pumped Solid-State Laser – The Lucia Laser System. Atomic Physics [physics.atom-ph]. EcolePolytechnique X, 2010. English. tel-00504915

THÈSE
pour obtenir le grade de DOCTEUR de l’ÉCOLE POLYTECHNIQUE
Spécialité : Physique
présentée par Daniel ALBACH
Titre de la thèse :
Amplified Spontaneous Emission and Thermal M anagement on a H igh Average-Power Diode-Pumped Solid-State Laser
The Lucia Laser System
soutenue le 28 Avril 2010 devant le jury composé de :
MM. A. BAYRAMIAN J.-C. CHANTELOUP J. HEIN J. KAWANAKA Y. LUTZ Rapporteur R. MONCORGÉ Rapporteur E. ROSENCHER Président du jury C. SAUTERET Directeur de thèse


Acknowledgments
At this point I would like to take the opportunity to thank all the persons involvedin this thesis work throughout the almost four magnificent years, which are nowbehind me. It was an exceptional experience and I’m very grateful to have had sucha possibility to join the LULI.
This thesis would have not been possible without the help of Mathias SIEBOLDwho introduced me to the Lucia project after I finished my diploma thesis at Jena.I’m especially thankful for the intense and fruitful exchange with Mathias within thelast years concerning various smaller and larger problems and discussions, especiallyamplifier and oscillator architecture.
The work described in this thesis was performed in collaboration between the LULIand the ISL. At this point I would like to express gratitude to the director of theLULI Francois AMIRANOFF and the responsible persons at the ISL, especiallyAntoine HIRTH and Yves LUTZ for the kind introduction at the LULI and ISL.
I wish to express special thanks to the head of the Lucia team, Jean-ChristopheCHANTELOUP, who always gave the necessary confidence and support neededto accomplish this work and kindly introduced me to the group. Many personaloccasions and fruitful discussions gave the impulse to find the right track for thiswork as well some distraction, when work seemed to be completely overloaded.
Special esteem goes to Christian SAUTERET, who superbly found the right wordsto further amplify my efforts to understand the physical problems and opened mymind for alternative approaches. He gave a great backup as a very good teacher andI am happy to have had the chance to be his last PhD student.
The Lucia team gave always the possibilities for intense and interesting discussionsand I would like to thank at this point all the current and former members ofthe team, in particular: Gilbert BOURDET, Philippe HOLLANDER, Antonio LU-CIANETTI, Mikayel ARZANKANTSYAN, Thierry NOVO, Pascal PIATTI, Fran-cois ASSEMAT, Stephanie LeMOAL and especially Sofiane BAHBAH.
I am pleased to thank one particular team–member, Bernard VINCENT and hisfamily. Without their support many things would have been much more difficult(and less funny). I would like to thank especially his wife Brigitte for introducingme to French cuisine, the French poetry and chansons as well as the many specialwords and expressions otherwise hidden to me. I am especially grateful to be suchdeeply integrated into the family, which gave me a special support during the yearspassed.
Especially for the introduction to ASE and thermal problems I would like to expressmy gratitude to Geoffroy Le TOUZÉ, in particular for the major help concerningthe simulation of the wavefront deformation.
I would like to thank Emmanuel ROSENCHER as the president of my PhD thesiscommittee as well as Yves LUTZ and Richard MONCORGÉ who took the positionand the work as reviewers. My gratitude goes in the same manner to AndrewBAYRAMIAN, Joachim HEIN, Junji KAWANKA and Christian SAUTERET fortheir participation as committee members.
For their collaboration as industrial partners a special thanks is attributed to HubertÄHLING and Jürgen ORTMANN at AMTRON, Jörg NEUKUM, Sandra AHLERT,Roland VENOHR and Timo MATTERN at DILAS for their swift solutions forvarious technical problems as well as the industrial part of the construction ofthe Lucia laser system. Thanks to Narine ANANYAN and the many workers atLASERAYIN TEKHNIKA for the necessary laser crystals, especially in this sizeand quality.
The very good ambiance and the kind reception at the LULI made it possible forme to work on this thesis and I would like to express my thanks to all the membersof the LULI I met within the recent years. Their steady help for smaller and largerproblems and the integration into the collective gave a lot of confidence to me.
I’m thankful for the support of my family – from the beginning of my study atJena until the very end. Without their support this whole voyage would have beenimpossible.

Contents
Introduction 1
1. Delivering High Energy at High Repetition Rate: A Different Paradigm 51.1. The way to the Laser . . . . . . . . . . . . . . . . . . . . . . . . . . . 51.2. Laser classification . . . . . . . . . . . . . . . . . . . . . . . . . . . . 7
1.2.1. 3–Level, Quasi–3–Level and 4–Level–Lasers . . . . . . . . . . . 71.2.2. Laser gain media . . . . . . . . . . . . . . . . . . . . . . . . . 91.2.3. Semiconductor Lasers . . . . . . . . . . . . . . . . . . . . . . . 14
1.3. Efficiency considerations . . . . . . . . . . . . . . . . . . . . . . . . . 161.4. Energy storage . . . . . . . . . . . . . . . . . . . . . . . . . . . . . . 18
1.4.1. Energy storage and extraction . . . . . . . . . . . . . . . . . . 181.4.2. Thermal constraints for energy storage . . . . . . . . . . . . . 24
1.5. Power and Intensity Limitations . . . . . . . . . . . . . . . . . . . . . 261.6. Overcoming the limitations – Gain medium selection for DPSSL . . . 291.7. Repetition-rate applications . . . . . . . . . . . . . . . . . . . . . . . 36
1.7.1. DPSSL and (OP)CPA . . . . . . . . . . . . . . . . . . . . . . 361.7.2. Laser Fusion . . . . . . . . . . . . . . . . . . . . . . . . . . . . 381.7.3. State of the Art . . . . . . . . . . . . . . . . . . . . . . . . . . 41
2. The Lucia Laser System 452.1. Overview . . . . . . . . . . . . . . . . . . . . . . . . . . . . . . . . . . 452.2. Oscillator . . . . . . . . . . . . . . . . . . . . . . . . . . . . . . . . . 462.3. Preamplification Stage . . . . . . . . . . . . . . . . . . . . . . . . . . 522.4. Beam Shaping . . . . . . . . . . . . . . . . . . . . . . . . . . . . . . . 572.5. Main Amplifier . . . . . . . . . . . . . . . . . . . . . . . . . . . . . . 65
2.5.1. Laser Diode Array . . . . . . . . . . . . . . . . . . . . . . . . 652.5.2. Light Concentration System (LCS) . . . . . . . . . . . . . . . 672.5.3. Laser head . . . . . . . . . . . . . . . . . . . . . . . . . . . . . 75
i

Contents
3. Amplified Spontaneous Emission Management 793.1. Motivation . . . . . . . . . . . . . . . . . . . . . . . . . . . . . . . . . 793.2. Introduction . . . . . . . . . . . . . . . . . . . . . . . . . . . . . . . . 79
3.2.1. ASE flux estimation in the one–dimensional, monochromaticcase . . . . . . . . . . . . . . . . . . . . . . . . . . . . . . . . 80
3.2.2. ASE intensity contrast at the end of a laser chain . . . . . . . 813.2.3. ASE flux estimations in Two and Three Dimensions . . . . . . 833.2.4. Life time modifier MASE . . . . . . . . . . . . . . . . . . . . . 84
3.3. Numerical Simulation of ASE . . . . . . . . . . . . . . . . . . . . . . 853.3.1. ASE Simulation in 2D . . . . . . . . . . . . . . . . . . . . . . 863.3.2. ASE Simulation in quasi–3D . . . . . . . . . . . . . . . . . . . 893.3.3. ASE in three dimensions . . . . . . . . . . . . . . . . . . . . . 92
3.4. Experimental Benchmark . . . . . . . . . . . . . . . . . . . . . . . . . 933.5. Parasitic oscillations . . . . . . . . . . . . . . . . . . . . . . . . . . . 1023.6. Application on the Lucia Amplifier . . . . . . . . . . . . . . . . . . . 1103.7. Conclusion . . . . . . . . . . . . . . . . . . . . . . . . . . . . . . . . . 119
4. Thermal Management 1214.1. Motivation . . . . . . . . . . . . . . . . . . . . . . . . . . . . . . . . . 1214.2. Introduction . . . . . . . . . . . . . . . . . . . . . . . . . . . . . . . . 121
4.2.1. Heat generation . . . . . . . . . . . . . . . . . . . . . . . . . . 1214.2.2. Thermal conductivity . . . . . . . . . . . . . . . . . . . . . . . 1234.2.3. Heat transport . . . . . . . . . . . . . . . . . . . . . . . . . . 1264.2.4. Radial temperature distribution . . . . . . . . . . . . . . . . . 130
4.3. Estimation of the Lucia laser head cooling capacity . . . . . . . . . . 1334.4. Thermally induced wavefront deformation . . . . . . . . . . . . . . . 140
4.4.1. Basic Model . . . . . . . . . . . . . . . . . . . . . . . . . . . . 1424.4.2. Thermal performance of the laser head . . . . . . . . . . . . . 1444.4.3. Numerical estimation of the gain medium deformation . . . . 152
4.5. Thermally induced depolarization . . . . . . . . . . . . . . . . . . . . 1574.5.1. Stress induced birefringence . . . . . . . . . . . . . . . . . . . 1574.5.2. Intrinsic birefringence . . . . . . . . . . . . . . . . . . . . . . . 1614.5.3. Thermally introduced birefringence on the Lucia laser head . . 163
4.6. Conclusion . . . . . . . . . . . . . . . . . . . . . . . . . . . . . . . . . 168
ii

ASE and Thermal Management on a High Average-Power DPSSL
5. Lucia Amplifier Performance 1715.1. Motivation . . . . . . . . . . . . . . . . . . . . . . . . . . . . . . . . . 1715.2. Lucia amplifier performance estimation . . . . . . . . . . . . . . . . . 1715.3. Energy extraction . . . . . . . . . . . . . . . . . . . . . . . . . . . . . 1765.4. Perspectives . . . . . . . . . . . . . . . . . . . . . . . . . . . . . . . . 183
5.4.1. Static Astigmatism Correction . . . . . . . . . . . . . . . . . . 1835.4.2. Doping variation along the pump axis . . . . . . . . . . . . . . 1855.4.3. Ceramic laser gain media . . . . . . . . . . . . . . . . . . . . . 188
6. Conclusion 191
A. Annex 195A.1. Variable Doping Distribution . . . . . . . . . . . . . . . . . . . . . . . 195
A.1.1. Pump ↔ Excitation Relationship . . . . . . . . . . . . . . . . 195A.1.2. Doping distribution in transmission case . . . . . . . . . . . . 196A.1.3. Gain profile for internal reflection . . . . . . . . . . . . . . . . 197
A.2. Linfords Formula . . . . . . . . . . . . . . . . . . . . . . . . . . . . . 200A.3. The Quasi–Three–Level–System Yb3+:YAG . . . . . . . . . . . . . . 203
B. Tables 205
List of Figures 205
List of Tables 211
Bibliography 213
iii

Abbreviations
Abbreviations
AR – Anti–ReflectionARL – Aspect RatioASE – Amplified Spontaneous EmissionBC – Boundary Condition
CCD – Charge Coupled DeviceCPA – Chirped Pulse Amplificationcw – continuous waveDP – Delaunay Prism
DPL – Diode–Pumped LaserDPSSL – Diode–Pumped Solid–State Laser
FAC – Fast Axis CollimatorFD – Finite Difference
FWHM – Full Width Half MaximumHR – High–ReflectionJP – Jet–Plate
LCS – Light Concentration SystemLDA – Laser Diode ArrayLIDT – Laser Induced Damage ThresholdLOI – Line Of InterestOPA – Optical Parametric Amplification
OPCPA – Optical Parametric Chirped Pulse AmplificationPC – Pockels Cellqcw – quasi–continuous waveSAC – Slow Axis CollimatorTFP – Thin Film PolarizerTIR – Total Internal Reflection
VCSEL – Vertical–Cavity Surface–Emitting Laser
iv

ASE and Thermal Management on a High Average-Power DPSSL
List of Symbols
α, αT – absorption coefficient [m−1], expansion coefficient [K−1]
a – distance, length [m]
a0 – maximum of the normalized vector potential of the laser pulse [W−1/2]
A – surface [m2]
Aij – Einsteins coefficients for spontaneous emission [s−1]
β – relative excitation value [1]
B, B – B–Integral [rad], dielectric impermeability tensor [1]c, cP – speed of light [m s−1], heat capacity [J m−3 K−1]
cd, cn – doping concentration [at.%], distance of jet–plate holes [m]
Cbunch – electron bunch charge [C]
∅ – pinhole diameter [m]
d, D – length [m], thickness [m]
δ, ∆δ – optical path [m], phase shift [1]
e – Euler number [1]
ε, ε – interatomic distance increase [1], dielectric tensor [1]E, E, E – energy [J], elastic modulus [Pa], electric field amplitude [V m−1]
Φ – photon density [m−3]
fi, f – thermal population of an energy level [1], focal length [m]
F – energy density [J m−2]
γ – scaling factor [1]
g, g0 – amplification factor [cm−1], small–signal gain [cm−1]
gij(ν), g(ν) – line–shape function [s]
G – energetic gain [1]
η, ηh – efficiency [1], heating parameter [1]
ϑ, θ Θ – angle []
ΘD – Debye temperature [K]
h – Planck constant [J s]
h – heat exchange coefficient [W m−2 K−1]
H – height [m]
I – intensity [W m−2]
k – heat conductivity [W m−1 K−1]
kB – Boltzmann constant [J K−1]
Kc – fracture toughness [Pa m1/2]
κ – geometry dependent scaling parameter [1]
λ, ∆λ – wavelength [m], bandwidth [m]
v

List of Symbols
L – characteristic length [m]
Λ – multiplier of the diffraction limit [1]
MASE – life time modifier [1]
M – molar mass [kg mol−1]
µ – reduced mass [kg mol−1]
ν, ∆ν, νp – frequency [s−1], bandwidth [s−1], Poisson ratio [1]n0, n2 – index of refraction [1], non–linear index of refraction [m2 W−1]
n, ∆n – population density [m−3], population density difference [m−3]
N – number [1]
Nu, Pr, Re – Nusselt number [1], Prandtl number [1], Reynolds number [1]Ω – solid angle [srad]
ω – pump rate [s−1]
π – Archimedes constant [1]
πijkl – piezo–optical coefficients [1]
P – power [W s−1]
ψ, ϕ, ς – angle []
r – radius [m]
RS – thermal shock parameter [W m−1]
R – reflectivity [1], radius [m]
ρ – density [kg m−3]
σ, σ – cross section [cm2], stress [Pa]
t – time [s]
T , ∆T – temperature [K], temperature difference [K]
τ – life time [s]
V – volume [m3]
w – beam diameter [m]
x, y, z – coordinates [m]
zijk – electro–optical coefficients [1]
cr, crit – related to critical values
beam, SF – related to beam parameter, beam self–focusing
∆T , RS – related to temperature difference, thermal shock parameter
tot – related to total amount
min, max – related to minimum value, maximum value
i,j,k,l – related to index
st, sp, ASE – related to stimulated, spontaneous, ASE emission
R, Θ – related to radial variable, tangential variable
vi

Introduction
Fifty years ago, an outstanding invention was about to revolutionize our daily life– the laser (light amplification by stimulated emission of radiation). It is oneof the acronyms associated with the dawn of the technological era in the 20thcentury. Ranging from the extent of a grain of salt to the size of several footballfields, and covering the electromagnetic spectrum from X-rays to the Far-Infrared,this invention gave birth to a complete new world of scientific development andapplications.
The first successful realization of the predictions made by Schawlow and Townesin 1958 resulted in the ruby laser in 1960 by Maiman. Like most inventions, thelaser was considered as a ‘device waiting for a job’ in the beginning.
Today, many parts of our daily life are in direct contact with lasers or laser–processed products. Applications range from cutting and welding materials forcars, airplanes and ships down to nanometer scale lithography for microelectronics.Besides industrial applications, these light sources are used for medical treatmentand help to understand fundamental physical laws.
Laser–plasma interaction is currently one of the most fruitful fields in scientificresearch. Probably the most spectacular application of a laser system would be thefulfillment of a long time dream: the exploitation of the stellar energy productionunder controlled conditions.
The next decades will see the generation of energy by thermonuclear fusion. Whethera future power plant will rely on magnetic fusion or inertial (laser) fusion is not yetclear. But from this demonstration to a full–scale, efficient power plant, still manytechnological steps are required and a wide field of physics has to be explored.Intense research in plasma physics and laser development is therefore necessary.
The main french national civil pole in research activities on warm and denseplasma physics is the Laboratoire pour l’Utilisation des Laser Intenses (LULI). It isa joint research unit and is supported by the Centre National de la Recherche Sci-entifique (CNRS), the Commissariat à l’Energie Atomique, the Ecole Polytechniqueand the Université Paris VI.
1

Introduction
Operating state–of–the–art laser technology has always been a necessity for theLULI to fulfill its mission of exploring forefront plasma physics. LULI launched theprogram Lucia in the early 2000’s. This program is a scientific project dedicatedto the exploration of an emerging laser physics field: the so-called Diode–PumpedSolid–State Laser (DPSSL). At the turn of the millennium, a conjunction of twomajors breakthrough in laser technology triggered the rise of high average–powerDPSSL.
Firstly, performances and costs of diode lasers became compatible with laserprograms at a laboratory scale. Secondly, transparent laser-grade quality ceramicsreached maturity. Together they give credibility to Mega–Joule scale, high average–power laser programs like HiPER (High Power laser Energy Research).
Lucia, together with Mercury (LLNL, USA), Halna (ILE, Japan) and Polaris (FSUJena, Germany), is among the handful of DPSSL laser programs currently workingthroughout the world.
The first three of the mentioned programs aim at a similar point of operationwhich is around 100 joules in the near infrared with a repetition rate of 10 hertzfor ∼ 10 nanoseconds long pulses. Such an energetic goal can be regarded asrelatively modest, compared to thousand times higher requirements for an inertialfusion power plant working with hundreds of kilojoules. Depending on the finallyselected architecture to efficiently couple that energy into a nuclear fuel pellet, theindividual beam energy requirement might be in the order of a few kilojoules. TheLucia final energetic goal should then be considered as a 1/10 scale unit.
Lucia is mainly funded by the local administrative body Région Ile-de-Franceand the Ministère de la Recherche et de l’Enseignement Supérieur. CNRS, EcolePolytechnique and Délégation Générale à l’Armement are also among key supportingpartners. The thesis work described in this document was funded by the InstitutFranco–Allemand de Recherches de Saint-Louis (ISL), a bi-national scientific insti-tution established by the Federal Republic of Germany and the French Republic.
When building a laser like Lucia, aiming at average powers in the kilowatt regimewith pulses of tens of Joules, key aspects to be addressed are optical elements inte-gration management, Amplified Spontaneous Emission (ASE) and thermal effects.
The first point was extensively explored in a first phase of the Lucia program(2003–2006). It took advantage of research performed within the Laser Mega Jouleprogram in the field of Laser Induced Damage Threshold of optical elements anddielectric coatings.
2

ASE and Thermal Management on a High Average-Power DPSSL
The work performed within the context of this thesis focuses on ASE and thermalmanagement. It takes place within an energetic milestone fixed at 10 joules and arepetition rate of 2 hertz. This document is therefore structured around the followingfive chapters:
Chapter 1, entitled “Delivering High Energy at High Repetition Rate: A DifferentParadigm” introduces the basic principles underlying this research work. In con-junction with the fiftieth anniversary of the invention of the laser, a short historicalintroduction opens the chapter. The following sections depict the general contextand identify the main obstacles for high average–power laser systems. Solutions areindicated as well as applications for rep–rated laser systems. The relevant obstaclesand their solutions are then discussed in more detail in following chapters.
Chapter 2, entitled “The Lucia Laser System” describes all five stages of the Lucialaser. Of special interest is the Lucia main amplifier, as this stage of the laser chainis extensively studied in the following chapters.
Chapter 3, entitled “Amplified Spontaneous Emission Management” describesa comprehensive theoretical and experimental study of ASE. Starting from one–dimensional models, the complexity is further increased up to a three dimensionalmodel. This model is benchmarked to an extensive experimental study of ASEcontrol solutions explored in the laboratory.
Chapter 4, entitled “Thermal Management” analyses the heat generation and heattransport in the context of the Lucia main amplifier stage. It demonstrates thecapability of the developed laser head cooling approach to perform a satisfyingthermal management by the presentation of experimental results of wavefront andbirefringence measurements. Further, it introduces a simplified one–dimensionalmodel of gain medium deformation which is benchmarked against a fully three–dimensional analysis of the laser gain medium.
Chapter 5 entitled “Lucia Amplifier Performance” explores the energetic potentialof the Lucia main amplifier. An experimental campaign aiming on energy extractionshowed the performance and limitation of the current amplifier setup. Solutions fora further improvement is given as well as perspectives.
Finally, a conclusion closes this thesis, proposing a scaling approach for higheraverage–power DPSSL extraction designs.
3


1. Delivering High Energy at HighRepetition Rate: A DifferentParadigm
The aim of this chapter is to introduce the basic principles underlying the researchwork depicted in this thesis, setting up its general context. Most of the pointsaddressed here are discussed more in detail in the following chapters.
After a brief historical overview, a discussion of the laser gain medium typesfollows. Then, fundamental efficiency considerations are discussed in a general viewas well as problems arising from energy storage, peak power and intensity limitations.How Diode–Pumped Solid–State Lasers (DPSSL) might overcome these issues willthereby be discussed briefly. A short review for possible applications is given, as wellas a presentation of state of the art DPSSL programs currently explored throughoutthe world. A conclusion summarizes this chapter.
1.1. The way to the Laser
In the year 1900, Max Planck (1858–1947) introduced the idea of an energy quantumin his famous ’Strahlungsgesetz’ (law of radiation) with the use of the, at that timeunpopular, theory introduced by Ludwig Boltzmann (1844–1906). Within the timeof the birth of the quantum–theory, Albert Einstein (1879–1955) postulated in 1916the existence of a ’reverse process of absorption’ [1]1.The proof of such a stimulated emission has been shown on Neon in 1928 by Hans
Kopfermann (1895–1963) and Rudolf Ladenburg (1882–1952) [2]. In the meantimeGilbert N. Lewis (1875–1946) created the word ’photon’ in 1926 [3]. The idea tobuild an optical generator based on stimulated emission was proposed by ValentinA. Fabrikant (1907–1991) in his PhD–thesis in 1940. He basically offered to use a gasdischarge to produce a significant higher population in the excited state comparedto the Boltzmann–distribution. He supposed that the energy would be transferedby collisions of the second kind. More than twenty years later this technique wasused in the first gas lasers. However, neither his doctorate work in 1940 nor his
1First publication in ’Mitteilungen der Physikalischen Gesellschaft Zürich. Nr. 18, 1916’
5

1. Delivering High Energy at High Repetition Rate: A Different Paradigm
soviet patent issued in 19512 could be considered to be known to the internationalscientific community, as it was de facto unknown even to the soviet researchers.Another important step towards the laser was the observation and understanding ofthe ’optical pumping’ between the discrete atomic energy levels3 by Alfred Kastler(1902–1984) in 1950 [4].
Without paying attention to it, Felix Bloch (1905–1983) found the experimentalproof of the inversion of population, while working on nuclear resonances in 1946and shortly after this, Edward M. Purcell (1912–1997) and his co–worker RobertV. Pound (1919–) introduced the concept of a ’negative temperature’ explainingtheir experimental results [5]. A population inversion can be interpreted as such a’negative temperature’, as the probability of a population in a higher energy state istherefore higher compared to the population probability in the lower energy state.No attention was paid at that time, that in connection with a microwave cavity orwaveguide, coherent amplification by stimulated emission might have been achieved.Such a device was proposed by Weber (1919–2000) in 19524, however, he was moreinterested in an amplifier than in an oscillator and therefore didn’t discuss the impactof a feedback.
Shortly after that, Charles H. Townes (1915–) and his co–workers successfullydemonstrated the first MASER (Microwave Amplification by Stimulated Emission ofRadiation) in 1954 [6]. Simultaneously and independently Nikolai G. Basov (1922–2001) and Alexander M. Prokhorov (1911–2002) demonstrated the Maser in theSoviet Union. The extension from the microwaves to the infrared and to the opticalregion was proposed by C. H. Townes together with Arthur L. Schawlow (1921–1999)in December 1958 [7].
Gordon Gould (1920–2005) encountered Townes at the Columbia University andwhile he was working on his PhD–thesis wrote in a notebook for the first time anew acronym – LASER (Light Amplification by Stimulated Emission of Radiation).While Gould held his ideas secret, not to spoil possible patents, the theoretical paperfrom Schawlow and Townes started a world-wide race for the first ’optical maser’.Finally on May 16, 1960, Theodore H. Maiman (1927–2007) built the first workinglaser – the ruby laser [8].
2The title of the patent was ’A method for the amplification of electromagnetic radiation(ultraviolet, visible, infrared and radio waves) characterized by the fact that the amplifiedradiation is made to pass through a medium that by means of auxiliary radiation or by othermeans generates an excess concentration with respect to the equilibrium concentration of atoms,other particles, or systems at upper energy levels corresponding to excited states’
3These discrete atomic energy levels were found in 1913–14 by James Franck (1882-1964) andGustav Hertz (1887–1975).
4Electron Tube Research Conference, Ottawa
6

ASE and Thermal Management on a High Average-Power DPSSL
1.2. Laser classification
The acronym laser describes the physical mechanism behind the representation asa machine. We get amplification through stimulated emission of photons with thesame energy and the same polarization as the incident photons. This gives thestriking features of the laser beam. However, the acronym does not explicitly referto the most important class of lasers, the oscillator. In fact every laser system startswith an oscillator and may posses several amplifiers afterwards, helping to furtheramplify the energy output initially generated.
The very basic principle allowing amplification is the preparation of populationinversion. As it can be shown, in a simple two-level system such an inversioncannot be achieved directly. For the sake of clarity, let us consider the most simplerepresentations of energy level systems – the three–level–laser and the four–level–laser. The first laser, the ruby–laser, was a three–level–laser and, as we will see, hadto be pumped quite hard to achieve a positive gain for the circulating photons. Aspecial type of lasers can be operated without population inversion [9], however itis a very special case and will not be discussed in the context of this thesis and willbe excluded from the following discussions.
1.2.1. 3–Level, Quasi–3–Level and 4–Level–Lasers
Pumping real laser materials usually involves a complicated energy level system,making modeling rather complex. Simplified models on the other side give a rea-sonably good understanding of the basic relationships and general behaviors of suchsystems.
Laser emission can only be achieved if the upper laser level exhibits a higherpopulation density than the terminal laser level – an inversion is then created.Classically two different laser models are discussed - the three–level laser and thefour–level laser. Simplified examples of these schemes are shown in Figure 1.1. Inthis short explanation we neglect all cross relaxations and the interaction with energylevels outside the described ones and approximate the energy bands to be discreteenergy levels.
Four–level system If the energy levels for the pump and the laser emission areenergetically sufficiently separated, one speaks of a four–level system. Ions in thelower pump level (referred as |0〉 in Figure 1.1) are excited into the energetic higherpump level |3〉 with a pump rate wP . Between the upper pump level |3〉 andthe upper laser level |2〉 occurs an energy transfer which might be radiative or
7
1. Delivering High Energy at High Repetition Rate: A Different Paradigm
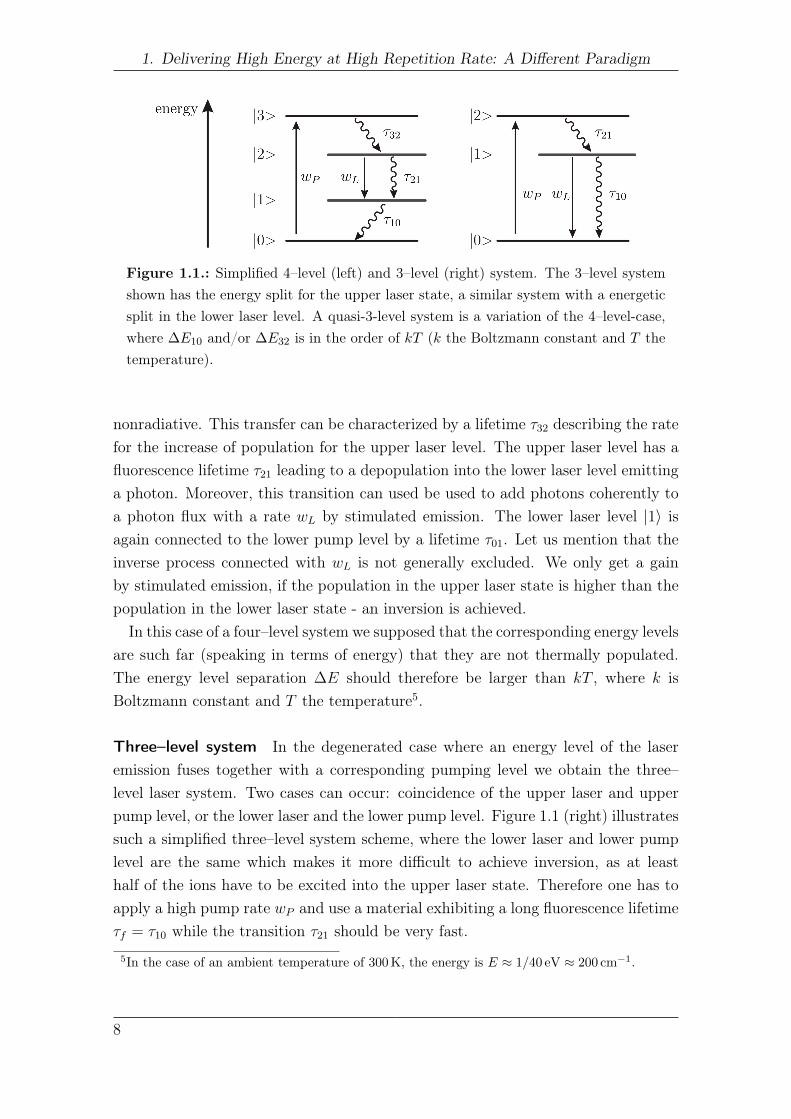
Figure 1.1.: Simplified 4–level (left) and 3–level (right) system. The 3–level systemshown has the energy split for the upper laser state, a similar system with a energeticsplit in the lower laser level. A quasi-3-level system is a variation of the 4–level-case,where ∆E10 and/or ∆E32 is in the order of kT (k the Boltzmann constant and T thetemperature).
nonradiative. This transfer can be characterized by a lifetime τ32 describing the ratefor the increase of population for the upper laser level. The upper laser level has afluorescence lifetime τ21 leading to a depopulation into the lower laser level emittinga photon. Moreover, this transition can used be used to add photons coherently toa photon flux with a rate wL by stimulated emission. The lower laser level |1〉 isagain connected to the lower pump level by a lifetime τ01. Let us mention that theinverse process connected with wL is not generally excluded. We only get a gainby stimulated emission, if the population in the upper laser state is higher than thepopulation in the lower laser state - an inversion is achieved.
In this case of a four–level system we supposed that the corresponding energy levelsare such far (speaking in terms of energy) that they are not thermally populated.The energy level separation ∆E should therefore be larger than kT , where k isBoltzmann constant and T the temperature5.
Three–level system In the degenerated case where an energy level of the laseremission fuses together with a corresponding pumping level we obtain the three–level laser system. Two cases can occur: coincidence of the upper laser and upperpump level, or the lower laser and the lower pump level. Figure 1.1 (right) illustratessuch a simplified three–level system scheme, where the lower laser and lower pumplevel are the same which makes it more difficult to achieve inversion, as at leasthalf of the ions have to be excited into the upper laser state. Therefore one has toapply a high pump rate wP and use a material exhibiting a long fluorescence lifetimeτf = τ10 while the transition τ21 should be very fast.
5In the case of an ambient temperature of 300 K, the energy is E ≈ 1/40 eV ≈ 200 cm−1.
8

ASE and Thermal Management on a High Average-Power DPSSL
Quasi–three–level system An intermediate case also exists, where the energeticseparation ∆E between the laser and pump level are in the order of ≈ kT . In thiscase both levels are significantly influenced by the Boltzmann statistics. Despitethis scheme is more similar to the four–level case, it is often called quasi–three–levelsystem with respect of the population of the laser level. Consequently the laserperformance depends on the temperature of the laser gain medium in this case.
1.2.2. Laser gain media
Taking a closer look on the transition from the upper laser state i to the lower laserstate j, one defines the stimulated emission cross section σij with the lifetime τijand the line shape function gij(ν) for a given frequency ν as [10]:
σij(ν) =c2
8π ν2
gij(ν)
τij(1.2.1)
Equation 1.2.1 gives the fundamental connection between the main parameters foreach given gain material. The physical representation of this gain medium dependson the application and envisaged properties. Indeed, every kind of existing state ofmatter can be used to build a laser. An extensive collection can be found in [11].A very natural classification of the laser gain media is the physical state of the gainmedium, which might be gaseous, liquid or solid. We will discuss briefly the mainthree classes – gas, liquids (dyes) and solid state laser gain media in the following.
It should be mentioned, that in the X–ray domain, plasma lasers exist as well asFELs (Free Electron Lasers). They are not discussed here.
1.2.2.1. Gas Lasers
A very intuitive laser gain medium is gas. The main advantage of gas is that itautomatically adapts its volume to its host cavity. It can flow through the laserdevice and can be very quickly refreshed as well. Also it might transport a highamount of heat out of the device. A very low density of gas can generate very stablelaser sources with well defined spectral properties. The output spectrum can beshifted by the use of isotopes, e.g. in the case of a hydrogen/deuterium fluoridechemical laser, where the output is shifted from 2.7 µm to about 3.8 µm. [12]
The lifetime of the excited state is usually in the order of 10−9 − 10−7 s, butcan span up to seconds for specific types of lasers. The spectral line width isusually rather small compared to other laser types (see Table 1.1) and dominatedby broadening mechanisms as collision and Doppler broadening. Gaseous laser gainmedia show emission line widths in the MHz to the GHz–range, which implies in
9
1. Delivering High Energy at High Repetition Rate: A Different Paradigm
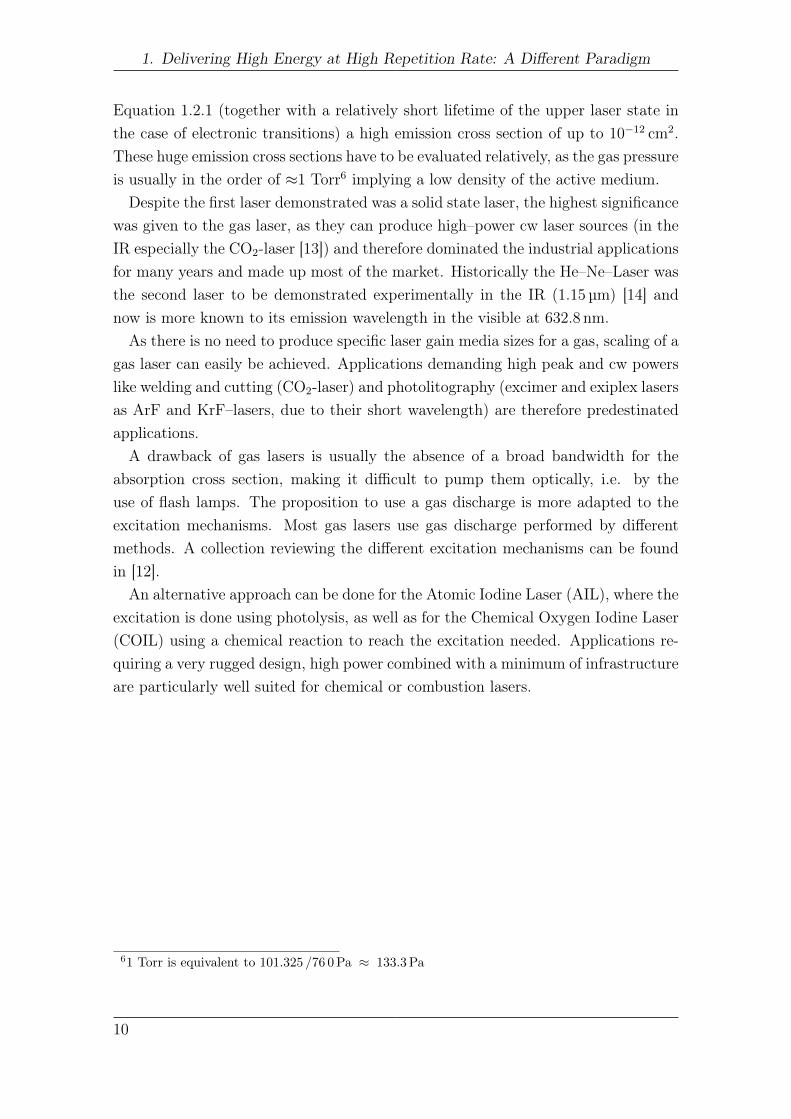
Equation 1.2.1 (together with a relatively short lifetime of the upper laser state inthe case of electronic transitions) a high emission cross section of up to 10−12 cm2.These huge emission cross sections have to be evaluated relatively, as the gas pressureis usually in the order of ≈1 Torr6 implying a low density of the active medium.Despite the first laser demonstrated was a solid state laser, the highest significance
was given to the gas laser, as they can produce high–power cw laser sources (in theIR especially the CO2-laser [13]) and therefore dominated the industrial applicationsfor many years and made up most of the market. Historically the He–Ne–Laser wasthe second laser to be demonstrated experimentally in the IR (1.15 µm) [14] andnow is more known to its emission wavelength in the visible at 632.8 nm.
As there is no need to produce specific laser gain media sizes for a gas, scaling of agas laser can easily be achieved. Applications demanding high peak and cw powerslike welding and cutting (CO2-laser) and photolitography (excimer and exiplex lasersas ArF and KrF–lasers, due to their short wavelength) are therefore predestinatedapplications.
A drawback of gas lasers is usually the absence of a broad bandwidth for theabsorption cross section, making it difficult to pump them optically, i.e. by theuse of flash lamps. The proposition to use a gas discharge is more adapted to theexcitation mechanisms. Most gas lasers use gas discharge performed by differentmethods. A collection reviewing the different excitation mechanisms can be foundin [12].
An alternative approach can be done for the Atomic Iodine Laser (AIL), where theexcitation is done using photolysis, as well as for the Chemical Oxygen Iodine Laser(COIL) using a chemical reaction to reach the excitation needed. Applications re-quiring a very rugged design, high power combined with a minimum of infrastructureare particularly well suited for chemical or combustion lasers.
61 Torr is equivalent to 101.325 /76 0 Pa ≈ 133.3 Pa
10

ASE and Thermal Management on a High Average-Power DPSSL
1.2.2.2. Dye Lasers
After the invention of the laser, the question arose if there was any possibility fora widely tunable laser source. Such a laser relies on an organic dye (usually in aliquid phase) as the gain medium. Dye lasers were first reported by Sorokin andLankard in 1966 [15] and almost simultaneously by Schäfer [16]. Dyes exhibit broadabsorption and emission cross sections and are consequently gain media of choicefor lasers requiring broad wavelength tunability or for ultra–short pulse generation[17]. Organic dye lasers were the first tunable lasers covering a large spectral rangefrom the near–infrared to the ultraviolet [17].
The lifetime of the upper laser state is usually in the order of a few nanosecondsand the emission spectrum is broad, resulting in a emission cross section, not aslarge as for gas lasers7, but typically much larger compared to solid state lasergain media (see Table 1.1). Most laser dyes are pumped using relatively shortpump wavelengths, such as Argon–ion (Ar+) laser, excimer lasers or frequency–double/tripled/quadrupled solid state lasers, reducing greatly the efficiency of thistype of laser material. Certain laser dyes can be pumped with flash lamps or laserdiodes.
With its large emission cross section (see e.g. Table 1.1) becomes the small–signalgain (the definition of the small–signal gain is given Section 1.4) fairly high (up to103 cm−1). A frequently used geometry is a dye–jet running trough the focus of anintracavity laser beam (pump beam diameter in the order of ≈ 10 µm). For largevolumes, flash lamp pumping might be considered.
Dye lasers suffer from certain disadvantages. Most notably, solvents and dyes areoften toxic or carcinogen. A solvent frequently used is DMSO (dimethylsulfoxide),which greatly accelerates the transport of laser dyes into the skin, making thehandling of these liquids even more problematic. Another practical problem is thetrapping of the molecule in the triplet state. By this, a quenching agent mightbe added and the dye exchanged into a reservoir. Due to these drawbacks, mostof the dye–lasers are nowadays replaced by solid–state lasers, except when certainwavelengths are demanded, which are difficult to achieve otherwise.
Recent progress in the field of dye lasers tend to use more solid–state–like mate-rials, where organic laser dyes are incorporated into plastics or sol–gel [18, 19].
7The active center density is much higher in a dye compared to typical gaseous gain media. Thiscompensates the smaller cross section.
11

1. Delivering High Energy at High Repetition Rate: A Different Paradigm
1.2.2.3. Solid State Lasers
The third major type is the Solid State Laser. It can be classified by its
1. Host material, which might be a crystal, a glass or a ceramic, defining themechanical, thermal and optical characteristics.
2. Activator/Doping ion with its energy levels leading to the lasers characteristicspectral properties.
The combination of host material and activator ion defines the specification thelaser material can offer. Sufficiently sharp fluorescence lines, a strong emission crosssection, a high quantum efficiency for the laser transition and good optical propertiesare demanded on one side. On the other side, good pumping characteristics, i.e. theavailability of usable pump bands, the achievable doping density and the possibilityto produce the gain medium in the requested size are often important. Suchcharacteristics are usually provided by crystals, ceramics and glasses containingtransition metals, rare earths or actinides as activator ions.
Compared to the other laser gain medium types, solid–state gain media cancombine the broad emission bandwidth (in the order of THz in the NIR/IR) withlifetimes in the order of 10−6 − 10−3 s. Resulting out of Equation 1.2.1, emissioncross sections are typically much smaller compared to gaseous or liquid gain media,in the order of 10−19 − 10−21 cm2. A comparison of several solid–state gain mediacan be found in Table 1.1.
Glasses are host matrices of choice when reproducible manufacturing in large sizesand quantity is requested with a high optical quality. Due to the absence of a welldefined crystalline field emission spectra are broader compared to their crystallinecounterparts. As an example, Table 1.1 shows the comparison between trivalentNd–doped Glass and Yttrium–Aluminum–Garnet (YAG).
Certain glasses, especially phosphate and fluoride phosphate glasses, show a smallindex of refraction leading to a small nonlinear index of refraction [20, 21]. The maindrawback is the low thermal conductivity of glasses compared to crystals restrictingthe applications to laser systems with a low average power.
A crystalline host matrix carries a high order of structure and is characterizedby its crystallographic axes. Uni– and biaxial crystals are of great use for theapplications in non–linear optics as e.g. frequency–conversion etc. [22]. As a lasergain medium, this feature can be used in certain cases since the emission crosssection is different for propagation directions along the different crystallographicaxes. Compared to glasses, crystals remain typically small in diameter (up to tensof centimeters) and usually show a higher nonlinear index of refraction [21].
12

ASE and Thermal Management on a High Average-Power DPSSL
laser quality ceramics combine the large size of glass and the good thermal prop-erties of crystals. This host matrix family consists of small crystallites, which aresintered together under high pressure with the help of additives[23]. The opticaland thermo–mechanical properties are almost similar to crystals. Other advantagesare the possibility to adjust the spatial distribution of the doping centers, as itcan improve the laser performance by adjusting the heat deposition [24] or gainmanagement.
As activators, actinides, transition metals and rare earths are of interest. Theonly successful use of an actinide is trivalent uranium (U3+). It was used in thefirst 4–level laser [25] and, shortly later, used in the first Diode–Pumped Solid StateLaser (DPSSL)[26]. Both systems used crystalline Calcium Fluoride (CaF2) as thehost matrix. The major objection against the use of actinides is their radioactivity.
Transition metals show a strong dependency on the host, valence electrons arenot shielded by outer electron shells [10]. Of special interest are divalent Chromium(Cr2+), trivalent Titanium (Ti3+) and tetravalent Chromium (Cr4+) as they exhibita very broad emission cross section due to vibrational–electronic broadening incertain hosts. A fairly large overview for Chromium doped lasers in the infra–redspectral region can be found in [27]. Of special interest is Ti3+–doped Al2O3 (oftencalled Titanium–Sapphire, Ti:Sa or TiSa) as it has an exceptional broad emissionbandwidth in the visible and near infrared [28]. Using Kerr–Lens–Modelocking,ultra–short laser pulses are generated [29] and is nowadays one of the most importantlaser source for ultra–short laser pulses.
In the case of rare earths as activator, the valence electrons are shielded by theouter electron shells and by this the spectral behavior is not as strongly affected bythe host as it is in the case of transition metal doped laser gain media. Rare earthsare naturally good candidates for laser operation as they show sharp spectral linesthroughout the near infrared and infrared. Neodymium doped glasses and crystals(especially YAG [35]) are important for high–power laser systems operating in theNIR as they show a reasonable long lifetime of the upper laser state. The terminallaser state is well above the lower pump level and therefore exhibits interestingproperties for cw and pulsed operation. Holmium, Erbium and Thulium are ofinterest as they work in the infrared, especially in the eye-safe region. Ytterbiumdoped laser gain media show an exceptional long fluorescence lifetime (in the orderof ≈ 1ms) and a simple energy level system. Due to its simple energy level system,only a few pump–bands are available which is not favorable for flash–lamp pumping.With the upcoming laser diodes as pump sources, Yb–doped laser gain media gainedin interest as they are good candidates for efficient high–power laser systems [36, 37].
13

1. Delivering High Energy at High Repetition Rate: A Different Paradigm
Laser medium type λ (µm) σij (cm2) τf ∆ν (GHz) Ref.HeNe gas 0.6328 1× 10⁻¹³ 1.4 µs 1.5 [12]CO2 gas 10.6 3× 10⁻¹⁸ 2.9 s 0.06 [12]KrF gas 0.248 0.6 – 2.7× 10⁻¹⁶ 7–10 ns 1,000 [30, 31]Ar+ gas 0.515 3× 10⁻¹² 6 ns 3.5 [32]AIL gas 0.76-1.36 7.5× 10⁻¹⁸ 0.2–1.7 s 0.025–0.25 [12]
Rhodamine 6G dye 0.56-0.64 2× 10⁻¹⁶ 3.3 ns 5,000 [32]Coumarin 120 dye 0.43-0.46 1× 10⁻¹⁶ 5 ns 6,000 [33]
DACH dye 0.49 0.4–1× 10⁻¹⁶ 2.8 ns 15,000 [34]Ruby solid 0.694 4× 10⁻²⁰ 3 ms 330 [10]
Tm3+:YAG solid 1.87-2.16 2× 10⁻²¹ 10 ms 25,000 [10]Nd3+:YAG solid 1.064 4× 10⁻¹⁹ 230 µs 120 [10]Nd3+:Glass solid 1.057 3× 10⁻²⁰ 300 µs 3,000 [10]Ti3+:Sa solid 0.66-1.18 3× 10⁻¹⁹ 3.2 µs 100,000 [10]
Yb3+:YAG solid 1.03 2.1× 10⁻²⁰ 950 µs 2,000 [10]
Table 1.1.: Properties of the some selected laser materials
1.2.3. Semiconductor Lasers
Shortly after the first laser, semiconductor lasers were demonstrated [38]. Lasersrelying on a semiconductor can be pumped using a driving current through a p–njunction. As most of the semiconductor lasers are indeed pumped in such a way,other pump techniques, like optically pumped semiconductor lasers, are omitted inthis context. The optical cavity is formed by the cleaved edges, as semiconductormaterials have a high index of refraction (in the order of n0 ≈ 3) and consequentlyshow a high reflectivity at the boundary to air/vacuum (more than 40 %).
In the following we will call semiconductor lasers with a current–carrying p-njunction laser diodes.
The evolution of such devices was slow at the beginning, as laser diodes couldnot take advantage of the (already) mature silicon technology. Direct band gapmaterials are needed to emit photons (compound semiconductors were developedpossessing a similar band gap structure). They were limited to operate at cryogenictemperatures with short pulses and with a low efficiency. Nevertheless, even undersuch conditions, laser diodes were used to pump one of the first solid–state laser[26].
With the invention of the heterostructure (multiple semiconductor layers replacingthe simple p–n junction) in 1969 [39], cw operation became possible. The thresholdcurrent was further reduced by the use of quantum wells [40].
14

ASE and Thermal Management on a High Average-Power DPSSL
Laser diodes cover a wide spectral region from the visible/NIR spectral region forInGaN/GaN (405 − 530 nm), InGaP (630 − 690 nm) and GaAs (730 − 980 nm) tothe IR for InP–structures (1200− 1700 nm) and InGaAsSb around 2000 nm.The attractiveness of the narrow emission spectra of laser diodes compared to
flash lamps make them highly efficient pump sources of choice for solid state–lasergain media, especially those doped with rare–earths. For instance, Ytterbium dopedgain media show narrow single absorption lines, which would otherwise be difficultto pump without the narrow emission of laser diodes.
High–power laser diodes usually consist of several single emitters arranged onone semiconductor chip (called bar). Several of such bars can be stacked together(forming the so–called stack). The density of the laser emitters per bar and stack(fill factor) depends on the heat deposition into the heat sink. Quasi–continuousemission (qcw) with pulses in the order of milliseconds and repetition rates in theorder of 1− 10 Hz allow high fill factors up to 90%.Current state of the art laser diode bars emit between peak powers between 200
and 400 W (for an emission wavelength near 940 nm and pulse lengths of 1 ms) fordriving currents of up to 300 A. The conversion efficiency from current into laser lightemission is 60−70%. Laser diode stack emission can be considered non–coherent dueto the high amount of independent laser light emitters. The geometrical arrangementof the cavity leads to two different spatial laser emission divergences. A so–calledfast axis emission perpendicular to the large extend of the laser diode bar showsa divergence in the order of ∼ 40, while along the perpendicular direction (so–called slow axis) the divergence is in the order of ∼ 10. Fast axis collimation usingcylindrical lenses with sub–millimetric focal lengths and high numerical aperturereduce this divergence to ∼ 1.The rather low beam quality of laser diodes, compared to other laser sources,
makes concentration of these light sources more complicated. Tapered laser diodesoffer a better beam quality, which is interesting for smaller pumped areas [41].
Besides the beam quality, the drift of the emission wavelength with temperatureand age of the laser diode stack is a problem for laser gain media with narrowabsorption cross sections. Volume Bragg gratings can be used to drastically reducethe temperature shift by a factor of ∼ 30 [42].Vertical–Cavity Surface–Emitting Lasers (VCSELs) [43] show a better beam qual-
ity compared to the edge–emitters but are limited to their output power since theiroperating principle relies on the large extends as emitting surface. Therefore, a highquality cavity is needed in order to prevent transverse lasing. Nevertheless, VCSELare interesting candidates as laser diode pump sources.
15

1. Delivering High Energy at High Repetition Rate: A Different Paradigm
1.3. Efficiency considerations
An important factor of a laser is its efficiency, namely the electrical–to–opticalefficiency ηe−o. Some authors refer to the optical–to–optical efficiency ηo−o, whichexcludes the generation and transport of the pump energy and therefore the pumpsource efficiency ηPS and the transport efficiency ηT .For the optical–to–optical efficiency of an amplifier, one might define it as the
fraction of extracted energy density Fout compared to the injected energy densityFinj:
ηo−o =FoutFinj
(1.3.1)
The optical efficiency on its own is characterized in two contributions:
1. energy storage
2. extraction of energy
Most prominent for the energy storage is the Stokes parameter ηS = λP/λL describ-ing the difference in energy for a pump and laser photon. Pump photons striking thegain material get subsequently absorbed with a fraction ηA and are transfered intothe upper laser state with a quantum efficiency ηQ which is mostly influenced byauxiliary fluorescence lines and upconversion. The upper laser state has a limitedfluorescence lifetime τf . In the case of a pump duration τP in the order of thelifetime τf , a certain amount 1 − ηL is converted into Spontaneous Emission (SE)which generates in an inverted gain medium Amplified Spontaneous Emission (ASE)affecting the efficiency by a factor ηASE.Energy extraction is closely related to the beam overlap ηBO and the extraction
efficiency ηE. Achieving a high value for the beam overlap strongly depends on thepump geometry and subsequently alters the pump transport efficiency ηT , which in-cludes beam shaping for the pump, too. Therefore a better optical–optical efficiencycan result in a lower overall electrical–optical efficiency. The extraction efficiencyηE however can be defined as the extracted energy in the spatial beam distributioncompared to the stored energy within the spatial beam shape.
ηe−o = ηPS ηT ηS ηA ηQ ηL ηASE ηBO ηE︸ ︷︷ ︸ηo−o
(1.3.2)
ηPS : Pump source efficiency
ηT : Pump transport efficiency
ηS : Stockes parameter
16
ASE and Thermal Management on a High Average-Power DPSSL
ηA : Absorbed fraction of the pump
ηQ : Quantum efficiency
ηL : Storage efficiency due to τfηASE : ASE losses
ηBO : Beam overlap
ηE : Extraction efficiency
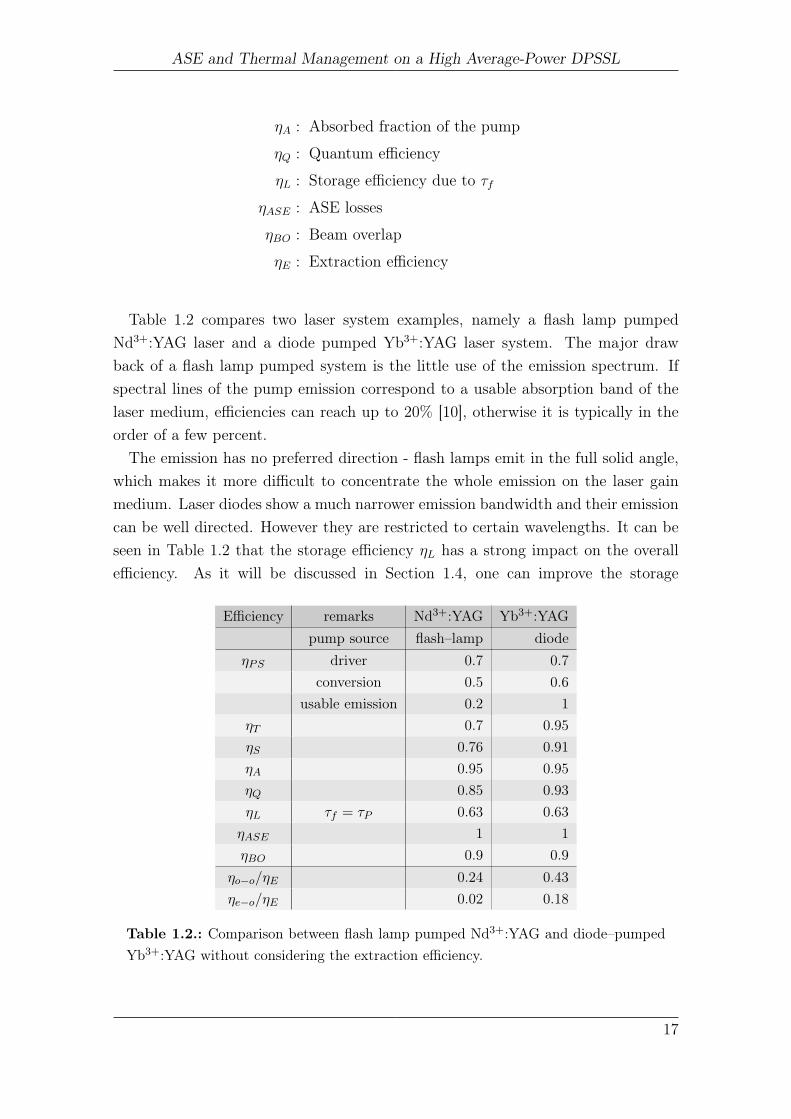
Table 1.2 compares two laser system examples, namely a flash lamp pumpedNd3+:YAG laser and a diode pumped Yb3+:YAG laser system. The major drawback of a flash lamp pumped system is the little use of the emission spectrum. Ifspectral lines of the pump emission correspond to a usable absorption band of thelaser medium, efficiencies can reach up to 20% [10], otherwise it is typically in theorder of a few percent.
The emission has no preferred direction - flash lamps emit in the full solid angle,which makes it more difficult to concentrate the whole emission on the laser gainmedium. Laser diodes show a much narrower emission bandwidth and their emissioncan be well directed. However they are restricted to certain wavelengths. It can beseen in Table 1.2 that the storage efficiency ηL has a strong impact on the overallefficiency. As it will be discussed in Section 1.4, one can improve the storage
Efficiency remarks Nd3+:YAG Yb3+:YAGpump source flash–lamp diode
ηPS driver 0.7 0.7conversion 0.5 0.6
usable emission 0.2 1ηT 0.7 0.95ηS 0.76 0.91ηA 0.95 0.95ηQ 0.85 0.93ηL τf = τP 0.63 0.63ηASE 1 1ηBO 0.9 0.9
ηo−o/ηE 0.24 0.43ηe−o/ηE 0.02 0.18
Table 1.2.: Comparison between flash lamp pumped Nd3+:YAG and diode–pumpedYb3+:YAG without considering the extraction efficiency.
17

1. Delivering High Energy at High Repetition Rate: A Different Paradigm
efficiency by applying a shorter pump duration. However to achieve the sameinjected energy within a shorter period of time requires a higher pump intensity.This can be achieved with e.g. higher driving currents for the flash lamps/ laserdiodes or a higher number of pump sources. The first one is limited by the damagethreshold of the pump device and its lifetime, the second is connected with a highercapital investment.
1.4. Energy storage
Before extracting energy with a laser pulse/beam, it has to be efficiently and safelystored. In this section, limiting factors for energy storage, due to Amplified Spon-taneous Emission (ASE) on one side and thermal limitations on the other side, arebriefly discussed.
1.4.1. Energy storage and extraction
The coupled rate equations for the population inversion n and the photon flux Φunder amplification, neglecting fluorescence, can be written to be [10]:
∂n
∂t= −γncσΦ (1.4.1)
∂Φ
∂t= cnσΦ− ∂Φ
∂zc (1.4.2)
where γ is 1 for a 4-level system and 2 for a three–level system, c the speed of light inthe medium of refractive index n0 (c = c0/n0) and σ the cross section of the activemedium. A solution can be derived according to the estimations done by Frantzand Nodvik [44]. The amplified photon density Φ(z, t) is given for a initial photondensity Φ0 to be:
Φ(z, t)
Φ0
= 1− [1− exp(−σnz)] exp [−γσΦ0c (t− z/c)]−1 . (1.4.3)
A square pulse of duration τp sees an energy gain G in a gain medium of length l:
G =1
cγσΦ0τPln 1 + [exp(γσΦ0τP c)− 1] exp(σnl) (1.4.4)
This expression is connected to not directly measurable variables. Therefore wedefine the incoming energy density Fin to be:
Fin = c Φ0τPhν (1.4.5)
where h is Planck’s constant and ν the laser frequency. The resulting combinationof variables in expression 1.4.4 can be interpreted to be a characteristic value for the
18

ASE and Thermal Management on a High Average-Power DPSSL
laser gain material - the so–called saturation fluence Fsat [J cm−2]:
Fsat =hν
γσ(1.4.6)
Two other important variables can be defined out of this relation, namely the small–signal gain g0 and the non–saturated energetic gain G:
g0 = σn (1.4.7)
G = exp(σnl) (1.4.8)
Replacing Fin, Fsat and G into Equation 1.4.4 leads to a more physically accessibleformula:
G =FsatFin
ln
1 +
[exp
(FinFsat
)− 1
]G0
. (1.4.9)
The cross section σ used in Equation 1.4.6 is the spectroscopic cross section and isby this not always directly accessible. Therefore it is more convenient to define theexperimental cross section as a material parameter. Equation 1.4.6 reduces withσe = γσ to
Fsat =hν
σe. (1.4.10)
As discussed in the previous section, storage efficiency due to limited lifetime of theupper laser state (without extraction) is an important factor for laser amplifiers.We can derive it as a solution of the differential equation:
dn
dt= α
IPhν− n
τf(1.4.11)
under the estimation of a non–saturated linear absorption coefficient α [cm−1], aconstant pump intensity IP [W cm−2] and a fluorescence lifetime τf [s]. Dividingthis result by the total absorbed energy αIP/(hν)τP , one yields:
ηL =1− exp −τP/τf
τP/τf(1.4.12)
This formula shows, that for a given fluorescence lifetime τf , a longer pump durationresults in a lower pump efficiency. Consequently, short pump durations are preferred.Shorter pump durations, however imply, with the same energy in the pump pulse,a higher pump intensity. This makes it more difficult to build such pump devices.
In this approach, the only source for the loss of population is the spontaneousemission (SE). The very basic principle of a laser implies its amplification due to thepositive gain at the fluorescence lines. Such spontaneously emitted photons traveling
19

1. Delivering High Energy at High Repetition Rate: A Different Paradigm
through the gain medium will see amplification on its own and further depopulatethe inversion – so–called Amplified Spontaneous Emission (ASE). Quite early in thelaser development it was understood, that ASE is an important factor for a laserinstallation [45, 46] and is still an important field of research [47, 48, 49].
ASE action depopulates the local excited activator ions as it can be interpretedas a locally, time–dependent fluorescence correction factor to the lifetime τ ∗f =
τf/MASE. In a first rough approximation, such a lifetime correction factorMASE canbe approximated to beMASE ≈ exp σenL, where L is the characteristic dimensionof the system. A more detailed discussion on this subject follows in Chapter 3.Equation 1.4.11 has then to be modified to:
dn
dt= α
IPhν− n
τf·MASE (1.4.13)
Again we have to mention that this approximation is fairly simple and will nothold true if ASE becomes important. A strong deexcitation due to ASE leads to anon–uniform gain distribution within the gain medium and a significantly spatiallyvarying MASE. The estimated impact obtained from MASE is then exaggerated.
Equation 1.4.13 is consequently approximated to be:
dn
dt= α
IPhν− n
τf· exp(Cn) (1.4.14)
where the constant C is given by C = σeL. The resulting efficiency ηLeff is by thisgiven by
ηLeff = ηLηASE. (1.4.15)
Relation 1.4.14 can be solved numerically and the efficiency ηLeff is shown in Figure1.2 for values of C varying between 0 and 10.
It is of major interest to derive an estimation when ASE related effects becomedominant. As it will be shown in Chapter 3, the ASE–flux in the monochromaticcase is expressed as:
ΦASE(r0) =1
4π
1
τf
∫V
n(r)
|ρ(r, r0)|2·Gr→r0dV (1.4.16)
where ρ(r, r0) is the distance between the point of observation r0 and the positionof the integration variable r. With the assumption of uniform excitation and anon–saturated gain, we can simplify Equation 1.4.16 to:
ΦASE =1
4π
n
τf
∫V
1
|ρ(r, r0)|2· exp g0 ρ(r, r0) dV (1.4.17)
Limiting for a given geometry one can derive two cases:
20

ASE and Thermal Management on a High Average-Power DPSSL
Figure 1.2.: Storage efficiency as a function of the pump duration τP , the fluorescencelifetime τf and the factor C = σeL characterizing the influence of ASE
• The ASE–fluence gets in the order of the saturation fluence Fsat and ASEsignificantly depopulates the stored energy in the case of an absence of parasiticoscillations.
• The product of the average gain and the gain medium internal surface reflec-tivity exceeds one reaching the oscillation threshold.
In the case of 4–level–system the relations g0 = σen, Fsat = hν/σe and ΦASE τfhν =
FASE transform Equation 1.4.17 to:
FASEFsat
=g0
4π
∫V
1
|ρ(r, r0)|2· exp g0 ρ(r, r0) dV (1.4.18)
In order to estimate the oscillation threshold for a given geometry, one can definea product g0L of the small–signal gain g0 and a characteristic length L. For a thindisc this length would be the disc diameter and for a pen–shape like rod the lengthof the rod. We can define a threshold for the parasitic oscillations, when the gainexp(g0L) is larger than the losses introduced at the extremities of the gain medium,i.e. absorbing cladding and surface reflectivity. With an effective reflectivity R∗
characterizing the losses, one derives:
g0L < − ln(R∗) (1.4.19)
21

1. Delivering High Energy at High Repetition Rate: A Different Paradigm
Typical values for the surface reflectivity are R∗ = 1 % (AR coatings),R∗ = 4 % 8
and R∗ = 9 % 9 yielding g0L ≈ 4.6, g0L ≈ 3.2 and g0L ≈ 2.4 respectively. Thiscertainly restricts the usable dimension of a laser gain medium. Of special interestfor scaling is the critical volume Vcr. The volume of a gain medium can be expressedin terms of the characteristic length to be V ∝ L3. Using Equation 1.4.19 gives:
Vcr ∝ κg−30 (1.4.20)
where κ depends on the given condition and geometry. Equation 1.4.18 shall nowbe solved for a given gain medium geometry and small signal gain g0 in the caseof FASE/Fsat = 1. The numerical result for the observation in the center of thegain medium with a homogeneous small signal gain (g0 =const.) is shown in Figure1.3(a).
It should be noted that the derived value only leads to a rough approximation.Equation 1.4.18 is only fully satisfied in the case of FASE Fsat as the gain is takento be strictly exponential. Consequently the values shown in Figure 1.3(a) and (b)lead to a value below which the design of the laser gain medium is not dominatedby ASE or parasitic oscillations, while a design point well above these estimationscan become critical to issues connected to ASE and parasitic oscillations.
Different geometries scale slightly different in terms of the critical volume. Rodsare slightly inferior compared to the thin disk in terms of energy storage in this case,but as the extraction is typically in the direction of the characteristic length, theyare superior in the energetic gain G.
Figure 1.3(b) shows a comparison between the results of Equation 1.4.18 and1.4.19 in the case of thin cylinder (the height is 1/10 of the radius). In this case, thecritical radius Rcr is shown as a function of the small signal gain g0. As comparison,the limit imposed by the surface reflectivity is plotted for different values. The mainresult is that the surface reflectivity plays an important role, if it is not suppressed.ASE depopulation will be the limiting factor if g0L > 4 and parasitic oscillationsare suppressed.
Beside the impact within the laser gain medium itself, the propagation of ASE in alaser amplifier chain decreases the laser system performance, especially the energyand temporal intensity contrast. ASE photons traveling under the restricted solidangle ∆Ω can reach the saturation fluence Fsat on the last amplifier stages. As anapproximation for the ASE fluence FASE at the end of a laser chain the following
8This corresponds to the reflectivity of glass with n0 = 1.5 under normal incidence against air.9This correponds to the reflectivity of YAG with n0 = 1.83 against air under normal incidence.
22

ASE and Thermal Management on a High Average-Power DPSSL
(a) The critical volume Vcrit as a function of g0 for different geometries belowwhich strong ASE losses are prevented.
(b) The critical radius Rcrit of a disk with a height H in the case R = 10H (Equation1.4.18) and the corresponding limit for a given surface reflectivity (Equation1.4.19)
Figure 1.3.: Estimation of the critical volume Vcrit as a function of g0 for differentgeometries (a), below which the condition FASE Fsat is satisfied and therefore theworking point is preferred. The critical radius Rcrit for a disc with R = 10H (b) iscompared to the corresponding values for different surface reflectivities.
23

1. Delivering High Energy at High Repetition Rate: A Different Paradigm
expression can be used [50, 51]:
FASE ≈ ∆νASE∆Ω∆tASEhc0n
20
ln(2)λ3
G
ln(G)(1.4.21)
where ∆νASE is the ASE bandwidth, ∆tASE is the duration of the ASE, h Planck’sconstant, c0 the speed of light in vacuum, n0 the refractive index of the amplifyingmedium, λ the emission wavelength and G the total energetic gain of the laser beamline. As an approximation for the spectral width of the ASE ∆νASE one might usethe relation for the spectral gain narrowing [52]:
1
(∆λout)2=
ln(G)
(∆λg)2+
1
(∆λin)2(1.4.22)
where ∆λin is the initial bandwidth, ∆λg the bandwidth of the amplifying mediumand ∆λout the resulting bandwidth. Corresponding spectral shapes are approxi-mated to be Gaussian. Translated into the bandwidth for the ASE ∆νASE startingout of the noise gives approximatively:
∆νASE ≈∆ν√ln(G)
(1.4.23)
wherein ∆ν is the gain medium bandwidth. A similar expression for the durationof the ASE can be found [51]:
∆tASE ≈τPump√ln(G)
(1.4.24)
where τPump is the pump pulse duration.
1.4.2. Thermal constraints for energy storage
Another limitation connected to the pump action comes out of the materials prop-erties. When a solid state laser material is exposed to a certain value of stress itcan deform or it fractures, if the limit of the strength of the material is reached.A non–uniform heating results in a non–uniform expansion and therefore leads tostress in the bulk material. The robustness of a laser material to a thermal shock ischaracterized by its thermal shock parameter [53]
RS =k(1− νp)αTE
σmax (1.4.25)
where k [W m−1 K−1] is the thermal conductivity, νp the Poisson ratio, αT [K−1]
the thermal expansion coefficient, E [Pa] the modulus of elasticity and σmax [Pa]
is the maximum surface stress a material can resist. The value for the maximum
24

ASE and Thermal Management on a High Average-Power DPSSL
allowable surface stress is strongly related to surface quality, especially the fracturedepth. Taking into account this consideration, a more general estimation is done bydefining the allowable surface stress as [54]:
σmax =Y Kc√a
(1.4.26)
where Y is a geometry factor near to unity, the fracture toughness Kc [Pa m1/2]
and a [m] the depth of the largest flaw. The maximum allowable surface stress is afunction of the maximum flaw and the material can be characterized by its thermalshock resistance R′S:
R′
S = RS
√a (1.4.27)
if the fracture depth is known. The polishing quality and the polishing materialsare consequently key factors [55]. Estimation for the requested surface preparationquality and surface treatment quality can be given. A significant increase for thethermal shock parameter was achieved by improving polishing techniques [56, 57, 58].
One has to understand, that due to the statistical nature of the occurrence ofsurface and volume defects, the thermal shock parameter RS will likely be reducedwith an increasing size of the active medium. This is an important factor for scalingthe active medium.
While pumping the active material, a fraction Ph = ηhP of the incident pumppower P is converted into heat. The fraction of the absorbed energy, which istransformed into heat ηh depends on the laser and material parameters [59]. If theheat–generated stress exceeds the elastic modulus, fracture is imminent. A thermalshock limited pump power PRS can be defined as [60, 61]:
PRS =3RSL
2
ηhD, (1.4.28)
where L is the width of the pumped region, D the thickness of the gain medium.The assumption is that the slab is uniformly heated, is insulated on one sideand D L. In the case of a slab cooled on both lateral sides, PRS is fourtimes larger. Besides the physical destruction of the laser material, generated heataffects the laser performance (e.g. a temperature dependent gain, stress inducedbirefringence, thermal lensing etc.). Considering a critical temperature difference∆Tmax (compared to the initial temperature), a temperature difference limited pumppower P∆Tmax might be defined as [60]:
P∆Tmax =2kL2
ηhD∆Tmax (1.4.29)
Again a uniform heating was assumed and in the case of a cooling applied to bothlateral surfaces, the allowable pump power is four times larger.
25

1. Delivering High Energy at High Repetition Rate: A Different Paradigm
1.5. Power and Intensity Limitations
In the previous section we discussed the limitations due to the energy storage in again material used as an amplifier. Energy extraction brings limitations as well. Ifa laser beam is kept at a low intensity, it introduces no deterioration in a material.With increasing intensity reversible effects occur and finally non–reversible changesare generated. The physical origins of these changes are manifold, like a rise intemperature, strain, stress and the whole world of non linear effects. Neverthelessthe interaction of the electrical field component of the laser pulse with the electronsin the conduction band of the solid state material is always the bias of the destructionmechanisms.
Two main classes of mechanisms lead to laser induced damage. Thermal processes,arising from the absorption of laser energy, is the first type and applies typically forcw, long–pulses (pulse duration 10 ps) and an operation at high repetition rates.Absorbed energy is transported into the lattice of the solid–state material resultingin local heating and therefore melting, softening or decomposition lead to laserinduced damage. Because thermal conduction limits the heat deposition, the LaserInduced Damage Threshold (LIDT) fluence goes with FLIDT ∝ τ 0.4−0.5
P in the rangefrom 0.1− 100 ns [62].The second type of processes is a dielectric breakdown, where the electric field
strength is strong enough to generate free electrons. The initial electron density(so–called seed) gets amplified by avalanche processes until it reaches a density of≈ 1018 cm−3 where dielectric breakdown occurs [63]. For short laser pulses (pulselengths 10 ps), the initial seed–electron density can be increased by multi–photonionization. In this temporal regime absorption centers in the material are notdominant anymore [64], no direct correlation between the absorption and the damagethreshold can be found.
Dielectric coatings are a very sensitive interface and by this of particular interestfor the LIDT. Recent years showed a steady improvement in LIDT for those coatings.Inclusions within the coating layers can lead to the destruction of the dielectriccoating itself. The density and nature of these inclusions significantly influencethe laser damage threshold [65]. Minor ablations can lead to diffraction centersdamaging preceding optical elements or can lead to bulk damage.
26

ASE and Thermal Management on a High Average-Power DPSSL
For high intensity pulses, the index of refraction n becomes dependent of the localintensity I:
n = n0 + n2 · I (1.5.1)
where n2 is the nonlinear index of refraction of a material. One of the effects is thatthe material becomes an optical element on its own, potentially compensating thenatural diffraction. A power can be derived for the moment the diffraction by thebeam propagation gets compensated by the intensity related non–linear lens effectand trapping the beam [66]. This power is called critical power Pcr and is given fora top–hat intensity distribution to be [67]:
Pcr 'π(0.61)2λ2
0
8n0n2
. (1.5.2)
The critical power Pcr is slightly different for different spatial profiles. However,the correction factor is close to 1 [67] and by this neglected in this context. Valuesfor the nonlinear refractive index are often given in the CGS unit system (γ [esu])and has to be transformed into the nonlinear refractive index in the SI unit system(n2 [cm2 W−1]) using the relation n2 = 4πγ/(c0n0). If the power is larger than thecritical power (P & Pcr), whole beam self focusing after a distance zsf is expected[67]:
zsf =2n0w
20
λ0
1√P/Pcrit − 1
(1.5.3)
where w0 is a characteristic beam radius (in the approximation of a Gaussian beamprofile it would be the half–width for the intensity at I/I0 = 1/e2). Usually thematerial is not thick enough to generate a whole beam self focusing. Nevertheless anonlinear lens is generated with a focal length fNL. If the pulse crosses a thin layerwith a thickness D, the focal length can be given as [10]:
fNL ≈w2
0
4n2I0D. (1.5.4)
Again, one should consider, that the focal length is dependent from the spatialprofile.
If the power is considerably larger than the critical power (P > Pcr), small amplitudemodulations in the spatial profile grow faster compared to the whole beam auto–focalization. The beam profile breaks up into small filaments, the so–called small–scale self–focusing occurs [68]. A threshold power similar to those of Equation1.5.2 depends of the initial uniformity of the beam profile. Smooth beams willhave higher thresholds compared to strongly modulated beam profiles. Moreover,these modulations can be acquired by bulk imperfections of the optical materialsencountered during the propagation in the laser system.
27
1. Delivering High Energy at High Repetition Rate: A Different Paradigm
Considering a randomly modulated uniform beam profile, a specific spatial fre-quency can be found where the modulation grows at maximum. The correspondingpower is of the same order of magnitude as the critical power. During propagation,the ripples in the spatial profile grow at maximum in intensity [69]:
I = I0e2B (1.5.5)
where B is the beam break–up integral. An exponential growth of the spatialmodulation is hereby estimated. The break–up integral is defined as the non–linearcomponent of the spatial phase integrated over the beam trajectory:
B =2π
λ0
∫ D
0
n2I(z)dz (1.5.6)
where D is the length of the passed material. If not controlled by spatial filtering,the beam can break up into a number of filaments each containing the critical power.
Moreover, the output energy density of a laser system is limited by a givenacceptable B–Integral Bmax. In the case of a non–saturated gain, g0 = ln(G)/D
and Fin << Fout Equation 1.5.6 is solved to get:
Fout ≤Bmaxλ0 ln(G)τP
2π n2D. (1.5.7)
We can filter the spatial frequencies corresponding to the B–Integral B by the meansof spatial filtering. Those have to obey certain rules regarding the design of filteringitself, especially the pinhole diameter ∅ and the focal length f . The angular scaleinhomogeneities growing with the maximum increment are [50, 69]:
Θmax =
(2n2
n0
I
)1/2
. (1.5.8)
In the far–field (i.e. in the focal plane of a spatial filter) spatial frequencies accordingto Equation 1.5.8 can be observed and filtered out by a pinhole located in the focalplane of a lens with a focal length f , if one satisfies
Θmax >∅
2f. (1.5.9)
Using Equation 1.5.7 we can estimate the necessary pinhole diameter to cancel apreviously built–up B–Integral to be:
∅ < 2f
(Bmax λ0 ln(G)
n0 πD
)1/2
. (1.5.10)
Typically a Λ–times diffraction limited pinhole is chosen, where the diffraction limitfor a given Gaussian beam with a 1/e2–radius is wf = λf/(πw0). Therefore we canonly cancel down to the spatial frequencies corresponding to the B–Integral Bmin:
Bmin > Λ2 · λ0 n0D
w20π ln(G)
. (1.5.11)
28

ASE and Thermal Management on a High Average-Power DPSSL
1.6. Overcoming the limitations – Gain medium
selection for DPSSL
As described in the latter sections, depending on the parameters of the laser systems,various limitations occur, mainly in terms of repetition rate, energy, power andlaser damage threshold. Every laser system to be build is then somehow limitedaccording to its foreseen application. With the uprising of the first laser systemsin the early 60’s, laser damage threshold on/in the laser gain material and opticstriggered the exploration of techniques to circumvent these issues. Shorter pulseswith more energy require a higher laser damage threshold of all optical surfaces andvolumes. Surpassing this limit was finally achieved using a technique called “ChirpedPulse Amplification” (CPA) [70] allowing a significant increase for the amplificationof short pulses. The laser energy is nowadays limited by the LIDT of the pulsecompression system.
On the other hand, large laser systems are limited in a more trivial way: theirthermal management and efficiency. Large scale laser systems show typically effi-ciencies in the range of 1–0.1% as discussed in Section 1.3. This is acceptable forlow-repetition rate applications (several shots per day up to several shots per hour),but becomes a problem if applications demand several shots per second. Averagepower consumption is a problem in this case, as for a kW–average power laser theinjected power would be in the MW–range. Moreover, most of the injected energywould be transformed into heat resulting in a potentially vast cooling effort.
The key to the solution is an increase in efficiency. One solution is a Diode–Pumped Laser (DPL), as laser diodes combine a good e–o efficiency and a sharpemission spectrum compared to e.g. the emission of a flash lamp. The difficulty isthat the output power of semiconductor laser emitter is rather small. Nonetheless,packaging several emitters to a bar leads to output powers in the order of 200–300W
per bar. Several bars can be stacked together and form a laser diode stack with apower in the order of 3–6 kW per stack with a surface of typically a few squarecentimeter. High–power laser diode stacks show an e–o efficiency of currently upto 70% under laboratory conditions and more than 60% for mass produced stacks.The rapid increase of available power and efficiency within the last decade will bringavailable efficiencies of 70% on the market for the next generation of laser diodestacks.
But even with an efficiency of 70%, 30% of the injected energy would be convertedinto heat. We define at this point the duty–cycle as the fraction of time in which thelaser diodes are activated compared to the time of a period duration (i.e. the time
29

1. Delivering High Energy at High Repetition Rate: A Different Paradigm
between the beginning of two successive pulses). For a duty–cycle higher than 10%,aggressive cooling is needed which can be achieved by water–cooling the laser diodestack with micro–channel coolers. Lower duty cycles relax this demand leading tomuch simpler cooling solutions.
State of the art laser diode stacks are driven with current up to 300 A, typically150 A, and a voltage per bar of 2–4V. Drivers delivering such currents have a risetime τ10−90 in the order of 10 µs. The falling time is in the same order. Pulses areby this limited to an order of magnitude of τP & 100 µs.
A suitable laser gain medium should therefore offer a lifetime of at least 100 µs,a suitable pump band matching the laser diode emission and desired working wave-length, a low nonlinear index of refraction n2, a high thermal conductivity, a suf-ficiently large absorption cross section, a saturation fluence less than the LIDTbut large enough not to be limited by ASE. Unfortunately such an all–in–one gainmedium suitable for every purpose doesn’t exist.
The fluorescence lifetime demand eliminates right away the gaseous and liquidgain media as their lifetimes are typically too short or the line width too small asdiscussed in Section 1.2.2. Solid–state materials are most adapted to these demandswhich is the reason why most of the diode pumped laser systems are Diode–PumpedSolid–State Lasers (DPSSL).
Let us now give a brief overview over a selected number of gain media and discusstheir selection with respect to DPSSL requirements.
Equation 1.2.1 describes the relationship of the four gain media parameters
• the stimulated emission cross section σij = σe
• the line shape function g(ν)
• the frequency ν
• the fluorescence lifetime τij = τf
where by fixing three of those, a maximum performance for the fourth parameter isconsequently defined. This section is dedicated to the derivation of the gain mediaparameters suitable for Diode Pumped Solid State Lasers.
30

ASE and Thermal Management on a High Average-Power DPSSL
In the case of a Gaussian broadening, the line shape function is given at theFHWM as [10]:
g(ν) =2
∆ν
(ln 2
π
)1/2
. (1.6.1)
This yields together with Equation 1.2.1:
σe =c2
0
8πν2
1
n20
1
τf
2
∆ν
(ln 2
π
)1/2
. (1.6.2)
Selecting the appropriate laser material strongly depends on the intended laserparameters. Laser systems operating in the picosecond (ps) and femtosecond (fs)range require large spectral bandwidths ranging from a few to several hundrednanometers. In contrast, pulses in the order of nanoseconds (ns) are manageableusing laser gain media with a considerably smaller bandwidth. The relation betweenbandwidth and transform–limited pulse duration tmin [s] is expressed as:
tmin∆ν ≤ K (1.6.3)
where K is a factor depending on the spectral shape of the pulse. As an example,a Gaussian shaped spectrum leads to K = 2 ln 2/π ≈ 0.441 [32]. Transform limitedpulses will show a minimum FWHM tmin of
tmin ≤λ2K
c0∆λ(1.6.4)
where λ is the central wavelength and ∆λ the FWHM bandwidth. Figure 1.4 showsthe necessary bandwidth for different pulse durations tmin in a spectral range varyingbetween 500 and 1500 nm.
Using Equation 1.6.3 in 1.6.2 with the definition of the saturation fluence 1.4.10gives [71]:
τftminFsat
=λ3
8πn20hc
( π
ln 2
)1/2
(1.6.5)
which describes the maximum performance achievable out of a solid–state lasermaterial. With a wavelength of λ = 1 µm, a fluorescence lifetime of τf = 100 µs andan index of refraction of n0 = 1.5 we get tminFsat ≈ 5.3× 10⁻¹⁴ J cm−2 s. Ideally,a saturation fluence not larger than 10 J cm−2 would then allow diode–pumped fs–laser systems. Nonetheless, such an ideal material has to be found.
Figure 1.5 displays a number of various laser gain materials doped either withNd, Yb or a transition metal. Most of the Nd–doped materials are limited by
31

1. Delivering High Energy at High Repetition Rate: A Different Paradigm
Figure 1.4.: Necessary bandwidths for selected pulse durations as a function of thecentral wavelength according to Equation 1.6.4
their low saturation fluence most of the transition metal doped materials show shortfluorescence lifetimes. On the other hand, most of the Yb–doped materials show ahigh saturation fluence and a long fluorescence lifetime which makes energy storagemore easy, but energy extraction becomes more difficult, as LIDT issues becomemore important.
The available bandwidths for selected materials are shown in Figure 1.6. In high–energy laser chains is the overall energetic gain G in the order of 106 − 109, whichincreases in combination with Equation 1.4.22 the need for the available bandwidthapproximately by a factor of ≈
√lnG ≈ 4−5. As most of the laser materials work at
laser wavelengths close to ≈ 1 µm, satisfying a bandwidth of ≈ 1 nm for 1 ps pulseswould require to rely on a gain medium with at least a spectral bandwidth of > 6 nm.However, as in certain cases different laser materials can be combined to achieve alarger amplification spectrum (e.g. fluoride and phosphate glasses near 1057 nm)and a spectral shaping can be applied, restrictions can be somehow softened.
Thermal effects play an important role for high–power laser systems and thereforewe are interested in a material exhibiting good thermal characteristics, especiallythe thermal conductivity k and the thermal shock parameter RS. As shown inEquation 1.4.25, a linear relation between both parameters exists. Figure 1.7 shows,
32

ASE and Thermal Management on a High Average-Power DPSSL
Figure 1.5.: Fluorescence lifetime (horizontal axis) and saturation fluence (verticalaxis) overview over several laser gain materials, according to [71] and Table B.2.
for selected laser materials, the thermal shock parameter as a function of the thermalconductivity. Clearly one identifies the low thermal conductivity of glasses on oneside and the high thermal conductivity for crystalline hosts, especially sapphire(Al2O3). One has to take into account, that the fracture toughness depends stronglyon the preparation of the samples [56, 54]. A significant increase can be found,resulting in an increase of the thermal shock resistance of up to one order of onemagnitude (see GSGG and strengthened GSGG in Figure 1.7).
Recalling the significance of the nonlinear index of refraction n2, another in-teresting way of classifying laser gain media for high-peak power laser systems isshown in Figure 1.8, where the product 2πn2Fsat for a given pulse length of 1 ns
at a wavelength of 1 µm as a function of the critical power Pcr is shown. The firstparameter represents the B–integral susceptibility of a laser material. If a laser pulsewith a given pulse length τ propagates with the saturation fluence Fsat in a laseramplifier, which might take place in the final passes within the laser amplifier, theaccumulated B–Integral between the spatial filtering will be B ≈ 2πn2Fsat/(λτ)DG,where D is the trajectory length in the gain medium and G the integrated energeticgain in this pass.
33
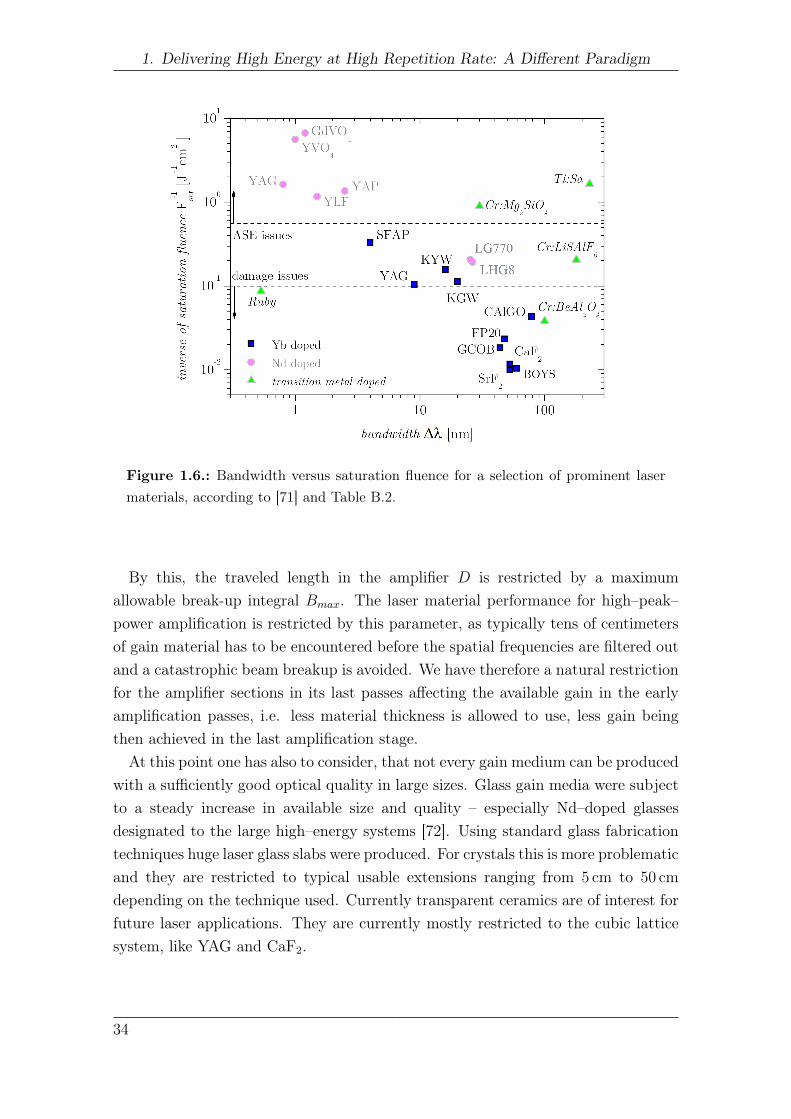
1. Delivering High Energy at High Repetition Rate: A Different Paradigm
Figure 1.6.: Bandwidth versus saturation fluence for a selection of prominent lasermaterials, according to [71] and Table B.2.
By this, the traveled length in the amplifier D is restricted by a maximumallowable break-up integral Bmax. The laser material performance for high–peak–power amplification is restricted by this parameter, as typically tens of centimetersof gain material has to be encountered before the spatial frequencies are filtered outand a catastrophic beam breakup is avoided. We have therefore a natural restrictionfor the amplifier sections in its last passes affecting the available gain in the earlyamplification passes, i.e. less material thickness is allowed to use, less gain beingthen achieved in the last amplification stage.
At this point one has also to consider, that not every gain medium can be producedwith a sufficiently good optical quality in large sizes. Glass gain media were subjectto a steady increase in available size and quality – especially Nd–doped glassesdesignated to the large high–energy systems [72]. Using standard glass fabricationtechniques huge laser glass slabs were produced. For crystals this is more problematicand they are restricted to typical usable extensions ranging from 5 cm to 50 cm
depending on the technique used. Currently transparent ceramics are of interest forfuture laser applications. They are currently mostly restricted to the cubic latticesystem, like YAG and CaF2.
34

ASE and Thermal Management on a High Average-Power DPSSL
Figure 1.7.: Thermal shock parameter RS as a function of the heat conductivityk for various materials at room temperature. RS can be improved through specificpreparation techniques e.g. for GSGG (red triangles) and YAG (blue diamonds). Thedata is given in Table B.2.
Figure 1.8.: Integral B susceptibility versus the critical power for 1ns pulses forvarious gain media. The data is given in Table B.2.
35
1. Delivering High Energy at High Repetition Rate: A Different Paradigm
1.7. Repetition-rate applications
A classification of repetition–rate laser systems can, for example, be performedaccording to the envisioned applications
• Direct use of the laser system. The laser parameters must then fit specificapplication requirements.
• Indirect use, where the laser system acts as a pump source: the laser parame-ters must then satisfy pump requirements.
Interest in DPSSL is mainly related to efficiency on one side and the low thermaleffects allowing high repetition rate operation on the other.
Recent years showed major steps in development of high–field physics using high–intense, ultra–short laser pulses. This opened the way for interesting applications,especially in the acceleration of electrons and ions on very short distances, allowingcompact accelerators with outstanding particle pulse durations. One prominentfuture application is the generation of ion beams for cancer treatment, where con-ventional acceleration techniques result in large–scale machines, not suited for thecommon use e.g. in hospitals.
Another important application may be the thermonuclear fusion using lasers, afield known as IFE (Inertial Fusion Energy). Different fusion schemes need differentlasers and different parameters.
This section summarizes the demand for such laser systems in terms of energy andpulse properties. When requested very basic discussions of the physical backgroundand the related physical problems are derived.
1.7.1. DPSSL and (OP)CPA
After a certain period of stagnation in terms of short pulse duration, Chirped PulseAmplification (CPA) [70] gave a major boost for the available peak power. Drivingthe development further in terms of available peak intensity will only be realizablewith an increase in energy for pulses in the fs–regime coupled to a tight control ofbeam focusability through adaptive optics [73, 74].
A typical critical power for laser gain media is in the order of 1−3 TW (see Figure1.8) and pulses are usually stretched to the order of a few nanoseconds. Energies upto the order of kilojoules are by this possible. Exawatts of laser power (1018 W) arepotentially feasible if an appropriate bandwidth, an amplifying gain medium with asufficient large diameter and a compression of the amplified, stretched pulses can be
36

ASE and Thermal Management on a High Average-Power DPSSL
achieved. In this extreme case it gets increasingly complicated to compensate theaccumulated phase [75] and to control the intensity and energy contrast of such alaser system.
The choice whether one or more amplifying stages of the laser system should berealized as a DPSSL or if the DPSSL should act as a pump source, depends on thenecessary bandwidth. As discussed in the previous section, gain media available forpumping by laser diodes have a bandwidth which is significantly less than 100 nm.As those laser systems work in the NIR near 1 µm pulses shorter than ≈ 30 fs arenot easily accessible. Shorter pulses are only available if combinations of differentgain media are used in the amplifier chain or in the case the DPSSL acts as a pumpfor a Ti:Sa CPA laser system or for an OPCPA (Optical Parametric Chirped PulseAmplification).
OPCPA combines the Optical Parametric Amplification (OPA) [76] with the CPAconcept. The gain medium in an OPCPA system is replaced with a non–linearcrystal and the transfer between the pump (i.e. generated by the DPSSL) baseson non–linear wave mixing. The main advantage is a large available bandwidth forultra–short pulses [77]. Despite the absence of ASE, we have unfortunately OpticalParametric Noise and Parametric Fluorescence as contrast–limiting effects [78]. Theefficiency of OPCPA systems varies typically between 20− 30% [79, 80].
If the DPSSL is chosen to act as a pump source for the corresponding laser system,conversion and extraction efficiency of the pump system has to be taken into accountseparately, which leads to a global 10− 20% efficiency.
The electron acceleration by laser interaction is mainly defined by the maximumof the normalized vector potential of the laser pulse a0 [81]:
a0 ' 8.6× 10⁻¹⁰ λL I1/2L (1.7.1)
where λL[µm] is the laser wavelength and IL[W cm−2] is the laser intensity atthe laser focus. Relativistic effects become important if a0 ≥ 1, therefore for awavelength of λ = 1 µm for intensities IL ≥ 1.36× 10¹⁸ W cm−2. Current lasersystem achieve peak intensities of up to IL ≈ 1020 W cm−2 consequently a0 ≈ 10.The peak electric field strengths reach Eelec
peak[TV m−1] ≈ 3.2 a0/λ[µm]. The electronmotion becomes relativistic and the laser–plasma interaction becomes nonlinear. Asthe magnetic component of the Lorentz force will create a component in the laserlight propagation direction, electrons get accelerated. A good overview over thetheory of laser–driven plasma–based electron accelerators can be found in [81].
Electron energies of up to 1 GeV have been demonstrated so far [82]. Laser systemsused are table–top sized and show powers in the order of 50 TW with pulse durations
37

1. Delivering High Energy at High Repetition Rate: A Different Paradigm
between 30 − 50 fs. The electron energy scales in respect to the laser power PL asEe ∝ P
1/3L and, concerning the electron bunch charge, we get Cbunch ∝ P
1/2L [83].
High electron energies in the order of a few GeV with charges in the order of 1 nC
requires a laser of the petawatt–class with pulse durations in the order of 100 fs orless [83].
Generating proton beams is currently only accessible via a secondary effect as theprotons are 1836 times less susceptible to acceleration than electrons due to theirhigher mass. Typical laser pulses show an ASE pedestal and potential pre–pulseswhich generates a plasma if the high–intense laser pulse hits a target (i.e. a metalfoil). As this heating generates electrons and their mean free path is long enough totravel through the target material, a strong charge separation is generated tearingpositively charged ions and protons along their path [84, 83]. Using microstructuredtargets, one can favor a defined energy range and quasi–monoenergetic proton beamsare possible [85].
Using proton beams for cancer treatment would need energies in the order of 100−200 MeV as well as a sufficient repetition rate (i.e. 1 Hz). Such laser systems wouldhave peak powers in the order of PL ≈ 1− 2 PW [83] and demand a good temporalcontrast (pre–pulses e.g. should not show intensities of more than 1014 W cm−2).
1.7.2. Laser Fusion
Shortly after the first Q–switched lasers were demonstrated, the idea to create a laserpulse intense enough to ignite DT (Deuterium–Tritium) fuel came into mind. Suchthermonuclear burn gives access to a rather clean source of energy, when consideringthe relatively short lifetime of associated nuclear wastes.
The first approach is historically the Inertial Confinement Fusion (ICF) triggered bylaser impact (laser fusion). A fuel capsule is imploded by a laser-driven expandingplasma (corona) on its surface such that certain values of core temperature and den-sity are achieved. They must obey the Lawson criterion [86]. A major breakthroughto achieve those compression factors is an isentropic compression using laser pulseshaping on nanosecond time scale [87]. Those pulses have a pulse shape in the formof
P (t) ∝ 1
|t− t0|β(1.7.2)
where β is ≈ 2. In special cases β = 2 can be shown explicitly [88]. This schemecan be called Central Ignition (CI) as the hot spot, where the thermonuclear burn
38

ASE and Thermal Management on a High Average-Power DPSSL
starts, is situated in the center.10 In this regime, two routes are conceivable:
• direct drive with a directly laser-irradiated capsule
• indirect drive where the laser energy is first converted into X-rays with helpof a small Hohlraum target surrounding the capsule
Direct drive is somehow unfavorable as it implies high demands for the spatial unifor-mity of the laser light of the target. A nonuniform pump distribution would give riseto hydrodynamic instabilities which inhibit compression, thus more driver energy isrequired. Expanding plasma has a critical density and light entering the plasmafront will be reflected at the critical electron density ncr = ω2
Lε0me/e2. Usually
the laser wavelength is converted to the third harmonic increasing significantly thepenetration.
The conversion to X-rays on the other hand smears the intensity variations out, theirradiation is more homogeneous, and allows a much better penetration. However,an indirect driven target is much more complicated and this conversion has its ownlimited efficiency. The energy requirement for such a pulse [87] is in the order of
EICF = 1− 2 MJ @ 3ω, 5 ns (1.7.3)
With a conversion efficiency of about 50% from the NIR to the UV wavelength, theenergy at ω must be then approximatly 4 MJ. In the case of a glass laser chain, peakpowers of 3 − 4 TW are reasonable taking into account critical power limitations.Consequently about 200 laser lines are necessary.11
To overcome the strong demand on the compression energy the concept of FastIgnition (FI) was proposed in 1994 [89]. The thermonuclear fuel is pre–compressedusing spherical implosion [90] and then ignited near the center of the compressedfuel using a heating event12. This has the advantage that less laser power andenergy is needed for compression. The triggering event near the compressed coremight be electrons or ions injected from an external source or an ultra–intense laserpulse generating the hot electrons. Once the burn started, a burn wave propagatesthrough the whole fuel.
10The overall process is somewhat similar to a Diesel combustion engine.11In the case of a material using a lower critical power, the number of laser lines has to be adjusted
consequently.12As the CI is compared with a Diesel engine, one might understand the FI as a gasoline combustion
engine.
39
1. Delivering High Energy at High Repetition Rate: A Different Paradigm
In the case of a high–energy, ultra–intense laser pulse, the requested laser energyEigL is[91]:
EigL ≥ 93
(ρ
300 g/cm3
)−0.9 [fRλig0.5 µm
0.25
ηig
]2
kJ (1.7.4)
where g is the fuel density, fR is a parameter close to unity, λig the ignition pulsewavelength and ηig the amount of laser energy transfered to the compression fuelthrough hot electrons. The laser pulse has consequently an energy in the order of100 kJ. Typical estimated pulse durations are in the order of 10 ps. The compressionpulse shows a similar shaping compared to the ICF case but with an energy of only≈ 180 kJ.
Again, the compression pulse must be converted to the third harmonic implyingan efficiency of about 50%. About 400 kJ are by this needed resulting in at least20 laser lines, which is a factor of 10 less than for CI. The main problem lies in theshort pulse part, as those powers need the application of CPA. The problem of LIDTof gratings, grating size and grating separation favor large bandwidth pulses [92].Using the same type of laser lines for the ignition pulse, another (at least) 10 laserlines are necessary. However those beams have to be combined within a restrictedangle from one side onto the compressed thermonuclear fuel.
A relatively new concept of FI is Shock Ignition (SI) [93, 94]. The ignition isgenerated through an additional hydrodynamic laser-generated shock. The overallconcept is close to the CI combined with additional laser pulses generating theshock. This combines the relatively relaxed requirements for the compression (slowbut efficient compression) with an all–optical approach, free of an additional particlesource. This shock is generated by a “spiked” pulse at the end of the nanosecondcompression pulse13. The total laser energy is less then for the standard CI.
This scheme uses only 50−75 kJ in a 300−500 ps [90]. If a temporal substructurewithin the sub–ns pulse is demanded, stretching and compression of the pulses isnecessary. If the hurdle of a temporal shaping could be overcome, a CPA part couldbe avoided.
The main advantages of SI compared to FI is that the beam spot sizes are con-centrated uniformly on the (spherical) fuel capsule. However, detailed calculationsfor peak power, B–Integral, etc. are necessary to asses more informations about themaximum achievable performance of appropriate laser lines for FI and SI.
13As CI has its analogon in the Diesel engine, the FI as the gasoline engine, the SI can beunderstood as a low–pressure Diesel engine, whose cylinders shrink abruptly at maximumcompression to finally initiate the burn.
40

ASE and Thermal Management on a High Average-Power DPSSL
The HiPER (High Power laser Energy Research) project currently favors a ∼ 10 Hz
repetition rate Shock Ignition scheme. LULI is strongly involved in this pan–European program in terms of Laser–matter interaction as well as Laser–developmentthrough the Lucia laser system. In the next section, DPSSL facilities throughoutthe world are described.
1.7.3. State of the Art
Project Mercury HALNA GENBU POLARIS PFSLocation USA Japan Japan Germany GermanyApplication IFE/Ti:Sa IFE IFE CPA OPCPAGain medium Yb:S–FAP Nd:Glass Yb:YAG Yb:Glass Yb:YAGPulse energy [J] 55(100) 21.3(100) 0.22(1000) 12(150) 2.9(4×12)Pulse duration [ns] 14 9 10 2 6(2)Repetition rate [Hz] 10 10 100 0.05 1(10)Center wavelength [nm] 1050 1050 1030 1030 1030Pump Wavelength [nm] 899 808 940 940 940o–o efficiency [%] 12 12 30 5 9
Table 1.3.: Comparison between the different DPSSL laser systems worldwide [95].Target characteristics are given in parenthesis.
Throughout the world, a limited number of High–Energy–Class Diode PumpedSolid–State Lasers (HEC–DPSSL) are currently under construction, mainly situatedin USA, Europe and Japan. Those systems can be divided into two groups of lasersaccording to their application. As mentioned before, the application drives therequired characteristics of those laser system, swiftly speaking of the repetition rate,pulse duration, pulse energy and restrictions to the amplifying material.
One one side there are efficiency–oriented ns–lasers mainly dedicated to the fieldof IFE and on the other side the laser systems dedicated to (OP)CPA applications.Table 1.3 summarizes the current point of development of those systems.
POLARIS The POLARIS (Petawatt Optical Laser Amplifier for Radiation Inten-sive experimentS) system is the only direct–diode–pumped fs–laser in this overview.The laser gain material is Yb:FP–glass offering a sufficient wide gain bandwidth tosupport pulses in the order of 100 fs. It relies on the CPA–technique being structuredaccording to an oscillator–stretcher–amplifiers–compressor architecture. As the gainmedium is glass, a high repetition rate such as 10 Hz can not be reached. The target
41

1. Delivering High Energy at High Repetition Rate: A Different Paradigm
pulse energy after compressor is 150 J at a repetition rate of 0.05 Hz. Combinedwith a pulse duration of 150 fs, a 1 PW laser system would be realized. Withinthe amplifier, the pulse is stretched to 2 ns, gets subsequently amplified within fiveamplifier stages (the last contains 240 laser diode modules with 6 J at 940 nm each)and is recompressed using a tiled grating compressor [96].
Current operation is at 10 J which results in a 60 TW laser system.
Petawatt Field Synthesizer The Petawatt Field Synthesizer (PFS) is an OPCPAlaser system aiming at few–cycle laser pulses (∼ 5 fs) with energies above 3 J andrepetition rate of 10 Hz [97]. The pump source is a DPSSL laser system with fourlaser arms each delivering 12 J at 1030 nm. The pump laser is a CPA on its own andproduces frequency–doubled ≈ 6 J with pulse durations of 1− 10 ps.
A portion of the pulse used in he OPCPA part is used to generate the seed forthe pump laser part ensuring the synchronization. Currently about 3 J have beenshown on the pump laser part [98].
MERCURY The first 100J–class DPSSL program developed and yet showing thehighest performance is the MERCURY project [99, 100]. The system uses two mainamplifiers in a image–relayed four–pass setup. Each of the amplifier heads hostsseven thin slabs and is cooled using a turbulent He–gas flow. The gas flows betweenthe slabs with a low Mach number (≈ 0.1) and ensures an efficient cooling. Thegain medium is Yb3+ doped S-FAP [101] pumped from both sides along extractiondirection.
The achieved output energy is ≈ 55 J at a repetition rate of 10 Hz. It has shownthat such systems can work stable for a long time (> 2× 10⁵ shots have been shownso far). In the same time an efficient frequency conversion at a high average powerhas been shown. Dedicated applications range from scaling for laser fusion beamlines to Ti:Sa pumping for ultra–short laser pulses.
HALNA The Japanese HALNA (High Average–power Laser for Nuclear FusionApplication) [102] system relies on a zig–zag amplifier design to generate in the finallayout 10 ns pulses with 100 J at a repetition rate of 10 Hz. The beam travels underTotal Internal Reflection (TIR) within the gain medium. Despite it is intendedto work at a high average power, a Nd3+ doped glass was chosen. The strongdeformation of the glass under pumping is partially compensated by an electricalheating of the the not pumped periphery. A low beam quality is inherent to thezig–zag slab geometry used. Due to the choice of the dopant, pump pulse duration isin the order of ∼ 200 µs. Nevertheless more than 21 J were achieved at 10 Hz [103].
42

ASE and Thermal Management on a High Average-Power DPSSL
Favored applications for such beams are surface treatment applications. Experiencesdrawn out of this program are a vital input for cryogenic approaches for a betterbeam quality which are currently under study by this group.
GENBU The most ambitious project in the context of this section is the GENBU(Generation of ENergetic Beam Ultimate) laser. It is designed as a CPA laser systemcomprising two optically synchronized laser lines. One laser line will be dedicated toa cryogenic Yb3+:YAG laser system in an active mirror scheme with a pulse energyof 1 kJ, pulse durations 10− 100 ps and repetition rates of up to 100 Hz [104].
A part of this laser light is frequency converted and used as the pump pulse ofthe ultra–short, ultra–intense OPCPA laser line. Large bandwidths support pulsedurations down to ∼ 5 fs with pulse energies of up to 10 J and a repetition rate ofup to 100 Hz.The current development is in the first stages of the GENBU laser system demon-
strating 1 J with a repetition rate of 100 Hz [105].
43


2. The Lucia Laser System
2.1. Overview
Figure 2.1.: Schematic overview over the Lucia laser system.
The Lucia laser system is a DPSSL program aiming at a 100 J, 10 Hz (i.e. a kWaverage power) laser pulse train. A pulse duration around 10 ns is targeted. Thewhole system relies on Yb3+:YAG as its gain medium and thereby the wavelengthwill be 1030 nm.
This thesis is situated within the context of the first 10 J milestone for laseroperation at a repetition rate close to 2 Hz and a pulse duration of ≤ 10 ns.
Figure 2.1 shows the layout of the laser system as a sketch. An oscillator generatesthe initial pulses which are amplified in the two stage pre–amplifier system to a sub–Jlevel. Successive magnification and a beam shaping section using a serrated aperturemagnifies the beam to a diameter of 22 mm. The main amplifier stage boosts theenergy to the 10 J level in four passes before the laser pulse leaves the laser system.
A short description of every stage of the Lucia laser system is given withinthis chapter. The following section describes the oscillator followed by the pre–amplification stage. The final two sections are dedicated to the beam shaping andfinally the description of the main amplifier.
45
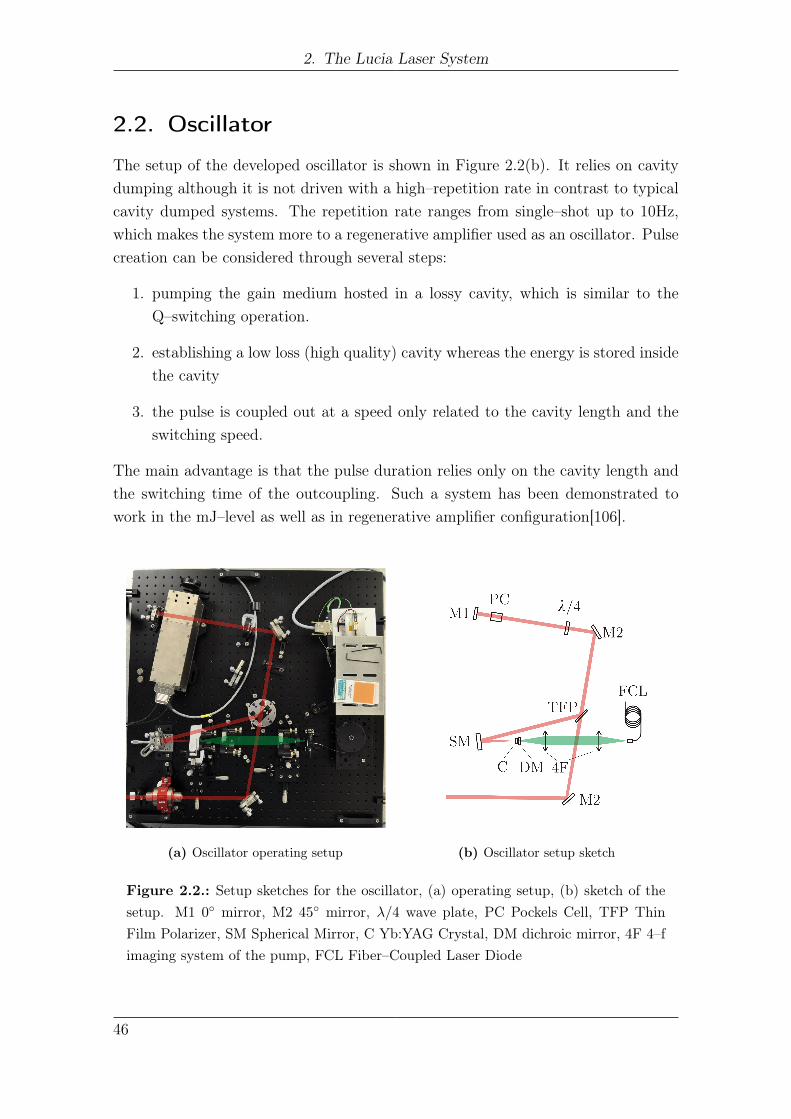
2. The Lucia Laser System
2.2. Oscillator
The setup of the developed oscillator is shown in Figure 2.2(b). It relies on cavitydumping although it is not driven with a high–repetition rate in contrast to typicalcavity dumped systems. The repetition rate ranges from single–shot up to 10Hz,which makes the system more to a regenerative amplifier used as an oscillator. Pulsecreation can be considered through several steps:
1. pumping the gain medium hosted in a lossy cavity, which is similar to theQ–switching operation.
2. establishing a low loss (high quality) cavity whereas the energy is stored insidethe cavity
3. the pulse is coupled out at a speed only related to the cavity length and theswitching speed.
The main advantage is that the pulse duration relies only on the cavity length andthe switching time of the outcoupling. Such a system has been demonstrated towork in the mJ–level as well as in regenerative amplifier configuration[106].
(a) Oscillator operating setup (b) Oscillator setup sketch
Figure 2.2.: Setup sketches for the oscillator, (a) operating setup, (b) sketch of thesetup. M1 0 mirror, M2 45 mirror, λ/4 wave plate, PC Pockels Cell, TFP ThinFilm Polarizer, SM Spherical Mirror, C Yb:YAG Crystal, DM dichroic mirror, 4F 4–fimaging system of the pump, FCL Fiber–Coupled Laser Diode
46
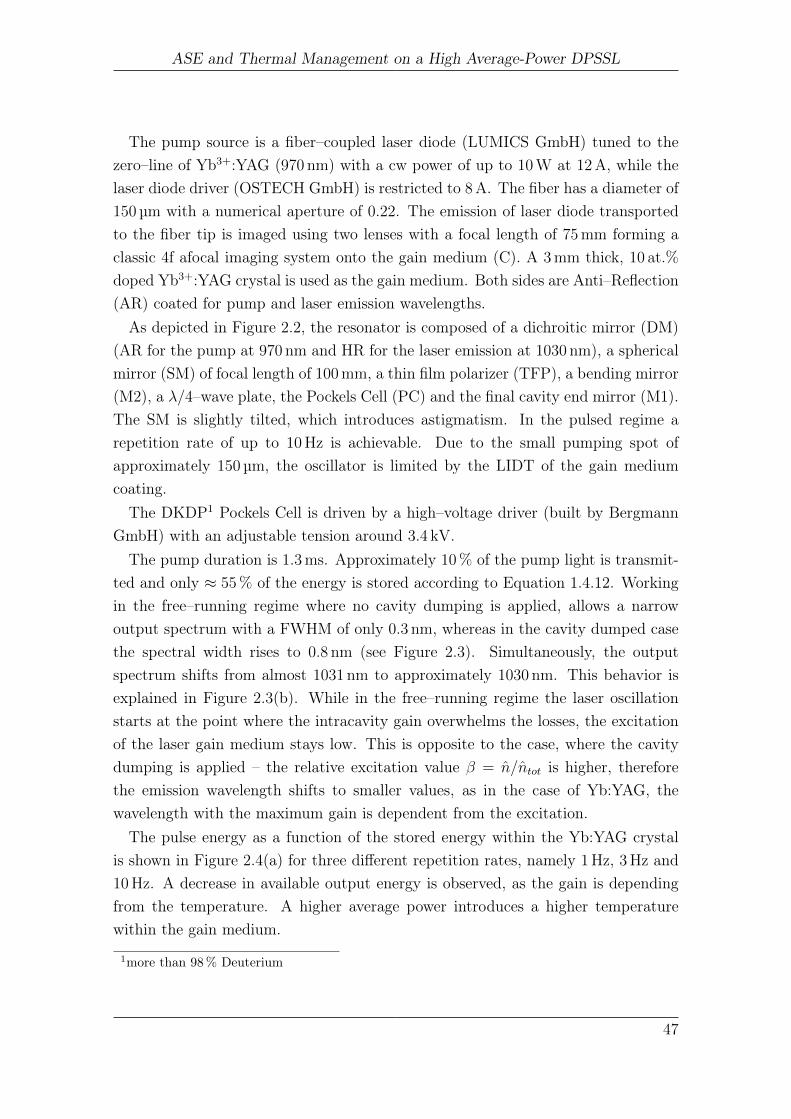
ASE and Thermal Management on a High Average-Power DPSSL
The pump source is a fiber–coupled laser diode (LUMICS GmbH) tuned to thezero–line of Yb3+:YAG (970 nm) with a cw power of up to 10 W at 12 A, while thelaser diode driver (OSTECH GmbH) is restricted to 8 A. The fiber has a diameter of150 µm with a numerical aperture of 0.22. The emission of laser diode transportedto the fiber tip is imaged using two lenses with a focal length of 75 mm forming aclassic 4f afocal imaging system onto the gain medium (C). A 3 mm thick, 10 at.%
doped Yb3+:YAG crystal is used as the gain medium. Both sides are Anti–Reflection(AR) coated for pump and laser emission wavelengths.
As depicted in Figure 2.2, the resonator is composed of a dichroitic mirror (DM)(AR for the pump at 970 nm and HR for the laser emission at 1030 nm), a sphericalmirror (SM) of focal length of 100 mm, a thin film polarizer (TFP), a bending mirror(M2), a λ/4–wave plate, the Pockels Cell (PC) and the final cavity end mirror (M1).The SM is slightly tilted, which introduces astigmatism. In the pulsed regime arepetition rate of up to 10 Hz is achievable. Due to the small pumping spot ofapproximately 150 µm, the oscillator is limited by the LIDT of the gain mediumcoating.
The DKDP1 Pockels Cell is driven by a high–voltage driver (built by BergmannGmbH) with an adjustable tension around 3.4 kV.
The pump duration is 1.3 ms. Approximately 10 % of the pump light is transmit-ted and only ≈ 55 % of the energy is stored according to Equation 1.4.12. Workingin the free–running regime where no cavity dumping is applied, allows a narrowoutput spectrum with a FWHM of only 0.3 nm, whereas in the cavity dumped casethe spectral width rises to 0.8 nm (see Figure 2.3). Simultaneously, the outputspectrum shifts from almost 1031 nm to approximately 1030 nm. This behavior isexplained in Figure 2.3(b). While in the free–running regime the laser oscillationstarts at the point where the intracavity gain overwhelms the losses, the excitationof the laser gain medium stays low. This is opposite to the case, where the cavitydumping is applied – the relative excitation value β = n/ntot is higher, thereforethe emission wavelength shifts to smaller values, as in the case of Yb:YAG, thewavelength with the maximum gain is dependent from the excitation.
The pulse energy as a function of the stored energy within the Yb:YAG crystalis shown in Figure 2.4(a) for three different repetition rates, namely 1 Hz, 3 Hz and10 Hz. A decrease in available output energy is observed, as the gain is dependingfrom the temperature. A higher average power introduces a higher temperaturewithin the gain medium.
1more than 98 % Deuterium
47

2. The Lucia Laser System
(a) Oscillator spectra in the free–running and cavity dumped regime.
(b) Oscillator wavelength shift explanation
Figure 2.3.: Spectra for the free–running and the cavity dumped operation of theoscillator are shown in (a). The maximum gain wavelength varies with the excitationvalue β = n/nnot (b) and therefore the output wavelength of the oscillator shifts.
48

ASE and Thermal Management on a High Average-Power DPSSL
As the optical length of the cavity divided by c is approximately 5 ns and thefall time of the Pockels–Cell is approximately 5 ns too, a resulting pulse durationof approximately 7.2 ns is found. The temporal pulse form is displayed in Figure2.4(b).
The spatial beam profile is Gaussian in the near field as it is shown in Figure2.5(a). Due to the slight off-axis use of the spherical mirror, an astigmatism can befound in the far field (Figure 2.5(b)).
Oscillator protection from unwanted reflections is performed with a Faraday iso-lator (more than 30 dB extinction ratio). Consequently the polarization is turnedby 45.
49

2. The Lucia Laser System
(a) Oscillator energy as a function of stored pump energy for three differentrepetition rates
(b) Oscillator temporal pulse shape
Figure 2.4.: Energy characteristics of the oscillator, (a) shows the pulse energy as afunction of the stored energy and (b) the temporal pulse shape.
50

ASE and Thermal Management on a High Average-Power DPSSL
(a) Oscillator near field transverse intensity distribution (left), with horizontal lineout(right). As comparison, a Gaussian fit is given.
(b) Oscillator near field transverse intensity distribution (left), with horizontal and verticallineout (right).
Figure 2.5.: Output beam shape of the operating oscillator, (a) shows the near fieldof the laser pulse, (b) the far field. Lineouts are given.
51
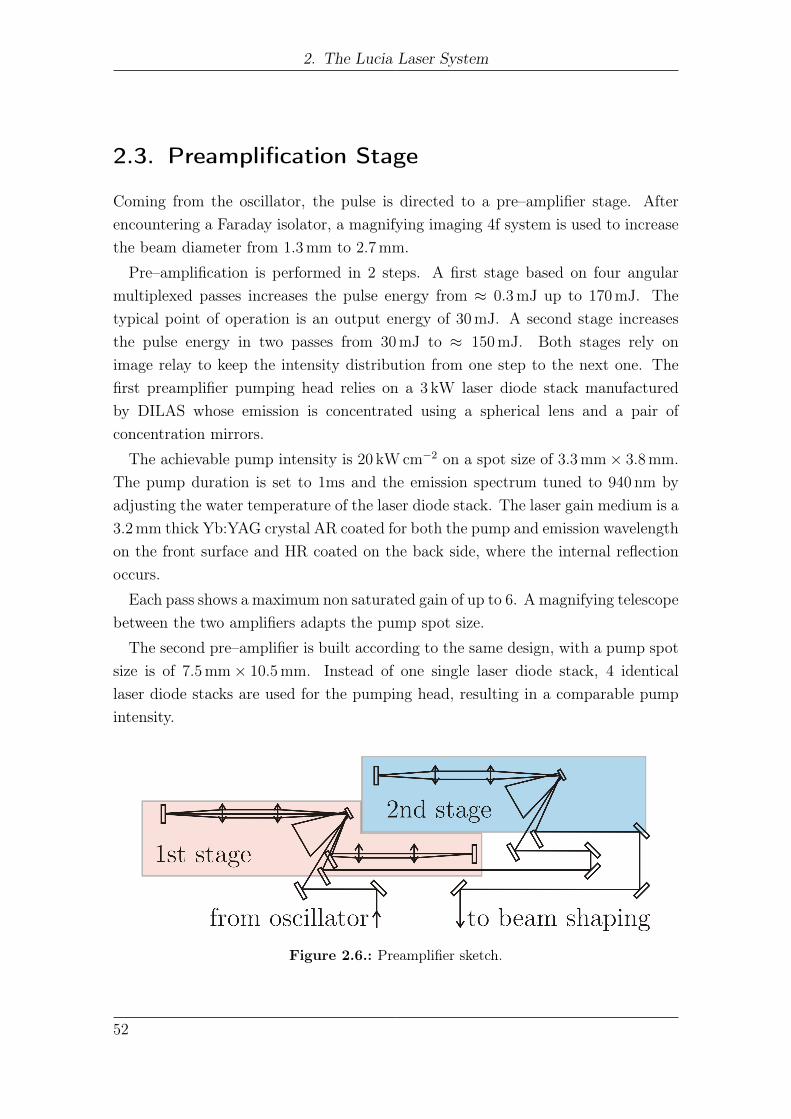
2. The Lucia Laser System
2.3. Preamplification Stage
Coming from the oscillator, the pulse is directed to a pre–amplifier stage. Afterencountering a Faraday isolator, a magnifying imaging 4f system is used to increasethe beam diameter from 1.3 mm to 2.7 mm.
Pre–amplification is performed in 2 steps. A first stage based on four angularmultiplexed passes increases the pulse energy from ≈ 0.3 mJ up to 170 mJ. Thetypical point of operation is an output energy of 30 mJ. A second stage increasesthe pulse energy in two passes from 30 mJ to ≈ 150 mJ. Both stages rely onimage relay to keep the intensity distribution from one step to the next one. Thefirst preamplifier pumping head relies on a 3 kW laser diode stack manufacturedby DILAS whose emission is concentrated using a spherical lens and a pair ofconcentration mirrors.
The achievable pump intensity is 20 kW cm−2 on a spot size of 3.3 mm× 3.8 mm.The pump duration is set to 1ms and the emission spectrum tuned to 940 nm byadjusting the water temperature of the laser diode stack. The laser gain medium is a3.2 mm thick Yb:YAG crystal AR coated for both the pump and emission wavelengthon the front surface and HR coated on the back side, where the internal reflectionoccurs.
Each pass shows a maximum non saturated gain of up to 6. A magnifying telescopebetween the two amplifiers adapts the pump spot size.
The second pre–amplifier is built according to the same design, with a pump spotsize is of 7.5 mm× 10.5 mm. Instead of one single laser diode stack, 4 identicallaser diode stacks are used for the pumping head, resulting in a comparable pumpintensity.
Figure 2.6.: Preamplifier sketch.
52

ASE and Thermal Management on a High Average-Power DPSSL
Figure 2.7.: Setup of the first preamplifier laser head.
53

2. The Lucia Laser System
Figure 2.8.: Setup of the second preamplifier laser head.
54

ASE and Thermal Management on a High Average-Power DPSSL
Figure 2.9.: Output energy after one, two and four passes in the first preamplifier.Input energy was 0.34 mJ. Lens damage occurred to the magnifying telescope afterthe preamplifier.
While in the first amplifier four round trips take place, only two passes are realizedin the second amplifier in order to take LIDT considerations into account.
Due to a ten times lower thermal load, emission wavelength is shifted ≈ 6 nm
towards smaller wavelengths when the laser diode stacks operate at 1 Hz instead oftheir nominal 10 Hz repetition rate design point. Taking into account a measuredthermal shift of 0.3 nm/K for the laser diode stack peak emission wavelength, anincrease of 18 K for the cooling water was requested (43 C instead of 25 C).The extraction scheme used in the amplifier heads is the active mirror scheme.
A simplified overview of the three main pumping schemes is shown in Figure 2.10,where single side pumping, counter–propagating pumping and the active mirrorscheme is illustrated.
Graph 2.9 shows the experimental results for the extracted energy in the case ofan injection of 0.34 mJ after one, two and finally four passes at 2 Hz. A maximumenergy level of 170 mJ was achieved, limited by the LIDT of the transport opticsbetween the first and second pre–amplifier. The maximum achieved total gain withinthis amplifier setup is ∼ 500 at a repetition rate of 2 Hz.
55

2. The Lucia Laser System
(a) Single side pumping (b) Counter propagating pump (c) Active mirror
Figure 2.10.: Description of the three major pumping schemes. The most commonpumping geometry is shown in (a) where the pump is incident from one side onlyresulting in a strongly varying gain profile (indicated by the small red curve). Animprovement is the counter propagating pumping scheme (b) and especially the activemirror scheme (c) used in the Lucia amplifiers.
56

ASE and Thermal Management on a High Average-Power DPSSL
2.4. Beam Shaping
Getting an efficient energy extraction in amplifier systems implies to satisfy severalconstraints. For instance it is desirable to have a sufficient high fluence of the laserpulse to achieve saturation, or a sufficient amount of round trips in the amplifyingmedium, to efficiently extract stored energy.
Also, as shown in Table 1.2 the beam overlap plays an important role in termsof efficiency. Pump and extraction area should indeed match as much as possible.Satisfying these specific requirements often implies tight adjustment of pump lightdelivery optics, laser head mechanical mount and extraction optics. Minimizing thepresence of edges, which ultimately generate diffraction, along the extraction beampath becomes therefore very difficult.
This is especially true at the Lucia amplifier head, where four concentrationmirrors and a circular mask are in close contact with the laser head. The availablespace for the extraction beam path is very narrow. Figure 2.11 depicts the laserhead assembly with the concentration mirrors and mask.
Performing a multi–pass extraction in such an environment with a Gaussian beamwould clearly generate diffraction ripples on both the extraction beam phase andintensity profile and consequently put extraction optics at risk. It is thereforerequested to adjust the intensity transverse distribution.
To perform this task an intermediate beam shaping stage is implemented afterpre–amplification.
Figure 2.11.: View from extraction direction at the main amplifier. The slow axisand fast axis concentration mirrors and the mask are potential sources of diffractionfor the extraction beam.
57

2. The Lucia Laser System
We might rely on two distinct approaches – at first a transformation of the laserbeam transverse energy distribution with, for instance telescopes based on asphericallenses [107] or apodizers using phase plates manipulating the laser output or the laserbeam focus [108, 109]. A more common approach for high power laser systems isthe sculpting of the laser beam shape by the means of soft diaphragms [69] or aserrated aperture[110]. This is the approach selected for Lucia: the use of a serratedaperture combined with a spatial filtering performing apodization (swiftly speakingapodizers), first introduced by Trenholme et. al. on the NOVA laser system in 1978[110]. An example of such a serrated aperture is shown in Figure 2.12.
Figure 2.12.: The apodizer used in the Lucia laser is a chrome mask applied onto asubstrate (anti–reflection coated). The fine tooth structure is illustrated in a magnifiedinset.
The name apodization derives from the greek α (to take away) and ρoδoς (foot),literally meaning ‘taking the foot away’ or more illustrative ‘cutting the feet’. Com-ing out of the signal theory, the term found its way to optical applications referringto an action which changes the intensity distribution in the near field.
The serrated aperture cuts the unwanted peripheral parts of the beam. Teeth atthe outer boundaries of this intensity filter are used to get a defined slope at theedges. Since it introduces sharp edges, this will generate high spatial frequenciesleading to a strongly disturbed beam shape with hot spots at the outer edges afterfree propagation. Consequently, the serrated aperture needs to work together witha subsequent spatial filtering. The filtering function has to be designed in a manner,
58

ASE and Thermal Management on a High Average-Power DPSSL
that the spatial frequencies in the direction perpendicular to the teeth are cut out,but the intensity variation parallel to the teeth is conserved.
Figure 2.13.: Apodizer setup general
The shape of the teeth used impacts the slope at the edges of the resulting beam.Size and slope are by this important in terms of transmission and the resulting beamshape. The most intuitive shape is the triangular tooth. However, applicationsdemanding a proper slope demand a well defined transmission function and by thisa well defined tooth pattern.
As mentioned before, such a beam–shaping device consists of a serrated aperturecoupled to a spatial filtering. The object and image plane positions of such anarrangement are related as follows:
L1f2
f1
+ L2f1
f2
= f1 + f2 (2.4.1)
where L1 is the distance from the image plane to the first lens, L2 the distancefrom the second lens to the object plane. The lenses have focal lengths of f1 andf2 respectively. Both lenses are separated by f1 + f2, therefore describing the imagerelay technique forming an image from one plane to the next one, while conservingphase and intensity. A special type would be the classical 4f–assembly when L1 =
L2 = f1 = f2.Considering a lens as a Fourier operator, estimating the impact of the applied
filtering function can be done by generating the 2D–Fourier transform of the electricfield amplitude distribution with the specific serration pattern. Then, multiplyingthe result in the Fourier space with the diaphragm function and finally applying aninverse 2D Fourier transformation to get the resulting beam shape after filtering.
The base length of the teeth is L and their height H (see Figure 2.14). Theteeth consequently introduce a period H in radial and L in tangential direction.After passing the serrated aperture, it is the task of the spatial filtering function toeliminate the tangential modulation in the focal plane.
59

2. The Lucia Laser System
Figure 2.14.: Apodizer teeth design sketch
Let us consider the separation u in the Fourier–space introduced by a period L
and a lens with a focus f . We know that the spatial frequency kL = 1/L yields:
1
L=
u
λf(2.4.2)
u =λf
L(2.4.3)
We will see diffraction rings according to the radial and tangential spatial frequencywhich should be sufficiently separated. Consequently the tangential pattern shouldcarry a higher spatial frequency – the teeth have to be higher than wide. As a ruleof thumb, the relationship between between the height H and teeth width L shouldbe at least
H
L& 3. (2.4.4)
The Number of teeth is determined by the allowable height H and Equation 2.4.4.Figure 2.15 gives an illustrative example of a circular aperture with an outer radiusof rout = 10 mm and N = 80 as the number of teeth. As one can easily estimate, wedo not completely fulfill Equation 2.4.4. The amount of teeth needed is given by:
N &6πroutH
(2.4.5)
The pinhole diameter ∅ filtering the serration pattern should then be smaller than:
∅ < 6λf
H. (2.4.6)
The realization of the teeth pattern is subject to different approaches, which mightbe:
60

ASE and Thermal Management on a High Average-Power DPSSL
(a) Triangular teeth pattern (b) Triangular teeth pattern FFT
Figure 2.15.: Triangular teeth pattern example with 80,f=1m, 633nm teeth (a) andits distribution in the focal plane (b)
1. Direct writing of the serration pattern: laser cut metallic sheet or a metalvapor deposition with the appropriate pattern. These techniques are wellknown, but suffer from laser induced damage due to the nature of metals.
2. Another possibility would be a double–sided anti-reflection coated bulk mate-rial [111]. The serration pattern is introduced by destroying partially the AR-coating using a laser or sand-dusting. Mixing Fresnel reflection and scatteringmay give a durable high–power apodizer. Unfortunately getting edge profile ofquality might be difficult when using sand–dusting in respect to the brittlenessof the coating material. fs–laser surface damage would be preferred for the sakeof precision but will severely impact the speed of writing the serration pattern.
3. An alternative would be to write small bubbles within the material implyingMie–scattering for spheres with a diameter of approximately the same size asthe wavelength. This has the advantage to use commercially available tech-niques. Randomly distributed spheres within the serration pattern should givea quite homogeneous extinction profile probably superior to the sand–dustingtechnique. As this is not tested until now (not know by the author), thismight be a very attractive alternative, as the writing is widely commerciallyavailable.
Apodization with serrated apertures is performed on the Lucia laser system forthe last amplifying stage boosting the energy from the 100mJ–level to the J–level.
61

2. The Lucia Laser System
The beam radius is set for the beam shaping section to be rout = 11 mm and thetooth height is set to be H = 1 mm. According to Equation 2.4.5 the requestednumber of teeth would be N & 200. The wavelength being λ = 1030 nm and thefocal length f = 1 m, the pinhole diameter (according to Equation 2.4.6) needs thento be D . 6 mm.
Figure 2.16 simulates the apodizer setup used on Lucia. Figure 2.16(a) depictsthe image teeth pattern used and Figure 2.16(b) shows the intensity distributionin log–scale in the Fourier–plane (focal length is 1 m). Filtering the high spatialfrequencies is done using a 5.6 mm diameter diaphragm. The resulting intensitydistribution is shown in Figure 2.16(c).
A serrated aperture was manufactured by IMTAG with an external radius rout =
11 mm, 200 teeth and a tooth height of H = 1 mm. The triangular teeth arestructured on a Chromium mask on a double–sided AR coated, laser quality BK7–substrate.
Testing these predictions was one of the main interests of an experimental verifi-cation. The impact of the serration pattern is shown in Figure 2.17. Starting withan initial beam shape depicted in Figure 2.17(a), the serrated aperture is insertedinto the beam, showing the serration pattern in Figure 2.17(b) when observed in thecorresponding image plane. Filtering the diffraction pattern (shown in Figure 2.18)results in the defined beam border as depicted in Figure 2.17(c).
62
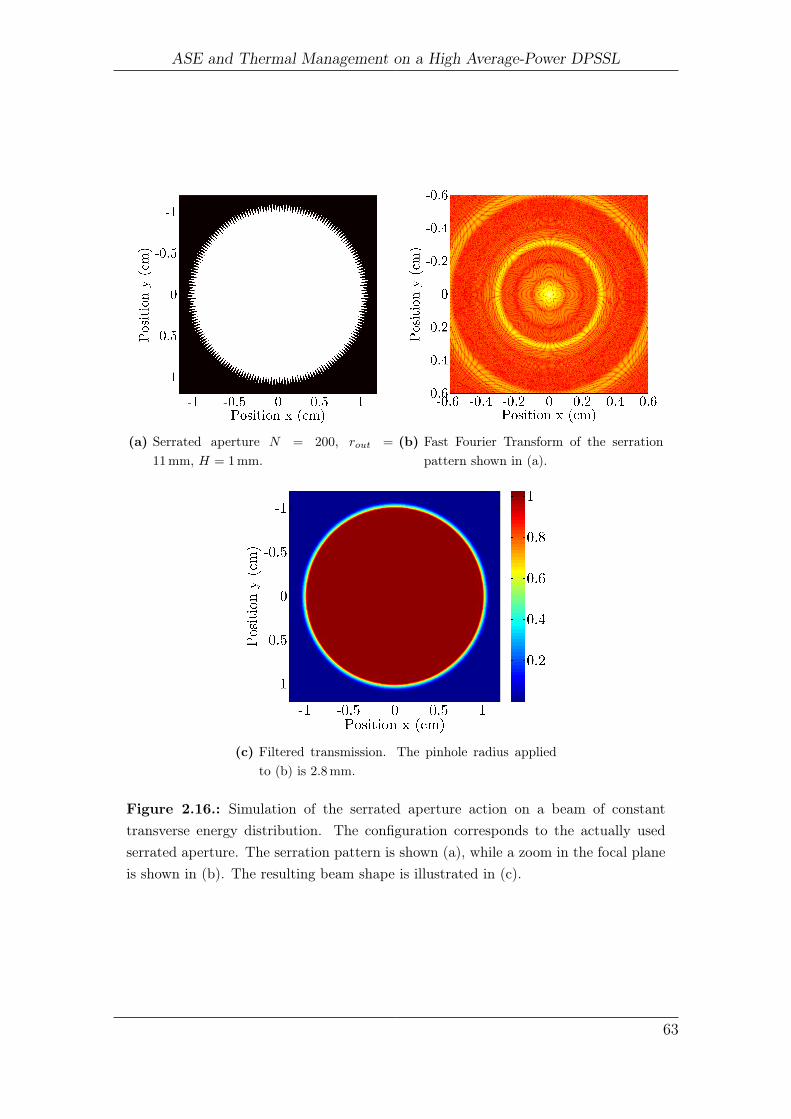
ASE and Thermal Management on a High Average-Power DPSSL
(a) Serrated aperture N = 200, rout =
11 mm, H = 1 mm.(b) Fast Fourier Transform of the serration
pattern shown in (a).
(c) Filtered transmission. The pinhole radius appliedto (b) is 2.8 mm.
Figure 2.16.: Simulation of the serrated aperture action on a beam of constanttransverse energy distribution. The configuration corresponds to the actually usedserrated aperture. The serration pattern is shown (a), while a zoom in the focal planeis shown in (b). The resulting beam shape is illustrated in (c).
63

2. The Lucia Laser System
(a) Initial intensity distribu-tion
(b) With serrated aperture (c) With serrated aperture andfiltered
Figure 2.17.: The impact of the serration pattern on the initial beam shape (a) in theimage plane is shown in (b). Filtering the appropriate spatial frequencies generates asmooth edge (c).
Figure 2.18.: The upper image shows, in logarithmic scale, a fraction of the calculatedintensity distribution observed in the focal plane of a serrated aperture with N = 200,rout = 11 mm, H = 1 mm. The lower image depicts a stitched intensity distributionmade with different filters with the experimental apodizer, tested with a collimatedHe–Ne (633 nm) laser. The central intensity lobe is blocked. A good agreement isfound.
64

ASE and Thermal Management on a High Average-Power DPSSL
2.5. Main Amplifier
After preamplifying the pulse generated by the oscillator to the level of ≈ 200 mJ
and shaping the beam, a last amplification step is performed in a single amplifierwith four passes. This laser amplifier is made of three major components as depictedin Figure 2.19 and 2.22:
1. The laser diode array housing up to 88 laser diode stacks.
2. The Light Concentration System (LCS) consisting of a set of prisms andconcentration mirrors.
3. The laser head with its laser gain medium.
Each of these elements will be discussed in the following sections.
Figure 2.19.: Overview of the main amplifier. The laser diode array housing up to 88stacks with the multiplexing prisms is shown on the left (a), the large concentrationmirrors (b) and the laser head (c).
2.5.1. Laser Diode Array
The Laser Diode Array (LDA) can host 88 laser diode stacks distributed in elevenrows and eight columns. Each of the laser diode stacks (manufactured by DILAS)has a nominal peak power of 3 kW at 130 A with a typical emission duration of 1 ms,therefore the LDA can emit 264 kW when fully populated.Each current source supplies up to four laser diode stacks with driving currents up
to 150 A at a duty cycle of one percent (nominally 1 ms at a repetition rate of 10 Hz).Under such conditions, no aggressive cooling is necessary for the stacks and conse-quently no micro–channel cooling is required, improving the overall reliability of thelaser diode stacks (corrosion is an inherent risk with micro–channels). Although
65

2. The Lucia Laser System
every column has its own cooling water entry, all eight columns are connected toonly one cooling unit (see Figure 2.20). Such a cooling approach leads to a robustand simple cooling architecture but does not allow an individual water temperatureadjustment for each laser diode stack. In order to do so, we rely on the so–calledbias current.
Applying a constant current besides the pulsed driving current on the laser diodestacks introduces an additional thermal load. This results in a higher averagetemperature of the laser diode junction and leads to a spectral shift similar to whatcan be obtained when changing the cooling water temperature. The dc currentapplied is well below the laser emission threshold (about 15 A). The average shiftfor the laser diode stacks used in the Lucia project is ≈ 0.12 nm/A. Current drivers(AMTRON GmbH) offer up to 1 A with a 5 mA accuracy, giving the possibility toprecisely adjust the emission wavelength over a 12 nm range.
This technique allowed us to relax the constraints on the laser bar sorting proce-dure (wavelength selection) and greatly decreased the overall cost of our stacks.
As stated in Section 2.3, a change from single–shot condition to an operationat 10 Hz introduces a shift of ≈ 6 nm in central emission wavelength. While itwas possible to adjust this shift for the first pre–amplifier by raising the watertemperature by 18 K, a similar shift if achieved for each stack individually on theLDA. Figure 2.21 illustrates the impact of the bias current on the spectrum of 30laser diode stacks in single–shot operation.
Figure 2.20.: Water distribution and cooling of the individual LDA columns. Thewater arrives from one cooling unit and is split up into eight channels using a waterdistribution unit (right). On the LDA, all channels are separately and simultaneouslycooled to improve cooling homogeneity (right).
66

ASE and Thermal Management on a High Average-Power DPSSL
Figure 2.21.: Impact of the bias current on the emission spectra of the laser diodearray. The emission of 30 stacks operated at 0.1 Hz and 130 A can be compared with(bold) and without (green) optimized bias current. The absorption cross section ofYb:YAG is shown as reference (right scale).
2.5.2. Light Concentration System (LCS)
Concentrating the light emitted by the LDA onto the gain medium is performedwith refractive and reflective optics. In order to superimpose at the laser head thelight emitted by each of the eight columns of the the LDA, a set of eight prisms isplaced right in front of the laser diode stacks (see Figure 2.22)
Performing such an angular multiplexing is made possible along the horizontal di-rection thanks to the collimation (divergence < 1) achieved by stack micro–lensing.The resulting depths of focus is compatible with the relatively small thickness of thegain medium (< 1 cm). The impact of the horizontal multiplexing can be seen inFigure 2.23.
The large concentration mirrors used to concentrate the laser diode emission inthe slow axis direction are made out of aluminum, polished and silver coated. Aprotective layer is applied to avoid oxidation of the silver and offers the possibilityto clean the mirrors. Taking into account the reflectivity of silver (< 98 % for theconsidered angle, polarization and wavelength) and the total average power to be
67
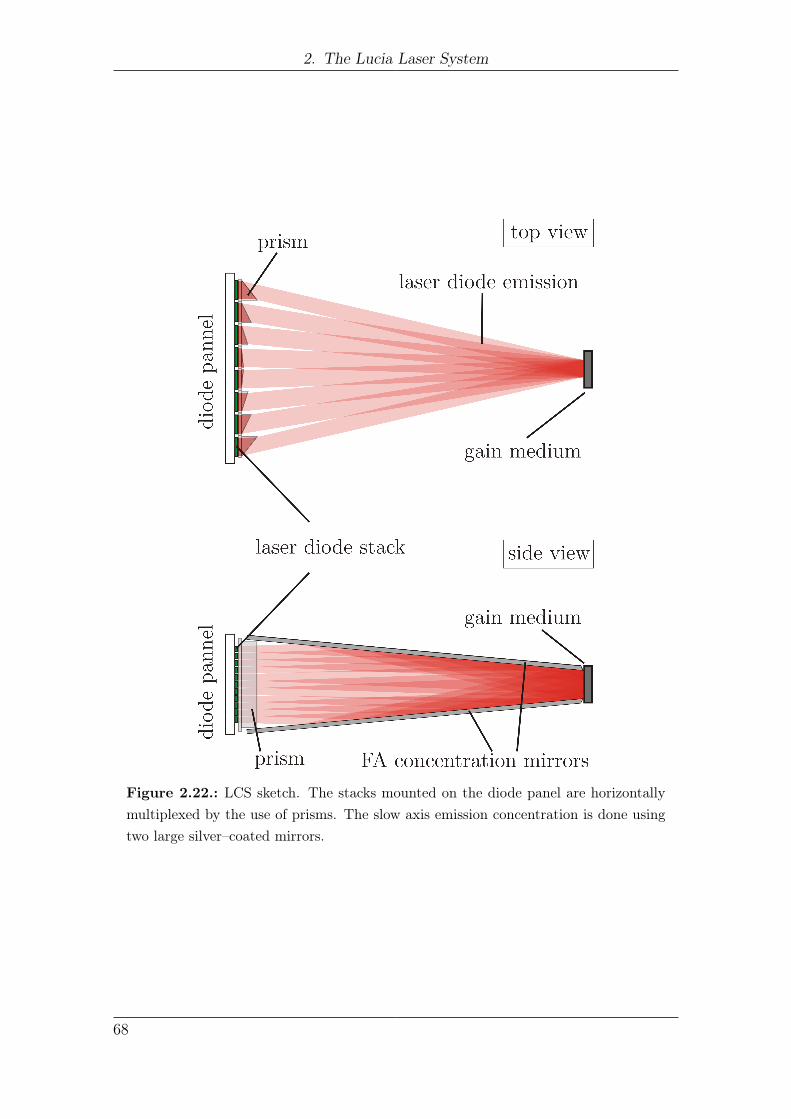
2. The Lucia Laser System
Figure 2.22.: LCS sketch. The stacks mounted on the diode panel are horizontallymultiplexed by the use of prisms. The slow axis emission concentration is done usingtwo large silver–coated mirrors.
68

ASE and Thermal Management on a High Average-Power DPSSL
Figure 2.23.: Horizontal multiplexing of the laser diode emission using the prisms.Only two laser diode stacks in one row are activated. The distance between the diffusivescreen and the laser diode stacks increases from the left to the right.
concentrated, these mirrors are actively cooled. The length of the large mirrors is617 mm. Due to the inclination of the mirrors one finds the superposition of thelaser diode emission approximately at 630 mm after the prisms plane.
Figure 2.24(a) shows the reconstructed composite laser light distribution in theplane of superposition without the action of the large concentration mirrors for30 stacks, while Figure 2.24(b) depicts the intensity distribution with the mirrorsforming a clear aperture of 26 mm and 41 stacks installed. The transmission withina row is basically not affected by the stacks horizontal position. This is not the casefor different vertical positions.
The more distant from the LDA central position (marked as ’0’ in Figure 2.25),the higher the losses experienced by this stack will be. With a total of eleven rows onthe LDA, six different positions can be identified – from the center (’0’) to the mostupper/lower (’5’) position. Consequently positions most far away from the centerwill suffer more losses. An overview of the transmission of the LCS calculated outof a ray tracing analysis compared to experimental results is shown in Figure 2.25.
The homogeneity of the pump spot is also of importance. Assuming a gainmodulation period ag, a beam propagation under an angle ψ within a gain mediumwith a thickness D, minimum modulation for the extracted beam in the case of aconstant gain distribution along the z–axis (see Figure 2.26) is achieved if
ag = 2D tan(ψ). (2.5.1)
For a non–constant gain profile along the z–axis, this relation looses its validity sincethe integrated gain along the beam paths is not compensated after the reflection onthe HR surface anymore. We have then to integrate along the beam path (we
69
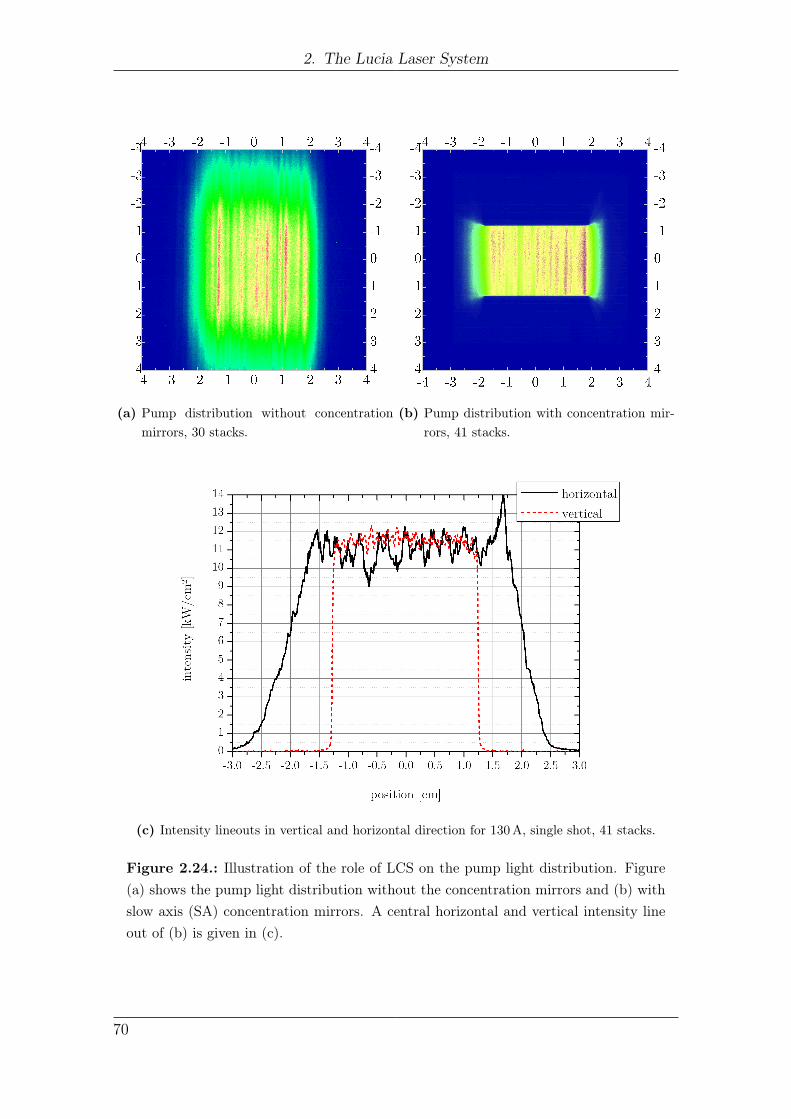
2. The Lucia Laser System
(a) Pump distribution without concentrationmirrors, 30 stacks.
(b) Pump distribution with concentration mir-rors, 41 stacks.
(c) Intensity lineouts in vertical and horizontal direction for 130 A, single shot, 41 stacks.
Figure 2.24.: Illustration of the role of LCS on the pump light distribution. Figure(a) shows the pump light distribution without the concentration mirrors and (b) withslow axis (SA) concentration mirrors. A central horizontal and vertical intensity lineout of (b) is given in (c).
70

ASE and Thermal Management on a High Average-Power DPSSL
Figure 2.25.: The transmission of the concentration system using large mirrorsdepends on the half–angle ϕ of the mirrors (given in ) which is coupled to its aperturex (given in mm). While for apertures of up to 26 mm the transmission for each rowis approximately the same ≈ 98 %, narrow concentrated setups show very differenttransmission factors for different vertical positions. If one reduces the aperture to18 mm by adjusting the angle to ≈ 5.7, then the transmission drops for the mostouter stacks (rows ’5’) to approximately 80 %.
71

2. The Lucia Laser System
Figure 2.26.: Beam trajectory in a pumped gain medium with a modulated gain(along the x–axis) profile. The front surface is anti–reflection (AR) coated, while theback side is highly reflective (HR). The beam is incident from the top, along a directionclose to the z–axis. The internal angle of reflection is ψ, the modulation period ag andthe thickness of the gain medium D.
neglect interference effects). Let us consider the gain variation as a cosine–patternperpendicular to the pump direction (i.e. the x–direction)
fmod(x) = a cos(x) + b (2.5.2)
where a and b are constants defining the modulation depth and offset. In the direc-tion of the pump–propagation (z–axis), an exponential and a constant distributionare discussed with:
hmod(z) =
1 constant distribution
exp(ln(κ)z) exponential distribution(2.5.3)
where κ is the exponential drop at the HR surface (e.g. the gain drops down to50 %). The distribution function Υ(x, y) of the small signal gain g0 is then
Υ(x, z) = g0 fmod(x)hmod(z). (2.5.4)
The solution for the gain G is found by integrating along the beam trajectory C:
G = exp
[∫C
Υ(x, z) ds
](2.5.5)
The curve C can be approximated as a straight propagating under the angle ψtowards the surface and from where it is reflected.
72

ASE and Thermal Management on a High Average-Power DPSSL
Typical modulations are in the order of ±10 % in intensity, as shown in Figure2.24(c). The parameters used for the numerical analysis are then a = 0.1, b = 1. Tostay consistent with the experimental data, the small signal gain is chosen for thedifferent thicknesses in such a way that the overall gain G is 4 (see Figure 3.31). Inthe case of an exponential drop with the penetration depth, the value for κ is set tobe κ = 0.5/D, where D is the thickness of the active mirror. The propagation angleis ψ = 13 and the backside exhibits a perfect reflectivity (R = 1).Figure 2.27 shows the resulting modulation imprint of a constant gain distribution
along the z–axis for four different thicknesses varying between half and twice themodulation period. One sees that, with the proper choice of thickness, a significantreduction in modulation can be achieved. The optimum thickness for the givenparameters is given by Equation 2.5.1, giving D/ag = 1/(2 tanψ) ≈ 2.1 in the caseof ψ = 13. Figure 2.27 shows a weak modulation for a ratio close to 2 (solid line).
An overview over the periodicity as a function of the gain medium thickness fora given angle is shown in Figure 2.28. A comparison between the case of a constantdistribution along the z–axis (a) and an exponential decay in the z–axis (b) shows,that in the case of an exponential distribution the periodicity is altered as well as the
Figure 2.27.: Modulation example for internal propagation under an angle of 13.The parameters are a = 0.1, b = 1, κ = 0.5/D. The horizontal position is given inmodulation periods and the thickness veries between 0.5 and 2 periods.
73

2. The Lucia Laser System
(a) sine pattern, a = 0.1, b = 1, constant in z
(b) sine pattern, a = 0.1, b = 1, constant in z, exponential in z (κ = 0.5/D)
Figure 2.28.: Impact of the gain medium thickness on the modulation of an amplifiedbeam in the active mirror scheme. The dotted line defines the working point (thicknessof the gain medium) in the case of the Lucia amplifier.
74

ASE and Thermal Management on a High Average-Power DPSSL
modulation is increased from a maximum value of 3 % to 12 % in the cases observed.The pump system used on Lucia amplifiers generates a modulation period of about
2 mm combined with a crystal thickness of 7 mm. Overall the system is obviously notoptimized to minimize modulations, as the working point is rather unfavorable (3.5periods). For future gain medium optimizations, the results derived above shouldbe taken into consideration.
2.5.3. Laser head
The laser head assembly holds the laser gain medium and ensures the cooling ofthe active mirror. In the active mirror scheme, the back and front surfaces offerthe largest interaction areas when compared to the lateral faces. As water absorbsstrongly outside of the visible spectrum [112], only one side can be cooled (see Figure2.10). Active cooling is achieved by water circulation on the back side, while thepump and extraction is incident on the front. Cooling the active medium on thebackside can be only efficient, if the heat exchange coefficient h is sufficiently high.This can be estimated by the use of relation 4.2.14 (introduced in Section 4.2.3) forthe active mirror case.
T (z) =q
2k
(D2 − z2
)︸ ︷︷ ︸T1
+1
hqD︸ ︷︷ ︸T2
+T∞ (2.5.6)
where z is the pumping direction, T [K] the temperature, q [W/cm3] is the volumet-ric heat production, k [W/m/K] the thermal conductivity, h [W/m2/K] the heatexchange coefficient and T∞ [K] the coolant temperature.
Term T1 in Equation 2.5.6 is the only one contributing to the global thermal gradi-ent. The contributions T2 and T∞ are responsible for the average offset temperature.For a given q, minimizing the thermal gradient can then be achieved by increasingk. Since k is strongly dependent of the temperature, it is desirable to minimize T2
and T∞ as much as possible.Representative values for the Lucia laser system are an area AP = 10 cm2, a gain
medium thickness D = 1 cm, an average incident power PP ≈ 260 W, a fractionof the stored energy transformed into heat ηh ≈ 0.1, a thermal conductivity k ≈0.07 W/cm/K and a cooling water temperature of T∞ = 285 K.We get, T1 ≈ 20K and T2 ≈ 2.6/hK. If we want e.g. minimizing T2 to one tenth
of T1, h should exceed a value of h > 1.4 W/cm2/K or h > 14.000 W/m2/K.Figure 2.29 gives three examples how water cooling could be achieved. Classically
a single water jet is used impinging on the cooled surface as shown in Figure 2.29(a).This technique is usable for small diameters, as the water throughput is typically in
75

2. The Lucia Laser System
(a) Single Jet (b) Tooth (c) Jetplate
Figure 2.29.: Comparison of the different cooling setup possibilities.
the order of 10 l/min for a surface of 1 cm2. As the surface scales with the squareof the diameter, this technique is not usable for large laser disks due to the need oflarge water pumps.
A different method is to use a lateral streaming coolant which is confined usinga narrowing channel (e.g. a tooth as indicated in Figure 2.29(b)). Besides the factit introduces potentially a pressure and an unfavorable transverse temperature gra-dient, an experimental demonstration at the pre–amplifier level was not consideredsuccessful.
As a third possibility, a so–called jet–plate is shown in Figure 2.29(c). It basicallyconsists of a regular assembly of holes, where water is pushed through from behind.As the water is forced through the small holes, strongly turbulent water jets willform. The resulting heat exchange coefficient map will be, however, strongly de-pending on the position of the holes, their respective diameter and shape. A strongmodulation of the heat exchange coefficient is expected, if the surface is close to thejet–plate. Roughly speaking, each jet forms an interaction similar to the single jetcase and consequently a large surface can be efficiently cooled.
The laser head developed and built within this thesis is sketched in Figure 2.30.Water enters the assembly from the back and enters a cylinder (relaxation chamber).At the end is the pierced plate whose distance to the gain medium can be adjustedby moving the whole cylinder.
The water pump delivers a nominal pressure of 2.5 bar with a flow of 14 l/min,which is sufficient to generate a heat exchange coefficient of more than hexp >
15.000 W/m2/K with a 39 holes (1.4 mm diameter each) plate (see Figure 2.31).The whole assembly is shown in Figure 2.32.
76

ASE and Thermal Management on a High Average-Power DPSSL
Figure 2.30.: Cooling head assembly
Figure 2.31.: Manufactured jet–plate with 39 holes, shown from the water inlet side.
77

2. The Lucia Laser System
Figure 2.32.: Laser head assembly on top of its massive, stable mount. A protectioncover is fixed on the crystal holder.
78

3. Amplified SpontaneousEmission Management
3.1. Motivation
A spontaneously emitted photon (Spontaneous Emission, SE) traveling trough thegain medium (from which it originated) will experience amplification, ultimatelyleading to a depopulation of the gain medium. This process is called AmplifiedSpontaneous Emission (ASE). ASE is unavoidable as it is inherent to the funda-mental origin of every laser. Keeping the impact of the ASE at a minimum, so itdoesn’t significantly impact the laser performance, is one of the main requirementsfor the successful realization of an amplifying system. Besides the impact of pureASE, a feedback from the outer boundaries can easily introduce parasitic lasing.
As it will be shown in this chapter, the scaling of laser gain media is not an easytask to achieve, if we don’t abide by a specific set of constraints. Basic models arederived as well as a three dimensional numerical analysis. The numerical results arebenchmarked against experimental results gathered from the main amplifier stage.Finally, an experimental campaign to explore several solutions to avoid parasiticoscillations is described in the last section.
3.2. Introduction
During pumping, and while being below threshold for parasitic lasing, three majorphysical phenomena will impact the population density n in the upper laser state.The pump action takes place followed by the unavoidable losses due to the radiativelifetime of the upper laser state and, third, the influence of the ASE. These actionsare respectively represented as the three terms on the right hand side of the followingequation:
dn
dt=dn
dt
∣∣∣∣P
− dn
dt
∣∣∣∣SE
− dn
dt
∣∣∣∣ASE
. (3.2.1)
79

3. Amplified Spontaneous Emission Management
For the two first ones (the pump and the spontaneous emission), the change in thepopulation density of the upper laser state is written as:
dn
dt
∣∣∣∣P
=
∫λ
g0 ·IPhνP
dλ (3.2.2)
dn
dt
∣∣∣∣SE
=n
τf(3.2.3)
with IP the spectral pump intensity [W/cm2/nm], h Planck’s constant, νP thefrequency of the pump light, λ the spectral wavelength and g0 the small signalgain at the corresponding wavelength.
The origin of the deexcitation is the photon flux throughout the crystal travelingacross the position under observation. The SE becomes ASE and acts as an auxiliarypump term. It can be written in the same way.
dn
dt
∣∣∣∣ASE
=
∫λ
g0 · ΦASE dλ (3.2.4)
where ΦASE [1/cm2/nm/s] is the ASE flux.
3.2.1. ASE flux estimation in the one–dimensional,monochromatic case
Determining the factor ΦASE can be done according to Figure 3.1 [113]. The gainmedium should be uniformly excited with the density in the upper laser state n.We express the fraction of the photon density dΦ out of the infinitesimal interval dxafter traveling the distance x to be:
dΦASE =n
2τfeg0x dx (3.2.5)
where τf is the lifetime of the upper state. Equation 3.2.5 is true under theestimation that the amplification is not saturated. The factor 1/2 appears, because
Figure 3.1.: Description of the variables used in the 1D, monochromatic estimationof ΦASE
80

ASE and Thermal Management on a High Average-Power DPSSL
Figure 3.2.: Distribution of the ASE–flux in a 1D gain medium for g0 = ±1 cm−1
half of the emission can be emitted in the positive or negative direction. Equation3.2.5 is integrated the following way:
ΦASE(z) =n
2τf
[∫ z
0
eg0x dx−∫ l
z
eg0(l−x) dx
](3.2.6)
which finally gives
ΦASE(z) =n
2g0τf
[eg0z + eg0(l−z) − 2
](3.2.7)
Figure 3.2 compares the solution of Equation 3.2.7 in the case of a positive (g0 =
1 cm−1) and a negative gain (g0 = −1 cm−1) for l = 1 cm and n/τf = 1. In a systemshowing absorption we get a negatively shaped curve for the ASE–flux. This is thecase of a system showing reabsorption at the emission wavelength. A positive gainwill deplete mostly the most outer edges of the pumped area.
3.2.2. ASE intensity contrast at the end of a laser chain
Considering a pencil shaped geometry, a well–known approximation is the relation-ship derived by Linford [46]. This relationship is of special interest for approxima-tions in a laser chain. References [114, 115] give generalizations of the approach forthis type of geometry. Let us then derive Linfords formalism.
The approach is very similar to the one described in Figure 3.1 with the differencethat the pure 1D configuration is replaced by a pencil–like geometry characterized
81

3. Amplified Spontaneous Emission Management
by a high Aspect Ratio (ARL)1. Also, unlike the preceding case, the emission is notmonochromatic but possesses a line shape function g(ν).As me might not expect a very different interpretation inside the cylinder in terms
of physics, we will restrict ourself to the interesting case of the output ASE flux.This is particularly interesting for a laser chain. Applying a similar strategy as inEquation 3.2.6, the ASE distribution within the cylindrical gain medium can beobtained.
Besides the integration over the length, an integration covering the spectral distribu-tion and the solid angle for the interesting point must be performed. Consequentlythe differential appears to be three–dimensional:
d3ΦASE =n
τf
dΩ
4πg(ν)Gdνdx (3.2.8)
The solution for this problem is found in Section A.2. With the definition of the ASEintensity at the central frequency ν0, IASE = ΦASE hν0 and the saturation intensityIsat = hν0/ [τfσ(ν0)], we derive out of Equation A.2.18
IASE = IsatΩ
4π
∆νst∆νsp
(eg0z − 1)3/2
(g0z eg0z)1/2
(3.2.9)
where the FWHM widths of the stimulated emission cross section is ∆νst andspontaneous emission cross section ∆νsp.
As the amplification is strong, and using the expression for the energetic gainG(z) = exp(g0z), Equation 3.2.9 reduces to:
IASE = IsatΩ
4π
∆νst∆νsp
G(z)√ln(G(z))
(3.2.10)
In good estimation we can take the stimulated and spontaneous emission linewidthsto be the same and we get:
IASE = IsatΩ
4π
G(z)√ln(G(z))
(3.2.11)
This relationship is useful for estimating the ASE intensity at the end of an amplifierchain. With the knowledge of the total gain of the laser chain, the material propertiesand the solid angle, limited by spatial filters pinhole aperture, intensity contrast ofthe laser pulse against the ASE pedestal can be estimated.
1The ARL is defined as the length in extraction direction divided by the typical size of the gainmedium cross section (diameter in the case of a rod or disc).
82

ASE and Thermal Management on a High Average-Power DPSSL
3.2.3. ASE flux estimations in Two and Three Dimensions
The very first requirement when calculating the ASE flux within/outside the lasergain medium is to estimate the solid angle. The two previous paragraphs avoidedthis problem with the use of a mere one or quasi–one dimensional analysis. Thistask is not so easy to fulfill, if a two or three–dimensional computation with a morecomplex geometry is of interest.
Writing the ASE flux at a position ~r0 in the most general way leads to the followingexpression:
ΦASE(~r0) =1
Ωsf
∫· · ·∫n(~r)
τfg(λ) G~r→~r0 d~rdλdΩ (3.2.12)
where Ωsf is the full solid angle depending on the dimension s = 1, 2, 3 of the given
geometry, n the excitation of the upper laser state, τf the fluorescence lifetime, g(λ)
the spectral distribution of the spontaneous emission and G~r→~r0 the gain over thetrajectory. This can be solved as the line integral between the point of integrationand the point of observation. The full solid angle in s dimensions is given as
Ωsf =
2πs/2
Γ(s2
) (3.2.13)
where Γ is the Gamma–function. For a one dimensional problem, Ω1f = 2, for a two
dimensional problem Ω2f = 2π rad and in three dimensions Ω3
f = 4π sr. The lineshape function g(λ) is approximated as:
g(λ) =σe(λ)∫∞
0σe(λ) dλ
(3.2.14)
Numerically it is rather difficult to integrate over the solid angle for an arbitrarygeometry. It can be simplified in the way, that the infinitesimal element d~rdΩ
describes a small volume element and is replaced by dsV/ |ρ(~r, ~r0)|s−1, where ρ(~r, ~r0)
is the distance a ray has to travel until it reaches the point of observation.
The most simple case is the one dimensional evaluation. Equation 3.2.12 reducesto:
ΦASE(z0) =1
2
∫∫n(z)
τfg(λ) Gz→z0 dz dλ (3.2.15)
which leads to the expression 3.2.5 in the monochromatic case of a uniform excitationcoupled with a non saturated gain. The limits for the integration are given in sucha way that the whole (one dimensional) volume contributes to the ASE flux at theposition z0.
83

3. Amplified Spontaneous Emission Management
The two dimensional interpretation of the ASE flux is consequently written as
ΦASE(~r0) =1
2π
∫∫n(~r)
τf |ρ(~r, ~r0)|g(λ) G~r→~r0 da dλ (3.2.16)
where da indicates the surface element. The integration has to be performed overthe whole surface. In the same way an expression for the three dimensional ASEflux is derived as:
ΦASE(~r0) =1
4π
∫∫n(~r)
τf |ρ(~r, ~r0)|2g(λ) G~r→~r0 dV dλ (3.2.17)
This expression is very similar to the expressions found in the literature [116].The amplification is, in good approximation, exponential and will by this rapidlyovercome the 1/ρ2 loss in intensity along the propagation in the gain medium. Thisrecalls the result given in Equation 3.2.7 in a more general context.
3.2.4. Life time modifier MASE
ASE reduces the local population in the upper laser state, which is indicated bythe third term in Equation 3.2.1. One can also see the action of ASE as a localreevaluation of the fluorescence lifetime. We introduce a lifetime modifier MASE
quantifying the impact of ASE. Equation 3.2.1 can thus be rewritten as:
dn
dt=dn
dt
∣∣∣∣P
− dn
dt
∣∣∣∣SE
·MASE. (3.2.18)
In the quasi three level scheme (relevant in the Yb3+:YAG context of this thesis) thesmall signal gain g0 is defined with the cross sections for emission and absorption σeand σa:
g0 = [n(σa + σe)− σa · ntot] . (3.2.19)
From the point of view the absorbed light, the sign of the small signal gain is inversed.
For the lifetime modifier MASE, one gets using Equation 3.2.1, 3.2.4 and 3.2.19the following relationship:
MASE = 1 + τf
∫λ
[σa
(1− ntot
n
)+ σe
]ΦASE dλ. (3.2.20)
From this point, an interesting relationship between the maximum achievable in-version density and MASE can be derived for a quasi three level system. It is thelimiting case for the energy storage, as the depletion by the ASE gets such strongthat the pump action is equalized (left and right hand side of 3.2.18 will become
84
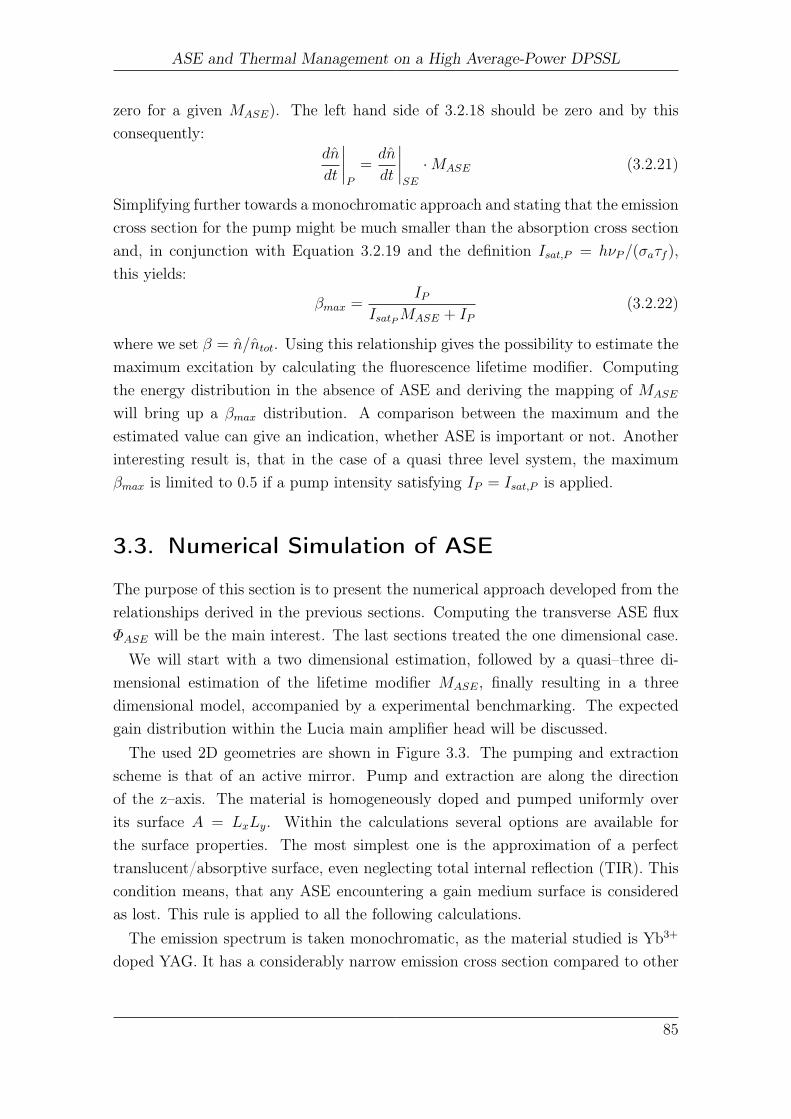
ASE and Thermal Management on a High Average-Power DPSSL
zero for a given MASE). The left hand side of 3.2.18 should be zero and by thisconsequently:
dn
dt
∣∣∣∣P
=dn
dt
∣∣∣∣SE
·MASE (3.2.21)
Simplifying further towards a monochromatic approach and stating that the emissioncross section for the pump might be much smaller than the absorption cross sectionand, in conjunction with Equation 3.2.19 and the definition Isat,P = hνP/(σaτf ),this yields:
βmax =IP
IsatPMASE + IP(3.2.22)
where we set β = n/ntot. Using this relationship gives the possibility to estimate themaximum excitation by calculating the fluorescence lifetime modifier. Computingthe energy distribution in the absence of ASE and deriving the mapping of MASE
will bring up a βmax distribution. A comparison between the maximum and theestimated value can give an indication, whether ASE is important or not. Anotherinteresting result is, that in the case of a quasi three level system, the maximumβmax is limited to 0.5 if a pump intensity satisfying IP = Isat,P is applied.
3.3. Numerical Simulation of ASE
The purpose of this section is to present the numerical approach developed from therelationships derived in the previous sections. Computing the transverse ASE fluxΦASE will be the main interest. The last sections treated the one dimensional case.We will start with a two dimensional estimation, followed by a quasi–three di-
mensional estimation of the lifetime modifier MASE, finally resulting in a threedimensional model, accompanied by a experimental benchmarking. The expectedgain distribution within the Lucia main amplifier head will be discussed.
The used 2D geometries are shown in Figure 3.3. The pumping and extractionscheme is that of an active mirror. Pump and extraction are along the directionof the z–axis. The material is homogeneously doped and pumped uniformly overits surface A = LxLy. Within the calculations several options are available forthe surface properties. The most simplest one is the approximation of a perfecttranslucent/absorptive surface, even neglecting total internal reflection (TIR). Thiscondition means, that any ASE encountering a gain medium surface is consideredas lost. This rule is applied to all the following calculations.The emission spectrum is taken monochromatic, as the material studied is Yb3+
doped YAG. It has a considerably narrow emission cross section compared to other
85

3. Amplified Spontaneous Emission Management
Figure 3.3.: Sketches for the two dimensional and quasi–three dimensional ASE fluxestimations. The gain medium is sliced into several layers in z–direction. In the x–yplane, a circular or rectangular geometry can be used.
laser gain material and with the exponential behavior of the amplification process,SE will become rapidly narrow enough justifying this estimation.
3.3.1. ASE Simulation in 2D
Let us recall the relationship between the ASE flux at a given position and thegeometry in two dimensions:
ΦASE(~r0) =1
2π
∫∫n(~r)
τf |ρ(~r, ~r0)|g(λ) G~r→~r0 da dλ (3.3.1)
Considering a monochromatic approach, this expression is reduced to:
ΦASE(~r0) =1
2π
∫n(~r)
τf |ρ(~r, ~r0)|G~r→~r0 da (3.3.2)
An interesting information is the distribution of the ASE impact within the gainmedium. Simplifying the numerical estimation, a rectangular two dimensional gainmedium is taken as an example.
Covering an area of extension Lx and Ly, integral 3.3.2 reduces with the estimationof a non saturated gain and a homogeneous distribution of the small signal gain to:
ΦASE(x0, y0) ∼=1
2π
∫ Lx
0
∫ Ly
0
n
τf
expg0
√(x− x0)2 + (y − y0)2√
(x− x0)2 + (y − y0)2dxdy (3.3.3)
where the small signal gain g0 can be defined as given in Equation 3.2.19. Whensolved,MASE can be calculated. However, Equation 3.3.3 has still to be solved. One
86

ASE and Thermal Management on a High Average-Power DPSSL
possibility is to use a Monte-Carlo (MC) approach. Using a uniformly distributedrandom generator (e.g. the Mersenne Twister [117]) generating N random numbersxi and yi within the interval [0,1] for the positions in x and y Equation 3.3.3 will betransformed into
ΦASE(x0, y0) ∼=LxLy2πN
N∑i=1
n
τf
expg0
√(xiLx − x0)2 + (yiLy − y0)2√
(xiLx − x0)2 + (yiLy − y0)2(3.3.4)
As example for such a MC calculation, a 4 cm× 4 cm Yb3+:YAG slab is studied inFigure 3.4. Initially the population inversion was set to a constant level in each case,resulting in a small gain coefficient of 0.3 cm−1 (a), 0.5 cm−1 (b) and 1.0 cm−1 (c).
While in the first example (Figure 3.4(a)) the depopulation in the center of thetwo–dimensional slice is at maximum, a more and more important influence towardsthe outer parts of the pumped region is revealed, when g0 is increased to 0.5 (seeFigure 3.4(b)).
This can be interpreted as follows. With a small gain, the amplification stayslow and by this, the local influence plays the major role (Figure 3.4(a)). With arising gain, the exponential product between length and gain dominates, resultingin a depopulation of the outer parts. This behavior is somehow similar to the onedimensional case discussed in Section 3.2, but occurs now even for the case of a nonabsorbing gain medium. The lifetime modifier MASE is in this case in the order ≈ 2
(Figure 3.4(b)).Stronger pumping leads to the case, where the exponential gain overwhelms the
effects described and a stronger depopulation appears in the outer edges of the gainmedium resulting in a higher value for the modifier MASE ≈ 3 (Figure 3.4(b)).
A further increase in pump power and thereby in gain will mainly deplete the areasmost far away from the center. One finds himself in the situation, where storageefficiency in the center is such strongly reduced, that an efficient energy storage isnot possible anymore (Figure 3.4(c)).
87

3. Amplified Spontaneous Emission Management
(a) g0 = 0.3 cm−1 2D example, MASE
(b) g0 = 0.5 cm−1 2D example, MASE
(c) g0 = 1.0 cm−1 2D example, MASE
Figure 3.4.: MASE distribution for different homogeneous g0
88

ASE and Thermal Management on a High Average-Power DPSSL
3.3.2. ASE Simulation in quasi–3D
As long as the product of the small signal gain and the characteristic length of thepumped gain medium is low (g0L 4), we might estimate the distribution ofMASE
to be uniform. We can therefore calculate for each slice the impact of ASE and solveEquation 3.2.18.
We estimate the gain medium to be circular (polar coordinates) and set the pointof observation in the center. Moreover, the gain distribution should be uniformwithin each of those slices and therefore the excitation n = const. Consequently,after integration, Equation 3.3.2 becomes:
ΦASE(0) =n
τf g0
[exp (g0R)− 1] (3.3.5)
where R is the radius of the gain medium.Using Equation 3.2.20 describing the lifetime modifier, Equation 3.2.18 is reduced
to:dn
dt=dn
dt
∣∣∣∣P
− n
τ· exp (g0R) (3.3.6)
This expression is now solved numerically along the pump axis (z). The modelseparates the transverse ASE from the pump action and consequently a one dimen-sional gain distribution with a two dimensional estimation for the ASE is derived.The model will be by this somewhat overestimating, as the gain distribution willnot be uniform anymore as soon as ASE becomes important.
Figure 3.5 shows the compiled result for an 7 mm thick, 2 at.% Yb3+ doped YAGcircular disk with a radius of 1 cm. As already discussed, the pump and ASE actionis treated quasi–three dimensional. Figure 3.5(a) shows the evolution of the localsmall signal gain as a function of the time and position within the gain medium andFigure 3.5(b) shows the corresponding MASE.Integrating along the z–axis gives access to G along the extraction direction. For
different dimensions of the gain medium, the evolution of the gain distribution willbe differently affected, which is shown in Figure 3.6. The larger the lateral size, thestronger the transverse ASE, the less effective the energy storage. Values of MASE
larger than ≈ 2 lead to a significant reduction of energy storage and gain. Thisvalue is reached for pump durations between 300 µs and 400 µs for gain mediumlayers located in the vicinity of the pumped front surface. Further pumping will notgenerate significantly more gain, but creates more ASE and by this more undesired
89

3. Amplified Spontaneous Emission Management
(a) g0 1D example, 2at.%, 7mm thickness, 15 kW/cm2, R = 1 cm
(b) MASE 1D example, 2at.%, 7mm thickness, 15 kW/cm2, R = 1 cm
Figure 3.5.: g0 and MASE evolution during the 1ms long pump process arrivingalong he vertical axis from top to bottom. For instance, after 0.4ms of pump duration,MASE ≈ 2 in the vicinity of the entering surface (z=0), meaning the effective lifetimeof the Yb3+ ions in the upper laser state is half of its nominal (∼ 1ms) value.
90

ASE and Thermal Management on a High Average-Power DPSSL
Figure 3.6.: Impact of increasing transverse size on the gain evolution during pumpingfor a 2 at.%, 7mm thick Yb3+:YAG gain medium.
effects like heat generation. Ultimately this leads to the case, where the maximumβ derived by Equation 3.2.22 is reached.
It should be noted, that the impact of ASE is overestimated. In the case of alateral extend very large compared to the thickness of the gain medium (thin disccase), coupled with a homogeneous gain distribution, the approximations applied tothis model would be in good agreement to the physical model. In the case discussedabove this is not true. The lateral extend is in the same order of magnitude asthe gain medium thickness and therefore SE will travel significantly trough thedifferently pumped “layers”. Consequently exists besides the transverse ASE aninter–layer crossing effect, which has to be taken into account. This reduces theASE impact and therefore a significant overestimation of the ASE takes place in thesimple model derived above.
In order to estimate the impact of such an effect, a full three–dimensional simula-tion is necessary. Such a model is the content of the next section with the emphasison its the experimental validation.
91
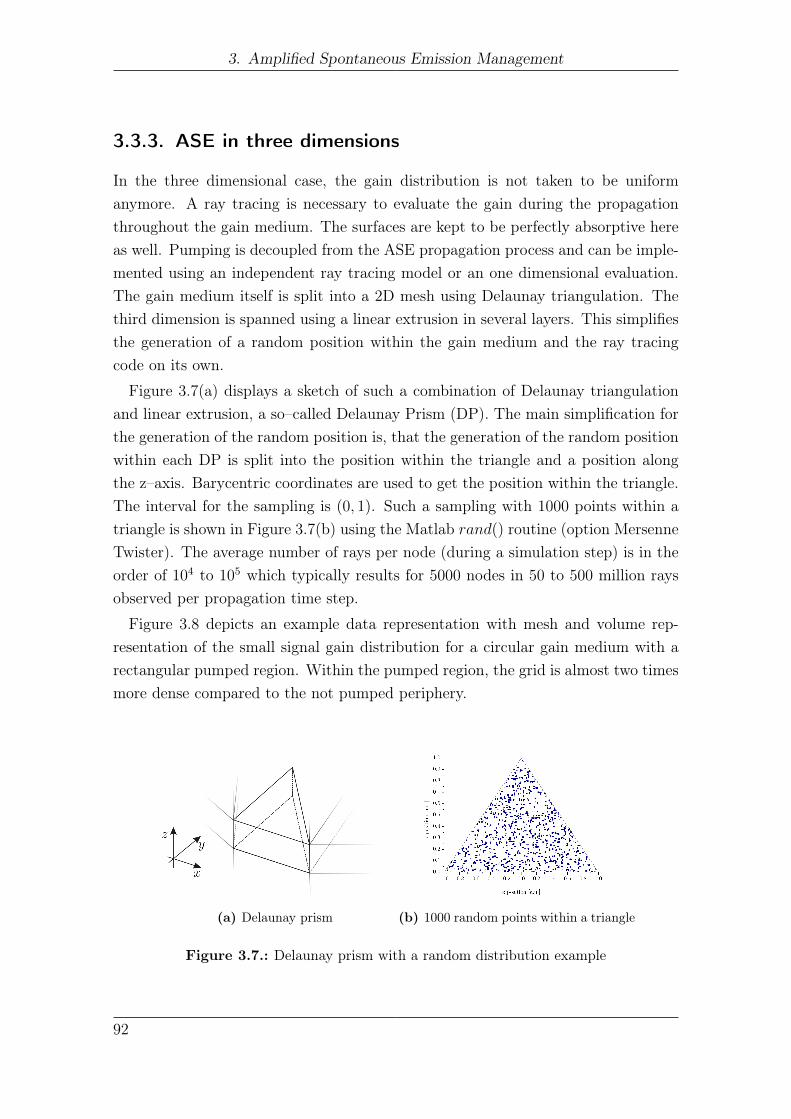
3. Amplified Spontaneous Emission Management
3.3.3. ASE in three dimensions
In the three dimensional case, the gain distribution is not taken to be uniformanymore. A ray tracing is necessary to evaluate the gain during the propagationthroughout the gain medium. The surfaces are kept to be perfectly absorptive hereas well. Pumping is decoupled from the ASE propagation process and can be imple-mented using an independent ray tracing model or an one dimensional evaluation.The gain medium itself is split into a 2D mesh using Delaunay triangulation. Thethird dimension is spanned using a linear extrusion in several layers. This simplifiesthe generation of a random position within the gain medium and the ray tracingcode on its own.
Figure 3.7(a) displays a sketch of such a combination of Delaunay triangulationand linear extrusion, a so–called Delaunay Prism (DP). The main simplification forthe generation of the random position is, that the generation of the random positionwithin each DP is split into the position within the triangle and a position alongthe z–axis. Barycentric coordinates are used to get the position within the triangle.The interval for the sampling is (0, 1). Such a sampling with 1000 points within atriangle is shown in Figure 3.7(b) using the Matlab rand() routine (option MersenneTwister). The average number of rays per node (during a simulation step) is in theorder of 104 to 105 which typically results for 5000 nodes in 50 to 500 million raysobserved per propagation time step.
Figure 3.8 depicts an example data representation with mesh and volume rep-resentation of the small signal gain distribution for a circular gain medium with arectangular pumped region. Within the pumped region, the grid is almost two timesmore dense compared to the not pumped periphery.
(a) Delaunay prism (b) 1000 random points within a triangle
Figure 3.7.: Delaunay prism with a random distribution example
92
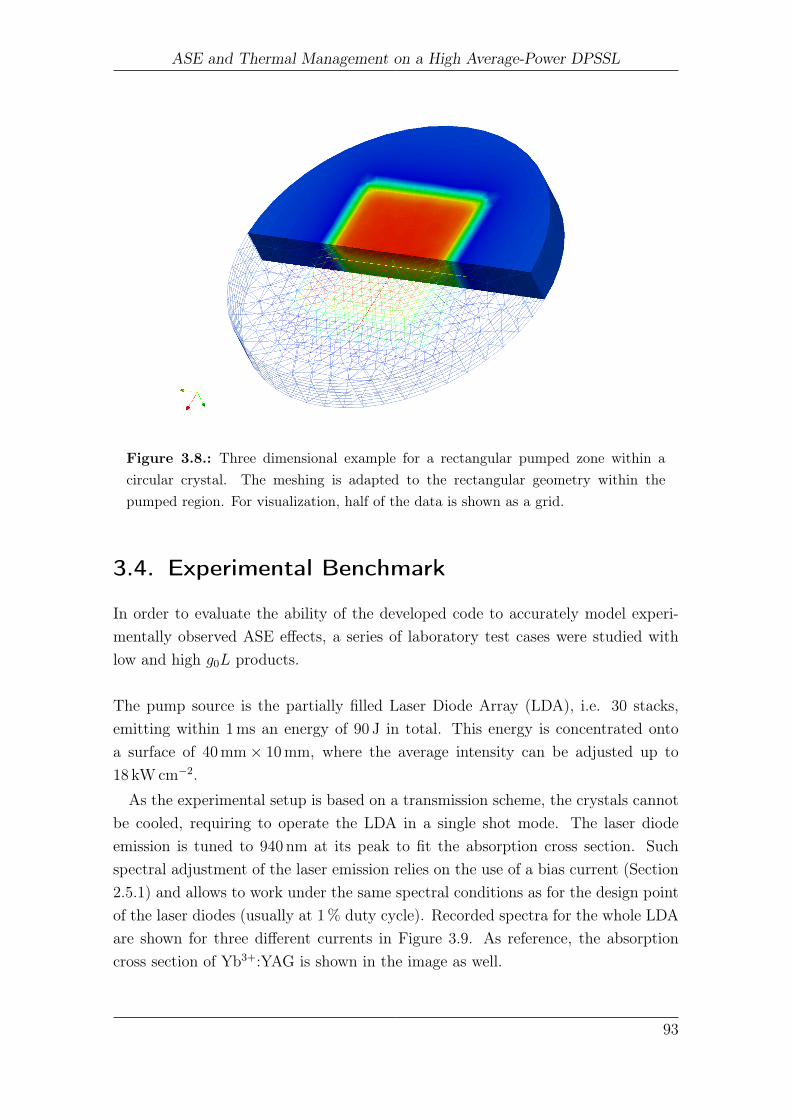
ASE and Thermal Management on a High Average-Power DPSSL
Figure 3.8.: Three dimensional example for a rectangular pumped zone within acircular crystal. The meshing is adapted to the rectangular geometry within thepumped region. For visualization, half of the data is shown as a grid.
3.4. Experimental Benchmark
In order to evaluate the ability of the developed code to accurately model experi-mentally observed ASE effects, a series of laboratory test cases were studied withlow and high g0L products.
The pump source is the partially filled Laser Diode Array (LDA), i.e. 30 stacks,emitting within 1 ms an energy of 90 J in total. This energy is concentrated ontoa surface of 40 mm× 10 mm, where the average intensity can be adjusted up to18 kW cm−2.
As the experimental setup is based on a transmission scheme, the crystals cannotbe cooled, requiring to operate the LDA in a single shot mode. The laser diodeemission is tuned to 940 nm at its peak to fit the absorption cross section. Suchspectral adjustment of the laser emission relies on the use of a bias current (Section2.5.1) and allows to work under the same spectral conditions as for the design pointof the laser diodes (usually at 1 % duty cycle). Recorded spectra for the whole LDAare shown for three different currents in Figure 3.9. As reference, the absorptioncross section of Yb3+:YAG is shown in the image as well.
93
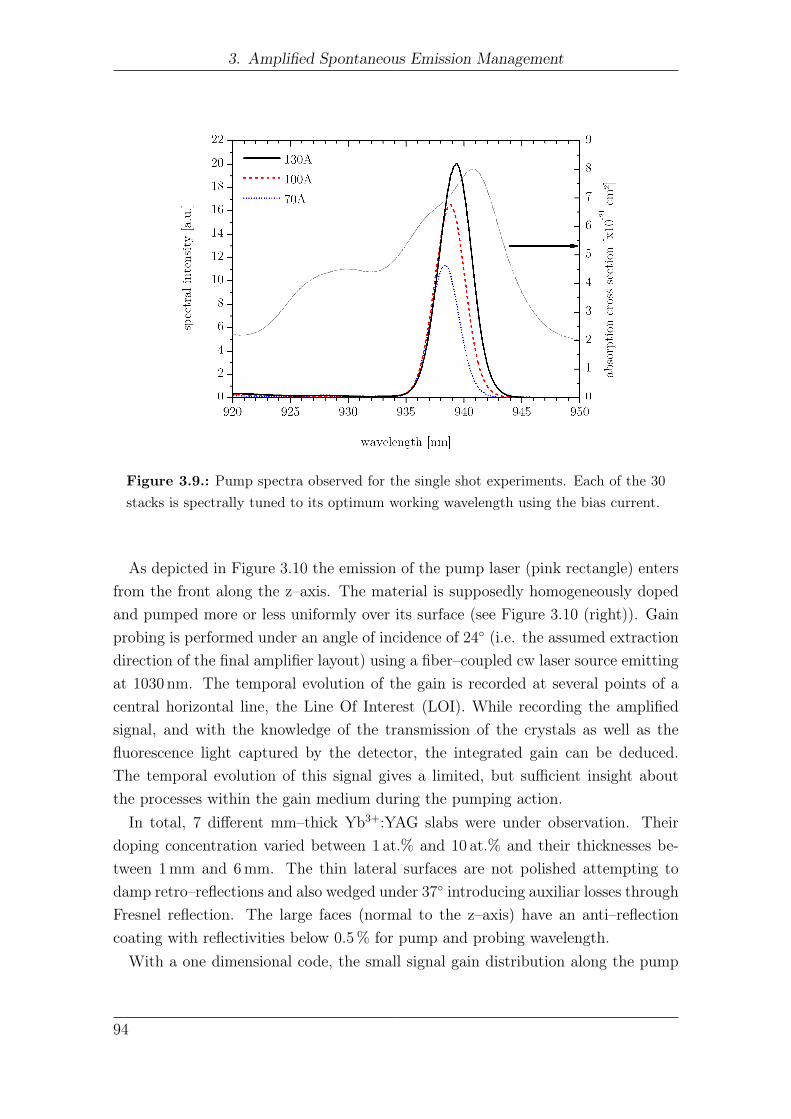
3. Amplified Spontaneous Emission Management
Figure 3.9.: Pump spectra observed for the single shot experiments. Each of the 30stacks is spectrally tuned to its optimum working wavelength using the bias current.
As depicted in Figure 3.10 the emission of the pump laser (pink rectangle) entersfrom the front along the z–axis. The material is supposedly homogeneously dopedand pumped more or less uniformly over its surface (see Figure 3.10 (right)). Gainprobing is performed under an angle of incidence of 24 (i.e. the assumed extractiondirection of the final amplifier layout) using a fiber–coupled cw laser source emittingat 1030 nm. The temporal evolution of the gain is recorded at several points of acentral horizontal line, the Line Of Interest (LOI). While recording the amplifiedsignal, and with the knowledge of the transmission of the crystals as well as thefluorescence light captured by the detector, the integrated gain can be deduced.The temporal evolution of this signal gives a limited, but sufficient insight aboutthe processes within the gain medium during the pumping action.
In total, 7 different mm–thick Yb3+:YAG slabs were under observation. Theirdoping concentration varied between 1 at.% and 10 at.% and their thicknesses be-tween 1 mm and 6 mm. The thin lateral surfaces are not polished attempting todamp retro–reflections and also wedged under 37 introducing auxiliar losses throughFresnel reflection. The large faces (normal to the z–axis) have an anti–reflectioncoating with reflectivities below 0.5 % for pump and probing wavelength.
With a one dimensional code, the small signal gain distribution along the pump
94

ASE and Thermal Management on a High Average-Power DPSSL
Figure 3.10.: ASE experiment setup. The top horizontal scale refers to the verticallineout of the depicted 2D pump profile (top left).
axis (i.e. z) is evaluated and, therefore, with the known geometry, a maximum g0L
calculated. Within these preliminary results two different groups are identified – thecrystal series with low doping (1 at.%) showing a g0L up to 4 and the other crystalswith a huge small signal gain (5 and 10 at.% doping). Consequently the first set(2 < g0L < 4) is expected to reveal less impact from ASE and parasitic lasing thanthe second one. Let us mention, that cases with a large g0L are often discussed inliterature, however under strong estimations [46].
With the estimation of a monochromatic model for the pump and SE, the emissionand absorption cross sections are set as follows:
• absorption cross section for pump wavelength σa,P = 0.7× 10⁻²⁰ cm2
• emission cross section for pump wavelength σe,P = 0.22× 10⁻²⁰ cm2
• absorption cross section for SE wavelength σa,P = 0.11× 10⁻²⁰ cm2
• emission cross section for SE wavelength σe,P = 0.4× 10⁻²⁰ cm2
Doping g0L at 10 kW cm−2 g0L at 14 kW cm−2 g0L at 18 kW cm−2
1 at.% 2 3 45 at.% 8 13 1610 at.% 17 25 33
Table 3.1.: Maximum g0L assuming a uniform pump distribution of 10, 14 and18 kW cm−2 and a transverse size of L = 40 mm. ASE is neglected during pumping.
95

3. Amplified Spontaneous Emission Management
Since the setup works in transmission, samples characterized by identical productof the doping concentration cd and the thickness of the gain medium D will behavesimilarly without ASE. Consequently in this case a classification can be done con-cerning the product of cdD. As one might expect, such classification will not berelevant anymore with different g0L factors.
To illustrate this effect one case is depicted in Figure 3.11, where two differentYb3+:YAG crystals with the same cdD are simulated with the numerical modelderived in the previous section. The doping is 1 at.% and a thickness of 30 mm inthe low gain case and a doping of 10 at.% with a thickness of 3 mm in the high gaincase. For both slabs the [doping concentration × thickness] (cdD) is then equalto 30 at.% mm. The pump power was taken to be uniformly distributed with anintensity of 14 kW cm−2 on the 4 cm× 1 cm surface for 1 ms. Results are depictedin Figure 3.11.We focus the interpretation on the central horizontal LOI out of the 2D gain
maps, since this line will be probed experimentally later on. Figure 3.11 (a) showsthe result for the low gain case. The LOI shows a gain distribution with a positivecurvature, indicating a higher expected gain in the outer periphery of the gainmedium. Concerning the high gain case, a lower gain in the outer periphery isexpected, showing a negative curvature on the LOI. The origin is already discussedin Section 3.3.1. Although the same factor cdD would yield the same gain neglectingASE, this cannot be taken to be true in the case of the high g0L anymore. Finallyit is interesting, that the 1 at.% case shows a higher gain in transmission comparedto the 10 at.% example (max values are 1.56 vs. 1.2).
Figure 3.11.: ASE experiment examples simulation. The integrated gain along thez–axis G is shown as a map and as a horizontal lineout.
96
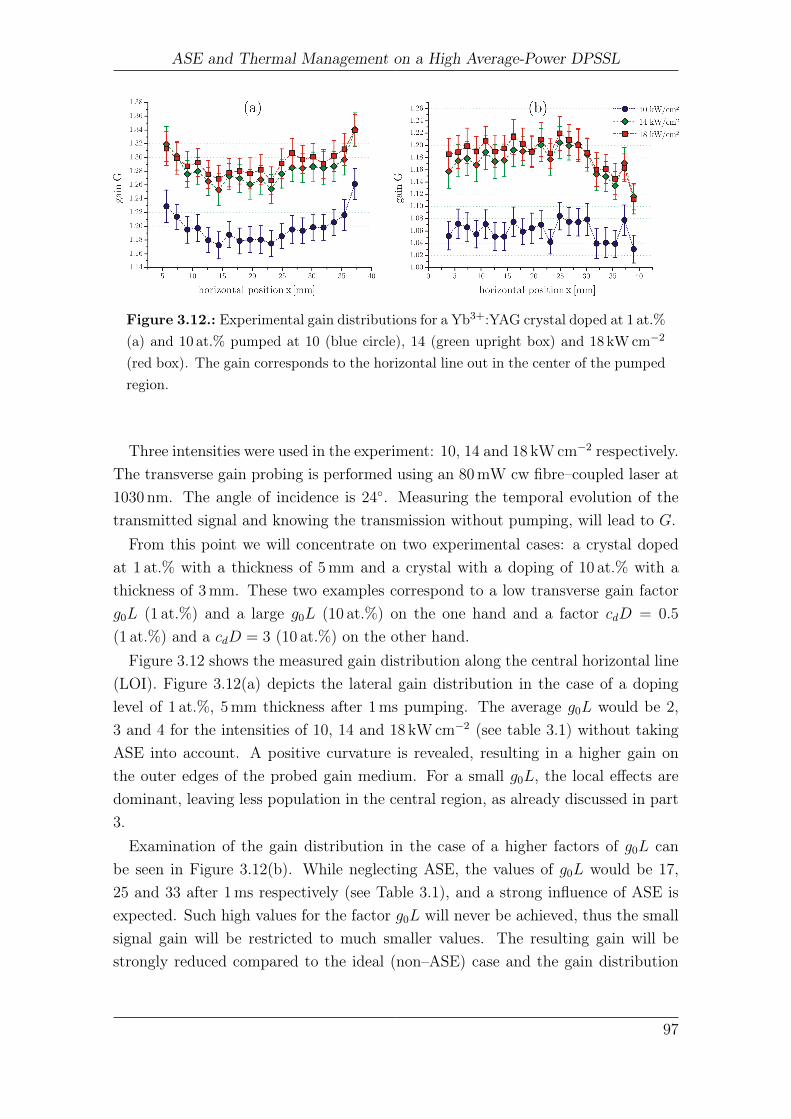
ASE and Thermal Management on a High Average-Power DPSSL
Figure 3.12.: Experimental gain distributions for a Yb3+:YAG crystal doped at 1 at.%
(a) and 10 at.% pumped at 10 (blue circle), 14 (green upright box) and 18 kW cm−2
(red box). The gain corresponds to the horizontal line out in the center of the pumpedregion.
Three intensities were used in the experiment: 10, 14 and 18 kW cm−2 respectively.The transverse gain probing is performed using an 80 mW cw fibre–coupled laser at1030 nm. The angle of incidence is 24. Measuring the temporal evolution of thetransmitted signal and knowing the transmission without pumping, will lead to G.From this point we will concentrate on two experimental cases: a crystal doped
at 1 at.% with a thickness of 5 mm and a crystal with a doping of 10 at.% with athickness of 3 mm. These two examples correspond to a low transverse gain factorg0L (1 at.%) and a large g0L (10 at.%) on the one hand and a factor cdD = 0.5
(1 at.%) and a cdD = 3 (10 at.%) on the other hand.Figure 3.12 shows the measured gain distribution along the central horizontal line
(LOI). Figure 3.12(a) depicts the lateral gain distribution in the case of a dopinglevel of 1 at.%, 5 mm thickness after 1 ms pumping. The average g0L would be 2,3 and 4 for the intensities of 10, 14 and 18 kW cm−2 (see table 3.1) without takingASE into account. A positive curvature is revealed, resulting in a higher gain onthe outer edges of the probed gain medium. For a small g0L, the local effects aredominant, leaving less population in the central region, as already discussed in part3.Examination of the gain distribution in the case of a higher factors of g0L can
be seen in Figure 3.12(b). While neglecting ASE, the values of g0L would be 17,25 and 33 after 1 ms respectively (see Table 3.1), and a strong influence of ASE isexpected. Such high values for the factor g0L will never be achieved, thus the smallsignal gain will be restricted to much smaller values. The resulting gain will bestrongly reduced compared to the ideal (non–ASE) case and the gain distribution
97

3. Amplified Spontaneous Emission Management
will change as well. In this high gain case (large g0L) SE gets strongly amplifiedresulting in a stronger depopulation at the edges, resulting in a negative curvatureshown in Figure 3.12(b). The maximum gain dropped by ≈ 10% compared to thelow gain case.
Each point in Figure 3.12 corresponds to a single measurement using a photodiodeallowing a sub–µs temporal resolution. Figure 3.13 shows the recorded temporalevolution for both the high and low gain cases for the three pump intensities andfor the three different localizations along the LOI.
In the case of a low doping concentration (Figure 3.13(a) (b) and(c) with 1 at.%,5 mm thick crystal) the central gain (x = 21.4 mm) stays always below the gainrecorded for lateral locations (x = 5.5 mm and 37 mm). The gain temporal evolutionin graphs (a) and (c) at pumping intensities of 18 kW cm−2 reveals a drop before theend of pumping 1 ms, whereas a saturation is observed for the central position (b).At about 0.6 ms after the pump started, the gain reaches its maximum in each of thethree cases. In the remaining 0.4 ms, the impact of ASE will differ with respect of theposition. We have to remind that the crystal has a cdD = 0.5, therefore we will stillsee even a significant amplification close to the back surface of the crystal (see sketchin Figure 3.10). As the photons under internal reflection will see an amplificationwhich gets stronger and stronger with the ongoing pumping, the depopulation dueto ASE will increase on the vicinity of the edges much stronger compared to thecenter. This leads to the decreasing gain at the edges and a saturation in the centerafter 0.6 ms. Pump intensities superior to 14 kW cm−2 show saturation.Let us now consider the temporal gain evolution for the crystal doped at 10 at.%
in Figure 3.13(d)–3.13(f). Due to a higher reabsorption, almost one third of thepump will be used to bleach out the reabsorption. As the intensity distribution ofthe pump drops almost exponentially with the penetration depth, the populatedparts will suffer from ASE, while the backside is still absorbing. An intensity of10 kW cm−2 doesn’t show saturation, but is again influenced by ASE. Stronger pumpintensities show saturation near the end of the pump duration of 1 ms.Figure 3.14 shows for the 7 different examined crystals at pump intensities of
10 kW cm−2 (a), 14 kW cm−2 (b) and 18 kW cm−2 (c) the resulting average gaincalculated along the LOI in transmission compared to the simulation. While in thesmall gain example (1 at.% with a low g0L, i.e. below 4) the expected gain fitsquite well with the experimental results, we observe for large values of g0L a strongdeviation, especially in the case of a high doping.
In the case of 10 kW cm−2, measured values for a large cdD are in relatively goodagreement with the simulation. As the pump is weak compared to the examples
98

ASE and Thermal Management on a High Average-Power DPSSL
Fig
ure
3.13
.:The
uppe
rrow
show
sthetempo
rale
volution
during
pumping
inthecase
ofa
1at.%
dope
d,5
mm
thickcrystalfor
the
mostlateralleft
(a),
central(b)an
dthemostlateralrigh
t(c)measuredpo
ints
inthecase
of10
(blue),14
(green
)an
d18
kW
cm−
2
(red).
The
lower
row
displays
thesamemeasurementin
thecase
ofa
10at.%
dope
d,3
mm
thickcrystal.
The
horizontal
axis
show
sthetimeafterpu
mpbe
ginin
ms,
while
thevertical
axis
show
sthemeasuredga
in.The
pumpdu
ration
was
1m
s.
99

3. Amplified Spontaneous Emission Management
shown in (b) and (c), the trend of the gain as a function of the factor cdD staysclose to the expectations. It is obvious in the cases of high g0L and a small cdD,that the deviation is significant. The thicker the crystal, the closer we get to themodel, the less important are the internal reflections.
Even higher pump intensities will further increase the gain and the influence ofASE as well. This can be clearly seen while comparing Figure 3.14(a) with 3.14(b):as the gain increases with increasing pump intensity, the more the measurementsdeviate from the model. The impact can be dramatically seen in (c). While in (a)the evolution of the gain as a function of cdD shows a curvature for the distributionof the measured points, this feature evolves into a linear behavior in (c). The 5 at.%
doped crystal with a high cdD (cdD = 3) shows at 18 kW cm−2 the same performanceas a crystal of 1 at.%.
We have to keep in mind that the crystal is too thin compared to the optimalthickness. We can expect a far superior performance for a gain medium with a lowdoping and an increased thickness.
This again shows that a low factor g0L should be preferred while designing anamplifier gain medium. However, such a low doping results in a higher demand ofmaterial, the gain medium becomes more thick and the thermal management mightbecome more complicated. Different cooling approaches are potentially needed, if ahigh average–power of the laser system is demanded.As the loss due to ASE can be accounted using the developed three dimensional
code, a potential exterior feedback resulting in parasitic oscillations should be takeninto account as well. However such computations including parasitic oscillations arenot within the context of this discussion, as working close to such oscillations mustbe avoided. Threshold conditions are discussed in the next section.
100

ASE and Thermal Management on a High Average-Power DPSSL
(a) Simulation and experimental results for 10 kW cm−2
(b) Simulation and experimental results for 14 kW cm−2
(c) Simulation and experimental results for 18 kW cm−2
Figure 3.14.: Overall comparison between simulation and experiment of ASE. Shadedareas indicate the range between the maximum/minimum values within the LOI.
101

3. Amplified Spontaneous Emission Management
3.5. Parasitic oscillations
The model described to this point neglects internal reflections for simplicity reasons.Unfortunately this does not stand true for a real application. There are indeed twodifferent additional sources contributing to gain depletion within a gain medium.First, surfaces show a non null reflectivity, enabling thus the SE photons to travela longer path due to internal reflections – the ASE might become stronger than itis estimated until this point. Second, photons can get trapped in closed paths aswell as a feedback from the outer periphery can create parasitic oscillations withinthe gain medium. The first one is mainly affected by the coatings applied and thegeometry used. Feedback relies on the properties of the surfaces, especially thepreparation of the boundary, as well as on the conditions how the gain medium ismounted. Figure 3.15 shows TIR within a Yb3+ doped YAG slab. Injected on thelower right of the picture, a cw signal at 1030 nm travels to the other side of thecrystal and gets partially reflected although the prisms outer faces were wedged andgrounded.
Figure 3.15.: Internal reflection in a slab
A gain medium will show in average one or more total internal reflections, if theAspect Ratio (ARL) is less than:
ARL =
√n2
1 − n22
n2
(3.5.1)
where n1 is the index of refraction of the gain medium and n2 the index of refractionof the surrounding medium. In our example, the refractive indexes are n1 ≈ 1.82 and
102

ASE and Thermal Management on a High Average-Power DPSSL
Figure 3.16.: Impact of the aspect ratio
n2 ≈ 1 at 1 µm, consequently ARL ≈ 1.5. Materials with a lower n1 are thereforemore preferred for constructing thin amplifiers.
Recalling the pump geometry used in the last section (single–side pumped gainmedium used in transmission), its small signal gain distribution is, in a quasi–threelevel scheme, associated with a specific thickness zopt, before reabsorption becomesimminent (see e.g. Figure 3.16). Increasing the gain medium thickness will increasethe overall gain on the extraction wavelength until zopt is reached. Models neglectingthe ASE and internal reflection will by this show a decreasing energetic gain witha further increasing thickness. As an example, a one dimensional model neglectingASE shows in Figure 3.16(a) the small signal gain distribution along the pumpaxis for a 4 cm thick Yb3+:YAG doped at 1 at.% pump for 1 ms at 10 kW cm−2.An optimum thickness is found to be zopt ≈ 1.7 cm. Pure transverse ASE willconsequently see an integrated energetic gain throughout the 4 cm long propagationof ≈ 7.4.Considering now SE confined by the internal reflections, the total energetic gain
for photons traveling trough the gain medium will depend on the thickness of thegain medium itself. Under the estimation of a transverse size of 4 cm, one cancalculate the average energetic gain under TIR for this case as a function of thethickness of the slab. The result depicted in Figure 3.16(b) considers three separateARL. For an ARL of 1 (4 cm thickness), the photons suffer from the reabsorption,as the thickness is significantly larger than zopt. An ARL of 0.1 (4 mm thickness)however results in a gain of ≈ 21 and a photon experiences under an AR of 0.01 again of ≈ 37. Overall the gain is converging in this case to a value of 39.4. Verythin disks will by this suffer from an increased ASE impact due to TIR. If the ARis ≈ 0.3 the same gain compared to the pure transverse ASE (∼ 7.4) case can befound.
103

3. Amplified Spontaneous Emission Management
Figure 3.17.: Gain for SE neglecting ASE for 7 mm thick Yb:YAG crystal pumpedat 10 kW cm−2.
This result should now be applied to the dimensions used in the case of theLucia main amplifier head. As discussed, even a moderate gain along the extractiondirection can lead to strong amplification in the most disadvantageous directions.The gain integrated along optical paths set at different angles within a 7 mm thick2 at.% doped Yb3+:YAG slab pumped at 10 kW cm−2 is of interest in Figure 3.17.Surfaces are considered to be not coated on any surface. Indeed, the averagereflectivity between a HR (> 99 %) and AR (< 1 %) coating is approximately thereflectivity found for Yb3+:YAG against air (≈ 8.5 %).
This graph illustrates, for different pumped areas, the respective gain as a functionof the propagation angle. It shows clearly, that the gain under TIR (θ & 33) ismost important. Large pumped zones (lengths beyond 30 mm) are not beneficial atall in this example. Indeed, the gain obtained near TIR for a 40 mm large pumpedarea is so strong ∼ 145, that a simple reflection on an uncoated surface would notbe enough to suppress parasitic oscillations anymore.
Of special interest are closed paths within a specific geometry, as SE can gettrapped. In a cylindrical geometry closed paths are well known and have the shapeof stars. Such an example is shown in Figure 3.18 depicting a star with nine teeth
104

ASE and Thermal Management on a High Average-Power DPSSL
Figure 3.18.: Closed paths within a circle and not crossed inner circle of radius d.
with its four different variants. With an arbitrary point of origin, such stars willgenerate inner, not crossed circles of radius d (dotted line in Figure 3.18).
The most simplest case is a centered circular homogeneously pumped region withina circular gain medium. A general sketch of this problem is found in Figure 3.19.Every closed path is defined by its radius d. One can then define the length s2
traveled within the pumped area. The reflectivity on the peripheral surfaces isrelated by the angle of incidence η.The total traveled distance between two reflections is s1:
s1 = 2√r2
1 − d2 (3.5.2)
where i = 1, 2. Within the length s2 amplification occurs while within the distances1 − s2 ASE can be absorbed, if an absorbing material is used. This might benot pumped Yb3+ doped YAG on its own as it absorbs at 1030 nm at ambienttemperatures as well as an absorbing cladding (e.g. Cr4+:YAG). In this geometrythe incident angle on the outer boundary is given by the angle η:
η = arcsin
(d
r1
)(3.5.3)
However as the angle η will approach, with increasing d, the critical angle of TotalInternal Reflection (TIR) ηc = arcsin(n1/n2), where n1 is the index of refractionof the external medium and n2 the index of the gain medium, a maximum radiusr2,max is given with the condition η = ηc (Figure 3.19):
r2,max <n1
n2
r1 (3.5.4)
The consequence is that surfaces larger than described by radius of r2,max very likelybecome a subject of closed ray traces under TIR and by this parasitic oscillations.These modes traveling under such angles are usually called lossless modes [116].
105

3. Amplified Spontaneous Emission Management
Figure 3.19.: A pumped circular region (red) located in the center of a circular gainmedium (grey).
In first order, the amplification and absorption process will be exponential on itsown and the reflectivity is governed by the Fresnel reflectivity. Parasitic oscillationswill quickly become polarized, maximizing the experienced gain. Consequently afirst–order approximation with a Fresnel reflectivity for s–polarized (transversal elec-tric, TE) light is most appropriate. This reflectivity however is strongly influenced bythe index of the external material. Thus, index–matching can dramatically improvethe threshold for parasitic lasing.
Figure 3.20 shows a compilation of four different index matching combinations fora 2 at.% doped Yb3+:YAG crystal at room temperature with an index of refractionof the external medium ranging from 1 to 1.7. The small signal gain g0 within thepumped area is equal to 1 cm−1. The crystal diameter is 2r1 = 60 mm and the radiusof the pumped inner circle varies between 0 and 100 % of the outer radius. The curvesof graphs 3.20 (a)–(d) show the gain as a function of the parameter d (horizontalaxis) for given radii (normalized to the outer radius (r2/r1 in %)) of the pumpedregion. The increment is 5 % for each curve. The pastel-colored lines indicate gainconditions above 1 per pass including reabsorption and reflection–losses. Specialattention should be given on the logarithmic scale for the gain.
In the case of air as index matching material (Figure 3.21(a)), one observes amaximum pumped area defined by a radius of r2 = 0.55 r1 = 1.65 cm (correspondingto g0L = 0.55 × 1 × 6 ≈ 3.3). This corresponds to the maximum allowable radiusr2,max ≈ 1.64 cm. Replacing the external material (air) with another medium
106
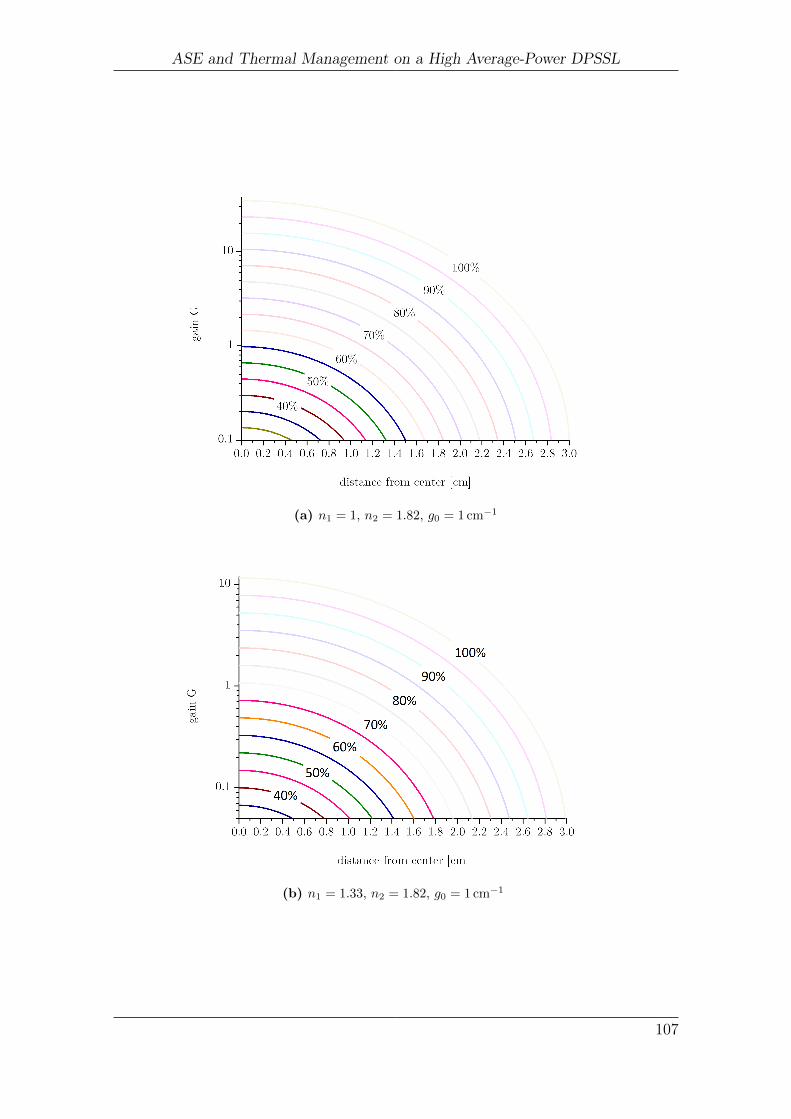
ASE and Thermal Management on a High Average-Power DPSSL
(a) n1 = 1, n2 = 1.82, g0 = 1 cm−1
(b) n1 = 1.33, n2 = 1.82, g0 = 1 cm−1
107

3. Amplified Spontaneous Emission Management
(c) n1 = 1.5, n2 = 1.82, g0 = 1 cm−1
(d) n1 = 1.7, n2 = 1.82, g0 = 1 cm−1
Figure 3.20.: Gain G (vertical axis in log–scale) per pass in the pumped region vs.the distance from the center (horizontal axis) as a function of the index matching liquid(n1), reabsorption is taken into account. The diameter of the Yb3+:YAG crystal is60 mm. The diameter of the pumped zone is given by the lines in 5 % steps.
108

ASE and Thermal Management on a High Average-Power DPSSL
showing a higher index of refraction, e.g. water (n1 ≈ 1.33, Figure 3.21(b)), impliesthis time, that about ≈ 69 % of the total diameter can be covered, before a gain of 1occurs between each reflection. In this case r2,max/r1 is ≈ 73 % therefore transverseoscillations are more likely to occur than oscillations due to closed paths.
A further increase in refractive index of the matching material to n1 = 1.5 (Figure3.20(c)) shows a r2,max/r1 = 82 %. Again, a very similar value compared (in thistwo dimensional example) is found for pure transverse oscillations (≈ 82 %). Indexmatching media with a even higher index of 1.7 (see Figure 3.20(d)) allows almostthe whole surface to be used as pumped surface.
The factor of acceptable g0L for closed paths rises to values of up to g0L ≈ 0.82×1 × 6 ≈ 5.5. Despite in such a case the parasitic oscillation for this special type ofmodes might be suppressed, ASE will strongly deplete the gain medium as well asfeedback from the outer limitations (e.g. the gain medium mount) might generatea sufficiently strong feedback generating oscillations within the gain medium. Theestimation of these effects are more complicated to estimate and are often onlyaccessible to experimental observations.
In summary the following is deduced:
• In the active mirror scheme, the emission confined by TIR within the gainmedium can quickly become the main source of parasitic oscillations.
• Lossless modes must be avoided. For each specific geometry of the gainmedium, the pumped area should be adjusted in such a way that closed pathsdon’t experience a gain superior to 1.
109

3. Amplified Spontaneous Emission Management
3.6. Application on the Lucia Amplifier
The Lucia main amplifier head hosts a 60 mm diameter Yb3+:YAG crystal doped at2 at.% (grown by Laserayin) in an active mirror architecture. A thickness of 7 mm
leads to an aspect ratio of ARL ≈ 0.12. On one side an antireflective coating isapplied while on the other side a highly reflective coating is applied on the centralpart (35 mm diameter, see Figure 3.21). As the YAG of the non–coated peripheryon the HR coated surface is in direct contact with water, ASE can be minimized dueto a better coupling of the SE into the water. The gain medium is then mountedinto the assembly as it is shown in Figure 3.22.
At the crystal periphery exists a cavity confining emitted SE and ASE to preventa full back reflection into the gain medium itself. The cavity on its own can befilled with different index matching liquids (using a special sealed retaining ring),however usually filled with water entering through the holes in the standard mount.
The area to be pumped with the light coming from the Laser Diode Array
Figure 3.21.: Sketch of the coatings applied on the 60 mm active mirrors. The crystalsare doped at 2 at.%.
Figure 3.22.: CAD view (half cut) of the mount for the 60 mm crystals. The pumpdirection in this image is from below and the water cooled side is on top.
110

ASE and Thermal Management on a High Average-Power DPSSL
(LDA) is illuminated through the AR coated side (see Figure 3.21) with intensitiesranging from 11.5 kW cm−2 for large pumped surfaces (2.6 cm× 3.8 cm) and up to16.5 kW cm−2 in the case of a reduced circular zone (diameter of 30 mm).
The initial experimental pump distribution is shown in Figure 3.23. With adriving current of 130 A, the average intensity is 11.5 kW cm−2 and can reach up to13 kW cm−2 for a maximum driving current of 150 A. The gain probing is performedunder the expected extraction direction with a 80 mW cw fiber coupled source at1030 nm. The detector is a photo diode with a bandwidth of 1 GHz in conjunctionwith a 1 GHz, 5 GS/s oscilloscope. The simulation is performed with a super–Gaussian pump distribution of the order 20 with a FWHM of 2.6 cm in verticaland 3.8 cm in horizontal direction.
Both, calculated and measured, gain evolutions in the case of a pump intensity of11.5 kW cm−2 (130 A driving current on all the laser diode stacks) can be comparedin Figure 3.24. While at the beginning of the pump pulse the prediction fits ratherwell to the experimental results, a strong derivation appears after about 600 µs, whenthe gain in the transverse direction is affected by the onset of parasitic oscillations.Further pumping does not increase the gain anymore, as the gain medium startedto transversally lase on its own.
The threshold for parasitic lasing can be roughly estimated as it was discussedin the foregoing section. The origin in this case lies in the large extend of thepumped zone. We might expect the highest gain for the internal reflections for a
Figure 3.23.: 2D pump profile and horizontal and vertical lineouts at 130 A, whichcorresponds to an average intensity of 11.5 kW cm−2.
111

3. Amplified Spontaneous Emission Management
Figure 3.24.: Comparison between the simulation and measurement for a rectangularpump zone in a 60 mm crystal, 11.5 kW cm−2. 130 A corresponds to an average pumpintensity of 11.5 kW cm−2.
TIR (YAG–water) propagation. The gain for a closed loop depends on the lateralsurface preparation as well as the boundary conditions. Lateral surfaces should beAR coated or kept unpolished in order to reduce the direct reflection from thosesurfaces. Highly reflective coatings should only applied, where they are needed.
In the experimental case a highly reflective coating is applied within a diameter of35 mm centered on the backside and the antireflective coating spans the whole frontsurface. At the periphery an index matching liquid can be inserted in the cavityshown in Figure 3.22. In the most simple case water is used implying a reflectivityof ≈ 2.5 %. The not pumped periphery is absorbing at the emission wavelength, asYb3+:YAG exhibits reabsorption at room temperature.
To get a feeling whether the parasitic oscillations set in or not, we use the modelfor the TIR reflections as it is shown in Figure 3.17. The angular distribution of thegain as a function of the time is of interest (Figure 3.25). The propagation under theTIR (∼ 33 at the interface YAG–air) will still see losses at the YAG–water surface(TIR∼ 47). Consequently, the TIR angle connected to the surface YAG–water isof main importance.
Keeping in mind that the reflectivity of YAG against water under normal incidence
112

ASE and Thermal Management on a High Average-Power DPSSL
Figure 3.25.: Gain distribution (colorbar) for rays propagating inside the gainmedium with angles of incidence on the large faces varying between 30 and 70. Thex–axis gives the time scale during the pump process and the y–axis the variation ofthe propagation angle. The dotted lines show the TIR angle against air θTIR = 33.1
and water θTIR = 46.6. The contour lines at a gain of 40 and 100 are indicated(rectangular pump 12 kW cm−2).
is ≈ 2.5 % a maximum overall gain of 1/0.025 = 40 is acceptable to avoid lasing.Considering such a threshold value, Figure 3.25 shows an onset of lasing around≈ 700 µs fitting the experimental value in Figure 3.24 quite well.
With an exponential growth of the amplification it is imperative to reduce thepumped area to its minimum with respect to the extraction aperture. The pumpzone is reduced to a region limited by a circle of 30 mm diameter using a mask.Usable surface is reduced from ≈ 10 cm2 to ≈ 6.5 cm2, in total resulting in 30 % ofthe energy wasted as it gets blocked by the mask. Additional concentration mirrorsare introduced reflecting most of the lost light back into the aperture. This increasesthe incident intensity and therefore the local gain in the pumped area.
The optimization process is shown in Figure 3.26 while the experimental setup isillustrated in Equation 3.27. Fast axis concentration mirrors are silver coated. Themask is simply made out of an aluminum sheet. The transmission loss due to themask and fast axis concentration is in approximately 20 %. The whole transmission
113

3. Amplified Spontaneous Emission Management
Figure 3.26.: Light concentration optimizations, Large concentration mirrors (slowaxis concentrators, grey), circular mask (green) and fast axis concentrators (blue).
function of the pump setup drops from ≈ 90 % to ≈ 80 %. Despite the highertransport losses a rise in intensity of almost 30 % is found.
Compiled results are shown in Figure 3.28. Applying the mask to the pumpedregion suppresses effectively the parasitic oscillations and a satisfying agreement be-tween the simulation and the experimental results is found (green curve). Recyclingthe pump light using the fast axis collimators (fac) brings a major improvement ingain (blue curve). However, pump durations longer than ≈ 700 µs show parasiticoscillations again.
As it was discussed already before, suppression of transverse ASE is performed bythe reduction of the feedback from the lateral surfaces, especially when using index–matching. Consequently with the possibility of filling the peripheral cavity, severalliquids were explored (see Table 3.2). An exhaustive collection of index matchingliquids can be found [118, 47]. Unfortunately most of the index matching liquidswith an index higher than 1.6 are toxic or at least irritant. Table 3.2 summarizesfive cases of index matching media under observation.
The impact of the index matching liquid on the gain evolution is shown in Figure3.29. Using no index matching liquid at all (air) a slight reduction of the maximumgain is observed. Nevertheless it does not change the overall behavior, especiallynot the roll–over appearing at ≈ 700 µs.
The roll-over is shifted by ≈ 50 µs using water or diiodomethane. Diiodomethaneis of common use for ruby and Ti:Sa index matching as it has an index of refractionvery close to the gain media in those cases.
Unfortunately diiodomethane suffers from a decomposition which results in adistinctive yellow to red coloring. On the other hand, diidomethane and α–bromo-naphthalene show a high viscosity and are by this not easily applicable in contrast todecaline or water. Moreover, those liquids (besides water) penetrate different typeof rubber rings, so special care should be taken in order to prevent leakage.
114

ASE and Thermal Management on a High Average-Power DPSSL
Figure 3.27.: Optical elements used for the light concentration optimizations (slowaxis concentrators, grey), fast axis concentrators (blue) and circular mask (green).
Figure 3.28.: Temporal gain evolution observed for three experimental pump distri-butions depicted in Figure 3.26.
115

3. Amplified Spontaneous Emission Management
An interesting characteristic is the absence of a difference in slope after theroll-over for most of the studied cases. The slope after the roll–over is directlyrelated to the impact of parasitic oscillations; a different slope indicates a differentfeedback. Consequently a change in this feature indicates the effectiveness of themeasures taken to suppress parasitic oscillations. An absence of parasitic oscillationsis reached, when the roll-over vanishes.
Feedback for transverse oscillations is related to the:
• reflection at the gain medium/liquid interface.
• reflection from the external cavity back into the gain medium.
The latter one was identical for the experimental results depicted in Figure 3.29 forair and α–bromonaphthalene as well for the cases of water and diiodomethane.Only the case of a blackened (ink) cavity and decaline (orange curve) showed an
important improvement over the use of water as index matching liquid. In this casegain is improved and, more interesting, exhibiting a bit different slope after theroll–over.
A reduction of the reflectivity on the outer periphery does not reveal any im-provement in gain performance, whereas the reduction of the reflectivity of the gainmedium holder shows an improvement. Obviously reflections from the gain mediummount are the main cause of parasitic oscillations in the studied amplifier assembly.
Another reflecting surface was also identified as a non negligible feedback for ASE:the back side of the circular (reflective) mask. The mask is made out of aluminumand is located in short distance to the AR coated top crystal surface. Aluminumhas a typical reflectivity in the order of 90 %. Consequently spontaneous emissionoriginating from the laser gain medium will be partially reflected back into the gainmedium.
Liquid n0 (1 µs) R(0) remarks Ref.water 1.33 2.5% absorption in the NIR [112]
decaline 1.42 1.6% nontoxic, solvent, low viscosity [119]α–bromonaphthalene 1.66 0.2% high viscosity, solvent, irritant [118, 47]
diiodomethane 1.74 0.06% solvent, toxic, high viscosity [118, 47, 120]air 1.00 8.6% gaseous
Table 3.2.: Comparison between four different Index matching liquids used in theexperimental studies. Air is given as reference.
116

ASE and Thermal Management on a High Average-Power DPSSL
Figure 3.29.: Impact of the index matching liquid on the gain, 16 kW cm−2
To overcome these problems, the gain medium mount is modified as depicted inFigure 3.30. The surfaces are treated with black nickel, lowering significantly thereflectivity [121]. The aperture of the laser gain medium mount is reduced to 32 mm
and replaces the mask. On the inner side all surfaces are blackened as well. Theouter side (which is hit by the pump light) is kept untreated. Figure 3.31 shows theresult of the gain measurement with the modified gain medium mount compared tothe original mount design and the 3D simulation using the developed model. Theroll–over vanished and the experimental results fit excellently the three dimensionalprediction neglecting parasitic lasing using the developed code.
117

3. Amplified Spontaneous Emission Management
Figure 3.30.: Redesigned gain mount with incorporated mask and blackening.
Figure 3.31.: Impact of the new mount and comparison to the simulation results
118

ASE and Thermal Management on a High Average-Power DPSSL
3.7. Conclusion
Amplified spontaneous emission is a fundamental limit to be very seriously analyzed,when considering laser gain media scaling. It grows exponential with the factor g0L,g0 being the small–signal–gain and L a characteristic dimension of the gain medium.It will dominate other scaling parameters if this value is not kept constant or at leastbelow a certain limit. Those limits are set by the gain depletion due to ASE or dueto parasitic oscillations.
For the depopulation by ASE Equation 3.2.12 is fundamental. It is most usefulwhen rewritten in the form of Equation 3.2.15 – 3.2.17. In the estimation of aconstant small–signal gain distribution several estimations can be made.
If the ASE flux FASE reaches the saturation fluence Fsat in a four level systemapproximation, the expression
FASEFsat
=g0
4π
∫V
1
|ρ(r, r0)|2· exp g0 ρ(r, r0) dV (3.7.1)
was derived in the three dimensional case with g0 = σen, Fsat = hν/σe and ΦASE τfhν =
FASE. Furthermore, we estimated the absence of saturation, which is, of course, avery strong approximation as the saturation fluence is reached. Nonetheless, suchan expression gives a first order approximation, from which a critical volume can bederived:
Vcr ∝ κg−30 (3.7.2)
where κ is a geometry dependent factor. A small collection of computed values forthe available g0L and the factor κ is found in Table 3.3. Geometries with a highaspect ratio are profitable for energy storage (κ in the order of 2). The gain along theextraction direction is low (transverse g0L is 2–3, but along extraction direction it is0.1–0.2). Low aspect ratios (rods etc.) show potentially a higher gain accompaniedby a factor of ∼ 2 lower energy storage. This discussion is only true for reasonableaspect ratios, i.e. between 0.1 and 10. As the ASE flux is somehow overestimated,an approximate value for the ASE limit should be situated somewhere in the orderof 2 to 4 for discs and larger values in the case of rods.As one can imagine out of the values for the factor g0L in Table 3.3, extreme values
can not be achieved even if the ASE would allow it. The amplification would generatean energetic gain of G ≈ exp(g0L) and g0L = 4 it would require a reflectivity of lessthan 1.8 % preventing a potential parasitic lasing. This value can be reached by theuse of index–matching. Nonetheless values above g0L > 4 are not managable at all
119

3. Amplified Spontaneous Emission Management
Geometry Height H to Radius R Aspect Ratio g0L κ typical length Lcylinder H=2R 1 1.2 1.43 cylinder diameter
disc H=R/10 5 2.3 1.91 disc diameterdisc H=R/20 10 3 2.20 disc diameterrod H=10R 0.2 4.2 1.14 rod lengthrod H=20R 0.1 7 1.37 rod length
Table 3.3.: Values for g0L and κ for different aspect ratios
without the aid of an absorbing cladding. For rods this is not an option, as it wouldintroduce an absorbing element along the extraction direction.
Parasitic oscillations and lasing can be avoided by the proper analysis of the gainmedium geometry:
• closed lossless paths, i.e. paths under TIR, must be avoided
• use of a material with an index of refraction close to the surrounding medium
A gain medium with an aspect ratio ARL showing less reflections under TIR isprofitable. Gain media with a high aspect ratio can be more sensitive to parasiticlasing.
The gain medium mount plays an important role too. Direct back reflection ofASE must be avoided. The use of materials with a low reflectivity for the ASEwavelength is advised.
One point of discussion was somewhat excluded: The transport of ASE from oneamplifying medium to the next. This problem is observed in a simple approximationwithin Section 3.2. It depends on the gain medium structure and its geometry,but also on the overall extraction architecture. Spatial filtering should be used tominimize the resulting ASE flux. Cross–talk between several amplifying passes canbe avoided by the proper extraction scheme.
ASE can not be avoided – however, parasitic oscillations can. ASE can only beminimized.
120

4. Thermal Management
4.1. Motivation
As already stated, understanding thermal mechanisms occurring within an ampli-fying medium is of key importance for every system based on high repetition rate.Several thermally induced effects can alter or degrade the laser system performancesignificantly. Consequences span from losses due to beam quality degradation,damages to the optical components to the destruction of the gain medium itself.
We will discuss the thermal management in the context of the Lucia laser systemin this section. Section 4.2 will present the heat source, the role of the thermalconductivity in the heat transport and give a first estimation of the temperaturedistribution expected in the Lucia main amplifier case.
Then Section 4.3 will demonstrate the capacity of the developed laser head coolingapproach to perform a satisfying thermal management.
Section 4.4 and 4.5 will close this chapter by describing an evaluation of our numer-ical model and an extensive experimental campaign aiming at qualifying the Lucialaser head in terms of wavefront management and the impact on depolarization.
4.2. Introduction
Overall, the thermal processes can be described as the following three steps sequence:
• heat generation
• heat transport
• induced effects (phase, polarization,. . . )
This section will thereby describe these steps in the following three subsections.
4.2.1. Heat generation
The heat generation is proportional to the amount of absorbed radiation. Theabsorbed photons at pump wavelength λP define a pump efficiency ηP associatedwith the amount of radiation available at the upper laser state. In the ideal case
121

4. Thermal Management
this parameter is close to unity and depends on the energy level system and itscorresponding branching ratio. With a finite lifetime of the upper laser state,fluorescence at the central wavelength λF or stimulated emission (i.e. extraction)at the extraction wavelength λL reduces the population inversion. The fraction ofenergy actually extracted through stimulated emission is given by the factor ηL. Forfluorescence, a radiative efficiency ηR is introduced (related to separate losses).Considering these three efficiencies, we write the fraction of the absorbed energy
transformed into heat, ηh, as [59]:
ηh = 1− ηP[(1− ηL)ηR
(λPλF
)+ ηL
(λPλL
)]. (4.2.1)
A very special case occurs when the efficiency is limited by the quantum defectηQD (ηP = ηL = ηR = 1):
ηQD = 1− λPλL. (4.2.2)
Another definition is the amount of heat generated for each Watt of laser output[122]:
ηh,LO =ηh
1− ηh(4.2.3)
In the case of Yb3+:YAG (λP = 0.94 µm, λF ≈ λL = 1.03 µm) and in the quantumdefect limited case, ηQD = 8.7 % of the absorbed power is transformed into heat while96 mW (according to Equation 4.2.3) must be dissipated at the cold reservoir foreach single Watt of laser output. In the case of Ti:Sa (λP = 0.532 µm, λL = 0.8 µm)33.5 % of the absorbed energy is transformed into heat and for each W output power500 mW are dissipated.
The quantum defect limited operation is interesting as it gives the ultimate limitin terms of laser efficiency for a given laser material. However the material propertiesare strongly altered if impurities and other effects are involved. As rare earth ionscan experience energy exchange, an impact on the heat generation will occur. Otherdefects, like OH−, color centers etc., open new decay channels as well [123]. Withincreasing Yb doping a stronger impact of the impurities and defects is found.
Let us now introduce the quantum efficiency ηQ defined as the product of pumpand radiative efficiency:
ηQ = ηPηR (4.2.4)
Values for ηQ for Yb3+:YAG are found experimentally to be 90 − 95% [124, 59].Considering a value of ηQ = 0.93 when no lasing occurs (ηL = 1 in Equation 4.2.1)leads to ηh = 15.1 %, i.e. twice more heat generation than in an ideal quantumdefect limited case, where ηQD = 8.7 %.
122

ASE and Thermal Management on a High Average-Power DPSSL
The volumetric heat production q is consequently
q =PabsηhV
(4.2.5)
where Pabs is the absorbed incident pump power.
4.2.2. Thermal conductivity
In crystalline solid state materials phonons (lattice vibrations) are responsible forthe heat transport. A perfect, infinite crystal would exhibit an infinite thermalconductivity if phonon–phonon interaction is omitted. However, such a perfectcrystalline structure doesn’t exist. The lattice vibrations propagate through thesystem and interact with each other, impurities and other defects. Those interactionslead to a loss of energy before the phonons strike the outer boundary. P. Debye(1884–1966) interpreted the phonons as vibrations in a solid box and in reference tothe theory of gases the expression of the thermal conductivity k [W m−1 K−1]
k =1
3cPνλ (4.2.6)
is derived, where cP is the heat capacity, ν he velocity of the phonons and λ themean free path. For very low temperatures, where the mean free path is mainlyrestricted by the sample size (or the grain size), the thermal conductivity will growproportionally to ∼ T 3 since the heat capacity in the model derived by Debye (orthe model derived by Einstein) carries the corresponding behavior.
To satisfy the collision theory, a phonon energy in the order of 1/2kBΘD isnecessary, where kB is Boltzmann’s constant and ΘD the Debye temperature1. ForYAG values of ΘD varies between 505 K and 750 K [125]. Increasing the temperatureleads to an exponential growth in Umklapp processes [126], decreasing the thermalconductivity.For ambient temperatures a qualitative model determining the thermal conduc-
tivity was derived by Gaumé [127]. The thermal conductivity k is expressed as:
k =1
T
A
γ2ε3T 3/2mp ρ
2/3M1/3 n−1/3 µ−2/3 (4.2.7)
where T is the temperature, A a numerical constant, γ a parameter measuring thedeviation to a pure harmonic behavior of chemical bonds, ε the increase of theinteratomic distance due to the nature of the chemical bond, Tmp the melting pointtemperature, ρ the material density, M the molar mass, n the number of atoms performula unit and µ the reduced mass.
1The Debye temperature is the corresponding reduced temperature at the Debye cut–off energy.
123

4. Thermal Management
This expression reveals that k depends, besides the temperature, on the composi-tion of the laser material, too. Figure 4.1 shows the thermal conductivity of YAG asa function of the grain size (ceramics) and the temperature. As comparison, a singlecrystal is used which is in the order of mm in size. The grain size varies between 3
and 7.5 µm in average and shows a reduction for k in the order of a factor 10.Figure 4.2 illustrates the impact of the doping concentration on the thermal
conductivity as a function of the temperature. A maximum value for k is foundaround 20 K and varies by a factor of 6 if the doping concentration is increased from1 at.% to 20 at.%.
Figure 4.1.: Thermal conductivity of YAG as a function of grain size and temperature,after [128].
The thermal conductivity is strongly affected by the amount of defects in thecrystal lattice. Consequently, changing the doping concentration affects the thermalconductivity, too. The variation of the thermal conductivity depends on the massdifference between the substituted ions. Figure 4.3 shows the variation of the thermalconductivity of Yb3+:YAG at room temperature.
The value of k varies strongly with the doping concentration and shows a minimumaround 30 at.%. Substituting even more Yb3+ for Y3+ will ultimately lead to
124

ASE and Thermal Management on a High Average-Power DPSSL
Figure 4.2.: Thermal conductivity of Yb3+:YAG as a function of doping andtemperature [129].
Yb3+AG instead of Yb3+ : Y AG. By this the thermal conductivity starts risingagain.
Table 4.1 displays ionic radii and molar masses of selected rare earths and ascomparison, Yttrium. It shows for the case of Yb3+:YAG, that the ionic radius ofYb3+ is smaller than Y3+, but the mass significantly higher. A strong dependencyof the thermal conductivity on the doping level is therefore expected. An interestingcombination is a material showing for both, host and substitution, an equal ionicradius and molar mass. As an example one can mention a relatively new lasermaterials like Yb3+ doped LuAG [130].
Element Y3+ Yb3+ Er3+ Tm3+ Lu3+ Nd3+ Ho3+ Ref.Ionic radius [pm] 90 86.8 89 88 86.1 98.3 90.1 [131]Molar mass [g mol−1] 88.9 173 167.3 168.9 175 144.2 164.9 [132]
Table 4.1.: Ionic radius and molar mass of trivalent rare earths and Yttrium
125

4. Thermal Management
Figure 4.3.: Variation of the thermal conductivity of Yb3+:YAG as a function ofsubstitution, after [127]
4.2.3. Heat transport
The temperature distribution within a medium satisfies a parabolic partial differen-tial equation of the Fourier type:
∇(k · ∇T ) + q = ρ cP∂T
∂t(4.2.8)
with k the thermal conductivity tensor, T the temperature field, q the volumetricheat production, ρ the density and c the heat capacity.In an isotropic medium becomes the thermal conductivity tensor a scalar value
and Equation 4.2.8 simplifies to:
k∆T + q = ρ cP∂T
∂t(4.2.9)
where ∆ is the Laplace operator. In general ρ, cP and k are functions of thetemperature.
The solution of this partial differential equation depends on the gain mediumgeometry. Figure 4.4 shows the two simplified schemes for cooling a gain medium.In the case of a rod, cooling is typically applied perpendicularly to the pump andextraction direction. For top–hat pump profile in the case of a static solution with
126

ASE and Thermal Management on a High Average-Power DPSSL
a uniform heat generation in an infinite rod, a parabolic shape can be found in theform of [10] (polar coordinate system):
T (r) = T (r0) +
(q
4k
)(r2
0 − r2) (4.2.10)
Within the context of the Lucia laser system, a thin disc approximation is moresuitable. If the extension of the disc is large compared to its thickness, a one–dimensional estimation in the direction of the pump and extraction direction isvalid.
Again, the volumetric heat production is taken uniform in first order approxima-tion, q(z) = const.. The Boundary Conditions (BC) applied are that on one side anisolation is present and on the other side a boundary condition of the third kind isapplied [133]. Such BC implies that the heat transported through the surface (alongthe surface normal) is proportional to the heat transfer coefficient h [W m−2 K−1]and the difference between the surface temperature TS and the coolant temperatureT∞. Consequently we get in the 1D case:
∂T
∂z
∣∣∣∣S
=h
k(TS − T∞) (4.2.11)
where S stands for the position on the surface.Solving Equation 4.2.9 for a gain medium of the thickness D with the following
BCs:
∂T
∂z
∣∣∣∣z=0
= 0 (4.2.12)
∂T
∂z
∣∣∣∣z=D
=h
k(T (D)− T∞) (4.2.13)
leads to:T (z) =
q
2k
(D2 − z2
)+
1
hqD + T∞ (4.2.14)
This reveals that the temperature is defined by three contributions. The first is,for a given q, quadratic with the position within the medium and doesn’t dependon the heat exchange on the surface. The second part is a constant throughout themedium and can be reduced with a stronger cooling effort (∼ 1/h). Finally thestrongest impact is the offset temperature defined by the coolant itself. The coolanttemperature is usually limited by the dew point of moisture on cooled surfaces orphase change of the coolant.
127

4. Thermal Management
Considering the Lucia laser system, the surface of the active medium is pumpedat ≈ 16 kW cm−2 for 1 ms at 2 Hz. With a thickness of the active medium of D =
7 mm and approximately ηh = 0.1, the heat volumetric heat production is q ≈4.6× 10⁶ W m−3. The first term of Equation 4.2.14 yields ≈ 16 K, whereas thesecond gives ≈ 2 K for a heat exchange coefficient of h ≈ 15.000 W m−2 K−1 and aheat conductivity of k ≈ 7 W m−1 K−1.
The Biot–number Bi of this arrangement is Bi = hD/k ≈ 15. This indicates,that there is a strong variation in temperature between both surfaces. Selectinga thinner gain medium implies a higher doping ratio, as the energy storage andgain should be maintained. However, a higher doping results in a lower thermalconductivity and can lead to parasitic oscillations. If the cooling would be appliedfrom both surfaces, the Biot number can be reduced by a factor of 2. This is limitedby design choices.
Equation 4.2.14 gives a good first order approximation in the static case. For atransient analysis a numerical estimation is necessary. Such a code solves Equation4.2.8 in one dimension using the implicit Finite Differential (FD) method. Anintroduction to FD can be found in e.g. [133].
As an application example, the characteristics of the main laser head is used inFigure 4.5. The coolant temperature is set to 286.15 K which is a typical temperature
Figure 4.4.: Cooling scheme for a rod and for a disc. The pump pulse direction isindicated by a red arrow and the cooling is realized over the largest surfaces (indicatedby blue curly arrows). In the case of a rod (left) cooling is applied on the surfaceperpendicular to the pump direction (z). In the case of a (thin) disc (right) the heatextraction is realized in the pump direction (in z direction along the z–axis).
128
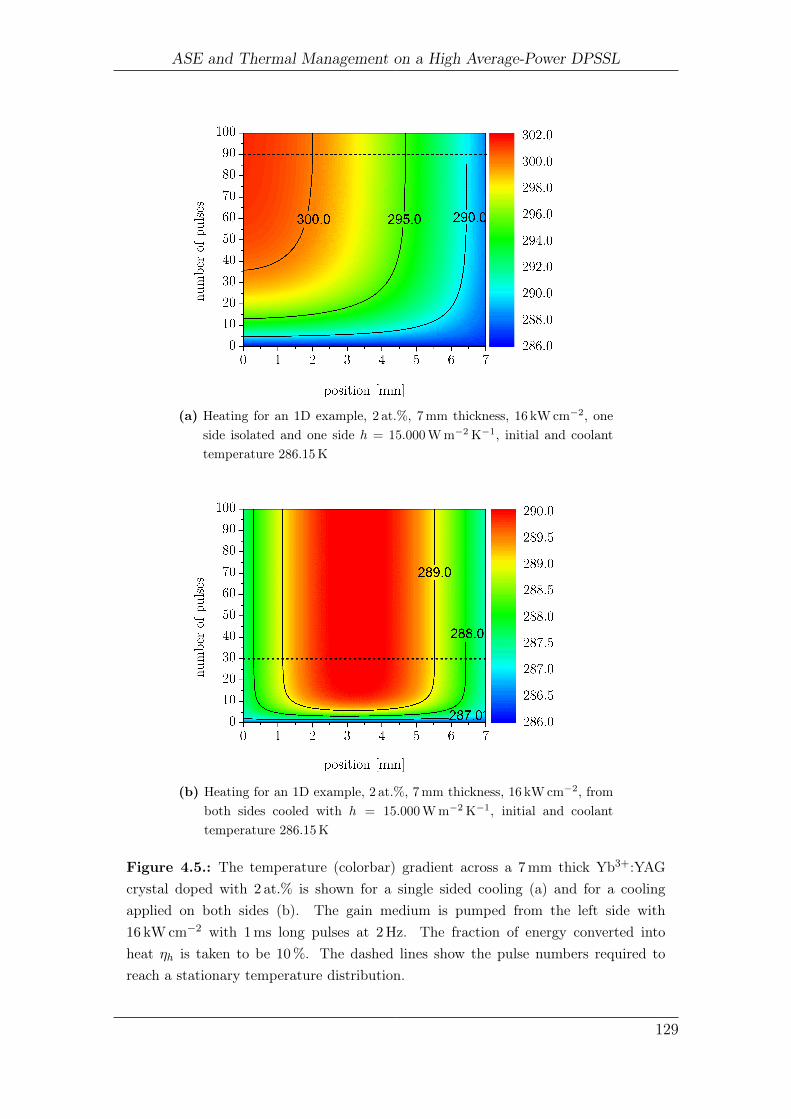
ASE and Thermal Management on a High Average-Power DPSSL
(a) Heating for an 1D example, 2 at.%, 7 mm thickness, 16 kW cm−2, oneside isolated and one side h = 15.000 W m−2 K−1, initial and coolanttemperature 286.15 K
(b) Heating for an 1D example, 2 at.%, 7 mm thickness, 16 kW cm−2, fromboth sides cooled with h = 15.000 W m−2 K−1, initial and coolanttemperature 286.15 K
Figure 4.5.: The temperature (colorbar) gradient across a 7 mm thick Yb3+:YAGcrystal doped with 2 at.% is shown for a single sided cooling (a) and for a coolingapplied on both sides (b). The gain medium is pumped from the left side with16 kW cm−2 with 1 ms long pulses at 2 Hz. The fraction of energy converted intoheat ηh is taken to be 10 %. The dashed lines show the pulse numbers required toreach a stationary temperature distribution.
129

4. Thermal Management
for the laboratory setup. An aggressive cooling with a heat exchange coefficienth = 15.000 W m−2 K−1 is applied to the opposite side of the pump entrance (i.e. atthe position at 7 mm), as shown in Figure 4.5(a), or to both sides (Figure 4.5(b)).The estimation uses a one dimensional code calculating the absorbed pump lightdistribution and the heat propagation within the laser gain medium during andbetween the pump pulses.
As an example 100 pump pulses were launched which corresponds to 50 s of opera-tion. The simplified model derived in the previous paragraphs estimates the surfacetemperature to be ≈ 304 K for a completely absorbed pump pulse. However suchcomplete absorption does not occur for the experimental case under consideration.The total pump absorption is approximately 90 %, reducing the surface temperatureestimation to ≈ 302 K. If there would be any possibility to apply on both surfacessuch an aggressive cooling, a reduction of 4 in peak temperature rise is achieved,as the effective thickness is reduced to its half. Figure 4.5(b) depicts this situation.The slight off–center position is given by the non–uniform heat generation due toabsorption of the laser pump light coming in from the left (position 0).
4.2.4. Radial temperature distribution
Up to this point we expected the lateral extend to be large compared to the thicknessof the heated medium. Especially we assumed that the whole surface is pumped andconsequently the system could be reduced to a one–dimensional geometry.
Let us now assume a partially pumped surface. The thin–disk theory for face–cooled rods described in [134] gives the temperature distribution in the case of acylindrical geometry. In a cylindrical coordinate system (see Figure 4.6) Equation4.2.8 (static problem, isotropic thermal conductivity) becomes:
1
r′∂
∂r′
(r′∂T ′
∂r′
)+
1
4
(1
D′
)2∂2T ′
∂z′2=
−4(αD)e−αDz
′
a′2(1−e−αD), if r′ ≤ a′
0, if r′ > a′(4.2.15)
where the dimensionless variables are r′ = r/b, z′ = z/D, a′ = a/b, D′ = D/2b andT ′ = (T − T∞)/(q/(4πkD)). The sketch of the variables used is found in Figure4.6. This problem can be solved in terms of a Fourier–Bessel series expansion fora face–cooled thin disc. Integrating along the z–axis gives the mean longitudinaltemperature < T ′ >, which is now only a function of the radial position r:
< T ′ >= C0 +∞∑n=1
CnJ0(βnr) (4.2.16)
130

ASE and Thermal Management on a High Average-Power DPSSL
Figure 4.6.: Definitions for the variables used for the radial temperature distributionestimation. The thickness of the cylinder is D, the radius b, the pumped radius a andthe radial position r.
where the βn are the roots of J1(βn) = 0, n = 1, 2, ...,∞ and the coefficients Cn
C0 =F0a
′2
(αD)2
(e−αD − 1
αD+ e−αD +
αD
2
)(4.2.17)
Cn =Fn
(χ)2 − (αD)2
1− e−αD
αD− e−αD
χtanh(χ)
+αD
χ2[cosh(χ)− tanh(χ) sinh(χ)− 1]
(4.2.18)
F0 =4αD
1− e−αD(2D′)2 (4.2.19)
Fn =F0
[2
βna′J1(βna
′)
J20 (βn)
](4.2.20)
χ =2D′βn (4.2.21)
As an example, Equation 4.2.16 is solved for αD = 1, D′ = 0.2 and plotted for threedifferent a′ in Figure 4.7. The more the surface is covered by the pump, the morehomogeneous is the radial temperature distribution. If the gain medium surface isonly partially covered by the pump spot, a thermal lens becomes important.
131

4. Thermal Management
Figure 4.7.: The solution for Equation 4.2.16 for the dimensionless parameters αD =
1, D′ = 0.2. In the case of an almost covered surface (a′ = 0.75), the temperaturevariation within the pumped area is low, while in the case a′ = 0.25 an importantvariation of the mean temperature distribution is found.
132
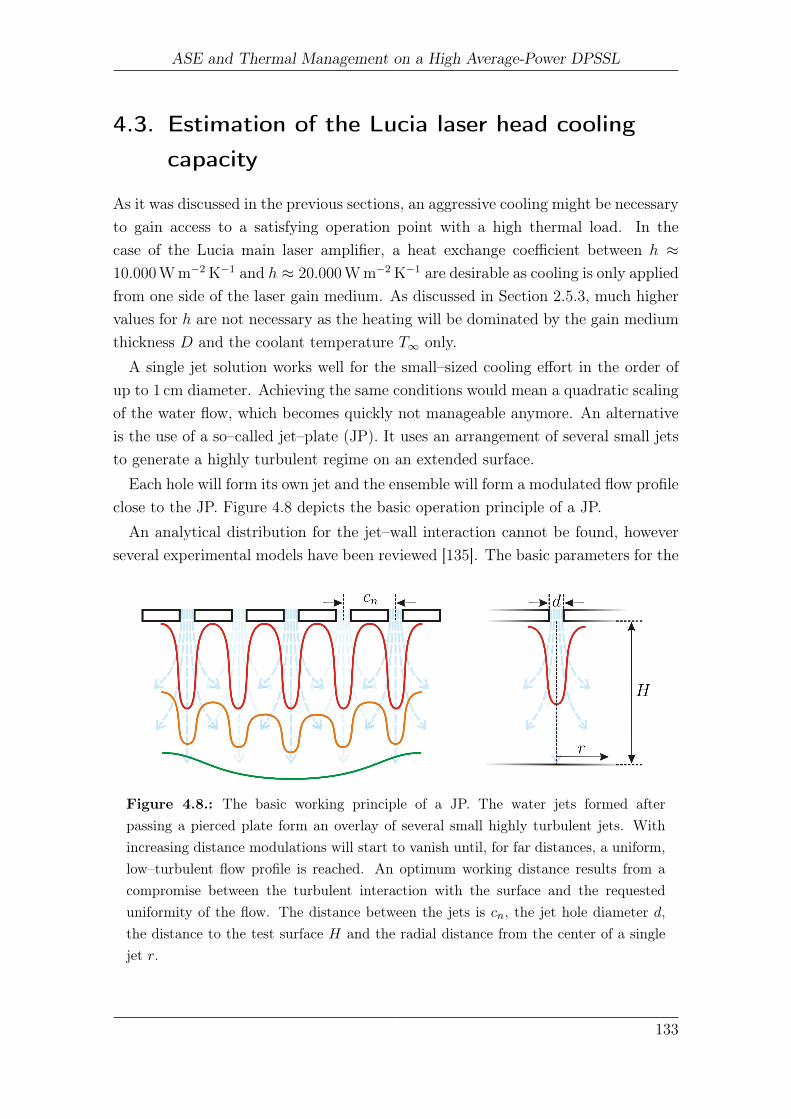
ASE and Thermal Management on a High Average-Power DPSSL
4.3. Estimation of the Lucia laser head cooling
capacity
As it was discussed in the previous sections, an aggressive cooling might be necessaryto gain access to a satisfying operation point with a high thermal load. In thecase of the Lucia main laser amplifier, a heat exchange coefficient between h ≈10.000 W m−2 K−1 and h ≈ 20.000 W m−2 K−1 are desirable as cooling is only appliedfrom one side of the laser gain medium. As discussed in Section 2.5.3, much highervalues for h are not necessary as the heating will be dominated by the gain mediumthickness D and the coolant temperature T∞ only.
A single jet solution works well for the small–sized cooling effort in the order ofup to 1 cm diameter. Achieving the same conditions would mean a quadratic scalingof the water flow, which becomes quickly not manageable anymore. An alternativeis the use of a so–called jet–plate (JP). It uses an arrangement of several small jetsto generate a highly turbulent regime on an extended surface.
Each hole will form its own jet and the ensemble will form a modulated flow profileclose to the JP. Figure 4.8 depicts the basic operation principle of a JP.
An analytical distribution for the jet–wall interaction cannot be found, howeverseveral experimental models have been reviewed [135]. The basic parameters for the
Figure 4.8.: The basic working principle of a JP. The water jets formed afterpassing a pierced plate form an overlay of several small highly turbulent jets. Withincreasing distance modulations will start to vanish until, for far distances, a uniform,low–turbulent flow profile is reached. An optimum working distance results from acompromise between the turbulent interaction with the surface and the requesteduniformity of the flow. The distance between the jets is cn, the jet hole diameter d,the distance to the test surface H and the radial distance from the center of a singlejet r.
133

4. Thermal Management
description are defined in Figure 4.8. According to Chang et. al. [136] the localNusselt number (Nu) for a single jet can be expressed in terms of the Reynoldsnumber (Re), the Prandtl number (Pr), the distance between the JP and the surfaceH to be cooled, the jet hole diameter d and the radial coordinate starting from thecenter of the jet r as:
Nu(r) = 0.66Re0.574 Pr0.4
(H
d
)−0.106[
1 + 0.1147
(r
d
)1.81], for r/d<1.25 (4.3.1)
Nu(r) = 0.7012Re0.574 Pr0.4
(H
d
)−0.106(r
d
)−0.62
, for r/d>1.25 (4.3.2)
The connection between Nu and heat exchange coefficient h is Nu = hLtyp/k
whereas k is the heat conductivity of the coolant and Ltyp is a typical length. TheReynolds number can be expressed as Re = vd/ν where v is the coolant velocityand ν the viscosity of the coolant. An expression of the Prandtl number is found tobe Pr = ν/α where α is the thermal diffusivity of the coolant.
In the case of water jets, the Prandtl number at room temperature is Pr ≈ 8.8.The JP developed for Lucia uses 39 holes d = 1.4 mm in diameter and a water flowof ≈ 14 L min−1 which yields Re ≈ 5, 900. Ltyp is, in the case of the JP, ≈ 5 mm.Plotting the resulting h as a function of the relative position r/d and the parameterH/d yields maximum heat exchange coefficients in the order of 24.000 W m−2 K−1 upto 32.000 W m−2 K−1 (Figure 4.9). It should be noted, that the jump at r/d = 1.25
has no physical meaning and values around this specific value will be incorrect, sinceno behavior for the transition is given.The central local minimum (at r/d = 0) indicates a reduced water flow in the
center of the impinging water jet. An incoming jet splits up into a radial distributionleaving a reduced velocity in the center (stagnation). For large distances, or a non–perpendicular impact, this behavior looses its physical meaning and a different modelshould be used.In the case of a JP, the distance between the jets plays an important role, as it is
found in experimental works e.g. [137, 138] and especially by Tawfek et. al. [139].The average Nusselt number Nu is found to be
Nu = 0.453Re0.691 Pr1/3
(H
d
)(cnd
)−0.38
(4.3.3)
where cn is the average distance between jets. One has to be aware, that thisrelation holds only true in the case of a sufficiently long distance between the JPand the test surface 3 < H/d < 8, a Reynolds number between 3,400 and 20,000
134

ASE and Thermal Management on a High Average-Power DPSSL
Figure 4.9.: Estimation of the heat exchange coefficient for one single jet. Thecharacteristics of the jet corresponds to one of the jets on the JP used for the Luciamain laser head. A typical dimensionless distance between the exit of the jet and thesurface H/d is between 3 and 5. The dimensionless position r/d has its maximum atr/d = 1.25 with values varying between 24.000 W m−2 K−1 and 32.000 W m−2 K−1.
135

4. Thermal Management
Figure 4.10.: Scheme of measuring the heat exchange coefficient of the Lucia laserhead. The thermalized laser head is abruptly brought in contact with cold waterflowing through the JP setup under the operational conditions. The temperature of thewater and the surface temperature of the gain medium are measured simultaneously.the setup is brought back to room temperature and the measurement starts again forthe same or a different distance of the JP to the test surface. The data of the surfacetemperature is compared to the result of a 1D simulation using the incoming watertemperature as reference. An estimation for h is found, when the deviation betweenmeasurement and simulation is minimized.
and 4 < cn < 8. Our experimental parameters fit these requirements partially withcn = 5.5, Re ≈ 5, 900 and 0.4 < H/d < 8.2. Consequently for short experimentaldistances between JP and surface, the domain of validity of this relation will not besatisfied.
Figure 4.10 describes the experimental measurement scheme used to estimate ofthe heat exchange coefficient h. At first the laser head, holding a test plate, isat room temperature (the coolant as well). Using a three–way valve, the watercirculation loop is abruptly changed to water coming out of a cold reservoir. Thetemperature of the cold water arriving at the back side of the test plate is measuredusing a fast external thermocouple (Type K probe 304SS, Omega Newport). Thetemperature evolution at the center of the isolated side (in contact to air) of the testplate is simultaneously measured using a fast response, self-adhesive thermocouple(SA1XL-KI-SRTC, Omega Newport). The test plate is maintained in its mountusing silicone. Finally the temperature of the whole system is heated back to roomtemperature. Figure 4.11 shows a sketch of the experimental setup. This sequenceis repeated several times for each H.
The result of each measurement sequence is then simulated using the data col-lected from the internal thermocouple (measuring the water temperature) with the1D heat transport code, which was used in the previous section. Adjusting the
136
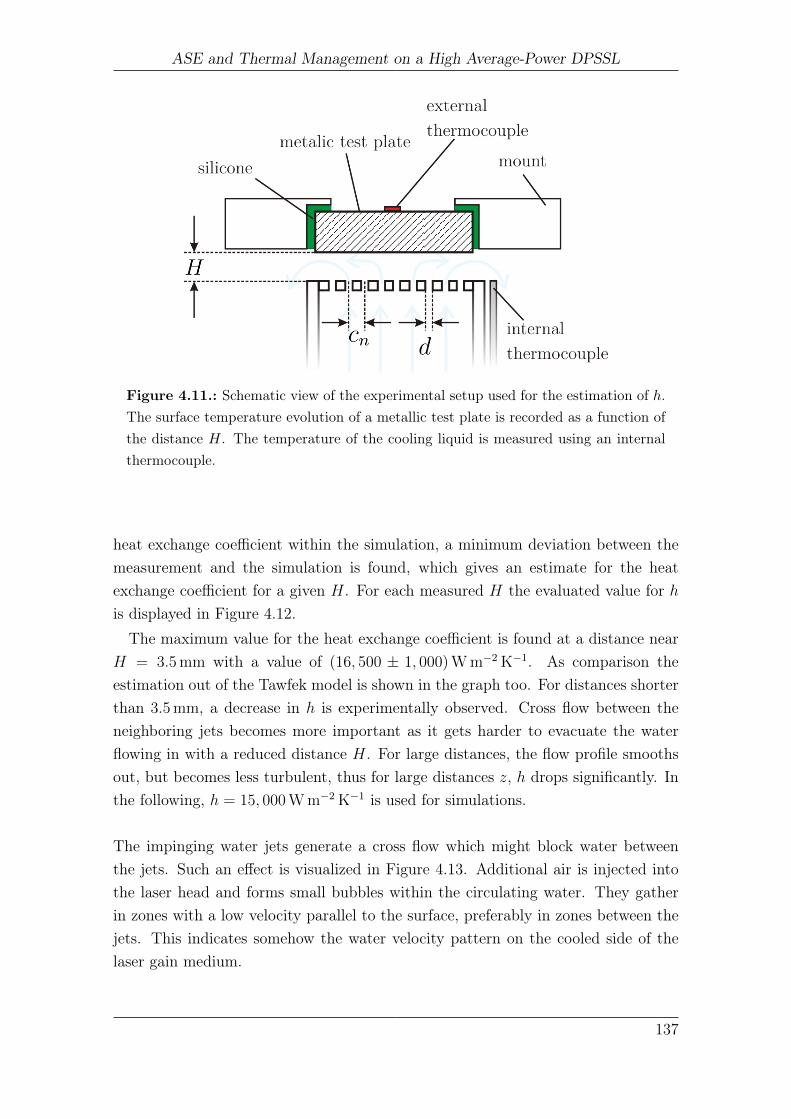
ASE and Thermal Management on a High Average-Power DPSSL
Figure 4.11.: Schematic view of the experimental setup used for the estimation of h.The surface temperature evolution of a metallic test plate is recorded as a function ofthe distance H. The temperature of the cooling liquid is measured using an internalthermocouple.
heat exchange coefficient within the simulation, a minimum deviation between themeasurement and the simulation is found, which gives an estimate for the heatexchange coefficient for a given H. For each measured H the evaluated value for his displayed in Figure 4.12.
The maximum value for the heat exchange coefficient is found at a distance nearH = 3.5 mm with a value of (16, 500 ± 1, 000) W m−2 K−1. As comparison theestimation out of the Tawfek model is shown in the graph too. For distances shorterthan 3.5 mm, a decrease in h is experimentally observed. Cross flow between theneighboring jets becomes more important as it gets harder to evacuate the waterflowing in with a reduced distance H. For large distances, the flow profile smoothsout, but becomes less turbulent, thus for large distances z, h drops significantly. Inthe following, h = 15, 000 W m−2 K−1 is used for simulations.
The impinging water jets generate a cross flow which might block water betweenthe jets. Such an effect is visualized in Figure 4.13. Additional air is injected intothe laser head and forms small bubbles within the circulating water. They gatherin zones with a low velocity parallel to the surface, preferably in zones between thejets. This indicates somehow the water velocity pattern on the cooled side of thelaser gain medium.
137

4. Thermal Management
Figure 4.12.: Experimental result for the heat exchange coefficient of the jet–platecompared to the Tawfek relation (Equation 4.3.3). For close distances, the water flowis hindered and consequently the heat exchange coefficient lowered in average. Anoptimum position is found near 3.5 mm distance between the jet–plate and the cooledsurface.
Figure 4.13.: Visualization of the cross flow introduced by neighboring water jetswith the JP of the main laser head. Air is injected into the laser head and appearsas small bubbles caught in the cross flow regions. As the arrangement is hexagonal,a similar pattern is found in the visualization. Under standard operation, no suchturbulences are visible to the naked eye, as no air is within the laser head.
138

ASE and Thermal Management on a High Average-Power DPSSL
A question arises then: if the lateral cross flow of the water significantly impactsthe heat exchange coefficient, will an important surface temperature variation beobserved? To answer, we set up an experiment whose results are presented inFigure 4.14. An IR camera images the surface temperature distribution of a pumpedrectangular Yb3+:YAG crystal of high doping concentration. A crystal with a dopinglevel of 20 at.% and a thickness of 4.7 mm was used. The gain medium was pumpedat up to 10 Hz with an intensity of only ≈ 1.8 kW cm−2. The transverse temperaturevariation is in the order of ∼ 0.2 K and does not change with a variation of H.Consequently the inhomogeneity of the JP flow will not seriously impact the laser
head performance. It is sufficient for the following calculations to consider a spatiallyaveraged h, which will be taken from now on to be h = 15.000 W m−2 K−1.
Figure 4.14.: Visualization of the surface temperature modulations introduced by thejet–plate for different distances jet–plate – cooled surface H. A highly doped (20 at.%)Yb3+:YAG crystal with a thickness of 4.7 mm thickness is mounted into the laser headand pumped at 2 kW cm−2 using the MPA. The surface temperature distribution isrecorded with an IR camera at an angle of observation of 25 with respect to thesurface normal. A variation of the distance H does not reveil any qualitative change.A hexagonal temperature variation is visible. It must be noted that the image colorscale is adapted to augment the contrast, as the temperature variation is small.
139

4. Thermal Management
4.4. Thermally induced wavefront deformation
While the last section was dedicated to the generation of heat, the resulting tem-perature distribution within the laser gain medium and consequently the use of aspecific cooling technique for the active mirror case, we now discuss the impact ofthis temperature distribution on the opto–mechanical properties of the pumped lasergain medium.
A laser beam traveling through a pumped laser gain medium will experience un-avoidable wavefront deformations. The deformation has three origins:
• deformations of the surfaces – mechanical lens effect
• bulk nonuniform temperature distribution – thermal lens effect
• nonuniform pump profile – “electronic” lens effect
The first effect is mechanically connected to the temperature, as a nonuniformtemperature distribution leads to different elongations at different positions withinthe crystal – the medium is deformed and by this its surfaces. This leads, as we willsee, to a “bi–metal” deformation in the case of thin disks and to a bulging of thesurfaces.
The thermal lens effect can be split up into several contributions. At first, atemperature variation leads to a profile of the index of refraction. This impactsthe phase of the transmitted laser beam. With the thermal expansion, stress andstrain are applied to the material and changes consequently the optical indicatrix[140]. Polarization dependent effects, like bi–focusing, birefringence, etc. appear. Athorough discussion can be found in [141].
The third effect (electronic lens effect) is more subtle, as an excitation within theelectronic level system changes the polarizability within the material [142, 143].
Figure 4.15 illustrates schematically the case of a gain medium in the not pumpedand the pumped case. We consider a rod–like geometry with cylindrical coordinatesr, θ and a coordinate z along the (straight) propagation direction. The extend ofthe gain medium is L and the free space traveled d. For the optical path in the notpumped case one can write:
δoff = n0(Tc)L+ d (4.4.1)
where Tc is the initial (cold) temperature. Being pumped (on), this changes to:
δonr,θ =
∫ L+∆L
0
nr,θ(T, εj, n) dz + d−∆L(r). (4.4.2)
140

ASE and Thermal Management on a High Average-Power DPSSL
Figure 4.15.: The thermal index variations of a pumped gain medium depends onthe temperature T , the strain/stress εj and the inversion n, after [141].
where the index strain is εj, the coordinates are r, θ, z and ∆L(r) corresponds to the(mechanical) deformation of the material. Expanding this equation into a Taylorseries and neglecting terms higher than the first order, yields for a pump lightdistribution depending only on r and z:
δonr,θ =
∫ L+∆L
0
[n0(Tc) +
(∂nr,θ∂T
)(T (r, z)− Tc)
+∑j=r,θ,z
(∂nr,θ∂εj
)εj(r, z) +
(∂nr,θ∂n
)n(r, z)
]dz + d−∆L(r).
(4.4.3)
where we estimated the electronic lens effect to be independent from temperatureand strain. It should be noted, that n corresponds to the excitation of the upperlaser state.
Equation 4.4.3 is discussed partially in [141]. Let us estimate the order of mag-nitude for the electronic lens. For the sake of simplicity, all effects are taken to beisotropic. The corresponding change in the refractive index due to a temperaturechange ∆T (at constant strain) is thus:
∆nT =∂n
∂T∆T (4.4.4)
The change in the refractive index due to the change in polarizability ∆p is givenas [142, 143]:
∆ne = 2πF 2L∆p∆n/n0 (4.4.5)
where FL = (n20+2)/3 is the Lorenz factor and ∆n the population inversion difference
across the extraction beam profile. The change in polarizability is in the order of∆p ≈ 2× 10⁻²⁶ cm3 for Yb3+:YAG in the visible (633 nm) [143] and near infrared(1030 nm) [144] spectral region. Data for other gain media are also available [145,146]. On the other hand, the refractive index is dependent from the temperature aswell. At ambient temperature ∂n/∂T ≈ 8× 10⁻⁶ K−1 for YAG, while it drops downto 3× 10⁻⁶ K−1 at 150 K [130].
141

4. Thermal Management
At room temperature ∆T is typically in the order of 10 K, whereas ∆n ≈ 0.2×ntot.With a doping of 2 at.%, we get ∆nT ≈ 8×10⁻⁵ while ∆ne ≈ 10.8×2 ·10−26×0.2×2× 1.39 · 1020 ≈ 1.2× 10⁻⁶. The electronic lens effect is approximately one order ofmagnitude less important than the refractive index change due to the temperaturevariation. At cryogenic conditions however, they might get comparable. However,as the desired pump light distribution is usually as homogeneously as possible, anelectronic lens effect might be suppressed.
In the case of a rod–like geometry, the thermal lens dominates over the surfacedeformation [10]. Considering the Lucia main amplifier head, where the gain mediumis close to the shape of the thin disc geometry, a strong thermal variation perpen-dicular to the extraction direction is not expected. The mechanical lens effect willbe consequently stronger than the thermal lens effect.
4.4.1. Basic Model
In order to estimate, in first order, the deformation for the thin disk case, we considerthe deformation to be small and the bulging between the surfaces to be negligible.With the definitions as shown in Figure 4.16 we get:
L
L+ ∆L=
R
R +D(4.4.6)
The elongation with the temperature is ∆L = αT∆TL with ∆T the temperaturedifference between surfaces and αT the thermal expansion coefficient. We get bythis:
R =D
αT∆T(4.4.7)
Using Equation 4.2.14 to determine the temperature difference between the twolarge surfaces in the single–side cooled, active mirror case:
∆T =qD2
2k(4.4.8)
The volumetric heat generation q is expressed using Equation 4.2.5 as
q = ηhηabsPinj/V (4.4.9)
where the factor ηabs describes the fraction of the absorbed total injected averagepower Pinj within the volume V . As q was assumed to be uniform, the volume V isby this defined as V = AbeamD where Abeam is the beam section. Finally, the radius
142
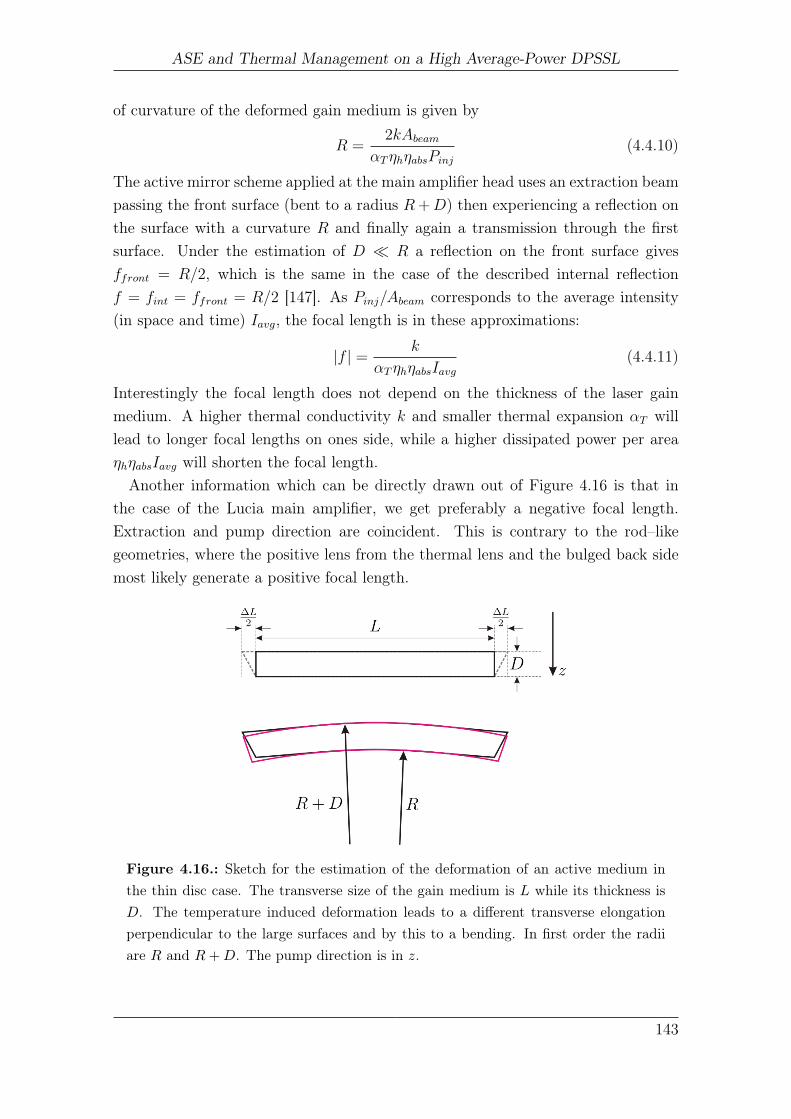
ASE and Thermal Management on a High Average-Power DPSSL
of curvature of the deformed gain medium is given by
R =2kAbeam
αTηhηabsPinj(4.4.10)
The active mirror scheme applied at the main amplifier head uses an extraction beampassing the front surface (bent to a radius R+D) then experiencing a reflection onthe surface with a curvature R and finally again a transmission through the firstsurface. Under the estimation of D R a reflection on the front surface givesffront = R/2, which is the same in the case of the described internal reflectionf = fint = ffront = R/2 [147]. As Pinj/Abeam corresponds to the average intensity(in space and time) Iavg, the focal length is in these approximations:
|f | = k
αTηhηabsIavg(4.4.11)
Interestingly the focal length does not depend on the thickness of the laser gainmedium. A higher thermal conductivity k and smaller thermal expansion αT willlead to longer focal lengths on ones side, while a higher dissipated power per areaηhηabsIavg will shorten the focal length.
Another information which can be directly drawn out of Figure 4.16 is that inthe case of the Lucia main amplifier, we get preferably a negative focal length.Extraction and pump direction are coincident. This is contrary to the rod–likegeometries, where the positive lens from the thermal lens and the bulged back sidemost likely generate a positive focal length.
Figure 4.16.: Sketch for the estimation of the deformation of an active medium inthe thin disc case. The transverse size of the gain medium is L while its thickness isD. The temperature induced deformation leads to a different transverse elongationperpendicular to the large surfaces and by this to a bending. In first order the radiiare R and R+D. The pump direction is in z.
143

4. Thermal Management
4.4.2. Thermal performance of the laser head
Three separate cases are depicted in Figure 4.17. An Yb3+:YAG crystal doped at2 at.% at ambient temperature (300 K) is characterized by αT ≈ 6× 10⁻⁶ K−1 andk = 9 W m−1 K−1, while at 150 K the thermal focal length increases by almost afactor of 4, since αT ≈ 3.5× 10⁻⁶ K−1 and k = 20 W m−1 K−1 (ηh = 0.1, ηabs = 0.9).
The third case is a thick, highly doped crystal (20at.%). As discussed before, forsuch high doping concentrations the heat generation is strongly increased. Valuesreported are in the order of up to 30 % [148].
The crystal is thick compared to the reabsorption–length (1/e) and consequently,strong reabsorption introduces an additional heating rate. As the spontaneousemission is isotrope, the spontaneously emitted photons near the surface have achance of ∼ 50 % to escape the crystal, otherwise they are reabsorbed and generateadditional heat. A photon traveling from one surface to the other will consequentlyincrease the heat generation by ≈ 0.5 · 0.3/(1− 0.5 · 0.3) ≈ 18 %.
Figure 4.17.: Estimations for the thermally induced focal length in three cases as afunction of the average incident intensity Iavg. Plotted curves stand for 2 at.% dopedYb3+:YAG crystal at 300 K and 150 K with ηh = 0.1, ηabs = 0.9 and a highly dopedcase (20 at.%), where ηh = 0.5 and ηabs = 1 are estimated.
144

ASE and Thermal Management on a High Average-Power DPSSL
Overall for a thick, highly doped crystal, we get ηh ≈ 0.5. Considering also atwice lower thermal conductivity, it is expected, that such a crystal will generate aone order of magnitude shorter thermally induced focal length compared to its lowdoped counterpart.
Figure 4.18 illustrates the experimental setup to measure the wavefront deformationon the main laser amplifier head. A collimated cw laser source (633 nm and 1064 nm)is imaged on the laser head, reflected on/within the pumped gain medium wavefrontand finally imaged onto a wavefront sensor (SID4, Phasics). The laser head ispumped using the LDA (red arrow) with intensities of up to 18 kW cm−2 andrepetition rates of up to 10 Hz in a circular area with a diameter of 30 mm. Thepulse length is 1 ms. The angle of incidence is 25, corresponding to an internalreflection angle of 13.Three different crystals were studied:
• 2 at.%, rectangular crystal, 40 mm× 35.8 mm× 8.4 mm
• 20 at.%, rectangular crystal, 41 mm× 37 mm× 4.7 mm
• 2 at.%, circular crystal, 60 mm diameter, 7 mm thickness
where the first two crystals served as calculation testbed, while the 60 mm circulardisc corresponds to the actual gain medium used on the Lucia laser amplifier.
Figure 4.18.: Sketch of the experimental setup measuring the wavefront deformationon the Lucia main amplifier laser head. A well collimated cw laser source is imagedonto the crystal to be tested. The analyzed reflection might be coming from the frontsurface or from the rear surface (internal reflection). The reflected wavefront is imagedonto a wavefront sensor. The reference wavefront is recorded, when no incident pumplight illuminates the crystals.
145

4. Thermal Management
The rectangular crystals are coated in such a way, that both large surfaces have alow reflectivity for the pump wavelength (i.e. 940 nm AR). For the test wavelength(in this case 633 nm) one side is HR coated, while the opposite side is AR coated.With this feature, the crystals can be flipped, to either measure the wavefrontdistortion introduced by only the front surface or the whole distortion as it is seenby the extraction beam under internal reflection (see Figure 4.18).
The circular crystal is coated according to Lucia nominal pump/extraction re-quirements, i.e. one surface is anti–reflection coated for both the pump wavelengthand extraction/test wavelength and the other surface is highly reflective for bothwavelengths as well. As the designed extraction wavelength is 1030 nm, a sufficientlygood performance for the test wavelength at 1064 nm is ensured.The phase arriving at the wavefront sensor is expanded on Zernike polynomials.
One of those polynomial describes the parabolic deformation (defocus) of the wave-front, its amplitude is Zdef . The corresponding focal length f can be calculated withthe pupil radius rp and the measurement wavelength λ:
|f | =r2p
4√
3λZdef. (4.4.12)
The first crystal to be tested is the highly doped (20 at.%, 4.7 mm thickness) sample,as it is expected to exhibit the strongest deformation for a given Iavg. Figure4.19 shows the first twelve Zernike polynomials for six different average intensitiesvarying between 0.2 W cm−2 and 20.7 W cm−2. Ten successive shots were averagedfor repetition rates ranging from 0.1 Hz to 10 Hz. The measurement was performedon the front surface reflection only.
Figures 4.19(a) and 4.19(b) show clearly that the defocus and the 0 astigmatismpolynomials are the most important, where Zdef is approximately six times strongerthan Zast0 . We will mainly face a parabolic wavefront distortion. On these graphsonly the steady state wavefront deformation is considered. Let us now examinethe temporal behavior of the two most important Zernike polynomials between twosuccessive pump pulses as it gives information about the heat generation and trans-port. Figure 4.21(a) depicts, in double logarithmic scale, the temporal evolution ofthe absolute values for the first Zernike Polynominal (Zdef ) and the correspondinginformation for Zast0 .
The peak power of the pump pulse was ≈ 2.1 kW cm−2 with a pulse length of 1 ms.Two successive pump pulses are separated by their repetition rate ranging from0.1 s (10 Hz) to 10 s (0.1 Hz). This fixed pump power combined with a repetitionrate varying over two decades allow to explore a range of average power from 0.2
146

ASE and Thermal Management on a High Average-Power DPSSL
(a) The first 12 Zernike polynomials as a function of the average incidentintensity Iavg for a highly doped Yb3+:YAG slab (20 at.%). The intensitieswere 0.2 W cm−2, 0.7 W cm−2 and 2.1 W cm−2.
(b) The first 12 Zernike polynomials as a function of the average incidentintensity Iavg for a highly doped Yb3+:YAG slab (20 at.%). The intensitieswere 6.2 W cm−2, 10.4 W cm−2 and 20.7 W cm−2.
Figure 4.19.: The first 12 Zernike polynomials in the case of the highly doped 20 at.%
Yb3+:YAG slab. The polynomial describing the defocus, Zdef , is approximately oneorder of magnitude stronger than the second, the 0 astigmatism Zast0 .
147
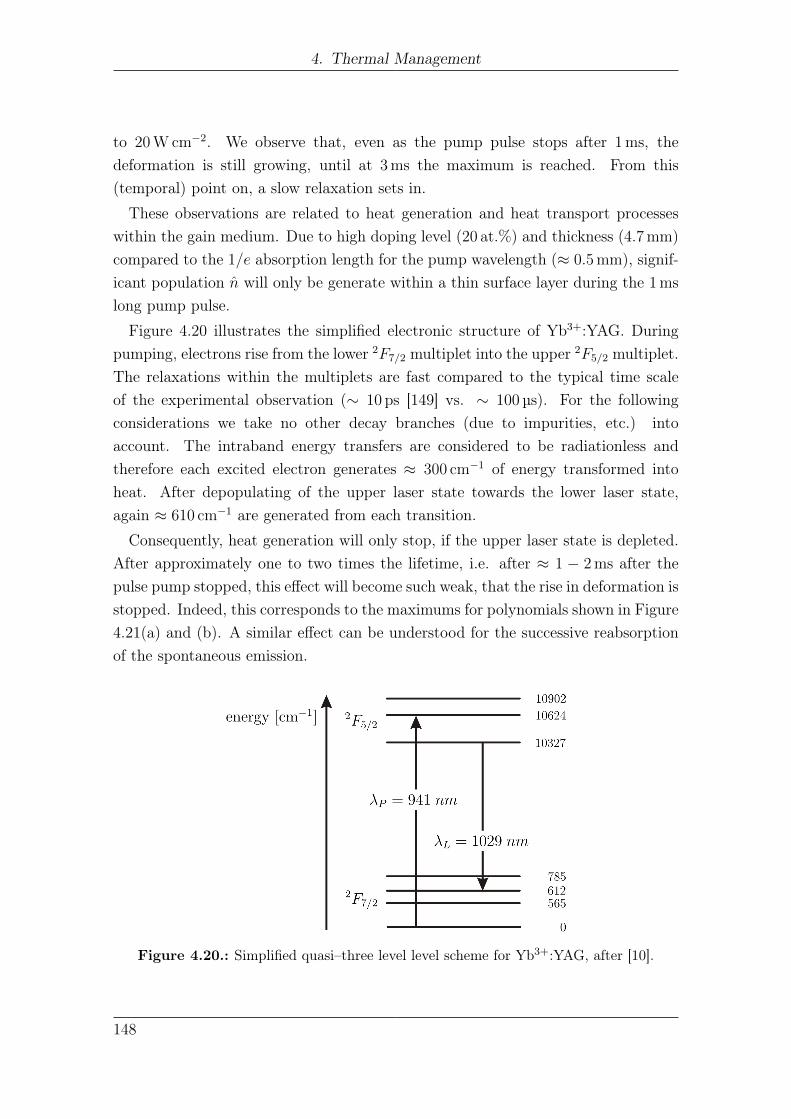
4. Thermal Management
to 20 W cm−2. We observe that, even as the pump pulse stops after 1 ms, thedeformation is still growing, until at 3 ms the maximum is reached. From this(temporal) point on, a slow relaxation sets in.
These observations are related to heat generation and heat transport processeswithin the gain medium. Due to high doping level (20 at.%) and thickness (4.7 mm)compared to the 1/e absorption length for the pump wavelength (≈ 0.5 mm), signif-icant population n will only be generate within a thin surface layer during the 1 ms
long pump pulse.
Figure 4.20 illustrates the simplified electronic structure of Yb3+:YAG. Duringpumping, electrons rise from the lower 2F7/2 multiplet into the upper 2F5/2 multiplet.The relaxations within the multiplets are fast compared to the typical time scaleof the experimental observation (∼ 10 ps [149] vs. ∼ 100 µs). For the followingconsiderations we take no other decay branches (due to impurities, etc.) intoaccount. The intraband energy transfers are considered to be radiationless andtherefore each excited electron generates ≈ 300 cm−1 of energy transformed intoheat. After depopulating of the upper laser state towards the lower laser state,again ≈ 610 cm−1 are generated from each transition.
Consequently, heat generation will only stop, if the upper laser state is depleted.After approximately one to two times the lifetime, i.e. after ≈ 1 − 2 ms after thepulse pump stopped, this effect will become such weak, that the rise in deformation isstopped. Indeed, this corresponds to the maximums for polynomials shown in Figure4.21(a) and (b). A similar effect can be understood for the successive reabsorptionof the spontaneous emission.
Figure 4.20.: Simplified quasi–three level level scheme for Yb3+:YAG, after [10].
148

ASE and Thermal Management on a High Average-Power DPSSL
(a) Time resolved measurement of the absolute value of the defocus Zernike polynomial.
(b) Time resolved measurement of the absolute value of the 0 astigmatism Zernikepolynomial.
Figure 4.21.: The time resolved measurement of the wavefront deformation yieldsthe temporal evolution of the Zernike polynomials, of which the absolute values of thedefocus Zdef and the 0 astigmatism are shown. The variation of the repetition rategenerates the different average intensities. The pump duration was 1ms.
149

4. Thermal Management
At ≈ 2 ms after the end of the pump pulse, the deformation starts to decreaseuntil the next pulse sets in. For large deformations such transient thermal effectsbecome small and can consequently be neglected. Therefore only the steady statethermal deformation is of interest for the following discussion.
Since Zdef is dominant against the other wavefront distortions, we will concentratefrom this point on the focal length calculated using Equation 4.4.12.
For several average incident intensities Iavg, we have measured the wavefrontdeformation and extracted the corresponding focal length with Equation 4.4.12,using the polynomial Zdef derived out of the static deformation. Figure 4.22 showsthe calculated focal length as the function of the average Intensity Iavg for the threestudied cases. Figure 4.22(a) illustrates the steady state focal length for the highlydoped gain medium case.
As references, both estimated performances are shown in Figure 4.17 for 300 K areadded. A good accordance to the 1/Iavg relation is found (see Equation 4.4.11). Forhigh average intensities (above 10 W cm−2), the gain medium properties (especiallythe thermal conductivity and thermal expansion) dependency from the temperaturehave to be taken into account. As this is not the case for the modeling, deviationsfrom the experimental results occur.
The fracture limit of the gain medium under such conditions was reached at≈ 30 W cm−2, while the experimental arrangement was set up for front–surfacereflection analysis. Therefore no measurement for the internal reflection could beperformed on this crystal for the internal reflection case.
Figure 4.22(b) shows the case of the 8.4 mm thick, rectangular crystal doped at2 at.% and compares the result to the simple model derived in Section 4.4.1. Both, forthe reflection on the front surface (solid triangles) and the reflection on the inner HRcoating (open triangles), a very good agreement between the measurement resultsand the prediction is found.
The same evaluation in the case of the 60 mm diameter circular disk brings an ob-vious mismatch from the model as shown in Figure 4.22(c). The measurement showsa significantly better performance as it could be expected. The model expressed inEquation 4.4.11 is not capable anymore to predict such a behavior. Indeed, as statedin Section 4.2.4, a temperature distribution cannot be neglected anymore.
In the cases of the rectangular crystal, the typical size was 40 mm, while a 30 mm
pump diameter was used. This corresponds to 75 % of occupation (a′ = 0.75 inFigure 4.7). In the circular case (Lucia), this value dropped to 50 % (a′ = 0.5 inFigure 4.7). Therefore a more complex, three dimensional analysis is necessary andwill be described in the following section.
150

ASE and Thermal Management on a High Average-Power DPSSL
(a) Focal length in the 20 at.% doped, rect. crystal case
(b) Focal lengths in the 2 at.% doped, rect. crystal case
(c) Focal length in the 2 at.% doped, circular crystal case
Figure 4.22.: Comparison between the experimentally observed static deformationand predictions for three different crystals. While (a) and (b) can be explained withthe simplified derived model, a complete model for (c) is necessary.
151

4. Thermal Management
4.4.3. Numerical estimation of the gain medium deformation
As we have seen in the previous section, a simple analytical model can describe,under certain approximations, the thermally induced wavefront deformations.
The model developed in Section 4.4.1 took only the lateral deformation into ac-count, but not the bulging of the surfaces and thermal lens due to a non–homogeneouslateral temperature profile. Therefore a three dimensional numerical calculation isrequired.
A Finite–Element–Analysis (FEA) is performed using CAST3M2 in order tocalculate the wavefront deformation of a plane wave traveling through the gainmedium.
In the model we consider the material properties (ρ, c, k, αT ) as constant. If asignificant rise in temperature is observed, we will consequently underestimate thetemperature and deformation.
The calculation for the three individual gain medium configurations (described onpage 145) is performed in three steps:
• Calculation of the temperature distribution
• Calculation of the deformation
• Estimation of the wavefront deformation
Figure 4.23 illustrates the result of the steady state heat transport equation bydisplaying the resulting temperature map and the steady state deformation for therectangular highly doped crystal (20 at.%, 4.7 mm thickness) pumped with Iavg =
30 W cm−2 and the Lucia laser head relevant case of a circular, 7 mm thick, 2 at.%
doped crystal pumped with Iavg = 75 W cm−2.It should be noted, that the calculated temperature for the highly doped crystal
exceeds 120 C at a pump intensity of Iavg = 30 W cm−2, while in the case shown inFigure 4.23(b) only 41 C are reached for Iavg = 75 W cm−2. Consequently, as alreadymentioned, the interpretation of the values derived for the highly doped case mustbe taken with caution due to the temperature dependent material properties.
Figure 4.24 shows the predicted distorted wavefronts (with a 24 mm observa-tion pupil) after exiting the crystal with an internal reflection for the circular(a) rectangular (b) crystals doped at 2 at.%. The average pump intensity was
2CAST3M is available at http://www-cast3m.cea.fr/cast3m/index.jsp
152

ASE and Thermal Management on a High Average-Power DPSSL
(a) Deformation and temperature map (colorbar in C) for the 20 at.% doped,rectangular crystal, Iavg = 30 W cm−2, deformation is ×300 magnified.
(b) Deformation and temperature map (colorbar in C) for the 2 at.% doped, cylin-drical crystal, Iavg = 75 W cm−2, deformation is ×3000 magnified.
Figure 4.23.: Deformation and temperature map for the 20 at.% doped, rect. crystalpumped at Iavg = 30 W cm−2 (a) and the 2 at.% doped, circ. crystal pumped atIavg = 75 W cm−2 (b). The deformation in (a) is magnified 300×, while in (b) it is3000×.
153

4. Thermal Management
(a) Wavefront deformation (colorbar inm) as seen by a plane wave experiencing an in-ternal reflection on the 2 at.% doped, 7 mm thick, cyl. crystal, Iavg = 75 W cm−2.The maximum deformation is ∼ 0.4λ.
(b) Wavefront deformation (colorbar in m) as seen by a plane wave experiencingan internal reflection on the 2 at.% doped, 8.4 mm thick, rect. crystal, Iavg =
75 W cm−2. The maximum deformation is ∼ 2.4λ.
Figure 4.24.: Wavefront deformation as seen by a plane wave after an internalreflection on the 2 at.% doped, 7 mm thick, cyl. crystal (a) and the 2 at.% doped,8.4 mm thick, rect. crystal. Both cases are pumped at Iavg = 75 W cm−2. A six timesless important wavefront distortion is found in the cylindrical case.
154

ASE and Thermal Management on a High Average-Power DPSSL
Iavg = 75 W cm−2. For the case of the circular, 2 at.% doped crystal (Figure 4.24(a))we get a ∼ 6× lower maximum deformation compared to the rectangular case (seeFigure 4.24(b)).
Horizontal lineouts of the predicted wavefronts obtained for the 20 at.% dopedcrystal exposed to Iavg = 30 W cm−2 and for both 2 at.% doped crystals at Iavg =
75 W cm−2 are shown in Figure 4.25. The experimental observation pupil was ≈22 mm over which the peak–to–peak surface deformations are approximately 15 µm,1.1 µm and 0.6 µm.
Figure 4.25.: Horizontal lineouts of the predicted wavefront deformation in the caseof the highly doped, rectangular (20 at.%, 4.7 mm thick) (red diamonds), the 2 at.%
doped rectangular crystal (8.4 mm thick) (orange triangles, magnified 5×) and thecrystal with the geometry of the Lucia laser head (2 at.%, 7 mm thick, 60 mm diameter)(green circles, magnified 10×).
For each of the three modeled crystals similar lineouts are computed and aparabolic polynomial fit is applied to the central part (for intensities ranging frombelow 1 W cm−2 up to 100 W cm−2). Out of this fit, the focal lengths are derived.A comparison between the calculated (using the 3D model) and the experimentalresults is shown in Figure 4.26.
155

4. Thermal Management
We see a very good agreement between the numerical predictions and the experi-mental results even for the cylindrical crystal pumped over only half of its diameter.Whereas the pure bi–metal model used in the previous section was not able toexplain the rise in focal length, the full three–dimensional model is now capable todo so.
Figure 4.26.: Deformation compilation of the experiments done on the main amplifierhead. The symbols show measured values for a highly doped crystal (green full circles),a rectangular, 8.4 mm thick crystal doped at 2 at.% where the test beam is reflected onthe front surface (blue full triangles) or under internal reflection (blue open triangles)and the crystal used in the main laser head (circular, 7 mm thick, red open diamonds).The computed negative focal length is plotted as a function of the injected averagelaser intensity. The lines indicate simulated focal lengths retrieved from the threedimensional model. The error bars in the case of the highly doped case and for thecircular crystal indicate the order of magnitude for the measurement error.
156
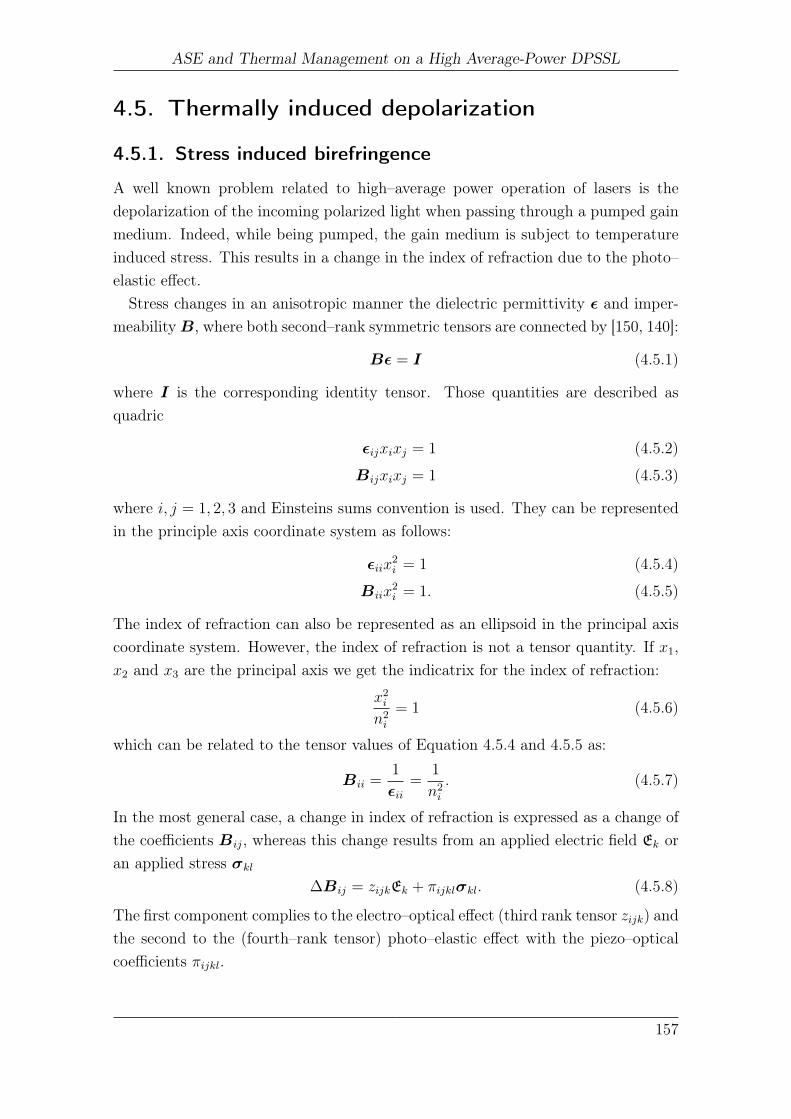
ASE and Thermal Management on a High Average-Power DPSSL
4.5. Thermally induced depolarization
4.5.1. Stress induced birefringence
A well known problem related to high–average power operation of lasers is thedepolarization of the incoming polarized light when passing through a pumped gainmedium. Indeed, while being pumped, the gain medium is subject to temperatureinduced stress. This results in a change in the index of refraction due to the photo–elastic effect.
Stress changes in an anisotropic manner the dielectric permittivity ε and imper-meabilityB, where both second–rank symmetric tensors are connected by [150, 140]:
Bε = I (4.5.1)
where I is the corresponding identity tensor. Those quantities are described asquadric
εijxixj = 1 (4.5.2)
Bijxixj = 1 (4.5.3)
where i, j = 1, 2, 3 and Einsteins sums convention is used. They can be representedin the principle axis coordinate system as follows:
εiix2i = 1 (4.5.4)
Biix2i = 1. (4.5.5)
The index of refraction can also be represented as an ellipsoid in the principal axiscoordinate system. However, the index of refraction is not a tensor quantity. If x1,x2 and x3 are the principal axis we get the indicatrix for the index of refraction:
x2i
n2i
= 1 (4.5.6)
which can be related to the tensor values of Equation 4.5.4 and 4.5.5 as:
Bii =1
εii=
1
n2i
. (4.5.7)
In the most general case, a change in index of refraction is expressed as a change ofthe coefficients Bij, whereas this change results from an applied electric field Ek oran applied stress σkl
∆Bij = zijkEk + πijklσkl. (4.5.8)
The first component complies to the electro–optical effect (third rank tensor zijk) andthe second to the (fourth–rank tensor) photo–elastic effect with the piezo–opticalcoefficients πijkl.
157

4. Thermal Management
In the absence of stress, the refractive index indicatrix for a cubic crystal is asphere
B0(x21 + x2
2 + x23) = 1. (4.5.9)
With stress applied, the dielectric impermeability tensor writes as
Bij = ∆Bij +B0. (4.5.10)
Consequently, even cubic crystals can become uni– or biaxial, depending oncrystal geometry, and the direction along which the stress is applied. A moredetailed discussion how the dielectric impermeability tensor is expressed for differentconditions is given in [150, 140].
Under propagation through the pumped crystal (i.e. along the z–axis), we haveto know the submatrix B⊥ [150] which describes the electric field polarization inthe plane perpendicular to the propagation direction.
B⊥ =
(B11 B12
B21 B22
)(4.5.11)
with its eigenvalues B± = 1/(n2±). The angle of rotation of the principle axes is:
tan(2θ) =2B12
B11 −B22
(4.5.12)
and the polarization phase shift ∆δ
∆δ =2π
λD(n+ − n−) (4.5.13)
where λ is the wavelength and D the length of the gain medium. The depolarizationlosses L are given as [150, 10]:
L =2π
λsin2(2θ) sin2
(∆δ
2
). (4.5.14)
In summary we see, that an applied stress changes the indicatrix and will conse-quently alter the polarization of an incident laser beam. Figure 4.27 illustratesthe impact on a linear polarized beam traveling through a crystal under stress. Ina circular geometry the stress might be decomposed into a radial stress σr anda tangential stress σt. As the projection of the direction of polarization and thestresses σr and σt depend on the position within the crystal, a spatial dependencyis found. In this case the major axis of polarization along the x and y–axis is notaltered in Figure 4.27, since only one of the stresses (σr and σt) has a non–zero
158
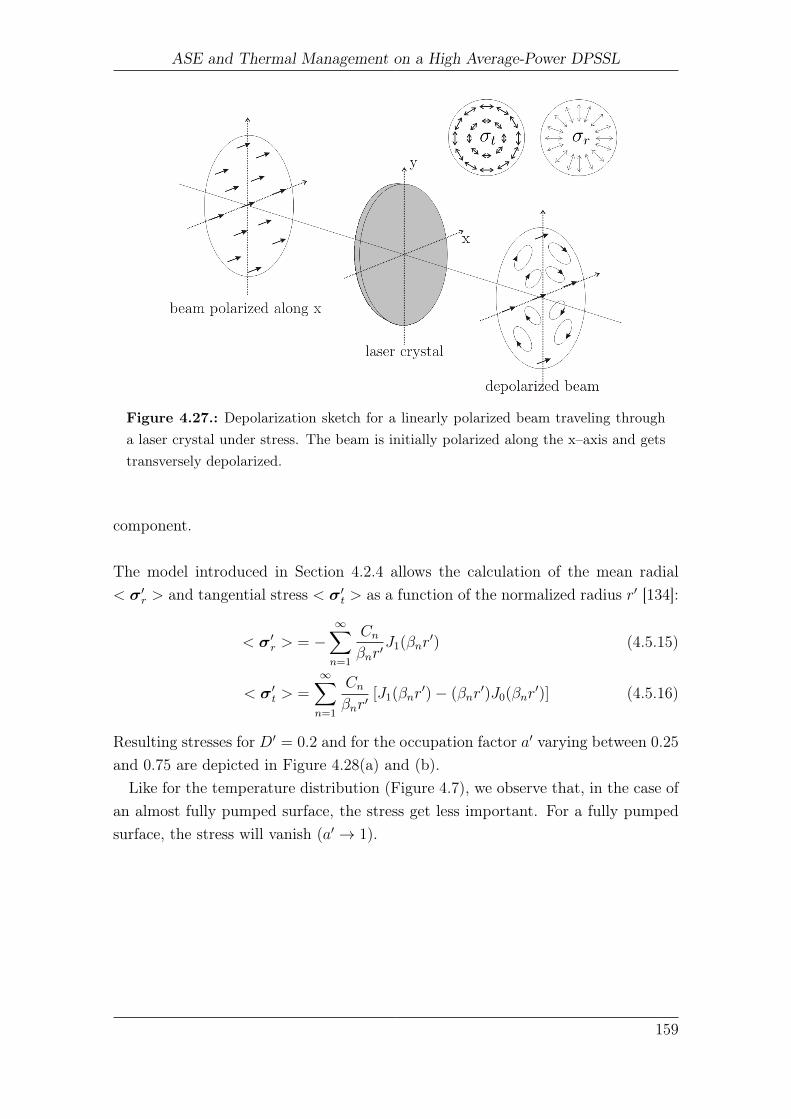
ASE and Thermal Management on a High Average-Power DPSSL
Figure 4.27.: Depolarization sketch for a linearly polarized beam traveling througha laser crystal under stress. The beam is initially polarized along the x–axis and getstransversely depolarized.
component.
The model introduced in Section 4.2.4 allows the calculation of the mean radial< σ′r > and tangential stress < σ′t > as a function of the normalized radius r′ [134]:
< σ′r > = −∞∑n=1
Cnβnr′
J1(βnr′) (4.5.15)
< σ′t > =∞∑n=1
Cnβnr′
[J1(βnr′)− (βnr
′)J0(βnr′)] (4.5.16)
Resulting stresses for D′ = 0.2 and for the occupation factor a′ varying between 0.25and 0.75 are depicted in Figure 4.28(a) and (b).
Like for the temperature distribution (Figure 4.7), we observe that, in the case ofan almost fully pumped surface, the stress get less important. For a fully pumpedsurface, the stress will vanish (a′ → 1).
159

4. Thermal Management
(a) Mean tangential stress < σ′t > integrated along the propagation direction as afunction of the normalized radial position r′ = r/b for D′ = 0.2 and a′ = a/b
varying between 0.25 and 0.75.
(b) Mean radial stress< σ′t > integrated along the propagation direction as a functionof the normalized radial position r′ for D′ = 0.2 and a′ varying between 0.25 and0.75.
Figure 4.28.: Mean tangential (a) and radial (b) stress distribution as a function ofthe normalized radial position r′ for D′ = 0.2.
160

ASE and Thermal Management on a High Average-Power DPSSL
4.5.2. Intrinsic birefringence
Besides the externally introduced birefringence, each material carries its own intrin-sic birefringence related to internal stress. This is especially true for laser crystals.Figure 4.29(a) and 4.29(c) show two samples of Yb3+:YAG crystals observed betweencrossed polarizers. Depending on the growth and cutting direction, after growthstreatment etc., different patterns for the intrinsic depolarization can be observed.
Simply using a crossed polarizer assembly is not sufficient to find out if initiallylinearly polarized light becomes spherically polarized and whether the principle axisis turned clockwise or counter–clockwise. The use of polarization dependent elementscan help at this point.
Figure 4.29(b) and (d) are obtained between crossed polarizers and a red–plate3[147].A fraction of the transmitted lights polarization is turned clockwise (e.g. the blueparts), while the complementary colors indicate a counter–clockwise rotation.
Different areas of the crystal under stress turn the polarization in different direc-tions. Also, zeroing (dark areas) in transmitted intensity between crossed polarizersdoes not necessarily introduce a change in the direction of rotation of the principleaxis.
Let us mention that at this stage no effort was undertaken to further quantifythe amount of depolarization due to intrinsic birefringence on the samples shown inFigure 4.29.
3Sometimes called red–one or gypsum plate. It is a first order retardation plate.
161

4. Thermal Management
(a) Transmission between crossed polarizersof a 4 mm thick Yb3+:YAG slab doped at5 at.%.
(b) Transmission between crossed polariz-ers and a red–plate of a 4 mm thickYb3+:YAG slab doped at 5 at.%.
(c) Transmission between crossed polarizersof a 1 mm thick Yb3+:YAG slab doped at10 at.%.
(d) Transmission between crossed polariz-ers and a red–plate of a 1 mm thickYb3+:YAG slab doped at 10 at.%.
Figure 4.29.: Transmission examples set between crossed polarizers of two differentYb3+:YAG slabs. Images (a) and (c) are obtained between crossed polarizers, whileimages (b) and (d) show the corresponding images between crossed polarizers and anadditional red–plate visualizing the difference for left end right circular polarization ofthe transmitted light. The bright spots are dust on the apparatus.
162

ASE and Thermal Management on a High Average-Power DPSSL
4.5.3. Thermally introduced birefringence on the Lucia laserhead
The test setup for qualifying the depolarization on the Lucia main amplifier isillustrated in Figure 4.30. A collimated laser beam at 1064 nm is polarized using abeam splitter cube and imaged, using a 4f assembly, onto the laser crystal. Thebeam has a diameter of 24.5 mm (the beam is cut using an apodizer setup).
The crystal is imaged onto a CCD camera using a magnifying image relay (magni-fication 1/10). The beam passes an analyzer mounted on a rotation stage, whereasthe analyzer can be conveniently turned by 90 or to any other desired angle. Themaximum extinction of the crossed polarizer setup was found to be better than1/500, limited by the polarizer cubes used. The optical densities used for theattenuation were measured with a spectro–photometer (Cary 500).
Figure 4.30.: Sketch of the experimental setup to measure the thermally induceddepolarization. A cw laser source at 1064 nm is imaged onto the gain medium of thelaser head. The gain medium is a 60 mm diameter, circular Yb3+:YAG crystal doped at2 at.% with a thickness of 7 mm. The incoming laser beam is polarized and is reflectedfrom the highly reflective coating on the back side of the crystal. The beam is thenimaged onto a CCD camera by passing a rotatable analyzer and optical densities (notshown in sketch).
163

4. Thermal Management
The general polarization state of light is characterized by the electric field ampli-tudes in two orthogonal directions (Ex and Ey) and the relative phase ϑ betweenthem.
E =
(Ex
Ey exp(iϑ)
)(4.5.17)
These informations are however not directly accessible. We therefore use threeindependent measurements to determine corresponding parameters. For simplicity,we consider that the (first) polarizer is oriented along the x–axis.
Analyzer parallel to x The analyzer transmits along the x–direction. The inten-sity seen on the detector is given by:
I1 =1
2c0ε0 |Ex|2 (4.5.18)
where c0 is the velocity of light in vacuum and ε0 the vacuum permittivity.
Analyzer parallel to y The analyzer transmits along the y–direction. The inten-sity seen on the detector is given by:
I2 =1
2c0ε0 |Ey|2 (4.5.19)
Analyzer set at 45 with respect to x The direction of the analyzer is rotatedto 45 against the x–axis and we get the intensity I3
I3 =1
2
(I1 + I2 + 2
√I1I2 cosϑ
)(4.5.20)
Out of these observations we can calculate the phase ϑ to be:
ϑ = arccos
(2I3 − I2 − I1
2√I1I2
)(4.5.21)
The polarization ellipse itself is rotated by an angle ς against the x-axis:
ς = arctan(√
I2/I1
)(4.5.22)
This angle is a convenient measure for the depolarization since it corresponds tothe angle one must turn the analyzer to achieve extinction on a particular spatialposition within the measurement pupil.ς is measured in [] and will be used for the following discussion. This method
cannot help in identifying if a beam is either unpolarized, circularly a linearlypolarized. A fourth measurement with a known phase shift would be necessaryto further characterize the nature of the transmitted light.
164

ASE and Thermal Management on a High Average-Power DPSSL
However, as usually polarizing/polarization sensitive elements are placed withinthe laser cavity, or at the end of the laser amplifier chain, a depolarization losscorresponding to ς of sin2 ς would appear. We restrict ourself to the measurementof ς from now on.
Figure 4.31 shows the measured angle ς for three different incident average intensityIavg within a 24.5 mm diameter pupil on the Lucia main laser head. The Yb3+:YAGcrystal is oriented with its crystallographic [111]–axis perpendicular to the pumpedsurface. Ceramics, which are of particular interest for large surface amplifiers, willbehave in the same way [151, 152]. Other orientations, like [110] are envisionable forcrystals to even further decrease the depolarization in an active mirror extractionlayout [150, 153].
The phase shift measured was in every case very close to 0, consequently we omitthe discussion for ϑ.
Image 4.31(a) gives the map of depolarization when no pump is applied. Thisintrinsic depolarization exhibits a maximum ς of ≈ 0.8. An increase of the pumpintensity (b) starts partially to compensate the intrinsic depolarization. For Iavg ≈30 W cm−2 a minimum depolarization of ς < 0.6 is found.
While increasing the pump intensity even further, thermally introduced depo-larization overwhelms the intrinsic depolarization and appears in the typical shapeillustrated in Figure 4.31(d) and which is subject to textbook explanations [10]. Themaximum depolarization angle is ς < 3.5.
Figure 4.32 shows the average depolarization angle ς and ς in the center of theobservation pupil. Within the observed range for Iavg, the average depolarizationfinds a minimum around 20 − 30 W cm−2 and starts increasing afterwards again.Intensities below such values are dominated by the intrinsic birefringence. The angleς rises approximately linear with increasing incident intensities for observation pointsclose to the center of the crystal.
Further increasing the incident intensity Iavg leads to a higher dissipated power percross sectional area and consequently increases the thermally induced depolarizationloss far beyond the intrinsic value. For higher repetition rates, a compensationbecomes necessary.
The most common method comprises a 90 rotator between two identical am-plifiers which can compensate the whole thermally introduced birefringence [10].Both amplifiers have to be identically pumped. It is however somewhat difficult to
165

4. Thermal Management
(a) Intrinsic depolarization (measured in )measured between two polarizers.
(b) Pump induced, static (Iavg ≈ 13 W cm−2)depolarization.
(c) Pump induced, static (Iavg ≈ 30 W cm−2)depolarization.
(d) Pump induced, static (Iavg ≈ 68 W cm−2)depolarization.
Figure 4.31.: Intrinsic and pump induced polarization (colorbar in ) on the Luciaamplifier head for four different average pump intensities measured at 1064 nm betweencrossed polarizers as sketched in Figure 4.30.
166

ASE and Thermal Management on a High Average-Power DPSSL
Figure 4.32.: Measured depolarization in the center and as the average over the pupil.
produce large rotators.To circumvent the necessity of large rotators, a similar method uses a quarter–
wave plate [154]. Such large wave plates show a better compatibility with largesize, high–power laser systems. This method cannot completely compensate thethermally induced birefringence, but at least strongly reduce it [155]. Both methodscan be extended to a single amplifier setup [156].
167
4. Thermal Management
4.6. Conclusion
The laser gain medium performance can be severely affected by thermally induced ef-fects ranging from wavefront deformation, birefringence and ultimately catastrophicdamage of the gain medium itself.
We discussed in detail the origin of the heat generation, the physical basis of thethermal conductivity and heat transport through the laser gain medium. A one–dimensional steady state and transient model was presented for the active mirrorscheme.
We showed that, if the observed transverse position is far away from the edgeof the pumped area and the pumped surface is large compared to the thickness,a one–dimensional analysis might be satisfying. This is similar to the thin–diskapproximations in heat flow. The resulting heat distribution is of parabolic shape.However, for a partially pumped surface, considering a transverse temperaturevariation is of importance.
The required cooling capacity of the Lucia amplifier head was estimated to besatisfied with a heat exchange coefficient varying between h ≈ 10.000 W m−2 K−1
and h ≈ 20.000 W m−2 K−1. Higher values do not significantly increase the coolingcapacity.
A cooling solution (jet–plate setup)4 was realized and experimentally assessed.The heat exchange coefficient h estimated to be h ≈ (16, 500± 1000) W m−2 K−1.
The general origin of the wavefront deformation is discussed. For the case of anactive mirror, a simplified model is derived. The deformation is mainly attributedto the mechanical deformation of the gain medium. The resulting focal length isnegative and the scaling law given by:
|f | = k
αTηhηabsIavg. (4.6.1)
Consequently, the thermally induced lens gets shorter with an increasing absorbed(temporally averaged) intensity ηabsIavg. Knowledge about the heat generation is ofgreat significance, as f ∼ 1/ηh.
Evidence of the temporally dependent in–pulse heat generation due to the lifetimeof the upper laser state is found on the millisecond timescale.
4This solution was selected for Lucia after fruitful discussions with A. Giesen while he was workingat the IFSW, Stuttgart, Germany.
168

ASE and Thermal Management on a High Average-Power DPSSL
The simplified, one–dimensional model describes the steady state deformation ap-propriately in the thin–disk approximation. A three dimensional model is neverthe-less necessary to explain the deformations observed in the case of the Lucia amplifierhead. The results drawn out of this model gives full access to the understanding ofthe deformation, including the thermal lens effect and bulging of the surfaces.
The thermally induced birefringence is found to be small and comparable with theintrinsic depolarization. Further increase in average intensity brings up the necessityto evaluate the depolarization with a more refined model.
It can be concluded, that the laser head developed and validated here satisfiesthermal management requirements imposed by the high average power operationof the Lucia laser system in the context of the first Lucia milestone.
An efficient cooling is crucial for high average power applications. Its optimizationis one of the central task for such system.
169


5. Lucia Amplifier Performance
5.1. Motivation
After assessing energy storage limitations using a three dimensional ASE–code inchapter Chapter 3, observing the thermal behavior for a repetition rate of up to2 Hz in terms of wave front deformation as well as depolarization of the laser beamtraveling through the laser gain medium in Chapter 4, we will discuss the energyperformance of the Lucia main amplifier in this Chapter.
The first part is dedicated to the energy extraction on the main amplifier headand a second part of this Chapter discusses ameliorations and foreseen developmentswithin the context of the Lucia laser system.
5.2. Lucia amplifier performance estimation
The three dimensional model considering ASE introduced in Chapter 3 is the basisfor the following stored energy estimation. It should be recalled, that the surfacesare taken perfectly absorbing, therefore no reflections of ASE are taken into accountin the model.
Parasitic oscillation are supposed to be suppressed, which is in good accordanceto the results shown in Figure 3.31 (page 118).
Let us recall that the gain medium is a 2 at.% doped Yb3+:YAG crystal with adiameter of 60 mm and a thickness of 7 mm. The pumped area is approximated toa circular, super–Gaussian (order 20) shaped pump profile with a peak intensity of16 kW cm−2. The pump pulse duration is set to be 1 ms.Figure 5.1 shows the numerical result for dβ/dt due to the pump (a), due to ASE
(b) and the distribution of β (c) at the end of the 1 ms long pump pulse. ASE isclearly of importance, as the maximum value for the ASE depopulation in (b) isonly a factor of 450/180 = 2.5 below that of the population increase due to thepump action (b).
We consider, in a good approximation, the spatial profile perpendicular to thepump axis to be uniformly distributed over the surface, where extraction takesplace. The distribution of β along the pump direction is illustrated in Figure 5.2.
171

5. Lucia Amplifier Performance
(a) dβ/dt|P after 1 ms pumping at 16 kW cm−2
(b) dβ/dt|ASE after 1 ms pumping at 16 kW cm−2
(c) β after 1 ms pumping at 16 kW cm−2
Figure 5.1.: Simulation results for the Lucia main amplifier 2 at.% doped, 7 mm
thick Yb3+:YAG crystal pumped at an intensity of 16 kW cm−2 for 1 ms at 940 nm.The three cuts are performed along the 60 mm long diameter of the crystal (horizontaldimension). The relative excitation is defined as β = n/ntot. The pump pulse arrivesfrom the top. The thickness (vertical axis) is stretched by a factor of 2 for visualization.
172

ASE and Thermal Management on a High Average-Power DPSSL
Even with the use of an active mirror concept, we see a difference of a factor 1.5
between the population on the front surface and the back surface.
While, within the pump duration, Finj = 16 J cm−2 are injected and 90 % of theenergy is absorbed (14.4 J cm−2), Fst,ideal = 9 J cm−2 are stored without the addi-tional ASE–losses. This would correspond to the immediate results out of a simpleASE–less code. Using the developed 3D code, the energy density distribution alongthe z–axis is computed (see Figure 5.2). An integration along the z–axis shows thatonly Fst = 6.8 J cm−2 are predicted to be stored in the central part, when consideringASE action. In total 2.2 J cm−2 are lost to ASE. This signifies an important impactof ASE action.
As Yb3+:YAG is a quasi–three level system, a minimum relative population βmin =
σa/(σa + σe) is necessary to overcome the reabsorption at the laser emission wave-length. For room temperature, this values is βmin ≈ 4.4 % for Yb3+:YAG. The calcu-lated average β is 18.1 % leaving, after the consideration of βmin, a β′ = 13.7 %. Thiscorresponds to an extractable energy density of Fextr = 5.1 J cm−2. Consequently,the maximum achievable optical–optical efficiency is ηo−o = 31.8 %. Table 5.1summarizes the results with an overview over the energy densities and the optical–optical efficiency.
We can now estimate the energy extraction for the four passes within the gainmedium. A one dimensional model uses the retrieved β–distribution along theextraction direction shown in Figure 5.2 to compute the output energy density as afunction of the input energy density and the amplifier round trip losses. The resultis shown in Figure 5.3.
variable valueinjected energy density Finj 16 J cm−2
absorbed energy density Fabs 14.4 J cm−2
stored energy density without ASE Fst,ideal 9 J cm−2
stored energy density with ASE Fst 6.8 J cm−2
non–extractable energy density Fnon−extr 1.7 J cm−2
extractable energy density Fextr 5.1 J cm−2
maximum o–o efficiency ηo−o 31.8 %
Table 5.1.: Energy storage and extractable energy for the Lucia main amplifier headpumped at 16 kW cm−2 for 1 ms.
173

5. Lucia Amplifier Performance
Figure 5.2.: β–distribution in the center along the pump axis of Figure 5.1(c).
Typical input energy densities provided by the Lucia front–end are in the order of20 mJ cm−2 to 50 mJ cm−2. Without considering any losses, energy densities between2.2 J cm−2 and 3.4 J cm−2 are expected. For single pass losses of 10 %, these valuesare reduced to 1.6 J cm−2 and 2.5 J cm−2 respectively.As an example, considering an input energy of 110 mJ within a 22 mm diameter
circular beam incident under 25 to the surface normal, we get an input energydensity of ≈ 26 mJ cm−2. In the case of a lossless beam transport, an output energydensity of 2.55 J cm−2 is found, while in the case of 10 % losses this values is reducedto 1.85 J cm−2. This corresponds to energies between 10.8 J and 7.8 J.
Figure 5.4 shows the gain G for the four passes as a function of the input energydensity in the case of a lossless beam transport. Input energy densities above0.1 J cm−2 will bring a strong depletion for the last pass.
174

ASE and Thermal Management on a High Average-Power DPSSL
Figure 5.3.: Estimation of the output energy density (vertical axis) as a function ofthe input energy density of the extraction beam (horizontal axis) for the Lucia mainamplifier after four passes. The loss is given as a loss per pass in the amplifier.
Figure 5.4.: Estimated gain G (vertical axis) for the first four passes in the mainamplifier as a function of the input energy density (horizontal axis).
175

5. Lucia Amplifier Performance
5.3. Energy extraction
Let us recall how energy build–up is realized in the Lucia laser system. The oscillatorgenerates pulses at a repetition rate of 2 Hz and energies in the order of 340 µJ.Those pulses are amplified in two pre–amplification stages. The energy outputof the second stage is in the order of ∼ 140 mJ. Finally the beam periphery isapodized through the beam shaping stage, where the apodizer, combined with thespatial filtering, allows, for the experimentally used beam shape, a transmission of80 %. This results in an energy of ∼ 110 mJ available at the entry of the first passof the Lucia main amplifier.
The angular–multiplexed four–pass extraction architecture of the Lucia final am-plification stage is sketched in Figure 5.5. A first amplification pass is realized byimaging the apodizer using an imaging telescope (not depicted) onto the pumpedgain medium. The gain medium plane is then imaged onto itself after propagatingtwice the imaging telescope (4f–assembly with f = 1 m) shown in Figure 5.5.To this point, the apodizer plane is strictly imaged. The transition from the
second to the third pass occurs under free propagation with a total distance of 4.5 m
since no image relay telescope is used. Consequently all the wavefront deformationsintroduced by the foregoing propagation will impact the intensity distribution arriv-ing on the amplifying medium. The fourth and final pass takes place after travelingthrough the imaging telescope again.
Figure 5.5.: The Lucia final amplification stage bases on two arms – an image–relayed arm (right arm) and free propagation (left arm). Both are separated by 50.The dotted circles indicate the positions of the observation planes explaining the beamsequence. The direction the corresponding beam is traveling through these planes isindicated by crosses (moving towards crystal) and dots (coming from it). The passesare labeled from 1 to 4. The picture on the right gives an illustrative image of theexperimental setup.
176

ASE and Thermal Management on a High Average-Power DPSSL
Figure 5.6 depicts the intensity distributions after the first and second pass in theLucia main amplifier. While the image (a) is recorded after the first pass withoutany pump action, (b) shows the same beam shape, but amplified at a repetition rateof 2 Hz. After the second pass, the image is consequently flipped, which is shownfor an amplification with 2 Hz in (c).
The images for the first and second pass were gathered separately and exhibittherefore a different input intensity distribution. Nevertheless, as the beam shapewas imaged from one plane to the next, no distortion in the intensity distribution isobserved.
The energy evolution with respect to the driving current of the Laser Diode Array(LDA) is shown in Figure 5.7 for the first (a) and the second pass (b) for repetitionrates of 2 Hz and 0.1 Hz. The injected energy was ≈ 110 mJ for both cases.The change in repetition rate affects the amplifier performance, as the gain de-
pends on the temperature. The difference in the first pass is 10 % – the maximumenergy found is 500 mJ for 0.1 Hz, while 440 mJ were obtained at a repetition rateof 2 Hz for an input energy of 110 mJ.For the second pass, the difference of obtained energy is ≈ 150 mJ (1.5 J vs. 1.35 J)
for a driving current of 150 A, which corresponds again to the 10 % difference foundin the preceding pass.
The energy measurement uncertainty is ≈ 5 %. Figure 5.8 shows the beam shapeafter four passes in the main amplifier without amplification (a), fully amplified at0.1 Hz (b) and at 2 Hz (c). The main difference to the preceding passes is the 4.5 m
long free propagation between the second and third pass.While comparing Figure 5.6(a) and 5.8(a), it appears that the extraction surface
is reduced from ∼ 4.2 cm2 to ∼ 2.8 cm2. This makes it somehow more difficult toextract energy, as the usable stored energy is reduced by a factor of 1.5 too. Gaindepletion sets slowly in for the last two passes (see Section 5.2).
The resulting energy (after four passes) as a function of the driving current ofthe laser diodes on the LDA is shown in Figure 5.9 for repetition rates of 2 Hz and0.1 Hz.The injected energy of ≈ 110 mJ is amplified in four passes to 7 J at 0.1 Hz and to
6.6 J at 2 Hz respectively. Again, the difference is related to the thermal performanceof the laser system. However as it is seen at the end of the trail, both curves startto close up. This is related to the saturation of the laser gain medium.
177

5. Lucia Amplifier Performance
(a) 1st pass, no pump applied, horizontal and vertical lineouts are shown on the right
(b) 1st pass, 150 A, 2 Hz, horizontal and vertical lineouts are shown on the right
(c) 2nd pass, 150 A, 2 Hz, horizontal and vertical lineouts are shown on the right
Figure 5.6.: Beam shape in the image relay plane after one pass without amplification(a) and with maximum laser diode current applied to the LDA (150 A) (b). Subfigure(c) illustrates the beam shape after the 2nd pass with maximum amplification. Therepetition rate for (b) and (c) is 2 Hz. The scale is in [cm].
178

ASE and Thermal Management on a High Average-Power DPSSL
(a) 1st pass for 2 Hz and 0.1 Hz repetition rate
(b) 2nd pass for 2 Hz and 0.1 Hz repetition rate
Figure 5.7.: Main amplifier performance for 0.1 and 2Hz in one pass (a) and twopasses (b) for 110mJ injection.
179

5. Lucia Amplifier Performance
(a) 4th pass, no pump, horizontal and vertical lineouts are shown on the right
(b) 4th pass, 150 A, 0.1 Hz, horizontal and vertical lineouts are shown on the right
(c) 4th pass, 150 A, 2 Hz, horizontal and vertical lineouts are shown on the right
Figure 5.8.: Beam shape in the image relay plane after four passes without amplifi-cation (a) and with maximum laser diode current applied to the LDA (150 A) (b) at0.1 Hz (b) and 2 Hz (c). The shown scale is in [cm].
180

ASE and Thermal Management on a High Average-Power DPSSL
The available energy is efficiently extracted (7/2.8×5.1 ≈ 49 %), but the optical–optical efficiency (total emitted energy of the LDA) is considerably small (ηo−o ≈7 J/123 J ≈ 5.7 %).
Figure 5.10 shows a compilation for the four passes within the amplifier for arepetition rate of 0.1 Hz. It should be recalled, that the three curves were recordedindependently. This is the origin of the absence of a shared crossing around 45 A oflaser diode driving current.
A future increase in energy demands an improvement in spatial beam quality whichmight be achieved by correcting the beam deformation or an application of the imagerelay technique to the second arm of the laser amplifier as well.
Figure 5.9.: Fourth pass in the main amplifier for a repetition rate of 2 Hz and 0.1 Hz.The drop at currents around 120 A is related to a filter change during which the outputpower of the pre–amplified laser pulse dropped by ≈ 6 %.
181

5. Lucia Amplifier Performance
Figure 5.10.: Performance of the Lucia main amplifier in one (green circles), two(blue triangles) and four passes (red diamonds) for a repetition rate of 0.1 Hz. 500 mJ
are achieved for one pass, 1.5 J for two passes and finally 7 J after four passes.
182

ASE and Thermal Management on a High Average-Power DPSSL
5.4. Perspectives
5.4.1. Static Astigmatism Correction
The correction of accumulated wavefront deformations is an important step towardsbeam quality improvement. As it is shown in the foregoing section such wavefront deformation can severely impact the intensity distribution when the beamexperiences free propagation. But, even if the beam is image relayed, wavefrontaberrations alter the intensity distribution on the imaging optics (i.e. lenses),potentially leading to LIDT issues.
An aberrated wavefront can be represented as a projection on the Zernike poly-nomials and its dynamic correction can be achieved with a closed–loop counter–reaction system. For static wave front deformations, low order Zernike polynomialscan be compensated using static devices, e.g. a parabolic wave front deformation iscompensated using an appropriately bent mirror or lens. Static astigmatism can beaddressed in a similar way [157].
We developed a correction appartus based on a reflective, free standing surface(i.e. a mirror) is deformed using four actuators, as shown in Figure 5.11. Themechanical deformation is transfered into a wave front deformation by reflection onthe surface of the mirror. Figure 5.12 shows the experimental setup of the staticastigmatism corrector we have developed.
In order to evaluate the performance of the static corrector, a wave front analysis(similar to the measurement setup shown in Section 4.4.2) of the reflected wave frontwas performed. As a first test, a 10 mm thick highly reflective mirror (under 0) isbent (Figure 5.12(a)) and generates a strong Zernike polynomial for 0 astigmatism(Figure 5.12(b)).
Such a compensation technique and its impact on the energy extraction is cur-rently under observation.
Figure 5.11.: Four micrometer screws apply forces on a free standing mirror. Itssurface is deformed to statically compensate the astigmatism of an incident wave front.
183
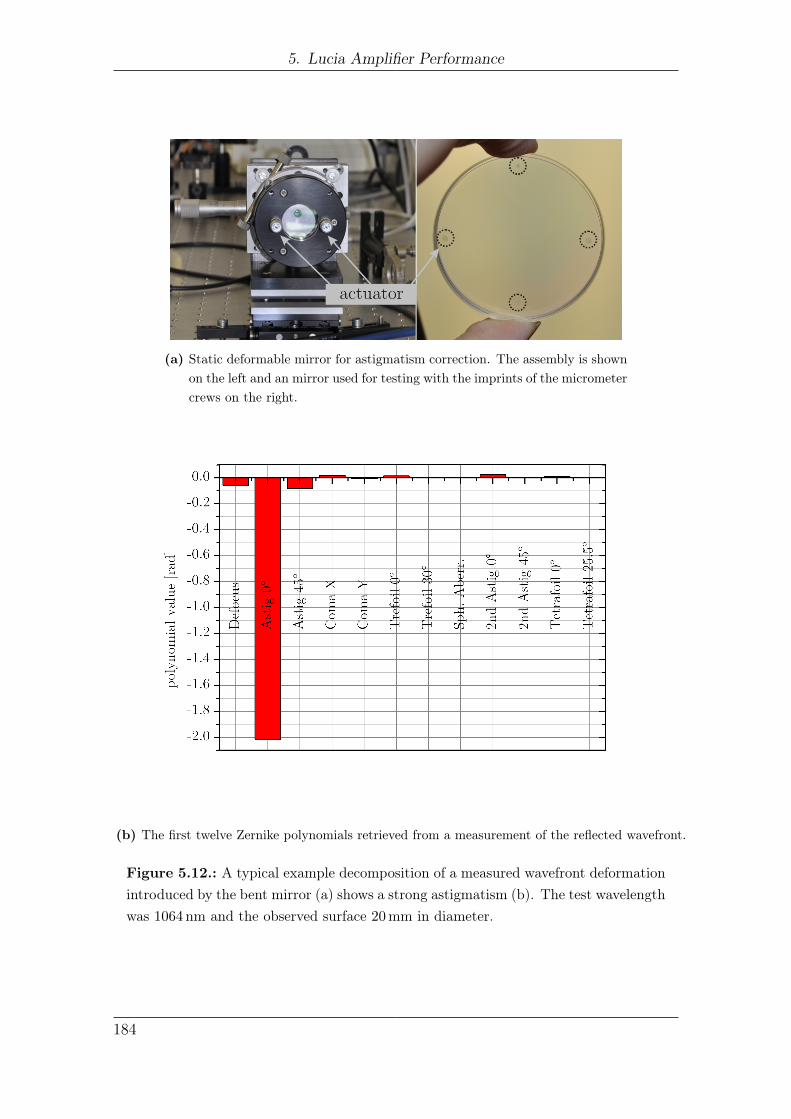
5. Lucia Amplifier Performance
(a) Static deformable mirror for astigmatism correction. The assembly is shownon the left and an mirror used for testing with the imprints of the micrometercrews on the right.
(b) The first twelve Zernike polynomials retrieved from a measurement of the reflected wavefront.
Figure 5.12.: A typical example decomposition of a measured wavefront deformationintroduced by the bent mirror (a) shows a strong astigmatism (b). The test wavelengthwas 1064 nm and the observed surface 20 mm in diameter.
184

ASE and Thermal Management on a High Average-Power DPSSL
5.4.2. Doping variation along the pump axis
Until now we considered a homogeneously doped laser gain medium. As it wasdiscussed in the context of ASE (Chapter 3) and thermal management (Chapter 4),such gain media show a rather unfavorable aspect: the (in first order) exponentialabsorption of the pump light results in an longitudinal exponential energy deposition.This is unfavorable in two ways:
• The energy deposition, thus the heat load, along the pump direction is inho-mogeneous.
• The gain distribution along the pump direction is inhomogeneous.
In the case of an end–pumped radially cooled rod the first point is the most serious.In this particular case, the gain medium temperature varies with the position alongthe pump axis. The probability of reaching the thermal fracture limit is thereforestrongly dependent from the position within the gain medium.
For a disk amplifier, the second point is more important. An inhomogeneouslongitudinal energy deposition leads to a localized (in the vicinity of the pumpedsurface) gain depopulation due to ASE and, potentially, to parasitic oscillations. Itis therefore of interest to get a uniform gain distribution.
As the intention is to store the same amount of energy with a uniform gaindistribution, a smaller volume is required. This reduces the thickness (extend alongthe pump direction) for disk amplifiers. The average temperature as well as thetemperature difference between the surfaces are also reduced.
This is of special interest for a quasi–three level system, like Yb3+:YAG, as itexhibits a temperature dependent reabsorption at the laser emission wavelength.Also, it ensures, that each position within the gain medium shows a significantlyhigher relative population density β compared to the minimum βmin. This guarantiesa maximum extractable energy density.
It may be asked, how this uniformly gain distribution may be achieved. Onepossibility would be to use multiple passes of the pump light in order to flatten theabsorption profile (beam recycling). This can be improved by the use of counter–propagating pump pulses or in combination with the active mirror concept. Thismethod requires a high brightness of the pump beam.
A different approach is to adapt the absorption profile in such a way, that theresulting gain profile will be uniform. However, such a profile will be fixed to onepump condition only.
185
5. Lucia Amplifier Performance
The most obvious solution is to split the gain medium into several steps withvarying doping concentrations. This approach is intensively discussed for longitu-dinal pumped rods in [24]. It is found, that the most sensitive part is the firstdoping step, as every following absorption is dependent on it. For cooling, it is evenmore interesting for those doped slices to be separated from each other and cooledin between (e.g. using a gas jet) allowing a significant decrease in temperature.However, conditions for internal reflections must be seriously considered to avoidparasitic lasing (see Section 3.5). Bonding several doping steps is possible, butbecomes, with an increasing number of doping steps, more and more complicated.
The more fine the doping steps are, the more uniform will be the gain distribution.This leads to the transition from discrete doping steps to a continuous dopingdistribution.
Let us consider a monochromatic, constant pump incident from one side (withoutbackreflection). The geometry shall be one dimensional.
In order to achieve a constant longitudinal gain distribution, the necessary dopingdistribution will be, in first order, hyperbolic (see Annex, Equation A.1.15):
ntot(z) =ntot(0)
1− z/zcrit(5.4.1)
where ntot(z) is the longitudinal doping density distribution, zcrit = (ntot(0)σaP )−1
the critical thickness, σaP the absorption cross section at pump wavelength and z
the pump direction.The more the pump penetrates the gain medium, the higher the absorbed fraction
of the remaining energy must be. The pump efficiency ηP (Equation A.1.18) is givenas:
ηP (z) =z
zcrit. (5.4.2)
In the active mirror case, an internal (perfect) reflection happens at the backside,modifying the requested doping profile (Equation A.1.35) to:
ntot(z) = σ−1aP
[(z −D)2 +
(D
sinh(a)
)2]−1/2
(5.4.3)
where D is the thickness of the gain medium and a = ln(1 − ηP )/2. The rationtot(D)/ntot(0) between the doping demand on the front and backside is an impor-tant factor to be considered in terms of feasibility. This value depends only on the
186
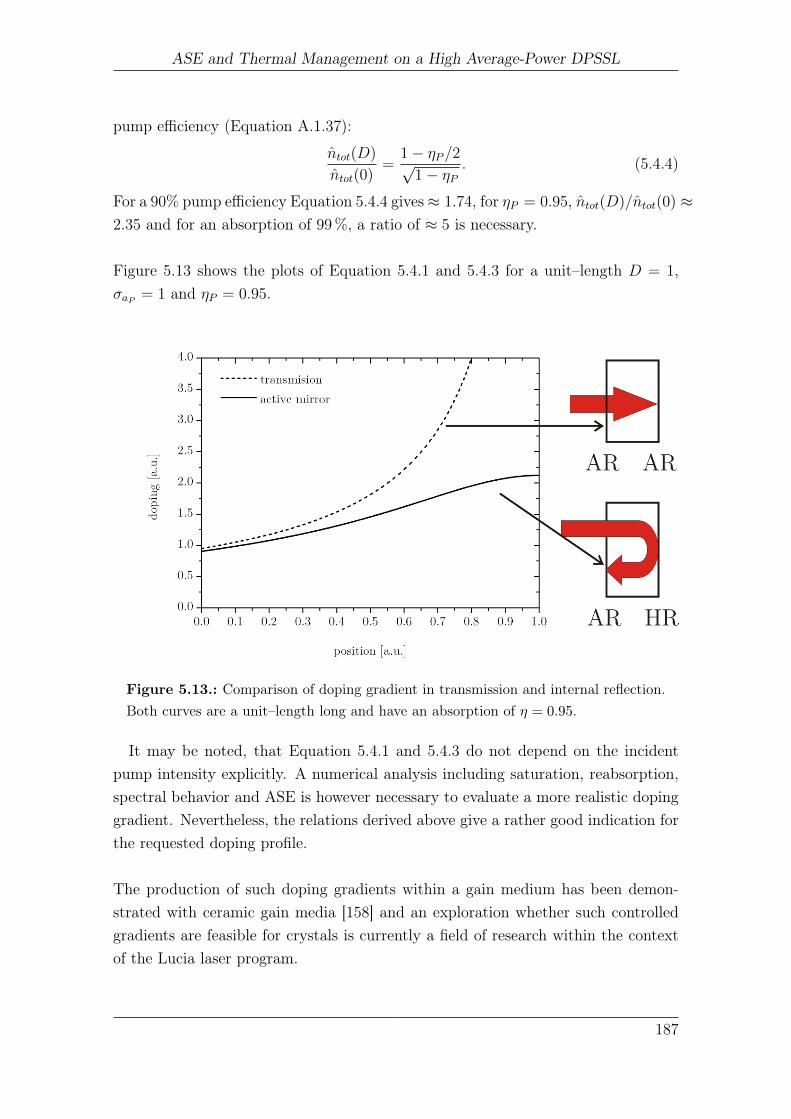
ASE and Thermal Management on a High Average-Power DPSSL
pump efficiency (Equation A.1.37):
ntot(D)
ntot(0)=
1− ηP/2√1− ηP
. (5.4.4)
For a 90% pump efficiency Equation 5.4.4 gives≈ 1.74, for ηP = 0.95, ntot(D)/ntot(0) ≈2.35 and for an absorption of 99 %, a ratio of ≈ 5 is necessary.
Figure 5.13 shows the plots of Equation 5.4.1 and 5.4.3 for a unit–length D = 1,σaP = 1 and ηP = 0.95.
Figure 5.13.: Comparison of doping gradient in transmission and internal reflection.Both curves are a unit–length long and have an absorption of η = 0.95.
It may be noted, that Equation 5.4.1 and 5.4.3 do not depend on the incidentpump intensity explicitly. A numerical analysis including saturation, reabsorption,spectral behavior and ASE is however necessary to evaluate a more realistic dopinggradient. Nevertheless, the relations derived above give a rather good indication forthe requested doping profile.
The production of such doping gradients within a gain medium has been demon-strated with ceramic gain media [158] and an exploration whether such controlledgradients are feasible for crystals is currently a field of research within the contextof the Lucia laser program.
187

5. Lucia Amplifier Performance
5.4.3. Ceramic laser gain media
The major drawback of crystals is their limited availability in large sizes and goodquality. Glasses are available in large sizes and good optical quality but do not offerthe required thermal properties for high average powers. Recent years showed asignificant improvement for a third kind of gain media host matrices: ceramics.
Ceramic laser gain media have a poly–crystalline structure. They can be broughtto complex shapes and large sizes [159, 158], which would be difficult to achieveotherwise.
Due to their crystallite nature, ceramics can show a somewhat lower transmissionrelated to surface, inter– and intra–crystalline pores and grain boundaries [23]. Athorough discussion of fabrication process and the role of additives can be found in[23, 159].
Currently, only laser gain media relying on a cubic system are available in largesizes and in laser grade quality (especially YAG). As the small crystallites arerandomly oriented, such ceramic laser gain media show an average orientation similarto a crystal observed in the crystalline [111]–axis [152, 151].
Another important feature of ceramic laser gain media is the possibility to achievespecific doping distributions along defined directions. Small size laser ceramicsexhibiting such a doping gradient were demonstrated [158].
Let us now concentrate on the Lucia laser system to present another possibilityoffered by ceramics. As it is discussed in Chapter 3, parasitic oscillations are oneof the major obstacles met. Cosintered ceramics offer the possibility to surroundthe gain medium with an absorbing cladding. Figure 5.14 shows a YAG ceramic
Figure 5.14.: 2 at.% doped Yb3+:YAG (35 mm diameter, transparent) ceramic with5 mm thick Cr4+:YAG periphery (black). The thickness is 7 mm. A 50 Euro–Centcoin is given for size comparison.
188

ASE and Thermal Management on a High Average-Power DPSSL
with an exterior diameter of 45 mm. The 35 mm diameter central part (opticallytransparent) is doped with 2 at.% Yb3+. The outer periphery (5 mm thick) is dopedwith 0.25 at.% Cr4+.
The measured absorption coefficient for both parts is depicted in Figure 5.15.Cr4+ doped YAG shows a strong broadband absorption between 800 nm and 1200 nm
which is in good accordance to the literature [160].The zero–phonon line for Cr4+:YAG is situated at 1280 nm, therefore the SE does
not affect the population density of the Yb3+ doped part. The lifetime of the upperlaser state is short compared to Yb3+:YAG (at room temperature ∼ 3 µs) [161].
As the transverse extend of the periphery is 5 mm, a photon will travel (includingthe reflection on the external surface) a total length of 1 cm, which correspondsto an absorption of ∼ exp(−5.5) ≈ 1/245. This is comparable to the reflectionloss achieved with most of the index matching liquids (see Table 3.2 on p. 116),but without the necessity of a specially absorbing gain medium mount preventing aretro–reflection into the gain medium again.
Figure 5.15.: Absorption coefficient of 2 at.% doped Yb3+:YAG ceramic and 0.25 at.%
doped Cr4+:YAG ceramic at room temperature. The spectra were recorded using aCary 500 spectrophotometer.
189


6. Conclusion
This thesis describes the three years of research performed within the frameworkof the Lucia program at the LULI laboratory. Amplified spontaneous emission andthermal management were the two main subjects for the theoretical and experimen-tal work.
Both issues were explored while keeping in mind the first energetic milestone of theLucia program, i.e. ∼ 10 J at a repetition–rate of 2 Hz. This objective can be con-sidered close to achievement with the very first extraction run, leading to 7 J/0.3 Hz
and 6.6 J/2 Hz. The potential to surpass the 10 J objective is clearly present whenconsidering the available extractable fluence. Wavefront quality improvement is themain approach being currently explored in foreseen experimental campaigns.
Thermo-mechanical analytical and numerical models of increasing complexity havebeen developed in order to accurately match experimental data collected on theLucia amplifier head. The ability of its cooling architecture to allow a satisfyingoperation was validated to a level of several hundreds of Watts of incident averagepower.
ASE models were developed and benchmarked with a set of specifically shapedcrystals as described in [49]. The pump duration of both preamplifier and amplifierstages was initially limited to 0.7 ms due to transverse laser oscillations. Numeroussolutions were proposed and experimentally explored to finally allow a full use ofthe laser diode investment (1 ms pumping). In addition to the implemented solution(internally absorbing mask coupled to a circulating peripheral liquid) which hasbeen proven to be extremely satisfying, an alternative all-solid-state approach withcosintered ceramics will soon be explored on the Lucia amplifier head.
Extensive use of this two families of modeling codes (thermo–mechanical andASE) ultimately reveals the great potential offered by doping engineering [162] onlaser gain media, not only in terms of thermal and ASE management, but also withrespect to the global amount of requested gain medium.
Whereas this last aspect is far from being critical for the Lucia program, it gainsdramatically in importance when considering the foreseen multi–kilojoule DPSSLprograms. Lucia, like the Mercury, Halna and Polaris laser programs, is one of thefirst precursor prototypes of high average–power DPSSLs designed to operate in the
191

6. Conclusion
kW range. Across the world, Inertial Fusion Energy (IFE) proposals like Life (USA),Koyo–F (Japan) or HiPER (Europe) will require to operate laser beam lines withat least a one or two order of magnitude higher average power (10 kW to 100 kW).In Europe, the HiLASE (multiple kW average power DPSSL program to be locatedin Dolni Brezany, Czech Republic) program was recently approved by the Czechauthorities.
At the moment, the Mercury program owns the world record for a long-run10 Hz operation at 600 W. Although much higher average powers (>10 kW) havebeen demonstrated on short time scale (minutes) using heat-capacity DPSSLs, suchtechnology is very unlikely to ever satisfy inertial fusion requirements of continuous(24/7), efficient operation. Within the context of Lucia, the next step will be toengineer a second laser head exploring a working point with a higher repetition rateand extracted energy. This probably requires a cryogenically cooled approach. Onthe other hand, even higher average power operation will require gain medium oflarger volume (∼ 100 cm3 compared to ∼ 10 cm3). If we consider laser systems rely-ing on an active mirror scheme, two distinctive scaling approaches can be envisioned.Let γ be the scaling parameter of the typical transverse size of the active mirror.
At first, a pure surface scaling can be considered. Surface, stored energy (at aconstant pump intensity) and volume are three parameters scaling with γ2. Asthe thickness of the gain medium remains constant, so does the small–signal gaing0 = const. as well as the overall gain G.
With a larger surface, the aspect ratio will decrease, ARL ∼ 1/γ. Considering acooling from the large surface(s), the maximum temperature as well as the relatedthermally induced deformation stays constant in first order constant. The injectedpower limited by the allowable temperature difference P∆Tmax (Equation 1.4.29)and due to the thermal shock parameter PRS (Equation 1.4.28) scale linear withthe surface (∼ γ2). As it is discussed in Chapter 3, ASE and parasitic lasing willincrease exponentially and can quickly outrun the other parameters. This is themain drawback for such surface scaling approach.
The second options to scale active mirrors is to keep the aspect ration ARL = const.
and consequently scaling the volume instead of the surface. Since a constant gainG is of interest, the doping concentration needs to decrease with the lateral size(∼ 1/γ).
This approach sacrifices the temperature in order to overcome the limitationintroduced by ASE and parasitic lasing. This severely restricts the acceptable
192

ASE and Thermal Management on a High Average-Power DPSSL
injected power (P∆Tmax = const. etc.) and repetition rate (∼ 1/γ). Thermallyinduced effects might be avoided by splitting the gain medium into several slicesand apply an intermediate cooling. However, this changes the aspect ratio, and thediscussion concerning the onset of parasitic lasing, deformation etc. must then bereevaluated.
Table 6.1 summarizes the first order dependencies for the surface and volumescaling approaches for the active mirror scheme. Combining high repetition rate,high energy storage and extraction efficiency will obviously limit the thermal scalingparameters, as well as the parameters for ASE/parasitic lasing, to a tight interval. Afurther increase in extracted energy is only possible if the number of laser amplifiersis increased.
variable surface scaling volume scalingSurface γ2 γ2
Energy γ2 γ2
Volume γ2 γ3
Doping 1 γ−1
g0 1 γ−1
G 1 1ASE exp(γ) 1
Parasitic Lasing exp(γ) 1Aspect Ratio ARL γ−1 1
Tmax 1 γ
Repetition rate 1 γ−1
Deformation 1 1P∆Tmax γ2 1PRS γ2 γ
B-Integral 1 γ
Table 6.1.: Scaling parameters for surface and volume scaling of laser materials. Theparameter γ scales the characteristic lateral size of the gain medium.
We might state, that thermal effects can be reduced by applying an appropriatecooling solution, and parasitic lasing can be suppressed if limits for the gain mediumsize, gain, surface reflectivity and external feedback are respected. However, as ASEis a fundamental process inseparably connected to the nature of lasers, its impactcan only be minimized but not suppressed completely.
193


A. Annex
A.1. Variable Doping Distribution
In order to obtain the optimum doping distribution inside a gain medium, we have atfirst to derive a relation between the incident pump intensity and the local excitation.We will explore the two main pumping configurations – the single–side pumpedgain medium case (with AR coated surfaces) in Section A.1.2 and the active mirrorscheme in Section A.1.3.
A.1.1. Pump ↔ Excitation Relationship
The relationship between the absorbed pump IP and the relative excitation value βis given by the following set of coupled differential equations:
dIPdz
= g0(z)IP (z) (A.1.1)
dβ
dt= −g0
IP (z)
hνP ntot− β
τ(A.1.2)
where we used the known expression for the small signal gain g0. In the case ofa simple transmission, without saturation, backreflection of the pump and withoutASE we get the simple evolution for the pump intensity IP :
dIPIP
= g0 dz (A.1.3)
The very well know solution can be written as:
IP = I0exp
∫ D
0
g0(z)dz
(A.1.4)
where D is the thickness of the gain medium. Beside the use of the unified variableβ, one can go back to the use of the (more useful) density of ions in the upper laserstate n. Therefore we write may express the differential equation for β in terms of
195

A. Annex
n as:dn
dt= −g0
IP (z)
hνP− n
τ(A.1.5)
Given the relationship for the small signal gain g0 = − [σa · ntot − n(σa + σe)] (Equa-tion 3.2.19) we can write:
dn
dt= ntotσa
IPhνP− n (σa + σe)
IPhνP− n
τ= γ − nκ (A.1.6)
This differential equation can easily be solved and giving the boundary condition(n(t = 0) = 0) finally yields:
n =γ
κ− γ
κexp −κt (A.1.7)
n ≈ ntotIP
IP + ISat
(1− exp
−IP + ISat
ISat
t
τ
)(A.1.8)
A.1.2. Doping distribution in transmission case
With the relationship between the pump intensity IP and the density of the excita-tion n derived above we can calculate the doping variation along the z–axis withoutsaturation for our first case, where the pump light is not recycled.
We have to satisfy dg0(λL)/dz = 0 to get a constant small signal distribution.Achieving this is performed by introducing a longitudinal dependence ntot(z) to thedoping concentration.
In our simplified case we approximate the pump to be small compared to thesaturation intensity Ip ISat in Equation A.1.8 and we get:
n ≈ ntotIPISat·[1− exp
− tτ
]︸ ︷︷ ︸
δ
(A.1.9)
The small signal gain g0(λL) (all variables at the emission wavelength (λL)) simplifiedby assuming σa σe (four–level case):
g0 = −σantot + (σa + σe)n ≈ σentotIP ·δ
ISat︸︷︷︸κ
(A.1.10)
Finally we have to solve:
dg0
dz= 0⇒ IP
dntotdz
= −ntotdIpdz
(A.1.11)
1
ntot
dntotdz
= − 1
IP
dIPdz
(A.1.12)
196

ASE and Thermal Management on a High Average-Power DPSSL
whereas for the pump the emission cross section is negligible and σa(λL) = σaP :
dIPdz≈ −σaP ntotIP (A.1.13)
results in the differential equation
dntotdz
= σaP n2tot (A.1.14)
As boundary condition we set ntot(z = 0) = n0 and get:
ntot(z) =n0
1− n0σaP z(A.1.15)
Obviously we get a critical length zcrit = (n0σaP )−1, where the doping concentrationwill diverge. The reason is simple: the deeper the pump penetrates the gain medium,the weaker it gets and the stronger the absorption has to be.
ntot(z) =n0
1− z/zcrit(A.1.16)
The pump intensity as a function of the penetration depth zis:
dIPdz≈ −σaP ntotIP = − 1
zcrit − zIP (A.1.17)
IP (z) = I0
(1− z
zcrit
)(A.1.18)
If one wants to absorb almost all the energy and still achieves a uniform gain profile,one has to come very close to the critical length zcrit.
A.1.3. Gain profile for internal reflection
After the transmission case, which was quite straight-forward, let us now considera more interesting case with respect to the Lucia relevant active mirror concept.How should the doping distribution look like, to get a uniform gain in the caseof a backreflected pump? As one might expect, the solution will follow at thebeginning the hyperbolic result of the previous case, as long as the optical thicknessof the gain medium at pump wavelength is high enough. Assuming the pump tobe non-coherent, we can estimate the pump intensity IP at every position as the
197

A. Annex
superposition of the forward and backwards traveling intensity, thus
IP (z) = I+P (z) + I−P (z) (A.1.19)
We write the evolution of the intensity again in the form
dI±Pdz
= g0P dz (A.1.20)
We can formally write this, considering a perfect reflection as:
I+P (z) = I0 exp
∫ z
0
g0P (z′)dz′
(A.1.21)
I−P (z) = I0 exp
∫ D
0
g0P (z′)dz′ +
∫ D
z
g0P (z′)dz′. (A.1.22)
Therefore we write using equation A.1.10:
g0L = σeLntotκ(I+P + I−P
). (A.1.23)
We impose the same demands on the small signal gain g0:
dg0L
dz= κσeL ·
[dntotdz
(I+P + I−P
)+ ntot
(dI+
P
dz+dI−Pdz
)]. (A.1.24)
Unfortunately it is not as easy to obtain an expression similar to equation A.1.14.We will use an approach as described in [24]. We can imply, that A.1.23 yields thesame small–signal gain for z = 0 and for an arbitrary position z. For simplicity, weabbreviate the expression g0P (z′)dz′ = ∗
g0l(z) ∝ ntotI0
[exp
∫ z
0
∗
+ exp
∫ D
0
∗+
∫ D
z
∗]
(A.1.25)
g0l(0) = g0l(z) (A.1.26)
ntot(0)
[1 + exp
∫ D
0
∗+
∫ D
0
∗]
= ntot(z)
[exp
∫ z
0
∗
+ exp
∫ D
0
∗+
∫ D
z
∗]
(A.1.27)
We now multiply both sides with exp−∫ D
0∗, −σaP and use the relation for the
hyperbolic cosine cosh(x) = 1/2 · (ex + e−x). As the the exponent of the integralbetween 0 and D is the absorption efficiency in one pass (or the square root of thepump absorption efficiency in the active mirror case), we abbreviate
∫ D0∗ = −a,
198

ASE and Thermal Management on a High Average-Power DPSSL
∫ z0∗ = b and g0P (0) = G yielding:
G cosh(a) = g0P (z) cosh (a+ b) (A.1.28)
Therefore we can eliminate the integral b using the function g0P (z):
cosh (a+ b) =G cosh(a)
g0P (z)(A.1.29)
dg0P (z)
dz= Gg0P (z)
cosh(a) sinh (a+ b)
cosh2 (a+ b)(A.1.30)
dg0P (z)
dz=g2
0P(z)√
[G cosh(a)]2 − g20P
(z)
G cosh(a)(A.1.31)
The solution can be found (using Mathematica e.g.) to be
g0P (z) = ± G cosh(a)√1 + (G cosh(a))2 z2 + 2 (G cosh(a))3 zC1 + (G cosh(a))4C2
1
(A.1.32)
The integration constant C1 can be deduced by the boundary condition g0P (0) = G.Completing the square in the lower square root finally gives:
g0P (z) = ±
[(z − tanh(a)
G
)2
+1
(G cosh(a))2
]−1/2
(A.1.33)
We have to remember, that G and g0P (z) are negative. There is still the unde-termined absorption on the front surface G. Considering the previously mentionedapproximations we directly get:
G =tanh(a)
Dand ntot(0) = −tanh(a)
σaPD(A.1.34)
Together with equation A.1.33 we get:
ntot(z) = σ−1aP
[(z −D)2 +
(D
sinh(a)
)2]−1/2
(A.1.35)
The constant a can be interpreted to be the absorbed fraction of the pump in single-pass, there for it is in direct connection to the overall pump efficiency ηP .
a =ln(1− ηP )
2(A.1.36)
An interesting feature is the ratio ∆tot between the doping concentration on thereflective and the front surface:
∆tot =ntot(D)
ntot(0)= cosh(a) =
1− ηP/2√1− ηP
. (A.1.37)
Interestingly is the ratio only dependent on the pump efficiency. The higher thepump efficiency, the stronger will be the doping requested gradient between bothextremities of the gain medium.
199

A. Annex
A.2. Linfords Formula
We start from the problem given in Section 3.2.2 in Equation 3.2.8:
d3ΦASE =n
τf
dΩ
4πg(ν)Gdνdx (A.2.1)
Considering the system as a four–level system, one can use G ≈ exp[∫ zxσstn(x′)dx′
].
The ASE flux can be expressed as:
ΦASE(z) =1
τf
Ω
4π
∫ ∞−∞
∫ z
0
ng(ν) exp
[∫ z
x
σstn(x′)dx′]dνdx (A.2.2)
The line shape function g(ν) and the emission cross section σ(ν) is approximatedwith a Gaussian function with the FWHM values of ∆νst and ∆νsp. The corre-sponding expressions are:
σ(ν) = σ(ν0) exp
[− ln(2)
(ν − ν0)2
∆ν2st
](A.2.3)
g(ν) =
√ln(2)/π
∆νspexp
[− ln(2)
(ν − νsp)2
∆ν2sp
](A.2.4)
Equation A.2.2 becomes then [115]:
ΦASE(z) =
√ln(2)/π
∆νspτf
Ω
4π
∫ ∞−∞
exp
[− ln(2)
(ν − ν0)2
∆ν2st
]F (ν, z) dν (A.2.5)
where F (ν, z) is:
F (ν, z) =
∫ z
0
n(x) exp
[∫ z
x
σ(ν0) exp
− ln(2)
(ν − ν0)2
∆ν2st
n(x′)dx′
]dx (A.2.6)
The function F (ν, z) is approximated by a Gaussian function H(ν, z) in the form of:
H(ν, z) = q(z) exp
[− ln(2)
(ν − ν0)2
∆ν2ASE(z)
](A.2.7)
with
q(z) =
∫ z
0
n(x) exp
[∫ z
x
σ(ν0)n(x′)dx′]dx (A.2.8)
Within this approximation a FWHM value for the Gaussian distribution of the ASE∆νASE is introduced. The functions H and F have to show their maximum at the
200

ASE and Thermal Management on a High Average-Power DPSSL
same position.
H(ν0, z) = F (ν0, z) (A.2.9)
H and F have to show the same curvature at their maximum frequency ν = ν0.
∂2H(ν0, z)
∂ν2=∂2F (ν0, z)
∂ν2+ h(z) (A.2.10)
The differentiation gives:
q(z)
∆ν2ASE(z)
=1
∆ν2st(z)
∫ z
0
exp
∫ z
x
σ(ν0)n(x′)dx′
×(∫ z
x
σ(ν0)n(x′)dx′)n(x) dx− 1
2 ln(2)h(z)
(A.2.11)
The auxiliary function h is indeed necessary to ensure, that the ASE line widthtends towards the stimulated emission line width, even for very thin gain media.We have to ensure:
limz→0
∆νASE(z) = ∆νst (A.2.12)
and to demand consequently:
h(z) = −2 ln(2)
∆ν2st
q(z) (A.2.13)
Using Equation A.2.9 together with A.2.11 and A.2.13 results in an expression forthe ASE line width:
∆ν2ASE(z)
∆ν2st
=
∫ z0n(x)e
∫ zx σ(ν0)n(x′)dx′dx∫ z
0n(x)e
∫ zx σ(ν0)n(x′)dx′dx+
∫ z0e∫ zx σ(ν0)n(x′)dx′
(∫ zxσ(ν0)n(x′)dx′
)n(x) dx(A.2.14)
Finally the integral for the ASE flux ΦASE is expressed as:
ΦASE(z) =1
τf
Ω
4π
∆νASE(z)√∆ν2
sp + ∆ν2ASE(z)
∫ z
0
n(x)e∫ zx σ(ν0)n(x′)dx′dx (A.2.15)
The only information which has to be given is the distribution of the populationinversion n along the propagation axis. Estimating the distribution n to be constant,Equation A.2.14 yields:
∆νASE(z)
∆νst=
(eg0z − 1
g0z eg0z
)1/2
(A.2.16)
where g0 is the small–signal gain coefficient in the four–level case. Defining thesaturation intensity of the gain medium used as Isat = hν0/ [τfσ(ν0)], we get for the
201

A. Annex
ASE intensity IASE
IASE = IsatΩ
4π
∆νASE(z)√∆ν2
sp + ∆ν2ASE(z)
(eg0z − 1) (A.2.17)
In Linfords model implies a strong spectral narrowing (∆νASE(z) ∆νsp), there-fore:
IASE = IsatΩ
4π
∆νst∆νsp
(eg0z − 1)3/2
(g0z eg0z)1/2. (A.2.18)
Furthermore, the overall gain G is very high and the widths of the spontaneous andstimulated emission cross section to be equal, we can write:
IASE = IsatΩ
4π
G(z)√lnG(z)
. (A.2.19)
This relation is very convenient to estimate the intensity of ASE at the end of alaser chain.
202

ASE and Thermal Management on a High Average-Power DPSSL
A.3. The Quasi–Three–Level–System Yb3+:YAG
Conventional laser system classifications cook down to the desciption of three–leveland four-level systems. The quasi-three-level-system of Yb3+:YAG is somewhere inbetween. While the terminal laser level is not the ground level, it is close enoughto it, to be considerably populated by the Boltzmann–distribution. Simplifying thesituation, we consider 2 level–systems, with four levels in total, where the relativedistribution therein is distributed thermally. The term schemata, however, are morecomplicated.
Figure A.1.: Quasi–three–level system of Yb+3:YAG. Values for the energy levelsafter [149, 10]
According to the Einstein coefficients [163], we can write the absorption andemission cross–section at a frequency ν between two energetic levels i and j withthe respective degeneracies gi and gj, where the index j marks the higher lying one,as follows:
g0(ν) = −α(ν) = σ (ginj − gjni) (A.3.1)
σ =c2
8πν2
Aijgi
Φ(ν) and σ =σjigi
=σijgj
(A.3.2)
hereby we used the sums convention. In the case, that the energy levels correspond toStark levels (i for the ground state manifold and j for the excited state manifold), therespective levels are thermally populated according to the Boltzmann distribution.The fractional thermal occupation is given against the whole occupation in thecorresponding manifold. we have therefore:
flowi =ninlow
and fupj =njnup
(A.3.3)
Due to the Boltzman distribution the following equations govern the population
203

A. Annex
distributions of the lower and upper levels in the manifolds:
flowi = giexp (−Elowi/kT ) /∑i
giexp (−Elowi/kT ) (A.3.4)
fupj = gjexp(−Eupj/kT
)/∑j
gjexp(−Elowj/kT
)(A.3.5)
We can therefore write the emission and absorption cross sections in the followingway:
σe(λ) =∑i,j
fupjσupj ,lowi (A.3.6)
σa(λ) =∑i,j
flowiσlowi,upj (A.3.7)
In the case of Yb-doped YAG, the relative occupation factor flowi is assigned to theoccupation factor of sublevel lowi within the manifold 2F7/2 and fupj to the sublevelupj within the manifold 2F5/2.In the case that only one Stark sublevel contributes to a transition at a specificwavelength λ, the equations lead to:
σeσa
=fupjflowi
gigj
(A.3.8)
The total doping density is ntot:
ntot = nup + nlow. (A.3.9)
The small–signal gain g0 is:
g0 = σenup − σendown = −σ [gjfintot − (gjfi + gifj)nup] (A.3.10)
At this point we change the variable names to be conform with the definitionsfound in Chapter 1:
n = nup. (A.3.11)
Of special interest is the minimum excitation necessary to bleach out the gainmedium βmin in this case (Equation A.3.10):
βmin =n
ntot=
σaσa + σe
=gjflowi
gjflowi + gifupj. (A.3.12)
Assuming the degeneracies gi = gj, this relation simplifies to
βmin =flowi
flowi + fupj. (A.3.13)
Consequently will the minimum excitation needed, to achieve gain in such a material,dependent from the temperature and decreases with a decreasing temperature.
204

B. Tables
variable Yb3+:YAG (2 at.%) Yb3+:YAG (20 at.%) silicone steelk [W m−1 K−1] 9 6 0.16 16.2
ρ [g cm−3] 4.56 4.56 2 8
Y [N m−2] 3× 10¹¹ 3× 10¹¹ 1× 10⁸ 2× 10¹¹
αT [K−1] 6× 10⁻⁶ 6× 10⁻⁶ 7× 10⁻⁴ 1.6× 10⁻⁵
α [m−1] 209.8 2098 – –
Table B.1.: Parameters used within the three dimensional thermo–mechanical anal-ysis.
205

B. Tables
Material n0 n2 k αT RS Fsat ∆λ τf Ref.YAG 1.82 7 10.7 6 10.4(55) 9.6(0.6) 9(0.8) 0.95(0.27) [164, 165, 166, 56, 71]SFAP 1.62 4.1 2 27 1.1 3(0.35) 4 1.1(0.3) [164, 166, 71]FP20 1.51 2.1 0.9 – 0.8 43 48 1.6 [167, 71]CaF2 1.43 1.3 9.7 -18 1.7 86 53 2.4 [21, 95, 71]SrF2 1.43 1.5 8.3 -20 2.2 102 53 2.9 [21, 95, 71]
CAlGO – – 6.9 35 6.4 23 80 0.4 [166, 71]KYW 2 8.7 2.7 – – 6.5 16 0.6 [165, 130, 71]KGW 2 – 3.8 16 4 8.9 20 0.6 [165, 166, 71]YVO4 1.96 1.9 7 – 11.3 2.8(0.18) –(1) 0.3(0.1) [165, 166, 71]YCOB 1.7 9 – – – – – 3 [165, 71]GCOB 1.7 10 2 33.5 1 55 44 2.6 [165, 168, 166, 71]BOYS 1.74 6.6 – – – 96 60 1.1 [165, 71]YSO 1.78 – 5 18 4.7 48 – 0.7 [168, 166, 71]Sc2O3 1.93 11.5 16.5 27 13 13 – – [164, 166, 71]Lu2O3 1.93 8.6 12.2 24 12 15 – – [164, 166, 71]Y2O3 1.92 11.6 12.8 25.5 12 18 – – [164, 165, 166, 71]YLF 1.45 1.7 5 42 1.8 – –(1.5) –(0.5) [165, 166]YAlO 1.93 7.3 8.5 25 7.8 –(0.74) –(2.5) –(0.16) [21, 166, 71]GGG 1.95 12.5 8.2 24 7.6 –(1) – – [21, 166, 71]GSGG 1.94 12 6 22.5 6.2(64) –(0.6) – – [21, 166, 53, 56, 71]LHG–5 1.54 – 1 9.8 1 – – – [53]LHG–8 1.52 3.1 0.58 12.7 0.5 –(5.2) –(26.5) –(0.36) [72, 169]LG–750 – – 0.62 11.4 0.7 – –(25.4) – [53]LG–770 1.5 2.8 0.57 13.5 0.4 –(4.8) – –(0.36) [72]
fused silica 1.45 2.5 1.4 – 1.5 – – – [21, 71]Ti:Sa 1.75 3 28 – 34 0.6 230 0.0032 [21, 53, 71]
Cr:LiSAF – – 3.1 19 1.6 4.9 180 0.067 [170, 71]Cr:YAG 1.82 7 10.7 6 10.4 0.3 – 0.004 [164, 165, 71]Cr:MgSiO 1.67 4.3 – – – 1.1 30 0.0025 [21, 71]Cr:BeAlO 1.73 3.5 23 8 23.5 26 100 0.0026 [21, 53, 71]Cr:Al2O3 1.75 3 28 – 34 11 0.5 3 [21, 71]
Table B.2.: Characteristics of selected gain media. The upper part of the table showsmaterials doped with Yb3+ or Nd3+. The lower part shows fused silica and transitionmetal doped gain media. The nonlinear index of refraction n2 in ×10−16 cm2 W−1,the thermal conductivity k in W m−1 K−1, thermal expansion αT in ×10−6 K−1 andthe thermal shock parameter RS in W cm−1 are given for pure materials. Valuesin brackets for RS signify strengthened materials. Saturation fluence at extractionwavelength Fsat in J cm−2, the bandwidth ∆λ in nm and the lifetime τf in ms aregiven for Yb3+(Nd3+) doping.
206

List of Figures
1.1. Three–level-laser and four–level–laser schemata . . . . . . . . . . . . 81.2. Storage efficiency as a function of time and ASE . . . . . . . . . . . . 211.3. Critical volume for different geometries and the critical radius for a
disk as a function of the surface reflectivity. . . . . . . . . . . . . . . 231.4. Necessary bandwidths . . . . . . . . . . . . . . . . . . . . . . . . . . 321.5. Fluoresence lifetime and saturation fluence for selected solid state
laser gain media . . . . . . . . . . . . . . . . . . . . . . . . . . . . . . 331.6. Bandwidth of laser gain materials . . . . . . . . . . . . . . . . . . . . 341.7. Thermal shock parameter RS for various laser materials. . . . . . . . 351.8. B–Integral susceptibility (vertical axis) and critical power Pcrit (hor-
izontal axis) for selected solid state laser gain media . . . . . . . . . . 35
2.1. Schematic overview over the Lucia laser system. . . . . . . . . . . . . 452.2. Oscillator setup sketches . . . . . . . . . . . . . . . . . . . . . . . . . 462.3. Oscillator spectra . . . . . . . . . . . . . . . . . . . . . . . . . . . . . 482.4. Oscillator energy characteristics . . . . . . . . . . . . . . . . . . . . . 502.5. Oscillator near and far field . . . . . . . . . . . . . . . . . . . . . . . 512.6. Preamplifier sketch . . . . . . . . . . . . . . . . . . . . . . . . . . . . 522.7. 1st preamplifier setup . . . . . . . . . . . . . . . . . . . . . . . . . . . 532.8. 2nd preamplifier setup . . . . . . . . . . . . . . . . . . . . . . . . . . 542.9. Performance of the first pre–amplifier. . . . . . . . . . . . . . . . . . 552.10. Description of the three major pumping schemes. . . . . . . . . . . . 562.11. View from extraction direction at the main amplifier. . . . . . . . . . 572.12. Lucia apodizer example . . . . . . . . . . . . . . . . . . . . . . . . . . 582.13. General Apodizer setup using a serrated aperture . . . . . . . . . . . 592.14. Serrated aperture tooth design . . . . . . . . . . . . . . . . . . . . . . 602.15. Triangular teeth pattern example and its FFT . . . . . . . . . . . . . 612.16. Simulation of the serrated aperture . . . . . . . . . . . . . . . . . . . 632.17. Impact of the serrated aperture, experiment. . . . . . . . . . . . . . . 642.18. Comparison between the calculated and experimental intensity dis-
tribution in the focus introduced by the serrated aperture . . . . . . . 642.19. Overview of the main amplifier setup . . . . . . . . . . . . . . . . . . 65
207

List of Figures
2.20. Water distribution and cooling of the laser diode array . . . . . . . . 662.21. Impact of the bias current . . . . . . . . . . . . . . . . . . . . . . . . 672.22. Schematic setup of the main power amplifier . . . . . . . . . . . . . . 682.23. Effect of the prisms . . . . . . . . . . . . . . . . . . . . . . . . . . . . 692.24. Impact of light concentration system on the pump light distribution . 702.25. Transmission of the large concentration mirrors . . . . . . . . . . . . 712.26. Beam trajectory in a gain medium pumped with a modulated gain
profile. . . . . . . . . . . . . . . . . . . . . . . . . . . . . . . . . . . . 722.27. Example calculations of the exiting beam modulation as a function
of the gain medium thickness. . . . . . . . . . . . . . . . . . . . . . . 732.28. Impact of the gain medium thickness on the modulation of an ampli-
fied beam in the active mirror scheme. . . . . . . . . . . . . . . . . . 742.29. Comparison of the different cooling setups . . . . . . . . . . . . . . . 762.30. Cooling head assembly . . . . . . . . . . . . . . . . . . . . . . . . . . 772.31. Manufactured jet–plate . . . . . . . . . . . . . . . . . . . . . . . . . . 772.32. Laser head assembly . . . . . . . . . . . . . . . . . . . . . . . . . . . 78
3.1. ASE in 1D sketch . . . . . . . . . . . . . . . . . . . . . . . . . . . . . 803.2. Distribution of the ASE–flux in a 1D gain medium . . . . . . . . . . 813.3. Sketches for the 2D and quasi–3D ASE estimations . . . . . . . . . . 863.4. MASE distribution for different homogeneous g0 . . . . . . . . . . . . 883.5. g0 (a) and MASE (b) evolution during the pumping process . . . . . . 903.6. ASE 2at% Yb:YAG 7mm scaling example . . . . . . . . . . . . . . . 913.7. Delaunay prism with a random distribution example . . . . . . . . . 923.8. 3D model example Paraview . . . . . . . . . . . . . . . . . . . . . . . 933.9. Pump spectra in the single shot experiment . . . . . . . . . . . . . . 943.10. ASE experiment setup . . . . . . . . . . . . . . . . . . . . . . . . . . 953.11. ASE experiment examples simulation . . . . . . . . . . . . . . . . . . 963.12. Experimentally found gain distributions for a weak and strong ASE
impact. . . . . . . . . . . . . . . . . . . . . . . . . . . . . . . . . . . . 973.13. Temporal evolutions during pumping for 1 at.%, 5 mm and 10 at.%,
3 mm. . . . . . . . . . . . . . . . . . . . . . . . . . . . . . . . . . . . 993.14. Overall comparison between simulation and experiment for the im-
pact of ASE . . . . . . . . . . . . . . . . . . . . . . . . . . . . . . . . 1013.15. Internal reflection in a slab . . . . . . . . . . . . . . . . . . . . . . . . 1023.16. Impact of the aspect ratio . . . . . . . . . . . . . . . . . . . . . . . . 1033.17. Gain for SE neglecting ASE for a 7 mm thick Yb:YAG crystal pumped
at 10 kW cm−2. . . . . . . . . . . . . . . . . . . . . . . . . . . . . . . 104
208

ASE and Thermal Management on a High Average-Power DPSSL
3.18. Closed paths within a circle . . . . . . . . . . . . . . . . . . . . . . . 1053.19. Circle in circle sketch . . . . . . . . . . . . . . . . . . . . . . . . . . . 1063.20. Circle in a a circle calculation examples . . . . . . . . . . . . . . . . . 1083.21. Sketch of the coatings applied on the 60 mm active mirrors. . . . . . . 1103.22. Mount for the 60 mm crystals, open design . . . . . . . . . . . . . . . 1103.23. Pump profile at 130A . . . . . . . . . . . . . . . . . . . . . . . . . . . 1113.24. Comparison between the simulation and measurement rectangular
pump zone in a 60 mm crystal, 11.5 kW cm−2 . . . . . . . . . . . . . . 1123.25. Gain for rays passing through the gain medium, rectangular pump
12 kW cm−2 . . . . . . . . . . . . . . . . . . . . . . . . . . . . . . . . 1133.26. Light concentration optimizations, theory . . . . . . . . . . . . . . . . 1143.27. Light concentration optimizations, realized . . . . . . . . . . . . . . . 1153.28. Temporal gain evolution observed for three experimental pump dis-
tributions . . . . . . . . . . . . . . . . . . . . . . . . . . . . . . . . . 1153.29. Impact of the index matching liquid on the gain in the central region,
16 kW cm−2 . . . . . . . . . . . . . . . . . . . . . . . . . . . . . . . . 1173.30. Redesigned gain mount with incorporated mask and blackening . . . 1183.31. Impact of the new mount and comparison to the simulation results . 118
4.1. Thermal conductivity of YAG as a function of grain size and temper-ature . . . . . . . . . . . . . . . . . . . . . . . . . . . . . . . . . . . . 124
4.2. Thermal conductivity of Yb3+:YAG as a function of doping and tem-perature . . . . . . . . . . . . . . . . . . . . . . . . . . . . . . . . . . 125
4.3. Variation of the thermal conductivity of Yb3+:YAG as a function ofsubstitution, after [127] . . . . . . . . . . . . . . . . . . . . . . . . . . 126
4.4. Cooling scheme for a rod and for a disc . . . . . . . . . . . . . . . . . 1284.5. Heat distribution examples for a one–sided and two–sided cooling . . 1294.6. Definitions for the variables used for the radial temperature distribu-
tion estimation . . . . . . . . . . . . . . . . . . . . . . . . . . . . . . 1314.7. Radial distribution of the mean temperature for different relative
pump diameters. . . . . . . . . . . . . . . . . . . . . . . . . . . . . . 1324.8. JP working principle sketch . . . . . . . . . . . . . . . . . . . . . . . 1334.9. Estimation of the heat exchange coefficient for a single jet . . . . . . 1354.10. Scheme of measuring the heat exchange coefficient of the Lucia laser
head . . . . . . . . . . . . . . . . . . . . . . . . . . . . . . . . . . . . 1364.11. Setup sketch for the estimation of h with its components. . . . . . . . 1374.12. Experimental result for the heat exchange coefficient of the jet–plate
compared to the Tawfek relation (Equation 4.3.3) . . . . . . . . . . . 138
209

List of Figures
4.13. Visualization of the cross flow introduced by neighboring jets . . . . . 1384.14. Visualization of the surface temperature modulations introduced by
the jet–plate for different distances jet–plate – cooled surface. . . . . 1394.15. Sketch of the dependence of the refractive index in a pumped gain
medium. . . . . . . . . . . . . . . . . . . . . . . . . . . . . . . . . . . 1414.16. Sketch for the estimation of the deformation of an active medium in
the thin disc case. . . . . . . . . . . . . . . . . . . . . . . . . . . . . . 1434.17. Estimations for the thermally induced focal length. . . . . . . . . . . 1444.18. Sketch of the experimental setup measuring the wavefront deforma-
tion on the Lucia main amplifier laser head. . . . . . . . . . . . . . . 1454.19. The first 12 Zernike polynomials in the case of the highly doped
20 at.% Yb3+:YAG slab. . . . . . . . . . . . . . . . . . . . . . . . . . 1474.20. Simplified quasi–three level level scheme for Yb3+:YAG. . . . . . . . . 1484.21. Time resolved measurement of the wavefront deformation . . . . . . . 1494.22. Comparison between the experimentally observed static deformation
and predictions for three different crystals. . . . . . . . . . . . . . . . 1514.23. Deformation and temperature for the 20 at.% doped, rect. crystal,
Iavg = 30 W cm−2 and the 2 at.% doped, circ. crystal, Iavg = 75 W cm−2.1534.24. Wavefront deformation for the 7 mm and 8.4 mm thick laser crystals
under internal reflection at Iavg = 75 W cm−2. . . . . . . . . . . . . . 1544.25. Horizontal lineouts of the wavefront deformation. . . . . . . . . . . . 1554.26. Deformation compilation of the experiments done on the main am-
plifier head. . . . . . . . . . . . . . . . . . . . . . . . . . . . . . . . . 1564.27. Depolarization sketch for a linearly polarized beam traveling through
a laser crystal under stress. . . . . . . . . . . . . . . . . . . . . . . . . 1594.28. Mean radial and tangential stress distribution for D′ = 0.2. . . . . . . 1604.29. Transmission examples set between crossed polarizers of two different
Yb3+:YAG slabs . . . . . . . . . . . . . . . . . . . . . . . . . . . . . . 1624.30. Sketch of the experimental setup to measure the thermally induced
depolarization. . . . . . . . . . . . . . . . . . . . . . . . . . . . . . . 1634.31. Intrinsic and pump induced polarization on the Lucia laser head. . . . 1664.32. Measured depolarization in the center and as the average over the pupil.167
5.1. Simulation results for the Lucia main amplifier Yb3+:YAG crystal . . 1725.2. β–distribution in the center along the pump axis . . . . . . . . . . . . 1745.3. Estimation of the output energy density as a function of the input
energy density for the Lucia main amplifier after four passes . . . . . 175
210

ASE and Thermal Management on a High Average-Power DPSSL
5.4. Estimated gain per pass for the first four passes in the main amplifieras a function of the input energy density. . . . . . . . . . . . . . . . . 175
5.5. Layout of the extraction setup. . . . . . . . . . . . . . . . . . . . . . 1765.6. Beam shape in the image relay plane after one and two passes in the
main amplifier. . . . . . . . . . . . . . . . . . . . . . . . . . . . . . . 1785.7. Main amplifier performance for 0.1 and 2Hz. . . . . . . . . . . . . . 1795.8. Beam shape in the image relay plane after four passes in the main
amplifier. . . . . . . . . . . . . . . . . . . . . . . . . . . . . . . . . . 1805.9. 4th pass for 2 Hz and 0.1 Hz repetition rate . . . . . . . . . . . . . . . 1815.10. Performance of the Lucia main amplifier . . . . . . . . . . . . . . . . 1825.11. Static astigmatism correction sketch. . . . . . . . . . . . . . . . . . . 1835.12. Astigmatism corrector setup. . . . . . . . . . . . . . . . . . . . . . . . 1845.13. Comparison of doping gradient in transmission and internal reflection 1875.14. 2 at.% doped Yb3+:YAG ceramic with Cr4+:YAG periphery . . . . . . 1885.15. Absorption coefficient of Yb3+:YAG and Cr4+:YAG ceramic . . . . . 189
A.1. Quasi–three–level system of Yb+3:YAG. Values for the energy levelsafter [149, 10] . . . . . . . . . . . . . . . . . . . . . . . . . . . . . . . 203
211


List of Tables
1.1. Properties of selected laser materials . . . . . . . . . . . . . . . . . . 141.2. Comparison of efficiencies flash lamp and diode pumped systems . . . 171.3. Comparison between the different laser DPSSL systems . . . . . . . . 41
3.1. Maximum g0L for the benchmark crystals. . . . . . . . . . . . . . . . 953.2. Used index matching media . . . . . . . . . . . . . . . . . . . . . . . 1163.3. Values for g0L and κ for different aspect ratios . . . . . . . . . . . . . 120
4.1. Ionic radius and molar mass of trivalent rare earths and Yttrium . . . 125
5.1. Energy storage and extractable energy for the Lucia main amplifierhead. . . . . . . . . . . . . . . . . . . . . . . . . . . . . . . . . . . . . 173
6.1. Scaling parameters for surface and volume scaling of laser materials. . 193
B.1. Data for the 3D model . . . . . . . . . . . . . . . . . . . . . . . . . . 205B.2. Gain medium data . . . . . . . . . . . . . . . . . . . . . . . . . . . . 206
213


Bibliography
[1] Einstein A. ‘Zur Quantentheorie der Strahlung.’ Physikalische Zeitschrift,18(6):(1917) pp. 121–128.
[2] Kopfermann H and Ladenburg R. ‘Untersuchungen über die anomale Disper-sion angeregter Gase.’ Zeitschrift für Physik, 48(1–2):(1928) pp. 26–50.
[3] Lewis G. ‘The conservation of Photons.’ Nature, 118(2981):(1926) pp. 874–875.
[4] Kastler A. ‘Quelques suggestions concernant la production optique et ladétection optique d’une inégalité de population des niveaux de quantifigationspatiale des atomes. Application à l’expérience de Stern et Gerlach et à larésonance magnétique.’ Journal de Physique et Le Radium, 11:(1950) pp.255–265.
[5] Purcell EM and Pound RV. ‘A Nuclear Spin System at Negative Temperature.’Phys. Rev., 81(2):(1951) pp. 279–280.
[6] Gordon JP, Zeiger HJ, and Townes CH. ‘Molecular Microwave Oscillator andNew Hyperfine Structure in the Microwave Spectrum of NH3.’ Phys. Rev.,95(1):(1954) pp. 282–284.
[7] Schawlow AL and Townes CH. ‘Infrared and Optical Masers.’ Physical Review,112(6):(1958) pp. 1940–1949.
[8] Maiman TH. ‘Stimulated Optical Radiation In Ruby.’ Nature,187(4736):(1960) pp. 493–494.
[9] Scully MO, Zhu SY, and Gavrielides A. ‘Degenerate Quantum-beat Laser -Lasing Without Inversion and Inversion Without Lasing.’ Physical ReviewLetters, 62(24):(1989) pp. 2813–2816.
[10] Koechner W. Solid-State Laser Engineering. Springer, 1999.
[11] Weber M. Handbook of Lasers. CRC Press LLC, 2001.
[12] Endo M. Gas Lasers. CRC Press, 2007.
215

Bibliography
[13] Patel CKN. ‘Continuous-Wave Laser Action on Vibrational-Rotational Tran-sitions of CO2.’ Phys. Rev., 136(5A):(1964) pp. A1187–A1193.
[14] Javan A, Herriott DR, and Bennett WR. ‘Population Inversion and Con-tinuous Optical Maser Oscillation In A Gas Discharge Containing A He-neMixture.’ Physical Review Letters, 6(1):(1961) pp. 106–110.
[15] Sorokin P and Lankard J. ‘Stuimulated emission observed from an organic dye,chloro-aluminium phtalocyanine.’ IBM Journal of Research and Development,10:(1966) p. 162.
[16] Schafer FP, Schmidt W, and Volze J. ‘Organic Dye Solution Laser.’ AppliedPhysics Letters, 9(8):(1966) pp. 306–309.
[17] Johnston TF, Brady RH, and Profitt W. ‘Powerful Single-frequency RingDye-laser Spanning the Visible Spectrum.’ Applied Optics, 21(13):(1982) pp.2307–2316.
[18] Bornemann R, Lemmer U, and Thiel E. ‘Continuous-wave solid-state dyelaser.’ Opt. Lett., 31(11):(2006) pp. 1669–1671. URL http://ol.osa.org/abstract.cfm?URI=ol-31-11-1669.
[19] Khader MA. ‘Lasing characteristics of Rhodamine B and Rhodamine 6G asa sensitizer in sol-gel silica.’ Optics and Laser Technology, 40(3):(2008) pp.445–452.
[20] Boling N, Glass A, and Owyoung A. ‘Empirical relationships for predictingnonlinear refractive index changes in optical solids.’ Quantum Electronics,IEEE Journal of, 14(8):(1978) pp. 601–608.
[21] Adair R, Chase LL, and Payne SA. ‘Nonlinear Refractive-Index Of Optical-Crystals.’ Physical Review B, 39(5):(1989) pp. 3337–3350.
[22] Bloembergen N and Pershan PS. ‘Light waves at the boundary of nonlinearmedia.’ Physical Review, 128(2):(1962) pp. 606–622.
[23] Belyakov AV and Sukhozhak AN. ‘Production of Transparent Ceramics(review).’ Glass and Ceramics, 52(1-2):(1995) pp. 14–19.
[24] Wilhelm R, Frede M, and Kracht D. ‘Power scaling of end-pumped solid-staterod lasers by longitudinal dopant concentration gradients.’ Ieee Journal OfQuantum Electronics, 44(3-4):(2008) pp. 232–244.
216

ASE and Thermal Management on a High Average-Power DPSSL
[25] Sorokin PP and Stevenson MJ. ‘Stimulated Infrared Emission from TrivalentUranium.’ Phys. Rev. Lett., 5(12):(1960) pp. 557–559.
[26] Keyes RJ and Quist TM. ‘Injection Luminescent Pumping of Ca F2-u3+ WithGaAs Diode Lasers.’ Applied Physics Letters, 4(3):(1964) pp. 50–&.
[27] Sorokin E, Naumov S, and Sorokina I. ‘Ultrabroadband infrared solid-state lasers.’ Selected Topics in Quantum Electronics, IEEE Journal of,11(3):(2005) pp. 690–712.
[28] Moulton PF. ‘Spectroscopic and laser characteristics of Ti:Al2O3.’ J. Opt. Soc.Am. B, 3(1):(1986) pp. 125–133. URL http://josab.osa.org/abstract.cfm?URI=josab-3-1-125.
[29] Spence DE, Kean PN, and Sibbett W. ‘60-fsec pulse generation from a self-mode-locked Ti:sapphire laser.’ Opt. Lett., 16(1):(1991) pp. 42–44. URLhttp://ol.osa.org/abstract.cfm?URI=ol-16-1-42.
[30] Milonni PW, Gibson RB, and Taylor AJ. ‘Ultrashort Pulse-propagation In KrfLaser-amplifiers.’ Journal of the Optical Society of America B-optical Physics,5(7):(1988) pp. 1360–1368.
[31] Nagy T, Simon P, and Szatmari S. ‘Spectral development of short pulses inKrF gain modules.’ Applied Physics B-lasers and Optics, 71(4):(2000) pp.495–501.
[32] Träger F, ed. Springer Handbook of Lasers and Optics. Springer, 2007.
[33] Lin QB and Zhang FG. ‘Coumarin-120 Laser-pulses Close To the Fourier-transform Limit From A Simplified Resonant Cavity.’ Applied Optics,26(13):(1987) pp. 2572–2574.
[34] Raju BB and Varadarajan TS. ‘Photophysical properties and energy transferdye laser characteristics of 7-diethylamino-3-heteroaryl coumarin in solution.’Laser Chemistry, 16(2):(1995) pp. 109–120.
[35] Geusic JE, Marcos HM, and Uitert LGV. ‘Laser Oscillations in Nd–dopedYttrium Aluminum, Yttrium Gallium and Gadolinium Garnets.’ AppliedPhysics Letters, 4(10):(1964) pp. 182–184. URL http://link.aip.org/link/?APL/4/182/1.
[36] Fan TY and Byer RL. ‘Diode Laser-Pumped Solid-State Lasers.’ Ieee JournalOf Quantum Electronics, 24(6):(1988) pp. 895–912.
217

Bibliography
[37] Giesen A, Hugel H, Voss A, Wittig K, Brauch U, and Opower H. ‘ScalableConcept For Diode-pumped High-power Solid-state Lasers.’ Applied PhysicsB-lasers and Optics, 58(5):(1994) pp. 365–372.
[38] Hall RN, Fenner GE, Kingsley JD, Soltys TJ, and Carlson RO. ‘CoherentLight Emission From GaAs Junctions.’ Phys. Rev. Lett., 9(9):(1962) pp. 366–368. URL http://link.aps.org/doi/10.1103/PhysRevLett.9.366.
[39] Chow W and Koch S. Semiconductor-Laser Fundamentals. Springer, 1999.
[40] Vanderziel J, Dingle R, Miller R, Wiegmann W, and Nordland W. ‘Laseroscillation from quantum states in very thin GaAs-Al0.2Ga0.8As multilayerstructures.’ Applied Physics Letters, 26(8):(1975) pp. 463–465.
[41] Klopp P, Petrov V, Griebner U, and Erbert G. ‘Passively mode-lockedYb:KYWlaser pumped by a tapered diode laser.’ Opt. Express, 10(2):(2002)pp. 108–113. URL http://www.opticsexpress.org/abstract.cfm?URI=oe-10-2-108.
[42] Volodin BL, Dolgy SV, Melnik ED, Downs E, Shaw J, and Ban VS.‘Wavelength stabilization and spectrum narrowing of high-power multimodelaser diodes and arrays by use of volume Bragg gratings.’ Opt. Lett.,29(16):(2004) pp. 1891–1893. URL http://ol.osa.org/abstract.cfm?URI=ol-29-16-1891.
[43] Iga K. ‘Surface-emitting laser-its birth and generation of new optoelectronicsfield.’ Selected Topics in Quantum Electronics, IEEE Journal of, 6(6):(2000)pp. 1201–1215.
[44] Frantz LM and Nodvik JS. ‘Theory of Pulse Propagation In A Laser Amplifier.’Journal of Applied Physics, 34(8):(1963) pp. 2346–2349.
[45] Allen L and Peters GI. ‘Amplified Spontaneous Emission .3. Intensity AndSaturation.’ Journal Of Physics Part A General, 4(4):(1971) p. 564.
[46] Linford GJ, PeressinER, Sooy WR, and Spaeth ML. ‘Very long lasers.’ AppliedOptics, 13(2):(1974) pp. 379–390.
[47] Ertel K, Hooker C, Hawkes SJ, Parry BT, and Collier JL. ‘ASE suppressionin a high energy Titanium sapphire amplifier.’ Optics Express, 16(11):(2008)pp. 8039–8049.
218

ASE and Thermal Management on a High Average-Power DPSSL
[48] Speiser J. ‘Scaling of thin-disk lasers-influence of amplified spontaneousemission.’ Journal Of The Optical Society Of America B-Optical Physics,26(1):(2009) pp. 26–35.
[49] Albach D, Chanteloup JC, and le Touzé G. ‘Influence of ASE on the gain dis-tribution in large size, high gain Yb3+:YAG slabs.’ Opt. Express, 17(5):(2009)pp. 3792–3801. URL http://www.opticsexpress.org/abstract.cfm?URI=oe-17-5-3792.
[50] Potemkin AK, Barmashova TV, Kirsanov AV, Martyanov MA, KhazanovEA, and Shaykin AA. ‘Spatial filters for high-peak-power multistage laseramplifiers.’ Applied Optics, 46(20):(2007) pp. 4423–4430.
[51] Makarov AI and Potemkin AK. ‘Maximum gain of a mutlistage laser amplifier.’Soviet journal of Quantum Electronics, 15(5):(1985) pp. 692–694.
[52] Ross IN, Matousek P, Towrie M, Langley AJ, and Collier JL. ‘The prospectsfor ultrashort pulse duration and ultrahigh intensity using optical parametricchirped pulse amplifiers.’ Optics Communications, 144(1-3):(1997) pp. 125–133.
[53] Krupke WF, Shinn MD, Marion JE, Caird JA, and Stokowski SE. ‘Spec-troscopic, optical, and thermomechanical properties of neodymium- andchromium-doped gadolinium scandium gallium garnet.’ J. Opt. Soc. Am. B,3(1):(1986) pp. 102–114. URL http://josab.osa.org/abstract.cfm?URI=josab-3-1-102.
[54] Marion JE. ‘Fracture of Solid-state Laser Slabs.’ Journal of Applied Physics,60(1):(1986) pp. 69–77.
[55] Suratwala T, Steele R, Feit M, Wong L, Miller P, Menapace J, and DavisP. ‘Effect of rogue particles on the sub-surface damage of fused silicaduring grinding/polishing.’ Journal of Non-Crystalline Solids, 354(18):(2008)pp. 2023 – 2037. URL http://www.sciencedirect.com/science/article/B6TXM-4RR86XG-1/2/e8677e2afe123b1621c6700cf6a93227.
[56] Marion J. ‘Strengthened solid-state laser materials.’ Applied Physics Letters,47(7):(1985) pp. 694–696. URL http://link.aip.org/link/?APL/47/694/1.
219

Bibliography
[57] Feldman R, Shimony Y, Jackel S, Levy I, and Golan Y. ‘Thermochemicalstrengthening of Nd:YAG laser rods.’ In Sennaroglu A, ed., ‘Proceedings ofSPIE,’ vol. 6190. SPIE, 2006, p. 619019. URL http://link.aip.org/link/?PSI/6190/619019/1.
[58] Cerqua KA, Shoup MJ, Smith DL, Jacobs SD, and Kally JH. ‘StrengthenedPhosphate-glass In A High Rep Rate Active-mirror Amplifier Geometry.’Applied Optics, 27(12):(1988) pp. 2567–2572.
[59] Fan TY. ‘Heat-Generation In Nd-Yag And Yb-Yag.’ Ieee Journal Of QuantumElectronics, 29(6):(1993) pp. 1457–1459.
[60] Kouznetsov D, Bisson JF, Dong J, and Ueda KI. ‘Surface loss limit of thepower scaling of a thin-disk laser.’ Journal of the Optical Society of AmericaB-optical Physics, 23(6):(2006) pp. 1074–1082.
[61] Naito K, Yamanaka M, Nakatsuka M, Kanabe T, Mima K, Yamanaka C,and Nakai S. ‘Conceptual Design Studies of A Laser Diode Pumped Solid-state Laser System For the Laser Fusion-reactor Driver.’ Japanese Journalof Applied Physics Part 1-regular Papers Short Notes & Review Papers,31(2A):(1992) pp. 259–273.
[62] Stuart BC, Feit MD, Herman S, Rubenchik AM, Shore BW, and Perry MD.‘Optical ablation by high-power short-pulse lasers.’ J. Opt. Soc. Am. B,13(2):(1996) pp. 459–468. URL http://josab.osa.org/abstract.cfm?URI=josab-13-2-459.
[63] Bloembergen N. ‘Laser-Induced Electric Breakdown In Solids.’ Ieee JournalOf Quantum Electronics, QE10(3):(1974) pp. 375–386.
[64] Hack H and Neuroth N. ‘Resistance of optical and colored glasses to 3-nseclaser pulses.’ Appl. Opt., 21(18):(1982) pp. 3239–3248. URL http://ao.osa.org/abstract.cfm?URI=ao-21-18-3239.
[65] Bertussi B, Natoli JY, and Commandre M. ‘Effect of polishingprocess on silica surface laser-induced damage threshold at 355nm.’ Optics Communications, 242(1-3):(2004) pp. 227 – 231. URLhttp://www.sciencedirect.com/science/article/B6TVF-4D4CWW4-5/2/f65f9406557fe47c815bf9ff5dfbc170.
[66] Chioa RY, Garmire E, and Townes CH. ‘Self-trapping of Optical Beams.’Physical Review Letters, 13(15):(1964) pp. 479–482.
220

ASE and Thermal Management on a High Average-Power DPSSL
[67] Boyd RW. Nonlinear Optics. Academic Press, 3 ed., 2008.
[68] Bespalov VI and Talanov VI. ‘Filamentary Structure of Light Beams InNonlinear Liquids.’ Jetp Letters-ussr, 3(12):(1966) pp. 307–310.
[69] Lukishova SG and Shen YR. Self–focusing: Past and Present, Fundamentalsand Prospects, vol. 114 of Topics in Applied Physics. Springer, 2009.
[70] Strickland D and Mourou G. ‘Compression of amplified chirped optical pulses.’Optics Communications, 56(3):(1985) pp. 219–221.
[71] Siebold M, Hein J, Hornung M, Podleska S, Kaluza MC, Bock S, and SauerbreyR. ‘Diode-pumped lasers for ultra-high peak power.’ Applied Physics B-LasersAnd Optics, 90(3-4):(2008) pp. 431–437.
[72] Ficini G and Campbell J. ‘Development of Large Scale Production of Nd-dopedPhosphate Glasses for Megajoule-Scale Laser Systems.’ Tech. rep., LawrenceLivermore National Laboratory, 1996.
[73] Druon F, Chériaux G, Faure J, Nees J, Nantel M, Maksimchuk A, Mourou G,Chanteloup JC, and Vdovin G. ‘Wave-front correction of femtosecond terawattlasers by deformable mirrors.’ Opt. Lett., 23(13):(1998) pp. 1043–1045. URLhttp://ol.osa.org/abstract.cfm?URI=ol-23-13-1043.
[74] Wattellier B, Fuchs J, Zou JP, Chanteloup JC, Bandulet H, Michel P, LabauneC, Depierreux S, Kudryashov A, and Aleksandrov A. ‘Generation of a singlehot spot by use of a deformable mirror and study of its propagation in anunderdense plasma.’ J. Opt. Soc. Am. B, 20(8):(2003) pp. 1632–1642. URLhttp://josab.osa.org/abstract.cfm?URI=josab-20-8-1632.
[75] Walmsley I, Waxer L, and Dorrer C. ‘The role of dispersion in ultrafast optics.’Review Of Scientific Instruments, 72(1):(2001) pp. 1–29.
[76] Baumgartner RA and Byer RL. ‘Optical Parametric Amplification.’ IeeeJournal Of Quantum Electronics, 15(6):(1979) pp. 432–444.
[77] Ishii N, Turi L, Yakovlev VS, Fuji T, Krausz F, Baltuska A, Butkus R, VeitasG, Smilgevicius V, Danielius R, and Piskarskas A. ‘Multimillijoule chirpedparametric amplification of few-cycle pulses.’ Optics Letters, 30(5):(2005) pp.567–569.
[78] Kleinman DA. ‘Theory Of Optical Parametric Noise.’ Physical Review,174(3):(1968) pp. 1027–1041.
221

Bibliography
[79] Waxer LJ, Bagnoud V, Begishev IA, Guardalben MJ, Puth J, and ZuegelJD. ‘High-conversion-efficiency optical parametric chirped-pulse amplifica-tion system using spatiotemporally shaped pump pulses.’ Optics Letters,28(14):(2003) pp. 1245–1247.
[80] Lozhkarev VV, Freidman GI, Ginzburg VN, Katin EV, Khazanov EA, Kir-sanov AV, Luchinin GA, Mal’shakov AN, Martyanov MA, Palashov OV,Poteomkin AK, Sergeev AM, Shaykin AA, Yakovlev IV, Garanin SG, SukharevSA, Rukavishnikov NN, Charukhchev AV, Gerke RR, and Yashin VE. ‘200TW 45 fs laser based on optical parametric chirped pulse amplification.’ OpticsExpress, 14(1):(2006) pp. 446–454.
[81] Esarey E, Schroeder CB, and Leemans WP. ‘Physics of laser-driven plasma-based electron accelerators.’ Reviews of Modern Physics, 81(3):(2009) pp.1229–1285.
[82] Leemans WP, Nagler B, Gonsalves AJ, Toth C, Nakamura K, Geddes CGR,Esarey E, Schroeder CB, and Hooker SM. ‘GeV electron beams from acentimetre-scale accelerator.’ Nat Phys, 2(10):(2006) pp. 696–699. URLhttp://dx.doi.org/10.1038/nphys418.
[83] Malka V, Faure J, Gauduel YA, Lefebvre E, Rousse A, and Phuoc KT.‘Principles and applications of compact laser-plasma accelerators.’ Nat Phys,4(6):(2008) pp. 447–453. URL http://dx.doi.org/10.1038/nphys966.
[84] Fuchs J, Audebert P, Borghesi M, Pépin H, and Willi O. ‘Laseracceleration of low emittance, high energy ions and applications.’Comptes Rendus Physique, 10(2-3):(2009) pp. 176 – 187. URLhttp://www.sciencedirect.com/science/article/B6X19-4W75RTF-1/2/6c361458f44a064bea30d40ae3294c94. Laser acceleration of particles inplasma.
[85] Schwoerer H, Pfotenhauer S, Jackel O, Amthor KU, Liesfeld B, Ziegler W,Sauerbrey R, Ledingham KWD, and Esirkepov T. ‘Laser-plasma acceler-ation of quasi-monoenergetic protons from microstructured targets.’ Na-ture, 439(7075):(2006) pp. 445–448. URL http://dx.doi.org/10.1038/nature04492.
[86] Lawson JD. ‘Some Criteria for a Power Producing Thermonuclear Reactor.’Proceedings of the Physical Society. Section B, 70(1):(1957) pp. 6–10. URLhttp://stacks.iop.org/0370-1301/70/6.
222

ASE and Thermal Management on a High Average-Power DPSSL
[87] Nuckolls J, Thiessen A, Wood L, and Zimmerma G. ‘Laser Compression ofMatter to Super-High Densities - Thermonuclear (CTR) Applications.’ Nature,239(5368):(1972) pp. 139–142.
[88] Meyer-ter Vehn J. ‘From laser fusion to laser accelerators: basic studiesinto high power laser plasmas.’ Plasma Physics and Controlled Fusion,51(12):(2009) p. 124001.
[89] Tabak M, Hammer J, Glinsky M, Kruer W, Wilks S, Woodworth J, CampbellE, Perry M, and Mason R. ‘Ignition and High–Gain with UltrapowerfulLasers.’ Physics of Plasmas, 1(5, Part 2):(1994) pp. 1626–1634. 35th AnnualMeeting of the Division-of-Plasma-Physics of the American-Physical-Society,ST LOUIS, MO, NOV 01-05, 1993.
[90] Atzeni S. ‘Laser driven inertial fusion: the physical basis of current andrecently proposed ignition experiments.’ Plasma Physics and ControlledFusion, 51(12):(2009) p. 124029.
[91] Atzeni S, Schiavi A, Honrubia JJ, Ribeyre X, Schurtz G, Nicolai P, Olazabal-Loume M, Bellei C, Evans RG, and Davies JR. ‘Fast ignitor target studies forthe HiPER project.’ Physics of Plasmas, 15(5):(2008) p. 056311.
[92] Treacy EB. ‘Optical pulse compression with diffraction gratings.’ Ieee JournalOf Quantum Electronics, QE 5(9):(1969) pp. 454–458.
[93] Betti R, Zhou CD, Anderson KS, Perkins LJ, Theobald W, and Solodov AA.‘Shock ignition of thermonuclear fuel with high areal density.’ Physical ReviewLetters, 98(15):(2007) p. 155001.
[94] Ribeyre X, Schurtz G, Lafon M, Galera S, and Weber S. ‘Shock ignition:an alternative scheme for HiPER.’ Plasma Physics and Controlled Fusion,51(1):(2009) p. 015013.
[95] Siebold M, Bock S, Schramm U, Xu B, Doualan J, Camy P, and MoncorgéR. ‘Yb:CaF2 – a new old laser crystal.’ Applied Physics B, 97(2):(2009) pp.147–158.
[96] Hein J, Kaluza MC, Bödefeld R, Siebold M, Podleska S, and SauerbreyR. ‘POLARIS: An All Diode-Pumped Ultrahigh Peak Power Laser forHigh Repetition Rates.’ Lasers and Nuclei, 694:(2006) pp. 47–66. URLhttp://dx.doi.org/10.1007/3-540-30272-7_4.
223

Bibliography
[97] Karsch S, Major Z, Fülöp J, Ahmad I, Wang TJ, Henig A, Kruber S, Weingart-ner R, Siebold M, Hein J, Wandt C, Klingebiel S, Osterhoff J, Hörlein R, andKrausz F. ‘The Petawatt Field Synthesizer: A New Approach to UltrahighField Generation.’ In ‘OSA Technical Digest Series (CD),’ Optical Societyof America, Jan. 2008, pp. WF1–. URL http://www.opticsinfobase.org/abstract.cfm?URI=ASSP-2008-WF1.
[98] Siebold M, Klingebiel S, Wandt C, Major Z, Popp A, Ahmad I, Wang TJ,Hein J, Krausz F, and Karsch S. ‘High Energy Diode-Pumped Yb:YAG Laserfor ns-Pulses.’ Optics Express, 16:(2008) pp. 3674–3679. URL http://www.opticsinfobase.org/abstract.cfm?URI=ASSP-2008-MF3.
[99] Bayramian A, Armstrong P, Ault E, Beach R, Bibeau C, Caird J, CampbellR, Chai B, Dawson J, Ebbers C, Erlandson A, Fei Y, Freitas B, Kent R, LiaoZ, Ladran T, Menapace J, Molander B, Payne S, Peterson N, Randles M,Schaffers K, Sutton S, Tassano J, Telford S, and Utterback E. ‘The mercuryproject: A high average power, gas-cooled laser for inertial fusion energydevelopment.’ Fusion Science and Technology, 52(3):(2007) pp. 383–387.
[100] Bibeau C, Bayramian A, Armstrong P, Ault E, Beach R, Benapfl M, CampbellR, Dawson J, Ebbers C, Freitas B, Kent R, Liao Z, Ladran T, Menapace J,Molander B, Moses E, Oberhelman S, Payne S, Peterson N, Schaffers K, StolzC, Sutton S, Tassano J, Telford S, Utterback E, Randles M, Chai B, and FeiY. ‘The mercury laser system - An average power, gas-cooled, Yb : S-FAPbased system with frequency conversion and wavefront correction.’ JournalDe Physique Iv, 133:(2006) pp. 797–803.
[101] Schaffers KI. ‘Yb:S-FAP lasers.’ Optical Materials, 26(4):(2004)pp. 391–394. URL http://www.sciencedirect.com/science/article/B6TXP-4BY3XHM-4/2/c027bcdd62fc944d0d3a2ba7bbb74dd0.
[102] Kawashima T, Ikegawa T, Kawanaka J, Miyanaga N, Nakatsuka M, IzawaY, Matsumoto O, Yasuhara R, Kurita T, Sekine T, Miyamoto M, Kan H,Furukawa H, Motokoshi S, and Kanabe T. ‘The HALNA project: Diode-pumped solid-state laser for inertial fusion energy.’ Journal De Physique Iv,133:(2006) pp. 615–620.
[103] Yasuhara R, Kawashima T, Sekine T, Kurita T, Ikegawa T, Matsumoto O,Miyamoto M, Kan H, Yoshida H, Kawanaka J, Nakatsuka M, Miyanaga N,Izawa Y, and Kanabe T. ‘213 W average power of 2.4 GW pulsed thermally
224

ASE and Thermal Management on a High Average-Power DPSSL
controlled Nd : glass zigzag slab laser with a stimulated Brillouin scatteringmirror.’ Optics Letters, 33(15):(2008) pp. 1711–1713.
[104] Kawanaka J, Yamakawa K, Tsubakimoto K, Kanabe T, Kawshima T, NakanoH, Yoshida M, Yanagitani T, Yamamura F, Fujita M, Suzuki Y, Mianaga N,and Izawa Y. ‘Generation of ENergetic Beam Ultimate (GENBU) Laser - MainLaser.’ The Review of Laser Engineering, 36(APLS):(2008) pp. 1056–1058.
[105] Yasuhara R, Katai R, Kawanaka J, Kawashima T, Miyajima H, and Kan H. ‘1Jx 100 Hz Cryogenic Yb:YAG Laser Development for Feasibility Demonstrationof GENBU Main Laser.’ The Review of Laser Engineering, 36(APLS):(2008)pp. 1092–1093.
[106] Wandt C, Klingebiel S, Siebold M, Major Z, Hein J, Krausz F, and KarschS. ‘Generation of 220 mJ nanosecond pulses at a 10 Hz repetition rate withexcellent beam quality in a diode-pumped Yb:YAGMOPA system.’ Opt. Lett.,33(10):(2008) pp. 1111–1113. URL http://ol.osa.org/abstract.cfm?URI=ol-33-10-1111.
[107] Hoffnagle JA and Jefferson CM. ‘Design and performance of a refractiveoptical system that converts a Gaussian to a flattop beam.’ Applied Optics,39(30):(2000) pp. 5488–5499.
[108] Gao XM, Fei Z, Xu WD, and Gan FX. ‘Tunable three-dimensional intensitydistribution by a pure phase-shifting apodizer.’ Applied Optics, 44(23):(2005)pp. 4870–4873.
[109] Sauceda A, Ramirez PJG, Garcia-Gonzalez L, Martinez-Castillo J, Herrera-May L, and Castro A. ‘Imaging properties of phase-shifting apodizers.’ RevistaMexicana De Fisica, 52(4):(2006) pp. 336–341.
[110] Auerbach JM and Karpenko VP. ‘Serrated-Aperture Apodizers For High-Energy Laser Systems.’ Applied Optics, 33(15):(1994) pp. 3179–3183.
[111] Rambo PK, Schwarz J, Kimmel M, Atherton BW, Bergstrom A, and FluscheB. ‘Development of High Damage Threshold Apodizers for Laser Applica-tions,.’ In ‘CLEO,’ 2008.
[112] Palmer KF and Williams D. ‘Optical properties of water in the nearinfrared.’ J. Opt. Soc. Am., 64(8):(1974) pp. 1107–1110. URL http://www.opticsinfobase.org/abstract.cfm?URI=josa-64-8-1107.
225

Bibliography
[113] Goren C, Tzuk Y, Marcus G, and Pearl S. ‘Amplified spontaneous emission inslab amplifiers.’ Ieee Journal Of Quantum Electronics, 42(11-12):(2006) pp.1239–1247.
[114] Tommasini R and Balmer JE. ‘Amplified spontaneous emission and maximumgain-length product revised for general line shapes.’ Journal Of The OpticalSociety Of America B-Optical Physics, 16(4):(1999) pp. 538–545.
[115] Tommasini R and Fill EE. ‘Generalized Linford formula.’ Journal Of TheOptical Society Of America B-Optical Physics, 17(10):(2000) pp. 1665–1670.
[116] Lowenthal DD and Eggleston JM. ‘Ase Effects In Small Aspect Ratio Laser-Oscillators And Amplifiers With Nonsaturable Absorption.’ Ieee Journal OfQuantum Electronics, 22(8):(1986) pp. 1165–1173.
[117] Matsumoto M and Nishimura T. ‘Mersenne twister: a 623-dimensionallyequidistributed uniform pseudo-random number generator.’ ACM Trans.Model. Comput. Simul., 8(1):(1998) pp. 3–30.
[118] Graham ME, Davis BI, and Keller DV. ‘Immersion Liquids For Ruby Lasers.’Applied Optics, 4(5):(1965) pp. 613–615.
[119] Gaworski CL, Haun CC, Macewen JD, Vernot EH, Bruner RH, Amster RL,and Cowan J M J. ‘A 90-Day Vapor Inhalation Toxicity Study of Decalin.’ Tox-icol. Sci., 5(4):(1985) pp. 785–793. URL http://toxsci.oxfordjournals.org/cgi/content/abstract/5/4/785.
[120] Christophorou L and Hadjiantoniou D. ‘Electron attachment and moleculartoxicity.’ CHEMICAL PHYSICS LETTERS, 419(4-6):(2006) pp. 405–410.
[121] Guch S. ‘Parasitic suppression in large aperture disk lasers employing liquidedge claddings.’ Applied Optics, 15(6):(1976) pp. 1453–1457.
[122] Fan TY, Ripin DJ, Aggarwal RL, Ochoa JR, Chann B, Tilleman M, andSpitzberg J. ‘Cryogenic Yb3+-doped solid-state lasers.’ Ieee Journal OfSelected Topics In Quantum Electronics, 13(3):(2007) pp. 448–459.
[123] Yin HB, Deng PZ, and Gan FX. ‘Defects in YAG : Yb crystals.’ Journal ofApplied Physics, 83(7):(1998) pp. 3825–3828.
226

ASE and Thermal Management on a High Average-Power DPSSL
[124] Barnes N and Walsh BM. ‘Quantum efficiency measurements of Nd:YAG,Yb:YAG, and Tm:YAG.’ In ‘Advanced Solid-State Lasers,’ Optical Soci-ety of America, 2002, p. TuB15. URL http://www.opticsinfobase.org/abstract.cfm?URI=ASSL-2002-TuB15.
[125] Sato Y, Akiyama J, and Taira T. ‘Effects of rare-earth doping on thermalconductivity in Y3Al5O12 crystals.’ Optical Materials, 31(5):(2009) pp. 720–724.
[126] Ashcroft NW and Mermin ND. Festkörperphysik. Oldenbourg, 2001.
[127] Gaume R, Viana B, Vivien D, Roger JP, and Fournier D. ‘A simple model forthe prediction of thermal conductivity in pure and doped insulating crystals.’Applied Physics Letters, 83(7):(2003) pp. 1355–1357.
[128] Yagi H, Yanagitani T, Numazawa T, and Ueda K. ‘The physical propertiesof transparent Y3Al5O12 elastic modulus at high temperature and thermalconductivity at low temperature.’ Ceramics International, 33(5):(2007) pp.711–714.
[129] Kawanaka J. ‘personal communication.’
[130] Aggarwal RL, Ripin DJ, Ochoa JR, and Fan TY. ‘Measurement ofthermo-optic properties of Y3Al5O12, Lu3Al5O12, YAIO(3), LiYF4, LiLuF4,BaY2F8, KGd(WO4)(2), and KY(WO4)(2) laser crystals in the 80-300 Ktemperature range.’ Journal of Applied Physics, 98(10):(2005) p. 103514.
[131] Shannon RD. ‘Revised effective ionic radii and systematic studies of in-teratomic distances in halides and chalcogenides.’ Acta CrystallographicaSection A, 32(5):(1976) pp. 751–767. URL http://dx.doi.org/10.1107/S0567739476001551.
[132] Wieser ME. ‘Atomic weights of the elements 2005.’ JOURNAL OF PHYSI-CAL AND CHEMICAL REFERENCE DATA, 36(2):(2007) pp. 485–496.
[133] Polifke W and J K. Wärmeübertragung. Pearson Education, 2005.
[134] Cousins A. ‘Temperature and thermal stress scaling in finite-length end-pumped laser rods.’ Quantum Electronics, IEEE Journal of, 28(4):(1992)pp. 1057 –1069.
227

Bibliography
[135] Li CY and Garimella SV. ‘Prandtl-number effects and generalized correlationsfor confined and submerged jet impingement.’ International Journal of Heatand Mass Transfer, 44(18):(2001) pp. 3471–3480.
[136] Chang CT, Kojasoy G, and Landis F. ‘Confined Single-jet and Multiple-jet Im-pingement Heat-transfer .1. Turbulent Submerged Liquid Jets.’ InternationalJournal of Heat and Mass Transfer, 38(5):(1995) pp. 833–842.
[137] Garimella SV and Schroeder VP. ‘Local heat transfer distributions in confinedmultiple air jet impingement.’ Journal of Electronic Packaging, 123(3):(2001)pp. 165–172.
[138] Oliphant K, Webb BW, and McQuay MQ. ‘An experimental comparison ofliquid jet array and spray impingement cooling in the non-boiling regime.’Experimental Thermal and Fluid Science, 18(1):(1998) pp. 1–10.
[139] Tawfek AA. ‘Heat transfer studies of the oblique impingement of round jetsupon a curved surface.’ Heat and Mass Transfer, 38(6):(2002) pp. 467–475.
[140] Nye J. Physical Properties of Crystals. Oxford Science Publications, 1985.
[141] Chenais S, Druon F, Forget S, Balembois F, and Georges P. ‘On thermaleffects in solid-state lasers: The case of ytterbium-doped materials.’ ProgressIn Quantum Electronics, 30(4):(2006) pp. 89–153.
[142] Antipov OL, Eremeykin ON, Savikin AP, Vorob’ev VA, Bredikhin DV, andKuznetsov MS. ‘Electronic changes of refractive index in intensively pumpedNd : YAG laser crystals.’ Ieee Journal Of Quantum Electronics, 39(7):(2003)pp. 910–918.
[143] Antipov OL, Bredikhin DV, Eremeykin ON, Savikin AP, Ivakin EV, andSukhadolau AV. ‘Electronic mechanism for refractive-index changes in in-tensively pumped Yb : YAG laser crystals.’ Optics Letters, 31(6):(2006) pp.763–765.
[144] Moncorgé R, Eremeykin O, Doualan J, and Antipov O. ‘Origin ofathermal refractive index changes observed in Yb3+ doped YAG andKGW.’ Optics Communications, 281(9):(2008) pp. 2526–2530. URLhttp://www.sciencedirect.com/science/article/B6TVF-4RNJB23-3/2/583e587f48c3dfd3197baa84701b34a7.
228

ASE and Thermal Management on a High Average-Power DPSSL
[145] Soulard R, Zinoviev A, Doualan JL, Ivakin E, Antipov O, and MoncorgéR. ‘Detailed characterization of pump-induced refractive index changes ob-served in Nd:YVO4, Nd:GdVO4 and Nd:KGW.’ Opt. Express, 18(2):(2010)pp. 1553–1568. URL http://www.opticsexpress.org/abstract.cfm?URI=oe-18-2-1553.
[146] Soulard R, Moncorgé R, Zinoviev A, Petermann K, Antipov O, and BrignonA. ‘Nonlinear spectroscopic properties of Yb3+-doped sesquioxides Lu2O3and Sc2O3.’ Opt. Express, 18(11):(2010) pp. 11173–11180. URL http://www.opticsexpress.org/abstract.cfm?URI=oe-18-11-11173.
[147] Haferkorn H. Optik. Hochschulbücher für Physik. VEB Deutscher Verlag derWissenschaften, 1980.
[148] Patel F. ‘Properties of YbAG and highly doped YbYAG.’ In ‘CLEO,’ 1999.
[149] Krupke WF. ‘Ytterbium solid-state lasers - The first decade.’ Ieee Journal OfSelected Topics In Quantum Electronics, 6(6):(2000) pp. 1287–1296.
[150] Chen Y, Chen B, Patel MKR, and Bass M. ‘Calculation of thermal-gradient-induced stress birefringence in slab Lasers-I.’ IEEE Journal of QuantumElectronics, 40(7):(2004) pp. 909–916.
[151] Shoji I, Taira T, Ikesue A, and Yoshida K. ‘Reduction of the thermal loadby laser oscillation in highly Nd3+-doped ceramic YAG.’ In ‘Advanced Solid-State Photonics (TOPS),’ Optical Society of America, 2004, p. 415. URLhttp://www.opticsinfobase.org/abstract.cfm?URI=ASSP-2004-415.
[152] Khazanov EA. ‘Thermally induced birefringence in Nd:YAG ceramics.’ Opt.Lett., 27(9):(2002) pp. 716–718. URL http://ol.osa.org/abstract.cfm?URI=ol-27-9-716.
[153] Chen Y, Chen B, Patel MKR, Kar A, and Bass M. ‘Calculation of thermal-gradient-induced stress birefringence in slab Lasers-II.’ IEEE Journal ofQuantum Electronics, 40(7):(2004) pp. 917–928.
[154] Clarkson WA, Felgate NS, and Hanna DC. ‘Simple method for reducing thedepolarization loss resulting from thermally induced birefringence in solid-state lasers.’ Opt. Lett., 24(12):(1999) pp. 820–822. URL http://ol.osa.org/abstract.cfm?URI=ol-24-12-820.
229

Bibliography
[155] Kandasamy R, Yamanaka M, Izawa Y, and Nakai S. ‘Analysis of birefringencecompensation using a quarter-wave plate in solid-state lasers.’ Optical Review,7(2):(2000) pp. 149–151.
[156] Fluck R, Hermann MR, and Hackel LA. ‘Birefringence compensation in singlesolid-state rods.’ Applied Physics Letters, 76(12):(2000) pp. 1513–1515. URLhttp://link.aip.org/link/?APL/76/1513/1.
[157] Hernandez-Gomez C, Collier J, and Hawkes S. ‘Vulcan Intensity Increaseby Wavefront Quality Improvement.’ Tech. rep., CLRC Rutherford AppletonLaboratory, 1998.
[158] Ikesue A and Aung YL. ‘Ceramic laser materials.’ Nature Photonics,2(12):(2008) pp. 721–727.
[159] Ikesue A, Aung YL, Taira T, Kamimura T, Yoshida K, and Messing GL.‘Progress in ceramic lasers.’ Annual Review of Materials Research, 36:(2006)pp. 397–429.
[160] Xu XD, Zhao ZW, Wang HH, Song PX, Zhou GQ, Xu J, and Deng PZ.‘Spectroscopic and thermal properties of Cr,Yb : YAG crystal.’ Journal OfCrystal Growth, 262(1-4):(2004) pp. 317–321.
[161] Eilers H, Hommerich U, Jacobsen SM, Yen WM, Hoffman KR, and JiaW. ‘Spectroscopy And Dynamics Of Cr4+ Y3al5o12.’ Physical Review B,49(22):(1994) pp. 15505–15513.
[162] Albach D, Bourdet G, Chanteloup JC, Hollander P, and Vincent B. ‘Dispositiflaser de forte énergie à milieu à gain à gradient de dopage.’, 2008.
[163] Moncorgé R. Current Topics in Rare-earth Lasers. Springer, 2005. URLhttp://dx.doi.org/10.1007/3-540-28209-2_6.
[164] Senatsky Y, Shirakawa A, Sato Y, Hagiwara J, Lu J, Ueda K, Yagi H, andYanagitani TY. ‘Measurements of nonlinear refractive indices in ceramic lasermedia.’ Laser Optics 2003: Solid State Lasers And Nonlinear FrequencyConversion, 5478:(2004) pp. 88–97.
[165] Major A, Aitchison JS, Smith PWE, Druon F, Georges P, Viana B, and AkaGP. ‘Z-scan measurements of the nonlinear refractive indices of novel Yb-doped laser crystal hosts.’ Applied Physics B-Lasers And Optics, 80(2):(2005)pp. 199–201.
230

ASE and Thermal Management on a High Average-Power DPSSL
[166] Sennaroglu A. Solid–State Lasers and Applications. CRC Press, 2007.
[167] Topfer T, Hein J, Philipps J, Ehrt D, and Sauerbrey R. ‘Tailoring the nonlinearrefractive index of fluoride-phosphate glasses for laser applications.’ AppliedPhysics B-lasers and Optics, 71(2):(2000) pp. 203–206.
[168] Haumesser PH, Gaume R, Viana B, and Vivien D. ‘Determination of laserparameters of ytterbium-doped oxide crystalline materials.’ Journal of theOptical Society of America B-optical Physics, 19(10):(2002) pp. 2365–2375.
[169] Lambropoulos JC. ‘Slow Crack Growth during radiative Cooling of LHG8 andBK7 Plates.’ Tech. Rep. 119, LLE, June 2009.
[170] Payne SA, Smith LK, Beach RJ, Chai BHT, Tassano JH, DeLoach LD, KwayWL, Solarz RW, and Krupke WF. ‘Properties of Cr:LiSrAIF6 crystals for laseroperation.’ Appl. Opt., 33(24):(1994) pp. 5526–5536. URL http://ao.osa.org/abstract.cfm?URI=ao-33-24-5526.
231