Emission Spectra of Arc Plasmas
15
American Institute of Aeronautics and Astronautics 092407 1 Emission Spectra of Plasmas Generated by Arcs on Solar Array Surface Boris VAYNER 1 Ohio Aerospace Institute, Cleveland, OH 44142, USA Joel GALOFARO 2 NASA Glenn Research Center, Cleveland, OH 44135, USA High resolution emission spectra of arc plasmas contain valuable information regarding arc sites, plasma parameters, and temporal dynamics of plasma expansion. Particular atomic and molecular lines were measured for trigger arcs on triple junctions and sustained arcs between solar array strings. Spectra were recorded from arcs on several different brands of conventionally designed solar array samples immersed in simulated Low Earth Orbit plasma. The arc sites (cathode materials) were determined for plasmas generated by primary discharges and sustained arcs. Statistical processing of spectral line intensities resulted in calculations of arc plasma electron temperatures and surface densities of some atomic species. I. Introduction Physical mechanisms of differential charging and electrostatic discharges (ESD) on spacecraft surfaces have been investigated for over thirty years [1-3]. ESDs are located on areas of triple junctions (interconnector-coverglass- plasma) and are accompanied by bright flashes of light. To our best knowledge, the first-ever study of correlations between electrical and optical emission properties of ESD on a solar array sample was conducted in Ref. 4. It was shown that both light intensity and arc current temporal behaviors were practically identical, and emissive spectral lines of cathode material (silver) were clearly resolved and measured. ESD on triple junctions has many common features with vacuum arcs such as cold emission of electrons due to the high electric field in the cathode area, arc initiation on a small spot on the cathode surface, and traces of melted cathode material observed on its surface after the arc is extinguished. This commonality between vacuum arcs and ESD on triple junctions was confirmed by measurements of emission spectra of ESDs initiated on surfaces of dummy samples and real solar cells [5]. However, there are essential differences between vacuum arcs and ESD on triple junctions in discharge initiation and development [6]. In particular, emission spectra contain spectral lines that certainly do not belong to the corresponding metal atoms (or ions). This feature was briefly mentioned in Ref. 4, but spectral lines were not identified at that time. Good quality and wide wavelength range (300-750 nm) emission spectra measured in Ref. 5 demonstrated not only narrow metal (Ag) lines but the atomic hydrogen Hα line also. This observation was not discussed in [5]. It is known that the spectra of vacuum arcs consist of cathode metal lines only [7] but adding air into the vacuum chamber (0.1 mTorr) results in the appearance of hydrogen and hydroxyl lines [8]. However, the presence of air could not be considered as an explanation for the observations [5,9] where the nitrogen partial pressure was below 1 μTorr. The main stimulus for a further thorough investigation of arc emission spectra was to understand the important correlations between the electrical and optical properties of these discharges. The presence of dielectrics with specific physical and chemical properties in the area of ESD on triple junctions makes these discharges different from pure vacuum arcs, and if the electrical characteristics of arcs are different, one can expect the emission spectra to be different as well. The expectations were confirmed by measuring the emission spectra of arcs located on solar array sample interconnects, dummy sample electrodes, and in the gap between separate strings in cases of sustained arcs. ___________________________ 1 Senior Scientist, NASA Glenn, MS 302-1, Cleveland, OH 44135, Senior Member of AIAA 2 Physisist, NASA Glenn, MS 302-1, Cleveland, OH 44135 Observations of spectral lines belonging to metal ions confirmed the presence of a flux of energetic electrons emitted by a protrusion on the interconnect surface.
-
Upload
rostovstatemedicaluniversity -
Category
Documents
-
view
0 -
download
0
Transcript of Emission Spectra of Arc Plasmas

American Institute of Aeronautics and Astronautics 092407
1
Emission Spectra of Plasmas Generated by Arcs on Solar
Array Surface
Boris VAYNER1
Ohio Aerospace Institute, Cleveland, OH 44142, USA
Joel GALOFARO2
NASA Glenn Research Center, Cleveland, OH 44135, USA
High resolution emission spectra of arc plasmas contain valuable information regarding arc sites, plasma
parameters, and temporal dynamics of plasma expansion. Particular atomic and molecular lines were
measured for trigger arcs on triple junctions and sustained arcs between solar array strings. Spectra were
recorded from arcs on several different brands of conventionally designed solar array samples immersed in
simulated Low Earth Orbit plasma. The arc sites (cathode materials) were determined for plasmas generated
by primary discharges and sustained arcs. Statistical processing of spectral line intensities resulted in
calculations of arc plasma electron temperatures and surface densities of some atomic species.
I. Introduction
Physical mechanisms of differential charging and electrostatic discharges (ESD) on spacecraft surfaces have been
investigated for over thirty years [1-3]. ESDs are located on areas of triple junctions (interconnector-coverglass-
plasma) and are accompanied by bright flashes of light. To our best knowledge, the first-ever study of correlations
between electrical and optical emission properties of ESD on a solar array sample was conducted in Ref. 4. It was
shown that both light intensity and arc current temporal behaviors were practically identical, and emissive spectral
lines of cathode material (silver) were clearly resolved and measured. ESD on triple junctions has many common
features with vacuum arcs such as cold emission of electrons due to the high electric field in the cathode area, arc
initiation on a small spot on the cathode surface, and traces of melted cathode material observed on its surface after
the arc is extinguished. This commonality between vacuum arcs and ESD on triple junctions was confirmed by
measurements of emission spectra of ESDs initiated on surfaces of dummy samples and real solar cells [5]. However,
there are essential differences between vacuum arcs and ESD on triple junctions in discharge initiation and
development [6]. In particular, emission spectra contain spectral lines that certainly do not belong to the corresponding
metal atoms (or ions). This feature was briefly mentioned in Ref. 4, but spectral lines were not identified at that time.
Good quality and wide wavelength range (300-750 nm) emission spectra measured in Ref. 5 demonstrated not only
narrow metal (Ag) lines but the atomic hydrogen Hα line also. This observation was not discussed in [5]. It is known
that the spectra of vacuum arcs consist of cathode metal lines only [7] but adding air into the vacuum chamber (0.1
mTorr) results in the appearance of hydrogen and hydroxyl lines [8]. However, the presence of air could not be
considered as an explanation for the observations [5,9] where the nitrogen partial pressure was below 1 μTorr.
The main stimulus for a further thorough investigation of arc emission spectra was to understand the important
correlations between the electrical and optical properties of these discharges. The presence of dielectrics with specific
physical and chemical properties in the area of ESD on triple junctions makes these discharges different from pure
vacuum arcs, and if the electrical characteristics of arcs are different, one can expect the emission spectra to be
different as well. The expectations were confirmed by measuring the emission spectra of arcs located on solar array
sample interconnects, dummy sample electrodes, and in the gap between separate strings in cases of sustained arcs.
___________________________ 1Senior Scientist, NASA Glenn, MS 302-1, Cleveland, OH 44135, Senior Member of AIAA 2Physisist, NASA Glenn, MS 302-1, Cleveland, OH 44135
Observations of spectral lines belonging to metal ions confirmed the presence of a flux of energetic electrons emitted
by a protrusion on the interconnect surface.

American Institute of Aeronautics and Astronautics 092407
2
II. Experimental Setup
All experiments were performed in the 2m diameter and 3 m height vertical plasma chamber equipped with four
diffusion pumps. Each pump has a cool trap providing low oil contamination of the chamber volume. Gas pressure
was measured by a standard ion gage, and the residual gas and plasma environment chemical composition was
monitored by a Residual Gas Analyzer (RGA, quadrupole mass spectrometer). Prior to the beginning of measurements
a high vacuum was continuously supported for 72 hours, resulting in a significant drop of water vapor partial pressure
(usually, to 0.3 μTorr). The simulated Low Earth Orbit (LEO) environment (xenon plasma) was generated by one
Kauffman source (hollow metal cylinder with hot tungsten filament and permanent transverse magnetic field) installed
on a horizontal bar that was mounted at a height of 1.6 m above the chamber floor. Thus, the distance between the
upper edge of the sample and the plasma source was 0.9 m. This source generated plasma with the electron number
density ne=(0.7-1.9)106 cm-3 , ion energy Ei=20 eV, and electron temperature Te=1.6-2 eV. The xenon pressure was
monitored by an ion gage and kept steady (65 μTorr) during the test. Plasma parameters were determined by sweeping
one Langmuir probe. After that, this LP was permanently biased to +20 V by a K-237 power supply during the test,
to monitor changes in plasma density. These changes amounted to a factor of two due to a significant decrease in the
filament emission current during 40 hour continuing measurements. Obviously, the decrease of electron number
density did not influence the arc spectra. The sample was mounted vertically at a distance of 90 cm from a quartz
window with a diameter of 20 cm. The emitted radiation entered the spectrometer through a 50 μm vertical slit, and
the spectrum was registered by an intensified CCD camera (PI-Max). The GenII-VUV CCD array employed has a
practically flat efficiency characteristic in the range of 200-350 nm that made simultaneous observations of neutral
metal atomic and ion lines very convenient. Using a grating with 1200 grooves/mm and a 1/4 m spectrometer provided
a spectral resolution of 0.12 nm/pixel, which allowed measuring spectra within the range of ±60 nm around the central
wavelength. Optical system was calibrated with Oriel-6030-34 calibration sources. Additional measurements of
spectra were performed with a high resolution 3/4 m spectrometer and 2400 grooves/mm holographic grating. Spectral
lines of neutral and ionized silver and neutral silicon atoms were registered with the resolution of 0.01 nm/pixel.
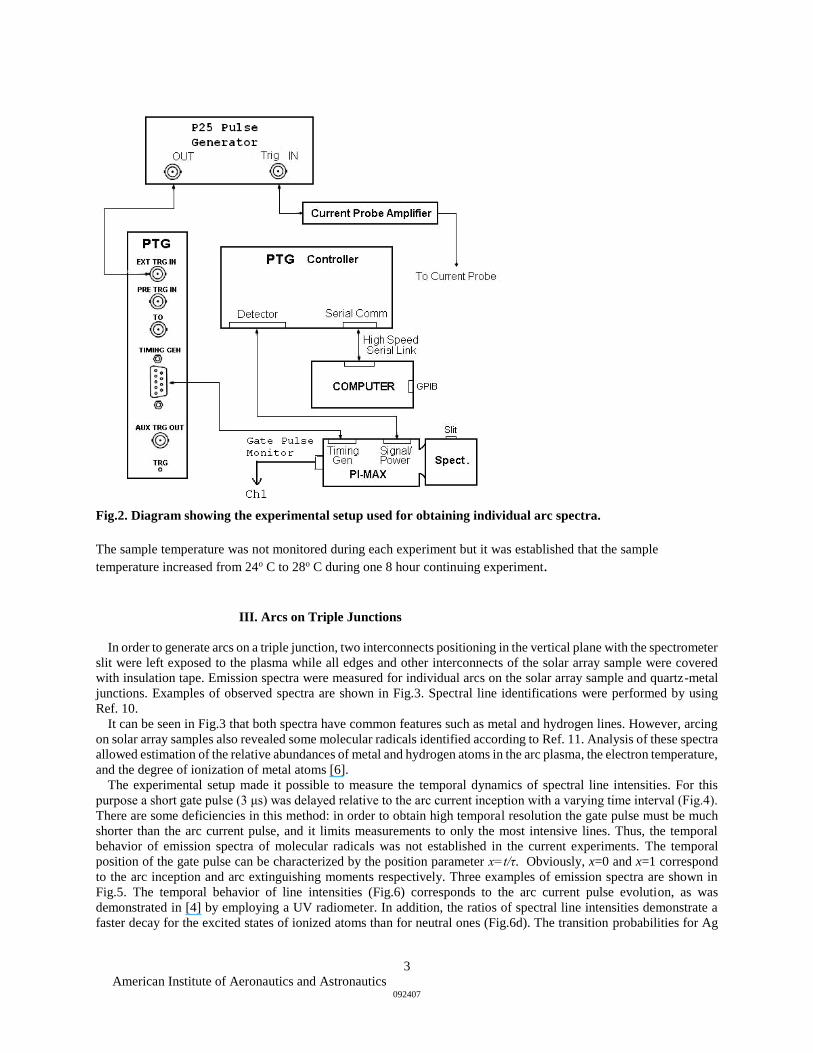
Circuitry diagrams for the measurements of arc parameters and arc spectra are shown in Fig.1 and Fig.2 respectively.
Fig.1. Circuitry diagram for arc parameter measurements (diode 1N4723).
American Institute of Aeronautics and Astronautics 092407
3
Fig.2. Diagram showing the experimental setup used for obtaining individual arc spectra.
The sample temperature was not monitored during each experiment but it was established that the sample
temperature increased from 24o C to 28o C during one 8 hour continuing experiment.
III. Arcs on Triple Junctions
In order to generate arcs on a triple junction, two interconnects positioning in the vertical plane with the spectrometer
slit were left exposed to the plasma while all edges and other interconnects of the solar array sample were covered
with insulation tape. Emission spectra were measured for individual arcs on the solar array sample and quartz-metal
junctions. Examples of observed spectra are shown in Fig.3. Spectral line identifications were performed by using
Ref. 10.
It can be seen in Fig.3 that both spectra have common features such as metal and hydrogen lines. However, arcing
on solar array samples also revealed some molecular radicals identified according to Ref. 11. Analysis of these spectra
allowed estimation of the relative abundances of metal and hydrogen atoms in the arc plasma, the electron temperature,
and the degree of ionization of metal atoms [6].
The experimental setup made it possible to measure the temporal dynamics of spectral line intensities. For this
purpose a short gate pulse (3 μs) was delayed relative to the arc current inception with a varying time interval (Fig.4).
There are some deficiencies in this method: in order to obtain high temporal resolution the gate pulse must be much
shorter than the arc current pulse, and it limits measurements to only the most intensive lines. Thus, the temporal
behavior of emission spectra of molecular radicals was not established in the current experiments. The temporal
position of the gate pulse can be characterized by the position parameter x=t/τ. Obviously, x=0 and x=1 correspond
to the arc inception and arc extinguishing moments respectively. Three examples of emission spectra are shown in
Fig.5. The temporal behavior of line intensities (Fig.6) corresponds to the arc current pulse evolution, as was
demonstrated in [4] by employing a UV radiometer. In addition, the ratios of spectral line intensities demonstrate a
faster decay for the excited states of ionized atoms than for neutral ones (Fig.6d). The transition probabilities for Ag

American Institute of Aeronautics and Astronautics 092407
4
I lines 328 nm and 338 nm are almost equal to each other [12], and the ratio of corresponding line intensities is close
to one during the entire arc pulse width.
a)
b)
Fig.3. Examples of emission spectra of arc plasmas: a) solar array sample (four upper panels); b) quartz-copper
junction (two bottom panels).

American Institute of Aeronautics and Astronautics 092407
5
Fig. 4. Arc current and gate pulses are shown for one particular delay parameter.

American Institute of Aeronautics and Astronautics 092407
6
Fig.5. Examples of emission spectra measured at different stages of the discharge development. Left panel
demonstrates gate pulse temporal position, and right panel shows corresponding spectrum.
a) b)
d)
c)
Fig.6. Temporal behavior of spectral line intensities: a) 328 nm; b) 338 nm; c) 224 nm (Ag II); d) ratios of
spectral line intensities for 25 arcs. Grey lines on plates a), b), and c) demonstrate the best fits to
measured intensities.
Corresponding spectral lines were identified using [13]. Due to the low spectral resolution of the optical system
employed, the observed spectral line at 224 nm was in reality a superposition of two close lines: 224.64 nm
(Aik=3.91·108 s-1) and 224.87 nm (Aik=2.95·108 s-1). The transition probability for the silver atomic line at 328 nm
(5p→5s) is Aik=1.47·108 s-1, which means that the number densities of excited atoms and ions are almost equal during
the middle stage of the discharge development (x=0.4-0.7). The same conclusion is confirmed by comparison of other
ion line intensities with the intensity of the atomic line at 338 nm (Aik=1.35·108 s-1). This particular observation can
be explained within the framework of a model [14] that suggests thermo-dynamical equilibrium in dense expanding
plasma. In this model, the observed charge state distribution reflects “frozen” parameters calculated at the moment
when the reaction rates between species become lower than plasma expansion rate. Calculations demonstrate that for
a silver cathode the electron temperature reached 4 eV and the number densities of neutrals and singly ionized atoms
were practically equal [14, p.977]. However, the calculated degree of ionization (~100%) is not in agreement with
measurements [15,16], and the most important contradiction with the observations is that the ratio of line intensities

American Institute of Aeronautics and Astronautics 092407
7
depend on the instantaneous arc current , i.e. they are not frozen (Fig.6). It is seen in Fig.6 (d) that the ratio of ion
number density to the neutral atom number density reaches its maximum at the moment x=0.4, which corresponds to
the current pulse peak (Fig.5). The temporal behavior of the spectral line intensities can be also explained by the
presence of a flux of non-thermal energetic electrons inside the expanding arc plasma cloud. In reality, the electron
temperature does not exceed 5 eV for arcs with peak currents below 100 A [15, 16]. Some theories [17] predict an
even lower electron temperature - about 1 eV (in agreement with estimates [6]), and a degree of ionization around 10
%. The energy of these thermal electrons is high enough to ionize silver atoms from the atomic level 5s (I1=7.6 eV)
and to excite the neutral atoms to the level 5p from 5s (I2=3.6 eV). This channel of excitation may also be supported
by a charge exchange process. But, all of our observed spectral lines of silver ions belong to ions having 4d95p→s
level configuration. The threshold energy for the ionization from the 4d level is equal to I3=15 eV [18]. Measured
charge state distribution demonstrated the prevalence of doubly ionized silver atoms [14], which demands electron
energies in excess of 20 eV. In order to generate an almost equal number of excited ions and neutrals, the electron
impact ionization rate for the 4d level must be comparable with one for the 5s level, which means that the electron
distribution function has a high energy component (beam) with average energy Εe≥50 eV. Both respective cross
sections are approximately equal to σ =2·10-16 cm2 for this electron energy [18]. Low energy electrons have a shorter
mean free path than energetic electrons because of their slightly (1.3 times) higher cross section but for our crude
estimates one can disregard this difference. Thus, the mean free path is 1
0
nle . The neutral density near the
cathode spot is close to 21
0 10n cm-3 [17], and le≈10-5 cm. Energetic electrons with energies of 50-100 eV emitted
by a cathode spot lose energy due to electron-electron collisions on a much longer spatial scale (Fig.7), and our overall
picture of two constituents in the electron component of the arc plasma seems to be validated.
Fig.7. Mean free path of energetic electrons and Debye length of low temperature electrons vs. electron number
density are shown for different electron energies.
Once excited, an atom (ion) will run an average distance of1 ikiir AVR before emitting a photon and returning to
the ground state. Radial velocities for neutrals and ions may differ from each other, and depend on arc energy and
cathode material, but for an estimate one can adopt a velocity of magnitude Vi=1-10 km/s [19,20], which results in
establishing a radiation shell radius Rir≥5·10-4 cm. The neutral atom number density at this distance from the arc spot
can be found from the tabulated erosion rate for a silver cathode [15]:

American Institute of Aeronautics and Astronautics 092407
8
16
20 102
iiir
irMVR
IRn
cm-3 (1)
where μ=35 μg/C is the erosion rate, I is the arc current, and Mi is the mass of a silver atom.
It follows from Eq.1 that the probability of repeated electron impact excitation of relaxed atom (ion) is very low (~10-
4). Now one can estimate the optical depth for self-absorption in the central wavelength of a spectral line as
RRRRn
cg
gAR
ir
irir
i
k
ik
1112, 2
0
42/3
(2)
where gi,k are the statistical weights of initial and final states tabulated in Ref.12 , and R is radial distance from the
cathode spot.
It is convenient to write optical depths for two representative lines separately:
yRRn irir
1102328
1
0
18
and
1
0
18105224
irir RRzn (3)
The width of the spectral line is due to Doppler broadening, and for the expanding arc plasma it can be estimated as
510
. After substituting numbers for the degree of ionization (z=0.1) and the relative density of excited
neutrals ( 3.0exp 2
eT
Iy ) in the Eq.(3) one can prove that the arc plasma is transparent for these spectral
lines (τ<1). Thus, the temporal dynamics of spectral line intensities (Fig.6) is linearly correlated with the temporal
evolution of the number densities of the species considered. In other words, neutral atoms emit lines at 328 nm and
338 nm until the arc plasma is absolutely extinguished, while the emission of lines from excited ions diminishes
earlier, when the electric field strength decreases due to the discharge of capacitor, and the generation of an energetic
electron flux becomes impossible. One more argument in favor of the presence of an electron beam in the arc plasma
comes from the observation of ion lines emitted by the arc on a copper-quartz junction (Fig. 3b), because the structures
of electron shells for copper and silver atoms are essentially congruent. It is hard to make a more precise conclusion
about the degree of ionization since the emission spectra of the main ionic constituent were not measured. However,
the degree of ionization may decrease faster than the magnitude of the arc current does because of the logarithmic
dependence of plasma conductivity on electron (ion) number density. High resolution spectra confirm the presence of
excited ions in arc plasma (Fig.8). Particularly, the ratio of intensities of two resolved close lines (224 nm) corresponds
to the ratio of transition probabilities, which means that plasma is transparent for these UV photons.

American Institute of Aeronautics and Astronautics 092407
9
a) b)
c)
Fig.8. Emission spectra of neutral (a&b) and ionized (c) silver atoms.
IV. Spectra of Sustained Arcs
Sustained arc spectra were measured and recorded during a special test for the coupon that was provided by
NEC/TOSHIBA. The coupon consisted of twelve pairs (strings) of Triple Junction (TJ) cells mounted on a Kapton
sheet (Fig.9).
Fig.9. Test coupon front view, with indications of the cell pairs where sustained arcs will be initiated.
All exposed triple junction areas were covered by Kapton tape with the exclusion of the gaps between strings.
Approximately one hundred primary arcs were generated in the gap between strings after biasing one string to (400 –
600) V negative and applying a Solar Array Simulator (SAS) voltage between strings. Finally, one sustained arc was
initiated with a SAS voltage of 50 V and a current limit of 2 A (Fig.10).

American Institute of Aeronautics and Astronautics 092407
10
Fig.10. Sustained arc initiated at 50 V and 2 A SAS output parameters.
The same sequence of stepwise-increasing SAS parameters resulted in initiation of sustained arcs between two other
pairs of strings. All discharges were recorded on VCR tape, and one example of these events is shown in Fig.11.
Many optical spectra were recorded during this test with a gate pulse width of 1 ms triggered by the primary arc
current pulse. The time delay between the gate pulse and arc inception moment was varied in the range of 10-50 μs in
order to measure spectra of sustained arcs with and without primary arc contribution. As was expected, emission
spectra of these arcs were absolutely different from those measured for primary arcs on interconnects. This observation
can be explained by different cathode materials: silver for arcs on an interconnect, and semiconductor (Ge, Si, other
elements like Ga, As, ?) for arcs between strings. To illustrate the difference, the emission spectrum of the silver
plasma is shown on the top panel in Fig.12.
Fig.11. Three frames of the video record of SA initiated between strings U3 and U4.

American Institute of Aeronautics and Astronautics 092407
11
a)
b)
c)
Fig. 12. Emission spectra of arc plasma: a) arc on interconnect; b) arc between strings U3-U4; c) temporary
sustained arc (>500 μs). Spectral lines of Ge I (303.9) and Si I (390.6) are identified.

American Institute of Aeronautics and Astronautics 092407
12
It is well known that the strongest emission lines of Si are at 251.6 nm and 288.2 nm [13]. These wavelengths belong
to the range of 220 – 340 nm where emission lines of Ag I and Ag II can be measured simultaneously with the low
resolution spectrometer employed in this experiment. Unfortunately, the intensities of the metal lines (Ag or Ge) were
much higher than the intensities of the Si emission lines, and this fact did not allow resolving the Si lines in the
recorded spectra. However, a significantly weaker Si line was recorded in the range of 340-460 nm because of the
absence of strong metal lines in this range (Fig.13).
Fig. 13. Spectral line of Si I (390.6) was identified (TSA on U3-U4).
When high resolution spectra were measured the most intensive spectral lines of Si I were clearly identified (Fig.14).
Fig.14. High resolution emission spectrum of Si I: lines 250.69, 251.43, 251.61, 251.92, 252.41, and 252.85 nm
are identified. Two other lines on left side may belong to Fe I.

American Institute of Aeronautics and Astronautics 092407
13
A few spectra of arcs on U11-U12 revealed Si I and Ge I emission lines. The atomic shell structure for germanium is
different from one for silver: it is 4s24p2 for neutral atom with ionization potential of 7.9 eV and 4s24p for ion. The
most intensive ion spectral lines (283 nm and 285 nm) are generated by the transition 4s24f→4s4p2, and the transition
probabilities are well below 108 s-1 [21]. Thus, spectral measurements proved conclusively the presence of excited
neutral germanium and silicon atoms in the sustained arc plasma with steady current of 2 A and voltage of about 20
V but these measurements did not provide any information regarding state of ionization and electron temperature. A
few attempts to estimate an electron temperature by measuring C2 emission bands failed due to low sensitivity of a
high-resolution optical system.
The measured intensities of emission lines for different atoms depend on the respective species number densities
and their corresponding transition probabilities. If a discharge on an interconnect and a discharge on a cell edge
generated the same number of excited atoms, the intensities of silver and silicon lines would be close to each other
and about two times lower that the intensity of the germanium line (see Table 1). However, measurements
demonstrated that the silicon lines had much lower intensities than the lines of two other elements. This meant that
there were a small number of excited and evaporated silicon atoms compared to the other species, and the explanation
could be found in thermo-dynamical properties of these elements (Table 2).
Really, the melting temperature and vaporization enthalpy are significantly higher for silicon than for the two other
elements. Thus, the same amount of thermal energy dissipated during the discharge should cause evaporation of a
much smaller number of silicon atoms. The comparison of thermal conductivity scales (Eq.4) for the same time
interval of 20 μs revealed a significantly smaller cathode spot on the germanium cathode than on the silicon and silver
cathodes (last column in Table 2). Actually, the size of cathode surface that was heated due to thermal conductivity
during discharge development can be calculated as
2/1
t
Cl
(4)
where χ is thermal conductivity, ρ is material density, and C is specific heat.
Table 1
Element : Wavelength : Transition prob.
: (nm) : 108 s-1
Ag I 328.1 1.4
Ag I 338.3 1.3
Ge I 303.9 2.8
Si I 251.6 1.7
Si I 288.2 1.9
Table 2
Element Density Sp.heat Melt.Temp. Therm.Cond. Vap.Ent. WorkFunc. Distance
g/cm3 J/g*K K W/m*K kJ/mole eV μm
Ag 10.5 0.23 1235 430 255 4.7 60
Ge 5.32 0.38 1211 60 334 5.0 24
Si 2.33 0.7 1687 150 439 4.5 43
Thus, arc inception voltages on the edges of the Si and TJ cells should be practically equal, but the consequences of
these discharges were expected to be very different. The amount of melted material is a growing function of a discharge
power, and the larger mass of melted germanium would result in a higher probability of a decrease in shunting
resistance and a malfunction of the p-n junction for TJ cells. This finale was confirmed by the special tests [22].
V. Conclusions
American Institute of Aeronautics and Astronautics 092407
14
Measurements of the emission spectra of arc plasmas give us valuable information regarding the role of cathode and
adjacent dielectric materials in discharge inception and development. It was confirmed that the emission spectra of
arc plasmas are essentially different for discharges on a solar array panel and for pure vacuum arcs. In particular, the
presence of a high energy electron flux (beam) in the arc plasma was ascertained by the comparative analysis of ion
and neutral atom emission spectra. The employment of a spectrometer with significantly higher spectral resolution
allowed measurement of weak atomic lines that was crucial for understanding the role of Kapton pyrolysis in
supporting sustained arcs.
Acknowledgments
Authors are thankful to NEDO (Japan) grant for providing some of the test samples.
References
1. Stevens, N.J. “Interactions Between Spacecraft and the Charged-Particle Environment”, Proc.
Spacecraft Charging Technology Conference, NASA CP-2071, 1978, pp.268-294.
2. Ferguson, D.C. “Solar Array Arcing in Plasmas”, NASA CP-3059, 1989, pp. 509-516.
3. Hastings, D.E. “A Review of Plasma Interactions With Spacecraft in Low Earth Orbit”,
Journal of Geophys. Research, Vol.100, No.A8, 1995, pp.14, 457-14, 483.
4. Upschulte, B.L., Marinelli, W.J., Carleton, K.L., Weyl, G., Aifer, E., and. Hastings, D.E.
“Arcing on Negatively Biased Solar Cells in a Plasma Environment”, Journal of
Spacecraft and Rockets, Vol.31, No.3, 1994, pp.493-501.
5. Amorim, E., Levy, L., and Vacquie, S. “Electrostatic discharges on solar arrays:
common characteristics with vacuum arcs”, Journal of Physics D:Appl.Phys., Vol.35., 2002, pp.L21-L23.
6. Vayner, B., Galofaro, J., and Ferguson, D. “Interactions of High-Voltage Solar Arrays
with Their Plasma Environment: Physical Processes”, Journal of Spacecraft and
Rockets, Vol.41, No.6, 2004, pp.1031-1041.
7. Anders, A., and Anders, S. “Emission Spectroscopy of Low-Current Vacuum Arcs”, Journal of Physics
D:Appl.Phys., Vol.24, 1991, pp.1986-1992.
8. Yotsombat, B., Davydov, S., Poolcharuansin, P., Vilaithong T., and Brown, I.G. “Optical Emission Spectra of a
Copper Plasma Produced by a Metal Vapor Vacuum Arc Plasma Source”, Journal of Physics D: Appl. Phys.,
Vol.34, 2001, pp.1928-1932.
9. Vayner, B.V., Galofaro, J.T., Ferguson, D.C., and Degroot, W. “Electrostatic Discharge Inception on a High-
Voltage Solar Array”, AIAA Paper 2002- 0631, Jan. 2002.
10. Wiese, W. L., Smith, M. W., and Glennon, B. M. Atomic transition probabilities; a critical data
compilation ,Washington, U.S. Dept. of Commerce, National Bureau of Standards, 1966.
11. Pearse, R.W.B., and Gaydon, A.G. The Identification of Molecular Spectra, 3rd edition, Chapman&Hall LTD,
London, UK, 1963.
12. www.nist.gov/database/atomicspectra
13. Harrison G.R (ed), Wavelength Tables, The MIT Press, Cambridge, MA, 1969.
14. Anders, A. “Ion state charge distribution of vacuum arc plasmas: The origin of speces”, Phys.Rev., Vol.55, No.1,
1997, pp..969-981.
15.. Boxman, R.L, Sanders, D.M., and Martin P.J (eds), Handbook of Vacuum Science and Technolog”, Noyes
Publications, Park Ridge, New Jersey, USA, 1996.
16.I. Beilis, B.E. Djakov, B. Juttner, and H. Pursch, “Structure and Dynamics of High-Current Arc Cathode Spots in
Vacuum”, Journal of Physics D:Appl.Phys, Vol.30,No 1, 1997, pp.119-130.
17. Mesyats, G.A. “Ectons and Their Role in Plasma Processes”, Plasma Phys.Control Fusion, Vol.47, 2005, pp.
A109-A151.
18. Bartlett, P.L., and.Stelbovics, A.T “Calculation of electron-impact total-ionization cross sections”, Phys. Rev. A,
Vol.66, No.1, 2002, pp.1-10.
19..Yu. G, Yushkov, Anders, A., Oks, E.M., and Brown, I.G. “Ion velocities in vacuum arc plasmas”, Journal of
Applied Physics, Vol.88, No.10, 2000, pp.5618-5622.
20. Chapelle, P., Bellot, J.P., Duval, H., Jardy, A., and Ablitzer, D. “Modelling of plasma generation and expansion
in a vacuum arc”, Journal of Physics D: Appl.Phys., Vol.35, No.1, 2002, pp137-150.
21. http://physics.nist.gov/PhysRefData/Handbook/Tables/silvertable3.htm

American Institute of Aeronautics and Astronautics 092407
15
22. Vayner, B., and Vayner, L. “Electrostatic Discharges on Triple Junction Solar Cells in Simulated LEO
Environment”, 10th Spacecraft Charging Technology Conference, Biarritz, France, June 2007.