Shock wave propagation and dispersion in glow discharge plasmas
13
Shock wave propagation and dispersion in glow discharge plasmas Sergey O. Macheret, a) Yuri Z. Ionikh, b) Naira V. Chernysheva, b) Azer P. Yalin, Luigi Martinelli, and Richard B. Miles Department of Mechanical and Aerospace Engineering, Princeton University, D-414 Engineering Quadrangle, Princeton, New Jersey 08544 ~Received 2 August 2000; accepted 6 June 2001! Spark-generated shock waves were studied in glow discharges in argon and argon–nitrogen mixtures. Ultraviolet filtered Rayleigh scattering was used to measure radial profiles of gas temperature, and the laser schlieren method was used to measure shock arrival times and axial density gradients. Time accurate, inviscid, axisymmetric fluid dynamics computations were run and results compared with the experiments. Our simulation show that changes in shock structure and velocity in weakly ionized gases are explained by classical gas dynamics, with the critical role of thermal and multi-dimensional effects ~transverse gradients, shock curvature, etc.!. A direct proof of the thermal mechanism was obtained by pulsing the discharge. With a sub-millisecond delay between starting the discharge and shock launch, plasma parameters reach their steady-state values, but the temperature is still low, laser schlieren signals are virtually identical to those without the discharge, differing dramatically from the signals in discharges with fully established temperature profiles. © 2001 American Institute of Physics. @DOI: 10.1063/1.1388204# I. INTRODUCTION Weakly ionized gases ~plasmas! could potentially have an impact on high-speed aerodynamics. Using plasmas for shock wave control, drag reduction, vehicle steering, sonic boom attenuation, ignition of combustion in engines, and magnetohydrodynamic ~MHD! power extraction and en- thalpy by-pass is being actively discussed. Of course, funda- mental issues have to be resolved prior to any practical ap- plications. The propagation of shock waves in weakly ionized plas- mas was studied in Russia, 1–11,15,16 and, later, in the U.S. 12–14 Shock acceleration, broadening, and ‘‘splitting’’ was ob- served in various direct current ~dc!, radio frequency ~RF!, and pulsed discharges, in inert as well as molecular gases. Some researchers 1–14 attributed experimental observations to various plasma-specific phenomena, from electric double layers to ion-acoustic waves to new long-range interactions or microscopic structure formed in gas discharges. However, other Russian researchers 15,16 found that their data can be adequately explained by conventional thermal phenomena. Gas heating, temperature inhomogeneity, and vibrational re- laxation were theoretically shown to result in ‘‘anomalous’’ behavior of shocks in gas discharges. 17–19 In Refs. 20 and 21, analysis of various physical mecha- nisms resulted in a conclusion that the ‘‘broadening,’’‘‘split- ting,’’ and acceleration of shocks in gas discharges could hardly be explained by plasma-specific effects. This is due ultimately to the very low ionization fraction in the dis- charges, which leads to a small fraction of the total gas en- ergy stored in ionized and excited states, to very inefficient energy and momentum transfer from electrons and ions to the bulk neutral gas, and to very long times of these transfer processes. In 1997, two research groups simultaneously and inde- pendently showed, based on inviscid computational fluid dy- namics ~CFD! modeling, 22,23 that transverse and longitudinal temperature and density gradients present in gas discharges due to Joule heating can be responsible for the observed ‘‘anomalous’’ shock profiles. The inviscid modeling of Ref. 22, extended in Ref. 24, emphasized that transverse gradients result in the multi-dimensional nature of shock propagation, and that attempts to interpret the phenomena in one- dimensional terms can be misleading. For example, shock curvature could be misinterpreted as a ‘‘broadened’’ or ‘‘split’’ one-dimensional ~1D! structure. The inviscid results were confirmed in Navier–Stokes computations. 25 Addition- ally, as demonstrated in Ref. 25, in the case of very weak shocks ~with a Mach number very close to 1! or very long propagation distances ~many meters! wall shear could also result in an apparent ‘‘splitting’’ of laser schlieren signals even in a cold gas. In the present paper, we describe a combined experimen- tal and computational effort to clarify mechanisms of shock propagation in weakly ionized plasmas. Experiments were done in a well-characterized positive column of glow dis- charge in Ar and Ar–N 2 mixtures. Shock velocity and struc- ture was measured using the laser schlieren method, similar to experiments of Refs. 12–14. Since the temperature and its gradients could play a critical role in shock propagation, ra- dial temperature profiles in our experiments were measured with filtered Rayleigh scattering. Axisymmetric CFD model- ing gives a very good agreement with experimental data, thus proving that it is classical, but multi-dimensional, gas dynamics that can account for the ‘‘anomalous’’ effects. a! Author to whom correspondence should be addressed. Electronic mail: [email protected] b! Permanent address: Institute of Physics, St.-Petersburg State University, St.-Petersburg, Russia. PHYSICS OF FLUIDS VOLUME 13, NUMBER 9 SEPTEMBER 2001 2693 1070-6631/2001/13(9)/2693/13/$18.00 © 2001 American Institute of Physics Downloaded 17 Sep 2001 to 128.112.32.240. Redistribution subject to AIP license or copyright, see http://ojps.aip.org/phf/phfcr.jsp
-
Upload
independent -
Category
Documents
-
view
0 -
download
0
Transcript of Shock wave propagation and dispersion in glow discharge plasmas
PHYSICS OF FLUIDS VOLUME 13, NUMBER 9 SEPTEMBER 2001
Shock wave propagation and dispersion in glow discharge plasmasSergey O. Macheret,a) Yuri Z. Ionikh,b) Naira V. Chernysheva,b) Azer P. Yalin,Luigi Martinelli, and Richard B. MilesDepartment of Mechanical and Aerospace Engineering, Princeton University,D-414 Engineering Quadrangle, Princeton, New Jersey 08544
~Received 2 August 2000; accepted 6 June 2001!
Spark-generated shock waves were studied in glow discharges in argon and argon–nitrogenmixtures. Ultraviolet filtered Rayleigh scattering was used to measure radial profiles of gastemperature, and the laser schlieren method was used to measure shock arrival times and axialdensity gradients. Time accurate, inviscid, axisymmetric fluid dynamics computations were run andresults compared with the experiments. Our simulation show that changes in shock structure andvelocity in weakly ionized gases are explained by classical gas dynamics, with the critical role ofthermal and multi-dimensional effects~transverse gradients, shock curvature, etc.!. A direct proof ofthe thermal mechanism was obtained by pulsing the discharge. With a sub-millisecond delaybetween starting the discharge and shock launch, plasma parameters reach their steady-state values,but the temperature is still low, laser schlieren signals are virtually identical to those without thedischarge, differing dramatically from the signals in discharges with fully established temperatureprofiles. © 2001 American Institute of Physics.@DOI: 10.1063/1.1388204#
fnn-da
as
b-
setobonveen
l rs’
hait-uu-een
tosfer
de-dy-lrges
rvedf.ientson,ne-ockor
ak
ls
en-ckereis--ilar
d itsra-redl-ta,as
ma
rs
I. INTRODUCTION
Weakly ionized gases~plasmas! could potentially havean impact on high-speed aerodynamics. Using plasmasshock wave control, drag reduction, vehicle steering, soboom attenuation, ignition of combustion in engines, amagnetohydrodynamic~MHD! power extraction and enthalpy by-pass is being actively discussed. Of course, funmental issues have to be resolved prior to any practicalplications.
The propagation of shock waves in weakly ionized plmas was studied in Russia,1–11,15,16and, later, in the U.S.12–14
Shock acceleration, broadening, and ‘‘splitting’’ was oserved in various direct current~dc!, radio frequency~RF!,and pulsed discharges, in inert as well as molecular gaSome researchers1–14 attributed experimental observationsvarious plasma-specific phenomena, from electric doulayers to ion-acoustic waves to new long-range interactior microscopic structure formed in gas discharges. Howeother Russian researchers15,16 found that their data can badequately explained by conventional thermal phenomeGas heating, temperature inhomogeneity, and vibrationalaxation were theoretically shown to result in ‘‘anomaloubehavior of shocks in gas discharges.17–19
In Refs. 20 and 21, analysis of various physical mecnisms resulted in a conclusion that the ‘‘broadening,’’ ‘‘splting,’’ and acceleration of shocks in gas discharges cohardly be explained by plasma-specific effects. This is dultimately to the very low ionization fraction in the discharges, which leads to a small fraction of the total gasergy stored in ionized and excited states, to very ineffici
a!Author to whom correspondence should be addressed. [email protected]
b!Permanent address: Institute of Physics, St.-Petersburg State UniveSt.-Petersburg, Russia.
2691070-6631/2001/13(9)/2693/13/$18.00
Downloaded 17 Sep 2001 to 128.112.32.240. Redistribution subject to
oricd
a-p-
-
s.
lesr,
a.e-’
-
lde
n-t
energy and momentum transfer from electrons and ionsthe bulk neutral gas, and to very long times of these tranprocesses.
In 1997, two research groups simultaneously and inpendently showed, based on inviscid computational fluidnamics~CFD! modeling,22,23 that transverse and longitudinatemperature and density gradients present in gas dischadue to Joule heating can be responsible for the obse‘‘anomalous’’ shock profiles. The inviscid modeling of Re22, extended in Ref. 24, emphasized that transverse gradresult in the multi-dimensional nature of shock propagatiand that attempts to interpret the phenomena in odimensional terms can be misleading. For example, shcurvature could be misinterpreted as a ‘‘broadened’’‘‘split’’ one-dimensional~1D! structure. The inviscid resultswere confirmed in Navier–Stokes computations.25 Addition-ally, as demonstrated in Ref. 25, in the case of very weshocks~with a Mach number very close to 1! or very longpropagation distances~many meters! wall shear could alsoresult in an apparent ‘‘splitting’’ of laser schlieren signaeven in a cold gas.
In the present paper, we describe a combined experimtal and computational effort to clarify mechanisms of shopropagation in weakly ionized plasmas. Experiments wdone in a well-characterized positive column of glow dcharge in Ar and Ar–N2 mixtures. Shock velocity and structure was measured using the laser schlieren method, simto experiments of Refs. 12–14. Since the temperature angradients could play a critical role in shock propagation,dial temperature profiles in our experiments were measuwith filtered Rayleigh scattering. Axisymmetric CFD modeing gives a very good agreement with experimental dathus proving that it is classical, but multi-dimensional, gdynamics that can account for the ‘‘anomalous’’ effects.
il:
ity,
3 © 2001 American Institute of Physics
AIP license or copyright, see http://ojps.aip.org/phf/phfcr.jsp

edntpen
ieowfudrc-a
s
ebrgenmtho
xionuothr
cmfo
e
lon
re
re-
ts
wefterctedrgetherenby
hiser-
r-
ege
all
gas300theforles
he
we
d
ngis-pre-teh ahe-ayso,rp-thelightrlyt is
byol-
ag
2694 Phys. Fluids, Vol. 13, No. 9, September 2001 Macheret et al.
In order to study shock propagation in weakly ionizplasma with very small or absent temperature gradiepulsed discharge experiments were carried out. Those exments prove again the thermal nature of shock propagatiogas discharges.
II. EXPERIMENTS ON SHOCK PROPAGATION INSTEADY-STATE GLOW DISCHARGES
A. Experimental setup and procedures
The experimental setup at Princeton University26,27 isbasically similar to that of Refs. 12–14. The plasmas studwere created by a longitudinal continuous or pulsed gldischarge. The discharge tube, 3.8 cm i.d. and 120 cmlength, was made of quartz. Shock waves were generatea spark discharge at the one end of the tube. The spark ciparameters are capacitor 0.2mF, voltage 15–20 kV. The capacitor discharge was controlled by a triggering spark gThe shock wave entered the discharge through a narrow~2mm wide and 0.1 mm thick! ring electrode made of stainlessteel foil mounted adjacent to~almost flush with! the wall.The electrode nearest to the spark was always the anodorder to prevent the incoming shock wave from passingthe hot cathode and through the cathode fall of the dischaThe cathode in all pulse and most steady-state experimwas identical in size and material to the anode. In soexperimental runs, where shock profiles deep insideplasma, far from the cathode, were studied, another cathwas used: a 25 mm diameter hollow cylinder with the aperpendicular to the tube axis. This cathode was usedwhen it was far enough downstream of the shock and conot affect shock propagation. Both the cathode and ancould be placed at different locations in the tube, so thatdistance between the spark and the anode could be 20 ocm, and the length of discharge could be 20, 40, or 60The flexibility in changing the discharge length was usedmeasuring the electric field in the plasma~see below!.
Similarly to Refs. 12–14, we used a laser schliermethod28 for detecting the shock wave front~Fig. 1!. AHe–Ne laser beam crossed the discharge horizontally athe diameter and was then focused onto the plane of a kby a lens~f550 cm!. The beam 1/e diameter was about 0.3mm. A photodiode with a response time of 20 ns measu
FIG. 1. Schematic of the experimental setup for studies of shock proption in glow discharges.
Downloaded 17 Sep 2001 to 128.112.32.240. Redistribution subject to
s,ri-in
d
llbyuit
p.
, inye.tseedeslylddee40.
r
n
ngife
d
the light intensity after the knife edge. The signal wascorded by a digital oscilloscope with 1 kV resistor at theinput, and a time resolution'0.1 ms. In some measuremena miniature pressure sensor was also used.
To measure the instantaneous shock wave velocityused an approach similar to that proposed in Ref. 29. Athe laser beam crossed the discharge it was retro-reflefrom a small 90° prism and passed through the dischaonce more with the spatial offset and then focused ontoknife edge. This produced two closely separated schliesignals of opposite signs. Shock wave velocity was founddividing the distance between the two beam passages~12 to21 mm! by the time gap between the schlieren signals. Tmethod provided an accuracy of absolute velocity near 3 pcent ~'10 m/s! and that of relative velocity about 0.5 pecent ~2 m/s!.
Experiments were performed in an Ar–N2 mixture ~1%of N2!. The addition of nitrogen substantially improved thradial uniformity of the discharge. A pure argon discharcontracted at currentsi.30–40 mA ~for pressuresp>30Torr!. With nitrogen the discharge was not contracted atconditions studied~p<100 Torr, i<100 mA!. To preventelectrophoresis and the accumulation of impurities, themixture was pumped through the discharge with a rate ofsccm, which corresponded to 5–10 cm/s linear speed intube. Control measurements with the gas flow turned offa short time gave shock velocities and schlieren profiidentical to those with the flow on.
As was already mentioned, the flexibility in changing tdischarge length allowed us to measure an electric fieldE ina positive column of the discharge~cathode voltage dropVc
could also be found in these measurements!. For p530–50Torr, i530–100 mA theE value was from 8 to 14 V/cm.Assuming a Bessel radial profile for gas temperature,calculated the reduced electric fieldE/N ~N is the gas numberdensity! and electron number densityne . Averaged over thetube cross section, these values areE/N51.2–1.4 Td,ne
5(1.2– 4)31010 cm23 for the condition range mentioneabove.
B. Measurements of temperature profiles
We have used ultraviolet filtered Rayleigh scatteri~UV FRS!30,31 to measure temperature profiles of the dcharges studied. A summary of these measurements issented here. A narrow linewidth laser is used to illuminathe sample gas and the scattered light is imaged througnarrow band absorption filter onto a detector, as shown scmatically in Fig. 2. The laser should be tunable so that it mbe tuned within an absorption notch, and narrow linewidththat the elastic background~due to windows, particulatesetc.! is narrow compared to the spectral width of an absotion notch. The amount of scattered light measured bydetector depends on the spectral overlap of the scatteredand the filter absorption profile. The filter offers very nea100% transmission outside of the absorption notches, yeextremely optically thick~suppression modeled as 105 andhigher! within the absorption notches. The light scatteredthe atoms and/or molecules in the flow is thermally and c
a-
AIP license or copyright, see http://ojps.aip.org/phf/phfcr.jsp

or
2695Phys. Fluids, Vol. 13, No. 9, September 2001 Shock wave propagation and dispersion
FIG. 2. Schematic diagram of experimental setup fUV FRS measurements of temperature profiles.
arlact-nn
enothth
es
s.eue
p
alte
o
porthise tog-ionca-nalm-af-oth. The
y aithise-ndRS
.
reve rge
lisionally broadened, and is therefore spectrally wider ththe laser and background. When the laser is tuned to ovean absorption notch, the filter serves to suppress the bground while transmitting a large fraction of the light scatered from the flow. By an appropriate selection of filter coditions, and laser frequency, one may obtain very strobackground suppression~greater than 105! while transmittingclose to half the scattered light.
Depending on the conditions of a specific measuremslightly different approaches may be used. In cases of cstant~known! pressure we use a method which precludesneed for background subtraction. The approach is to ratioFRS signal at a temperature to be measured,TM , to thesignal at a known temperature,Tref . Both measurements artaken at the same frequency within an absorption notchthat any background is strongly suppressed in both caseconstant pressure there is a one-to-one correspondenctemperature and density so that the measured ratio uniqdefines the unknown temperatureTM . The signal ratio isprimarily determined by the density ratio, with a smaller oposing contribution from lineshape effects.
Modeling results for the present measurementsshown in Figs. 3 and 4. Figure 3 shows the modeled fitransmission profile and FRS signal levels as functions
FIG. 3. Modeled FRS signal levels for argon at a range of temperatuMercury has several absorption notches in the 253.7 nm vicinity, howeFig. 3 shows the experimentally used~high-frequency! notch.
Downloaded 17 Sep 2001 to 128.112.32.240. Redistribution subject to
napk-
-g
t,n-ee
oAtofly
-
rerf
frequency. The filter has a length of 5 cm, a mercury vapressure of 0.0030 Torr, and a temperature of 315 K. Inspectral region, mercury has six absorption notches duhyperfine splitting and different isotopic contributions. Fiure 3 is a closer view of the highest frequency absorptnotch—the one used in the current work. The nominal lotion of the lines is at 253.7 nm. The modeled FRS siglevels are for a scatterer of 50 Torr of argon at various teperatures. The Rayleigh scattering cross-section is notfected by the weak ionization and so the curves describe bargon gases and the plasmas used in these experimentssignals are normalized to 300 K~by the ideal gas law! so thattheir relative magnitude scales as would be measured bdetector. In the absence of the filter the signal is linear wdensity~or 1/T!, while within the absorption features therealso a weaker effect from the variation of a scattering linwidth with temperature. From such modeling one may fithe relationship between the experimentally measured Fsignal ratio,
Ratio5FRS signal~T5TM !/FRS signal~T5Tref!,
and the unknown temperatureTM . Figure 4 is such a curveIn this case the unknown temperature,TM , corresponds to
s.r,FIG. 4. Look-up graph used to convert signal ratio found with dischaON/OFF to plasma temperature.
AIP license or copyright, see http://ojps.aip.org/phf/phfcr.jsp

d
i-e
2696 Phys. Fluids, Vol. 13, No. 9, September 2001 Macheret et al.
FIG. 5. Radial temperature profile inan Ar glow discharge tube measureby UV filtered Rayleigh scattering.Pressure and electric current are indcated on the plot. Fitting curve—seEq. ~1!.
rain
rle
livates
rr
ndthisms
tuereifiotehtroheigliearekere
dein
rd
mo-Twoargelesis-
a ases-nt.d,e
nres
40ee-h
e,
tedulti-inals
sonet-tric
the ‘‘plasma on’’ temperature while the reference tempeture, Tref , corresponds to the ‘‘plasma off’’ temperature—this caseTref5308 K.
The experimental configuration for FRS temperatumeasurements is illustrated in Fig. 2. A high power, tunabnarrow linewidth titanium sapphire laser32 was used as theexcitation source. The frequency-tripled output was deered to the plasma tube through several anti-reflection cobeam-shaping optics. For these experiments pulse energi;10 mJ in the ultraviolet~254 nm! were used. The beampassed through a quarter-wave plate to ensure the coorientation of the linearly polarized beam, and throughhalf-wave plate to correct for the slight elliptical polarizatiointroduced at the tube windows. Several irises were usereduce stray light carried with a beam. A long focal lenglens~;90 cm! was used to weakly focus the beam to a waof ;200 microns at the sample volume. The sample voluwas within the discharge tube and was defined by the labeam waist and an iris located between the dischargeand imaging lens~f#52.4!. The geometry was such that thsample volume had a length of about 1 mm. The scattelight was collected at a scattering angle of 90 degrees wthe imaging lens and imaged through the mercury vaporter. The filter had length 5 cm and had two temperature ctrollers yielding a vapor pressure of 0.003 Torr, and a filtemperature of 315 K. After the mercury filter, the ligpassed through a monochromator, which acted as a bpassband filter, while rejecting plasma luminosity and otcolors of light from the laser. Finally, the scattered light snal was collected with a Hamamatsu R960 photomultiptube. After propagation through the discharge tube a quflat was used to pick off a fraction of the beam for pownormalization as well as a frequency reference. The picoff beam illuminated a diffuser, and the elastically scattelight was detected through a second mercury filter~fre-quency reference!, as well as measured by a photodio~power reference!. The latter two measurements used thfilm interference filters~CORION G25-254-F! for spectral
Downloaded 17 Sep 2001 to 128.112.32.240. Redistribution subject to
-
e,
-edof
ecta
to
teerbe
dthl-n-r
adr
-rtzrdd
filtering. The three signals were collected with a StanfoResearch System boxcar onto a computer.
In plasma temperature profile measurements, a thercouple was used to the measure the wall temperature.1-D translation stages were used to translate the dischtube horizontally relative to the laser beam. Radial profialong the horizontal axis were found by translating the dcharge tube. Profiles were obtained in the argon plasmwell as the argon plus 1% nitrogen mixture, both at a prsure of 50 Torr, at several different values of electric curre
For the range of experimental conditions studiep530–50 Torr, i530–100 mA, the steady-state centerlintemperature range was found to be from 440630 K to830670 K. Figure 5 shows the experimental profile of aargon plasma at pressure 50 Torr and current 20 mA. Figu6 and 7 are experimental profiles of an argon11% nitrogenmixture at a pressure of 50 Torr, and currents of 10 andmA, respectively. The experimental points are in good agrment with computation.31 We have plotted them here witfitted Gaussian curves:
T~r !
Tw5
Tc
TwexpF2 ln
Tc
Tw•~r /R!2G , ~1!
where Tc and Tw are the centerline and wall temperaturrespectively;r is the radial variable; andR is the tube radius.
III. RESULTS OF SHOCK PROPAGATION STUDIES INSTEADY-STATE DISCHARGES AND COMPARISONWITH CFD AXISYMMETRIC MODELING
In our earlier work,22,24 we performed a 2-D inviscidmodeling of shock propagation through a discharge-heagas and concluded that transverse gradient and mdimensionality play a crucial role in shock propagationglow discharges, and that multi-peak laser schlieren signare simply due to the shock curvature. For better compariwith experiments, in this work we developed an axisymmric version of our code. The code solves the axisymme
AIP license or copyright, see http://ojps.aip.org/phf/phfcr.jsp

r-
2697Phys. Fluids, Vol. 13, No. 9, September 2001 Shock wave propagation and dispersion
FIG. 6. Radial temperature profile inan Ar11%N2 glow discharge tubemeasured by UV filtered Rayleighscattering. Pressure and electric curent are indicated on the plot. Fittingcurve—see Eq.~1!.
ecasstoah
e-he-
mseisfocth
f
s sor a
a-ullTheon-
icalallargeharpthe
asnas
the
conservative form of the Euler equations on unstructurtriangular, adaptive meshes. The flux balance and shockturing were carried out by extending the Bhatnagar–GroKrook ~BGK! solver developed and validated in Ref. 33axisymmetric problems. The grid adaption technique widentical to the one used for the two-dimensional code. T‘‘driven’’ gas was initially at rest, and a shock wave of prscribed strength separated initially the ‘‘driven’’ gas from t‘‘driver.’’ The state of the ‘‘driver’’ gas was specified according to the Rankine–Hugoniot conditions.
The subsequent development of the flow field was coputed by solving time-dependent Euler equations in convation form. Thus, no additional care was required to satthe Rankine–Hugoniot conditions, and the correct shpropagation and jump conditions across shocks and odiscontinuities were captured by the solution.
As found in the earlier work,24 to model shock structureon a 10 microsecond time scale, simple computations o‘‘piston-driven,’’ or ‘‘step’’ shock would suffice. This is due
Downloaded 17 Sep 2001 to 128.112.32.240. Redistribution subject to
d,p-–
se
-r-yker
a
to the fact that the initial spark-generated shock broadenmuch in its 20–40 cm path to the discharge entrance omeasurement point that on the 5 mm distance~or 10ms timeinterval! from the shock front the shock is very close to‘‘step’’ shock.24 This simplification, while being quite accurate, saved us from running extremely CPU-intensive fcomputations of the spark-generated pulse shocks.plasma region between the infinitely thin electrodes was csidered uniform along the tube axis~x!, and to have a sym-metric radial temperature profile described by the analytfit ~1! to the experimentally measured profile. Both the wtemperature and the gas temperature outside the dischwere set equal to room temperature. Thus, there was a sthermal diaphragm between the cold and hot regions. Inabsence of diffusion~both physical and numerical! this dia-phragm will remain fixed with respect to a quiescent guntil the incident shock impinges upon it. The initial positioof the incident shock in the calculations reported here wone tube radius to the left from the boundary between
r-
FIG. 7. Radial temperature profile inan Ar11%N2 glow discharge tubemeasured by UV filtered Rayleighscattering. Pressure and electric curent are indicated on the plot. Fittingcurve—see Eq.~1!.
AIP license or copyright, see http://ojps.aip.org/phf/phfcr.jsp

fciooth
-
ssm-de-ff.ineri-
omtedtheis
ant.he
re-ltedrge
y.ren
ge-ur-.ent0.are
a
ece
2698 Phys. Fluids, Vol. 13, No. 9, September 2001 Macheret et al.
cold and the discharge-heated gases. Mach numbers oincident shock were selected so as to give the shock veloin the uniform room-temperature gas at a given locatclose to that measured experimentally with the discharge
For comparison with laser schlieren measurements,density gradient integrated in thex direction across the nar
FIG. 8. Calibration of the ‘‘laser beam width’’ for CFD modeling againstlaser schlieren signal with the discharge off. Note: experimental timet wasmeasured from the moment of spark firing, while the computational timtwas counted from the moment when the shock was located at a distanone tube radius to the left of the discharge.
Downloaded 17 Sep 2001 to 128.112.32.240. Redistribution subject to
theitynff.e
row ‘‘laser beam’’ and averaged in the radial direction acrothe tube was computed. The ‘‘laser beam’’ width in the coputations was adjusted once to match the experimentallytermined width of the schlieren signal with the discharge oThe result of this calibration is shown in Fig. 8. As seenthe figure, computations reproduce the shape of the expmental peak very well.
Note that in the experiments time was measured frthe moment of spark firing, while the computations starwith the shock located at a distance of one tube radius toleft of the discharge region. Thus, computational timeshifted with respect to the experimental one by a constThis is reflected in Figs. 8–11. For example, in Fig. 9, texperimental signals are plotted versus~t2700 ms!, wheretis the time from the spark firing, and the computationalsults are plotted against (t2420 ms), with the computationatime t counted from the moment when the shock was locaat a distance of one tube radius to the left of the discharegion. The constant shift oft obviously does not affect dif-ferential measurements or computations of shock velocit
Figures 9–11 show measured and computed schliesignals in pure argon~Fig. 9! and Ar11%N2 ~Figs. 10 and11!. In each figure, upper plots correspond to the discharoff case, while lower plots correspond to the discharge crent of 20 mA~Fig. 9!, and 10 and 40 mA in Figs. 10 and 11Figures 10 and 11 differ in that the schlieren measurempoint in Fig. 11 is about 11 cm downstream of that in Fig. 1Measured and computed velocities of shock wavesshown near all the signals in Figs. 9–11.
of
dr--fmdisd---
ss
FIG. 9. Experimentally measured ansimulated laser schlieren signals foshocks propagating in a glow discharge in pure Ar at 50 Torr. The discharge current is 20 mA. The first othe two laser beams is located 18 cfrom the entrance to the discharge, anthe spacing between the two beams3.6 cm. The experimentally measureand computed shock velocities are indicated in the figure. Note: experimental time t was measured from the moment of spark firing, while thecomputational time t was countedfrom the moment when the shock walocated at a distance of one tube radiuto the left of the discharge.
AIP license or copyright, see http://ojps.aip.org/phf/phfcr.jsp

ls-
Ar-c-.
d-lt
aft
2699Phys. Fluids, Vol. 13, No. 9, September 2001 Shock wave propagation and dispersion
FIG. 10. Experimentally measuredand simulated laser schlieren signafor shocks propagating in a glow discharge in Ar11%N2 at 50 Torr. Thedischarge current values are 10 mand 40 mA. The first of the two lasebeams is located 9 cm from the entrance to the discharge, and the spaing between the two beams is 2.1 cmThe experimentally measured ancomputed shock velocities are indicated in the figure. Note: experimentatime t was measured from the momenof spark firing, while the computa-tional timet was counted from the mo-ment when the shock was located atdistance of one tube radius to the leof the discharge.
uwo, tthm
ntu
ar
hhaemei
tiogt
uo
re-xis
m-lent,ndverytednaleri-is
-ea-
ntal
idrd-0
-
As seen in the figures, agreement between the comptions and experiments, in both shock velocities and the tpeak signal shapes, is excellent. As discussed in Ref. 24two-peak structure of the laser schlieren signals is due tocurvature of the shock front in a region with transverse teperature gradient. This is illustrated in Figs. 12~a!–12~d!,where lines of constant density are shown in four momeof time, as the shock propagated from the room-temperagas into the plasma. Note that flow perturbations upstreamthe moving shock, such as the distortion of the boundbetween hot and cold regions seen in Figs. 12~c! and 12~d!,do not affect shock propagation. The first peak in tschlieren signal comes from the portion of the shock tpropagates through the hot centerline region. The high tperature and low density in this region result in both highshock speed and lower intensity of the peak compared wthose corresponding to colder near-wall regions. The porof the shock moving through the cold near-wall region labehind and produces a strong peak in the signal due tohigh density near the wall.@Note that in Fig. 12~d!, a well-resolved Mach stem is discernible near the wall.# The de-crease in the schlieren signal following the first peak is dto the curvature of the shock. Indeed, the signal is prop
Downloaded 17 Sep 2001 to 128.112.32.240. Redistribution subject to
ta--
hee-
tsreofy
et-
rthnshe
er-
tional to the axial component of the density gradient. Thefore, with the decrease of the shock angle with the tube afrom 90° to lower values@Fig. 12~d!#, the signal weakenssubstantially.
Although in Figs. 9–11 the agreement between coputed and experimentally measured parameters is excelit is not perfect. Specifically, computed shock velocities adistances between two peaks in schlieren signals agreewell with experimental values. On the other hand, compuheight of both peaks in the signals relative to the sigstrength between the peaks is higher than that in expments. One of the principal uncertainties in computationsdue to the use of Gaussian fit~1! to the experimentally measured temperature profile, especially since temperature msurements have their own errors. Next, neither experimenor computational~the latter—due to the mesh size! resolu-tion is perfect. Still another factor is the use of an inviscmodel that disregards viscosity and heat conduction. Accoing to the data of Ref. 34, kinematic viscosity of Ar at 5Torr, 300 K, is n52.1 cm2/s, and at 50 Torr, 600 K, it isn57.1 cm2/s. Thermal diffusivity values are, of course, comparable with those of viscosity.34 The total width of the sig-nal ~that is, the distance between the peaks! in Figs. 9–11 is
AIP license or copyright, see http://ojps.aip.org/phf/phfcr.jsp

ls-
Ar-c-.
d-lt
aft
2700 Phys. Fluids, Vol. 13, No. 9, September 2001 Macheret et al.
FIG. 11. Experimentally measuredand simulated laser schlieren signafor shocks propagating in a glow discharge in Ar11%N2 at 50 Torr. Thedischarge current values are 10 mand 40 mA. The first of the two lasebeams is located 20 cm from the entrance to the discharge, and the spaing between the two beams is 3.7 cmThe experimentally measured ancomputed shock velocities are indicated in the figure. Note: experimentatime t was measured from the momenof spark firing, while the computa-tional timet was counted from the mo-ment when the shock was located atdistance of one tube radius to the leof the discharge.
c-akthhethidcu
amr ie
ee,
ictam
ta-the
theondard
eenongck
ificto
ith
aboutt510 ms. During this time, viscosity and heat condution can smear velocity and density profiles on a length scof d'A6nt50.1– 0.2 mm. Since the width of each peaconverted into the length scale is about 0.5 mm, anddistance between the peaks—about 5 mm, viscosity andconduction cannot change the overall structure ofschlieren signals, which reaffirms the validity of inviscmodeling; however, some smearing of the signals can ochelping to fill the ‘‘trough’’ between the peaks.
Note that since the linear velocity of the gas downstreof the shock is extremely low, 5–10 cm/s, boundary layevirtually nonexistent prior to the shock arrival. Behind thshock, boundary layer thickness growth with distancex canbe estimated, similar to the previous paragraph, asd'A6nt, wheret5x/u, andu is the gas velocity behind thshock. On the time scale of 1–10ms after the shock passagthe boundary layer will grow to onlyd50.03– 0.09 mm inour experimental conditions. Thus, the boundary layervery thin in the vicinity of the shock and does not affeschlieren signals. As to the boundary layer farther upstreit has no effect on the shock propagation.
Downloaded 17 Sep 2001 to 128.112.32.240. Redistribution subject to
le,eat
e
r,
s
s
,
For further quantitative comparison between computional and experimental results, Figs. 13 and 14 showwidth of schlieren signals versus centerline temperature~Fig.13! and the shock velocity versus average temperature indischarge~Fig. 14!, using the same set of shock propagatidata. The average temperature was determined in a stanway:
Tav5*0
RT~r !•2prdr
pR2. ~2!
Again, Figs. 13 and 14 show excellent agreement betwcomputations and experimental data. This provides a strevidence of conventional, thermal mechanism of shopropagation in weakly ionized plasmas.
IV. EXPERIMENTS ON SHOCK PROPAGATION INPULSED DISCHARGES
To distinguish between thermal and plasma-specmechanisms of shock propagation, it would be desirableeliminate temperature effects while maintaining plasma w
AIP license or copyright, see http://ojps.aip.org/phf/phfcr.jsp

Utene
te
aon
rois
imthss
enir
dia
itsis-erhe
aand
areis-sity
in
f o
n
cm
the
2701Phys. Fluids, Vol. 13, No. 9, September 2001 Shock wave propagation and dispersion
the same density of charged particles, electric field, etc.fortunately, a conventional steady-state discharge is a syswhere thermal effects are coupled with electric fields aelectron density. However, in pulsed discharges, a relativlong time interval can exist when electron, ion, and excimolecule densities are quite high while the temperaturelow. Indeed, gas heating and cooling occurs on time scorders of magnitude longer than the time scale for ionizatirecombination/excitation processes.35
In this work, the pulsed mode of the discharge was pduced by using a transistor switch in series with the dcharge. The rise time for the current pulse was 20ms, and thepulse duration was about 0.5 ms. It was found that this twas insufficient to get a uniform discharge. In fact, whendischarge was turned on, undesirable transitional proce~for example, discharges on the wall of the tube! were ob-served. Therefore a weak pilot discharge with 1 mA currwas maintained between pulses, which resulted in a fauniform volume pulsed discharge. Figure 15 shows thecharge pulse shape and the time dependence of disch
FIG. 12. Computed constant-density lines during shock propagationglow discharge tube~pure Ar, 50 Torr, 20 mA!: ~a! t521 ms, prior to shockentry into the discharge;~b! t543 ms, shock entering the discharge;~c! t560ms, shortly after the shock entered the discharge;~d! t5123 ms; the shockhas penetrated deep inside the discharge. The computational timet wascounted from the moment when the shock was located at a distance otube radius to the left of the discharge.
Downloaded 17 Sep 2001 to 128.112.32.240. Redistribution subject to
n-m
dlydisle/
--
eees
tlys-rge
integral emission~with no shock wave!. Clearly, at timesnear to the middle of the pulse the emission reachessteady-state value, similar to that of the continuous dcharge. The initial peak of intensity is a result of the highelectric field arising in the discharge immediately after ttransistor switch is opened~see below!.
As shown in Figs. 16 and 17, for the pilot dischargesmall acceleration, accompanied by some wideningweakening of the signal can be noticed, but the changesvery small compared to the higher-current continuous dcharge. This is no surprise since the electron number denin the pilot discharge is'108 cm23 only and the measuredaxial gas temperature is less than 320 K.
a
ne
FIG. 13. The width of the schlieren signal in the discharge~D! minus thesignal width with the discharge off (D0) vs temperature difference betweethe axis and the wall,Taxis2Tw . Gas mixture Ar10.16%N2 , pressure 50Torr; 3 cm spark gap, 15 kV spark voltage; the first laser beam is 24.8inside the discharge; spacing between the two beams is 2.9 cm.
FIG. 14. Shock wave velocity vs average temperature@definition—see Eq.~2!# in the discharge. Gas mixture Ar10.16%N2 , pressure 50 Torr; 3 cmspark gap, 15 kV spark voltage; the first laser beam is 24.8 cm insidedischarge; spacing between the two beams is 2.9 cm.
AIP license or copyright, see http://ojps.aip.org/phf/phfcr.jsp

edselyd is
terent
fielddethe-
en-
rge.ione tore-an-rfe
m
e
reless
he
ram-e,rge,
ri
ge
inge,
2702 Phys. Fluids, Vol. 13, No. 9, September 2001 Macheret et al.
FIG. 15. Discharge current and integrated spectral emission vs time duthe pulse.
FIG. 16. Schlieren signals and shock velocities in a glow dischargeAr11%N2 at 50 Torr: the discharge off; 38 mA continuous dc discharweak ~1 mA! pilot discharge, and a pulsed discharge.
Downloaded 17 Sep 2001 to 128.112.32.240. Redistribution subject to
Much more important is that schlieren signal obtainfrom the pulsed discharge, as seen in Figs. 16 and 17, clomatches both no-discharge and pilot-discharge curves, anvery unlike the signal from the continuous discharge. Afthe transistor switch is turned on, the discharge currreaches its new steady-state value in'20 ms. This value isalmost the same as in continuous discharge. The electricstrengthE in the pulse could be found by subtracting cathodropVc and voltage drop across the ballast resistor frompower supply voltage. TheE values were found to be somewhat larger than in the continuous discharge, but theE/Nvalues are almost identical. Thus, the electron number dsities and mean electron energies~electron temperatures!should be very close to those in the continuous dischaThis is confirmed by the behavior of the discharge emiss~Fig. 15!. It reaches its steady-state value that is very closthat of the continuous discharge. An initial overshoot islated to the over voltage applied to the discharge in the trsition period~;20 ms! from small to large current. HigheE/N values in this interval result in efficient excitation oatoms and molecules, including those with radiative lifetim;1–10ms ~e.g., intensive bands of the first positive systeof the N2 molecule!.
The increase in gas temperature,DT, during the pulsefor the pulse durationtp may by calculated from the simplbalance equationiEtp5cpmlDT, where cp is the specificheat, andml is a mass of gas per unit length. Here we ignoheat losses because the pulse duration is a factor of 100than the characteristic time for thermal conductivity. For tconditions of Fig. 16, this equation givesDT50.4 K20.6 K.Thus, the pulsed discharge has electron component paeters~ E/N, ne , Te) the same as in the continuous dischargbut the gas temperature is the same as in the pilot discha
ng
in,
FIG. 17. Schlieren signals and shock velocities in a glow dischargeAr11%N2 at 50 Torr: the discharge off; 80-mA continuous dc discharweak ~1 mA! pilot discharge, and a pulsed discharge.
AIP license or copyright, see http://ojps.aip.org/phf/phfcr.jsp

re
wtio
n-lt
ch
-laoerlakena
ocdigetiotu
a
cim
andk–
u-be
vi-ag-m-e as
ed at
22
othas toni-oc-r
,by
de-,behat
thed t
l atning
2703Phys. Fluids, Vol. 13, No. 9, September 2001 Shock wave propagation and dispersion
that is, close to room temperature. Comparing the thschlieren curves of Fig. 16~and, similarly, those of Fig. 17!definitely shows that changing the electron density by torders of magnitude does not affect shock wave propagawhile changing gas temperature fromTg'320 K to Tg
'500– 600 K~from the pilot or pulsed discharge to the cotinuous discharge! affects the shock dramatically. This resumay by considered as a strong evidence of thermal menism of shock wave–plasma interaction.
To further illustrate the role of heating in shock dynamics, Fig. 18 shows schlieren signals taken with a time debetween turning the discharge on and launching the shranging from 1 ms to 200 ms. The 1-ms-delay signal is vclose to that in the pilot discharge, while the 200-ms-designal is close to that in the continuous discharge. It tatens and hundreds of milliseconds of the discharge existefor the signal to get close to its steady-state shape. The spoint is also illustrated in Fig. 19, showing measured shspeed and schlieren signal width approaching their dccharge values as the discharge is allowed to exist lonOnly gas heating in the discharge takes that long; ionizaand excitation processes are many orders of magnifaster.
As the discharge is turned off, one would expect thermeffects to persist for a long time, tens or even hundredsmilliseconds, when the recombination of a charged speand the quenching of excited states will be long since co
FIG. 18. Evolution of the schlieren signal at a fixed location insidedischarge with a time delay between the beginning of the discharge anshock launch.
Downloaded 17 Sep 2001 to 128.112.32.240. Redistribution subject to
e
on,
a-
yckyyscemeks-r.n
de
lofes-
plete. Indeed, this persistence is clearly seen in Figs. 2021, again supporting the thermal mechanism of shocplasma interaction.
It should be noted that vibrational temperature, or poplations of vibrational states, of nitrogen molecules, couldanother parameter~apart from the gas temperature! that isquite different in pulsed and continuous discharges. Thebrational relaxation characteristic time is 1–2 orders of mnitude longer than the pulse duration, so the vibrational teperature in the pulsed discharge must be almost the samin the pilot ~1 mA! discharge.
To clarify the role of vibrational relaxation, shock wavpropagation through pure argon discharge was also studielow currents where contraction did not occur. In Fig.schlieren signals for the two gases~Ar and Ar11%N2) arecompared. The main features of schlieren signals for bcases are similar. For a more detailed comparison, one htake into account that the addition of even 0.1%–1% oftrogen to argon dramatically changes the electron drift velity for the sameE/N.36 Another important factor found in ouexperiments is that the values ofE/N in Ar11%N2 are sub-stantially lower than those in pure Ar. SinceE/N in the posi-tive column is determined by the local ionization balance35
ionization, and/or recombination rates must be affectedthe addition of nitrogen. The exact mechanism of thecrease inE/N with nitrogen addition is not clear at this timeand, being outside the immediate goal of this work, caninvestigated in the future. One possible explanation is t
he
FIG. 19. Evolution of shock velocity and the width of the schlieren signaa fixed location inside the discharge with time delay between the beginof the discharge and the shock launch.
AIP license or copyright, see http://ojps.aip.org/phf/phfcr.jsp
duc-erin
ent,the
dis-ost
ast.ef-
of
ingenh-
m-andedity
pa-ndsarytainer-
ock
thed
l af th
Artric
2704 Phys. Fluids, Vol. 13, No. 9, September 2001 Macheret et al.
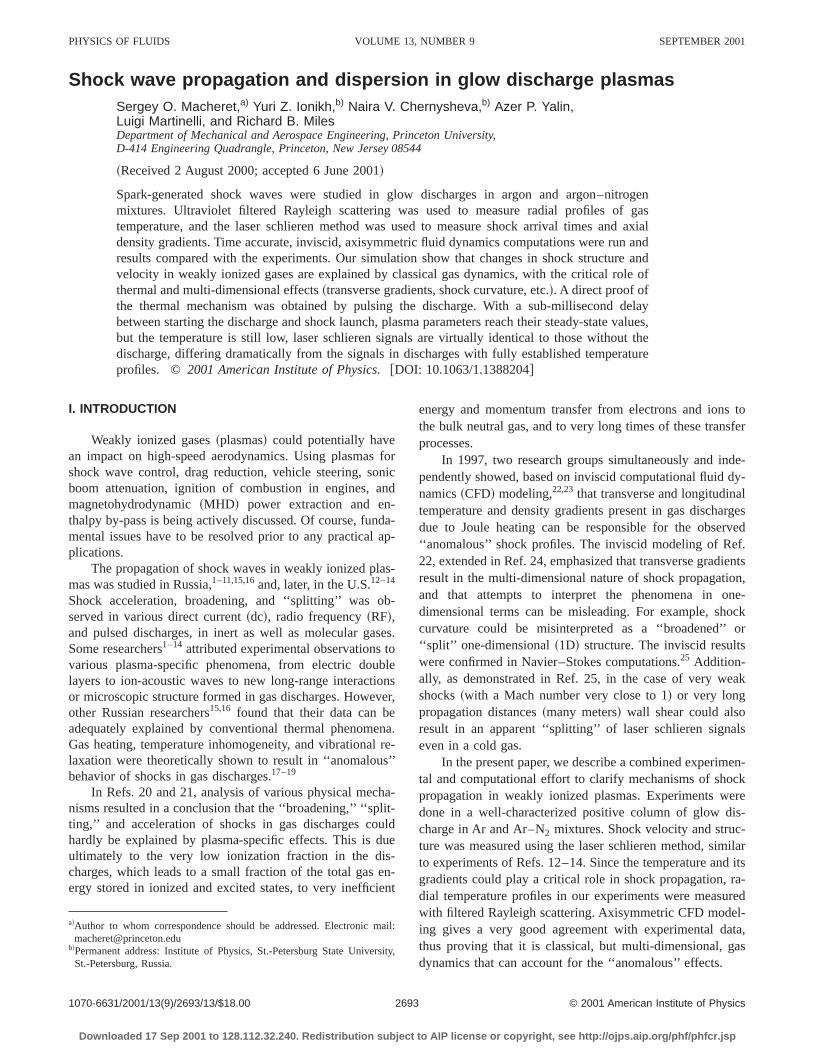
FIG. 20. Evolution of the schlieren signal at a fixed location insidedischarge with a time delay between the end of the discharge pulse anshock launch.
FIG. 21. Evolution of shock velocity and the width of the schlieren signaa fixed location inside the discharge with time delay between the end odischarge pulse and the shock launch.
Downloaded 17 Sep 2001 to 128.112.32.240. Redistribution subject to
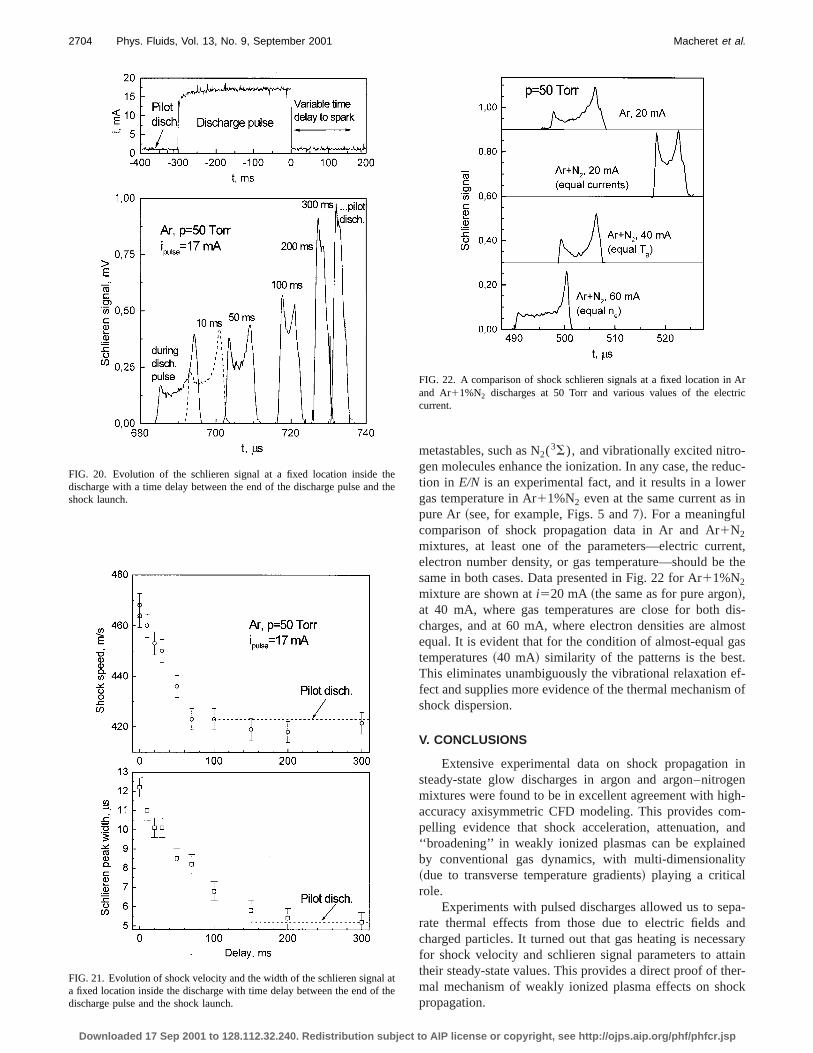
metastables, such as N2(3S), and vibrationally excited nitro-gen molecules enhance the ionization. In any case, the retion in E/N is an experimental fact, and it results in a lowgas temperature in Ar11%N2 even at the same current aspure Ar ~see, for example, Figs. 5 and 7!. For a meaningfulcomparison of shock propagation data in Ar and Ar1N2
mixtures, at least one of the parameters—electric currelectron number density, or gas temperature—should besame in both cases. Data presented in Fig. 22 for Ar11%N2
mixture are shown ati520 mA ~the same as for pure argon!,at 40 mA, where gas temperatures are close for bothcharges, and at 60 mA, where electron densities are almequal. It is evident that for the condition of almost-equal gtemperatures~40 mA! similarity of the patterns is the besThis eliminates unambiguously the vibrational relaxationfect and supplies more evidence of the thermal mechanismshock dispersion.
V. CONCLUSIONS
Extensive experimental data on shock propagationsteady-state glow discharges in argon and argon–nitromixtures were found to be in excellent agreement with higaccuracy axisymmetric CFD modeling. This provides copelling evidence that shock acceleration, attenuation,‘‘broadening’’ in weakly ionized plasmas can be explainby conventional gas dynamics, with multi-dimensional~due to transverse temperature gradients! playing a criticalrole.
Experiments with pulsed discharges allowed us to serate thermal effects from those due to electric fields acharged particles. It turned out that gas heating is necesfor shock velocity and schlieren signal parameters to attheir steady-state values. This provides a direct proof of thmal mechanism of weakly ionized plasma effects on shpropagation.
the
te
FIG. 22. A comparison of shock schlieren signals at a fixed location inand Ar11%N2 discharges at 50 Torr and various values of the eleccurrent.
AIP license or copyright, see http://ojps.aip.org/phf/phfcr.jsp

of
Ps-
,.
ov
he
r,a
Pr-
hy
s-
rehy
-ec
k
.inm
ine
lib
ter
fhy
ovis
ium
ve
gastivesow,
et,7-
et,zed
ins of–13
k
nd99.
ark
B.on
s,A-
of
the
-
iner
rer
.
2705Phys. Fluids, Vol. 13, No. 9, September 2001 Shock wave propagation and dispersion
ACKNOWLEDGMENT
This work was sponsored by the Air Force OfficeScientific Research.
1G. I. Mishin, A. P. Bedin, N. I. Yushchenkova, G. E. Skvortsov, and A.Ryazin, ‘‘Anomalous relaxation and instability of shock waves in plamas,’’ Sov. Phys. Tech. Phys.26, 1363~1981!.
2A. I. Klimov, A. N. Koblov, G. I. Mishin, Yu. L. Serov, and I. P. Yavor‘‘Shock wave propagation in a glow discharge,’’ Sov. Tech. Phys. Lett8,192 ~1982!.
3A. L. Klimov, A. N. Koblov, G. I. Mishin, Yu. L. Serov, K. V. Khodataev,and I. P. Yavor, ‘‘Shock wave propagation in a decaying plasma,’’ STech. Phys. Lett.8, 240 ~1982!.
4I. V. Basargin and G. I. Mishin, ‘‘Probe studies of shock waves in tplasma of a transverse glow discharge,’’ Sov. Tech. Phys. Lett.11, 535~1985!.
5V. A. Gorshkov, A. I. Klimov, G. I. Mishin, A. B. Fedotov, and I. P. Yavo‘‘Behavior of electron density in a weakly ionized nonequilibrium plasmwith a propagating shock wave,’’ Sov. Phys. Tech. Phys.32, 1138~1987!.
6A. P. Ershov, S. V. Klishin, A. A. Kuzovnikov, S. E. Ponomareva, and Y.Pyt’ev, ‘‘Application of the reduction method to the microwave interfeometry of shock waves in weakly ionized plasma,’’ Sov. Phys. Tech. P34, 936 ~1989!.
7I. V. Basargin and G. I. Mishin, ‘‘Precursor of shock wave in glow dicharge plasma,’’ Sov. Tech. Phys. Lett.15, 311 ~1989!.
8S. A. Bystrov, I. S. Zaslonko, Y. K. Mukoseev, and P. V. Shugaev, ‘‘Pcursor ahead of a shock front in an RF discharge plasma,’’ Sov. PDokl. 35, 39 ~1990!.
9G. I. Mishin, A. I. Klimov, and A. Y. Gridin, ‘‘Measurements of the pressure and density in shock waves in a gas discharge plasma,’’ Sov. TPhys. Lett.17, 602 ~1992!.
10A. Y. Gridin, A. I. Klimov, and K. V. Khodataev, ‘‘Propagation of shocwaves in a nonuniform transverse pulsed discharge,’’ High Temp.32, 454~1994!.
11A. Y. Gridin, A. I. Klimov, K. V. Khodataev, N. B. Shcherbak, and S. BShcherbak, ‘‘Two-dimensional simulation of shock wave propagationtransverse pulse glow discharge with a heated cathode layer,’’ High Te32, 755 ~1994!.
12B. N. Ganguly, P. Bletzinger, and A. Garscadden, ‘‘Shock wave dampand dispersion in nonequilibrium low pressure argon plasmas,’’ Phys. LA 230, 218 ~1997!.
13B. N. Ganguly and P. Bletzinger, ‘‘Shock wave dispersion in nonequirium plasmas,’’ Paper AIAA-96-4607, 1996.
14A. Garscadden, P. Bletzinger, and B. N. Ganguly, ‘‘Acoustic shock inaction in a positive column plasma,’’ Paper AIAA-99-4973, 1999.
15N. V. Evtyukhin, A. D. Margolin, and V. M. Shmelev, ‘‘On the nature oshock wave acceleration in glow discharge plasma,’’ Sov. J. Chem. P3, 2080~1986!.
16P. A. Voinovich, A. P. Ershov, S. E. Ponomareva, and V. M. Shibk‘‘Propagation of weak shock waves in plasma of longitudinal glow dcharge in air,’’ High Temp.29, 468 ~1991!.
Downloaded 17 Sep 2001 to 128.112.32.240. Redistribution subject to
.
.
.
s.
-s.
h.
ap.
gtt.
-
-
s.
,-
17N. Babaeva, ‘‘On the structure of shock and blast waves in nonequilibrplasma of gas discharge,’’ Khim. Fiz.12, 357 ~1993! ~in Russian!.
18N. Babaeva, A. Mnatsakanyan, and G. Naidis, ‘‘Simulation of shock wapropagation in a gas discharge developing in nitrogen,’’ High Temp.31,617 ~1993!.
19N. Babaeva and G. Naidis, ‘‘Simulation of shock wave propagation indischarge plasma regions,’’ in Proceedings of the Workshop Perspecof MHD and Plasma Technologies in Aerospace Applications, Mosc24–25 March 1999, p. 108.
20I. V. Adamovich, V. V. Subramaniam, J. W. Rich, and S. O. Macher‘‘Shock wave propagation in weakly ionized plasmas,’’ Paper AIAA-92499, 1997.
21I. V. Adamovich, V. V. Subramaniam, J. W. Rich, and S. O. Macher‘‘Phenomenological analysis of shock-wave propagation in weakly ioniplasmas,’’ AIAA J.36, 816 ~1998!.
22S. O. Macheret, L. Martinelli, and R. B. Miles, ‘‘Shock propagationweakly ionized plasmas: Mechanisms and key problems,’’ Proceedingthe 1st Weakly Ionized Gases Workshop, U.S. Air Force Academy, 9June 1997, pp. X-11–X-33.
23W. F. Bailey and W. M. Hilbun, ‘‘Baseline of thermal effects on shocpropagation in glow discharge,’’ in Ref. 22, pp. GG3–GG18.
24S. O. Macheret, L. Martinelli, and R. B. Miles, ‘‘Shock propagation astructure in non-uniform gases and plasmas,’’ Paper AIAA-99-0598, 19
25S. M. Aithal and V. V. Subramaniam, ‘‘On the characteristics of a spgenerated shock wave,’’ Phys. Fluids12, 924 ~2000!.
26Y. Z. Ionikh, N. V. Chernysheva, A. V. Meshchanov, A. P. Yalin, and R.Miles, ‘‘Direct evidence for thermal mechanism of plasma influenceshock wave propagation,’’ Phys. Lett. A259, 387 ~1999!.
27S. O. Macheret, Y. Z. Ionikh, L. Martinelli, P. F. Barker, and R. B. Mile‘‘External control of plasmas for high-speed aerodynamics,’’ Paper AIA99-4853, 1999.
28J. H. Kiefer and R. W. Lutz, ‘‘Simple quantitative schlieren techniquethe high sensitivity for shock tube densitometry,’’ Phys. Fluids8, 1393~1965!.
29J. A. Bander and G. Sanzone, ‘‘An improved laser-schlieren system formeasurement of shock-wave velocity,’’ Rev. Sci. Instrum.45, 949 ~1974!.
30A. P. Yalin and R. B. Miles, ‘‘Ultraviolet filtered Rayleigh scattering temperature measurements with a mercury filter,’’ Opt. Lett.24, 590 ~1999!.
31A. P. Yalin, Y. Ionikh, and R. B. Miles, ‘‘Temperature measurementsglow discharges with ultraviolet filtered Rayleigh scattering,’’ PapAIAA-99-3431, 1999.
32N. D. Finkelstein, W. R. Lempert, and R. B. Miles, ‘‘Mercury vapor filtetechnology and ultraviolet laser source for flowfield imaging,’’ PapAIAA-97-0157, 1997.
33C. A. Kim, A. Jameson, L. Martinelli, and K. Xu, ‘‘An accurate LED-BGKsolver in unstructured adaptive meshes,’’ Paper AIAA 97-0328, 1997.
34Handbook of Physical Quantities, edited by I. S. Grigoriev and E. ZMeilikhov ~CRC Press, Boca Raton, FL, 1997!, Chaps. 15 and 16.
35Yu. P. Raizer,Gas Discharge Physics~Springer-Verlag, Berlin, 1991!,Chaps. 4, 10, and 14.
36S. C. Brown,Basic Data of Plasma Physics~MIT Press, Cambridge, MA,1966!, p. 94.
AIP license or copyright, see http://ojps.aip.org/phf/phfcr.jsp