Warm Glow and Embedding in Contingent Valuation
30
Fondazione Eni Enrico Mattei Warm Glow and Embedding in Contingent Valuation Paulo A.L.D. Nunes* and Erik Schokkaert** NOTA DI LAVORO 73.2001 SEPTEMBER 2001 SUST – Sustainability Indicators and Environmental Evaluation *Katholieke Universiteit Leuven, Center for Economic Studies, Leuven, and Vrije Universiteit,Department of Spatial Economics,Amsterdam ** Katholieke Universiteit Leuven, Center for Economic Studies, Leuven This paper can be downloaded without charge at: The Fondazione Eni Enrico Mattei Note di Lavoro Series Index: http://www.feem.it/web/activ/_activ.html Social Science Research Network Electronic Paper Collection: http://papers.ssrn.com/paper.taf?abstract_id Fondazione Eni Enrico Mattei Corso Magenta, 63, 20123 Milano, tel. +39/02/52036934 – fax +39/02/52036946 E-mail: [email protected] C.F. 97080600154
-
Upload
independent -
Category
Documents
-
view
0 -
download
0
Transcript of Warm Glow and Embedding in Contingent Valuation

Fondazione Eni Enrico Mattei
Warm Glow and Embedding inContingent Valuation
Paulo A.L.D. Nunes* andErik Schokkaert**
NOTA DI LAVORO 73.2001
SEPTEMBER 2001SUST – Sustainability Indicators and Environmental
Evaluation
*Katholieke Universiteit Leuven,Center for Economic Studies, Leuven, and
Vrije Universiteit,Department of Spatial Economics,Amsterdam** Katholieke Universiteit Leuven,
Center for Economic Studies, Leuven
This paper can be downloaded without charge at:
The Fondazione Eni Enrico Mattei Note di Lavoro Series Index:http://www.feem.it/web/activ/_activ.html
Social Science Research Network Electronic Paper Collection:http://papers.ssrn.com/paper.taf?abstract_id
Fondazione Eni Enrico MatteiCorso Magenta, 63, 20123 Milano, tel. +39/02/52036934 – fax +39/02/52036946
E-mail: [email protected]. 97080600154

Warm glow and embedding in contingent valuation
Paulo A. L. D. Nunes a,b,*
Erik Schokkaert a
a Katholieke Universiteit Leuven, Center for Economic Studies69 Naamsestraat, 3000 Leuven
Belgiumb Vrije Universiteit, Department of Spatial Economics
De Boelelaan 1105, 1081 HV AmsterdamNetherlands
* Corresponding author. Tel.: +31-20-4446029; Fax.:+31-20-4446004; E-mail address: [email protected]

Abstract
This paper reports the results from a contingent valuation study designed to investigate the
influence of warm glow in willingness-to-pay responses. Interindividual differences in warm glow
motivation are measured through a factor analysis, performed on a list of attitudinal items. The
reported willingness to pay measures fail to pass the scope test. Both socioeconomic variables and
motivational factor scores are significant in the explanation of the individual WTP measures. We
compute dry WTP measures by taking out the effect of the warm glow motivation. These dry
measures satisfy both the scope test and Hausman’s adding-up property and could therefore be
interpreted as reflecting true economic preferences.
JEL Codes
C12, C13, C14, Q26
Key words
Contingent valuation, recreation, wildlife, willingness to pay, warm glow.

1
1. Introduction
One of the main points in the ongoing debate about the use of contingent valuation (CV) studies is
the so-called embedding phenomenon. The embedding problem is present whenever reported
willingness to pay (WTP) responses fail to meet the scope test, i.e., when the WTP for two
environmental goods taken together, is about the same as the WTP for one of the individual goods,
considered separately. It has been suggested that this valuation pattern may result from a tendency
for CV respondents to signal non-economic considerations and, in particular, as a signal indicating
that respondents also bid because they derive moral satisfaction or a warm glow from the act of
giving per se [11]. Prominent critics of CV [9] hold that the evidence on the embedding problem
shows that CV answers do not reflect real economic preferences and should therefore not be used
in cost benefit analysis.
In this paper we present some further empirical evidence on the significance of the warm glow
effect. Our data refer to a CV survey designed to measure the economic benefits from preventing
commercial tourism development in the Alentejo Natural Park in Portugal. The survey contained
three protection programs: the Recreation Areas protection program (RA); the Wilderness Areas
protection program (WA); and the joint Wilderness and Recreation Areas protection program
(WA+RA). To investigate the warm glow effect we included in the questionnaire a list of attitudinal
items. Factor analytic techniques are used to reduce these different individual items to three
underlying factors that can be related to the use value, the existence value and the warm glow of
giving. We then test whether interindividual variation in the factor scores for these different
motivations can explain differences in the WTP answers. We also investigate the relationship
between the warm glow and the embedding phenomenon.
In section 2 we present a simple testing strategy for the scope and the adding-up test. We also

2
propose a methodology to correct the WTP answers for the warm glow component, i.e. to
compute what we call a “dry” WTP measure. Section 3 describes the survey and introduces the
attitudinal items and the factor analysis. In section 4 we perform a traditional CV analysis. Given
that our survey instrument implements a double bounded dichotomous choice elicitation format, we
hypothesize that the CV answers follow a lognormal distribution to calculate mean and median
WTP for the three protection scenarios. It turns out that these results are subject to the embedding
problem and do not pass the scope test. In section 5 we refine the estimation procedure by
specifying the sources of interindividual variation in the WTP answers. The psychological
motivation factors are highly significant and this holds also for the warm glow effect. After taking
out this warm glow effect, the resulting dry WTP measures are much lower and satisfy both the
scope and the adding-up test. Section 6 concludes.
2. A simple strategy to operationalise the warm glow effect
In order to focus our discussion, we consider the case of a Natural Park, consisting of a
wilderness area with restricted visitor’s access and a recreation area where visitors may enjoy
recreational activities in a natural environment. Three different protection programs are considered.
In the first one, the wilderness area is protected while the recreation area is further developed for
commercial tourism. In the second one, the wilderness area is given up but the recreation area is
kept intact, i.e. remains reserved for activities that are unagressive for the natural environment. The
last one protects both the wilderness area and the recreational area. Call these protection
programs WA, RA and WA+RA respectively.

3
It is immediately obvious that the first two programs are embedded in the last one. It is
therefore interesting to test whether the reported values of willingness-to-pay satisfy the scope test.
This can be formalized with the following hypotheses:
Hypothesis 1: Scope effect for the reported willingness-to-pay
(H1a) (H1b)
( ) ( )( ) ( )rr
rr
WTPEWTPE
WTPEWTPE
RA)+(WAW Aa
RA)+(WAW A0
:H
:H
<
= ( ) ( )( ) ( )rr
rr
WTPEWTPE
WTPEWTPE
RA)+(WARAa
RA)+(WARA0
:H
:H
<
=
where the notation WTPjr refers to the reported willingness-to-pay for protection program j. The
literature contains many examples of CV studies in which the hypotheses (H1) are not rejected.1
Unless one accepts the (not very realistic assumption) that WA and RA are perfect substitutes, this
suggests that there is a problem of incoherence of the reported willingness-to-pay values. As a
matter of fact, Diamond et al. [6] go further and argue that “if the answers reflect economic
preferences”, they should satisfy an adding up-hypothesis:
Hypothesis 2: Adding-up hypothesis for the reported willingness to pay
(H2)
( ) ( ) ( )( ) ( ) ( )rrr
rrr
WTPEWTPEWTPE
WTPEWTPEWTPE
RA)+(WARAW Aa
RA)+(WARAW A0
:H
:H
≠+
=+
Critics have used the empirical findings (acceptance of H1 and rejection of H2) as one of the main
arguments to claim that CV studies give an unreliable measure of non-use values [9]. In fact, at
least since Kahneman and Knetsch [11], these findings have been related to the idea that
respondents purchase moral satisfaction through their CV answers. This idea is inspired by the

4
work of Andreoni [1, 2] and others on impure altruism. In this approach the individual consumer
contributes to the provision of a public good for two reasons. First, because she simply wants
more of the public good and, secondly, because she derives some private benefit from contributing
to its provision. The latter effect may be related to social pressure, to feelings of guilt and
sympathy, to the quest for moral satisfaction or simply to the desire for a “warm glow”. In any
case, it implies that the individual’s contribution to the public good enters into her utility function
twice: firstly, as a contribution to public good provision; secondly, as a private good. By inference,
it is plausible that the act of assisting in the supply of an environmental good through a CV question
could also provide a private benefit, or warm glow, on top of the benefits derived from the
increased supply of the public good.
Let us therefore write in general
),( dryij
wgij
rij WTPWTPfWTP = (1)
where the subscripts i and j refer to the respondent and the project respectively. The first
component at the RHS refers to the warm glow, the second to the “dry” measure related to
economic preferences. Equation (1) immediately shows that (H2) can be rejected even if the
adding-up condition is satisfied at the level of the “dry” measure, i.e. at the level of the economic
preferences. An easy example would be the case where f(.) takes a simple additive form and
where the warm glow effect is subject to rapidly declining marginal utility so that it can be
hypothesized that for each respondent
WTP WTP WTP j WA RA WA RAjr
jdry
jwg= + = +, ,( )
WTP WTP WTPRAwg
WAwg
WA RAwg
= = +

5
WTP WTP WTPWAdry
RAdry
WA RAdry
+ = +
Even if the adding-up condition holds for the dry measures, it will be rejected for the reported
willingness-to-pay measures. If this description of reality makes sense, it is obvious that much
progress could be made if we were able to distinguish empirically the different components in (1).
One possible approach to this problem (already proposed in another context by Schokkaert and
Van Ootegem [18]) is to exploit the interindividual variation in the willingness-to-pay and in the
importance attached to the warm glow-effect.2 This interindividual variation will be related to
differences in socioeconomic characteristics such as income, education, gender, etc. Different
individuals will also differ in their sensitivity to the warm glow effect and in the importance they
attach to use and existence values. We can therefore write )( ii m,ajij fWTP = , where ai refers to
a vector of socioeconomic characteristics and m m m mi wg i u i ex i= ( , , ), , , refers to the
psychological characteristics of respondent i: the satisfaction generated by the act of giving (warm
glow motivation), the importance attached to the use or recreational value (use motivation), the
utility with respect to the protection of nature independently of recreational use (existence
motivation) respectively.
In our empirical work we will work with the following semilogarithmic form:
ln , , , , , ,WTP a m m m eijr
j kj kir
wg j wg ir
u j u ir
ex j ex ir
ijk
= + + + + +∑β δ δ δ δ (2)
where the superscript r indicates the values of the variables as reported by the respondents, e is
the normally distributed error term and the δ j ’s are the coefficients to be estimated. Note that
( , , ), , ,δ δ δwg j u j ex j relate to the amount of warm glow obtained from contributions for project j

6
and to the use and existence value of that same project respectively.
We will return in the next section to the operationalisation of the vector of psychological
characteristics m. Estimation of equation (2) will allow us to test directly whether the warm glow
effect plays a role in the reported willingness-to-pay measures and, more specifically, whether
individual respondents with different values for the warm glow component indeed report different
values for their WTP:
Hypothesis 3. Significance of the warm-glow effect
(H3)
0 :
0 :
≠
=
wga
wgo
H
H
δ
δ
We can even go further and simulate what would be the WTP of the respondents if they were
immune for the warm glow effect. Define by mwgdry the minimal value of mwg , i.e. the value of the
warm glow motivation for a Mr. Scrooge who does not get any warm feeling from giving and can
resist social pressure without problem. We can then simulate for each respondent a “dry” WTP,
i.e. the value of her willingness-to-pay if she had the same (minimal) warm glow motivation as Mr.
Scrooge:
ln , , , , , ,WTP a m m m eijdry
j kj kir
wg j wg idry
u j u ir
ex j ex ir
ijk
= + + + + +∑β δ δ δ δ (3)

7
If rejection of the scope test and the adding up test for the reported values of willingness-to-pay
can be fully explained by the presence of the warm glow effect, there should be no problem with
the dry measures. This can be tested as
Hypothesis 4. Scope effect for the dry willingness to pay
and
Hypothesis 5. Adding-up hypothesis for the dry willingness to pay
(H5)
( ) ( ) ( )( )( ) ( ) ( )( )drydrydry
a
drydrydry
WTPEWTPEWTPEH
WTPEWTPEWTPEH
RAW ARAW A
RAW ARAW A0
:
:
+
+
≠+
=+
In our empirical work we will formally test the five hypotheses introduced in this section.
Before we turn to the hypothesis testing, however, we first have to construct a measure of the
vector of psychological characteristics m m m mi wg i u i ex i= ( , , ), , , .
3. The data: willingness to pay and consumer motivations
In section 3.1 we will first describe the general features of the survey design. In section 3.2 we go
deeper into the calculation of the psychological functionings.
3.1. Survey design and data collection
Our empirical data are taken from a large-scale contingent valuation study with a representative
sample of the Portuguese population. The good being valued is the protection from commercial
tourism development of the Recreation Areas and Wilderness Areas in the Alentejo Natural Park,
(H4a) (H4b)
( ) ( )( ) ( )drydry
drydry
WTPEWTPE
WTPEWTPE
RA)+(WAW Aa
RA)+(WAW A0
:H
:H
<
= ( ) ( )( ) ( )drydry
drydry
WTPEWTPE
WTPEWTPE
RA)+(WARAa
RA)+(WARA0
:H
:H
<
=

8
situated along the southwest coastline of Portugal and covering about 180 miles of coastline. As
described in the previous section, there were three versions of the questionnaire, focusing on the
Recreation Areas protection program (RA); the Wilderness Areas protection program (WA); and
the joint Wilderness and Recreation Areas protection program (WA+RA) respectively. Since non-
use values play a crucial role in the evaluation of the various scenarios, the CV method suggested
itself.
Table I. Survey descriptive statistics
The results were obtained by a nationwide survey conducted in mid September 1997 by the
Survey Department of the Portuguese Catholic University. Use was made of oral interviews with
trained interviewers. A two-stage area probability sample was set up - see Thompson [19]. In the
first stage, 37 parishes across Portugal were selected. In the second stage, a set of housing units
was drawn.3 The interviewer teams paid visits to 3597 households but 21% of them could not be
reached because the residents were not at home. From the households that were successfully
contacted, we received a total of 1678 completed interviews, corresponding to a participation
response of approximately 60%. Table I provides descriptive statistics for a selected set of
variables. A comparison of the data of our survey with demographic statistics available from the
last Census data for Portugal (1991) indicates that the different demographic clusters of the
Portuguese population are well covered in our sample.
The payment vehicle as described in the questionnaire was either a voluntary contribution in the
form of a one-time lump-sum payment to a trust fund, or a tax. It was explained that the money
collected in the trust fund or by the tax would only be used to finance the efforts of the Natural
Park’s management agency to protect the coastline. Inspection reveals that there were only minor

9
differences between the two versions - see Nunes [15]. To structure the willingness-to-pay
question we used the double bounded dichotomous choice elicitation question format described by
Hanemann et al. [7]. Pictures of animals and landscapes (before and after tourist development)
were used as visual aids.
3.2. Consumer motivations
While the collection of the willingness-to-pay data through contingent valuation has become quite
standard - and we followed the current best practice in the field - a more innovative aspect of our
survey is the attempt to measure consumer motivations towards the protection of nature in general,
and towards the act of giving in particular. Therefore, we introduced into the questionnaire a list of
26 attitudinal questions4 to be answered by the respondents on a five point Likert-scale [13], with
values ranging from 1 (for “I disagree completely”) to 5 (for “I agree completely”). These items
were formulated so as to capture the warm glow, use and existence motivations.
In order to get internally coherent measures of these motivations we used factor analysis as a
variable reduction method - see Harman [8]. This technique enables us to identify and measure the
underlying latent motivation structure on the basis of the correlations between the responses on
the specific individual items. The underlying hypothetical variables or factors are constructed in
such a way that the observed responses are linear combinations of the underlying factors. The so-
called factor loadings then give the product-moment correlation between the individual responses
and these underlying latent factors. The latter are scaled to have mean zero and variance equal to
1. To get a clear picture we choose an orthogonal factor representation, implying that the factors
are uncorrelated and hence that the basic consumer motivations do not overlap5, and we opted for
the varimax rotation procedure, which maximizes the variance of the squared loadings of the
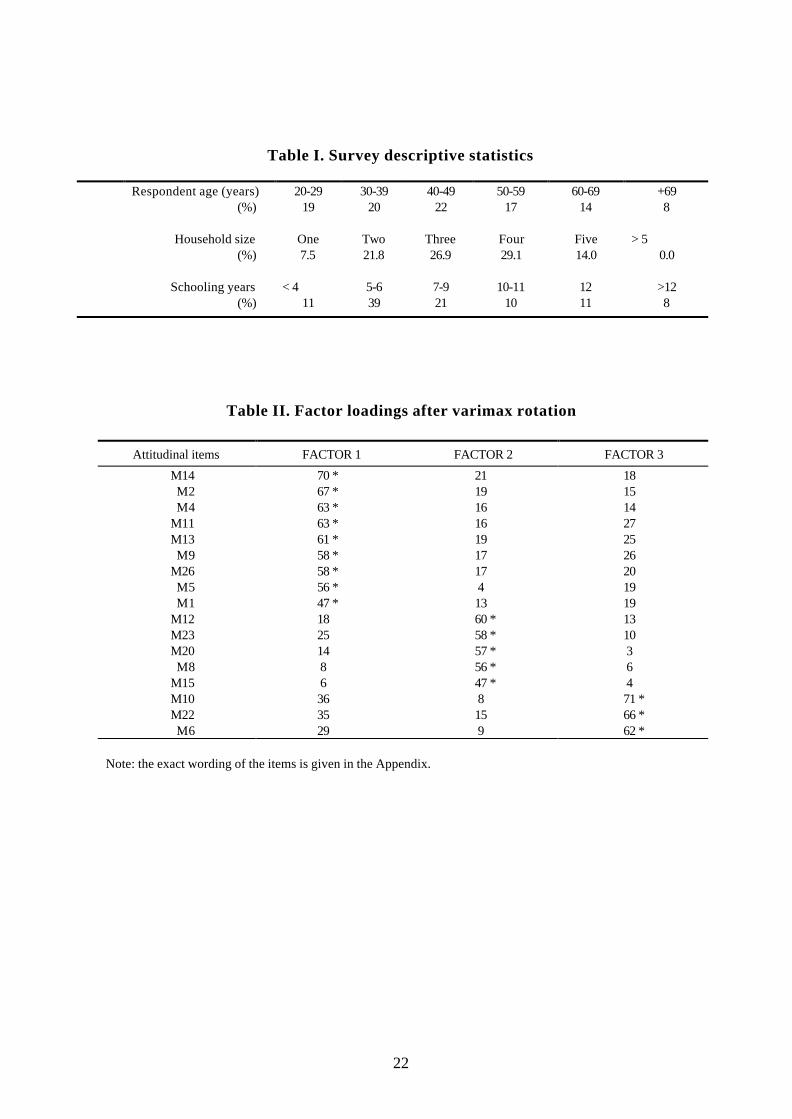
different items on the factors. The factor loadings after varimax rotation are shown in Table II.

10
Printed results are multiplied by 100 and rounded to the nearest integer. The asterisks denote
values above 0.45.6
Table II. Factor loadings after varimax rotation
Although the interpretation of the factors remains somewhat subjective the overall pattern
seems clear. The main items loading on a given factor share the same conceptual meaning and
items that load on different factors are associated with different conceptual meanings. The items
loading on factor 1 relate to the direct consumption of the natural park for recreational use.7
Therefore, this latent variable is interpreted as the consumer ‘use/recreation’ motivation. Factor 2
is associated with items that underpin a respondent’s feeling of well being or satisfaction generated
by the act of giving. We interpret it as the consumer ‘warm glow’ motivation.8 Factor 3 is
associated with items indicating the respondent’s ethical and moral considerations with respect to
the conservation of nature, independent of its human use and we interpret it as the consumer ‘non-
9
After having defined the content of the factors, the next step is to determine the position of the
individuals on these factors, i.e. the vectors m m m mi wg i u i ex i= ( , , ), , , . These are given by the
standardized factor scores (again with mean zero and variance equal to 1 - see Harman, 1976). A
higher value for mu i, (i.e. a larger factor score for Factor 1) indicates that the respondent has a
stronger propensity for recreation and other use values. Higher values for mwg i, (Factor 2) and
mex i, (Factor 3) reveal that the respondent is more sensitive to a warm glow of giving and is more
concerned with the protection of nature and no-extinction of wildlife respectively. These factor
scores will play a crucial role in the testing for the warm glow effect and the computation of dry
11
measures in section 5.
4. Testing for the scope effect in a univariate setting
As a first approach we will calculate the mean WTP for the different protection scenarios in a
simple univariate setting, i.e. neglecting the information on demographic, socioeconomic and
psychological characteristics of our respondents. We introduce the statistical model in section 4.1
and the results in section 4.2.
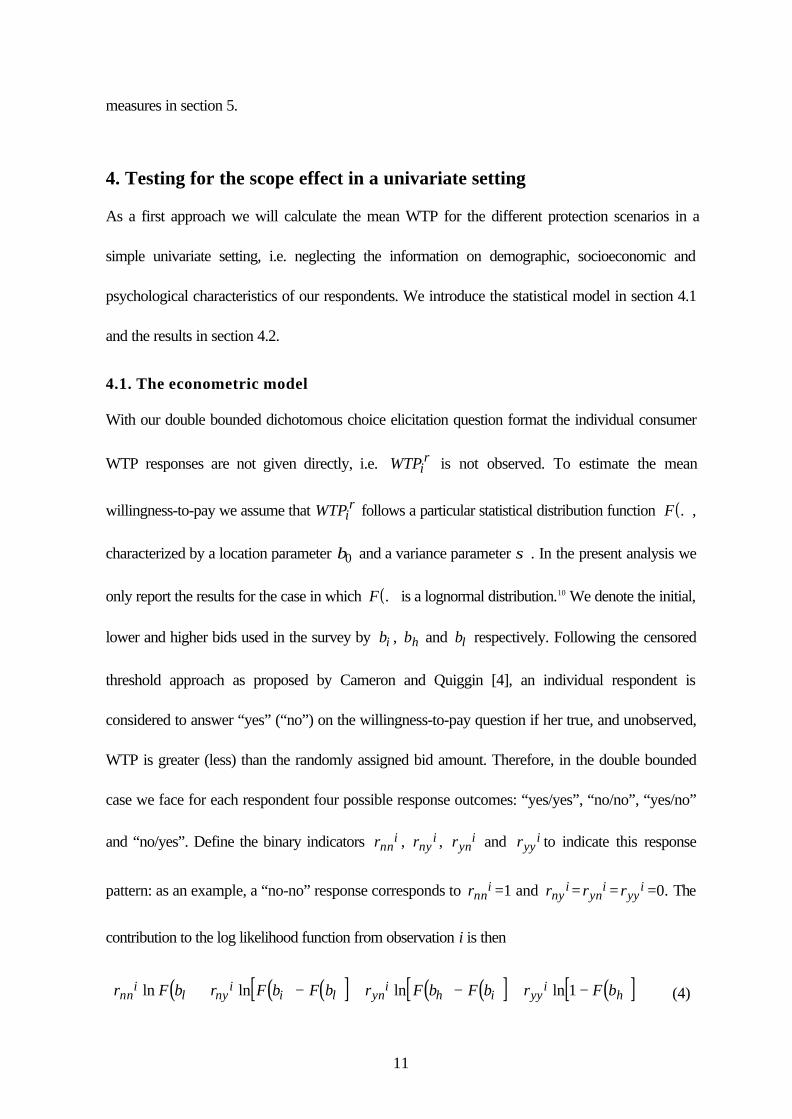
4.1. The econometric model
With our double bounded dichotomous choice elicitation question format the individual consumer
WTP responses are not given directly, i.e. WTPir is not observed. To estimate the mean
willingness-to-pay we assume that WTPir follows a particular statistical distribution function ( )F . ,
characterized by a location parameter β0 and a variance parameter σ . In the present analysis we
only report the results for the case in which ( )F . is a lognormal distribution.10 We denote the initial,
lower and higher bids used in the survey by bi , bh and bl respectively. Following the censored
threshold approach as proposed by Cameron and Quiggin [4], an individual respondent is
considered to answer “yes” (“no”) on the willingness-to-pay question if her true, and unobserved,
WTP is greater (less) than the randomly assigned bid amount. Therefore, in the double bounded
case we face for each respondent four possible response outcomes: “yes/yes”, “no/no”, “yes/no”
and “no/yes”. Define the binary indicators rnni , rny
i , ryni and ryy
i to indicate this response
pattern: as an example, a “no-no” response corresponds to rnni =1 and rny
i = ryni = ryy
i =0. The
contribution to the log likelihood function from observation i is then
( ) ( ) ( )[ ] ( ) ( )[ ] ( )[ ]r F b r F b F b r F b F b r F bnni
l nyi
i l yni
h i yyi
hln ln ln ln+ − + − + −1 (4)

12
To estimate β0 and σ we maximize the global log likelihood function, i.e. the sum of the
expressions (4) for all individuals over the sample, subject to the constraint that F is a lognormal
distribution.
4.2. Empirical results
The estimates of the location and scale parameters $β0 and $σ of the lognormal distribution for the
WTP of the WA, RA and (WA+RA) protection programs are given in table III. The standard
errors indicate that these estimates are rather precise. On the basis of these results we computed
the mean and median WTP for the different programs and the corresponding 90 percent
confidence intervals.11 They are also shown in table 3 and represented in Figure 1. The means for
the WA, RA and (WA+RA) protection programs are 9800, 7600 and 9300 escudos
respectively.12 The estimated medians are significantly smaller. This reflects the asymmetric shape
of the lognormal probability distribution. The mean estimates are particularly sensitive to the right-
hand-side of the distribution, and thus to the respondents who say “yes/yes” to the higher stated
bid amounts. The median estimates are particularly sensitive to the left-hand-side of the
distribution, and thus to the respondents who say “no/no” to the stated bids. Since a great deal of
respondents say “no” to both WTP questions, this drags down substantially the median estimates
(when compared to the mean values) and we get median estimates that vary from 2200 escudos
for the RA protection program to 2700 escudos for the WA protection program.
Table III. Estimation results for the univariate case
Figure 1. Mean and median WTP estimates

13
These results are in line with those found in other studies. The mean WTP for the protection of
the Wilderness Area is similar to the results obtained by Diamond et al. [6] in their empirical study
on embedding. We follow their procedure for testing hypotheses (H1a) and (H1b). Estimation of a
pooled model for WA and (WA+RA) and computing the likelihood ratio test for the restriction of
identical location and variance parameters yields a value for the test statistic of 2.66. The same
exercise for RA and (WA+RA) gives a value of 2.92. Both values are well below the critical value
of 5.02 (Chi-square distribution with two degrees of freedom). We can therefore conclude that the
empirical evidence does not reject hypothesis (H1a) and (H1b): the WTP for WA is
approximately the same as the WTP for (WA+RA), and the WTP for RA is approximately the
same as the WTP for (WA+RA). In other words, the test results suggest
Finding 1. There is an embedding problem. The reported WTP-measures fail thescope test (H1 is not rejected).
As said before, this result can be interpreted in two possible ways. A first possibility is to see
the recreational use and the nonuse characteristics as pure substitutes. This does not seem to be a
very realistic hypothesis in our context, where the wilderness areas and the recreational areas
provide clearly different benefits to the survey respondents. A second possible interpretation
introduces the idea of the warm glow effect of giving. We can directly test the relevancy of this
second hypothesis by exploiting our information on the motivational structure of the respondents.
5. Computing the dry willingness in a multivariate setting
We will first introduce some interindividual variation in the estimation of the reported willingness-
to-pay measures. In a second step we compute the “dry” WTP (by cooling-off the warm glow)
and repeat the scope test for these corrected measures.

14
5.1.Explaining the interindividual variation in the WTP
To estimate the full model with all explanatory variables included, we maximize the likelihood
function derived from (4), but now with a complete multivariate specification as described in (2). A
large number of possible predictors are available to be integrated in the valuation function. In table
IV we show the results for a specification in which the explanatory variables are the individual
motivational factor scores, as computed in section 3 and various series of dummy variables to
represent the age of the respondent, his/her occupation/job, his/her educational level. The
reference individual is between 60 and 70 years old, has completed a medium level of secondary
studies and is now retired. We also include the number of individuals living in the household and
net household income. Finally we include indicators for the payment vehicle as described in the
survey instrument (taking the value 1 for a voluntary contribution) and for the protest bidders.13
Table IV. Explaining interindividual variation in the WTP
Depending on the respondent’s characteristics, the mean WTP for the protection programs
varies widely. Let us illustrate this by the results for the wilderness area where WTP estimates in
our sample range from about 200 escudos (for a low income worker of more than 50 years old
without university degree and with a low value for the existence motivation) to about 31,000
escudos (for a young high income respondent with a university degree and with a large value for
the existence motivation). While most of the results reported in table 4 speak for themselves, we
focus particular attention on the effects of the motivational factor scores.
The overall pattern is remarkably sensible. Respondents with a higher value on the “use”
motivation reveal a higher willingness-to-pay for the RA program. Differences in the existence
value motivation have a significant effect in all three programs, but most strongly in the WA

15
scenario. Most remarkably, the estimated coefficients regarding the ‘warm glow’ motivational
factor are statistically significant (p-value lower than .05) in all protection programs. Therefore, we
are able to reject Hypothesis (H3):
Finding 2. Our empirical evidence confirms the presence of a significant warmglow effect in the WTP responses. Respondents who are more sensitive to warmglow (or less resistant towards social pressure) ceteris paribus reveal a higherwillingness to pay.
At first sight the estimates in table IV suggest that the warm glow effect is different for the
different protection programs, i.e. for different valuation objects. Indeed, the warm glow marginal
effect seems to be somewhat weaker in the (WA+RA) scenario. However, formal testing does not
corroborate that impression. The likelihood ratio test statistic for the restriction of equal warm glow
effects in the three equations is 0.048, well below the 5% critical level of the chi-square distribution
with 2 degrees of freedom. This result suggests that the individual respondents get, at the margin,
the same moral satisfaction from each escudo contributed, independently of the public good they
are evaluating.
5.2. Computing the dry willingness to pay
The results in the previous subsection pave the way for the final step in our exercise: the calculation
of the “dry” measures. As we have seen the respondent’s motivational factor scores are computed
on the basis of her answers upon the motivational questions using a five point semantic differential
scale "I completely agree ", "I agree", "Sometimes I agree, sometimes I disagree", "I disagree" and
"I completely disagree". For the warm glow the main motivational items are M8, M12, M15, M20
and M23 (see appendix and table 2). Let us now take the position of a Mr. Scrooge, who is
completely insensitive to the warm glow effect: he will answer "I completely disagree" on all these
five motivational items. We define the resulting factor score for the warm glow effect as drywgm , the

16
score that would characterize a respondent whose motivation profile is free from any feeling of well
being or satisfaction generated by the act of giving. Assuming that all the respondents share Mr.
Scrooge’s warm glow motivation, we can use equation (3) to predict a mean WTP measure free
from any embedding due to warm glow feelings, i.e. a dry WTP value.
Figure 2. Mean WTP versus mean dry WTP estimates
The dry WTP estimation results are plotted against the original reported estimates in Figure 2.
It is immediately obvious from these results that drying the stated WTP responses from warm glow
does induce a significant reduction of the final mean estimates. Our procedure also leads to better
results concerning the scope test (H4a) and (H4b). We use the Wilcoxon-Mann-Whitney test
assuming that the two distributions, the sum of the individual WTP measures and the joint WTP
measure, have the same general shape, but that one of them is shifted relative to the other by a
constant amount under the alternative hypothesis14. Both hypotheses (H4a) and (H4b) are
significantly rejected (P-values smaller than .01). We can therefore now go further and also test the
(stronger) adding-up hypothesis (H5). According to the same Wilcoxon-Mann-Whitney test the
P-value is 0.72, well above the 5% cutoff. We cannot reject the hypothesis that the mean dry
WTP value attached to preserving the WA and RA jointly is equal to the sum of the mean dry
WTP values attached to preserving the two areas individually. Therefore we can summarize our
results as
Finding 3. The dry WTP-measures, i.e. after correcting for the warm glow-effect, satisfy both the scope test and the adding-up test.
6. Conclusion
Let us first take an ambitious position with respect to our results. In an optimistic mood, we could

17
claim that the use of motivational information has enabled us to show that the embedding problem
in CV applications is linked to the warm glow effect. Moreover, our procedure to operationalize
and estimate a dry WTP, i.e. a WTP measure for the case in which all respondents would be free
from a general feeling of well-being or satisfaction generated by the act of giving, has worked
reasonably well. The dry WTP estimates are lower than the original estimates and formal testing
has shown that they do not violate the adding-up property.
If one accepts the view that the original WTP estimates do not reflect “economic preferences”
because they contain an altruistic motive and should therefore not be used for cost-benefit
exercises [14], this procedure of “drying” out the altruistic motive might offer a way-out. Further
refinement of our method could even lead to a better distinction between the different components
of “altruism”. On the other hand, it seems also possible to take the position that our results indicate
the existence of a stable and measurable warm glow component in individual preferences and that
this evidence offers a satisfactory explanation for the problems with the embedding effect. In a
certain sense this explanation paves the way for the direct use of the uncorrected original WTP
measures. After all, at least since Arrow [3] the modern theory of social choice has emphasized
that it was immaterial whether individual’s preferences reflected selfish interest or moral judgement:
“The individual may order all social states by whatever standards he deems relevant”.
Caution is needed, however, and we would argue in favor of a less ambitious interpretation of
our results. Since this paper is one of the first attempts to introduce attitudinal information into the
analysis of CV answers, our results for the scope and the adding-up effect with the dry measures
must rather be seen as provisional. Conclusions on the usefulness of CV methods and on the so-
called “economic” nature of the resulting preferences must therefore be drawn cautiously. It is not
obvious that similar results would be found with other samples, other questionnaires and for other

18
environmental commodities. However, even in this more cautious interpretation, it still seems fair to
claim that the methodology we propose to measure and incorporate motivational information has
worked reasonably well and is promising. Moreover, the evidence that the warm glow effect has
an important influence on the WTP answers seems to be rather robust. The use of direct attitudinal
information may play a crucial role to get a better understanding of the real content of CV answers.
Acknowledgments
The authors thank John Loomis and Stef Proost for invaluable help in setting up the study and for
many interesting comments. Paulo Nunes acknowledges the Portuguese Ministry of Science
(contract BD/2622/93-RO) and the European Commission (contract ENV4-CT96-5050) for
financial support.
References
1. Andreoni, J., Giving with impure altruism: applications to charity and Ricardian equivalence,Journal of Political Economy 97(6), 1447-1458 (1989).
2. Andreoni, J., Impure altruism and donations to public goods: a theory of warm-glow giving,Economic Journal 100, 464-477 (1990).
3. Arrow, K., “Social choice and individual values”, New York: Wiley (1951)
4. Cameron, T., Quiggin, J. Estimation using contingent valuation data from a dichotomouschoice with follow-up questionnaire, Journal of Environmental Economics andManagement 27, 218-234 (1994)
5. Carson, R., Contingent valuation surveys and tests of insensitivity to scope, in Kopp, R. et al.(eds.), “Determining the value of non-marketed goods”, The Netherlands: KluwerAcademic Publishers, chapter 6 (1997)
6. Diamond, P., Hausman, J., Leonard, G., Denning, M., Does contingent valuation measurepreferences? Experimental evidence, in Hausman, J. (ed.), “Contingent valuation: a criticalassessment”, New York: North-Holland, 41-85 (1993)
7. Hanemann, W., Loomis, J., Kanninen, B., Statistical efficiency of double-boundeddichotomous choice contingent valuation, American Journal of Agricultural Economics73(4), 1255-1263 (1991)

19
8. Harman, H., “Modern factor analysis”, Chicago: Chicago University Press (1976).
9. Hausman, J. (ed.), “Contingent valuation: a critical assessment”, New York: North-Holland(1993).
10. Johnson, N., Kotz, S. “Continuous univariate distributions”, New York: Wiley (1970).
11. Kahneman, D., Knetsch, J., Valuing public goods: the purchase of moral satisfaction, Journalof Environmental Economics and Management 22, 57-70 (1992).
12. Lehmann, E., “Nonparametrics: statistical methods based on ranks”, San Francisco: Holden-Day (1975).
13. Likert, R. The Method of Constructing an Attitude Scale, in Fishhbein (ed.), “Readings in, 90-95. Originally in Archives of Psychology,140, 44-53,
Columbia University Press (1967).
14. Milgrom, P., Is sympathy an economic value? Philosophy, economics and the contingentvaluation method, in Hausman, J. (ed.), “Contingent valuation: a critical assessment”, NewYork: North-Holland, 417-435 (1993).
15. Nunes, P., “Contingent valuation of the benefits of natural areas and its warmglowcomponent”, Katholieke Universiteit Leuven: Ph.D. thesis (2000).
16. Schkade, D., Payne, J., Where do the numbers come from? How people respond tocontingent valuation questions, in Hausman, J. (ed.), “Contingent valuation: a criticalassessment”, New York: North-Holland, 271-293 (1993).
17. Schkade, D., Payne, J., How people respond to contingent valuation questions: a verbalprotocol analysis of willingness to pay for an environmental regulation, Journal ofEnvironmental Economics and Management 26, 88-109 (1994).
18. Schokkaert, E., Van Ootegem, L., Preference variation and private donations, in Gérard-Varet, L.-A., Kolm, S.-C., Mercier-Ythier, J. (eds.), “The economics of reciprocity,giving and altruism”, London: Macmillan, 78-95 (2000).
19. Thompson, S., “Sampling”, New York: John Wiley (1992).

20
APPENDIX1. My family and I would have great pleasure in knowing that the SIC, RTP and TVI
together have agreed in introducing in their TV schedule more documentary filmsabout wildlife and its natural habitats.
2. My family and I think that the preservation of the Alentejo coast line isimportant because this is a place which all of us can visit and where we can seevery beautiful natural landscapes. (‘use’)
3. My family and I like to see the Portuguese government giving more support to thenational organizations that are promoting work in the field of environmentconservation. (‘warmglow’)
4. My family and I think that the preservation of the Parks is important becausethese are privileged places where everybody may enjoy a walk or a picnic in arelaxed environment. (‘use’)
5. My family and I take great satisfaction in knowing that it is today guaranteedthat our children, and future generations, will continue to have the possibilityof observing wildlife in its natural habitat. (‘use’)
6. Despite the fact that my family and I may never see an otter in its naturalhabitat, we would be very worried if the total population of otters in Portugalbecame extinct. (‘existence’)
7. My family and I like to spend the weekends at home or going to the movies ratherthan going out for a walk in the countryside or by the beach. (‘use’)
8. Our family admires the individuals who, on voluntary basis, participate incollecting donations for national programs for social aid and solidarity.(‘warmglow’)
9. My family and I take great pleasure in knowing that we are still able to visitvillages in Alentejo which keep their true identity and their typical houses,facades and streets. (‘use’)
10. Despite the fact that my family and I may never see an Iberian lynx in itsnatural habitat, we are very happy to know that we have the guarantee that thelynx is kept safe from extinction in Portugal. (‘existence’)
11. My family and I think that the preservation of the natural areas is importantsince they are privileged sites for recreational activities like sightseeing orbiking in a natural environment. (‘use’)
12. There are some funding campaigns to which my family and I feel very close andtherefore we do not hesitate to contribute a donation. (‘warmglow’)
13. Despite the fact that my family and I may never visit a Natural Park, we arevery happy to see these natural areas protected so that other Portuguesecitizens may also have the possibility to observe wildlife in its naturalhabitat.(‘use’)
14. My family and I think that the preservation of the Alentejo coast line isimportant because this is a privileged place where all of us may enjoy going tothe beach in a relaxed environment and being in contact with nature. (‘use’)
15. It is difficult for me to decline my help to other individuals who, either inthe streets or at my door, beg for charity. (‘warmglow’)
16. Whenever I am approached by identified personnel, it is not difficult for me torefuse to make a financial contribution to a national fund raising campaign.(‘warmglow’)
17. The protection of the forests is very important because for Portugal they are avery important source of wealth. (‘use’)
18. With the increasing use of the media in our elementary schools as well as anincreasing number of school visits to the Zoo, it will no longer be important totake the children on educational trips to the Natural Areas. (‘use’)
19. Sometimes our help in national fund raising campaigns is explained because wecome under observation and feel “socially-pressed” to contribute, and thereforewe do not decline to make a contribution. (‘warmglow’)
20. I am happy with myself whenever I give a financial contribution to national fundraising campaigns. (‘warmglow’)
21. With the Portuguese participation in the EU, the preservation of our nationaldiversity is no longer so important since we are constructing a common andshared European culture.(‘existence’)

21
22. Despite the fact that my family and I may never observe an eagle in nature, wetake great pleasure in knowing that the eagles are kept safe from extinction.(‘existence’)
23. My family and I like to contribute to good causes such as the protection of theenvironment, and whenever we can afford it, we do not decline our help to suchfund raising campaigns. (warmglow)
24. Giving blood is giving life. (‘warmglow’)25. During the holidays, my family and I prefer to stay home or to go to the beach
rather than travelling around Portugal visiting our traditional villages.(‘use’)
26. My family and I think that the preservation of the Alentejo coast line isimportant because in this way we are protecting a typical lifestyle of the localinhabitants, which belongs to our national identity. (‘use’)
22
Table I. Survey descriptive statistics
Respondent age (years) 20-29 30-39 40-49 50-59 60-69 +69(%) 19 20 22 17 14 8
Household size One Two Three Four Five > 5(%) 7.5 21.8 26.9 29.1 14.0 0.0
Schooling years < 4 5-6 7-9 10-11 12 >12(%) 11 39 21 10 11 8
Table II. Factor loadings after varimax rotation
Attitudinal items FACTOR 1 FACTOR 2 FACTOR 3
M14 70 * 21 18M2 67 * 19 15M4 63 * 16 14
M11 63 * 16 27M13 61 * 19 25M9 58 * 17 26
M26 58 * 17 20M5 56 * 4 19M1 47 * 13 19
M12 18 60 * 13M23 25 58 * 10M20 14 57 * 3M8 8 56 * 6
M15 6 47 * 4M10 36 8 71 *M22 35 15 66 *M6 29 9 62 *
Note: the exact wording of the items is given in the Appendix.

23
Table III. Estimation results for the univariate case
WA Protection Program RA Protection Program (WA+RA) Protection Program
Estimate Standard Error Estimate Standard Error Estimate Standard ErrorLocation 7.918 0.092 7.710 0.094 7.751 0.077
Scale 1.598 0.096 1.577 0.100 1.662 0.084Log-likelihood -515.25 -488.62 -807.72
Mean 9 800 7 600 9 300[6 700 - 14 600]* [5 200 - 11 700]* [6 600 - 13 300]*
Median 2 700 2 200 2 300[2 400 - 3 200]* [1 900 - 2 600]* [2 100 - 2 600]*
* 90% confidence interval
Figure 1. Mean and median WTP estimates
9800
2700 2300
9300
2300
7600
0
2000
4000
6000
8000
10000
12000
14000
16000
DC-mea
n
DC-med
ian
DC-mea
n
DC-med
ian
DC-mea
n
DC-med
ian
WA RA (WA+RA)

24
Table IV. Explaining interindividual variation in the WTP
Protection ProgramsWA RA (WA+RA)
Parameters Est. Sd. Er. p-val. Est. Sd. Er. p-val. Est. Sd. Er. p-val.
factor scores‘use’ .091 .12 .47 .291* .13 .02 .165 .11 .13
‘warm glow’ .536* .14 .00 .448* .12 .00 .238* .11 .04‘existence’ .438* .12 .00 .254* .14 .08 .233* .11 .03
area‘rural’ .390 .33 .23 -1.04* .37 .00 .019 .29 .94
‘urban’ .148 .23 .53 .336 .21 .12 .094 .18 .60
age20’s .710 .48 .14 1.403* .50 .00 .774* .40 .0530’s .956* .49 .05 1.447* .46 .00 .655* .36 .0740’s .279 .48 .56 .885* .44 .04 .431 .35 .2250’s .242 .41 .56 .954* .41 .02 .225 .33 .4470’s -.388 .47 .41 .034 .45 .93 -.598 .42 .15
occupationexecutives .891 .68 .19 -.964 .63 .12 -.565 .53 .29scientists .330 .58 .57 -.341 .59 .56 -1.51* .54 .00
technicians -.006 .50 .98 -.736 .48 .12 -.121 .42 .77administrative .729 .50 .14 -.751 .46 .10 -.269 .42 .52sales services -.899* .51 .08 -.496 .46 .28 -1.04* .43 .01
Farmers, fishers .242 .72 .73 -1.09 .77 .37 -2.68* 1.28 .03Craftsmen .295 .47 .54 -.615 .46 .18 -.170 .39 .66
Assembly work -1.045* .61 .08 .081 .59 .89 .047 .60 .93Unskilled work .020 .66 .98 -.723 .61 .24 -1.39* .58 .01Housekeepers -.295 .45 .51 -.790* .45 .07 -.314 .36 .39Work students -1.683* .87 .05 -.305 .77 .69 -.986 .77 .20
EducationPrimary (freq.) .057 .62 .92 .201 .60 .73 -.521 .59 .38
primary 1.045* .52 .04 .318 .47 .50 -.751 .52 .15Secondary: low 1.262* .51 .01 .171 .45 .14 -.770 .49 .11Secondary: high .963* .53 .07 -.087 .44 .84 -.258 .50 .61
University 1.000* .45 .02 -.000 .54 .99 .871* .51 .09
Payment vehicle -.094 .20 .64 -.370* .19 .05 -.311 .20 .12Net income .157* .09 .09 .291* .10 .00 .017 .08 .82Household -.124 .11 .25 -.082 .09 .38 .099 .08 .22Protesters -1.79* .31 .00 -2.02* .32 .00 -1.38* .27 .00
Intercept ( β ) 6.589 6.899 8.243
Scale ( σ ) 1.292 1.195 1.576Log-Likelihood -305.06 -279.10 -573.12
* Significant at 10%

25
Reference group: respondent in her 60s, with a medium level of secondary studies, now retired.

26
Figure 2. Mean WTP versus mean dry WTP estimates
0
2000
4000
6000
8000
10000
12000
1 PROGRAM WA PROGRAM RA PROGRAM (WA+RA)
Por
tugu
ese
Esc
udos
7200
9600
2700
3500
6000
9300

27
End notes:
1 But this is not always the case! Carson [5] reviews over 30 studies using split-sample tests, which all clearly
reject the hypothesis that respondents are insensitive to the scope of the good being valued.2 Schkade and Payne [16, 17] analyze the verbal protocols of a CV-study and find that some respondents
vocalize a parallel with charitable contributions when answering the WTP survey. Moreover, the variablesfrom the verbal protocol show a significant relationship with the WTP-answers.
3 More detailed information on the questionnaire and the sample design can be found in Nunes [14].4 See the Appendix for the exact wording of the attitudinal items.5 This way we avoid potential multicollinearity problems when estimating equation (2).6 The factor loadings are analogous to standardized regression coefficients. Dropping for our interpretation
attitudinal items which do not score above 0.45 - to be seen as a kind of minimum correlation bound - meansthat we follow an exploratory rule based on the magnitude of the estimated regression coefficients. Items thathave a low correlation with the common factors are not taken into consideration.
7 The two largest ones are M14 (“Preservation of the Alentejo coast line is important because this is aprivileged place where all of us may enjoy going to the beach in a relaxed environment and being in contactwith nature”) and M2 (“…because this is a place which all of us can visit and where we can see very beautiful
8 The two main items are M12 (“There are some funding campaigns to which my family and I feel very close andtherefore we do not hesitate to contribute a donation”) and M23 (“My family and I like to contribute to goodcauses such as the protection of the environment and whenever we can afford it, we do not decline our helpto such fund raising campaigns”).
9 The largest loading is for item M10 (“Despite the fact that my family and I may never see an Iberian lynx in itsnatural habitat, we are very happy to know that we have the guarantee that the lynx is kept safe fromextinction in Portugal”). Items M22 and M6 convey the same idea for the eagle and the otter.
10 Nunes [14] compares the results for the lognormal distribution with those for the Weibull, the exponentialand the loglogistic function. Although the Weibull distribution provides the best fit according to the AkaikeInformation Criterion, the lognormal distribution does not do much worse and is preferred for interpretationalreasons.
11 For the lognormal distribution, the mean WTP is given by )ˆ5.0ˆexp( 2σβ+ and the median by )ˆexp( β . For adetailed discussion refer to Johnson and Kotz [10] Calculations are performed using SAS® programming.
12 Which corresponds to 48, 36 and 45 Euro, respectively.13 All individuals with no/no answers were asked about their reasons for this answer. Those who answered that
they did not want to pay because “they do not believe in the described tax scheme/national fund campaign“do not agree with this type of question”, “believe that this questionnaire is not the best way to approach thetopic” and “do not accept any increase in taxes/any participation in a funding campaign” were considered tobe protest voters - see Nunes [14] for more details.
14 For a detailed discussion of this test refer to Lehmann [12].