Electrical characterization of atmospheric pressure arc plasmas
11
Eur. Phys. J. D 28, 241–251 (2004) DOI: 10.1140/epjd/e2003-00301-8 T HE EUROPEAN P HYSICAL JOURNAL D Electrical characterization of atmospheric pressure arc plasmas An overview C. Fanara 1, a and L. Vilarinho 2, b 1 School of Industrial and Manufacturing Science - Cranfield University MK430AL Cranfield, UK 2 Federal University of Uberlˆandia, Campus Santa Mˆ onica, 38400-902, Uberlˆandia/MG, Brazil Received 20 August 2003 Published online 2nd December 2003 – c EDP Sciences, Societ`a Italiana di Fisica, Springer-Verlag 2003 Abstract. The properties of atmospheric pressure arcs are investigated by means of electric exploration of plasma column and anode region. For the electrostatic probe technique, where the level of collisionality distorts the characteristic curve, data interpretation is difficult because no comprehensive underlying theory exists for the non-homogeneous electric arcs used in industry. Results are presented from an extended study of Langmuir probes applied to short, point-plane arcs. A multi-wire apparatus, operating for arc currents in the range 50–200 A is described and ion current densities and temperature maps are shown. The reduction of the probe determined temperature with respect to emission spectroscopy values is discussed and the “cooling” is ascribed to ion-electron recombination within the perturbation region formed around the probe. This region is investigated by means of emission spectroscopy and the extension found agrees both with numerical estimations and fast speed camera photographs. Diamond Like Carbon (DLC) partially coated wires can address data inversion problems and the role of arc flow directionality on charge capture and preliminary observations are shown. Charge capture and anode fall structure can be investigated using a “split-anode” technique. A prototype of a modified apparatus is described and preliminary results on the collected current are given. PACS. 52. Physics of plasmas and electric discharges – 52.80.Mg Arcs; sparks; lightning; atmospheric electricity – 52.70.-m Plasma diagnostic techniques and instrumentation 1 Introduction Atmospheric plasmas are widely used in technological pro- cesses, from metal welding and cutting (TIG arcs) to spray technologies for the coating industry. The region of inter- est for the atmospheric pressure arc on a density tem- perature (n, T ) diagram is shown in Figure 1a, the torch assembly for the TIG arc is depicted in Figure 1b. Among the techniques used for the characterisation of laboratory plasmas, emission spectroscopy is one of the most em- ployed but it suffers from the lower temperature limit (9–10 000 K [1,2]) so that TIG arc plasma edge tempera- tures are not measurable. In contrast, the relatively sim- pler electric (Langmuir) probe [3,4] can investigate lower temperature regions. The main goal of this work is the determination of key parameters of industrial arc plasmas, namely electrical ra- dius, plasma potential, temperature, current density, using the electrostatic probe technique extended to partially in- sulated probes and by detecting the current at the anode. In addition to the traditional Langmuir probes, which de- liver line-averaged signals which require Abel inversion, a e-mail: [email protected] b e-mail: [email protected] wires whose surface is partly coated with diamond like carbon (DLC) have been constructed. These allow exam- ining local signals and the influence of the directionality of the arc flow. A modified version of the split-anode tech- nique is described, which is capable to collect the current impinging on the anode electrode. The electrostatic Langmuir Probe technique benefits from simplicity of operation, although the interpretation of the data presents difficulties under typical atmospheric pressure flowing conditions. Several classification criteria were investigated and the results believed to be applicable to the present study were summarized in [4,5]. None of the available theories is fully applicable to the given experi- mental conditions and particularly, the interpretation of the characteristic V -I curve is difficult. Temperature mea- surements performed by Gick et al. [3] made use of the ion saturation part of the V -I curve, the only available under these experimental conditions, but gave values lower by a factor two than the spectroscopic results. In this work a method similar to Gick is employed. However, because of this flow-induced cooling in the perturbation region (PR) forming around probes, an estimate of the extension of the latter was obtained by the comparison of emission spec- troscopy line intensities in presence and absence of probes. Section 2 describes the probes experimental apparatus,
-
Upload
independent -
Category
Documents
-
view
1 -
download
0
Transcript of Electrical characterization of atmospheric pressure arc plasmas
Eur. Phys. J. D 28, 241–251 (2004)DOI: 10.1140/epjd/e2003-00301-8 THE EUROPEAN
PHYSICAL JOURNAL D
Electrical characterization of atmospheric pressure arc plasmas
An overview
C. Fanara1,a and L. Vilarinho2,b
1 School of Industrial and Manufacturing Science - Cranfield University MK430AL Cranfield, UK2 Federal University of Uberlandia, Campus Santa Monica, 38400-902, Uberlandia/MG, Brazil
Received 20 August 2003Published online 2nd December 2003 – c© EDP Sciences, Societa Italiana di Fisica, Springer-Verlag 2003
Abstract. The properties of atmospheric pressure arcs are investigated by means of electric exploration ofplasma column and anode region. For the electrostatic probe technique, where the level of collisionalitydistorts the characteristic curve, data interpretation is difficult because no comprehensive underlying theoryexists for the non-homogeneous electric arcs used in industry. Results are presented from an extended studyof Langmuir probes applied to short, point-plane arcs. A multi-wire apparatus, operating for arc currents inthe range 50–200 A is described and ion current densities and temperature maps are shown. The reductionof the probe determined temperature with respect to emission spectroscopy values is discussed and the“cooling” is ascribed to ion-electron recombination within the perturbation region formed around theprobe. This region is investigated by means of emission spectroscopy and the extension found agrees bothwith numerical estimations and fast speed camera photographs. Diamond Like Carbon (DLC) partiallycoated wires can address data inversion problems and the role of arc flow directionality on charge captureand preliminary observations are shown. Charge capture and anode fall structure can be investigated usinga “split-anode” technique. A prototype of a modified apparatus is described and preliminary results on thecollected current are given.
PACS. 52. Physics of plasmas and electric discharges – 52.80.Mg Arcs; sparks; lightning; atmosphericelectricity – 52.70.-m Plasma diagnostic techniques and instrumentation
1 Introduction
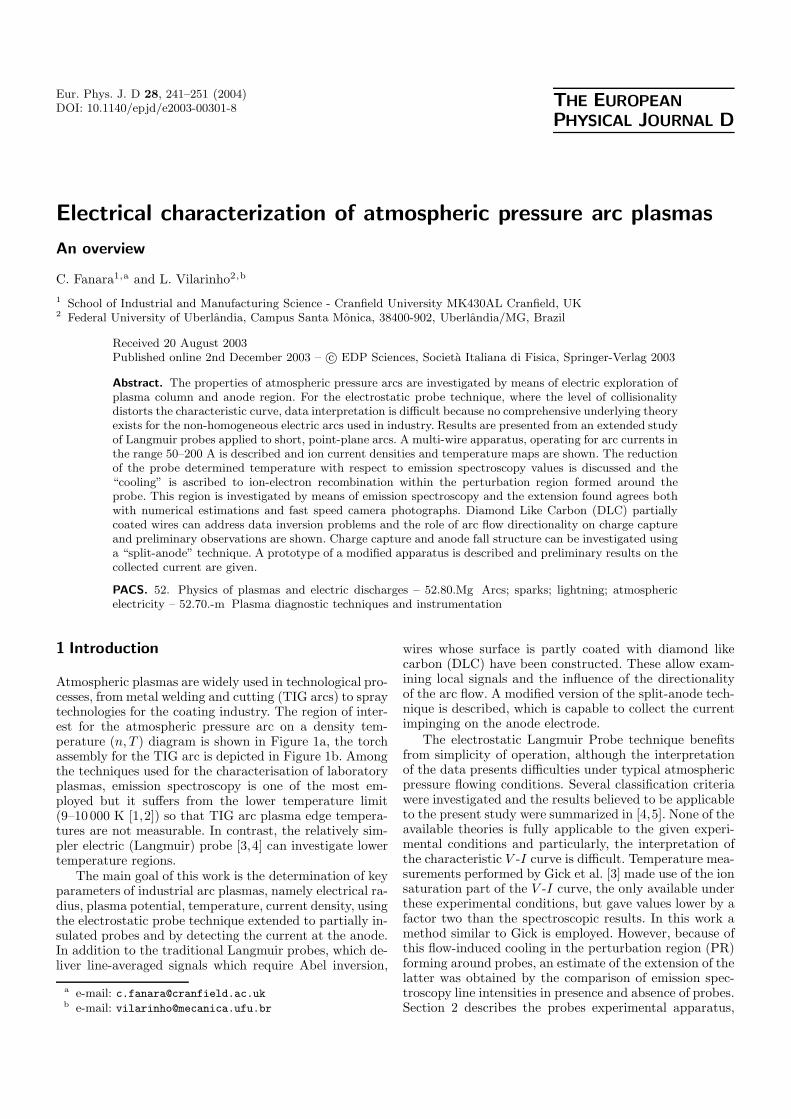
Atmospheric plasmas are widely used in technological pro-cesses, from metal welding and cutting (TIG arcs) to spraytechnologies for the coating industry. The region of inter-est for the atmospheric pressure arc on a density tem-perature (n, T ) diagram is shown in Figure 1a, the torchassembly for the TIG arc is depicted in Figure 1b. Amongthe techniques used for the characterisation of laboratoryplasmas, emission spectroscopy is one of the most em-ployed but it suffers from the lower temperature limit(9–10 000 K [1,2]) so that TIG arc plasma edge tempera-tures are not measurable. In contrast, the relatively sim-pler electric (Langmuir) probe [3,4] can investigate lowertemperature regions.
The main goal of this work is the determination of keyparameters of industrial arc plasmas, namely electrical ra-dius, plasma potential, temperature, current density, usingthe electrostatic probe technique extended to partially in-sulated probes and by detecting the current at the anode.In addition to the traditional Langmuir probes, which de-liver line-averaged signals which require Abel inversion,
a e-mail: [email protected] e-mail: [email protected]
wires whose surface is partly coated with diamond likecarbon (DLC) have been constructed. These allow exam-ining local signals and the influence of the directionalityof the arc flow. A modified version of the split-anode tech-nique is described, which is capable to collect the currentimpinging on the anode electrode.
The electrostatic Langmuir Probe technique benefitsfrom simplicity of operation, although the interpretationof the data presents difficulties under typical atmosphericpressure flowing conditions. Several classification criteriawere investigated and the results believed to be applicableto the present study were summarized in [4,5]. None of theavailable theories is fully applicable to the given experi-mental conditions and particularly, the interpretation ofthe characteristic V -I curve is difficult. Temperature mea-surements performed by Gick et al. [3] made use of the ionsaturation part of the V -I curve, the only available underthese experimental conditions, but gave values lower by afactor two than the spectroscopic results. In this work amethod similar to Gick is employed. However, because ofthis flow-induced cooling in the perturbation region (PR)forming around probes, an estimate of the extension of thelatter was obtained by the comparison of emission spec-troscopy line intensities in presence and absence of probes.Section 2 describes the probes experimental apparatus,
242 The European Physical Journal D
(a) (b)
Fig. 1. (a) Location of atmospheric pressure arcs on a (n, T ) diagram, (b) nozzle and cathode configuration.
(a) (b)
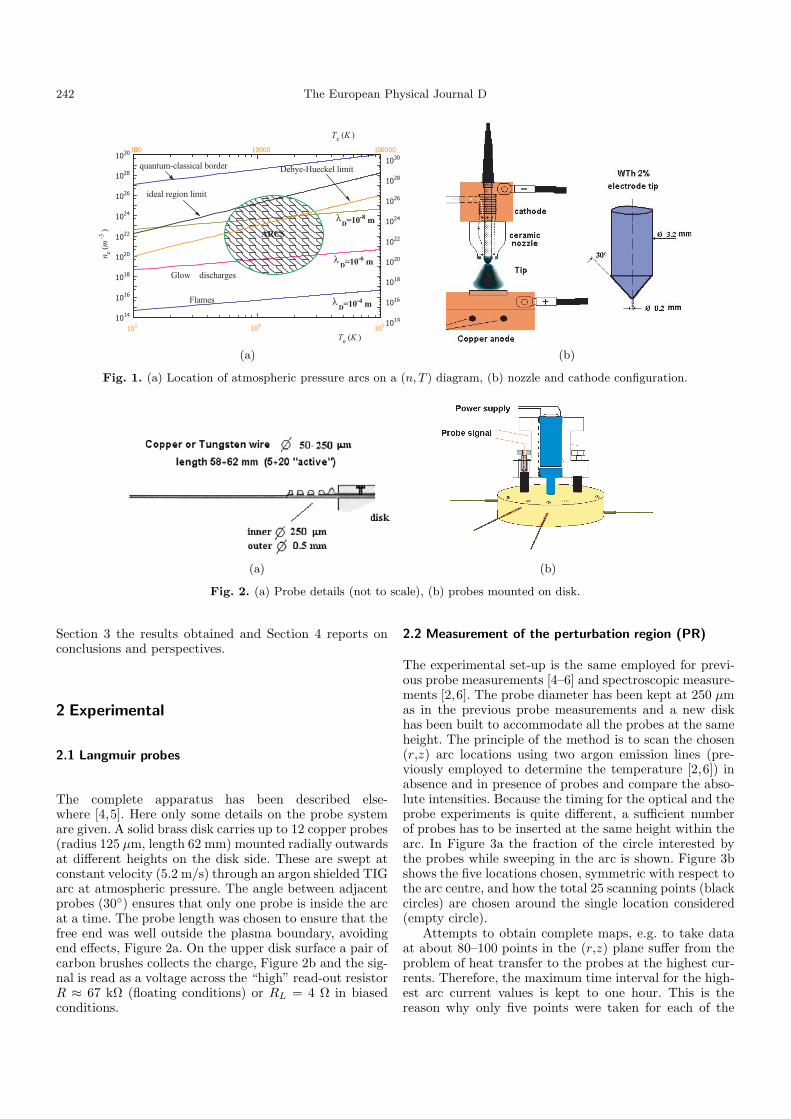
Fig. 2. (a) Probe details (not to scale), (b) probes mounted on disk.
Section 3 the results obtained and Section 4 reports onconclusions and perspectives.
2 Experimental
2.1 Langmuir probes
The complete apparatus has been described else-where [4,5]. Here only some details on the probe systemare given. A solid brass disk carries up to 12 copper probes(radius 125 µm, length 62 mm) mounted radially outwardsat different heights on the disk side. These are swept atconstant velocity (5.2 m/s) through an argon shielded TIGarc at atmospheric pressure. The angle between adjacentprobes (30) ensures that only one probe is inside the arcat a time. The probe length was chosen to ensure that thefree end was well outside the plasma boundary, avoidingend effects, Figure 2a. On the upper disk surface a pair ofcarbon brushes collects the charge, Figure 2b and the sig-nal is read as a voltage across the “high” read-out resistorR ≈ 67 kΩ (floating conditions) or RL = 4 Ω in biasedconditions.
2.2 Measurement of the perturbation region (PR)
The experimental set-up is the same employed for previ-ous probe measurements [4–6] and spectroscopic measure-ments [2,6]. The probe diameter has been kept at 250 µmas in the previous probe measurements and a new diskhas been built to accommodate all the probes at the sameheight. The principle of the method is to scan the chosen(r,z) arc locations using two argon emission lines (pre-viously employed to determine the temperature [2,6]) inabsence and in presence of probes and compare the abso-lute intensities. Because the timing for the optical and theprobe experiments is quite different, a sufficient numberof probes has to be inserted at the same height within thearc. In Figure 3a the fraction of the circle interested bythe probes while sweeping in the arc is shown. Figure 3bshows the five locations chosen, symmetric with respect tothe arc centre, and how the total 25 scanning points (blackcircles) are chosen around the single location considered(empty circle).
Attempts to obtain complete maps, e.g. to take dataat about 80–100 points in the (r,z) plane suffer from theproblem of heat transfer to the probes at the highest cur-rents. Therefore, the maximum time interval for the high-est arc current values is kept to one hour. This is thereason why only five points were taken for each of the

C. Fanara and L. Vilarinho: Electrical characterization of atmospheric pressure arc plasmas 243
(a) (b)
Fig. 3. (a) Set-up with 10 probes. The disk to arc centre distance is shown with a possible arc diameter [5]. The limiting anglefor the shadowing to occur is also indicated (≈ 35.3). (b) The five probe positions within the arc (empty circles) and choice ofthe corresponding 25 points to be scanned (full circles) to measure the PR extension. All distances in mm.
measurements (z = 3.75 (4.0 mm at 200 A), z = 2.5 atr = 0, on axis, and r = ±1 mm and z = 1.25 to 1.40 mmfrom the anode). The spectroscopy procedure consists intaking readings at 25 points, 12 per side of each of thechosen locations (12 up-stream, 12 down-stream, and theprobe location). The total spectrometer read-out time isof the order of 2 seconds per point. “Blank” will alwaysindicate emission intensities taken in absence of probes.
A fast CCD camera with digital output was used forthe photographs, with a 0.5 m focal lens (Phantom V4.0,arc magnification: 6:1; 2 000 frames per second, resolution512 × 256 pixels, exposure time 10 µs). The probes weremounted as in the spectroscopic experiment for the 5 mmarc, but additional photographs were taken of the 10 mmarc at the positions z = 2.5, 5.0, 7.5 mm from the anodewith various lens apertures at arc currents of 50, 100 and200 A.
2.3 Anode detector
In earlier attempts to investigate the arc anode region bymeans of the “split anode” technique [7,8], an arc travelledacross the interface of two conducting blocks, insulatedfrom each other by air or mica. The technique sufferedfrom the need of a double Abel inversion to reconstructthe local information originating from a variable anodesurface area. In the present approach, a modified versionhas been constructed (Fig. 4). The split anode was madeof two water-cooled copper blocks separated by a sand-wiched copper strip (Goodfellow 120 length mm, height20 mm, thickness 50 µm) insulated with two r©Kaptonfoils (thickness 25 µm).
The current signal is read out of a 50 µm insulatedcopper strip clamped between the two anode blocks (com-mon). This set-up reduces the geometry of the problemfrom two to one dimension.
Fig. 4. The modified split anode.
3 Results and discussion
3.1 Langmuir probes
A typical set of peaks is shown in Figure 5 for biasedconditions. The highest signal amplitudes correspond tothe probes that are the furthest from the anode surface(the anode is taken as reference for the voltage scale).
Once Abel inverted, the signals are used to constructthe characteristic curves (V I). The V I curve method canbe used to determine electron temperatures, charged par-ticle density and plasma potential. Figure 6 shows theion portion (to the left of each graph) and the electronretarding region (steeper part) of the curves obtained byvarying the bias (note that the curve is folded with respectto “textbook VI curve” [9]).
These are the only regions obtainable in the columnof TIG arcs. Due to the much higher electron mobility,it is not possible to obtain the electron saturation regionwithin these experimental limits. It can be observed thatclear ion saturation occurs at “low” arc currents (Fig. 4a,50 A) the more so the lower the probe height within

244 The European Physical Journal D
Fig. 5. Peak widths for all probes under specific bias voltage−21.1 V, close to ion saturation.
the arc. At higher arc currents ion saturation is less ev-ident (Fig. 6b, 150 A). The ion saturation part can beused to infer the temperature assuming either a Contin-uum plus free-fall model [10,11] or a ion random flux to-wards the thin sheath [3,4]. The construction of a current-temperature relationship [3] using data by Olsen [12]permits to obtain the temperature. However, the latter issignificantly lower than the values obtained from emissionspectroscopy [6] in both the collection models considered,see Figure 7. The (steady-plasma) Continuum plus Free-Fall model provides somewhat higher values, although re-cent studies [5] demonstrated that the random model isthe most appropriate for the system under study.
The temperature depression (“cooling”), due to rel-ative arc probe motion has been ascribed to electron-ion recombination within the perturbation region form-ing around the probe [5]. It should be mentioned that thelatter fully embeds the thin electrical sheath so that thetemperature refers to the PR and not to the bulk of theplasma.
An axial plasma potential is obtainable from probevoltage measurements performed in floating conditions inthe hypothesis of constant “contact” potential along thearc height and negligible radial field component (Fig. 8).Because this assumption is questionable, as an alterna-tive, the plasma potential can be obtained from the probe-determined temperature. Corrections for the flow inducedcooling permit comparisons with the literature. For lowarc current (I = 50 A) the corrections are detrimentalwith respect to the data in the literature. In contrast,at higher arc currents, the correction leads to substantialagreement with the computed values by Sansonnes andLowke [13]. In this case it is noteworthy that the forecastof a voltage inversion in the arc column, i.e. far from theelectrode sheaths, is reproduced experimentally.
A floating arc radius can be obtained by taking thehalf width of the peaks obtained in floating conditions.Under these conditions, the current collected by the probeis practically zero, i.e. no substantial charge conductioncan be expected at these distances from the arc axis. In
(a)
(b)
Fig. 6. Example of characteristic curves obtained from probesin TIG arc. The ion saturation part is shown but the steepregion is only partial. (a) 50 A, (b) 150 A.
contrast, the current carrying radius can be defined asthe half width of the ion current density signal at ionsaturation. This is the region where the conduction takesplace. Beyond this radial distance, the charge collected isclose to zero, which justifies the nomenclature of the regionas “electrical halo”. For example, Figure 9 shows the tworadii at 50 and 200 A. Both radii increase with total arccurrent. The number of collected ions (measured current)has been compared with the number of ions present at thesame location and temperature based on the hypothesisof LTE.
It was shown that the collected absolute number ofparticles (within the probe elemental volume) is up totwo orders of magnitude lower than the number of par-ticles contained within the same volume in LTE condi-tions [5]. Bearing in mind the degree of uncertainty in boththe directly measured and in the temperature-computednumber of particles, still it appears that the hypothe-sis of a probe collecting the correct number of charges

C. Fanara and L. Vilarinho: Electrical characterization of atmospheric pressure arc plasmas 245
(a) (b)
Fig. 7. Comparison between probe and optical temperatures at z = 2.99 mm at I = 50 and 200 A. (a) Optical emissiontemperature (full circles), continuum plus free fall theory (CFF, triangles) and random (TGPSh23, [3]) with pre-sheath andpartial collecting surface (empty circles). (b) Ratios of probe determined to optical emission spectroscopy.
(a) (b)
Fig. 8. Axial plasma potential for I = 50 and 200 A. (a) For 50 A (uncorrected data empty circles, corrected values dottedline) comparison is made with measured values of Tanaka et al. [14] obtained in the anode region (full circles). (b) The 200 Acase (same symbols) is compared with the model of Sansonnes and Lowke (S&L, [13]).

246 The European Physical Journal D
(a)
(b)
Fig. 9. Edges (where I = 0) of the inverted peaks as afunction of position, e.g. “internal” or current carrying re-gion and external or “halo” electrical radius. (a) Iarc = 50 A,(b) Iarc = 200 A. Legend: Isat , ion current in biased conditionsat saturation; If .c., current in floating conditions.
locally available is not unrealistic. This implies that theion current density at ion saturation is representative ofthe plasma ion current density and as a consequence, theinner electrical radius could truly represent the extent ofthe current carrying region. The shape of the radial dis-tribution confirms this indication. By collecting all the(j, r) maps from the Abel inverted currents, the ion cur-rent density can be represented by the two-dimensionalmaps of Figure 10, for arc currents from 50 to 200 A.
These figures show that increasing the arc current from50 to 100 A, the inner (most luminous) region expandstowards the anode and from 150 A upwards, is distributedmore uniformly along the arc length.
3.2 Perturbation region
For consistency check, the curves obtained with the twoemission lines (696.54 and 706.72 nm) were compared.Because these correspond to different excitation states ofatomic argon, they differ somewhat, but provide electrontemperatures which agree well within the experimentalerror [2,6].
(a)
(b)
(c)
(d)
Fig. 10. Two-dimensional maps for the ion saturation currentdensity (A/m2). Arc currents: from above, 50, 100, 150 and200 A.

C. Fanara and L. Vilarinho: Electrical characterization of atmospheric pressure arc plasmas 247
(a) (b)
Fig. 11. Blank consistency for two different lines at I = 100 A. (a) λ = 696.54 nm, (b) λ = 706.72 nm. The branches indicatedby the different symbols correspond to sets of data (full circles of Fig. 3b) taken for two different points (empty circles ofFig. 3b).
The variation of the integrated intensity with the archeight, non monotonic, is consistent with the expected be-haviour of the emission coefficient as a function of height(Fig. 4, [2]). In fact, the arc section decreases as the archeight increases, causing a lowering of the integrated in-tensity. In contrast, the intensity increases as the tem-perature rises with the arc height. These two effects canbe appreciated observing the number of counts for the“blanks” between the different axial regions, which matchin the complete curves, 0 to 5 mm in Figure 11. Note thatin all the curves showing the emission intensity as a func-tion of height, the flow is oriented from high to low z (e.g.right to left, cathode to anode).
The comparison between the curves obtained with andwithout probes as a function of the height z gives an ap-preciation of the PR extension. For quantitative purposes,the averages of the curves obtained with probes are com-pared with the averages of the “blank curves” obtainedwith two argon lines acquired simultaneously (696.54 and706.72 nm). These comparisons are shown in Figure 12where the estimate of the PR thickness is indicated foreach of the arc currents. The spectroscopic measurementsagree with computed data [15].
The difference of the counts is lower at higher probeposition, even if the number of counts is lower in theblanks. This suggests that the probe “shadowing effect”is less marked at higher axial positions. As noted earlier,the greater the height, the smaller the arc section. Thusthe (line) integrated intensity is lower for both signals andblanks. If this reduction, due to the smaller section, is thesame with and without probes, the reduced contributionof the signals with probe would dominate. However, thisassumption implies undisturbed arc, thus to avoid circu-lar argument, a series of photographs was taken to checkfor discernible variations of the arc diameter at the probechosen height. Figure 13, referring to the 50 A case, showsa reduction of the section by ∼14% (to the original pho-tographs a numerical algorithm was applied in order toappreciate the contrast of different arc regions [16]). Thusthe line-integrated intensity is reduced by the combined
effect of probe shadowing under “undisturbed conditions”and by the arc radius reduction. It is difficult to discrimi-nate the two effects. For the 200 A case shown in Figure 14,the reduction of the arc section due to probe presence ismuch less marked. Also from Figure 12, it can be observedthat the width of the perturbation region is always loweras the arc height increases. This is expected because in theregion closer to the cathode the flow velocity is higher andin the idealized “free-stream” conditions one would expecta thinner boundary layer. In contrast, it is not possible toconclude on the extension of the PR as a function of thearc current (the data points are scattered at 1.25 mm,perhaps increasing at 3.75 mm). Also, these graphs showthat with the exception of the I = 50 A case, the up-stream part of the PR is less extended. The PR thicknessobtained is approximate because of the probe positioningand alignment, with a resulting error on the axial coordi-nate (z), estimated in 200 µm on each point, close to oneprobe diameter (250 µm).
Should the conditions allow for the existence of a “freestream”, the PR could be identified with the boundarylayer and an estimate of the velocity at the edge could beattempted. However, the extension of this PR is of an or-der of magnitude comparable with the overall length of theplasma arc in the 5 mm point-plane geometry. The lattercircumstance makes the mentioned identification unjusti-fied.
In fact, the complete sequence of photographs at differ-ent currents, especially of the arc core, where velocity andtemperature gradients are steeper, and of the envelopes,indicates that the perturbation takes place beyond theexpected “Boundary layer” extension allowed by a free-stream theory, estimated previously in a fraction of a mil-limetre [5].
With this limitation in mind, a visual inspection ofFigure 14 (200 A, 5 mm) suggests a PR extension whichamounts to 30 to 35% of the arc length; the up-stream ex-tension is 1 to 2% of the arc length and the remaining ofthe PR is due to the down-stream portion of the PR. Theasymmetry tends to disappear for lower probe positions

248 The European Physical Journal D
(a) (b)
(c) (d)
(e) (f)
Fig. 12. Signal and blanks averaged over the two different wavelengths at the positions r = 0, z = 1.25 and r = 0, z = 3.75 mm.From above 50 A (a, b), 100 A (c, d) and 200 A (e, f) the latter is z = 1.2 and 4.0 mm instead of 1.25 and 3.75 mm.
(a) (b)
Fig. 13. I = 50 A. Exampleof probe perturbation obtained fromhigh-speed camera films (aperturef8). Arc length 5 mm. (a) Withoutprobe, (b) with probe at z = 3.75 mm.

C. Fanara and L. Vilarinho: Electrical characterization of atmospheric pressure arc plasmas 249
(a) (b)
Fig. 14. I = 200 A. Exampleof probe perturbation obtained fromhigh-speed camera films (aperturef22). Arc length 5 mm. (a) Withoutprobe, (b) with probe at z = 3.75 mm.
(a) (b)
Fig. 15. (a) Current signals (left axis)and corresponding voltages (right axis)from DLC coated copper probes (U =metal up, C = control, D = metaldown, see text). (b) Delamination due towire-coating thermal mismatch (Coatingthickness, 5 µm).
(below mid-arc, towards the anode). This is in agreementwith the spectroscopic measurements (cf. Fig. 12). There-fore, despite the semi-quantitative nature of this partic-ular analysis, two conclusions are possible: (1) there isclear asymmetry between the up- and down-stream proberegions at high arc length and (2) the PR extension in-creases with the arc length. In the first instance, thereis some experimental evidence [17] of orientation depen-dent charge capture on cylindrical probes, with “active”surface variable from half to two-thirds of the up-streamprobe surface [17,18]. If this is correct, the fact that thePR is less extended up-stream of the probe indicates thatthe relevant plasma parameters could be obtained fromthe up-stream surface within the limitation of a “small”disturbance. Therefore, for this purpose, the found asym-metry between up- and down-stream regions could be ig-nored.
3.3 DLC coated probes
So far, tests were performed with probes half-coated alongthe axial direction. The electron current signals shown inFigure 15a were obtained in conditions close to floatingat I = 50 A using three probes placed at 2 mm from theanode: metal up, control (uncoated) and metal down.
In the initial stages (about 300 ms), possibly due tocoating disruption, the contribution from “down” probe
(a) (b)
Fig. 16. Schematics of coating damage upon immersion in arcat 50 A, (a) metal-up probe at z = 2.0 mm, (b) metal-down atz = 2.0 mm.
dominates but after decay, it remains always lower thanthe contribution of probes with conducting surfaces fac-ing the cathode (metal up). Despite the use of controlledinert (Ar) atmosphere, DLC delamination occurs due tothe difference in the thermal expansion coefficients of sub-strate (Cu initially, but later also W) and coating (DLC,5 µm), cf. Figure 15b. A systematic study of the delami-nation was performed and some differences in the up- anddown-stream exposed surface were observed as indicatedin Figure 16.
To overcome the problem, a graded (WC and DLC)was developed at Cranfield [19] and new spot-uncoatedprobes are under testing. The main advantage of the latteris that it delivers local values of the current avoiding theAbel inversion procedure.

250 The European Physical Journal D
(a) (b)
Fig. 17. Arc path trace on the two copper blocks, I = 50 A. (a) Travel speed = 10 mm/s. (b) Travel speed 60 mm/s. Theinterface and the anode disk where the arc is struck before — and after the split anode motion — are also shown.
Fig. 18. Comparison of voltage falls reported by [8] (fullsquares) and this work (empty circles) as a function of arccurrent.
3.4 Anode detector
In order to verify reproducibility and stability and uni-formity of arc motion, the split anode set-up was movedback and forth in two subsequent passages of the arc acrossthe interface, providing two experimental signals. Both thecalculations and the signal gathered during the travel, ruleout any noticeable asymmetry of the arc. Stability and re-producibility of the signals were achieved by the choice ofa travel speed of 60 mm/s. In Figure 17 the traces of thearc path are shown for (a) 10 and (b) 60 mm/s.
Moreover, the signals obtained for different arc cur-rents show a monotonic decrease of the voltage similar toprobe floating in the arc column. Figure 18 shows a com-parison between the voltage values obtained in floatingconditions and the values of Schoeck [8].
Also, agreement with data from probes in the columnof the arc [20] exist, indicating that an arc constrictiontakes places at the electrodes as expected [21] and visuallyobserved. This is shown in Figure 19 where the radius
Fig. 19. Arc electrical radii: from ion saturation of V -I curves(probes in arc column only, full squares), electron current den-sity under zero bias (probes in arc and anode detector, emptycircles) and from floating conditions (probes in arc and anodedetector, full circles).
obtained from the electron current density (empty circles)and floating conditions (full circles) is shown in conditionswhich are the closest to “plasma potential” (zero bias).
Measurements in biased conditions are currently underway at Cranfield.
4 Conclusions
Atmospheric pressure electric (TIG) arcs, inhomogeneousboth radially and axially (ionization, temperature) can beinvestigated by means of Langmuir probes, but the char-acteristic curve is incomplete and only the ion saturationpart can be constructed. The use of direct methods al-lows reconstructing the temperatures. However, these de-terminations are from 50 to 60% of the values obtainedby emission spectroscopy. The major contribution to this

C. Fanara and L. Vilarinho: Electrical characterization of atmospheric pressure arc plasmas 251
reduction is boundary layer cooling due to electron-ionrecombination. The thickness of this layer, more exactlyindicated as “perturbation region” has been obtained ex-perimentally and agrees with previous numerical predic-tions and qualitatively with fast speed camera photo-graph. Also, its up-stream extension is less than in thedown-stream region of the probe.
Axial values of the electric field can be obtained butthe hypothesis that the probe to plasma contact potential(floating potential) does not vary appreciably with axialdistance is unjustified. Values of the plasma potential ob-tained from the temperatures corrected for cooling, partlyagree with the literature. The width of signals obtainedin floating and biased conditions reveals a halo (no sub-stantial current conduction) and a narrower current carry-ing region respectively. The use of coated probes has onlybeen partially successful up to now due to coating delam-ination, and preliminary indications of directional chargecapture need confirmation. The modified split-anode de-tector showed voltages value in agreement with previousdata and it is a promising tool for the mapping of thecurrent density at the anode.
EPSRC funded projects, grant Nr. GR/L8 2281, andNr. GR/NB2648/01
References
1. M.F. Thornton, Ph.D. thesis, Cranfield University, 19932. L.O. Vilarinho, Optical emission spectroscopy, Internal
Report Cranfield University, Cranfield, 20023. A.E.F. Gick, M.B.C. Quigley, P.H. Richards, J. Phys. D:
Appl. Phys. 6, 1941 (1973)4. C. Fanara, I.M. Richardson, J. Phys. D: Appl. Phys. 34,
2715 (2001)5. C. Fanara, Ph.D. thesis, Cranfield University, 2003
6. C. Fanara, L.O. Vilarinho, Optical and electrical mea-surements in atmospheric pressure arcs: a comparisonin Annual Gaseous Electronics Conference (GEC02),Minneapolis, MN, USA 2002
7. O. Nestor, J. Appl. Phys. 33(5), 1638 (1962)8. P.A. Schoeck, An investigation of the anode energy balance
of high intensity arcs in argon in Modern Developments inHeat Transfer, edited by W. Ibele (Academic Press, 1963)
9. J.B. Cobine, Gaseous conductors (Dover, New York, 1958)10. J.D. Swift, S. Schwar, Electrical probes for plasma diag-
nostics (Iliffe, London, 1970)11. P.M. Chung, L. Talbot, K.J. Touryan, Electric probes in
stationary and flowing plasmas: theory and application(Springer, New York, 1975)
12. H.N. Olsen, Phys. Fluids 2(6), 614 (1959)13. L. Sansonnes, J. Haidar, J.J. Lowke, J. Phys. D: Appl.
Phys. 33, 148 (2000)14. M. Tanaka, M. Ushio, J. Phys. D: Appl. Phys. 32, 906
(1999)15. M.T.C. Fang, JinLing Zhang, J.D. Yan, Can Langmuir
Probe be used for the diagnostics of atmospheric ther-mal plasmas with gas motion? Paper ISPC-343 in 16thInternational Symposium on Plasma Chemistry, Taormina(Italy), 22-27 June 2003
16. L.O. Vilarinho, Assessment of shielding gases by meansof numerical and experimental techniques, Qualificationexam, UFU, Brazil, 2001
17. H. Tsuij, H. Toshisuke, AIAA J. 11(1), 100 (1973)18. M.S. Benilov, J. Appl. Phys. 70(11), 6726 (1991)19. Courtesy of Prof. J. Nicholls, 200320. C. Fanara, Electrical characterization of atmospheric pres-
sure arc plasmas in EMRS Symposium A-TPP7 (ThermalPlasma Processes), poster presentation, Ref. Nr. 0356A,Strasbourg, France, 18-21 June 2002 to be published inHigh Temperature Journal, edited by Prof. J. Amouroux,P. Fauchais
21. J.F. Lancaster, The Physics of Welding (Pergamon Press,Oxford, 1983)