Mahendra Singh Sodha - Kinetics of Complex Plasmas
300
Springer Series on Atomic, Optical, and Plasma Physics Mahendra Singh Sodha Kinetics of Complex Plasmas 81
-
Upload
khangminh22 -
Category
Documents
-
view
2 -
download
0
Transcript of Mahendra Singh Sodha - Kinetics of Complex Plasmas

Springer Series on Atomic, Optical, and Plasma Physics
Mahendra Singh Sodha
Kinetics of Complex Plasmas
81

Springer Series on Atomic, Optical,and Plasma Physics
Volume 81
Editor-in-Chief
Gordon W. F. Drake, Windsor, Canada
Series editors
Andre D. Bandrauk, Sherbrooke, CanadaKlaus Bartschat, Des Moines, USAUwe Becker, Berlin, GermanyPhilip George Burke, Belfast, UKRobert N. Compton, Knoxville, USAM. R. Flannery, Atlanta, USACharles J. Joachain, Bruxelles, BelgiumPeter Lambropoulos, Iraklion, GreeceGerd Leuchs, Erlangen, GermanyPierre Meystre, Tucson, USA
For further volumes:http://www.springer.com/series/411

The Springer Series on Atomic, Optical, and Plasma Physics covers in a com-prehensive manner theory and experiment in the entire field of atoms and mole-cules and their interaction with electromagnetic radiation. Books in the seriesprovide a rich source of new ideas and techniques with wide applications in fieldssuch as chemistry, materials science, astrophysics, surface science, plasma tech-nology, advanced optics, aeronomy, and engineering. Laser physics is a particularconnecting theme that has provided much of the continuing impetus for newdevelopments in the field, such as quantum computation and Bose-Einstein con-densation. The purpose of the series is to cover the gap between standard under-graduate textbooks and the research literature with emphasis on the fundamentalideas, methods, techniques, and results in the field.

Mahendra Singh Sodha
Kinetics of Complex Plasmas
123

Mahendra Singh SodhaDepartment of Education BuildingUniversity of LucknowLucknow, Uttar PradeshIndia
ISSN 1615-5653 ISSN 2197-6791 (electronic)ISBN 978-81-322-1819-7 ISBN 978-81-322-1820-3 (eBook)DOI 10.1007/978-81-322-1820-3Springer New Delhi Heidelberg New York Dordrecht London
Library of Congress Control Number: 2014931383
� Springer India 2014This work is subject to copyright. All rights are reserved by the Publisher, whether the whole or part ofthe material is concerned, specifically the rights of translation, reprinting, reuse of illustrations,recitation, broadcasting, reproduction on microfilms or in any other physical way, and transmission orinformation storage and retrieval, electronic adaptation, computer software, or by similar or dissimilarmethodology now known or hereafter developed. Exempted from this legal reservation are briefexcerpts in connection with reviews or scholarly analysis or material supplied specifically for thepurpose of being entered and executed on a computer system, for exclusive use by the purchaser of thework. Duplication of this publication or parts thereof is permitted only under the provisions ofthe Copyright Law of the Publisher’s location, in its current version, and permission for use mustalways be obtained from Springer. Permissions for use may be obtained through RightsLink at theCopyright Clearance Center. Violations are liable to prosecution under the respective Copyright Law.The use of general descriptive names, registered names, trademarks, service marks, etc. in thispublication does not imply, even in the absence of a specific statement, that such names are exemptfrom the relevant protective laws and regulations and therefore free for general use.While the advice and information in this book are believed to be true and accurate at the date ofpublication, neither the authors nor the editors nor the publisher can accept any legal responsibility forany errors or omissions that may be made. The publisher makes no warranty, express or implied, withrespect to the material contained herein.
Printed on acid-free paper
Springer is part of Springer Science+Business Media (www.springer.com)
Dedicated toMrs. Vijay Sodha
and
Mrs. Usha Sodha
Preface
With the rapidly increasing interest in complex plasmas many books and reviewson different aspects of this growing field have been published. However, no reviewor book dedicated to the kinetics of complex plasmas and associated processes isavailable; this book is a modest attempt to present the basic aspects of electronemission from and electron/ion accretion on the surface of dust particles and thekinetics of complex plasmas, illustrated by a few typical applications.
Over the years, the approach to the kinetics has changed from mere chargebalance on the dust particles to include the number and energy balance of theconstituents, size distribution of dust, quantum effects in emission from andaccretion of electrons on the dust particles, statistical mechanics considerations,nonlinear interaction with electric, electromagnetic field, etc. Effort has been madein the book to introduce the readers to the contemporary concepts.
In a book like this some omissions of significant work are inevitable, for whichsincere apologies are in order. As far as possible the presentation is based oncharge balance on the particles and number/energy balance of the constituents.
The book should be of use to researchers, engineers, and graduate students.Comments are welcome.
Delhi Mahendra Singh Sodha
vii
Acknowledgments
The author is very grateful to his associates:
Late Dr. Samiran GuhaDr. Sanjay MishraDr. Shikha MisraDr. Sweta SrivastavaDr. Sujeet AgarwalDr. Amrit DixitDr. M. P. VermaDr. Lalita Bhasin,
with whom he has learnt the subject; special thanks are due to Dr. S. K. Mishra forwriting Chap. 6. He is also grateful to the Department of Science and Technology,Government of India for financial support toward writing the book. Thanks arealso due to coauthors, other authors, and corresponding publishers, whose tables/diagrams have been reproduced in the book with their generous permission/policy.The typing and organization of the contents was done by Mr. Ram Shanker, whoseefforts are appreciated. The pains taking assistance in proof correction byDr. Rashmi Mishra is gratefully acknowledged.
Mahendra Singh Sodha
ix

Contents
Part I Basics
1 Introduction . . . . . . . . . . . . . . . . . . . . . . . . . . . . . . . . . . . . . . . . 31.1 Complex Plasma. . . . . . . . . . . . . . . . . . . . . . . . . . . . . . . . . 31.2 Occurrence in Space . . . . . . . . . . . . . . . . . . . . . . . . . . . . . . 3
1.2.1 Planetary Magnetospheres . . . . . . . . . . . . . . . . . . . . 31.2.2 Cometary Magnetosphere . . . . . . . . . . . . . . . . . . . . 41.2.3 Interplanetary Dust . . . . . . . . . . . . . . . . . . . . . . . . . 41.2.4 Interstellar Dust . . . . . . . . . . . . . . . . . . . . . . . . . . . 41.2.5 Polar Mesospheric Clouds . . . . . . . . . . . . . . . . . . . . 5
1.3 Flames . . . . . . . . . . . . . . . . . . . . . . . . . . . . . . . . . . . . . . . 51.4 Complex Plasma in Laboratory and Industry . . . . . . . . . . . . . 51.5 Kinetics. . . . . . . . . . . . . . . . . . . . . . . . . . . . . . . . . . . . . . . 61.6 Organization of the Book . . . . . . . . . . . . . . . . . . . . . . . . . . 6References . . . . . . . . . . . . . . . . . . . . . . . . . . . . . . . . . . . . . . . . . 7
2 Electron Emission from Dust . . . . . . . . . . . . . . . . . . . . . . . . . . . 92.1 Free Electron Model . . . . . . . . . . . . . . . . . . . . . . . . . . . . . . 9
2.1.1 Basic Model . . . . . . . . . . . . . . . . . . . . . . . . . . . . . 92.1.2 Density of Electronic States . . . . . . . . . . . . . . . . . . . 92.1.3 Distribution Function . . . . . . . . . . . . . . . . . . . . . . . 112.1.4 Fermi Energy . . . . . . . . . . . . . . . . . . . . . . . . . . . . . 12
2.2 Basic Concepts of Electron Emission . . . . . . . . . . . . . . . . . . 132.2.1 Potential Energy of an Electron Near the Plane
Surface of a Metal . . . . . . . . . . . . . . . . . . . . . . . . . 132.2.2 Transmission Coefficient Across Metallic Plane
Surfaces: Uncharged Surface . . . . . . . . . . . . . . . . . . 152.2.3 Thermionic and Electric Field Emission of Electrons
from a Plane Surface . . . . . . . . . . . . . . . . . . . . . . . 232.2.4 Photoelectric and Light Induced Field Emission
from a Plane Surface . . . . . . . . . . . . . . . . . . . . . . . 292.3 Fowler’s Theory (Case: Ia) (After Fowler et al. [13]) . . . . . . . 31
2.3.1 Uncharged Surface . . . . . . . . . . . . . . . . . . . . . . . . . 31
xi

2.3.2 Positively Charged Surface (t0 \ 0) . . . . . . . . . . . . . 332.3.3 Light Induced Field Emission . . . . . . . . . . . . . . . . . 332.3.4 Numerical Results and Discussions. . . . . . . . . . . . . . 34
2.4 Modified Dubridge Theory: Case IIa and other effects . . . . . . 362.5 Spicer’s Three Step Model . . . . . . . . . . . . . . . . . . . . . . . . . 382.6 Size Effect. . . . . . . . . . . . . . . . . . . . . . . . . . . . . . . . . . . . . 392.7 Secondary Electron Emission . . . . . . . . . . . . . . . . . . . . . . . . 39
2.7.1 Secondary Electron Emission by Electron Impact . . . . 392.7.2 Spherical Particle (After Misra et al. [31]). . . . . . . . . 422.7.3 Spherical Particle in Maxwellian Plasma . . . . . . . . . . 45
2.8 Electron Emission from Charged Spherical and CylindricalSurfaces of Metals . . . . . . . . . . . . . . . . . . . . . . . . . . . . . . . 472.8.1 What is Different About Electron Emission
from Curved Surfaces? . . . . . . . . . . . . . . . . . . . . . . 472.8.2 Reduction of Work Function by Negative Electric
Potential on a Spherical Surface . . . . . . . . . . . . . . . . 482.8.3 Simple Theory of Electron Emission
from Curved Surfaces . . . . . . . . . . . . . . . . . . . . . . . 502.8.4 Transmission Coefficient for Electrons . . . . . . . . . . . 612.8.5 Electron Emission. . . . . . . . . . . . . . . . . . . . . . . . . . 68
2.9 Mie’s Theory of Light Scattering by Spherical Particles . . . . . 75Appendix A: Electron Transmission Coefficient Across a
Negatively Charged Cylindrical Surface(After Misra et al. [28], Sodha and Dubey [45]) . . . . . . 77
Appendix B: Secondary Emission from Cylindrical Particles. . . . . . . 79References . . . . . . . . . . . . . . . . . . . . . . . . . . . . . . . . . . . . . . . . . 82
3 Accretion of Electrons/Ions on Dust Particles . . . . . . . . . . . . . . . 853.1 Classical Rate of Accretion of Electrons/Ions
on Spherical and Cylindrical Particles(After Mott-Smith and Langmuir [13]) . . . . . . . . . . . . . . . . . 853.1.1 General Considerations . . . . . . . . . . . . . . . . . . . . . . 853.1.2 Function f ðu; tÞ for Maxwellian Distribution
of Velocities . . . . . . . . . . . . . . . . . . . . . . . . . . . . . 873.1.3 Spherical Particles . . . . . . . . . . . . . . . . . . . . . . . . . 873.1.4 Alternate Derivation for Spherical Particles . . . . . . . . 893.1.5 Flowing Plasma . . . . . . . . . . . . . . . . . . . . . . . . . . . 903.1.6 Cylindrical Particles . . . . . . . . . . . . . . . . . . . . . . . . 90
3.2 Quantum Effects in Electron Accretion on the Surfaceof Charged Particles (After Mishra et al. [12]) . . . . . . . . . . . . 923.2.1 General Remarks . . . . . . . . . . . . . . . . . . . . . . . . . . 923.2.2 Quantum Effects in Electron Accretion . . . . . . . . . . . 93
3.3 Critique of OML Theory . . . . . . . . . . . . . . . . . . . . . . . . . . . 96
xii Contents
3.4 Trapping of Ions. . . . . . . . . . . . . . . . . . . . . . . . . . . . . . . . . 963.4.1 Effect of Charge Exchange Ion Collisions
with Neutral Atoms on Accretion Current(After Lampe et al. [6]). . . . . . . . . . . . . . . . . . . . . . 97
3.5 Schottky Effect and Electron Accretion. . . . . . . . . . . . . . . . . 983.6 Accretion of Electrons/Ions Having Generalized
Lorentzian Energy Distribution Function on Dust Particles(After Mishra et al. [9]). . . . . . . . . . . . . . . . . . . . . . . . . . . . 98
References . . . . . . . . . . . . . . . . . . . . . . . . . . . . . . . . . . . . . . . . . 99
4 Kinetics of Dust-Electron Cloud . . . . . . . . . . . . . . . . . . . . . . . . . 1014.1 Thermal Equilibrium: Charge Distribution Over Dust . . . . . . . 1014.2 Steady State (Non Equilibrium) Kinetics . . . . . . . . . . . . . . . . 104
4.2.1 Philosophy. . . . . . . . . . . . . . . . . . . . . . . . . . . . . . . 1044.2.2 Charge Distribution in Irradiated Dust Cloud
(After Sodha et al. [9]) . . . . . . . . . . . . . . . . . . . . . . 1054.3 Uniform Charge Theory . . . . . . . . . . . . . . . . . . . . . . . . . . . 1084.4 Dust Cloud with Cylindrical Dust Particle . . . . . . . . . . . . . . . 1114.5 Solid State Complex Plasma (After Sodha and Guha [6]) . . . . 111References . . . . . . . . . . . . . . . . . . . . . . . . . . . . . . . . . . . . . . . . . 112
5 Kinetics of Complex Plasmas with Uniform Size Dust . . . . . . . . . 1135.1 Introduction . . . . . . . . . . . . . . . . . . . . . . . . . . . . . . . . . . . . 1135.2 Complex Plasma in Thermal Equilibrium . . . . . . . . . . . . . . . 114
5.2.1 Charging . . . . . . . . . . . . . . . . . . . . . . . . . . . . . . . . 1175.2.2 Conservation of the Sum of Number Densities
of Neutral Atoms and Ions . . . . . . . . . . . . . . . . . . . 1175.2.3 Charge Neutrality . . . . . . . . . . . . . . . . . . . . . . . . . . 117
5.3 Complex Plasma in Absence of Electron Emissionfrom Dust Particles . . . . . . . . . . . . . . . . . . . . . . . . . . . . . . . 1185.3.1 Number Balance. . . . . . . . . . . . . . . . . . . . . . . . . . . 1205.3.2 Energy Balance . . . . . . . . . . . . . . . . . . . . . . . . . . . 1205.3.3 Dust Particle Balance . . . . . . . . . . . . . . . . . . . . . . . 121
5.4 Illuminated Complex Plasmas (After Sodha et al. [23]). . . . . . 1225.4.1 Early Investigations . . . . . . . . . . . . . . . . . . . . . . . . 1225.4.2 Collisions in Gaseous Plasmas . . . . . . . . . . . . . . . . . 1225.4.3 Specific Problem and Approach
(After Sodha et al. [23]) . . . . . . . . . . . . . . . . . . . . . 1245.4.4 Rate of Emission and Mean Energy
of Photoelectrons . . . . . . . . . . . . . . . . . . . . . . . . . . 1245.4.5 Analytical Model . . . . . . . . . . . . . . . . . . . . . . . . . . 126
References . . . . . . . . . . . . . . . . . . . . . . . . . . . . . . . . . . . . . . . . . 128
Contents xiii

6 Kinetics of Flowing Complex Plasma. . . . . . . . . . . . . . . . . . . . . . 1316.1 Introduction . . . . . . . . . . . . . . . . . . . . . . . . . . . . . . . . . . . . 1316.2 Modification in Electron/Ion Accretion Current to Particles . . . 1326.3 Kinetics. . . . . . . . . . . . . . . . . . . . . . . . . . . . . . . . . . . . . . . 133
6.3.1 Charge Distribution. . . . . . . . . . . . . . . . . . . . . . . . . 1336.3.2 Master Equation for the Population Balance . . . . . . . 134
6.4 Other Kinetic Equations . . . . . . . . . . . . . . . . . . . . . . . . . . . 1346.4.1 Conservation of Neutral Plus Ionic Species . . . . . . . . 1346.4.2 Charge Neutrality . . . . . . . . . . . . . . . . . . . . . . . . . . 1346.4.3 Electron and Ion Kinetics . . . . . . . . . . . . . . . . . . . . 1356.4.4 Energy Balance for Electrons and Ions . . . . . . . . . . . 135
6.5 Specific Situations (After Mishra et al. [13]) . . . . . . . . . . . . . 136References . . . . . . . . . . . . . . . . . . . . . . . . . . . . . . . . . . . . . . . . . 138
7 Kinetics of the Complex Plasmas Having Dustwith a Size Distribution . . . . . . . . . . . . . . . . . . . . . . . . . . . . . . . 1417.1 Introduction . . . . . . . . . . . . . . . . . . . . . . . . . . . . . . . . . . . . 1417.2 Size Distribution. . . . . . . . . . . . . . . . . . . . . . . . . . . . . . . . . 1427.3 Uniform Electric Potential on all Dust Particles
of Same Material . . . . . . . . . . . . . . . . . . . . . . . . . . . . . . . . 1437.4 Kinetics with Uniform Electric Potential on Dust Particles
(After Sodha et al. [20]) . . . . . . . . . . . . . . . . . . . . . . . . . . . 1437.4.1 Basic Equations . . . . . . . . . . . . . . . . . . . . . . . . . . . 1437.4.2 Kinetics of the Complex Plasmas with a Mixture
of Dust of Different Materials: Uniform ElectricPotential Theory (After Sodha et al. [19]) . . . . . . . . . 145
7.5 Kinetics of the Complex Plasma in Thermal Equilibrium . . . . 1457.6 Inclusion of Mie Scattering by Dust in Complex
Plasma Kinetics (After Sodha et al. [20]) . . . . . . . . . . . . . . . 146References . . . . . . . . . . . . . . . . . . . . . . . . . . . . . . . . . . . . . . . . . 149
8 Theory of Electrical Conduction . . . . . . . . . . . . . . . . . . . . . . . . . 1518.1 Phenomenological Theory (After Sodha [2]) . . . . . . . . . . . . . 151
8.1.1 Motion of Electrons . . . . . . . . . . . . . . . . . . . . . . . . 1518.1.2 Current Density/Electrical Conductivity/Resistivity . . . 1528.1.3 Einstein Relation . . . . . . . . . . . . . . . . . . . . . . . . . . 1538.1.4 Electrical Conductivity in Presence of an Alternating
Electric Field . . . . . . . . . . . . . . . . . . . . . . . . . . . . . 1548.1.5 Electrical Conductivity in Presence
of Magnetic Field . . . . . . . . . . . . . . . . . . . . . . . . . . 1548.1.6 Nonlinear Effects: Hot Electrons . . . . . . . . . . . . . . . 156
8.2 Kinetic Theory (After Mishra and Sodha [1]) . . . . . . . . . . . . 1588.2.1 Boltzmann’s Transfer Equation . . . . . . . . . . . . . . . . 1588.2.2 Electrical Current/Electrical Conductivity . . . . . . . . . 160
xiv Contents

8.2.3 Other Transport Parameters . . . . . . . . . . . . . . . . . . . 1618.2.4 Ohmic Power Loss . . . . . . . . . . . . . . . . . . . . . . . . . 162
8.3 Kinetics of Complex Plasma with a D.C. Electric Field . . . . . 164References . . . . . . . . . . . . . . . . . . . . . . . . . . . . . . . . . . . . . . . . . 165
9 Electromagnetic Wave Propagation in Complex Plasma. . . . . . . . 1679.1 Linear Propagation . . . . . . . . . . . . . . . . . . . . . . . . . . . . . . . 167
9.1.1 Wave Equation. . . . . . . . . . . . . . . . . . . . . . . . . . . . 1679.1.2 Complex Refractive Index for Linear Propagation
in the Absence of a Magnetic Field . . . . . . . . . . . . . 1689.1.3 Electromagnetic Propagation Along
the Magnetic Field . . . . . . . . . . . . . . . . . . . . . . . . . 1699.1.4 Simplified Expressions for Transport Parameters . . . . 170
9.2 Physical Basis of Nonlinear Propagationof Electromagnetic Waves . . . . . . . . . . . . . . . . . . . . . . . . . . 171
9.3 Nonlinear Complex Plasma Parameters . . . . . . . . . . . . . . . . . 1729.4 PMSE Structures . . . . . . . . . . . . . . . . . . . . . . . . . . . . . . . . 1769.5 Self-Focusing of a Gaussian Electromagnetic Beam
in a Complex Plasma (After Mishra et al. [5]) . . . . . . . . . . . . 1789.5.1 Self-Focusing . . . . . . . . . . . . . . . . . . . . . . . . . . . . . 1789.5.2 Net Flux of Electrons/Ions. . . . . . . . . . . . . . . . . . . . 1799.5.3 Complex Plasma Kinetics . . . . . . . . . . . . . . . . . . . . 1809.5.4 Propagation of Gaussian Electromagnetic Beam. . . . . 1849.5.5 Numerical Results and Discussion . . . . . . . . . . . . . . 185
References . . . . . . . . . . . . . . . . . . . . . . . . . . . . . . . . . . . . . . . . . 186
10 Fluctuation of Charge on Dust Particles in a Complex Plasma . . . 18710.1 Introduction . . . . . . . . . . . . . . . . . . . . . . . . . . . . . . . . . . . . 18710.2 Fluctuation of Charge on Uniform Size Dust Particles
in a Complex Plasmas. . . . . . . . . . . . . . . . . . . . . . . . . . . . . 18810.2.1 Methodology . . . . . . . . . . . . . . . . . . . . . . . . . . . . . 18810.2.2 Numerical Results and Discussion . . . . . . . . . . . . . . 189
10.3 Fluctuation of Charge on Dust Particles with a SizeDistribution in a Complex Plasmas . . . . . . . . . . . . . . . . . . . . 193
References . . . . . . . . . . . . . . . . . . . . . . . . . . . . . . . . . . . . . . . . . 195
Part II Applications
11 Kinetics of Complex Plasmas in Space . . . . . . . . . . . . . . . . . . . . 19911.1 Introduction . . . . . . . . . . . . . . . . . . . . . . . . . . . . . . . . . . . . 199
11.1.1 Planetary Magnetospheres . . . . . . . . . . . . . . . . . . . . 19911.1.2 Cometary Magnetosphere . . . . . . . . . . . . . . . . . . . . 20011.1.3 Interplanetary Dust . . . . . . . . . . . . . . . . . . . . . . . . . 200
Contents xv

11.1.4 Interstellar Dust . . . . . . . . . . . . . . . . . . . . . . . . . . . 20111.1.5 Polar Mesospheric Clouds . . . . . . . . . . . . . . . . . . . . 201
11.2 Kinetics of Polar Mesospheric Clouds (NLCs and PMSEs)(After Sodha et al. [55]) . . . . . . . . . . . . . . . . . . . . . . . . . . . 20111.2.1 Basic Information . . . . . . . . . . . . . . . . . . . . . . . . . . 20111.2.2 Analytical Model . . . . . . . . . . . . . . . . . . . . . . . . . . 20311.2.3 Model of the Mesosphere Without Dust . . . . . . . . . . 20611.2.4 Computational Methodology . . . . . . . . . . . . . . . . . . 20711.2.5 Photoelectric Emission from Charged Dust Particles
by Solar Radiation . . . . . . . . . . . . . . . . . . . . . . . . . 20711.2.6 Other Parameters . . . . . . . . . . . . . . . . . . . . . . . . . . 20811.2.7 Numerical Results and Discussion . . . . . . . . . . . . . . 208
11.3 Cometary Plasma (After Sodha et al. [54]) . . . . . . . . . . . . . . 21111.3.1 Basic Information . . . . . . . . . . . . . . . . . . . . . . . . . . 21111.3.2 Analytical Model for Electronic Processes
in a Cometary Coma Plasma . . . . . . . . . . . . . . . . . . 21211.3.3 Numerical Results and Discussion . . . . . . . . . . . . . . 215
11.4 Charging of Ice Grains in Saturn E Ring(After Misra et al. [37]). . . . . . . . . . . . . . . . . . . . . . . . . . . . 21711.4.1 Model of Complex Plasma Environment . . . . . . . . . . 21711.4.2 Mathematical Modeling of Kinetics . . . . . . . . . . . . . 21811.4.3 Numerical Results and Discussion . . . . . . . . . . . . . . 222
11.5 Kinetics of Interplanetary Medium(After Misra and Mishra [36]) . . . . . . . . . . . . . . . . . . . . . . . 22511.5.1 The Interplanetary Medium . . . . . . . . . . . . . . . . . . . 22511.5.2 Analysis . . . . . . . . . . . . . . . . . . . . . . . . . . . . . . . . 22511.5.3 Constancy of Neutral Plus Ionic Species . . . . . . . . . . 22611.5.4 Energy Balance . . . . . . . . . . . . . . . . . . . . . . . . . . . 22711.5.5 Dust Temperature . . . . . . . . . . . . . . . . . . . . . . . . . . 22711.5.6 Methodology . . . . . . . . . . . . . . . . . . . . . . . . . . . . . 22711.5.7 Photoelectric Efficiency. . . . . . . . . . . . . . . . . . . . . . 22811.5.8 Secondary Electron Emission . . . . . . . . . . . . . . . . . . 22811.5.9 Numerical Results and Discussion . . . . . . . . . . . . . . 230
11.6 Temperature of Interstellar Warm Ionized Medium(After Misra et al. [37]). . . . . . . . . . . . . . . . . . . . . . . . . . . . 23011.6.1 Interstellar Warm Ionized Medium . . . . . . . . . . . . . . 23011.6.2 Analysis . . . . . . . . . . . . . . . . . . . . . . . . . . . . . . . . 23211.6.3 Numerical Results and Discussion . . . . . . . . . . . . . . 236
11.7 Conclusions . . . . . . . . . . . . . . . . . . . . . . . . . . . . . . . . . . . . 242References . . . . . . . . . . . . . . . . . . . . . . . . . . . . . . . . . . . . . . . . . 242
12 Complex Plasma as Working Fluid in MHDPower Generators. . . . . . . . . . . . . . . . . . . . . . . . . . . . . . . . . . . . 24512.1 Introduction . . . . . . . . . . . . . . . . . . . . . . . . . . . . . . . . . . . . 245
xvi Contents

12.2 Basic Equations . . . . . . . . . . . . . . . . . . . . . . . . . . . . . . . . . 24512.3 Analysis for Constant Mach Number
(After Swifthook and Wright [13]) . . . . . . . . . . . . . . . . . . . . 24712.3.1 Efficiency . . . . . . . . . . . . . . . . . . . . . . . . . . . . . . . 24712.3.2 Other Parameters . . . . . . . . . . . . . . . . . . . . . . . . . . 248
12.4 Complex Plasmas as Working Fluid in MHD Generators(After Sodha and Bendor [10, 11]) . . . . . . . . . . . . . . . . . . . . 24912.4.1 The Need . . . . . . . . . . . . . . . . . . . . . . . . . . . . . . . 24912.4.2 Equivalent Parameters . . . . . . . . . . . . . . . . . . . . . . . 24912.4.3 Steam Turbine-Magnetohydrodynamic Topping
Closed Cycle . . . . . . . . . . . . . . . . . . . . . . . . . . . . . 25012.4.4 Feasibility . . . . . . . . . . . . . . . . . . . . . . . . . . . . . . . 252
References . . . . . . . . . . . . . . . . . . . . . . . . . . . . . . . . . . . . . . . . . 253
13 Rocket Exhaust Complex Plasma . . . . . . . . . . . . . . . . . . . . . . . . 25513.1 Introduction . . . . . . . . . . . . . . . . . . . . . . . . . . . . . . . . . . . . 25513.2 Composition of Rocket Exhausts . . . . . . . . . . . . . . . . . . . . . 25613.3 Impact of Rocket Exhausts on Ionosphere
and Upper Atmosphere . . . . . . . . . . . . . . . . . . . . . . . . . . . . 25813.3.1 Early Work . . . . . . . . . . . . . . . . . . . . . . . . . . . . . . 25813.3.2 Optical Observations. . . . . . . . . . . . . . . . . . . . . . . . 25913.3.3 Nature of Dust . . . . . . . . . . . . . . . . . . . . . . . . . . . . 26013.3.4 Chemical Kinetics of Electron/Ion Depletion
by Rocket Exhausts . . . . . . . . . . . . . . . . . . . . . . . . 26013.3.5 Role of Dust . . . . . . . . . . . . . . . . . . . . . . . . . . . . . 262
References . . . . . . . . . . . . . . . . . . . . . . . . . . . . . . . . . . . . . . . . . 262
14 Kinetics of Complex Plasmas with Liquid Droplets . . . . . . . . . . . 26314.1 Introduction . . . . . . . . . . . . . . . . . . . . . . . . . . . . . . . . . . . . 26314.2 Wet Alkali Metal Vapor (After Smith [14]) . . . . . . . . . . . . . . 26314.3 Reduction of Electron Density in a Plasma by Injection
of Water Droplets . . . . . . . . . . . . . . . . . . . . . . . . . . . . . . . . 26614.3.1 Early Work . . . . . . . . . . . . . . . . . . . . . . . . . . . . . . 26614.3.2 Reduction of Potential Energy Barrier. . . . . . . . . . . . 26714.3.3 Rate of Accretion of Electrons on Droplets . . . . . . . . 26714.3.4 Emission of Negative Ions from a Charged
Droplet Due to Evaporations . . . . . . . . . . . . . . . . . . 26814.3.5 Kinetics of Complex Plasma with Water Droplets . . . 270
References . . . . . . . . . . . . . . . . . . . . . . . . . . . . . . . . . . . . . . . . . 274
15 Growth of Particles in a Plasma . . . . . . . . . . . . . . . . . . . . . . . . . 27715.1 Introduction . . . . . . . . . . . . . . . . . . . . . . . . . . . . . . . . . . . . 27715.2 Basic Equations . . . . . . . . . . . . . . . . . . . . . . . . . . . . . . . . . 278
15.2.1 Charging of Dust Grains . . . . . . . . . . . . . . . . . . . . . 279
Contents xvii
15.2.2 Number Balance of Electrons. . . . . . . . . . . . . . . . . . 27915.2.3 Number Balance of Ions . . . . . . . . . . . . . . . . . . . . . 27915.2.4 Number Balance of Neutral Atoms . . . . . . . . . . . . . . 27915.2.5 Radius of the Particles . . . . . . . . . . . . . . . . . . . . . . 28015.2.6 Energy Balance of Electrons . . . . . . . . . . . . . . . . . . 28015.2.7 Energy Balance for Ions . . . . . . . . . . . . . . . . . . . . . 28115.2.8 Energy Balance for Neutral Species . . . . . . . . . . . . . 28115.2.9 Numerical Results and Discussion . . . . . . . . . . . . . . 283
References . . . . . . . . . . . . . . . . . . . . . . . . . . . . . . . . . . . . . . . . . 285
16 Electrostatic Precipitation . . . . . . . . . . . . . . . . . . . . . . . . . . . . . . 28716.1 Introduction . . . . . . . . . . . . . . . . . . . . . . . . . . . . . . . . . . . . 28716.2 Corona Discharge (After White [4], Oglesby
and Nichols [2]) . . . . . . . . . . . . . . . . . . . . . . . . . . . . . . . . . 28716.3 Particle Charging (After White [4]) . . . . . . . . . . . . . . . . . . . 288
16.3.1 Two Distinct Processes . . . . . . . . . . . . . . . . . . . . . . 28816.3.2 Field Charging . . . . . . . . . . . . . . . . . . . . . . . . . . . . 28916.3.3 Ion Diffusion (Ion Accretion). . . . . . . . . . . . . . . . . . 29016.3.4 Magnitude of Charge, Acquired by a Particle Due
to Electric Field and Ion Diffusion (Accretion) . . . . . 29016.4 Particle Collection (After White [4]). . . . . . . . . . . . . . . . . . . 290
16.4.1 Limitation of Theory. . . . . . . . . . . . . . . . . . . . . . . . 29016.4.2 Drift of Particles. . . . . . . . . . . . . . . . . . . . . . . . . . . 29116.4.3 Collection Efficiency . . . . . . . . . . . . . . . . . . . . . . . 292
References . . . . . . . . . . . . . . . . . . . . . . . . . . . . . . . . . . . . . . . . . 293
About the Author . . . . . . . . . . . . . . . . . . . . . . . . . . . . . . . . . . . . . . . 295
Index . . . . . . . . . . . . . . . . . . . . . . . . . . . . . . . . . . . . . . . . . . . . . . . . 297
xviii Contents

About the Book
The presentation in the book is based on charge balance on dust particles, number,and energy balance of the constituents and atom–ion–electron interaction in thegaseous plasma. Size distribution of dust particles, statistical mechanics, Quantumeffects in electron emission from and accretion on dust particles, and nonlinearinteraction of complex plasmas with electric and electromagnetic fields have beendiscussed in the book. The book introduces the reader to the basic concepts andtypical applications.
The book should be of use to researchers, engineers, and graduate students.
xix

Part IBasics

Chapter 1Introduction
1.1 Complex Plasma
It is well-known that about 99 % of the matter in the universe is in the plasmastate, comprising of electrons, ions, and neutral atoms/molecules. Very often theplasmas have a suspension of dust and in case the dust significantly affects theproperties of the plasma, the dust plasma system is known as a colloidal plasma,dusty plasma, or complex plasma. Despite significant variation in the character-ization, we have in this book referred to plasma with suspended dust system ascomplex plasma, in case the dust significantly affects the properties of the plasma.
1.2 Occurrence in Space
1.2.1 Planetary Magnetospheres
Dust plasma interactions in the planetary magnetospheres have been studied for along time. The period of vigorous research on the role of complex plasma in themagnetospheres started with the highly significant observations by spacecraft oninteresting phenomena in the magnetospheres of giant planets in the early 1980s(For a review see Horanyi [4]). It is instructive to take a look at some specific cases.
1.2.1.1 Saturn’s Spokes
The approximately radial features (Spokes) across the dense B ring, observedintermittently by Voyager spacecraft 1 and 2 as they flew by Saturn have attracteda great amount of attention.
All theories have proposed a sporadic increase of the plasma density, andsubsequent charging of fine dust to a negative potential and consequent levitation.Thus the charging of the dust turns out to be an important part of the dynamics ofthe spokes.
M. S. Sodha, Kinetics of Complex Plasmas, Springer Series on Atomic,Optical, and Plasma Physics 81, DOI: 10.1007/978-81-322-1820-3_1,� Springer India 2014
3

1.2.1.2 High speed dust streams from Jupiter and Saturn
The observation [3] of collimated quasi-periodic and high-speed streams of finedust particles, emanating from Jupiter by the Ulysses spacecraft highlighted therole of the electrodynamic force in the dynamics of fine dust particles; the chargeon the particles is an important parameter in the process. Subsequently, suchstreams emanating from Saturn were also discovered by the Cassini spacecraft [5].
1.2.1.3 Differential Collection of Charged Dust by Planetary Satellites
Mendis and Axford [6] have proposed that the two-tone appearance of the satel-lites could be explained in terms of the differential collection of charged dust bythe leading and trailing faces of the satellite. Recent Cassini observations supportthe model of Mendis and Axford [6]. As in other cases, the charge on the dust is acritical parameter.
1.2.2 Cometary Magnetosphere
The solar radiation and solar wind cause a variety of phenomena, associated withdust plasma interaction in the magnetosphere of a comet, approaching the sun. Theseinclude electrostatic levitation of dust from the bare cometary nucleus at largedistance from the sun and electrostatic disruption and electrodynamic transport inthe induced cometary magnetosphere as the distance from the sun gets decreased.
1.2.3 Interplanetary Dust
Particulates of size between a few centimeters to few nanometers in space withappreciable solar wind in the solar system are referred to as interplanetary dust. Themain sources of interplanetary dust in the inner region (within a distance of 5 A.U.from the sun) of the solar system are the asteroidal debris and ejecta from comets.
1.2.4 Interstellar Dust
The interstellar medium (ISM) is highly nonuniform and it contains a suspensionof fine (mm. to nm.) dust in regions of very low (H I) and very high (H II)ionization. Dust plays an important role in the dynamics and thermodynamics ofISM and in the secondary star formation. The dust tends to be negatively chargedby the impact of low energy cosmic rays while the ultraviolet radiation causes
4 1 Introduction

photoelectric emission from the dust particles, making these positively charged.Dust exists in the H I region and localized regions in H II.
1.2.5 Polar Mesospheric Clouds
Noctilucent clouds (NLC) and polar mesospheric summer echoes (PMSE, dis-cussed in Chap. 9) are of considerable interest on account of their relevance toglobal warming. The low temperatures (110–130 K) at the low ionospheric alti-tudes in the polar region cause condensation of water vapor as ice particles; theresulting system of suspended ice dust with size from 3 nm to 0.1 lm are knownas polar mesospheric clouds (PMC); this term includes both the NLC (dust sizefrom 20/30 nm to 0.1 lm) and PMSE regions (dust size from 3 to 20/30 nm).These dust particles get charged on account of the accretion of ionospheric plasmaelectrons/ions on the surface of the particles and photoelectric emission from dirtyice particles, if present. PMCs are a well-known manifestation of dust plasmainteraction in the terrestrial atmosphere.
1.3 Flames
The early experiments by Sugden and Thrush [9] and Shuler and Weber [7]showed that the electron density in rich hydrocarbon flames is far in excess of whatcan be explained by the application of Saha’s equation to gaseous species. Further,they have shown that the observed electron density can be explained on the basisof the thermionic emission of electrons from the hot solid carbon particles, presentin the flames.
Complex plasmas are also encountered in the exhausts of the rockets that usesolid propellants [1, 2, 8]. It has been known for long that the flight of somerockets, using solid propellants is accompanied by electromagnetic effects thatinterfere with communications and guidance by radio and radar. One of thecommonest types of interference is due to free electrons in the neighborhood of therocket. The electrons causing these effects originate from thermal ionization ofatoms and molecules, and probably also from the thermionic emission from hotsolid particles; particles of alumina and aluminum are present in the combustion ofaluminized propellants and should contribute significantly to the electron density.
1.4 Complex Plasma in Laboratory and Industry
Dust occurs in d.c. and more so in r.f. discharges. The role of dust in plasmaprocessing reactors, commonly employed in microelectronics/thin film industry issignificant and in many cases crucial. The role of significant amount of dust,
1.2 Occurrence in Space 5
mainly produced by sputtering on the walls in fusion machines is important; theradioactive nature of the dust is another concern.
1.5 Kinetics
While there are a number of books and reviews on different aspects of complexplasma, there is no review or book on the kinetics which is essential for under-standing any aspect of the physics of complex plasmas or for a rational design ofan application. This book is an attempt to provide a text on the kinetics of complexplasmas, which will serve as an introduction to the basic processes and illustrativeapplications to specific situations.
The initial approach to the kinetics comprised of determining the charge on aparticle from the charge balance on an isolated particle, which implied that theplasma parameters were not affected by the presence of dust.
The next improvement in the approach was the incorporation of the numberbalance of the constituents; the results indicated significant departure from theresults of the isolated particle theory.
It was realized that the rates of different processes in the kinetics weredependent on the temperature of different species, and hence energy balance ofdifferent constituents had also to be taken into account. In addition, the mainte-nance of the plasma (without dust) has also to be accounted for; in particularionization of atoms, electron–ion recombination electron attachment, etc. shouldalso be incorporated.
Thus a satisfactory formulation of the kinetics of complex plasmas shouldinclude:
(1) Maintenance of gaseous plasma(2) Number balance of constituents(3) Energy balance of constituents and(4) Charge balance on the dust particles.
In this book, as far as possible all the four aspects have been kept in mind.
1.6 Organization of the Book
Chapter 2 is a presentation of the theory of thermionic, photoelectric, electric field,light induced field, and secondary electron emission from charged spherical andcylindrical surfaces of solids (particles); quantum effects have been also discussed.Chapter 3 is a discussion of electron and ion accretion on charged spherical andcylindrical particles; quantum effects and effect of ion trapping have been inclu-ded. Chapter 4 is a discussion of charge distribution on particles in an electron dust
6 1 Introduction

cloud; both thermal equilibrium and steady state nonequilibrium situation, corre-sponding to photoelectric emission from the dust particles have been considered.The kinetics of a complex plasma with uniform size dust has been analyzed inChap. 5 under thermal equilibrium and steady state illumination (causing photo-electric emission from the dust) situations; the analysis incorporates charge bal-ance on the particles, maintenance of the plasma and number/energy balance of theconstituents. The kinetics of a complex plasma with a flow velocity larger than ionspeed and much less than electron speed has been analyzed in Chap. 6. Chapter 7is discussion of the kinetics of a complex plasma, with a size distribution of dust,which is based on the uniform potential theory; the case of illuminated complexplasma with small size dust particles (when the uniform potential theory is notvalid) has also been highlighted. The nonlinear theory of transport phenomena inthe presence of a high electrical field has been given in Chap. 8. The results ofChap. 8 have been used in Chap. 9 to explore linear and nonlinear electromagneticpropagation in a dark complex plasma, nonlinear effects in PMSE and self focusingof an e.m. beam in a complex plasma. The theory of fluctuation of charge on dustin a complex plasma is given in Chap. 10.
The rest of the chapters describe the application of the basics (Chaps. 2–10) tosome interesting situations. The kinetics of polar mesospheric clouds, cometaryplasma, plasma in Saturn E ring, interplanetary medium, and interstellar medium,as presented in Chap. 11 are illustrative applications of the basics to space envi-ronment. Use of Ar-BaO complex plasma in MHD generators has been explored inChap. 12. Chapter 13 explores complex plasma effects in rocket exhaust plasmaand its interaction with the ionosphere. Chapter 14 investigates the reduction ofelectron density in a plasma by a water spray; the loss of negative ions from thesurface of the droplets by evaporation is a unique phenomenon. Chapter 15 dis-cusses a simple situation of growth of particles in a plasma and is illustrative of theapplication of complex plasma kinetics to plasma reactors, used in microelec-tronics and thin film industry. Chapter 16 discusses the working of an electrostaticprecipitator via interaction of corona ion plasma with dust.
References
1. R. Friedman, L.W. Fagg, T.K Miller, W.D. Charles, M.C. Hughes, in Progress in Astronauticsand Aeronantics, vol. 12, ed. by K.E. Shuler, T.B. Fenn (Academic Press, New York, 1963)
2. R.M. Fristrom, F.A. Oxhus, G.H. Albrecht, Am. Rocket Soc. J. 32, 1729 (1962)3. E. GrÜn et al., Nature 362, 428 (1992)4. M. Horanyi et al., Rev. Geophys. 42, RG 4002 (2004)5. S. Kempf, R. Srama, M. Horanyi, M.E. Burton, S. Elfort, G. Maragos-Klostermeyer, M. Roy,
E. GrÜn, Nature 433, 289 (2005)6. D.A. Mendis, W.A. Axford, Rev. Earth Planetar. Sci. 2, 419 (1974)7. K.E. Shuler, J. Weber, J. Chem. Phys. 22, 491 (1954)8. F.T. Smith, C.R. Gatz, Progress in Astronautics and Aeronautics, vol. 12 (Academic Press,
New York, 1963)9. T.M. Sugden, B.A. Thrush, Nature 168, 703 (1951)
1.6 Organization of the Book 7

Chapter 2Electron Emission from Dust
2.1 Free Electron Model
2.1.1 Basic Model
The free electron model, which is applicable to metals, is based on the fact that thevalence electrons in a metal get detached from atoms and are free to move aroundin the metal and that their motion is not affected by the ions and other electrons.The confinement of the free electrons in the metal is ensured by a potential energybarrier of height Wa at the surface, corresponding to energy, much larger than themean energy of the free electrons in the metal. The potential energy of the elec-trons within the metal is assumed to be uniform; it is often, without loss ofgenerality taken as zero or -Wa.
2.1.2 Density of Electronic States
Wave mechanics provides an effective basis for the understanding of processes onthe atomic scale. The wave mechanical approach is necessary to appreciate a hostof phenomena, related to the behavior of electrons in a solid.
It is well known that electrons with a momentum p display wave phenomenawith an associated wave vector k; given by
k ¼ ð2p=hÞp; ð2:1Þ
where h is Planck’s constant.One may associate a parameter w with the wave motion so that the probability
of occurrence of an electron in the volume element dxdydz is ww*dxdydz; thefunction w satisfies Schrödinger’s equation
r2wþ ð8p2me=h2Þ½E � Vðx; y; zÞ�w ¼ 0; ð2:2Þ
M. S. Sodha, Kinetics of Complex Plasmas, Springer Series on Atomic,Optical, and Plasma Physics 81, DOI: 10.1007/978-81-322-1820-3_2,� Springer India 2014
9

where E and V denote the total and potential energy of the electron and me is themass of the electron.
Schrödinger’s equation has stood the test of time and led to a host of experi-mentally verified results.
In a metallic crystal (with dimensions of many atomic spacings) having aperiodicity Lx, Ly, and Lz in the x, y, and z directions, w has a periodic solution ofthe form (for V = 0)
wðx; y; zÞ ¼ A exp½iðkxxþ kyyþ kzzÞ�; ð2:3aÞ
such that
w½ðxþ LxÞ; ðyþ LyÞ; ðzþ LzÞ� ¼ wðx; y; zÞ: ð2:3bÞ
Equations (2.3a) and (2.3b) lead to kxLx ¼ 2nxp; kyLy ¼ 2nyp and kzLz ¼ 2nzp:Substituting for k; from (2.1) in the above relations one gets
px ¼ nxh=Lx; py ¼ nyh=Ly and pz ¼ nzh=Lz; ð2:4Þ
where nx, ny, and nz are integers.In the volume element LxLyLz an electronic state is characterized by a set of
integral values of nx, ny, and nz. In this volume consider an element DnxDnyDnz
such that nx lies between nx and nx ? Dnx, ny lies between ny and ny ? Dny and nz
lies between nz and nz ? Dnz; within this element nx can have Dnx values, ny canhave Dny values and nz can have Dnz values. Hence by Pauli’s exclusion principle(which stipulates a unique set of four quantum numbers for an electron) thenumber of electronic states (characterized by a definite combination of nx, ny, nz
and the spin quantum number) in this element is 2DnxDnyDnz, because theelectron spin quantum number has two values. Therefore, the number of electronicstates per unit volume, characterized by nx, ny, and nz lying between nx andnx ? Dnx, ny and ny ? Dny and nz and nz ? Dnz, respectively is
2DnxDnyDnz=LxLyLz
Substituting for (nx/Lx), (ny/Ly), and (nz/Lz) from (2.4) in the above expressionthe number of electronic energy states d3ns per unit volume corresponding toelectron momenta between p and pþdp is given by
d3ns ¼ ð2=h3Þdpxdpydpz: ð2:5Þ
To evaluate the number of states with momenta between p and p ? dp, theabove equation has to be integrated such that the volume element dpxdpydpz liesbetween spheres of radius p and p ? dp because
p2x þ p2
y þ p2z ¼ p2
10 2 Electron Emission from Dust

represents a sphere in the px, py, pz space. Since the volume of the p space betweenspheres of radius pand p ? dp is 4pp2dp, the number of electronic energy stateswith momenta between pand p ? dp per unit volume is
dns ¼ ð2=h3Þ4pp2dp ¼ ð8pp2=h3Þdp; ð2:6Þ
An alternate derivation of (2.5) and (2.6), based on the uncertainty relation hasbeen given by Seitz [37].
2.1.3 Distribution Function
The probability P(E) of the occupation of a state of energy E = p2/2me by elec-trons is given by the Fermi-Dirac distribution, viz.
PðEÞ ¼ FD½ðE � EFÞ=kBT�; ð2:7Þ
where
FD(X) = [1 ? exp X]-1,kB is Boltzmann’s constant,T is the temperature of the electrons andEF is the Fermi energy.
Therefore from (2.5), (2.6), and (2.7) the number of electrons per unit volumewith momenta between p and pþdp is given by
d3ne ¼ ð2=h3ÞFD½ðp2=2mekBTÞ � ðEF=kBTÞ�dpxdpydpz: ð2:8aÞ
and correspondingly
dne ¼ ð8pp2�
h3ÞFD½ðp2�
2mekBTÞ � ðEF=kBTÞ�dp; ð2:8bÞ
is the number of electrons per unit volume with momentum between p and pþdp:The number of electrons d3n1, having momenta between p and pþdp; which are
incident on the surface (from inside) per unit area per unit time is given by
d3n1 ¼ ðpx=meÞd3ne; ð2:8cÞ
where x is normal to the surface.If pt is the magnitude of the transverse component (normal to x) of the electron
momentum,
p2t ¼ p2
y þ p2z
2.1 Free Electron Model 11

and dpydpz may be integrated as 2pptdpt, which is the area between two circles ofradii pt and pt ? dpt, respectively. Hence from (2.8c) and (2.8a), one obtains
d2n1 ¼ ð4p=h3ÞFD½ðp2�
2mekBTÞ � ðEF=kBTÞ�ðpx=meÞptdpxdpt:
Putting ex ¼ ðp2x=2mekBT ; et ¼ p2
t =2mekBT� �
and eF ¼ EF=kBTð Þ; the aboveequation may be expressed as:
d2n1 ¼ ð4pmek2BT2=h3ÞFDðex þ et � eFÞdexdet ¼ ðA0T2=eÞFDðex þ et � eFÞdexdet
ð2:9Þ
where A0 ¼ 4pemek2B=h3
� �¼ 120 A/cm2K2 and -e is the electronic charge.
In the above equation, ex and et represent the normalized normal and transversekinetic energies on account of the normal (px) and transverse (pt) components ofthe electron momentum in the metal. The parameter ex ? et represents the totalnormalized electron energy, while eF is the normalized Fermi energy. Theparameters ex, et, and eF are all positive.
2.1.4 Fermi Energy
Putting E ¼ p2=2með Þ in (2.8b) one obtains
dne ¼ ð8p�
h3Þð2meÞ1=2FD½ðE � EFÞ=kBT �E1=2dE
or
ne ¼ ð8p=h3Þð2meÞ1=2Z1
0
E1=2FD½ðE � EFÞ=kBT�dE; ð2:10Þ
where ne is the number of electrons per unit volume, i.e., the electron density.The above equation can be used to evaluate the Fermi energy EF, corre-
sponding to a given electron density ne and the temperature T.A simple expression for Fermi energy EF0 can be obtained at the temperature
0 K, corresponding to
FD ¼ 0 for E [ EF0
and
FD ¼ 1 for E\EF0:
Thus, the electron density
12 2 Electron Emission from Dust
ne ¼ZEF0
0
ð8p=h3Þð2meÞ1=2E1=2dE;
which leads to
EF0 ¼ ðh2=8meÞð3ne=8pÞ2=3: ð2:11Þ
Using (2.10), one may obtain [37] an approximate expression for the Fermienergy EF corresponding to an electron density ne and finite temperature T, as
EF � EF0½1� ðp2=8ÞðkBT=EF0Þ�2=3
� EF0½1� ðp2=12ÞðkBT=EF0Þ�:ð2:12Þ
where EF0 is given by (2.11) and is much larger than kBT.
2.2 Basic Concepts of Electron Emission
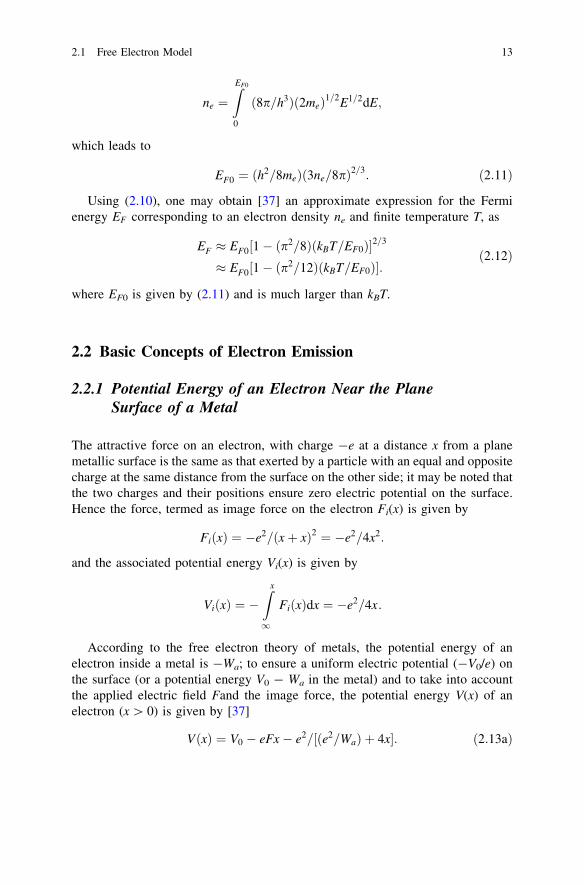
2.2.1 Potential Energy of an Electron Near the PlaneSurface of a Metal
The attractive force on an electron, with charge -e at a distance x from a planemetallic surface is the same as that exerted by a particle with an equal and oppositecharge at the same distance from the surface on the other side; it may be noted thatthe two charges and their positions ensure zero electric potential on the surface.Hence the force, termed as image force on the electron Fi(x) is given by
FiðxÞ ¼ �e2=ðxþ xÞ2 ¼ �e2=4x2:
and the associated potential energy Vi(x) is given by
ViðxÞ ¼ �Zx
1
FiðxÞdx ¼ �e2=4x:
According to the free electron theory of metals, the potential energy of anelectron inside a metal is -Wa; to ensure a uniform electric potential (-V0/e) onthe surface (or a potential energy V0 - Wa in the metal) and to take into accountthe applied electric field Fand the image force, the potential energy V(x) of anelectron (x [ 0) is given by [37]
VðxÞ ¼ V0 � eFx� e2=½ðe2=WaÞ þ 4x�: ð2:13aÞ
2.1 Free Electron Model 13
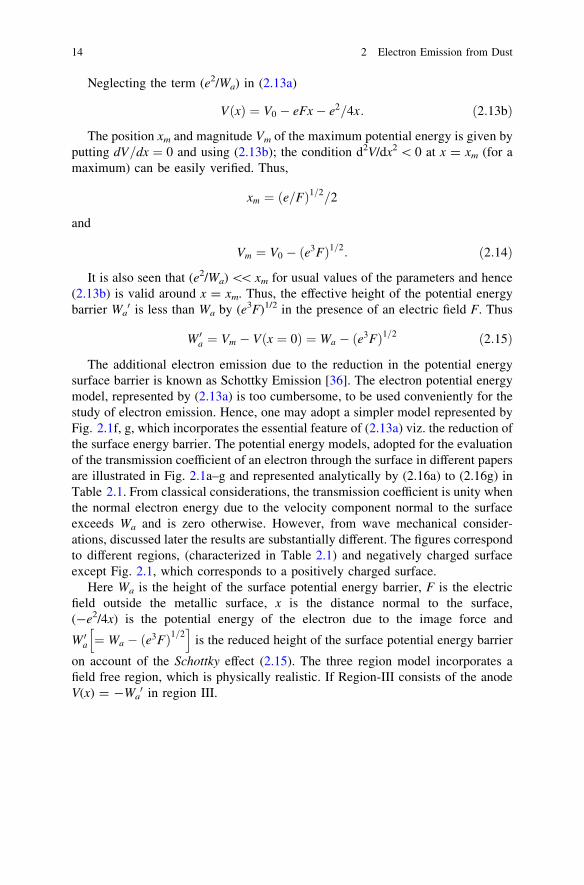
Neglecting the term (e2/Wa) in (2.13a)
VðxÞ ¼ V0 � eFx� e2=4x: ð2:13bÞ
The position xm and magnitude Vm of the maximum potential energy is given byputting dV=dx ¼ 0 and using (2.13b); the condition d2V/dx2 \ 0 at x = xm (for amaximum) can be easily verified. Thus,
xm ¼ ðe=FÞ1=2=2
and
Vm ¼ V0 � ðe3FÞ1=2: ð2:14Þ
It is also seen that (e2/Wa) \\ xm for usual values of the parameters and hence(2.13b) is valid around x = xm. Thus, the effective height of the potential energybarrier Wa
0 is less than Wa by (e3F)1/2 in the presence of an electric field F. Thus
W 0a ¼ Vm � Vðx ¼ 0Þ ¼ Wa � ðe3FÞ1=2 ð2:15Þ
The additional electron emission due to the reduction in the potential energysurface barrier is known as Schottky Emission [36]. The electron potential energymodel, represented by (2.13a) is too cumbersome, to be used conveniently for thestudy of electron emission. Hence, one may adopt a simpler model represented byFig. 2.1f, g, which incorporates the essential feature of (2.13a) viz. the reduction ofthe surface energy barrier. The potential energy models, adopted for the evaluationof the transmission coefficient of an electron through the surface in different papersare illustrated in Fig. 2.1a–g and represented analytically by (2.16a) to (2.16g) inTable 2.1. From classical considerations, the transmission coefficient is unity whenthe normal electron energy due to the velocity component normal to the surfaceexceeds Wa and is zero otherwise. However, from wave mechanical consider-ations, discussed later the results are substantially different. The figures correspondto different regions, (characterized in Table 2.1) and negatively charged surfaceexcept Fig. 2.1, which corresponds to a positively charged surface.
Here Wa is the height of the surface potential energy barrier, F is the electricfield outside the metallic surface, x is the distance normal to the surface,(-e2/4x) is the potential energy of the electron due to the image force and
W 0a ¼ Wa � e3Fð Þ1=2h i
is the reduced height of the surface potential energy barrier
on account of the Schottky effect (2.15). The three region model incorporates afield free region, which is physically realistic. If Region-III consists of the anodeV(x) = -Wa
0 in region III.
14 2 Electron Emission from Dust

2.2.2 Transmission Coefficient Across Metallic PlaneSurfaces: Uncharged Surface
The transmission coefficient of an electron through the surface can be evaluatedfrom matching the solution (w and dw/dx) of Schrödinger’s equation at theinterface of the two regions.
The derivation of an expression for the transmission coefficient D(Ex) corre-sponding to an uncharged surface with electron potential energy, described by
Fig. 2.1 Potential energy of an electron near the surface of a metallic plate. The labels are asfollows: a Uncharged surface, b two region Fowler’s model [15] (negatively charged), c tworegion. Schottky/Nordheim [32] model (negatively charged), d two region Forbes and Deane [12]model (negatively charged) e three region model by Sodha et al. [40] (negatively charged),f negatively charged surface with V0\Wa and g negatively charged surface with V0 [ Wa; f andg correspond to the present three region model and h positively charged surface ðV0\0Þ (afterAgarwal et al. [1]; curtsey authors and publishers NRC Press)
2.2 Basic Concepts of Electron Emission 15

(2.16a) is given in many books on Quantum Mechanics (e.g., [17]. Thus, thetransmission coefficient D0(Ex) is given by
D0ðExÞ ¼ 4E1=2x ðEx �WaÞ
1=2.½E1=2
x þ ðEx �WaÞ1=2�2
¼ 4e1=2x ðex � waÞ
1=2.½e1=2
x þ ðex � waÞ1=2�2;
ð2:17Þ
where
ex ¼ Ex=kBT;
wa ¼ Wa=kBT
and Ex is the normal component of kinetic energy of the electron in the metal.To a first approximation (2.17) is valid for negatively charged surfaces, when
Wa is replaced by Wa–e3/2F1/2 (2.15) and Ex is significantly larger than Wa. For apositively charged surface (V0 \ 0) (2.17) is an approximation when Wa isreplaced by Wa–V0; the surface is then charged to an electric potential (–V0/e).
Table 2.1 Models of potential energy of an electron near a negatively charged plane metallicsurface (x = 0)
Fig. 2.1a Region-I V(x) = -Wa x \ 0Simple model (uncharged) Region-II V(x) = 0 x [ 0 (2.16a)Fig. 2.1b Region-I V(x) = 0 x \ 0Fowler and Nordheim [15] Region-II V(x) = V0 - eF(x) x [ 0 (2.16b)Fig. 2.1c Region-I V(x) = -Wa x \ 0Forbes and Deane [12] Region-II V(x) = -eF(x) x [ 0 (2.16c)Fig. 2.1d Region-I V(x) = 0 x \ 0Schottky/ Nordheim [32] Region-II V(x) = V0 - eF(x)
- (e2/4x)x [ 0 (2.16d)
Fig. 2.1e Region-I V(x) = 0 x \ 0Sodha and Dixit [40] Region-II V(x) = V0 - eF(x) 0 \ x \ d( = V0/eF)
Region-III V(x) = 0 x [ d (2.16e)Fig. 2.1f (V0 [ Wa) Region-I V(x) = V0 - Wa
0x \ 0
Fig. 2.1g (V0 \ Wa) Region-II V(x) = V0 - eF(x) 0 \ x \ d( = V0/eF)(Three region model) Region-III V(x) = 0 x [ d (2.16f, g)Fig. 2.1h (V0 \ 0) Region-I V(x) = V0 - Wa x \ 0 (2.16h)
Region-II V(x) = V0 - V0(x/d) x [ 0Region-III V(x) = 0 x [ d
After Agarwal et al. [1]; curtsey authors and publishers NRC Press
16 2 Electron Emission from Dust

2.2.2.1 Negatively Charged Surface (After Agarwal et al. [1])
Referring to Fig. 2.1f, g, one notices that from wave mechanical considerations thetransmission coefficient, D(Ex) is also finite for Wa–V0–e3/2F1/2 \ Ex \ Wa–e3/2F1/2,when Wa [ V0 and 0 \ Ex \ Wa–e3/2F1/2 for Wa \ V0 on account of tunneling,where V0 is the potential energy of electrons at the surface; this accounts for theelectric field emission. A critique of the theories of electric field emission has beengiven by [12, 40]. Little attention has however been given to D(Ex) (for a negativelycharged surface) for electrons with Ex [ Wa–e3/2F1/2, which are responsible forthermionic and photoelectric emission. This may be due to the electric field emissionstudies being mainly limited to low temperatures.
The frequently used [15] model, which is the basis of the famous Fowler–Nordheim equation for the electric field emission, is illustrated in Fig. 2.1d. Thismodel ignores the fact that V(x) = (–Wa ? V0 ? e3/2F1/2) in Region-I and also theexistence of Region-III where V = 0. The vast amount of work on two regionmodels, corresponding to Fig. 2.1d has been critically reviewed by Forbes andDeane [12]. Some models (Fig. 2.1e) have taken into account (e.g., [40] Region-IIIbut have ignored the fact that in Region-I, V(x) = (–Wa ? V0 ? e3/2F1/2). Nord-heim [32] has used a model similar to that in Fig. 2.1b except that in Region-II, thepotential energy takes into account the image force (Fig. 2.1d). Because of ignoringthe surface energy barrier in these models, the corresponding evaluated transmissioncoefficients and the electron emission currents, lack a sound foundation.
In what follows an expression for D(Ex) corresponding to a negatively chargedsurface has been derived and the dependence of D(Ex)on electron energy, electricfield, and height of the surface energy barrier has been graphically illustrated; it isseen that D(Ex) is an increasing function of Ex and hence the thermionic and pho-toelectric currents should also increase with increasing field F. The dependence ofthermionic and photoelectric current density on the electric field and the height of thesurface energy barrier has also been investigated and the results have been graphi-cally illustrated in later sections. For the sake of completeness, the currents onaccount of the electric field emission and light-induced field emission as a function ofWa and F have also been evaluated; the earlier studies pertained to low temperatures.
It is seen that the electric field significantly enhances the transmission coeffi-cient of an electron across the surface and hence for the evaluation of the electronemission from a metal an appropriate expression for D(Ex), (derived herein),should be used for negatively charged surfaces. The electron emission, corre-sponding to a positively charged surface is also briefly discussed later for the sakeof completeness.
2.2.2.2 Expression for D(Ex)
The potential energy of an electron inside and outside a negatively charged planemetallic surface may be modeled by (2.16f, g).
2.2 Basic Concepts of Electron Emission 17
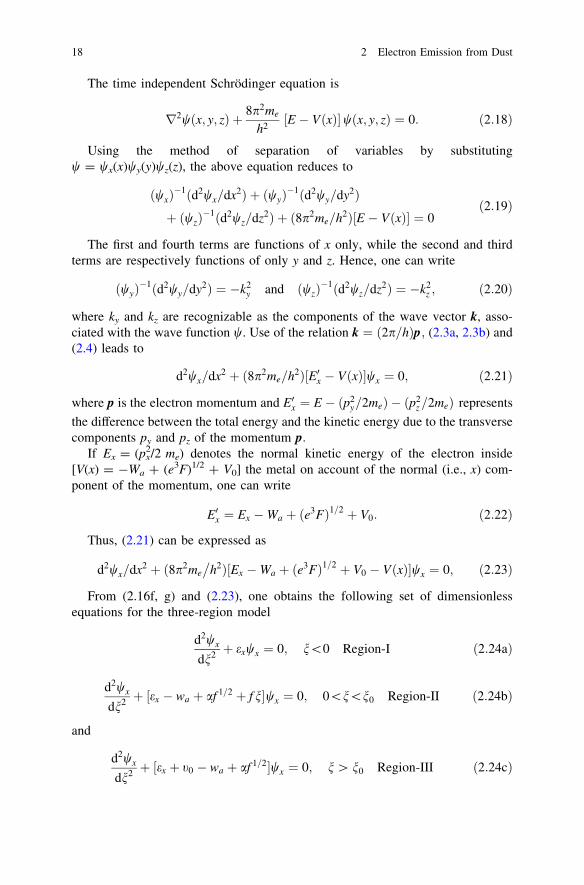
The time independent Schrödinger equation is
r2wðx; y; zÞ þ 8p2me
h2½E � VðxÞ�wðx; y; zÞ ¼ 0: ð2:18Þ
Using the method of separation of variables by substitutingw = wx(x)wy(y)wz(z), the above equation reduces to
ðwxÞ�1ðd2wx=dx2Þ þ ðwyÞ
�1ðd2wy=dy2Þþ ðwzÞ
�1ðd2wz=dz2Þ þ ð8p2me=h2Þ½E � VðxÞ� ¼ 0ð2:19Þ
The first and fourth terms are functions of x only, while the second and thirdterms are respectively functions of only y and z. Hence, one can write
ðwyÞ�1ðd2wy=dy2Þ ¼ �k2
y and ðwzÞ�1ðd2wz=dz2Þ ¼ �k2
z ; ð2:20Þ
where ky and kz are recognizable as the components of the wave vector k, asso-ciated with the wave function w. Use of the relation k ¼ ð2p=hÞp; (2.3a, 2.3b) and(2.4) leads to
d2wx=dx2 þ ð8p2me=h2Þ½E0x � VðxÞ�wx ¼ 0; ð2:21Þ
where p is the electron momentum and E0x ¼ E � ðp2y=2meÞ � ðp2
z=2meÞ represents
the difference between the total energy and the kinetic energy due to the transversecomponents py and pz of the momentum p:
If Ex = (px2/2 me) denotes the normal kinetic energy of the electron inside
[V(x) = -Wa ? (e3F)1/2 ? V0] the metal on account of the normal (i.e., x) com-ponent of the momentum, one can write
E0x ¼ Ex �Wa þ ðe3FÞ1=2 þ V0: ð2:22Þ
Thus, (2.21) can be expressed as
d2wx=dx2 þ ð8p2me
�h2Þ½Ex �Wa þ ðe3FÞ1=2 þ V0 � VðxÞ�wx ¼ 0; ð2:23Þ
From (2.16f, g) and (2.23), one obtains the following set of dimensionlessequations for the three-region model
d2wx
dn2 þ exwx ¼ 0; n\0 Region-I ð2:24aÞ
d2wx
dn2 þ ½ex � wa þ af 1=2 þ f n�wx ¼ 0; 0\n\n0 Region-II ð2:24bÞ
and
d2wx
dn2 þ ½ex þ t0 � wa þ af 1=2�wx ¼ 0; n[ n0 Region-III ð2:24cÞ
18 2 Electron Emission from Dust

where ex ¼ Ex=kBT; t0 ¼ V0=kBT ¼ eFd=kBT;wa ¼ Wa=kBT ;f ¼ heF=ðpkBT
ffiffiffiffiffiffiffiffiffiffiffiffiffiffiffiffi8mekBTp
Þ is the dimensionless electric field strength inRegion-II,
a ¼ ð8p2me=h2kBTÞ1=4e;
n ¼ ðpffiffiffiffiffiffiffiffiffiffiffiffiffiffiffiffi8mekBT
p=hÞx;
n0 ¼ ðpffiffiffiffiffiffiffiffiffiffiffiffiffiffiffiffi8mekBTp
=hÞd; ðV0=eFÞ ¼ t0=f and T is the temperature of the metal.
The solution of (2.24a), (2.24b), and (2.24c) may be written as
wxðnÞ ¼ A1 expðik1nÞ þ A2 expð�ik1nÞ; Region-I ð2:25aÞ
wxðnÞ ¼B1Ai½�ðex � wa þ af 1=2 þ f nÞ=f 2=3�þ B2Bi½�ðex � wa þ af 1=2 þ f nÞ=f 2=3� Region-II
ð2:25bÞ
and
wxðnÞ ¼ C1 expðik3nÞ; Region-III ð2:25cÞ
where Ai and Bi are Airy functions,
k21 ¼ ex and k2
3 ¼ ½ex þ t0 � wa þ af 1=2�:
The constants a1, a2, b1, b2, and c1 are related by the fact that the wave functionand its derivative is continuous at the boundaries. viz., at n = 0 and n = n0.
Thus at n = 0
a1 þ a2 ¼ b1l2 þ b2m2; ð2:26aÞ
and
ik1a1 � ik1a2 ¼ �b1l02f 1=3 � b2l02f 1=3: ð2:26bÞ
and at n = n0
b1l1 þ b2m1 ¼ C1 expðik3n0Þ ð2:26cÞ
and
�b1l01f 1=3 � b2m01f 1=3 ¼ ik3c1 expðik3n0Þ; ð2:26dÞ
where
2.2 Basic Concepts of Electron Emission 19
l1 ¼ Ai½�ðex þ t0 � wa þ af 1=2Þ=f 2=3�; l01 ¼ Ai0½�ðex þ t0 � wa þ af 1=2Þ=f 2=3�l2 ¼ Ai½�ðex � wa þ af 1=2Þ=f 2=3�; l02 ¼ Ai0½�ðex � wa þ af 1=2Þ=f 2=3�;
m1 ¼ Bi½�ðex þ t0 � wa þ af 1=2Þ=f 2=3�; m01 ¼ Bi0½�ðex þ t0 � wa þ af 1=2Þ=f 2=3�;m01 ¼ Bi0½�ðex þ t0 � wa þ af 1=2Þ=f 2=3�m2 ¼ Bi½�ðex � wa þ af 1=2Þ=f 2=3� and
m02 ¼ Bi0½�ðex � wa þ af 1=2Þ=f 2=3�:
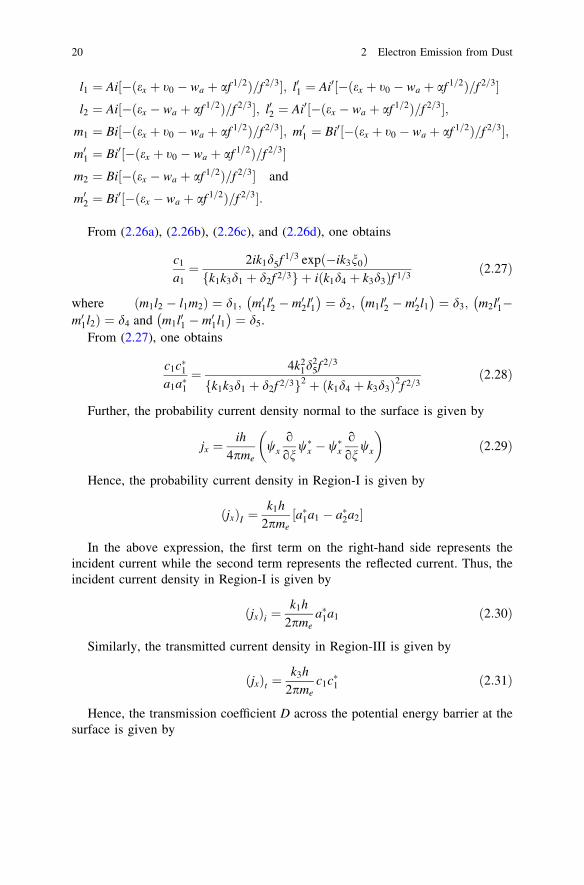
From (2.26a), (2.26b), (2.26c), and (2.26d), one obtains
c1
a1¼ 2ik1d5f 1=3 expð�ik3n0Þfk1k3d1 þ d2f 2=3g þ iðk1d4 þ k3d3Þf 1=3
ð2:27Þ
where m1l2 � l1m2ð Þ ¼ d1; m01l02 � m02l01� �
¼ d2; m1l02 � m02l1� �
¼ d3; m2l01��
m01l2Þ ¼ d4 and m1l01 � m01l1� �
¼ d5.From (2.27), one obtains
c1c�1a1a�1
¼ 4k21d
25f 2=3
fk1k3d1 þ d2f 2=3g2 þ ðk1d4 þ k3d3Þ2f 2=3ð2:28Þ
Further, the probability current density normal to the surface is given by
jx ¼ih
4pmewx
o
onw�x � w�x
o
onwx
� �ð2:29Þ
Hence, the probability current density in Region-I is given by
ðjxÞI ¼k1h
2pme½a�1a1 � a�2a2�
In the above expression, the first term on the right-hand side represents theincident current while the second term represents the reflected current. Thus, theincident current density in Region-I is given by
ðjxÞi ¼k1h
2pmea�1a1 ð2:30Þ
Similarly, the transmitted current density in Region-III is given by
ðjxÞt ¼k3h
2pmec1c�1 ð2:31Þ
Hence, the transmission coefficient D across the potential energy barrier at thesurface is given by
20 2 Electron Emission from Dust

D ¼ ðjxÞtðjxÞi¼ k3
k1
c1c�1a1a�1
ð2:32Þ
which using (2.28) can be reduced to
DðexÞ ¼4k1k3d
25f 2=3
fk1k3d1 þ d2f 2=3g2 þ ðk1d4 þ k3d3Þ2f 2=3; ð2:32aÞ
According to Fowler [13], a fraction of electrons get their normal energyenhanced by an amount hm, when the surface is irradiated by light of frequency m.Hence the transmission coefficient Dph(ex)of such electrons can be obtained bysubstituting (ex ? ev)for ex in (2.32a), where ev = (hv/kBT). Thus
DphðexÞ ¼ Dðex þ evÞ: ð2:32bÞ
Equation (2.32a) is also valid in the case of positively charged surfaces whenone substitutes (-t0) for t0 and -f for f in the inherent coefficients in the finalexpression for D(ex).
The set of Fig. 2.2 and 2.3 illustrate the dependence of transmission coefficient[D(ex)] on the normal energy of electrons ex, as a function of dimensionless fieldstrength (f) (Fig. 2.2) and the potential energy barrier height (wa) (Fig. 2.3). It isseen that D(ex) increases monotonically with increasing ex and f.
The straight vertical dashed lines are indicative of the effective surface energybarrier (wa - af1/2), so that the points to the left of these lines contribute to theelectric field emission while those to the right contribute to thermionic emission;the broken curves correspond to transmission coefficient for step potential barrierwith reduced barrier height D0(ex). It is interesting to notice that contribution of the
Fig. 2.2 Dependence of Transmission-coefficient D(ex) on ex for the parametersT = 1000 K, wa = 100 and t0 = 104. The different values of field strength has been shown onthe graph by letters; p, q, r, s, t and u correspond to f = 0, 0.2, 0.4, 0.7, 1.0 and 1.5 respectively.The portion of the curves corresponding to left and right-hand side of the vertical lines refer tofield emission and thermionic emission respectively (after Agarwal et al. [1]; curtsey authors andpublishers NRC Press)
2.2 Basic Concepts of Electron Emission 21

field emission and departure of D(ex) from D0(ex) increase with increasing f. Thefigure also reflects the fact that D0(ex) is only meaningful for ex [ (wa - af1/2).Figure 2.3 indicates that D(ex) decreases with increasing potential energy barrierheight (wa). It is seen that the surface potential energy t0 has no significant effecton the energy dependence of D(ex). It is seen from Fig. 2.4 that the expression dueto Forbes and Dean [12], based on the two region model overestimates thetransmission coefficient except for very high and low values of ex compared to wa.
Fig. 2.3 Dependence of Transmission-coefficient D(ex) as a function of ex for the parametersT = 1000 K, f = 1 and t0 = 104. The different values of wa parameter have been shown on thegraph by letters. The letters p, q, r and s refer to wa = 90, 95, 100 and 105 respectively (afterAgarwal et al. [1]; curtsey authors and publishers NRC Press)
Fig. 2.4 Dependence of D(ex) on ex for the Case-I as stated in the text, for the parametersT = 1000 K, f = 1, wa = 120 and t0 = 1.0 9 104; here the role of image force is ignored. Thesolid curve corresponds to the present three region model while the broken curve refers to Forbesand Deane’s approach (after Agarwal et al. [1]; curtsey authors and publishers NRC Press)
22 2 Electron Emission from Dust

2.2.3 Thermionic and Electric Field Emission of Electronsfrom a Plane Surface
2.2.3.1 Negatively Charged Surface
From classical considerations electrons hitting the surface with normal energyex [ (wa - af1/2) have a unit probability of crossing the surface or of emission;such an emission is known as thermionic emission. However, wave mechanicalconsiderations, outlined before lead to a probability of emission D(ex), given by(2.32a). The number of electrons hitting the surface per unit area per unit time andhaving normal energy between ex and ex ? dex and transverse energy between et
and et ? det is
d2n1 ¼ ðA0=eÞT2FDðex þ et � eFÞdexdet; ð2:9Þ
Hence, the number nth of electrons emitted from the surface per unit area perunit time and the corresponding electric current Jth is given by
Jth ¼� enth ¼ �e
Z1
ex¼ðwa�af 1=2Þ
Z1
et¼0
DðexÞd2n1
¼� A0T2Z1
ðwa�af 1=2Þ
Z1
0
DðexÞ � FDðex þ et � eFÞdexdet:
ð2:33Þ
For electrons of interest to thermionic emission, ex [ (wa - af1/2),
g ¼ ðex þ et � eFÞ[ wa � eF þ etð Þ � af 1=2
½� uþ et � af 1=2� is much larger than unity, where u ¼ ðwa � eFÞ¼ Wa � EFð Þ=kBT ¼ U=kBT ; and U is known as the work function of the metal.Hence FD(g) ? exp (-g) and (2.9) simplifies to
d2n1 ¼ ðA0=eÞT2 expð�ex � et þ eFÞdexdet; ð2:9aÞ
Thus (2.33) reduces to
Jth¼�enth¼�eðA0T2=eÞZ1
ðwa�af 1=2Þ
Z1
0
DðexÞ �expð�ex�etþeFÞdexdet
¼�A0T2Z1
ðwa�af 1=2Þ
DðexÞ �expð�exþeFÞdex ð2:34aÞ
2.2 Basic Concepts of Electron Emission 23

In most of investigations on thermionic emission, the transmission coefficient isassumed to be unity; as evident from Figs. 2.2, 2.3 and similar calculations forother parameters this is indeed a poor approximation.
However, putting DðexÞ ¼ 1 (2.34a) reduces to
J0th0 ¼ �A0T2 expð�wa þ af 1=2 þ eFÞ ¼ �A0T2 expð�uþ af 1=2Þ ð2:34bÞ
and
Jth=J0th0 ¼ expðu� af 1=2ÞZ1
ðwa�af 1=2Þ
DðexÞ expð�ex þ eFÞdex ð2:34cÞ
For an uncharged surface f ¼ 0 and if DðexÞ ¼ 1 (2.34b) reduces to
Jth0 ¼ �A0T2 expð�uÞ ¼ �A0T2 expð�U=kBTÞ: ð2:35aÞ
The above equation is known as Richardson Dushman equation.For metals, as well as semiconductors the experimental data conforms to the
relation
Jth0 ¼ �AT2 expð�U=kBTÞ; ð2:35bÞ
where the constant A is known as Richardson’s Constant and is in general differentfrom A0.
For an uncharged surface and DðexÞ ¼ 1; the mean energy eth0 of the emittedelectrons at the surface is given by
eth0 ¼Z1
wa
Z1
0
ðex þ et � waÞd2n1
,Z1
wa
Z1
0
d2n1
Using (2.9) and putting e0x ¼ ex � wa and e0 ¼ e0x þ et
eth0 ¼Z1
0
Z1
0
ðe0x þ etÞ expð�e0x � e0tÞde0xdet
,Z1
0
Z1
0
expð�e0x � etÞde0xdet
¼Z1
0
ðe02Þ expð�e0Þde0,Z1
0
e0 expð�e0Þde0 ¼ 2 just outside the surfaceð Þ
ð2:36aÞ
In writing the above equation, the following identity has been used
Z1
0
Z1
0
f ðx1 þ x2Þdx1dx2 ¼Z1
x0
xf ðxÞdx ð2:37Þ
x1 þ x2 [ x0
24 2 Electron Emission from Dust

For a negatively charged surface at a potential (-V0/e), the mean electronenergy far away from the surface is
eth ¼ 2þ t0: ð2:36bÞ
The values of Richardson’s Constant for different metals are different from oneanother as well as from A0. The reasons for departure of A from A0, as given bySeitz [37] are as follows:
I. The concept of effective mass of an electron is phenomenological; puttingeffective mass equal to free electronic mass is another approximation.
II. The interaction of electrons (mutual and with ions) in the metals has beenneglected.
III. The relation E = (px2 ? py
2 ? pz2)/2 me is at best an approximation, within
the metal.IV. The assumption of a perfectly plane surface is idealistic.V. The coefficient of transmission from the surface for the electrons with
(px2/2m) [ Wa -(e3F)1/2 has been assumed to be unity [D(ex) = 1].
VI. The temperature dependence of U has been neglected. If one assumesU = U0 ? U1 T, substitution for U as above in (2.3b) leads to (2.3c)with A = A0 exp (-U1/kB). This explains A being larger or smaller thanA0, depending on the sign of U1.
The work function U and other parameters for some materials has been listed inTable 2.2.
2.2.3.2 Electric Field Emission
As discussed before electrons with ex \ (wa - af1/2) have a finite probability D(ex)of tunneling through the modified surface energy barrier and thus contributing toelectron emission, known as electric field emission. Hence proceeding as in thederivation of (2.34a) the field emission current density is given by
Jfe ¼ �e
Zwa�af 1=2
0
Z1
0
DðexÞd2n1 ¼ �A0T2Zðwa�af 1=2Þ
0
DðexÞ ln½1þ expð�ex þ eFÞ�dex
for t0 [ wa
ð2:38aÞ
and
Jfe ¼ �A0T2Zðwa�af 1=2Þ
wa�af 1=2�t0
DðexÞ ln½1þ expð�ex þ eFÞ�dex for t0\wa ð2:38bÞ
2.2 Basic Concepts of Electron Emission 25
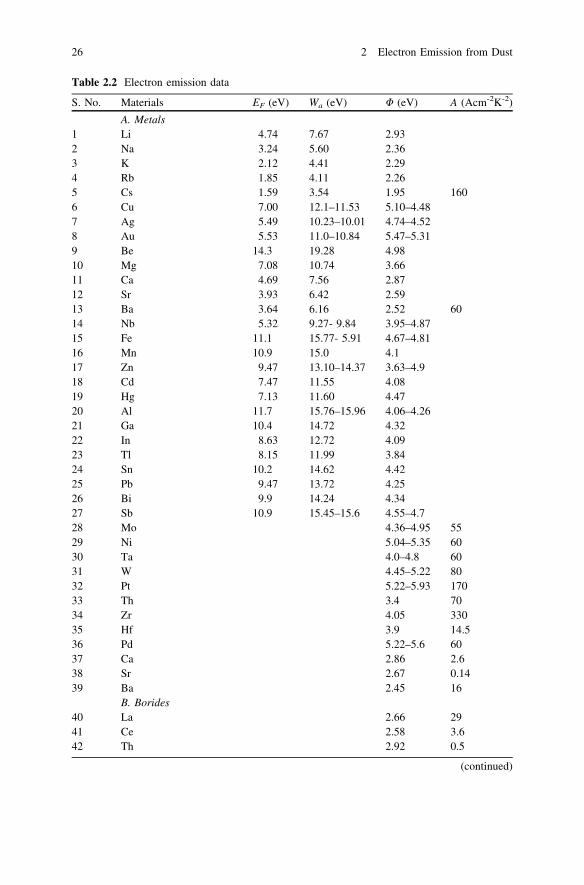
Table 2.2 Electron emission data
S. No. Materials EF (eV) Wa (eV) U (eV) A (Acm-2K-2)
A. Metals1 Li 4.74 7.67 2.932 Na 3.24 5.60 2.363 K 2.12 4.41 2.294 Rb 1.85 4.11 2.265 Cs 1.59 3.54 1.95 1606 Cu 7.00 12.1–11.53 5.10–4.487 Ag 5.49 10.23–10.01 4.74–4.528 Au 5.53 11.0–10.84 5.47–5.319 Be 14.3 19.28 4.9810 Mg 7.08 10.74 3.6611 Ca 4.69 7.56 2.8712 Sr 3.93 6.42 2.5913 Ba 3.64 6.16 2.52 6014 Nb 5.32 9.27- 9.84 3.95–4.8715 Fe 11.1 15.77- 5.91 4.67–4.8116 Mn 10.9 15.0 4.117 Zn 9.47 13.10–14.37 3.63–4.918 Cd 7.47 11.55 4.0819 Hg 7.13 11.60 4.4720 Al 11.7 15.76–15.96 4.06–4.2621 Ga 10.4 14.72 4.3222 In 8.63 12.72 4.0923 Tl 8.15 11.99 3.8424 Sn 10.2 14.62 4.4225 Pb 9.47 13.72 4.2526 Bi 9.9 14.24 4.3427 Sb 10.9 15.45–15.6 4.55–4.728 Mo 4.36–4.95 5529 Ni 5.04–5.35 6030 Ta 4.0–4.8 6031 W 4.45–5.22 8032 Pt 5.22–5.93 17033 Th 3.4 7034 Zr 4.05 33035 Hf 3.9 14.536 Pd 5.22–5.6 6037 Ca 2.86 2.638 Sr 2.67 0.1439 Ba 2.45 16
B. Borides40 La 2.66 2941 Ce 2.58 3.642 Th 2.92 0.5
(continued)
26 2 Electron Emission from Dust

The limits can be appreciated by looking at Fig. (2.1f, g).
2.2.3.3 Numerical Results and Discussion
For an appreciation of the results computations were made, corresponding to theparameters T = 1000 K when
wa ¼ 38:64ðWa in eVÞ; f ¼ 4:7� 10�6ðF in V/cmÞ and t0 ¼ 38:64ðg0in eVÞ;
g0 is surface potential energy of an electron. The dependence of the fieldemission (Jfe/Jth0) and thermionic (Jth/Jth0) emission currents on the dimensionlessfield strength (f) for different values of the parameter wa has been illustrated inFig. 2.5. It is seen that the field emission current (Jfe) strongly depends on theapplied field and significantly contributes to the total current for large fields. Thethermionic current (Jth) also increases monotonically with increasing f, with aslower rate than Jfe. The dependence of these currents on parameter wa can easilybe understood in terms of transmission coefficient dependence on potential energybarrier height. It may be noticed that the total emission current (Jt = Jth ? Jfe)gets enhanced by a factor of about eight for f = 2 from its initial value (for f = 0).
Table 2.2 (continued)
S. No. Materials EF (eV) Wa (eV) U (eV) A (Acm-2K-2)
C. Carbides43 Ta 3.14 0.344 Ti 3.35 2545 Zr 2.18 0.346 Th 3.5 55047 Ur 3.3 4048 Th on W 2.63 3.049 Th on Mo 2.58 1.550 Zr on W 3.14 5.051 La, Ce on W 2.71 8.052 Cs on W 1.36 3.253 O on W 9.2 5� 1011
54 Cs on O on W 0.72 0.003D.Mono molecular films
55 Ba on W 1.56 1.556 Ba on O on W 1.34 0.1857 Ice 8.7
Note The values for EF, Waand U for materials 1–36have been taken from Lide [25]The values of A for materials 5, 13, 28–36 and 48–56are from Fowler [14]The values of U for materials 48–56are from Fowler [14]The values of A and U for materials 37–47 are from Jenkins and Trodder [22]The value of U for ice is an indirect reference from Klumov et al. [24]
2.2 Basic Concepts of Electron Emission 27

2.2.3.4 Positively Charged Surface (V0 < 0)
An electron can be emitted from a surface, charged to positive electric potential(-V0/e)only when its normal energy exceeds Wa - V0.
Hence the thermionic emission current Jth and the mean energy of the emittedelectrons far away from the surface is in the approximation D(ex) = 1 given by
Jth ¼ �A0T2 exp½�ðu� t0Þ� ¼ �A0T2 exp½�ðU� V0Þ=kBT�¼ Jth0 expðV0=kBTÞ
ð2:35cÞ
and
ðethÞfar away ¼ 2 ð2:36cÞ
In contrast to (2.36b), eth does not depend on t0. This is because the net effect ofthe positive potential is to enhance the work function and eth0 is independent of thework function. In fact in the evaluation of Jth and eth only electrons with energy inexcess of Wa - V0 are considered.
Fig. 2.5 Dependence of Jth=Jth0ð Þ; Jfe=Jth0ð Þand Jt=Jth0ð Þ with dimensionless electric field (f) forthe parameters T = 1000 K and t0 = 1.0 9 104. The labels on the curves p, q, r and s correspondto wa = 60, 80, 100 and 120 respectively. Dashed (left hand scale), short dashed (right handscale) and solid curves (right hand scale) correspond to the field Jfe=Jth0ð Þ, thermionic Jth=Jth0ð Þand total Jth=Jth0ð Þ emission current density respectively (after Agarwal et al. [1]; curtsey authorsand publishers NRC Press)
28 2 Electron Emission from Dust

2.2.4 Photoelectric and Light Induced Field Emissionfrom a Plane Surface
A quantitative theory for the rate of photoelectric emission from a plane metallicsurface was first formulated by Fowler [13, 14] on the basis of the followingexplicit and implicit assumptions:
I. The free electron theory is applicable.II. Free electrons incident on a unit area of the surface (from inside) have a
probability of absorbing a photon, which is proportional to the number ofincident photons per unit area per unit time (the absorption occurs on thesurface of the metal and does not alter the number of incident electrons onthe surface from inside).
III. The normal energy of an electron (due to the velocity component, normalto the surface) gets enhanced by ht after absorption of a photon of fre-quency m at the surface, where h is Planck’s constant.
IV. Electrons with a normal energy, exceeding the potential energy barrier atthe surface get emitted.
A little later than Fowler [13], DuBridge [11] presented a similar theory forphotoelectric emission; however instead of assumptions (ii) and (iii) DuBridge[11] assumed that
(iia) The absorption of a photon by the electron occurs inside the metal andthe number of such absorptions per unit volume is proportional to thenumber density of free electrons; the implicit assumption that thisnumber is also proportional to the number of incident photons per unitarea per unit time was not mentioned by him. Since he did not considercollisions of the electrons after absorption of photon, it is implied thatthe absorption was assumed to occur close to the surface, within athickness much less than the mean free path of the electrons and
(iiia) The total (not the normal) energy of an electron gets enhanced by htafter the absorption of the photon.
In his derivation of the energy distribution of emitted photoelectrons and theemitted photoelectric current, DuBridge [11] made two further simplificationswithout justification viz.
(i) The energy of the electron after absorption of a photon is much larger thanht (footnote on p. 735 of his paper) and
(ii) The normal energy of electrons after absorption of photons is just equal tothe potential energy barrier at the surface [paragraph after (25) of his paper].
Usually the environment in which the photoelectric emission is of interest is at atemperature of 300 K, which corresponds to a thermal energy of electrons of theorder of 0.04 eV, which is negligible as compared to the work function of themetal (which is the minimum value of ht of interest). Hence in general the ratio of
2.2 Basic Concepts of Electron Emission 29
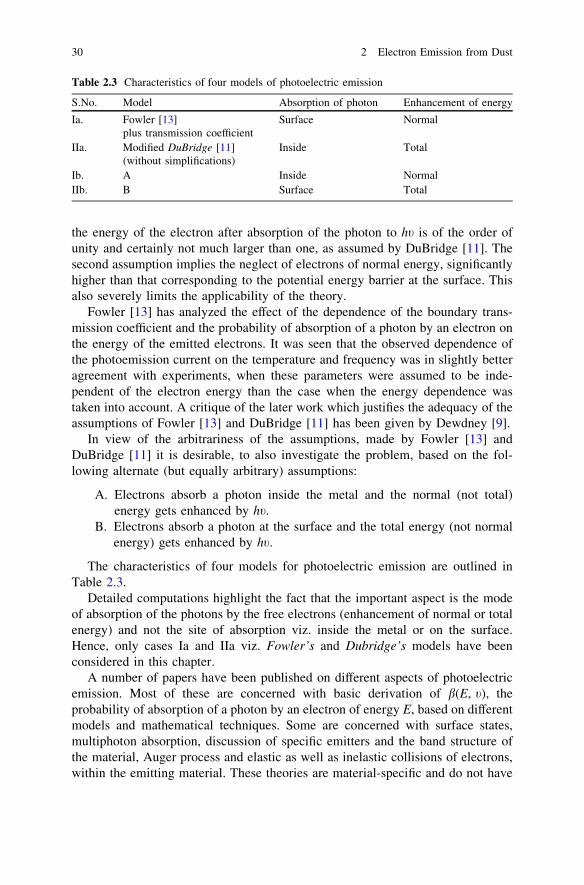
the energy of the electron after absorption of the photon to ht is of the order ofunity and certainly not much larger than one, as assumed by DuBridge [11]. Thesecond assumption implies the neglect of electrons of normal energy, significantlyhigher than that corresponding to the potential energy barrier at the surface. Thisalso severely limits the applicability of the theory.
Fowler [13] has analyzed the effect of the dependence of the boundary trans-mission coefficient and the probability of absorption of a photon by an electron onthe energy of the emitted electrons. It was seen that the observed dependence ofthe photoemission current on the temperature and frequency was in slightly betteragreement with experiments, when these parameters were assumed to be inde-pendent of the electron energy than the case when the energy dependence wastaken into account. A critique of the later work which justifies the adequacy of theassumptions of Fowler [13] and DuBridge [11] has been given by Dewdney [9].
In view of the arbitrariness of the assumptions, made by Fowler [13] andDuBridge [11] it is desirable, to also investigate the problem, based on the fol-lowing alternate (but equally arbitrary) assumptions:
A. Electrons absorb a photon inside the metal and the normal (not total)energy gets enhanced by ht.
B. Electrons absorb a photon at the surface and the total energy (not normalenergy) gets enhanced by ht.
The characteristics of four models for photoelectric emission are outlined inTable 2.3.
Detailed computations highlight the fact that the important aspect is the modeof absorption of the photons by the free electrons (enhancement of normal or totalenergy) and not the site of absorption viz. inside the metal or on the surface.Hence, only cases Ia and IIa viz. Fowler’s and Dubridge’s models have beenconsidered in this chapter.
A number of papers have been published on different aspects of photoelectricemission. Most of these are concerned with basic derivation of b(E, t), theprobability of absorption of a photon by an electron of energy E, based on differentmodels and mathematical techniques. Some are concerned with surface states,multiphoton absorption, discussion of specific emitters and the band structure ofthe material, Auger process and elastic as well as inelastic collisions of electrons,within the emitting material. These theories are material-specific and do not have
Table 2.3 Characteristics of four models of photoelectric emission
S.No. Model Absorption of photon Enhancement of energy
Ia. Fowler [13]plus transmission coefficient
Surface Normal
IIa. Modified DuBridge [11](without simplifications)
Inside Total
Ib. A Inside NormalIIb. B Surface Total
30 2 Electron Emission from Dust

the general applicability of the models in Table 2.3. Moreover, Fowler [13] pre-sented results in a user friendly mode; these have been used frequently by theinvestigators. Most of these investigations assumed that the probability of emissionof an electron having a normal energy greater than the surface potential energybarrier is unity; this assumption is valid from classical considerations but isuntenable in wave mechanics.
2.3 Fowler’s Theory (Case: Ia) (After Fowler et al. [13])
2.3.1 Uncharged Surface
In view of Fowler’s assumption (ii), the electrons, hitting the surface per unit timeper unit area d2n1 have a probability b(m)K(m) of absorbing a photon of frequencym, where K(m) is the number of incident photons per unit area per unit time and b(m) isindicative of the efficiency of the absorption of photons by electrons, incident on thesurface; the energy of the absorbed photon enhances the normal energy of theelectrons. Hence, using (2.9) the number of photoelectrons (electrons, which haveabsorbed a photon), hitting the surface per unit area per unit time is
d2nph ¼ ðA0=eÞT2bðmÞKðmÞFDðex þ et � eFÞdexdet:
Putting e0x ¼ ex þ em (where em ¼ ht=kBT where e0x is the normal energy of anelectron with energy ex after absorption of a photon) in the above equation oneobtains
d2nph ¼ðA0=eÞT2bðmÞKðmÞFDðe0x þ et � ev � eFÞde0xdet:
¼ðA0=eÞT2bðmÞKðmÞFDðe00x þ et þ wa � ev � eFÞde00x det;ð2:39Þ
where e00x ¼ e0x � wa is the energy of a photoelectron after crossing the surfaceenergy barrier wa.
Integrating d2nph over 0\et\1 one obtains
dnph ¼ ðA0=eÞT2bðmÞKðmÞ ln½1þ expðev þ eF � e0xÞ�de0x: ð2:40Þ
Hence the number of photoelectrons emitted due to the photoelectric effect isgiven by
nph ¼ ð�Jph=eÞ ¼ ðA0=eÞT2bðmÞKðmÞZ1
wa
Dðe0xÞ ln½1þ expðev þ eF � e0xÞ�de0x;
¼ ðA0=eÞT2bðmÞKðmÞZ1
0
Dðe00x þ waÞ ln½1þ expðn� e00x Þ�de00x ;
ð2:41aÞ
2.2 Basic Concepts of Electron Emission 31

where e00x ¼ e0x � wa is the energy of a photoelectron after emission,
n ¼ em � ½wa � eF� ¼ em � u ¼ ðhm� UÞ=kBT
and U = Wa - EF is the work function of the material.Putting Dðe00x þ waÞ ¼ 1 as is usually the practice and expðn� e00x Þ ¼ f one
obtains the current density due to photoelectron emission
Jph ¼ �enph ¼ �A0T2bðmÞKðmÞU0ðnÞ; ð2:41bÞ
where
U0ðnÞ ¼Zexp n
0
ln½1þ f�f
df: ð2:41cÞ
As discussed earlier, in general Dðe0xÞ is not unity but given by (2.17) for anelectrically neutral surface.
However in case Dðe00x þ waÞ ¼ 1, as is usually assumed the mean energy of theemitted photoelectrons, just outside the surface is
he00i ¼Z1
0
Z1
0
ðe00xþetÞd2nph
,Z1
0
Z1
0
d2nph
¼Z1
0
Z1
0
ðe00xþetÞFDðe00x þ et � nÞde00x det
,Z1
0
Z1
0
FDðe00x þ et � nÞde00x det:
Using identity (2.37) the above equation reduces to
he00i ¼Z1
0
e002FDðe00 � nÞde
,Z1
0
e00FDðe00 � nÞde00
¼ 1U0ðnÞ
Z1
0
2e00 ln½1þ expðn� e00Þ�de00:
ð2:42aÞ
It is useful to define photoelectric efficiency v(m) as the number of photoelec-trons emitted per incident photon. Thus
vðvÞ ¼ nph=KðvÞ:
The best fit of experimental data for dependence of v(m) on m is as followsv(m)/vm = (729/16)(m0/m)4(1 - m0/m)2 (Spitzer [64]; Sodha et al. [49] and
v(m)/vm = (1 - m0/m)2 [7] where m0 is threshold frequency and vm is the maximumvalue of v.
It is seen that for n[ 5, he0 0i & 0.472 ? 0.657n to an excellent approximation.
32 2 Electron Emission from Dust

2.3.1.1 Negatively Charged Surface (t0 > 0)
Equations (2.41a), (2.41b) and (2.42a, 2.42b) for the current density and meanenergy of electrons are valid for a negatively charged surface when wa is replacedby wa - af1/2 and appropriate data for Dðe0xÞ is used. Further the mean energyaway from the surface is e00faraway ¼ he00i þ t0:
2.3.2 Positively Charged Surface (t0 < 0)
As in the case of thermionic emission the expressions for Jph and he00i (far awayfrom the surface) is obtained by putting wa � t0 for wa. Thus
Jph ¼ Jph ¼ �enph ¼ �A0T2bðmÞKðmÞU0ðnþ t0Þ ð2:41dÞ
and
he00ifar away ¼1
U0ðnþ t0Þ
Z1
0
2e00 ln½1þ expðnþ t0�e00Þ�de00 ð2:42bÞ
2.3.3 Light Induced Field Emission
For a negatively charged surface, the current density Jfp (in analogy with (2.41a))on account of tunneling of low energy photoelectrons ðe0x\wa � af 1=2Þ is given by
Jfp ¼ �enlife ¼ �A0T2bðmÞKðmÞZwa�af 1=2
0
Dðe0xÞ ln½1þ expðet þ eF � e0xÞ�de0x
for t0 [ wa
ð2:43aÞ
and
Jfp ¼ �enlife ¼ �A20T2bðmÞKðmÞ
Zwa�af 1=2
wa�af 1=2�t0
Dðe0xÞ ln½1þ expðet þ eF � e0xÞ�de0x
for t0\wa
ð2:43bÞ
2.3 Fowler’s Theory (Case: Ia) 33
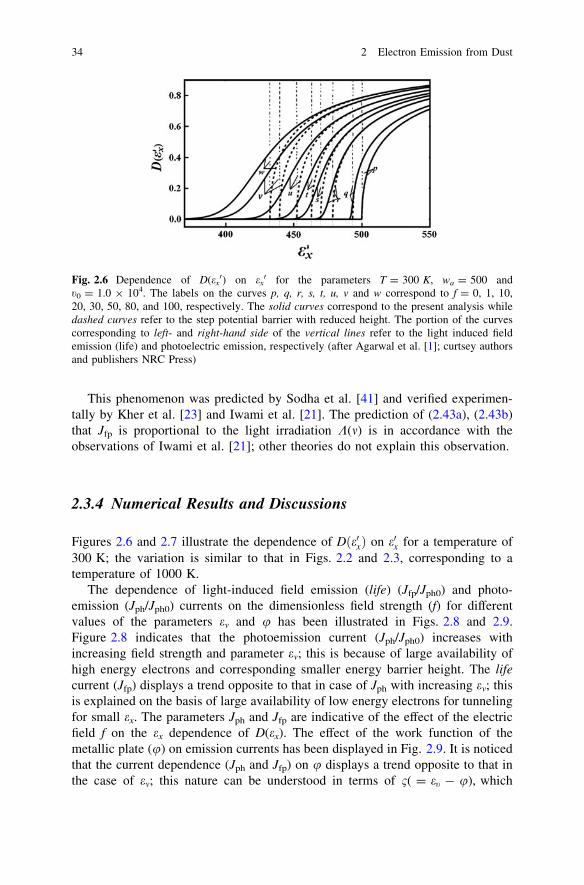
This phenomenon was predicted by Sodha et al. [41] and verified experimen-tally by Kher et al. [23] and Iwami et al. [21]. The prediction of (2.43a), (2.43b)that Jfp is proportional to the light irradiation K(m) is in accordance with theobservations of Iwami et al. [21]; other theories do not explain this observation.
2.3.4 Numerical Results and Discussions
Figures 2.6 and 2.7 illustrate the dependence of Dðe0xÞ on e0x for a temperature of300 K; the variation is similar to that in Figs. 2.2 and 2.3, corresponding to atemperature of 1000 K.
The dependence of light-induced field emission (life) (Jfp/Jph0) and photo-emission (Jph/Jph0) currents on the dimensionless field strength (f) for differentvalues of the parameters em and u has been illustrated in Figs. 2.8 and 2.9.Figure 2.8 indicates that the photoemission current (Jph/Jph0) increases withincreasing field strength and parameter em; this is because of large availability ofhigh energy electrons and corresponding smaller energy barrier height. The lifecurrent (Jfp) displays a trend opposite to that in case of Jph with increasing em; thisis explained on the basis of large availability of low energy electrons for tunnelingfor small ex. The parameters Jph and Jfp are indicative of the effect of the electricfield f on the ex dependence of D(ex). The effect of the work function of themetallic plate (u) on emission currents has been displayed in Fig. 2.9. It is noticedthat the current dependence (Jph and Jfp) on u displays a trend opposite to that inthe case of em; this nature can be understood in terms of 1( = et - u), which
Fig. 2.6 Dependence of D(ex0) on ex
0 for the parameters T = 300 K, wa = 500 andt0 = 1.0 9 104. The labels on the curves p, q, r, s, t, u, v and w correspond to f = 0, 1, 10,20, 30, 50, 80, and 100, respectively. The solid curves correspond to the present analysis whiledashed curves refer to the step potential barrier with reduced height. The portion of the curvescorresponding to left- and right-hand side of the vertical lines refer to the light induced fieldemission (life) and photoelectric emission, respectively (after Agarwal et al. [1]; curtsey authorsand publishers NRC Press)
34 2 Electron Emission from Dust

increases with increasing em and decreasing u. The figures also display the fact thatlife current significantly contributes to the total emission current (Jt = Jph ? Jfp)for large f; it is also interesting to point out that the total current enhances by afactor of about 1.5 from its initial value (at f = 0) for the chosen set of parameters.
Fig. 2.7 Dependence of D(ex0) on ex
0 for the parameters T = 300 K, f = 10 and t0 = 1.0 9 104.Curves p, q, r, s and t correspond to wa = 300, 400, 500, 600, and 700, respectively. The natureof the curves (solid, dashed and vertical lines) is the same as in Fig. 2.6 (after Agarwal et al. [1];curtsey authors and publishers NRC Press)
Fig. 2.8 Dependence of (Jph/Jph0), (Jfp/Jph0) and (Jt/Jph0)on dimensionless electric field (f) forthe parameters T = 300 K wa = 500 and 120 and t0 = 1.0 9 104. Dashed, short dashed andsolid curves correspond to u = 200, The labels on the curves p, q, r and s correspondtoet = 250, 300, 350, and 400, respectively. Dashed (left-hand scale), short dashed (right-handscale) and solid curves (right hand scale) correspond to the life (Jfp/Jph0), photo (Jph/Jph0) andtotal (Jt/Jph0) emission current density, respectively (after Agarwal et al. [1]; curtsey authors andpublishers NRC Press)
2.3 Fowler’s Theory (Case: Ia) 35

2.4 Modified Dubridge Theory: Case IIa and other effects
According to this theory, the total (not normal) energy of an electron getsenhanced by hm on absorption of a photon of frequency m. Hence if p and p0 denotethe momentum of an electron before and after the absorption of a photon and E0 isthe energy of the electron after absorption of the photon [11].
E0 ¼ ðp02=2mÞ ¼ hmþ ðp2=2mÞ: ð2:44Þ
Hence from (2.8b) and (2.44) the momentum distribution of electrons afterabsorption of a photon is
nðp0Þdp0 ¼ ð2=h3ÞbðmÞKðmÞFDðe0 � et � eFÞ4p½1� ðet=e0Þ�1=2p02dp0;
which is equivalent to
nðp0Þdp0xdp0ydp0z ¼ ð2=h3ÞbðmÞKðmÞFDðe0 � et � eFÞ½1� ðet=e0Þ�1=2dp0xdp0ydp0z;
where e0 = E0/kBT.
Fig. 2.9 Dependence of (Jph/Jph0), (Jfp/Jph0) and (Jt/Jph0) on dimensionless electric field (f) forthe parameters T = 300 K wa = 500 and 120 and t0 = 1.0 9 104. Dashed, short dashed andsolid curves correspond to et = 300, The labels on the curves p, q, r and s correspond tou = 100, 150, 200 and 250 respectively. Dashed (left hand scale), short dashed (right handscale) and solid curves (right hand scale) correspond to the life (Jfp/Jph0), photo (Jph/Jph0) andtotal (Jt/Jph0) emission current density respectively (after Agarwal et al. [1]; curtsey authors andpublishers NRC Press)
36 2 Electron Emission from Dust

Out of the electrons having e0[ wa; the fraction having e0x [ wa is
½1� ðwa=e0Þ�1=2=2:1 Hence, the number of electrons emitted per unit area per unittime is
nph ¼Z1
ffiffiffiffiffiffiffiffiffi2mWap
Z1
�1
Z1
�1
�Dðe0xÞ½1� ðwa=e0Þ�1=2ðp0x=mÞnðp0Þdp0xdp0ydp0z:
As in the case of Fowler’s theory, the above integral may be simplified as
nph ¼ ð�Jph=eÞ
¼ ðA0=2eÞT2bðmÞKðmÞ �Z1
0
Z1
0
D e00x þ wa
� �f1� ½wa=ðe00x þ e00t þ waÞ�1=2g
f1� ½ev=ðe00x þ e00t þ waÞ�g1=2FDðe00x þ e00t � nÞde00x de00x ;
As an approximation Dðe00x þ waÞ can be replaced by an average value�Dðe00 þ waÞ;
where e00 ¼ e00x þ e00t and �Dðe00 þ waÞ ¼ 1e00Re00
0Dðe00x þ waÞde00x :
Thus using the identityR1
0
R10 f x1 þ x2ð Þdx1dx2 ¼ x
R10 xf xð Þ
One obtains
nph ¼ ð�Jph=eÞ ¼ ðA0=2eÞT2bðmÞKðmÞ �Z1
0
�Dðe00 þ waÞf1� ½wa=ðe00 þ waÞ�1=2g
� f1� ½et=ðe00 þ waÞ�g1=2f1þ expðe00 � nÞg�1ede
ð2:45Þ
The energy distribution of emitted photoelectrons, based on this theory is in alittle better agreement with experiments than that corresponding to Fowler’stheory. In view of the mathematically untreatable expressions occurring in Du-bridge’s theory, it has not been used to an appreciable extent in the study of thekinetics of complex plasmas. Hence, no further discussions of this theory has beenmade later in this book.
1 The possible values of ux, uy, uz corresponding to an electron speed u are the coordinates on thesurface of a sphere of radius u. The area of the surface corresponding to ux [ uc is 2p(u - uc)u,while the area of the whole spherical surface is 4 pu2. Hence the fraction of electrons with speedu having ux [ uc is simply
½2puðu� ucÞ=4pu2� ¼ 1=2ð1� uc=uÞ ¼ 1=2½1� ðwa=e0Þ1=2�;
where wa ¼ meu2c=2
� �and e0 ¼ meu2=2ð Þ.
2.4 Modified Dubridge Theory: Case IIa and other effects 37
2.5 Spicer’s Three Step Model
No discussion of the photoelectric effect is complete, without a reference to thewidely cited three step model, advanced by Spicer [52] and formalized byBergland and Spicer [2]; a simple account of the model has been given by Spicerand Herrara-Gomez [53]. According to this model, photoemission of electrons is abulk (rather than a surface) process and consists of three steps, viz
(i) Generation of photoelectrons, (deep in material) having enough energy toovercome the surface barrier.
(ii) Transport of these photoelectrons to the surface, taking into account thescattering of the electrons and
(iii) Transmission through the surface.
Consider the normal incidence of light of frequency m and irradiance I0(m)incident normally on the surface of a material with reflectivity R(m). The irradianceI(m) at the depth x in the material is given by
IðmÞ ¼ I0ðmÞ½1� RðmÞ� exp½�aðmÞx�; ð2:46Þ
where a(m) is the attenuation constant of light in the material and R(v) is thereflection coefficient at the surface.
The number of photoelectrons with enough energy to escape from the surface,which is generated from photoexcitation per unit volume per unit time, is pro-portional to the irradiance. Hence, the number dnexc of such photoelectrons gen-erated per unit area in a thickness dx of the material is given by
dnexc ¼ aexc � I � dx; ð2:47Þ
where aexc is a coefficient indicative of the efficiency of photoexcitationThe probability of traversing a distance x without significant loss of energy is
given by
PTðxÞ ¼ expð�x=LÞ: ð2:48Þ
where L is the mean free path of the electrons.Hence, the number of photoelectrons emitted per unit area per unit time from
the surface is
nph ¼Z1
0
PðmÞemPTðxÞdnexc;
where Pem(m) is the probability of transmission through the surface barrier.
Substituting for I(m), dnexc and PT(x) from (2.46), (2.47) and (2.48) in the aboveequation and integrating the R.H.S. one obtains
38 2 Electron Emission from Dust

nph ¼ I0ðmÞ½1� RðmÞ�aaexcfaexc þ 1=Lg�1: ð2:49Þ
The predictions for Spicer’s model agree with experiments; however the inputsviz. absorption of the radiation in the solid, electron scattering/transport data andband structure are not available for many photoelectric surfaces. Further thecomputation, necessary for the application of Spicer’s model is formidable. Hencephenomenological models, in good agreement with experiments are still relevant.In fact Fowler’s expression for the photoelectric emission is still in vogue forinterpretation of photoelectric data and models for physical processes, wherephotoelectric emission is important.
2.6 Size Effect
Watson [57, 58] adopted a simple model and predicted that the photoelectricefficiency v of the surface of a particle of radius a is given by
ðv=vbÞ ¼bw
aw
� �2 a2w � 2aw þ 2� 2 expð�2awÞ
b2w � 2bw þ 2� 2 expð�2bwÞ
ð2:50Þ
where aw ¼ aaþ a=L; bw ¼ aa.
2.7 Secondary Electron Emission
2.7.1 Secondary Electron Emission by Electron Impact
When a high energy primary electron is incident on the surface of a material, itmay either be reflected or enter the material. Once it is in the material, it maycollide with scattering centers and ultimately get out of the material; this process isknown as back scattering. However, some of the energy of the electron may beutilized in the excitation of electrons, which may escape from the material; thisprocess is known as secondary electron emission.
The reflection coefficient is of the order of 0.05 at low energies of primaryelectrons and it rapidly decreases with increasing energy of primary electrons [19].Both reflection and back scattering are not of importance in the kinetics of com-plex plasmas and therefore not considered hereinafter.
In what follows a phenomenological theory of secondary electron emissionfrom (i) plane surface of a semi infinite solid and (ii) spherical grain has beenpresented. The case of a cylindrical surface has been discussed in Appendix B ofthis chapter.
2.7 Secondary Electron Emission 39

2.7.1.1 Plane Surface of Semi-infinite Solid (After Jonker [20])
Jonker [20] has given a theory of secondary electron emission from the planesurface of a semi-infinite solid on account of the incidence of primary high energyelectrons. The following four assumptions made by him constitute the basis of histheory as well as subsequent theories, including this presentation: (i) The primaryelectrons loose energy according to Whiddington’s [59] law and that the absorp-tion and scattering of electrons is negligible, (ii) The number of secondary elec-trons generated by a primary electron is proportional to the rate of energy loss inthe solid, (iii) The absorption of secondary electrons in the material follows theexponential law and (iv) The distribution of generated secondary electrons isisotropic. Further for the sake of simplicity, it has also been implicitly assumedthat Vp, the energy of the incident electron is much larger than the surface energybarrier.
The energy V(x) in eV of a primary electron in a solid is given by [59]
V2ðxÞ ¼ V2p � ax ð2:51Þ
where
Vp is the electron energy at x = 0,x is the distance traversed in cm anda is a constant dependent on the material.
The rate of secondary electron production ns is proportional to the energy lossper unit length; thus the rate of secondary electron production in a distance dx is asper Bruining [3]
nsdx ¼ �KIpdVðxÞ
dxdx ¼ ðKaIp=2ÞðV2
p � axÞ�1=2dx; ð2:52Þ
where Ip is the primary beam current, i.e., number of primary electrons, incident onthe surface per unit time and K is a material specific constant.
Consider the normal (along x direction) incidence of a beam of primary (highenergy) electrons on the plane surface (x = 0) of a semi-infinite solid substance.The secondary electrons, generated at x (the distance from the surface) and movingin a direction making an angle between h and h ? dh with the axis (correspondingto a solid angle 2psinhdh), traverse a distance xsech, before hitting the surface andgetting emitted. Hence the number of such secondary electrons getting emittedfrom the surface is from 2.51 and 2.52 given by
dis ¼ ðKaIp=2ÞðV2p � axÞ�1=2dx
Zp=2
0
2psinhdh4p
expð�bxsechÞdh; ð2:53Þ
40 2 Electron Emission from Dust

where b is the attenuation constant for secondary electrons and (2psinhdh/4p) isthe fraction of electrons emitted, making an angle between h and h ? dh with thenormal.
Integrating the above equation in the limit x = 0 to x ¼ xm ¼ V2p=a (corre-
sponding to V(x) = 0) one obtains.
Is ¼ ðKaIp=4ÞZxmax
0
ðV2p � axÞ�1=2dx
Zp=2
0
expð�bxsechÞsinhdh: ð2:54aÞ
where xm ¼ V2p=a is the depth of penetration of the primary electron in the material
and corresponds to V(xm) = 0.It is common to express the results in terms of secondary yield d(Vp), defined as
dðVpÞ ¼ Is=Ip: ð2:54bÞ
In case of oblique incidence at an angle k to the normal, the distance of thepoint x from the surface is xcosk and hence
Is ¼ ðKaIp=4ÞZxmax
0
ðV2p � axÞ�1=2dx
Zp=2
0
expð�b0xÞsinhdh; ð2:54cÞ
where b0 ¼ bcosk:
If I0pðVpÞdVp is the energy distribution of the primary beam the secondary
current is is
is ¼Z
dðVpÞI0
pðVpÞdVp ð2:54dÞ
The various approaches to the evaluation of secondary electron emissionessentially differ in the expressions for the rate of energy loss by primary electrons.A popular empirical expression for d(Vp), number of secondary electrons emittedby the incidence of primary electrons of energy Vp is Sternglass [55], Jonker [20],Meyer-Vernet [26] is
dðVpÞ ¼ 7:4dmðVp=VmÞ exp½�2ðVp=VmÞ1=2�; ð2:55Þ
where the maximum value of d = dm occurs for Vp = Vm.Representative values [60] of dm and Vm are given in Table 2.4.The energy distribution of secondary electrons is approximately Maxwellian
with a characteristic energy of 2 eV (Hachenberg and Brauer [18].The electron emission on account of electron beams has been discussed in
literature.
2.7 Secondary Electron Emission 41

2.7.2 Spherical Particle (After Misra et al. [31])
On the basis of rather simple analysis Draine and Salpeter [65] have emphasizedthe importance of secondary electron emission in the charging of small grains(&10 nm or less in radius) when the penetration depth xm of the primary electronsexceeds the diameter of the grains. In view of the existence of such small particlesin the interstellar medium (Puget and Leger [66]) and space, e.g., Hailey’s cometenvironment (Sagdeev et al. [67]), this phenomenon is of much interest in thecharging of dust. A theory of the secondary electron emission and charging of adust particle, exposed to high energy electrons (from the plasma or elsewhere)should also be of interest to situations other than those in space environment.
Meyer-Vernet [26] developed an elaborate theory for the charging of a dustparticle in space, taking into account the phenomenon of secondary electronemission; however this theory was based on the widely used empirical relation bySternglass [55]. However the validity of the results is severely limited by the factthat this relation is applicable only for the plane surface of the semi-infinite solidand hence completely ignores the effect of the size and shape of the particle.
Chow et al. [5] modified the theory by Jonker [20] to make it applicable tospherical particles and applied it to investigate the charging of the particles inMaxwellian and Lorentzian plasmas. The theory distinguishes between the caseswhen the diameter of the particle is larger or smaller than the penetration depth ofthe electrons. However the relevance of the theory is limited because it overlooksthe following points: (i) The length of an electron path (AB) in the sphericalparticle depends on the perpendicular distance (q) from the center of the particle;hence it varies from zero to the diameter or xm depending upon q (see Fig. 2.10),(ii) As a corollary to (i), when the diameter exceeds the penetration depth xm thereis an optimum perpendicular distance qm from the center (corresponding to thepath length equal to the penetration depth xm) such that electrons corresponding toq C qm will pass through the particle while the electrons, corresponding to q\ qm
will get stuck in the particle and (iii) The electrons, stuck in the particle andprimary electrons sticking to the surface contribute to the charging of the particles.
Here we have modified the theory of Chow et al by incorporating the points,enumerated above. Specifically the parameter d (the number of secondary elec-trons, emitted by the particle per primary electron) has been evaluated as afunction of primary electron energy, radius, and electric potential of the particle.The parameter d for Maxwellian distribution of the primary electron energy hasalso been evaluated.
Table 2.4 Values of dm and Vm
Material Sio2 MgO Teflon Kapton Al2O3 Mg Al
dm 2.4 4.0 3.0 2.1 1.5–1.9 0.92 0.97Vm (keV) 0.4 0.4 0.3 0.15 0.35–1.3 0.25 0.3
42 2 Electron Emission from Dust
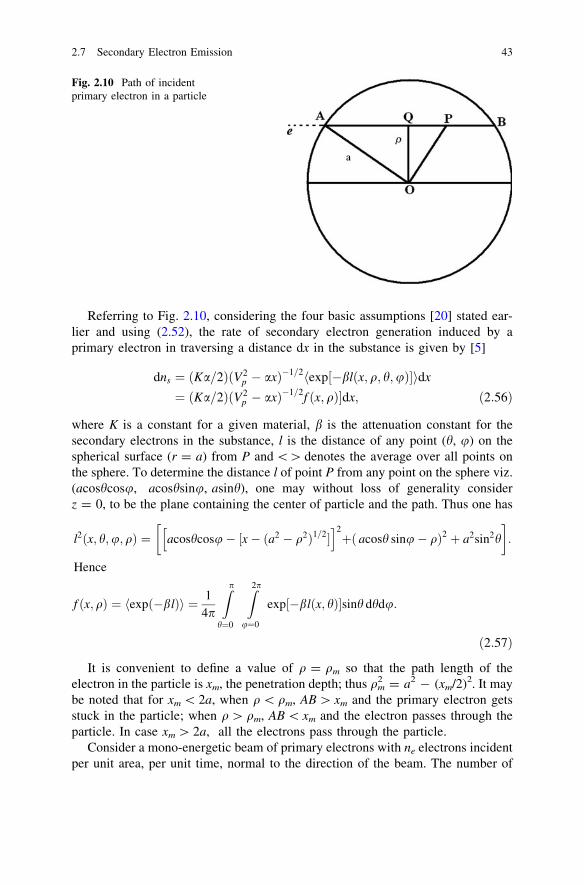
Referring to Fig. 2.10, considering the four basic assumptions [20] stated ear-lier and using (2.52), the rate of secondary electron generation induced by aprimary electron in traversing a distance dx in the substance is given by [5]
dns ¼ ðKa=2ÞðV2p � axÞ�1=2
exp½�blðx; q; h;uÞ�h idx
¼ ðKa=2ÞðV2p � axÞ�1=2f ðx; qÞ�dx; ð2:56Þ
where K is a constant for a given material, b is the attenuation constant for thesecondary electrons in the substance, l is the distance of any point (h, u) on thespherical surface (r = a) from P and \[ denotes the average over all points onthe sphere. To determine the distance l of point P from any point on the sphere viz.(acoshcosu, acoshsinu, asinh), one may without loss of generality considerz = 0, to be the plane containing the center of particle and the path. Thus one has
l2ðx; h;u;qÞ ¼ acoshcosu� ½x� ða2 � q2Þ1=2�h i2
þð acosh sinu� qÞ2 þ a2sin2h
� :
Hence
f ðx;qÞ ¼ expð�blÞh i ¼ 14p
Zp
h¼0
Z2p
u¼0
exp½�blðx; hÞ�sinh dhdu:
ð2:57Þ
It is convenient to define a value of q = qm so that the path length of theelectron in the particle is xm, the penetration depth; thus qm
2 = a2 - (xm/2)2. It maybe noted that for xm \ 2a, when q\ qm, AB [ xm and the primary electron getsstuck in the particle; when q[ qm, AB \ xm and the electron passes through theparticle. In case xm [ 2a, all the electrons pass through the particle.
Consider a mono-energetic beam of primary electrons with ne electrons incidentper unit area, per unit time, normal to the direction of the beam. The number of
Fig. 2.10 Path of incidentprimary electron in a particle
2.7 Secondary Electron Emission 43

primary electrons incident per unit cross section of the dust surface normal to thebeam, per unit time np is given by (Abbas et al. [68])
np ¼ ne½1� ðVs=VpÞ� ð2:58Þ
where Vs is the potential energy of the electron at the surface of the particle andVs \\ Vp.
Hence, the number of secondary electrons produced per unit time is
ns ¼ ð1� gsÞKa2
� � Zqm
0
2pnpI1ðVp; qÞqdqþZa
qm
2pnpI2ðVp; qÞqdq
3
75
2
64 for xm\2a
ð2:59aÞ
and
ns ¼ ð1� gsÞKa2
� �Za
0
2pnpI2ðVp; qÞqdq for xm� 2a ð2:59bÞ
where
I1ðVp; qÞ ¼Zxm
0
ðV2p � axÞ�1=2f ðx; qÞdx
0
@
1
A;
I2ðVp; qÞ ¼Z2ffiffiffiffiffiffiffiffiffiffia2�q2p
0
ðV2p � axÞ�1=2f ðx; qÞdx
0
BB@
1
CCA
and gs is the electron sticking (at the surface) coefficient.The secondary electron emission yield d can be expressed as: d ¼ ns=pa2np
� �.
In the dimensionless form d viz. d0 ¼ d=ð1� gsÞK
ffiffiffiffiffiaap
can be expressed as afunction of b
0= ba, and x0m ¼ xm=að Þ; to do so one has to use r ¼ ar0
For a charged particle, the yield d(Vs) is given by6
d0ðVsÞ ¼ d0ðVs ¼ 0Þ for Vs� 0 ð2:60aÞ
d0ðVsÞ ¼ jd0ðVs ¼ 0Þ for Vs\0 ð2:60bÞ
where j ¼ 1� Vs=kTsð Þ exp Vs=kBTsð Þ and Ts is the temperature of secondaryelectrons.
The dependence of d0 on x0m has been illustrated for different values of b0
inFig. 2.11. It is seen that the yield d0m
� �takes a maximum value for an optimum
value of x0m and it decreases with increasing b0
(i.e., particle size).When diameter of the particle exceeds the penetration distance, the number of
primary electrons which gets stuck in the dust particle is given by
44 2 Electron Emission from Dust
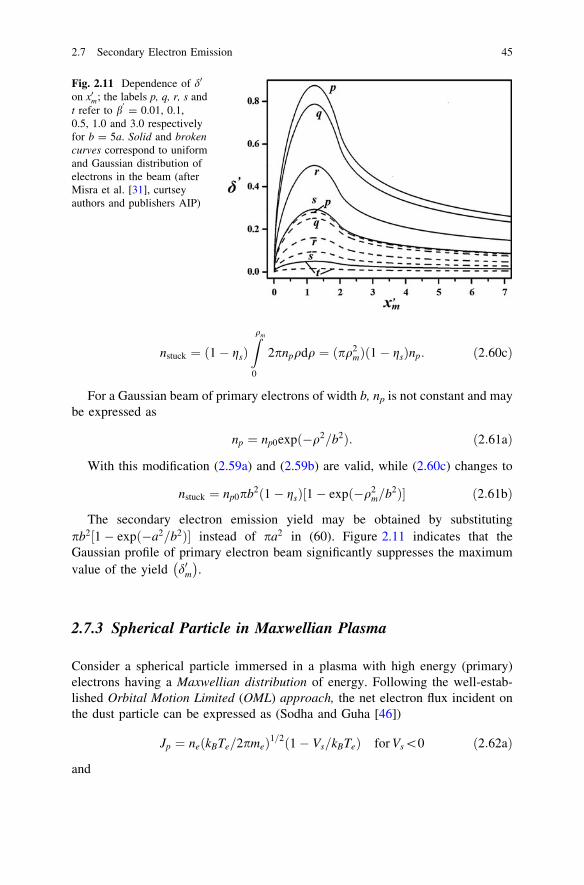
nstuck ¼ ð1� gsÞZqm
0
2pnpqdq ¼ ðpq2mÞð1� gsÞnp: ð2:60cÞ
For a Gaussian beam of primary electrons of width b, np is not constant and maybe expressed as
np ¼ np0expð�q2=b2Þ: ð2:61aÞ
With this modification (2.59a) and (2.59b) are valid, while (2.60c) changes to
nstuck ¼ np0pb2ð1� gsÞ½1� expð�q2m=b2Þ� ð2:61bÞ
The secondary electron emission yield may be obtained by substitutingpb2 1� exp �a2=b2ð Þ½ � instead of pa2 in (60). Figure 2.11 indicates that theGaussian profile of primary electron beam significantly suppresses the maximumvalue of the yield d0m
� �.
2.7.3 Spherical Particle in Maxwellian Plasma
Consider a spherical particle immersed in a plasma with high energy (primary)electrons having a Maxwellian distribution of energy. Following the well-estab-lished Orbital Motion Limited (OML) approach, the net electron flux incident onthe dust particle can be expressed as (Sodha and Guha [46])
Jp ¼ neðkBTe=2pmeÞ1=2ð1� Vs=kBTeÞ for Vs\0 ð2:62aÞ
and
Fig. 2.11 Dependence of d0
on x0m; the labels p, q, r, s andt refer to b
0= 0.01, 0.1,
0.5, 1.0 and 3.0 respectivelyfor b = 5a. Solid and brokencurves correspond to uniformand Gaussian distribution ofelectrons in the beam (afterMisra et al. [31], curtseyauthors and publishers AIP)
2.7 Secondary Electron Emission 45

Jp ¼ neðkBTe=2pmeÞ1=2expð�Vs=kBTeÞ for Vs� 0 ð2:62bÞ
Following the approach similar to the earlier analyses [5, 26], the net electronflux associated with secondary electron emission is given by
Js ¼ neð2p=m2eÞð2pkBTe=meÞ�3=2j
Z1
0
1sðVpÞðVp � VsÞexp½�Vp=kBTe�dVp
for Vs\0
ð2:63aÞ
and
Js ¼ neð2p=m2eÞð2pkBTe=meÞ�3=2
Z1
Vs
1sðVpÞðVp � VsÞexp½�Vp=kBTe�dVp;
for Vs� 0;
ð2:63bÞ
where
1s ¼ ð1� gsÞðKa=2ÞZqm
0
2pI1ðVp; qÞqdqþZa
qm
2pI2ðVp; qÞqdq
3
75
2
64 for xm\2a;
ð2:64aÞ
1s ¼ ð1� gsÞðKa=2ÞZa
0
2pI2ðVp; qÞqdq for xm� 2a; ð2:64bÞ
and
j ¼ 1� ðVs=kBTeÞ:
The secondary emission yield can be expressed as: d = (Js/Jp).The effect of particle size and electron temperature on secondary emission yield
(d) for a particle in a Maxwellian plasma has been illustrated in Fig. 2.3a, b, for astandard set of parameters, viz. a = 50 nm, kBTs = 3 eV, kBTe = 50 eV, a =
1012(eV)2/cm, b = 105/cm, K = 0.01/eV and ls = 0.1. The figures indicate thatd linearly increases with increasing negative potential on the surface while itsharply decays with increasing positive potential. Increasing the size of the particlesignificantly reduces the generation of secondaries because of decreasing functionf(x, q), which leads to decrease in the secondary emission yield (d); this nature hasbeen displayed in Fig. 2.12. Further, the increase in the temperature of primaryelectrons (kBTe) enhances xm and the accretion over dust surface, resulting in theincreasing secondary yield (this behavior has been illustrated in Fig. 2.12).
(iii) Cylindrical Particles (see Appendix B).
46 2 Electron Emission from Dust

2.8 Electron Emission from Charged Sphericaland Cylindrical Surfaces of Metals
2.8.1 What is Different About Electron Emissionfrom Curved Surfaces?
Consider an electron just outside the surface (after overcoming the surface barrier)of a metal, charged to a potential -(V0/e).
The conditions for the electron to overcome the surface potential and thus getemitted are
Fig. 2.12 Dependence of don (Vs/kTs) for differentvalues of a radius (a, in nm)of the particle and b meantemperature (kTe, in eV) ofthe incident primary electronsfor standard set of parametersin the text; the magnitude ofvarying parameter (kTe) hasbeen indicated on the curves(after Misra et al. [31],curtsey authors andpublishers AIP)
2.7 Secondary Electron Emission 47

I. Negatively Charged surface (positive electron potential energy V0 afteremission of an electron): All such electrons will escape (or get emitted).Hence, the expressions for thermionic and photoelectric emission currentand the mean energy, just outside the surface are identical to the case ofuncharged plane surface.
II. Positively Charged surface (negative electron potential energy -V0 afteremission of an electron just outside the surface):
1. Plane surface:
Exð¼ meu2x=2Þ[ V0; ð2:65aÞ
2. Spherical surface:
Eð¼ meu2=2Þ[ V0; ð2:65bÞ
3. Cylindrical surface:
½Exð¼ meu2x=2Þ þ Eyð¼ meu2
y=2Þ�[ V0; ð2:65cÞ
where u is the velocity of the electron just outside the metal, x is the direction,normal to a surface element and z is the direction along the axis (in case 3 only).
Further since the expressions for the potential energy of an electron outside ametal, taking into account the image force are dependent on the nature of thesurface, the reduction in the work function on account of a negative electricpotential on the surface also depends on its nature. The expressions for thetransmission coefficient also depend on the variation of electron potential energywith distance, which is determined by the shape of the surfaces.
2.8.2 Reduction of Work Function by Negative ElectricPotential on a Spherical Surface
The potential energy V(r) of an electron near the surface of a metallic sphericalparticle of radius a is given by [50]
VðrÞ ¼ ð�e2=aÞ½2ðr2 � a2Þ þ e2a=Wa��1 þ ðe2a=2r2Þ þ ðZe2=rÞ for r [ a;
ð2:66aÞ
and
VðrÞ ¼ �½Wa � e2=2a� þ ðZe2=aÞ for r\a; ð2:66bÞ
where a is the radius of the particle, and -Ze is the charge on the particle.When e2a/Wa is negligible as compared to (r2 - a2) (2.66a) reduces to the
usual expression, in text books (e.g., Page and Adams [33].
48 2 Electron Emission from Dust

Equation (2.66b) is the usual expression, except for a surface barrier -[Wa -
e2/2a] instead of -Wa.Based on (2.66a), Sodha and Sharma [50] tabulated the reduction in the work
function Du/(e2/a) as a function of the charge on the particle. An identical analysiswas also made much later by [8]. Recently Sodha and Srivatsava [51] have made asimilar analysis, taking into account the Debye shielding; thus (2.66a) getsreplaced by
UðqÞ ¼ �f2ðq2 � 1Þ þ ðe2=aWaÞg�1 þ ð1=2q2Þ þ ðZ=qÞ exp½ð1� qÞ=l�for q [ 1
ð2:66cÞ
and
UðqÞ ¼ ðZ þ 1=2Þ �Wa=ðe2=aÞ for q\1; ð2:66dÞ
where q = r/a and U(q) = V(r)/(e2/a).The value of q corresponding to the maximum value of U viz. qm can be
obtained by putting by ðdU=dqÞ = 0; thus
lq4m � lðq2
m � 1Þ2 þ Zqmðq2m � 1Þ2ðqm þ lÞ exp½ð1� qmÞ=l� ¼ 0:
It is seen that (qm2 - 1) is in general much larger than e2/aWa.
Hence, the maximum value of the potential energy Um(Z, l) is given by
UmðZ; lÞ ¼ �½1�
2ðq2m � 1Þ� þ ½1
�2q2
m� þ ðZ=qmÞ exp½ð1� qmÞ=l� ð2:67Þ
In view of (2.66d), the energy EF corresponding to Fermi level of a chargedparticle is given by
½EF=ðe2=aÞ� ¼ ½EF0=ðe2=aÞ� þ ðZ þ 1/2Þ � ½Wa=ðe2=aÞ�;
where EF0 refers to an uncharged plane surface.Hence the work function u, corresponding to the charged particle is given by
½u=ðe2=aÞ� ¼ [(Wa � EF0)/ðe2=aÞ]þ [UmðZ; lÞ � ðZ þ 1/2Þ�or ðu� u0Þ=ðe2=aÞ ¼ ½Du=ðe2=aÞ� = ½UmðZ; lÞ � (Z + 1/2)�;
ð2:68Þ
where u0 refers to the work function of the uncharged plane surface andDuð = u� u0Þ is the change in work function due to the charge and curvature ofthe surface of the particle.
Table 2.5 illustrates the dependence of Du=ðe2=aÞ on Z and l. The Coulomblimit is approached when l tends to infinity as given in Table 2.5.
2.8 Electron Emission from Charged Spherical 49

2.8.3 Simple Theory of Electron Emission from CurvedSurfaces
The theory presented in this section assumes that the transmission coefficient of anelectron across the surface is unity when the normal energy is greater than Wa andis zero otherwise.
2.8.3.1 Negatively Charged Surfaces: (Vs > 0)
In the approximation, stated before, the rate and mean energy of emitted electrons(just outside the surface) are the same as in planar uncharged case. The meanenergy far away from the surface gets enhanced by an amount equal to thepotential energy of the electron at the surface. We have used the symbol V0 forpotential energy of an electron in case of a plane surface but it is convenient to usesymbol Vs in case of curved surface.
2.8.3.2 Positively Charged Spherical Surfaces: (Vs < 0)
References [38, 39, 46] are relevant.
2.8.3.3 Thermionic Emission
The energy distribution of the number of electrons incident per unit area per unittime on the surface is given by
Table 2.5 Dependence of ½�Du=ðe2=aÞ�on Z and l
Z !l #
1 2 3 4 7 10 20 40 60 80 100 200 400
2 1.16 1.59 1.94 2.24 2.99 3.60 5.17 7.42 9.14 10.61 11.89 16.95 24.123 1.11 1.51 1.84 2.12 2.83 3.40 4.86 6.99 8.61 9.99 11.21 15.98 22.734 1.09 1.47 1.79 2.06 2.74 3.30 4.72 6.76 8.34 9.67 10.84 15.46 22.005 1.07 1.45 1.75 2.02 2.68 3.23 4.62 6.62 8.17 9.47 10.62 15.15 21.556 1.06 1.43 1.73 1.99 2.65 3.18 4.56 6.53 8.05 9.34 10.47 14.93 21.257 1.05 1.42 1.72 1.98 2.62 3.15 4.51 6.46 7.97 9.24 10.36 14.78 21.038 1.04 1.41 1.70 1.96 2.60 3.12 4.47 6.41 7.90 9.16 10.28 14.66 20.869 1.04 1.40 1.69 1.95 2.58 3.10 4.44 6.37 7.85 9.11 10.21 14.57 20.7310 1.03 1.39 1.68 1.94 2.57 3.08 4.42 6.33 7.81 9.06 10.16 14.49 20.6350 1.01 1.35 1.62 1.87 2.47 2.97 4.25 6.09 7.51 8.71 9.78 13.9 19.9100 1.00 1.34 1.62 1.86 2.46 2.96 4.23 6.06 7.48 8.67 9.73 13.9 19.81 1.00 1.34 1.61 1.85 2.45 2.94 4.20 6.03 7.44 8.63 9.68 13.8 19.7
After Sodha and Srivastava [23], curtsey authors and publishers Elseiver
50 2 Electron Emission from Dust
d2n1 ¼ ðA0=eÞT2 expð�ex � et þ eFÞdexdet: ð2:9Þ
The energy distribution just outside the surface (after the electrons have crossedthe surface barrier wa ¼ Wa=kBTð Þ) is
d2n01 ¼ ðA0=eÞT2 expð�e0x � et � wa þ eFÞde0xdet
¼ ðA0=eÞT2 expð�uÞ expð�e0x � etÞde0xdet;ð2:69Þ
where e0x ¼ ex � wa denotes the normal energy of an electron just outside thesurface and u ¼ ðwa � eFÞ ¼ Wa � EFð Þ=kBT :
If the surface has an electrical potential �Vs=e Vs\0ð Þ, only electrons having atotal energy larger than �Vs or ðe0x þ etÞ[ � ts ¼ �Vs=kBTð Þ can escape from thesurface and get emitted; in many publications instead of �ts, Ze2=akBT ¼ Za isused.
Hence from (2.69) the number of electrons nth emitted from the surface per unitarea per unit time is given by
ð�Jth=eÞ ¼ nth ¼ ðA0=eÞT2 expð�uÞZ1
0
ðe0x þ etÞ[ � ts
Z1
0
expð�e0x � etÞde0xdet:
¼ �ðA0=eÞT2 expð�uÞZ1
�ts
e expð�eÞde
¼ �ðA0=eÞT2ð1� tsÞ exp½�ðu� tsÞ�;
ð2:70aÞ
In writing the single integral from the double integral identity (2.37) has beenused.
In many investigations the term 1� tsð Þ is missing, which may be responsiblefor unacceptably large errors.
The mean energy of electrons, just outside the surface is from (2.69), given by
eth0 ¼ ½ðA0=eÞT2 expð�uÞ=nth�:Z1
0
ðe0x þ etÞ[ � ts
Z1
0
ðe0x þ etÞ expð�e0x � etÞde0xdet
¼ ½expð�tsÞ�ð1� tsÞ�
Z1
�ts
e2 expð�eÞde
¼ �ts þ ð2� tsÞ�ð1� tsÞ
2.8 Electron Emission from Charged Spherical 51

Hence, the mean energy far away from the surface is given by
eth ¼ eth0 þ ts ¼ ð2� tsÞ�ð1� tsÞ ð2:70bÞ
For the evaluation of the integrals, occurring in the expressions for nth and eth0
the identity from (2.37) has been used.If we consider a particle of radius a with charge (Z - 1)e, it acquires a charge
Ze after an electron gets outside the surface and hence the corresponding value of-ts is Ze2/akBT.
2.8.3.4 Photoelectric Emission
From (2.39), the energy distribution of photoelectrons crossing the surface of themetal per unit area per unit time just outside the surface is given by.
d2nph ¼ ðA0T2=eÞbðmÞKðmÞFDðe00x þ et � nÞde00x det; ð2:71Þ
where n ¼ et � wa � eF½ � ¼ hm� Uð Þ=kBT .Of these only those electrons can escape or be emitted for which
ðe00x þ etÞ[ � ts. Hence
ð�Jph=eÞ ¼ nph ¼ ðA0=eÞT2bðmÞKðmÞZ1
0
ðe00x þ etÞ[ � ts
Z1
0
FDðe00x þ et � nÞde00x det;
¼ ðA0=eÞT2bðmÞKðmÞI1ð�ts; nÞ
ð2:72aÞ
and
eph;0 ¼ ½ðA0=eÞT2bðmÞKðmÞ=nph�Z1
0
ðe00x þ etÞ[ � ts
Z1
0
ðe00x þ et � nÞFDðe00x þ et � nÞde00x det:
¼ ðA0=eÞT2bðmÞKðmÞI2ð�ts; nÞ=nph
ð2:73aÞ
where using identity (2.37)
52 2 Electron Emission from Dust

I1 ¼Z1
�ts
e½1þ expðe� nÞ��1de
¼ f�e ln½1þ expðn� eÞ�g1�tsþZ1
�ts
ln½1þ expðn� eÞ�de;
¼ �ts ln½1þ expðnþ tsÞ� þZ1
0
ln½1þ expðnþ ts � e00Þ�de00;
¼ �ts ln½1þ expðnþ tsÞ� þ Uðnþ tsÞ;
ð2:72bÞ
Uðnþ tsÞ ¼ZexpðnþtsÞ
0
ln½1þ X�X
dX; I2 ¼Z1
�ts
e2½1þ expðe� nÞ��1de
¼ f�e2 ln½1þ expðn� eÞ�g1�tsþ 2
Z1
�ts
e ln½1þ expðn� eÞ�de
¼ t2s ln½1þ expðnþ tsÞ� þ 2
Z1
�ts
e ln½1þ expðn� eÞ�de
¼ t2s ln½1þ expðnþ tsÞ� þ 2
Z1
0
ð�ts þ e1Þ ln½1þ expðn� e1 þ tsÞ�de1
¼ t2s ln½1þ expðnþ tsÞ� � 2tsUðnþ tsÞ þ 2I3ðnþ tsÞ:
ð2:73bÞ
and
I3ðXÞ ¼Z1
0
g ln½1þ expðX� gÞ�dg: ð2:73cÞ
Thus, the mean energy far away from the surface is given by
eph ¼ eph0 þ ts ¼�tsUðnþ tsÞ þ 2I3ðnþ tsÞ
Uðnþ tsÞ � ts ln½1þ expðnþ tsÞ�:
If np denotes the rate of photoelectron emission from an uncharged surface�ts ¼ 0ð Þ
½nph=np� ¼ I1ðn;�tsÞ=UðnÞ: ð2:72cÞ
Many investigators have used the intuitive and erroneous relation
2.8 Electron Emission from Charged Spherical 53

ðnph=npÞ ¼ expðtsÞ: ð2:72dÞ
Misra and Sodha [30] have evaluated nph=np
� �and eph on the basis of modified
DuBridge theory; the ts dependence of the both the parameters corresponding toFowler’s and modified DuBridge theory is shown in Fig. 2.13a, b.
It is seen from Fig. (2.14) that the disagreement between the correct (2.72c) anderroneous (2.72d) increases with increasing n and -ts. Since for most situations ofinterest n is large, the use of (2.72d) can lead to unacceptably large errors.
In Tables 2.6a, b, c, and 2.7a, b, c nph/np and eph have been tabulated asfunctions of n and -ts.(after Sodha et al. [44], curtsey authors and publishers APS)
2.8.3.5 Cylindrical Surface
We consider emission from an element of the surface, normal to x direction andassume the z axis to be along the axis of the cylindrical surface; the potentialenergy of an electron at the surface is -Vs (Sodha et al. [49]).
Fig. 2.13 Dependence ofrate of emission (nphD/nph0),(nphF/nph0) and mean energyephD, ephF of emitted ofphotoelectrons on the electricpotential ts( = -eVs/kT) atthe surface of an emittingspherical particle; thecontinuous and broken curvesrefer to Du-Bridge andFowler theories respectively,while the lettersp, q, r, s, t and u refer toequal ton = 50, 60, 70, 80, 90, and100, respectively (after Misraet al. [30], curtsey authorsand publishers NRC Press)
54 2 Electron Emission from Dust

2.8.3.6 Thermionic Emission
From (2.8a) and (2.8c), the number of electrons incident per unit area per unit timeon an element of the surface, normal to the x direction is
d3n1 ¼ ðpx=meÞð2=h3ÞFD½ðp2�
2mekBTÞ � ðEF=kBTÞ�dpxdpydpz: ð2:8dÞ
For electrons of interest to thermionic emission px2/2me [ Wa and the above
equation reduces to (see the argument after (2.33).
d3n1 ¼ ðpx=meÞð2=h3Þ expðEF=kBTÞ exp½�ðp2x þ p2
y þ p2z=2mekBTÞ�dpxdpydpz
ð2:8eÞ
If p0 denotes the electron momentum just outside the surface
p02x =2me
� �¼ p2
x=2me
� ��Wa; p
0y ¼ py and p0z ¼ pz:
The momentum distribution of electrons just outside the surface element is thus
d3nth ¼ ðp0x=meÞð2=h3Þ expð�U=kBTÞ exp½�ðp02x þ p02y þ p02z =2mekBTÞ�dp0xdp0ydp0z
ð2:8fÞ
where U is the work function of the metal.As discussed before (47c) only those electrons get emitted for which
p02x þ p02y
�=2me [ � Vs; thus the number of electrons, emitted per unit area from
the surface can be obtained by integrating (3f), subject to this inequality. Hence,
Fig. 2.14 Dependence of nph/np on -ts for different values of n. The solid curves a, b, c, d referto (2.59c) and n = 5, 10, 15, and 20. The broken straight line refer to the erroneous (2.59d) (afterMisra et al. [29], curtsey authors and publishers Springer)
2.8 Electron Emission from Charged Spherical 55

Table 2.6 nph/np for 1 \ n\ 300
n ?; (-tS)
1 2 3 4 5 6 7 8
1 1.73234 1.96651 2.30933 2.74097 3.261 3.77477 4.34342 4.933132 1.43231 1.56106 1.79139 2.12938 2.55559 3.04494 3.57764 4.140283 1.28821 1.34624 1.47161 1.69632 2.02678 2.44437 2.92464 3.448214 1.21417 1.23733 1.29404 1.41665 1.63662 1.9605 2.37022 2.841955 1.17184 1.18058 1.20332 1.25902 1.37946 1.59565 1.91414 2.317266 1.14474 1.14796 1.15657 1.17899 1.23388 1.35262 1.56579 1.879897 1.12569 1.12686 1.13004 1.13855 1.16071 1.21497 1.33234 1.543068 1.11136 1.11179 1.11296 1.11611 1.12453 1.14648 1.20022 1.316479 1.10009 1.10025 1.10067 1.10183 1.10496 1.11331 1.13509 1.188410 1.09094 1.091 1.09116 1.09158 1.09273 1.09583 1.10413 1.12576
n ?; (-tS)
9 10 15 20 30 40 50 60
1 5.53803 6.15411 9.33055 12.5829 19.1673 25.7922 32.4375 39.08762 4.72408 5.32328 8.44792 11.6733 18.2294 24.8397 31.4746 38.11733 4.00191 4.57712 7.62838 10.8145 17.3283 23.916 30.533 37.16534 3.35671 3.9016 6.86264 10.0005 16.4609 23.0191 29.617 36.23635 2.78163 3.2886 6.1435 9.22611 15.6242 22.1474 28.7248 35.336 2.27754 2.73567 5.46544 8.487 14.8159 21.2993 27.8512 34.44067 1.85357 2.24665 4.82446 7.7796 14.0335 20.4731 26.9949 33.56338 1.52518 1.8327 4.21803 7.10093 13.2752 19.6676 26.1574 32.69989 1.30372 1.51075 3.64525 6.4486 12.5391 18.8816 25.338 31.854110 1.17871 1.29325 3.1074 5.82069 11.8237 18.138 24.5343 31.0262
n ?; (-tS)
70 80 90 100 150 200 250 300
1 45.7381 52.3544 58.9834 65.8947 98.2935 131.018 166.614 198.152 44.7672 51.3854 58.0506 64.8368 97.2761 130.446 165.765 199.0113 43.812 50.4415 57.1345 63.8029 96.352 129.744 164.54 199.8844 42.8736 49.5158 56.2234 62.7946 95.4268 128.576 162.82 200.3955 41.9518 78.5982 55.3038 61.8123 94.5055 127.428 161.362 199.9666 41.0457 47.6824 54.369 60.8548 93.6061 126.829 160.658 197.9537 40.154 46.7712 53.4304 59.9208 92.7189 126.483 160.325 194.6898 39.2759 45.8728 52.4999 59.009 91.8461 125.745 159.643 191.9479 38.4125 44.9915 51.587 58.1178 90.981 124.464 158.073 190.82710 37.564 44.1268 50.6945 57.2456 90.1328 123.327 155.97 190.958
56 2 Electron Emission from Dust
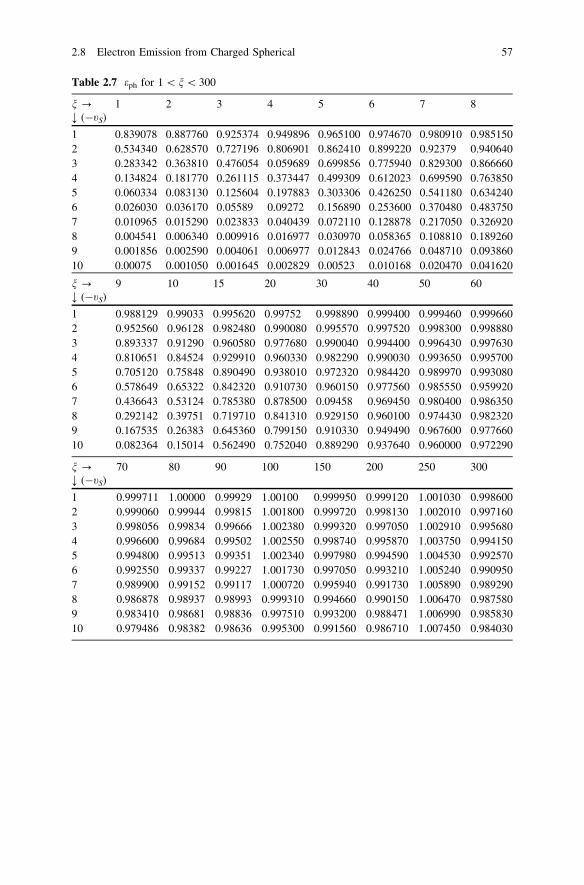
Table 2.7 eph for 1 \ n\ 300
n ?; (-tS)
1 2 3 4 5 6 7 8
1 0.839078 0.887760 0.925374 0.949896 0.965100 0.974670 0.980910 0.9851502 0.534340 0.628570 0.727196 0.806901 0.862410 0.899220 0.92379 0.9406403 0.283342 0.363810 0.476054 0.059689 0.699856 0.775940 0.829300 0.8666604 0.134824 0.181770 0.261115 0.373447 0.499309 0.612023 0.699590 0.7638505 0.060334 0.083130 0.125604 0.197883 0.303306 0.426250 0.541180 0.6342406 0.026030 0.036170 0.05589 0.09272 0.156890 0.253600 0.370480 0.4837507 0.010965 0.015290 0.023833 0.040439 0.072110 0.128878 0.217050 0.3269208 0.004541 0.006340 0.009916 0.016977 0.030970 0.058365 0.108810 0.1892609 0.001856 0.002590 0.004061 0.006977 0.012843 0.024766 0.048710 0.09386010 0.00075 0.001050 0.001645 0.002829 0.00523 0.010168 0.020470 0.041620
n ?; (-tS)
9 10 15 20 30 40 50 60
1 0.988129 0.99033 0.995620 0.99752 0.998890 0.999400 0.999460 0.9996602 0.952560 0.96128 0.982480 0.990080 0.995570 0.997520 0.998300 0.9988803 0.893337 0.91290 0.960580 0.977680 0.990040 0.994400 0.996430 0.9976304 0.810651 0.84524 0.929910 0.960330 0.982290 0.990030 0.993650 0.9957005 0.705120 0.75848 0.890490 0.938010 0.972320 0.984420 0.989970 0.9930806 0.578649 0.65322 0.842320 0.910730 0.960150 0.977560 0.985550 0.9599207 0.436643 0.53124 0.785380 0.878500 0.09458 0.969450 0.980400 0.9863508 0.292142 0.39751 0.719710 0.841310 0.929150 0.960100 0.974430 0.9823209 0.167535 0.26383 0.645360 0.799150 0.910330 0.949490 0.967600 0.97766010 0.082364 0.15014 0.562490 0.752040 0.889290 0.937640 0.960000 0.972290
n ?; (-tS)
70 80 90 100 150 200 250 300
1 0.999711 1.00000 0.99929 1.00100 0.999950 0.999120 1.001030 0.9986002 0.999060 0.99944 0.99815 1.001800 0.999720 0.998130 1.002010 0.9971603 0.998056 0.99834 0.99666 1.002380 0.999320 0.997050 1.002910 0.9956804 0.996600 0.99684 0.99502 1.002550 0.998740 0.995870 1.003750 0.9941505 0.994800 0.99513 0.99351 1.002340 0.997980 0.994590 1.004530 0.9925706 0.992550 0.99337 0.99227 1.001730 0.997050 0.993210 1.005240 0.9909507 0.989900 0.99152 0.99117 1.000720 0.995940 0.991730 1.005890 0.9892908 0.986878 0.98937 0.98993 0.999310 0.994660 0.990150 1.006470 0.9875809 0.983410 0.98681 0.98836 0.997510 0.993200 0.988471 1.006990 0.98583010 0.979486 0.98382 0.98636 0.995300 0.991560 0.986710 1.007450 0.984030
2.8 Electron Emission from Charged Spherical 57
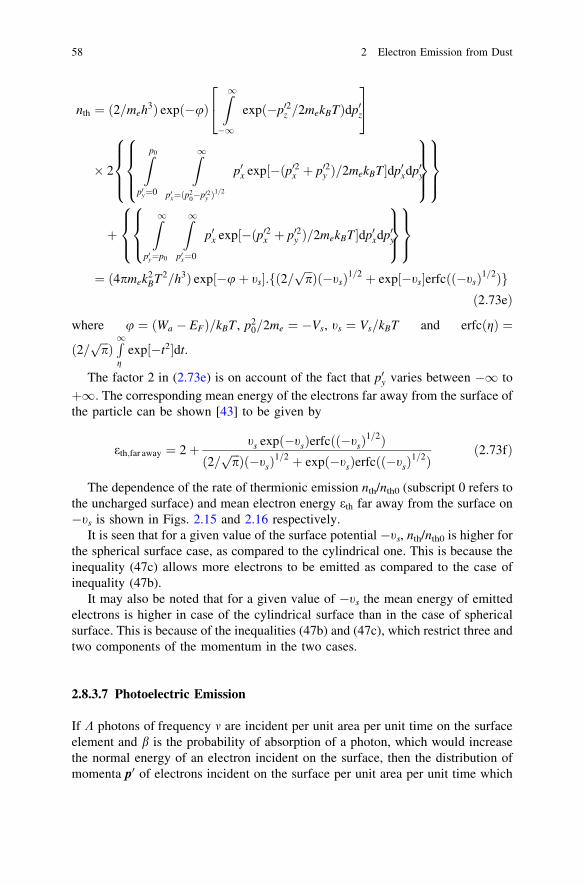
nth ¼ ð2=meh3Þ expð�uÞZ1
�1
expð�p02z =2mekBTÞdp0z
2
4
3
5
� 2Zp0
p0y¼0
Z1
p0x¼ðp20�p02y Þ
1=2
p0x exp½�ðp02x þ p02y Þ=2mekBT�dp0xdp0y
8>><
>>:
9>>=
>>;
8>><
>>:
9>>=
>>;
þZ1
p0y¼p0
Z1
p0x¼0
p0x exp½�ðp02x þ p02y Þ=2mekBT �dp0xdp0y
8><
>:
9>=
>;
8><
>:
9>=
>;
¼ ð4pmek2BT2=h3Þ exp½�uþ ts�:fð2=
ffiffiffippÞð�tsÞ1=2 þ exp½�ts�erfcðð�tsÞ1=2Þg
ð2:73eÞ
where u ¼ Wa � EFð Þ=kBT , p20=2me ¼ �Vs, ts ¼ Vs=kBT and erfcðgÞ ¼
ð2=ffiffiffippÞR1
gexp½�t2�dt.
The factor 2 in (2.73e) is on account of the fact that p0y varies between �1 toþ1: The corresponding mean energy of the electrons far away from the surface ofthe particle can be shown [43] to be given by
eth;far away ¼ 2þ ts expð�tsÞerfcðð�tsÞ1=2Þ
ð2=ffiffiffippÞð�tsÞ
1=2 þ expð�tsÞerfcðð�tsÞ1=2Þ
ð2:73fÞ
The dependence of the rate of thermionic emission nth/nth0 (subscript 0 refers tothe uncharged surface) and mean electron energy eth far away from the surface on-ts is shown in Figs. 2.15 and 2.16 respectively.
It is seen that for a given value of the surface potential -ts, nth/nth0 is higher forthe spherical surface case, as compared to the cylindrical one. This is because theinequality (47c) allows more electrons to be emitted as compared to the case ofinequality (47b).
It may also be noted that for a given value of -ts the mean energy of emittedelectrons is higher in case of the cylindrical surface than in the case of sphericalsurface. This is because of the inequalities (47b) and (47c), which restrict three andtwo components of the momentum in the two cases.
2.8.3.7 Photoelectric Emission
If K photons of frequency m are incident per unit area per unit time on the surfaceelement and b is the probability of absorption of a photon, which would increasethe normal energy of an electron incident on the surface, then the distribution ofmomenta p0 of electrons incident on the surface per unit area per unit time which
58 2 Electron Emission from Dust
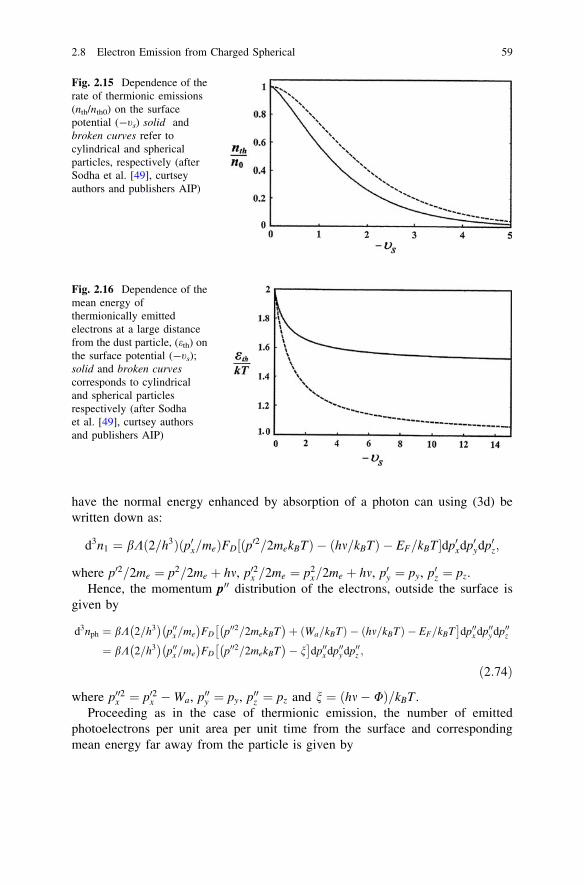
have the normal energy enhanced by absorption of a photon can using (3d) bewritten down as:
d3n1 ¼ bKð2=h3Þðp0x=meÞFD½ðp02=2mekBTÞ � ðhm=kBTÞ � EF=kBT �dp0xdp0ydp0z;
where p02=2me ¼ p2=2me þ hm, p02x =2me ¼ p2x=2me þ hm, p0y ¼ py, p0z ¼ pz.
Hence, the momentum p00 distribution of the electrons, outside the surface isgiven by
d3nph ¼ bK 2=h3� �
p00x=me
� �FD p002=2mekBT
� �þ Wa=kBTð Þ � hm=kBTð Þ � EF=kBT
� dp00x dp00y dp00z
¼ bK 2=h3� �
p00x=me
� �FD p002=2mekBT
� �� n
� dp00x dp00y dp00z ;
ð2:74Þ
where p002x ¼ p02x �Wa, p00y ¼ py, p00z ¼ pz and n ¼ hm� Uð Þ=kBT .Proceeding as in the case of thermionic emission, the number of emitted
photoelectrons per unit area per unit time from the surface and correspondingmean energy far away from the particle is given by
Fig. 2.15 Dependence of therate of thermionic emissions(nth/nth0) on the surfacepotential (-ts) solid andbroken curves refer tocylindrical and sphericalparticles, respectively (afterSodha et al. [49], curtseyauthors and publishers AIP)
Fig. 2.16 Dependence of themean energy ofthermionically emittedelectrons at a large distancefrom the dust particle, (eth) onthe surface potential (-ts);solid and broken curvescorresponds to cylindricaland spherical particlesrespectively (after Sodhaet al. [49], curtsey authorsand publishers AIP)
2.8 Electron Emission from Charged Spherical 59
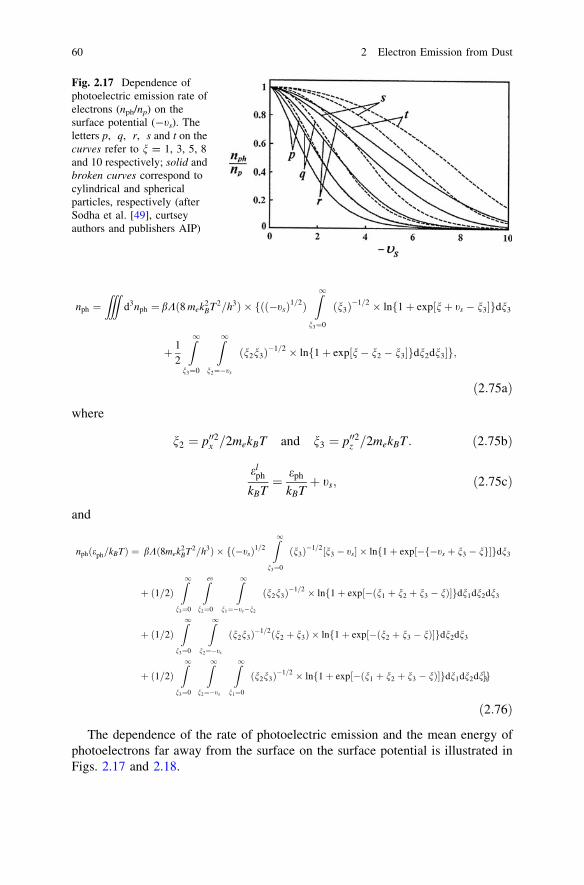
nph ¼ZZZ
d3nph ¼bKð8 mek2BT2=h3Þ � fðð�tsÞ1=2Þ
Z1
n3¼0
ðn3Þ�1=2 � lnf1þ exp½nþ ts � n3�gdn3
þ 12
Z1
n3¼0
Z1
n2¼�ts
ðn2n3Þ�1=2 � lnf1þ exp½n� n2 � n3�gdn2dn3�g;
ð2:75aÞ
where
n2 ¼ p002x =2mekBT and n3 ¼ p002z =2mekBT : ð2:75bÞ
elph
kBT¼ eph
kBTþ ts; ð2:75cÞ
and
nphðeph=kBTÞ ¼ bKð8mek2BT2=h3Þ � fð�tsÞ1=2
Z1
n3¼0
ðn3Þ�1=2½n3 � ts� � lnf1þ exp½�f�ts þ n3 � ng�gdn3
þ ð1=2ÞZ1
n3¼0
Zet
n2¼0
Z1
n1¼�ts�n2
ðn2n3Þ�1=2 � lnf1þ exp½�ðn1 þ n2 þ n3 � nÞ�gdn1dn2dn3
þ ð1=2ÞZ1
n3¼0
Z1
n2¼�ts
ðn2n3Þ�1=2ðn2 þ n3Þ � lnf1þ exp½�ðn2 þ n3 � nÞ�gdn2dn3
þ ð1=2ÞZ1
n3¼0
Z1
n2¼�ts
Z1
n1¼0
ðn2n3Þ�1=2 � lnf1þ exp½�ðn1 þ n2 þ n3 � nÞ�gdn1dn2dn3�g
ð2:76Þ
The dependence of the rate of photoelectric emission and the mean energy ofphotoelectrons far away from the surface on the surface potential is illustrated inFigs. 2.17 and 2.18.
Fig. 2.17 Dependence ofphotoelectric emission rate ofelectrons (nph/np) on thesurface potential (-ts). Theletters p, q, r, s and t on thecurves refer to n = 1, 3, 5, 8and 10 respectively; solid andbroken curves correspond tocylindrical and sphericalparticles, respectively (afterSodha et al. [49], curtseyauthors and publishers AIP)
60 2 Electron Emission from Dust

2.8.4 Transmission Coefficient for Electrons
2.8.4.1 Negatively Charged Surfaces
For the study of electric field emission of electrons from curved surfaces it is usualto utilize the result for a plane surface and substitute the electric field at the surfacefor the constant electric field in the case of a plane surface. Almost all efforts in thecase of curved surfaces are limited to the case of electric field emission; theexpressions for the transmission coefficient are applicable only for low values ofelectron energy (above the bottom of the conduction band), typically up to half ofthe height of the surface potential energy barrier Wa. Expressions for the trans-mission coefficient (corresponding to electric field emission) in case of sphericaland cylindrical surfaces were obtained in the Born approximation by [45, 47] bysolving Schrödinger’s equation for the appropriate unshielded electric potential, inthe JWKB approximation. Dubey [10] conducted a similar analysis with theinclusion of the image force. Sodha et al. [42, 43] obtained appropriate expressionsin the case of spherical and cylindrical surfaces respectively, employing the for-malism by Ghatak et al. [16, 35] and using the three-region model of electronpotential energy variation in the vicinity of the surface. In this section, an analysis(Sodha et al. [44]) for spherical and cylindrical cases, using appropriate expres-sions, corresponding to Debye–Huckel shielding has been presented. It may bementioned that Prakash [34] has made an analysis, corresponding to nonlinearshielding. However, the formalism adopted so far is valid only for low energy (lessthan that corresponding to 0.5 Wa) and a more rigorous treatment is required. Afairly rigorous treatment, applicable to all values of electron energy has been givenby Mishra et al. [28], which is outlined in what follows.
Fig. 2.18 Dependence of themean energy of thephotoelectrons (at a largedistance from the dustgrains), (eph) on the surfacepotential (-ts). The letters p,q, r, s and t on the curvesrefer to the n = 1, 3, 5, 8 and10 respectively; solid anddotted curves correspond tocylindrical and sphericalparticles respectively (afterSodha et al. [49], curtseyauthors and publishers AIP)
2.8 Electron Emission from Charged Spherical 61

2.8.4.2 Spherical Surface
The electron potential energy V(r) in and out of a spherical particle of radius a,charged to an electric potential (-Vs/e), corresponding to the electron potentialenergy Vs at the surface is given by [28]
VðrÞ ¼ Vs �Wa for r\a ðRegion-IÞ
and
VðrÞ ¼ ðaVs=rÞexp½�ðr � aÞ=kD for r\a ðRegion-IIÞ
where Wa is the height of the surface electron potential energy barrier of thematerial of the particle,
kD is the Debye length in the plasma and
-e is the electronic charge.
It is convenient for purposes of computation to express the potential energy in adimensionless form as follows and have another Region-III (r [ rn), such thatV(r) in this region is very nearly zero (say \0.05 Vs).
Thus,
tðqÞ ¼ ðts � 1Þ for q\1 ðRegion-IÞ ð2:77aÞ
tðqÞ ¼ ðts=qÞ exp½�ðq� 1Þ=ld� for 1\q\qn ðRegion -IIÞ ð2:77bÞ
and
tðqÞ ¼ 0 for q [ qn ðRegion-IIIÞ ð2:77cÞ
where t(q) = (V(r)/Wa), ts = (Vs/Wa), q = (r/a), ld = (kD/a) and qn = (rn/a).
2.8.4.3 Schrödinger’s Equation
Putting
wðr; h;uÞ ¼ rwðrÞYl;mðh;uÞ;
(as is the case for a spherically symmetrical potential energy) and interpreting theorbital quantum number l semiclassically, Schrödinger’s equation, correspondingto an electron in a spherically symmetric potential reduces [28] to
d2wdr2þ 8p2me
h2ðEr � VðrÞÞw ¼ 0
or
62 2 Electron Emission from Dust

d2wdq2þ bðer � VðqÞÞw ¼ 0; ð2:78Þ
where b = (8p2mea2Wa/h2), er = (Er/Wa) and Er is the radial kinetic energy of an
electron due to the radial component of its momentum in Region-III, whereV(r) = 0; hence is also the total (kinetic plus potential) energy of the electron.
Substituting for V(q) from (2.77a), (2.77b) and (2.77c) in (2.78), Schrödinger’sequation in the three regions may be expressed as:
d2wdq2þ bðer � ts þ 1Þw ¼ 0 for q\1ðRegion-IÞ; ð2:79aÞ
d2wdq2þ bfer � ðts=qÞ exp½�ðq� 1Þ=ld�gw ¼ 0 for 1\q\qnðRegion -IIÞ
ð2:79bÞ
and
d2wdq2þ berw ¼ 0 for q[ qnðRegion-IIIÞ: ð2:79cÞ
The tangential component of the momentum is not affected by the movement ofthe electron in the three regions; hence, the radial kinetic energy inside the particlee0r = E0r/Wa is given by
e0r þ ts � 1 ¼ er þ 0 ðRegion-I) (Region-III)
or
e0r ¼ er � ts þ 1: ð2:80Þ
For computation qn is obtained by putting q = qn and t(q = qn) = 0.05 ts in(2.77b).
The interval 1 \q\ qn is divided in n segments where the qth segment isdefined by (1 ? qd) \ q\ (1 ? (q ? 1)d) and d = (qn - 1)/n.
The electron potential energy t(q) in the qth segment of the second region maybe approximated as
tqðqÞ ¼ tð1þ qdÞ þ ½q� ð1þ qdÞ�ft½1þ ð1þ qÞd� � tð1þ qdÞgd�1; ð2:80dÞ
where q varies from zero to (n - 1) and t(q) is given by (2.77b).Equation (2.80d) implies that ts in a segment varies linearly with r and is not
uniform.In other words, (2.80d) is an improvement over the usual assumption
tqðqÞ ¼ ½tð1þ qdÞ þ tð1þ ð1þ qÞdÞ�=2;
2.8 Electron Emission from Charged Spherical 63

which has not been used herein; this assumption is usually made in such situations.The usual boundary conditions are the continuity of w and it derivative at the
interfaces of regions/segments.
2.8.4.4 General Solution of Schrödinger’s Equation
The general solution in Region-I (inside the particle), Region-II (qth Segment),and Region-III (far away from the particle) may from (2.79a), (2.79b) and (2.79c)be expressed as:
Region-I: wðqÞ ¼ A exp½ik1ðq� 1Þ� þ B exp½�ik1ðq� 1Þ�; ð2:81aÞ
Region-II: wðqÞ ¼ CqAi½gq� þ DqBi½gq� ð2:81bÞ
and
Region-III: wðqÞ ¼ E exp½ik3ðq� qnÞ� þ F exp½�ik3ðq� qnÞ�; ð2:81cÞ
where
k21 ¼ bðer � ts þ 1Þ; gq ¼ �ðer � tqðqÞÞ=f 2=3
q ;
fq ¼ bts expð�qd=ldÞ 1d
expð�d=ldÞ½1þðqþ1Þd� � 1
½1þqd�
�and k3
2 = ber.
2.8.4.5 Transmission of Electrons
When electron emission is considered
F ¼ 0; A ¼ 1 arbitraryð Þ ð2:81dÞ
and when electron accretion is considered
A ¼ 0; F ¼ 1 arbitraryð Þ: ð2:81eÞ
The transmission coefficient F = 1 (arbitrary) in the two cases is given by
De ¼ 1� BB�=AA� Emissionð Þ ð2:82aÞ
and
Da ¼ 1� EE�=FF� Accretionð Þ ð2:82bÞ
the subscripts e and a indicate emission and accretion respectively.The coefficient A, B, Cq, Dq, E, F [q varying from zero to (n - 1)] may be
obtained from the fact that w and (dw/dq) are continuous at the interface ofsegments and region viz at q = 1, q = 1 ? (q ? 1)d (0 B q B (n - 1)) andq = qn = (1 ? nd). Thus
64 2 Electron Emission from Dust

(i) at q = 1,
Aþ B ¼ C1Ai½g1� þ D1Bi½g1� ð2:83aÞ
and
ik1ðA� BÞ ¼ f ð1=3Þ1 ðC1Ai0½g1� þ D1Bi0½g1�Þ; ð2:83bÞ
(ii) at q = 1 ? (q ? 1)d where (0 B q B (n - 1)),
CqAi½gq� þ DqBi½gq� ¼ Cqþ1Ai½gqþ1� þ Dqþ1Bi½gqþ1� ð2:83cÞ
and
f 1=3q ðCqAi
0 ½gq� þ DqBi0 ½gq�Þ ¼ f 1=3
qþ1ðCqþ1Ai0½gqþ1� þ Dqþ1Bi0½gqþ1�Þ: ð2:83dÞ
(iii) at q = qn( = 1 ? nd),
CqnAi½gqn
� þ DqnBi½gqn
� ¼ E þ F; ð2:83eÞ
and
f 1=3qnðCqn
Ai0½gqn� þ Dqn
Bi0½gqn�Þ ¼ ik3ðE � FÞ: ð2:83fÞ
Thus, the transmission coefficients, corresponding to emission/accretion ofelectrons from/on a spherically negatively charged particle can be evaluated from(2.82a) and (2.82b), making use of (2.83a) to (2.83f) to obtain A, B, E, F.
In this section, the transmission coefficient for an electron having an arbitraryenergy has been evaluated. This is in contrast to earlier work, applicable toelectron energy er, which is less than half of the surface energy barrier.
For a better understanding of underlying physics and numerical appreciation ofthe results, three cases viz. (i) a spherical metallic particle at a temperatureT = 1500 K, (thermionic and field emission) (ii) spherical metallic particle at atemperature T = 300 K, illuminated by a continuous source of monochromaticradiation causing photoemission, characterized by a parameter n and light inducedfield emission and (iii) accretion (classical as well as tunneling) of electrons at thesurface of the spherical metallic particle, have been considered. Correspondingdependence of De(er) and Da(er) on the radial energy of electrons er, potentialenergy at the surface and height of the surface energy barrier has been graphicallyillustrated. For computational purpose, the following standard sets of parametershave been used.
2.8 Electron Emission from Charged Spherical 65

2.8.4.6 For the Evaluation of Transmission Coefficient
ts = 0.5, ld = (kD/a) = 5 and b = 1,000.
2.8.4.7 For the Evaluation of Electron Currents
Case-I: a = 10 nm, Wa = 10 eV, ld = 5 with / = 5 eV and T = 1500 K.Case-II: a = 10 nm, Wa = 10 eV, ld = 5 with T = 300 K.Case-III: a = 10 nm, Wa = 10 eV, ld = 5.Parametric dependences have been investigated by varying one of these
parameters, keeping others unchanged.The set of Fig. 2.19 illustrates the dependence of the transmission coefficient
[De(er) and Da(er)] on the radial energy of electrons er and e0r corresponding to faraway from and inside the particle as a function of ts (surface potential) (Figs. 2.19,2.20), parameter b (Fig. 2.21) and Debye length (ld) (Fig. 2.22).
It is seen from Fig. 2.19 that the transmission coefficient [i.e., D(er)] increasesmonotonically with increasing er and ts, and approaches unity asymptotically forlarge er. In the curves the region er \ ts is indicative of the contribution to theelectron emission through tunneling (electric field emission) while the rest (i.e.,er [ ts) corresponds to classically allowed emission; the broken curves correspondto transmission coefficient for step potential barrier [D0(er)] corresponding to ts
(when Wa is substituted by (Wa - Vs)). The transmission coefficient correspondingto irradiated metallic particles (causing photoemission) may be obtained by shiftinger-axis by em( = hm). Further it is seen that the numerical values of the transmissioncoefficient, corresponding to accretion [Da(er)] and emission [De(er)] of electronsare very close to each other and almost indistinguishable on the same graph.
Fig. 2.19 Dependence of transmission coefficient [De(er) or Da(er)] on er for ld = (kD/a) = 5and b = 1,000. The labels on the curves p, q, r, s and t correspond to ts = 0.5, 1.0, 1.5, 2.0 and3.0 respectively. The solid curves correspond to the present analysis while the dashed curves referto the step potential barrier of height (1 - ts) (after Mishra et al. [28], curtsey authors andpublishers AIP)
66 2 Electron Emission from Dust

The graphical representation for transmission of the set of Fig. 2.19 is wellapplicable to the latter two cases viz. irradiated particles and accretion. The factthat De(er) & Da(er) is the necessary and sufficient condition [48] for the validityof Saha’s equation in thermal equilibrium of a system of electron emitting dust andelectrons accreting on the surface of the particles. Since Saha’s equation is basedon statistical thermodynamics, without regard to process details, this result is asource of satisfaction. By the way this result relaxes the previous condition [48] for
Fig. 2.20 Dependence of transmission coefficient De e0r� �
orDa e0r� ��
on e0r for ld = (kD/a) = 5and b = 1,000. The labels on the curves p, q, r, s and t correspond to ts = 0.5, 1.0, 1.5, 2.0 and3.0 respectively. The solid curves correspond to the present analysis while the dashed curves referto the step potential barrier of height (1 - ts) (after Mishra et al. [28], curtsey authors andpublishers AIP)
Fig. 2.21 b Dependence of transmission coefficient [De(er) or Da(er)] on er for ts = 0.5, andld = (kD/a) = 5. The labels on the curves p, q, r, s, and t correspond to b = 250, 500, 1,000,2,000 and 26,000 respectively. The solid curves correspond to the present analysis while thedashed curves refer to the step potential barrier of height (1 - ts) (after Mishra et al. [28], curtseyauthors and publishers AIP)
2.8 Electron Emission from Charged Spherical 67
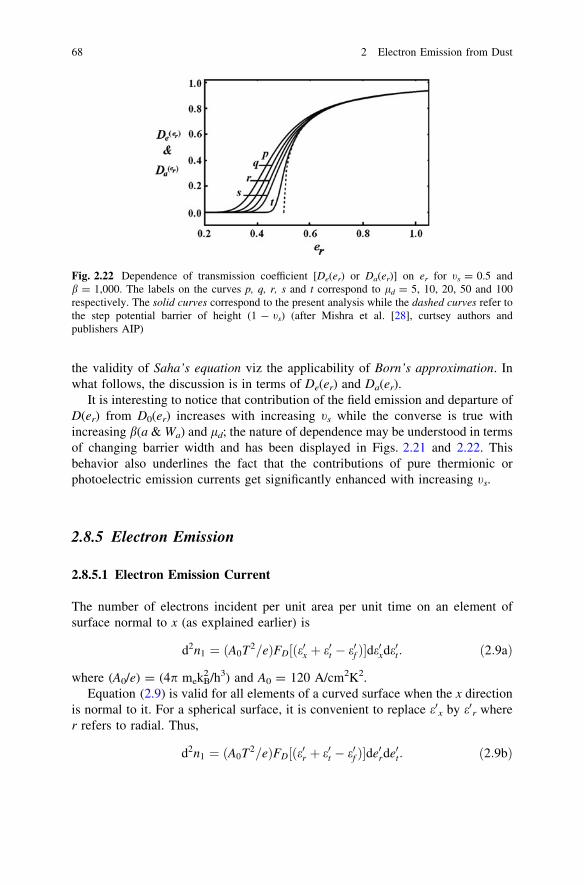
the validity of Saha’s equation viz the applicability of Born’s approximation. Inwhat follows, the discussion is in terms of De(er) and Da(er).
It is interesting to notice that contribution of the field emission and departure ofD(er) from D0(er) increases with increasing ts while the converse is true withincreasing b(a & Wa) and ld; the nature of dependence may be understood in termsof changing barrier width and has been displayed in Figs. 2.21 and 2.22. Thisbehavior also underlines the fact that the contributions of pure thermionic orphotoelectric emission currents get significantly enhanced with increasing ts.
2.8.5 Electron Emission
2.8.5.1 Electron Emission Current
The number of electrons incident per unit area per unit time on an element ofsurface normal to x (as explained earlier) is
d2n1 ¼ ðA0T2=eÞFD½ðe0x þ e0t � e0f Þ�de0xde0t: ð2:9aÞ
where (A0/e) = (4p mekB2 /h3) and A0 = 120 A/cm2K2.
Equation (2.9) is valid for all elements of a curved surface when the x directionis normal to it. For a spherical surface, it is convenient to replace e0x by e0r wherer refers to radial. Thus,
d2n1 ¼ ðA0T2=eÞFD½ðe0r þ e0t � e0f Þ�de0rde0t: ð2:9bÞ
Fig. 2.22 Dependence of transmission coefficient [De(er) or Da(er)] on er for ts = 0.5 andb = 1,000. The labels on the curves p, q, r, s and t correspond to ld = 5, 10, 20, 50 and 100respectively. The solid curves correspond to the present analysis while the dashed curves refer tothe step potential barrier of height (1 - ts) (after Mishra et al. [28], curtsey authors andpublishers AIP)
68 2 Electron Emission from Dust
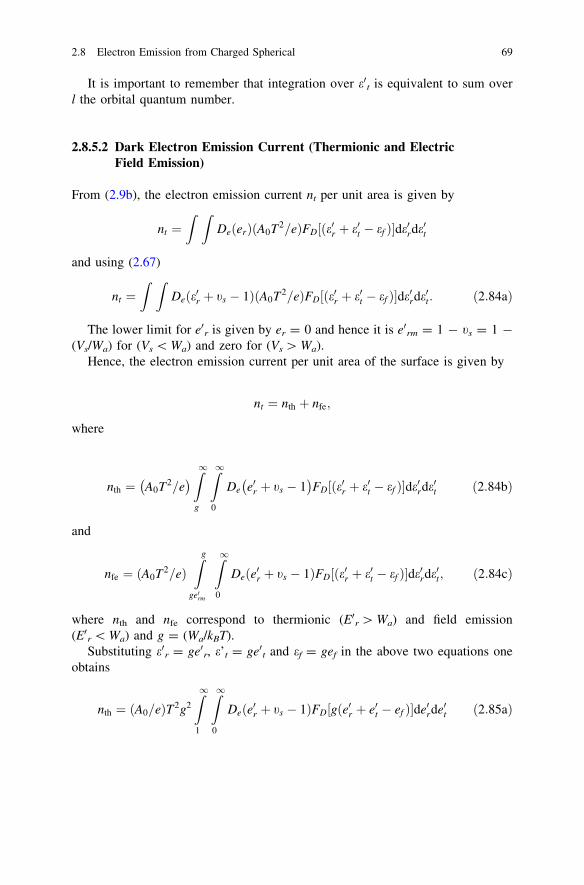
It is important to remember that integration over e0t is equivalent to sum overl the orbital quantum number.
2.8.5.2 Dark Electron Emission Current (Thermionic and ElectricField Emission)
From (2.9b), the electron emission current nt per unit area is given by
nt ¼Z Z
DeðerÞðA0T2=eÞFD½ðe0r þ e0t � ef Þ�de0rde0t
and using (2.67)
nt ¼Z Z
Deðe0r þ ts � 1ÞðA0T2=eÞFD½ðe0r þ e0t � ef Þ�de0rde0t: ð2:84aÞ
The lower limit for e0r is given by er = 0 and hence it is e0rm = 1 - ts = 1 -
(Vs/Wa) for (Vs \ Wa) and zero for (Vs [ Wa).Hence, the electron emission current per unit area of the surface is given by
nt ¼ nth þ nfe;
where
nth ¼ A0T2=e� � Z
1
g
Z1
0
De e0r þ ts � 1� �
FD½ðe0r þ e0t � ef Þ�de0rde0t ð2:84bÞ
and
nfe ¼ ðA0T2=eÞZg
ge0rm
Z1
0
Deðe0r þ ts � 1ÞFD½ðe0r þ e0t � ef Þ�de0rde0t; ð2:84cÞ
where nth and nfe correspond to thermionic (E0r [ Wa) and field emission(E0r \ Wa) and g = (Wa/kBT).
Substituting e0r = ge0r, e’t = ge0t and ef = gef in the above two equations oneobtains
nth ¼ ðA0=eÞT2g2Z1
1
Z1
0
Deðe0r þ ts � 1ÞFD½gðe0r þ e0t � ef Þ�de0rde0t ð2:85aÞ
2.8 Electron Emission from Charged Spherical 69

nfe ¼ ðA0=eÞT2g2Z1
e0rm
Z1
0
Deðe0r þ ts � 1ÞFD½gðe0r þ e0t � ef Þ�de0rde0t: ð2:85bÞ
In case of thermionic emission one is interested only in electrons having anenergy higher that Wa, which itself is much higher than the Fermi energy( [[ kBT). Hence c = g(e0x ? e0t - e0f) [[ 1 and FD(c) = exp (-c).
Thus (2.72a) simplifies to
nth ¼ ðA0=eÞT2g2 expðgef ÞZ1
0
expð�ge0tÞde0
t
Z1
1
Deðe0r þ ts � 1Þ expð�ge0rÞde0r
¼ ðA0=eÞT2g expðgef ÞZ1
1
Deðe0r þ ts � 1Þ expð�ge0rÞde0r:
ð2:86Þ
If it is assumed as in many books and papers that De = 1, the above equationreduces to
nth0 ¼ A0=eð ÞT2 exp �gþ gef
� �¼ A0=eð ÞT2 expð�/=kBTÞ ð2:87Þ
where U = Wa - EF is the work function.Equation (2.85b) can also be simplified by integrating with respect to e0t. Thus,
nfe ¼ ðA0=eÞT2g
Z1
e0rm
Deðe0r þ ts � 1Þ ln½1þ exp½�gðe0r � ef Þ��de0r ð2:88Þ
The mean energy of emitted electron (inside the metal) e0th and e0fe are given by
e0th ¼ A0=enthð ÞT2g2Z 11
Z 10
e0r þ e0t� �
De e0r þ ts � 1� �
FD g e0r þ e0t � ef
� �� de0rde0t
ð2:89Þ
e0fe ¼ ðA0=enfeÞT2g2Z1
e0rm
Z1
0
ðe0r þ e0
tÞDeðe0
r þ ts � 1ÞFD½gðe0
r þ e0
t � ef Þ�de0
rde0t
ð2:90Þ
The mean energy of electrons far away from the particle is using (2.80) givenby eth ¼ e0th þ 1� ts and efe ¼ e0fe þ 1� ts.
70 2 Electron Emission from Dust

2.8.5.3 Photoelectric Current
(Photoelectric effect and light-Induced field emission)The most widely used quantitative theory of photoelectric emission was for-
mulated by [13], who assumed that the normal energy of a fraction b(m)K(m)dm ofthe electrons incident on the surface from inside gets enhanced by an amount (hm),when K(m)dm photons of frequency between (m) and (m ? dm) are incident on thesurface per unit area per unit time. Hence, the energy distribution of photoelec-trons [whose normal energy has been enhanced by (hm)], incident per unit area perunit time from the inside is, using (2.9b), given by
d2nph ¼ bðmÞKðmÞdmðA0T2=eÞFD½ðe00r þ e00t � ev � ef Þ�de00r de00t ; ð2:39Þ
where e00t ¼ e0t, e00r ¼ e0r þ hm=kBTð Þ is the enhanced (after absorption of a photon)dimensionless radial energy and em = hm/kBT.
Proceeding in the same way, as in the evaluation of dark electron current thetotal photoelectric current is using (2.79b), given by
nphT ¼ nphðmÞ þ nlifeðmÞ; ð2:91aÞ
where
nphðmÞ ¼Zm2
m1
bðmÞKðmÞdmðA0=eÞT2g
Z1
1
Deðe00r þ ts � 1Þ ln½1þ exp½�gðe00r � ev � ef Þ��de00r
ð2:91bÞ
and
nlifeðmÞ ¼Zm2
m1
bðmÞKðmÞdmðA0=eÞT2g
Z1
e00rm
Deðe00r þ ts � 1Þ
� ln½1þ exp½�gðe00r � ev � ef Þ��de00r
ð2:91cÞ
In case Deðe00r Þ ¼ 1; (2.90) reduces to (2.41b) viz.
nph0 ¼ ðA0=eÞT2½bðmÞKðmÞ�UðnÞ:
The corresponding mean energy of the emitted electrons while inside theparticle is given by
nphe00ph ¼
Zm2
m1
bðmÞKðmÞdmðA0=eÞT2g
Z1
1
Z1
0
ðe00r þ e00t ÞDeðe00r þ ts � 1Þ
ð1þ exp½gðe00r þ e00t � ev � ef Þ�Þ�1de00r det
ð2:91dÞ
2.8 Electron Emission from Charged Spherical 71

nlifee00life ¼
Zm2
m1
bðmÞKðmÞdmðA0=eÞT2g
Z1
e00rm
Z1
0
ðe00r þ e00t ÞDeðe00r þ ts � 1Þ
ð1þ exp½gðe00r þ e00t � ev � ef Þ�Þ�1de00r det
ð2:91eÞ
The mean energy of electrons far away from the particle is using (2.80) givenby eph ¼ e00ph þ 1� ts and elife ¼ e00life þ 1� ts:
2.8.5.4 Numerical Results and Discussion
The dependence of the electric field (nfe/nth0) and thermionic (nth/nth0) emissioncurrents and associated respective mean energy (efe and eth, far away from theparticle surface) on the dimensionless surface potential (ts) has been illustrated inthe set of Fig. 2.23.
The figures indicate that the field emission currents are strongly influenced bysurface potential and can largely contribute to the emission current (Figs. 2.23, 2.25)while thermionic emission also increases monotonically with ts but with muchslower rate than field emission (Figs. 2.24, 2.25 2.26). This behavior may beunderstood in terms of the availability of electrons for field emission inside metallicparticles which is more than the availability of high energy electrons, correspondingto thermionic emission. The Figs. (2.23, 2.24) also display the fact that the therm-ionic emission current increases with increasing temperature of the spherical particlewhile field emission current displays the opposite trend; this may be ascribed tothe large availability of electrons at high temperature for thermionic emission.
Fig. 2.23 Dependence of (nfe/nth0) and efe with dimensionless surface potential (ts), for Case-Ia = 10 nm, Wa = 10 eV, ld = 5 and U = 5 eV. The labels on the curves p, q, r and scorrespond to T = 800, 1000, 1500 K and 2000 K respectively. Solid and broken linescorrespond to left and right hand scale respectively (after Mishra et al. [28], curtsey authors andpublishers AIP)
72 2 Electron Emission from Dust

Further, the size dependence has been illustrated in Figs. (2.25, 2.26) and can beunderstood in terms of D(er) dependence on b which ensures the large contributionfrom field emission with smaller size (larger electric field for given (ts)). Corre-spondingly the mean energy decreases with (ts) on account of larger emission of lowenergy electrons with increasing surface potential (ts); efe/eth display very weakdependence on size and temperature of the metallic particle.
The electron emission from spherical metallic particles in the presence ofmonochromatic radiation resulting in photoemission has been illustrated inFigs. 2.27, 2.28, 2.29. Figures 2.27 displays the dependence of light-induced fieldemission (nlife/nph0) and corresponding mean energy elife on surface potential (ts)as
Fig. 2.25 Dependence of (nfe/nth0) and efe with dimensionless surface potential (ts), for Case-I,T = 1500 K, Wa = 10 eV, ld = 5 and U = 5 eV. The labels on the curves p, q, r ands correspond to a = 5, 10, 15 and 20 nm respectively. Solid and broken lines correspond to leftand right hand scale respectively (after Mishra et al. [28], curtsey authors and publishers AIP)
Fig. 2.24 Dependence of (nth/nth0) and eth with dimensionless surface potential (ts), for Case-Ia = 10 nm, Wa = 10 eV, ld = 5 and U = 5 eV. The labels on the curves p, q, r ands correspond to T = 800, 1000, 1500 and 2000 K respectively. Solid and broken lines correspondto left and right hand scale respectively (after Mishra et al. [28], curtsey authors and publishersAIP)
2.8 Electron Emission from Charged Spherical 73
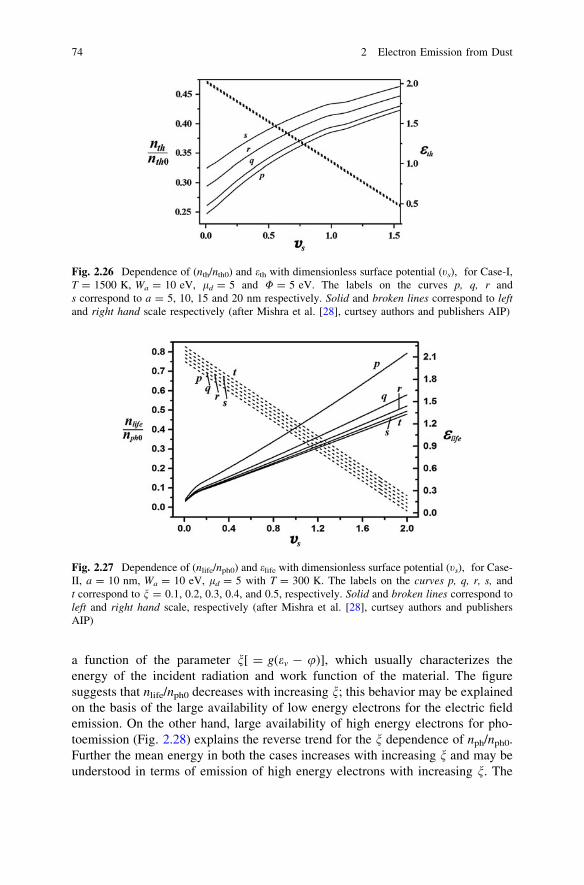
a function of the parameter n[ = g(em - u)], which usually characterizes theenergy of the incident radiation and work function of the material. The figuresuggests that nlife/nph0 decreases with increasing n; this behavior may be explainedon the basis of the large availability of low energy electrons for the electric fieldemission. On the other hand, large availability of high energy electrons for pho-toemission (Fig. 2.28) explains the reverse trend for the n dependence of nph/nph0.Further the mean energy in both the cases increases with increasing n and may beunderstood in terms of emission of high energy electrons with increasing n. The
Fig. 2.27 Dependence of (nlife/nph0) and elife with dimensionless surface potential (ts), for Case-II, a = 10 nm, Wa = 10 eV, ld = 5 with T = 300 K. The labels on the curves p, q, r, s, andt correspond to n = 0.1, 0.2, 0.3, 0.4, and 0.5, respectively. Solid and broken lines correspond toleft and right hand scale, respectively (after Mishra et al. [28], curtsey authors and publishersAIP)
Fig. 2.26 Dependence of (nth/nth0) and eth with dimensionless surface potential (ts), for Case-I,T = 1500 K, Wa = 10 eV, ld = 5 and U = 5 eV. The labels on the curves p, q, r ands correspond to a = 5, 10, 15 and 20 nm respectively. Solid and broken lines correspond to leftand right hand scale respectively (after Mishra et al. [28], curtsey authors and publishers AIP)
74 2 Electron Emission from Dust

results are in conformance with the transmission coefficient curves illustrated inFig. 2.19. Figure 2.29 displays the fact that light induced field emission (life)current significantly contributes to the total emission current (nt = nph ? nlife)with increasing ts; it is interesting to point out that the total current enhances by afactor of about 2.1 from its initial value (at ts = 0) for the chosen set ofparameters.
2.9 Mie’s Theory of Light Scattering by Spherical Particles
For large particles, the power incident on a sphere of radius a from a beam ofirradiation I is simply
Fig. 2.29 Dependence of((nlife ? nph)/nph0) withdimensionless surfacepotential (ts), for Case-II,a = 10 nm, Wa = 10 eV,ld = 5 with T = 300 K. Thelabels on the curves p, q, r, sand t correspond to n = 0.1,0.2, 0.3, 0.4, and 0.5,respectively (after Mishraet al. [28], curtsey authorsand publishers AIP)
Fig. 2.28 Dependence of(nph/nph0) and eph withdimensionless surfacepotential (ts), for Case-II,a = 10 nm, Wa = 10 eV,ld = 5 with T = 300 K. Thelabels on the curves p, q, r, s,and t correspond to n = 0.1,0.2, 0.3, 0.4, and 0.5,respectively. Solid andbroken lines correspond toleft and right hand scalerespectively (after Mishraet al. [28], curtsey authorsand publishers AIP)
2.8 Electron Emission from Charged Spherical 75
Pa ¼ pa2I:
On account of diffraction and scattering, the above equation gets modified to
Pa ¼ Mf ða;N; kÞpa2I
where the Mie factor Mf depends on a, and the complex refractive indexN = N1 ? iN2 of the sphere for the radiation of wavelength k.
The theory for the interaction of the spherical particles with electromagneticradiation has been given by Mie [27] and elucidated in the excellent books byStratton [54], Born and Wolf [62], Goody [63] and Van de Hulst [56]. In thissection only the results, obtained by Mie [27] have been stated; for a derivation thereader is referred to the cited sources.
The power S of light incident per unit area, normal to the direction of incidenceis
S ¼ E20
�2
� �em
�lm
� �1=2; ð2:92Þ
where E0 is the amplitude of the electric vector, and em/emlm.lm are the dielectricand magnetic permittivity of the medium.
The scattered power Ws is given by
Ws ¼ pE2
0
k2m
em
�lm
� �1=2Xn¼1
n¼1
ð2nþ 1Þ an
�� ��2þ bn
�� ��2 �
ð2:93Þ
where km = 2p/km.km is the wavelength of the incident radiation in the medium in which the
sphere is situated,
an ¼ �lsjnðNqÞ½qjnðqÞ�
0 � lmjnðqÞ½NqjnðNqÞ�0
lsjnðNqÞ½qhð1Þn ðqÞ�0 � lmhð1Þn ðqÞ½NqjnðNqÞ�0; ð2:94aÞ
Bn ¼ �lsjnðqÞ½NqjnðNqÞ�0 � lmN2jnðNqÞ½qjnðNqÞ�0
lshð1Þn ðqÞ½NqjnðNqÞ�0 � lmN2jnðNqÞ½qhð1Þn ðqÞ�0
; ð2:94bÞ
q = kma, N is the complex refractive index of the sphere, relative to themedium
jnðxÞ ¼ ðp=2xÞ1=2Jnþ1=2ðxÞ;
Jm(x) is the Bessel function of order m,
hð1Þn ðxÞ ¼ ðp=2xÞ1=2Hð1Þnþ1=2ðxÞ;
and Hn+1/2(1) (x) is Henkel function.
The sum of absorbed and scattered power Wt is given by
76 2 Electron Emission from Dust

Wt ¼pE2
0
k2m
em
lm
� �1=2
ReXn¼1
n¼1
ð2nþ 1Þðan þ bnÞ( )
ð2:95Þ
The efficiency factors for scattering QS and for scattering cum absorption (total)Qt are defined as
QS ¼ ðWs=pa2SÞ ð2:96aÞ
and
Qt ¼ ðWt=pa2SÞ ð2:96bÞ
The efficiency factor corresponding to absorption Qa is given by
Qa ¼ Qt � Qs ð2:96cÞ
The parameters Qa, Qs and Qt have been tabulated in two books. (NationalBureau of Standards 1940 and Wickramasinghe [61]).
A user friendly Mie Calculator, made available by Scott Prahl (on website:http://omlc.ogi.edu/calc/mie_calc.html); may be used for computation of Qa, Qs
and Qt. Values corresponding to ice and silicates have been tabulated by Dorschner[6].
Appendix A
Electron Transmission Coefficient Across a Negatively ChargedCylindrical Surface (After Mishra et al. [28], Sodha and Dubey[45])
Sodha and Dixit [42] have evaluated the tunneling probability of an electron in thecase of a negatively charged cylindrical surface by following a formalism, pro-posed by Ghatak et al. [16] and [35]. This approximation is better than Born’sapproximation, but it is not valid when Er [ 0.7 Vs. In this section, the case of thecylindrical surface is analyzed on the same lines as in the case of spherical surface.
Assuming that the electron potential energy is zero at r C kD, the electronpotential energy in and out of the surface is given by
tðqÞ ¼ ðts � 1Þ for q\1 ðRegion-IÞ ð2:97aÞ
tðqÞ ¼ tsln½ld=q�
ln½ld�
� �exp½�ðq� 1Þ=ld� for 1\q\qn ðRegion -IIÞ ð2:97bÞ
and
2.9 Mie’s theory of Light Scattering by Spherical Particles 77
tðqÞ ¼ 0 for q [ qn ðRegion-IIIÞ ð2:97cÞ
where t(qn) = 0.05 ts and the symbols are the same as in the case of a sphericalsurface.
Substituting in
W ¼ r1=2wðrÞ expðinhÞ expðiczÞ;
time independent Schrödinger’s equation, interpreting n and c in term of the h andz component of the linear momentum of an electron, one obtains [45]
d2wdr2þ 8p2me
h2ðEr � VðrÞÞw ¼ 0
or
d2wdq2þ bðer � tðqÞÞw ¼ 0
where the nomenclature is the same as in the spherical case.Substituting for t(q) from (2.97) in the above equation one obtains
d2wdq2þ bðer � ts þ 1Þw ¼ 0 for q\1 ðRegion-IÞ; ð2:98aÞ
d2wdq2þ b er � ts
ln½ld=q�ln½ld�
� �exp½�ðq� 1Þ=ld�
� �w ¼ 0 for 1\q\qn
ðRegion -IIÞð2:98bÞ
and
d2wdq2þ berw ¼ 0 for q[ qn ðRegion -IIIÞ: ð2:98cÞ
It may be noticed that the dependences of t(q) on q, are very close (for ld [ 5)for the spherical and cylindrical surfaces, corresponding to the regions when1 \q\ 3 and ts \ t(q) \ 0.2 ts. Since these are the main regions, contributing tothe transmission probability the er dependence of De(er) and Da(er) should also bealmost the same in the two cases. Hence, the electron current for given ts, ld anda will also be the same in both cases. Computations for the two cases support thisconclusion.
78 2 Electron Emission from Dust

Appendix B
Secondary Emission from Cylindrical Particles
Chow et al. [4] have analyzed secondary electron emission from a cylindrical grainon account of the incidence of a high energy beam of (primary) electrons, prop-agating in a direction parallel to the axis of the grain. This restriction puts a severelimitation on the application of this model to complex plasma kinetics.
The phenomenon of secondary electron emission from the surface of an infi-nitely long cylindrical grain for oblique incidence of primary electrons has beenanalyzed herein. Specifically, the ratio d0 of the number of emitted secondaryelectrons to that of accreting incident primary (high energy) electrons has beenevaluated for an electrically neutral particle. The multiplying factor for a chargedparticle has been given. For typical parameters, numerical results have beenobtained and discussed.
Consider the incidence of a uniform electron beam on an infinitely long cyl-inder, with its axis at an angle k with the direction of propagation of the beam.Fig. A.1 represents the cross section of the cylinder at an angle k to the axis, whichis an ellipse with semi major axis acosec k and semi minor axis a, where a is theradius of the cylinder; the primary electrons travel along chords, parallel to themajor axis. Thus, the typical path of a primary electron is AB, parallel to the majoraxis at a distance q from the center O.
Using simple coordinate geometry
AB ¼ 2ða2 � q2Þ1=2co sec k ¼ 2x1: ðA1Þ
The distance r1 of point P from the axis of the cylinder is given by
r21 ¼ ðx1 � xÞ2sin2kþ q2 ðA2Þ
where (x1 - x)sink is the projection of (x1 - x)on a plane, normal to the axis.If one chooses a system of coordinates with P (at a distance r1 from the axis) as
origin, U = 0 as the perpendicular from P on the axis and h = 0 in the planehaving P and normal to the axis, the distance l of any point on the cylinder to P canbe shown to be given by
l ¼ ðr21 þ a2
1 þ 2r1acosuÞ1=2co sec h ðA3Þ
Equations (2.56) and (2.57) are valid in this case also, where l is given by (A3).The number of secondary electrons generated by a primary electron in motion
along AB is
FðqÞ ¼ ð1� gseÞZ X
0dns ¼ ð1� gseÞ
Ka1=2
2
Z X
0ðxm � xÞ�1=2f ðx; qÞdx; ðA4Þ
where
2.9 Mie’s theory of Light Scattering by Spherical Particles 79

X ¼ 2x1 if xm [ 2x1or q[ qm; ðA5aÞ
X ¼ xm if xm\2x1 or q\qm; ðB5bÞ
2x1 is given by (A1).gse is sticking coefficient of electrons on the particle surface and
q2m ¼ a2 � ðxmsink=2Þ2 ðA5cÞ
If xm \ 2acosec k, qm is real and positive and the limits of x are obtained from(A5a) and (B5b) and if xm [ 2acosec k, the limits are given by (A5a).
Hence, the mean number of secondary electrons d0(k) generated by the motionof a primary electron in the cylindrical particle
d0ðkÞ ¼ ð1=2aÞZ a
�aFðqÞdq ¼ ð1=aÞ
Z a
0FðqÞdq ðA6Þ
where F(q) is given by (A4).The corresponding mean number of electrons stuck (xm \ 2x1) per primary
electron is given by
dstðkÞ ¼ ð1� gseÞð2qm=2aÞ ¼ ð1� gseÞðqm=aÞ ðA7Þ
In case the particle is at an electric potential Vs with respect to the surroundingsone has (Sodha et al. 2005)
dðts; kÞ ¼ d0ðkÞ for ts� 0 ðA8aÞ
and
dðts; kÞ ¼ expð�tsÞfð2=p1=2Þt1=2s þ expðtsÞerfcðt1=2
s Þgd0ðkÞ for ts\0 ðA8bÞ
where ts = eVs/kTs, e is the electronic charge, k is Boltzmann’s constant and Ts isthe temperature of the particle.
In general, the angle k, between the incoming electron direction and the axis ofthe cylinder varies at random. Hence
d0 ¼Z p=2
0d0ðsin k=2Þdk ðA9aÞ
Fig. A.1 Oblique incidenceof electrons on a cylindricalparticle
80 2 Electron Emission from Dust

and
dst ¼Z p=2
0dstðsink=2Þdk ¼ ðð1� gseÞ=aÞ
Z p=2
0qmðsink=2Þdk; ðA9bÞ
where (sink/2)dk is the solid angle contained between cones making angle betweenk and (k ? dk) with the axis divided by 4p.
From (8Aa) and (8Ab), one can write
dðtsÞ ¼ d0 for ts� 0 ðA8cÞ
and
dðts; kÞ ¼ expð�tsÞfð2=p1=2Þt1=2s þ expðtsÞerfcðt1=2
s Þgd0ðkÞ for ts\0: ðA8dÞ
The energy (kTe) distribution of the electrons incident on the particle per unittime is given by
neðtpÞdtp ¼ palð2kTe=mpÞ1=2neðtp � tsÞ expð�tpÞdtp; ð2:10Þ
where tp = (VP/kTe).Hence, the number of secondary electrons emitted by the particle per unit time
is
nsee ¼Z 1
0neðtpÞdðts; tpÞdtp for ts\0 ð2:11aÞ
and
nsee ¼Z 1
ts
neðtpÞdðts; tpÞdtp for ts� 0: ð2:11bÞ
The number of electrons stuck in the particles per unit time is
nStuck ¼Z t0
0ne tp
� ��dst tp
� �dtp for ts\0 ð2:12aÞ
nStuck ¼Z t0
ts
ne tp
� ��dst tp
� �dtp for ts� 0 ð2:12bÞ
where
t0 ¼ V 0=kTe ¼ ts Ts=Teð Þ þ 2aaco sec kð Þ1=2=kTe
h i; ð2:12cÞ
corresponding to the primary electron energy needed to traverse a distance2acoseck; in other words,
xm V 0ð Þ ¼ 2acoseck:
2.9 Mie’s theory of Light Scattering by Spherical Particles 81
References
1. S. Agarwal, S. Misra, S.K. Mishra, M.S. Sodha, Can. J. Phys. 90, 265 (2012)2. C.N. Berglend, W.E. Spicer, Phys. Rev. 4A, A1030 (1964)3. H. Bruining, Thesis, Leydew, Die Sekandar-Electron Emission Festa Korper, (Springer
Berlin, 1942). p. 604. V.W. Chow, M. Rosenberg, Planet. Space Sci. 43, 613 (1995)5. V.W. Chow, D.A. Mendis, M. Rosenberg, J. Geophys. Res. 98, 19065 (1993)6. J. Dorschner, Astron. Nachr. Bd. 292, H. 2 (1970)7. B.T. Draine, Astrophys. J. Suppl. Ser. 36, 595 (1978)8. B.T. Draine, B. Sutin, Astrophys. J. 320, 803 (1987)9. J.W. Dewdney, Phys. Rev. 125, 399 (1962)
10. P.K. Dubey, J. Phys. D 3, 145 (1970)11. L.A. Dubridge, Phys. Rev. 43, 727 (1933)12. R.G. Forbes, J.H.B. Deane, Proc. Roy. Soc. Lond. A467, 2927 (2011)13. R.H. Fowler, Phys. Rev. 38, 45 (1931)14. R.H. Fowler, Statistical Mechanics: The Theory of the Properties of Matter in Equilibrium
(Cambridge University Press, London, 1955)15. R.H. Fowler, L.W. Nordheim, Proc. Roy. Soc. Lond. A112, 781 (1928)16. A. Ghatak, R.L. Gallawa, I.C. Goyal, IEEE J. Quat. Electr. 28, 400 (1992)17. A. Ghatak, S. Lokanathan, Quantum Mechanics, Theory and Applications (Macmillan, New
Delhi, 2005)18. O. Hachenberg, W. Brauer, Adv. Electron Phys. 11, 413 (1959)19. C. Herring, M.H. Nichols, Rev. Mod. Phys. 21, 185 (1949)20. J.H. Jonker, Phillips Res. Repts. 7, 1 (1952)21. K. Iwami, A. Iuzuka, N. Umeda, J. Vac. Sci. Technol. B, 29, 028103 (2011)22. R.O. Jenkins, W.G. Trodden, Electron and Ion Emission from Solids (Dover Publications,
New York, 1965)23. S. Kher, A. Dixit, D. N. Rawat, M.S. Sodha Appl. Phys. Lett. 96, 044101 (2010)24. B.A. Klumov, S.I. Popel, R. Bingham, JETP Lett. 72, 364 (2000)25. D.R. Lide, Editor-in-chief, CRC Handbook of Chemistry and Physics, 89th edn. (CRC Press,
New York, 2008–2009)26. N. Meyer Vernet, Astron. Astrophys. 105, 98 (1982)27. G. Mie, Ann. Physik [4], 25, 377 (1908)28. S.K. Mishra, S. Misra, M.S. Sodha, Phys. Plasmas 19, 073705 (2012)29. S.K. Mishra, M.S. Sodha, S. Srivastava, Astrophys. Space Sci. 344, 193 (2013)30. S. Misra, M.S. Sodha, Can. Phys. Under publication31. S. Misra, S.K. Mishra, M.S. Sodha Phys. Plasma 20, 013702 (2013)32. L.W. Nordheim, Proc. Roy. Soc. Lond. A121, 788 (1928)33. L. Page, N.I. Adams, Principles of Electricity (D Van Nostranel, New York, 1931). p. 10334. G. Prakash, Can. J. Phys. 8, 617 (2010)35. S. Roy, A.K. Ghatak, I.C. Goyal, IEEE J. Quant. Electr. 29, 340 (1993)36. W. Schottky, Z. Phys. 14, 63 (1923)37. F. Seitz, Modern Theory of Solids (Mc Graw Hill Book Co., New York, 1940)38. M.S. Sodha, J. Appl. Phys. 32, 2059 (1961)39. M.S. Sodha, Brit. J. Appl. Phys. 14, 172 (1963)40. M.S. Sodha, A. Dixit, J. Appl. Phys. 104, 064909 (2008)41. M.S. Sodha, A. Dixit, S. Srivastava, Appl. Phys. Lett. 94, 251501 (2009a)42. M.S. Sodha, A. Dixit, J. Appl. Phys. 105, 034909 (2009b)43. M.S. Sodha, A. Dixit, S.K. Agarwal, Can. J. Phys. 87, 175 (2009c)44. M. S. Sodha, A. Dixit, S. Srivastava, Phys. Rev. E 79, 046407 (2009d); erratum E 80, 06990
(2010)45. M.S. Sodha, P.K. Dubey, Brit. J. Appl. Phys. D 2, 1617 (1969)
82 2 Electron Emission from Dust
46. M.S. Sodha, S. Guha, Physics of Colloidal Plasmas, vol. 4 eds. by A. Simon, W.B. Thompson.In Advances Plasma Physics (InterScience New York, 1971). pp. 219–369
47. M.S. Sodha, P.K. Kaw, Brit. J. Appl. Phys. D 1, 1303 (1968)48. M.S. Sodha, S.K. Mishra, Phys. Plasmas 18, 083708 (2011)49. M.S. Sodha, S.K. Mishra, S. Misra, Phys. Plasmas 16, 123701 (2009e)50. M.S. Sodha, S. Sharma, Brit. J. Appl Phys. D 18, 1127 (1967)51. M.S. Sodha, S. Srivastava, Phys. Lett. A 374, 4733 (2010)52. W.E. Spicer, Phys. Rev. 112, 114 (1958)53. W.E. Spicer, A Herrara-Gomez, Modern Theory and Applications of Photocathodes. Paper
Presented at SPIE’s International Symposium on Optics, Imaging and Instrumentation, SanDiego, CA, July 11–16, 1993; SLAC-PUB-6306;SLAC/SSRL-0042, August 1993 (A-SSRL-H)
54. J.A. Stratton, Electromagnetic Theory (Mc Graw Hill, New York, 1941), pp. 563–57355. E.J. Sternglass, Scientific Paper 1773 (Westinghouse Research lab, Pittsburgh, 1954)56. H.C. Van de Hulst, Light Scattering by Small Particles (Wiley, New York, 1957)57. W.D. Watson, Astrophys. J. 176, 103 (1972)58. W.D. Watson, J. Opt. Soc. Am. 63, 164 (1973)59. R. Whiddington, Proc. Roy. Soc. A86, 360 (1912)60. E.C. Whipple, Rep. Prog. Phys. 44, 1197 (1981)61. N.C. Wikramsinghe, Light Scattering Functions for Small Particles (Wiley, New York, 1973)62. M. Born, E. Wolf, Principles of Optics, Chapter XIII, McMillan, New York (1964)63. R.M. Goody, Atmospheric Radiation I. Theoretical Basis, Chapter 7, Oxford University Press
(Clarendon, London and New York , 1964)64. L. Spitzer, Astrophys. J. 93, 369 (1948)65. B.T. Draine, E.E. Salpeter, Astrophys. J. 231, 77 (1979)66. J.L. Puget, A. Leger, Ann. Rev. Astron. Astrophys. 27, 161 (1989)67. R.Z. Sagdeev, E.N. Evlanov, M.N. Formenkova, O.F. Prilutskii, B.V. Zubov, Adv. Space
Res. 9, 263 (1989)68. M.M. Abbas, D. Tankosio, P.D. Craven, A.C. McClair, J.F. Spann, Astrophys. J. T18, 795
(2010)
References 83

Chapter 3Accretion of Electrons/Ions on DustParticles
Orbital ModelOrbital model is the simplest model of accretion of electrons/ions on dust particlesand the results have been used extensively in complex plasma kinetics. The modelassumes that the number of collisions with gaseous species, suffered by ions/electrons is negligible as compared to the number of accretions on the dust par-ticles. It is also of interest to realize that from classical considerations the resultsfor a monotonically varying electric potential around a charged particle do notdepend on the nature of the variation but only on the electric potential of theparticle with reference to the free plasma. Quantum effects, charge exchange ioncollisions with neutral atoms and ion trapping also play an important role inaccretion, which has been highlighted.
3.1 Classical Rate of Accretion of Electrons/Ionson Spherical and Cylindrical Particles(After Mott-Smith and Langmuir [13])
3.1.1 General Considerations
Consider (1) a spherical particle of radius a and (2) a cylindrical particle of radius aand length lð� aÞ in a plasma, with electron/ion density n, charge q (þe for ions and�e for electrons), temperature T with suffixes e and i referring to electrons and ions;the particle is at an electric potential Vs=q with respect to the plasma. Also consider aconcentric sphere or coaxial cylinder of radius b ðb� aÞ, such that the electric fieldand electric potential due to the charged particle is zero for r [ b.
Let u and t denote the radial and tangential components of the electron/ionvelocity and let u be taken as positive when directed toward the center/axis of theparticle. The number of electrons/ions, having radial velocity between u and uþdu and tangential velocity between t and tþ dt, which cross the surface r ¼ b, perunit time is
M. S. Sodha, Kinetics of Complex Plasmas, Springer Series on Atomic,Optical, and Plasma Physics 81, DOI: 10.1007/978-81-322-1820-3_3,� Springer India 2014
85

Sb u n f ðu; tÞdu dt ð3:1Þ
where nf ðu; tÞdu dt is the number of electrons/ions per unit volume having radialand tangential velocity components between u and uþ du and t and tþ dt, atr ¼ b, where the electric field/potential due to the particle is zero and Sb is the areaof the surface at r ¼ b; Sb ¼ 4pb2 for the sphere and 2pbl for the cylinder. Thenature of f ðu; tÞ has been discussed later (refer to 3.8a, 3.8b and 3.9).
If ua and ta denote the radial/tangential components of the electron/ion velocityat the surface of the particle r ¼ a, the conservation of energy and angularmomentum requires
Vs þm
2ðu2
a þ t2aÞ ¼
m
2ðu2 þ t2Þ ð3:2aÞ
and
ata ¼ bt ð3:2bÞ
where m is the mass of the electron/ion.From (3.2a) and (3.2b) one obtains
u2a ¼ u2 � ðb2=a2 � 1Þt2 � ð2Vs=mÞ: ð3:3Þ
It may be noted that only those electrons/ions will reach the surface of theparticle r ¼ a for which
u [ 0 ð3:4aÞ
and
u2a [ 0: ð3:4bÞ
The minimum value of u, corresponding to u2a [ 0 and t ¼ 0 is from (3.3) given
by
u2m ¼ ð2Vs=mÞ: ð3:5aÞ
When Vs is positive, um is the positive square root of ð2Vs=mÞ; in case Vs isnegative, um ¼ 0 in view of the inequality (3.4a).
For a given value of u, the maximum value of t2 viz. t21 corresponds to u2
a ¼ 0and is from (3.3) given by
t21 ¼ ðu2 � ð2Vs=mÞÞðb2=a2 � 1Þ�1: ð3:6aÞ
By choice of b� a, t1
�� ��� u:Without detriment to the evaluation of the rate of accretion of electrons and
ions one can choose a large value of b� a such that
t21 ¼ ða2=b2Þðu2 � ð2Vs=mÞÞ ð3:6bÞ
86 3 Accretion of Electrons/Ions on Dust Particles

and hence
mt21=2kBTeÞ � 1 ð3:6cÞ
From (3.1), the number of electrons/ions incident on the surface of the particleper unit time or the accretion current is given by
nc ¼ Sbn
Z1
um
Zt2¼t2
1
t2¼0
uf ðu; tÞdu dt ð3:7Þ
3.1.2 Function f ðu; tÞ for Maxwellian Distributionof Velocities
The Maxwellian distribution of electron/ion velocities c may be expressed as
f ðcx; cy; czÞdcxdcydcz ¼ ðm=2pkBTeÞ3=2exp½�ðm=2kBTÞðc2
x þ c2y þ c2
z Þ�dcxdcydcz
ð3:8aÞ
Since in the case of a cylindrical particle with axis along z axis cz is notrelevant, the distribution function may be expressed in terms of u and t by inte-grating the above distribution with respect to cz in the limits �1; thus
f ðu; tÞdudt ¼ ðm=2pkBTeÞ exp½�ðm=2kBTeÞðu2 þ t2Þ�dudt ð3:8bÞ
where u ¼ cx and t ¼ cy.For the spherical case, both the tangential components are effective and we may
replace dcx by du and dcydcz by 2ptdt; hence
f ðu; tÞdudt ¼ 2pðm=2pkBTeÞ3=2t exp½�ðm=2kBTeÞðu2 þ t2Þ�dudt ð3:9Þ
where u ¼ cx and t is the resultant of cy and cz.Equation (3.9) has been obtained by putting 2ptdt as the first integral of dcxdcy
where cx and cy are the two tangential components of the electron/ion velocity; thisimplies that t is positive.
3.1.3 Spherical Particles
From (3.7) and (3.9), one obtains
3.1 Classical Rate of Accretion of Electrons/Ions 87

nc ¼ n � 4pb2
� 2pðm=2pkBTeÞ3=2Z1
um
u exp½�ðmu2=2kBTeÞ�du
Zt2¼t2
1
t2¼0
t exp½�ðmt2=2kBTeÞ�dt
ð3:10Þ
Since ðmt21=2kBTeÞ � 1 (by the choice of b� a), expð�mt2
1=2kBT Þ � 1 and(3.10) reduces to
nc ¼ n � 8p2b2ðm=2pkBTeÞ3=2 R1
0uðt2
1=2Þ exp½�ðmu2=2kBTeÞ�du.
Substituting for t21 from (3.6b) in the above equation
nc ¼ n � 4p2a2ðm=2pkBTeÞ3=2Z1
um
uðu2 � 2Vs=mÞ exp½�ðmu2=2kBTeÞ�du
¼ n � pa2ð8kBTe=pmÞ1=2Z1
erm
ðer � tsÞ expð�erÞder
ð3:11aÞ
where er ¼ ðmu2=2kBTeÞ is the dimensionless radial energy of the electrons/ionsand ts ¼ Vs=kBTe.
Further for ts [ 0, erm ¼ ts and (3.11a) reduces to
nc ¼ n � pa2ð8kBTe=pmÞ1=2expð�tsÞ ð3:11bÞ
and for ts\0, erm ¼ 0 and (3.11b) reduces to
nc ¼ n � pa2ð8kBTe=pmÞ1=2ð1� tsÞ ð3:11cÞ
Remembering that when t is positive, the mean energy of the accretingelectrons/ions, when these are far away r � b can from (3.7) and (3.9) beexpressed as
ncEc ¼n � 4pb2 � 2pðm=2pkBTeÞ3=2
Z1
um
u exp½�ðmu2=2kBTeÞ�du
Zt2¼t2
1
t2¼0
tm
2ðu2 þ t2Þ exp½�ðmt2=2kBTeÞ�dt:
Remembering that u� t1, ðmt2=2kBTeÞ\ðmt21=2kBTeÞ � 1, and
expð�mt21=2kBTeÞ �1; the above equation reduces to
ncEc ¼ n � 8p2b2ðm=2pkBTeÞ3=2Z1
um
u3 exp½�ðmu2=2kBTeÞ�m
2t2
1
2du:
88 3 Accretion of Electrons/Ions on Dust Particles

Substituting for v21 corresponding to b� a from (3.6a)
ncEc ¼ n � 8p2a2ðm=2pkBTeÞ3=2Z1
um
u3 exp½�ðmu2=2kBTeÞ�m
4ðu2 � 2qVs=mÞdu
¼ n � pa2kBTð8kBTe=mpÞ1=2Z1
erm
erðer � tsÞ expð�erÞder
ð3:12aÞ
For ts [ 0 erm ¼ ts and substituting for nc from (3.11b) in the above equationone obtains
Ec ¼ ð2þ tsÞkBTe ð3:12bÞ
For ts\0, erm ¼ 0 and
Ec ¼ ½ð2� tsÞ=ð1� tsÞ�kBTe ð3:12cÞ
The rates of accretion of electrons and ions and the corresponding mean energyare given by putting the electron/ion mass and temperature and density for m, Tand n. Further ts ¼ Vs=kBTe and is positive if the dust particle and the accretingparticle (electron/ion) have like charges and negative for a combination of unlikecharges.
3.1.4 Alternate Derivation for Spherical Particles
Consider the grazing incidence of an electron/ion on the dust particle and let r0 bethe perpendicular distance of the path of electron/ion at large distance ðV ¼ 0Þfrom the center of the particle. The conservation of energy and angular momentumrequires
Vs þ ðmc2a=2Þ ¼ mc2=2
and aca ¼ r0c; where c is the speed of electron/ion at larger distance and ca is thegrazing speed.
From the above equations the accretion cross-section QðcÞ is given by
QðcÞ ¼ pr20 ¼ pa2½1� 2Vs=mc2�
and the rate of accretion is given by
3.1 Classical Rate of Accretion of Electrons/Ions 89

nc ¼ n
Z Z ZcQðcÞf ðcÞdcxdcydcz
¼ n
Z1
um
4pc3QðcÞf ðcÞdc
ð3:11dÞ
where f ðcÞ ¼ ðm=2pkBTeÞ3=2exp½�ðmc2=2kBTeÞ�
Similarly
ncEc ¼ n
Z1
um
4pc3ðmc2=2ÞQðcÞf ðcÞdc ð3:12dÞ
Substituting for f ðcÞ and QðcÞ one obtains (3.11b), (3.11c), (3.12d) and (3.12c).
3.1.5 Flowing Plasma
There are some situations, when the electrons/ions flow past the dust particles witha velocity C, much less than the mean electron speed but comparable to the meanion speed. This affects the ion flux nic on the particle and Eic the mean energy ofthe accreting ions; these parameters have been evaluated by Mishra et al. [8] from(3.11d) and (3.12d) by substituting the following expression for f ðcÞ, corre-sponding to a displaced Maxwellian distribution:
f ðcÞ ¼ ðmi=2pkBTiÞ3=2exp½�ðmi=2kBTiÞðc� CÞ2�
Expressions for nic and Eic thus obtained corresponding to Vs\0 and Vs [ 0 arein terms of error functions. The distribution function averaged over all values ofthe angle between c and C can be shown to be given by
f ðcÞ ¼ ðmi=2pkBTiÞ3=2ðkBTi=micCÞfexp½�ðmi=2kBTiÞðc� CÞ2�� exp½�ðmi=2kBTiÞðcþ CÞ2�g
3.1.6 Cylindrical Particles
From (3.7) and (3.8a, 3.8b), the rate of accretion of charged particles (electrons/ions) is given by
90 3 Accretion of Electrons/Ions on Dust Particles

nc ¼ n � ð4pblÞ � ðm=2pkBTÞZ1
um
u exp½�ðmu2=2kBTÞ�du
Zt1
�t1
exp½�ðmt2=2kBTÞ�dt
ð3:13aÞ
For b� a, ðmt21=2kBTÞ (and hence mt2=2kBT)� 1 and expð�mt2
1=2kBTÞ maybe put as unity; thus the above equation reduces to
nc ¼ n � ð2pblÞ � ðm=2pkBTÞZ1
um
2ut1 exp½�ðmu2=2kBTÞ�du: ð3:13bÞ
Substituting for t1 from (3.13b) in the above equation b� a one obtains
nc ¼ n � ð2alÞ � ð2kBT=mÞ1=2Z1
erm
ðer � tsÞ1=2
expð�erÞder ð3:13cÞ
For ts [ 0, erm ¼ ts, (3.13b) simplifies to
nc ¼ nal � ð2pkBT=mÞ1=2expð�tsÞ ð3:13dÞ
For ts\0, erm ¼ 0 and (3.13b) simplifies to
nc ¼ nal � ð2pkBT=mÞ1=2 ð2=ffiffiffippÞ ffiffiffiffiffiffiffiffi�tsp þ expð�tsÞerfcð ffiffiffiffiffiffiffiffi�ts
p Þ� ffi
ð3:13eÞ
where the complementary error function erfc(x) is defined as
erfcðxÞ ¼Z1
x
expð�t2Þdt:
The mean energy Ec of the accreting electrons far away from the particleðr [ bÞ is (in a way to similar to that for spherical potential) given by
ncEc ¼ n � ð2pblÞ � ðm=2pkBTÞZ1
um
mu2
22ut1 exp½�ðmu2=2kBTÞ�du
¼ n � ð2alÞ � ð2kBT=mÞ1=2kBT
Z1
erm
erðer � tsÞ1=2
expð�erÞder
ð3:14aÞ
Hence including the axial energy, corresponding to the component of themomentum along the axis of the cylinder (z- axis) viz. kBT=2, which is unaffectedby the electric field (normal to the z-axis) the mean energy of the electrons, faraway ðr [ bÞ from the axis is given by
3.1 Classical Rate of Accretion of Electrons/Ions 91

ec ¼ ½Ec þ ðkBT=2Þ�=kBT
¼ 1=2þZ1
erm
erðer � tsÞ1=2
expð�erÞder
,Z1
erm
ðer � tsÞ1=2
expð�erÞderð3:14bÞ
For ts\0, erm ¼ ts and (3.14b) simplifies to
ec ¼ 1=2þ ð1=2Þ ð6=ffiffiffippÞ ffiffiffiffiffiffiffiffi�vsp þ ð3� 2
ffiffiffiffiffiffiffiffi�vsp Þ expð�vsÞerfcð ffiffiffiffiffiffiffiffi�vs
p Þ� ffi
�ð2=
ffiffiffippÞ ffiffiffiffiffiffiffiffi�vsp þ expð�vsÞerfcð ffiffiffiffiffiffiffiffi�vs
p Þ� ffi
¼ ð4=ffiffiffippÞ ffiffiffiffiffiffiffiffi�vsp þ ð2� ffiffiffiffiffiffiffiffi�vs
p Þ expð�vsÞerfcð ffiffiffiffiffiffiffiffi�vsp Þ
� ffi
�ð2=
ffiffiffippÞ ffiffiffiffiffiffiffiffi�vsp þ expð�vsÞerfcð ffiffiffiffiffiffiffiffi�vs
p Þ� ffi
ð3:14cÞ
Further for ts [ 0, erm ¼ 0 and (3.14b) leads to
ec ¼ 1=2þZ1
0
erðer � tsÞ1=2
expð�erÞder
,Z1
0
ðer � tsÞ1=2
expð�erÞder ð3:14dÞ
ec ¼ 1=2þ ð1=2Þð3þ 2tsÞ¼ ð2þ tsÞ
ð3:14eÞ
There are alternate ways to derive (3.11b), (3.11c), (3.12b), (3.12c), (3.13d),(3.13e), (3.14c) and (3.14d), but the present treatment is a rigorous one. Theseequations are applicable to both electrons and ions, when corresponding values ofelectron and ion parameters are substituted. One has to remember that ts [ 0, for(i) electrons and negative electric potential on the surface and (ii) ions and positiveelectric potential on the surface. Further ts\0 corresponds to (i) electrons andpositive electric potential on the surface and (ii) ions and negative electricpotential on the surface.
It may be added that for ts [ 0, the maximum of the potential energy of anelectron gets reduced on account of the image force on an electron by an amountDVs ¼ Du, tabulated in Table 2.5. Thus for negatively charged particles oneshould use Vs � DVs in place of Vs in the expressions.
3.2 Quantum Effects in Electron Accretion on the Surfaceof Charged Particles (After Mishra et al. [12])
3.2.1 General Remarks
The classical theory of electron accretion on a charged particle, presented in thepreceding sections is based on the implicit assumption that the transmissioncoefficient of plasma electrons through the surface of the particle is unity whener [ ts and zero, when er\ts. Such an assumption is valid in classical physics but
92 3 Accretion of Electrons/Ions on Dust Particles

it breaks down when quantum mechanical considerations are taken into account.Although the quantum effects have been appreciated to some extent in the case ofelectron emission, particularly in the context of electric field emission, the reverseprocess viz. the tunneling of plasma electrons into the bulk of a negatively chargedparticle has been investigated only recently [10, 12, 15, 17, 18].
In contrast to the usual expressions, an expression for the transmission coeffi-cient of electrons across a charged metallic surface, based on the three regionmodel has been derived in Sect. 3.2.2; the results and a commentary thereon is alsoavailable in the same section.
3.2.2 Quantum Effects in Electron Accretion
Following the derivations in Sect. 3.1 and introducing the coefficient of tunnelingaccretion DaðerÞ, the rate of accretion on a negatively charged surface is given by
nec ¼ pa2ð8kBTe=mpÞ1=2Z
DaðerÞexp½�er�der;
where er ¼ Er=Wa, er ¼ Er=kBTe;, ðer ¼ g0erÞ and ðg0 ¼ Wa=kBTeÞ:The rate of classically allowed (er [ t0s ¼ VS=Wað Þ ¼ ts=g0) and tunneling
accretion are given by
necc ¼ pa2ð8kBTe=mpÞ1=2g0Z1
t0s
DaðerÞexp½�g0er�der
¼ nc0g0Z1
t0s
DaðerÞexp½�g0er�der ð3:15aÞ
nect ¼ pa2ð8kBTe=mpÞ1=2g0Zt0s
0
DaðerÞexp½�g0er�der
¼ nc0g0Zt0s
0
DaðerÞexp½�g0er�der ð3:15bÞ
and
nec ¼ necc þ nect ð3:15cÞ
where nc0 is the rate of accretion on an uncharged particle.
3.2 Quantum Effects in Electron Accretion 93

In semiclassical treatment DaðerÞ is usually taken to be unity; in this limit(3.15a) reduces to
nec0 ¼ nc0exp �g0t0s� ffi
¼ nc0exp �ts½ �:
The corresponding mean radial energies of the accreting electrons are given by
neccerecc ¼ nc0g0Z1
t0s
erDaðerÞexp½�g0er�der ð3:16aÞ
and
necterect ¼ nc0g0Zt0s
0
erDaðerÞexp½�g0er�der ð3:16bÞ
To get the total mean energy of accreting electrons, one has to add the meantransverse energy of electrons kBTe to er. Thus
eec ¼ eecr þ kBTe; ð3:16cÞ
where
eecr ¼ ½neccerecc þ necterect�=nec
Figure 3.1a illustrates the dependence [12] of the transmission coefficient[DeðerÞ&DaðerÞ] on the radial energy of electrons er as a function of t0s (surfacepotential). It is seen from Fig. 3.1a that the transmission coefficient [i.e., DðerÞ]increases monotonically with increasing er and t0s, and approaches unity asymp-totically for large er. The electrons in the curves corresponding to the region er\t0scontribute to electron emission through tunneling (electric field emission) whilethe rest (i.e., er [ t0s) correspond to classically allowed emission; the brokencurves correspond to transmission coefficient for step potential barrier [D0ðerÞ]corresponding to t0s (when Wa is substituted by ðWa � VsÞ).
The effect of parameter g0ð¼ Wa=kTeÞ on accretion current has been illustratedin Fig. 3.1b, which suggests that the accretion current through tunneling (nect=nec0)initially increases with increasing t0s till g0t0s [ 1 and then decreases with furtherincrease in t0s. This can be understood in terms of the larger availability of elec-trons for accretion through tunneling in case of g0t0s [ 1 and increasing barrierwidth with increasing surface potential. The figure also indicates that the contri-bution of tunneling accretion to be accretion current increases with increasing g0;this is primarily because of larger availability of low energy electrons for tunnelingthrough accretion. On the other hand, the accretion current (necc=nc0) graduallydecreases with increasing t0s and g0, as indicated in Fig. 3.1c. It is seen that withquantum mechanical considerations that the accretion current gets significantlymodified with respect to usual semiclassical treatment [i.e., DaðerÞ ¼ 1]. The
94 3 Accretion of Electrons/Ions on Dust Particles

Fig. 3.1 a Dependence of transmission coefficient [De(er) or Da(er)] on er for ld = (kD/a) = 5and b = 1000. The labels on the curves p, q, r, s, and t correspond to t0s = 0.5, 1.0, 1.5, 2.0, and3.0, respectively. The solid curves correspond to the present analysis while the dashed curvesrefer to the step potential barrier of height (1 - t0s) (after Mishra et al. [12], curtsey authors andpublishers AIP). b Dependence of (nect/nc0) and erect with dimensionless surface potential (t0s),for a = 10 nm, and ld = 5. The labels on the curves p, q, r, s and t correspond to g0 = 0.5, 1.0,1.25, 2.0, 5.0, and 10.0, respectively. Solid and broken lines correspond to left and right handscale respectively (after Mishra et al. [12], curtsey authors and publishers AIP). c Dependence of(necc/nc0) and erecc with dimensionless surface potential (t0s), for a = 10 nm, and ld = 5. Thelabels on the curves p, q, r, s and t correspond to g0 = 0.5, 1.0, 1.25, 2.0, 5.0 and 10.0respectively. Solid/dotted lines on left hand scale refer to present/semiclassical approach whiledashed lines (on right hand scale) correspond to mean energy respectively (after Mishra et al.[12], curtsey authors and publishers AIP)
3.2 Quantum Effects in Electron Accretion 95

figures also indicate the fact that the mean energy of electrons (away from thesurface) associated with usual accretion increases with increasing t0s while itdisplays opposite trend with increasing g0 on account of the larger availability oflow energy electrons for accretion. The mean energy of the electrons in case oftunneling accretion (erect) increases gradually with surface potential; however itremains almost independent of g0.
3.3 Critique of OML Theory
The previous sections are based on the OML theory, which assumes the absence ofelectron/ion collisions in the vicinity of the dust particles. This is justified becausethe mean free path of electrons/ion collisions is much larger than the Debye lengthin typical complex plasmas in laboratory, industry, and space. However, there areseveral remaining issues which need to be discussed. First, the potential is ofDebye form, only when expð�eV=kBTe;iÞ � 1� eV=kBTe;i; however it is seen(e.g., [5]) that the Debye form is a useful good approximation for many othersituations of interest. Second, the OML theory does not take into account thepossible partition [1] of phase space into mutually inaccessible regions by barriersin the radial effective potential UðrÞ ¼ VðrÞ þ L2=2mv2; where L denotes theangular momentum and m the electron/ion mass. However, Lampe [4] has shownthat the effect of this phenomenon in typical complex plasmas is not significant.Another limitation has been pointed out by Pandey et al. [11] viz. the fact that atlow electron temperature, the electron de-Broglie wavelength is comparable oreven larger than the size of small dust particles.
3.4 Trapping of Ions
When collisions are neglected, the total (Kinetic ? Potential) energy of electrons/ions in the vicinity of a dust particle is positive and the electrons/ions hit theparticle, get reflected back or just fly by. However, Bernstein and Rabinowitz [2]have pointed out that there may be collisions of positive ions with neutral particles(including charge exchange collisions) having low kinetic energy, so that the totalenergy of the ion after the collision is negative; it may be remembered that thepotential energy of a positive ion in the field of a negatively charged particle isnegative. Since the collision frequency m is usually small, the production rate oftrapped ions is small. But a trapped ion, once created stays trapped for a long time.Hence, the trapped ion density may slowly be large enough to affect accretion. Atrapped ion may suffer a collision with a high energy neutral particle and henceacquire positive total energy and escape. The ion may be scattered in a collision tofall on the dust particle and get accreted. Monte Carlo simulations by Goree [3]
96 3 Accretion of Electrons/Ions on Dust Particles

and Zobnin et al. [19] show that the number density of trapped ions in the vicinityof a dust particle may be quite significant. In what follows an elementary phe-nomenological theory by Lampe et al. [6] of the effect of ion trapping on theaccretion current on the particle has been given.
3.4.1 Effect of Charge Exchange Ion Collisions with NeutralAtoms on Accretion Current (After Lampe et al. [6])
In a charge exchange collision of an ion with a neutral atom, the energy of the newion is less than of that of the old ion, which enhances the probability of accretionon the dust particle. To estimate the rate of accretion, one may define a distance r0from the center of a negatively charged particle so that r ¼ r0 is the edge of thesheath, defined by eVðr0Þ ¼ �3kBT=2 This newly created ion may fall on thegrain surface, immediately if it has a low angular momentum or orbit it ifotherwise. The orbiting ion will also get accreted on account of further collisions.Thus, practically all collisions, occurring in the space r\r0 cause accretion of anelectron on the surface of the particle. The probability of an ion, suffering acollision inside a sphere of radius r0 is r0=km, where km is the mean free path.
Hence, the additional accretion rate of electrons on the dust particle due tocollisions is
nict ¼ 4pr20niðkBTi=2mipÞ1=2ðr0=kmÞ;
¼ ðr20=a2Þnic0ðr0=kmÞ
ð3:17Þ
where nic0 refers to the rate of accretion on the uncharged particle and equals
4pa2niðkBTi=2mipÞ1=2
The usually considered rate of accretion is given by
nicc ¼ nic0 expð�eVðr¼aÞ=kBTiÞ � nic0ð1� ðeVs=kBTiÞÞ ð3:18Þ
Hence the total rate of accretion of ions on the dust particle is given by
nic ¼ nict þ nicc ¼ nic0½1� ðeVs=kBTiÞ � ðr30=a2kmÞ� ð3:19Þ
Elaborate and sophisticated theories for evaluation of VðrÞ and nic, taking intoaccount the collision of ions with neutral atoms have been advanced. A discussionof these theories is beyond the scope of this book.
3.4 Trapping of Ions 97

3.5 Schottky Effect and Electron Accretion
As discussed in Sect. 2.3.1, the effective potential energy of an electron near thesurface of negatively charged particles is reduced on account of the image force onthe electron. Thus [16]
Veff ¼ Vs � DU ¼ ðZe2=aÞ � DU ð3:20Þ
where �Ze is the charge on the particle, a is the radius of the particle, andVs ¼ ðZe2=aÞ is the potential energy due to the charge on the surface.
Hence from Sect. 3.1 the rate of electron accretion n0ec on the surface of theparticle is given by
n0ec ¼ neð8kBT=mepÞ1=2pa2expð�Veff=kBTeÞ¼ necexpð�DU=kBTeÞ
ð3:21Þ
where nec is given by (3.11b), DU is tabulated in Table 2.5 as a function of Z andl ¼ D=a and D is the Debye length in the plasma.
3.6 Accretion of Electrons/Ions Having GeneralizedLorentzian Energy Distribution Function on DustParticles (After Mishra et al. [9])
In some regions of space, the electrons and ions in the plasma are characterized bya generalized Lorentzian energy distribution function [7, 14]; for such a distri-bution function (3.9) may be replaced by
fjðu; tÞdudt ¼ 2pbðpct2TÞ�3=2t 1þ ðu2 þ t2Þ=ct2
T
� ffi�ðjþ1Þdudt ð3:22Þ
where tT ¼ ð2kBT=mÞ1=2 is the thermal speed of the plasma electrons/ions,c ¼ ðj� 3=2Þ, b ¼ ½Cðjþ 1Þ=Cðj� 1=2Þ� and j is the spectral index of thedistribution.
Following the methodology as outlined in Sect. 3.1, the rate of accretion njc and
the mean energy ejc of accretion of electrons and ions is given by
njc ¼ ð4pa2Þn ckBT
2pm
� �1=2 Cðj� 1ÞCðj� 1=2Þ
� �1þ ts
c
� �1�j
; for ts [ 0 ð3:23aÞ
and
njc ¼ ð4pa2Þn ckBT
2pm
� �1=2 1c
Cðj� 1ÞCðj� 1=2Þ
� �½c� ðj� 1Þts�; for ts 0 ð3:23bÞ
98 3 Accretion of Electrons/Ions on Dust Particles

ejc ¼ ðEj
c=njc Þ ¼
2cþ tsjj� 2
� �kBT for ts [ 0 ð3:24aÞ
and
ejc ¼ ðEj
c=njc Þ ¼
cðj� 2Þ
� �2c� ðj� 2Þts
c� ðj� 1Þts
� �kBT for ts 0 ð3:24bÞ
References
1. J.E. Allen, B.M. Annaratone, U. deAngelis, J. Plasma Phys. 63, 299 (2000)2. I.B. Bernstein, I.N. Rabinowitz, Phys. Fluids 2, 112 (1959)3. J. Goree, Phys. Rev. Lett. 69, 277 (1969)4. M. Lampe, J. Plasma Phys. 65, 171 (2001)5. M. Lampe, G. Joyee, G. Ganguli, V. Gavrischaka, Phys. Plasmas 7, 3851 (2000)6. M. Lampe, R. Goswami, Z. Sternovsky, S. Robertson, V. Gavrishchaka, G. Ganguli, G.
Joyce, Phys. Plasmas 10, 1500 (2003)7. D.A. Mendis, M. Rosenberg, Annu. Rev. Astr. Astrophys. 32, 419 (1994)8. S.K. Mishra, S. Misra, M.S. Sodha, Phys. Plasmas 18, 103708 (2011)9. S.K. Mishra, S. Misra, M.S. Sodha, Europhys. J., D , 67, 210 (2013)
10. S. Misra, S.K. Mishra, M.S. Sodha, Phys. Plasmas 19, 043702 (2012)11. B.P. Pandey, S.V. Vladimirov, A.A. Samarian, Phys. Rev. E83, 016401 (2011)12. S.K. Mishra, M.S. Sodha, S. Misra, Phys. Plasmas 19, 073705 (2012)13. H.M. Mottsmith, I. Langmuir, Phys. Rev. 28,727 (1926)14. M. Rosenberg, D.A. Mendis, J. Geophys. Res. 97, 14773 (1992)15. M.S. Sodha, S.K. Mishra, Phys. Plasmas 18, 044502 (2011)16. M.S. Sodha, S. Srivastava, Phys. Lett. A377, 4773 (2010)17. M.S. Sodha, S.K. Mishra, S. Misra, Phys. Lett. A 374, 3376 (2010)18. Y. Tyshetskiy, S.V. Vladimirov, Phys. Rev. E 83, 046406 (2011)19. A.V. Zobnin, A.P. Nefedov, A.P. Sinel’stichikov, V.E. Fortov, J. Exp. Theor. Phys. 91, 483
(2000)
3.6 Accretion of Electrons/Ions Having Generalized Lorentzian 99

Chapter 4Kinetics of Dust-Electron Cloud
4.1 Thermal Equilibrium: Charge Distribution Over Dust
The early experiments by Sugden and Thrush [10] and Shuler and Weber [3]concluded that the electron density in rich hydrocarbon flames (with Carbon dust)is much higher than that predicted by the application of Saha’s equation to thegaseous species. Further, it was shown that the electron density could be explainedon the basis of thermionic emission from the surface of the graphite dust particles,present in the flames; it was seen that Saha’s equation was applicable to theemission from and accretion of electrons on dust (or ionization/recombination inthe dust-electron system), when the ionization energy is replaced by the energyneeded by an electron to move from inside the dust particle to infinity. The validityof Saha’s equation testifies that the dust-electron system is in thermal equilibrium.There are many situations, when the dust-electron system is not in thermal equi-librium; this is particularly true when the dominant electron emission is not ofthermal origin. In this section, the statistical mechanics of a dust-electron systemin thermal equilibrium has been considered; this analysis is only valid when thegas, in which the dust is suspended, does not directly or indirectly affect theelectronic processes.
Consider the following electron emission/accretion process
PZ�1 � PZ þ e�; ð4:1Þ
where PZ represents a dust particle with charge Ze and e- represents an electron.The condition of equilibrium requires
nZ�1nth Z � 1ð Þ ¼ nZnec Zð Þ; ð4:2Þ
where nZ is the number density of particles with a charge Ze, nth(Z - 1) is the rateof thermionic emission from a particle with a charge (Z - 1)e and nec(Z) (pro-portional to ne) is the rate of electron accretion on a particle with a charge Ze.Substituting for nth(Z - 1) from Sect. 2.3.2 and for nec(Z) from Sect. 3.1 in (4.2)and remembering that the particles and the electrons are at the same temperature T,one obtains an equation, analogous to Saha’s equation for thermal ionization of
M. S. Sodha, Kinetics of Complex Plasmas, Springer Series on Atomic,Optical, and Plasma Physics 81, DOI: 10.1007/978-81-322-1820-3_4,� Springer India 2014
101

atoms, when the ionization potential is replaced by the effective work functionuþ Ze2
�a
� �and the statistical weight of PZ and PZ-1 are equal. Thus
KZ ¼nenZ
nZ�1¼ ns Tð Þ exp a=2ð Þ exp �Zað Þ; ð4:3Þ
where KZ is the equilibrium constant of the reaction represented by (4.1),
ns Tð Þ ¼ 2�
h3� �
2pmekBTð Þ3=2exp �U0=kBTð Þ;
U is the work function for an uncharged particle equal to U0 � e2�
2a, U0 is the
work function corresponding to a plane surface, e2�
2a arises from the image force,
a ¼ e2�
akBT and ts ¼ �Za.It can be shown [1, 7] that Saha’s equation is valid, even when quantum effects
are considered.Equation (4.3) is valid for positive as well as negative values of Z. From (4.3)
nZ
n0¼ nZ
nZ�1� nZ�1
nZ�2. . .. . .. . .
n1
n0¼YZ
Z¼1
KZ=ne
¼ ns
ne
ffi �Z
exp �a 1þ 2þ . . .. . .. . .þ Zð Þ½ � � exp Za=2ð Þ
¼ ns
ne
ffi �Z
exp �Z2a�
2� �
:
ð4:4aÞ
Putting x ¼ ln nsne
, i.e. ne = ns exp (-x) the above equation can be expressed
as
lnnZ
n0¼ Zx� Z2a=2 ¼ � a=2ð Þ Z2 � 2Z
x
aþ x2
a2
ffi �þ x2
2að4:4bÞ
or
nZ
n0¼ exp x2
�2a
� �exp �a=2 Z � x=að Þ2h i
: ð4:4cÞ
This is the distribution function of charge on the particles.The two equations for determination of x and n0 are
nsexp �xð Þ ¼ ne ¼X1
�1ZnZ ¼ Znd ð4:5aÞ
and
nd ¼X1
�1nZ ; ð4:5bÞ
102 4 Kinetics of Dust-Electron Cloud

where Z is the mean charge on the particles and nd is the number density of dustparticles.
From (4.4a), (4.4b), (4.4c) and (4.5a), (4.5b) one can obtain [4].
Z ¼ x
a� h x; að Þ
að4:6aÞ
where
h x; að Þ ¼4pP1
1n exp �2p2n2
�a
� �sin 2pnx=að Þ
1þ 2pP1
1exp �2p2n2=að Þ cos 2pnx=að Þ
:
From (4.5a) and (4.6a) one obtains
ne=nsð Þ ¼ exp �x½ � ¼ Z nd
�ns
� �¼ W x� h x; að Þ½ � ð4:6bÞ
where W ¼ nd=ans.The dependence of ne=nsð Þ on W for different values of a is illustrated in
Fig. 4.1.Smith [4] has pointed out that the term h x; að Þ is negligible when a\ 6 (cor-
responding to particles, larger than 1 nm in radius for a temperature of 2500 K);then (4.6b) reduces to
ne=nsð Þ þ W ln ne=nsð Þ ¼ 0: ð4:6cÞ
For high values of nd (i.e. large W), ne=nsð Þ � 1 while for low values of nd (i.e.small W), ne � nd
1/2, equivalent to a single charge on some particles. For a specificvalue of W ¼ nd=ansð Þ, x ¼ ln ne=nsð Þ and hence ne can, in general, be obtainedfrom (4.6b) and (4.6c). Knowing x, the charge distribution is given by (4.4c) wheren0 can be evaluated from (4.5b).
Fig. 4.1 Dependence of(ne/ns) on W = nd/ns fordifferent values of a = (a) 0,(b) 2p, (c) 4p, (d) 24 (afterSmith [4], curtsey publisherAIP)
4.1 Thermal Equilibrium: Charge Distribution Over Dust 103

To appreciate the charge distribution on particles one may evaluate the meancharge �Z ¼ ne=ndð Þ, and ne=nsð Þ corresponding to set of values of nd=nsð Þ anda ¼ e2
�akT . Figures 4.2 and 4.3 illustrate the charge distribution (dependence of
nZ=nd on Z) for different values of a ¼ e2�
akT , corresponding to ns=neð Þ ¼ 2 andfor different values of ns=neð Þ, corresponding to a ¼ 0:0098. The points on thecurves, corresponding to integral values of Z are the only significant points.
4.2 Steady State (Non Equilibrium) Kinetics
4.2.1 Philosophy
Early researchers in the field were interested only in the average charge on the dustparticles, which was evaluated from the charge balance on a particle, consideringelectron emission from and electron/ion accretion on the particle; the effect of duston the plasma parameters was ignored and hence the theory was applicable only to
Fig. 4.2 Charge distributionon the particles in a dustyplasma for ns/ne = 2; thecurves a, b, c, d and e refer toa = 0.0196, 0.0098, 0.0065,0.0049 and 0.00327respectively (after Misra andMishra [2])
Fig. 4.3 Charge distributionon the particles in a dustyplasma for a = 0.0098; thecurves a, b, c, d and e refer tons/ne = 62.69, 142.182,234.54, 337.15 and 566.73respectively (after Misra andMishra [2])
104 4 Kinetics of Dust-Electron Cloud

very low density of dust particles. The next step was to take into account thenumber balance of electrons/ions, considering electron/ion/dust temperatureunchanged. It was, however, realized that since the rates of electron emission fromand electron/ion accretion on the dust particles, as well as of the gaseous ioni-zation/deionization processes were strongly temperature dependent, the energybalance of the plasma species and the dust should also be taken into account. Tosummarize, a satisfactory investigation in the kinetics of complex plasma shouldinclude charge balance of the particles and number/energy balance the complex ofplasma species. Later considerations included charge distribution on particleshaving (i) uniform size and (ii) size distribution.
4.2.2 Charge Distribution in Irradiated Dust Cloud (AfterSodha et al. [9])
Consider a dust cloud, irradiated by light and having dust particles at a temperatureT and electrons at a temperature Te. Following the same logic as in the derivationof (4.3) one obtains
KZ ¼ nphðZ � 1Þ�
nZnec; ð4:7aÞ
where KZ is a parameter, corresponding to the present case and nph Z � 1ð Þ is therate of photoelectron emission from a particle with charge (Z - 1)e.
Using the expressions for nph Z � 1ð Þ from Sect. 2.3.2 and for nec from Sect. 3.1,one obtains.
KZ ¼ np 8kBTe=mpð Þ�1=2exp �Zaeð Þ for Z\0 ð4:7bÞ
and
KZ ¼ np w n; Zað Þ=U nð Þ½ � 8kBTe=mpð Þ�1=2 1þ Zaeð Þ�1 for Z [ 0 ð4:7cÞ
where w and U are given by (2.72b).np is the rate of photoelectron emission per unit area from an uncharged plane
surface and ts ¼ �Za.From (4.7b) and (4.7c) one obtains
nZ=n0ð Þ ¼ P0
Zþ1ne=KZð Þ for Z\0 ð4:8aÞ
and
nZ=n0ð Þ ¼ PZ
1KZ=neð Þ for Z [ 0; ð4:8bÞ
Using (4.7b) and (4.7c), (4.8a) and (4.8b) may be expressed as
4.2 Steady State (Non Equilibrium) Kinetics 105

nZ=n0ð Þ ¼ YX�1=2 Z
exp �Z Z þ 1ð Þa=2X½ � for Z [ 0 ð4:9aÞ
and
nZ=n0ð Þ ¼ YX�1=2 Z
PZ
1w n; Zað Þ= 1þ Za=Xð ÞU nð Þ½ �exp �Z Z þ 1ð Þa=2X½ �
for Z [ 0;
ð4:9bÞ
where
Y ¼ np
�ne
� �8kBTe=mpð Þ�1=2; X ¼ Te=T
wðn; ZaÞ ¼ Za ln½1þ exp(n� ZaÞ� þ U0ðn� ZaÞ
and
U0ðKÞ ¼ZexpK
0
lnð1þ XÞX
dX:
From (3.12b) and (3.12c) the mean energy ea of accreting electrons for awayfrom the particle is after putting ts ¼ �Za=X, given by
e�a ðEa=kBTÞ ¼ 2X � Za for Z\0 ð4:10aÞ
and
eþa ðEa=kBTÞ ¼ ð2þ Za=XÞ=ð1þ Za=XÞ for Z [ 0; ð4:10bÞ
From (2.42a) and (2.73d)
ephðZ � 1Þ ¼ �Zaþ 2IðnÞ=U0ðnÞ for Z\0 ð4:11aÞ
and
eph Z � 1ð Þ ¼ Za U0 n� Zað Þ þ 2I n� Zað Þ½ �= w n; Zað Þ½ �; for Z [ 0; ð4:11bÞ
where I Xð Þ ¼R1
0 gln 1þ exp X� gð Þ½ �dg.In steady state, the energy of photoelectrons emitted per unit time per unit
volume should be equal to the energy of accreting electrons per unit volume perunit time. Thus,
X0
�1nZ�1nphðZ � 1ÞephðZ � 1Þ þ
X1
1
nZ�1nphðZ � 1ÞephðZ � 1Þ !
¼ ne
X0
�1nZ
ncðZÞne
ffi �ecðZÞ þ ne
X1
1
nZncðZÞ
ne
ffi �ecðZÞ
!
;
ð4:12Þ
106 4 Kinetics of Dust-Electron Cloud

where the left-hand side of above equation refers to the total energy of emittedphotoelectrons from the surface of dust and the right hand side of the aboveequation refers to the total energy of accreted electrons on the surface (per unittime per unit volume) of dust. Hence, substituting for nph Z � 1ð Þ from Sect. 2.3.2,for nec Zð Þ from Sect. 3.1, ea Zð Þ from (4.10a), (4.10b), and eph Z � 1ð Þ from (4.11a),(4.11b) and nZ from (4.9a), (4.9b) one obtains.
YX�3=2 X0
�1YX�1=2 Z�1
exp �Z Z � 1ð Þa=2X½ � �Zaþ IðnÞ/0ðnÞ
ffi �
þX1
1
YX�1=2 Z�1 YZ�1
1
Wðn; ZaÞ1þ Z � 1ð Þa=Xð Þ/0 nð Þð Þ
!W n; Zað Þ/0 nð Þ �Zaþ I n; Zað Þ
W n; Zað Þ
ffi �!
¼X0
�1YX�1=2 Z�1
exp �Z Z þ 1ð Þa=2X½ � 2� Za=Xð Þ exp �Za=Xð Þ
þX1
1
YX�1=2 Z�1
1þ Za=Xð Þ 2X þ Zað Þ= X þ Zað Þð ÞYZ
1
W n; Zað Þ1þ Za=Xð Þ/0 nð Þð Þ
!!
ð4:13Þ
The charge neutrality for the dust cloud can be expressed as:
ne
n0¼X1
�1Z
nZ
n0¼X0
�1Z
nZ
n0þX1
1
ZnZ
n0:
By substitution from (4.8a) and (4.8b)
ne
n0¼X0
�1Z YX�1=2 Z
exp �Z Z þ 1ð Þa=2X½ �
þX1
1
Z YX�1=2 Z YZ
1
W n; Zað Þ1þ Za=Xð Þ/ nð Þð Þ
!
: ð4:14Þ
Total density of the dust particle nd is given by
nd
n0¼X1
�1
nZ
n0¼X0
�1
nZ
n0þX1
1
nZ
n0
or
nd
n0¼X0
�1YX�1=2 Z
exp �Z Z þ 1ð Þa=2X½ �
þX1
1
YX�1=2 Z YZ
1
W n; Zað Þ1þ Za=Xð Þ/ nð Þð Þ
!
ð4:15Þ
4.2 Steady State (Non Equilibrium) Kinetics 107
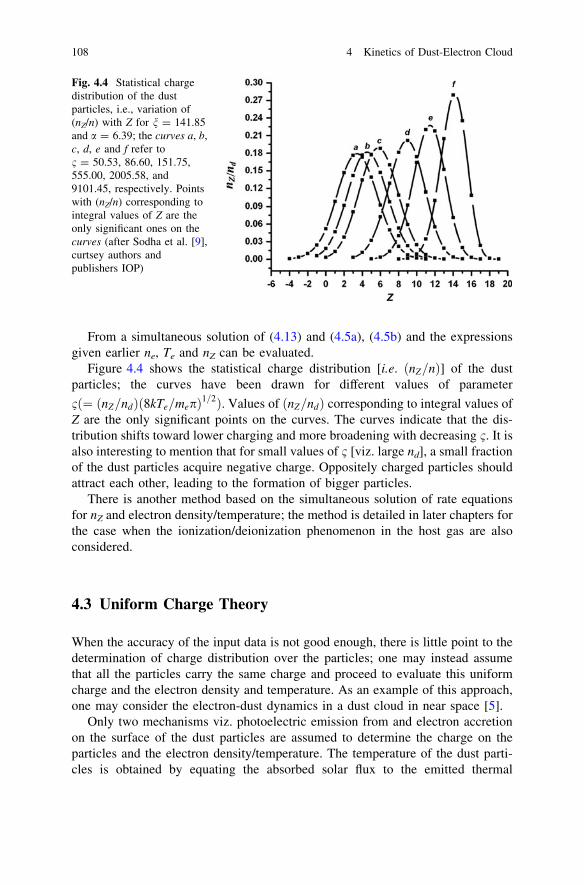
From a simultaneous solution of (4.13) and (4.5a), (4.5b) and the expressionsgiven earlier ne, Te and nZ can be evaluated.
Figure 4.4 shows the statistical charge distribution [i.e. nZ=nð Þ] of the dustparticles; the curves have been drawn for different values of parameter
1ð¼ nZ=ndð Þ 8kTe=mepð Þ1=2Þ. Values of nZ=ndð Þ corresponding to integral values ofZ are the only significant points on the curves. The curves indicate that the dis-tribution shifts toward lower charging and more broadening with decreasing 1. It isalso interesting to mention that for small values of 1 [viz. large nd], a small fractionof the dust particles acquire negative charge. Oppositely charged particles shouldattract each other, leading to the formation of bigger particles.
There is another method based on the simultaneous solution of rate equationsfor nZ and electron density/temperature; the method is detailed in later chapters forthe case when the ionization/deionization phenomenon in the host gas are alsoconsidered.
4.3 Uniform Charge Theory
When the accuracy of the input data is not good enough, there is little point to thedetermination of charge distribution over the particles; one may instead assumethat all the particles carry the same charge and proceed to evaluate this uniformcharge and the electron density and temperature. As an example of this approach,one may consider the electron-dust dynamics in a dust cloud in near space [5].
Only two mechanisms viz. photoelectric emission from and electron accretionon the surface of the dust particles are assumed to determine the charge on theparticles and the electron density/temperature. The temperature of the dust parti-cles is obtained by equating the absorbed solar flux to the emitted thermal
Fig. 4.4 Statistical chargedistribution of the dustparticles, i.e., variation of(nZ/n) with Z for n = 141.85and a = 6.39; the curves a, b,c, d, e and f refer to1 = 50.53, 86.60, 151.75,555.00, 2005.58, and9101.45, respectively. Pointswith (nZ/n) corresponding tointegral values of Z are theonly significant ones on thecurves (after Sodha et al. [9],curtsey authors andpublishers IOP)
108 4 Kinetics of Dust-Electron Cloud

radiation. If one considers dust of a material with high work function (say 7.8 eV),only solar radiation with wavelength less than 1600 Å will be effective in pho-toelectric emission. It may be seen from the solar spectrum in near space that in theregion k\ 1600 Å, Lyman Alpha radiation with a wavelength 1215.7 Å has 80 %of photons and 60 % of the energy in this region (k\ 1600 Å) of interest. Hence,it is a good approximation to assume that the photoelectric emission is caused onlyby Lyman Alpha radiation.
The electric neutrality, charge balance on the particles and energy balance ofelectrons require
ne ¼ Znd; ð4:16aÞ
nph Z;Tð Þ ¼ nec Z; Teð Þ ð4:16bÞ
and
Eph Z; Tð Þ ¼ Ec Z; Teð Þ ð4:16cÞ
where ne and nd are the densities of electrons and dust particles, nph Z; Tð Þ isthe rate of photoelectron emission per unit area from the particles and given by(2.72c).
np is the rate of photoelectron emission is the product of number of incidentphotons per unit area per unit time and the photoelectric efficiency,
�ts ¼ Z þ 1ð Þa;
a ¼ e2�
akBT;
Eph Z; Tð Þ is given by (2.73d).
nec ¼ nepa2 8kBTe=mepð Þ1=2 1þ Zaeð Þ; (3.11c)
Eec ¼ 2þ Zaeð Þ= 1þ Zaeð Þ½ �kBTe (3.12c)
and ae ¼ e2�
akBTe:
The set of three equations (4.16a), (4.16b), (4.16c) can be solved numerically togiven ne, Te and Z. In what follows some numerical results, obtained from theabove considerations for the following set of standard parameters have beenpresented.
Wavelength of radiation = 1215.7 ÅWork function of dust material = 7.8 eV.Radius of dust particles a = 100, 175 and 250 Å
4.3 Uniform Charge Theory 109
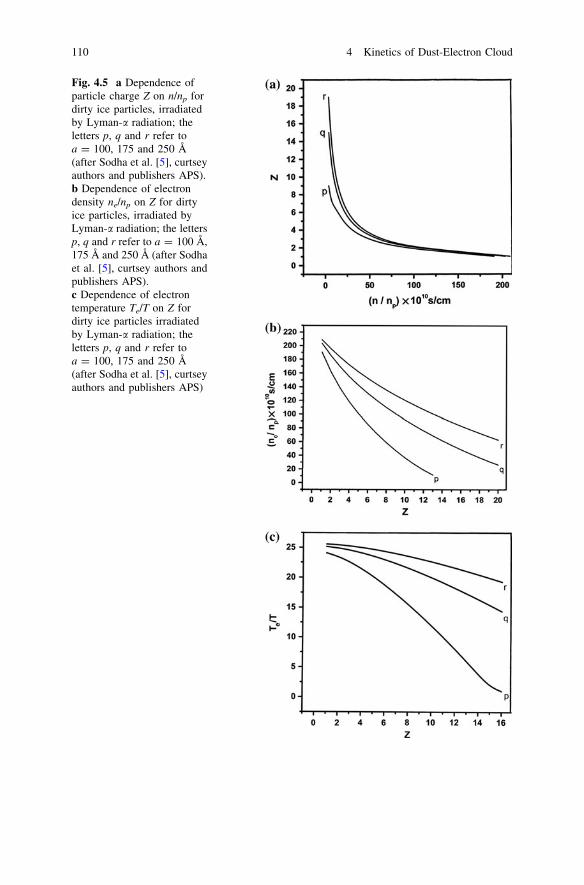
Fig. 4.5 a Dependence ofparticle charge Z on n/np fordirty ice particles, irradiatedby Lyman-a radiation; theletters p, q and r refer toa = 100, 175 and 250 Å(after Sodha et al. [5], curtseyauthors and publishers APS).b Dependence of electrondensity ne/np on Z for dirtyice particles, irradiated byLyman-a radiation; the lettersp, q and r refer to a = 100 Å,175 Å and 250 Å (after Sodhaet al. [5], curtsey authors andpublishers APS).c Dependence of electrontemperature Te/T on Z fordirty ice particles irradiatedby Lyman-a radiation; theletters p, q and r refer toa = 100, 175 and 250 Å(after Sodha et al. [5], curtseyauthors and publishers APS)
110 4 Kinetics of Dust-Electron Cloud

np ¼ 1:5� 1010=cm2s;
T ¼ 200 K:
The dependence of the charge on the particles Ze on nd
�np is illustrated in
Fig. 4.5a for varying a; the dependence of ne
�np and Te=T on Z for the three radii
has been illustrated in Fig. 4.5b, c.
4.4 Dust Cloud with Cylindrical Dust Particle
The kinetics of a dust cloud in thermal equilibrium and when illuminated hasbeen developed on similar considerations as in the proceeding sections bySodha et al. [8].
4.5 Solid State Complex Plasma (After Sodhaand Guha [6])
In this section, a summary of section XII of the review by Sodha and Guha [6] onthe subject is presented; references may be obtained from the review.
The infrared, E.S.R., optical and NMR spectrum, light scattering measure-ments, X-ray scattering experiments, electron diffraction studies, and photo con-ductivity measurements establish the presence of spherical alkali metal particles inadditively colored (excess of alkali metal) alkali halide crystals; the size of theparticles has been estimated as few hundred atoms of the alkali metal.
The excess amount of alkali metal in an additively colored alkali halide crystalis used in the creation of F Centers (one atom per center) and alkali metal particles.Hence, the number of alkali metal particles nd is given by
nd ¼ Nk � NFð Þ=p; ð4:17Þ
where Nk is the number of excess alkali metal atoms per unit volume, NF is thenumber of F centers per unit volume and p is the number of alkali metal atoms in aparticle.
The number of F centers per unit volume is given by
NF ¼ NkC � exp �DHc=kBTð Þ ð4:18Þ
where DHc is the energy required to from an F center from an excess alkali metalatom and C is a constant characteristic of the crystal. The radius of the alkali metalparticles a can be estimated from the relation
p ¼ 4=3ð Þpa3qK=A; ð4:19Þ
4.3 Uniform Charge Theory 111

where q is the density and A is the atomic weight of the alkali metal and K isAvogadro’s number.
In alkali halide crystals the work function / is replaced by /-v, where v is theelectron affinity of the crystal; hence (4.3) is valid with
ns ¼ 2�
h3� �
2pmekBT�
h2� �3=2
exp �ð/� vÞ=kBT½ �:
For experiments of interest a � 6, and nd=ansð Þ � 1.Therefore
ne ¼ ns:
With the available expression for electron mobility le and ne, thus obtained theelectronic conductivity re ¼ enele may be computed: for additively colored NaClcrystal, the evaluated electron conductivity is about 10-1 to 10-3 times theobserved value. The photoconductivity of an illuminated additively colored crystalcan also be evaluated likewise.
References
1. S.K. Mishra, M.S. Sodha, S. Misra, Phys. Plasma 19, 073705 (2012)2. S. Misra, S.K. Mishra, private communication (2013)3. K.E. Shuler, J. Weber, A microwave investigation of the ionization of hydrogen and
acetylene-oxygen flames. J. Chem. Phys. 22, 491 (1954)4. F.T. Smith, On the ionization of solid particles. J. Chem. Phys. 28, 746 (1958)5. M.S. Sodha, A. Dixit, S. Srivastava, Phys. Rev. E 79, 046407 (2009a); Erratum E 80,
069906E (2010)6. M.S. Sodha, S. Guha, Physics of Colloidal Plasmas in Advances in Plasma Physics, vol. 4,
ed. by A. Simon, W.B Thompson (Interscience Publishers, New York, 1971), p. 2217. M.S. Sodha, S.K. Mishra, Phys. Plasma 18, 044502 (2011)8. M.S. Sodha, S.K. Mishra, Shikha Misra, Phys. Plasmas 16, 123701 (2009b)9. M.S. Sodha, A. Dixit, S. Srivastava, S.K. Mishra, M.P. Verma, L. Bhasin, Plasama Sources
Sci. Tech. 19, 015006 (2010)10. T.M. Sugden, B.A. Thrush, Nature 168, 703 (1951)
112 4 Kinetics of Dust-Electron Cloud

Chapter 5Kinetics of Complex Plasmaswith Uniform Size Dust
5.1 Introduction
The early studies on the charging of dust particles, suspended in a plasma arecharacterized by the consideration of the charge balance of the particles taking intoaccount the electron emission from and electron/ion accretion on the dust. Theseinvestigations ignored the effect of dust on the plasma parameters viz. on the densityand temperature of the constituent electrons, ions, and neutral atoms; thus, thesestudies were ideally relevant to a single test particle. This chapter presents kinetics ofcomplex plasmas, taking number and energy balance of electrons and ions (inaddition to charge balance on particles) and maintenance mechanism of the plasma(without dust).
The next significant advancement in the theory was the inclusion of the numberbalance of the constituents viz. neutral atoms, electrons, and ions along with thecharge balance on the particles. This was the first step in the recognition of thecharacter of openness of complex plasmas, which is an important [26, 27, 29] featureof the kinetics of complex plasma. This feature is related to the continuous flow ofelectrons and ions toward the surface of the particles and the continuous emission ofelectrons from the surface. The accreting electrons and ions give their charge to theparticles and accreting ions are released as neutral atoms thereafter; thus electron/ionaccretion on the surface of the particles provides in effect a mechanism for electron–ion recombination and a sink for plasma electrons and ions. It was also emphasizedby Tsytovich and Morfill [27] that the existence of the steady state in complexplasmas requires an agency for ionization of neutral atoms in addition to electronemission from and electron/ion accretion on the dust particles. Diffusion of electronshas also to be considered when the inhomogenity is significant.
Hence, it is necessary [13, 28] to consider the processes for electron/ion gen-eration/annihilation, in addition to electron emission from and electron/ionaccretion on the surface of the particles. Since these processes are characterized bysignificant exchange of energy between the various constituents of the complexplasmas, the rates of these processes depend significantly on the temperatures ofthe species, which should figure in the kinetics. Thus, the investigations in the
M. S. Sodha, Kinetics of Complex Plasmas, Springer Series on Atomic,Optical, and Plasma Physics 81, DOI: 10.1007/978-81-322-1820-3_5,� Springer India 2014
113

kinetics of complex plasmas should be based on a system of equations, corre-sponding to the charge balance on the dust particles and the number and energybalance of the constituents’ viz. dust, ions, electrons, and neutral atoms.
The electrical neutrality of the complex plasmas follows from the charge bal-ance on the dust particles and the number balance of electrons and ions and henceit need not to be considered separately. Such an analysis for an illuminatedcomplex plasma having a suspension of dust of uniform size was made by Sodhaet al. [21]; appropriate expression Sodha [18] for the photoelectric emission from acharged spherical particle was employed. In a series of papers, this approach wasfollowed up for the investigation of complex plasma kinetics, corresponding to anumber of interesting situations. The extension of this approach to complexplasmas, with size distribution of the dust has been discussed in Chap. 7.
The quantum effects in the emission/accretion of electrons, discussed in Chaps.2 and 3 have in general been ignored in studies on complex plasma kinetics exceptin three papers [11, 19, 20]. Sodha et. al [21] have also pointed out a seriouslimitation of the analyses viz. that the mean free path of the electrons should beless than the dimensions of the complex plasma. In this chapter, the kinetics ofcomplex plasmas under various conditions has been discussed.
5.2 Complex Plasma in Thermal Equilibrium
Sugden and Thrush [25] and Shuler and Weber [15] measured the electron densityin rich hydrocarbon flames and found the electron density to be much larger thanthat which could be explained on the basis of the application of Saha’s equation tothe ionization of the gaseous species. It was also concluded that the observationscould be explained on the basis of thermionic emission of electrons from the hotsolid carbon particles in the flame; the existence of carbon particles in rich flameshas indeed been established by experiments. However, this approach ignores theaccretion of ions on the dust (solid carbon) particles and hence is not applicable,when the ion density is appreciable.
Smith [17] extended the analysis [16] of the statistical mechanics of an electrondust cloud, in thermal equilibrium (as in Chap. 4) to the general case to include manyspecies of singly ionized gases and many species of dust with characteristic radiusand work function. In this section, the treatment by Smith [17] has been followed.
The single ionization and electron attachment of the jth gas may be representedas
nsj ¼ nijne
�n0j ð5:1aÞ
and
Lj ¼ nen0j=n�ij ð5:1bÞ
where ne; ½n�ij �; n0j
� �and nij
� �represent the number density of electrons, singly
charged negative ions, neutral atoms and singly charged positive ions of the jthgas, and nsj
�Lj are the equilibrium constants for the ionization/electron attachment
114 5 Kinetics of Complex Plasmas with Uniform Size Dust

reactions of the jth gas. The equilibrium constant for single ionization of atoms isgiven by Saha’s equation as
nsj ¼ nenij
�n0j
ffi �¼ 2 2pmekBT
�h2
ffi �3=2exp �eVj
�kBT
ffi �; ð5:1cÞ
where Vj is the ionization potential of the jth gas.From (4.6a) and for ar [ 6 one obtains
NrZr ¼ Nr=arð Þ ln nrs=neð Þ ¼ Nr=arð Þ ln nrsð Þ � ln neð Þ½ � ð5:1dÞ
where Nr is number density of the rth species of particles, ar ¼ e2�
arkBTffi �
, ar isthe radius of the rth species of particles, nrs is as given by (4.3) and Zr is the meancharge on the dust particles of the rth species. Equation (5.2a) has been derived onthe basis of (4.3), which does not take into account the phenomenon of ionaccretion on dust.
The charge balance requiresX
nij þX
Nr �Zr ¼ ne þX
n�ij : ð5:1eÞ
Substituting for nij, n�ij and Nr �Zr from (5.1a), (5.1b) and (5.1d), one obtains
A� B ln ne þ C=neð Þ ¼ Dne; ð5:2aÞ
where
A ¼X
r
Nr=arð Þ ln nrsð Þ; ð5:2bÞ
B ¼X
r
Nr=arð Þ; ð5:2cÞ
C ¼X
j
nsj n0j; ð5:2dÞ
and
D ¼ 1þX
j
½n0j��
Lj: ð5:2eÞ
Further, the conservation of the jth species of gas requires
nj ¼ n�ij þ n0j þ nij
or
n0j ¼ nj
�1þ nsj
�ne
ffi �þ ne
�Lj
ffi �� �: ð5:2fÞ
Smith [17] obtained a different equation for ne which is valid, only if nrs is thesame for all species of dust. Once ne is known from numerical solutions of (5.2a),Zr; nij and n�ij may be obtained from (5.1a) and (5.1b); the charge distribution is
5.2 Complex Plasma in Thermal Equilibrium 115
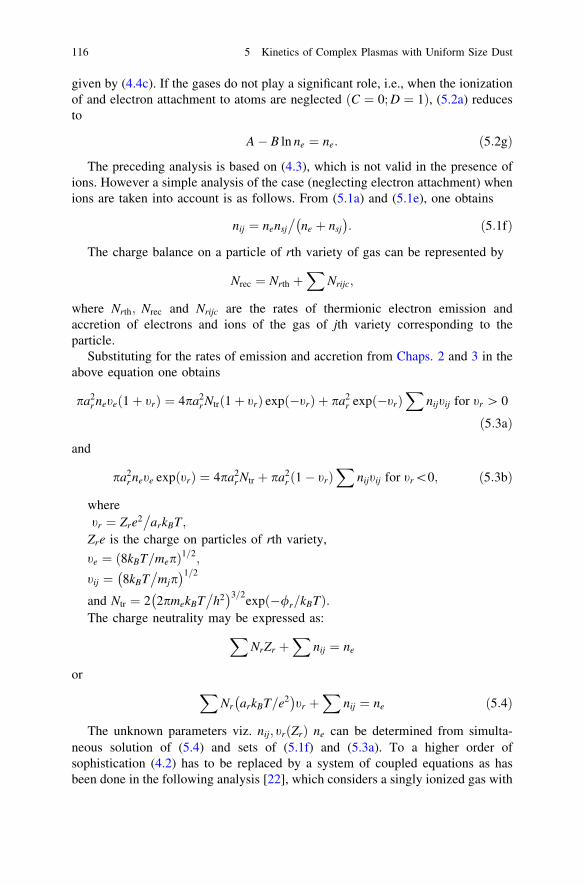
given by (4.4c). If the gases do not play a significant role, i.e., when the ionizationof and electron attachment to atoms are neglected C ¼ 0; D ¼ 1ð Þ, (5.2a) reducesto
A� B ln ne ¼ ne: ð5:2gÞ
The preceding analysis is based on (4.3), which is not valid in the presence ofions. However a simple analysis of the case (neglecting electron attachment) whenions are taken into account is as follows. From (5.1a) and (5.1e), one obtains
nij ¼ nensj
�ne þ nsj
ffi �: ð5:1fÞ
The charge balance on a particle of rth variety of gas can be represented by
Nrec ¼ Nrth þX
Nrijc;
where Nrth; Nrec and Nrijc are the rates of thermionic electron emission andaccretion of electrons and ions of the gas of jth variety corresponding to theparticle.
Substituting for the rates of emission and accretion from Chaps. 2 and 3 in theabove equation one obtains
pa2r nete 1þ trð Þ ¼ 4pa2
r Ntr 1þ trð Þ exp �trð Þ þ pa2r exp �trð Þ
Xnijtij for tr [ 0
ð5:3aÞ
and
pa2r nete exp trð Þ ¼ 4pa2
r Ntr þ pa2r 1� trð Þ
Xnijtij for tr\0; ð5:3bÞ
wheretr ¼ Zre2
�arkBT;
Zre is the charge on particles of rth variety,
te ¼ 8kBT=mepð Þ1=2;
tij ¼ 8kBT�
mjpffi �1=2
and Ntr ¼ 2 2pmekBT�
h2ffi �3=2
exp �/r=kBTð Þ:The charge neutrality may be expressed as:
XNrZr þ
Xnij ¼ ne
orX
Nr arkBT=e2ffi �
tr þX
nij ¼ ne ð5:4Þ
The unknown parameters viz. nij; trðZrÞ ne can be determined from simulta-neous solution of (5.4) and sets of (5.1f) and (5.3a). To a higher order ofsophistication (4.2) has to be replaced by a system of coupled equations as hasbeen done in the following analysis [22], which considers a singly ionized gas with
116 5 Kinetics of Complex Plasmas with Uniform Size Dust

a single species of spherical dust particles of uniform radius. The analysis can beextended to multiple gases with multiple species of dust. The basic equations ofthe kinetics of a singly ionized gas and a single species of dust of uniform radiusare as follows [22].
5.2.1 Charging
The charge distribution on the particles is given by [9, 10]
dnZ=dtð Þ ¼ nZþ1nec Z þ 1ð Þ þ nZ�1 nth Z � 1ð Þ þ nic Z � 1ð Þ½ �� nZ nth Zð Þ þ nic Zð Þ þ nec Zð Þ½ �; ð5:5Þ
where nz is the fraction of the particles with charge Ze and the expressions fornth(Z - 1), nec(Z) and nic(Z) are as derived in Chaps. 2 and 3.
The first term on the RHS refers to the production of the particles of charge Ze byelectron accretion on particles of charge (Z ? 1)e, the second term refers to theproduction of particles of charge Ze by thermionic electron emission from and ionaccretion on the particle of charge (Z - 1)e. The last term refers to loss the particleswith charge Ze by thermionic emission and electron/ion accretion on the surface.
5.2.2 Conservation of the Sum of Number Densitiesof Neutral Atoms and Ions
Since a neutral atom produces an ion by ionization and an ion gives rise to an atomby recombination with a neutral atom
n0 þ ni ¼ n00 þ ni0 ¼ NðconstantÞ; ð5:6Þ
where n0 and ni is the number densities of neutral atoms and ions, respectively;additional subscripts 0 refer to the initial values in a dust free plasmas.
5.2.3 Charge Neutrality
This can be expressed as
nd
XZ2
Z1
ZnZ ¼ ne � nið Þ; ð5:7Þ
where the consideration is restricted to the particles with charges between Z1e andZ2e (Z1� Z� Z2), where Z is the mean value of the charge on the particle; it isusual to have (Z � Z1) and (Z � Z2) equal to 4� 0:5Z1=2, since the standard
5.2 Complex Plasma in Thermal Equilibrium 117

deviation for the approximately normal distribution is 0:5 Z1=2
[3] as obtained fromnumerical simulation. To determine the mean charge, (5.5) may be replaced by
dZ=dtð Þ ¼ nth Zð Þ þ nic Zð Þ � nec Zð Þ: ð5:5aÞ
The procedure is to evaluate the mean charge on the particle Z by simultaneoussolutions of (5.1c, 5.5a, 5.6 and 5.7) as t!1 or d=dtð Þ ! 0 (steady state). Using
the values of Z, Z2 ¼ Z þ 4� 0:5Z1=2
and Z1 ¼ Z � 4� 0:5Z1=2
, get fixed andn (Z) is obtained from the steady state solution (t!1) of the system of (5.5) and(5.1c, 5.6 and 5.7) for Z1� Z� Z2; one has to make the justifiable assumption thatnz is zero for Z\Z1 and Z [ Z2.
For a numerical appreciation of the results, the following set of standardparameters may be chosen.
N ¼ 109cm�3; Te0 ¼ Ti0 ¼ T ¼ 1500 K; a ¼ 0:1 lm; nd ¼ 103 cm�3;
u ¼ 4:0 eV; Vi ¼ 5:2 eV and m0 � mi ¼ 30 amu:
The dependence of the charge distribution on the size of the particle a, thetemperature T and the work function of dust (keeping other parameters the same)has been illustrated in Fig. 5.1a, b, and c, respectively.
5.3 Complex Plasma in Absence of Electron Emissionfrom Dust Particles
Consider a gaseous plasma to be characterized by an electron density ne0; electrontemperature Te0, ion density ni0, ion temperature Ti0, neutral atom/molecule den-sity n00 and temperature T00. To a good approximation, the ionization may bemodeled as that maintained by the production of bin00 electron ion pairs, per unitvolume per unit time and recombination of electrons and ions at the rate ofare Te0ð Þne0ni0 per unit volume per unit time; bi and are are known as the ionizationfrequency and recombination coefficient. Thus in steady state one has
bin00 ¼ are Te0ð Þne0ni0 ð5:5aÞ
If Ee and Ei denote the mean energy of the electron and ion, produced in theionization of a neutral atom the energy balance of the electron/ions in the steadystate requires
Ee ¼ 3=2ð ÞkBTe0 and Ei ¼ 3=2ð ÞkBTi0; ð5:5bÞ
Because an electron with mean energy Ee and an ion with Ei recombine to forma neutral atom, the energy of an atom formed by electron ion recombination isgiven by
Erecomb ¼ 3=2ð ÞkB Te þ Tið Þ þ Vi½ �; ð5:5cÞ
118 5 Kinetics of Complex Plasmas with Uniform Size Dust
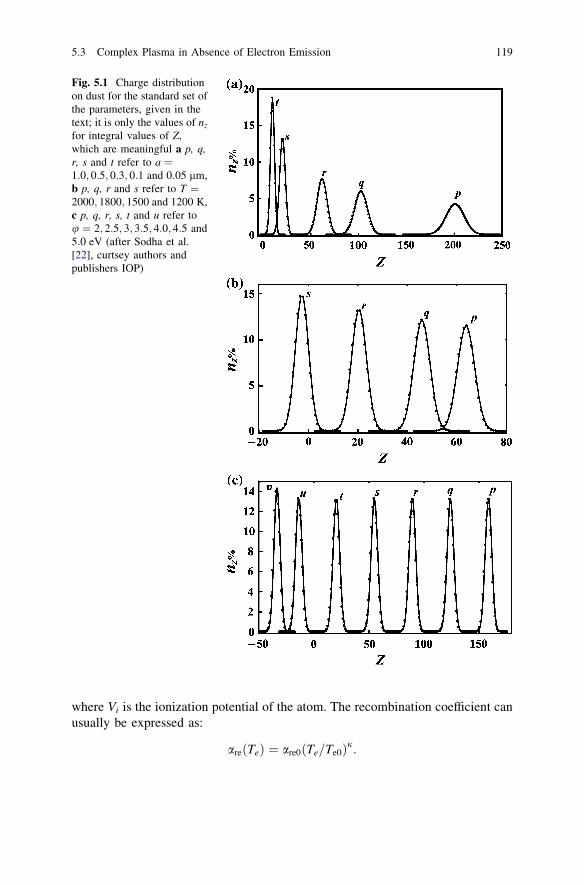
where Vi is the ionization potential of the atom. The recombination coefficient canusually be expressed as:
are Teð Þ ¼ are0 Te=Te0ð Þj:
Fig. 5.1 Charge distributionon dust for the standard set ofthe parameters, given in thetext; it is only the values of nz
for integral values of Z,which are meaningful a p, q,r, s and t refer to a ¼1:0; 0:5; 0:3; 0:1 and 0:05 lm,b p, q, r and s refer to T ¼2000; 1800; 1500 and 1200 K,c p, q, r, s, t and u refer tou ¼ 2; 2:5; 3; 3:5; 4:0; 4:5 and5:0 eV (after Sodha et al.[22], curtsey authors andpublishers IOP)
5.3 Complex Plasma in Absence of Electron Emission 119

The basic dust parameters, which are relevant to the studies on kinetics ofcomplex plasmas include the rate and mean energy of electrons emitted from thesurface of the dust particles which has been discussed in Chap. 2 in the context ofthermionic, photoelectric, secondary, normal field and light-induced field emissionfrom spherical and cylindrical particles. An equally important aspect is the rate andmean energy of the accreting electrons and ions, on the surface of the dust par-ticles; this has been discussed in Chap. 3.
In this section, the electron emission from the dust grain has been neglected; acold dark plasma corresponds to this condition. If dust is introduced in the plasmathe basic equations of kinetics are as follows.
5.3.1 Number Balance
dne=dtð Þ ¼ bin0 � are Teð Þneni½ � � ndnec Zð Þ Electronsð Þ ð5:6aÞ
dni=dtð Þ ¼ bin0 � are Teð Þneni½ � � ndnic Zð Þ Ionsð Þ ð5:6bÞ
dn0=dtð Þ ¼ � dni=dtð Þ ¼ are Teð Þneni � bin0½ � þ ndnic Zð Þ Neutralsð Þ ð5:6cÞ
Equation (5.6c) is a consequence of the conservation of n0 þ nið Þ.
5.3.2 Energy Balance
ddt
32
nekBTe
� �¼ bin0Ee � are Teð Þneni
32
kBTe
� � � ndnec Zð ÞEec Zð Þ
� nemenden
32
kB Te � T0ð Þ� �
þ nemeidei
32
kB Te � Tið Þ� �
þ Qohmic Electronsð Þ
ð5:7aÞ
ddt
32
nikBTi
� �¼ bin0Ei � are Teð Þneni
32
kBTi
� � � ndnic Zð ÞEic Zð Þ
þ nemeidei
32
kB Te � Tið Þ� �
� nimindim
32
kB Ti � T0ð Þ� �
Ionsð Þ
ð5:7bÞ
ddt
32
n0kBT0
� �¼ are Teð ÞneniErecomb � bin0
32
kBT0
� �
þ nemenden
32
kB Te � T0ð Þ� �
þ nimindim
32
kB Ti � T0ð Þ� �
� Qe Neutralsð Þ
ð5:7cÞ
120 5 Kinetics of Complex Plasmas with Uniform Size Dust

5.3.3 Dust Particle Balance
dZ=dtð Þ ¼ nic Zð Þ � nec Zð Þ Chargeð Þ ð5:8aÞ
ddt
mdCpTd
� �¼ nec Zð ÞEs
ec Zð Þ þ nic Zð Þ Esic Zð Þ � 3
2kBT0
� � � Qd Energyð Þ
ð5:8bÞ
where ne; ni; n0 and nd are the number densities of electrons, ions, neutral atoms,and dust particles, Te; Ti; T0 and Td are the temperatures of electrons, ions, neutralatoms, and dust particles, Ze is the charge on the particles, bi is the ionizationfrequency, areðTeÞ is the electron–ion recombination coefficient, nec and nic are therates of accretion of electrons and ions on dust particles, Eec and Eic are the meanenergies (far from the dust surface) of the accreting electrons and ions on the dustparticle, m and d are the frequency and fraction, characterizing energy exchange inplasma particle collisions, suffixes en, ei, and im refer to collisions betweenelectron–neutral, electron–ion, and ion–neutral collisions, Q0 is rate of Ohmic lossper unit volume, Qe is the rate of heat loss to the environment per unit volume bythe gaseous component (predominantly neutral atoms) and Qd is the rate of heatloss to the environment per unit volume by the dust particles. From (5.6a), (5.6b),and (5.8a), one obtains d=dtð Þ Znd þ ni � neð Þ ¼ 0. At t ¼ 0; Z ¼ 0 and ne ¼ ni,and hence one has
Znd þ ni � neð Þ ¼ 0: ð5:9Þ
Thus it is seen that charge neutrality is inherent in the number and chargebalance and need not be separately taken into account.
In the steady state d=dtð Þ ¼ 0 and the set of (5.6), (5.7) and (5.8a, b) reduces toa set of algebraic equations, which may be solved to get plasma parameters usingthe appropriate expressions for nec; nic;Eec and Eic as in Chap. 3. However, it isconvenient to retain the differential form of these equations and solve them byusing relevant mathematical software program (Mathematica or Mat-Lab) usingsuitable boundary conditions viz. the value of the parameters before the addition ofdust and Z ¼ 0 at t ¼ 0. The steady state (d=dt ¼ 0) solution does not depend onthe initial conditions, because for d=dt ¼ 0 the equations reduces to algebraicequations, independent of the boundary conditions. In this section, the typicalresults of the analysis have not been considered because the more general case ofilluminated complex plasma has been discussed later in the text.
5.3 Complex Plasma in Absence of Electron Emission 121
5.4 Illuminated Complex Plasmas (After Sodha et al. [23])
5.4.1 Early Investigations
A number of investigations (e.g., [4, 5, 7] on the kinetics of illuminated complexplasma were conducted on the basis of charge balance on the dust particles, i.e.equating electron emission from and ion/electron accretion on the surface of thedust particles. Apart from ignoring the number and energy balance of the con-stituents of the complex plasmas, these investigations were based on an intuitivebut erroneous expression for the rate of photoelectric emission (nph) from a pos-itively charged spherical particle viz.
nph ¼ np exp �eVs
�kBTp
ffi �for V � 0ð Þ;
where np ¼ pa2vJ, a is the radius of the particle, J is the photon flux incident onthe particle, v mð Þ is the photo-electric efficiency and Tp is an unspecified tem-perature of the photoelectrons. The inadequacy of this relation has been discussedat length in Chap. 1.
Sodha et al. (2009b) investigated the kinetics of a dust electron cloud in nearspace, where the photoelectric emission from the surface of the dust (u ¼ 7:8 eV)was caused by the dominant Lyman-a radiation (121:57 nm); with photon energyexceeding the work function of the dust particles. The number and energy balanceof the electrons was taken into account. The analysis made use of appropriateexpressions for the rate of photoelectron emission and the corresponding meanenergy of the photoelectrons.
5.4.2 Collisions in Gaseous Plasmas
As seen in Sect. 5.3, the carrier gas (or plasma) plays an important role in complexplasma kinetics and hence it is useful to recapitulate the processes in plasmas/gases, which have a bearing on the kinetics.
5.4.2.1 Ion–Neutral Atom Interaction
The frequency m0in of the collisions of an ion with neutral atoms (not resulting incharge exchange) is given by Banks [1]
m0in ¼ b0inno; ð5:10aÞ
where b0in is a constant. The values of b0in, corresponding to some neutral-ion pairshas been given by Gurevich [8] in Table 9 of his book.
122 5 Kinetics of Complex Plasmas with Uniform Size Dust

The frequency of collision of an ion with a neutral atom, resulting in chargeexchange is given by Gurevich [8]
m00in ¼ b00in Ti þ Toð Þ1=2no ð5:10bÞ
where b00in is given in Table 10 of the book by Gurevich [8] for some neutral-ionpairs.
The net ion–neutral collision frequency min is given by
min ¼ m0in þ m00inffi �
ð5:10cÞ
This has been tabulated as a function of height, for the ionosphere in Table 11of the book by Gurevich [8]. The energy exchange in an ion–neutral atom collisionis din 3kB=2ð Þ Ti � Toð Þ where din ¼ 2mi= mo þ mið Þ � 1.
5.4.2.2 Electron Collisions
The frequency men of the collision of an electron with speed t with neutral atoms isgiven by
men ¼ n0tQ tð Þ; ð5:11Þ
where Q tð Þ is the collision cross section; for constant mean free path Q tð Þ isindependent of t and
men ¼ men0 Te=Te0ð Þ1=2with men0 ¼ n0Q 3kBTe0=með Þ1=2:
The rate of energy loss to the neutral atoms per unit volume is given bynemenden 3kB=2ð Þ Te � T0ð Þ where
den ¼ 2me= m0 þ með Þ � 2me=m0ð Þ
The frequency mei of the electron collision with ions having charge Zie [6, 14] isgiven by
mei ¼ nitQei tð Þ ð5:12Þ
where Qei tð Þ ¼ 2pZ2i e4�
met4ffi �
ln K, ln K ¼ ln 1þ D2met4�
e4ffi �� �
� 10 and D isthe Debye length.
The rate of energy gain by ions from the electrons per unit volume can be givenby nemeidei 3kB=2ð Þ Te � Tið Þ where dei ¼ 2me= mi þ með Þ � 2me=mið Þ:
Following Rose and Clark [14], Sodha [18] obtained the following expressionfor elastic collisions of electrons with charged particles viz.
m0ed ¼ ndtQ0ed tð Þ; ð5:13Þ
5.4 Illuminated Complex Plasmas 123

where
Qed tð Þ ¼ 4pZ2e4�
m2et
4ffi �
ln sin v1=2ð Þ=sin v2=2ð Þ½ �; cot v1=2ð Þ ¼ m2ebt2
�Ze2
ffi �;
cot v2=2ð Þ ¼ m2eDt2
�Ze2
ffi �and b2 ¼ a2 1þ 2Ze2
�amet
2ffi �� �
:
It is common to use a typical value of the ln term viz. 10.
5.4.3 Specific Problem and Approach(After Sodha et al. [23])
In this section, the kinetics of a complex plasma, characterized by the suspensionof the dust of Cesium (Cs) coated Bronze, LaB6 and CeO2 with the work function1.5, 2.0, and 3.0 eV respectively in near space plasma has been studied; thephotoelectric ionization of the neutral atoms and the photoelectric emission fromthe surface of the dust particles by the incident solar radiation are the dominantmechanisms for the generation of electrons.
In view of the nonavailability of the spectral dependence of the absorptioncoefficient and emissivity of the surface of the dust particles, the energy balance ofthe dust particles has not been considered but a plausible value viz. 250 K for thetemperature of the dust particles has been assumed instead. The attenuation ofsolar radiation in the complex plasma has also been neglected. The spectral dis-tribution of the solar irradiance can be approximated [1] by a black body (sun) at atemperature of 5800 K for the wavelengths, higher than 122.5 nm the lowerwavelength behavior can be approximated [2] by the flux of 3:25� 1011 photons,corresponding to Lyman-a radiation of the wavelength 121:57 nm. For low workfunction dust (low threshold frequency) the photoelectric efficiency, becomesnegligible; hence, the photoelectric emission from solar radiation of wavelengthsbelow 121.57 nm has not been considered.
5.4.4 Rate of Emission and Mean Energy of Photoelectrons
The number of photons incident on a unit area, normal to the direction of incidenceper unit time having frequencies between m and mþ dmð Þ is given by Fortov et al. [4]
dninc ¼ rs=rdð Þ2K mð Þdm; ð5:14Þ
where K mð Þ ¼ 4pm2�
c2ffi �
ftr mð Þ exp hm=kBTsð Þ � 1½ ��1dm; ftr mð Þ is the transmissionfunction of the experimental chamber (it is unity for a dust cloud in near space),rs � 6:96� 1010 cmð Þ is the radius of the radiating surface of the sun,
124 5 Kinetics of Complex Plasmas with Uniform Size Dust

rd � 1:5� 1013 cmð Þ is the mean distance between the sun and the ensemble of thedust particles.
After photoemission of an electron, the charge Ze on the particle changes to(Z ? 1)e. Hence using the results in Chap. 2, the rate of photoemission of elec-trons from the particles corresponding to dninc is given by
nph Zð Þ ¼Zmm
m0
dnph Zð Þ ¼ pa2 rs=rdð Þ2Zmm
m0
v mð ÞK mð ÞW n; Z þ 1ad
ffi �
U nð Þ
dm; ð5:15Þ
where hm0 ¼ uþ Z þ 1ð Þe2�
a� �
is the minimum frequency for photoemission andmm is the upper limit of the incident solar radiation spectrum.
The spectral dependence of the photoelectric efficiency v mð Þ is given by Spitzer[24] as
v mð Þ ¼ 0 for m\m00 ð5:16aÞ
and
v mð Þ ¼ b1m4
1� m00
m
� �2; for m� m00; ð5:16bÞ
where m00 ¼ u=hð Þ is the threshold frequency and b is a constant for a givensurface. In terms of maximum value vm of v mð Þ, (5.16b) can be expressed as
v mð Þvm¼ 729
16m00
m
� �41� m00
m
� �2: ð5:16cÞ
The mean energy of the photoelectrons, emitted by a particle with positivecharge Ze is given by
nph Zð Þ�Eph Zð Þ ¼Zmm
m0
nph Zð Þ dnph Zð Þ�
dm� �
dm
¼ pa2 rs=rdð Þ2Zmm
m0
Eph Z; mð Þv mð ÞK mð ÞW n; Z þ 1ad
ffi �
U nð Þ
dm
ð5:17Þ
where �vs ¼ Z þ 1ð Þe2�
akBTd, Eph Z; mð Þ ¼ kBTdeph, eph is given by (2.73d) forZ [ 0, eph ¼ vs þ e00h i and is given for Z \ 0 by (2.42a).
5.4 Illuminated Complex Plasmas 125

5.4.5 Analytical Model
A. Conservation of the sum of densities of neutral atoms and ions
n0 þ ni ¼ n00 þ ni0 ¼ N ð5:6Þ
B. Charge neutrality
Znd þ ni ¼ ne ð5:18Þ
C. Charging of the dust particles
dZ=dtð Þ ¼ nic þ nph � nec; ð5:19Þ
D. Number balance of electron
dne=dtð Þ ¼ bin0 þ nphnd � arneni � necnd; ð5:20Þ
where bi is the coefficient of ionization and ar Teð Þ ¼ 5:0� 10�7 300=Teð Þ1:2 cm3�
sis a typical [2, 8] coefficient of electron/ion recombination. In the absence of dustone has bin00 ¼ arne0ni0 ¼ arn2
e0.E. Number balance of Ions
dni=dtð Þ ¼ bin0 � arneni � nicnd: ð5:21Þ
F. Energy balance for electrons
ddt
32
kBneTe
� �¼ bin0ee þ nphndeph � arneni 3kBTe=2ð Þ � ndneceec
� memdem 3kB=2ð Þ Te � T0ð Þne � meidei 3kB=2ð Þ Te � Tið Þne
ð5:22Þ
where ee � 3=2ð ÞkBTe0 is the energy of an electron produced by neutral ionization,expression for eec has been given in Chap. 3 and the significance of mem; dem; mei
and dei has been explained in the Sect. 5.4.2.G. Energy balance for ions
ddt
32
kBniTi
� �¼ bin0ei þ meidei 3kB=2ð Þ Te � Tið Þne � nicndeic
� arneni 3kBTi=2ð Þ � mimdim 3kB=2ð Þ Ti � T0ð Þni;
ð5:23Þ
where ei � 3=2ð ÞkBTi0 is the energy of an ion produced by neutral ionization,expression for eic has been given in Chap. 3 and the significance of mim and dim hasbeen explained in the Sect. 5.4.2.
126 5 Kinetics of Complex Plasmas with Uniform Size Dust
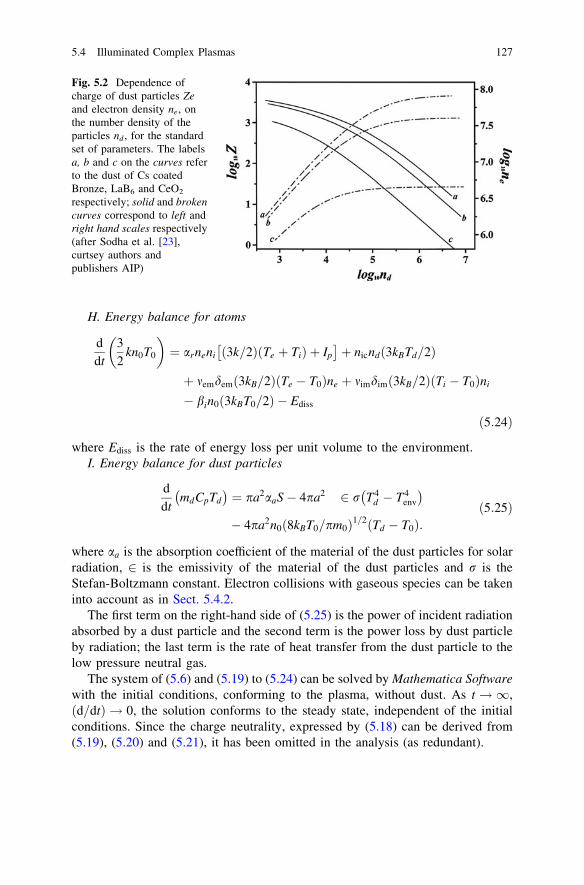
H. Energy balance for atoms
ddt
32
kn0T0
� �¼ arneni 3k=2ð Þ Te þ Tið Þ þ Ip
� �þ nicnd 3kBTd=2ð Þ
þ memdem 3kB=2ð Þ Te � T0ð Þne þ mimdim 3kB=2ð Þ Ti � T0ð Þni
� bin0 3kBT0=2ð Þ � Ediss
ð5:24Þ
where Ediss is the rate of energy loss per unit volume to the environment.I. Energy balance for dust particles
ddt
mdCpTd
ffi �¼ pa2aaS� 4pa2 2 r T4
d � T4env
ffi �
� 4pa2n0 8kBT0=pm0ð Þ1=2 Td � T0ð Þ:ð5:25Þ
where aa is the absorption coefficient of the material of the dust particles for solarradiation, 2 is the emissivity of the material of the dust particles and r is theStefan-Boltzmann constant. Electron collisions with gaseous species can be takeninto account as in Sect. 5.4.2.
The first term on the right-hand side of (5.25) is the power of incident radiationabsorbed by a dust particle and the second term is the power loss by dust particleby radiation; the last term is the rate of heat transfer from the dust particle to thelow pressure neutral gas.
The system of (5.6) and (5.19) to (5.24) can be solved by Mathematica Softwarewith the initial conditions, conforming to the plasma, without dust. As t!1,d=dtð Þ ! 0, the solution conforms to the steady state, independent of the initial
conditions. Since the charge neutrality, expressed by (5.18) can be derived from(5.19), (5.20) and (5.21), it has been omitted in the analysis (as redundant).
Fig. 5.2 Dependence ofcharge of dust particles Zeand electron density ne, onthe number density of theparticles nd , for the standardset of parameters. The labelsa, b and c on the curves referto the dust of Cs coatedBronze, LaB6 and CeO2
respectively; solid and brokencurves correspond to left andright hand scales respectively(after Sodha et al. [23],curtsey authors andpublishers AIP)
5.4 Illuminated Complex Plasmas 127

Sodha et al. [23] have made a parametric analysis of the charge on the particlesand other plasma parameters by choosing the following set of standard parametersand study the effect of changing a single parameter keeping others unchanged.
ne0 ¼ ni0 � 3� 105�
cm3; n00 ¼ 103ne0; Te0 ¼ 800 K; Ti0 ¼ T00 ¼ 670 K;
Td ¼ 250 K; mei0 ¼ 480 s�1; mem0 ¼ 910 s�1; mim0 ¼ 100 s�1; vm ¼ 0:05;
a ¼ 5:0 l; Vi ¼ 9:3 eV; mi0 ¼ 30 amu; S ¼ 1:368� 106 ergs�
cm2;
Cp ¼ 4:47� 106 ergs�
gK; q ¼ 7:87 g�
cm3 and md ¼ 4=3ð Þ3q:
The computations correspond to the dust of Cs coated Bronze, LaB6 and CeO2
(as an illustration) with the work functions 1.5, 2.0, and 3.0 eV, respectively. Thedependence of the charge on the particles Ze and electron density ne for the dust ofthe three materials on the number density of the dust particles is shown in Fig. 5.2.
In this analysis, photoelectric emission is the only mechanism for the emissionof electrons from the surface of the dust particles, which has been considered.Other mechanisms viz. thermionic emission, electric field emission [20], light-induced field emission [19], and secondary electron emission [12] have also beenconsidered in other analyses.
References
1. P.M. Banks, Proc. I.E.E.E. 57, 258 (1959)2. S.J. Bauer, Physics of Planetary Ionospheres (Springer, New York, 1973)3. C. Cui, G. Goree, IEEE Trans. Plasma Sci. 22, 151 (1994)4. V.E. Fortov, A.P. Nefedov, O.S. Vaulina, A.M. Lipaev, V.I. Molotokov, A.A. Samarian, V.P.
Nikitski, A.I. Ivanov, S.F. Savin, A.V. Kalinikov, A. Ya Solov’ev, P.V. Vinogradov, J. Exp.Theor. Phys. 87, 1087 (1998)
5. V.E. Fortov, A.P. Nefedov, O.S. Vaulina, O.F. Petrov, I.E. Dranzhevski, A.M. Lipaev, Yu PSemenov, New J. Phys. 5, 102 (2003)
6. V.L Ginzburg, A.V Gurevich, Sov. Phys. Usp. 3, 115 (1960)7. J. Goree, Plasma Sources Sci. Technol. 03, 400 (1994)8. A.V. Gurevich, Some Nonlinear Phenomena in the Ionosphere (Springer, New York, 1978)9. T. Matasoukos, M. Russel, J. Appl. Phys. 77, 4285 (1995)
10. T. Matasoukos, M. Russel, M. Smith, J. Vac. Sc.Tech. A 14, 624 (1996)11. S. Misra, S.K. Mishra, M.S. Sodha, Phys. Plasmas 19, 043702 (2012)12. S. Misra, S.K. Mishra, M.S. Sodha, Phys. Plasmas 20, 013702 (2013)13. K.N. Ostrikov, M.Y. Yu, L. Stenflo, Phys. Rev. E 61, 4314 (2000)14. D.J. Rose, M. Clark, Plasmas and Controlled Fusion (John Wiley, New York, 1961)15. K.E. Shuler, J. Weber, J. Chem. Phys. 22, 491 (1954)16. F.T. Smith, J. Chem. Phys. 28, 746 (1958)17. F.T. Smith, in Proceedings of Third Conference on Carbon, University of Buffalo, Buffalo,
New York 1957, Pergamm Prev., New York, p. 301 (1959)18. M.S. Sodha, Brit. J. Appl. Phys. 14, 172 (1963)19. M.S. Sodha, A. Dixit, Appl. Phys. Lett. 95, 101502 (2009)
128 5 Kinetics of Complex Plasmas with Uniform Size Dust

20. M.S. Sodha, A. Dixit, G. Prakash, J. Plasma Phys. 76, 159 (2010)21. M.S. Sodha, A.Dixit, S. Srivastava, Phys. Rev. E 79, 046407 (2009), Erratum E 80, 06990
(2009)22. M.S. Sodha, S.K. Mishra, S. Misra, Phys. Scripta 83, 015502 (2011)23. M.S. Sodha, S. Misra, S.K. Mishra Phys. Plasmas 16, 123705 (2009a), Erratum 17, 049902
(2010)24. L. Spitzer, Astrophys. J. 107, 6 (1948)25. T.M. Sugden, B.A. Thrush, Nature 168, 703 (1951)26. V.N. Tsytovich, Sov. Phys. Uspekhi 40, 53 (1997)27. V.N. Tsytovich, G.E. Morfill, Plasma Physics Rep. 28, 171 (2002)28. V.N. Tsytovich, G.E. Morfill, S.V. Vladimirov, H.M. Thomas Elementary physics of complex
plasmas, (Springer, Berlin, 2008)29. S.V. Vladimirov, Phys. Plasmas 1, 2762 (1994)
References 129

Chapter 6Kinetics of Flowing Complex Plasma
6.1 Introduction
In the last chapter, the kinetics of a uniform, isotropic, and stationary complex plasmawith dust particles of uniform size has been discussed. However frequently, theplasma exhibits a drift relative to the dust particles; it is a common feature in rfdischarge laboratory experiments and the charging of satellites, spacecraft, andmeteors/meteorites in the ionospheric and near earth space plasmas [2–5, 12, 15, 24].In such situations, the symmetrical nature of the charging phenomena breaks down,and the angular momentum of the accreting ions is no longer conserved. Thisasymmetric behavior modifies the accretion cross-section and velocity distributionfunction of electrons and ions, and in turn affects the particle charge and other plasmacharacteristics and transport properties. In an elegant review, Whipple [24] analyzedthe charging of moving bodies (satellite and spacecraft) in space by applying thebalance between the various charging currents on the bodies; an expression for theion flux toward a moving spherical body, originally derived by Kanal [8] wasemployed. By reviewing the status of the subject, Melandso [11] pointed out that themesothermal flow (speed larger than thermal speed of ions but smaller than electronthermal speed) of plasmas with respect to dust is a typical situation in industrialplasmas and laboratory plasma experiments; in particular, the characteristic featuresof the crystal structure formation and their heating in a flowing plasma were dis-cussed. Discussing an interesting aspect of flowing plasma viz. meteor showering,Sorasio et al. [20] analyzed the dynamics and charging of a meteoroid entering in theEarth’s atmosphere by solving the simultaneous equations for conservation ofcharge, mass, momentum, and energy. The plasma flow occurring in the fabricationof devices and the interactions of flowing plasmas with near-wall impurities and/ordust significantly affects the efficiency and lifetime of such devices [21, 23]. Con-sidering the relevance of the complex plasmas characterized by relative motion ofdust and plasma to natural phenomena, laboratory experiments, nano/micro devicefabrication, fusion and industrial applications, the kinetics of such plasmas has beendiscussed in this chapter, and the charge distribution on the dust particles has beenobtained.
M. S. Sodha, Kinetics of Complex Plasmas, Springer Series on Atomic,Optical, and Plasma Physics 81, DOI: 10.1007/978-81-322-1820-3_6,� Springer India 2014
131

6.2 Modification in Electron/Ion Accretion Currentto Particles
The electrons/ions in an isotropic plasma in equilibrium are characterized by theMaxwellian distribution function of energy; however, in the presence of a relativeflow of a plasma constituents, the distribution function gets modified to shiftingMaxwellian, which leads to a significant modification of the accretion current.Following Chap. 2, the shifting Maxwellian distribution [13] can be expressed as:
f cð Þ ¼ n pt2T
� ��3=2exp � c� Cð Þ2
.t2
T
h ið6:1Þ
where C is the velocity of electron/ions relative to the dust particle and t2T ¼
2kBT=mð Þ refers to the thermal speed.Utilizing the alternate method based on the OML approach, described in Sect.
2.3, the cross-section for electron/ion accretion on a dust particle surface (havingcharge Ze) may be expressed as [17]:
r cð Þ ¼ pa2 1� 2Vs
�mc2
� �ffi �; ð6:2Þ
where Vs ¼ �Ze2�
a� �
and the ± signs correspond to ions/electrons, respectively.Hence, the rate of accretion (nc) on the surface of the dust particle corre-
sponding to the shifted Maxwellian distribution [f(c)] of speeds is given by Mishraet al. [13].
ncðVsÞ ¼Z
c � r cð Þf cð Þd3c
¼ pa2n pt2T
� ��3=2Z
c 1� 2Vs
mc2
� �exp � c� Cð Þ2
t2T
" #
d3c
¼ pa2n pt2T
� ��3=2Z1
0;Vs
Z1
�1
c 1� 2Vs
mc2
� �exp � c2 þ C2 � 2cC cos hð Þ
t2T
ð2pc2Þdcd cos hð Þ
¼ pa2neð ÞtT
p1=2p
Z1
xm
x2 � ts
� �exp � x� pð Þ2h i
� exp � xþ pð Þ2h ih i
dx
ð6:3Þ
where ts ¼ 2Vs
�mt2
T
� �, p ¼ C=tTð Þ, x ¼ c=tTð Þ and x2
m ¼ ts for ts [ 0 and x2m ¼
0 for ts B 0, respectively. Using the accretion conditions viz. x2m ¼ ts, 0 corre-
sponding to ts [ 0 and ts B 0, respectively (6.3) gives for ts C 0.
nc tsð Þ ¼ pa2n� �
tT
.4p1=2p
� �2 pmexp �p2
n
� �� pnexp �p2
m
� �ffi �ffi
þp1=2 1� 2pmpnð Þ erf pmð Þ � erf pnð Þ½ �� ð6:4aÞ
132 6 Kinetics of Flowing Complex Plasma

and for ts \ 0,
nc tsð Þ ¼ pa2n� �
vT
�2p1=2p
� �2pexp �p2
ffi �þ 1þ 2p2 þ 2ts
� �p1=2erf p½ �
ffi �for ts \ 0; ð6:4bÞ
where pn = (ts1/2 - p) and pm = (ts
1/2 ? p).Further, the mean energy associated with the accreting electrons/ions can be
written as [13]:
Ec Vsð Þ ¼Z
m=2ð Þ c� Cð Þ2 c � r cð Þf cð Þ½ �d3c
¼ pa2n pt2T
� ��3=2Z
m=2ð Þ c� Cð Þ2c 1� 2Vs
mc2
� �exp � c� Cð Þ2
t2T
" #
d3c:
Following the algebraic treatment and simplifications, similar to that in deri-vation of the accretion current, one obtains for ts C 0
nc tsð ÞEc tsð Þ ¼ kBT pa2n� �
tT=8p1=2p� �
6 pmexp �p2n
ffi �� pnexp �p2
m
ffi �� �ffi
þ4t1=2s exp �p2
n
ffi �� exp �p2
m
ffi �� �
þp1=2 5� 6pmpnð Þ erf pm½ � � erf pn½ �ð Þ�
ð6:5aÞ
and for ts \ 0
nc tsð ÞEc tsð Þ ¼ kBT pa2n� �
tT
.4p1=2p
� �p 6� 4tsð Þexp �p2
� �ffi
þ p1=2 5þ 6ts þ 6p2� �
erf p½ �� :: ð6:5bÞ
Further, the mean energy associated with the accreting electrons/ions can beexpressed in the dimensionless form as ec = (Ec/kBT).
6.3 Kinetics
6.3.1 Charge Distribution
As discussed in the Chap. 5, the charge on a dust particle in a complex plasmaundergoes fluctuations around the mean charge due to the random nature of thedust charging processes (emission/accretion) [1, 6], (Sodha et al. [18]); this chargefluctuation leads to a charge distribution on the dust particles in the complexplasma. Matasoukas et al. [10, 11] have analyzed the charge distribution consid-ering a Markov process [22] in which the probability density is governed by amaster difference equation for the population balance ensuring the discrete natureof charge on the particles. Using this master difference equation, Sodha et al. [18]developed the statistical mechanics of the charge distribution on uniform size dust
6.2 Modification in Electron/Ion Accretion Current to Particles 133
particles in dark, thermal, and illuminated complex plasmas on the basis of thenumber and energy balance of the plasma constituents; the study shows goodagreement with the fluctuation theory [1], (Sodha et al. [18]) for large values ofcharge. Mishra et al. [13] have extended the theory of the charge distribution tostudy the effect of relative motion of dust and plasma system.
6.3.2 Master Equation for the Population Balance
In a complex plasma, the dust particles undergo random charging processes viz.emission of the electrons from and accretion of electrons/ions on the surface of thedust particles, the inherent charging processes can be represented as:
PZ�1 � PZ þ e; PZþ1 þ e� PZ and PZ�1 þ i� PZ :
where PZ refers to particles with charge Ze; e and i represent electrons and ions,respectively.
As discussed in Sect. 5.2, the population balance equation, describing thegeneration and depletion of dust particles with charge Ze can be written as [19]:
dnZ=dtð Þ ¼ nZþ1nec Z þ 1ð Þ þ nZ�1 nee Z � 1ð Þ þ nic Z � 1ð Þ½ �� nZ nee Zð Þ þ nic Zð Þ þ nec Zð Þ½ � ð6:6Þ
where nZ ¼ NZ=ndð Þ is the charge distribution viz. the fraction of particles carryinga charge Ze, nec, and nic refer to electron/ion accretion currents on the surface ofdust grain and nee represents the rate of electron emission from the dust particles.
6.4 Other Kinetic Equations
6.4.1 Conservation of Neutral Plus Ionic Species
As described in Chap. 5, for a plasma in the steady state
no þ ni ¼ n00 þ ni0 ¼ N constantð Þ; ð6:7Þ
where no and ni are the number density of neutral atoms and ions, respectively, andthe additional subscript ‘‘0’’ corresponds to number densities in dust-free plasmas.
6.4.2 Charge Neutrality
nd
XZ2
Z1
ZnZ ¼ ðne � niÞ: ð6:8Þ
134 6 Kinetics of Flowing Complex Plasma

To keep the algebra/mathematics tractable, one restricts the consideration to thevalues of Z lying between Z1 and Z2 Z1� Z � Z2
� �; nd is the number density of
dust particles, ne is the electron density and Z refers to the average charge on dustparticles. The values of Z1 and Z2 can be chosen arbitrarily such that nZ ? 0 forZ \ Z1 and Z [ Z2.
6.4.3 Electron and Ion Kinetics
dne nedt= dtð Þ ¼ bino � arnenið Þ � nd
XZ2
Z1þ1ð ÞnZnec Zð Þ �
XZ2�1ð Þ
Z1
nZnee Zð Þ
0
@
1
A ð6:9Þ
and
dni=dtð Þ ¼ bino � arnenið Þ � nd
XZ2�1ð Þ
Z1
nZnic Zð Þ ð6:10Þ
where bi is the coefficient of ionization, ar Teð Þ ¼ ar0T�ge cm3
�s is the coefficient
of recombination of electrons and ions [6], Te is the electron temperature and ar0
and g are constants.The first term on the right in both (6.9, 6.10) refer to the net gain in electron and
ion density per unit time on account of ionization of neutral atoms and electron–ion recombination processes, respectively. The second term represents the loss inelectron/ion density on account of the net accreting electron/ion flux over the dustparticle and electron emission.
6.4.4 Energy Balance for Electrons and Ions
ddt
32
kBneTe
� �¼ bin0ee � arneni 3kBTe=2ð Þ½ �
� nd
XZ2
Z1þ1ð ÞnZnec Zð Þeec Zð Þ �
XZ2�1ð Þ
Z1
nZnee Zð Þeee Zð Þ
2
4
3
5� Qec
ð6:11Þ
and
ddt
32
kBniTi
� �¼ bin0ei � arneni 3kBTi=2ð Þ½ � � nd
XZ2�1ð Þ
Z1
nZnic Zð Þeic Zð Þ � Qic:
ð6:12Þ
6.4 Other Kinetic Equations 135
Here (ee, ei) are the mean energies of electrons and primary ions produced byionization of neutral atoms, (eec, eic) are the mean energies (far away from thesurface) of electrons and ions accreting on the surface of the dust grain, eee refersthe mean energy of emitted electrons at a large distance from the surface of thedust grain, Ti is the temperature of the ionic species and the numerical values of ee/ei and bi can be evaluated in same way as in Sect. 5.3.
The first term on the right-hand side in (6.11) and (6.12) represents the netpower gained per unit volume by the electrons and ions through the ionization ofthe neutral atoms and electron–ion recombination. The next term corresponds tothe net power loss due to net electron and ion flux from the dust grain. The rest ofthe terms in both the equations represents the net power transferred to electrons(Qec) and ions (Qic) on account of elastic collisions between electrons, ions, andneutral species, respectively; the characteristic plasma elastic collisions have beendiscussed in detail in Chap. 5; usually Qec and Qic are negligible as compared tothe other terms.
For an arbitrarily chosen range of Z values, one can easily obtain the steadystate charge distribution and other plasma parameters (i.e. ne, ni, no, Te, Ti) bysimultaneous numerical integration of (6.6–6.12) for a given initial set ofparameters as t ? ?. The energy balance of neutral atoms/dust has been ignoredon account of their large thermal capacity and efficient energy exchange betweenthem; it is a good approximation to assume their temperature to be the same viz. T(hence no energy exchange). The neutral atom/dust energy balance can be writtenas in Sect. 5.3. To illustrate the effect of plasma flow on dust charging and thenumerical appreciation of the analysis a specific situation has been discussed inSect. 6.5.
6.5 Specific Situations (After Mishra et al. [13])
In this section, the kinetics of the uniformly dispersed mono-sized dust grains in agaseous complex plasma characterized by mesothermal flow has been analyzedand the charge distribution on the dust particles has been evaluated in mesothermalflow regime, which is a situation when the thermal velocity of electrons is muchhigher than the plasma flow speed te k Cð Þ across the dust particle while ionsmove with random velocity comparable to that of the plasma flow speed (ti & C).In the case of dark flowing plasmas, i.e., in the absence of electron emission fromthe dust particle, electron/ion accretion on the dust particles is only dust chargingmechanism; the numerical results correspond to the following set of parameters.
ne0 ¼ ni0 � 106�
cm3; n00 ¼ 1010�
cm3; Te0 ¼ 103 K; Ti0 ¼ 400 K; Td ¼ T ¼ 300 K;
mn � mi ¼ 20 amu; a ¼ 0:1 l; g ¼ 0:7; ar0 ¼ 10�7cm3�
s; nd ¼ 100 cm�3 and
p0 ¼ 2=3ð Þ1=2; p ¼ 2=3ð Þ1=2 C=tTið Þ:
136 6 Kinetics of Flowing Complex Plasma
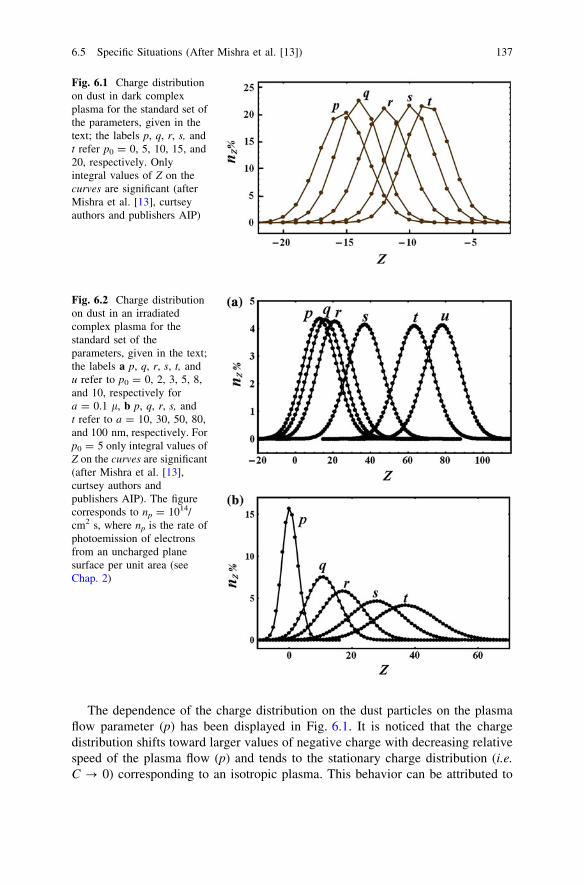
The dependence of the charge distribution on the dust particles on the plasmaflow parameter (p) has been displayed in Fig. 6.1. It is noticed that the chargedistribution shifts toward larger values of negative charge with decreasing relativespeed of the plasma flow (p) and tends to the stationary charge distribution (i.e.C ? 0) corresponding to an isotropic plasma. This behavior can be attributed to
Fig. 6.1 Charge distributionon dust in dark complexplasma for the standard set ofthe parameters, given in thetext; the labels p, q, r, s, andt refer p0 = 0, 5, 10, 15, and20, respectively. Onlyintegral values of Z on thecurves are significant (afterMishra et al. [13], curtseyauthors and publishers AIP)
Fig. 6.2 Charge distributionon dust in an irradiatedcomplex plasma for thestandard set of theparameters, given in the text;the labels a p, q, r, s, t, andu refer to p0 = 0, 2, 3, 5, 8,and 10, respectively fora = 0.1 l, b p, q, r, s, andt refer to a = 10, 30, 50, 80,and 100 nm, respectively. Forp0 = 5 only integral values ofZ on the curves are significant(after Mishra et al. [13],curtsey authors andpublishers AIP). The figurecorresponds to np = 1014/cm2 s, where np is the rate ofphotoemission of electronsfrom an uncharged planesurface per unit area (seeChap. 2)
6.5 Specific Situations (After Mishra et al. [13]) 137

the larger accretion of ions over dust surface on account of the availability of highenergy ions in a flowing plasma for large values of p.
Next we consider a complex plasma irradiated by a monochromatic source ofradiation and hence the photoelectric emission of the electrons from the dustsurface has been taken as an additional charging mechanism along with electron/ion accretion. The photoemission rate has been modified by including Mie Scat-tering factor as a function of dust size and wavelength of incident radiation; thecoefficient of Mie Scattering (mf) has been evaluated for monochromatic incidentradiation of wavelength k = 224.3 nm (corresponding to He–Ag+ laser) andsuspended dust grains of Na (with work function u = 2.3 eV) as a function of thesize parameter (2pa/k) from Web available computational program viz. MieScattering Calculator [16].
Charge distribution in the case of the illuminated flowing plasma has beendisplayed as a function of plasma flow parameter (p) and grain size (a) in Fig. 6.2.Large accretion of ionic species over dust surface on account of the presence ofhigh energy ions in the flowing plasma in addition to photoemission leads thecharge distribution on the dust grains widening and shifting toward more positivevalues; the effect is more pronounced with increasing particle radius.
References
1. C. Cui, J. Goree, IEEE Trans. Plasma Sci. 22, 151 (1994)2. V.E. Fortov, A.G. Khrapak, S.A. Khrapak, V.I. Molotkov, O.F. Petrov, Phys. Usp. 47, 447
(2004)3. V.E. Fortov, A.V. Ivlev, S.A. Khrapak, A.G. Khrapak, G.E. Morfill, Phys. Rep. 421, 01
(2005)4. C.K. Goertz, Rev. Geophys. 27, 271 (1989)5. J. Goree, Plasma Sources Sci. Technol. 03, 400 (1994)6. A.V. Gurevich, Nonlinear Phenomena in the Ionosphere (Springer, New York, 1978)7. Ch. Hollenstein, Plasma Phys. Control. Fusion 42, R93 (2000)8. M. Kanal, Theory of Current Collection of Moving Spherical Probes. Science Report, No. JS-
5, Space Physics Research Laboratory, University of Michigan, Ann Arbor, 19629. T. Matasoukas, M. Russel, J. Appl. Phys. 77, 4292 (1995)
10. T. Matsoukas, M. Russel, M. Smith, J. Vac. Sci. Technol. A14, 624 (1996)11. F. Melandso, Phys. Rev. E 55, 7495 (1997)12. D.A. Mendis, Plasma Sources Sci. Technol. 11, A219 (2002)13. S.K. Mishra, S. Misra, M.S. Sodha, Phys. Plasmas 18, 103708 (2011)14. G.E. Morfill, E. Grun, T.V. Johnson, Planet. Space Sci. 28, 1087 (1980)15. T.G. Northrop, Phys. Scr. 45, 475 (1992)16. S. Prahl, Mie scattering calculator, http://omlc.ogi.edu/calc/mie_calc.html17. M.S. Sodha, S. Guha, in Physics of Colloidal Plasma, ed. by A. Simon, W.B. Thomas.
Advantage of Plasma Physics, vol 4 (Interscience, New York, 1971), p. 21918. M.S. Sodha, S.K. Mishra, S. Misra, S. Srivastava, Phys. Plasmas, 17, 073705 (2010)19. M.S. Sodha, S.K. Mishra, S. Misra, Phys. Scr. 83, 015502 (2011)20. G. Sorasio, D.A. Mendis, M. Rosenberg, Planet. Space Sci. 49, 1257 (2001)
138 6 Kinetics of Flowing Complex Plasma

21. V.N. Tsytovich, G.E. Morfill, S.V. Vladimirov, H.M. Thomas, Elementary Physics ofComplex Plasmas (Springer, Berlin, 2008)
22. N.G. Van Kampen, Stochastic Processes in Physics and Chemistry (North Holland, NewYork, 1990)
23. S.V. Vladimirov, K. Ostrikov, A.A. Samarian, Physics and Applications of Complex Plasmas(Imperial College Press, London, 2005)
24. E.C. Whipple, Rep. Prog. Phys. 44, 1197 (1981)
References 139

Chapter 7Kinetics of the Complex Plasmas HavingDust with a Size Distribution
7.1 Introduction
The fact that the dust particles in complex plasmas, occurring in nature, laboratoryand engineering are not of the same size, but have a size distribution that has beenknown for a long time, but relatively few papers on the kinetics of the complexplasmas having a size distribution have been published. In this Chapter anapproach, based on number/energy balance of constituents, charge balance of theparticles, ionization/deionization mechanisms and Mie scattering have been given.
In early work [2–4, 10, 11], an intuitive rather than the appropriate [16, 17]expression for the photoelectric electron emission from a positively chargespherical particle was employed and the dependence of the absorption coefficientof light by a particle (Qa) on the size of the particle (as analyzed by Mie [13] wasignored. Further, the energy balance of the constituents of the complex plasma wasalso not considered.
Recently Sodha et al. [18] have analyzed the kinetics of a complex plasma, witha size distribution of dust, taking into account the charge balance on the particlesand the number and energy balance of the constituents; the dependence of Qa onsize was neglected in the analysis which is justified for particles with radius largerthan 1.5 = (10/2p) times the wavelength of the incident radiation, causing thephotoelectric emission. The analysis was of course applicable to dark plasmas,with or without thermionic emission from the dust particles. Considerable sim-plification in the analysis was made by using the fact that in the steady state, theelectric potential of the dust particles is independent of the particle size. Thisanalysis was extended to the case of a complex plasma, having dust of differentmaterials (with a size distribution) by Sodha et al. [19]. In a later paper [20] thedependence of Qa on size was also taken into account. The charge distribution,thus obtained is the distribution of the mean charge and does not take into accountthe discrete nature of the charge, whereby the charge on the particle can changeonly by a discrete amount viz the electronic charge. The charge distribution/fluctuation of charge on particles of a specific radius will be considered in a laterchapter.
M. S. Sodha, Kinetics of Complex Plasmas, Springer Series on Atomic,Optical, and Plasma Physics 81, DOI: 10.1007/978-81-322-1820-3_7,� Springer India 2014
141

7.2 Size Distribution
The size distribution of dust in a complex plasma depends on a number of pro-cesses, associated with the formation, coalescing/breakup and annihilation of theparticles. The size distribution of the dust in the interplanetary [5] and interstellar[8] space is given by the MRN [12] power law viz.
f að Þda ¼ Aa�sda; ð7:1Þ
where f(a)da is the number of particles per unit volume having radii between a and(a ? da), 0.9 \ s \ 4.5 for the interplanetary space, s & 3.5 for the interstellarspace and A is a normalizing constant given by
nd ¼ A
Za2
a1
f að Þda; ð7:2Þ
where a1 and a2 denote the extreme limits of the radii in the region characterizedby the size distribution function f(a) and nd is the number density of the dustparticles.
Raadu [14], in an investigation on electrostatic waves in a complex plasma,with size distribution of dust assumed that f(a) varies exponentially with mass forlarge size and according to a power law for smaller particles; both the features areinherent in the Kappa distribution [15] of the size of dust particles, given by
f að Þda ¼ Aa�s exp �a3a3� �
da; ð7:3Þ
where A, a, and s are constants.The two useful parameters, which are determined by the size distribution viz.
mean and root mean square values of the radius of the dust grains, are given by
�a ¼Za2
a1
af ðaÞda
0
@
1
A, Za2
a1
f ðaÞda
0
@
1
A ¼ am ð7:4aÞ
and
a2 ¼Za2
a1
a2f að Þda
0
@
1
A, Za2
a1
f að Þda
0
@
1
A ¼ a2rms: ð7:4bÞ
The parameters am and arms can be evaluated for the power law distribution bystraightforward integration. The value of am and arms for the Kappa distributionhave been tabulated by Sodha et al. [18].
142 7 Kinetics of the Complex Plasmas Having Dust with a Size Distribution
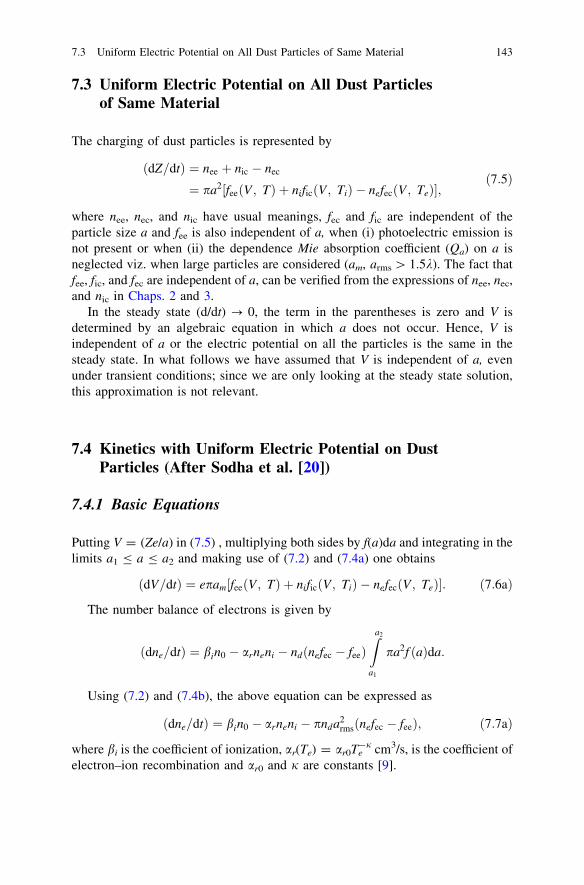
7.3 Uniform Electric Potential on All Dust Particlesof Same Material
The charging of dust particles is represented by
dZ=dtð Þ ¼ nee þ nic � nec
¼ pa2 fee V ; Tð Þ þ nific V; Tið Þ � nefec V ; Teð Þ½ �;ð7:5Þ
where nee, nec, and nic have usual meanings, fec and fic are independent of theparticle size a and fee is also independent of a, when (i) photoelectric emission isnot present or when (ii) the dependence Mie absorption coefficient (Qa) on a isneglected viz. when large particles are considered (am, arms [ 1.5k). The fact thatfee, fic, and fec are independent of a, can be verified from the expressions of nee, nec,and nic in Chaps. 2 and 3.
In the steady state (d/dt) ? 0, the term in the parentheses is zero and V isdetermined by an algebraic equation in which a does not occur. Hence, V isindependent of a or the electric potential on all the particles is the same in thesteady state. In what follows we have assumed that V is independent of a, evenunder transient conditions; since we are only looking at the steady state solution,this approximation is not relevant.
7.4 Kinetics with Uniform Electric Potential on DustParticles (After Sodha et al. [20])
7.4.1 Basic Equations
Putting V = (Ze/a) in (7.5) , multiplying both sides by f(a)da and integrating in thelimits a1 B a B a2 and making use of (7.2) and (7.4a) one obtains
dV=dtð Þ ¼ epam fee V; Tð Þ þ nific V; Tið Þ � nefec V ; Teð Þ½ �: ð7:6aÞ
The number balance of electrons is given by
dne=dtð Þ ¼ bin0 � arneni � nd nefec � feeð ÞZa2
a1
pa2f að Þda:
Using (7.2) and (7.4b), the above equation can be expressed as
dne=dtð Þ ¼ bin0 � arneni � pnda2rms nefec � feeð Þ; ð7:7aÞ
where bi is the coefficient of ionization, ar(Te) = ar0Te-j cm3/s, is the coefficient of
electron–ion recombination and ar0 and j are constants [9].
7.3 Uniform Electric Potential on All Dust Particles of Same Material 143

Similarly, the number balance of ions can be expressed as:
dni=dtð Þ ¼ bin0 � arneni � pnda2rmsnific: ð7:8aÞ
Since the charge neutrality can be derived from (7.5), (7.7a), and (7.8a), it is notconsidered separately. The energy balance for electrons and ions can be expressedas:
ddt
32
kBneTe
� ffi¼ bin0Ee � arneni 3kBTe=2ð Þ � pnda2
rms nefeceec � feeeeeð Þ ð7:9aÞ
and
ddt
32
kBniTi
� ffi¼ bin0Ei � arneni 3kBTi=2ð Þ � pnda2
rmsnificeic: ð7:10aÞ
Further
n0 þ ni ¼ n00 þ ni0 ¼ Nt : ð7:11Þ
Expressions for fee, fic, fec, Ee, Ei, eec, and eic are given in Chaps. 2 and 3. Forthe sake of simplicity, the temperatures of dust and neutral species may be taken tobe T (known).
The system of equations (7.6a–7.10a) and (7.11) may be solved, using Math-ematica software to obtain V, ne, ni, n0, Te, and Ti as functions of t. The initialconditions at t = 0 may be the ones, corresponding to Z = 0 and the plasma in theabsence of dust. As discussed earlier, the steady state values (t ? ?) of V, ne, ni,n0, Te, and Ti are independent of the initial conditions.
It is seen from equations (7.6a–7.10a) and (7.11), that the steady state kineticsof a complex plasma with dust having a size distribution is very similar to that ofthe complex plasma with the same number density of the dust particles of uniformradius equal to the root mean square radius of the particle size distribution. Theonly difference is that in the case of complex plasma with a size distribution thecharge on the particle is proportional to the radius. Thus, the charge distribution onthe particles with a size distribution can be expressed as:
F Zð ÞdZ ¼ A V=eð Þ1�sZ�sdZ MRN power lawð Þ ð7:12aÞ
and
F Zð ÞdZ ¼ A V=eð Þ1�sZ�s exp � ea=Vð Þ3Z3h i
dZ Kappa distributionð Þ: ð7:12bÞ
V is of course the same for all the particles and, the charge Ze on a particle ofradius a, as referred to here before is just the mean charge. The charge distributionon such particles is a normal distribution with the standard deviation rZ & 0.5 Z1/2
[6] when Z [ 30.
144 7 Kinetics of the Complex Plasmas Having Dust with a Size Distribution

7.4.2 Kinetics of the Complex Plasmas with a Mixtureof Dust of Different Materials: Uniform ElectricPotential Theory (After Sodha et al. [19])
Usually a mixture of dust of different materials is present in a complex plasma. Fordifferent applications, the electron density may be increased or decreased byaddition of dust of low or high work function. In such cases, one has to writeseparate equations for the electric potential on the jth species of dust and considerthe effect of all species of dust on the number and energy balance of the electrons/ions; hence the (7.6a–7.10a) are replaced by
dVj=dt� �
¼ epam;j fee;j Vj; T� �
þ nific; j Vj; Ti
� �� nefec; j Vj; Te
� �� �; ð7:6bÞ
dne=dtð Þ ¼ bin0 � arneni �X
j
pa2rms; jnj nefec; j � fee; j
� �; ð7:7bÞ
dni=dtð Þ ¼ bin0 � arneni �X
j
pa2rms; jnjnific; j; ð7:8bÞ
ddt
32
kneTe
� ffi¼ bin0Ee � arneni 3kTe=2ð Þ �
X
j
pnja2rms; j nefec; jeec; j � fee; jeee; j
� �
ð7:9bÞ
and
ddt
32
kniTi
� ffi¼ bin0Ei � arneni 3kTi=2ð Þ �
X
j
pnja2rms; jnific; jeic; j; ð7:10bÞ
Equation (7.11) is of course valid in this case.Thus one has (p ? 5) equations (j = 1, 2, …, p) to determine Vj and ne, ni, n0,
Te, and Ti when there are p species of dust. The fluctuation of charge on anindividual particle is as before viz. 0.5Zj
1/2; where Zj refers to the average chargeon the particle of radius aj. The set of equations can as before be solved by usingthe Mathematica software.
7.5 Kinetics of the Complex Plasma in ThermalEquilibrium
In the exploration of the kinetics of such systems in thermal equilibrium, twoapproximations have been made in some papers, viz.
(1) Applicability of Saha’s equation to the electron emission/accretion process inthe case of dust particles; this is only justified in the absence of ions (ideallyfor a dust-electron cloud system).
7.6 Inclusion of Mie Scattering by Dust in Complex Plasma Kinetics 145

(2) Using the number balance of electrons/ions with uncertain values of recom-bination/ionization coefficients (ar/bi) which are in general not consistent withSaha’s equation for the ionization of gases.
In this section following Sodha et al. [19] a formulation of the kinetics, which isfree of these handicaps is presented. As before only single ionization of atoms hasbeen allowed. Consider a number of species of gases (p) and number of species(j) of dust particles with a size distribution.
From Saha’s equation
nenip=n0p
� �¼ kp; ð7:12Þ
where kp = 2(2pmekBT/h2)3/2exp(-eIp/kBT) and Ip is the ionization potential of thepth gas.
The conservation of the sum of the ions and neutral atom densities of the pthgas requires
n0p þ nip ¼ np ð7:11Þ
From (7.11 and 7.12), one obtains,
nip ¼ xpnp= 1þ xp
� �; ð7:13Þ
where
xp ¼ ðkp=neÞ
Further the charging equation is [18]
ðdVj=dtÞ ¼ epamj½feejðVj; TÞ � nefecjðVj; TÞ þX
nipficpjðVj; TÞ� ð7:13bÞ
where Vj, amj, and armsj are the surface potential, mean radius and root mean radiusof the jth species of the dust; fee,j = nee,j/paj
2, fec,j = nec,j/paj2, and ficp,j = nicp,j/paj
2
are the rates of electron emission, electron accretion and accretion of ion of pth gasspecie on a particle of jth species of dust with a radius aj.
The equation for the charge neutrality takes the formXðVj=eÞnjam; j þ
Xnip ¼ ne ð7:14Þ
where Vj is the number density of the dust particles of the jth species. The systemof (7.11, 7.12, 7.13b, and 7.14) is adequate to determine Vj and ne, ni,j, n0,j.
7.6 Inclusion of Mie Scattering by Dust in Complex PlasmaKinetics (After Sodha et al. [20])
In most of the investigations on the kinetics of the complex plasma, particularly theones with a size distribution of dust, the number of photons, incident on the sphericalparticle of radius a per unit time is taken as Kpa2, where K is the number of photons
146 7 Kinetics of the Complex Plasmas Having Dust with a Size Distribution

incident per unit area on an infinite plane surface. However, Mie32 has long backpointed out that in general the number of photons, incident on a sphere ispa2K.Qa(2pa/k, l), where Qa is a function of (2pa/k) and the complex refractiveindex l of the material of the sphere and k is the wavelength of incident radiation.Sodha et al. [19] have investigated the kinetics of a complex plasma having dust withsize distribution governed by the MRN power law [12], taking into account thevariation of Qa with (2pa/k), as given by Mie theory [13]. In this section, it isproposed to present an outline of the approach to the kinetics and discussion of theresults, thus obtained for typical values of the relevant parameters. Since Qa is afunction of a, the uniform potential theory is not applicable, when photoelectriceffect is the only or dominant source of the electron emission from the dust. Hence,the rate of photoelectric emission (nph) as derived in Chap. 2, nph should be multi-plied by Qa; the expression for Eph or eph remains unchanged. The uniform potentialtheory is applicable, when the dust particles have a large radius so that Qa & 1.
It is convenient to proceed further in terms of the dimensionless radius q = (a/a0) and divide the region of the radii q1 \ q\ q2 in N(=100) regions; the jthregion is described by (qj - dq) \ q\ (qj ? dq) where 2dq = 0.1. The numberof particles in this region having the mean radius qj is given by
nj ¼ A0ndq�sj 2dqð Þ ¼ Bndq
�sj ð7:15aÞ
where
B ¼ 1=X
q�sj ð7:15bÞ
The conservation of number density of neutral atoms and ions requires
n0 þ ni ¼ n00 þ ni0 ¼ N: ð7:16Þ
The rate of charging of the dust particles in the jth region (qj -
dq) \q\ (qj ? dq) is given by
dZj=dt� �
¼ nic qj; Zj
� �� nec qj; Zj
� �þ nph qj; Zj
� �: ð7:17Þ
The number and energy balance of the electrons/ions may be expressed as:
dne=dtð Þ ¼ bin0 � arneni �XN
1
nj nec qj; Zj
� �� nph qj; Zj
� �� �; ð7:18Þ
dni=dtð Þ ¼ bin0 � arneni �XN
1
njnic qj; Zj
� �; ð7:19Þ
ddt
32
kBneTe
� ffi¼ bin0Ee � arneni 3kBTe=2ð Þ �
XN
1
nj nec qj; Zj
� �eec qj; Zj
� ��
�nee qj; Zj
� �eph qj; Zj
� ��ð7:20Þ
7.6 Inclusion of Mie Scattering by Dust in Complex Plasma Kinetics 147

and
ddt
32
kBniTi
� ffi¼ bin0Ei � arneni 3kBTi=2ð Þ �
XN
1
njnic qj; Zj
� �eec qj; Zj
� �; ð7:21Þ
The system of (7.16) and (7.17–7.21) can be solved (with a set of initial con-ditions, conforming to the absence of dust) to obtain the steady state (t ? ?)values of Zj and ne, ni, n0, Te, and Ti. As pointed out before the steady state valuesare independent of the initial condition.
For a numerical appreciation of the results, Sodha et al. [20] considered a complexplasma comprising of high work function pure ice particles suspended in a plasma,corresponding to near earth environment. Since ice has a high work function(8.7 eV), only the EUV part of the solar radiation is effective in causing the photo-electric emission of electrons from the surface of the particles. The only significantEUV radiation from the sun in the outer region of the earth is (3 9 1011 cm-2s-1)photons of Lyman Alpha radiation (k = 121.57 nm) [1]. The computed [7] depen-dence of Qa on (2pa/k) can to a very good approximation be expressed [20] as:
Qa ¼ 1:128� 1:31� 10�3� �
2pa=kð Þ � 1:125 exp �0:135 2pa=kð Þ1:277h i
: ð7:22Þ
For a parametric analysis of the results, the following set of parameters may bechosen and the effect of changing one of these, keeping others the same may bestudied.
ne0 ¼ ni0 � 105=cm3; n00 ¼ 103ne0; np ¼ 1012s�1cm�2; Te0 ¼ 1000 K;
Ti0 ¼ 400 K; T ¼ 250 K; 0.5� q� 100.5; n ¼ 73.61ðcorresponding to
Lyman� a radiation and u ¼ 8.7 eVÞ; a0 ¼ 0.01 lm; nd ¼ 103cm�3;
mi ¼ 30 amu; m0 � mi; s ¼ 2; j ¼ 1.2 and ar0 ¼ 5� 10�7cm3=s:
Some of the results are presented in Fig. 7.1; it is seen that (i) the charge on theparticles increases with increasing number density of the particles and (ii) since Qa
Fig. 7.1 Dependence of thecharge Z on the dust particles,on the particle radius q(=a/a0);p, q, r, s, t, and u refer tond = 50, 100, 500,1000, 5,000, and10,000 cm-3, respectively,the plasma parameters are pertext, following (7.19) (afterSodha et al. [20], curtseyauthors and publishers AIP)
148 7 Kinetics of the Complex Plasmas Having Dust with a Size Distribution

increases with increasing radius of the particle, the photoelectric emission from thesmaller particles gets reduced in a much larger proportion compared to the case oflarge particles, for which Qa & 1. This leads to the interesting conclusion, evidentfrom the figure that in some conditions the large particles are positively chargedwhile small particles are negatively charged. This is in contrast to the case (Sect.7.3), when Mie scattering is neglected; then all the particles carry the charge ofsame sign, which is proportional to radius. The other dependences have beenillustrated and discussed by Sodha et al. [20].
References
1. S.J. Bauer, Physics of Planetary Ionosphere (Springer, New York, 1973)2. L. Bringol-Barge, T.W. Hyde, Adv. Space Res. 29, 1277 (2002)3. L. Bringol-Barge, T.W. Hyde, Adv. Space Res. 29, 1283 (2002)4. L. Bringol-Barge, T.W. Hyde, Adv. Space Res. 29, 1289 (2002)5. J.A. Burns, M.R. Showalter, G.M. Morfill, The Ethereal Rings of Jupiter and Saturn in
Planetary Rings, ed. by R. Greenberg, A. Braphic (The University of Arizona Press, Tuscon,1984), p. 200
6. C. Cui, J. Goree, IEEE Trans. Plasma Sci. 22, 151 (1994)7. J. Dorschner, Astr. Nach. 292, 71 (1908)8. B.T. Draine, B. Sutin, Astrophys. J. 320, 803 (1987)9. A.V. Gurevich, Nonlinear Phenomena in the Ionosphere (Springer, New York, 1978)
10. O. Havnes, T.K. Aanesan, F. Melandso, J. Geophys. Res. 95, 6581 (1990)11. H. Houpis, E.C. Whipple, J. Geophys. Res. 92, 12057 (1987)12. J.S. Mathis, W. Rumpl, K.H. Nordsieek, Astrophys. J. 217, 425 (1977)13. G. Mie, Ann. Phys. Leipzig 25, 377 (1908)14. M.A. Raadu, IEEE Trans. Plasma Sci. 29, 182 (2001)15. M. Shafiq, Doctoral thesis on Test charge response of a dusty plasma with grain size
distribution and charging dynamics, Space and Plasma Physics, School of ElectricalEngineering, Royal Institute of Technology, Stockholm, 2006
16. M.S. Sodha, Brit. J. Appl. Phys. 14, 172 (1963)17. M.S. Sodha, S. Guha, Physics of Colloidal Plasma, Adv. Plasma Phys., ed. by A. Simon,
W.B. Thomas. Interscience, vol 4 (Wiley, New york, 1971), p. 21918. M.S. Sodha, S. Mishra, S.K. Mishra, Phys. Plasmas 17, 113705 (2010)19. M.S. Sodha, S.K. Mishra, S. Misra, IEEE Trans. Plasma Sci. 39, 1141 (2011)20. M.S. Sodha, S.K. Mishra, S. Misra, J. Appl. Phys. 109, 01303 (2011)
7.6 Inclusion of Mie Scattering by Dust in Complex Plasma Kinetics 149

Chapter 8Theory of Electrical Conduction
8.1 Phenomenological Theory (After Sodha [2])
Soon after the discovery of the electron, the flow of the electrical current (syn-onymous with the transport of charge) in the ionized gases was ascribed to themovement of electrons and ions, along and counter (respectively) to the directionof the applied electric field. On account of the heavier mass of ions, the role of ionsin the electrical conduction is not significant and hence not taken into account inthis chapter. A theory of electrical conduction, based on the average behavior ofelectrons/ions is usually referred to as the phenomenological theory. This theorybrings out the physics of the electrical conduction, but it ignores the energy/velocity distribution of electrons/ions.
8.1.1 Motion of Electrons
The motion of an electron in the presence of a constant electric field E is in the firstinstance expressed by
dt=dtð Þ ¼ � eE=með Þ; ð8:1Þ
where t is the drift (or average) velocity of the electrons in the direction of theelectric field (the average of random velocities is of course zero because for anyvalue of random velocity trandom the value �trandomð Þ is equally probable) and -
e and me are the electronic mass and charge, respectively.On integration the above equation leads to an absurd conclusion that the drift
velocity t (shown later to be proportional to the electrical current density) keepsincreasing with time and does not attain a steady state value. This is contrary toexperience and one has to look for a damping term (or process), which would ensurea steady state. Collision of electrons (as may be seen in the following) representsa damping process, which leads to the steady state. One may define a collisionas an event, which randomizes a fraction (say ao) of the momentum of an electron.
M. S. Sodha, Kinetics of Complex Plasmas, Springer Series on Atomic,Optical, and Plasma Physics 81, DOI: 10.1007/978-81-322-1820-3_8,� Springer India 2014
151

If an electron has an average momentum met before collision, the momentum lostby the electron in a collision is aomet; it still retains an average momentumð1� aoÞmet. It should be emphasized that the space average of randomizedmomentum is zero. Hence, the force on an electron on account of collisions, i.e., therate of change of momentum is equal to the change in the momentum per collisionaomet, multiplied by the number of collisions per unit time m0. Thus the dampingforce Fm on an electron is given by
Fm ¼ �aometm0 ¼ �metme ð8:2Þ
where me ¼ aom0ð Þ refers to the electron momentum transfer collision frequency orsimply the electron collision frequency; the parameters ao and m0 do not occurseparately but only as aom0 and hence the use of me ¼ aom0ð Þ is physically moremeaningful. The negative sign of Fm indicates that it is a damping force withcorresponding negative rate of change (loss) of momentum. Hence, the equation ofmotion of an electron in a plasma can be rewritten as:
dt=dtð Þ ¼ � eE=með Þ � tme: ð8:3Þ
The above equation is equally applicable to the ordinary and complex plasmas,where electron collisions with other plasma constituents occur naturally. Thephysics of the electron collisions in complex plasmas and the expressions forcorresponding collision frequencies are given in Sect. 5.4.2.2. Without loss ofgenerality with t ¼ 0 at t ¼ 0 when an external electric field is switched on, oneobtains from (8.3)
t ¼ � eE=memeð Þ 1� exp �metð Þ½ �: ð8:4aÞ
It can be seen from (8.4a, b) that in the steady state t� sð¼ 1=meÞ the driftvelocity attains a value
to ¼ � eE=memeð Þ: ð8:4bÞ
Another parameter of basic interest is the drift mobility, which can be definedas:
le ¼ t=Ej jð Þ ¼ e=memeð Þ: ð8:5Þ
8.1.2 Current Density/Electrical Conductivity/Resistivity
Consider a cuboid (Fig. 8.1) of unit area of cross section and of length t, with itslength along the electric field. In unit time, all the electrons entering from left end(A) will travel a distance t and cross the unit area (shaded) at the right end (B);thus the charge flowing across the unit area per unit time, i.e., the current density isgiven by the number of such electrons, i.e., the number of electrons in the cuboid;thus
152 8 Theory of Electrical Conduction

J ¼ �neet; ð8:6Þ
where ne is the electron density of the plasma.Substituting for t from (8.4b) one gets
J ¼ rE; ð8:7Þ
where r ¼ 1=qð Þ ¼ nee2�
meme
� �¼ neele is the electrical conductivity and q
represents the resistivity.
8.1.3 Einstein Relation
Consider an isolated conductor, located in an electric field, which pushes theelectrons in the opposite direction, setting up an electron density gradient. In thesteady state, the net current density in the conductor on account of electron dif-fusion (caused by the density gradient) and the electric field should be zero. Thusone has
Jx ¼ eDe one=oxð Þ þ neeleE ¼ 0;
or,
De one=oxð Þ ¼ �neleE; ð8:8Þ
where De is the coefficient of diffusion.For partially ionized plasmas the density of electrons/ions, usually character-
ized by the Maxwellian Boltzmann distribution can be, expressed as:
ne xð Þ ¼ neoexp euðxÞ=kBTe½ �; ð8:9Þ
where uðxÞ is the electric potential corresponding to electric field E ¼ � ou=oxð Þx.Substituting for ne from (8.8), (8.9) reduces to
ðDe=leÞ ¼ ðkBTe=eÞ: ð8:10Þ
This relation is known as Einstein relation and is valid when the charge carriersobey classical (Boltzmann) statistics.
Fig. 8.1 Cuboid of unit areaof cross section and lengthequal to drift velocity
8.1 Phenomenological Theory (After Sodha [2]) 153

8.1.4 Electrical Conductivity in Presence of an AlternatingElectric Field
In the presence of an alternating electric field E ¼ E0exp ixtð Þ½ �, the equation ofmotion gets modified as
dt=dtð Þ þ tme ¼ � eE0=með Þexp ixtð Þ: ð8:11Þ
The steady state solution of (8.11) for the drift velocity of electron can bewritten as:
t ¼ Re�eE0
meðme þ ixÞ expðixtÞffi �
¼ Re ðtr � itiÞexpðixtÞ½ �
¼ trcosðxtÞ þ tisinðxtÞ½ �ð8:12Þ
where tr ¼ � eE0v0e
mex 1þv02eð Þ
ffi �, ti ¼ � eE0
mex 1þv02eð Þ
ffi �, and m
0
e ¼ me=xð Þ.The current density in this case can then be expressed as:
J ¼ rE ¼ �neet ¼ Re ðrr � iriÞE0expðixtÞ½ �¼ rrcosðxtÞ þ risinðxtÞ½ �E0;
ð8:13Þ
where rr ¼ nee2m0emexð1þm02e Þ
� �and ri ¼ nee2
mexð1þv02e Þ
� �.
It is interesting to notice that the drift velocity and hence the current densityhave a component in phase with the electric field while other one is out of phase byp=2ð Þ:
8.1.5 Electrical Conductivity in Presence of Magnetic Field
When an electric field (say E ¼ xEx þ yEy) and a magnetic field B ¼ zBoð Þ aresimultaneously operative, the equation of motion of an electron is
dt=dtð Þ þ met ¼ � e=með Þ Eþ 1=cð Þt� B½ �: ð8:14Þ
In terms of velocity components, this equation can be written as:
ðdtx=dtÞ þ metx ¼ �ðe=meÞEx � xcty ð8:15aÞ
and
dty
�dt
� �þ mety ¼ � e=með ÞEy þ xctx; ð8:15bÞ
where xc ¼ eB=mc:
154 8 Theory of Electrical Conduction

The z-velocity component is zero in the absence of any driving force in thez direction. In the steady state (i.e., dt=dt ¼ 0) and with a little algebra (8.15a, b)lead to
tx ¼ �e v0ecEx � Ey
� �
mexc 1þ v02ec
� �
!
and ty ¼ �eðEx þ v0ecEyÞmexcð1þ v02ecÞ
ffi �; ð8:16Þ
where m0ec ¼ me=xcð Þ.Hence, the two components of the current density are given by
Jx ¼ �enetx ¼ rjjEx � r?Ey
� �ð8:17aÞ
and
Jy ¼ �enetx ¼ r?Ex þ rjjEy
� �; ð8:17bÞ
where
rjj ¼nee2v0ec
mexcð1þ v02ecÞ
ffi �and r? ¼
nee2
mexcð1þ v02ecÞ
ffi �ð8:18Þ
It is remarkable that the expressions for rjj and r? are identical to those for rr
and ri, when the cyclotron frequency xc is replaced by the frequency of theapplied electric field x. It is noticed that (8.17a and b) provide two relationsbetween four parameters Ex;Ey; Jx and Jy and hence to uniquely define a rela-tionship between two parameters, an additional auxiliary condition has to bespecified. The popular auxiliary condition is Jy ¼ 0 which can easily be realized ifEy is measured by a potentiometer; this yields an important parameter viz. Hallcoefficient. Using (8.17a), (8.17b) the Hall coefficient RHð Þ may be expressed as:
RH ¼ Ey
�BoJx
Jy¼0¼ �1=enecð Þ: ð8:19aÞ
The nature (positive or negative charge) of the carrier and the number density ofthe carriers can thus be obtained from the knowledge of the Hall coefficient. In away, similar to that followed in the derivation of Hall coefficient it can be shownthat
Jx=Exð ÞJy¼0¼ e2ne
�meme
� �: ð8:19bÞ
This relation leads to the fact that in this particular situation the conductivity(i.e., r) is independent of the applied magnetic field Bo. Another auxiliary con-dition, which can be easily realized, is that by electric shorting in the y direction,i.e., Ey ¼ 0; relations similar to (8.18–8.19a, b) can be derived, as in the caseJy ¼ 0.
In the presence of an alternating electric field say E ¼ xEx þ yEy
� �exp ixtð Þ
,
an approach similar to that in Sect. 8.1.5 leads to
8.1 Phenomenological Theory (After Sodha [2]) 155

tx ¼ � e=með Þ me þ ixð ÞEx � xcEy
me þ ixð Þ2þx2c
!
and
ty ¼ � e=með Þ xcEx þ me þ ixð ÞEy
me þ ixð Þ2þx2c
!
; ð8:20Þ
Hence, in the oscillatory case the current density is given by Jexp ixotð Þ¼ xJx þ yJy
� �exp ixotð Þ
where Jx and Jy can be expressed by (8.17a, b) and
rjj ¼ nee2=me
� � me þ ixð ÞEx � xcEy
me þ ixð Þ2þx2c
!
and
r? ¼ nee2=me
� � xcEx þ me þ ixð ÞEy
me þ ixð Þ2þx2c
!
: ð8:21Þ
It is interesting to notice that the expressions for rjj and r? in this case areidentical to those in (8.19a, b) and can be obtained by substituting me þ ixð Þ for me
in (8.19a, b).
8.1.6 Nonlinear Effects: Hot Electrons
As seen in the earlier sections, the current density in a plasma is a linear functionof the electric field and the transport coefficients are independent of the electricfield. However, it is observed that at high electric fields this is no longer valid andthe relation between the current density and the electric field becomes nonlinear. Inthis section, a model to explain the nonlinearity has been discussed, which bringsout the essential physics of the nonlinear collision phenomena.
Consider, for example, a slightly ionized gas with dominant elastic electron-neutral atom collisions with a constant mean free path, which corresponds to
ve a T1=2e or ve ¼ ve0 Te=Tð Þ1=2; ð8:22Þ
where Te and T are the temperatures of the electrons and the gas.When an electric field is applied, the electrons gain energy from the electric
field and in the steady state transfer this energy to the neutral gas through colli-sions; such an energy transfer between the electrons and the gas takes place onlywhen the electrons are at a higher temperature than that of the gas. When thetemperature difference between the electrons and the gas is significant suchelectrons are known as hot electrons. The energy transfer per collision is
156 8 Theory of Electrical Conduction

De ¼ d32
kBTe �32
kBT
ffi �; ð8:23aÞ
where
d � 2me=M ð8:23bÞ
and M is the mass of the neutral atoms.The energy balance of electrons may be expressed as:
J: E ¼ neveDe ð8:24Þ
Using (8.22) and (8.23a, 8.23b), (8.24) leads to
loEð Þ2
3kBT=M¼ Te
T� Te
T� 1
ffi �¼ aE2; ð8:25Þ
where lo ¼ e=mvo is the electron mobility in the absence of the electric fieldTe ¼ Tð Þ and a ¼ l2
o
�3kBT=Mð Þ. The parameter 3kBT=Mð Þ is equal to the mean
square speed of the neutral atoms. Hence, Te=T is appreciably different from unitywhen the ratio of the drift velocity loE to the r.m.s speed of neutral atoms issignificant.
The current density J, corresponding to an electric field E can be obtained byevaluating Te from (8.25) and iið ÞJ from (8.7) and (8.22). Since (8.25) is quadraticand Te=T is positive, this can be done for any value of aE2. However, two casesare of much interest.
1. aE2 � 1; Te=Tð Þ � 1 and from (8.25), Te=T ¼ 1þ aE2; hence
J ¼ nee2
meveE ¼ e2ne
meveo
E ve=veoð Þ�1¼ r0E Te=Tð Þ�1=2¼ roE 1� aE2�
2� �
: ð8:26aÞ
where ro ¼ e2ne
�meveo is the electrical conductivity at low electric fields.
2. Similarly when aE2 � 1; Te=Tð Þ � 1 and Te=Tð Þ ¼ aE2ð Þ1=2from (8.25);
hence,
J ¼ e2ne
meveo
E: veo=veð Þ ¼ roE Te=Tð Þ�1=2¼ roa�1=4E1=2: ð8:26bÞ
Equations (8.26a) and (8.26b) indicate the departure from linearity.It is also interesting to consider the case when the electric field is very high,
leading to large electron temperatures, so that the dominant collisions are theinelastic ones; for simplicity, it may be assumed that the energy transfer from anelectron to the neutral atom in such a collision is a constant amount Deinð Þ. In thiscase the energy balance of the electrons may be written as.
8.1 Phenomenological Theory (After Sodha [2]) 157

rE2 ¼ ne:e2
meveE2 ¼ neve Deinð Þ or Dein=með Þ ¼ e=meveð Þ2E2
J ¼ ene e=meveð ÞE ¼ eneðDein=mÞ1=2:
ð8:26cÞ
Thus in this extreme case, there is a drastic departure from linearity and thecurrent density is independent of the electric field.
This theory can be extended to include alternate electric or/and magnetic fields.
8.2 Kinetic Theory (After Mishra and Sodha [1])
In contrast to the phenomenological theory, the transport phenomena can beinvestigated on the basis of the kinetic theory, which takes into account the energy/speed dependence of the electron collision frequency. The kinetic approach isbased on Boltzmann’s transfer equation, which explores the change in the electronvelocity distribution function on application of an electric field or any otherstimulus like temperature and density gradients.
8.2.1 Boltzmann’s Transfer Equation
This equation is primarily concerned with the electron velocity distributionfunction f x; y; z; tx; ty; tz; ; t
� �dx dy dz dtx dty dtz; which represents the number of
electrons in the phase space element d3rd3t ¼ dx dy dz dtx dty dtz at time t; inequilibrium the distribution function is isotropic and given by classical statistics as
fo ¼ A exp �mt2�
2kBTe
� �; ð8:27aÞ
the normalizing constant A is in terms of electrons density given by
ne ¼Z1
�1
Z1
�1
Z1
�1
A exp �mt2=2kBTe
� �dtxdtydtz
¼Z1
o
4pAt2 exp �mv2�
2 kB Te� �
dt;
ð8:27bÞ
where by A ¼ ne me=2pkBTeð Þ3=2:
158 8 Theory of Electrical Conduction

The triple integral has been replaced by a single one as in Chap. 2. Equation(8.27a) is valid for non degenerate plasma, which is in general the case for gaseousplasmas.
In the presence of an electric field or electron temperature/density gradient thedistribution function has an anisotropic component, which gives rise to thetransport of electronic charge and energy and causes electrical and thermalcurrents.
The distribution function f may vary with time on account of the velocity andacceleration of electrons; such a variation is known as drift variation ðDf Þd.Remembering that at time t þ dt, the electrons having the coordinates x� tzdt; y�tydt and z� tzdt and velocity components tx � axdt, ty�aydt and tz � azdt at timet will be characterized by the space and velocity coordinates x; y; z; tx; ty and tz attime t þ dt: In the interval between t and t þ dt, the electrons characterized byx; y; z; tx; ty;tz at time t have moved out of the phase space dx; dy; dz; dtx; dty; dtz.Hence,
Dfð Þd ¼ f x� txdt; y� tydt; z� tzdt; tx � axdt; ty � aydt; tz � azdt; t� �
� f x; y; z; tx; ty; tz; t þ dt� �
¼ � of
otþ tx
of
oxþ ty
oyþ tz
of
ozþ ax
of
otxþ ay
otyþ az
of
otz
� �dt:
or
of
ot
ffi �
d
¼ � of
otþ t � rf þ a � rtf
� �
To ensure a steady state
of
ot
ffi �
d
þ of
ot
ffi �
c
¼ 0;
where ofot
� �
edenotes the rate of change of f due to electron collisions.
Hence
of
otþ t � rf þ a � rtf ¼
of
ot
ffi �
c
: ð8:28Þ
This equation is known as Boltzmann’s transfer equation. In the presence ofelectric and magnetic field and linear gradient of electron density and temperature,the electron velocity distribution function can to a first approximation be written as
f t; rð Þ ¼ foðtÞ þX
tx=tð ÞFx tð Þ: ð8:29Þ
8.2 Kinetic Theory (After Mishra and Sodha [1]) 159

For isotropic collisions and validity of (8.29), it can be shown [3] that
of
ot
ffi �
c
¼� meðtÞ � f � foð Þ
þ Another termwhich takes into account the energy
exchange in collisions
ð8:30Þ
This another term can be readily written down only for elastic collisions;however, it is of little interest to complex plasmas since in complex plasmas thecollisions are primarily inelastic.
8.2.2 Electrical Current/Electrical Conductivity
Consider a uniform plasma with an electric field E ¼ iEx in the x direction. Thusr � f ¼ 0; ay ¼ az ¼ 0 and ax ¼ �eEx=me; then from (8.28), (8.29), and (8.30) oneobtains.
eEx
me� o
otxfoðtÞ þ tx=tð ÞFx tð Þ �
¼ metx
t xFx tð Þ
Since fo tð Þ � tx=tð ÞFx tð Þ
eEx
me� ototx� dfo
dt¼ eEx
me� dfo
dtx� tx
t¼ me �
tx
tFx tð Þ ð8:31Þ
or
Fx tð Þ ¼ eEx
meme
ofoot
The electrical current density Jx is given by
Jx ¼ �e
Zþ1
�1
Zþ1
�1
Zþ1
�1
tx fo tð Þ þ tx=tð ÞFx=t½ �dtxdtydtz
Putting for t2x its average value t2
�3,
Jx ¼ �e
Z1
o
4pt2
3� eEx
meme
df0
dtdt:
160 8 Theory of Electrical Conduction

Integrating by parts
Jx ¼e2
3meEx
Z1
o
4pt2foddt
t3
me
ffi �dt ¼ e2
�3me
� �Ex
Z1
o
ddt
t3�me
� �dne
where dne is the number of electrons per unit volume with speed between t andtþ dt:
Hence,
Jx ¼e2ne
3me
1t2
ddt
t3�me
� �� �Ex ¼ rjjEx; ð8:32aÞ
where \[ denotes average over the velocity distribution of electrons and re is theelectrical conductivity given by
r ¼ e2ne
3me
1t2
dd
t3�me
� �� �: ð8:32bÞ
When the electron collisions frequency m is independent of the electron velocity(as in the phenomenological theory)
r ¼ e2ne
�meme:
8.2.3 Other Transport Parameters
In a way, similar to that used in the Sect. 8.2.2 one can obtain [1, 3] expressions forthe other transport coefficients as follows:
De ¼ kBTe=3með Þ 1t2
ddt
t3
me
ffi �� �; ð8:33Þ
rr ¼e2ne
3me
1t2
ddt
met3
m2e þ x2
� �� �ð8:34aÞ
and
ri ¼e2ne
3me
1t2
ddt
xot3
m2e þ x2
� �� �; ð8:34bÞ
the expressions for rjj and r? are identical to (8.32a) and (8.32b), with x, replacedby xe, the cyclotron frequency of electrons.
The parameters De; rr; ri; rjj; and r? have been defined and correspondingexpressions based on the phenomenological theory given in Sect. 1.8 of thischapter.
8.2 Kinetic Theory (After Mishra and Sodha [1]) 161

In the presence of an electric field E ¼ iEx þ jEy
� �exp ixtð Þ and a magnetic
field B ¼ kB xc ¼ kxcð Þ the current density J is given by
Jx ¼ rjjEx � r?Ey
� �exp ixtð Þ ð8:35aÞ
and
Jy ¼ r?Ex � rjjEy
� �exp ixtð Þ ð8:35bÞ
where
rjj ¼e2ne
3me
1t2
ddt
ðme þ ixoÞt3
ðme þ ixoÞ2 þ x2c
" #* +
ð8:36aÞ
and
r? ¼e2ne
3me
1t2
ddt
xct3
ðme þ ixoÞ2 þ x2c
" #* +
ð8:36bÞ
8.2.4 Ohmic Power Loss
The Ohmic power loss per unit volume is given by [3]
(1) dc electric field
W ¼ r E2x ð8:37Þ
(2) de electric field with perpendicular magnetic field
W ¼ JxEx þ JyEy ¼ rjj E2x þ E2
y
� �ð8:38Þ
where Ey ¼ KtB (MHD generators); t ¼ kt
(a) Continuous electrodes
Ex ¼ 0; W ¼ rjj KtBð Þ2 ð8:39aÞ
(b) Segmented electrode
Jx ¼ 0;W ¼ rjj þ r2?=rjj
KtBð Þ2 ð8:39bÞ
162 8 Theory of Electrical Conduction

(3) Alternating electric field with perpendicular magnetic field
W ¼ e2ne
24me
ffi �A1A�1 þ A2A�2� � 1
t2
ddt
met3
ðxo � xcÞ2 þ m2e
!* +" #
þ 1t2
ddt
met3
xo þ xcð Þ2 þ m2e
!* +" # ð8:40Þ
where A1 ¼ Eox þ iEoy and A2 ¼ Eox � iEoy
The Ohmic power loss is an important term in the energy balance of electrons,for significant electric fields.
Fig. 8.2 vs and (ne=ne0)dependence on cdcE2 in thepresence of a dc field for thestandard set of parameters asstated in the text. The labelsp, q, and r refer to nd ¼10000; 1000 and 100
�cm3
respectively while solid andbroken lines refer to left- andright-hand scales,respectively (after Sodha [2],curtsey authors andpublishers AIP)
Fig. 8.3 Te=Te0ð Þ andTi=Ti0ð Þ dependence on
cdcE2; the parameters andlabels on the curve are thesame as in Fig. 8.2 (afterMishra and Sodha [1], curtseyauthors and publishers AIP)
8.2 Kinetic Theory (After Mishra and Sodha [1]) 163

8.3 Kinetics of Complex Plasma with a D.C. Electric Field
Consider a plasma with suspended dust having a size distribution. The uniformelectric potential on the dust particles Vs and the electron/ion, density/temperaturecan be obtained by simultaneous solution of (7.6a), (7.7a), (7.8a), (7.9a), (7.10a),and (7.11a). In the presence of a d.c. /alternating electric field with or without amagnetic field, the energy balance of electrons, expressed by Eq. (7.9a) getsmodified by the inclusion of the Ohmic loss, given by (8.37) to (8.40) of thisChapter in different cases. In this Chapter the case of a d.c. electric field, with W,given by (8.36a, b) has been considered as an example. Thus in the presence of a d.c.electric field one has to obtain the simultaneous solution of (7.6a), (7.7a), (7.8a), and(7.11), (8.37) for Ohmic loss, (8.32b) for electrical conductivity, and the following(modified energy balance of electrons) equation to obtain no;Vs; ne; ni; Te; Ti and theelectrical conductivity [from (8.30)]:
Fig. 8.4 re=re0ð Þ andDe=De0ð Þ dependence on
cdcE2 with re0 ¼ 11:11=Xmand De0 ¼ 103 m2
�s; the
other parameters and labelson the curve are the same asin Fig. 8.2 (after Mishra andSodha [1], curtsey authorsand publishers AIP)
Fig. 8.5 ts and ðTe=Te0Þdependence on cdcE2 in thepresence of a dc field for thestandard set of parameters asstated in the text. The labelsp, q, r, and s correspond toa ¼ 1:0; 0:5; 0:3 and 0:1lmrespectively while solid andbroken lines refer to left- andright-hand scales,respectively (after Mishra andSodha [1], curtsey authorsand publishers AIP)
164 8 Theory of Electrical Conduction

ddt
32
kBneTe
ffi �¼ binoEe � arneni 3kBTe=2ð Þ � nd � pa2
rms nefeceec � feceecð Þ þW
ð8:41Þ
Electron collisions with gaseous species can be taken into account as in Sect. 5.4.2.
For a numerical appreciation of the effect of the electric field, computationshave been made for the following set of standard parameters; the parametric studyis conducted by changing one parameter keeping others the same.
Standard parameters:
neo ¼ nio ¼ 1010�
cm3; noo ¼ 104neo; ðme=xcÞ ¼ 0:2; nd ¼ 104 cm�3; a ¼ 1 lm; Teo ¼ 1000 K; Tio
¼ 400 K; T ¼ Td ¼ 300 K; j ¼ 1; aro ¼ 10�7 cm3=s; cdc ¼ 4pe2=medenkBTeom2eo
� �reo ¼ 11:11=Xm½
and Deo ¼ 103 m2=s are thecomputed values for cdc ¼ 0:
The results of the computations have been illustrated in Figs. 8.2, 8.3, 8.4, 8.5,and 8.6. It is seen that an electric field can significantly affect the kinetics ofcomplex plasmas and the transports parameters.
In a similar manner the effect of the magnetic field and alternating electric fieldcan be investigated (see [1]).
References
1. S.K. Mishra, M.S. Sodha, Phys. Plasmas 20, 033701 (2013)2. M.S. Sodha, IAPT Bull. 31, 240 (2007)3. I.P. Shakarofsky, T.W. Johnston, M.P. Prachynski, The Particle Dynamics of Plasmas.
(Addison Wesley Publishing Co., Reading, 1966)
Fig. 8.6 re=re0ð Þ andDe=De0ð Þ dependence on
cdcE2, the parameters andlabels on the curve are thesame as in Fig. 8.5 (afterMishra and Sodha [1], curtseyauthors and publishers AIP)
8.3 Kinetics of Complex Plasma with a D.C. Electric Field 165

Chapter 9Electromagnetic Wave Propagationin Complex Plasma
9.1 Linear Propagation
9.1.1 Wave Equation
Electromagnetic phenomena in a medium are governed by Maxwell’s equations.As derived in all texts on electromagnetic theory, Maxwell’s equations lead to theequation for the propagation of an electromagnetic wave in an electrically neutralmedium. Nonlinear propagation of electromagnetic waves with uniform and non-uniform irradiance on the wave front have been explored.
r2E ¼ 2 l�
c2� � o2E
ot2þ 4pl
�c2
� � oJ
ot; ð9:1aÞ
whereE is the electric vector2 is the dielectric function of the mediuml is the magnetic permeability, andJ is the current density
The above equation is known as the wave equation and has been hereinexpressed in the Gaussian system of units; this system is the most popular one inplasma physics.
For complex plasmas of interest 2 ¼ 1 and l ¼ 1; thus for an electromagneticwave E ¼ jE0 exp ixtð Þ propagating in the z direction, (9.1a) reduces to
d2E0
dn2 ¼ � E0 � 4pi=xð ÞJ0½ �; ð9:1bÞ
where J ¼ jJ0 exp ðixtÞ and n ¼ ðxz=cÞ:
M. S. Sodha, Kinetics of Complex Plasmas, Springer Series on Atomic,Optical, and Plasma Physics 81, DOI: 10.1007/978-81-322-1820-3_9,� Springer India 2014
167

9.1.2 Complex Refractive Index for Linear Propagationin the Absence of a Magnetic Field
Substituting for J0 from (8.13) in (9.1b) one obtains
d2E0
dn2 ¼ �b2E0; ð9:2Þ
where
b2 ¼ 1� 4pri=xð Þ � i 4prr=xð Þ ¼ �nþ ikð Þ2
2n2 ¼ 1� 4pri=xð Þ2þ 4prr=xð Þ2n o1=2
þ 1� 4pri=xð Þ
2k2 ¼ 1� 4pri=xð Þ2þ 4prr=xð Þ2n o1=2
� 1� 4pri=xð Þ
and rr; ri are given by (8.13).
It is convenient to express 4pri=xð Þ, and 4prr=xð Þ, as 4pri=x ¼x2p
.m2 þ x2ð Þ
and 4prr=x ¼x2p m=xð Þ
�m2 þ x2ð Þ in the phenomenological theory approximation,
where xp ¼ ð4pnee2.
meÞ1=2, is known as the plasma frequency; the electron
collisions and collision frequency have been discussed in earlier chapters, specif-ically Sect. 5.4.2.
In the linear case, corresponding to low electric field J0 / E0, and rr; rið Þ, areindependent of E0; thus the solution of (9.2) may be written as
E ¼E0 exp iwtð Þ ¼ E1 exp i xt þ bnð Þ½ � þ E2 exp i xt � bnð Þ½ �¼E1 exp i xt � 2pn=kð Þz½ �f g exp �2pk=kð Þz½ �þ E2 exp i xt þ 2pn=kð Þz½ �f g exp 2pk=kð Þz½ �;
ð9:3Þ
where k ¼ 2pc=x is the wavelength of the wave in free space and E1 and E2 areconstants.
The first term on the RHS of (9.3) represents a wave, propagating in the zdirection, while the second term refers to a wave propagating in the opposite (�z)direction. In both the cases, n and k represent the refractive index and the atten-uation constant.
Sodha et al. [7] have shown that the amplitude and phase of an EM waveE exp½iðxt þ wÞ�, propagating in a nonlinear medium in the JWKB approximationare given by
E�1 dE=dn½ � ¼ �k � ð2l0Þ�1 dl0=dnð Þ ð9:4aÞ
or
bE2ffi ��1
d bE2� ��
dnffi �
¼ �2k � ðl0Þ�1 dl0=dnð Þ ð9:4bÞ
168 9 Electromagnetic Wave Propagation in Complex Plasma

and
dw=dnð Þ ¼ �nþ 0:5 dh=dnð Þ; ð9:4cÞ
where bE2ðnÞ is the dimensionless irradiance of the beam, n ¼ x=cð Þz is thedimensionless distance of propagation along the z axis, l ¼ l0 expð�ihÞ ¼ ðn� ikÞ,l0 ¼ ðn2 þ k2Þ1=2, tan h nð Þ ¼ k nð Þ=n nð Þ½ � and b ¼ e2m0
�3m2
ekBTx2� �
is a constant.It may be remembered that n, k, l0, and h are all functions of bE2.
Knowing n and k dependence on axial irradiance (bE2) of the EM beam, the setof (9.13) can be solved numerically to obtain the dependence of the irradiance(bE2) and phase (w) on the dimensionless distance of propagation (n).
9.1.3 Electromagnetic Propagation Along the MagneticField
An expression for the current density, corresponding to an electric field, repre-sented by E0 ¼ iE0x þ jE0y and a magnetic field B0 ¼ kB0; has been derived inChap. 8. After substitution for J0 from (8.21), (9.1b) can be written as
d2E0x
dn2 ¼ �E0x þ ð4pi=xÞJ0x ¼ �AE0x � BE0y ð9:5aÞ
and
d2E0y
dn2 ¼ BE0x � AEoy; ð9:5bÞ
where
A ¼ 1� ð4pi=xÞrk;B ¼ 4pi=xð Þr?
and rk=r? are given by (8.21). Equations (9.5a) and (9.5b) imply that E0x and E0y
are coupled. To proceed further, one may multiply (9.5b) by a and add it to (9.5a);thus.
d2
dn2 E0x þ aE0y
� �¼ � A� Bað ÞE0x � Aaþ Bð ÞE0y ¼ �b2ðE0x þ aE0yÞ; ð9:5cÞ
where b2 ¼ A� Ba and b2a ¼ Aaþ B; whence a2 ¼ �1 and a ¼ � i:Thus (9.5c) may be expressed as:
d2
dn2 E0x þ iE0y
� �¼ �b2
þ E0x þ iE0y
� �¼ � nþ � ikþð Þ2 E0x þ iE0y
� �ð9:6aÞ
9.1 Linear Propagation 169
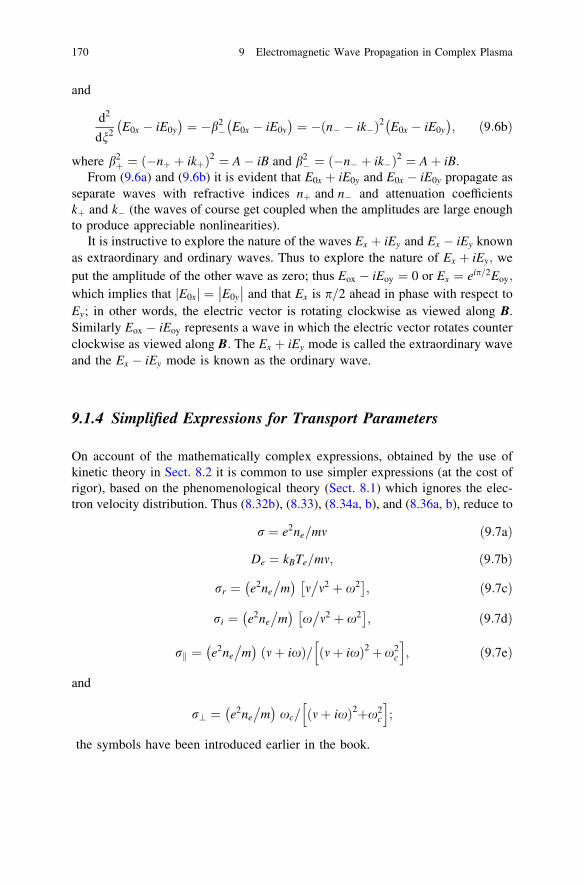
and
d2
dn2 E0x � iE0y
� �¼ �b2
� E0x � iE0y
� �¼ � n� � ik�ð Þ2 E0x � iE0y
� �; ð9:6bÞ
where b2þ ¼ ð�nþ þ ikþÞ2 ¼ A� iB and b2
� ¼ ð�n� þ ik�Þ2 ¼ Aþ iB:From (9.6a) and (9.6b) it is evident that E0x þ iE0y and E0x � iE0y propagate as
separate waves with refractive indices nþ and n� and attenuation coefficientskþ and k� (the waves of course get coupled when the amplitudes are large enoughto produce appreciable nonlinearities).
It is instructive to explore the nature of the waves Ex þ iEy and Ex � iEy knownas extraordinary and ordinary waves. Thus to explore the nature of Ex þ iEy; weput the amplitude of the other wave as zero; thus Eox � iEoy ¼ 0 or Ex ¼ eip=2Eoy;
which implies that E0xj j ¼ E0y
�� �� and that Ex is p=2 ahead in phase with respect toEy; in other words, the electric vector is rotating clockwise as viewed along B.Similarly Eox � iEoy represents a wave in which the electric vector rotates counterclockwise as viewed along B: The Ex þ iEy mode is called the extraordinary waveand the Ex � iEy mode is known as the ordinary wave.
9.1.4 Simplified Expressions for Transport Parameters
On account of the mathematically complex expressions, obtained by the use ofkinetic theory in Sect. 8.2 it is common to use simpler expressions (at the cost ofrigor), based on the phenomenological theory (Sect. 8.1) which ignores the elec-tron velocity distribution. Thus (8.32b), (8.33), (8.34a, b), and (8.36a, b), reduce to
r ¼ e2ne=mm ð9:7aÞ
De ¼ kBTe=mm; ð9:7bÞ
rr ¼ e2ne
�m
� �m�m2 þ x2
ffi �; ð9:7cÞ
ri ¼ e2ne
�m
� �x�m2 þ x2
ffi �; ð9:7dÞ
rk ¼ e2ne
�m
� �mþ ixð Þ= mþ ixð Þ2þx2
c
h i; ð9:7eÞ
and
r? ¼ e2ne
�m
� �xc= mþ ixð Þ2þx2
c
h i;
the symbols have been introduced earlier in the book.
170 9 Electromagnetic Wave Propagation in Complex Plasma

9.2 Physical Basis of Nonlinear Propagationof Electromagnetic Waves
In the presence of a low electric field, associated with an electromagnetic wave,propagating in a plasma, the Ohmic loss and consequent heating of electrons isnegligible and hence the temperature and composition of the complex plasmaremains almost unaltered. Under these conditions, the refractive index andabsorption coefficient may be evaluated by using the expressions, developed inChap. 8 (for rr and ri) and Sect. 9.1 (for n and k).
The physics of heating of electrons by an electric field has been developed inChap. 8 and an expression for the Ohmic loss per unit volume has been given.Basically, the electrons gain power from the electric field; the Ohmic loss or powergained by the electrons from the electric field per unit volume is just the product ofthe real part of the electrical conductivity and mean square value of the electricfield. Electrons also lose power in energy exchange during collisions. Hence, in thesteady state, the electrons acquire a higher temperature such that the Ohmic lossequals collisional loss; the electron density and electron temperature, thusget altered, affecting rr and ri and hence the propagation parameters; this changeof the propagation parameters (n and k) with the electric field gives rise to non-linear electromagnetic propagation. In such studies the electron collision fre-quency is as an important parameter.
The studies on the propagation of intense electromagnetic beams in complexplasmas, based on the number and energy balance of the constituents (consideredearlier in the book) and the electromagnetic wave equation should include thefollowing considerations.
(a) Generation and annihilation of ions/electrons in the gaseous component,(b) Elastic collisions of electrons with ions, neutral atoms, and dust particles,(c) Elastic collisions of ions with neutral atoms and elastic collision of ions with
dust particles may be ignored on account of the slow ion speeds,(d) Electron and ion accretion on dust particles,(e) Electron emission from the surface of the dust,(f) Energy exchange in the processes,(g) Number and energy balance of the constituents of complex plasmas,(h) Charge balance on dust particles,(i) Electrical neutrality follows from (g) and (h),(j) Electrical conduction in the complex plasma, and(k) Electromagnetic wave equation.
These phenomena and their impact on the number/energy balance equationshave been considered at length in the former Chapters of this book. The distin-guishing characteristics of the present approach are (i) inclusion of the Ohmic lossterm (Chap. 8) in the energy balance equation of electrons and the evaluation ofthe real and imaginary parts of the electrical conductivity as a function of the
9.2 Physical Basis of Nonlinear Propagation 171

electric field of the wave and (ii) using this dependence of the electrical con-ductivity on the electric vector of the wave to investigate specific nonlinear phe-nomenon through the electromagnetic wave equation.
In the rest of the chapter, the nonlinear propagations in dark and illuminatedcomplex plasma have been discussed and typical numerical results have beenpresented. Some interesting phenomena in PMSE plasmas have also been dis-cussed. Lastly, the self-focusing of electromagnetic beams in complex plasmas hasbeen investigated.
9.3 Nonlinear Complex Plasma Parameters
The basic parameters viz. neutral atom/electron/ion densities and temperatures andthe charge or charge distribution on the particles can be determined as indicated inChaps. 4, 5, and 7 by the simultaneous solution of equations representing conser-vation of charge, number density, and energy of the constituents; under the action ofan electric field, the Ohmic loss has to be accounted for in the energy balance ofelectrons. Besides electron density, the conduction parameters depend on theelectron collision frequency me; the dependence of me on the electron temperature hasbeen elucidated in Sect. 5.4.2. From a knowledge of the electron density and col-lision frequency, a number of transport parameters may be evaluated as discussed inChap. 8. The dependence of the transport parameters (n and k) on the electric fieldleads to a host of nonlinear phenomena like demodulation, cross modulation, har-monic generation, frequency mixing, self-focusing etc. associated with the propa-gation of high irradiance electromagnetic waves. The physics of these processes iswell known (e.g., Ginzburg and Gurevich [2], Gurevich [3] and Sodha et al. [8]) andis outside the scope of the present monograph. It is suffice to state that all thesephenomena are analyzed on the basis of the electric field dependence of therefractive index and attenuation factor; this has been adequately discussed before.
For a numerical appreciation of the nonlinear effects, Sodha et al. [9] haveanalyzed four specific situations viz.
(i) Effect of an applied electric field in a dark complex plasma,(ii) Effect of an applied electric field in an illuminated complex plasma,(iii) Effect of a periodic RF field on PMSE structures, and(iv) Self-focusing of Gaussian electromagnetic beam in a complex plasma.
The approach to such studies consists of
(a) Writing down the equations of the kinetics of complex plasmas as in Chap. 5viz. (i) conservation of total number of atoms and ions, (ii) charging of dustgrains, (iii) number and energy balance of electrons/ions/neutral atoms (theenergy balance for electrons has a term, corresponding to Ohmic loss), (iv)expressions for the electron collision frequency as per Sect. 5.4.2 and transportand propagation parameters and (iv) the electromagnetic wave equation.
172 9 Electromagnetic Wave Propagation in Complex Plasma
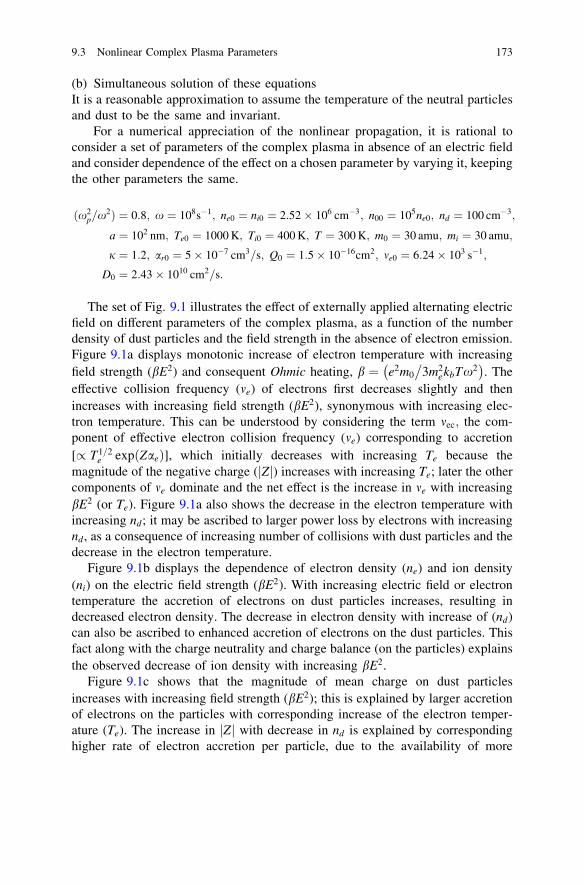
(b) Simultaneous solution of these equationsIt is a reasonable approximation to assume the temperature of the neutral particlesand dust to be the same and invariant.
For a numerical appreciation of the nonlinear propagation, it is rational toconsider a set of parameters of the complex plasma in absence of an electric fieldand consider dependence of the effect on a chosen parameter by varying it, keepingthe other parameters the same.
ðx2p=x
2Þ ¼ 0:8; x ¼ 108s�1; ne0 ¼ ni0 ¼ 2:52� 106 cm�3; n00 ¼ 105ne0; nd ¼ 100 cm�3;
a ¼ 102 nm; Te0 ¼ 1000 K; Ti0 ¼ 400 K; T ¼ 300 K; m0 ¼ 30 amu; mi ¼ 30 amu;
j ¼ 1:2; ar0 ¼ 5� 10�7 cm3=s; Q0 ¼ 1:5� 10�16cm2; me0 ¼ 6:24� 103 s�1;
D0 ¼ 2:43� 1010 cm2=s:
The set of Fig. 9.1 illustrates the effect of externally applied alternating electricfield on different parameters of the complex plasma, as a function of the numberdensity of dust particles and the field strength in the absence of electron emission.Figure 9.1a displays monotonic increase of electron temperature with increasingfield strength (bE2) and consequent Ohmic heating, b ¼ e2m0
�3m2
ekbTx2� �
. Theeffective collision frequency (me) of electrons first decreases slightly and thenincreases with increasing field strength (bE2), synonymous with increasing elec-tron temperature. This can be understood by considering the term mec; the com-ponent of effective electron collision frequency (me) corresponding to accretion[/ T1=2
e expðZaeÞ], which initially decreases with increasing Te because themagnitude of the negative charge ( Zj j) increases with increasing Te; later the othercomponents of me dominate and the net effect is the increase in me with increasingbE2 (or Te). Figure 9.1a also shows the decrease in the electron temperature withincreasing nd; it may be ascribed to larger power loss by electrons with increasingnd, as a consequence of increasing number of collisions with dust particles and thedecrease in the electron temperature.
Figure 9.1b displays the dependence of electron density (ne) and ion density(ni) on the electric field strength (bE2). With increasing electric field or electrontemperature the accretion of electrons on dust particles increases, resulting indecreased electron density. The decrease in electron density with increase of (nd)can also be ascribed to enhanced accretion of electrons on the dust particles. Thisfact along with the charge neutrality and charge balance (on the particles) explainsthe observed decrease of ion density with increasing bE2.
Figure 9.1c shows that the magnitude of mean charge on dust particlesincreases with increasing field strength (bE2); this is explained by larger accretionof electrons on the particles with corresponding increase of the electron temper-ature (Te). The increase in Zj j with decrease in nd is explained by correspondinghigher rate of electron accretion per particle, due to the availability of more
9.3 Nonlinear Complex Plasma Parameters 173

electrons per particle, for accretion. The increase in the coefficient of diffusion ofelectrons (De / T1=2
e ), with increasing bE200 is the net effect of corresponding
enhanced electron temperature and electron collision frequency, enhanced by a
Fig. 9.1 a Dependence of the temperature (Te) and effective collision frequency (me) of electronson the electric field strength (bE2) as a function of nd , for the standard set of parameters as statedin this section. The letters p; q; r; s; and t on the curves refer to nd ¼ 10; 50; 100; 500 and103 cm�3; respectively. The solid and broken lines correspond to ðTe=Te0Þ and ðme=me0Þ;respectively. b Dependence of the electron (ne) and ion (ni) densities on the electric field strength(bE2) as a function of nd . The parameters and labels are the same as given in (a). The solid andbroken lines correspond to ðne=ne0Þ and (ni=ni0), respectively. c Dependence of the magnitude ofmean charge ( Zj j) on dust particles and the coefficient of diffusion (De) of electrons on the electricfield strength (bE2), as a function of nd . The parameters and labels are the same as given in (a).The solid and broken lines correspond to (log10 Zj j) and ðDe=D0Þ; respectively. d Dependence ofthe refractive index (n) and the absorption coefficient (k) on the electric field strength (bE2), as afunction of nd . The parameters and labels are the same as given in (a). The solid and broken linescorrespond to (n) and ðkÞ; respectively. e Effect of the size of the dust particle on the magnitudeof the mean charge ( Zj j) on dust particles and the diffusion coefficient with the electric fieldstrength ðbE2Þ, for the standard set of parameters as stated in the text. The letters p, q, r, s, andt on the curves refer to a ¼ 0:01; 0:05; 0:1; 0:5 and 1:0 lm; respectively. The solid and brokenlines correspond to (log10 Zj j) and ðDe=D0Þ; respectively. (after Sodha et al. [9], curtsey authorsand publishers AIP)
174 9 Electromagnetic Wave Propagation in Complex Plasma

lesser extent. The nonlinear dependence of the complex refractive index (n� ik)for the complex plasma with bE2 and nd is illustrated in Fig. 9.1d. It is a conse-quence of the dependence of ne and me on bE2 (Fig. 9.1a and b).
Fig. 9.1 (continued)
9.3 Nonlinear Complex Plasma Parameters 175

Figure 9.1e indicates that the charge on the particles increases with increasingradius a of the particles; this is primarily due to enhanced accretion of electrons onthe particle, associated with larger size of the dust grains. It is seen (the figure isnot given here) that the electron temperature (and hence me) increases withdecreasing size of the dust grains; this is on account of lesser energy lost byelectrons due to their accretion on dust particle surface. The net effect is theincrease in coefficient of diffusion as indicated in Fig. 9.1e. The enhancement inthe electron temperature for the same mean square electric field is more in the caseof static field because rD [ rr. Thus it is seen that a radio wave leads to anenhancement in the coefficient of electron diffusion, which can cause disappear-ance of the PMSEs.
Computation indicates that case of illuminated plasma the dependence ofcharge Z on the coefficient of diffusion on bE2 and nd shows a trend similar to thecase of dark plasma. However the values of D2, are higher on account of largerelectron temperature.
9.4 PMSE Structures
Sodha et al. [9, 10] have among others discussed the physics of polar mesosphericsummer echoes (PMSE). At an altitude of around 82 km in the polar region, thelower ionosphere has sufficient electron density to cause enhanced radar backscattering (PMSE) this region which is characterized by the presence of ice par-ticles with radii between 3 nm to 20/80 nm. It has been pointed out by Rapp andLubken [6] that the increase in the coefficient of diffusion by increase of electrontemperature, caused by the electric field of a radio wave accounts for the disap-pearance of PMSEs by the incidence of a r.f. wave and its reappearance onswitching off the r.f. transmitter.
The electric field E0 at the PMSE altitudes can be estimated from the relation(Milikh et al. [4])
E0 ¼ ðPG=2pe0cz20Þ
1=2;
where P is the power of the transmitter, G is the antenna gain, e0 is the permittivityof free space, z0 is the PMC altitude and all parameters are in SI. Units. The otherparameters used in the computation are as follows:
x ¼ 2pð2:24� 108Þ s�1; ne0 ¼ ni0 ¼ 4:5� 103 cm�3
at 85 km day time ionosphericð altitudeÞn00 ¼ 1014; a ¼ 50 nm; Te0 ¼ Ti0 ¼ Td ¼ T ¼ 130 K; m0 ¼ 30 amu;
mi ¼ 30 amu; j ¼ 1:2; G ¼ 10; P ¼ 95 dB; w ¼ 3:16� 109 watt; z0 ¼ 85 km and
ar0 ¼ 5� 10�7 cm3=s: The data corresponds to bE20 � 19:
176 9 Electromagnetic Wave Propagation in Complex Plasma

Chilson et al. [1] have demonstrated that the RF-heating of electrons reducesthe echo power, associated with PMSE. This phenomenon has been attributed tothe enhancement of electron diffusivity causing reduction of electron densitygradients. There is no theory available which correlates the electron density gra-dients quantitatively to the electron diffusivity or other plasma parameters, but thefact that the gradient gets reduced by high values of diffusivity is obvious and wellappreciated.
Figure 9.2a shows the time dependence of the coefficient of electron diffusion,when transmitter is switched (Chilson et al. [1] ) ON or OFF, every 2 s. It is seenthat the electron diffusivity almost immediately (t � 0:1 s) acquires a steady-statevalue after switch ON or OFF. This is on account of the almost instantaneousresponse of the electron temperature to the changes in the electric field. It is seenthat the electron diffusivity gets enhanced by a factor of 4:5 after the field is
Fig. 9.2 a Transientcharacter of diffusivity(De=De1) of electrons inPMSE, for the standard setof parameters as stated inthe text with bE2 ¼ 20. Thepulse duration of the RF field(switching it on and off) is2 s. b Transient character ofcorresponding (a) electrondensity (ne=ne1) in PMSE, forthe standard set of parametersas stated in the text withbE2 ¼ 20. c Effect of RF fieldduration on the electrondensity (ne=ne1) in PMSEstructures as a function oftime, for the standard set ofparameters as stated in thetext with bE2 ¼ 20. Theletters p; q; r; s; t and u onthe curves correspond toton ¼ 2; 5; 10; 15; 20 and25 s; respectively (afterSodha et al. [9], curtseyauthors and publishers AIP)
9.4 PMSE Structures 177

switched on and comes back to original value after the field is switched off. Thecorresponding time dependence of the electron density is displayed in Fig. 9.2b. Itis seen that the electron density decreases after the field is switched on and itrecovers little in the next 2 s, when the field is switched off. This results in steadydecrease of electron density with time. The time needed for the electron density torelax is relatively large because the electron density is determined by the charging/discharging process of ice dust grains, where ions play an important part.Figure 9.2c shows the time dependence of the electron density when the electricfield is switched off after 2, 5, 10, 15, 20, and 25 s. The nature of the dependence iswell explained by what has been stated in the explanation of Fig. 9.2b. In thesefigures ne1 and De1 correspond to the electron density and diffusivity in field-freeplasmas with dust particles in PMSE structure.
9.5 Self-Focusing of a Gaussian Electromagnetic Beamin a Complex Plasma (After Mishra et al. [5])
9.5.1 Self-Focusing
Consider the propagation of an initially parallel electromagnetic beam with radi-ally decreasing irradiance in a complex plasma, characterized by increasingrefractive index with increasing irradiance. In such a complex plasma, the irra-diance and hence the refractive index is maximum near the axis of the beam and itdecreases with increasing radius. Hence the wave (phase) velocity of the elec-tromagnetic beam decreases with increasing distance from the axis. Hence aninitially parallel beam with a plane wave front will be transformed into anincreasingly concave wave front as the beam propagates in the plasma or in otherwords the beam gets increasingly focused as the beam propagates. Such a focusingcaused by the dependence of the dielectric function on the irradiance (or electricfield) of the wave is known as self-focusing. Since the magnitude of any nonlinearphenomenon depends on the radial distribution of the irradiance, this phenomenonaffects the magnitude of all the nonlinear processes; thus self-focusing should betaken into account in the evaluation of the magnitude of all nonlinear phenomenain a complex plasma. The dependence of the refractive index on irradiance EE�
has been discussed in Chap. 8 and Sect. 9.3.The nonuniform irradiance distribution of the beam causes nonuniform heating
of electrons. The electrons are hottest around the axis of the beam, which causeslargest electron accretion on the surface of dust particles; this results in the cre-ation of a depleted electron density channel around the axis, even when the dif-fusion of electrons/ions is taken into account. The depleted electron densitychannel is responsible for the self-focusing of the beam. Mishra et al. [5] haveanalyzed the phenomenon of self-focusing of a Gaussian electromagnetic beam ina complex plasma, taking into account
178 9 Electromagnetic Wave Propagation in Complex Plasma

(i) the paraxial theory of self-focusing, which means that all the terms may beexpanded to terms in r2=r2
0f 2
(ii) inhomogeneous Ohmic heating of electrons/ions due to the inhomogeneouselectric field of the beam and radial distribution of electron density/tempera-ture. Ohmic heating of ions has been neglected on account of their large mass,
(iii) evaluation of the net radial electron/ion currents due to the electron/iondensity and temperature gradients and space charge field (in steady state, theelectron and ion currents are equal in magnitude),
(iv) all parameters except the thermal conductivity and diffusion coefficientshave been expanded up to terms in r2
�r2
0f 2� �
, which is consistent with theparaxial approximation; the diffusion coefficient and the thermal conduc-tivity conform to electron/ion temperatures on the axis. (r0 is the initial beamwidth (at z ¼ 0) and f is the beam width parameter),
(v) corresponding to a low level of ionization, the density/temperature of theneutral gas atoms has been assumed to be constant,
(vi) generation and annihilation of electrons in the gaseous state,(vii) elastic collisions of electrons with ions, dust particles, and neutral atoms,(viii) elastic collisions of ions with neutral atoms (elastic collisions with dust
particles can be ignored on account of the slow speed of ions),(ix) accretion of electrons and ions on the surface of dust particles,(x) energy exchange between plasma constituents in the above processes,(xi) number and energy balance of all the constituents,(xii) charge balance on the dust particles,(xiii) electrical neutrality of the complex plasma [it follows from (xi) and (xii)
above], and (xiv) electromagnetic wave equation.
9.5.2 Net Flux of Electrons/Ions
Consider a complex plasma consisting of electrons, singly charged ions, neutralatoms, and uniform size spherical dust grains with radius a and charge Ze. The netflux of constituent species is given by
Ce ¼ �Derne � neleE� D0eneðrTe=TeÞ; ð9:8aÞ
Ci ¼ �Dirni þ niliE � D0
iniðrTi=TiÞ; ð9:8bÞ
and
Cd ¼ �Ddrnd � ndldE; ð9:8cÞ
where Ch, nh, Dh, ðnhD0
hÞ, lh, and E are the flux, density, diffusion coefficient,thermal diffusion coefficient, mobility, and ambipolar space charge field; thesubscript h refers to electrons (e), ions (i), and charged dust particles (d),respectively.
9.5 Self-Focusing of a Gaussian Electromagnetic Beam 179

In steady state, the net flux of positive and negative charges across a unit areashould be zero, thus one should have
Ci ¼ Cd þ Ce ð9:9aÞ
As a good approximation, the dust particles are assumed to be stationary onaccount of their large mass and hence Dd and ld may be put as zero. Thus (9.8c)gives Cd ¼ 0 and (9.9a) reduces to
Ce ¼ Ci ¼ C ð9:9bÞ
Using (9.8a), (9.8b), and (9.9b) the net flux of electrons (or ions) is given by
C ¼� Derne � D0eneðrTe=TeÞ � neleDirni � Derne þ D0iniðrTi=TiÞ � D0eneðrTe=TeÞ
ðnele þ niliÞ
�
¼� Di½c2nerni þ c1nirne� þ neniD0i½c2ðrTi=TiÞ þ c3ðrTe=TeÞ�ðnec2 þ niÞ
� ; ð9:10Þ
where D0h ¼ 5kTh=2mhmhð Þ, lh ¼ eDh=kThð Þ, Dh ¼ kTh=mhmhð Þ, c1 ¼ De=Dið Þ,c2 ¼ le=lið Þ; and c3 ¼ D0e
�D0
� �; Th, mh; mh; and Qhn correspond to the tempera-
ture, mass, effective collision frequency, and collision cross-section with neutralsof the charged species 0h0 (e is the numerical value of electronic charge and k isBoltzmann’s constant). In what follows D0e; D0i; De; Di; le and li correspond tothe parameters on the axis of the electromagnetic beam; thus the radial dependenceof these parameters has not been taken into account.
9.5.3 Complex Plasma Kinetics
The kinetics of complex plasma can be described by the following set of equations.
9.5.3.1 Charging of Dust Grains
ðdZ=dtÞ ¼ neeðZ; TÞ þ nicðZ; TiÞ � necðZ; TeÞ; ð9:11Þ
where neeðZ; TÞ is the rate of electron emission from the surface of a particle,necðZ; ne; TeÞ and nicðZ; ni; TiÞ are the accretion rates of electrons and ions on thesurface of the particle, and T is the temperature of the dust particles and neutralatomic species (assumed to be constant on account of their large heat capacities).
9.5.3.2 Electron and Ion kinetics
ðdne=dtÞ ¼ bin0 � arneni � ndðnec � neeÞ � rC ð9:12Þ
180 9 Electromagnetic Wave Propagation in Complex Plasma

and
ðdni=dtÞ ¼ bin0 � arneni � ndnic �rC; ð9:13Þ
wherebi is the coefficient of ionization, due to processes,
responsible for ionization in the absence (or presence)of dust particles
ar Teð Þ ¼ ar0T�je cm3
�s is the coefficient of recombination of electrons and ions
andar0 and j are constants.
The first two terms on the right-hand side of (9.5a), (9.5b), (9.5c), and (9.6a),(9.6b) correspond to the net gain in electron and ion density due to ionization ofneutral species and recombination of electrons and ions in the plasma. The nextterm in both the equations represents the net electron and ion currents, respec-tively, accreting on the surface of the dust particles. The last term in both theequations refer to loss in electron and ion density on account of diffusion ofelectrons and ions, respectively.
9.5.3.3 Neutral Kinetics
On account of the low level of ionization, the density of neutral atoms n0 may beconsidered to be constant, i.e.,
n0 ¼ n00; ð9:14Þ
where n00 refers to the neutral atom density in the absence of beam and dustparticles.
9.5.3.4 Charge Neutrality
The equation for charge neutrality may be expressed as
Znd þ ni � ne ¼ 0:
Since (9.8a), (9.8b,) and (9.8c) can be derived from the set of (9.4a), (9.4b) and(9.4c), (9.5a), (9.5b), (9.5c), and (9.6a), (9.6b), the equation of charge neutrality(9.8a), (9.8b) and (9.8c) has been omitted in further analysis.
9.5 Self-Focusing of a Gaussian Electromagnetic Beam 181

9.5.3.5 Electron and Ion Energy Balance Equations
ddt
32
kneTe
� ¼ bin0ee � arneni 3kTe=2ð Þ � nd neceec � neeeeeð Þ
þ 1r
o
orver
oTe
or
� þ e2neme
4meðm2e þ x2Þ
� EE�
ð9:15Þ
and
ddt
32
kniTi
� ¼ bin0ei � arneni 3kTi=2ð Þ � ndniceic þ
1r
o
orvir
oTi
or
� ; ð9:16Þ
where small energy exchange in elastic collisions is neglected,vh ¼ 5k2nhTh
�mhmh
� �; corresponds to the coefficients of thermal conductivities
of electrons and ions,
mei ¼ mei0 ni=ne0ð Þ Te=Te0ð Þ�3=2, is the electron collision frequency correspondingto elastic collisions with ionic species,
mei0 ¼ 5:5ne0=T 3=2eo
�ln 220Teo=n 1=3
e0
h i
men ¼ men0 n0=n00ð Þ Te=Te0ð Þ1=2 is the electron collision frequency correspondingto elastic collisions with neutral species,
men0 ¼ ð8:3� 105ÞQ0n00T1=2e0 ,
min ¼ minon0 Ti þ Tð Þ=n00 Ti0 þ Tð Þ,
min0 ¼16ffiffiffiffiffiffiffiffiffiffiffiffið2kT=pÞp
3 Qinn00ðTi0 þ TÞ1=2,me ¼ ðmed þ mec þ mei þ menÞ, is the effective collision frequency of electrons,mi ¼ ðmic þ minÞ, is the effective collision frequency of ions,mec ¼ nd nec=neð Þ, is the frequency of accretion of an electron on dust particles,mic ¼ nd nic=nið Þ, is the frequency of accretion of an ion on dust particles,
med ¼ med0ðTe=Te0Þ�3=2Z2 is the collision frequency corresponding to elasticcollisions with dust particles47,
med0 ¼ ð2:9� 10�6ÞndT�3=2e0 lnK (with ln K � 10),
Q0 is the collision cross-section of the electron-neutral elastic collisionQin is the collision cross-section of the ion-neutral elastic collisionmi is the mass of an ionic speciesm0 is the mass of a neutral atom andTj0 is the temperature constituent species in the absence of the dust grains and
field-free space, here j stands for electron (e) and ionic (i) species,respectively.
The first two terms in (9.9a), (9.9b), and (9.10) refer to the net gain in the meanenergy of electron and ionic species due to ionization of neutrals and recombi-nation of electrons and ions in the plasma. The next term in both the equationscorrespond to the net loss in energy of electrons and ions, due to their accretion on
182 9 Electromagnetic Wave Propagation in Complex Plasma

and electron emission from the surface of dust particles. The next term describesthe power loss per unit volume of electrons and ionic species on account of thebinary elastic collisions between electrons, ions, and neutral atomic species. Thenext term correspond to net power gain per unit volume of electrons and ions dueto thermal conduction. The last term in (9.9a), (9.9b) refers to the power gained byelectrons per unit volume due to Ohmic heating of electrons from the electric fieldof the beam; Ohmic heating of ions (which are much heavier) can be neglected.The radial dependence of ve and vi is not taken into account, for the sake ofconvenience; the values correspond to the parameters on the axis of the beam.
Due to the large thermal capacity of neutral atoms and dust particles andefficient energy exchange between them, it is a good approximation to assumetheir temperature to be the same viz. T (no energy exchange). The value of theionization coefficient (bi) may be determined by applying the electron kinetics indust-free plasmas; thus
bin00 ¼ arne0ni0 ¼ arn2e0; ð9:17Þ
where the suffix zero refers to the absence of dust.Further the mean energy of electrons and of ions generated due to ionization
may be obtained by imposing the initial conditions for dust-free plasma in theenergy balance equations; thus
ee ¼ 3kTe0=2 ð9:18aÞ
and
ei ¼ 3kTi0=2 ð9:18bÞ
9.5.3.6 Paraxial Approximation
The initial ðz ¼ 0Þ irradiance distribution of a Gaussian EM beam can beexpressed as
ðE20Þz¼0 ¼ E2
00 exp½�ðr2=r20Þ� ð9:19aÞ
where E00 is the amplitude of the electric vector and r0 is the beam width.In this approximation, the irradiance distribution in the complex plasma is
given by (Sodha et al. [8])
A20 ¼ ðE2
0=f 2Þ exp½�ðr2=r20f 2Þ�; ð9:19bÞ
where the beam width parameter f is a function of the distance of propagation z.As the expression suggests, most of the power of the beam is concentrated in a
region around central axis ðr ¼ 0Þ; paraxial ray approximation [i.e., ðr=r0f Þ � 1]
9.5 Self-Focusing of a Gaussian Electromagnetic Beam 183

has been adopted to study the propagation of Gaussian EM-beams. In this context,all the relevant parameters can be expanded around central maximum ðr ¼ 0Þ as
Xðr; zÞ ¼ XaðzÞ � ðr2=r20ÞXrðzÞ; ð9:20Þ
where XaðzÞ and XrðzÞ are the axial and radial parts of the parameter Xðr; zÞ.Substituting equations like (9.20) in the system of (9.10) to (9.13) naðzÞ and
nrðzÞ and hence eaðzÞ and erðzÞ can be evaluated.
9.5.3.7 Effective Dielectric Function of the Complex Plasma
The nonlinear complex dielectric function of the plasma is given by
eðr; zÞ ¼ eaðzÞ � ðr2=r20ÞerðzÞ; ð9:21aÞ
where the subscripts a and r refer to axial and radial parts of the dielectricfunction.
ea ¼ 1�x2
p
x2 þ m2ea
!
ðnea=ne0Þ ð9:21bÞ
er ¼x2
p
x2 þ m2ea
!ðnea=ne0Þmeamer
x2 þ m2ea
� ðner=ne0Þ�
; ð9:21cÞ
where xp ¼ 4pne0e2�
me
� �1=2is the plasma frequency in the absence of dust.
9.5.4 Propagation of Gaussian Electromagnetic Beam
Consider the propagation of a linearly polarized Gaussian EM-beam along thez-axis in a complex plasma with its electric vector polarized along the y-axis; theelectric field vector E for such a beam may be expressed in the cylindricalcoordinate system with azimuthal symmetry as
EðzÞ ¼ jE0ðr; zÞ expðixtÞ ð9:22aÞ
where ðE0Þz¼0 ¼ E00 exp½�ðr2=2r20Þ�, refers to the complex amplitude of the
Gaussian beam of initial beam width r0, E00 is a real constant characterizing theamplitude of the beam, j is the unit vector along the y-axis.
Starting from the wave equation and (9.21a), it can be shown (Sodha et al. [8])that
E20ðr; zÞ ¼ E2
00 ea 0ð Þ=ea zð Þ½ �1=2:1f 2
exp �r2=r20f 2ðzÞ
� �; ð9:22bÞ
184 9 Electromagnetic Wave Propagation in Complex Plasma

where the beam width parameter f is given by
eafd2f
dn2 ¼1f 3� q2
0f er
� � 1
2df
dn
� dea
dn
� ; ð9:22cÞ
n ¼ c�
r20x
� �z is the dimensionless distance of propagation; q0 ¼ r0x=cð Þ is the
dimensionless initial beam width.The critical curves are obtained by putting d2f
�d12
� �and df=d1ð Þ equal to zero
and f equal to unity in (9.22c). Thus
q20cer E2
00
� �¼ 1: ð9:22dÞ
Thus the critical curve expresses the relationship between the beam width (q0)and initial axial irradiance (bE2
00) for critical focusing.The dependence of the beam width parameter f on the dimensionless distance
of propagation 1 can be obtained by the numerical integration of (25b) after puttingsuitable expressions for ea and er, and using the initial boundary conditions f ¼ 1,df=dnð Þ ¼ 0 at n ¼ 0.
9.5.5 Numerical Results and Discussion
Standard set of parameters for which computations have been made are as follows:
x2p
.x2
�¼ 0:8;x ¼ 108 s�1; ne0 ¼ ni0 ¼ 2:52� 106 cm�3; n00 ¼ 1012 cm�3;
nd ¼ 100 cm�3; a ¼ 102 nm; Te0 ¼ 1000 K; Ti0 ¼ 400 K; T ¼ 300 K;m0 ¼ 30 amu;
mi ¼ 30 amu; j ¼ 1:0; ar0 ¼ 5� 10�7 cm3=s;Q0 � Qin ¼ 1:5� 10�16 cm2;
and me0 ¼ 6:24� 103 s�1; and the suffix 0 refers to the absence of dust and beams:
Fig. 9.3 Three regimes of beam propagation: Dependence of the dimensionless beam widthparameter f on the dimensionless distance of propagation n for the standard set of parameters asstated in the text. The labels p; q; and r refer to bE2
00 ¼ 2,2500 and 104; respectivelyb ¼ e2m0=6mex2kBTð Þ (after, Sodha et al. [9], curtsey authors and publishers AIP)
9.5 Self-Focusing of a Gaussian Electromagnetic Beam 185

Figure 9.3 illustrates the dependence of beam width parameter f on dimen-sionless distance of propagation n in a complex plasma; the figure indicates thepropagation of Gaussian EM-beam in three modes viz. steady divergence self-focusing and oscillatory divergence and as the power of the beam increases.
References
1. P.B. Chilson, E. Belova, M.T. Rietvald, S. Kirkwood, U.P. Hoppe, Geophys. Res. Lett. 27,3801 (2000)
2. V.L. Ginzburg, A.V. Gurevich, Sov. Phys. Uspekhi 3, 115 (1960)3. A.V. Gurevich, Nonlinear Phenomena in the Ionosphere (Springer, Berlin, 1978)4. G.H. Milikh, M.J. Freeman, L.M. Duncan, Radio Sci. 29, 1355 (1994)5. S.K. Mishra, S. Misra, M.S. Sodha, Phys. Plasmas 18, 043702 (2011)6. M. Rapp, J. Lubken, Geophys. Res. Lett. 27, 3285 (2000)7. M.S. Sodha, S.K. Mishra, S.K. Agarwal, IEEE Trans. Plasma Sci. 37, 375 (2009)8. M.S. Sodha, A.K. Ghatak, V.K. Tripathi, Self Focusing of Laser Beams in Plasmas and
Semiconductors in, Progress in Optics, vol. 13, ed. by E. Wolf, (North Holland & Co,Amsterdam, 1976) p. 169
9. M.S. Sodha, S.K. Mishra, S. Misra, Phys. Plasmas 18, 023701 (2011)10. M.S. Sodha, S. Misra, S.K. Mishra, Phys. Plasmas 18, 083708 (2011)
186 9 Electromagnetic Wave Propagation in Complex Plasma

Chapter 10Fluctuation of Charge on Dust Particlesin a Complex Plasma
10.1 Introduction
The charge on a dust particle in a plasma can fluctuate for two reasons. The spatial,temporal, and turbulent changes in the properties of the plasma may induce [2, 3, 8]fluctuations in the charge on the dust particles. The more important reason is thediscrete nature of charge on electrons, ions, and dust particles. Electrons and ionsare incident on the charged particles at random times, causing fluctuation of chargeZe on the dust particles (where -e is the electronic charge) even in a steady stateuniform plasma. Morfill et al. [7] anticipated that corresponding to normal distri-bution of charge fe on particles the root-mean square fluctuation of the charge isDf = r = (|Z|)1/2; however, using numerical simulation, Cui and Goree [1] con-cluded that Df = 0.5(|Z|)1/2, where Z is the mean charge on the particles.Matsoukas and Russel [5] and Matsoukas et al. [6] considered the charging of adust particle in a plasma as a one step Markov process [11] with the probabilitydensity governed by a master difference equation.
dnf
dt¼ nfþ1 nec fþ 1ð Þ þ nf�1 nee f� 1ð Þ þ nic f� 1ð Þ½ �
� nf nic fð Þ þ nec fð Þ þ nee fð Þ½ �;ð10:1Þ
where nf is the probability of a particle having a charge fe (which is the same asthe fraction of particles having a charge fe), nee(f) is the rate of electron emissionby a particle having a charge fe, and nec(nic) is the rate of electron/ion accretion onthe particles.
The analytical solution of the master equation was obtained by the sameworkers as
nf ¼ 1=rffiffiffiffiffiffi2pp� �
exp �ðf� ZÞ2.
2r2h i
for Z [ 30: ð10:2Þ
For a plasma having Maxwellian distribution of speed of electrons and ions, thestandard deviation r is given by Matsoukas and Russel [5] and Matsoukas et al. [6]
M. S. Sodha, Kinetics of Complex Plasmas, Springer Series on Atomic,Optical, and Plasma Physics 81, DOI: 10.1007/978-81-322-1820-3_10,� Springer India 2014
187

r2 ¼ 12
nic þ nec
n0ic � n0ec
ffi �
f¼Z
;
where nec and nic are the number of electrons and ions incident per unit time on aparticle of charge Ze and the primes denote the differential coefficient with respectto f. In case the particles emit nee electrons per unit time (10.2) gets modified to [9]
r2 ¼ 12
nic þ nec þ nee
n0ic � n0ec þ n0ee
ffi �
f¼Z
: ð10:3Þ
Khrapak et al. [4] have given an alternate derivation of (10.2), which they put ina different form. Some comments on Khrapaks, work are given later in the chapter.
Most of the work on the fluctuation of charge on the particles is based on theassumption that the dust does not significantly affect the electron/ion density andtemperature; expressions for nec and nic are based on the magnitudes of parametersin the absence of dust. Recently, as may be seen from the previous chapters,considerable work on the kinetics of complex plasma has been conducted con-sidering (i) ionization and electron–ion recombination in the gaseous phase,(ii) suitable expressions for the parameters, occurring in the kinetics equations,(iii) number cum energy balance of the constituents of the complex plasma, and(iv) charge balance on the particles. Thus, the effect of dust on the electron/ionnumber density and temperature gets accounted for and realistic values of nee, nec,nic and hence r2 can be obtained by using these values of ne, ni, Te, Ti and Z thusobtained. Such an approach for the investigation of fluctuation of charge on par-ticles has been adopted by Sodha et al. [9].
Another approach for determining the charge distribution on the particles in adust cloud (in the absence of neutral atoms and ions), is based on the use of steadystate (analogous to equilibrium) constants and takes account of the emission andaccretion processes, applicable to the particles. Two cases of electron emission viz.thermionic emission in a dust cloud in thermal equilibrium and photoelectricemission in an irradiated dust cloud have been analyzed [10].
In the following sections, we consider the cases of (i) complex plasma with dustparticles of uniform size and (ii) complex plasmas with size distribution of dust.
10.2 Fluctuation of Charge on Uniform Size Dust Particlesin a Complex Plasmas
10.2.1 Methodology
The starting point is the determination of the mean charge Z on the particles andthe electron/ion density and temperature in the complex plasma, following thelogic and methodology in the earlier chapters.
188 10 Fluctuation of Charge on Dust Particles in a Complex Plasma

Knowing ne, ni, Te, Ti, and Z the parameters nec, nic, nee and nec/ , nic
/ and nee/ can
be determined for f = Z. Hence r2 can be evaluated by using (10.3) in the casewhen Z [ 30. It is common to use a parameter a = r/Z1/2 in discussions on thesubject.
It should be remembered that (10.3) is valid only for Z [ 30. Hence if Z comesout to be less than 30, another approach is followed viz solution of a system ofequations analogous to (10.1) for Z1 \ f\ Z2, along with the number and energybalance of electrons/ions where Z1,2 = Z ; 2Z1/2.
10.2.2 Numerical Results and Discussion
Sodha et al. [9, 10] have considered three cases; corresponding to Z [ 30.
Case 1: Absence of electron emission from the particlesIf there is no emission process then accretion of electron and ions are the onlyprocesses, which lead to the charging of the dust grains. Thus, one may obtain themean charge and various relevant parameters by solving the equations of kinetics,as explained earlier in the book.
Case 2: Thermionic emissionIn this case, all the plasma constituent species have the same temperature; hence,the energy balance equations are not relevant. The mean charge on dust grain andother parameters can be obtained by solution of the equations of number/energybalance, charging of particles and equation for electrical neutrality.
Case 3: Photoelectric emissionIn case when photoelectric emission is the dominant electron emission process themean charge on the dust particle and other parameters may be estimated bysimultaneous solution of the relevant kinetics equations.
[On account of efficient energy exchange between abundant (high thermalcapacity) neutral atoms and dust particles, it is a good approximation to assumetheir temperatures to be the same viz. Tn = Td = T. The standard sets of param-eters for which computations have been made are as follows:
Case 1: Absence of electron emission from the particles
ne0 ¼ ni � 1010�
cm3; n00 ¼ 103ne0; Te0 ¼ 1000 K; Ti0 ¼ 400 K; T ¼ 300 K;
a ¼ 1:0 l; m0 � mi ¼ 30 amu; l ¼ 1:2; and ar ¼ 5� 10�7 cm3�
s:
Case 2: Thermionic emission
ne0 ¼ ni � 1010�
cm3; n00 ¼ 103ne0; Te0 ¼ Ti0 ¼ T ¼ 2000 K; nd ¼ 105 cm�3;
a ¼ 1:0 l; m0 � mi ¼ 30 amu; l ¼ 1:2 and ar ¼ 5� 10�7 cm3�
s
10.2 Fluctuation of Charge on Uniform Size Dust Particles in a Complex Plasmas 189

Case 3: Photoelectric emission
ne0 ¼ ni � 108�
cm3; n00 ¼ 103ne0; Te0 ¼ 1000 K; Ti0 ¼ 400 K; T ¼ 300 K;
n ¼ hm� ;ð Þ=kBT ¼ 20; a ¼ 1:0 l; nd ¼ 104 cm�3; m0 � mi ¼ 30 amu; l ¼ 1:2 and
ar ¼ 5� 10�7 cm3�
s:�
The set of Fig. 10.1a, b illustrates the dependence of the parameter a2(=r2/Z)(describing the charge fluctuation of a dust grain) and the mean charge on theparticle (Z/Z0) (Z0 is the mean charge on the dust grain for nd = 1) on the number
Fig. 10.1 a The dependence of the parameter a2(=r2/Z) and mean charge (Z/Z0) on the numberdensity of the dust particle nd, (in the absence of electron emission) for the standard set ofparameters as stated in Case 1 in the text. The letters on the curve a, b, c, d and e refer to theinitial electron density ne0 = 108, 109, 1010, 1011 and 1012 cm-3, respectively. Further the solidand broken curves correspond to left hand side scale (a2) and right hand side scale, respectively(Z/Z0) (after Sodha et al. [9], curtsey authors and publishers AIP). b The dependence of theparameter a2(=r2/Z) and mean charge (Z/Z0) on nd, (in the absence of electron emission) for thestandard set of parameters as stated in Case 1 in the text. The letters on the curve a, b, c, d ande refer to the radius of the dust particle a = 0.1, 0.3, 0.5, 0.8, and 1.0 l, respectively. Further thesolid and broken curves correspond to left hand side scale (a2) and right hand side scale,respectively (Z/Z0) (after Sodha et al. [9], curtsey authors and publishers AIP)
190 10 Fluctuation of Charge on Dust Particles in a Complex Plasma

density of the dust particles (nd) in a complex plasma when the accretion ofelectrons and ions are the only processes responsible for the charge on the parti-cles. Figure 10.1a indicates that the mean charge |Z| on the dust particles decreaseswith increasing nd and increases with increasing initial electron density.Figure 10.1b shows the dependence of (Z/Z0) and a on the size of the dust grains;the figure indicates smaller fluctuations for larger radii of the dust grains associatedwith larger values of |Z|. It is also significant to note that for the chosen parameters0.45 \ a\ 0.51 this agrees with the results predicted by simulation techniquesviz. a & 0.5 [1].
The set of Fig. 10.2a–c, describes the dependence of the parameter a2(=r2/Z)and the mean charge on the particle Ze on the work function of the material of thedust grains (u) in a complex plasma when thermionic emission is the significantmechanism for electron generation; accretion of electron and ionic species on theparticles has also been considered. Figure 10.2a indicates that the mean chargedecreases with increasing u and ne0. Further a increases sharply with increasingne0, due to larger electron accretion on the surface of the dust grain. The figureexcludes the region |Z| B 101.5(&30), (nec & nic) because in this region the der-ivation of (10.1) from the master difference equation is not valid. It can also beseen from the figure that for the case of negative charging of the dust grain (largeu), a is around 0.5. The dependence of Z and a2 on size and dust temperature havebeen displayed in Fig. 10.2b, c, respectively.
The set of Fig. 10.3a, b illustrate the dependence of the parameter a2 and themean charge on the particles Ze, on the parameter np in a complex plasma irra-diated by a monochromatic source of radiation when the photoemission is thesignificant charging process of the dust grains. The effect of size on the chargingand hence on a2 has been shown in Fig. 10.3a; the mean charge increases withincreasing np and increasing radius of the dust grains on account of larger pho-toemission. Figure 10.3b indicates increasing charge of the dust grains withincreasing n. Further a takes higher values in the case of positive charging withincreasing n; this may also be understood in terms of charging characteristics ofthe dust grains.
It is of some interest to compare the results of the present analysis with those ofKhrapak et al. [4]. For this purpose, it will be useful to take note of the differencein notation between the two analyses viz. I+ = nic ? nee, I- = nec, b = (dI/df)f=Z
and c = Ze2/akTe0; in both cases a ¼ Df=�Z1=2 has the same significance. SinceKhrapak et al. [4] formulation does not take into account the dependence of plasmaparameters on nd, the plasma parameters corresponding to Khrapak et al. [4] havebeen taken to be the parameters in the absence of dust; this analysis ignores ionsand thus conforms to a dust cloud (without gas or ions). In the absence of electronemission, a neutral gas number density n00 = 1012 cm-3 has been chosen forcomputational purpose. It is seen that the departure of our results with those ofKhrapak et al. [4] decreases as nd ! 1 or 0.
For the case of thermionic emission in dust cloud, the formulation is the same inboth the analyses and hence the results are in agreement.
10.2 Fluctuation of Charge on Uniform Size Dust Particles in a Complex Plasmas 191

192 10 Fluctuation of Charge on Dust Particles in a Complex Plasma

10.3 Fluctuation of Charge on Dust Particles with a SizeDistribution in a Complex Plasmas
Consider (Chap. 7) the simple case of complex plasma with dust particles, having auniform surface potential Vs and size distribution given by the MRN power law viz.
nðaÞ da ¼ Aa�s da:
For a uniform potential Vs, a = Ze/Vs and the, mean charge (Z) distribution canbe put as
n Zð Þ dZ ¼ e=Vsð Þ1�sZ�s dZ:
Hence, the fraction of particles with a mean charge between Z and Z ? dZ is
f ðZÞ dZ ¼ nðZÞ dZ
ZZ2
Z1
nðZÞ dZ
2
4
3
5
�1
¼ ð1� SÞðZ1�S2 � Z1�S
1 Þ�1Z�S dZ
¼ U s; Z1; Z2ð ÞZ�s dZ
where Z2 ¼ a2Vs=e and Z1 ¼ ða1Vs=eÞ:Of the particles having a mean charge Z the fraction having a charge between f
and f ? df is given by (for Z [ 30)
F f; zð Þ df ¼ 1.
rffiffiffiffiffiffi2pp� �
exp � f� Zð Þ2.
2r2h i
df:
¼ 2=pð Þ1=2 Zj jð Þ�1=2exp �2 f� Zð Þ2
.Zj j
h idf
ð10:4Þ
and r ¼ 0:5 Zj jð Þ1=2:
b Fig. 10.2 a The dependence of the parameter a2(=r2/Z) and mean charge (Z) on the work functionu of the material, in the case of thermionic emission for the standard set of parameters as stated inCase 2 in the text. The letters on the curve a, b, c, d and e refer to the initial electron densityne0 = 108, 109, 1010, 1011 and 1012 cm-3, respectively. Further the solid and broken curvescorrespond to left hand side scale (a2) and right hand side scale, respectively (Z) (after Sodha et al.[9]). b The dependence of the parameter a2 and mean charge (Z) on the work function u of thematerial, in the case of thermionic emission for the standard set of parameters as stated in Case 2 inthe text. The letters on the curve a, b, c, d and e refer to the radius of the dust particle a = 0.1, 0.3,0.5, 0.8, and 1.0 l, respectively. Further the solid and dotted curves correspond to left hand sidescale (a2) and right hand side scale, respectively (Z) (after Sodha et al. [9]). c The dependence ofthe parameter a2ð¼r2=�ZÞ and mean charge (Z) on the work function u of the material, in the caseof thermionic emission for the standard set of parameters as stated in Case 2 in the text. The letterson the curve a, b, c, d and e refer to T = 1000, 1500, 2000, 2500, and 3000 K, respectively.Further, the solid and broken curves correspond to left hand side scale (a2) and right hand sidescale, respectively (Z) (after Sodha et al. [9], curtsey authors and publishers AIP)
10.2 Fluctuation of Charge on Uniform Size Dust Particles in a Complex Plasmas 193

Hence, the fraction of particles having charge between f and f ? df is given by
/ fð Þdf ¼ZZ2
Z1
f Zð ÞF f; Zð Þ dZ:df
¼ df:U S; Z1; Z2ð ÞZZ2
Z1
Z�SF f; Zð Þ dZ: for Z1j j[ 30
ð10:5Þ
For given values of parameters s; Z1 and Z2 the distribution /(f) can beobtained by numerical integration of (10.5). For a typical set of parameters viz.
Fig. 10.3 a The dependence of the parameter a2(=r2/Z) and mean charge (Z) on the parameternp, in the case of photoelectric emission for the standard set of parameters as stated in Case 3 inthe text. The letters on the curve a, b, c, d and e refer to the radius a = 0.1, 0.3, 0.5, 0.8, and1.0 l, respectively. Further the solid and broken curves correspond to left hand side scale (a2) andright hand side scale, respectively (Z) (after Sodha et al. [9]). b The dependence of the parametera2(=r2/Z) and mean charge (Z) on the parameter np, in the case of photoelectric emission for thestandard set of parameters as stated in Case 3 in the text. The letters on the curve a, b, c, d, e andf refer to n = 5, 10, 15, 20, 25, and 30, respectively. Further the solid and broken curvescorrespond to left hand side scale (a2) and right hand side scale, respectively (Z) (after Sodhaet al. [9], curtsey authors and publishers AIP)
194 10 Fluctuation of Charge on Dust Particles in a Complex Plasma

Z1 ¼ 30 and Z2 ¼ 200; /(f) has been plotted in Fig. 10.4 as a function of f forvarious values of s; letters a, b, c and d, refer to s ¼ 2; 3; 4 and 5 respectively. Itmay be pointed out that the (10.5) is meaningful only for Z1 [ 30 and s [ 1:Further in obtaining /(f) only the magnitude of Z1 and Z2 is considered; hence, thedistribution function is also valid for negatively charged particles.
References
1. C. Cui, J. Goree, IEEE Trans. Plasma Sci. 22, 151 (1994)2. C.K. Gorertz, Rev. Geophys. 27, 271 (1989)3. M.R. Jana, A. Sen, P.K. Kaw, Phys. Rev. E 48, 3930 (1993)4. S.A. Khrapak, A.E. Nefedov, O.F. Petrov, O.S. Vaulina, Phys. Rev. E 59, 6017 (1999)5. T. Matsoukas, M. Russel, J. Appl. Phys. 77, 4292 (1995)6. T. Matsoukas, M. Russel, M. Smith, J. Vac. Sci. Technol., A 14, 624 (1996)7. G.E. Morfill, E. Grun, T.V. Johnson, Planet. Space Sci. 28, 1087 (1980)8. T.G. Northrop, J.R. Hill, J. Geophys. Res. 88, 01 (1983)9. M.S. Sodha, S.K. Mishra, S. Misra, S. Srivastava, Phys. Plasmas 17, 073705 (2010a)
10. M.S. Sodha, A. Dixit, S. Srivastava, S.K. Mishra, M.P. Verma, L. Bhasin, Plasma SourcesSci. Technol. 19, 015006 (2010b)
11. N.G. Van Kampen, Stochastic Processes in Physics and Chemistry (North Holland, NewYork, 1990)
Fig. 10.4 Dependence ofcharge distribution on dustparticles (f) as a function ofcharge fe on the particles;letters a, b, c, d refer to s = 2,3, 4, and 5, respectivelyZ1 = 30 and Z2 = 200(curtsey Dr. S.K. Mishra,I.P.R., Ahmedabad, India)
10.3 Fluctuation of Charge on Dust Particles 195

Part IIApplications
Chapter 11Kinetics of Complex Plasmas in Space
11.1 Introduction
A variety of environments in space comprise of slightly to highly ionized plasmawith a suspension of fine (nanometer to micrometer) dust. In this chapter suchplasmas have been referred to as complex plasmas, regardless of the relative mag-nitudes of Debye radius and intergrain distance; the only criterion is that the dustcarries a charge and significantly affects the properties of the plasma. Electronemission from the dust particles (usually photoelectric, caused by ultraviolet light)and electron/ion accretion lead to the charging of the dust particles. The physics anddynamics of the plasma are significantly affected by the presence of charged dust andthe change in physical properties, caused by the dust. In this section, some typicalenvironments, comprising of complex plasmas in space have been mentioned; in thiscontext the author has benefitted much from a keynote talk by Mendis [32].
11.1.1 Planetary Magnetospheres
Dust–plasma interactions in the planetary magnetospheres have been studied for along time. The period of vigorous research on the role of complex plasma in themagnetospheres started with the highly significant observations by spacecraft oninteresting phenomena in the magnetospheres of giant planets in the early 1980s(For a review see Horanyi et al. [13]). It is instructive to take a look at somespecific cases.
Saturn’s SpokesThe approximately radial features (Spokes) across the dense B ring, observedintermittently by Voyager spacecraft 1 and 2 as they flew by Saturn have attracteda great amount of attention; several theories have been invoked to explain theobservations.
Light scattering measurements indicated the presence of fine (micron andsubmicron) dust in the rings. This fact along with the observation that the grains
M. S. Sodha, Kinetics of Complex Plasmas, Springer Series on Atomic,Optical, and Plasma Physics 81, DOI: 10.1007/978-81-322-1820-3_11,� Springer India 2014
199
were levitated above the plane of the ring indicated the existence of a force normalto the plane. All theories have proposed a sporadic increase of the plasma densityand subsequent charging of fine dust to a negative potential and consequent lev-itation. Thus the charging of the dust turns out to be an important part of thedynamics of the spokes.
High Speed Dust Streams from Jupiter and SaturnThe observation [9] of collimated quasi-periodic and high speed streams of finedust particles, emanating from Jupiter by the Ulysses spacecraft highlighted therole of electrodynamic force in the dynamics of fine dust particles; the charge onthe particles is an important parameter in the process. Subsequently such streams,emanating from Saturn were also discovered by the Cassini spacecraft [18].
Differential Collection of Charged Dust by Planetary SatellitesMendis and Axford [33] have proposed that the two-tone appearance of the sat-ellites could be explained in terms of the differential collection of charged dust bythe leading and trailing faces of the satellite. Recent Cassini observations [60]support the model of Mendis and Axford [33]. As in other cases the charge on thedust is a critical parameter.
11.1.2 Cometary Magnetosphere
The solar radiation and solar wind cause a variety of phenomena, associated withdust–plasma interaction in the magnetosphere of a comet, approaching the sun.These include electrostatic levitation of dust from the bare cometary nucleus atlarge distance from the sun and electrostatic disruption and electrodynamictransport in the induced cometary magnetosphere as the distance from the sun getsdecreased. For a review of these processes, the reader is referred to a review byMendis [31]. The timely interest is on account of the incoming rendezvous of theRosette spacecraft with Churiyumov—Gerasimenko comet in the spring of 2014.Needless to say the charging of dust particles is an important part of the process.
11.1.3 Interplanetary Dust
Particulates of size between a few centimeters to few nanometers in space withappreciable solar wind in the solar system are referred to as interplanetary dust.The main source of interplanetary dust in the inner region (within a distance of5 A.U. from the sun) of the solar system are the asteroidal debris and ejecta fromcomets. In the outer region (at a distance of more than 5 A.U. from the sun), theinterplanetary dust is contributed by the interstellar medium, volcanic satellites ofgiant planets, and the collisional debris of small satellites. The dominant forceswhich determine the dynamics of dust particles are gravitation for large particles,
200 11 Kinetics of Complex Plasmas in Space

solar radiation (Poynting Robertson effect) and solar wind for intermediate sizeparticles, and electrodynamic forces for small dust particles; the electrodynamicforces are of course dependent on the charge on the particles.
11.1.4 Interstellar Dust
The interstellar medium (ISM) is highly nonuniform and it contains a suspensionof fine (mm to nm) dust in regions of very low (H I) and very high (H II)ionization. Dust plays an important role in the dynamics and thermodynamics ofISM and in the secondary star formation. The dust tends to be negatively chargedby the impact of low energy cosmic rays while the ultraviolet radiation causesphotoelectric emission from the dust particles, making these positively charged.Dust exists in the H I region and localized regions in H II.
11.1.5 Polar Mesospheric Clouds
Noctilucent clouds (NLC) and polar mesospheric summer echoes (PMSE, dis-cussed in Chap. 9) are of considerable interest on account of their relevance toglobal warming. The low temperatures (110–130 K) at the low ionospheric alti-tudes in the polar region cause condensation of water vapor; the resulting systemof suspended ice particles with sizes from 3 nm to 0.1 lm are known as polarmesospheric clouds (PMC); this term includes both the NLC (dust size from 20/30 nm to 0.1 lm) and PMSE regions (dust size from 3 to 20/30 nm). These dustparticles get charged on account of accretion of ionospheric plasma electrons/ionson the surface of the particles and photoelectric emission from dirty ice particles, ifpresent. PMCs are a well-known manifestation of dust–plasma interaction in theterrestrial atmosphere.
In the rest of the chapter, this kinetics of the complex plasma in the PMC,cometary environment, Saturn E ring, and interplanetary and interstellar mediahave been discussed as applications of the basics, presented in Part I of the book.
11.2 Kinetics of Polar Mesospheric Clouds (NLCsand PMSEs) (After Sodha et al. [55])
11.2.1 Basic Information
Based on earlier work [11] have listed typical values of plasma, neutral gas, anddust parameters in the mesopause region, associated with NLCs and PMSEs.Table 11.1 indicates the values of the parameters, and the range of values for
11.1 Introduction 201

which computations have been made in this section; the agreement of the observedand computed charge distribution on pure ice particles and the condition for whichthe computed charge on dirty ice particles is around &80e are notable features ofthe present analysis.
Klumov et al. [21–23] have published three important papers on the charging ofice dust particles and formation of dust structures (PMCs) in the upper atmosphere.The models introduced the role of primary and proton hydrate (PHs) ions in thecontext of PMCs.
In contrast to the models, discussed in Part I of the book the attachment ofelectrons with O2 molecules and the detachment (including photodetachment) ofelectrons from O�
2ions have to be taken into account. The departure of Qabs, the
Table 11.1 Values of typical parameters for PMCs
Characterization Measured andobserved data
Present theory
Data used Evaluated values
Height 82–90 km &85 km
Temperature minimumWinter 200 K 130 K –Summer 130 K
Neutral gas number density (30 a.m.u.)80 km 5 9 1014 cm-3 3.5 9 1013 cm-3 (O2) –90 km 6 9 1013 cm-3 1.3 9 1014 cm-3 (N2)
Ionospheric electron densityDay 103–104 cm-3 103–104 cm-3 –Night 10–103 cm-3 10–103 cm-3
DustRadius (a) 50 nm 10–102 nm –Number density 10–1000 cm-3 1–2500 cm-3 –
PMC electron densityDay time Corresponds to
Bite outa 10–102 nm 20–100 % of
ionosphericelectron density
nd 1–2500 cm-3
ne0 4.5 9 103 cm-3
Dust charge (Pure ice)Frequent day time -e, -2 e, -3 e a 50 nm -e, -2 e, -3 e
nd 100 cm-3
ne0 4.5 9 103 cm-3
Frequent nighttime -e, 0, e a 50 nm -e, 0, end 100 cm-3
ne0 10 cm-3
Dust charge (Dirty ice)Occasional day time B 100 e a 10–100 nm Zmax = 100 e
Zmean = 85 end 100 cm-3
ne0 4.5 x 103 cm-3
202 11 Kinetics of Complex Plasmas in Space

fraction of radiant energy absorbed on the surface of the particles from unity, aspredicted by Mie’s theory of scattering should also be accounted for. It is seen thatfor pure ice particles and a specific set of mesospheric parameters, the observedcharge distribution (as given in Table 11.1) during day (-3e, -2e, -e) and night(-e, 0, e) gets explained; the corresponding decrease (bite out) in the electrondensity during the day is more than 30 %. Further with dirty ice particles of workfunction 2.3 eV (a value, which explains observations but has no other basis), largevalues of positive charge on the particles can also be explained; as an example fora = 80 nm and nd = 100 cm-3, the mean charge on the particles has beencomputed as Z ¼ 80 which compares very well with the occasional value(\100 e), listed in Table 11.1. Corresponding values of electron density andtemperature have also been computed.
11.2.2 Analytical Model
11.2.2.1 Master Equation
Consider the ionospheric region at mesospheric altitudes (&82–90 km), illumi-nated by solar radiation; it consists [21, 22] of electrons, two different groups ofsingly charged ions (viz. primary and cluster or PHs ions), neutral species (mainlyN2 and O2) and uniform size spherical pure (with work function u & 8.7 eV) ordirty ice dust grains with an effective work function u; the value u = 2.3 eVexplains the observations but has no other basis. The electron and ion accretioncurrents on and photoemission of electrons from the surface of dust grains are thebasic processes determining the charging of dirty ice grains; hence the inherentcharging processes may be expressed as
PZ�1�PZ þ e�;
PZþ1 þ e��PZ
PZþ1 þ i��PZ
and
PZ�1 þ iþ�PZ ð11:1Þ
where PZ refers to particles with charge Ze and e- and i± represent electrons andionic species respectively. It may be emphasized that this model is not limited bythermal equilibrium.
The population balance equation describing the generation and depletion of iceparticles with charge Ze may be written as [28, 29]
11.2 Kinetics of Polar Mesospheric Clouds (NLCs and PMSEs) 203

dnZ=dtð Þ ¼ nZþ1½necðZ þ 1Þ þ n�icðZ þ 1Þ� þ nZ�1½neeðZ � 1Þþ np
þicðZ � 1Þ þ nhþicðZ � 1Þ� � nZ ½neeðZÞ þ np
þicðZÞþ nh
þicðZÞ þ n�icðZÞ þ necðZÞ�;ð11:2Þ
where nZ(=NZ/nd) is the fraction of particles carrying a charge Ze, nec and ny�ic
referto electron and ion accretion currents on the surface of the ice grains and nee refersto the photoemission rate of electrons from the surface of ice dust particles; here p,h stand for primary (p) and cluster or proton hydrate (h) positive ions.
The basic equations of the kinetics of a mesospheric layer with ice dust are asfollows.
11.2.2.2 Approximate Constancy of Neutral Species
On account of the low level of ionization, the density of the neutral species can beconsidered to be a constant. Hence
n0;O2 ¼ n0 ðconstantÞ ð11:3aÞ
n0;N2 ¼ N0 ðconstantÞ ð11:3bÞ
At mesospheric altitudes, N2 molecules do not take part in the formation of ionseither by solar radiation or three body collision; here n refers to the O2 molecules.The N2 molecules contribute only to negligible energy exchange in elastic colli-sions with electrons and ions. There are no other natural gases, present in themesosphere in significant amounts.
11.2.2.3 Charge Neutrality
nd
XZ2
Z1
ZnZ ¼ ðne þ n�i � npþi � nh
þiÞ; ð11:4Þ
where one restricts consideration to the values of Z lying between Z1 and Z2
(Z1 \ Z \ Z2) and nd is the number density of ice dust particles and ne is theelectron density.
11.2.2.4 Electron Kinetics
dne
dt¼ bin0 � ne ap
r npþi þ ah
r nhþi
� �þ vdn�i � vaneð Þ
� nd
XZ2
Z1þ1ð ÞnZnecðZÞ �
XZ2�1ð Þ
Z1
nZneeðZÞ
0
@
1
A; ð11:5Þ
204 11 Kinetics of Complex Plasmas in Space

where
bi is the coefficient of ionization due to the processes responsible for the ionizationin the absence (also in presence) of dust particles,ay
rðTeÞ ¼ ayr0T�gye cm3 s�1 is the coefficient of recombination of electrons and ions
y = p, hva(=kan0
2) is the frequency of the electron attachment to the neutral species due totriple collisions,vd = (vph ? ved) is the electron detachment frequency,vph is the photodetachment frequency, under conditions of the day timeionosphere,ved(=kdn0) is the collision detachment frequency,ka = (1.4 9 10-29) exp[-(600/Te)] cm6 s-1,
kd ¼ 10�20 cm3 s�1
and Te is the electron temperature and ayr0 and gy are constants.
The formulation and values of the parameters have been taken from the book ofGurevich [10].
11.2.2.5 Kinetics for Ionic Species (After Klumov et al. [21])
Primary Ion Kinetics
dnpþi
dt¼ bin0 � ap
r nenpþi � bcnp
þi � nd
XZ2�1ð Þ
Z1
nZnpþicðZÞ: ð11:6aÞ
Proton Hydrate Ion Kinetics
dnhþi
dt¼ bcnp
þi � ahr nenh
þi � nd
XZ2�1ð Þ
Z1
nZnhþicðZÞ: ð11:6bÞ
Negative Ion Kinetics
dn�i
dt¼ ðvane � vdn�iÞ � nd
XZ2
Z1þ1ð ÞnZn�icðZÞ: ð11:6cÞ
It is seen that any one of (11.3a), (11.3b), (11.4), (11.5) and (11.6a), (11.6b),(11.6c) can be derived from the remaining three equations and hence one of theequations becomes redundant. As a convenience (11.4) has been omitted in furtheranalysis.
11.2 Kinetics of Polar Mesospheric Clouds (NLCs and PMSEs) 205

11.2.2.6 Energy Balance for Electrons and Ions
ddt
32
kneTe
� ffi¼ bin0ee � ne½ap
r npþi þ ah
r nhþi�ð3kTe=2Þ þ vdn�iev � vane 3kTe=2ð Þ½ �
� nd
XZ2
ðZ1þ1ÞnZnecðZÞeecðZÞ �
XðZ2�1Þ
Z1
nZneeðZÞeeeðZÞ
2
4
3
5
ð11:7Þ
and
ddt
32
kðnpþi þ nh
þi þ n�iÞTi
� ffi¼ bin0e
pþi � ne ap
r npþi þ ah
r nhþi
� �3kTi=2ð Þ
þ vane � vdn�ið Þ 3kTi=2ð Þ
� nd
XðZ2�1Þ
Z1
nZnpþicðZÞe
pþicðZÞ þ nh
þicðZÞehþicðZÞ
�
þ n�icðZÞe�icðZÞ�ð11:8Þ
where
ee, epþi are the mean energies of electrons and primary ions produced by ionization
of neutral atoms,eec,ey
�icare the mean energies (far away from the surface) of electrons and ions
accreting on the surface of the ice grain,ev is the mean energy of photodetached electrons from negative ions,eee is the mean energy of photoemitted electrons at a large distance from thesurface of the dust grain,Ti is the temperature of the ionic species,and Te0, Ti0 and T represent the temperature of electrons, ions, and neutrals,respectively, in absence of dust; unless otherwise stated most of this data is fromthe book by Gurevich [10].
Energy exchange in elastic collisions has been neglected.
11.2.3 Model of the Mesosphere Without Dust
The mesosphere has been modeled by putting nd = 0 in the kinetic equations,given as above. The value of bi was adjusted to yield an electron density, equal tothe observed value; this however gives an electron temperature, a little larger thanthe observed value in the day time environment (this is mainly because ofinclusion of the process of photodetachment in the model).
206 11 Kinetics of Complex Plasmas in Space

The adjusted values of and the corresponding electron density and temperatureare as in Table 11.2.
Further the mean energy of electrons and ions generated due to ionization maybe obtained by imposing the initial conditions for dust-free plasma in the energybalance equations; thus
ee � 3kTe0=2ð Þ � bin00ð Þ�1vph ev � 3kTe0=2ð Þ ð11:9Þ
and
epi ¼ 3kTi0=2ð Þ; ð11:10Þ
where the suffix zero refers to the absence of dust. Equations (11.9) and (11.10)have been obtained by putting nd = 0 in (11.7) and (11.8) in the steady state.
11.2.4 Computational Methodology
For an arbitrarily chosen range of Z values, one can easily obtain the steady-statecharge distribution and other relevant parameters viz. ne, ni
p, nih, ni-, n0, Te, and Ti
by simultaneous numerical integration of (11.2), (11.3a), (11.3b), (11.5), (11.6a),(11.6b), (11.6c), (11.7), and (11.8) for a given initial set (in the absence of dust) ofparameters as t ? ?; the steady state is indeed independent of the initial con-ditions. The arbitrary range of Z may be estimated around mean charge Z on thedust particles, obtained by average charge theory (Sodha et al. [52, 53]). For such achosen range (11.2) yields a set of equations for nZ.
11.2.5 Photoelectric Emission from Charged Dust Particlesby Solar Radiation
Expressions for the rate of emission nph, and mean energy of photoelectrons,emitted by the incidence of white (sun) light on the dust particles have been givenin Sect. 5.4.4 [(5.15) and (5.17)]. The effect of Mie scattering may be incorporatedby having Qabs in the integrand.
Table 11.2 Observed and adjusted parameters in PMC
Time Electron density(observed) ne0 (cm-3)
Ionization rate(adjusted)bin0 (cm-3 s-1)
Electron temperatureTe0 (K)
Ion temperatureTi0 (K)
Observed Computed Observed Computed
Day 4.5 9 103 141.5 130 145 130 130Night 35 3.35 130 130 130 130
After Sodha et al. [55], courtesy authors and publishers AIP
11.2 Kinetics of Polar Mesospheric Clouds (NLCs and PMSEs) 207

11.2.6 Other Parameters
The expressions for the relevant parameters are as per Chaps. 2 and 3.The photodetachment frequency vph and the mean energy of the electrons
produced by photodetachment are given by
vph ¼ZEvm
Ed
QdðEvÞdnincðEvÞ ð11:11aÞ
and
ev ¼ v�1ph
ZEvm
Ed
ðEv � EdÞQdðEvÞdnincðEvÞ; ð11:11bÞ
where Ed = 0.5 eV is the energy of dissociation of photodetachment.Following McEwan and Philips [30], the photodetachment cross-section cor-
responding to O�2 negative ions can be expressed as
Qd ¼ 2:3� 10�18� �
=2:5� �
Ev � 0:5ð Þ cm2; where Ev is in eVð Þ
or
Qd ¼ 2:3=4ð Þ � 10�6 Ev � 8� 10�13� �
cm2: where Ev is in ergsð Þ ð11:11cÞ
11.2.7 Numerical Results and Discussion
PMC plasma with pure ice dust (Basic data)
ne0 ¼ ni0 ¼ 35 cm�3 night timeð Þ; 4:5� 103 cm�3 day timeð Þ; nd ¼ 100 cm�3; nO2 ¼ 3:5� 1013 cm�3
nN2 ¼ 1:3� 1014 cm�3; a ¼ 50 nm; Te0 ¼ Ti0 ¼ Tn ¼ Td ¼ 130 K observedð Þm0 � mpi ¼ 30 amu;
mhi ¼ 5mp
i ; gp ¼ 0:7; gh ¼ 1:2; apr0 ¼ 10�7 cm3=s; ah
r0 ¼ 10�5cm3=s; bin00 adjustedð Þ¼ 141:5 s�1ðdayÞ; 3:35 s�1ðnightÞ and Computed Te0 ¼ 130 KðnightÞ; 145:45 KðdayÞ:
The set of Fig. 11.1 (corresponding to the above data) illustrates the chargedistribution [i.e. (nz = NZ/nd) vs Z] in day and night time mesospheric dust clouds(consisting of pure ice particles characterized by high work function u = 8.7 eV)and corresponding density and temperature of electrons; since there are no photonsavailable having energy more than the work function of pure ice there is nophotoelectron emission from the pure ice dust. It may be appreciated that in theabsence of electron emission from pure ice dust, a large change in the electron
208 11 Kinetics of Complex Plasmas in Space

density can be caused by the presence of very few ice particles on account ofelectron/ion accretion on dust surface. This reduction in electron density at mes-ospheric layers leads to electron bite out phenomenon. The analysis incorporatesboth day and nighttime mesospheric data and the results have been displayedseparately in the figures.
Fig. 11.1 a Dependence of the charge distribution [i.e. (NZ/nd) vs Z] (for pure ice dust and inabsence of electron emission), on the grain size (a), for standard set of parameters as stated in thetext. The letters p, q, and r on the curves refer to a = 10, 50, and 100 nm, respectively. Solid andbroken lines correspond to day and night time conditions, respectively. Only points on the curveswhich correspond to integral values of Z are significant. b Dependence of the charge distribution onthe number density of ice grains (nd) for the standard set of parameters as stated in the text. Theletters p, q, and r on the curves refer to nd = 10, 100, and 1,000 cm-3, respectively. Solid andbroken lines correspond to day and night time conditions, respectively. Only points on the curveswhich correspond to integral values of Z are significant. c Effect of the dust-free mesosphericelectron density (ne0) on the charge distribution for the same standard set of parameters as stated intext. The letters p, q, and r on the curves correspond to ne0 = 10, 100, and 103 cm-3. Solid andbroken lines correspond to day and night time. Only points on the curves which correspond tointegral values of Z are significant. d Dependence of electron density (ne/ne0) and electrontemperature (Te/Te0) on the ice grain size (a) as a function of nd, for standard set of parameters asstated in text (day time). The letters p, q, and r on the curves correspond to a = 10, 50, and 100 nm,respectively. The solid (ne/ne0) and broken (Te/Te0) lines correspond to left- and right-hand sidescales, respectively (after Sodha [55], courtesy authors and publishers AIP)
11.2 Kinetics of Polar Mesospheric Clouds (NLCs and PMSEs) 209

Figure 11.1a indicates that the charge distribution shifts toward larger values ofnegative charge with increasing radius of the particles. The broadening of thedistribution may be qualitatively understood in terms of the earlier result [3] that
DZ � 0:5 �Zð Þ1=2. Curves with solid lines correspond to day time mesosphericconditions while broken lines refer to nighttime situation; the difference betweenthe two may be ascribed to difference in day and nighttime mesospheric electrondensities. The dependence of the charge distribution (nZ) on the number density ofice particles nd and the initial electron density ne0 have been displayed inFig. 11.1b and c, respectively. Figure 11.1b indicates that the charge distribution[viz. day (-3e, -2e, -1e) and night (-2e, -1e, -0e) time NLCs] remains almostunaffected by the number density of dust grains; however, the nature of the dis-tribution varies significantly. The charge distribution dependence on ne0 may beunderstood in terms of smaller number of electrons/ions, available for accretion onthe dust particles for small values of ne0. Figure 11.1d illustrates the dependence ofcorresponding number density of electrons (ne/ne0) and temperature (Te/Te0) ofelectrons as a function of number density of pure ice particles (nd).
Fig. 11.1 (continued)
210 11 Kinetics of Complex Plasmas in Space

Some interesting features extracted from Fig. 11.1.
(i) From Fig. 11.1a, it is seen that the number of possible values of charge on theice grains for which there are significant number (probability more than 5 %)of ice grains, increases with increasing radii of the ice particles (from two toseven). However, for a = 50 nm this number (three) appears to be inde-pendent of nd and ne0 (as illustrated in Fig. 11.1b and c).
(ii) Figure 11.1a and b reflect the fact that for nd = 100 cm-3 and a = 50 nm,the computed charge is distributed over the range(N-3 & 19 cm-3, N-2 & 66 cm-3, N-1 & 14 cm-3) for the day timemesospheric parameters (viz. ne0 = 4.5 9 103 cm-3), while the charge dis-tribution shifts toward less negative charging over the range(N-2 & 35 cm-3, N-1 & 60 cm-3, N0 & 4 cm-3) for ne0 = 35 cm-3,corresponding to night time mesospheric layer at NLC altitude. Figure 11.1cindicates that in night time NLCs [with nd = 100 cm-3, a = 50 nm andne0 = 10 cm-3] the computed charge is distributed over the range(N-1 & 33 cm-3, N0 & 59 cm-3, N1 & 7 cm-3). This provides an expla-nation for the observed/estimated data of Havnes et. al (Table 11.1).
(iii) The nature of dependence of the electron density on nd (as shown inFig. 11.1d) is a clear indication of the occurrence of electron bite out, theelectron density gets reduced by at least &30 % (corresponding tond = 1000) from its initial concentration viz. ne0 = 4.5 9 103 cm-3 anda = 50 nm during the day time mesospheric layers.
Thus it may be concluded that the main features of NLCs/PMSEs (like electronbite out and charge distribution) can be explained by considering the mesosphericice dust plasma layer as an open system [52, 53] consisting of pure ice grains;these pure ice particles act as a sink of electrons and ionic species. It may beappreciated that the predicted numerical outcome of the present analyticalapproach is in excellent agreement with the observed data for charge distribution(Table 11.1) in PMCs.
Computations also show that high positive charge on dust can be explained onthe basis of a work function of 2.3 eV, for dirty ice; however, there is no otherevidence for such a work function.
11.3 Cometary Plasma (After Sodha et al. [54])
11.3.1 Basic Information
It is well known that the dust grains in cometary plasmas significantly affect thenumber density and temperature of the constituents on account of the accretion ofelectrons and ions and emission of electrons by the grains. The solar radiationcauses ionization of the gaseous species. The photoelectric emission of electronsfrom the grains acts as an additional source of electrons.
11.2 Kinetics of Polar Mesospheric Clouds (NLCs and PMSEs) 211

The charging of the regolith of the comet on account of solar wind and electro-magnetic radiation from the sun has been the main theme of most publications in thefield of cometary plasma. Qualitative aspects of the role of dust in the plasma ofcometary tails have been frequently mentioned. Possibly the most comprehensivemodel of the coma plasma, which enables an analysis of the impact of dust (com-prising ice particles) on the plasma chemistry of an inner comet coma has beendeveloped by Klumov et al. [21, 23, 25] who considered the following processes:
(i) Photoionization of water molecules by extreme UV solar radiation withwavelength less than 98.4 nm (the sun was assumed to be at a distance of1 A.U.).
(ii) Ionization of atoms by solar radiation.(iii) Photoelectric emission from ice particles (work function u = 8.7 eV) by the
incidence of solar radiation (Lyman-a radiation); dust of Fe, Na, K, Al, and Simay also be present (amount not specified).
(iv) Recombination of molecular ions with electrons.(v) Charge exchange between atomic ions and neutral molecules, dominating
over recombination of atomic ions with electrons, which has been neglected.(vi) Accretion of electrons and ions on the ice particles on account of efficient
charge exchange process; the recombination of atomic ions with electronswas ignored.
Sodha et al. [54] have improved the analysis by incorporating the followingadditional features in the analysis.
(i) The energy balance of the various constituents has been taken into account.(ii) Appropriate expressions (Chap. 2) for the rate of photoelectric emission of
electrons from the particles and the corresponding mean energy have been used.(iii) The recombination of atomic ions with electrons has also been taken into
account.
The effect of solar radiation on the gaseous species is to produce electrons,atomic ions, and molecular ions at the rate of qe, qa
i and qmi per unit volume,
respectively, with energies (3kTe0/2) (electrons) and (3kTi0/2) (ions).Further since the number density of the neutral species is very large, their
temperature and number density can be justifiably assumed to remain unchanged;hence the number of electron/ion pairs created per unit time per unit volume by theionization of molecules/atoms due to solar radiation is also constant.
11.3.2 Analytical Model for Electronic Processesin a Cometary Coma Plasma
Consider a cometary coma, consisting of water vapor plasma and spherical icegrains with radius a and charge Ze (all the grains have been assumed to have thesame charge), located at a heliocentric distance of 1.0 A.U. Photoemission from
212 11 Kinetics of Complex Plasmas in Space

ice (work function 8.7 eV) particles, caused by the extreme UV solar radiation(Lyman-a) is assumed to be the prime mechanism of electron/ion generation inaddition to photoionization of water molecules by EUV radiation from the sun. Itmay be appreciated [1] that 80 % of the incident photons in EUV (122.5–4.0 nm)part of solar spectrum are accounted for by Lyman-a radiation; further the pho-toelectric efficiency drops rapidly with decreasing wavelength. Hence Lyman-aradiation alone has been considered as the source of photoelectron emission fromthe ice dust. The basic equations, governing the kinetics of the cometary plasmaare as follows:
Charge Neutrality
Znd þ nai þ nm
i ¼ ne; ð11:12Þ
where Ze is the charge on an ice particle and nd is the number density of dustparticles.
Charging of the Dust Particles
dZ=dtð Þ ¼ naic þ nm
ic þ nph � nec; ð11:13Þ
where n jic j� a;mð Þ is the atomic and molecular ion accretion current to a dust
particle and nph is the rate of photoemission of electrons per unit time from thesurface of the dust particle.
Electron Kinetics
dne=dtð Þ ¼ qe þ nphnd � aar nena
i � amr nenm
i � necnd: ð11:14Þ
In general qe is proportional to the number density of neutral species n0;however, as pointed out earlier on account of the low level of ionization it has beentreated as constant.
Ion KineticsHere two distinct groups of ions have been considered viz. atomic (O+, H+, etc.)
and molecular (H2O+, OH+, CO2+, etc.) ions; the kinetics is as follows:
For Atomic Ions
dnai =dt
� �¼ qa
i � banm0 na
i � aar nena
i � naicnd; ð11:15Þ
For Molecular Ions
dnmi =dt
� �¼ qm
i þ banm0 na
i � amr nenm
i � nmicnd ð11:16Þ
where ba is a coefficient, characterizing the charge exchange between atomic ionsand neutral molecules.
It is necessary to mention that any one of (11.2), (11.3a), (11.3b), (11.4), (11.5)and (11.6a), (11.6b), (11.6c) can be derived from the remaining four equations and
11.3 Cometary Plasma 213

hence one of the equations becomes redundant. Thus (11.2) has been omitted infurther analysis.
Energy Balance of Electrons
ddt
32
kTene
� ffi¼ qeee þ nphndeph � ðaa
r nai þ am
r nmi Þneð3kTe=2Þ � necnderec;e
ð11:17Þ
where
Tij is the temperature of the ionic species,
T0 is the temperature of the neutral species,ee is the mean energy of electrons produced by ionization of neutral species,eph is the mean energy of the photoemitted electrons at large distance from thesurface of the dust particles,erec,e is the mean energy of the electrons, (at large distance from the surface)collected by the dust particles,and the small energy exchange in elastic collisions is neglected.
Energy Balance of Ionic SpeciesFor Atomic Ions
ddt
32
kTai na
i
� ffi¼ qa
i eai � aa
r nai neð3kTa
i =2Þ � naicnde
arec;i ð11:18Þ
For Molecular Ions
ddt
32
kTmi nm
i
� ffi¼ qm
i emi � am
r nmi neð3kTm
i =2Þ � nmicnde
mrec;i ð11:19Þ
where e ji is the mean energy of ions, produced by ionization due to the ionization
agency and the energy exchange in the charge exchange process is neglected onaccount of same temperature of ions and neutral atoms.
The rate of ionization qe; qji
� �and mean energy ee; e
ji
� �) of electrons and ionic
species, generated due to ionization may be obtained by imposing the initialconditions for dust-free coma plasma in the number and energy balance equations,respectively.
Thus
qe ¼ aar na
i0 þ amr nm
i0
� �ne0;
qmi ¼ aa
r nai0ne0 þ banm
0 nai0
� �;
qai ¼ aa
r nmi0ne0 � banm
0 nai0
� �;
qeee ¼ ð3k=2Þne0½ðaar na
i0 þ amr0nm
i0ÞTe0
qai e
ai ¼ ð3k=2Þne0a
ar na
i0Tai0
214 11 Kinetics of Complex Plasmas in Space

and
qmi em
i ¼ 3k=2ð Þne0ami nm
i0Tmi0
The above equations are in conformance with the basic information. Expres-sions for nph, eph, nee, eec, nic, and eic may be seen in Chaps. 2 and 3.
11.3.3 Numerical Results and Discussion
The contribution of the EUV radiation (from 122.5–4.0 nm) to photoelectronemission by ice dust may be approximated [1] by 3.25 9 1011 photons/cm2scorresponding to Lyman-a radiation with the wavelength 121.57 nm.
ne0 ¼ ni0 � 104=cm3; n00 ¼ 1013=cm3; Te0 ¼ 1000 K; Tmi0 ¼ Ta
i0 ¼ T00 ¼ 400K
Td ¼ 250 K; photoelectric efficiency Y ¼ 0:03; nai0 ¼ 0:3ne0; a ¼ 1:0 l m
mmi ¼ m0 � 30 amu; ma
i 0a � 10 amu; aar ¼ 10�8cm3=s; am
r ¼ 10�7cm3=s
ba ¼ 10�4 s�1 and K0 ¼ 3:25� 1011=cm2s
The values of parameters ne0, ni0, n00, Te0, Ti0, Tai0, Tm
i0, amr , ba, a and Y have
been chosen from the range of values, given by Klumov et al. [25]. The effect ofchange in one of these parameters can be studied by computation of the result ofchange of that parameter, keeping others the same, as in the standard set.
Simultaneous solution of (11.3a, 11.3b), (11.4), (11.5), (11.6a, 11.6b, 11.6c),(11.7), (11.8), and (11.9) has been obtained by using the MATHEMATICAsoftware.
Figure 11.2a illustrates the dependence of the charge on the particle Ze andmean free path of electrons kc on the number density of the ice particles (nd) in thecoma environment. It is seen that the character of positive charging of the iceparticles increases with increasing number density and the particles acquire amaximum positive charge at a certain value of nd; the charge finally gets saturatedto a small value for large nd.
The dependence of electron density ne and electron temperature Te on nd hasbeen shown in Fig. 11.2b. The curves indicate that the electron density falls withincreasing number density of ice grains and is higher for smaller radii; this is dueto the fact that larger size and larger nd, both lead to larger accretion of electronsand ionic species.
Atomic and molecular ion densities decrease with increasing a and nd, onaccount of their larger accretion to the ice particles; this nature has been shown inFig. 11.2c.
11.3 Cometary Plasma 215

216 11 Kinetics of Complex Plasmas in Space

11.4 Charging of Ice Grains in Saturn E Ring(After Misra et al. [37])
11.4.1 Model of Complex Plasma Environment
Saturn’s tenuous outer E ring lies at a distance 1.8 9 105 to 6.4 9 105 km fromthe planet. The ring’s brightness peaks near the orbit of Saturn’s moon Enceladus,where the thickness of the ring is least. The most unusual characteristic of the ringis the prominent presence of micron-sized particles with a distinctly blue color.
Misra et al. [37], have on the basis of numerous studies, including the con-clusions of the spacecraft missions arrived at the following model of the complexplasma environment in the Saturn’s E ring (&3 – 8 Rs). The plasma is illuminatedby solar radiation and consists of cold (C) (&5 eV) and hot (H) (C50 eV) elec-trons, two different groups of singly charged ions viz. protons (p) and water groupheavy ions (w : O+, OH+, H2O+, etc.) and neutral species (mainly OH and H)along with pure and dirty spherical ice dust particles; dirty ice particles develop onaccount of inherent impurities of sodium and silicates and are characterized by aneffective work function lower than that of pure ice [i.e., u (=8.7 eV)]. The icegrains acquire a charge on account of the accretion of the cold electrons and theionic species on the dust and the photoelectric emission due to Lyman-a radiation(see Sect. 11.3.2) and secondary electron emission (due to hot electron impact)from the surface of the ice grains.
The data (based on model calculations) available on the size distributioncharacterizing the ice grains in E ring plasma, given by Juhasz and Horanyi [15](also provided in the review by Grasp et al. [8]) is summarized in Table 11.3. It isseen that there are three regions (j) of radii with different characteristic distribu-tions. The parameters a2
rms;j and am,j for the whole range of the radii of the particlesize distribution may thus be evaluated.
b Fig. 11.2 a Dependence of charge of dust particles Ze and mean free path of the electrons kc
(cm), on the number density of ice particles nd (cm-3) in a coma environment; the relevantparameters are Te0 = 1000 K, Ti0
a = Ti0m = 400 K, Td = 250 K, ne0 & ni0 & 104/cm3,
n00 = 1013/cm3, ni0m = 0.3ne0, Y = 0.03, and K0 & 3.25 9 1011/cm2s for varying radii a of
the ice particles; the letters on the curves p, q, r, s, t, and u refer to a = 0.3, 0.5, 0.8, 1.0, 2.0,and 3.0 lm, respectively. Further the solid and dotted curves correspond to left-hand side scale(Ze) and right-hand side scale (log10kc), respectively. b Dependence of electron density (ne/ne0)and the electron temperature (Te/Td), on the number density of ice particles nd(cm-3) for differentradii; the relevant parameters and the meaning of the letters is as in the caption of Fig. 11.2a.Further the scale of (ne/ne0) and (Te/Td) has been indicated in the figure. c Dependence of atomicion density (ni
a/ni0a ) and molecular ion density (ni
m/ni0m), on the number density of ice particlesnd
(cm-3); the relevant parameters and the meaning of the letters is as in the caption of Fig. 11.2a.Further the solid and dotted curves correspond to left-hand side scale for (ni
a/ni0a ) and right-hand
side scale for (nim/ni0
m), respectively (after Sodha et al. [54], courtesy authors, and publishers IOP)
11.4 Charging of Ice Grains in Saturn E Ring 217

11.4.2 Mathematical Modeling of Kinetics
11.4.2.1 Charging Kinetics
It has been shown in Chap. 7 that the charging of dust grains (with a size distri-bution) of the jth variety can be represented by
dVs;j
�dt
� �¼ epam;j fph;j Vs;j; Td
� �þ neHfse;j Vs;j; TeH
� �þ nipficp;j Vs;j; Tip
� ��
þ niwficw;j Vs;j; Tiw
� �� necfecC;j Vs;j; Tec
� ��;
ð11:20Þ
where the suffix ‘‘se’’ indicates secondary electron emission.It should be appreciated that although Vs,j is independent of a, only in the steady
state, this property has been used in writing (11.20). Since the aim is to analyze thesteady state (t ? ?) only, this simplification does not lead to any error.
Further analysis follows the methodology in Part I of the book.
11.4.2.2 Constancy of Neutral Plus Ionic Species
np þ nip ¼ np0 þ nip0 ¼ Nt1ðConstantÞ ð11:21aÞ
nw þ niw ¼ nw0 þ niw0 ¼ Nt2ðConstantÞ ð11:21bÞ
where niy refers to the density of protons (p) and water group (w) ions while ny
corresponds to the neutral densities of hydrogen atom and water group molecules.The subscript ‘0’ refers to the corresponding number densities in the absence of icegrains.
Table 11.3 Size distribution of dust in Saturn E ring plasma
Range of a(lm)
Max.nd (m-3)
arms (lm) am (lm)
s = 4 s = 5.0 s = 6.0 s = 4 s = 5.0 s = 6.0
1. 0.1 to 0.5 7.0 0.156 0.139 0.129 0.145 0.133 0.1252. 0.5 to 1.0 1.2 0.655 0.633 0.614 0.643 0.622 0.6053. 1.0 to 3.0 0.3 1.441 1.342 1.270 1.385 1.300 1.2414. 0.1 to 3.0 8.5 0.392 0.369 0.352 0.259 0.243 0.232
After Misra et al. [37], courtesy authors and publishers Oxford University Press
218 11 Kinetics of Complex Plasmas in Space

11.4.2.3 Electron Number Balance
dnec=dtð Þ ¼ bipnp þ biwnw
� �� nec arpnip þ arwniw
� �� �
þX
j
pa2rms;jnj fph;j þ neHfseC;j � necfecC;j
� �; ð11:22Þ
where biy is the mean value of the coefficient of ionization due to the processes,responsible for the ionization of neutral species (viz. photo and electron impactionizations), ary is the mean value of the recombination coefficient of electrons andrespective ions, nj is the number density of ice dust grains corresponding to jthvariety of ice dust, and nd =
Pjnj. For simplification of the analysis, the tem-
perature dependence of biy and ary has been ignored.
11.4.2.4 Number Balance for Ionic Species
Proton Kinetics
dnip=dt� �
¼ bipnp � arpnecnip
� �� bcnip �
X
j
pa2rms;jnjnicpficp;j ð11:23aÞ
Water Group Ion Kinetics
dniw=dtð Þ ¼ biwnw � arwnecniwð Þ þ bcnip �X
j
pa2rms;jnjnicwficw;j: ð11:23bÞ
where bc is the mean value of the conversion rate [46] of protons to water group ofions on account of the charge exchange process.
Since charge neutrality may be derived from (11.21a), (11.21b), (11.22), and(11.23a), (11.23b) the equation of charge neutrality has been excluded from furtheranalysis.
11.4.2.5 Energy Balance for Electrons
3k=2ð Þ dðneCTeCÞ=dt½ � ¼ bipnp þ biwnw
� �ee � neC arpnip þ arwniw
� �3kTeC=2ð Þ
þX
j
2rms;jnj fpheph;j þ neHfse;jese;j � neCfecC;jeecC;j
� �;
ð11:24Þ
where ee is the mean energy of electrons produced by ionization of neutral species,eecC, j is the mean energy (far away from the grain surface) of cold electrons,accreting on the surface of the ice grains, eph,j and esc,j(&2–3 eV) are the meanenergies of the photo and secondary emitted electrons (far away from the surfaceof the ice grain), and Tec is the temperature of the cold electrons.
11.4 Charging of Ice Grains in Saturn E Ring 219

11.4.2.6 Energy Balance for Ions
Proton Energy Balance
3kB=2ð Þ d nipTip
� �=dt
� �¼binpeip � arwnecnip 3kBTip=2
� �
� bcnip 3kBTip=2� �
�X
j
pa2rms;jnjnicpficp;jeicp;j
ð11:25aÞ
Energy Balance Water Group Ions
3kB=2ð Þ d niwTiwð Þ=dt½ � ¼biwnweiw � arwnecniw 3kBTiw=2ð Þþ bcnip 3kB=2ð Þ Tip � Tw � Tp
� �
�X
j
pa2rms;jnjnicwficw;jeicw;j
ð11:25bÞ
where eip and eiw are the mean energies of protons and water group of ions,respectively, produced by ionization of corresponding neutral species, eicp,j andeicw,j are the mean energies (far away from the surface of the grain) of protons andwater group ions accreting on the surface of the ice grain, Tiy and Ty are thetemperatures of corresponding ions and neutral species, respectively.
11.4.2.7 Computational Highlights
As a simplification it is assumed that in the steady state the temperature of theneutral species remains unaffected. Further the temperature of the dust particlesmay be estimated by equating the solar radiation absorbed per unit time by theparticle to the power lost by thermal radiation; other electronic processes do notplay a significant role. For computational purposes a typical value of Td = 130 K(for ice grains), corresponding to (aa/e) & 1.17 has been assumed (aa is theabsorptivity and e is emissivity of the dust); the results depend only slightly on Td.
Further the mean energy of electrons and ions generated due to ionization ofneutral species may be obtained by imposing the initial conditions for dust-freeplasma in the energy balance equations; thus one has
ee ¼ neC0 arpnip0 þ arwniw0
� �3kBTeC0=2ð Þ
� ��bipnp0 þ biwnw0� �
ð11:26Þ
eip ¼ arwneC0nip0 3kBTip0=2� �
þ bcnip0 3kBTip0=2� �� ��
bipnp0� �
ð11:27Þ
eiw ¼ arwneC0niw0 3kBTiw0=2ð Þ � bcnip0 3kB=2ð Þ Tip0 þ Tw � Tp
� �� ��biwnw0ð Þð11:28Þ
where the suffix zero refers to plasma parameters in the absence of ice dustparticles.
220 11 Kinetics of Complex Plasmas in Space

For a chosen set of plasma parameters, one can obtain the steady-state potentialon ice grains (Vs,j) and other parameters viz. nec, niy, ny, Tec, and Tiy by simulta-neous numerical integration of (11.3a), (11.3b), (11.5), (11.6a), (11.6b), (11.6c),(11.7), (11.9), and (11.10) along with (11.11a), (11.11b), (11.11c), and appropriateexpressions for other relevant parameters as t ? ?; the steady state is indeedindependent of the initial conditions.
Expressions for the parameters, occurring in these equations can be seen in PartI of the book.
Further for Vsj \ 0
fse;j Vs;j
� �¼ 3:7dMJ0eH exp V5;jaeH
� �F5 EM=4kTeHð Þ ð11:29aÞ
and
fph;j Vs;j
� �¼ QabsY vð ÞKs vð Þ ð11:30aÞ
where
F5 gð Þ ¼ g2Z1
0
u5exp½�ðgu2 þ uÞ�du:
and for Vs, j C 0:
fse;j Vs;j
� �¼ 3:7dMJ0eH 1þ Vs;jaec
� �exp Vs;j aeH � aecð Þ� �
f5;B EM=4kTeHð Þ ð11:29bÞ
fph;j Vs;j
� �¼ QabsYðvÞKsðvÞ W n;Vs;jad
� �=U nj
� �� �ð11:30bÞ
where
F5;B gð Þ ¼ g2Z1
B
u5exp �ðgu2 þ uÞ� �
du;Bj ¼ � 4kTeHVs;jaeH=EM
� �;
for Vs,j \ 0:Equation (11.29a) and (11.29b) have been given by Mayer-Vernet [34].The flux Ks(v) of the Lyman-a photons on the Saturn atmosphere is given by
KsðvÞ ¼ ðDe=DsÞ2KeðvÞ
where De and Ds are the distances of Earth and Saturn from Sun and, Ke(v) andKs(v) denotes the flux on the Earth and Saturn atmosphere, respectively.
11.4 Charging of Ice Grains in Saturn E Ring 221

11.4.3 Numerical Results and Discussion
The present study considers the plasma regions in the E belt near the orbits of icysatellites (Mimas (3.08 Rs), Enceladus (3.95 Rs), Tethys (4.89 Rs), Diane (6.26 Rs)and Rhea (8.75 Rs)), which consist of cold and hot electrons, hydrogen and watergroup neutral/ionic species, and ice grains characterized by the MRN power law ofthe size distribution (see Table 11.3). In view of the recent understanding of icegrain composition in the E ring plasma environment viz. 10 % Sodium rich impureice grains along with remaining 90 % pure ice particles [17, 18, 39, 40], thisanalysis considers both pure and dirty ice grains.
For computations the relevant plasma parameters (listed in Table 11.4, havebeen picked from available literature and data based on Cassini/Voyager/Pioneerspace missions and HST observations [16, 43, 44, 46–48, 50]. The number den-sities of hydrogen and water group neutrals and corresponding ionic species havebeen taken from the E ring plasma environment model based on HST observation,proposed by Richardson et al. [47]. The number density of the cold and hotelectrons has been picked from an elegant paper by Richardson [44]. The coeffi-cient of ionization and recombination has been extracted from one of the basicpapers by Richardson et al. [46].
The size distribution of ice grains following MRN power law and corre-sponding number densities of ice grains (as listed in Table 11.3) have been usedfor computational purpose. The incident EUV radiation, causing photoelectricemission from ice can be approximated (See Sect. 11.3.2) as photon fluxKe & 3 9 1011/cm2, corresponding to Lyman-a radiation, just outside the earth’satmosphere (see Sect. 11.3.2). The photoelectric yield is taken to be 0.1 [8]. Asdiscussed earlier the Mie coefficient (Qabs) is almost unity for the whole range ofsize of the dust particles. The data corresponding to secondary electron emissionviz yield (dm = 1.5), optimum impact energy of electrons (Em = 400 eV), andcharacteristic mean energy of the secondary emitted electrons (Ese & 2.5 eV) hasbeen collected from a recent review by Graps et al. [8]. The dataset, used forcomputational purpose to evaluate the potential of ice grains corresponding to theorbits of Saturnian moons has been tabulated in Table 11.4.
Figure 11.3a illustrates the dependence of the surface potential (Vs) of pure anddirty ice grains on their number density (c = nd/nd,max) in the plasma environmentof the orbits of E ring Saturnian moons. Increase in the photoelectric yield sig-nificantly leads to more positive values of dust potential as displayed in Fig. 11.3b.Due to strong photoemission current from positively charged grains [n = (hm -
u)/kBTd], the dust potential is significantly enhanced with the lowering in thework function of dirty ice, as displayed in case of Rhea environment in Fig. 11.3c.
222 11 Kinetics of Complex Plasmas in Space
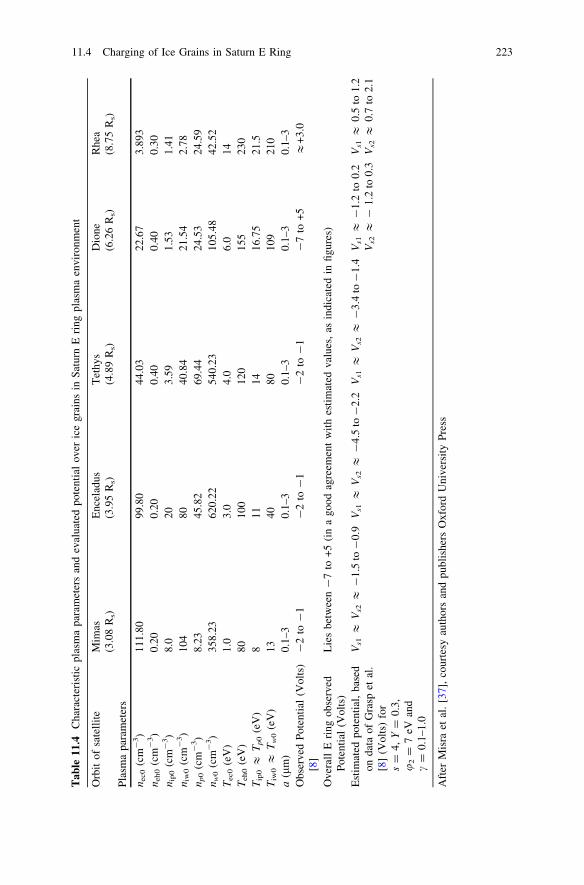
Tab
le11
.4C
hara
cter
isti
cpl
asm
apa
ram
eter
san
dev
alua
ted
pote
ntia
lov
eric
egr
ains
inS
atur
nE
ring
plas
ma
envi
ronm
ent
Orb
itof
sate
llit
eM
imas
(3.0
8R
s)E
ncel
adus
(3.9
5R
s)T
ethy
s(4
.89
Rs)
Dio
ne(6
.26
Rs)
Rhe
a(8
.75
Rs)
Pla
sma
para
met
ers
n ec0
(cm
-3)
111.
8099
.80
44.0
322
.67
3.89
3n e
h0
(cm
-3)
0.20
0.20
0.40
0.40
0.30
n ip0
(cm
-3)
8.0
203.
591.
531.
41n i
w0
(cm
-3)
104
8040
.84
21.5
42.
78n p
0(c
m-
3)
8.23
45.8
269
.44
24.5
324
.59
n w0
(cm
-3)
358.
2362
0.22
540.
2310
5.48
42.5
2T
ec0
(eV
)1.
03.
04.
06.
014
Teh
0(e
V)
8010
012
015
523
0T
ip0&
Tp0
(eV
)8
1114
16.7
521
.5T
iw0&
Tw
0(e
V)
1340
8010
921
0a
(lm
)0.
1–3
0.1–
30.
1–3
0.1–
30.
1–3
Obs
erve
dP
oten
tial
(Vol
ts)
[8]
-2
to-
1-
2to
-1
-2
to-
1-
7to
+5
&+
3.0
Ove
rall
Eri
ngob
serv
edP
oten
tial
(Vol
ts)
Lie
sbe
twee
n-
7to
+5
(in
ago
odag
reem
ent
wit
hes
tim
ated
valu
es,
asin
dica
ted
infi
gure
s)
Est
imat
edpo
tent
ial,
base
don
data
ofG
rasp
etal
.[8
](V
olts
)fo
rs
=4,
Y=
0.3,
u2
=7
eVan
dc
=0.
1–1.
0
Vs1&
Vs2&
-1.
5to
-0.
9V
s1&
Vs2&
-4.
5to
-2.
2V
s1&
Vs2&
-3.
4to
-1.
4V
s1&
-1.
2to
0.2
Vs2&
-1.
2to
0.3
Vs1&
0.5
to1.
2V
s2&
0.7
to2.
1
Aft
erM
isra
etal
.[3
7],
cour
tesy
auth
ors
and
publ
ishe
rsO
xfor
dU
nive
rsit
yP
ress
11.4 Charging of Ice Grains in Saturn E Ring 223

Fig. 11.3 a Dependence ofice dust surface potential (Vs)on number density (c) for theparameters s = 4, Y = 0.3,u2 = 7 eV, and tabulatedplasma parameters inTable 11.4, in the orbit ofSaturnian satellite in E ringenvironment; the labelsM, E, T, D, and R on thecurve correspond Mimas,Enceladus, Tethys, Dione,and Rhea orbits, respectively.The solid and broken curvescorrespond to pure (Vs1) anddirty (Vs2) ice, respectively.b Dependence of ice dustsurface potential (Vs) onparameter np; the parametersand labels on the curve arethe same as in Fig. 11.3a.c Dependence of ice dustsurface potential (Vs) on dirtyice work function u2; theparameters and labels on thecurve are the same as inFig. 11.3a (after Misra et al.[37], courtesy authors andpublishers Oxford UniversityPress)
224 11 Kinetics of Complex Plasmas in Space
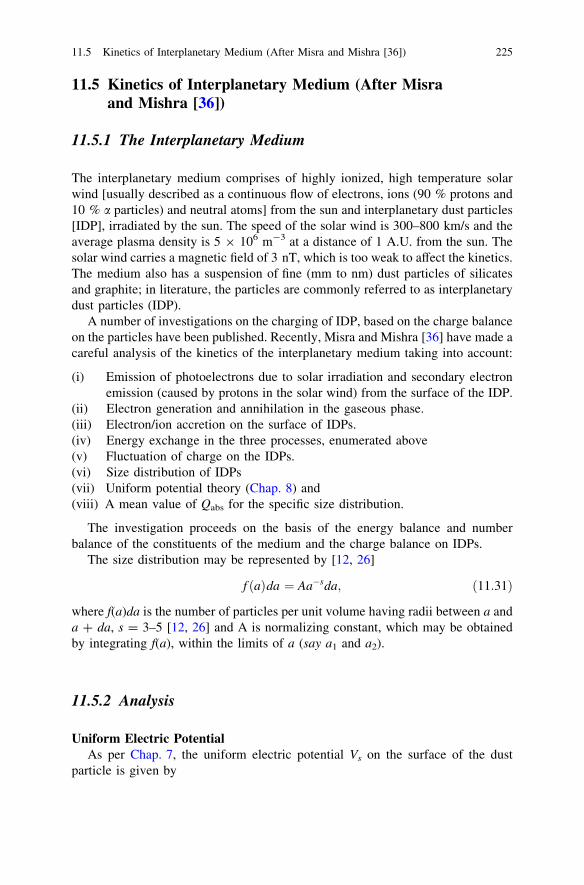
11.5 Kinetics of Interplanetary Medium (After Misraand Mishra [36])
11.5.1 The Interplanetary Medium
The interplanetary medium comprises of highly ionized, high temperature solarwind [usually described as a continuous flow of electrons, ions (90 % protons and10 % a particles) and neutral atoms] from the sun and interplanetary dust particles[IDP], irradiated by the sun. The speed of the solar wind is 300–800 km/s and theaverage plasma density is 5 9 106 m-3 at a distance of 1 A.U. from the sun. Thesolar wind carries a magnetic field of 3 nT, which is too weak to affect the kinetics.The medium also has a suspension of fine (mm to nm) dust particles of silicatesand graphite; in literature, the particles are commonly referred to as interplanetarydust particles (IDP).
A number of investigations on the charging of IDP, based on the charge balanceon the particles have been published. Recently, Misra and Mishra [36] have made acareful analysis of the kinetics of the interplanetary medium taking into account:
(i) Emission of photoelectrons due to solar irradiation and secondary electronemission (caused by protons in the solar wind) from the surface of the IDP.
(ii) Electron generation and annihilation in the gaseous phase.(iii) Electron/ion accretion on the surface of IDPs.(iv) Energy exchange in the three processes, enumerated above(v) Fluctuation of charge on the IDPs.(vi) Size distribution of IDPs(vii) Uniform potential theory (Chap. 8) and(viii) A mean value of Qabs for the specific size distribution.
The investigation proceeds on the basis of the energy balance and numberbalance of the constituents of the medium and the charge balance on IDPs.
The size distribution may be represented by [12, 26]
f ðaÞda ¼ Aa�sda; ð11:31Þ
where f(a)da is the number of particles per unit volume having radii between a anda ? da, s = 3–5 [12, 26] and A is normalizing constant, which may be obtainedby integrating f(a), within the limits of a (say a1 and a2).
11.5.2 Analysis
Uniform Electric PotentialAs per Chap. 7, the uniform electric potential Vs on the surface of the dust
particle is given by
11.5 Kinetics of Interplanetary Medium (After Misra and Mishra [36]) 225

dVsj=dt� �
¼ epamj fphj Vsj; Te
� �þ 1� geð Þnefse ts; Teð Þ þ nefth Vsj; Td
� ��
þ gijnijfic Vsj; Ti
� �� gejnefec Vsj; Te
� �� ð11:32Þ
where ge and gi denote the sticking coefficient of electrons and ions on the surfaceof dust; the suffix se refers to secondary emission and other symbols conform toChap. 7.
11.5.3 Constancy of Neutral Plus Ionic Species
Since an atom gives rise to an ion on ionization and an ion converts to an atomafter recombination with an electron the sum of number densities of ions andneutral atoms is constant; hence
n0 þ ni ¼ n00 þ ni0 ¼ Nt ðConstantÞ; ð11:33Þ
where the symbols are as in Chap. 7.
11.5.3.1 Electron and Ion Number Balance
The number balance of electrons and ions can be expressed as
dne=dtð Þ ¼ bin0 � arnenið Þ þ pa2rmsnd fph þ 1� geð Þnefse � genefec
� �ð11:34Þ
and
dni=dtð Þ ¼ bin0 � arnenið Þ � pa2rmsndnific; ð11:35Þ
where bi is the mean value of the coefficient of ionization due to the processes,responsible for the ionization of neutral species (viz. photo and electron impactionizations), ar(Te) = ar0Te
-hcm3/s is the recombination coefficient of electronsand ions [10], and ar0 and h are constants.
The value of the ionization coefficient may be determined from (11.34) byputting nd = 0 and d/dt = 0, corresponding to the steady-state plasma in theabsence of dust. Thus
bin00 ¼ arðTe0Þne0ni0 ¼ arðTe0Þn2e0: ð11:36Þ
It may be noticed that the electrical neutrality of the complex plasma is inherentin the number balance equations and can be easily derived from (11.32), (11.33),(11.34), and (11.35).
226 11 Kinetics of Complex Plasmas in Space

11.5.4 Energy Balance
The energy balance of solar wind plasma, with suspended dust particles may beexpressed as
ddt
32
kB ne þ ni þ n0ð ÞT� ffi
¼ bin0 ei þ eeð Þ þ arneniIp � 3kBT=2ð Þbin0� ��
þ pa2rmsnd fpheph þ 1� geð Þnefseese � genefeceec � ginificeic
� �
þ 3kBTd=2ð Þ pa2rms
� �ndginific
�;
ð11:37Þ
where ee (ei) is the mean energy of electrons (ions) produced by ionization ofneutral species, Ip is the ionization potential of the neutral atoms, eec(eic) is themean energy (far away from the grain surface) of the electrons (ions), accreting onthe surface of the grains, eph and ese correspond to the mean energy of the pho-toelectrons and secondary emitted electrons (far away from the surface of thegrain), and T is the mean temperature of the plasma species. Further, the meanenergy of electrons and ions produced due to ionization may be obtained byimposing the initial conditions for dust-free plasma nd = 0 in the energy balanceequations. The radiative and convective energy exchange between the dust and thegaseous component has been neglected.
11.5.5 Dust Temperature
Due to nonavailability of reliable values of absorptivity a0 and emissions e of thesurface of the particles, a typical value of the dust particle temperature i.e.,Td & 250 K may be chosen.
11.5.6 Methodology
For a chosen set of initial (t = 0) values of parameters corresponding to dust-freeplasma, one can obtain the steady-state potential on grains (Vs) and otherparameters viz. ne, ni, n0, and T by simultaneous numerical integration of (11.32–11.37) along with appropriate expressions for the electron/ion accretion andelectron emission; the steady state (t ? ?) is indeed independent of the initialconditions, since as t ? ?, (d/dt = 0) the set of differential equations reduces toa set of algebraic equations, independent of the values at t = 0.
11.5 Kinetics of Interplanetary Medium (After Misra and Mishra [36]) 227

11.5.7 Photoelectric Efficiency
The photoelectric efficiency can be represented [38] as v (ev) = yo[1 - (bo/12.5)],½100:6ðev�12:5Þ� which is applicable to the spectral regime ev B 12.5 eV; here (yo, bo)are constants and valued as (0.5, 8 eV) and (0.05, 7 eV) for silicate and graphiteparticles respectively. The Mie scattering coefficient (Qa) for the graphite andsilicate particles may be taken from the paper of Draine and Lee [6] in which thespectral dependence of Qa for different size grains is illustrated graphically. Thisfigure can be enlarged and the values of Qa(a, k) read at intervals of 10 nm inwavelength for particles of radii 3, 10, 30, 100, 300, and 1000 nm. The mean
spectral absorption efficiency QaðaÞ was evaluated by the relation
QaðaÞ ¼Xk1
k2
Qaða; kÞFðEvÞ,Xk1
k2
FðEvÞ !
; ð11:38aÞ
where Ev = 300 (ch/ek) is the energy of a photon of wavelength k in eV.The mean absorption efficiency Qm
a corresponding to a size distribution ofparticles and spectral irradiance distribution of incident radiation is given by
Qma ¼
XQaðaÞf ðaÞ
h i. Xf ðaÞ
h i: ð11:38bÞ
Using the curves for Qa(a,k) [6] and expressions for F(Ev) and f(a), the meanabsorption efficiency Qm
a can be evaluated. The mean values Qma ¼ 0:198 and
0.351 corresponding to silicate and graphite particles, has been used for thecomputations;
11.5.8 Secondary Electron Emission
The rate of secondary electron emission [34] is given by (11.29a) and (11.29b).Thus
For ts\0
fse tsð Þ ¼ nse=pa2� �
¼ 3:7dMJ0e;i 1� pstsð Þexp � pe � psð Þts½ �F5;B EM=4kBTeð Þ;ð11:39aÞ
where
J0e;i ¼ 8kBTe;i=me;ip� �1=2
;
F5;B lð Þ ¼ l2R1
B u5exp � lu2 þ uð Þ½ �du, B = (4kBTdvs/EM), ps = (Td/Tse), pe =(Td/Te), and Tse corresponds to the temperature (mean energy) of the secondaryelectrons, emitted from the dust particles.
228 11 Kinetics of Complex Plasmas in Space

For ts� 0
fse tsð Þ ¼ 1� gð Þnse=pa2� �
¼ 1� gð Þ3:7dMJ0e;iexp �petsð ÞF5 EM=4kBTeð Þ;ð11:39bÞ
where
F5 lð Þ ¼ l2Z1
0
u5exp � lu2 þ u� �� �
du:
The data corresponding to secondary electron emission viz. (i) yield dm = 2.4(Silicate) and 1.43 (Graphite), (ii) optimum impact energy (Em = 400 eV) ofelectrons [7, 20], and (iii) characteristic mean energy of the secondary emittedelectrons (ese & 2.5 eV, [58]) has been chosen for the computations.
11.5.8.1 Accretion of Electrons/Ions
Well-known expressions for the electron/ion accretion current over the dust par-ticles in a complex plasma based on the OML approach have been used forcomputations. HenceFor ts \ 0
fec tsð Þ ¼ nec=pa2� �
¼ J0e 1� petsð Þ;pe ¼Td=Te;
fic tsð Þ ¼ nic=pa2� �
¼ J0iexp pitsð Þ;
eecðtsÞ ¼2� pets
1� pets
� ffikTe and eic tsð Þ ¼ kBTi 2� pitsð Þ with
pi ¼ Td=Tið Þ:
For ts [ 0
fec tsð Þ ¼ nec=pa2� �
¼ J0eexp �petsð Þ;ficðtsÞ ¼ ðnic=pa2Þ ¼ J0ið1þ pitsÞ;eec tsð Þ ¼ kBTeð2þ petsÞ
and
eicðtsÞ ¼2þ pits
1þ pits
� ffikTi:
11.5 Kinetics of Interplanetary Medium (After Misra and Mishra [36]) 229

11.5.9 Numerical Results and Discussion
For a numerical appreciation of the kinetics of the charging of IDPs in theinterplanetary space plasma, the following standard set of parameters have beenused for computations; the effect of various parameters on the dust potential hasbeen studied by varying one parameter and keeping others the same.
ne0 = ni0 = n00 = 5 cm-3, Ts & 5800 K, T0 = 2 9 105 K, Td = 250 K,s = 3, a1 = 10 nm, a2 = 1000 nm, ge = 0.5, gi = 1, EM = 400 eV, j = 1.2,mi & mp = 1.67 9 10-24 g, ar0 = 10-7 cm3/s, and total dust mass densityMd = 10-23 g/cm3 corresponding to nd = 1 9 10-7 cm-3and arms & 30 nm,respectively; rs(&6.96 9 1010 cm) and rd(&1.45 9 1013 cm). For Silicates:u = 3.8 eV, dm = 2.4, (yo, bo) = (0.5, 8 eV), and Qa
m = 0.198. For Graphite:u = 4.8 eV, dm = 1.43, (yo, bo) = (0.05, 7 eV), and Qa
m = 0.35.Using the initial set of parameters, the steady-state dust surface potential (Vs)
can be obtained by simulations solution of the set of differential (11.32–11.37) ast ? ?.
The set of Fig. 11.4a–c illustrates the dependence of the steady-state surfacepotential (Vs) of the (i) silicate and (ii) graphite particles on the number density (nd)in the interplanetary space plasma. It is seen that Vs increases with increasing nd; thiscan be understood on the basis of increasing photoemission of electrons from thedust surface with increasing nd. Figure 11.4a reflects that the dust potential increaseswith decreasing work function (u) of the dust material. The dependence of thesurface potential of silicate and graphite particles on the size distribution parameters has been illustrated in Fig. 11.4b. It is seen that Vs decreases with increasing s; thisis because of decrease in arms with increasing s which leads to a smaller cross sectionavailable for the photoemission. Figure 11.4c illustrates the effect of stickingcoefficient (ge) on the surface potential of IDPs of silicate particles. The figureindicates that the surface potential increases with decrease in ge; this can beexplained by the fact that for a low value of ge the negative charge transfer to the dustdue to electron accretion will be small.
11.6 Temperature of Interstellar Warm Ionized Medium(After Misra et al. [37])
11.6.1 Interstellar Warm Ionized Medium
Warm ionized medium (WIM) regarded as diffused ionized gas region extends upto 1 kpc from the mid galactic plane [42]; this region usually consists of neutraland ionized H (about 99 %) gas along with small proportions of a few heavygaseous elements (like C, N, O, etc., about 1 %). High energy radiation of theorder of 10 nm wavelength from O-stars causes photo ionization of H atoms(ionization potential 13.6 eV) and subsequent heating of the gas through the
230 11 Kinetics of Complex Plasmas in Space

Fig. 11.4 a Surface potential(Vs, solid lines (silicates,L.H.S scale) and broken lines(graphite R.H.S scale)) of thedust particles as a function ofthe number density of dustparticles nd for differentvalues of u for the standardset of parameters, as stated inthe text. The labels p, q, r,and s refer to u = 3.8, 4.0,4.2, and 4.5 eV while a, b,and c refer to u = 4.5, 4.8,and 5.0 eV. b Surfacepotential (Vs, solid lines(silicates, L.H.S scale) andbroken lines (graphite R.H.Sscale)) of the dust particles asa function of the numberdensity of dust particles nd fordifferent values of s and thestandard set of parameters, asstated in the text. The labelsp, q, r, and s refer to s = 3,3.5, 4.0, and 5.0. c Surfacepotential (Vs) of the silicatedust particles as a function ofthe number density of dustparticles nd for differentvalues of ge and the standardset of parameters, as stated inthe text. The labels p, q, r, s,t, and u refer to ge = 0.1, 0.2,0.3, 0.5, 0.8, and 1.0 (after[36], courtesy authors andpublishers Oxford UniversityPress)
11.6 Temperature of Interstellar Warm Ionized Medium 231

energy gained by the free electrons; the electron–ion plasma recombination,accounts for the maintenance of WIM region plasma [59]. On account of weakabundance of heavy elements (i.e., C, N, O, etc.) their contribution to WIM plasmaheating is not significant, in comparison to that due to H atoms and may beignored. Photoemission of electrons from the dust particles (specifically graphite)is reckoned as a major source of WIM environment heating on account of a largedensity of high energy photoelectrons. Cooling in WIM region occurs on accountof electron-neutral collisional excitation of forbidden/semi-forbidden transitions,followed by a radiative decay; high energy neutral species also transfer theirkinetic energy to excite the heavy element atoms (specifically C and O, at groundstate) to radiate in the far IR region. In the context of heating, other plasma energytransfer mechanisms are insignificant in the energy balance of the WIM plasmaenvironment.
Mishra et al. [35] investigated the WIM kinetics; the main features of theanalysis are.
(i) Number and energy balance of ions/electrons and neutral species.(ii) Use of appropriate expressions for the rate of emission and mean energy of
emitted photoelectrons from a positively charged dust particle, consideringthe parametric dependence of the absorption efficiency, continuous spectralirradiance distribution of radiation and photoelectric efficiency.
(iii) Uniform potential approach in the context of the size distribution of dust.(iv) The (heating/cooling) kinetic processes, enumerated before.
The main aim of the analysis was to explain the observed/measured/estimatedconsensus values of WIM temperature [5] T = 8000 K, the electric potential onthe surface of graphite dust particles Vs(=2–4 V), and the electron densityne0 = 0.01 cm-3 and neutral H atom density nn0 = 0.1 cm-3on the basis ofplausible values of the initial parameters.
11.6.2 Analysis
Charging KineticsFrom Chap. 7 one has, in the steady state
dVs=dtð Þ ¼ epam 4fph Vs; Tdð Þ þ nific Vs; Tið Þ � nefec Vs; Teð Þ� �
; ð11:40Þ
where the symbols have usual meanings.This equation assumes Qabs to be independent of a, which is true of large
particles (2pa/k) [ 10 or a/k[ 1.6 and when a mean value can be used.
Conservation of Neutral Plus Ionic SpeciesThe conservation of atoms/ionic species implies
nn þ ni ¼ nn0 þ ni0 ¼ ntðConstantÞ ð11:41Þ
232 11 Kinetics of Complex Plasmas in Space

where nn/ni corresponds to the neutral/ion density and the subscript ‘0’ refers to thecorresponding number densities in the absence of the grains.
Electron Number BalanceThe number balance of electrons may be expressed as
dne=dtð Þ ¼ binn � arnenið Þ þ pa2rmsnd 4fph � nefec
� �; ð11:42aÞ
where bi is the mean value of the coefficient of ionization due to the processes,responsible for the ionization of neutral gaseous species (specifically photoion-izations), ar[� T -0.7] is the recombination coefficient [57] of electrons and ionsand T is the mean temperature of the species (electrons/ions/neutral atoms). Forsimplification of the analysis, the temperature dependence of bi and ar has beenignored.
Number Balance for Ionic SpeciesThe number balance of ions may be represented by
dni=dtð Þ ¼ binn � arnenið Þ � pa2rmsndnific ð11:42bÞ
Energy BalanceThe important source for the energy gain in warm ionized medium plasma is theionization of neutral atoms and photoemission from dust particles; all gaseousspecies may, following earlier investigations be assumed to have the same tem-perature T. Thus the energy balance in WIM may be expressed as
ddt
32
kBðne þ ni þ nnÞT� ffi
¼ binnðei þ eeÞ þ arneniIp � bnn32
kBT
� ffi
� aexnenn fex
32
kBT
� ffi� fdeaden2
nexp½�92=T�
þ 2rmsnd½4fpheph � fecneeec � ficnieic� þ
32
kBTd
� ffindnific
;
ð11:43Þ
where ee/ei is the mean energy of electrons/ions produced by ionization of neutralspecies, Ip is the ionization potential of neutral atom, fex corresponds to thefractional energy transfer to the neutrals by electrons which depends on energydifference between transition levels, fde is the depletion factor of C with respect toneutrals, eec/eic are the mean energy (far away from the grain surface) of theelectrons/ions, accreting on the surface of the grains, eph corresponds to the meanenergy of the photoemitted electrons (far away from the surface of the grain), andT is the mean temperature of the plasma species.
The first term on the right-hand side in (11.43) represents the net power gainedper unit volume by the plasma species on account of ionization and recombinationprocesses. The second term in the right-hand side represents the energy loss per
11.6 Temperature of Interstellar Warm Ionized Medium 233

unit volume in the process of neutral atomic excitation, specifically by electronimpact (due to higher mobility than ions). The next term is the power loss due tocollisions of C atoms with other neutral atoms resulting in loss of power byradiation from C atoms [2]. The last term represents the net gain in the meanenergy of plasma species on account of emission and accretion of electron/ionicspecies. The power loss due to elastic collisions between gaseous plasma con-stituents (electron/ion/neutral) have been ignored because this does not lead to anynet gain/loss of energy by the system. The term [(3/2)kBTd]ndnific corresponds tothe power carried by neutral atoms, produced from accretion of ions on the dustparticles.
Temperature of Dust ParticlesOn account of the nonavailability of reliable values of the parameters the tem-perature of dust Td = 20 K, corresponding to an idealized environment [14] hasbeen used.
Computation StrategyFor a chosen set of initial parameters, one can obtain the steady state potential ongrains (Vs) and other parameters viz. ne, ni, nn, and T by simultaneous numericalintegration of (11.40), (11.42a), (11.42b) and (11.43) along with appropriateexpressions for other relevant parameters as t ? ?; the steady state is indeedindependent of the initial conditions, since as t ? ?, (d/dt = 0) the set of dif-ferential equations reduces to a set of algebraic equations, independent of thevalues at t = 0. However the differential form of equations is retained, becausethese are amenable to numerical solution.
Photoemission from Dust ParticlesStellar RadiationBased on available data from measurement/observations, Draine [5] has formu-lated an empirical fit for F(Ev)dEv, the number of photons with energy between Ev
and Ev ? dEv, incident on a unit area per unit time per steradian, which is in agood agreement with the data over the range 5.0 eV B Ev B 13.6 eV. Theempirical fit is
FðEvÞ ¼ ð1:658� 106Ev � 2:152� 105E2v þ 6:919� 103E3
vÞ dEv; ð11:44Þ
where Ev is expressed in eV.Hence the number of photons with energy between Ev and Ev ? dEv, incident
on the surface 4pa2of a particle of radius a, per unit time is
dnincðEvÞ ¼ 4pa2 � 2pFðEvÞdEv ¼ 8p2a2FðEvÞdEv; ð11:45Þ
where F(Ev) is given by (11.44); it may be remembered that interstellar radiation isisotropic.
Mean Absorption Efficiency hQaiPlease see Sect. 11.5.7.
234 11 Kinetics of Complex Plasmas in Space
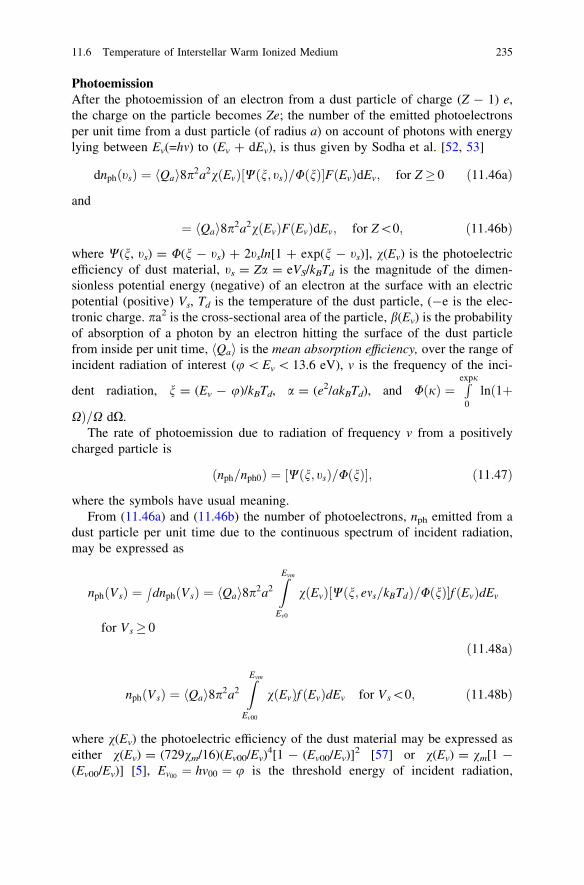
PhotoemissionAfter the photoemission of an electron from a dust particle of charge (Z - 1) e,the charge on the particle becomes Ze; the number of the emitted photoelectronsper unit time from a dust particle (of radius a) on account of photons with energylying between Ev(=hm) to (Ev ? dEv), is thus given by Sodha et al. [52, 53]
dnph tsð Þ ¼ hQai8p2a2v Evð Þ W n; tsð Þ=U nð Þ½ �F Evð ÞdEv; for Z� 0 ð11:46aÞ
and
¼ hQai8p2a2v Evð ÞF Evð ÞdEv; for Z\0; ð11:46bÞ
where W(n, ts) = U(n - ts) ? 2tsln[1 ? exp(n - ts)], v(Ev) is the photoelectricefficiency of dust material, ts = Za = eVS/kBTd is the magnitude of the dimen-sionless potential energy (negative) of an electron at the surface with an electricpotential (positive) Vs, Td is the temperature of the dust particle, (-e is the elec-tronic charge. pa2 is the cross-sectional area of the particle, b(Ev) is the probabilityof absorption of a photon by an electron hitting the surface of the dust particlefrom inside per unit time, hQai is the mean absorption efficiency, over the range ofincident radiation of interest (u\ Ev \ 13.6 eV), v is the frequency of the inci-
dent radiation, n = (Ev - u)/kBTd, a = (e2/akBTd), and U jð Þ ¼Rexpj
0lnð1þ
XÞ=X dX.The rate of photoemission due to radiation of frequency v from a positively
charged particle is
ðnph=nph0Þ ¼ Wðn; tsÞ=UðnÞ½ �; ð11:47Þ
where the symbols have usual meaning.From (11.46a) and (11.46b) the number of photoelectrons, nph emitted from a
dust particle per unit time due to the continuous spectrum of incident radiation,may be expressed as
nph Vsð Þ ¼Z
dnph Vsð Þ ¼ Qah i8p2a2ZEvm
Ev0
vðEvÞ½Wðn; ems=kBTdÞ=UðnÞ�f ðEvÞdEv
for Vs� 0
ð11:48aÞ
nphðVsÞ ¼ Qah i8p2a2ZEvm
Ev00
vðEvÞf ðEvÞdEv for Vs\0; ð11:48bÞ
where v(Ev) the photoelectric efficiency of the dust material may be expressed aseither v(Ev) = (729vm/16)(Ev00/Ev)
4[1 - (Ev00/Ev)]2 [57] or v(Ev) = vm[1 -
(Ev00/Ev)] [5], Ev00 ¼ hv00 ¼ u is the threshold energy of incident radiation,
11.6 Temperature of Interstellar Warm Ionized Medium 235

Ev0 = hm0 = (u ? eVs), Evm is the upper limit of the spectrum (13.6 eV), and vm
is the maximum value of v. As discussed before a mean value hQai = 0.33 hasbeen adopted.
Similarly the mean energy [52, 53] of the photoemitted electrons (at a largedistance from the dust surface) may be expressed as
for Vs� 0
ephðVsÞkBTd
� ffi¼ Qah i8p2
nph
� ffi ZEvm
Ev0
vðEvÞUðnÞ
Z1
eVs=kBTd
y2½1þ expðy� nÞ��1dy
0
B@
1
CAf ðEvÞdEv
2
64
3
75
� ðeVs=kBTdÞð11:49aÞ
and for Vs \ 0
ephðVsÞkBTd
� ffi¼ Qah i8p2
nph
� ffi ZEvm
Ev00
vðEvÞUðnÞ
Z1
0
2glnð1þ expðn� gÞdg
0
@
1
Af ðEvÞdEv
2
64
3
75
� eV s=kBTdð Þ:ð11:49bÞ
Other ParametersThe expressions for other relevant parameters are as follows (Chap. 3):
for Vs� 0 : fic ¼ 8kBT=mipð Þ1=2exp �eVs=kBTð Þ;fec ¼ 8kBT=mepð Þ1=2 1þ eVs=kBTð Þ½ �eic ¼ 2þ eVs=kBTð Þ= 1þ eVs=kBTð Þ½ �kBT and eic Vsð Þ ¼ 2kBT þ eVs:
for Vs\0 : fec ¼ 8kBT=mepð Þ1=2exp eVs=kBT½ �;fic ¼ 8kBT=mipð Þ1=2 1� eVs=kBTð Þeec ¼ 2� eVs=kBTð ÞkBT and
eic ¼ 2� eVs=kBTð Þ= 1� eVs=kBTð Þ½ �kBT :
11.6.3 Numerical Results and Discussion
For computations, the authors have chosen a standard set of parameters andstudied the effect of change of one parameter, keeping others the same. Thestandard set of parameter for WIM (including spherical graphite particles) is asfollows:
236 11 Kinetics of Complex Plasmas in Space

F Evð Þ ¼ 1:658� 106 Ev � 2:152� 105 E2v þ 6:919� 103E3
v
� �dEv [5], s = 3.5,
arms = 20 nm corresponding to amin = 10 nm and amax = 1,000 nm [6], averageabsorption efficiency (Mie coefficient of scattering) computed before in this paperhQai ¼ 0:33, bi = 10-16/s [5], ar = 1.75 9 10-10 9 T-0.70 [4], nd = 10-7 cm-3
[49], Td = 20 K [14], vm = 0.1, T0 = 8000 K, Ip = 13.6 eV (hydrogen), workfunction of graphite u = 5 eV [27] and nt = 0.11 cm-3 [5] and ade & 8 9 10-39/cm3s, fexaex & 10-9/cm3s, fde = 0.1 [2].
In the steady state as t ? ?, d/dt = 0, the set of differential Eqns. (11.40),(11.41), (11.42a), (11.42b), and (11.43) reduces to a set of algebraic equations,which give steady-state values of n0, ne, ni, Vs, and T; these values are independentof the values at t = 0. Since the simultaneous numerical solution of the set ofalgebraic equations is formidable, a numerical solution of the set of differentialequations has been obtained with plausible initial values of the parameters n0, ne,ni, Vs and T at t = 0 viz. nn0 = 0.10/cc, ne0 = ni0 = 0.01/cc, Vs = 0, T = 8000 K.Since the values of n0, ne, ni, Vs and T, so obtained are independent of the initialconditions, the accuracy of the assumed initial conditions t = 0 is irrelevant. Thenormalized values of ne, ni, n0 and T viz. (ne/ne0), (ni/ni0), (nn/nn0), (T/T0) and thesurface potential Vs have been discussed later.
Figure 11.5a displays the surface potential (Vs) dependence of the photoemis-sion current and corresponding mean energy of the photoelectrons (far away fromthe surface), from spherical graphite particles (u = 5.0 eV) of radius a at atemperature of Td = 20 K, irradiated by photons with energy distribution, givenby (11.9). On account of the fact that with increasing (Vs) electrons in the particleneed more energy to be emitted nph and Eph get consequently decreased.
Figure 11.5b shows the dependence of the dust surface potential Vs and meantemperature of the plasma species T on the number density of dust particles fordifferent values of root mean square radius arms. It is seen that as arms increases,both Vs and T/T0 increase; this may be ascribed to larger number of emittedphotoelectrons because of increased effective surface area of the particles andsmaller number of electrons available per particle for accretion on the dust.
Figure 11.5c shows the corresponding dependence of the electron/ion densityon dust particle density nd; it is seen that the electron density decreases withincreasing number density of dust particles (nd). This is due to enhancement in therate of accretion of electrons on dust particles due to increased temperature of theplasma and the surface potential of dust particles with increasing dust particledensity nd; the rate of photoelectric emission also decreases with increasing dustparticle density nd on account of simultaneous increase in Vs.
Figure 11.5d and e display the effect of increasing vm on the surface potentialVs, mean temperature T and electron/ion density as a function of dust particledensity nd.
Figure 11.5f displays the dependence of the temperature of the WIM plasmaand the surface potential on the graphite particles on the number density of dustparticles for different values of fexaex. It is seen that both Vs and (T/T0) increasewith increase in dust particle density nd, as discussed earlier. However with
11.6 Temperature of Interstellar Warm Ionized Medium 237

increasing value of fexaex and hence associated cooling the temperature (T/T0) andthe surface potential decrease. The corresponding dependence of the electron/iondensity on dust particle density nd is displayed in Fig. 11.5g.
Figure 11.5h and i display the effect of change of nt on the temperature T/T0,surface potential Vs, electron density ne/ne0, ion density ni/ni0.
From Fig. 11.5f and g it is seen that the consensus measured/observed/esti-mated values of the temperature of the WIM plasma 8000 K, the surface potential
Fig. 11.5 a Photoemission current (solid) and corresponding mean energy far from the surface(broken lines) as a function of surface potential Vs. The labels D and S on the curves correspondto different dependences of v on Et, as given by Draine [5] and Spitzer 57]. b Surface potential(Vs, solid lines) of the dust particles and the mean temperature (T, broken lines) of the plasmaspecies as a function of the number density of dust particles nd for different values of arms and thestandard set of parameters, as stated in the text. The labels a, b, c, d, e, f, g, and h refer toarms = 1, 5, 10, 20, 30, 50, 80, and 100 nm, respectively. c Corresponding electron (ne, solid) andion (ni, broken) densities as function of nd for different values of arms. The standard set of theparameters and labels are the same as in Fig. 11.2a. d Surface potential (Vs, solid lines) of thedust particles and the mean temperature (T, broken lines) of the plasma species as function of nd
for different values of vm and the standard set of parameters, as stated in the text. The labels p, q,r, s, and t refer to vm = 0.05, 0.08, 1.0, 0.3, and 0.5. e Corresponding electron (ne, solid) and ion(ni, broken) densities as function of nd for different values of vm. The standard set of theparameters and labels are the same as in Fig. 11.3a. f Surface potential (Vs, solid lines) of the dustparticles and the mean temperature (T, broken lines) of the plasma species as function of nd fordifferent values of parameter fexaex and the standard set of parameters, as stated in the text. Thelabels a, b, c, d, e, f, and g refer to fexaex = (0.01, 0.05, 0.1, 0.5, 1.0, 5, 10) 9 10-9/cm3 s,respectively. g Corresponding electron (ne, solid) and ion (ni, broken) densities as function of nd
for different values of fexaex. The standard set of the parameters and labels are the same as inFig. 11.4a. h Surface potential (Vs, solid lines) of the dust particles and the mean temperature(T, broken lines) of the plasma species as function of nd for different values of nt and the standardset of parameters as stated in the text. The labels p, q, r, s, t, and u refer to nt = (0.11, 0.22, 0.33,0.44, 0.55, and 1.1/cm3, respectively. i Corresponding electron (ne, solid) and ion (ni, broken)densities as function of nd for different values of nt. The standard set of the parameters and labelsare the same as in Fig. 11.5a. j Values of nd and fexaex, which lead to consensus values of WIMparameters viz. T = 8000 K, Vs = 2.3 V, ne = 0.01 cm-3, ni = 0.01 cm-3, nn = 0.1 cm-3 forthe standard set of the parameters in the text (after Misra et al. [35], courtesy authors andpublishers Springer)
238 11 Kinetics of Complex Plasmas in Space
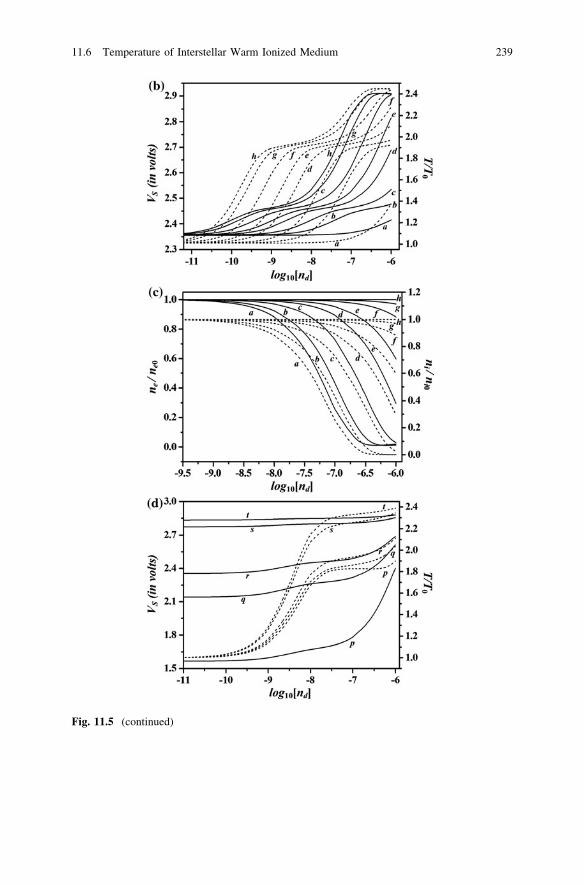
Fig. 11.5 (continued)
11.6 Temperature of Interstellar Warm Ionized Medium 239

Fig. 11.5 (continued)
240 11 Kinetics of Complex Plasmas in Space

Fig. 11.5 (continued)
11.6 Temperature of Interstellar Warm Ionized Medium 241

(2.3 V) on graphite particles [59]; (2 \ Vs \ 4 V) the electron/ion densities(ne = ni = 0.01 cm-3) and density of neutral H atoms (nn = 0.1 cm-3) [5] can beexplained on the basis of plausible combination of values of the number density ofparticles and the parameter fexaex as illustrated by Fig. 11.5j.
A precise determination of fex and aex in the laboratory will thus lead to adefinite value of the density of graphite particles. The other parameters are as perSect. 11.6.3.
Since all the particles are at the same electric potential Vs = Ze/a, the chargedistribution may be obtained by putting a = (Ze/Vs) in (11.1) and may beexpressed as
F Zð ÞdZ ¼ e=Vð ÞF Ze=Vsð ÞdZ: ð11:50Þ
11.7 Conclusions
1. A parametric analysis of the kinetics and temperature of the WIM complexplasma, including number and energy balance of the constituents and sizedistribution of dust particles has been presented. The results have beengraphically illustrated.
2. It is seen that the consensus values of the WIM plasma temperature, surfacepotential on the graphite dust particles, and electron/ion/neutral atom densitiescan be explained on the basis of plausible combinations of dust particle densitynd and the parameter fexaex.
References
1. S.J. Bauer, Physics of planetary ionospheres (Springer, New York, 1973)2. R.L. Bowers, T. Deeming, Astrophysics (Jones & Bartlett, Boston, 1984)3. C. Cui, J. Goree, IEEE Trans. Plasma Sci. 22, 151 (1994)4. T. deJong, Astron. Astrophys. 55, 137 (1977)5. B.T. Draine, Astrophys. J. Suppl. Ser. 36, 595–619 (1978)6. B.T. Draine, H.M. Lee, Astrophys. J. 285, 89–108 (1984)7. B.T. Draine, E.E. Salpeter, Astrophys. J. 231, 77 (1979)8. A.L. Graps, G.H. Jones, A. Juhasz, M. Horanyi, O. Havnes, Space Sci. Rev. 137, 435 (2008)9. E. GrÜn et al., Nature 362, 428 (1992)
10. A.V. Gurevich, Nonlinear Phenomena in the Lonosphere (Springer, New York, 1978)11. O. Havnes, T. Aslaksen, A. Brattli, Phys. Scr. T89, 133 (2001)12. H. Hirashita, T. Nozawa, Earth, Planets and Space 00, 1–10 (2012)13. M Horanyi et al, Rev. Geophys. 42, RG4002 (2004)14. T. Huang, B.T. Draine, A. Lazarian, Astrophys. J. 715, 1462–1485 (2010)15. A. Juhasz, M. Horanyi, J. Geophys. Res. 107, A6 (2002)16. S. Jurac, Johnson, J.D. Richardson, Icarus 149, 384 (2001)17. S. Kempf et al., Nature 433, 289 (2005)
242 11 Kinetics of Complex Plasmas in Space

18. S. Kempf, R. Srama, M. Horanyi, M.E. Burton, S. Helfert, G. Moragas-Klostermeyer,M. Roy, E. Grun, Nature 433, 289 (2005)
19. S. Kempf, R. Srama, F. Postberg, M. Burton, S.F. Green, S. Helfert, J.K. Hillier, N. Mcbride,M.J. McDonnell, G. Moragas-Klostermeyer, M. Roy and E. Grun, Science 307, 1274 (2005b)
20. H. Kimura, I. Mann, Astron. J. 499, 454 (1998)21. B.A. Klumov, S.V. Vladimirov, G.E. Morfill, JETP Lett. 82, 632–637 (2005)22. B.A. Klumov, S.I. Popel, R. Bingham, JETP Lett. 72, 364 (2000)23. B.A. Klumov, G.E. Morfill, S.I. Popel, J. Expr, Theor. Phys. 100, 152 (2005)24. B.A. Klumov, S.V. Vladimirov, G.E. Morfill, JETP Lett. 82, 632 (2005)25. B.A. Klumov, S.V. Vladimirov, G.E. Morfill, JETP Lett. 85, 478 (2007)26. D. Le Sargeant, L.B. Hendecourt, P.H.L. Lamy, ICARUS 43, 350 (1980)27. D.R. Lide, Handbook of Chemistry and Physics. (CRC press, London, 2008)28. T. Matsoukas, M. Russel, J. Appl. Phys. 77, 4285 (1995)29. T. Matsoukas, M. Russel, M. Smith, J. Vac. Sci. Tecnol. A14, 624 (1996)30. M. McEwan, L.F. Phillips, Chemistry of the Atmosphere. (Edward Arnold, London, 1975)31. D.A. Mendis, Ann. Rev. Astron. Astrophys. 26, 11 (1988)32. D.A Mendis, Keynote talk in ICPDN 6, (May 2011)33. D.A. Mendis, W.I. Axford, Rev. Earth Planetar. Sci. 2, 419 (1974)34. N. Meyer-Vernet, Astron. Astrophys. 105, 98 (1982)35. S.K. Mishra, M.S. Sodha, S. Srivastava, Astrophys. Space Sci. 344, 193 (2013)36. S. Misra, S.K. Mishra, Mon. Not. Roy. Astron. Soc. 432, 2985 (2013)37. S. Misra, S.K. Mishra, M.S. Sodha, Mon. Not. Roy. Astron. Soc. 423, 176 (2012)38. T. Mukai, Astron. Astrophys 99, 1 (1981)39. F. Postberg, S. Kemf, J. Schmidt, N. Brilliantov, A. Beinsen, B. Abel, U. Burk, R. Srama,
Nature 459, 2009 (1098)40. F. Postberg, J. Schmidt, J. Hillier, S. Kempf, R. Srama, Nature 474, 620 (2011)41. G.C. Reid, Adv. Space Res. 20, 1285 (1997)42. R.J. Reynolds, L.M. Heffner, S.L. Tufte, Evidence for an additional heat source in the warm
ionized medium of galaxies. Astrophys. J. 525, L21–L24 (1999)43. J.D. Richardson, J. Geophys. Res. 97, 13705 (1992)44. J.D. Richardson, Geophys. Res. Lett. 22, 1177 (1995)45. J.D. Richardson, A. Eviatar, J. Geophys. Res. 93, 7297 (1988)46. J.D. Richardson, A. Eviatar, G.L. Siscoe, J. Geophys. Res. 91, 8749 (1986)47. J.D. Richardson, A. Eviatar, M.A. McGrath, V.M. Vasyliunas, J. Geophys. Res. Planets 103,
245 (1998)48. J.D. Richardson, E.C. Sittler Jr, J. Geophys. Res. 95, 12019 (1990)49. P.K. Shukla, A.A. Mamun, Introduction to dusty plasma physics (Institute of Physics, Bristol,
2002)50. E.C. Sittler Jr., M. Thomsen, D. Chornay, M.D. Shappirio, D. Simpson, R.E. Jhonson,
H.T. Smith, A.J. Coates, A.M. Rymer, F. Crary, D.J. Mc.Comas, D.T. Young, D. Reisenfeld,M.Dougherty, N. Andre, Geophys. Res. Lett. 32, L14S07 (2005)
51. M.S. Sodha, S. Guha, Physics of colloidal plasma. Adv. Plasma Phys, eds. by A. Simon,W.B. Thomas, (Interscience) 4, 219 (1971)
52. M.S. Sodha, S.K. Mishra, S. Misra, Phys. Plasma 16, 123701 (2009)53. M.S. Sodha, S. Misra, S.K. Mishra, Charging Phys. Plasmas 16, 123705 (2009)54. M.S. Sodha, S. Misra, S.K. Mishra, Plasma Sources Sci. Technol. 19, 045022 (2010)55. M.S. Sodha, S. Misra, S.K. Mishra, A Dixit, Phys. Plasmas. 18, 083708 (2011)56. L. Spitzer Jr., M.G. Tomasko, Astrophys. J. 152, 971–986 (1968)57. L. Spitzer, Astrophys. J. 107, 6–33 (1948)58. E.J. Sternglass, The Theory of Secondary Electron Emission, Sci. Paper 1772 (Westinghouse
Res. Lab, Pittsburgh, 1954)59. J.C. Weingartner, B.T. Draine, Astrophys. J. Suppl. Ser. 134, 263–281 (2001)60. M. Wilson, Phys. Today, p.15 (Feb. 2010)
References 243

Chapter 12Complex Plasma as Working Fluidin MHD Power Generators
12.1 Introduction
The efficiency of mechanical (and hence electrical) power generation in a steamturbine system is limited by the temperature of the superheated steam and not bythe high temperature of the gases obtained from combustion or flow of a carriergas through a nuclear reactor; some loss of efficiency is also suffered in theconversion of mechanical into electrical power. Hence, it is desirable to have asystem that can utilize the high temperature gases, corresponding to combustion orflow through nuclear reactor, for direct conversion of thermal into electrical power.The magnetohydrodynamic (MHD) power generation system is a powerful meansto this end. Figure 12.1 illustrates the basic configuration of an MHD generator. Itconsists of a stagnation (t ¼ 0) chamber, containing hot gases (obtained bycombustion or flow through nuclear reactor) and the MHD duct, where the elec-trical power gets generated; the gas exiting from the duct is fed into a conventionalsteam power generation unit to produce further electrical power. The electrodesare placed in the opposite walls of the duct as shown in Fig. 12.1 (segmentedelectrode configuration); in such a configuration, no current can flow along thedirection (x axis) of flow of the gas (since it is an open circuit in the x direction)and along the magnetic field (z axis) because there is no force on the chargecarriers along the z direction.
The parameters in the stagnation chamber and at the entrance to the duct arecharacterized by the suffixes 0 and 1.
12.2 Basic Equations
Following earlier works (e.g. [13]), the basic (viz., momentum, energy, continuity,state, and modified Ohm’s Law) equations corresponding to the duct may beexpressed as
M. S. Sodha, Kinetics of Complex Plasmas, Springer Series on Atomic,Optical, and Plasma Physics 81, DOI: 10.1007/978-81-322-1820-3_12,� Springer India 2014
245

Momentum qt dt=dxð Þ þ dp=dxð Þ þ JB ¼ 0; ð12:1Þ
Energy: qt d CpT þ t2=2� ��
dxffi �
þ JE ¼ 0 ð12:2Þ
and
Continuity: qtA ¼ constant ¼ q1t1A1; ð12:3Þ
where d=dt ¼ td=dx,
q is the density of the gasT is the temperature of the gast is the flow velocity of the gas (along x direction)p is the pressure of the gascp is the specific heat at constant pressure of the gasJ is the current densityB is the magnetic field (along z direction)E is the electric field in the gasJ � B ¼ iJB is the force per unit volume exerted by the magnetic field on the
flowing gasJE is the Ohmic loss per unit volume, andA(x) is the area of cross section of the duct.
Recalling that
cp � ct ¼ R=l
and
cp=ct ¼ c;
the equation of state for unit mass of the gas is
ðp=qÞ ¼ ðR=lÞT
Fig. 12.1 MHD duct configuration (after Swifthook and Wright [13])
246 12 Complex Plasma as Working Fluid in MHD Power Generators

can be expressed as
p ¼ qcpT ðc� 1Þ=c; ð12:4Þ
where ct is the specific heat of gas at constant volume and l is the molecularweight of the gas.
The modified Ohm’s law, which takes into account the induced t � Bð Þ e m fper unit volume may be expressed as
J ¼ rðtB� EÞ; ð12:5Þ
where r is the electrical conductivity of the gas and E is electric field along they direction (perpendicular to t and B). The systems of (12.1)–(12.4) have beensolved by various workers (Coe and Eisen [1], Huth [5], Neuringer [8], Sutton[12], Way [16]), corresponding to one of the parameters ðA; p; T ; tÞ being keptconstant. Swifthook and Wright [13] solved this system of equations keeping theMach number M ¼ t=c constant, where c is the speed of sound in the gas. Thisanalysis is convenient for analyzing the performance of a combined cycle of MHDgeneration and generation by a steam turbine system; since the conductivity of thegas falls to low values after traversing some distance in the duct, the remainingenergy of the gas can be used to extract further electrical power by the use of exitgas from the MHD duct as an input in the conventional steam turbine cycle.
From (12.4), the Mach number M of the flow is given as
M2 ¼ t2�
c2 ¼ t2�
cp=qð Þ ¼ t2�
c� 1ð ÞcpT : ð12:6Þ
12.3 Analysis for Constant Mach Number (After Swifthookand Wright [13])
12.3.1 Efficiency
Using (12.2) the electrical power, extracted per unit length is given as
JEA ¼ �qtA d cpT þ t2=2� ��
dx:
Substituting for t from (12.6) and qtA from (12.3) into the above equation oneobtains
dQ
dx¼ JEA ¼ �q1 t1 A1 d cpTf1þ ðc� 1ÞM2=2g
ffi ��dx
¼� q1 t1 A1 cpdT0=dx;
where the stagnation temperature T0 is defined as
12.2 Basic Equations 247

cpT0 ¼ cpT þ t2=2 ¼¼ cpT 1þ ðc� 1ÞM2=2ffi �
:
Thus dQdx¼ JEA ¼ q1 t1 A1 d T=T1ð Þ dx ¼ Q1d T0=T01ð Þ=dx; where Q1 is the
enthalpy of the gas entering the duct (x = 0) per unit time.Integrating the above equation
Q=Q1 ¼ 1� T0=T01ð Þ ¼ 1� T=T1ð Þ ¼ g ð12:7Þ
where g is the efficiency of electrical power extractions.It is interesting to note that the above expression corresponds to the efficiency
of a reversible engine.
12.3.2 Other Parameters
From (12.1)–(12.4) and (12.6), it can be shown [13] that
p=p1ð Þ ¼ T=T1ð Þb; ð12:8Þ
q=q1ð Þ ¼ T=T1ð Þb�1; ð12:9Þ
t=t1ð Þ ¼ T=T1ð Þ1=2 ð12:10Þ
and
A=A1ð Þ ¼ T=T1ð Þ� b�1=2ð Þ; ð12:11Þ
where
b ¼ 1þ ð1� KÞðc� 1ÞM2=2cffi ��
c� 1ð ÞK� �
ð12:12aÞ
and
K ¼ Ey=tB is the load factor: ð12:12bÞ
The duct length x corresponding to a temperature T can be shown to be given by
x=x0ð Þ ¼ � Kð1� KÞ½ ��1ZT=T1
1
r1=rð Þ T=T1ð Þb�3=2d T=T1ð Þ ð12:13aÞ
where
x0 ¼ Q1=A1ð Þ�r1 t2
1B2: ð12:13bÞ
An analytical expression for x can be obtained when the electrical conductivityof the gas can be expressed as
248 12 Complex Plasma as Working Fluid in MHD Power Generators

r ¼ STyp�z: ð12:14aÞ
In this case, it can be shown that
x=x2ð Þ ¼ 1� T=T1ð Þx; ð12:14bÞ
where
x ¼ b� 1=2ð Þ � y� bzð Þ ð12:14cÞ
and
x2 ¼ x0=K 1� Kð Þx: ð12:14dÞ
12.4 Complex Plasmas as Working Fluid in MHDGenerators (After Sodha and Bendor [10, 11])
12.4.1 The Need
The large-scale use of MHD power generation (particularly in closed cycles withnuclear reactor) is mainly constrained by the low electrical conductivity of the gas(even after seeding with cesium) at temperatures feasible with technology (par-ticularly in the 1960s, when MHD power generation was pursued as a seriousoption). Hence, many interesting concepts were put forward to enhance the con-ductivity of the gas at temperatures compatible with the then technology. One ofthe approaches proposed at that time was to have a suspension of low workfunction dust in a gas and use this complex plasma as the working fluid. Honna andFushima [2], Honna et al. [3], Hooper et al. [4], Mori et al. [7], Sodha and Bendor[10, 11], Waldie and Fells (1967) have investigated the use of this concept forsytems compatible with gas cooled reactor. Experimental [17], values of theelectrical conductivity of Argon–BaO complex plasmas were found to be in goodagreement with theory [14, 15].
12.4.2 Equivalent Parameters
The parameters of an equivalent gas (for study of gas dynamics) having a sus-pension of dust with a fraction k by mass are given as
q ¼ 1þ kð Þqg ð12:15aÞ
R ¼ Rg
�1þ kð Þ ð12:15bÞ
12.3 Analysis for Constant Mach Number 249

cp ¼ cpg þ kcpp
� ��1þ kð Þ ð12:15cÞ
c ¼ cpg þ kcpp
� ��kcpp þ cpg=cg
� �ð12:15dÞ
where cpg and cpp are the specific heats per unit mass at constant pressure of thegas and the dust, Rg is the gas constant of the pure gas and cg ¼ cpg=cg.
12.4.3 Steam Turbine-Magnetohydrodynamic ToppingClosed Cycle
The cycle is illustrated in Fig. 12.2. The suffixes 1, 2, 3, and 4 refer to inlet/outletfrom various components of the cycle; the suffix 0 indicates the stagnation values.For a mass flow rate m of the complex plasma, the power input/output corre-sponding to different components is given by
WM ¼ gM mcp T01 � T02ð Þ; ð12:16aÞ
WT ¼ gT mcp T02 � T03ð Þ; ð12:17aÞ
Wc ¼ mcp T04 � T03ð Þ=gc ð12:18aÞ
and
H ¼ mcp T01 � T04ð Þ; ð12:19aÞ
where gM is the efficiency of conversion of D.C. power (produced by the MHDgenerator) into A.C. power, gT is the efficiency of conversion of heat absorbedfrom the complex plasma to electrical power by the steam turbine cum associatedequipment, and gc is the mechanical efficiency of the compressor.
We have neglected the energy needed to maintain the magnetic field, includingrefrigeration for superconductors, in case of superconducting magnets.
For a constant Mach number duct, from (12.8) one has
p2=p1ð Þ ¼ T02=T01ð Þb; ð12:16bÞ
further,
p3 ¼ KT p2 ð12:17bÞ
and
p4 ¼ K�1H p1; ð12:18bÞ
where KT and KH indicate the pressure drop in the heat exchanger and the reactor.The temperature ratio across the compressor is
250 12 Complex Plasma as Working Fluid in MHD Power Generators

T04
T03¼ 1þ p4=p3ð Þðc�1Þ=c
n og�1
p ; ð12:18cÞ
where gp is the polytrophic efficiency.In all components except the MHD duct, the flow velocity is not large enough
to make T0 substantially different from T.Thus, WM=m; WT=m; Wc=m and H=m may be evaluated by a choice of
T02=T01; T03=T02 and p4/p3; the cycle efficiency is given by
g ¼ Wm þWT �Wcð Þ=H:
For a numerical appreciation of the dependence of the overall efficiency g onT2/T1 and T3/T1, the following typical parameters have been assumed:
cpg ¼ 522 J kg�1K�1; cpp ¼ 334 J kg�1K�1; cg ¼ 1:667; K ¼ 0:8; gM ¼ 0:95; gc ¼ 0:98;
gp ¼ 0:9; gT ¼ 0:45; KT ¼ 0:96; KH ¼ 0:95:
For a suspension of BaO dust in Argon and k the ratio of mass of dust to gasequals to 0.1. The dependence of the efficiency g on T2/T1 and T3/T1 is illustratedin Fig. 12.3 for M = 0.7.
Sodha and Bendor [11] evaluated the electrical conductivity of a suspension ofBaO dust in Argon as function of pressure, temperature, and k. The followingparameters were used:
Diameter of particles 0.05 l; density of BaO = 5.72 9 103 kg/m3; workfunction of BaO = 1.7 eV; ionization potential of Argon = 15.68 eV; electroncross collision cross-section of Ar atoms = 3 9 10-10 cm2.
Fig. 12.2 Magnetohydrodynamic generator steam turbine topping cycle—steam water—gasparticle suspended (after Sodha and Bendor [11], curtsey authors and publishers IOP). Thecomplex plasma cycle is represented by continuous line, while the water stream cycle conformsto dashed lines
12.4 Complex Plasmas as Working Fluid 251

The evaluated conductivity (as per Part I of the book) can be approximatelyfitted to the relation r = 1.39 9 10-8k0.66722 T2.92191 p-0.13130, where r isexpressed in mhos/m, T in K and p in atmospheres. Further, for duct B = 10 Wb/m2 and V = 11,505 V.
Detailed results for a cycle, corresponding to M ¼ 1 and k ¼ 0:3 are given inTable 12.1.
Corresponding dependence of the duct length on k is illustrated in Fig. 12.4.
12.4.4 Feasibility
The interest in the commercial exploitation of the concept of MHD power gen-eration started waning by the end of 1960s and practically vanished in the 1970s.This was on account of the then nonavailability of materials for fabrication ofelectrodes and ducts, compatible with the temperature and gas flow speeds,
Fig. 12.3 Variation of efficiency of a steam turbine–MHD generator topping cycle with T3/T1
and T2/T1 (after Sodha and Bendor [11], curtsey authors and publishers IOP)
Table 12.1 Results for a selected cycle: T2/T1 = 0.7, M = 1.0, k = 0.3 (after Sodha and Bendor[11], curtsey authors and publishers IOP)
T01 (K) T02 (K) T03 (K) T04 (K) P1 (atm) P2
(atm)P3
(atm)P4 (atm) r1
(mhom-1)
r2
mhom-1
x2 (m)
1,669 1,167 367 635 7.001.73 1.65
7.286.85 2.95
6.35
WM
W
WT
W
Wc
W
H
WA1
W
� 1010
m2=W
m
W
� �� 107
kg/J
XW
� 108
m3=W
g
0.845 0.652 0.490 1.832 39.0 37.0 4.67 0.543
X Volume of the duct; W net out part
252 12 Complex Plasma as Working Fluid in MHD Power Generators

characteristic of the MHD duct designs. The nonavailability and cost of a super-conducting system to produce large magnetic field over the duct length was alsodiscouraging. However, since then the tremendous progress in the field of mate-rials, including superconductors, warrants a fresh look at the material aspects.
Dust of BaO and other materials with a particle size of 0.05 lm (or less) hasbeen commercially available for a very long time and the situation has furtherimproved with the advent of nanotechnology. The uniform suspension of fine dust(size 0.05 lm or less) is perfectly feasible on account of negligible slip [10, 11]between the particles and the gas. The tendency of the particles to coalesce iscountered on account of the positive charge due to thermionic emission. In coolerparts of the system, ultrasonics should be helpful. The turbulent flow also tends tokeep the suspension uniform.
For a long time gas dust suspension loops have been in operation for pneumatictransmission; most of these systems are characterized by larger particle size(1.0 l), high k, and low flow velocities. The experimental work on dust suspensionreactor (Schluderberg et al. [9]) and dust fuel reactor (Krucoff [6]) leads to theconclusion that closed cycle reactor systems, using dust suspension, are feasible.
Thus the use of dust in the MHD power generation system does not aprioripresent a road block; however, a lot of work is needed to get a feasible systemrunning.
References
1. W.B. Coe, C.L. Eisen, Elec. Eng. 79, 997 (1960)2. T. Honma, K. Fushimi, Jap. J. Appl. Phys. 5, 238 (1966)3. T. Honma, O. Nomura, A. Kanai, Bull-Electrotech. Lab. (Japan) 32, 83 (1968)4. A.T. Hooper, D. Newby, A.H. Russell, Electricity from MHD, vol. 1, (IAEA, Vienna, 1966),
p. 6315. J.H. Huth, in Energy Conversion for Space Power, ed. by N.W. Snyder. (Academic Press,
New York, 1961)
Fig. 12.4 Variation of ductlength x2 with k and M (afterSodha and Bendor [11],curtsey authors andpublishers IOP)
12.4 Complex Plasmas as Working Fluid 253

6. D. Krucoff, Nucleonics, 17, 100 (1951)7. F. Mori, K. Fushimi, T. Honma, Electricity from MHD, vol. 1 (IAEA, Vienna, 1966), p. 6438. J. Neuringer, J. Fluid Mech. 7, 28 (1960)9. D.C. Schluderberg, R.L. Whitelaw, R.W. Carlson, Nucleonics, 19, 67 (1961)
10. M.S. Sodha, E. Bendor, Symposium on MHD Electrical Power Generation, vol. 2 (ENEA,Paris, 1964a), p. 289
11. M.S. Sodha, E. Bendor, Brit. J. Appl. Phys. 15, 1031 (1964b)12. G.W. Sutton, General Electric Report, R59SD, 432 (1959)13. D.T. Swifthook, J.K. Wright, J. Fluid Mech. 15, 97 (1963)14. B. Waldie, I. Fells, Phil. Trans. Soc. London, A261, 490 (1967)15. B. Waldie, I. Fells, International Symposium on MHD Electrical Power Generation, Warsaw,
IAEA Vienna, Paper SM 107/127 (1968)16. S. Way, Westinghouse Science Paper, 6-40509-2P1 (1960)17. E.P. Zimin, Z.G. Mikhnevich, V.A. Popov, Electricity from MHD, vol. 3 (IAEA Vienna,
1966), p. 97
254 12 Complex Plasma as Working Fluid in MHD Power Generators

Chapter 13Rocket Exhaust Complex Plasma
13.1 Introduction
Baghdady and Ely [1] have pointed out that observations on signal strength,received from a rocket highlight the fact that during certain phases of the flightsevere attenuation of the order of tens of db occurs. For example, the early Polarisfirings were characterized by signal blackouts over a period of tens of seconds,resulting in loss of link to the missile; even the range safety command ‘‘destruct’’and control command for telemetry could not be implemented during this period.These severe electromagnetic propagation effects were attributed to the rocketexhaust tail, comprising of dense plasma (e.g., Brake and Howell [4]).
Various mechanisms to explain the electron density in a rocket exhaust, beingfar in excess of that predicted by the application of Saha’s equation to the gaseousphase were proposed but not analyzed in sufficient detail. Einbinder [6] and Smith[15] have explained the electron density in hydrocarbon flames, which is far inexcess of that predicted by Saha’s equation, on the basis of thermionic emissionfrom the surface of carbon particles, present in the flame; the kinetics of a dust-electron cloud was worked out taking into account the charge distribution on theparticles. Sodha et al. [16] noted the work of Sehgal [13] on the nature of solidparticles in the exhaust of solid propellant rockets; Sehgal [13] concluded that.
(i) all particles are nearly spherical.(ii) the particle surfaces are smooth and continuous without pores or pokes.
(iii) the average diameter D0 of the particles is related to the rocket chamberpressure by the relation.
ln P0 ¼ aþ bD0:
Bernhardt et al. [2] have considered the role of ice particles, (formed by con-densation of water vapor in the space shuttle exhaust) in the back scatter from theexhaust. For the parameters of the plasma, the approximately 5.6 nm ice particleshad little charge and there were few of them; hence no significant effects of the icedusty plasma were observed.
M. S. Sodha, Kinetics of Complex Plasmas, Springer Series on Atomic,Optical, and Plasma Physics 81, DOI: 10.1007/978-81-322-1820-3_13,� Springer India 2014
255
Platov and Kosch [11] have considered the effect of sublimation of ice particles inthe dynamics of gas cloud formations. The dynamics depends on the size distributionof the particles, their lifetime and initial velocities. The size of the particles isdetermined by the associated heat and mass transfer. The role of dust in the asso-ciated optical phenomena has been discussed. Platov et al. [12] have classified thegas dust formations formed by rocket exhausts in the upper atmosphere/ionosphere.
Large rocket exhausts cause large ionosphere holes, usually attributed to thechemical reaction between the ionosphere gases and the rocket exhaust. Littleeffort has been made to examine the role of the dust particles in the formation ofthe holes.
Shukla and Mamun [14] have given typical parameters of complex rocketexhaust and flame plasmas. The electron density (ne) and temperature (Te), thenumber density (nd) and radius (a) of the dust particles are 1013 cm-3, 3000 K, 108
cm-3, and 0.1 lm for rocket exhausts and 1012 cm-3, 2000 K, 108 cm-3 and0.01 lm for the flames, respectively; the neutral gas molecular density is 1018
cm-3 and 1019 cm-3 respectively for the two cases. Shukla and Mamun [14] havealso given the composition, radius, and density of the dust particles in earth’ssurroundings; it is seen that the dust from rocket exhausts is many orders ofmagnitude more abundant than other types of dust. The rocket exhaust dust typ-ically consists of dirty ice particles with radius 5 9 10-3 lm and number density3 9 104 cm-3.
13.2 Composition of Rocket Exhausts
Sodha et al. [16] have investigated the composition of a system of atoms/mole-cules, ions, dust particles, and electrons in thermal equilibrium; such an analysis isuseful in appreciating the role of low work function dust in the enhancement of theelectron density and the reduction of electron density by addition of dust ofmaterial with high work function.
Denoting a particle (ion or dust) with charge Ze of the sth species (atom/molecule, ion, or dust) by AZ
s one has
XZ¼ls
Z¼�/As
Z
� �¼ As½ �; ð13:1Þ
Xs¼m
s¼1
XZ¼ls
Z¼�/Z As
Z
� �¼ ne ð13:2Þ
and
ne AsZ
� �
AsZ�1
� � ¼ KsZ ; ð13:3Þ
256 13 Rocket Exhaust Complex Plasma

where[AZ
s ] is the concentration of AZs
As can be gaseous or dust particlene is the electron densityKZ
s is the equilibrium constant, given by Saha’s equation as
KsZ ¼ xs
Z
�xs
Z�1
ffi �2: 2pmekBT=h2ffi �3=2
exp �eZs =kBT
� �; ð13:4Þ
xZs is the statistical weight of the ground state of AZ
s
me is the electronic masskB is Boltzmann’s constanth is Planck’s constantes
Z is the energy needed for change from AsZ�1 to As
Z and ls is the number ofelectrons in As.
For a numerical appreciation of the role of dust particles in a rocket exhaustplasma, Sodha et al. [17] analyzed a simple model of rocket exhaust plasmascharacterized by the three following assumptions:
(i) The gaseous medium comprises of a single species of atoms and singlycharged ions and electrons.
(ii) There are two species of dust—one having low work function and the otherhigh work function and all dust particles of the same species have uniformradius and charge.
(iii) The plasma is in thermal equilibrium.
Thus the general (13.1) to (13.4) can be simplified to
n0 þ ni ¼ n;
ne ¼ ni þ Z1n1 þ Z2n2
ðneni=n0Þ ¼ K0 ¼ 2 2pmekBT=h2ffi �3=2
x1=x0ð Þ exp �eV=kBTð Þ;ne ¼ K1 exp �Z1a1ð Þne ¼ K2 exp �Z2a2ð Þ
K1;2 ¼ 2 2pmekBT=h2ffi �3=2
exp �e/1;2=kBTffi �
and
K0 ¼ 2 2pmekBT=h2ffi �3=2
exp �eV=kBTð Þ:
13.2 Composition of Rocket Exhausts 257

The above equations lead to the following equation, whose solutions give ne
and hence other parameters.
ne ¼ neK0=K0ne½ � þ n1=a1ð Þ ln K1=neð Þ þ n2=a2ð Þ ln K2=neð Þ; ð13:5Þ
where a1,2 = e2/a1,2kBT.Table 13.1 presents the electron density, as a function of n1, the number density
of particles of dust with a low work function (for n2 = 0) and the values of n2 thenumber density of particles of high work function, which restores the electrondensity to the value in absence of dust. The relevant parameters are:
V ¼ 10 eV; T ¼ 2318 K; n ¼ 1019cm�3; radius a ¼ 480 Ao
;/1 ¼ 3 eV; /2
¼ 15 eV:
It can be concluded that the presence of dust can cause a large change inelectron density in an exhaust plasma. The simple theory explains electron densityin far excess of that predicted by application of Saha’s equation to the gaseouscomponent. Further dust of high work function can drastically reduce the electrondensity. This theory is based on (13.3), which is not valid when ions are taken intoaccount. An improved theory is based on (5.1a, 5.1b, 5.1c and 5.1d), (5.3), (5.4). Asatisfactory theory, which also accounts for size distribution of dust has beendeveloped by Sodha et al. [17].
13.3 Impact of Rocket Exhausts on Ionosphere and UpperAtmosphere
13.3.1 Early Work
Booker [3] suggested that powered rocket flights through the F region of iono-sphere caused an extensive and drastic reduction of electron density (commonlyknown as a hole), which may persist for a period of the order of 1 h. This fact wasconfirmed subsequently in a number of rocket flights; the hole persisted after theflight for long times of the order of 1 h.
One of the most spectacular demonstration of the effect was the launch ofSkylab by Saturn V carrier rocket in 1973 (Mendilo et al. [8, 9], which caused
Table 13.1 Effect of dustparticles on electron densityin a typical rocket exhaust(after Sodha et al. [16],curtsey authors andpublishers IOP)
S. No N1 (cm-3) ne (cm-3) N2 (cm-3)
1 0 109 –2 1.53 9 108 1010 4.30 9 106
3 2.03 9 109 1011 5.70 9 107
4 2.94 9 1010 1012 8.26 9 108
5 5.35 9 1011 1013 1.51 9 1011
258 13 Rocket Exhaust Complex Plasma

large-scale depletion of the ionosphere. Simulations Mendilo and Forbes [10]based on the reactions of H2 and H2O gases from the exhaust with the ionosphericconstituents explained that the disturbances in the ionosphere could cover an areaof the order of one million square kilometer and occur at distances of the order of athousand kilometer from the flight path. All these observations were made by theradio methods.
Launch of powerful rockets and operation of space craft are characterized byexhaust of complex plasma, consisting of gases (neutral, electron, ions) and dustwith a size distribution. This complex plasma causes the formation of cloud-likestructures, which have been extensively studied (e.g., Platov et al. [12]).
13.3.2 Optical Observations
The large-scale optical phenomena, associated with the flight of powerful rocketsin the upper atmosphere may be classified [5, 12] as follows:
13.3.2.1 Stratospheric Phenomena (Height 40–50 km)
These phenomena occur on account of the discharge of excess fuel componentsafter the separation of the first stage of the rocket and the exhaust of the brakeengines of the separated stages. The main features of the exhaust formation are:
(i) Small expansion and hence growth, limited by diffusion. (The total mass ofexhausted material in the stratosphere was estimated to be of the order of500 kg by Chernouss [5]. This amount is indicative of the pollution at theseheights.)
(ii) long lifetime and(iii) high brightness.
13.3.2.2 Turbo Pause Phenomena (Height 100–120 km)
These phenomena, observable in twilight occur on account of the scattering oflight by an extended cloud of the exhaust material. The scattered light is verybright and can be observed visually at a distance of 1,000 km. These clouds withcross-sectional size of 100–200 km expand with a velocity of 2 km/s. The locationof the phenomenon is determined by the path length of the solid particles in theexhaust.
At altitudes below 100 km, the exhaust trail retains a small cross-sectional sizeand is hence optically bright. For heights above 120 km. the solid particles expandfreely and the trail is less bright.
13.3 Impact of Rocket Exhausts on Ionosphere and Upper Atmosphere 259

13.3.2.3 Large-Scale Dynamic Phenomena (Height 150 km or more)
These classes of phenomena are caused by certain modes of operation of the rocketengine. For example, during the shutoff of solid fuel rocket motors, there is asudden drop of pressure in the combustion chamber, resulting in practically instantejection of large quantities (hundreds of kilogram) of fuel components andincomplete combustion products in the atmosphere. The clouds thus created can inexceptional cases rise to a height of 700 km and get a cross-sectional size of about1,500 km and an expansion velocity of 2–3 km/s.
13.3.2.4 Weak Optical Phenomena
Another class of gas dust structures is the conical formation behind working rocketengines at large heights (200–400 km), under dark night conditions. The charac-teristic size is 200–400 km. The optical effect is due to the scattering of sunlight bythe ice particles, formed by the condensation of water vapor in the exhaust. Thesize of the formation depends on the life time of ice particles, determined by therate of sublimation for typical conditions the life time is 100–200 s with anexpansion velocity of 3 km/s, the characteristic size is 300–600 km.
13.3.3 Nature of Dust
As mentioned before, ice particles are formed in the rocket exhausts on account ofcondensation of water vapor, which is a product of combustion. Due to sublima-tion, the ice particles have a limited life. Platov and Kosch [11] have presented atheory of sublimation of such particles.
The combustion in solid propellant rocket motors provides an exhaust, whichcontains dust of Al or Al2O3, having a long life. All longtime optical phenomenaare thus associated with the use of solid fuel rockets.
The observed luminosity can be explained by assuming a 5–10 % condensationof water vapor into ice dust with a particle size of 100 Å (Kung et al. [7]).
13.3.4 Chemical Kinetics of Electron/Ion Depletionby Rocket Exhausts
The rocket exhaust molecules, H2O and H2, undergo charge–exchange reactionswith the O+ ions of the ionosphere, and the resulting molecular ions react withelectrons with O+ ions; the sequence is (Zinn et al. [18])
260 13 Rocket Exhaust Complex Plasma

Oþ þ H2O! H2Oþ þ O; ð13:6Þ
followed by
H2Oþ þ e� ! Hþ OH: ð13:7Þ
Reaction (13.7) is about 105 times faster than the direct recombination ofelectrons with O+ ions, i.e.,
Oþ þ e� ! Oþ hv: ð13:8Þ
Reaction (13.6) is much faster than either of the normally occurring F-layercharge-transfer reactions
Oþ þ O2 ! Oþ2 þ O ð13:9Þ
or
Oþ þ N2 ! NOþ þ N:
The OH radical formed in reaction (13.7) can react further with O+. Thereaction is
Oþ þ OH! Oþ2 þ H;
which is followed by rapid neutralization of the O2+ viz
Oþ2 þ e� ! Oð1DÞ þ O:
In most cases, however, the OH radical is destroyed by reaction with atomicoxygen, i.e.,
OHþ O! Hþ O2 ð13:10Þ
before reactions (13.6) and (13.7) proceed to a significant extent.The result of the two cycles viz (i) Reactions (13.6) and (13.7) and (ii) Reac-
tions (13.8), (13.10), and (13.7) in sequence, is the destruction of between one andtwo electron–ion pairs by each H2O molecule.
Similar processes occur with other common rocket-exhaust products, such asH2 or CO2; with H2, the sequence is
Oþ þ H2 ! OHþ þ H
followed by
OHþ þ e� ! Oþ HOð1DÞ þ H
� �:
The state O(1D) is metastable; electronically excited oxygen atom decays pri-marily by emission of 630.0 nm radiation.
13.3 Impact of Rocket Exhausts on Ionosphere and Upper Atmosphere 261

13.3.5 Role of Dust
The role of dust in optical phenomena has been extensively investigated; however,the role of dust in the evaluation of electron density in the ionosphere-rocketexhaust interaction has not been investigated to a significant extent. It may beappreciated that the dust will in general reduce the electron density on account ofhigh rate of electron accretion on the dust particles and hence it may play asignificant role in the formation of ionospheric holes by rocket exhausts. However,during day time the photo electric emission from dust (particularly dirty ice par-ticles, with low work function) tends to enhance the electron density.
Hence, a careful investigation of the kinetics of upper atmosphere-rocketexhaust system taking into account significant electron production/annihilation andassociated processes is called for; dust must be taken as an important constituent inthese studies.
References
1. E.J. Baghdady, O.P. Ely, Proc. IEEE 54, 1134 (1966)2. P.A. Bernhardt, G. Ganguli, M.C. Kelley, W.E Swartz, J. Geophys. Res. 100, 23811 (1995)3. H.G. Booker, J. Geophys. Res. 66, 1073 (1961)4. W.H. Brake, E.F.S. Howell, Radio frequency propagation to and from ICBMS and IRBMS.
In: Proceedings of IRE National Symposium on Space Electronics and Telemetry (1959)5. S.A. Chernauss, A.S. Kirrilov, Yu. V. Platov, Optical Features of Rocket-Exhaust Products
Interaction with the Upper Atmosphere, 17th European Space Agency Symposium onEuropean Rocket and Balloon Programs and Related Research, Sandefford, Norway (May 10to June 2, 2005), ESA-SP-590
6. H. Einbinder, J. Chem. Phys. 26, 948 (1957)7. R.T.V. Kung et al., AIAA J. 13, 432 (1975)8. M. Mendilo, G.S. Hawkins, JA Klobuchar, J. Geophys. Res. 80, 2217 (1975a)9. M. Mendilo, G.S. Hawkins, J.A. Klobuchar, Science 187, 343 (1975)
10. M. Mendilo, J.A. Forbes, J. Geophys. Res. 83, 151 (1978)11. YuV Platov, M.J. Kosch, J. Geophys. Res. 108, 1434 (2003)12. YuV Platov, S.A. Chernouss, M.J. Kosch, J. Spacecr. Rocket. 41, 667 (2004)13. R. Sehgal, 9th Symposium (international) on Combustion: Abstracts (The Combustion
Institute, Pittsburgh, 1962)14. P.K. Shukla, A.A. Mamun, Introduction to Dusty Plasma Physics (Institute of Physics
Publishing, Bristol, 2001). p. 1715. F.T. Smith, J. Chem. Phys. 28, 746 (1958)16. M.S. Sodha, C.J. Palumbo, JT Daley, Brit. J Appl. Phys. 14, 916 (1963)17. M.S. Sodha, S.K. Mishra, S. Misra, IEEE Trans. Plasma Sci. 39, 1141 (2011)18. J. Zinn, C. Dexter Sutherland, S.N. Stone, L.M. Duncan, R. Behnke, Ionospheric effects of
rocket exhausts, Report DOE/ER- 0082, Dist Category UC-34b (Los Alamos ScientificLaboratory, Los Alamos, 1980)
262 13 Rocket Exhaust Complex Plasma

Chapter 14Kinetics of Complex Plasmas with LiquidDroplets
14.1 Introduction
The kinetics of complex plasmas with liquid droplets has been discussed in thecontext of two applications. First, [14] the alkali metal vapor, used as the workinggas in a nuclear reactor-based MHD power generation cycle, can partially con-dense into droplets under certain operating conditions. The wet vapor, so formedcan be considered to be a complex plasma with neutral atoms, ions electrons, andcharged sodium liquid droplets. The role of droplets is to enhance the electrondensity by thermionic electron emission from the surface and reduction of electrondensity due to electron accretion on the surface. A satisfactory analysis of thekinetics of such a process is not available.
The other application [15] is the use of water spray for reduction of electrondensity in the plasma sheath in front of a hypersonic vehicle in the upper atmo-sphere. The twin application to rocket exhausts has not been considered.
In this chapter, we briefly consider both the applications.
14.2 Wet Alkali Metal Vapor (After Smith [14])
Smith [14] has analyzed electron conduction in a wet alkali metal vapor in anelectric field (t x B in an MHD generator): Smith [14] considered the complexplasma to comprise of neutral gas at temperature Tg, electrons at temperature Te,and ions and droplets at the temperature Td. The simplified basic equations are
neni=n0 ¼ 2 2pmekBTe=h2� �3=2
exp �eVi=kBTeð Þ; ð14:1aÞ
where ne, ni, no are the electron, ion, and neutral atom densities, and Vi is theionization potential of the alkali metal. Equation (14.1a) implies that even in non-equilibrium conditions Saha’s equation is valid when the temperature occurring inthe equation refers to the electron temperature [7]; this assumption does not have atheoretical basis but is based on empirical observations [5] in a small range of
M. S. Sodha, Kinetics of Complex Plasmas, Springer Series on Atomic,Optical, and Plasma Physics 81, DOI: 10.1007/978-81-322-1820-3_14,� Springer India 2014
263

parameters. The charge balance on the droplets, for negative charge, on dropletswas given by
nec ¼ 4pa2nth: ð14:2aÞ
Equation (14.2a) omits an important term nic, corresponding to the rate of ionaccretion on the droplets.
The temperature of the droplets is given by
neckB Te � Tdð Þ ¼ nopa2 8pkTg=mo
� �1=2Td � Tg
� �� ð14:3aÞ
The left-hand side represents heat transfer from the electrons to a droplet whilethe right-hand side represents the heat lost by the droplet to the gas. As explainedin Part I of this book, there should be factors of 2 and 3/2 on the left- and right-hand side. This equation does not take into account the exchange of energy incondensation and evaporation from the droplets and collision of neutral atoms andions with the droplets.
The energy equation, corresponding to segmented electrode geometry forelectrons is
Kð1� KÞ e
mmet2B2 ¼ 2mod
32
kBTe � kBTg
� �þ nec2kB Te � Tdð Þ: ð14:4Þ
where K = E/vBThe charge neutrality may be expressed by
ne ¼ ni þ Zn1: ð14:5aÞ
The number of Potassium atoms in the gas per unit volume is NNa = p/kBT wherep the pressure. If the number of atoms in the liquid state is a fraction f of NNa, thenumber of droplets having n1 atoms is nd = fNna/n1. The above set of equationsenables one to evaluate ne and hence evaluate the transport parameters as indicatedin Chap. 8.
Figure 14.1 shows the dependence of ne/neo with the electron temperaturewhere ne0 is the electron density in absence of droplets. The ionization potentialand work function of the alkali metal (potassium) are 4.34 and 2.15 eV, respec-tively. The vapor corresponds to K vapor at 800 K and 0.1 atmospheres with 75 %moisture.
The inadequacies in [14] theory have been pointed out before in this section.Kovacs [8] has considered situations, where the electron density gets enhanced
by droplets on account of the rate of thermionic emission, exceeding the rate ofelectron accretion.
Based on the previous chapters in the book, one can formulate a theory ofelectrical conductivity of Potassium vapor at a temperature T, less than T0 thetemperature at which the vapor is saturated.
264 14 Kinetics of Complex Plasmas with Liquid Droplets

The density q(T) of the saturated vapor at temperature T is given by
qðTÞ ¼ psðTÞ � ðM=RTÞ; ð14:6aÞ
where ps(T) is the saturation vapor pressure at temperature T (see Lide [10]), M isthe molecular weight, and R is gas constant.
Since the vapor is saturated at the temperature T, the mass of the condensate perunit volume is
q T0ð Þ � q Tð Þ ð14:6bÞ
Hence, the number nd of solid Potassium particles of radius a, per unit volumeis given by
nd ¼ q T0ð Þ � q Tð Þ½ �= 4pa3qs=3� �
; ð14:6cÞ
where qs is the density of solid Potassium.The number of Potassium atoms/ions in the vapor per unit volume is
N Tð Þ ¼ ps Tð Þ=kBT : ð14:6dÞ
The kinetics of the complex Potassium plasma is given by
N ¼ n0 þ ni ð14:7Þ
n0ni=ne ¼ 2 2pmekBT=h2� �3=2
exp �eVi=kBTð Þ ð14:1bÞ
ndZ þ ni ¼ ne ð14:5bÞ
and
nic Zð Þ þ nee Zð Þ � nec Zð Þ ¼ 0 ð14:2bÞ
where the symbols have used meanings.The simultaneous solution of these four equations can yield, ne, ni, no and Z.The rationale behind the four equations is explained in detail in Part I of the
book.
0
e
e
nn
eT
4 3
6
7.5 10
10
dn cm
a cm
−
−
= ×
=
Fig. 14.1 Dependence ofelectron density on electrontemperature in wet Potassiumvapor
14.2 Wet Alkali Metal Vapor 265

14.3 Reduction of Electron Density in a Plasmaby Injection of Water Droplets
14.3.1 Early Work
Evans [4, 13] has analyzed a successful hypersonic flight experiment for relief ofradio black out by the injection of a water spray in the ionized sheath in front of are-entering (hypersonic) vehide in the atmosphere [3]. It is well known that theelectron density in the plasma sheath is very much larger than that predicted byequilibrium considerations or application of Sahas’ equation to the gaseouscomponent. The electrons are removed from the plasma by accretion on the waterdroplets.
The kinetics of complex plasmas, with dust of solid particles has been discussedin sufficient detail in this book; the analysis is mainly in the context of metallic ormetal-like dust. There are two essential differences between the behavior of solidparticles and liquid droplets, which are dielectric in nature. Since the nature of theimage force on an electron is different for metallic and dielectric spheres, theelectron potential energy function V(r) is different in the two cases, which mani-fests in different expressions (values) for the reduction in the work function due toa negative charge on the droplet/particle. This reduction (due to Schottky effect) isreflected in different expressions for the emission from and accretion of electronson the surface.
Aisenberg et al. [1] have proposed that the thermal evaporation of ions from thesurface of a droplet may be an important mechanism for the loss of charge by anegatively charged liquid droplet. Considering the liquid surface to be a plane one,in an electric field, these researchers evaluated the reduction of latent heat, cor-responding to negative ions, taking the image force on an ion (outside the liquid)into account. Further, the ratio of the rate of evaporation of ions to that of mol-ecules was assumed to be exp jDLj=kBTdð Þ where DL is the reduction in latent heatdue to charge on the droplets. The effect of the large abundance of neutral mol-ecules on the surface as compared to ions was not considered.
Sodha and Evans [15] evaluated the reduction in work function by a negativecharge on the droplets and also the electric field emission of electrons; it was seenthat the role of electric field emission is negligible under typical working condi-tions. Further, the role of evaporation of ions from the surface of a charged waterdroplet was also revaluated, taking into account the relative abundance of ions andmolecules on the surface of the droplet; These results may be used to investigatethe kinetics of complex plasma, with a suspension of water droplets.
266 14 Kinetics of Complex Plasmas with Liquid Droplets

14.3.2 Reduction of Potential Energy Barrier
As may be seen from Chap. 3, plasma electrons need an energy larger than -Ze2/a tobe able to accrete on the surface of a spherical particle of radius a with a charge-Ze(Z [ 0). The potential energy of an electron outside a dielectric sphere of radiusa with charge -Ze is given by (Menzel [16])
V rð Þ ¼ Ze2
r� e2
a� K � 1K þ 1
X/
1
1þ 1=n 1þ Kð Þ½ ��1 a=rð Þ2nþ2; ð14:8aÞ
where K is the dielectric constant of the material of the particle viz water.For water K is large and hence1 ? 1/n(1 ? K) & 1; thus the above equation simplifies to
V nð Þ ¼ e2=a� �
K � 1ð Þ= K þ 1ð Þ½ �U nð Þ ð14:8bÞ
where
U nð Þ ¼ �Z 0n�1 � n�4= 1� n�2� �;
Z 0 ¼ Z K þ 1ð Þ= K � 1ð Þ
and
n ¼ r=að Þ:
The maximum value Um of U(n) is given by
dU=dnjn¼nm¼ 0
and
Um ¼ U n ¼ nmð Þ:
The reduction in the barrier height is
DV ¼ e2=a� �
�Z 0 � Umð Þ K � 1ð Þ= K þ 1ð Þ: ð14:8cÞ
The dependence of -Z0 -Um on -Z0 is tabulated in Table 14.1.
14.3.3 Rate of Accretion of Electrons on Droplets
The rate of accretion of electrons on a negatively charged particle is given by(Chap. 3)
nec ¼ pa2 8kTe=mepð Þ1=2exp Ze2=akBTe
� �when Z\0: ð14:9aÞ
14.3 Reduction of Electron Density in a Plasma 267

As seen in the previous section, an electron needs a minimum energyVm not� Ze2=að Þ to accrete on the surface. Hence, the above equation gets mod-ified to
nee ¼ pa2 8kTe=mepð Þ1=2exp �Vm=kBTeð Þ; ð14:3bÞ
where Vm = (e2/a)[(K - 1)/(K ? 1)]Um and Um has been tabulated in Table 14.1.
14.3.4 Emission of Negative Ions from a Charged DropletDue to Evaporations
14.3.4.1 Saturation Vapor Pressure Over Droplet Surface
Saturation vapor pressure ps is an important parameter in the evaluation of the rateof evaporation. The saturation vapor pressure over a drop of radius a carrying acharge Ze is given by (Glosios [6]; Scharrer 17)
ln ps=psoð Þ ¼ M=qRTdð Þ 2r=að Þ þ Ze2=84� �� ffi
;
wherepso is the saturation vapor pressure over uncharged plane water surface, (Lide
[10])M is the molecular weight of water,q is the density of water, andr is the surface tension of water.
For parameters of interest, the right-hand side of the above equation is verysmall and hence
ps � pso:
14.3.4.2 Evaporation of Neutral Molecules from the Droplet
Using the kinetic theory of evaporation [12], the number of neutral moleculesevaporating per unit time from the surface of a droplet of radius a is
Table 14.1 Dependence of �Z=�Um on� Z= (After Sodha and Evans [15], curtsey authors andpublishers Springer)
-Z/ 4498 2220 1248 553.5 198.0 100.0 48.06 20.37 10.75 6.357-Z/-Um 98.3 64.9 48.3 31.6 18.3 12.5 8.26 4.94 3.20 2.31
268 14 Kinetics of Complex Plasmas with Liquid Droplets

nn ¼ 4pa2aac ns=4ð Þ 8kBTd=m0pð Þ1=2;
where ns = ps/kBTd is the number of water molecules per unit volume in saturatedwater vapor at temperature Td, mo is the mass of a water molecule and aac is theaccommodation factor.
Hence, putting ps = nskBTd in the above equation.
nn ¼ pa2psaac 8=mopkBTdð Þ1=2; ð14:9bÞ
For water at about 100 �C, aac = 0.08 [2]. However, for water droplets in hightemperature gases aac = 0.8 [9]. The parameter ps is just the atmospheric pressureand the liquid is boiling.
14.3.4.3 Number of Neutral Molecules on the Surface of the Droplet
Assuming that the molecules have a typical dimension d, the number of moleculeson the surface is
n=n � 4paz=d2:
where d is a typical dimension of the molecule such that
Kd3 � M=q;
where K is Avagadro’s number and q is the density of water.Hence
n=n � 4pa2 M=qKð Þ�2=3: ð14:10Þ
For other shapes of molecules the RHS of (14.10) gets multiplied by a factor ofthe order of unity.
14.3.4.4 Lowering of Surface Barrier
The molecules in the droplet have to overcome a potential energy barrier to getevaporated. Following the logic in Sect. 14.3.2, for negative ions, evaporatingfrom the charged drop, the barrier gets lowered by
v ¼ Ze2=a� Vm ¼ kBTda=d �Z= � Um
� �;
where
a=d ¼ K � 1ð Þ e2=akBTd
� �= K þ 1ð Þ:
14.3 Reduction of Electron Density in a Plasma 269
14.3.4.5 Ion Evaporation Rate
The rate of ion evaporation from the surface nie- is given by
n�ie = nn ¼ Zj j=nn
� �exp v=kBTdð Þ;
since the ions reside on the surface.Substituting for nn from (14.4), for nn
/ from (14.5a), and for v from (14.6a),(14.6b), (14.6c), (14.6d) in the above equation one obtains
n�ie ¼ aac Zj jps M=Kqð Þ2=3 2pmokBTdð Þ�1=2exp a=d �Z= � Um
� �h i: ð14:11Þ
14.3.5 Kinetics of Complex Plasma with Water Droplets
Sodha and Evans [15] have made a preliminary analysis of the kinetics of a plasmasheath with water droplets. Misra et al [11] have recently developed an updatedversion of the kinetics of a plasma with an easily ionizable CO2 like gas, watervapor, and suspended water droplets. The fundamentals of the kinetics viz thecharge balance on the droplets and number as well as energy balance of theconstituents (neutral atoms, positive and negative ions, and the droplets) have beenincorporated in the formulation along with the maintenance of the plasma by theionization of molecules of the easily ionizable gas and recombination of corre-sponding ions and electrons. The charge neutrality is a consequence of the numberbalance of electrons/ions and the charge balance on the droplets and hence has notbeen considered separately. The expression (14.11) for nie
-, the rate of evaporationof negative ions from the surface of the droplets as derived by Sodha and Evans[15] is an important input in the problem.
In the present analysis [11]; which ignores second-order effects one considers asuspension of water droplets in a CO2 like plasma, which in the absence of thedroplets has an electron density neo and temperature Teo, singly charged positiveions with a density nio = neo and temperature T0. The ions and neutral atoms areassumed to be at the same temperature T0 which is a reasonable assumption onaccount of efficient energy exchange between the ions and the neutral atoms. In thepresence of water droplets (which get negatively charged on account of theaccretion of electrons/ions) one also has molecules and negatively charged ions ofwater in the complex plasma.
If one considers this complex plasma to be moving in the x direction with avelocity it one can write a system of equations to characterize the kinetics of thesystem as follows.
270 14 Kinetics of Complex Plasmas with Liquid Droplets
Charging of droplets
dZ
dt¼ n�ie þ nþic � n�ic � nec;
where
d
dt¼ o
otþ t
o
ox;
nic-, nic
+ , and nec are respectively the accretion rates of negative ions, positiveions, and electrons on a droplet, and nie
- is the rate of negative ion evaporation fromthe droplet. For steady state and stationary plasma
d=dt ¼ d=ds
when s = x/tx for the steady state moving plasma and s = t for a stationaryplasma.
Hence, one may write (14.9a) and subsequent equations in terms of dds ; thus
ðdZ=dsÞ ¼ n�ie þ nþic � n�ic � nec ð14:12Þ
Number balance of electrons
dne=dsð Þ ¼ bno � anenþi� �
þ adn�i � aaNone
� �� ndnec : ð14:13Þ
wherebn0 is the rate of production of electron-positive ion pairs per unit volume,aeineni
+ is the rate of recombination of positive ions with electrons per unitvolume,
adni- is the rate of electron detachment from negative water ions per unit
volume,aaN0ne is the rate of electron attachment to water molecules per unit volume,N0 is the number density of water molecules,nec is the rate of electron accretion on a droplet, andnd is the number of droplets per unit volume.
Number balance of positive ions (of ionizing gas)
ðdnþi =dsÞ ¼ ðbno � aeinenþi Þ � ndnþic ð14:14Þ
Number balance of negative ions of water
ðdn�i =dsÞ ¼ ndn�ie þ ðaaNone � adn�i Þ � ndn�ic ð14:15Þ
Conservation of sum of positive ion density and neutral molecular density (ofionizing gas)
n ¼ n0 þ nþi ð14:16Þ
14.3 Reduction of Electron Density in a Plasma 271

Number balance of neutral water molecules
dNo
ds¼ adn�i � aaNone � ndNoc þ ndnn: ð14:17Þ
Energy balance of electrons
d
ds32
kBneTe
� ¼ bnoee � anenþi ð3kBTe=2Þ� ffi
þ adn�i edi � aaNoneð3kBTe=2Þ� ffi
� ndneceec
ð14:18Þ
where ee = (3/2)kBTeo is the energy a the electrons ion produced by ionization, inrecombination and attachment of on electron an energy (3/2)kBTe is lost, edi is theenergy of the electron produced by detachment from negative water ions and eec isthe mean energy (at large distance from the drop) of accreting electrons on thedroplet.Energy balance of neutral molecule and ions
We have so far considered monoatomic gases and their ions and hence the meanenergy (3/2)kBT was justified. However, water vapor corresponds to a mean energyof (7/2)kBT per molecule as per data [10] on specific heat at constant pressure.Similarly, for the other CO2 like gas, corresponding to combustion products weuse a value 6kBT, corresponding to CO2. Keeping this in mind the energy balanceof neutral molecules and ions may be expressed as
d
ds7kBTo=2ð Þ No þ n�i
� �þ 6kBTo no þ nþi
� �� ffi¼ bno eþi � 6kBToð Þ
� ffi
þ anenþi 3kB=2ð ÞTe þ Ip
� ffi� ndnþic eþic � 6kBTd=2ð Þ
� ffi
þ ndn�ie 7kBTd=2ð Þ � Ze2=a� ffi �
� ndn�ice�ic � adn�i edi
� Noc 7kB=2ð ÞT0 � nnnd � 7kB T0 � Tdð Þ=2
ð14:19Þ
where (i) ei+ = 6kBTio is the energy of ions produced by ionization of neutral
molecules with mean energy 6kBTo (ii) an electron of energy 3/2kBTe and an ion ofenergy 6kBTo produce a neutral molecule of energy [3/2kBTe ? 6kBTo ? Ip], andhence the net gain in energy of ions plus neutral molecules is [3/2kBTe ? 6kB-
To ? Ip] - 6kBTo = (3/2)kBTo ? Ip (Ip is the ionization potential), (iii) in accre-tion a positive ion with mean energy eic
+ is lost and a neutral molecule with energy6kBTo gets generated (iv) a negative water ion evaporates and acquires an energy(7kBTd/2) at the surface of the droplet, gets pushed by the negative charge on thedroplet and thus has an energy (7kBTd/2) - Ze2/a at large distance from thedroplet, (v) e�ic is the mean energy of accreting negative water ions, (vi) an electrongets detached from a negative ion with an energy edi, and (vii) Noc is the rate ofaccretion of water molecules on the surface of the droplets and (7kBTo/2) is thecorresponding energy per molecule, and (viii) nn water molecules get evaporatedat temperature Td per unit time per droplet.
272 14 Kinetics of Complex Plasmas with Liquid Droplets
In the evaluation of eic- and eic
+ we have to add (7kBT/2) - (3kBT/2) and(6kBT) - (3kBT/2) to the usual expressions (Chap. 3) for ions of water vapor andionizable gas respectively because the non-translational energy is not affected byaccretion. To obtain the energy of the ions on the surface Za has to be added to theexpressions for eic
+ and eic-.
Energy balance of droplets
�Lqd
ds43pa3
� ¼ nece
sec þ nþice
sþic þ n�ic es�
ic þ Lh
� �þ 6kBnoc To � Tdð Þ
� er T4d � T4
o
� �4pa2 þ Noc 7=2ð ÞkBT0 þML=K½ �
ð14:20Þ
whereM is molecular weight of water,K is Avagadro’s number,Lh = ML/K is the latent heat of vaporization/condensation per molecule/ion,
andL is the latent heat of vaporization per unit mass.
Simultaneous solution of (14.12)–(14.18) can be obtained, using the Mathem-atica software.
In steady state, the value of parameters Z, ne, ni+, nw
-, no, nw, Te, and T, it can bedetermined by simultaneous solution of (14.9a, 14.9b)–(14.18) as t ? ?; thesteady state values are, in general, independent of initial conditions. The initialconditions are at s ¼ 0 are Z = 0, ne = neo, ni
+ = nio+ , nw
- = 0, no = noo, nw = 0,Te = Teo, a = a0 and T = Too, while Td = 100 �C.
For ease of computation we have put v = 0For a numerical appreciation of the results, the following standard parameters
have been chosen.
ao ¼ 10�4 cm; neo ¼ 1014 cm�3; nþio ¼ 1014 cm�3; noo ¼ 103neo; Teo ¼ 5000 K;
Tio ¼ To ¼ 2000 K; Td ¼ 373 K; Tw ¼ 273 K;L ¼ 450 C=g; Ip ¼ 13:77 eV;
K ¼ 6:06� 1023;M ¼ 18; aac; qs ¼ 1 atmosphere; q ¼ 1 gm/cc
Figure 14.2 illustrates the transient evolution of the dimensionless radius of thewater droplet and its dependence on the number density of the water droplets.
Figure 14.3 represents the time dependence of the electron density on thenumber density of droplets. The electron density of the plasma decreases withincreasing density of the water droplets, due to larger number of water droplets,available for accretion of electrons. When the droplets get fully evaporated, theelectron density attains a steady value.
14.3 Reduction of Electron Density in a Plasma 273

References
1. S. Aisenberg, R.W. Chang, P.N. Hu, Modificetion of Plama by Rapidly Evaporating LiquidAdditives, Semiannual Report of Contract No. DAHCO4-68C-0031, (Space Sciences Inc.,Waltham, Mass., USA, 1969), p. 02154
2. T. Alty, Philos. Mag. 15, 82 (1933)3. W.F. Cuddihy, I.E. Beckwith, L.C. Schroeder, NASA TM X-1092 (1963) declassified (Dec.
30, 1970)4. J.S. Evans, NASA TM X 1186 (1965) declassified (Dec. 30, 1970.)5. J.S. Evans, Third Symposium on Plasma Sheath-Plasma Electromagnetics of Hypersonic
Light, vol III, (Air force Cambridge Research Lab., Bedford, Mass USA, 1967)6. T. Glosios, Ann. Phys. 34, 446 (1939)
τ
p
q
rst
Fig. 14.3 Dependence of electron density on s; p, q, r, s, t refer to nd = (5 9 104, 105, 59 105, 106, and 5 9 106) cm-3, respectively (after Misra et al. [11])
tsrqp
τ
Fig. 14.2 Dependence of radius of droplet on s; p, q, r, s, t refer to nd (5 9 104, 105, 59 105, 106, and 5 9 106) cm-3, respectively (after Misra et al. [11])
274 14 Kinetics of Complex Plasmas with Liquid Droplets

7. J. Kerrebrock, Second Symposium on Engineering Aspects of MHD (Columbia UniversityPress, New York, 1962), p. 327
8. C. Kovacs, P. Halasz, J.W. Hansen, Acta. Tech. Hungr. 56, 383 (1966)9. S.C. Kurzius, F.H. Raab, Vaporization and Decomposition of Condidate Reenty Blackout
Suppresants in Low pressure Plasmas, NASA CR-1330 (Aerochem Research Lab Inc,Princeton N.J., 1969)
10. D Lide (Editor), CRC Handbook of Physics and Chemistry, (CRC Press, Boca Raton, 2004)11. S. Misra, S.K. Mishara, M.S. Sodha, Phys. Plasmas, 20, 123701 (2013)12. J.R Partington, An Advanced Tractise on Physical Chemistry, vol. 2, (Wiley, New York,
1962), p. 29113. J.S. Evans in report AFCRL-67-0280 (Vol. III). Special Report No 64 (III), ed. by
W. Rotman, Moore, R. Papa, J. Lennon, pp. 343–36114. J.M. Smith, AIAA J. 3, 648 (1965)15. M.S. Sodha, J.S. Evans, Appl. Sci. Res. 29, 380 (1974)16. D.H. Monzel, Fundamental Formulas of Physics, Vol. 1, 214 (1960)17. L. Scharrer, Ann. Phys. 35, 619 (1935)
References 275

Chapter 15Growth of Particles in a Plasma
15.1 Introduction
The presence of particles in a plasma reactor is of serious concerns to micro-electronic industry, material science, and other areas. Dust in plasma reactorscauses irrecoverable defects and line shorts in large-scale integrated circuits.However, the emphasis has recently changed from considering dust as a processkiller to recognizing it as a desired feature with numerous applications like (i)plasma-assisted assembly of carbon-based nanostructures, (ii) plasma-enhancedCVD of nanostructure silicon-based films, (iii) high rate deposition of clusters andparticles on nanostructure films, etc. A discussion of the deleterious and beneficialaspects of complex plasma in micro electronic industry has been given in theclassic books by Vladimirov et al. [4] and Ostrikov [6]. For a rational design ofsuch applications, it is necessary to have an appreciation of the physics andchemistry of the formation and growth of the dust particles in a plasma.
Perrin and Hollenstein [2] have authored an excellent chapter on sources andgrowth of particles; these authors have covered the time sequence from (i) theformation of primary cluster of atoms up to a critical size, followed by nucleation,(ii) growth of small particles by condensation (a \ 5 nm), (iii) coagulation ofsmall particles into macroscopic particles by condensation (a \ 50 nm), and (iv)independent growth of the macroscopic particles (a [ 50 nm) by condensation ofneutral atoms and ions. With the background of Part I of this book, we will confineour attention to a simple model of the independent growth of the embryonicparticles (a [ 5 nm) by condensation of neutral atoms and ions.
Haaland et al. [1] analyzed a simple model of the complex plasma and growthof particles. These authors considered a plasma consisting of (i) neutral atoms/molecules of A and B, (ii) embryonic particles (A) with charge -e (to enableefficient accretion of positive ions), (iii) ions of A and B, and (iv) electrons. Theatoms and ions of A condense on the particles while atoms/ions of B can exchangecharge and energy in encounters with dust particles. The initial charge -e on theembryonic particles initiates the acquisition of ions of A.
M. S. Sodha, Kinetics of Complex Plasmas, Springer Series on Atomic,Optical, and Plasma Physics 81, DOI: 10.1007/978-81-322-1820-3_15,� Springer India 2014
277

However, Haland et al. [1] assumed that the plasma parameters are independentof time; this assumption violates the principles of number and energy balance. Inthis context, Sodha et al. [3] analyzed this model, on the basis of number andenergy balance of the constituents and the charge balance on the particles; thecharge neutrality follows from the number balance of the constituents and hastherefore been not separately considered.
15.2 Basic Equations
In the context of a complex plasma flowing along the x direction with a velocity tx,the operator
ddt¼ o
otþ tx �
o
ox: ð15:1aÞ
For the two specific cases considered herein viz. steady state oot! 0� �
andstationary (tx = 0) plasma (15.1a) reduces to
ddt¼ d
ds; ð15:1bÞ
where
s ¼ t for stationary plasma and s ¼ x=tx for the steady state: ð15:1cÞ
The initial (s = 0) radius of the dust particles a0 is the minimum radius to holda charge -e and may be obtained by equating the rates of accretion of electronsand ions on the particle.
nec ¼ nicA þ nicB:
Substituting for the accretion rates from Chap. 3 in the above equation oneobtains
cene0 Te0=með Þ1=2exp �e2�
a0kBTe0
ffi �¼ 1þ e2
�a0kBTi0
� �
niA0 Ti0=miAð Þ1=2þniB0 Ti0=miBð Þ1=2h i
;
ð15:2Þ
where
nec, nicA and nicB are the rates of accretion of electrons and ions A and B on theparticle, ce is the sticking coefficient of electrons to the surface of the particles,s = 0.Te0/Ti0 are the initial (s = 0) electron/ion temperature, me, miA and miB are themasses of an electron ion A and ion B.
278 15 Growth of Particles in a Plasma

ne0, niA0 and niB0 are the initial (s = 0) electron and ion densities.The initial radius a0 may be obtained from a numerical solution of (15.2).
15.2.1 Charging of Dust Grains
The charge on the particle is governed by the equation
ðdZ=dsÞ ¼ niAc þ niBc � cenec; ð15:3Þ
where the expressions for nec and nic (A, B) have been given in Chap. 3.
15.2.2 Number Balance of Electrons
ðdne=dsÞ ¼ ðbAnA þ bBnBÞ � ðaAneniA þ aBneniBÞ � cendnec; ð15:4Þ
where
bj is the coefficient of ionization of the constituent neutral atoms due to an externalagency (e.g. R.F. discharge) andaj(Te) = aj0(300/Te)
j cm3/s is the coefficient of recombination of electrons andions (Gurevich [5]).
15.2.3 Number Balance of Ions
ðdniA=dsÞ ¼ bAnA � aAneniA � ndniAc ð15:5aÞ
and
ðdniB=dsÞ ¼ bBnB � aBneniB � ndniBc: ð15:5bÞ
It may be remembered that all accreting ions either get deposited on the particleor get converted to neutral atoms by giving charge to the particle.
15.2.4 Number Balance of Neutral Atoms
dnA=dsð Þ ¼ aAneniA � bAnA þ nd 1� ciAð ÞniAc � ndcAnAc; ð15:6aÞ
and
dnB=dsð Þ ¼ aBneniB � bBnB þ ndniBc; ð15:6bÞ
15.2 Basic Equations 279

where
njc = pa2(8kBTn/mjp)1/2nj is the neutral collection current to a dust particle; andc
A
�c
iAare the sticking coefficient for ions and atoms of A.
Equations (15.6a) and (15.6b) refer to the growth of the number density ofneutral atoms (A and B). The first term of the right-hand side shows the gain inneutral particle density per unit time on account of electron–ion recombination inplasma while the next term corresponds to the decrease in the neutral density perunit time due to ionization. The third term corresponds to the gain in the neutraldensity per unit time on account of neutralization of the ions collected on thesurface of the dust grain. The last term in (15.6a) refers to the accretion of theneutral atoms of species A on the dust particles. It may be remembered that thethird term in (15.6a) corresponds to incident neutral atoms on the particle, notdepositing on the particles but just giving their charge to the particle and gettingconverted to neutral atoms.
15.2.5 Radius of the Particles
dds
43pa3q
� �¼ mAcAnAC þ miAciAniAcð Þ; ð15:7Þ
where
q is the density of the particle material; andnAC/niAC denote the rates of accretion of neutral atoms and positive ions of A.
15.2.6 Energy Balance of Electrons
dds
32
nekBTe
� �¼ bAnAeA þ bBnBeBð Þ � 3kB=2ð Þ aAnenAi þ aBnenBið ÞTe � nece
0
ecðZÞ
ð15:8Þ
where
Tn is the temperature of the neutral atomic species,Td is the temperature of the dust particles,ej is the mean energy of electrons produced by ionization of neutral atoms,
eiecðZÞ ¼ es
ecðZÞ � Ze2�
a
is the mean energy of the electrons, (at large distance from the grain surface)collected by the dust particles,
280 15 Growth of Particles in a Plasma
esecðZÞ ¼ 2kBTe
is the mean energy of electrons at the surface, collected by the dust particles.
The first term on the right-hand side in (15.8) represents the power gained perunit volume by the electrons through ionization of the neutral atoms/molecules.The second term represents the energy loss per unit volume per unit time due torecombination with ions in the plasma. The last term is the power loss per unitvolume by accreting electrons.
We have ignored the negligible loss of electron energy on account of elasticcollisions with ions, neutral atoms, and dust particles on account of the large massratio.
15.2.7 Energy Balance for Ions
dds
32ðnAi þ nBiÞkBTi
� �¼ðbAnAeiA þ bBnBeiBÞ � ð3kB=2ÞðaAneniA þ aBneniBÞTi
� ndðniAceliAc þ niBce
liBcÞ
ð15:9Þ
where
elijcðZÞ ¼
2� Zaji
1� Zaji
� �kBTi;
is the mean energy of ions (at large distance from the grain surface), collected bythe dust particles (Chap. 3).
The next two terms refer to the energy loss per unit volume per unit time due tothe electron-ion recombination and accretion of ions on the surface of the dustparticles.
15.2.8 Energy Balance for Neutral Species
dds
32
nA þ nBð ÞkBTn
� �¼ ½ð3kB=2ÞðaAneniA þ aBneniBÞðTe þ TiÞ þ ðaAneniAIpA þ aBneniBIpBÞ�
þ ð3kB=2Þnd½ð1� ciAÞniAc þ niBc�Td � ð3kB=2ÞndnAccATn
� ð3kB=2ÞðbAnA þ bBnBÞTn � Ediss;
ð15:10Þ
where
15.2 Basic Equations 281

Ipj is the ionization energy of the constituent atomic species,
Ediss ¼ ðEA;diss þ EB;dissÞ
Ej,diss is the energy dissipated per unit volume per unit time by neutral atoms to thesurrounding atmosphere, andTa is the ambient temperature.
The dissipation energy may be reasonably assumed to be proportional to thedifference between the temperature of the neutral atomic species and the ambienttemperature. Thus one obtains
Ej;diss ¼ Ej;diss0ðTj � TaÞðTj0 � TaÞ
ð15:11Þ
The constant Ediss0 may easily be obtained by imposing the ambient conditionsof the complex system in (15.11) for both the constituent neutral species.
The first two terms on the right-hand side of (15.10) refer to the power gainedper unit volume by the neutral species due to the recombination of electrons andions. The third term is the power gain by neutral species per unit volume due toformation of neutrals at the surface of the dust grain on account of electron and ioncollection currents. The next term corresponds to the power loss per unit volumedue to the sticking accretion on the dust grains. The last but one term refers to thethermal energy lost per unit volume per unit time by neutral atoms due to ioni-zation. It is assumed that the total energy thus gained by the neutral atoms getsdissipated to the surroundings; the last term refers to the power dissipation rate perunit volume by neutral atoms to the surroundings.
15.2.8.1 Energy Balance for the Dust Particles
d
ds43pa3qCpTd
� �¼ neccee
sec þ ð3kB=2ÞnAc½cATn þ niAcðes
iAc þ IpAÞ þ niBcðesiBc þ IpBÞ
� �
� ð3kB=2Þ ð1� cAiÞniAc þ niBc½ �Td � 4pa2½2 rðT4d � T4
a Þ
þ nAð8kBTn=pmAÞ1=2 þ nBð8kBTn=pmBÞ1=2h i
kBðTd � TnÞ�
ð15:12Þ
where
esijcðZÞ ¼
2� Zaji
1� Zaji� Zaji
� �kBTi
282 15 Growth of Particles in a Plasma

is the mean energy of collected ions at the surface of the dust particle,
Cp is the specific heat of material of the dust particle at constant pressure,2 is the emissivity of the material of the dust grains; andr is the Stefan-Boltzmann constant.
The first two terms on the right-hand side of (15.12) are the rate of energytransferred to the dust particle due to the sticking electron and neutral atomaccretion. The third term is the power carried away by the neutral species per unit(generated by recombination of accreted ions and electrons) from the dust grains.The last term describes the rate of energy dissipation of the dust particles per unitvolume through radiation and energy gained conduction to the host gas.
15.2.9 Numerical Results and Discussion
Let us consider the growth of graphite particles in an acetylene flame dusty plasmawith R.F. discharge; the thermionic emission from the particles has been neglec-ted. The computations have been made to investigate the dependence of the sizeand charge on the dust grains and other relevant parameters viz. ne, niA, niB, nA, nB,Te, Ti, Tn on the parameter s for different values of nd and cA by simultaneoussolution of (15.4), (15.5a, b), (15.6a, b), (15.7), (15.8), (15.9), (15.10), (15.11), and(15.12) with appropriate boundary conditions viz. at s = 0 viz. nd = 106 cm-3,niA0 = 0.6ne0, niB0 = 0.4ne0, nA0 = nB0 = 5 9 1010 cm-3, ne0 = 109 cm-3,Te0 = 0.5 eV, Ti0 = 2500 K, and Tn0 = Td = 2000 K.
Further the other relevant parameters used in this investigation are as follows:
mia � ma ¼ 12 amu; mib � mb ¼ 20 amu; aA0 ¼ aB0 � 10�7 cm3=s; 2¼ 0:6;
ciA ¼ cA ¼ 1; Cp ¼ 7� 106 ergs=gK; IpA ¼ 11:26 eV; IpB ¼ 10 eV; eA ¼ 6:2 eV;
eB ¼ 10:7 eV; eiA ¼ 7:3 eV; eiB ¼ 12:2 eV; eA;diss0 ¼ 42:9 eV; eB;diss0 ¼ 19:6 eV;
j ¼ �1:2; a0 ¼ 8:0� 10�8 cm and q ¼ 2:5 g=cm3:
Figure 15.1 illustrates the dependence of the radius a of the dust particle on theparameter s for different values of number density of the embryonic dust particlend. The figure indicates that the size of the dust grain increases with s and attains asaturation value corresponding to depletion of the atoms and ions of A. For largervalues of nd the number of neutral atoms and ions of A, available for accretion perparticle is small and hence the radius of the particle saturates at a lower value ofa and sooner.
Figure 15.2 displays the dependence of the charge on the particle -Ze with nd.Figure 15.3 indicates the dependence of saturation radius a and the saturation
charge -Ze on nd.
15.2 Basic Equations 283

Fig. 15.1 Dependence of the radius of the particles (a/a0) on the parameter s: niA = 0.6ne0,niB = 0.4ne0, nA0 = nB0 = 5 9 1010 cm-3, ne0 = 109 cm-3, Te0 = 0.5 eV, Ti0 = 2500 K,Tn0 = Td0 = 2000 K at s = 0 and ce = ciA = cA = 1, cB = ciB = 0. The curves a, b, c, d,and e correspond to nd = 102, 103, 104, 105, and 106 cm-3, respectively (after Sodha et al. [4]curtsey authors and publishers AIP)
Fig. 15.2 Charge onparticles as a function of s forparameters, corresponding toFig. 15.1. The curves a, b, c,d and e correspond tond = 102, 103, 104, 105, and106 cm-3, respectively (afterSodha et al. [4] curtseyauthors and publishers AIP)
Fig. 15.3 Dependence ofsteady state of radius (a/a0)and charge (-Ze) on theparticles on the density ofdust particles nd; theparameters are the same as inFig. 15.1 (after Sodha et al.[4] curtsey authors andpublishers AIP)
284 15 Growth of Particles in a Plasma
References
1. P. Haaland, A. Garscadden, B. Ganguly, Appl. Phys. Lett. 69, 904 (1996)2. M.J. Perrin, C. Hollenstein, in Dusty Plasmas: Physics, Chemistry and Technological Impacts
in Plasma Processing, ed. by A. Boucherville Sources and Growth of Particles (Wiley, NewYork, 1999)
3. M.S. Sodha, S. Misra, S.K. Mishra, S. Srivastava, J. Appl. Phys. 107, 103307 (2010)4. S.V. Vladimirov, K. Ostrikov, A.A. Samarian, Physics and Applications of Complex Plasmas
(Imperial College Press, London, 2005)5. A.V. Gurevich, Some nonlinear phenomena in the ionosphere (Springer, New York, 1978)6. K. Ostrikov, Plasma Nanoscience, Wiley VCH (2008)
References 285
Chapter 16Electrostatic Precipitation
16.1 Introduction
Suspended particles in air may be caused by industrial processes and use of woodor coal as a fuel. These particles are a menace from the health and aesthetics pointof view. This has caused a widespread concern about the removal of such particlesand enforcement of increasingly severe regulations.
There are a number of methods for removal of the suspended particles, but onlythe electrostatic precipitation is within the scope of this book on complex plasmasviz. particle charging, particle collection, and removal of the collected dust. Wemay begin this study by first considering corona discharge, which is a unipolarcorona, comprising of neutral atoms/molecules and positive or negative ions.
16.2 Corona Discharge (After White [4], Oglesbyand Nichols [2])
The unipolar corona, employed for electrostatic precipitation is a gas discharge,characterized by stability and self-maintenance. The discharge is maintainedbetween a fine wire and a cylinder or a plate. The electrode spacing is a fewcentimeters and the gas pressure is around one atmosphere. The gas is ionized bythe impact of high energy electrons, produced by acceleration due to the highelectric field around the wire. An accelerated electron causes a number of elec-tron–ion pairs, to be produced. In case of a negative corona, the positive ions aredrawn to the wire and released as molecules. The electrons attach to molecules toform negative ions; thus a negative corona gets produced.
It is of interest to derive a simple current–voltage relationship in case of anegative corona discharge between a wire and a coaxial cylinder. The startingpoint is the Poisson equation viz.
r2V ¼ �4pe n�i ;
M. S. Sodha, Kinetics of Complex Plasmas, Springer Series on Atomic,Optical, and Plasma Physics 81, DOI: 10.1007/978-81-322-1820-3_16,� Springer India 2014
287

which for a cylindrical symmetry reduces to
d2V
dr2þ 1
r
dV
drþ 4pe n�i ¼ 0: ð16:1Þ
The current I corresponding to unit length of wire is given by
I ¼ 2prn�i el�i E; ð16:2Þ
whereE ¼ � dV=drð Þ is the electric fieldl�i is the ionic mobility, andn�i is the negative ion density.
From (16.1)–(16.3) one obtains
rEdE
drþ E2 � 2I
�l�i ¼ 0;
which on integration yields.
E ¼ � dV=drð Þ ¼ 2I�l�i
� �þ C2
�r2
ffi �1=2; ð16:3Þ
where C is a constant.At r ¼ r0 (outer radius of visible glow region), E ¼ E0 and hence
C ¼ r0 E20 � 2I
�l�i
� �1=2.
Using the above value of C and integrating (16.3), one obtains
V ¼ r0E0 ln a=bð Þ þ 1� 1þ 2I�l�i
� �b2�
E20r2
� �1=2h in
þ ln 1=2ð Þ 1þffiffiffiffiffiffiffiffiffiffiffiffiffiffiffiffiffiffiffiffiffiffiffiffiffiffiffiffiffiffiffiffiffiffiffiffiffiffiffiffiffiffiffiffiffi1þ 2I=l�ið Þ b2
�E2
0r20
� �q� �o: ð16:4Þ
16.3 Particle Charging (After White [4])
16.3.1 Two Distinct Processes
There are two distinct mechanisms for charging of dust particles in a corona. Thefirst phenomenon is the ion attachment in the electric field. This process in knownas field charging and is the dominant one for particles with radius, larger than0:5 l. A second process, known as ion diffusion is the accretion of ions by thecharged particles, as discussed in Chap. 3 of this book; this process is dominant forparticles with radii less than 0:2 l. In the range of radius of the particles0:2 l to 0:5 l both the processes should be taken into account.
288 16 Electrostatic Precipitation

16.3.2 Field Charging
When a conducting sphere (the particle) of radius a is in an initially uniformelectric field E0, the electric field at any point on the sphere can be shown to begiven by
E1 ¼ 3E0 cos h;
the coulomb field due to the charge �Ze on the particle is
E2 ¼ �Ze�
a2:
Hence, the total electric field E is given by
E ¼ E1 þ E2 ¼ 3E0cos h� Ze�
a2 ð16:5Þ
The total electric flux entering the surface is given by
w ¼Z
E:2pa2sin h dh: ð16:6Þ
The above integral is to be evaluated over the regions of h where E is positive.Thus,
w ¼ 3pa2E0 1� Ze�
3E0a2� �2
peZs 1� Z=Zsð Þ: ð16:7Þ
The saturation charge on the particle �Zse corresponds to w ¼ 0; where
Zs ¼ 3E0a2�
e: ð16:8aÞ
For dielectric material dust, (16.8a) should be replaced by
Zs ¼ 3E0a2�
e� �
1þ 2 K � 1ð Þ= K þ 2ð Þ½ �; ð16:8bÞ
where K is the dielectric constant of the dust material.The charging current to the sphere is
I ¼ en�i l�i w ¼ ddt
Zeð Þ:
Substituting for w from (16.7) in the above equation simplifies to
d Z=Zsð Þ1� Z=Zsð Þ2
¼ d t=t0ð Þ;
where t0 ¼ 1�pn�i l�i :
Integrating the above equation with the initial boundary condition Z ¼ 0 at t ¼ 0one obtains
Z=Zs ¼ t=t0ð Þ= 1þ t=t0ð Þ: ð16:9Þ
16.3 Particle Charging 289
For t=t0ð Þ ¼ 1; Z=Zs ¼ 1=2; thus, t0 can be considered as characteristic time ofcharging.
16.3.3 Ion Diffusion (Ion Accretion)
The charge �Ze on a particle due to negative ion accretion (Chap. 3) is given by
dZ
dt¼ n�i t�i exp �Ze2
�akTi
� �¼ n�i;c
where t�i ¼ 8kBTi=mipð Þ1=2 is the mean speed of the negative ions.Integrating the above equation with Z ¼ 0 at t ¼ 0 one gets
Z ¼ akBTi
�e2
� �ln 1þ t=T0ð Þ; ð16:10Þ
where T0 ¼ kBTi
�pat�i n�i e2:
Equation (16.10) indicates a monotonic increase of Z with increasing t which isnot physically tenable; this is caused by considering n�i as constant, which is onlytrue when the number of particles is very small.
16.3.4 Magnitude of Charge, Acquired by a Particle Dueto Electric Field and Ion Diffusion (Accretion)
Table 16.1 displays the time dependence of the charge Z on the particles acquired bythe two processes for the following typical set of parameters, n�i ¼ 5�107 cm�3;E0 ¼ 2 kV=cm and K ¼ 3 which are typical of electrostatic precipitation.
Fair agreement between theory and experiment has been found by White [4]and Liu et al. [1]. As stated earlier, it may be noticed from Table 16.1 that the fieldcharging is the dominant process of charging of particles for large radius while forsmaller particles ion accretion is the dominant process.
16.4 Particle Collection (After White [4])
16.4.1 Limitation of Theory
Collection of charged dust particles on a suitable surface is the second essentialstep in electrostatic precipitators. This may be achieved by continuation of thecorona electric field configuration or an applied electrostatic potential differencebetween non-discharging electrodes. In this section, a simple theory of the
290 16 Electrostatic Precipitation

collection of charged particles on the positive electrode has been given; compli-cations like particle entrainment and disturbances of the corona are neglected.
16.4.2 Drift of Particles
The charged particles will acquire a velocity w along the electric field Ep (per-pendicular to the collecting surface) given by
mdw
dt¼ �ZeEp � 6pga:w= 1þ A k=að Þ½ �;
wherem is the mass of the particlesg is the viscosity of the gask is the molecular mean free path andA is a constant, equal to 0.86 for air at NTP, corresponding to k ¼ 0:1l
(Cunningham correction).
The solution of this equation with the boundary condition w ¼ 0 at t ¼ 0 isgiven by
w=ws ¼ 1� exp �6pgat=m A 1þ k=að Þ½ �
For durations even much less than the retention time in the collection stage, theexponential term tends to zero and hence for our purpose.
w ¼ ws; ð16:11aÞ
where
ws ¼ ZseEp
�6pga 1þ A k=að Þ½ � ¼ E0Epa
�2pg 1þ A0 k=að Þ½ �: ð16:11bÞ
Table 16.1 Charging of particle in negative corona: dependence of Z on time
Particles radius l Field charging Accretion
Period of exposure (s) Period of exposure (s)
0.01 0.1 1 ?a 0.01 0.1 1 10
0.1 0.7 2 2.4 2.5 3 7 11 151.0 72 200 240 250 70 110 150 19010 7,200 20,000 24,400 25,000 1,100 1,500 1,900 2,300
The charge on the particle is �Ze (after Sodha and Guha [3], curtsey authors)a Limiting charge
16.4 Particle Collection 291

When the value of Zs from (16.8a) is substituted; the expression gets multiplied[(16.8b)] by 1þ 2 K � 1ð Þ=K þ 2f g for dielectric particles.
16.4.3 Collection Efficiency
Consider an element of precipitator of thickness dx along the direction of the flow.The loss of dust particles per unit time in the corresponding volume Ac dx ispdx wnd and hence the loss of particles per unit time per unit volume is pw=Acð Þnd:
The continuity equation for the dust particles may be expressed as:
ddt
nd ¼ � pw=Acð Þnd;
where
ddt¼ o
otþ t
ond
ox:
In the steady state o=otð Þ ¼ 0 and
t: dnd
dx¼ � pw=Acð Þnd:
For the initial condition nd ¼ nd0 at x ¼ 0 the solution of the above equation is
nd ¼ nd0 exp �x=x0ð Þ ð16:12aÞ
where
x0 ¼ tAc=pw:
Putting x ¼ tt; the above expression may be put in the form
nd ¼ nd0 exp �t=t0ð Þ; ð16:12bÞ
where
t0 ¼ Ac=pw:
The collection efficiency g may be expressed as:
g ¼ nd0 � nd
nd0¼ 1� exp �x=x0ð Þ: ð16:13Þ
The mechanical removal of dust from the collector plate is not in the scope ofthe book.
292 16 Electrostatic Precipitation

References
1. B.Y. Liu, K.T. Whitby, H.S. Yu, J. App. Phys. 38, 1592 (1967)2. S. Oglesby Jr, G.B. Nichols, Electrostatic Precipitation (Marc el Dekker, New York, 1978)3. M.S. Sodha, S. Guha in Physics of Colloidal Plasmas, ed. by A. Simon, W.B. Thompson.
Advances in Plasma Physics, Vol. 4, (Inter Science Publishers, New York, 1971), p. 2194. H.J. White, Industrial Electrostatic Precipitation (International Society for Electrostatic
Precipitation, Birmingham, 1963)
References 293

About the Author
The author is presently Visiting Professor at the Centre of Energy Studies IITDelhi and has worked in universities and industries in India, USA, and Canada. Hehas served three universities as Vice-Chancellor and in IIT Delhi as Professor,Head of Department, Dean, Deputy Director, etc. Prof. Sodha has been Ph.D thesisadvisor to over 75 candidates who successfully completed the program. He haspublished over 600 papers in international journals of repute in plasma physics,optics, semiconductors, energy, combustion and ballistics, etc., in addition toauthoring/editing 11 books.
The author is a Fellow of Indian National Science Academy and NationalAcademy of Sciences, India and has received the S.S. Bhatnagar prize for physicalscience in 1974.
The honor of Padmashri was conferred on Prof. Sodha by the President of Indiain 2003.
M. S. Sodha, Kinetics of Complex Plasmas, Springer Series on Atomic,Optical, and Plasma Physics 81, DOI: 10.1007/978-81-322-1820-3,� Springer India 2014
295

Index
BBeam propagation, 169Boltzmann’s transfer equation, 158
CCharge distribution, 133, 137, 138Charge distribution over uniform dust, 101Classical theory, 85Cometary magnetosphere, 4, 200, 211Comets, 212Complex plasma, 3Complex plasma MHD power generation, 245Complex plasmas in space, 199Complex refractive index, 168Complex rocket exhaust plasma, 256Composition, 256Conductivity, 152, 154–156, 160, 161, 164Constant Mach number duct, 247Corona discharge, 287Current density, 152, 154–156, 158, 160, 162
DDark, 120Data, 27Distribution function, 11Droplet complex plasma, 263Dust charge fluctuation, 187Dust mixture, 144
EEffect of Electric Field, 34Einstein relation, 153Electric field, 23, 25Electron collisions, 122
Electron emission, 13Electron transmission coefficient, 15, 21, 23,
60, 61, 63, 65, 66, 76Electronic states, 9Electron/ion accretion, 132Electron-ion accretion on spherical/cylindrical
particles, 85Electrostatic precipitators, 287EM propagation, 168–171
FFermi energy, 12Field charging, 288Flames, 5Flowing plasma, 131Fowler’s theory, 31Free electron model, 9
GGrowth of particles, 277
HHall coefficient, 155Hot electrons, 156
IIlluminated, 122Interaction with ionosphere, 259Interplanetary plasma, 225Interstellar (WIM) plasma, 230Ion diffusion charging, 290Ion trapping, 96Irradiated, 105
M. S. Sodha, Kinetics of Complex Plasmas, Springer Series on Atomic,Optical, and Plasma Physics 81, DOI: 10.1007/978-81-322-1820-3,� Springer India 2014
297

KKappa distribution, 142Kinetics, 133, 164Kinetic theory, 158–163
LLight induced field, 29, 33–38Lorentzian plasma, 98
MMaster difference equation, 187, 203Mie scattering, 146Mie’s theory, 75Moist K vapour, 264MRN power law, 142
NNegative ion emission, 268NLC, PMSE, PMC, 201Nonlinear effect, 156Nonlinear electromagnetics, 171
OOhmic loss, 162Orbital model, 85, 94
PParaxial approximation, 183Particle collection, 290Photoelectric-cylindrical surface, 58Photoelectric-plane surface, 29, 32, 34, 35, 37Photoelectric-spherical surface, 52PMSE structures, 176Propagation parameters, 172
QQuantum effect, 88
RRichardson-Dushman equation, 23Richardson’s constant, 23Role of dust, 262
SSaturn E ring, 217Schottky effect, 88, 266Secondary-cylindrical surface, 77Secondary-plane surface, 36Secondary-spherical surface, 42Self focusing, 186Size distribution, 193Size distribution of dust, 141Solid state, 111
TThermal equilibrium, 101, 114Thermionic-cylindrical surface, 54Thermionic-plane surface, 23Thermionic-spherical surface, 50Topping cycle, 252Transport parameters, 161, 170
UUniform charge theory, 108Uniform potential, 143
WWave equation, 167
298 Index