Luminous Compact Galaxies at Intermediate Redshifts: Progenitors of Bulges of Massive Spirals
Upload
independentCategory
view
0download
0
Optical Redshifts due to Correlations inQuasar Plasmas
William Lama andPeter Walsh Xerox Research (retired)Fairleigh Dickinson U, Emeritus 28 Via Porto Grande40 Saint Joseph Drive Rancho Palos Verdes, CA, 90275Stirling, NJ, 07980
Abstract
While it is commonly accepted that cosmic redshifts are causedby the expansion of space, there are some puzzling cases. Forexample, a number of quasars having very large redshifts appearto be close to galaxies having much lower redshifts. If thestandard cosmological model of the universe is correct, thenthe apparent proximity of quasars and galaxies must beincorrect, and the quasars must be much farther away. Then weare puzzled by the enormous luminosity of the quasars, whichmust be thousands of times more energetic than an entiregalaxy, and by their enormous speeds which must approach thespeed of light. But if the quasar redshifts have a significantcontribution from another mechanism besides expansion, thentheir proximity to low redshift galaxies and the quasar energyand speed puzzles would be resolved. One physical mechanismthat produces redshifts is optical correlations. In fact,
1

correlation-induced spectral changes on scattering from gasesor plasmas can mimic the major features of redshifts caused byexpansion. We will present a high level, hopefully intuitive,overview of the theory that has been developed over the lastdecade and try to draw some concrete conclusions about therelevancy of the effect to the redshifts from quasars.
Part l: General Theory
Introduction
Modern cosmology is founded on the hypothesis that the universeis expanding. The most convincing indirect evidence forexpansion is the observation of pervasive redshifts of cosmicradiation. However, the complete cosmological picture builtupon this hypothesis contains numerous unexplained mysteries.The standard cosmological model relies on a universal beginningof both space and time, when energy and matter first emergedfrom the vacuum. This hot big bang was followed by an instant(10-30 sec) of fantastic inflation, when the universe grew froma tiny seed a billion times smaller than a proton to fill avolume of diameter about 1 meter (an average speed of ~ 1021 c).According to the model, the expansion has continued to this day(~ 15B years). Recent measurements of Type-1A supernova seemto imply that the cosmic expansion is actually accelerating – anew age of inflation. Furthermore, the model has required anumber of additional hypotheses: (1) dark matter of an unknownkind that accounts for most of the matter in the universe; (2)dark energy that also emerged from the vacuum and isgravitationally repulsive (anti-gravity); (3) several exoticnew particles; (4) black holes within quasars. Indeed, quasarsappear to possess several unusual properties that will bediscussed below. But what if space expansion is not the only cause of theobserved redshifts from some stellar objects such as quasars?
2

There are numerous physical mechanisms that can produceredshifts, and some of these can mimic the characteristics ofexpansion redshifts. Here we will review and discuss one suchmechanism first proposed by Emil Wolf 1 in 1986. The mechanisminvolves correlations among radiating sources and classicalinterference. In over 100 publications, Wolf’s basic concepthas been extensively developed and experimentally verified.While we do not suggest that this mechanism is the cause ofmost cosmic redshifts, there is a reasonable chance that itcould account for some part of the redshift from quasars.
Background
3

The classical demonstration of the wave properties of light isthe Young two-slit interference experiment. Consider thestandard case where the slits are illuminated by a quasi-monochromatic (narrow band, long coherence time) light source,with constant phase difference between the slits (spatialcoherence). Then the superposition of the light waves comingfrom the two slits will produce an interference (fringe)pattern of intensity that is stationary (constant) in time andsinusoidal in space. It is well known that the fringevisibility decreases as the degree of coherence decreases, thatis, as the phase difference between the slits becomes morerandom. Also, as the bandwidth increases, the fringes becomedifficult to observe since they move rapidly in space. What isnot so well known is that when the fringes disappear due to thewide bandwidth (short coherence time), the spatial coherencestill produces interference, this time in the frequency domain.This effect was first predicted by Mandel2 in 1961, but was notobserved experimentally 3 until 1992. The spectralinterference law predicts that the frequency spectrum S(r,)at point r, produced by two sources S1 (r,) and S2 (r,) isgiven by 4
S(r,) = S1 + S2 + 2 [S1 S2]1/2 Re [ (r1,r2,) exp{-i(R2-R1)/c}](1)
where (r1,r2,) is the spectral degree of coherence of thelight at the two slits. This is the analog of the Youngintensity interference formula*. Note that the interferencespectrum is, in general, not the same as the spectrum of theindividual sources due to the spectral dependence of ().For incoherent light, = 0, the interference spectrum issimply the sum of the source spectra. For perfect coherence, = 1, the interference term is a sinusoidal function of whichmodulates the source spectra at any point. This produces thespectral interference “fringes” due to spatial coherence of thewideband source. There are many other analogous effects due tosource coherence and correlations in optical gratings, laserfrequency modes and mode locking, frequency combs in nonlinear
4

fibers, and even the common forward scattering in refractivemedia.
* Since Young’s experiment is over 200 years old, it isinteresting that the analogous frequency interference was notpredicted until 1961 and was finally observed 31 years later.With the invention of the laser in 1960 optical coherence wasgiven renewed attention.Source Correlations
All light sources, including plasmas and their radiationfields, undergo random fluctuations due to causes such asfluctuations of the radiating medium, random spontaneousemission, vibrations of laser mirrors and electron scatteringin plasmas. Wolf 5 considered the spectrum produced by thesuperposition of two such (point) sources and showed (withgeometrical simplifications) that the spectrum at a field pointa distance R to each source is given by
S() = (2/R2) S0() [1 + Re (R, ) ](2)
where S0() is the (common) source spectrum and is thespectral degree of correlation (similarity) of the sourcefluctuations. For completely uncorrelated sources ( = 0), orfor complete correlation ( = 1), then the interferencespectrum is the same as the source spectrum. Whenever thecorrelation function depends on the frequency, the spectrum ischanged by the correlations. These spectral changes can takethe form of simple shifts of the spectral peaks to higher(blue) or lower (red) frequencies, linewidth changes, etc, anddepend on the nature of the source fluctuations.
As a simple example, imagine that the source spectrum isgaussian of width 0, peaked at 0, and that the correlationfunction of the fluctuations is a gaussian of width 1 andpeaked at 1. Then the field spectrum is also gaussian but ispeaked at 5
5

’ = [12 0 + 02 1]/[02 + 12](3)
Note that ’ is not equal to the source spectral peak 0. Therelative frequency shift of the spectral peak is given by z =[0 – ’ ]/’ , or
z = 02 [0 – 1] /[02 1 + 12 0](4)
This is just the simplest example of source correlations givingrise to frequency shifts. The frequency shift is positive(redshift) whenever 1 < 0. Note, however, that z depends onthe source frequency 0, unlike (relative) cosmic redshiftsthat are the same for all frequencies. Some insight into themicroscopic cause of the macroscopic correlations is providedin Appendix A.Frequency Shifts due to Scattering
In a series of papers from 1986 to 1998, Wolf et al consideredthe spectral changes due to a variety of source correlations;the extension to the case of correlations within a scatteringmedium; and a number of practical consequences, including someimplications for cosmology. Some of the main theoreticalresults are summarized in Appendix B. Some validatingexperiments are summarized in Appendix C.
In the cases of scattering from media with spatial and temporalcorrelations, the scattered spectrum S(r, ) is given by anintegral equation which is solved through the use of the firstorder Born approximation 4:
S(r,) = (1/r2) d’ K (ur, , ’) S0 (’)(5)
6

Here S0 is the source spectrum and K is the scattering kernalwhich is equal to the Fourier transform of the opticalcorrelation function of the scattering medium. We will examinethe solution of the scattering equation for the case of aquasar scattering medium in the following sections. Firstnote, from the table in Appendix B, that scattering from astatic medium (case 4) can produce a redshift of the scatteredlight that is proportional to the frequency, like the DopplerEffect. However, the shift is constrained by the bandwidth ofthe incident light. A dynamic scattering medium (cases 5 – 7)is required to produce arbitrarily large, Doppler-likeredshifts.
Part ll: Cosmological Applications
Redshifts
If the Wolf effect is to even partially explain the redshiftsof galaxies or quasars, the theory must predict the commonobservations:
1. z > 0 (redshift only)2. z independent of frequency (same for all lines)3. z arbitrarily large
In the context of the Wolf theory, we will see that only thescattering from a medium with space-time correlations can beconsistent with the three observations. (See Appendix B) While
7

source correlations and scattering from static media may giveredshifts that are independent of frequency, the shifts arelimited to be within the natural line-width of the incidentlight. Without time dependence of the correlations, no newfrequencies are generated; only the existing amplitudes aremodulated by the correlations.
Quasar Redshifts
The optical correlation theory was applied to quasar redshiftsin a paper by Daniel James 6. He treats a model of a quasarwith the following plausible properties:
1. A super-massive Black Hole2. An accretion layer that generates intense non-thermal
radiation3. The radiation excites Narrow Line Region gas clouds that
emit line radiation.4. The line radiation interacts with a scattering medium
(plasma or gas) having spatial and temporal correlationsthat induce frequency shifts.
5. Axial symmetry: The line radiation is constricted by a dusttorus to emission within a solid angle around the axialdirection. (See Figure 1)
The observation of wavelength-independent polarization ofquasar lines is an indication that the scattering is from aplasma.7 It has been estimated 8 that the plasma may have atemperature of 104 K, an electron density of 104 cm-3, and amagnetic filed of 10-3 G.
James employs a Gaussian correlation model for the quasarscattering medium (see Figure 2)
G (b,) = exp {- [(b/)2 + (b/)2 + (c/)2]/2} ,(6)
8

where the b’s are spatial coordinates reflecting the circularsymmetry and c is the speed of light. The temporal and spatialcorrelation coefficients are , and , respectively, wherethe axis of symmetry is denoted by ( ) and the transversedirection by ( ). Assuming a monochromatic source offrequency 0, the solution of the scattering Eq (5) is given by9
S() = A 4 exp{-02[’ – 2]/2} exp{-( – 0’)2/2
2} (7)
The scattered spectrum is a Gaussian with a shifted frequency0’ and a line-width , where
= [2 +
2 + q2 (2 –
2)]/c2
= [2 + q
2]/c2
and, q = [1 – /4] cos (8)
o’ = l 0/(9)
= 1/(10) From the shifted frequency 0’ we obtain the fractionalfrequency shift due to optical correlations
z = /ll – 1(11)
9

Note that the fractional frequency shift is independent of thesource frequency, as it must be for quasar redshifts. Theshift is also arbitrarily large since is arbitrarily small as 0 and 0. The redshift-only requirement implies that > , or
(/) 2 > q /(1 + q)(12)
a condition on the parallel and transverse correlationcoefficients for each scattering angle. The angular dependenceis contained in the factor q.
For the special case of a symmetric scattering medium, =
, and the shift and line-width become
z = [1 – q] / [(/) 2 + q](13)
= c/ (2 + 2)
(14)
Now consider the temporal fluctuations. For a static mediumthe correlation coefficient = and the shift given by Eq(13) 0. The opposite limit is a “white noise” medium whereall frequencies are present and = 0. In that case in asymmetric medium, the shift is simply [1 – q]/q > 0, ie anarbitrarily large redshift. Note that the thermal Johnson-Nyquist noise 10 in a plasma has a white spectrum independentof frequency,f, with a noise power of 4kTf. The white noiseextends up to a quantum frequency limit of kT/h. Finally, notethat the linewidth > 0 in all cases, which means that theWolf effect has broadened the monochromatic line.
A major condition on the scattering medium imposed by thecorrelation theory involves the first order Born approximation.The solution to the scattering integral equation is obtained bysubstituting the incident wave as an approximation in the
10

integrand. But this implies that the scattering is weak, orthe series will not converge and the first order approximationis invalid. Thus the unshifted incident spectrum will dominatein the forward direction, and only well off-axis will theshifted spectrum be observed. A higher order theory will beneeded to understand the efficiency of the Wolf effect andwhether the main features will persist when the scattering isstrong.
Dependence of Intensity on Scattering Angle
The scattered spectrum S, Eq (7), depends on scattering angle’ through the factor q = (1 – o/4) cos ’. The simplestcase is when the parallel correlation coefficient () is muchless than the temporal coefficient () and the perpendicularcomponent (). Then the angular dependence is given by
S(’) = So exp[- p sin2 ’ ](15)
Where p = (1/2)(1 – o/4)2 ()2 and So is the spectrum onaxis. Thus the scattered spectrum decreases with increasingscattering angle. In this case the redshift z is given by
z = (/)2 [1 – q2](16)
The redshift increases with increasing scattering angle as qdecreases. In this asymmetric case, the redshift increases butthe scattered intensity decreases with increasing angle. Nowsince S and z both depend on the scattering angle ’, it can beeliminated to obtain a relation between the spectral intensityand the redshift generated for any ’. The result is
Ln (S/So) = (1/2) ( )2 [1 – (1 – /4)2 – (/)2
z] (17)
11
Thus the scattered intensity decreases exponentially withincreasing redshift z. The spectral intensity S() at a givenline frequency () is proportional to the strength of the lineemitted by the Narrow Line Region (NLR) which, in turn, dependson the pump luminosity L (the continuum radiation) and theproperties of the NLR. Thus S() ~ L(). If we consider thetotal intensity (scattered and unscattered) of a given linethen the ionization cone should be dominated by the unscattered(unshifted) radiation, given the validity of the Bornapproximation. The scattered (and red shifted) radiation willbe observable outside the cone. Now consider a set of quasarswith the same intrinsic luminosity and all at the same distancefrom earth. The redshift and brightness we see will be afunction of their inclination angles. Those at larger angleswill have higher measured redshifts but lower measuredbrightness. Very high redshift will not necessarily implyimmense distance and enormous energy.
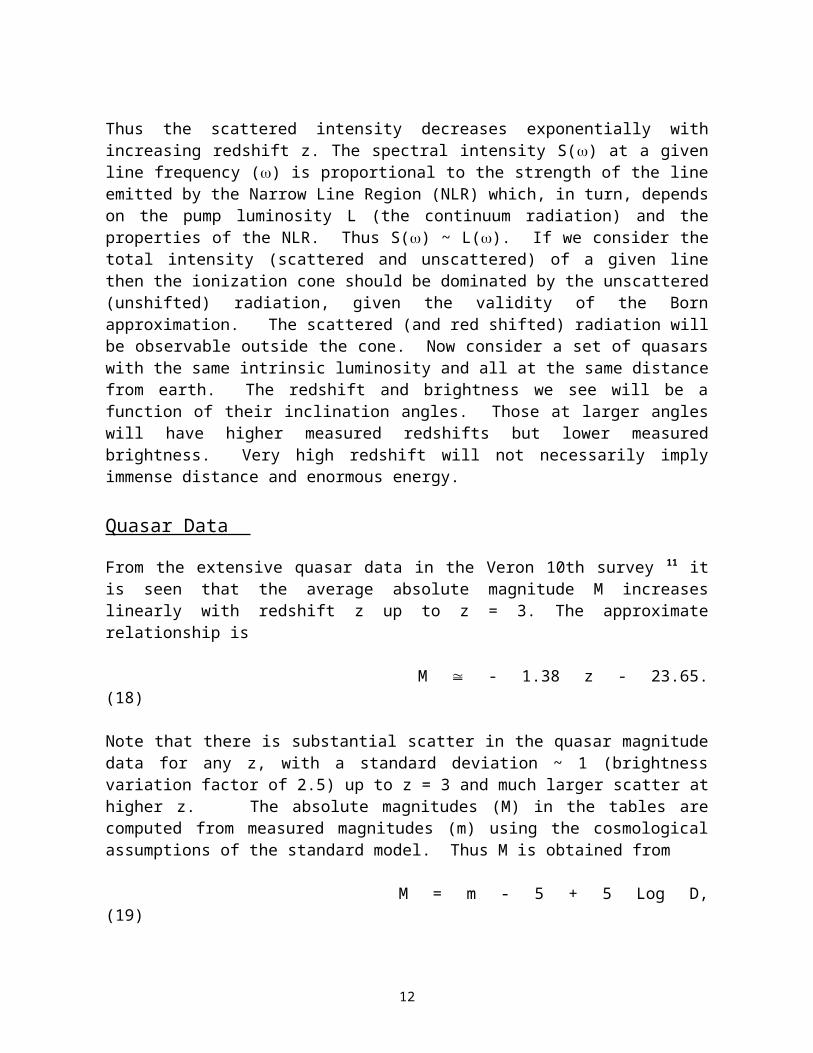
Quasar Data
From the extensive quasar data in the Veron 10th survey 11 itis seen that the average absolute magnitude M increaseslinearly with redshift z up to z = 3. The approximaterelationship is M - 1.38 z - 23.65.(18) Note that there is substantial scatter in the quasar magnitudedata for any z, with a standard deviation ~ 1 (brightnessvariation factor of 2.5) up to z = 3 and much larger scatter athigher z. The absolute magnitudes (M) in the tables arecomputed from measured magnitudes (m) using the cosmologicalassumptions of the standard model. Thus M is obtained from
M = m - 5 + 5 Log D,(19)
12

where
D = c z (1 + z/2)/H,(20)
D is the “luminosity distance” and H is the Hubble constant.The result is that the calculated absolute magnitudes increasewith z according to Eq (18) and the absolute luminosityincreases as 11
Log (L/Lsun) = 0.55z + 11.36.(21)
Here Lsun = 3.8 x 1033 erg/sec is the luminosity of the sun. Asan example, a quasar at z = 3.0 will have a luminosity
L = 1013 Lsun
ie 10 trillion suns! Thus the standard model yields a quasarluminosity that increases with redshift z (and distance) andrequires enormous energy sources (eg super massive black holes)to supply the power if the redshifts are due solely to theexpansion of space.
Conclusion
We have shown that light scattering from correlatedfluctuations within quasar plasmas can produce spectralredshifts that mimic the redshifts due to space expansion.While the correlation-induced redshifts are indistinguishablefrom expansion redshifts, there are dependences of thescattered power spectra on frequency, angle and quasar physicalproperties that may be investigated to differentiate betweenthe active redshift mechanisms. Consideration of thisalternative redshift mechanism may partially alleviate theenormous energy required of quasars if their redshifts areassigned only to the expansion of space. If our mechanism isat work within quasars, then the quasars may be much closerthan conventionally assumed and the effects of intervening
13

cosmic matter would be correspondingly less. We have mentionedseveral of the unusual features of the measured quasarredshifts. Another puzzle is the apparent systematic shift 12
of spectral lines originating in the Broad Line Regionsrelative to those coming from the Narrow Line Regions. Thesenumerous anomalies argue for a more complex physical model todescribe the redshifts from quasars. It may be that opticalcorrelations play a part.
Figure 1
Figure 2
14

Acknowledgements
We want to thank Dr. Daniel James (Los Alamos NationalLaboratory) and Prof. Jack Sulentic (University of Alabama) fortheir guidance and for many helpful suggestions. Thanks alsoto Charles Gallo (Superconix) for arranging the APS Conferencesession on “Non-Doppler Redshift Mechanisms with PossibleCosmological Applications” (Philadelphia 2003) where this workwas presented. We also acknowledge the pioneering work in thisfield by Prof. Emil Wolf (University of Rochester) and one ofus (Lama) thanks Prof. Wolf for his inspiring lectures atRochester.
15

References
1. E. Wolf, Phys Rev Letters 56, 1370 (1986)
2. L. Mandel, J. Opt. Soc. Am. 51, 1342 (1961)
3. M. Santarsiero and F. Gori, Phys. Letters 167A, 123 (1992)
4. L. Mandel and E. Wolf, Optical Coherence and Quantum Optics,Cambridge Univ. Press (1995)
5. E. Wolf, Phys. Rev. Letters 58, 2646 (1987) 6. D. F. V. James, Pure Appl. Opt. 7, 959 (1998)
7. B. Peterson, An Introduction to Active Galactic Nuclei,Cambridge Univ. Press, chapter 7 (1997)
8. D. F. V. James, M. P. Savedoff and E. Wolf, Astrophysical J.359, 67 (1990).
9. Ref. 6, using Eqs. (3.31), (3.22) and a delta function forthe source.
10. See, for example, C. Beenakker and C. Schonenberger,“Quantum Shot Noise”, Physics Today, 57, 37 (2003)
11. See, eg, Michael Feltz's web site at www.bright.net/~mrf
12. J. W. Sulentic, Astrophysical J, 343, 54 (1989)
13. G. V. Varada and G. S. Agarwal, Phys. Rev. A 44, 7626(1991)
14. D. F. V. James, Phys. Rev. A 47, 1336 (1993)
15. See, eg, W. Lama and L. Mandel in Coherence and QuantumOptics, Plenum Press, p273 (1973).
16

Appendix A: Atomic Treatment of the Wolf Effect
Some insight into the underlying physics of the macroscopiccorrelations that produce Wolf effects may be obtained from atreatment of a simple 2-atom system in the presence of thermalradiation. Thus Varada and Agarwal 13 and James 14 consideredsystems consisting of a pair of 2-level atoms and of a pair of4-level atoms, respectively.
In the first case 13, the dipole-dipole interaction of the pairof radiating atoms causes atomic correlations of the dipolemoment operators, shifts of the source spectrum as well asshifts of the radiation spectrum. When the atoms are closetogether compared to the radiated wavelength, numericalcalculations show that the spectral frequency shift is to thered and can be large. For example, when the atom separation is0.1 /2, the frequency shift is 20A, where A is the naturallinewidth. Thus it is shown in this simple model of radiationinteraction that the frequency shifts are due to atomiccorrelations that arise from cooperative behavior of theradiating atoms.
In the James paper 14, the two atoms are each described by 4states, three degenerate upper (p) levels and a singlet (s)ground state. This model has the advantage of sphericalsymmetry and admits closed form solutions in the case ofmoderate temperatures (T<< 3000K). The solutions, thoughcomplicated, show explicitly that the atomic fluctuations andthe radiated spectrum change as a result of the interactionthrough the radiation field. The limits of the totalradiation spectrum at very large and at very small atomicseparations (d) are given by
S() = (4 I n/ r2) (A/2) /[( - 0)2 + (A/2)2] d >> (A1)
S(w) = (6 I n/ r2) (A) / [( – 0 – )2 + A 2] d << (A2)
17

where,
= (3A/4) [ y0(kd) – y1(kd)/(kd) ] (A3)
is the frequency shift, 0 is the spectral peak in the absenceof interactions, I is the single atom intensity, n is thephoton occupation number, r is the distance to the field point,A is the natural line-width, k = 2/ and the y’s are Besselfunctions. When the atoms are far apart compared to thewavelength, the radiation spectrum peaks at 0 and thebandwidth is A, the natural line-width. However, when theatoms are close together compared to the wavelength, theradiation spectrum shifts and spreads. The frequency shift is to the red, and can be very large for kd << 1. The line-width is (2A), twice the natural line-width. These 2-atomcorrelated effects are analogous to the multi-atom effectsknown as Superradiance 15.
Appendix B: Frequency Shifts due to the Wolf Effect
In the following table, the source spectrum S0 is a Gaussian,peaked at the (angular) frequency 0 having bandwidth (),except for the last case where the light is monochromatic. Thespatial correlation function is a Gaussian having width ().In the cases of scattering from media with spatial and temporalcorrelations, the analog of the degree of spectral coherence isthe correlation function of the medium (G) that is related tothe kernel in the integral equation for the spectrum. Thefractional frequency shift of the spectrum (due tocorrelations) is denoted by (z), as in the Doppler Effect.
Source Correlations Spectral Effects
18

1. Planarsource,spatiallyuniformspectrum Phys Rev Letters56, 1370 (1986)
Fourier transform of is a product of afunction of directionand a function offrequency (Wolf’s scaling law)
No frequency shiftz = 0
2. Twofluctuatingpoint sourceshavingidenticalspectra Nature, 326, 363(1987)
is a Gaussianfunction of sourceseparation havingbandwidth () that isa function offrequency
For = constant z = (/c)2 redshift, indep. offreqFor = const/ z = 3(/0)2 which depends onfrequency
3.Twofluctuatingpoint sourcesPhys Rev Letters58, 2646 (1987)
is a Gaussianfunction of frequencypeaked at 1 havingwidth 1
z > 0 if 1 < 0
redshiftz < 0 if 1 > 0
blueshiftz depends on frequency0
4. Scatteringfrom a staticmedium havingrandom spatialfluctuations JOSA-A, 6, 1142(1989)
G is a 3-dimensionalGaussian of positionhaving width .Incident lightdirection defines =0. Medium behaves as acollection ofradiating dipolesdriven by the incidentlight.
z = 4 [ (/c)2sin2(/2)– (/0)2 ] z < 0, blue-shift for = 0, uncorrelatedfor = 0,monochromaticfor 0, forwarddir’notherwisez > 0, redshift
5. Scatteringfrom a mediumthatfluctuates inboth space andtime Phys Rev A, 40,588 (1989)
G is a sphericalGaussian function ofposition ( = correlationlength) and of time ( = correlationtime)
z = 2 [(/c)2 +2(/c)2] X sin2(/2) - 4[(1/0)2+ (/0)2] redshift possible for > 0
19

Scattering angle is relative to incidentdirection
6. Scatteringfromanisotropic,dynamicmedium.Incident lightis gaussian Astrophys J, 359,67 (1990)
G is a 4D Gaussianhaving a correlationcoefficient ( )strong in onedirection. Theincident lightdirection is at angle and the scatteredlight is at ’relative to theanisotropy direction.
z = l cos’ /cos l – 1
Like Doppler: independent offrequency,arbitrarily largeredshift for ’ < z = 0 for ’ = (forward)
7. Scattering from anisotropic, dynamic medium.Incident lightis monochromatic
Phys letters A,146, 167 (1990)
G is a 4D Gaussian,with arbitraryisotropy
= [x2ux’ 2 + …. +
2]/c2
= [ x2uxux’ +…. +
2]/c2
z = (/ll) – 1where and are functions of the correlation coefficients and the incident and scattered directions. Shift can be red or blue.For isotropic medium,shift is red for alldirections except z = 0for forward scattering.
Appendix 3: Experiments
The following table contains selected experiments that have provided some verification of correlation-induced spectral shifts.
REFERENCE EXPERIMENTBako, Douglass and Knox,Phys Rev Lett, 58, 2649
Observed shift in acoustic spectra from 2 sound sources as correlation
20

(1987) degree variedGori et al, Opt Commun 67, 1 (1988)
2 pinholes illuminated by 2 independent light sources. Beamsplitter varied contributions of source illuminations. Resulting light correlation shifted optical spectra.
Santarsiero and Gori, Phys Lett 167A, 123 (1992)
Observed spectral fringes in Young’s two slit experiment. Slits were illuminated by broadband partially coherent light from a first pair of slits.
Morris and Faklis, Opt Commun 62, 5 (1987)
Produced spectral degree of coherence and observed, as predicted, no frequency shift when Wolf’s scaling law was satisfied andshift when law not satisfied. Showedspectrum depended on angle
21
Copyright © 2022 FDOKUMEN