The ages of quasar host galaxies
25
arXiv:astro-ph/0002020v2 23 Oct 2000 Mon. Not. R. Astron. Soc. 000, 000–000 (0000) Printed 17 January 2014 (MN L A T E X style file v1.4) The ages of quasar host galaxies. L.A. Nolan 1 , J.S. Dunlop 1 , M.J. Kukula 1 , D. H. Hughes 1,2 , T. Boroson 3 & R. Jimenez 1 . 1 Institute for Astronomy, University of Edinburgh, Blackford Hill, Edinburgh, EH9 3HJ 2 INOAE, Apartado Postal 51 y 216, 72000, Puebla, Pue., Mexico. 3 NOAO, PO Box 26732, Tucson, Arizona 85726−6732, U.S.A. Submitted for publication in MNRAS ABSTRACT We present the results of fitting deep off-nuclear optical spectra of radio-quiet quasars, radio-loud quasars and radio galaxies at z ≃ 0.2 with evolutionary synthesis models of galaxy evolution. Our aim was to determine the age of the dynamically dominant stellar populations in the host galaxies of these three classes of powerful AGN. Some of our spectra display residual nuclear contamination at the shortest wavelengths, but the detailed quality of the fits longward of the 4000 ˚ A break provide unequivocal proof, if further proof were needed, that quasars lie in massive galaxies with (at least at z ≃ 0.2) evolved stellar populations. By fitting a two-component model we have separated the very blue (starburst and/or AGN contamination) from the redder underlying spectral energy distribution, and find that the hosts of all three classes of AGN are dominated by old stars of age 8 − 14 Gyr. If the blue component is attributed to young stars, we find that, at most, 1% of the visible baryonic mass of these galaxies is involved in star-formation activity at the epoch of observation, at least over the region sampled by our spectroscopic observations. These results strongly support the conclusion reached by McLure et al. (1999) that the host galaxies of luminous quasars are massive ellipticals which have formed by the epoch of peak quasar activity at z ≃ 2.5. Key words: galaxies: active – galaxies: evolution – galaxies: stellar content – quasars: general 1 INTRODUCTION Determining the nature of the host galaxies of powerful ac- tive galactic nuclei (AGN) is of importance not only for improving our understanding of different manifestations of AGN activity, but also for exploring possible relationships between nuclear activity and the evolution of massive galax- ies. The recent affirmation that black-hole mass appears ap- proximately proportional to spheroid mass in nearby inac- tive glaxies (Maggorian et al. 1998) has further strengthened the motivation for exploring the link between active AGN and the dynamical and spectral properties of their hosts. Over the last few years, improvements in imaging res- olution offered by both space-based and ground-based op- tical/infrared telescopes has stimulated a great deal of re- search activity aimed at determining the basic structural parameters (i.e. luminosity, size and morphological type) of the hosts of radio-loud quasars, radio-quiet quasars, and c 0000 RAS
-
Upload
independent -
Category
Documents
-
view
0 -
download
0
Transcript of The ages of quasar host galaxies

arX
iv:a
stro
-ph/
0002
020v
2 2
3 O
ct 2
000
Mon. Not. R. Astron. Soc. 000, 000–000 (0000) Printed 17 January 2014 (MN LATEX style file v1.4)
The ages of quasar host galaxies.
L.A. Nolan1, J.S. Dunlop1, M.J. Kukula1, D. H. Hughes1,2, T. Boroson3 & R. Jimenez1.
1Institute for Astronomy, University of Edinburgh, Blackford Hill, Edinburgh, EH9 3HJ
2INOAE, Apartado Postal 51 y 216, 72000, Puebla, Pue., Mexico.
3NOAO, PO Box 26732, Tucson, Arizona 85726−6732, U.S.A.
Submitted for publication in MNRAS
ABSTRACT
We present the results of fitting deep off-nuclear optical spectra of radio-quiet
quasars, radio-loud quasars and radio galaxies at z ≃ 0.2 with evolutionary synthesis
models of galaxy evolution. Our aim was to determine the age of the dynamically
dominant stellar populations in the host galaxies of these three classes of powerful
AGN. Some of our spectra display residual nuclear contamination at the shortest
wavelengths, but the detailed quality of the fits longward of the 4000A break provide
unequivocal proof, if further proof were needed, that quasars lie in massive galaxies
with (at least at z ≃ 0.2) evolved stellar populations. By fitting a two-component
model we have separated the very blue (starburst and/or AGN contamination) from
the redder underlying spectral energy distribution, and find that the hosts of all three
classes of AGN are dominated by old stars of age 8 − 14 Gyr. If the blue component
is attributed to young stars, we find that, at most, 1% of the visible baryonic mass
of these galaxies is involved in star-formation activity at the epoch of observation, at
least over the region sampled by our spectroscopic observations. These results strongly
support the conclusion reached by McLure et al. (1999) that the host galaxies of
luminous quasars are massive ellipticals which have formed by the epoch of peak
quasar activity at z ≃ 2.5.
Key words: galaxies: active – galaxies: evolution – galaxies: stellar content – quasars:
general
1 INTRODUCTION
Determining the nature of the host galaxies of powerful ac-tive galactic nuclei (AGN) is of importance not only forimproving our understanding of different manifestations ofAGN activity, but also for exploring possible relationshipsbetween nuclear activity and the evolution of massive galax-ies. The recent affirmation that black-hole mass appears ap-proximately proportional to spheroid mass in nearby inac-
tive glaxies (Maggorian et al. 1998) has further strengthenedthe motivation for exploring the link between active AGNand the dynamical and spectral properties of their hosts.
Over the last few years, improvements in imaging res-olution offered by both space-based and ground-based op-tical/infrared telescopes has stimulated a great deal of re-search activity aimed at determining the basic structuralparameters (i.e. luminosity, size and morphological type)of the hosts of radio-loud quasars, radio-quiet quasars, and
c© 0000 RAS

2 L.A. Nolan et al. .
lower-luminosity X-ray-selected and optically-selected AGN(e.g. Disney et al. 1995; Hutchings & Morris 1995; Bahcallet al. 1997; Hooper et al. 1997; McLure et al. 1999, Schade etal. 2000). However, relatively little corresponding effort hasbeen invested in spectroscopic investigations of AGN hosts,despite the fact that this offers an independent way of clas-sifying these galaxies, as well as a means of estimating theage of their stellar populations.
Our own work in this field to date has focussed onthe investigation of the hosts of matched samples of radio-quiet quasars (RQQs), radio-loud quasars (RLQs) and radiogalaxies (RGs) at relatively modest redshift (z = 0.2). De-tails of these samples can be found in Dunlop et al. (1993).In brief, the sub-samples of quasars (i.e. RQQs and RLQs)have been selected to be indistinguishable in terms of theirtwo-dimensional distribution on the V − z plane, while thesub-samples of radio-loud AGN (i.e. RLQs and RGs) havebeen selected to be indistinguishable in terms of their two-dimensional distribution on the P5GHz − z plane (as well ashaving indistinguishable spectral-index distributions). Deepinfrared imaging of these samples (Dunlop et al. 1993; Tay-lor et al. 1996) has recently been complemented by deepWFPC2 HST optical imaging (McLure et al. 1999), the fi-nal results of which are reported by Dunlop et al. (2000).As well as demonstrating that, dynamically, the hosts ofall three types of luminous AGN appear indistinguishablefrom normal ellipticals, this work has enabled us to deducecrude spectral information on the host galaxies in the formof optical-infrared colours. However, broad-baseline colourinformation can clearly be most powerfully exploited if com-bined with detailed optical spectroscopy. Over the past fewyears we have therefore attempted to complement our imag-ing studies with a programme of deep optical off-nuclearspectroscopy of this same sample of AGN.
Details of the observed samples, spectroscopic obser-vations, and the basic properties of the observed off-nuclearspectra are given in a companion paper (Hughes et al. 2000).As discussed by Hughes et al. (2000), the key feature of thisstudy (other than its size, depth, and sample control) is thatwe have endeavoured to obtain spectra from positions fur-ther off-nucleus (≃ 5 arcsec) than previous workers, in anattempt to better minimize the need for accurate subtrac-tion of contaminating nuclear light. This approach was madepossible by our deep infrared imaging data, which allowedus to select slit positions ≃ 5 arcsec off-nucleus which stillintercepted the brighter isophotes of the host galaxies (slitpositions are shown, superimposed on the infrared images,in Hughes et al. 2000).
In this paper we present the results of attempting to fitthe resulting off-nuclear spectra with evolutionary synthesismodels of galaxy evolution. Our primary aim was to de-termine whether, in each host galaxy, the optical spectrumcould be explained by the same model as the optical-infraredcolour, and, if so, to derive an estimate of the age of the dy-namically dominant stellar population. However, this studyalso offered the prospect of determining whether the hosts ofdifferent classes of AGN differ in terms of their more recentstar-formation activity.
It is worth noting that our off-nuclear spectroscopy ob-viously does not enable us to say anything about the level ofstar-formation activity in the nucleus of a given host galaxy.Rather, any derived estimates of the level of star-formation
activity refer to the region probed by our observations ≃ 5arcsec off-nucleus. However, given the large scalelengths ofthe hosts, their relatively modest redshift, and the fact thatour spectra are derived from long-slit observations, it is rea-sonable to regard our conclusions as applying to fairly typ-ical regions, still located well within the bulk of the hostgalaxies under investigation.
The layout of this paper is as follows. In section 2 weprovide details of the adopted models, and how they havebeen fitted to the data. The results are presented in section3, along with detailed notes on the fitting of individual spec-tra. The implications of the model fits are then discussedin section 4, focussing on a comparison of the typical de-rived host-galaxy ages in the three AGN subsamples. Finallyour conclusions are summarized in section 5. The detailedmodel fits, along with corresponding chi-squared plots arepresented in Appendix A.
2 SPECTRAL FITTING.
The stellar population synthesis models adopted for age-dating the AGN host galaxy stellar populations are the so-lar metallicity, instantaneous starburst models of Jimenezet al. (2000). We have endeavoured to fit each off-nuclearhost galaxy optical spectrum by a combination of two sin-gle starburst components. For the first component, age isfitted as a free parameter, while for the second componentthe age is fixed at 0.1 Gyr, and the normalization relative tothe first component is the only free parameter. This dual-component approach was adopted because single-age modelsare not able to adequately represent the data, and becauseit allows the age of the dynamically dominant component tobe determined in a way which is not overly reliant on thelevel of ultraviolet flux which might be contributed eitherby a recent burst of star-formation, or by contamination ofthe slit by scattered light from the quasar nucleus. After ex-perimentation it was found that the spectral shape of theblue light was better represented by the 0.1 Gyr-old (solarmetallicity) model of Jimenez than by models of greater (in-termediate) age (e.g. 1 Gyr). Moreover, the further additionof a third intermediate age component, ≃ 1 Gyr, did notsignificantly improve the quality of the fits achieved.
In general, our data are of insufficient quality to tellwhether the component which dominates at λ ≃ 3000A re-ally is due to young stars, or is produced by direct or scat-tered quasar light. However, while the origin of the blue lightis obviously of some interest, it has little impact on the mainresults presented in this paper, which refer to the age of thedynamically dominant stellar population which dominatesthe spectrum from longward of the 4000A break through tothe near infrared. The robustness of the age determinationof the dominant population is demonstrated by comparingthe results of the two stellar-population model fit with theresults of a fit allowi ng for a nuclear contribution as well asthe two stellar populations.
The model parameters determined were therefore theage of the dominant stellar population, which we can reason-ably call the age of the galaxy, and the fraction, by (visible)baryonic mass, of the 0.1 Gyr component. For the fit in-cluding a nuclear contribution, the fraction of the total fluxcontributed by quasar light was a third parameter. The red
c© 0000 RAS, MNRAS 000, 000–000

The ages of quasar host galaxies. 3
end of each SED was further constrained by fitting R − K
colour simultaneously with the optical spectral energy dis-tribution. The fitting process is described below.
First, the observed off-nuclear spectra were corrected forredshift and transformed to the rest frame. They were thenrebinned to the spectral resolution of the model spectra. Therebinned flux is then the mean flux per unit wavelength inthe new bin and the statistical error on each new bin is thestandard error in this mean. The data were normalised to amean flux per unit wavelength of unity across the wavelengthrange 5020 − 5500 A.
The two-component model was built from theinstantaneous-burst stellar-population synthesis modelSEDs, so that
Fλ,age,α = const(αfλ,0.1 + (1 − α)fλ,age)
where fλ,age is the mean flux per unit wavelength in the bincentred on wavelength λ for a single burst model of age Gyr,α is the fraction by mass of the young (0.1 Gyr) component,and Fλ,age,α is then the new, mean twin stellar-populationflux per unit wavelength in the bin centred on wavelength λ
for a model of age Gyr. This composite spectrum was thennormalised in the same way as the observed spectra.
A χ2 fit was used to determine the age of the older stel-lar population and the mass-fraction, α, of the younger pop-ulation, for each host galaxy in the sample. The whole pa-rameter space was searched, with the best-fit values quotedbeing those parameter values at the point on the grid withthe minimum calculated χ2. The normalization of the modelspectra was allowed to float during the fitting process, to al-low the best-fitting continuum shape to be determined in anunbiased way.
The models were fitted across the observed (rest-frame)spectral range, within the wavelength ranges listed in Table1. As a result of the optimisation of the instruments withwhich the objects were observed, some of the galaxy spec-tra contain a ‘splice’ region where the red and blue end ofthe spectrum have been observed separately and then joinedtogether (see Hughes et al. (2000) for details). These spliceregions, defined in Table 1, were masked out of the fit inorder to guard against the fitting procedure being domi-nated by data-points whose flux calibration was potentiallyless robust. The main emission lines, present due to nu-clear light contamination or nebular emission from withinthe host, were also masked out, over the wavelength rangesgiven in Table 2.
The fit including a nuclear component was carried outin the same way, with the model flux in this case being
Fλ,age,α,η = const(αfλ,0.1 + (1 − α)fλ,age + ηf0054λ)
where η is the fraction contributed to the total model flux bythe nucleus, and f0054λ is the observed flux of the nucleus ofthe radio quiet quasar 0054+144. α is the fraction by massof the total stellar population contributed by the 0.1 Gyrpopulation. The wavelength range of the observed nuclearflux of 0054+144 is 3890−6950 A. This was extended to3500−8500 A by smooth extrapolation over the wavelengthranges 3500−3890 A and 6950−8500 A in order to carry outthe χ2 fit across the full wavelength range of the observedoff-nuclear spectr a.
R − K colour was fitted in both cases with a typicalerror of a few percent. The observed R − K colours for
the host galaxies are obtained from ukirt and hst images(McLure et al. , 1999, Dunlop et al. , 2000), and define thebasic shape of the host galaxy SED out to λ ≃ 2µm. Thecomposite model spectra were appropriately red-shifted be-fore calculating the colour, so that they could be comparedto the observed colours without introducing uncertaintiesin k-correction. The R band was simulated using the filterfunction, including system response and CCD quantum effi-ciency, for the hstwfpc2 F675W filter, and the K band wasreproduced using the filter data for the ircam3K Ocli filterat 77K combined with Mauna Kea atmosphere.
3 RESULTS
The plots showing fits to individual spectra and χ2as a func-tion of fitted age are given in Appendix A. The plots for thetwo-component fit are presented in Figure A1, and those forthe two stellar-component plus nuclear contribution are inFigure A2. The results for each object are summarized be-low, under their IAU names, with alternative names givenin parentheses. Objects are listed in order of increasing rightascension, within each AGN class (radio loud quasars, radioquiet quasars and radio galaxies). The telescopes with whichthe spectra were obtained are also noted; M4M denotes theMayall 4m Telescope at Kitt Peak, and WHT denotes the4.2m William Herschel Telescope on La Palma. Where thereare two spectra, the first plot is for the spectrum observedwith the Mayall 4m Telescope, and the second is for thespectrum taken with the William Herschel Telescope.
3.1 Notes on individual objects
3.1.1 Radio loud quasars
0137+012 (L1093) M4MThe models give a good fit at 13 Gyr, which is clearly im-proved by the inclusion of a small percentage (0.25%) ofyoung stars. There is no significant nuclear contribution tothe spectrum. HST imaging has shown that this host galaxyis a large elliptical, with a half-light radius re = 13 kpc(McLure et al. 1999).0736+017 (S0736+01, OI061) M4M,WHT0736+017 has been observed with both telescopes, and fitsto the two observed spectra are in good agreement. Bothindicate an age of 12 Gyr. The M4M spectrum requires asomewhat larger young blue population (0.75%) than theWHT spectrum (0.125%). This may be due to poorer seeingat Kitt Peak leading to slightly more nuclear contaminationof the slit, or to the use of slightly different slit positions atthe two telescopes. However, this difference between the ob-served spectra shortward of 4000A leaves the basic form ofχ2 versus age, and the best-fitting age of 12 Gyr unaffected.Inclusion of a nuclear component gives a much better fit tothe blue end of the M4M spectrum, without changing theage estimation. The size of the fitted young populations arein much better agreement in this case. HST imaging hasshown that morphologically this host galaxy is a large el-liptical, with a half-light radius re = 13 kpc (McLure et al.1999).1004+130 (S1004+13, OL107.7, 4C13.41) WHT
c© 0000 RAS, MNRAS 000, 000–000

4 L.A. Nolan et al. .
Table 1. Wavelength ranges of observed spectra, and splice regions which were excluded from the fitting process. All wavelengths arein the observed frame. M4M denotes the Mayall 4m Telescope at Kitt Peak, and WHT denotes the 4.2m William Herschel Telescope onLa Palma (see Hughes et al. (2000) for observational details).
IAU name Telescope Wavelength range / A Masked splice region / A
Radio Loud Quasars
0137+012 M4M 3890−69500736+017 M4M 3890−6950
WHT 3500−8000 6050−61501004+130 WHT 3500−8000 6050−61501020−103 M4M 3890−69501217+023 WHT 3500−7500 6000−61002135−147 WHT 3500−8500 6000−61002141+175 WHT 3500−8500 6000−61002247+140 M4M 3890−6950
WHT 3500−7500 6050−61502349−014 WHT 3500−8300 6000−6100
Radio Quiet Quasars
0054+144 M4M 3890−6950WHT 3500−8000 6000−6100
0157+001 M4M 3890−6950WHT 3500−8000 6050−6150
0204+292 WHT 3500−8000 6050−61500244+194 WHT 3500−8500 6000−61000923+201 WHT 3500−70001549+203 WHT 3500−8000 6050−61501635+119 WHT 3500−7800 6000−61002215−037 WHT 3500−8500 6000−61002344+184 M4M 3890−6950
WHT 3500−8500 6000−6100
Radio Galaxies
0230−027 WHT 3500−8500 6000−61000345+337 WHT 3500−8500 6000−61000917+459 WHT 3500−8500 6050−61501215−033 WHT 3500−7500 6000−61001330+022 M4M 3890−69502141+279 M4M 3890−6950
The spectrum of this luminous quasar certainly appears todisplay significant nuclear contamination below the 4000Abreak. As a result a relatively large young population is re-quired to attempt (not completely successfully) to reproducethe blue end of the spectrum . However, the models predictthat the underlying stellar population is old (12 Gyr). Al-lowing a nuclear component to be fit reproduces the blue endof the spectrum much more successfully, without changingthe best-fit age estimation. HST R-band imaging indicatesthe morphology of the host galaxy is dominated by a large(re = 8 kpc) spheroidal component, but subtraction of thisbest-fit model reveals two spiral-arm-type features on eitherside of the nucleus (McLure et al. 1999), which may be asso-ciated with the young stellar component required to explainthe spectrum.1020−103 (S1020−103, OL133) M4MThis object has the second bluest R − K of this sample,which leads to a much younger inferred age than the major-ity of the rest of the sample (5 Gyr), despite the presenceof a rather clear 4000A break in the optical spectrum. Agesgreater than ≃10 Gyr are rejected by Jimenez’ models, pri-marily on the basis of R−K colour. HST imaging has shown
that this host has an elliptical morphology, and a half-lightradius of re = 7 kpc. (Dunlop et al. 2000).1217+023 (S1217+02, UM492) WHTNuclear contamination can again be seen bluewards of4000A, with a correspondingly large young population pre-diction for the purely stellar population model, which stillfails to account for the very steep rise towards 3000A. Hence,a large nuclear contribution is required to reproduce the blueend of the spectrum. The fit achieved by the models suggeststhat the dominant population is old, with a best-fit age of 12Gyr. HST imaging has shown that this host has an ellipticalmorphology, and a half-light radius of re = 11 kpc. (Dunlopet al. 2000).2135+147 (S2135−14, PHL1657) WHT2135+147 has a very noisy spectrum, but a constrained fithas still been achieved, and an old population is preferred.2135+147 requires a large α, even when a nuclear contribu-tion is fitted. HST imaging has shown that this host has anelliptical morphology, and a half-light radius of re = 12 kpc.(Dunlop et al. 2000).2141+175 (OX169) WHTThis is another noisy spectrum, which has a relatively large
c© 0000 RAS, MNRAS 000, 000–000

The ages of quasar host galaxies. 5
quasar light contribution. An old population is again indi-cated by the model fits. ¿From optical and infrared imagingthis object is known to be complex, but HST images indi-cate that it is dominated by a moderate sized (re = 4 kpc)elliptical component (see McLure et al. (1999) for furtherdetails).2247+140 (PKS2247+14, 4C14.82) M4M,WHT2247+140 has been observed with both telescopes. Themodel fitting indicates an old population is required by bothspectra - although the two observations do not agree pre-cisely, the general level of agreement is very good, the twoχ2 plots have a very similar form, and the difference in χ2
between the alternative best-fitting ages of 8 Gyr and 12Gyr is very small. No significant nuclear contribution to theflux is present. HST imaging has shown that this host hasan elliptical morphology, and a half-light radius of re = 14kpc (Dunlop et al. 2000).2349−014 (PKS2349−01, PB5564) WHTThis is a very good fit to a good-quality spectrum, show-ing an obvious improvement when the low-level young pop-ulation is added. Jimenez’ models clearly predict that thedominant population is old, with a well-constrained age of12 Gyr. A very small nuclear contribution (η = 0.050) doesnot significantly change the results. HST imaging of thisobject strongly suggests that it is involved in a major in-teraction, with a massive tidal tail extending to the northof the galaxy. However, the dominant morphological com-ponent is a spheroid with a half-light radius of re = 18 kpc(McLure et al. 1999).
3.1.2 Radio quiet quasars
0054+144 (PHL909) M4M,WHTThere is evidence of relatively large contamination from nu-clear emission in the spectrum of this luminous quasar takenon both telescopes, and the age is not well-constrained, al-though the fit to the WHT spectrum derived from the mod-els again suggests an old age. The χ2 plots serve to empha-size how similar the two spectra of this object actually are(as also discussed by Hughes et al. 2000). Inclusion of a nu-clear component in the model better constrains the age andimproves the goodness of the fit. HST imaging of this objecthas shown that, morphologically, it is undoubtedly an ellip-tical galaxy, with a half-light radius re = 8 kpc (McLure etal. 1999).0157+001 (Mrk 1014) M4M,WHTThe age inferred from both the M4M and WHT spectrumof 0157+001 is again 12 Gyr. The apparently more nuclear-contaminated WHT spectrum does not give such a good fit,but 0157+001 is a complex object known to have extendedregions of nebular emission, and the slit positions used forthe two observations were not identical (Hughes et al. 2000).The age is much better constrained from the more passiveM4M spectrum, to which Jimenez’ models provide a verygood fit. Again, it seems that the nuclear contamination doesnot have a great influence on the predicted age of the oldpopulation, although the fit to the WHT spectrum is greatlyimproved by including a nuclear component in the model.Despite its apparent complexity in both ground-based andHST images, this host galaxy does again seem to be domi-
nated by a large spheroidal component, of half-light radiusre = 8 kpc (McLure et al. 1999).0204+292 (3C59) WHTJimenez’ models fit the spectrum of this object well, indi-cating an old underlying stellar population (> 6Gyr), witha best-fit age of 13 Gyr for the stellar population plus nu-clear component model, and a very small young population.HST imaging has shown this galaxy to be an elliptical, withhalf-light radius re = 9 kpc (Dunlop et al. 2000).0244+194 (MS 02448+19) WHTThe colour derived from the optical and infrared imagingof this host galaxy is rather blue ((R − K)obs = 2.34) andthis in part leads to a fairly young (5 Gyr) age prediction.However, the spectrum is very noisy, and, as indicated bythe very flat χ2 plot, the age is not strongly constrained. Nonuclear flux contamination is fitted. HST imaging has shownthis galaxy to have an elliptical morphology, with half-lightradius re = 9 kpc (McLure et al. 1999).0923+201 WHTThe spectrum of 0923+201 is noisy, and it also appears tohave some nuclear contamination. The fit is therefore im-proved by inclusion of a nuclear component. An old age isstrongly preferred by the form of the χ2 / age plot, witha best-fit value of 12 Gyr. HST imaging has shown thisgalaxy to have an elliptical morphology, with half-light ra-dius re = 8 kpc (McLure et al. 1999).1549+203 (1E15498+203, LB906, MS 15498+20) WHTThis is a good fit, which is clearly improved by the additionof the younger population. The slope of the χ2 / age plotstrongly indicates an old dominant population, with a best-fit age of 12 Gyr. There is very little evidence of nuclearcontamination. HST imaging has shown this galaxy to be amoderate-sized elliptical re = 5 kpc (Dunlop et al. 2000).1635+119 (MC1635+119, MC2) WHTThis is another very successful fit. An old age (12 Gyr) isinferred. Again, HST imaging has shown this galaxy to bea moderate-sized elliptical re = 6 kpc (McLure et al. 1999).2215−037 (MS 22152−03, EX2215−037) WHT2215−037 has a noisy spectrum, to which an acceptable fithas nevertheless been possible. Jimenez’ models suggest anold population, with a best-fitting age of 14 Gyr, but thisage is not well constrained. This is the only object wherethe inclusion of a nuclear contribution to the fitted spectrumsubstantially changes the age predicted of the dominant stel-lar population. However, the χ2 plots are very flat after anage of 5 Gyr, and the age is not strongly constrained in ei-ther case. HST imaging has shown this galaxy to have anelliptical morphology, with re = 7 kpc (Dunlop et al. 2000).2344+184 (E2344+184) M4M,WHT2344+184 has been observed with both telescopes, and thefits to both spectra are in good agreement − although, for-mally, two different ages are predicted. This is because theχ2 / age plots are fairly flat after about 8 Gyr. The fitsto both observations suggest an old dominant population,with a small young blue population improving the fit. Thereis no significant change in the predictions when a nuclearflux component is included in the model. HST imaging hasshown this to be one of the few host galaxies in the currentsample to be disc-dominated. However, the nuclear compo-nent is in fact sufficiently weak that this object should re-ally be classified as a Seyfert galaxy rather than an RQQ
c© 0000 RAS, MNRAS 000, 000–000
6 L.A. Nolan et al. .
Table 2. Rest frame emission lines masked out in the χ2 fit.
Masked region / A Emission line
3720 − 3735 OII 37273860 − 3880 NeIII 38694840 − 5020 OIII 4959, OIII 5007, Hβ 4861
(McLure et al. 1999).
3.1.3 Radio galaxies
0230−027 (PKS0230−027) WHT0230−027 has a very noisy spectrum, and the colour of thehost as derived from optical and infrared imaging is veryblue ((R−K)obs = 2.09). Consequently the best-fitting agederived using the models is 1 Gyr, with no younger com-ponent, but it is clear that little reliance can be placed onthe accuracy of this result. Allowing for a contribution fromquasar light does not improve the fit. HST imaging hasshown this galaxy to have an elliptical morphology, withre = 8 kpc (Dunlop et al. 2000).0345+337 (3C93.1) WHT0345+337 requires no young component or nuclear flux con-tribution at all, and an old age, of 12 Gyr, is clearly indicatedby the models. HST imaging has shown this galaxy to be alarge elliptical, with re = 13 kpc (McLure et al. 1999).0917+459 (3C219, 3C219.0) WHTThis is an excellent fit, with an old age produced by themodels (12 Gyr), together with a very small young popu-lation. HST imaging has shown this galaxy to be a largeelliptical, with re = 11 kpc (McLure et al. 1999).1215−033 WHTJimenez’ models suggest that the population of 1215−033 isuniversally old (best-fit age, 13 Gyr), with no young com-ponent or nuclear contribution required. HST imaging hasshown this galaxy to be a large elliptical, with re = 9 kpc(Dunlop et al. 2000).1330+022 (3C287.1) M4MAn excellent fit to the data is produced by Jimenez’ mod-els, indicating that the dominant population is old, with abest-fit age of 8 Gyr. HST imaging has shown this galaxy tobe a large elliptical, with re = 16 kpc (Dunlop et al. 2000).2141+279 (3C436) M4M,WHTThis is another very successful, and well-constrained fit, withan inferred age of 12 Gyr. HST imaging has shown thisgalaxy to be a large elliptical, with re = 21 kpc (McLureet al. 1999).
3.2 Sample overview
The results illustrated in Appendix A are summarised inTable 3. It should be noted that the 4000A break typicalof evolved stellar populations is present in the majority ofthe observed spectra (see Appendix A and Hughes et al.
2000), so we can be confident in fitting stellar populationmodels to the data. The plots clearly show that the additionof even a very small amount of secondary star formation to
the simple, near-instantaneous star-burst models reproducesthe blue end of the observed host galaxy spectra much moresuccessfully (and in most cases very well) than does a singlestellar population. Including a nuclear component furtherimproves the fit to the blue end, especially for those spectranot well fit by purely stellar light. At the same time, the redend of the spectra, plus the observed R−K colours generallyrequire that the underlying stellar populations are old.
The most meaningful output from the model fitting isa constraint on the minimum age of the host galaxies; theχ2 plots show that often the best-fit age is not strongly con-strained but the trend is clearly towards old (≥ 8 Gyr) stel-lar populations. In general, young populations are stronglyexcluded.
The peaks and troughs in χ2 as a function of model ageappear to be the result of real features of the populationevolution synthesis, rather than being due to, for example,poor sampling (Jimenez, private communication).
4 DISCUSSION
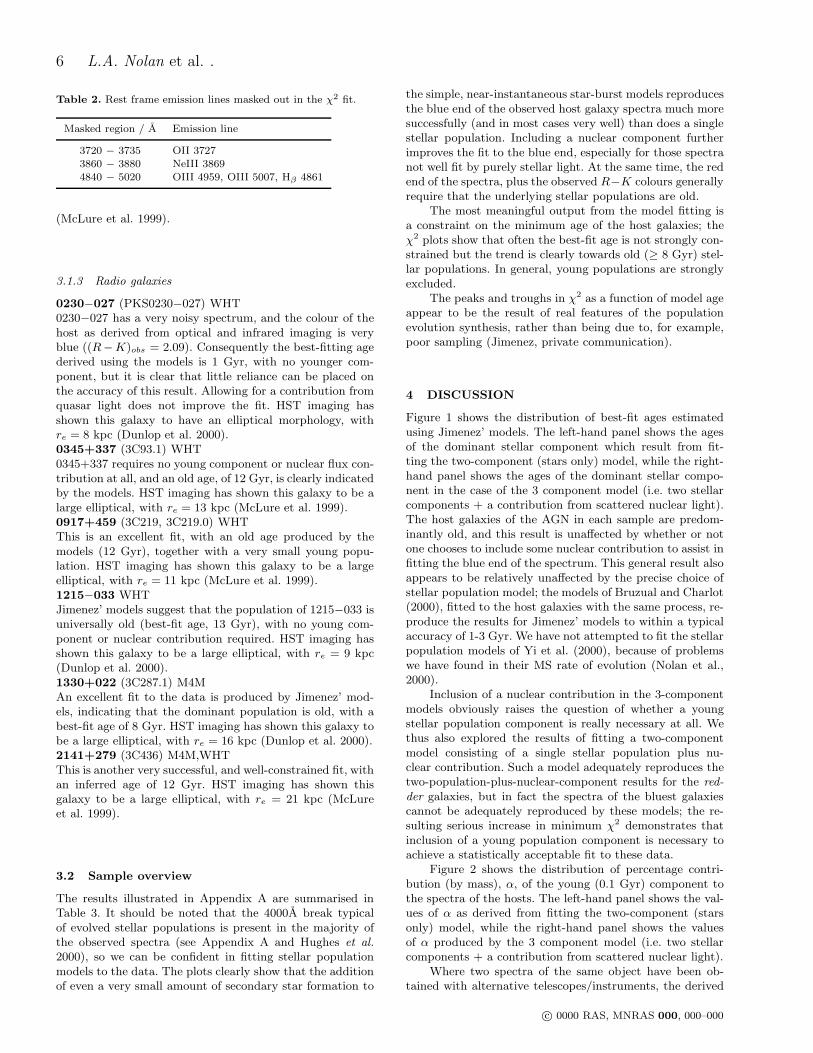
Figure 1 shows the distribution of best-fit ages estimatedusing Jimenez’ models. The left-hand panel shows the agesof the dominant stellar component which result from fit-ting the two-component (stars only) model, while the right-hand panel shows the ages of the dominant stellar compo-nent in the case of the 3 component model (i.e. two stellarcomponents + a contribution from scattered nuclear light).The host galaxies of the AGN in each sample are predom-inantly old, and this result is unaffected by whether or notone chooses to include some nuclear contribution to assist infitting the blue end of the spectrum. This general result alsoappears to be relatively unaffected by the precise choice ofstellar population model; the models of Bruzual and Charlot(2000), fitted to the host galaxies with the same process, re-produce the results for Jimenez’ models to within a typicalaccuracy of 1-3 Gyr. We have not attempted to fit the stellarpopulation models of Yi et al. (2000), because of problemswe have found in their MS rate of evolution (Nolan et al.,2000).
Inclusion of a nuclear contribution in the 3-componentmodels obviously raises the question of whether a youngstellar population component is really necessary at all. Wethus also explored the results of fitting a two-componentmodel consisting of a single stellar population plus nu-clear contribution. Such a model adequately reproduces thetwo-population-plus-nuclear-component results for the red-
der galaxies, but in fact the spectra of the bluest galaxiescannot be adequately reproduced by these models; the re-sulting serious increase in minimum χ2 demonstrates thatinclusion of a young population component is necessary toachieve a statistically acceptable fit to these data.
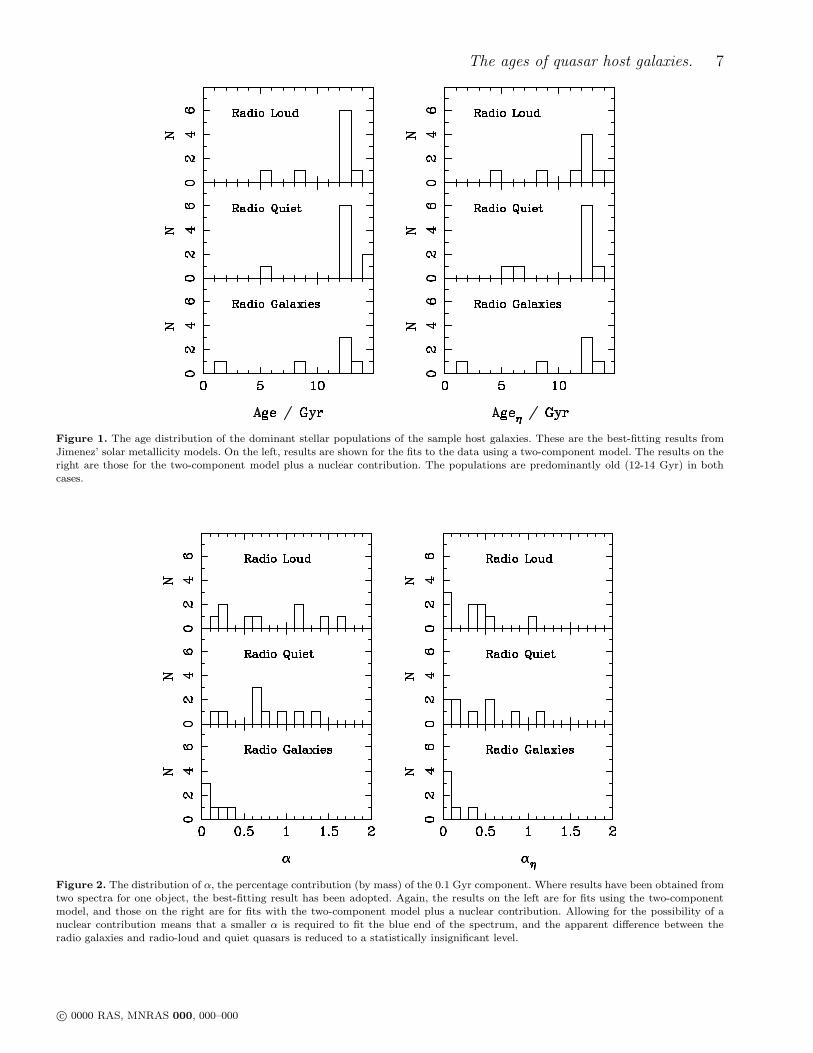
Figure 2 shows the distribution of percentage contri-bution (by mass), α, of the young (0.1 Gyr) component tothe spectra of the hosts. The left-hand panel shows the val-ues of α as derived from fitting the two-component (starsonly) model, while the right-hand panel shows the valuesof α produced by the 3 component model (i.e. two stellarcomponents + a contribution from scattered nuclear light).
Where two spectra of the same object have been ob-tained with alternative telescopes/instruments, the derived
c© 0000 RAS, MNRAS 000, 000–000
The ages of quasar host galaxies. 7
Figure 1. The age distribution of the dominant stellar populations of the sample host galaxies. These are the best-fitting results fromJimenez’ solar metallicity models. On the left, results are shown for the fits to the data using a two-component model. The results on theright are those for the two-component model plus a nuclear contribution. The populations are predominantly old (12-14 Gyr) in bothcases.
Figure 2. The distribution of α, the percentage contribution (by mass) of the 0.1 Gyr component. Where results have been obtained fromtwo spectra for one object, the best-fitting result has been adopted. Again, the results on the left are for fits using the two-componentmodel, and those on the right are for fits with the two-component model plus a nuclear contribution. Allowing for the possibility of anuclear contribution means that a smaller α is required to fit the blue end of the spectrum, and the apparent difference between theradio galaxies and radio-loud and quiet quasars is reduced to a statistically insignificant level.
c© 0000 RAS, MNRAS 000, 000–000

8 L.A. Nolan et al. .
IAU Telescope Best �t Best �t � �
�
Reduced Reduced (R�K)
fit
(R �K)
fit
�
(R �K)
obs
� z
name age/Gyr age
�
/Gyr �
2
�
2
�
Radio Loud Quasars
0137+012 M4M 13 13 0.2 0.3 3.7 3.6 2.88 2.88 2.82 0.025 0.258
0736+017 M4M 12 12 0.7 0.1 12.0 6.2 2.69 2.89 3.16 0.250 0.191
WHT 12 12 0.1 0.0 3.3 2.9 2.89 2.93 0.100
1004+130 WHT 12 12 1.4 0.4 5.4 2.2 2.65 2.96 3.01 0.350 0.240
1020�103 M4M 5 4 0.6 0.0 1.7 1.5 2.33 2.29 2.29 0.125 0.197
1217+023 WHT 12 12 1.1 0.0 11.8 4.9 2.71 3.10 3.18 0.350 0.240
2135�147 WHT 12 11 1.6 1.0 2.2 2.2 2.50 2.50 2.49 0.175 0.200
2141+175 WHT 12 14 1.1 0.5 3.2 2.5 2.66 2.69 2.69 0.500 0.213
2247+140 M4M 8 8 0.3 0.3 1.8 1.8 2.77 2.77 2.81 0.000 0.237
WHT 12 12 0.9 0.9 2.9 2.9 2.79 2.79 0.000
2349�014 WHT 12 12 0.5 0.4 3.3 3.0 2.71 2.75 2.87 0.050 0.173
Radio Quiet Quasars
0054+144 M4M 8 12 1.3 0.3 46.9 9.1 2.32 2.78 3.12 0.400 0.171
WHT 12 12 1.3 0.0 17.7 3.6 2.51 2.86 0.475
0157+001 M4M 12 12 1.1 1.1 5.9 5.8 2.52 2.52 2.83 0.025 0.164
WHT 12 12 1.6 0.9 41.0 10.9 2.41 2.58 0.250
0204+292 WHT 14 13 0.2 0.1 6.3 5.4 2.47 2.45 2.49 0.125 0.109
0244+194 WHT 5 5 0.1 0.1 2.6 2.6 2.37 2.37 2.34 0.000 0.176
0923+201 WHT 12 12 0.6 0.0 5.6 4.0 2.72 2.92 3.24 0.375 0.190
1549+203 WHT 12 12 0.6 0.5 3.8 3.8 2.90 2.95 3.37 0.050 0.250
1635+119 WHT 12 12 0.7 0.5 6.7 6.4 2.57 2.63 3.27 0.100 0.146
2215�037 WHT 14 6 0.6 0.3 2.4 2.4 2.70 2.69 2.68 0.175 0.241
2344+184 M4M 8 11 0.4 0.4 4.8 4.9 2.43 2.57 2.51 0.025 0.138
WHT 12 12 0.9 0.8 2.1 2.0 2.51 2.54 0.075
Radio Galaxies
0230�027 WHT 1 1 0.0 0.0 2.0 2.0 2.02 2.02 2.08 0.000 0.230
0345+337 WHT 12 12 0.0 0.0 2.7 2.7 3.13 3.13 3.62 0.000 0.244
0917+459 WHT 12 12 0.2 0.3 4.7 4.6 2.79 2.79 3.42 0.025 0.174
1215�033 WHT 13 13 0.0 0.0 3.4 3.4 2.74 2.74 2.56 0.000 0.184
1330+022 M4M 8 8 0.3 0.1 2.9 2.8 2.70 2.74 2.79 0.050 0.215
2141+279 M4M 12 12 0.1 0.0 3.1 2.5 3.27 3.01 3.25 0.025 0.215
Table 3. Results from the simultaneous fitting to the AGN host sample of the two-component model spectra (using the solar metallicitymodels of Jimenez et al. 2000) and R − K colour. α is the percentage young population, by mass. Results are also p resented for thefits including the subtraction of a nuclear component from the observed spectrum. η is the fraction of nuclear flux subtracted, and thecorresponding results are denoted by the subscript η.
ages of the dominant stellar componenets are reproducedreassuringly well. There are, however, small discrepancies inthe estimated percentage of young population present (seeTable 3). This effect is suggestive that at least some of theblue light might be due to a scattered nuclear contribution,the strength of which would be highly dependent on the see-ing at the time of observation, and on the precise repeatabil-ity of slit placement relative to the galaxy core. Interestingly,when a nuclear component is included with the stellar fluxmodel, an even smaller percentage of 0.1 Gyr stellar popula-tion is required to fit the blue end of the spectra, and (moreimportantly) the difference in α between two spectra of thesame object is generally reduced. This provides further sup-port for the suggestion that some of the bluest quasar hostspectra remain contaminated by quasar light at the short-est wavelengths, and indicates that the right-hand panel ofFigure 2 provides a more realistic estimate of the level ofon-going star-formation in the host galaxies. While this fig-ure still appears to suggest that at least some quasar hostsdisplay higher levels of ongoing star-fomration activity thando radio galaxies, statistically this ‘result’ is not significant.
There are three galaxies which have very low age esti-mates, namely 0230−027, 0244+1944 and 1020−103. Theseobjects have the bluest observed R − K colours, so it may
be expected that the fitted ages would be younger than therest of the sample, and that these populations are genuinelyyoung. As discussed above, it may be that these objectsare bluer because of scattered nuclear light contaminatingthe host galaxy spectrum. However, it seems unlikely thattheir fitted ages are low simply because of this, because else-where in our sample, where two spectra have been obtainedof the same object, the amount of nuclear contaminationpresent does not significantly affect the age estimation (e.g.0736+017 and 0157+001). Moreover, the inclusion of a nu-clear component to the fit does not change the estimatedage distribution of the host galaxies. If these ages are inerror, then a more likely explanation, supported by the rel-ative compactness of these particular host galaxies, is thatnuclear and host contributions have been imperfectly sepa-rated in the K-band images, leading to an under-estimateof the near-infrared luminosity of the host.
The result of the three-component fitting process whichalso allows a contribution from scattered nuclear light isthat there are in fact only 3 host galaxies in the sample forwhich there is evidence that α > 0.5. One of these is thehost of a radio-loud quasar (2135−147) but, as can be seenfrom Fig A2, this spectrum is one of the poorest (along with0230−027, the only apparently young radio galaxy) in the
c© 0000 RAS, MNRAS 000, 000–000

The ages of quasar host galaxies. 9
entire dataset. The 2 convincing cases are both the hosts ofradio-quiet quasars, namely 0157+001 and 2344+184.
Within the somewhat larger sample of 13 RQQs im-aged with the HST by McLure et al. (1999) and Dunlopet al. (2000), 4 objects showed evidence for a disk compo-nent in addition to a bulge, namely 0052+251, 0157+001,0257+024, and 2344+184. Since we do not possess spectra of0052+251 and 0257+024 this means that there is a 1:1 corre-spondence between the objects which we have identified onthe basis of this spectroscopic study as having recent star-formation activity, and those which would be highlighted onthe basis of HST imaging as possessing a significant diskcomponent. This straightforward match clearly provides uswith considerable confidence that the spectral decomposi-tion attempted here has been effective and robust. Finallywe note that it is almost certainly significant that 0157+001,which has the largest starburst component (α = 1.1) basedon this spectroscopic analysis, is also the only IRAS sourcein the sample.
5 CONCLUSIONS
We conclude that the hosts of all three major classes of AGNcontain predominantly old stellar populations (≃ 11 Gyr)by z ≃ 0.2. This agrees well with the results of McLureet al. (1999), and Dunlop et al. (2000) who compare hostgalaxy morphologies, luminosities, scale lengths and coloursin the same sample, and conclude that the hosts are, tofirst order, indistinguishable from ‘normal’ quiescent giantelliptical galaxies.
The best-fitting age of the dominant stellar populationis not a function of AGN class. For the purely stellar models,the fitted percentage contribution of the blue componentis, however, greater in the quasar hosts than in the radiogalaxies; the median values are 0.6% for the 9 radio-loudquasars, 0.6% for the 9 radio-quiet quasars, and 0.05% forthe 6 radio galaxies. However, when a nuclear componentis included, the median values are 0.3% for the radio-loudquasars, 0.3% for the radio-quiet quasars, and 0.00% for theradio galaxies. Performing a Kolmogorov-Smirnov test onthese results yields a probability greater than 0.2 that thepercentage of young stellar population in host galaxies is infact also not a function of AGN class.
These results strongly support the conclusion that thehost galaxies of all three major classes of AGN are massiveellipticals, dominated by old stellar populations.
ACKNOWLEDGEMENTS
Louisa Nolan acknowledges the support provided by theaward of a PPARC Studentship. Marek Kukula and DavidHughes acknowledge the support provided by the awardPPARC PDRAs, while Raul Jimenez acknowledges theaward of a PPARC Advanced Fellowship. We thank ananonymous referee for perceptive comments which helpedto clarify the robustness of our results and improved theclarity of the paper.REFERENCES
Bahcall J.N., Kirhakos S., Saxe D.H., Schneider D.P., 1997,
ApJ, 479, 642Bruzual A.G., Charlot S., 2000, in preparationDisney M.J. et al., 1995, Nat, 376, 150Dunlop J.S., 2000, In: ‘The Hy-Redshift Universe: GalaxyFormation and Evolution at High Redshift’, ASP Conf. Ser.,Vol 193, eds. A.J. Bunker & W.J.M. van Breugel, in press,(astro-ph/9912380)Dunlop J.S., McLure R.J., Kukula M.J., Baum S.A., O’DeaC.P., Hughes D.H., 2000, MNRAS, in pressDunlop J.S., Taylor G.L., Hughes D.H., Robson E.I., 1993,MNRAS, 264, 455Hooper E.J., Impey C.D., Foltz C.B., 1997, ApJ, 480, L95Hughes D. H., Kukula M.J., Dunlop J.S., Boroson T., 2000,MNRAS, in pressHutchings J.B., Morris S.C., 1995, AJ, 109, 1541Jimenez R., Dunlop J.S., Peacock J.A., Padoan P., MacDon-ald J., Jørgensen U.G., 2000, MNRAS, in pressJimenez R., Padoan P., Matteucci F., Heavens A.F., 1998,MNRAS, 299, 123Magorrian J., et al., 1998, AJ, 115, 2285McLure R.J., Kukula M.J., Dunlop J.S., Baum S.A.,O’Dea C.P., Hughes D.H., 1999, MNRAS, in press, (astro-ph/9809030)Nolan L.A., Dunlop J.S., Jimenez R., 2000, MNRAS,submitted, (astro-ph/0004325) Schade, D.J., Boyle, B.J.,Letawsky, M., 2000, MNRAS, in pressTaylor G.T., Dunlop J.S., Hughes D.H., Robson E.I., 1996,MNRAS, 283, 930Yi S., Brown T.M., Heap S., Hubeny I., Landsman W., LanzT., Sweigart A., 2000, ApJ, submitted
APPENDIX A: SPECTRA AND χ2 PLOTS
The fits for all the off-nuclear spectra are given. In Fig A1,the rest frame spectra are in the first column (black), withthe best-fitting two-component model spectra (Jimenez etal., 2000) superimposed (green). The spectra of the single-aged old popula tion (red) is given for comparison. In FigA2, the fits allowing for an additional contribution to theflux from the nucleus are presented. The key is the same asin A1, with the additional blue line representing the best-fitting two-component model flux plus the nuclear flux con-tribution.
The second column of plots shows the χ2evolution withage for the dominant older population. The third columnshows the best-fit χ2as a function of percentage young pop-ulation, α, for fixed ages of the dominant component. Themodels have solar metallicity. The subscript η denotes re-sults obtained by including the nuclear contribution.
Where there are two spectra of the same object, thespectrum given first is the one observed on the Mayall 4mTelescope, and the second is that observed using the WilliamHerschel Telescope.The data for the following objects havebeen smoothed using a Han ning function: 2135+147 (RLQ),2141+175 (RLQ), 0244+194 (RQQ), 0923+201 (RQQ),1549+203 (RQQ), 2215-037 (RQQ), 0230-027 (RG) and0345+337 (RG).
c© 0000 RAS, MNRAS 000, 000–000

10 L.A. Nolan et al. .
Radio Loud Quasars
Figure A1. Model fits to the off-nuclear rest frame spectra, for each object, with the corresponding χ2 plots. The rest-frame host-galaxyspectra are in the first column (lightest grey), with the best-fitting two-component model spectra (Jimenez et al., 2000) superimposed(black). The spectra of the single-aged old population (mid-grey, lowest line) is given for comparison. The second column shows theχ2evolution with age for the dominant older population and the third column shows the best-fit χ2 as a function of percentage youngpopulation, α, for fixed ages of the dominant component. All models have solar metallicity. Where there are two spectra of the sameobject, the spectrum given first is the one observed on the Mayall 4m Telescope, and the second is that observed using the WilliamHerschel Telescope. The data for the following objects have been smoothed using a Hanning function: 2135+147 (RLQ), 2141+175(RLQ), 0244+194 (RQQ), 0923+201 (RQQ), 1549+203 (RQQ), 2215−037 (RQQ), 0230−027 (RG) and 0345+337 (RG).
c© 0000 RAS, MNRAS 000, 000–000

The ages of quasar host galaxies. 11
Radio Loud Quasars
Figure A1. Model fits to the off-nuclear rest frame spectra, continued.
c© 0000 RAS, MNRAS 000, 000–000

12 L.A. Nolan et al. .
Radio Loud Quasars
Figure A1. Model fits to the off-nuclear rest frame spectra, continued.
c© 0000 RAS, MNRAS 000, 000–000

The ages of quasar host galaxies. 13
Radio Quiet Quasars
Figure A1. Model fits to the off-nuclear rest frame spectra, continued.
c© 0000 RAS, MNRAS 000, 000–000

14 L.A. Nolan et al. .
Radio Quiet Quasars
Figure A1. Model fits to the off-nuclear rest frame spectra, continued.
c© 0000 RAS, MNRAS 000, 000–000

The ages of quasar host galaxies. 15
Radio Quiet Quasars
Figure A1. Model fits to the off-nuclear rest frame spectra, continued.
c© 0000 RAS, MNRAS 000, 000–000

16 L.A. Nolan et al. .
Radio Galaxies
Figure A1. Model fits to the off-nuclear rest frame spectra, continued.
c© 0000 RAS, MNRAS 000, 000–000

The ages of quasar host galaxies. 17
Radio Galaxies
Figure A1. Model fits to the off-nuclear rest frame spectra, continued.
c© 0000 RAS, MNRAS 000, 000–000

18 L.A. Nolan et al. .
Radio Loud Quasars
Figure A2. Model fits to the off-nuclear rest frame spectra, including the modelling of a nuclear contribution, for each object, with thecorresponding χ2 plots. The rest frame host galaxy spectra are in the first column (light grey), with the best-fitting two-component modelflux plus the nuclear flux contribution (black) and the best-fitting two-component model spectra (Jimenez et al. 2000) superimposed(mid grey). As in Fig A1, the spectra of the single-aged old population (dotted line) is given for comparison. The second column showsthe χ2evolution with age for the dominant older population and the third column shows the best-fit χ2 as a function of percentage youngpopulation, α, for fixed ages of the dominant component. The subscript η denotes results obtained by including the nuclear contribution.All models have solar metallicity. Where there are two spectra of the same object, the spectrum given first is the one observed on theMayall 4m Telescope, and the second is that observed using the William Herschel Telescope. The data for the following objects havebeen smoothed using a Hanning function: 2135+147 (RLQ), 2141+175 (RLQ), 0244+194 (RQQ), 0923+201 (RQQ), 1549+203 (RQQ),2215−037 (RQQ), 0230−027 (RG) and 0345+337 (RG).
c© 0000 RAS, MNRAS 000, 000–000

The ages of quasar host galaxies. 19
Radio Loud Quasars
Figure A2. Model fits to the off-nuclear rest frame spectra, including the modelling of a nuclear contribution, continued.
c© 0000 RAS, MNRAS 000, 000–000

20 L.A. Nolan et al. .
Radio Loud Quasars
Figure A2. Model fits to the off-nuclear rest frame spectra, including the modelling of a nuclear contribution, continued.
c© 0000 RAS, MNRAS 000, 000–000

The ages of quasar host galaxies. 21
Radio Quiet Quasars
Figure A2. Model fits to the off-nuclear rest frame spectra, including the modelling of a nuclear contribution, continued.
c© 0000 RAS, MNRAS 000, 000–000

22 L.A. Nolan et al. .
Radio Quiet Quasars
Figure A2. Model fits to the off-nuclear rest frame spectra, including the modelling of a nuclear contribution, continued.
c© 0000 RAS, MNRAS 000, 000–000

The ages of quasar host galaxies. 23
Radio Quiet Quasars
Figure A2. Model fits to the off-nuclear rest frame spectra, including the modelling of a nuclear contribution, continued.
c© 0000 RAS, MNRAS 000, 000–000

24 L.A. Nolan et al. .
Radio Galaxies
Figure A2. Model fits to the off-nuclear rest frame spectra, including the modelling of a nuclear contribution, continued.
c© 0000 RAS, MNRAS 000, 000–000

The ages of quasar host galaxies. 25
Radio Galaxies
Figure A2. Model fits to the off-nuclear rest frame spectra, including the modelling of a nuclear contribution, continued.
c© 0000 RAS, MNRAS 000, 000–000