Illusory Spirals and Loops in Crystal Growth, Proc. Natl. Acad. Sci. U S A. 2013, 110(43): 17195.
Upload
independentCategory
view
0download
0
arX
iv:a
stro
-ph/
0011
218v
1 1
0 N
ov 2
000
Luminous compact galaxies at intermediate redshifts: progenitors
of bulges of massive spirals ?
Francois Hammer1 and Nicolas GruelDAEC, Observatoire de Paris-Meudon, 92195 Meudon, France
Trinh X. ThuanDepartment of Astronomy, University of Virginia, Charlottesville, VA 22903
Hector FloresService d’Astrophysique, CEA-Saclay, 91191 Gif-sur-Yvette, France
and
Leopoldo InfanteUniversidad Catolica, Santiago, Chile
ABSTRACT
VLT spectra of 14 luminous compact galaxies (LCGs) reveal strong metallic absorptionline sytems as well as narrow and intense emission lines. Their gas extinction is found tobe large (AV ∼ 1.5 mag) leading to an upward revision of their star formation rate (SFR)to an average value of ∼ 40 M⊙yr−1. Large extinction values are also supported by thelarge rate of detection in one field observed by ISO. Gas metal abundances in LCGs haveabout half the solar value. LCG absorption spectra can be synthesized with a mix of a fewGyr old and relatively metal-rich (generally solar to over-solar values) stellar population anda younger stellar population (< 5×10⁸ years) having a metal abundance similar to that of the gas.
We argue that LCGs are the progenitors of present-day spiral bulges. LCGs have massesand light concentrations similar to those of present-day bulges. They could have been formedentirely during a period of a few Gyr prior to the epoch of their observations if the star formationhas been sustained at the observed rate. As in present-day galactic bulges, LCG stars show awide range of abundances. Thus, observing LCGs allows us to directly witness an importantstage in the formation of a massive galaxy, the building of the bulge prior to that of the disk.The gas needed to feed the observed star formation is likely to be falling in from the outskirtsof the galaxy, being tidally pulled out from interacting companion galaxies. An infall scenarionaturally explains the gas metal abundance which is generally lower than that of the older stellarcomponent. At least for the strongest star-forming LCGs, there is clear imaging evidence for thepresence of companions. Some LCGs also show evidence for the beginning of a disk formation.If the above scenario holds for most LCGs, we estimate that at least 20% of present-day spiralgalaxies have formed the bulk of their stars at relatively recent epochs, during the last 8-9 Gyr,at redshifts less than ∼ 1. Since they are heavily extincted, we predict their IR luminosities to berelatively large, around LIR=1011 L⊙, i.e. near or slightly below the luminosities of the galaxiesdetected by ISO in the same redshift range. Taking into account the integrated IR luminosity ofthe LCG galaxy population can lead to a significant upward revision of the cosmic SFR densityin the redshift range from 0.5 to 1.
Subject headings: galaxies: formation, galaxies: bulges1
1. Introduction
The evolution of UV and IR luminosity densi-ties can be understood as a decrease by a factorof ∼ 6 of the global star formation density fromthe epoch corresponding to redshift z=1 to thepresent epoch (Lilly et al. 1996; Flores et al.1999). These luminosity densities evolve similarlyand contribute equally to the star formation inthat redshift range, if one assumes that the shapesof the UV and IR luminosity functions to be sim-ilar to the local ones (Hammer 1999). Integrationof the derived global star formation implies thatbetween half and two thirds of the present-daystars have been formed since z=1. This is some-what in contradiction with the primordial collapsescenario in which the most massive galaxies wereformed at much earlier epochs, at redshifts largerthan ∼ 3 (e.g. Renzini and Cimatti 1999). Thelatter scenario is supported by the apparent non-evolution in the number density of large disks(Lilly et al. 1998), and by its success in reproduc-ing galactic disk evolution with chemical evolutionmodels normalized to local galaxies (Boissier andPrantzos 2000).The study of the luminosity density evolutionrelies on observations of luminous galaxies withMB < -20 in the optical, and with Lbol > 2 ×
1011 L⊙ in the IR. The two main galaxy pop-ulations responsible for the observed decline inthe star formation density are, in decreasing im-portance, the luminous IR galaxies (Flores et al.1999) and the luminous compact galaxies (LCG)(Guzman et al. 1997; Lilly et al. 1998). Theformer are generally large and massive galaxiesfound mostly in interacting systems (Hammer,1999), and which show star formation rates (SFR)exceeding 50 M⊙yr−1. They represent ∼ 4% ofthe field galaxy population. The latter are muchmore numerous and contribute to more than 40%of the UV luminosity density at z∼ 1 (Guzman etal. 1997; Hammer & Flores 1998). They consti-tute the most rapidly evolving galaxy populationseen in the UV. The properties of these LCGsare still largely unknown. They are sometimesso compact that their nucleus is barely resolvedin the WFPC2 HST images, which prevents theirclassification on the basis of their luminosity pro-
1Visiting Astronomer, Very Large Telescope, operated
by The European Southern Observatory
file.
Koo & Kron (1981) first drew attention tothese compact galaxies during their search forfaint QSOs on the basis of colors and compact-ness. They identified a sparse population (thesurface density is ∼ 30 sources per square degree)of very blue compact galaxies with z ≤ 0.7 andexhibiting narrow emission lines. Using the KeckHIRES spectrograph, Koo et al. (1995) demon-strated that the emission lines of LCGs have aGaussian profile, and suggested that they may beprogenitors of local spheroidal galaxies throughfading by ∼ 4 to 5 magnitudes. More recently,Guzman et al. (1997) and Phillips et al. (1997)have identified a large population of emission-linecompact galaxies in the flanking fields around theHubble Deep Field (HDF, Williams et al. 1996) atz ≤ 1, comprising ∼ 20% of the field galaxy pop-ulation. They found the [OII]λ3727 emission-linevelocity widths of the compact galaxies to rangebetween 35 and 150 km s−1 (Phillips et al. 1997),comparable to those of local dwarf galaxies, al-though the compact galaxies are 10 to 100 hundredtimes more luminous (up to a few L⋆). The sim-ilarities between the HDF compact galaxies andthose from Koo and Kron (1981) have led Guz-man (1999) to suggest that blue compact galaxiesat intermediate redshifts may be the progenitorsof local spheroidal or irregular galaxies throughfading by ≤ 4 magnitudes. If true, according toGuzman (1999), these should have extremely lowM/L ratio, and this scenario would imply a se-vere downwards revision of the amount of starformation at z∼ 1, since the baryonic content inirregulars (or spheroidals) is very small (Fukugitaet al. 1998).
We develop in this paper a different scenariofor the nature of the brightest LCGs, which aremajor contributors to the observed decline of starformation density since z=1. In our picture, LCGsare not the progenitors of present-day spheroidaland irregular galaxies, but rather of today’s spiralbulges which built up gradually over time by a se-ries of mergers of smaller units. There have beenseveral previous observations that have hinted atthat scenario, but their meaning was not realized
2
at the time. Thus, Phillips and al. (1997) foundthat a large fraction of galaxies selected by theircompactness appeared to be small but bright spi-rals. Even adding a color criterion is not sufficientto distinguish between old and young stellar pop-ulations: Schade et al. (1999) found that fully athird of the distant ellipticals they studied showstar formation and colors as blue as those of bluecompact galaxies. The merging scenario comesnaturally as the merging rate was about ten timeshigher at z=1 than it is today (Le Fevre et al.2000). Moreover, Guzman (1999) and Hammer(1999) have noticed that a large fraction of com-pact galaxies selected from the HDF and Canada-France redshift survey (CFRS) fields are in inter-acting systems, with the presence of complex anddistorted features surrounding their cores. Finally,the LCGs in the CFRS fields have near-IR andvisible colors very similar to those of other lumi-nous non-dwarf galaxies, with values apparentlynot consistent with those produced by a strongand short burst of star formation in a low-mass ob-ject (Hammer et al. 1997). We present next newobservational data which support and sharpen theabove scenario.In the following, h50=H0/50 and if not specifiedwe adopt h50=1 and q0=0.5.
2. The sample: selection criteria
Our LCG sample was selected from two galaxyfields studied in the CFRS: the CFRS 0300+00(Hammer et al. 1995) and the CFRS 2230+00(Lilly et al. 1995) fields. To define our sample,we apply 3 selection criteria. First is the com-pactness criterion, as determined from deep HSTimages (see Brinchmann et al. 1998), or from deepground-based images obtained by the CFRS team,with an image quality better than 0”.8 FWHMand a pixel size of 0.207”. It is based on either asmall size:
r1/2 ≤ 5 h−1
50 kpc, where r1/2 is the half-lightradius and h50 the Hubble constant in units of 50km s−1 Mpc−1
or on light concentration as defined by the pa-rameter:
δ I = mI(15h−150 kpc) - mI(5h−1
50 kpc) ≤ 0.75 mag(Hammer and Flores 1998).
Imagery from HST has been analysed with SEx-tractor software package (Bertin and Arnouts,1996). The detection threshold was set to3.5 σand a 35 pixel annulus was used for sampling thebackground. The minimum contrast parameter fordeblending was set to 0.005, and for each sourcewith an identified companion at more than 2” (18kpc at z=0.5), an image with a mask superimposedon the companion has been generated. The back-ground level at the mask location has been set us-ing the background mean level, and the mask sizewas set from the derived Kron radius of the com-panion (Bertin and Arnouts 1996). This proce-dure has the advantage of eliminating systematicbiases against compact sources with companionsbeyond 2”. For HST images, 15 apertures with di-ameters varying from 0”.2 to 3”.0 with increasingsteps of 0”.2, were used to derive aperture pho-tometry. The half-light radius has been derivedassuming that the isophotal magnitude generatedby SExtractor was a good approximation to thetotal magnitude of the source. Calculation of thelight concentration parameter was done after in-terpolating to the luminosities enclosed within the5 kpc and 15 kpc radii. Ground-based images wereanalyzed in a similar way, but a 20-pixel annuluswas used for background sampling. Another prob-lem with images obtained from the ground comefrom background fluctuations. For the majorityof the objects, aperture magnitudes are increasingsmoothly with aperture radius. Those that show amagnitude decrease larger than the measurementerrors have been excluded from the sample.
The above selection criteria are equivalent fora face-on disk or a spheroidal component witha r1/4 profile since for a r1/2 ≤ 5 kpc source,
mI(15h−1
50 kpc) is a good approximation of the to-tal source luminosity. Figure 1 demonstrates thisequivalence for sources imaged with the HST. Thebottom panel shows that the light concentrationscalculated from HST and CFHT images for thesame object correlate well, the correlation coeffi-cient being 0.73. We note however that the aver-age value of δ I from ground images is larger by0.1 magnitude as compared to that from the HSTimages. This can be easily explained by the broad-ening of the profile due to seeing conditions, andwe have applied a slight empirical correction to the
3
values derived from the ground. The correlationbetween ground and HST data is found to be bet-ter for the concentration parameter (upper panel)than for the half-light radius. We interpret this tobe related to the uncertainties in the calculationof the isophotal magnitudes for ground-based im-ages, because background fluctuations affect themmore than aperture magnitudes. As a result, wehave decided to adopt the concentration parame-ter as the selection criterion for compact galaxies.Examination of images of the selected compactgalaxies shows that the compactness selection cri-terion has also picked out a few highly inclineddisks with a large major axis extent. These wereremoved from the sample using the axis ratio cal-culated by SExtractor. One can also notice fromFigure 1 that ∼ 20% of the sources are foundto be compact on the basis of their HST pho-tometry, although they appear to be extendedfrom the ground. Examination of their imagesshow that they are mostly sources with nearbycompanions (within 3”) for which the deblend-ing procedure applied to ground-based images hasfailed. In other words, our procedure applied toground-based images appears to be more restric-tive than when applied to higher spatial resolutionHST images. A selection from ground images willinevitably generate a sample of galaxies slightlybiased against galaxies with nearby companions.
Second, we apply a luminosity and redshift cri-terion. Only galaxies with MAB(B) ≤ -20, andin the redshift range from 0.45 to 0.8 are in-cluded. The luminosity cut-off is motivated by thefact that the reported evolution of the rest-frameUV luminosity density is based on observations ofgalaxies with MAB(B) ≤ -20 (Lilly et al. 1996),while the redshift range is the one in which theCFRS is considered complete for luminous galax-ies (see Hammer et al. 1997).
Third, we include only LCGs with known[OII]λ3727 emission (W0([OII]) ≥ 15 A), becausewe wish to compare the gas properties to those ofthe underlying stellar population.
Applying these three selection criteria to the2 CFRS fields yields a sample of 59 galaxies, ofwhich we have chosen a small representative sub-sample of 14 LCGs for a first investigation. They
represent ∼ 23% of the MAB(B) ≤ -20 galaxy pop-ulation in the redshift range defined above. Theirglobal properties, including B and K luminositiesand compactness and concentration parameters,are given in Table 1.
Their apparent magnitudes range from I = 20.5mag to 22 mag, and they possess colors spanningthe entire morphological sequence from Irr to Sbcgalaxies. They are very similar in their proper-ties to the brightest ∼ 25% of the blue compactgalaxies selected by Guzman et al. (1997) in theHubble Deep Field at 0.1<z<1.3. However mostof the brightest compact galaxies of Guzman etal. have higher redshifts than the LCGs consid-ered here, which complicates a direct comparison.
3. Observations and data reduction
Spectrophotometric observations of the 14LCGs were obtained during one night (1999 Au-gust 10-11) with the European Southern Obser-vatory 8m VLT/UT1 using the FORS1/R600 andI600 spectrograph at a resolution of 5A and cov-ering the wavelength range from 5500 to 9200A.This ensures the coverage from [OII]λ3727 to[OIII]λ5007 in the rest-frame spectrum for a largefraction of the targets. Additional exposures havebeen done through service observing mode, duringJuly and August 2000. Each galaxy was observedthrough a 1” slit (Figure 2) in 5 to 7 exposures of∼ 40 mn each, using the ”shift and add” techniqueto ensure proper removal of cosmic rays and of pos-sible CCD defaults. Spectra were extracted andwavelength-calibrated using the IRAF1 package.Flux calibration was done using 15 min exposuresof three different photometric standard stars. Toensure the reliability of the data, all spectrum ex-tractions as well as lines measurements using theSPLOT program were performed independentlyby two of us (F.H. and N.G.).
To disentangle the continuum properties fromthose of the emission lines, we have adopted thefollowing specific procedure for all spectra. Weapplied a two-step smoothing (first by 7 pixelsand then by 15 pixels) to the continuum, whileexcluding from the smoothing the well identified
1IRAF is distributed by National Optical Astronomical Ob-
servatories, which is operated by the Association of Univer-
sities for Research in Astronomy, Inc., under cooperative
agreement with the National Science Foundation.
4
and mostly unresolved emission lines to keep theiroriginal spectral resolution. This smoothing pro-cedure has the advantage of not affecting the shapeof the continuum and the narrow emission lines,while revealing the more prominent absorptionfeatures. For the latter the nominal spectral res-olution is ∼ 10 – 11 A, comparable to that ofthe stellar cluster spectra used as templates inour spectral synthesis work to be described later(section 4.2). Figure 3 presents the 14 resultingrest-frame spectra, where the location of strongsky emission lines (at 5577, 6300 and 6364A) aswell as sky absorption lines (at 6874, 7590 and7630A) have been indicated. Excluding thesenight sky lines, the smoothed continuum of allspectra shows a S/N per pixel element alwayslarger than 5. For each spectrum, the locationsof the most prominent lines are marked and theiridentifications are given in the last panel.
The Hβ, Hγ and Hδ Balmer emission lineswere found to be systematically contaminated byabsorption lines. To disentangle the absorptionfrom the emission, we have synthesized the stel-lar continuum by a combination of star spectra.Stellar energy distributions were taken from thelibrary of Jacoby et al. (1984). The stars havesolar metallicity which is appropriate for our ob-jects as shown later. We used a combination ofstars with spectral type varying from B to K, andoptimized the fit to the continuum for the impor-tant spectral absorption lines, such as the highorder Balmer lines (H10 to H8), the CaII K lineand the G band (Figure 4, top panel). We imposethe additional constraint that the resulting syn-thesized stellar continuum not be redder than theobject continuum, since the spectra of LCGs havesimultaneously strong absorption features charac-teristic of old stellar populations and blue U-Vcolors characteristic of young ones. The synthe-sized stellar continuum is then subtracted fromthe observed spectrum to yield a pure emissionspectrum uncontaminated by absorption (Figure4, bottom panel) which we can use to measurethe Balmer decrement and derive extinction. For12 LCG spectra with both Hβ and Hγ lines, theresidual emission lines have been measured usingthe SPLOT package, and the measurement errorsestimated by trying several combinations of the
stellar templates. In most cases, the Balmer emis-sion lines are seen to be either blue or red-shiftedwith respect to the center of the absorption lines,which minimize their contamination by underlyingstellar absorption, and hence the measurement er-ror for the gas extinction.
Emission line widths were estimated after acareful examination of the actual spectral resolu-tion because seeing conditions were varying from0”.65 to 1”.0 FWHM, and the object sizes werecomparable to the slit size. The instrumental reso-lution is around 5 A (FWHM), as measured fromabsorption lines of the calibration stars and un-resolved sky lines. Each line measurement waschecked against the closest sky emission line andvelocity widths were derived assuming a gaus-sian profile. All spectra but one include the[OIII]λ4959 and 5007 emission lines. FollowingGuzman et al. (1997), velocity widths derivedfrom this set of lines are averages, weighted bythe quality of individual measurements. They aregiven in Table 2.
4. Stellar populations
4.1. Color properties
Ten of the 14 LCGs possess K’ band photom-etry (Hammer et al. 1997) along with B, V andI photometry. At the reference redshift of z =0.5182, the central wavelength of the observed Iband is exactly that of the rest frame V band,while the observed V band matches well the restframe U band centered at 3622 A. At this redshiftthe observed K’ band represents a filter centeredaround 1.416 µm. Observed colors have been de-rived within an aperture of 3” diameter. Cal-culations of rest-frame colors has been done bysystematic fits of the observed V, I and K’ photo-metric points, using Bruzual and Charlot (2000)models with exponentially decreasing SFR char-acterized by e-folding times τ of 0, 0.1 Gyr, 0.5Gyr, 1.2 Gyr, 4 Gyr and infinity. The fits havebeen performed without extinction correction, andreproduce well the colors of all objects except forCFRS 03.1349, CFRS 03.1540 and CFRS 22.1064.The latter objects have observed (I - K’) colorswhich are too red even when compared with thoseof a 15 Gyr old stellar population. Because the 14selected LCGs have redshifts close to the referenceone, the model-dependent corrections applied to
5
the rest-frame colors (U - V) and (V - 1.4 µm)are always negligible or smaller than the measure-ments errors (i.e. < 0.05 mag). Thus, our derivedrest-frame colors are very accurate, with only asecond-order dependency on the model used toderive them.
The resulting color distribution in Figure 5 il-lustrates the following point: our sample whichwas constructed using a selection criterion on theemission lines includes galaxies with (U - V) col-ors ranging from those of Irr to those of Sbc, justas the sample of Guzman et al. (1997). On theother hand, our LCGs display a large dispersionof the (V - 1.4 µm) color, with 7 of them showingcolors much too red compared to the predictionsof the models. Model uncertainties of the (V - K)color – which is very similar to the (V - 1.4µm)color – cannot account for this effect. These veryred colors can be explained if the presently ob-served burst is superimposed on a red old stellarpopulation, if there is significant extinction, if thestellar population has over-solar abundances, orif there is a combination of the above. For thereddest objects (CFRS 03.1242, CFRS 03.1349,CFRS 03.1540 and CFRS 22.1064), a combina-tion of these effects is likely at work. Interestingly,these four extremely red LCGs all possess a brightcompanion within 4” or 36 kpc (Figure 2). Thesecompanions are not affecting the K’ band aper-ture photometry, except maybe for 03.1242. TheCFRS 0300+00 field was also observed by ISO toa limit of 350 µJy (4σ) at 15µm and by the VLAto a limit of 90µJy (5σ) at 21 cm. Two very redLCGs, CFRS03.1349, 03.1540 in our sample havebeen detected at both mid-IR and radio wave-lengths.
The dispersion in the (V - 1.4 µm) color jus-tifies a posteriori our adopted name for these ob-jects, Luminous Compact Galaxies (and not blueLCGs), since only their (U-V) colors are blue.The lower luminosity compact galaxies of Guz-man et al. are significantly bluer in (V - 1.4µm)as compared to the LCGs in our sample (Guzman,private communication).
4.2. Absorption lines
All the LCG spectra show strong and broad ab-sorption lines. Most prominent are the Balmerlines, the Ca I 4227A and Ca II H and K lines,the CN band at 4182A, the CH band at 4301A,and the Mg I line at 5173A (Figure 3). A specialmention should also be made for the importantiron absorption line system in LCG spectra, in-cluding Fe I 4037A , 4264A , 4384A and 4435A,and sometimes Fe I 4004A , 4595A and 4645A .FeI lines are even present below 3900 A . This sug-gests that a large fraction of stars in LCGs havesolar abundances or greater, and that SN Ia havealready released iron-peak elements, giving an ageof about 1 Gyr or more for the bulk of the stars(see e.g. McWilliams 1997). In some LCG spectrathe CN band affects the location and shape of theH8 and H9 lines (see for example the spectrum of03.1540), which also suggests the presence of highmetal abundance stars.
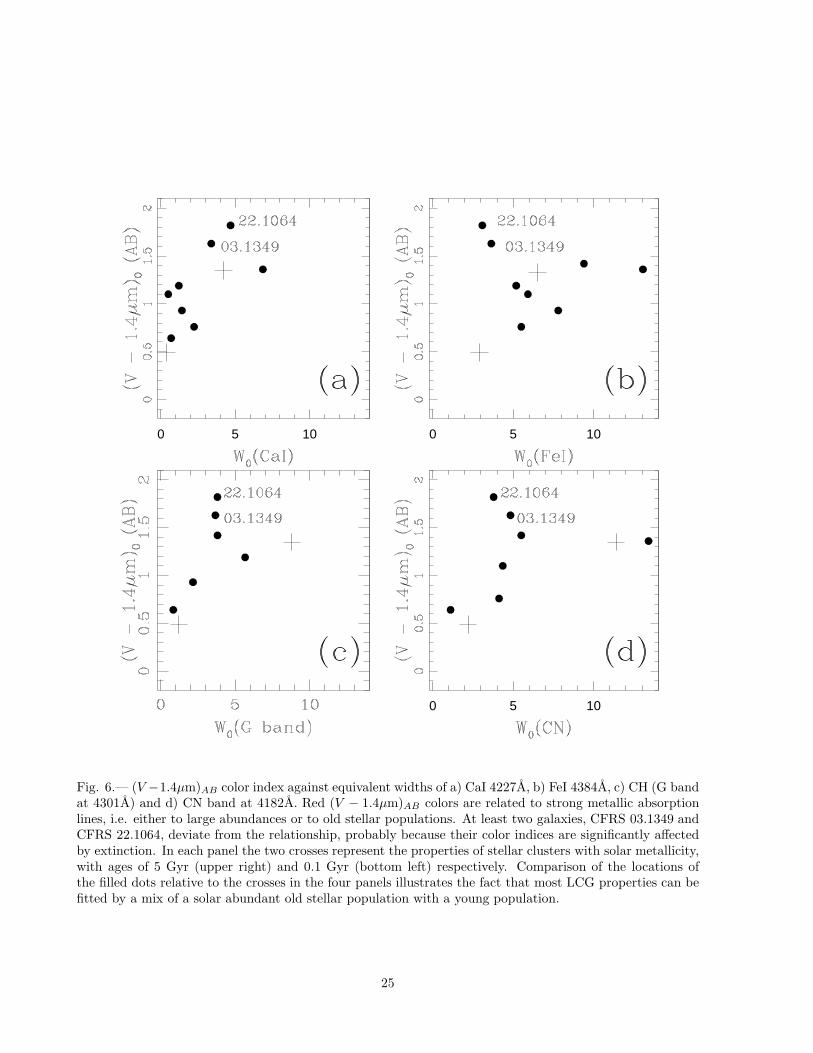
Table 3 gives the equivalent widths of the mostimportant absorption lines. The continuum hasbeen synthesized using a grid of stellar clusterspectra with different ages and metallicities, andfollowing the procedure outlined by Bica & Alloin(1986a and b, herafter BAa and BAb). To test ourcomputer routines, we have first performed a con-tinuum fit of the stellar cluster spectra, and checkour results against those of BAa, before applyingthe procedure on LCG spectra. Our measurementerrors are slightly lower than those of BAb ’s Table5 (from 1 to 2 A). We found a correlation betweenthe equivalent widths of the metal absorption linesand the (V − 1.4µm)AB color index (Figure 6).This is to be expected if the latter is mainly sen-sitive to age and metallicity effects. A few objectsdepart from the correlation. These are the reddestLCGs, CFRS03.1349 and 22.1064, for which wesuspect extinction to modify the (V − 1.4µm)AB
color index. Figure 6 also shows that the proper-ties of most LCGs are consistent with their stellarpopulations being composed of a 5 Gyr old popu-lation with solar abundance, mixed with a young(≤0.1 Gyr) population, the latter being responsi-ble for the dilution of the absorption lines.
The Bica & Alloin population synthesis methodallows us to perform a two-parameter analysiswhich takes into account both age and metallicityeffects. Because galaxy interactions are important
6

in LCGs, we prefer not to adopt any assumptionconcerning the abundances of the young popula-tion relative to those of the old population, as doneby Bica (1988) in his analysis of E/S0 and spiralnuclei. On the other hand, to simplify the analy-sis, we have made the plausible assumption that,in a small volume with intense star formation, thegas is chemically homogeneous at least during thelast 108 years. Ten absorption lines have been usedto perform the fit. They include H 10 (3798 A),H8 (3889 A), Ca II K (3933 A), FeI (4037 A), CN(4182 A), CaI (4227 A), FeI (4264 A), the G band(4301 A), FeI (4384 A) and MgI (5175 A). Formost LCGs, this results in 4 to 7 lines available inthe spectral range, and not contaminated by skyemission or absorption. Five star cluster popula-tions with ages 5 × 10⁹, 109, 5 × 10⁸, 107 and 106
yr have been used as templates. We have chosennot to use globular cluster spectra (age = 15 ×
109) because at z∼ 0.5, LCGs emitted their lightnot more than 6-7 Gyr ago. The metal abundanceof the older population was allowed to be one ofthe following values: log(Z/Z⊙) = - 1.5, - 1, - 0.5,0 and 0.6. The same metal abundance has beenassumed for the 109 and 5 × 10⁸ yr old popula-tions (log(Z/Z⊙)= -1, -0.5, 0 and 0.6), and for the108 and 107 yr old populations (log(Z/Z⊙) = -0.5,0 and 0.6). Our goal here is not to fully disentan-gle the metallicity from age effects for each LCG(our spectra do not have the required S/N to ac-complish that), but rather to have a first roughestimate of its stellar population properties. Inmany cases, LCGs show large equivalent widths ofFeI 4384A and MgI 5175A and relatively smallequivalent widths of CaII K lines. The latter havebeen fitted thanks to the line dilution in the blueby the younger population which has a HII spec-trum. The fit has been done as follows: we addfirst a new star cluster population to the mixturein incremental steps of 5% in the light contribu-tion. If the objects are not fitted, we reduced thestep to 2%. In some cases, the individual iron lineequivalent widths were not well reproduced by themodels. This is not too surprising given the com-plexity of the Fe line system: even for well-knownstars, Fe/H is not known to better than a factor of2 or 3 (Wheeler, Sneden & Truran 1989). For the6 LCGs with non-satisfactory fits of individual Felines, we have fitted only the sum of the three FeIrather than each of them individually.
Table 4 presents the result of the fits. χ2 valuesare calculated as averages of the sum of the squaresof the differences between model and LCG spec-trum divided by the squares of the measurementerrors. The latter are taken to be the quadraticsum of the BAb errors and our errors. We alsorestrict the parameter space to be explored by im-posing the plausible constraint that the (3728A -5175A) color (approximately the (U-V) color) ofthe model has to be bluer than that of the LCG.The contribution to the V light of each populationin the synthesis model is given in Table 4, in boldcharacters for the major contributor. Most LCGsare dominated by populations having ages rang-ing from 1 to 5 Gyr. We have tested this result byattempting to fit the LCG absorption lines by lim-iting the age range to values lower than or equalto 5×10⁸ yr : for all LCGs but CFRS 22.0637 andCFRS 22.0919, the χ2 value of the fit is well inexcess of 1.
Except for CFRS 22.0637 and CFRS 22.0919,the stellar populations in LCGs invariably includean important contribution (≥ 35%) stars olderthan 1 Gyr and with metal abundance log(Z/Z⊙)≥ -0.5. For 9 of them, we find an important con-tribution of > 1Gyr stars with log(Z/Z⊙) ≥ 0.We have tested the robustness of the latter re-sult by running models where the metal abun-dance has been constrained to have log(Z/Z⊙)values lower than or equal than -0.5. We foundthat for 7 LCGs, CFRS 03.0523, CFRS 03.0570,CFRS 03.0595, CFRS 03.1242, CFRS 22.0344,CFRS 22.0429 and CFRS 22.0619, there is no pos-sibility to fit their absorption line spectra with-out an important contribution of solar or over-solar stellar population. Special mention shouldbe made of CFRS 03.1242 for which we couldnot find a satisfactory fit. The reason is thatit shows very strong absorption lines (Table 3),stronger than the most metal-rich star clusters inour library. Four LCGs, CFRS 03.1540, CFRS22.0637, CFRS 22.0919 and CFRS 22.1064, ap-parently require low-abundance populations to fittheir absorption line spectra. However our mod-elling was unsuccessful to provide physical solu-tions for CFRS 03.1540 and CFRS 22.1064, forwhich no (or in very small amounts) young popu-lation responsible of their emission lines have beenidentified. Any young component added would di-lute the absorption lines, and would lead to an old
7
stellar component with a solar metallicity.
While our spectral synthesis work allows us toput constraints on the ages and metallicities of thestellar populations in LCGs, the reader should nottake the values given in Table 4 as being the actualstellar population distributions in LCGs. Thereare several caveats which limit the results of ouradopted spectral synthesis procedure. First, thereis more than one solution with χ2 values lowerthan 1, and Table 4 only displays the solution withthe minimum value. These appear to be true min-ima as they do not change when the incrementalstep for adding the light contribution of a stellarpopulation is changed. Second, the fit of a galaxypopulation using only a few stellar cluster tem-plates can smooth over some important events inthe star formation history of a galaxy in which starformation is sustained over long periods of time.We believe this effect to be especially importantin LCGs within interacting systems. The complexnature of the star formation history and the result-ing young stellar population could then explainits absence in CFRS03.1540 and CFRS 22.1064.It can also be the reason why our modeling ofCFRS 03.1242 proves to be unsuccessful. Third,and more importantly, our ability in disentanglingage from metal abundance effects is limited by therelatively small number of absorption lines. Forexample, some LCG spectra do not cover the blueregion and do not include the important lines be-low 4000A. This would bias the synthesis methodagainst finding young stellar populations whichwould dilute the UV absorption lines. This ef-fect can be seen in Table 4 for CFRS 03.1540 andCFRS 22.1064 for which the best-fit model foundno young population, although their spectra showemission lines. What can be firmly said about themetal abundance and age of LCGs ? First, allLCGs, but CFRS 22.0637 and CFRS 22.0919, aredominated by 1 to 5 Gyr old population, charac-terized in most cases by solar to over-solar abun-dances. To test the robustness of this result, wehave attempted to fit the 12 LCGs with an oldstellar population with the added constraint thatthe contribution of that old population does notexceed 25%. We found that half of the LCGs spec-tra could not be fitted, their χ2 being invariablygreater than 1. As for the remaining LCGs, theycould be only fitted by assuming a young popu-lation with the highest metal abundance available
in our stellar library (log(Z/Z⊙) = 0.6). This isnot realistic when compared to the gas abundancevalues discussed in the next section. Second, thebest fits to the LCGs spectra always give a mix ofstellar populations with metal abundance coveringa wide range from undersolar (generally character-izing the youngest population) to solar or overso-lar values (characterizing the oldest population).This is illustrated in Figure 6, which shows thatthe most important lines within a LCG cannot allbe fitted with a single metallicity. As noted above,some models of LCG spectra show no young pop-ulation, in evident contrast with their emissionline spectra. Adding a young stellar componentwould inevitably enhance the metal abundance ofthe oldest stellar component, making our conclu-sion that most LCGs are dominated by old andsolar metallicity stellar population even stronger.
5. Gas properties: SFR and oxygen abun-
dance
For the 12 spectra with both Hβ and Hγ de-tected, we have been able to derive AV extinc-tion values, after correcting the Balmer emissionlines for stellar absorption using the results of ourspectral synthesis work (Section 3). As shown inTable 5 and Figure 7 (left panel), the derived ex-tinctions can have values much larger than thosecurrently found in present-day irregular galaxieswhich have an average AV of ∼ 0.57 (Gallagheret al. 1989). These large extinctions imply thatthe SFR derived from the 2800A luminosity ofLCGs is greatly underestimated. We have cal-culated for each LCG the dereddened Hβ lineflux and derived the corresponding SFR using aSalpeter IMF (Kennicutt 1998) and assuming thestandard ratio between Hα and Hβ, Case B and agas temperature of 10000 K. Figure 7 (right panel)compares the SFRs so calculated to those derivedusing the 2800A continuum, assuming the sameIMF (see Kennicutt 1998). Even allowing for er-rors due mainly to uncertainties in the extinctionestimates, it is clear that the UV luminosity un-derestimates the actual SFR in LCGs by factorsranging from 2 to 30, with an average of 14 and amedian of 11. The largest underestimates are forCFRS 03.0523, CFRS 03.1540 and CFRS 03.1349,which are both IR-luminous galaxies. From theirIR and radio energy distributions, Flores & Ham-mer (2000, in preparation) derive SFRs respec-
8
tively of 87, 135 and 94 M⊙yr−1. These valuesare in agreement with those derived from the ex-tinction corrected Balmer lines, allowing for theerror bars which have large upper values. As an-other consistency check, we have applied the ex-tinction factor derived from the Hβ/Hγ ratio tocorrect the SFR values at 2800A (see Table 5).Extinction-corrected SFR2800 values are alwaysconsistent with extinction-corrected SFRHα val-ues within the error bars.
The O/H abundance ratio for the gas can beestimated from the quantity R23 = ([OII]3727 +[OIII]4959, 5007)/Hβ (Edmunds and Pagel 1984),although the relationship is degenerate and thereare two O/H values for a given R23. The cal-culated R23 for the 12 LCGs with the neces-sary lines range from 0.5 to 1 (Table 6), in goodagreement with the values obtained for similarobjects at lower redshifts by Kobulnicky andZaritsky (1999). Flux measurements of the faint[OIII]λ4363 line allow to lift the degeneracy fortwo objects (CFRS22.0619 and CFRS22.0919).For those, we derive gas temperatures of 12500and 13000 K, close to the average upper value forthe rest of the sample (Table 6). Using Figure8 of Kobulnicky et al (1999), it was possible toset for each line ratio R23, an upper and a lowervalue of O/H, with the help of the ionisation ra-tio [OIII]4959, 5007/[OII]3727. We found thatall LCGs have gas abundances Z/Z⊙ in the rangefrom 0.25 to 0.4, with the exception of CFRS22.0919, to be discussed later, which shows a verylow O/H. Adopting a statistical correction of +0.1dex on the O/H abundance as suggested by Kobul-nicky et al. (1999) for physical parameters derivedfrom global galaxy spectra, our data are finallyconsistent with a median metal abundance Z/Z⊙
= 0.45, similar to the value derived by Kobulnickyand Zaritsky (1999) for their objects. Thus, gasin LCGs displays oxygen abundances intermedi-ate between those of local spirals (Z/Z⊙ ∼ 1) andthose of irregular dwarf galaxies (Z/Z⊙ ∼ 0.3).
6. Discussion
We have obtained VLT spectra of 14 LCGs se-lected by their compactness and luminosity in therest-frame blue. The blue luminosities of LCGsrange from 0.35 to 1.4 L⋆ with an average of 0.70L⋆. They are also bright in the near-IR, with
a rest-frame K-band luminosity ranging from 0.1to 2.8 L⋆ and an average of 0.86 L⋆, assumingM⋆
K(AB)=-22.55 for H0 = 50 (Glazebrook et al,1995). Guzman (1999) has noticed that LCGsare also compact at near-IR wavelengths. Herewe assume that the K-light samples the stellarmass (Charlot 1998), with a mass-to-IR light ra-tio very close to unity. This follows Charlot (1996)who has investigated this ratio for a solar abun-dance population with various ages, appropriatefor LCGs. A Salpeter Initial Mass Function (IMF)has been adopted, as it allows models to reproducewell the evolution of the global IR and B luminos-ity densities from z = 0 to z =1, to which theLCGs contribute importantly. On the other hand,Lilly et al. (1996) found that the use of a ScaloIMF in modeling the z = 0 – 1 galaxy popula-tion produces too many long-lived low-mass stars.Also photometric properties of local disks suggesta Salpeter rather than a Scalo IMF (Kennicutt etal. 1994). In any case, the adopted 0.22 dex un-certainty based on Charlot (1996)’s study of theconversion of K luminosity to mass likely accountsfor the major uncertainties related to the IMF.
LCGs have stellar masses ranging from 1010 to2.5 ×1011 M⊙, with an average of 7 ×10¹⁰ M⊙
(see Table 1). K-band luminosities derived fromthe 1.4µm luminosities are robust as the (1.4µm-K) color shows small variations during the periodfrom 108 years (it has the value -0.32 mag) to 1010
years (its value is -0.15 mag) after the beginningof star formation. Uncertainties in these deriva-tions are small compared to the large uncertaintyinvolved in the conversion of the K-light into mass(∼ 0.22 dex in Figure 8). From the way they havebeen selected and their properties, the LCGs stud-ied here are very similar to the 25% most luminousblue compact galaxies identified by Guzman et al(1997) in the Hubble Deep Field (HDF). They arethe galaxies responsible for the decrease in the UVluminosity density since the epoch correspondingto z=1 (Lilly et al. 1998).
With the noticeable exception of CFRS 22.0919and CFRS 22.0637, LCGs all display strong metal-lic absorption lines and have (U-V) colors similarto those of late-type galaxies, in the range Sbcto Irr. These properties can be reproduced by acombination of an old star population with age≥ 109 yr with a younger population with age ≤
5 × 10⁸ yr (see Section 4.2). It is important to
9
note that the best spectral synthesis fits are gen-erally obtained with an older stellar populationwith abundances larger than or equal to solar val-ues, while the younger component has solar orsub-solar abundances. The latter component di-minishes the observed strength of the absorptionlines due to the older stellar population, as wellas making the (U − V )AB color bluer than thatof a Sbc galaxy. Analysis of the emission lines in-dicates that the ionized gas in LCGs also displaysoxygen abundances in the range from 0.3 to 0.5 thesolar value, i.e. the metal abundance of the gas issimilar to that of the younger stellar population.
Given these observations, what can we sayabout the nature of LCGs? The presence of amoderately old stellar population with solar abun-dances or larger, stellar masses near that of theMilky Way, large SFRs similar to or only slightlybelow those of luminous IR galaxies, all argueagainst a scenario in which LCGs are progenitorsof today’s spheroidal or irregular dwarf galaxiesas discussed by Koo et al. (1995) and Guzmanet al. (1997). That hypothesis is based mainlyon one key observation: that of the small velocitywidths of the emission lines of LCGs (Table 2).These authors argue that the velocity widths arerepresentative of virialized motions of the gas andsince the velocity widths are similar to those ofdwarf galaxies, they are dwarf progenitors. How-ever an examination of the LCG spectra ( Figure3), shows that the Balmer emission lines are oftenred-shifted relatively to the Balmer absorption,suggesting that more complex mechanisms may beresponsible of the narrowness of their widths. Wealso note that, in some cases, emission lines haveasymetric profiles. In the case of CFRS 03.0523,they show two peaks separated by ∼ 470 km s−1,which are likely to be associated with each of thetwo merging components (Gruel et al. 2001, inpreparation). A special comment should be madeabout CFRS 22.0637 and CFRS 22.0919 which,as we have noted before, appear to be differentfrom other LCGs and resemble more HII galax-ies. In particular, CFRS 22.0919 has a young low-metallicity stellar population as well as a low gasoxygen abundance, it shows a moderate gas ex-tinction, and a large velocity difference (800 kms−1) between the emission and absorption lines.Gas outflow can be responsible for the blue-shiftedBalmer absorption lines, so that CFRS 22.0919
may be just the type of dwarf progenitor objectdiscussed by Koo et al. (1995) and Guzman et al.(1997).
But objects such as CFRS 22.0919 constitutemore the exception than the rule in our LCG sam-ple. The stellar mass as well as the light con-centration of other LCGs is more reminiscent ofthose of bulges of today’s Sab to Sbc spirals oreven ellipticals. Could LCGs be the progenitors ofbulges of present-day massive galaxies? The bulkof their stars displays a large range in metal abun-dance, as in the Milky Way’s bulge. Taking intoaccount their large extinctions, LCGs are found tobe still forming stars at a very vigorous rate, witha median SFR equal to 40 M⊙yr−1. For 8 LCGswith the necessary data, the median characteris-tic formation time scale for the bulk of the starsderived from the emission lines is ∼ 1.8 Gyr (Fig-ure 8). This value is consistent with that obtainedby the absorption line analysis, but is much largerthan the characteristic time of ∼ 0.1 Gyr for themonolithic scenario of bulge formation (Elmegreen1999). Thus, the latter scenario does not appearto be the appropriate one for explaining the ob-served properties of the majority of LCGs.
Which mechanism can then explain the trans-formation of LCGs to present-day spirals? An im-portant hint can be obtained from HST images.These show that an important fraction, if not all,of the LCGs possess a low-surface-brightness com-ponent which surrounds their core (Figure 2, seealso Guzman, 1999 or Hammer, 1999). Moreover,a substantial fraction of them (6/14) are seen tohave bright companions within a radius of 40 kpc.The LCGs with companions show the largest SFRsin the sample, and they are also the reddest in (V-1.4µm). The three galaxies in the sample whichhave been detected by ISO (Flores et al. 2000, inpreparation) are among them. It is thus plausi-ble to think that gas tidally pulled out from thecompanion and falling into a LCG can feed thestar formation within it. This would naturally ex-plain the metal abundance difference between thegas and the oldest stars. A good example of aLCG where such a mechanism may be at work isCFRS 03.1540: its low-surface-brightness compan-ion acts as a reservoir of low abundance gas to sus-tain the star formation in it during several 108 yr.CFRS 03.1540 also shows a well-developped disk– it was classified as a disk galaxy by Lilly et al.
10
(1998) – and star formation is probably occurringin both bulge and disk. The tadpole galaxies de-scribed by Brinchmann et al. (1998) which wouldhave been selected as LCGs by our criteria, canbe interpreted in this context as undergoing thefirst stage of the formation of a disk around thebulge. Thus, by observing LCGs, we are witness-ing an important phase of galaxy formation: thebuilding of the bulge and the beginning of the diskformation of L⋆ spirals, where galaxy interactionsplay a major role.
The scenario developped here has to accountfor the narrow emission line widths reported byPhillips et al. (1997) and also seen in severalof our spectra. In normal galaxies, the bulge isdynamically relaxed, and the gas emission likelysamples most of the velocity field, i.e. the emis-sion line widths should be indicative of the wholegalaxy potential. Weedman (1983) reported how-ever unusually narrow emission line widths in star-burst nuclei. Lehnert and Heckman (1996) study-ing a sample of IR-selected starburst galaxies, haveshown that the starburst occurs preferentially inthe inner region, so that the gas does not sam-ple fully the solid body part of the rotation curve.They found several objects with emission line ve-locity widths of less than 50 km s−1 in systemswith rotational velocities ranging from 100 to 200km s−1. Since they have SFRs and hence IR lu-minosities, equal or slightly below those of ISOgalaxies (Flores et al. 1999), we conclude that ourLCGs are very similar to some Lehnert & Heck-man galaxies, and that the narrow emission linewidths are not indicative of the entire potential ofthe LCGs and lead to a systematic underestimateof their true masses.
The present study thus suggests that LCGs areprogenitors of today’s massive (non-dwarf) galax-ies, which have formed the bulk of their stars at z< 1. We note that:1) the gas supplied to LCGs from interacting com-panions is enough to sustain their star formationduring several 108 yr, until completion of the bulgestellar content as well as to feed a gradual forma-tion of the disk.2) the characteristic time for the formation of thebulk of LCG stars is relatively small, averaging toonly ∼ 1.8 Gyr, i.e. most of the stars formed at z< 1.Because LCGs represent ∼ 20% of the field galax-
ies, the fraction of stars in massive galaxies formedat relatively recent epochs could have reached20%, and even more if the star formation in in-teracting systems of large (non-compact) galaxiesdetected by ISO (Flores et al. 1999; Hammer,1999) is taken into account. This estimate is muchhigher than the one obtained by Brinchmann & El-lis (2000), who find the fraction to be negligible.The main reason for the discrepancy comes fromthe way the SFR is derived. Brinchmann and Ellis(2000) calculate the SFR from the [OII]3727 flux,while we use the extinction-corrected Hα emis-sion, assuming the standard ratio between Hα andHβ, Case B and T = 10000 K. Our derived SFRscan be a factor 10 or more greater than those de-rived by Brinchmann & Ellis (2000). This can beseen by comparing their Figure 3 to our Figure8. Using the same sample as that of Brinchmann& Ellis (2000), Hammer and Flores (1998) haveshown that SFRs derived from either [OII]3727 or2800A luminosities do not correlate with thoseobtained from Hα luminosities, mainly because ofextinction effects.
Given their large extinction and Hα-derivedSFRs, it is likely that the IR luminosities of LCGsare similar to or only slightly below those of theluminous IR galaxies detected by ISO in the sameredshift range (Flores et al. 1999). Because theyrepresent 20% of the field galaxies in the redshiftrange from 0.4 to 0.8, the contribution of the LCGsto the global SFR density needs to be reevaluated.Such a reevaluation will probably lead to an in-crease in the fraction of the SFR density relatedto photons reprocessed by dust, i.e. there shouldbe an evolution in the shape of the IR luminosityfunction, due to the addition of new populations– such as LCGs – around LIR=1011L⊙. This sub-ject cannot be addressed properly with our presentsmall sample. We shall discuss it in a future paperwith a much enlarged sample.
7. Conclusions
Spectroscopic observations of a small sample of14 Luminous Compact Galaxies (LCG) with theVLT have provided new and important informa-tion on a crucial stage in the formation of galax-ies, that of bulges in massive (non-dwarf) spiralgalaxies. The LCG spectra are characterized bythe following properties:
11
1) they show strong metallic absorption lines,including those from α-elements and iron.
2) they show large Balmer decrement ratios (asmeasured by Hβ/Hγ), implying large extinctions(median AV of ∼ 1.5 mag).
3) the SFRs derived from the extinction-corrected Balmer lines are more than ten timeshigher than the corresponding ones derived fromthe UV luminosities.
LCGs with redshifts between 0.4 and 0.8 areundergoing intense bursts of star formation, withSFRs averaging to ∼ 40 M⊙yr−1. Because of theirlarge extinctions, they are expected to be luminousin the IR, at a luminosity level just below the IRluminous galaxies detected by ISO in the sameredshift range (Flores et al. 1999). Indeed 3 ofthe 14 LCGs discussed in this paper are detectedby ISO, implying higher extinction for them.
We believe that LCGs are progenitors ofpresent-day bulges of massive spiral galaxies be-cause:
1) they have stellar masses similar to thoseof today’s bulges in ≥L⋆ spirals, concentrated incomparable volumes.
2) their stars show a wide range of metal abun-dance, from sub-solar to over-solar values, as inthe bulge of the Milky Way.
3) the majority of LCGs show low-surface-brightness components around their high-surface-brightness cores (the bulges). Most are in inter-acting systems, and the tidally pulled gas fromthe companions is likely to sustain star formationin the LCGs at a high rate for several hundredsMyr, resulting in the completion of the bulge for-mation and the beginning of the disk formation.The characteristic time for forming the bulk of thestars in LCGs is rather small, only ∼ 1.6 Gyr onaverage. It is comparable to the age of the oldeststars in LCGs derived from the analysis of theirabsorption lines. This means that a significantfraction (several tens of percent) of present day’smassive galaxies could have been formed at rel-atively recent epochs, at z ≤ 1. This is consis-tent with the cosmic star formation history whichpredicts that an important fraction of the stellarmass was formed in the z = 0 – 1 redshift range(Hammer 1999). The importance role played bygalaxy interactions in the formation of bulges ofspiral galaxies is also consistent with the hierar-
chical theory of galaxy formation. On the otherhand, the scenario outlined here may appear tobe in contradiction with the results of Lilly et al.(1998) who found that the number density of largespirals at z ∼ 1 is comparable to that today. How-ever the Lilly et al. results are based on only ∼ 40morphologically selected large spirals in the red-shift range from 0.2 to 1, and their large one σ er-ror bar can easily accomodate a density evolutionof spiral disks of ∼ 20% as found here. Moreover,some of the large spirals in Lilly et al. (1998)’sample are in interacting systems and are stronginfrared emittors, such as CFRS 03.1540 discussedhere, or other examples discussed by Flores et al.(1999). Presumably, these large interacting diskswill merge leading to a density evolution.
If the 14 LCGs described here are represen-tative of the whole LCG population at z >0.4,then their contribution to the global star forma-tion density should be revised upwards by factorsas large as 7 – 10. That contribution could thenbe as high or higher than that of the luminousIR galaxies detected by ISO (Flores et al. 1999).The latter are more massive systems and formedstars more rapidly than LCGs, but they constitutea much sparser population of galaxies, comprisingonly a few percent of the total population. MostLCGs at z ∼ 0.5 would have bolometric IR lu-minosities not far below the ISO sensitivity limit,and we predict that they will be easily detected inlarge numbers by SIRTF.
Finally we reiterate that our interpretation ofthe nature of LCGs is quite different from thatproposed by Koo et al. (1995), Guzman et al.(1997) and Guzman (1999) for the majority ofcompact galaxies found in the Hubble Deep Fieldand flanking fields. This is probably because mostof the Guzman et al galaxies have intrinsicallylower luminosities than LCGs. We believe LCGsto be 10 to 100 times more massive than dwarfgalaxies, to be forming stars at large rates, so theycannot be the progenitors of local spheroidal orirregular systems through fading. Correspondingto the brightest 25% of the compact galaxies se-lected by Guzman et al (1997), the LCGs selectedin CFRS fields are mostly evolved starbursts prob-ably similar to those classified as such in the HDF.Due to their large derived SFRs, LCGs are themain contributors to the large SFR density ob-served at z=0.5 to 1.
12
In future papers (Gruel et al. in preparation)we will investigate the velocity fields and dynamicsof LCGs, using data of superior quality and basedon a larger sample. We will also be studying thepossible revision of the star formation history andof the IR luminosity density caused by the LCGpopulation.
We are grateful to C. Balkowski, F. Combes,R. Guzman, D. Kunth and C. Vanderriest for use-ful discussions and advices. We are especially in-debted to Pascale Jablonka who introduced us tothe methodology of fitting absorption line spec-tra by star cluster synthesis. We thank the ESOAllocation Time Committee for the one night at-tributed to this program at UT1. F.H. is verygrateful to Claire Moutou and Thomas Szeifert fortheir help at Paranal and their patience. We thankthe data flow operations team for the fast deliv-ery of the data. We thank the CNRS/CONICYTfor financial support of our collaboration. T.X.T.is grateful for the hospitality of the Departementd’Astronomie Extragalactique et de Cosmologieat the Observatoire de Meudon and the Institutd’Astrophysique during his sabbatical leave. Hethanks the partial financial support of the Cen-tre National de la Recherche Scientifique, of theUniversite of Paris VII and of a SesquicentennialFellowship from the University of Virginia.
REFERENCES
Bertin, E., & Arnouts, S. 1996, A&A, 117, 393
Bica, E., & Alloin, D. 1986a, A&A, 162, 21
Bica, E., & Alloin, D. 1986b, A&AS, 66, 171
Bica, E. 1988, A&A, 195, 76
Boissier, S., & Prantzos, N. 2000, MNRAS, sub-mitted
Brinchmann, J., et al. 1998, ApJ, 499 112
Brinchmann, J., & Ellis, R. 2000, ApJ, 536, 77
Bruzual, G., & Charlot, S. 2000, in preparation
Charlot, S., 1996, in the Universe at High-z:Large Scale Structures and Cosmic MicrowaveBackground, ed. Martinez Gonzales & J. Sanz(Berlin : Springer), 53
Charlot, S., 1998, in The Next Generation SpaceTelescope: Science Drivers and Technologi-cal Challenges, 34th Liege Astrophysics Collo-quium, 135 (astro-ph/9810408)
Charlot, S., Worthey, G., & Bressan, A. 1996,ApJ, 457, 625
Edmunds, M., & Pagel, B., 1984, MNRAS, 211,507
Elmegreen, B., 1999, ApJ, 517, 103
Flores, H. et al. 1999, ApJ, 517, 148
Fukugita, M., Hogan, C., & Peebles, P.J.E., 1998,ApJ, 503, 518
Gallagher, J., Bushouse, H., & Hunter, D., 1989,AJ, 97, 700
Glazebrook, K., Peacock, J., Miller, L., Collins,C., 1995, MNRAS275, 169
Guzman, R., Gallego, J., Koo, D.C., Phillips,A.C., Lowenthal, J.D., Faber, S.M., Illing-worth, G.D., & Vogt, N.P. 1997, ApJ, 489, 559
Guzman, R., 1999, in Proceedings of the XIXthMoriond Conference on ”Building Galaxies:from the primordial Universe to the present”,ed. F. Hammer, T.X. Thuan, V. Cayatte, B.Guiderdoni & J.T.T. Van (Paris: EditionsFrontieres),
Hammer, F., Crampton, D., Le Fevre, O., & Lilly,S.J. 1995, ApJ, 455, 88
Hammer F., et al. 1997, ApJ, 480, 59.
Hammer F., & Flores H, 1998, in Proceedings ofthe XVIIIth Moriond Conference on ”DwarfsGalaxies and Cosmology”, ed. T.X. Thuan, C.Balkowski, V. Cayatte & J.T.T. Van (Paris:Editions Frontieres), 353 (astro-ph/9806184)
Hammer, F. 1999, in ASP Conf. Ser., Vol. 197,“Dynamics of Galaxies: from the Early Uni-verse to the Present” eds. F. Combes, G.Mamon and V. Charmandaris (San Francisco:ASP), in press
Jacoby, G., Hunter, D., & Christian, C., 1984,ApJS, 56, 257
13
Kennicutt, R., Tamblyn, P., Congdon, C., 1994,ApJ, 435, 22
Kennicutt, R. 1998, A&A Rev., 36, 189
Koo, D., & Kron, R. 1981, A&A, 105, 107
Koo, D., Guzman, R., Faber, S., Illingworth, G.D.,Bershady, M.A., Kron, R.G., & Takamiya, M.1995, ApJ, 440, 49
Kobulnicky, H., & Zaritsky, D., 1999, ApJ, 511,118
Kobulnicky, H., Kennicutt, R., &Pizagno, J. 1999,ApJ, in press
Le Fevre et al. 2000, MNRAS, 311, 565
Lehnert, M. & Heckman, T., 1996 ApJ, 472, 546
Lilly, S.J., Hammer, F., Le Fevre, O., & Cramp-ton, D. 1995, ApJ, 455, 75
Lilly S., Le Fevre O., Hammer F., & Crampton,D. 1996, ApJ, 460, L1
Lilly, S.J., et al. 1998, ApJ, 500, 75
McWilliams, A., 1997, A&A Rev.35, 503
Phillips, A., Guzman, R., Gallego, J., Koo, D.,Lowenthal, J.D., Vogt, N.P., faber, S.M., &Illingworth, G.D. 1997, ApJ, 489, 543
Renzini, A., & Cimatti, A., 1999, astro-ph/9910162
Schade, D., et al. 1999, ApJ, 525, 31
Weedman, D. 1983, ApJ, 266, 479
Wheeler, J., Sneden, C., Truran, J., 1989A&A Rev.27, 279
Williams, R., et al, 1996, AJ, 112, 1335
This 2-column preprint was prepared with the AAS LATEX
macros v5.0.
14
Table 1: Luminosity and compactness
CFRS z MBLB
L⋆
Err MKLK
L⋆
Err LK1 δI2CFHT δI2HST log(r1/2)
3
03.0442 0.47807 -20.30 0.436 0.064 -21.06 0.254 0.084 2.2 0.68 – –03.0523 0.65355 -21.20 1.000 0.147 -22.24 0.752 0.194 6.5 0.43 0.46 0.5803.0570 0.64682 -20.38 0.470 0.117 — — — — 0.30 – –03.0595 0.60442 -20.78 0.680 0.119 -22.09 0.655 0.157 5.6 0.31 0.54 0.6503.0645 0.52737 -20.77 0.673 0.049 -22.20 0.724 0.113 6.3 0.62 0.64 0.6903.1242 0.76786 -21.21 1.009 0.223 -22.99 1.500 0.317 12.9 0.73 – –03.1349 0.61640 -21.43 1.236 0.114 -23.67 2.805 0.206 24.2 0.73 0.35 0.5203.1540 0.68931 -21.52 1.343 0.124 -22.83 1.294 0.274 11.2 9999 0.56 0.6722.0344 0.51680 -20.30 0.437 0.048 — — — — 0.62 – –22.0429 0.62433 -20.29 0.433 0.083 -22.13 0.679 0.144 5.9 0.57 – –22.0619 0.46706 -20.08 0.356 0.082 — — — — 0.75 – –22.0637 0.54188 -21.26 1.057 0.107 -21.83 0.515 0.099 4.4 0.61 – –22.0919 0.47144 -20.22 0.406 0.034 — — — — 9999 0.37 0.4222.1064 0.53685 -20.06 0.350 0.074 -22.43 0.895 0.214 7.7 0.21 – –
Notes:1 in units of 1010 L⊙
2 light concentration, mI(15h−1
50 kpc) - mI(5h−1
50 kpc); 9999: unsuccessful measurement3 r1/2 in kpc
15
Table 2: FWHM of emission lines
CFRS FWHM1OII Q2 FWHM1
Hγ Q2 FWHM1OIII Q2 FWHM1 Q2
03.0442 – 9 50 3 50 1 50 103.0523 115 2 150 2 180 1 180 103.0570 50 3 79.5 3 130 1 130 103.0595 54 4 150 2 50 2 50 203.0645 50 2 50 2 55 2 55 203.1242 135 3 81 3 – 9 108 203.1349 252 2 60 2 250 2 250 103.1540 50 3 50 3 60 2 60 122.0344 – 9 50 2 50 2 50 222.0429 52 4 50 3 50 2 50 222.0619 50 3 50 2 50 1 50 122.0637 89 4 50 2 50 1 50 122.0919 – 9 50 1 50 1 50 122.1064 – 9 76 2 82 2 80 1
Notes:1 In [km/s]2 Quality factor: (1) error of 10%, (2) error of 20%, (3) error of 50% and (9) not measured
16
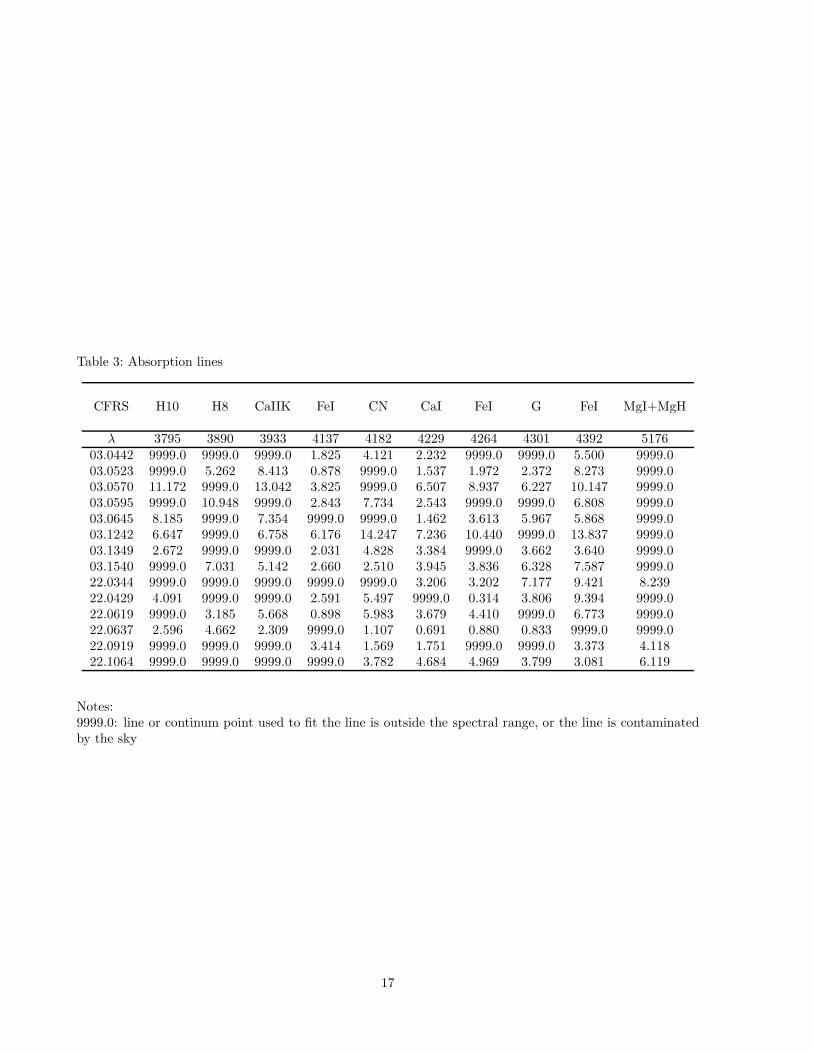
Table 3: Absorption lines
CFRS H10 H8 CaIIK FeI CN CaI FeI G FeI MgI+MgH
λ 3795 3890 3933 4137 4182 4229 4264 4301 4392 517603.0442 9999.0 9999.0 9999.0 1.825 4.121 2.232 9999.0 9999.0 5.500 9999.003.0523 9999.0 5.262 8.413 0.878 9999.0 1.537 1.972 2.372 8.273 9999.003.0570 11.172 9999.0 13.042 3.825 9999.0 6.507 8.937 6.227 10.147 9999.003.0595 9999.0 10.948 9999.0 2.843 7.734 2.543 9999.0 9999.0 6.808 9999.003.0645 8.185 9999.0 7.354 9999.0 9999.0 1.462 3.613 5.967 5.868 9999.003.1242 6.647 9999.0 6.758 6.176 14.247 7.236 10.440 9999.0 13.837 9999.003.1349 2.672 9999.0 9999.0 2.031 4.828 3.384 9999.0 3.662 3.640 9999.003.1540 9999.0 7.031 5.142 2.660 2.510 3.945 3.836 6.328 7.587 9999.022.0344 9999.0 9999.0 9999.0 9999.0 9999.0 3.206 3.202 7.177 9.421 8.23922.0429 4.091 9999.0 9999.0 2.591 5.497 9999.0 0.314 3.806 9.394 9999.022.0619 9999.0 3.185 5.668 0.898 5.983 3.679 4.410 9999.0 6.773 9999.022.0637 2.596 4.662 2.309 9999.0 1.107 0.691 0.880 0.833 9999.0 9999.022.0919 9999.0 9999.0 9999.0 3.414 1.569 1.751 9999.0 9999.0 3.373 4.11822.1064 9999.0 9999.0 9999.0 9999.0 3.782 4.684 4.969 3.799 3.081 6.119
Notes:9999.0: line or continum point used to fit the line is outside the spectral range, or the line is contaminatedby the sky
17
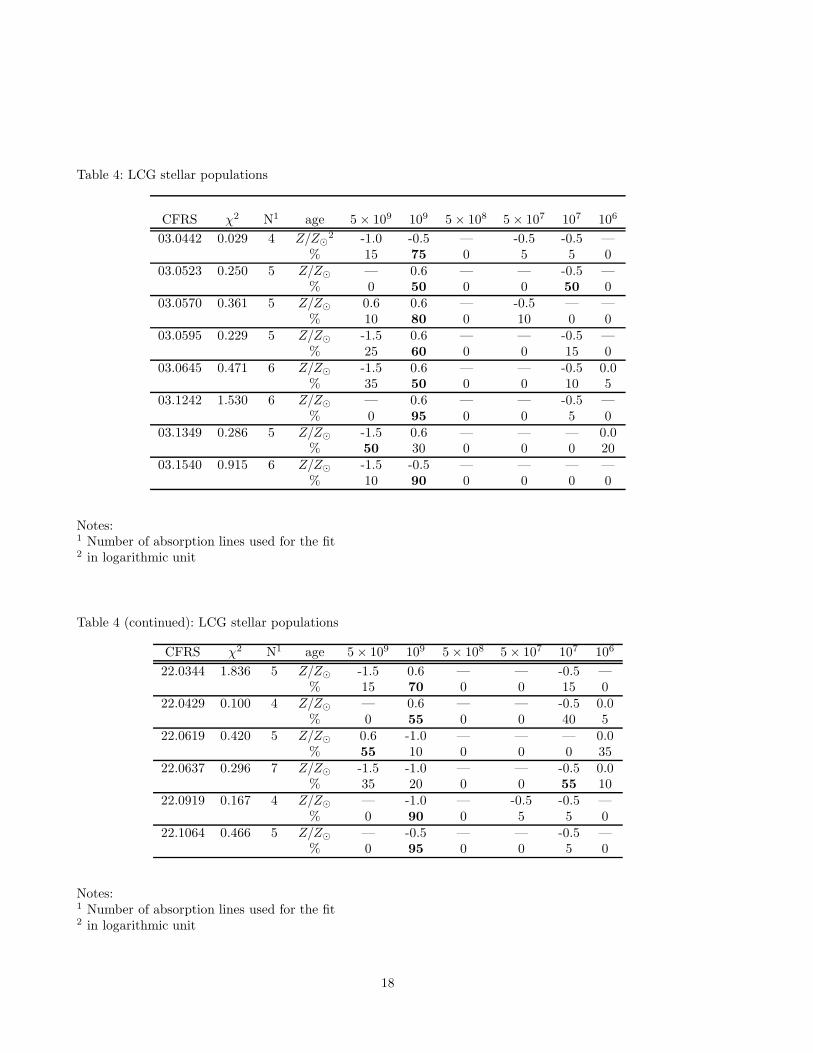
Table 4: LCG stellar populations
CFRS χ2 N1 age 5 × 10⁹ 109 5 × 10⁸ 5 × 10⁷ 107 106
03.0442 0.029 4 Z/Z⊙2 -1.0 -0.5 — -0.5 -0.5 —
% 15 75 0 5 5 003.0523 0.250 5 Z/Z⊙ — 0.6 — — -0.5 —
% 0 50 0 0 50 003.0570 0.361 5 Z/Z⊙ 0.6 0.6 — -0.5 — —
% 10 80 0 10 0 003.0595 0.229 5 Z/Z⊙ -1.5 0.6 — — -0.5 —
% 25 60 0 0 15 003.0645 0.471 6 Z/Z⊙ -1.5 0.6 — — -0.5 0.0
% 35 50 0 0 10 503.1242 1.530 6 Z/Z⊙ — 0.6 — — -0.5 —
% 0 95 0 0 5 003.1349 0.286 5 Z/Z⊙ -1.5 0.6 — — — 0.0
% 50 30 0 0 0 2003.1540 0.915 6 Z/Z⊙ -1.5 -0.5 — — — —
% 10 90 0 0 0 0
Notes:1 Number of absorption lines used for the fit2 in logarithmic unit
Table 4 (continued): LCG stellar populations
CFRS χ2 N1 age 5 × 10⁹ 109 5 × 10⁸ 5 × 10⁷ 107 106
22.0344 1.836 5 Z/Z⊙ -1.5 0.6 — — -0.5 —% 15 70 0 0 15 0
22.0429 0.100 4 Z/Z⊙ — 0.6 — — -0.5 0.0% 0 55 0 0 40 5
22.0619 0.420 5 Z/Z⊙ 0.6 -1.0 — — — 0.0% 55 10 0 0 0 35
22.0637 0.296 7 Z/Z⊙ -1.5 -1.0 — — -0.5 0.0% 35 20 0 0 55 10
22.0919 0.167 4 Z/Z⊙ — -1.0 — -0.5 -0.5 —% 0 90 0 5 5 0
22.1064 0.466 5 Z/Z⊙ — -0.5 — — -0.5 —% 0 95 0 0 5 0
Notes:1 Number of absorption lines used for the fit2 in logarithmic unit
18
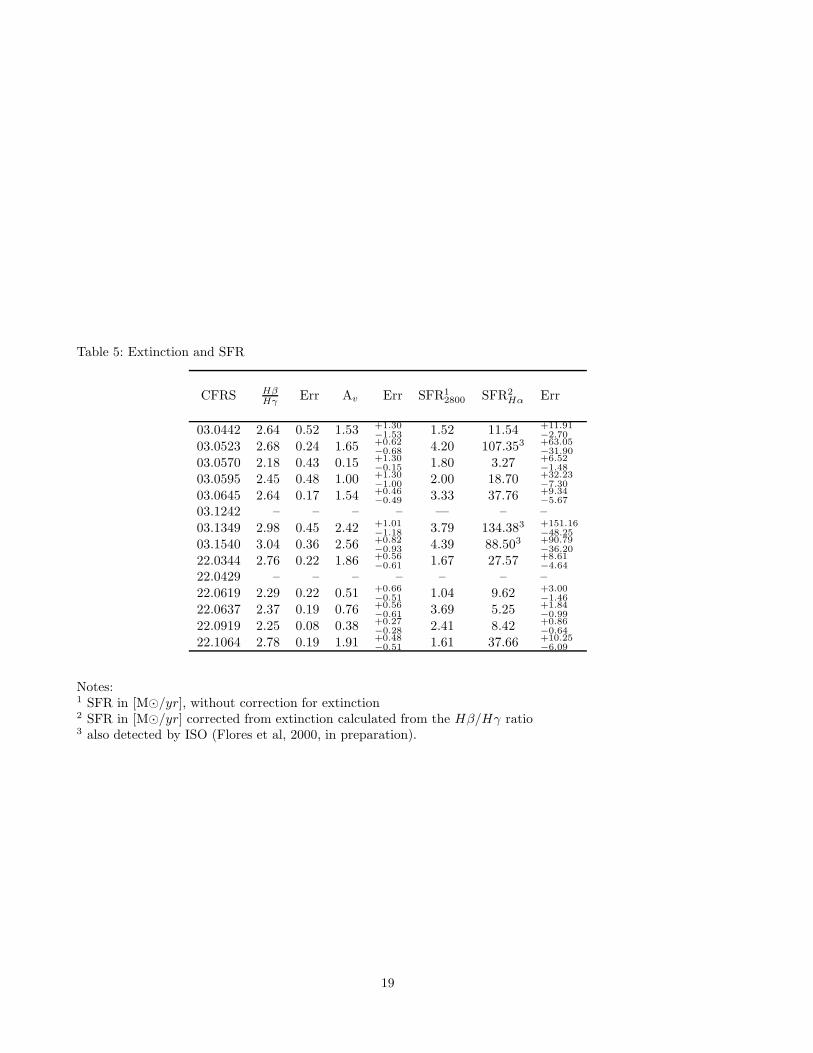
Table 5: Extinction and SFR
CFRS HβHγ Err Av Err SFR1
2800 SFR2Hα Err
03.0442 2.64 0.52 1.53 +1.30−1.53 1.52 11.54 +11.91
−2.70
03.0523 2.68 0.24 1.65 +0.62−0.68 4.20 107.353 +63.05
−31.90
03.0570 2.18 0.43 0.15 +1.30−0.15 1.80 3.27 +6.52
−1.48
03.0595 2.45 0.48 1.00 +1.30−1.00 2.00 18.70 +32.23
−7.30
03.0645 2.64 0.17 1.54 +0.46−0.49 3.33 37.76 +9.34
−5.67
03.1242 – – – – — – –03.1349 2.98 0.45 2.42 +1.01
−1.18 3.79 134.383 +151.16−48.25
03.1540 3.04 0.36 2.56 +0.82−0.93 4.39 88.503 +90.79
−36.20
22.0344 2.76 0.22 1.86 +0.56−0.61 1.67 27.57 +8.61
−4.64
22.0429 – – – – – – –22.0619 2.29 0.22 0.51 +0.66
−0.51 1.04 9.62 +3.00−1.46
22.0637 2.37 0.19 0.76 +0.56−0.61 3.69 5.25 +1.84
−0.99
22.0919 2.25 0.08 0.38 +0.27−0.28 2.41 8.42 +0.86
−0.64
22.1064 2.78 0.19 1.91 +0.48−0.51 1.61 37.66 +10.25
−6.09
Notes:1 SFR in [M⊙/yr], without correction for extinction2 SFR in [M⊙/yr] corrected from extinction calculated from the Hβ/Hγ ratio3 also detected by ISO (Flores et al, 2000, in preparation).
19
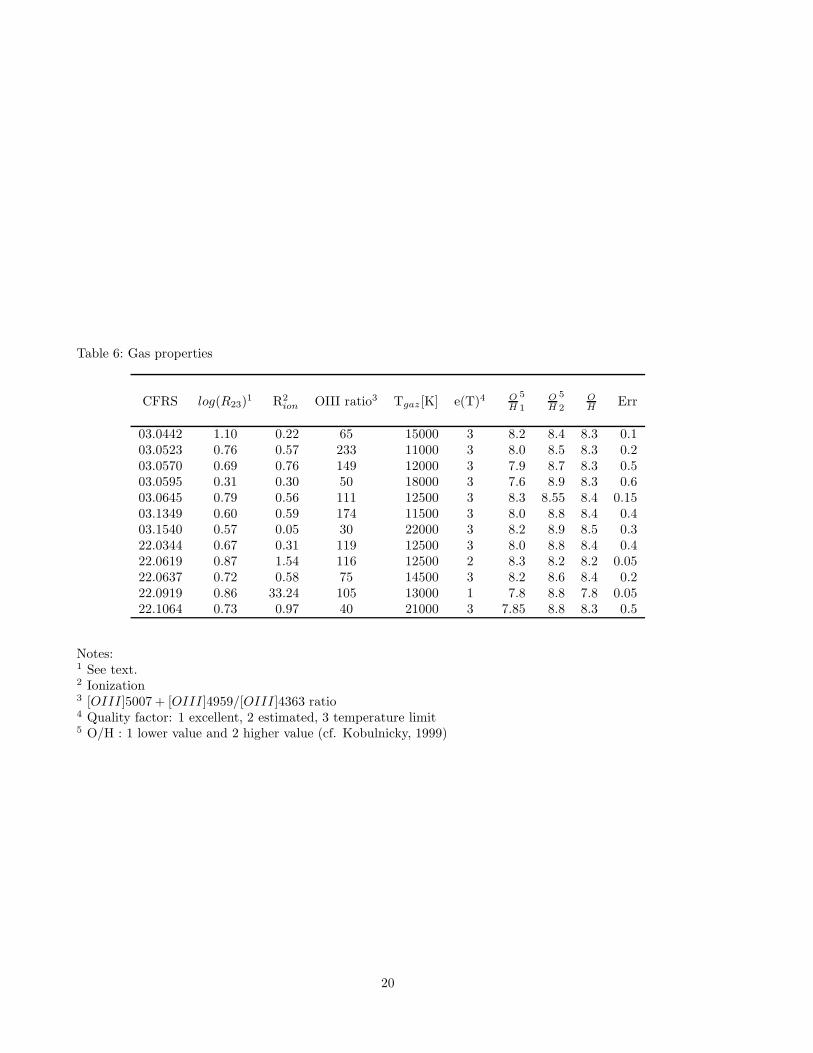
Table 6: Gas properties
CFRS log(R23)1 R2
ion OIII ratio3 Tgaz [K] e(T)4 OH
5
1
OH
5
2
OH Err
03.0442 1.10 0.22 65 15000 3 8.2 8.4 8.3 0.103.0523 0.76 0.57 233 11000 3 8.0 8.5 8.3 0.203.0570 0.69 0.76 149 12000 3 7.9 8.7 8.3 0.503.0595 0.31 0.30 50 18000 3 7.6 8.9 8.3 0.603.0645 0.79 0.56 111 12500 3 8.3 8.55 8.4 0.1503.1349 0.60 0.59 174 11500 3 8.0 8.8 8.4 0.403.1540 0.57 0.05 30 22000 3 8.2 8.9 8.5 0.322.0344 0.67 0.31 119 12500 3 8.0 8.8 8.4 0.422.0619 0.87 1.54 116 12500 2 8.3 8.2 8.2 0.0522.0637 0.72 0.58 75 14500 3 8.2 8.6 8.4 0.222.0919 0.86 33.24 105 13000 1 7.8 8.8 7.8 0.0522.1064 0.73 0.97 40 21000 3 7.85 8.8 8.3 0.5
Notes:1 See text.2 Ionization3 [OIII]5007 + [OIII]4959/[OIII]4363 ratio4 Quality factor: 1 excellent, 2 estimated, 3 temperature limit5 O/H : 1 lower value and 2 higher value (cf. Kobulnicky, 1999)
20
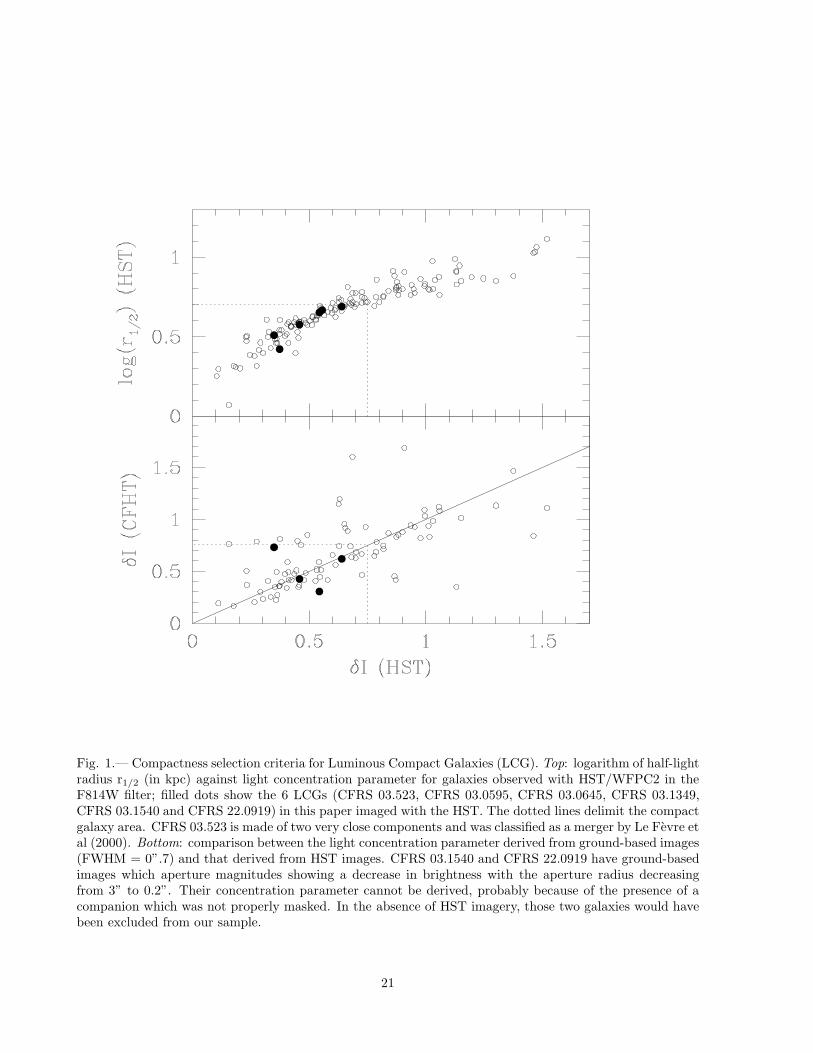
Fig. 1.— Compactness selection criteria for Luminous Compact Galaxies (LCG). Top: logarithm of half-lightradius r1/2 (in kpc) against light concentration parameter for galaxies observed with HST/WFPC2 in theF814W filter; filled dots show the 6 LCGs (CFRS 03.523, CFRS 03.0595, CFRS 03.0645, CFRS 03.1349,CFRS 03.1540 and CFRS 22.0919) in this paper imaged with the HST. The dotted lines delimit the compactgalaxy area. CFRS 03.523 is made of two very close components and was classified as a merger by Le Fevre etal (2000). Bottom: comparison between the light concentration parameter derived from ground-based images(FWHM = 0”.7) and that derived from HST images. CFRS 03.1540 and CFRS 22.0919 have ground-basedimages which aperture magnitudes showing a decrease in brightness with the aperture radius decreasingfrom 3” to 0.2”. Their concentration parameter cannot be derived, probably because of the presence of acompanion which was not properly masked. In the absence of HST imagery, those two galaxies would havebeen excluded from our sample.
21
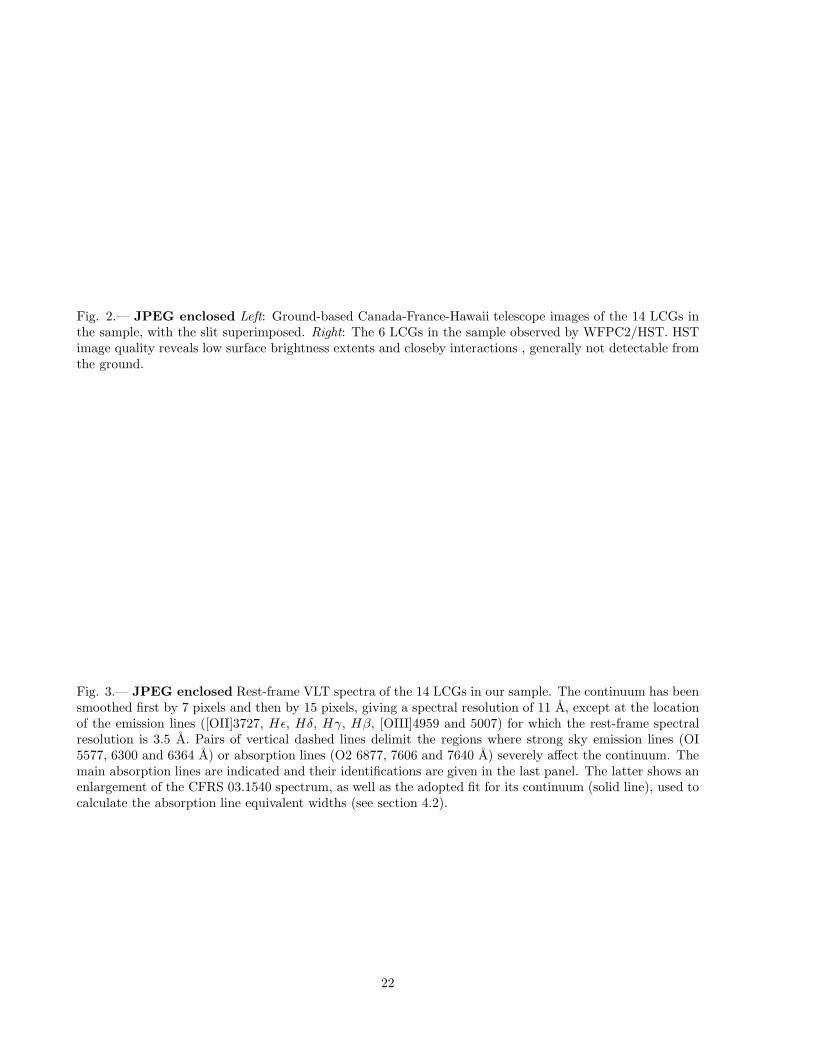
Fig. 2.— JPEG enclosed Left: Ground-based Canada-France-Hawaii telescope images of the 14 LCGs inthe sample, with the slit superimposed. Right: The 6 LCGs in the sample observed by WFPC2/HST. HSTimage quality reveals low surface brightness extents and closeby interactions , generally not detectable fromthe ground.
Fig. 3.— JPEG enclosed Rest-frame VLT spectra of the 14 LCGs in our sample. The continuum has beensmoothed first by 7 pixels and then by 15 pixels, giving a spectral resolution of 11 A, except at the locationof the emission lines ([OII]3727, Hǫ, Hδ, Hγ, Hβ, [OIII]4959 and 5007) for which the rest-frame spectralresolution is 3.5 A. Pairs of vertical dashed lines delimit the regions where strong sky emission lines (OI5577, 6300 and 6364 A) or absorption lines (O2 6877, 7606 and 7640 A) severely affect the continuum. Themain absorption lines are indicated and their identifications are given in the last panel. The latter shows anenlargement of the CFRS 03.1540 spectrum, as well as the adopted fit for its continuum (solid line), used tocalculate the absorption line equivalent widths (see section 4.2).
22
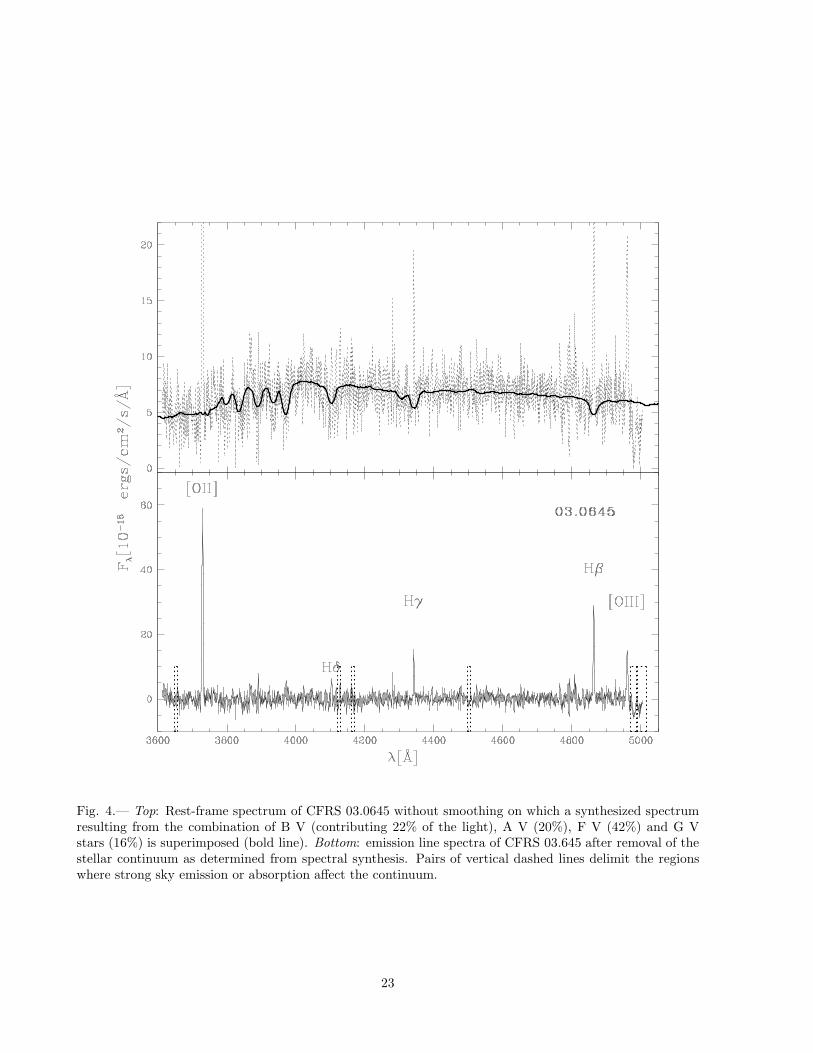
Fig. 4.— Top: Rest-frame spectrum of CFRS 03.0645 without smoothing on which a synthesized spectrumresulting from the combination of B V (contributing 22% of the light), A V (20%), F V (42%) and G Vstars (16%) is superimposed (bold line). Bottom: emission line spectra of CFRS 03.645 after removal of thestellar continuum as determined from spectral synthesis. Pairs of vertical dashed lines delimit the regionswhere strong sky emission or absorption affect the continuum.
23
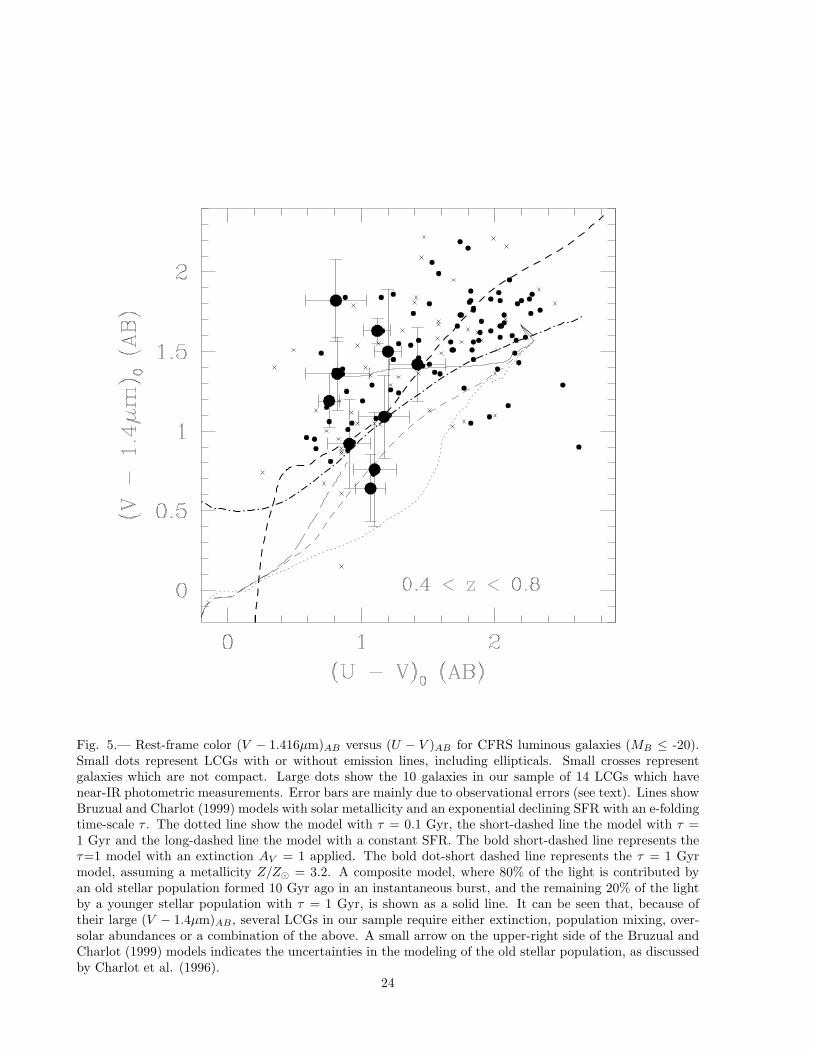
Fig. 5.— Rest-frame color (V − 1.416µm)AB versus (U − V )AB for CFRS luminous galaxies (MB ≤ -20).Small dots represent LCGs with or without emission lines, including ellipticals. Small crosses representgalaxies which are not compact. Large dots show the 10 galaxies in our sample of 14 LCGs which havenear-IR photometric measurements. Error bars are mainly due to observational errors (see text). Lines showBruzual and Charlot (1999) models with solar metallicity and an exponential declining SFR with an e-foldingtime-scale τ . The dotted line show the model with τ = 0.1 Gyr, the short-dashed line the model with τ =1 Gyr and the long-dashed line the model with a constant SFR. The bold short-dashed line represents theτ=1 model with an extinction AV = 1 applied. The bold dot-short dashed line represents the τ = 1 Gyrmodel, assuming a metallicity Z/Z⊙ = 3.2. A composite model, where 80% of the light is contributed byan old stellar population formed 10 Gyr ago in an instantaneous burst, and the remaining 20% of the lightby a younger stellar population with τ = 1 Gyr, is shown as a solid line. It can be seen that, because oftheir large (V − 1.4µm)AB, several LCGs in our sample require either extinction, population mixing, over-solar abundances or a combination of the above. A small arrow on the upper-right side of the Bruzual andCharlot (1999) models indicates the uncertainties in the modeling of the old stellar population, as discussedby Charlot et al. (1996).
24
0 5 10
0 5 10 0 5 10
Fig. 6.— (V −1.4µm)AB color index against equivalent widths of a) CaI 4227A, b) FeI 4384A, c) CH (G bandat 4301A) and d) CN band at 4182A. Red (V − 1.4µm)AB colors are related to strong metallic absorptionlines, i.e. either to large abundances or to old stellar populations. At least two galaxies, CFRS 03.1349 andCFRS 22.1064, deviate from the relationship, probably because their color indices are significantly affectedby extinction. In each panel the two crosses represent the properties of stellar clusters with solar metallicity,with ages of 5 Gyr (upper right) and 0.1 Gyr (bottom left) respectively. Comparison of the locations ofthe filled dots relative to the crosses in the four panels illustrates the fact that most LCG properties can befitted by a mix of a solar abundant old stellar population with a young population.
25
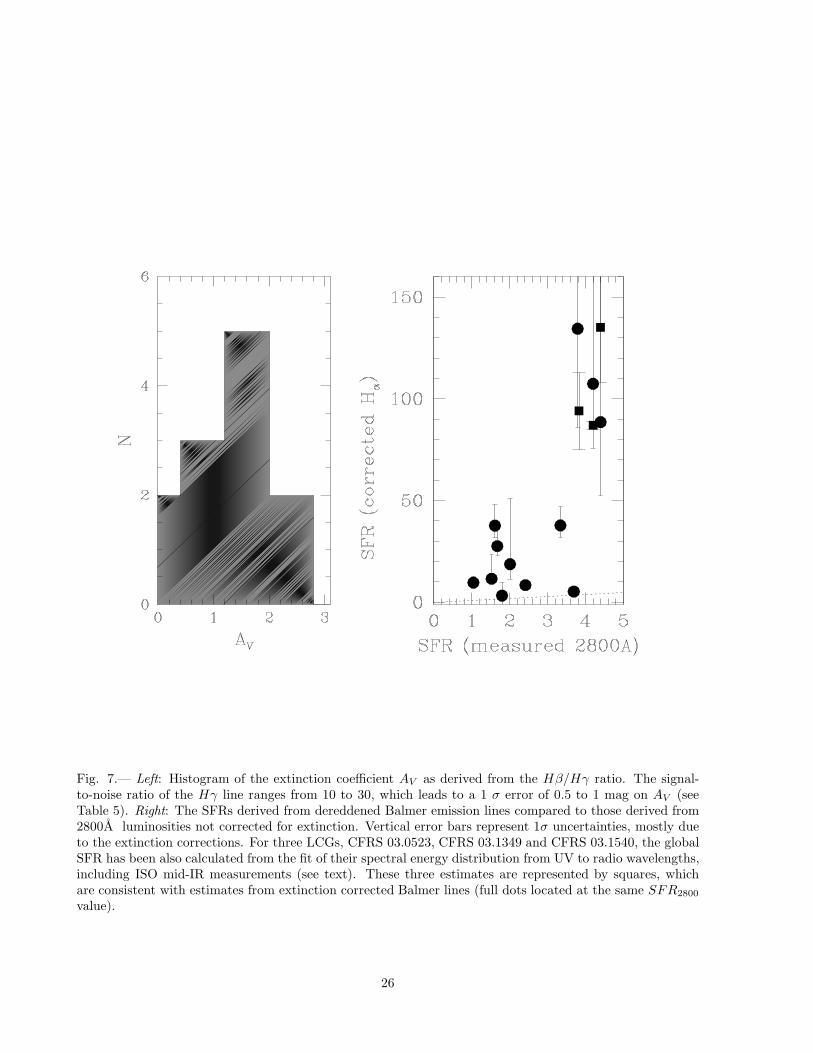
Fig. 7.— Left: Histogram of the extinction coefficient AV as derived from the Hβ/Hγ ratio. The signal-to-noise ratio of the Hγ line ranges from 10 to 30, which leads to a 1 σ error of 0.5 to 1 mag on AV (seeTable 5). Right: The SFRs derived from dereddened Balmer emission lines compared to those derived from2800A luminosities not corrected for extinction. Vertical error bars represent 1σ uncertainties, mostly dueto the extinction corrections. For three LCGs, CFRS 03.0523, CFRS 03.1349 and CFRS 03.1540, the globalSFR has been also calculated from the fit of their spectral energy distribution from UV to radio wavelengths,including ISO mid-IR measurements (see text). These three estimates are represented by squares, whichare consistent with estimates from extinction corrected Balmer lines (full dots located at the same SFR2800
value).
26
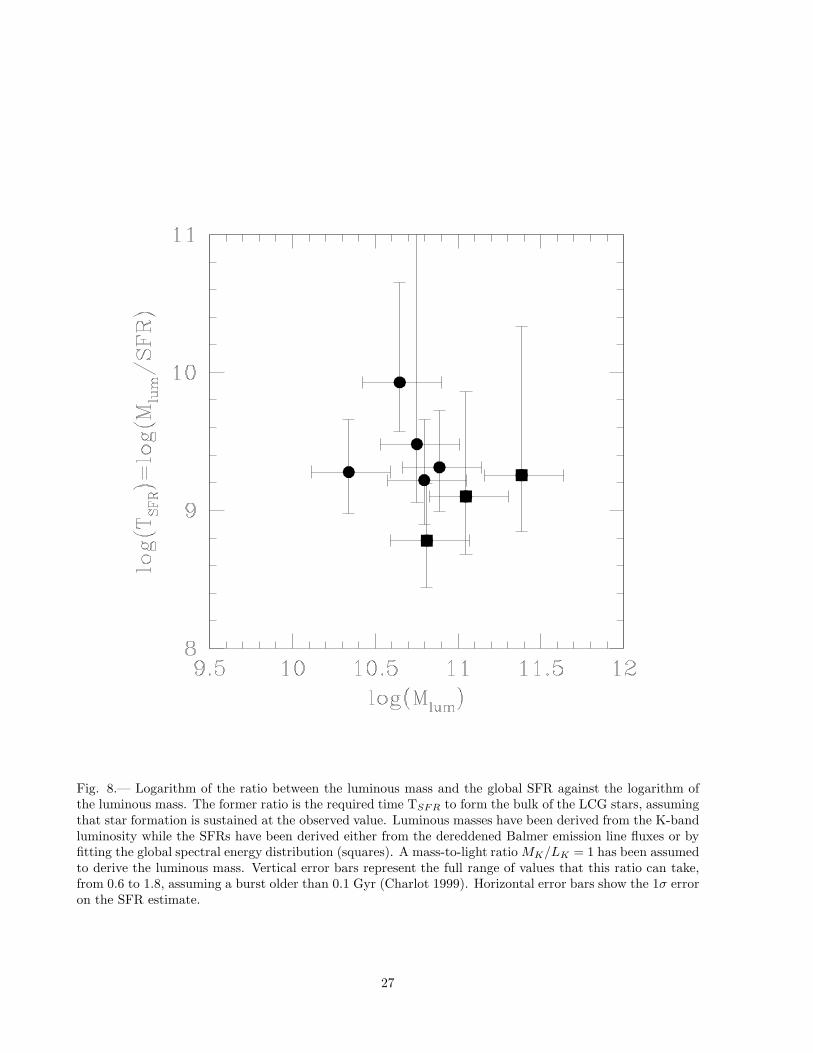
Fig. 8.— Logarithm of the ratio between the luminous mass and the global SFR against the logarithm ofthe luminous mass. The former ratio is the required time TSFR to form the bulk of the LCG stars, assumingthat star formation is sustained at the observed value. Luminous masses have been derived from the K-bandluminosity while the SFRs have been derived either from the dereddened Balmer emission line fluxes or byfitting the global spectral energy distribution (squares). A mass-to-light ratio MK/LK = 1 has been assumedto derive the luminous mass. Vertical error bars represent the full range of values that this ratio can take,from 0.6 to 1.8, assuming a burst older than 0.1 Gyr (Charlot 1999). Horizontal error bars show the 1σ erroron the SFR estimate.
27
This figure "Figure2.jpg" is available in "jpg" format from:
http://arxiv.org/ps/astro-ph/0011218v1
This figure "Figure3a.jpg" is available in "jpg" format from:
http://arxiv.org/ps/astro-ph/0011218v1

This figure "Figure3b.jpg" is available in "jpg" format from:
http://arxiv.org/ps/astro-ph/0011218v1
Copyright © 2022 FDOKUMEN