The SCUBA Half Degree Extragalactic Survey - IV. Radio-mm-FIR photometric redshifts
20
arXiv:0708.0845v1 [astro-ph] 6 Aug 2007 Mon. Not. R. Astron. Soc. 000, 000–000 (0000) Printed 6 August 2007 (MN L A T E X style file v2.2) The SCUBA HAlf Degree Extragalactic Survey (SHADES) – V. Submillimetre properties of near-infrared–selected galaxies in the Subaru/XMM–Newton deep field T. Takagi 1,2,3⋆ , A.M.J. Mortier 1,8 , K. Shimasaku 4 , K. Coppin 5,6 , A. Pope 5 , R. J. Ivison 7 , H. Hanami 9 , S. Serjeant 1 , D.L. Clements 2 , R. S. Priddey 10 , J. S. Dunlop 8 , T. Takata 11 , I. Aretxaga 12 , S. C. Chapman 13 , S.A. Eales 14 , D. Farrah 15 , G.L. Granato 16 , M. Halpern 5 , D.H. Hughes 12 , E. van Kampen 17 , D. Scott 5 , K. Sekiguchi 11 , I. Smail 6 , M. Vaccari 2 1 Centre for Astrophysics and Planetary Science, University of Kent, Canterbury, Kent CT2 7NR 2 Blackett Laboratory, Imperial College London, Prince Consort Road, London, SW7 2BZ 3 Institute of Space and Astronautical Science, Japan Aerospace Exploration Agency, Sagamihara, Kanagawa 229 8510, Japan 4 Department of Astronomy, School of Science, University of Tokyo, Tokyo 113-0033, Japan 5 Department of Physics & Astronomy, University of British Columbia, 6224 Agricultual Road, Vancouver, B.C., V6T 1Z1, Canada 6 Institute for Computational Cosmology, Durham University, South Rd, Durham, DH1 3LE 7 UK ATC, Royal Observatory, Blackford Hill, Edinburgh EH9 3HJ 8 SUPA†, Institute for Astronomy, University of Edinburgh, Royal Observatory, Edinburgh EH9 3HJ 9 Physics Section, Faculty of Humanities and Social Sciences, Iwate University, Morioka, 020-8550, Japan 1 0 Department of Physics, Astronomy & Mathematics, University of Hertfordshire, College Lane, Hatfield, Hertfordshire AL10 9AB 11 Subaru Telescope, National Astronomical Observatory of Japan, 650 N. A’ohoku Place, Hilo, HI 96720, USA 12 Instituto Nacional de Astrof´ ısica, ´ Optica y Electr´onica (INAOE), Apartado Postal 51 y 216, 72000 Puebla, Pue., Mexico 13 California Institute of Technology, 1200 East California Boulevard, Pasadena, CA 91125 14 Cardiff School of Physics and Astronomy, Cardiff University, 5, The Parade, Cardiff, CF24 3YB 15 Department of Astronomy, Cornell University, Space Sciences Building, Ithaca, NY 14853, USA 16 Istituto Nazionale di Astrofisica, Osservatorio Astronomico di Padova, Vicolo dell’Osservatorio 5, I-35100 Padova, Italy 17 Institute of Astro- and Particle Physics, University of Innsbruck, Technikerstr. 25, A-6020, Innsbruck, Austria ABSTRACT We have studied the submillimetre (submm) properties of the following classes of near- infrared (NIR)-selected massive galaxies at high redshifts: BzK-selected star-forming galaxies (BzKs); distant red galaxies (DRGs); and extremely red objects (EROs). We used the SCUBA HAlf Degree Extragalactic Survey (SHADES), the largest uniform submm survey to date. Partial overlap of SIRIUS/NIR images and SHADES in SXDF has allowed us to identify 4 submm-bright NIR-selected galaxies, which are detected in the mid-infrared, 24 μm, and the radio, 1.4GHz. We find that all of our submm-bright NIR-selected galaxies satisfy the BzK selection criteria, i.e. BzK ≡ (z - K) AB - (B - z ) AB ≥-0.2, except for one galaxy whose B - z and z - K colours are however close to the BzK colour boundary. Two of the submm-bright NIR-selected galaxies satisfy all of the selection criteria we considered, i.e. they belong to the BzK-DRG-ERO overlapping population, or ‘extremely red’ BzKs. Although these extremely red BzKs are rare (0.25 arcmin -2 ), up to 20 % of this population could be submm galaxies. This fraction is significantly higher than that found for other galaxy populations studied here. Via a stacking analysis, we have detected the 850-μm flux of submm-faint BzKs and EROs in our SCUBA maps. While the contribution of z ∼ 2 BzKs to the submm background is about 10–15% and similar to that from EROs typically at z ∼ 1, BzKs have a higher fraction (∼ 30 %) of submm flux in resolved sources compared with EROs and submm sources as a whole. From the SED fitting analysis for both submm- bright and submm-faint BzKs, we found no clear signature that submm-bright BzKs are experiencing a specifically luminous evolutionary phase, compared with submm- faint BzKs. An alternative explanation might be that submm-bright BzKs are more massive than submm-faint ones. Key words: galaxies: starburst – dust, extinction – infrared: galaxies – submillimetre – galaxies:evolution.
-
Upload
independent -
Category
Documents
-
view
0 -
download
0
Transcript of The SCUBA Half Degree Extragalactic Survey - IV. Radio-mm-FIR photometric redshifts

arX
iv:0
708.
0845
v1 [
astr
o-ph
] 6
Aug
200
7
Mon. Not. R. Astron. Soc. 000, 000–000 (0000) Printed 6 August 2007 (MN LATEX style file v2.2)
The SCUBA HAlf Degree Extragalactic Survey (SHADES)– V. Submillimetre properties of near-infrared–selectedgalaxies in the Subaru/XMM–Newton deep field
T. Takagi1,2,3⋆, A.M.J. Mortier1,8, K. Shimasaku4, K. Coppin5,6, A. Pope5,
R. J. Ivison7, H. Hanami9, S. Serjeant1, D.L. Clements2, R. S. Priddey10,
J. S. Dunlop8, T. Takata11, I. Aretxaga12, S. C. Chapman13, S.A. Eales14,
D. Farrah15, G.L. Granato16, M. Halpern5, D.H. Hughes12, E. van Kampen17,
D. Scott5, K. Sekiguchi11, I. Smail6, M. Vaccari21 Centre for Astrophysics and Planetary Science, University of Kent, Canterbury, Kent CT2 7NR2 Blackett Laboratory, Imperial College London, Prince Consort Road, London, SW7 2BZ3 Institute of Space and Astronautical Science, Japan Aerospace Exploration Agency, Sagamihara, Kanagawa 229 8510, Japan4 Department of Astronomy, School of Science, University of Tokyo, Tokyo 113-0033, Japan5 Department of Physics & Astronomy, University of British Columbia, 6224 Agricultual Road, Vancouver, B.C., V6T 1Z1, Canada6 Institute for Computational Cosmology, Durham University, South Rd, Durham, DH1 3LE7 UK ATC, Royal Observatory, Blackford Hill, Edinburgh EH9 3HJ8 SUPA†, Institute for Astronomy, University of Edinburgh, Royal Observatory, Edinburgh EH9 3HJ9 Physics Section, Faculty of Humanities and Social Sciences, Iwate University, Morioka, 020-8550, Japan10 Department of Physics, Astronomy & Mathematics, University of Hertfordshire, College Lane, Hatfield, Hertfordshire AL10 9AB11 Subaru Telescope, National Astronomical Observatory of Japan, 650 N. A’ohoku Place, Hilo, HI 96720, USA12 Instituto Nacional de Astrofısica, Optica y Electronica (INAOE), Apartado Postal 51 y 216, 72000 Puebla, Pue., Mexico13 California Institute of Technology, 1200 East California Boulevard, Pasadena, CA 9112514 Cardiff School of Physics and Astronomy, Cardiff University, 5, The Parade, Cardiff, CF24 3YB15 Department of Astronomy, Cornell University, Space Sciences Building, Ithaca, NY 14853, USA16 Istituto Nazionale di Astrofisica, Osservatorio Astronomico di Padova, Vicolo dell’Osservatorio 5, I-35100 Padova, Italy17 Institute of Astro- and Particle Physics, University of Innsbruck, Technikerstr. 25, A-6020, Innsbruck, Austria
ABSTRACTWe have studied the submillimetre (submm) properties of the following classes of near-infrared (NIR)-selected massive galaxies at high redshifts: BzK-selected star-forminggalaxies (BzKs); distant red galaxies (DRGs); and extremely red objects (EROs). Weused the SCUBA HAlf Degree Extragalactic Survey (SHADES), the largest uniformsubmm survey to date. Partial overlap of SIRIUS/NIR images and SHADES in SXDFhas allowed us to identify 4 submm-bright NIR-selected galaxies, which are detected inthe mid-infrared, 24µm, and the radio, 1.4GHz. We find that all of our submm-brightNIR-selected galaxies satisfy the BzK selection criteria, i.e. BzK ≡ (z−K)AB− (B−
z)AB ≥ −0.2, except for one galaxy whose B − z and z −K colours are however closeto the BzK colour boundary. Two of the submm-bright NIR-selected galaxies satisfyall of the selection criteria we considered, i.e. they belong to the BzK-DRG-EROoverlapping population, or ‘extremely red’ BzKs. Although these extremely red BzKsare rare (0.25 arcmin−2), up to 20% of this population could be submm galaxies. Thisfraction is significantly higher than that found for other galaxy populations studiedhere. Via a stacking analysis, we have detected the 850-µm flux of submm-faint BzKsand EROs in our SCUBA maps. While the contribution of z ∼ 2 BzKs to the submmbackground is about 10–15% and similar to that from EROs typically at z ∼ 1, BzKshave a higher fraction (∼ 30%) of submm flux in resolved sources compared withEROs and submm sources as a whole. From the SED fitting analysis for both submm-bright and submm-faint BzKs, we found no clear signature that submm-bright BzKsare experiencing a specifically luminous evolutionary phase, compared with submm-faint BzKs. An alternative explanation might be that submm-bright BzKs are moremassive than submm-faint ones.
Key words: galaxies: starburst – dust, extinction – infrared: galaxies – submillimetre– galaxies:evolution.

2 T. Takagi et al.
1 INTRODUCTION
The first 3–4 billion years in the history of the universe ap-pears to have been a very important epoch for the forma-tion of present-day massive galaxies, in particular for ellipti-cal galaxies and bulges with masses of M >
∼ 1011M⊙. Recentwide field near-infrared (NIR) surveys in conjunction withmulti-band optical images or spectroscopy have resulted ina profusion of samples of massive galaxies at high redshifts(e.g. Franx et al. 2003; Fontana et al. 2003; Dickinson et al.2003; Fontana et al. 2004; Cimatti et al. 2004; Glazebrooket al. 2004; Daddi et al. 2004; Juneau et al. 2005; Labbeet al. 2005; Drory et al. 2005; Reddy et al. 2005; Kong et al.2006; Papovich et al. 2006; Daddi et al. 2007; Arnouts et al.2007; Pozzetti et al. 2007). At z ∼ 2, the physical prop-erties of massive galaxies are very different from those ofpresent-day ones, i.e. a large fraction of them are intensivelystar-forming galaxies (e.g. Daddi et al. 2005), rather thanpassively evolving, like nearby ones. A notable character-istic of these massive star-forming galaxies is that, in somecases, a large total stellar mass ∼ 1011M⊙ could be formed inthe time-scale of a single starburst event, ∼ 0.1 Gyr (Perez-Gonzalez et al. 2005; Caputi et al. 2006; Papovich et al.2006).
Massive, intensively star-forming galaxies have alsobeen found in submillimetre (submm) surveys (Smail et al.1997; Hughes et al. 1998; Eales et al. 1999; Scott et al. 2002;Borys et al. 2003; Mortier et al. 2005; Coppin et al. 2006).These submm galaxies turn out to be typically starburstsor starburst/AGN composite systems at z ∼ 2 (Chapmanet al. 2005; Alexander et al. 2005, and references therein),which are massive (Swinbank et al. 2004; Greve et al. 2005).They are likely to become passively evolving massive galax-ies at lower redshifts (e.g. Smail et al. 2004; Blain et al.2004; Takagi et al. 2004). The star formation rates (SFRs)of submm-bright galaxies are estimated to be extraordinar-ily high, ∼ 103 M⊙ yr−1 (e.g. Greve et al. 2005; Alexanderet al. 2005; Chapman et al. 2005; Pope et al. 2006; Kovacset al. 2006), enough to produce a massive elliptical galaxy(> 3 L∗) within ∼ 1 Gyr. Determining the nature of thesestar-forming galaxies at high redshifts may be the key tounderstanding the process of massive galaxy formation.
Efficient methods for selecting massive star-forminggalaxies at high redshifts with one or two optical/NIRcolours have played a significant role in studying the prop-erties of massive galaxy populations. These include BzK-selected galaxies (selected in B − z and z −K colours), dis-tant red galaxies (selected with J−K colour), and extremelyred objects (selected with R−K or I−K colour). Hereafterwe call these galaxy populations NIR-selected galaxies orNIRGs.
Daddi et al. (2004) proposed an effective method for se-lecting massive star-forming galaxies at 1.4<
∼ z <∼ 2.5 along
with the selection of passively evolving galaxies at a sim-ilar redshift range in a colour-colour diagram of B − z vsz − K. It is expected to be reddening independent, i.e. ap-plicable to heavily obscured galaxies like ultraluminous in-frared galaxies (ULIRGs). Their luminosities at UV (red-dening corrected), infrared, X-ray and radio indicate thatBzK-selected star-forming galaxies (BzKs)1 with K < 20
1 Since we are studying cross-identifications between BzK-
are typically ULIRGs with SFRs of ∼ 200 M⊙ yr−1 and red-dening of E(B − V ) ∼ 0.4 (Daddi et al. 2004, 2005; Reddyet al. 2005; Kong et al. 2006).
In an alternative approach, Franx et al. (2003) em-ployed a colour cut of (J − Ks)Vega > 2.3 to select distantred galaxies (DRGs). This colour criterion selects both pas-sively evolving and heavily obscured star-forming galaxiesat 2 < z < 4.5 with strong Balmer or 4000A breaks. RecentSpitzer imaging at 24 µm suggests that the bulk of DRGsare dusty star-forming galaxies (Webb et al. 2006; Papovichet al. 2006). Similar to BzK-selected star-forming galaxies,DRGs are likely to be ULIRGs at z ∼ 2 (e.g. Knudsen et al.2005), but to also include a significant fraction of less lu-minous dusty star-forming galaxies at 1 < z < 2 (Grazianet al. 2006). Submm galaxies, another sample of ULIRGsat z ∼ 2, could have a large overlap with BzKs or DRGs,but with systematically higher SFR than the average (e.g.Dannerbauer et al. 2006).
Extremely red objects (EROs) defined with R − K orI − K colours have received particular attention as possi-ble optical-NIR counterparts of submm galaxies (e.g. Smailet al. 1999; Webb et al. 2003; Pope et al. 2005), since submmgalaxies are expected to be heavily obscured by dust andtherefore red. However, it turns out that only 10–30 % ofsubmm galaxies, whose optical counterparts are identifiedwith associated radio sources, are EROs (Ivison et al. 2002;Webb et al. 2003; Borys et al. 2004; Smail et al. 2004). Themedian redshift of EROs with KVega < 19.2 is z = 1.1± 0.2(Cimatti et al. 2002), and therefore lower than that of re-solved submm-bright galaxies, BzKs and DRGs. Neverthe-less, there is certainly some overlap between their redshiftdistributions.
It is important to understand the the physical relation-ships between these high-z massive star-forming galaxieswhich are selected in different ways (e.g. see Reddy et al.2005). The surface density of BzKs, DRGs and EROs issimilar to each other, about 1–2 arcmin−2 with KVega <
∼ 20(Daddi et al. 2004; Cimatti et al. 2002; van Dokkumet al. 2003). A similar surface density has been found forsubmm galaxies with S850µm >
∼ 1mJy (e.g. Blain et al. 1999),although the surface density of bright (S850µm >
∼ 8mJy)submm galaxies in ‘blank sky’ surveys is at least an order ofmagnitude smaller. Understanding the physical origin of theoverlap between submm galaxies and NIR-selected galaxiesis not straightforward, given the diverse optical-NIR proper-ties of submm galaxies, which include those similar to less-attenuated UV-selected galaxies as well as EROs (e.g. Smailet al. 2002, 2004).
Here we study the submm properties of BzKs, DRGsand EROs by using the SCUBA HAlf Degree Extragalac-tic Survey (SHADES – Mortier et al. 2005), providing alarger sample of submm galaxies for investigating the rela-tion between submm galaxies and NIRGs than the studyof Reddy et al. (2005) for galaxies in the GOODS-Northfield. SHADES has mapped two regions in the LockmanHole and in the Subaru/XMM–Newton deep field (SXDF).In this study, we focus on a 93 arcmin2 sub-region of the
selected galaxies and submm galaxies, star-forming galaxies se-lected with this method are simply referred to as BzK-selectedgalaxies or BzKs.

Submm properties of NIR-selected galaxies in SHADES/SXDF 3
SXDF field of SHADES, in which both optical (BV Ri′z′)and NIR (JHKs) photometry are already available. We de-scribe the data in Section 2 and the sample of NIR-selectedgalaxies in Section 3. In Section 4, we identify submm-brightNIR-selected galaxies and assess the overlap between submmgalaxies and NIR-selected galaxies. In Section 5, we presentthe results of a statistical detection of NIR-selected galax-ies in the SCUBA map using a stacking analysis. In Sec-tion 6, we analyse the spectral energy distributions (SEDs)of submm-bright NIR-selected galaxies and also an averageSED of submm-faint NIRGs, in order to investigate theirphysical properties. Summary of our study is given in Sec-tion 7. Throughout this paper, we adopt the cosmology ofΩm = 0.3, ΩΛ = 0.7 and H0 = 70 kmsec−1 Mpc−1. All themagnitudes are given in the AB system, unless otherwisenoted.
2 THE DATA
2.1 Optical/NIR data in the SXDF
We have used the optical and NIR imaging data of theSXDF centred at [2h18m00s, −500′00′′ (J2000)] publishedby Miyazaki et al. (2003). The NIR data were obtained withthe University of Hawaii 2.2 m telescope with the Simultane-ous 3-colour InfraRed Imager for Unbiased Survey (SIRIUS;Nagayama et al. 2003). The final image covers an area of114 arcmin2 in the H- and Ks-bands. For the J-band, weobtained data only for 77 arcmin2, since a quarter of thefield of view was not operational. The 5 σ detection lim-its of the final NIR image are J = 22.8, H = 22.5 andKs = 22.1 mag, through a 2′′ diameter aperture. From thefinal image in the Ks-band, we have detected 1308 objectshaving Ks < 22.1 mag using SExtractor (Bertin & Arnouts1996). Throughout this work we use the total magnitudesin the optical-NIR bands measured with the MAG AUTOalgorithm in SExtractor.
For these Ks-band detected objects, we made a multi-band catalogue using optical images of Subaru/Suprime-cam(Miyazaki et al. 2002) in B, V , R, i′, z′ bands2. The limitingmagnitudes (5 σ) of our images are B = 27.1, V = 25.9,R = 26.3, i′ = 25.7, z′ = 25.0 mag through a 2′′ diameteraperture. The FWHM of the point-spread function is 0.98′′
in both the optical and NIR images. Stars were identifiedwith the colour criterion of B−Ks < 1.583(B− i′)−0.5 andFWHM ≤ 1.2′′ (Miyazaki et al. 2003), and removed fromthe analysis.
2.2 Submm/radio data from SHADES
Details of the survey design and observing strategy withJCMT/SCUBA are given in Mortier et al. (2005). Here wedescribe the SHADES survey only briefly. Using the SCUBAinstrument on the JCMT we have obtained jiggle maps ofthe SXDF and also the Lockman Hole in grade 2–3 weather(τCSO = 0.05 − 0.1). The FWHM of the SCUBA beamis 14.7′′ and 7.8 ′′ at 850 and 450 µm, respectively. TheSHADES observations with SCUBA were continued from
2 Our data were obtained during the commissioning phase of theSuprime-cam.
December 2002 to the decommissioning of SCUBA in June2005. Here we use the SCUBA data acquired until 1st Feb,2004.
The SCUBA data have been reduced by four indepen-dent groups in the SHADES consortium. Practical methodsof data reduction, such as flux calibration, extinction cor-rection, and map making depends on the reduction groupand are summarised in Coppin et al. (2006). The extractedsources from four different SCUBA maps have been com-pared and then combined to produce the SHADES sourcecatalogue, which is expected to be the most reliable sourcecatalogue from SCUBA surveys. In our analyses, we focuson two particular SCUBA maps out of four, along with theSHADES source catalogue, in order to make the sample ofsubmm-bright NIRGs as complete as possible.
We have chosen to use only regions with noise lessthan 3mJy at 850 µm. The total area of this region is∼250 arcmin2. The field centre for the SHADES map of theSXDF, 02h17m57s.5, −0500′18′′.5 (J2000), is offset fromthat of the SIRIUS observations and hence our sub-mmmaps do not cover the whole region covered by the NIR data.In one of the four SCUBA maps (‘Reduction B’ in Coppinet al.), this overlap is 93 arcmin2, with median noise levelsof 2.0 mJy and 18.4 mJy at 850 and 450 µm, respectively.
Wide-field 1.4-GHz radio images of SXDF were ob-tained using the VLA during 2003. Around 60 hr of inte-gration were salvaged, following a prolonged failure of thecorrelator, comprising data from the A, B and C configu-rations, with an approximate 9:3:1 ratio of recorded visi-bilities, evenly distributed in three pointings separated by15 arcmin. The final images were mosaiced together, aftercorrecting for the response of the primary beam. The re-sulting noise level is around 7 µJy beam−1 in the best regionsof the map (rather higher near bright, complex radio emit-ters) with a synthesised beam measuring 1.87× 1.65 arcsec(FWHM), major axis 22 east of north. The data and theirreduction are described in detail in Ivison et al. (2007).
2.3 Spitzer data from SWIRE
The whole area of our Ks-band image is covered by theSpitzer Wide-area InfraRed Extragalactic survey (SWIRE;Lonsdale et al. 2003). We used the IRAC+24µm cata-logue from version 2.0 data products (released in Sum-mer 2005), available from the NASA/IPAC Infrared Ser-vice Archive (IRSA). We adopted the Kron fluxes, whichare MAG AUTO fluxes from SExtractor, in order to com-pare with the ground-based optical-NIR photometry. Thiscatalogue includes IRAC sources which are detected at both3.6 µm (> 10 σ) and 4.5 µm (> 5σ). The astrometric errorof the IRAC sources is small enough to easily identify coun-terparts of NIRGs with the angular separation of <
∼ 0.5′′. Inthe SIRIUS/Ks-band region, the faintest sources at 24 µmin the catalogue have a flux of ∼300µJy. Cross-correlationbetween the SHADES sources and the SWIRE sources inSXDF is given in Clements et al. (2007, in preparation).

4 T. Takagi et al.
3 SAMPLE OF NIR-SELECTED GALAXIES ATHIGH REDSHIFTS
3.1 EROs and DRGs
Following Miyazaki et al. (2003), we define EROs as objectswith R−Ks > 3.35, which is equivalent to (R−K)Vega >
∼ 5,i.e. the widely used criterion of EROs. In order to obtainthe DRG sample, we use the threshold of J −Ks > 1.32 (i.e.>∼ 2.3 in Vega magnitudes). Within the SHADES area, wehave detected 201 EROs and 67 DRGs in total, among which39 objects satisfy both R − Ks > 3.35 and J − Ks > 1.32.In Figure 1, we show a colour-colour plot with R − Ks andJ−Ks for Ks-band detected objects, along with the adoptedcolour criteria. The statistics of NIRGs are summarised inTable 1.
We derived a surface density of 2.18 ± 0.14 and 1.09 ±0.12 arcmin−2 (Poissonian errors) for EROs and DRGs, re-spectively. By using the same data, Miyazaki et al. (2003)found a good agreement in the surface density of EROswith those of the other surveys with areas of > 50 arcmin2
(Cimatti et al. 2002; Daddi et al. 2000; Thompson et al.1999). The surface density of DRGs is coincidentally verysimilar to that derived by van Dokkum et al. (2003), al-though the Ks-band limiting magnitude in van Dokkumet al. (2003) is ∼ 0.7 mag deeper than ours. Thus, we find ahigher surface density of Ks <
∼ 20 DRGs than in van Dokkumet al. (2003). This could be partly because of the contam-ination of the sample at Ks > 21.5 where the detection ofDRGs at J-band is possible only below 4 σ.
3.2 BzK-selected star-forming galaxies
Daddi et al. (2004) proposed a joint selection of star-forminggalaxies and passively evolving galaxies in the redshift rangeof z = 1.4–2.5 in the z − K vs B − z diagram (here-after ‘BzK diagram’). Following Daddi et al. (2004), wechoose BzK-selected galaxies with BzK ≥ −0.2, whereBzK ≡ (z − K) − (B − z). In order to adjust the selec-tion in our photometric bands to that of Daddi et al., wecompared the stellar sequence in the BzK diagram withthat of Daddi et al. (2004). To match the stellar sequence,we applied the following colour corrections: (B − z)Daddi =(B − z′) + 0.2 and (z − K)Daddi=(z′ − K) − 0.2. After thiscorrection, we obtained 132 BzK-selected galaxies withinthe SHADES area.
We obtained a surface density of 1.1 arcmin−2 for Ks <20 (Vega). This surface density is consistent with thatof Daddi et al. (2005), who found 169 BzKs within 154arcmin2, including X-ray detected objects, in the GOODSNorth region. Thus, we assume there are no systematic dif-ferences between our sample and that of Daddi et al. (2005).In Figure 2, we plot the raw BzK colour (i.e. with no colourcorrections) of Ks-band detected objects against Ks magni-tudes along with the photometric errors.
4 IDENTIFICATION OF SUBMM-BRIGHTNIRGS
4.1 Method of identification
In order not to miss any candidate submm-bright NIRGs,we utilized two SCUBA 850-µm maps which have differentpixel size produced by independent reductions and reportedin Coppin et al. (2006 – Reductions B and D). The pixel sizesof the SCUBA 850-µm map from Reductions B and D are1′′ and 3′′, respectively. One benefit of using SCUBA maps,rather than the SHADES source catalogue, is the possibilityof identifying additional submm sources which are just be-low the limit of the SHADES catalogue. This is a reasonableapproach, since we know the sky positions of targets before-hand (and see Appendix A for a statistical discussion).
We adopted the threshold of S/N > 3 for the detectionof submm fluxes at the positions of NIRGs. In order to con-firm the detection of NIRGs in SCUBA maps, we need to ex-clude the possibility of; 1) chance association with a nearbySCUBA source; and 2) false positive detections. Sources inthe SHADES catalogue should be quite reliable, since theyare extracted using 4 independent reductions. If there areno SHADES catalogue sources corresponding to detectedNIRGs, we need to pay special attention to check the reli-ability of the detection in the SCUBA map. To overcomethese problems, we use the Spitzer images at 24 µm andthe VLA radio images at 1.4 GHz as they have proved tobe useful in previous studies (e.g. Ivison et al. 2002; Egamiet al. 2004). The identification of SHADES sources has beenundertaken by Ivison et al. (2007). We confirmed that ourresults are consistent with their identifications. For non-SHADES sources, we require detection at 24 µm or in theradio for secure identification of submm-bright NIRGs.
We also obtained 450-µm images simultaneously withthe 850-µm images, although the weather conditions allo-cated for SHADES were not good enough to detect typical850-µm sources at 450 µm in the same integration time. Wehave however used the 450 µm map to constrain the 450-µm flux for the detected 850-µm sources. The reduction of450 µm data is fully described in Coppin et al. (2006).
4.2 Results
Among 307 NIRGs in the SHADES/SIRIUS Ks-band area(245 fall in J-band area), we detected 5 NIRGs at 850µmas a result of photometry at the position of NIRGs in theSHADES B-map (i.e. the SCUBA 850 µm map from Re-duction B). We also detected 5 NIRGs at 850µm in theSHADES D-map, four of which are common with those de-tected in the SHADES B-map. The results of the sub-mmdetections from both SHADES maps are summarised in Ta-ble 2. All of the submm-detected NIRGs except fo ID1390have corresponding SHADES catalogue sources. Although asubmm source for ID1390 (SXDF850.62) was included in apreliminary SHADES source catalogue, this source did notsatisfy the final significance limit adopted for the SHADEScatalogue presented by Coppin et al. (2006). However, wefound that ID1390 is detected both at 24 µm and in the ra-dio, and therefore we conclude that this is a real submmgalaxy (see also Appendix A). In the 450-µm map, we findno convincing detections at the positions of NIRGs. This

Submm properties of NIR-selected galaxies in SHADES/SXDF 5
is not unexpected given the high noise level in the 450µmmaps.
Three (ID300, 445, 912) out of six submm-detectedNIRGs are identified as optical counterparts of correspond-ing SHADES sources in Ivison et al. (2007). Additionally, wefind ID1390 as an optical-NIR counterpart of SXDF850.62 (anon-SHADES source), since this galaxy is detected at 24 µmand in the radio as noted above. In summary, we identifyfour submm-bright NIRGs. Figure 3 shows the 850-µm con-tours plotted over Ks-band images of submm-bright NIRGs.Figure 3 also shows the radio contours over R-band imagesof the same NIRGs. The remaining two submm-detectedNIRGs (ID718 and ID1133) are detected neither in the radionor at 24 µm. Such chance associations are expected and thenumber is consistent with the estimate given in AppendixA. For a submm source associated with ID1133, Ivison etal. (2007) found another reliable optical counterpart with aradio detection. Considering these results, we exclude bothID718 and 1133 from further analyses.
In order to check additional candidates for optical-NIRcounterparts of the SHADES catalogue sources, we alsosearched for NIR-selected galaxies within 7′′ radius of theSHADES positions. Although we found two additional as-sociations (ID475 and 579), they are not detected either at24 µm or in the radio. Therefore, this alternative methoddoes not produce any further submm-bright NIRGs for oursample.
4.3 Relation between submm galaxies and NIRGs
In Table 3, we tabulate the optical-NIR properties ofsubmm-bright NIRGs. Note that all of the submm-brightNIRGs are BzK-selected galaxies, except for ID1390 withBzK = −0.36, although it satisfies BzK ≥ −0.2 before thecolour correction on B − z and z −K. This also means thatno EROs and DRGs which are clearly non-BzK galaxiesare detected at 850 µm. The distribution of submm-brightNIRGs in the B − z vs z − K colour-colour diagram is dis-cussed in detail in Section 6.1.
Two galaxies, ID300 and ID445, satisfy all the colourselection criteria we adopted, i.e. BzK ≥ −0.2, R − K >3.35 and J − K > 1.32. Hereafter, we refer to this BzK-DRG-ERO overlapping population as extremely red BzK-selected galaxies. We found only 16 extremely red BzKs inthe combined Ks and SHADES areas, corresponding to asurface density of only 0.25 ± 0.05 arcmin−2. This meansthat 12 ± 8% (2/16)3 of extremely red BzKs are submmgalaxies. Although the sample is very small, neverthelessit may indicate that this rare NIR galaxy population hasa much higher fraction of submm galaxies, compared withthe other optical-NIR selected galaxy populations alreadystudied. For example, the fractions of submm galaxies whichare BzKs, EROs and DRGs in our sample are 4/132 (3± 2%), 3/201 (1.5 ± 1 %) and 3/67 (5 ± 3 %), respectively.
We found that there are 20 (13) SHADES sources inthe SIRIUS/Ks-band (J-band) area, among which three are
3 The errors on fractions, f , are given by
√
f(1−f)n
where n is
the total number of the sample. This gives a rough estimate basedon the normal approximation to the binomial distribution.
BzK-selected and two satisfy both the ERO and DRG se-lection. The resulting fractions of BzKs, EROs and DRGsin our sub-sample of SHADES sources are 15 ± 8 %, 10 ± 7% and 15 ± 10 %, respectively. Thirteen SHADES sourcesout of 20 have a robust radio identification (Ivison et al.2007). If we confine our attention to SHADES sources witha robust radio identification, the above fractions of NIRGsare higher by a factor of ∼1.5.
Ivison et al. (2002) found an ERO fraction of 33 %(6/18) in SCUBA sources with robust radio identificationfrom the 8-mJy survey, in which one ERO is too faint tobe detected at our detection limit in the Ks-band. Reddyet al. (2005) studied the BzK and DRG fraction of submmgalaxies with S850µm >
∼ 5mJy in the GOODS-North field.Out of 11 radio-detected submm galaxies, they found that5 (45±15 %) and 3 (27± 13%) objects satisfy the BzK andDRG criteria, respectively. For these submm-bright BzKand DRG samples, 2 objects each are too faint to be de-tected at our detection limits. Subtracting these K-bandfaint sources would give the BzK and DRG fractions of27±13 % and 9±8%, respectively. On the other hand, Daddiet al. (2005) found only one BzK-selected galaxy in the listof submm sources in Pope et al. (2005) in the GOODS-Northfield. These results are not inconsistent with ours, consider-ing the large errors, due to a small sample size and cosmicvariance.
Since the redshift distribution of BzKs has a large over-lap with that of submm galaxies, and both classes of objectare star-forming galaxies, one could expect a large fractionof BzKs within the submm galaxy population. We roughlyestimate the expected fraction of BzKs in submm galaxysamples as follows, based on the results of the redshift surveyof radio-detected submm galaxies by Chapman et al. (2005).In their sample of radio-detected submm galaxies, the frac-tion of galaxies at 1.4 < z < 2.5 is about 45 %. This fractionshould be corrected for the incompleteness of the sample,mainly due to the redshift desert at 1.2 < z < 1.8. Giventhe 20% incompleteness at z ≃ 1.2–1.8 estimated by Chap-man et al. (2005), the fraction of galaxies at 1.4 < z < 2.5may be in the range of 35–45 %. If BzKs are an almostcomplete sample of star-forming galaxies at 1.4 < z < 2.5,including heavily obscured objects, most of radio-detectedsubmm galaxies at 1.4 < z < 2.5 may be selected as BzKs.In our SHADES/SIRIUS field, there are 13 radio-detectedSHADES catalogue sources. Therefore, one may expect that4–6 of them are BzKs. From the K-band magnitude ofradio-detected submm galaxies of Smail et al. (2004), wefound that ∼65% of radio-detected submm galaxies are de-tectable at the detection limit of our Ks-band image. Thus,we expect that at most ∼4 radio-detected submm galaxieswould be BzKs in our sample. This rough estimate is con-sistent with the results above, since we found 3 such radio-detected submm galaxies. Although the sample is small, thissuggests that the BzK selection technique is effective evenfor submm galaxies, i.e. heavily obscured galaxies with ex-tremely high SFR. Thus, submm galaxies at z ∼ 2 mayhave the largest overlap with BzK-selected galaxies, whencompared to EROs and DRGs. In Section 6.2.3, we discussthe implications of this, using a radiative transfer model ofstarburst galaxies.
The results presented here are hampered by small sam-ple size, partly due to the limited overlap between our NIR

6 T. Takagi et al.
images and the SHADES field. Both of the SHADES fieldshave been covered by the UKIRT Infrared Deep Sky Survey(UKIDSS – Lawrence et al. 2006). In the near future it willtherefore be possible to study the submm properties of alarge sample of NIRGs using the UKIDSS data.
5 STACKING ANALYSIS FOR SUBMM-FAINTNIRGS
We can try to extract a little more information about thesubmm galaxies/NIRG overlap by looking at the statisticalcorrelations within the images. Here we estimate the average850-µm flux of submm-faint NIRGs and the contribution tothe extragalactic background light (EBL) from each class ofobjects.
We first eliminated the effects of resolved submmsources in our SCUBA maps. In the B-map, we excludedregions within 7′′ of the SHADES catalogue sources. In theD-map, all the SHADES sources and their associated nega-tive off-beams were removed before measuring the flux. Forthis cleaned D-map, we confirmed that random positionsgive a variance-weighted average flux of zero. Although anon-SHADES source for ID1390 is not removed from themaps, its effect is negligible.
In Figures 4–6, we show the histogram of measured fluxat the position of NIRGs in the B-map, compared with thatof the map as a whole. The significance of the difference be-tween the distributions of the map and the measured fluxeswas estimated with the Kolmogorov-Smirnov test. The fluxdistributions of BzKs and EROs were found to be differentfrom that of the map as a whole, with a significance of 2–3 σ(see Table 4). For DRGs, we found no significant detectionfrom the Kolmogorov-Smirnov test using 56 objects. As acomparison, Knudsen et al. (2005) detected an average fluxof 0.74 ± 0.24 mJy for DRGs (excluding discrete sources)with a smaller sample of 30, but with a lower noise SCUBAmap. A possibly large contamination in our DRG sample,owing to the shallow J-band data, might cause no significantdetection.
From the B-map, we obtained an average flux of 0.52±0.19 and 0.53± 0.16 mJy for BzKs and EROs, respectively.We measured the average flux of data between the first andthe third quartiles of the sample, which is a robust measureagainst outliers. The errors are given by the median absolutedeviation. Table 4 gives a summary of the stacking analysisusing the B-map. The noise-weighted average flux of BzKs,EROs, and DRGs measured in the D-map is 0.64 ± 0.16,0.50±0.13 and 0.42±0.23 mJy, respectively, which are con-sistent with the results from the B-map. The derived aver-age fluxes of BzKs and EROs are consistent with previousstudies in other sky regions (Webb et al. 2004; Daddi et al.2005)4. In the following discussion, we use the average fluxof submm-faint BzKs and EROs from the B-map.
We next estimate the contribution from each class ofobject to the EBL at 850 µm. The total flux from individ-ually detected sources is added to the estimated total flux
4 Note that Daddi et al. (2005) derived an average flux of 1.0 ±0.2mJy for ‘24 µm-detected’ BzKs. Including 24 µm-undetectedobjects, this average becomes 0.63 ± 0.17mJy in the GOODS-North field
from undetected objects. The values obtained for the EBLfrom BzKs and EROs are 3.8 ± 1.2 and 5.1 ± 1.5 Jy deg−2,respectively. The measured 850 µm EBL is 31 Jy deg−2 inPuget et al. (1996) and 44 Jy deg−2 in Fixsen et al. (1998),i.e. there is a relatively large uncertainty on the absolutelevel. The contribution from BzKs and EROs are both 10–15% each, depending on the adopted value of the EBL. Thismodest contribution is also suggested by a comparison ofthe surface density of objects. For example, the surface den-sity of BzKs, ∼ 1.5 arcmin−2 is a factor of ∼ 5 smaller thanthat of >0.5 mJy SCUBA sources, ∼ 7 arcmin−2 (Blain et al.1999; Cowie et al. 2002) at which flux density level the back-ground is close to complete.
We also estimate the resolved fraction of the EBL orig-inating from a given galaxy population only. The resolvedfraction of the EBL from BzKs is at least ∼ 30 %, whichcould be higher than that found in EROs. The detectedsources in our sample correspond to >
∼ 3.5 σ sources whenwe measure the peak flux in the SCUBA map with the noiselevel of ∼ 2mJy. From the 8-mJy survey, which has a similarnoise level, Scott et al. (2002) found that >
∼ 3.5 σ sources ac-count for ≃ 10% of the EBL. Thus, the submm flux of BzKsis apparently biased high; i.e. a large fraction of the submmfluxes from BzKs are found in resolved bright sources.
Recently, Wang et al. (2006) suggested that the major-ity of the EBL at 850 µm originates from submm-undetectedgalaxies at z <
∼ 1.5. On the other hand, the majority ofsubmm-detected galaxies, i.e. resolved sources, lie at z >
∼ 1.5(Chapman et al. 2005). This suggests that the resolved frac-tion of the EBL varies as a function of redshift. If we studythe EBL only from galaxy populations at z >
∼ 1.5 like BzKs,the contribution from submm-undetected galaxies to theEBL would be significantly reduced. This may explain whythe resolved fraction of the EBL from z ∼ 2 BzKs is higherthan that from EROs typically at z ∼ 1.
6 SED ANALYSIS OF SUBMM-BRIGHTNIRGS
In this section, we investigate the physical properties ofsubmm-bright NIRGs from the observed SEDs. Firstly, weexamine the distribution of submm-bright NIRGs in theB−z vs z−K colour-colour plot, i.e. BzK diagram. Specif-ically, we compare the properties of submm-bright NIRGswith those of 24 µm-detected NIRGs. Secondly, we applyan evolutionary SED model of starbursts to submm-brightNIRGs for a more detailed study of each object. Also, westudy the properties of submm-faint NIRGs from an aver-age SED, which are compared with those of submm-brightNIRGs.
6.1 Submm-bright NIRGs in the BzK diagram
The fraction of BzKs in a galaxy population would de-pend on its redshift distribution; i.e. low-z galaxy popula-tion would have a small fraction of BzKs. Figure 7 showsthe BzK diagram for all the Ks-detected objects in theSXDF/SIRIUS field. While NIRGs have a wide range ofB − z, i.e. 0 <
∼ (B − z)<∼ 6, submm-bright NIRGs favour the
colour range 1<∼ (B − z)<
∼ 3, with BzK >∼ − 0.2. This is
not the case for general 24µm-detected objects, which have
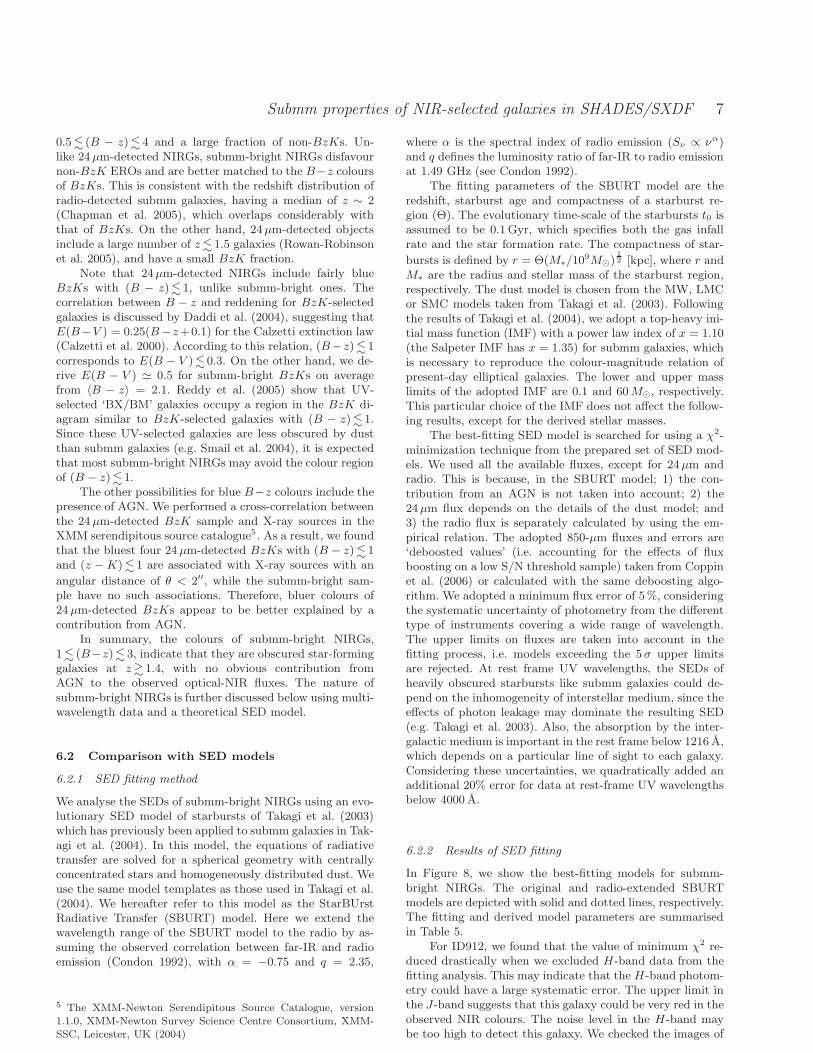
Submm properties of NIR-selected galaxies in SHADES/SXDF 7
0.5 <∼ (B − z) <
∼ 4 and a large fraction of non-BzKs. Un-like 24 µm-detected NIRGs, submm-bright NIRGs disfavournon-BzK EROs and are better matched to the B−z coloursof BzKs. This is consistent with the redshift distribution ofradio-detected submm galaxies, having a median of z ∼ 2(Chapman et al. 2005), which overlaps considerably withthat of BzKs. On the other hand, 24 µm-detected objectsinclude a large number of z <
∼ 1.5 galaxies (Rowan-Robinsonet al. 2005), and have a small BzK fraction.
Note that 24µm-detected NIRGs include fairly blueBzKs with (B − z)<
∼ 1, unlike submm-bright ones. Thecorrelation between B − z and reddening for BzK-selectedgalaxies is discussed by Daddi et al. (2004), suggesting thatE(B−V ) = 0.25(B−z+0.1) for the Calzetti extinction law(Calzetti et al. 2000). According to this relation, (B−z) <
∼ 1corresponds to E(B − V ) <
∼ 0.3. On the other hand, we de-rive E(B − V ) ≃ 0.5 for submm-bright BzKs on averagefrom 〈B − z〉 = 2.1. Reddy et al. (2005) show that UV-selected ‘BX/BM’ galaxies occupy a region in the BzK di-agram similar to BzK-selected galaxies with (B − z)<
∼ 1.Since these UV-selected galaxies are less obscured by dustthan submm galaxies (e.g. Smail et al. 2004), it is expectedthat most submm-bright NIRGs may avoid the colour regionof (B − z) <
∼ 1.The other possibilities for blue B−z colours include the
presence of AGN. We performed a cross-correlation betweenthe 24 µm-detected BzK sample and X-ray sources in theXMM serendipitous source catalogue5. As a result, we foundthat the bluest four 24 µm-detected BzKs with (B − z) <
∼ 1and (z − K) <
∼ 1 are associated with X-ray sources with an
angular distance of θ < 2′′, while the submm-bright sam-ple have no such associations. Therefore, bluer colours of24 µm-detected BzKs appear to be better explained by acontribution from AGN.
In summary, the colours of submm-bright NIRGs,1<∼ (B−z)<
∼ 3, indicate that they are obscured star-forminggalaxies at z >
∼ 1.4, with no obvious contribution fromAGN to the observed optical-NIR fluxes. The nature ofsubmm-bright NIRGs is further discussed below using multi-wavelength data and a theoretical SED model.
6.2 Comparison with SED models
6.2.1 SED fitting method
We analyse the SEDs of submm-bright NIRGs using an evo-lutionary SED model of starbursts of Takagi et al. (2003)which has previously been applied to submm galaxies in Tak-agi et al. (2004). In this model, the equations of radiativetransfer are solved for a spherical geometry with centrallyconcentrated stars and homogeneously distributed dust. Weuse the same model templates as those used in Takagi et al.(2004). We hereafter refer to this model as the StarBUrstRadiative Transfer (SBURT) model. Here we extend thewavelength range of the SBURT model to the radio by as-suming the observed correlation between far-IR and radioemission (Condon 1992), with α = −0.75 and q = 2.35,
5 The XMM-Newton Serendipitous Source Catalogue, version1.1.0, XMM-Newton Survey Science Centre Consortium, XMM-SSC, Leicester, UK (2004)
where α is the spectral index of radio emission (Sν ∝ να)and q defines the luminosity ratio of far-IR to radio emissionat 1.49 GHz (see Condon 1992).
The fitting parameters of the SBURT model are theredshift, starburst age and compactness of a starburst re-gion (Θ). The evolutionary time-scale of the starbursts t0 isassumed to be 0.1 Gyr, which specifies both the gas infallrate and the star formation rate. The compactness of star-
bursts is defined by r = Θ(M∗/109M⊙)
1
2 [kpc], where r andM∗ are the radius and stellar mass of the starburst region,respectively. The dust model is chosen from the MW, LMCor SMC models taken from Takagi et al. (2003). Followingthe results of Takagi et al. (2004), we adopt a top-heavy ini-tial mass function (IMF) with a power law index of x = 1.10(the Salpeter IMF has x = 1.35) for submm galaxies, whichis necessary to reproduce the colour-magnitude relation ofpresent-day elliptical galaxies. The lower and upper masslimits of the adopted IMF are 0.1 and 60 M⊙, respectively.This particular choice of the IMF does not affect the follow-ing results, except for the derived stellar masses.
The best-fitting SED model is searched for using a χ2-minimization technique from the prepared set of SED mod-els. We used all the available fluxes, except for 24 µm andradio. This is because, in the SBURT model; 1) the con-tribution from an AGN is not taken into account; 2) the24µm flux depends on the details of the dust model; and3) the radio flux is separately calculated by using the em-pirical relation. The adopted 850-µm fluxes and errors are‘deboosted values’ (i.e. accounting for the effects of fluxboosting on a low S/N threshold sample) taken from Coppinet al. (2006) or calculated with the same deboosting algo-rithm. We adopted a minimum flux error of 5%, consideringthe systematic uncertainty of photometry from the differenttype of instruments covering a wide range of wavelength.The upper limits on fluxes are taken into account in thefitting process, i.e. models exceeding the 5 σ upper limitsare rejected. At rest frame UV wavelengths, the SEDs ofheavily obscured starbursts like submm galaxies could de-pend on the inhomogeneity of interstellar medium, since theeffects of photon leakage may dominate the resulting SED(e.g. Takagi et al. 2003). Also, the absorption by the inter-galactic medium is important in the rest frame below 1216 A,which depends on a particular line of sight to each galaxy.Considering these uncertainties, we quadratically added anadditional 20% error for data at rest-frame UV wavelengthsbelow 4000 A.
6.2.2 Results of SED fitting
In Figure 8, we show the best-fitting models for submm-bright NIRGs. The original and radio-extended SBURTmodels are depicted with solid and dotted lines, respectively.The fitting and derived model parameters are summarisedin Table 5.
For ID912, we found that the value of minimum χ2 re-duced drastically when we excluded H-band data from thefitting analysis. This may indicate that the H-band photom-etry could have a large systematic error. The upper limit inthe J-band suggests that this galaxy could be very red in theobserved NIR colours. The noise level in the H-band maybe too high to detect this galaxy. We checked the images of

8 T. Takagi et al.
ID912 and found that photometry of this galaxy could beaffected by a nearby object. Hence, we adopt the best fittingmodel for ID912 without H-band data.
We find a significant underestimate of 850 µm flux forID445 which has a very red z′ − Ks colour, although theresulting χ2 value indicates that the best-fitting model isstatistically acceptable. Since the predicted radio flux is alsowell below the observed flux, the best-fitting model might berejected with more accurate measurements in the submm.For this source, we may particularly need a more compli-cated multi-component model of starbursts, in which youngheavily obscured molecular clouds are treated separately(e.g. Silva et al. 1998).
The SED fitting suggests that submm-bright NIRGscould lie at the typical redshift range of submm galaxies(Chapman et al. 2005). In order to show the fitting error onphotometric redshifts zphot, we show contour plots of ∆χ2
projected onto the age-redshift plane in Figure 9 for modelswith the best dust model for each galaxy. We note that thederived zphot and the far-IR–radio relation reproduce theobserved radio flux well, except for ID445.
At 24 µm, we find that the observed fluxes are typicallyhigher than the model predictions, while the model flux ofID912 is consistent with the observed 24 µm flux. We regardthe model flux at 24 µm as the lower limit for the followingreasons: 1) lack of AGN contribution in the model; and 2)the non-MW dust models are preferentially selected from thefeatureless SED at rest-frame UV, which may have a lowerMIR emissivity than actual dust grains in submm galaxies.Specifically, the lack of AGN could be important for submmgalaxies, in which the AGN activity to some extent is alreadyknown (Alexander et al. 2005). Recently, Daddi et al. (2007)found a galaxy population at z ∼ 2 which shows a distinctexcess of flux at 24 µm, compared to that expected from theSFR estimated at other wavelengths. This MIR excess isattributed to Compton-thick AGNs, as a result of stackinganalysis of deep X-ray images. Submm-bright NIRGs show-ing a clear excess of flux at 24 µm (ID300 and 1390), mightbe such MIR-excess galaxies.
Submm-bright NIRGs are found to be massive, with thestellar masses of 5 × 10¹⁰–1011 M⊙. The derived bolomet-ric luminosity of 3 × 10¹²–1013L⊙ (excluding ID445) corre-sponds to the star formation rate of ∼ 300–1000 M⊙ yr−1
for the adopted top-heavy IMF. For the Salpeter IMF, thestellar mass and the SFR could be even a few times higherthan we derived.
Following Takagi et al. (2004), we predict the present-day colours and absolute magnitudes of submm-brightNIRGs. Since we assume that the effects of star formationafter the observed epoch is negligible, the derived present-day colours and luminosities are both lower limits. Theselower limits could be close to reasonable values for ID300and 1390, which seem to be well evolved starbursts witht/t0 >
∼ 2 and Mstar > Mgas. For these galaxies, we predict ab-solute V -band magnitudes of MV = −20.7 to −20.1, whilesubmm-faint BzKs would have MV = −19.4 on average.Since we use a top-heavy IMF, this magnitude is ∼ 1 magfainter than those by the Salpeter IMF. We find that thepredicted rest-frame U −V and MV are consistent with thecolour-magnitude relation of elliptical galaxies. This is notthe case for the Salpeter IMF (see also Takagi et al. 2004).
6.2.3 Colour evolution of the SBURT model
In Section 4, we mentioned the possibility that submmgalaxies have a much larger overlap with BzK-selectedgalaxies, compared with EROs and DRGs. In Figure 10,we show the BzK, R −K, and J −K colours as a functionof starburst age at z = 2, i.e. a typical redshift for submmgalaxies. We choose Θ = 0.7–1.4, which results in a goodmatch with the observed SED variation of submm galax-ies for the SMC dust model (see Takagi & Pearson 2005).The SBURT models satisfy BzK >
∼ − 0.2 for a wide rangeof model parameters, i.e. starburst age and compactness ofthe starburst region (or optical depth). On the other hand,R−K > 3.35 is only satisfied with old models having t/t0 >
∼ 3for a wide range of Θ. This is also true for DRGs, exceptfor a small fraction of models. Therefore, in the SBURTmodel, SEDs of stellar populations need to be intrinsicallyred to reproduce the colours of EROs and DRGs. Thus,this model predicts the largest overlap between BzKs andsubmm galaxies, among NIRGs. If we assume the limit onstarburst age of t/t0 ∼ 6 (Takagi et al. 2004), we expect thenumber of BzKs in submm galaxies to be about twice thatof EROs, given that the selection of BzKs and EROs arenot sensitive to the compactness Θ. This prediction could beconfirmed by using larger samples of submm-bright NIRGs.
6.2.4 Why are some BzKs bright in submm?
In this study, we found that only a handful of NIRGs arebright in the submm. So, are submm-bright ones experienc-ing a special luminous evolutionary phase or simply moremassive than submm-faint ones? If the former is the case,the duty cycle of submm-bright BzKs may be estimatedfrom the fraction of submm-bright NIRGs. In the followingdiscussion, we focus only on BzKs, since EROs and DRGscould be contaminated by passively evolving galaxies. Wefound that only 3% of BzKs are bright in submm. This in-dicates that the duty cycle of submm-bright BzKs is only<10% of the star-forming phase, even if we consider the in-completeness of the SHADES survey (Coppin et al. 2006).Thus, we might be observing a very sharp peak in the starformation activity of BzKs (e.g. see also Dannerbauer et al.2006). If this is the case, the SEDs of submm-bright BzKsmay be systematically different from those of submm-faintones.
In order to address this question, we derived the aver-age SED of submm-faint BzKs with 1.5 < (B−z) < 2.5, i.e.having similar colour to submm-bright ones. In Figure 11, weshow the average SED of 65 submm-faint BzKs with 1.5 <(B − z) < 2.5. At 850 µm, we adopted the average flux ofBzKs derived from our stacking analysis. The average fluxof submm-faint BzKs in the radio were also derived with astacking analysis, and found to be f1.4GHz = 5.7±1.0 µJy. Arepresentative model6 for the average SED was sought withthe same method used for individual submm-bright galax-ies. For the flux error at optical-NIR bands, we adopted thestandard deviation of the sample at each photometric band.Since this error is rather large, we fixed the redshift to the
6 We call this model not the ‘best’ but ‘representative’, since thevariance of the average SED is too large to specify one particularmodel as the best one.

Submm properties of NIR-selected galaxies in SHADES/SXDF 9
average redshift of BzKs, 〈z〉 =1.9 (Daddi et al. 2004), inorder to constrain the parameter space. We show the modelthus obtained in Figure 11. The model parameters are tab-ulated in Table 5.
Although the uncertainty is large, the average SED thusderived is not very much different from those of submm-bright BzKs, and reasonably explained by the the SBURTmodel, i.e. a starburst model, not mild evolutionary mod-els for quiescent galaxies. Therefore, from the SED analysis,we found no clear signatures that the evolutionary phaseof submm-bright BzKs is substantially different from thatof submm-faint ones. Compared to submm-bright galaxies,a difference in the model parameters may be found in themass scale, i.e. submm-faint ones are less massive. Since therepresentative model is an old model of a starburst, the es-timated mass is close to the upper limit, owing to a highermass-to-light ratio compared with younger models. From anoldest model which reproduces the average SED, we derivethe upper limit on the stellar mass as Mstar <
∼ 5 × 10¹⁰ M⊙.Compared to the oldest submm-bright NIRG in our sample,ID1390 (excluding ID445), the stellar mass of submm-faintBzKs could be less than half of ID1390. This may suggestthat submm-bright and faint BzKs evolve into galaxies withdifferent stellar masses, rather than being galaxies of a simi-lar stellar mass but in different evolutionary stages. We how-ever caution that the sample size of submm-bright BzKs aretoo small to derive firm conclusions on their average physicalproperties, such as stellar mass. We need a larger sample ofsubmm-bright BzKs, and spectroscopic redshifts for moresecure analyses. Also note that the mass estimate of theSBURT model may suffer from systematic effects, owing tothe assumed simple star/dust geometry.
7 SUMMARY
We have investigated the submm properties of the followingclasses of NIR-selected galaxies: BzK-selected star-forminggalaxies; DRGs; and EROs. We utilised a 93 arcmin2 sub-region of the SHADES SXDF 850µm map which with hasalready been imaged in the NIR with the SIRIUS cameraon the UH2.2m telescope.
Using two SCUBA 850-µm maps (the SHADES B-mapand D-map) produced by two different groups within theSHADES consortium, we detected 6 NIRGs above 3σ. Foursubmm-detected NIRGs out of six are also detected both at24 µm and in the radio. This suggests that these 4 submm-detected NIRGs are genuine submm-bright galaxies. Thesesubmm-bright NIRGs are all BzK-selected galaxies, exceptfor ID1390 whose BzK colour is however close to the se-lection boundary. In other words, no EROs and DRGs arefound to be submm-bright if they are clearly non-BzKs.We made a rough estimate of the number of BzKs in radio-detected submm galaxies, assuming that submm galaxies at1.4 < z < 2.5 satisfy the selection criteria of BzKs. Al-though the sample is small, this estimate is consistent withour result. This may indicate that most submm galaxies at1.4 < z < 2.5 could be BzKs.
Two submm-detected NIRGs satisfy all the selectioncriteria we adopted, i.e. they are extremely red BzK-selected galaxies. Although these extremely red BzKs arerare, the fraction of submm galaxies in them could be
high (up to 20%), compared with the other colour-selectedoptical-NIR galaxy populations.
We performed stacking analyses with our SCUBA 850-µm maps, in order to derive the average flux of submm-faintNIRGs. We derived 0.52±0.19 (0.64±0.16) mJy and 0.53±0.16 (0.50 ± 0.13) mJy from the B-map (D-map) for BzKsand EROs, respectively, while we found no significant signalfrom DRGs in either map. The contribution from BzKs andEROs to the EBL at 850 µm is about 10–15 %. Focusing onthe EBL only from BzKs, we found that >
∼ 30% of the EBLfrom BzKs is resolved in our SCUBA map. This is higherthan that for EROs and submm sources as a whole. Thismight be expected if the majority of the EBL originatesfrom submm-undetected galaxies at z < 1.5, as suggestedby Wang et al. (2006). For galaxies at z ∼ 2, the fraction ofsubmm flux in resolved sources could be higher than that inlow-z galaxies.
We have also fitted SED models of starbursts to eachof the submm-bright NIRG (mostly BzKs) and to an aver-age SED of submm-faint BzKs derived from galaxies with1.5 < (B − z) < 2.5, i.e. similar colours to the submm-bright ones. Submm-bright NIRGs are found to lie at thetypical redshifts of submm galaxies and have stellar massesof 5 × 10¹⁰–1011 M⊙ with a Salpeter-like, but slightly top-heavy IMF and bolometric luminosity of 3 × 10¹²–1013 L⊙.From the average SED of submm-faint BzKs, we found noclear signature that the evolutionary phase of submm-brightBzKs are substantially different from that of submm-faintones, as suggested by the small number of submm-brightBzKs. On the other hand, submm-faint BzKs are likely tobe less massive, with the stellar mass below ∼ 5× 10¹⁰ M⊙.
The results presented here are clearly limited by smallsample size. Nevertheless, our study can still be consid-ered useful for investigating the physical relationships be-tween NIR-selected and submm-selected massive galaxies. Alarge sample of submm-bright NIRGs from currently ongo-ing and future muti-wavelength surveys, including SHADESand UKIDSS will play an important role on the study ofmassive galaxy formation and evolution.
ACKNOWLEDGMENTS
We thank all the members of the SHADES consortium, andacknowledge continuous support from the staff of the JCMT.We also thank all the members of the SIRIUS team and ac-knowledge the SWIRE project team. We thank E. Daddi foruseful discussions on the BzK-selection technique. TT ac-knowledges the Japan Society for the Promotion of Science(JSPS – PD fellow, No. 18·7747). TT and SS acknowledgesupport by the Particle Physics and Astronomy ResearchCouncil under grant number PPA/G/S/2001/00120/2. IRSacknowledges support from the Royal Society. This work ispartly supported by a Grant-in-Aid for Scientific Research(No. 14540220) by the Japanese Ministry of Education, Cul-ture, Sports, Science and Technology. KC and AP acknowl-edge the National Science and Engineering Research Councilof Canada (NSERC). IA and DHH acknowledge partial sup-port from Conacyt grants 39548-F and 39953-F. The JCMTis operated by the Joint Astronomy Centre on behalf of theUK Particle Physics and Astronomy Research Council, the

10 T. Takagi et al.
Canadian National Research Council and the NetherlandsOrganization for Scientific Research.
REFERENCES
Alexander D. M., Bauer F. E., Chapman S. C., Smail I.,Blain A. W., Brandt W. N., Ivison R. J., 2005, ApJ, 632,736
Arnouts S., Walcher C. J., Le Fevre O., Zamorani G., IlbertO., Pozzetti L., Bardelli S., Tresse L., Zucca E., Le BrunV., et al. 2007, ArXiv e-prints, 705
Bertin E., Arnouts S., 1996, A&AS, 117, 393Blain A. W., Chapman S. C., Smail I., Ivison R., 2004,ApJ, 611, 725
Blain A. W., Kneib J.-P., Ivison R. J., Smail I., 1999, ApJ,512, L87
Borys C., Chapman S., Halpern M., Scott D., 2003, MN-RAS, 344, 385
Borys C., Scott D., Chapman S., Halpern M., Nandra K.,Pope A., 2004, MNRAS, 355, 485
Calzetti D., Armus L., Bohlin R. C., Kinney A. L., Koorn-neef J., Storchi-Bergmann T., 2000, ApJ, 533, 682
Caputi K. I., Dole H., Lagache G., McLure R. J., PugetJ.-L., Rieke G. H., Dunlop J. S., Le Floc’h E., PapovichC., Perez-Gonzalez P. G., 2006, ApJ, 637, 727
Chapman S. C., Blain A. W., Smail I., Ivison R. J., 2005,ApJ, 622, 772
Cimatti A., Daddi E., Mignoli M., Pozzetti L., Renzini A.,Zamorani G., Broadhurst T., Fontana A., Saracco P., PoliF., Cristiani S., D’Odorico S., Giallongo E., Gilmozzi R.,Menci N., 2002, A&A, 381, L68
Cimatti A., Daddi E., Renzini A., Cassata P., VanzellaE., Pozzetti L., Cristiani S., Fontana A., Rodighiero G.,Mignoli M., Zamorani G., 2004, Nature, 430, 184
Condon J. J., 1992, ARA&A, 30, 575Coppin K., Chapin E. L., Mortier A. M. J., Scott S. E.,Borys C., Dunlop J. S., Halpern M., Hughes D. H., PopeA., Scott D., Serjeant S., Wagg J., Alexander D. M., etal. 2006, MNRAS, 372, 1621
Coppin K., Halpern M., Scott D., Borys C., Chapman S.,2005, MNRAS, 357, 1022
Cowie L. L., Barger A. J., Kneib J.-P., 2002, AJ, 123, 2197Daddi E., Alexander D. M., Dickinson M., Gilli R., Ren-zini A., Elbaz D., Cimatti A., Chary R., Frayer D., BauerF. E., Brandt W. N., Giavalisco M., Grogin N. A., HuynhM., Kurk J., Mignoli M., Morrison G., Pope A., Ravin-dranath S., 2007, ArXiv e-prints, 705
Daddi E., Cimatti A., Pozzetti L., Hoekstra H., RottgeringH. J. A., Renzini A., Zamorani G., Mannucci F., 2000,A&A, 361, 535
Daddi E., Cimatti A., Renzini A., Fontana A., Mignoli M.,Pozzetti L., Tozzi P., Zamorani G., 2004, ApJ, 617, 746
Daddi E., Cimatti A., Renzini A., Vernet J., Conselice C.,Pozzetti L., Mignoli M., Tozzi P., Broadhurst T., di SeregoAlighieri S., Fontana A., Nonino M., Rosati P., ZamoraniG., 2004, ApJ, 600, L127
Daddi E., Dickinson M., Chary R., Pope A., Morrison G.,Alexander D. M., Bauer F. E., Brandt W. N., GiavaliscoM., Ferguson H., Lee K.-S., Lehmer B. D., Papovich C.,Renzini A., 2005, ApJ, 631, L13
Daddi E., Dickinson M., Morrison G., Chary R., CimattiA., Elbaz D., Frayer D., Renzini A., Pope A., AlexanderD. M., Bauer F. E., Giavalisco M., Huynh M., Kurk J.,Mignoli M., 2007, ArXiv e-prints, 705
Dannerbauer H., Daddi E., Onodera M., Kong X.,Rottgering H., Arimoto N., Brusa M., Cimatti A., KurkJ., Lehnert M. D., Mignoli M., Renzini A., 2006, ApJ,637, L5
Dickinson M., Papovich C., Ferguson H. C., Budavari T.,2003, ApJ, 587, 25
Drory N., Salvato M., Gabasch A., Bender R., Hopp U.,Feulner G., Pannella M., 2005, ApJ, 619, L131
Eales S., Lilly S., Gear W., Dunne L., Bond J. R., HammerF., Le Fevre O., Crampton D., 1999, ApJ, 515, 518
Egami E., Dole H., Huang J.-S., Perez-Gonzalez P., LeFloc’h E., Papovich C., Barmby P., Ivison R. J., SerjeantS., Mortier A., et al. 2004, ApJS, 154, 130
Fixsen D. J., Dwek E., Mather J. C., Bennett C. L., ShaferR. A., 1998, ApJ, 508, 123
Fontana A., Donnarumma I., Vanzella E., Giallongo E.,Menci N., Nonino M., Saracco P., Cristiani S., D’OdoricoS., Poli F., 2003, ApJ, 594, L9
Fontana A., Pozzetti L., Donnarumma I., Renzini A.,Cimatti A., Zamorani G., Menci N., Daddi E., GiallongoE., Mignoli M., Perna C., Salimbeni S., Saracco P., Broad-hurst T., Cristiani S., D’Odorico S., Gilmozzi R., 2004,A&A, 424, 23
Franx M., Labbe I., Rudnick G., van Dokkum P. G.,Daddi E., Forster Schreiber N. M., Moorwood A., RixH., Rottgering H., van de Wel A., van der Werf P., vanStarkenburg L., 2003, ApJ, 587, L79
Glazebrook K., Abraham R. G., McCarthy P. J., SavaglioS., Chen H.-W., Crampton D., Murowinski R., JørgensenI., Roth K., Hook I., Marzke R. O., Carlberg R. G., 2004,Nature, 430, 181
Grazian A., Fontana A., Moscardini L., Salimbeni S., MenciN., Giallongo E., de Santis C., Gallozzi S., Nonino M.,Cristiani S., Vanzella E., 2006, A&A, 453, 507
Greve T. R., Bertoldi F., Smail I., Neri R., Chapman S. C.,Blain A. W., Ivison R. J., Genzel R., Omont A., Cox P.,Tacconi L., Kneib J.-P., 2005, MNRAS, 359, 1165
Hughes D. H., Serjeant S., Dunlop J., Rowan-Robinson M.,Blain A., Mann R. G., Ivison R., Peacock J., EfstathiouA., Gear W., Oliver S., Lawrence A., Longair M., Gold-schmidt P., Jenness T., 1998, Nature, 394, 241
Ivison R. J., Greve T. R., Dunlop J. S., et al. 2007, ArXivAstrophysics e-prints
Ivison R. J., Greve T. R., Smail I., Dunlop J. S., RocheN. D., Scott S. E., Page M. J., Stevens J. A., Almaini O.,Blain A. W., et al. 2002, MNRAS, 337, 1
Juneau S., Glazebrook K., Crampton D., McCarthy P. J.,Savaglio S., Abraham R., Carlberg R. G., Chen H.-W., LeBorgne D., Marzke R. O., Roth K., Jørgensen I., Hook I.,Murowinski R., 2005, ApJ, 619, L135
Knudsen K. K., van der Werf P., Franx M., ForsterSchreiber N. M., van Dokkum P. G., Illingworth G. D.,Labbe I., Moorwood A., Rix H.-W., Rudnick G., 2005,ApJ, 632, L9
Kong X., Daddi E., Arimoto N., Renzini A., Broadhurst T.,Cimatti A., Ikuta C., Ohta K., da Costa L., Olsen L. F.,Onodera M., Tamura N., 2006, ApJ, 638, 72
Kovacs A., Chapman S. C., Dowell C. D., Blain A. W.,

Submm properties of NIR-selected galaxies in SHADES/SXDF 11
Ivison R. J., Smail I., Phillips T. G., 2006, ApJ, 650, 592Labbe I., Huang J., Franx M., Rudnick G., Barmby P.,Daddi E., van Dokkum P. G., Fazio G. G., SchreiberN. M. F., Moorwood A. F. M., Rix H.-W., RottgeringH., Trujillo I., van der Werf P., 2005, ApJ, 624, L81
Lawrence A., Warren S. J., Almaini O., et al. 2006, ArXivAstrophysics e-prints, astro-ph/0604426
Lonsdale C. J., Smith H. E., Rowan-Robinson M., SuraceJ., Shupe D., Xu C., Oliver S., Padgett D., Fang F., Con-row T., Franceschini A., Gautier N., et al. 2003, PASP,115, 897
Miyazaki M., Shimasaku K., Kodama T., Okamura S., Fu-rusawa H., Ouchi M., Nakata F., Doi M., Hamabe M.,Kimura M., Komiyama Y., Miyazaki S., Nagashima C.,et al. 2003, PASJ, 55, 1079
Miyazaki S., Komiyama Y., Sekiguchi M., Okamura S., DoiM., Furusawa H., Hamabe M., Imi K., Kimura M., NakataF., Okada N., Ouchi M., Shimasaku K., Yagi M., YasudaN., 2002, PASJ, 54, 833
Mortier A. M. J., Serjeant S., Dunlop J. S., Scott S. E.,Ade P., Alexander D., Almaini O., Aretxaga I., BaughC., Benson A. J., Best P. N., Blain A., Bock J., Borys C.,et al. 2005, MNRAS, 363, 563
Nagayama T., Nagashima C., Nakajima Y., Nagata T.,Sato S., Nakaya H., Yamamuro T., Sugitani K., TamuraM., 2003, in Instrument Design and Performance for Op-tical/Infrared Ground-based Telescopes. Edited by Iye,Masanori; Moorwood, Alan F. M. Proceedings of theSPIE, Volume 4841, pp. 459-464 (2003). SIRUS: a nearinfrared simultaneous three-band camera. pp 459–464
Papovich C., Moustakas L. A., Dickinson M., Le Floc’h E.,Rieke G. H., Daddi E., Alexander D. M., Bauer F., BrandtW. N., Dahlen T., Egami E., Eisenhardt P., Elbaz D., etal. 2006, ApJ, 640, 92
Perez-Gonzalez P. G., Rieke G. H., Egami E., Alonso-Herrero A., Dole H., Papovich C., Blaylock M., Jones J.,Rieke M., Rigby J., Barmby P., Fazio G. G., Huang J.,Martin C., 2005, ApJ, 630, 82
Pope A., Borys C., Scott D., Conselice C., Dickinson M.,Mobasher B., 2005, MNRAS, 358, 149
Pope A., Scott D., Dickinson M., Chary R.-R., Morrison G.,Borys C., Sajina A., Alexander D. M., Daddi E., FrayerD., MacDonald E., Stern D., 2006, MNRAS, 370, 1185
Pozzetti L., Bolzonella M., Lamareille F., Zamorani G.,Franzetti P., Le Fevre O., Iovino A., Temporin S., IlbertO., Arnouts S., Charlot S., Brinchmann J., et al. 2007,ArXiv e-prints, 704
Puget J.-L., Abergel A., Bernard J.-P., Boulanger F., Bur-ton W. B., Desert F.-X., Hartmann D., 1996, A&A, 308,L5
Reddy N. A., Erb D. K., Steidel C. C., Shapley A. E.,Adelberger K. L., Pettini M., 2005, ApJ, 633, 748
Rowan-Robinson M., Babbedge T., Surace J., Shupe D.,Fang F., Lonsdale C., Smith G., Polletta M., Siana B.,Gonzalez-Solares E., Xu K., Owen F., et al. 2005, AJ,129, 1183
Scott S. E., Fox M. J., Dunlop J. S., Serjeant S., Pea-cock J. A., Ivison R. J., Oliver S., Mann R. G., LawrenceA., Efstathiou A., Rowan-Robinson M., Hughes D. H.,Archibald E. N., Blain A., Longair M., 2002, MNRAS,331, 817
Silva L., Granato G. L., Bressan A., Danese L., 1998, ApJ,
509, 103Smail I., Chapman S. C., Blain A. W., Ivison R. J., 2004,ApJ, 616, 71
Smail I., Ivison R. J., Blain A. W., 1997, ApJ, 490, L5Smail I., Ivison R. J., Blain A. W., Kneib J.-P., 2002, MN-RAS, 331, 495
Smail I., Ivison R. J., Kneib J.-P., Cowie L. L., Blain A. W.,Barger A. J., Owen F. N., Morrison G., 1999, MNRAS,308, 1061
Swinbank A. M., Smail I., Chapman S. C., Blain A. W.,Ivison R. J., Keel W. C., 2004, ApJ, 617, 64
Takagi T., Arimoto N., Hanami H., 2003, MNRAS, 340,813
Takagi T., Hanami H., Arimoto N., 2004, MNRAS, 355,424
Takagi T., Pearson C. P., 2005, MNRAS, 357, 165Takagi T., Vansevicius V., Arimoto N., 2003, PASJ, 55, 385Thompson D., Beckwith S. V. W., Fockenbrock R., FriedJ., Hippelein H., Huang J.-S., von Kuhlmann B., LeinertC., Meisenheimer K., Phleps S., Roser H.-J., ThommesE., Wolf C., 1999, ApJ, 523, 100
van Dokkum P. G., Forster Schreiber N. M., Franx M.,Daddi E., Illingworth G. D., Labbe I., Moorwood A., RixH., Rottgering H., Rudnick G., van der Wel A., van derWerf P., van Starkenburg L., 2003, ApJ, 587, L83
Wang W.-H., Cowie L. L., Barger A. J., 2006, ApJ, 647, 74Webb T. M. A., Brodwin M., Eales S., Lilly S. J., 2004,ApJ, 605, 645
Webb T. M. A., Lilly S. J., Clements D. L., Eales S., YunM., Brodwin M., Dunne L., Gear W. K., 2003, ApJ, 597,680
Webb T. M. A., van Dokkum P., Egami E., Fazio G., FranxM., Gawiser E., Herrera D., Huang J., Labbe I., Lira P.,Marchesini D., Maza J., Quadri R., Rudnick G., van derWerf P., 2006, ApJ, 636, L17
APPENDIX A: ESTIMATE ON THE NUMBEROF CHANCE DETECTIONS IN OUR SCUBAMAPS
The large beam size of the JCMT (14.7′′ FHWM at 850 µm)could lead to some chance detections of spurious >3σ peaksat the position of NIR-selected galaxies. We statisticallyevaluate the expected number of >3σ chance detections fora given class of galaxies as follows. The probability of ran-domly finding an object at >3σ in the 850-µm map may begiven by the ratio of the number of pixels with >3σ to thetotal number of pixels in the region under consideration. Forthe SHADES/SIRIUS Ks-band area, we found this proba-bility as p(>3σ) = 0.45×10⁻² for the SHADES B-map and0.85×10−2 for the D-map7. If we randomly distribute n ob-jects in the 850-µm map, the number of objects spuriouslydetected with >3σ would follow a Poisson distribution withthe parameter of µ = np(>3σ). For 307 NIRGs, we deriveµ = 1.4 and 2.6 for the B- and D-map respectively, givingthe mean number of >3σ detections by chance. This meansthat we must confirm whether submm-detected NIRGs are
7 The difference in p(>3 σ) between the maps may be explainedby the difference in the adopted pixel size.

12 T. Takagi et al.
Table 1. Statistics of NIR-selected galaxies (NIRGs)
Population Areaa Number Surface densityKs or J [arcmin−2]
Ks-detected object Ks 1308 (992)b 11.5Star Ks 95 (64) 0.83NIRGs J 307 (245) 3.14ERO Ks 249 (201) 2.18DRG J 84 (67) 1.09ERO and non-DRG J 105 (84) 1.36DRG and non-ERO J 38 (28) 0.49ERO and DRG J 46 (39) 0.60BzK Ks 168 (132) 1.47BzK and ERO and non-DRG J 17 (14) 0.22BzK and DRG and non-ERO J 14 (8) 0.18BzK and ERO and DRG J 19 (16) 0.25
a) Image (Ks- or J-band area) for which the number of objects are derived.
b) Total number of objects, with the number within the SHADES area givenin parentheses.
Table 2. Submm properties of submm-bright NIR-selected galaxies
Source Mapa S/Nb θc850µm Sd
850µm S24µm S1.4GHz SHADES IDe
[arcsec] [mJy] [µJy] [µJy] [SXDF]
300 B,D 3.1 4.5 5.7± 2.1 546±27 27.8± 7.0 850.30445 B 3.3 2.9 5.6± 2.1 357±24 250.± 7.4 850.27912 B,D 4.1 2.1 4.4± 1.8 511±27 145.± 7.7 850.41390 B,D 3.4 1.8 4.0± 2.8 446±29 29.6± 7.5 (850.62)f
Unconfirmed detections
718 B,D 3.3 2.3 4.0± 2.1 < 450 < 35 850.701133 D 3.0 6.6 3.0± 2.1 < 450 < 40 850.77
Notes: The upper limits correspond to 5 σ. a) SHADES map in which NIRGs are detected
b) S/N at the position of NIRGs in the SHADES map. We adopt values from the SHADES
B-map if NIRGs are detected in both B and D maps. c) The angular separation betweensubmm and NIR position. Submm positions are taken from the SHADES source catalogue.For ID1390, we adopt the submm position from the SHADES B-map. d) Deboosted 850-µmflux densities from the SHADES source catalogue, using the algorithm of Coppin et al.(2005). e) Source names in the SHADES source catalogue. f) Source name from a preliminarySHADES source catalogue.
genuine submm emitters or not by other means. Here we re-quire a detection at 24 µm or radio to identify submm-brightNIRGs, along with the detection in the SCUBA map. Forexample, only 15 NIRGs are found to be detected at 24 µm.This results in µ = 0.067 and 0.13 for 24µm-detected NIRGsin the B-map and D-map, respectively. Thus, we expect nochance detections in the SCUBA map if NIRGs are detectedat 24µm.

Submm properties of NIR-selected galaxies in SHADES/SXDF 13
Table 3. Optical – NIR properties of submm-bright NIR-selected galaxies
Source R.A. Dec. Ks R − Ks J − Ks B − z′ z′ − Ks Notes[J2000] [J2000] [AB mag] BzK ERO DRG 24 µm Radio
300 2 17 40.01 -05 01 15.7 21.14 3.43 1.56 2.05 2.61 Y Y Y Y Y445 2 18 07.92 -05 01 45.7 22.00 4.39 > 1.40 1.75 3.21 Y Y Y Y Y912 2 17 38.67 -05 03 39.4 21.64 2.59 ... 1.20 2.05 Y N ... Y Y1390 2 18 07.74 -05 06 10.5 21.13 3.67 2.02 2.52 2.56 (N)a Y Y Y Y
Notes: A ‘Y’ (’N’) in the last five columns indicate that the galaxy is (not) BzK-selected galaxy, ERO, DRG, 24 µm-detected
and radio-detected. a) After the colour correction on B − z and z − K, this source becomes a non-BzK-selected galaxy, asshown in Figure 7. This correction is adopted to match the observed colour sequence of stars to that of Daddi et al. (2004).
Table 4. Summary of stacking analysis at 850 µm
Class Numbera 〈S850µm〉b K-S Prob.c % Resolved fluxd E.B.L.e
[mJy] [%] [%] [Jy deg−2]
BzKs 112 0.52 ± 0.19 5.91 32 ± 18 3.8 ± 1.2EROs 178 0.53 ± 0.16 1.70 18 ± 9 5.1 ± 1.5DRGs 56 0.30 ± 0.28 45.91 ... ...
a) The number of objects used for the stacking analysis. b) The average 850-µm
flux of non-detected objects, which are > 7′′ away from individual sources. c) Theprobability from the Kolmogorov-Smirnov test. that the flux distribution of objectsare derived from the same sample. d) The fraction of the flux density in individuallydetected sources. e) The extragalactic background light at 850 µm from each class ofobjects.
Table 5. Summary of the SED fitting with the SBURT model
Source χ2/νa zphot Ageb Θc Ext.d log Mstar log Mgas log Lebol AV log SFR Mf
V(U − V )f
[Gyr] [M⊙] [M⊙] [L⊙] [mag] [M⊙ yr−1] [mag] [mag]
300 0.91 2.8 0.2 2.0 SMC 10.8 10.7 12.7 1.3 2.7 −20.1 1.3445 1.47 2.1 0.5 1.0 LMC 10.9 10.0 12.1 2.3 2.0 −20.3 1.5912 0.47 2.4 0.07 1.4 LMC 10.7 11.1 13.1 3.1 3.2 −20.1 0.91390 2.45 2.4 0.4 1.4 LMC 11.1 10.4 12.5 1.5 2.4 −20.7 1.4
〈BzKs〉g ... 1.9h 0.4 1.6 LMC 10.6 9.8 11.9 1.1 1.8 −19.4 1.4
a) χ2 divided by the degree of freedom ν. b) Starburst age with the evolutionary time scale of t0 = 0.1Gyr.
c) Compactness parameter of starburst region. d) Extinction curve used. e) Bolometric luminosity. f) Predictedpresent-day V -band magnitude and U − V (Vega), assuming the passive evolution after the observed epoch. g)Model parameters for an average SED of submm-faint BzKs with 1.5 < (B − z) < 2.5 h) Assumed redshift for theSED fitting.
-1 0 1 2 3 4 5 6 7R-K [AB]
-1
0
1
2
3
4
J-K
[A
B]
Figure 1. J − Ks versus R − Ks for Ks-band detected objects in the SIRIUS J-band area. The selection criteria for EROs and DRGsare indicated with a vertical line and a horizontal line, respectively.

14 T. Takagi et al.
18 19 20 21 22K
s [AB]
-5
-4
-3
-2
-1
0
1
2
3
4
5
(z’-
Ks)
- (B
-z’)
[A
B]
Figure 2. BzK colour vs. Ks magnitude for Ks-band detected objects. Here the z′ − Ks and B − z′ colours have not been colour-corrected in order to show the original photometric errors. The BzK selection criterion proposed by Daddi et al. (2004) corresponds to(z′ − Ks) − (B − z′) = 0.2 for the adopted colour correction (see text).
10 5 0 -5 -10ARC SECONDS
-10
-5
0
5
10
AR
C S
EC
ON
DS
Source ID 0300 K band image 850µm contours
CENTER: R.A. 02 17 40.00 DEC -05 01 15.8 J2000
10 5 0 -5 -10ARC SECONDS
-10
-5
0
5
10
AR
C S
EC
ON
DS
Source ID 0300 K band image 850µm contours
CENTER: R.A. 02 17 40.00 DEC -05 01 15.8 J2000
1.0
2.0
2.0
2.0
2.0
3.0
3.0
3.0 4.0
AR
C S
EC
ON
DS
ARC SECONDS10 5 0 -5 -10
10
8
6
4
2
0
-2
-4
-6
-8
-10
10 5 0 -5 -10ARC SECONDS
-10
-5
0
5
10
AR
C S
EC
ON
DS
Source ID 0445 K band image 850µm contours
CENTER: R.A. 02 18 7.94 DEC -05 01 45.6 J2000
10 5 0 -5 -10ARC SECONDS
-10
-5
0
5
10
AR
C S
EC
ON
DS
Source ID 0445 K band image 850µm contours
CENTER: R.A. 02 18 7.94 DEC -05 01 45.6 J2000
1.0
1.0
1.0
2.0
2.0
2.0
3.0
AR
C S
EC
ON
DS
ARC SECONDS10 5 0 -5 -10
10
8
6
4
2
0
-2
-4
-6
-8
-10
Figure 3. [Left column] Contours of SCUBA 850-µm for submm-bright NIR-selected galaxies. The corresponding S/N ratios at 850 µmare indicated at each contour line. The underlying images are Ks-band with 20′′ on a side. The names of the sources are indicated at thetop of each image. [Right column] Contour maps of radio (1.4 GHz) on negative images at R-band for the same regions as shown in theleft panels. Contour lines are shown at −2, 2, 3, 4, ... ,10, 20, ... 100×σ. Positive (negative) contours are indicated with solid (dashed)lines.

Submm properties of NIR-selected galaxies in SHADES/SXDF 15
10 5 0 -5 -10ARC SECONDS
-10
-5
0
5
10
AR
C S
EC
ON
DS
Source ID 0912 K band image 850µm contours
CENTER: R.A. 02 17 38.67 DEC -05 03 39.4 J2000
10 5 0 -5 -10ARC SECONDS
-10
-5
0
5
10
AR
C S
EC
ON
DS
Source ID 0912 K band image 850µm contours
CENTER: R.A. 02 17 38.67 DEC -05 03 39.4 J2000
1.0
1.0
1.0
2.0
2.02.0
2.0
3.0
3.0
4.0
AR
C S
EC
ON
DS
ARC SECONDS10 5 0 -5 -10
10
8
6
4
2
0
-2
-4
-6
-8
-10
10 5 0 -5 -10ARC SECONDS
-10
-5
0
5
10
AR
C S
EC
ON
DS
Source ID 1390 K band image 850µm contours
CENTER: R.A. 02 18 7.77 DEC -05 06 10.7 J2000
10 5 0 -5 -10ARC SECONDS
-10
-5
0
5
10
AR
C S
EC
ON
DS
Source ID 1390 K band image 850µm contours
CENTER: R.A. 02 18 7.77 DEC -05 06 10.7 J2000
1.0
1.02.0
2.0
2.0
3.0
AR
C S
EC
ON
DS
ARC SECONDS10 5 0 -5 -10
10
8
6
4
2
0
-2
-4
-6
-8
-10
Figure 3. - continued.
-10 -5 0 5 10Flux (mJy)
0
200
400
600
800
1000
-10 -5 0 5 100
5
10
15
Figure 4. Histograms of the 850-µm flux at the position of BzKs (shaded; right axis), compared to the histograms for the unmaskedregions of the SCUBA map as a whole (open; left axis).

16 T. Takagi et al.
-10 -5 0 5 10Flux (mJy)
0
200
400
600
800
1000
-10 -5 0 5 100
10
20
30
Figure 5. Same as Figure 4, but for EROs.
-10 -5 0 5 10Flux (mJy)
0
200
400
600
800
-10 -5 0 5 100
2
4
6
8
10
Figure 6. Same as Figure 4, but for DRGs.

Submm properties of NIR-selected galaxies in SHADES/SXDF 17
0 1 2 3 4 5 6(B-z)
AB
0
1
2
3
4
(z-K
) AB
EROs/DRGs850µm-detected NIRGs
K-detected objects
Stars from Daddi et al.24µm-detected NIRGs
24µm-detected galaxies
Figure 7. The BzK diagram for Ks-detected sources in the SXDF/SIRIUS field. Solid circles indicate submm-bright NIRGs. Thephotometric errors include those of colour corrections on B − z and z −K. Both EROs and DRGs are indicated with small circles. Largethick/thin crosses are for NIR-selected/Ks-detected galaxies which are detected at 24 µm with SWIRE. Small pluses indicate stars fromDaddi’s catalogue. We depict the BzK-selection criterion with a solid line. Dashed and dotted lines are boundaries for selecting passivelyevolving galaxies and stars, respectively.

18 T. Takagi et al.
0.1 1 10 100 1000 10000 1e+05 1e+06Wavelength [µm]
1e-09
1e-08
1e-07
1e-06
1e-05
1e-04
1e-03
1e-02
1e-01
1e+00
Flux
[Jy
]
ID300z
phot = 2.8
t/t0=2.0
Θ=2.0SMC
χ2/ν=0.91
0.1 1 10 100 1000 10000 1e+05 1e+06Wavelength [µm]
1e-09
1e-08
1e-07
1e-06
1e-05
1e-04
1e-03
1e-02
1e-01
1e+00
Flux
[Jy
]
ID445z
phot=2.1
t/t0=5.0
Θ=1.0LMC
χ2/ν=1.47
0.1 1 10 100 1000 10000 1e+05 1e+06Wavelength [µm]
1e-09
1e-08
1e-07
1e-06
1e-05
1e-04
1e-03
1e-02
1e-01
1e+00
Flux
[Jy
]
ID912z
phot=2.4
t/t0=0.7
Θ=1.4LMCχ2/ν=0.47
0.1 1 10 100 1000 10000 1e+05 1e+06Wavelength [µm]
1e-09
1e-08
1e-07
1e-06
1e-05
1e-04
1e-03
1e-02
1e-01
1e+00
Flux
[Jy
]
ID1390z
phot = 2.4
t/t0=4.0
Θ=1.4LMC
χ2/ν=2.45
Figure 8. Solid and dotted lines indicate the best-fitting SBURT model without and with an extended radio component of the SED,respectively. The data points used for the SED fitting are shown as solid circles. Arrows indicate the 5 σ upper limits. See Section 6.2.1for the definition of the fitting parameters.

Submm properties of NIR-selected galaxies in SHADES/SXDF 19
Figure 9. Contour maps of ∆χ2 from the SED fitting in a plane of starburst age (with t0 = 0.1Gyr) and redshift. The contours aredepicted at ∆χ2 = 2.71, 6.63, having the probabilities of 90 and 99 % when projected on to each axis. We note that there are no localminima at z < 1 and z > 4.

20 T. Takagi et al.
0.1 1 10Starburst age (t/t
0)
-3
-2
-1
0
1
2
3
BzK
AB
SMC Θ=0.7SMC Θ=0.9SMC Θ=1.0SMC Θ=1.2SMC Θ=1.4MW Θ=0.7MW Θ=0.9MW Θ=1.0MW Θ=1.2MW Θ=1.4 z=2.0
0.1 1 10Starburst age (t/t
0)
0
1
2
3
4
5
R-K
AB
z=2.0
0.1 1 10Starburst age (t/t
0)
-0.5
0
0.5
1
1.5
2
2.5
J-K
AB
z=2.0
Figure 10. BzK, R−K and J −K colours of the SBURT model at z = 2 as a function of starburst age, which show the range of modelparameters to satisfy BzK, DRG, and ERO selection criteria. Model parameters for a given line symbol are shown in the legend box.Horizontal lines indicate the colour boundary for BzKs, DRGs and EROs.
0.1 1 10 100 1000 10000 1e+05 1e+06Wavelength [µm]
1e-09
1e-08
1e-07
1e-06
1e-05
1e-04
1e-03
1e-02
1e-01
1e+00
Flux
[Jy
]
Average BzKs<z> = 1.9
t/t0=4.0
Θ=1.6LMC
Figure 11. Average SED of BzKs with 1.5 < (B − z′) < 2.5 and a representative SBURT model for the average SED. Symbols are thesame as in Figure 8.