Planck early results. XIII. Statistical properties of extragalactic radio sources in the Planck...
12
arXiv:1101.2044v2 [astro-ph.CO] 28 Feb 2011 Astronomy & Astrophysics manuscript no. 16471 c ESO 2011 March 1, 2011 Planck Early Results: Statistical properties of extragalactic radio sources in the Planck Early Release Compact Source Catalogue Planck Collaboration: P. A. R. Ade 75 , N. Aghanim 51 , F. Arg¨ ueso 15 , M. Arnaud 63 , M. Ashdown 61,4 , J. Aumont 51 , C. Baccigalupi 73 , A. Balbi 31 , A. J. Banday 79,8,68 , R. B. Barreiro 57 , J. G. Bartlett 3,59 , E. Battaner 80 , K. Benabed 52 , J.-P. Bernard 79,8 , M. Bersanelli 28,45 , R. Bhatia 5 , A. Bonaldi 41 , L. Bonavera 73,6 , J. R. Bond 7 , J. Borrill 67,76 , F. R. Bouchet 52 , M. Bucher 3 , C. Burigana 44 , P. Cabella 31 , B. Cappellini 45 , J.-F. Cardoso 64,3,52 , A. Catalano 3,62 , L. Cay´ on 21 , A. Challinor 54,61,11 , A. Chamballu 49 , R.-R. Chary 50 , X. Chen 50 , L.-Y Chiang 53 , P. R. Christensen 71,32 , D. L. Clements 49 , S. Colafrancesco 42 , S. Colombi 52 , F. Couchot 66 , B. P. Crill 59,72 , F. Cuttaia 44 , L. Danese 73 , R. D. Davies 60 , R. J. Davis 60 , P. de Bernardis 27 , G. de Gasperis 31 , A. de Rosa 44 , G. de Zotti 41,73 , J. Delabrouille 3 , J.-M. Delouis 52 , F.-X. D´ esert 47 , C. Dickinson 60 , H. Dole 51 , S. Donzelli 45,55 , O. Dor´ e 59,9 ,U.D¨orl 68 , M. Douspis 51 , X. Dupac 35 , G. Efstathiou 54 , T. A. Enßlin 68 , H. K. Eriksen 55 , F. Finelli 44 , O. Forni 79,8 , M. Frailis 43 , E. Franceschi 44 , S. Galeotta 43 , K. Ganga 3,50 , M. Giard 79,8 , G. Giardino 36 , Y. Giraud-H´ eraud 3 , J. Gonz´ alez-Nuevo 73 , K. M. G´ orski 59,82 , S. Gratton 61,54 , A. Gregorio 29 , A. Gruppuso 44 , F. K. Hansen 55 , D. Harrison 54,61 , S. Henrot-Versill´ e 66 , D. Herranz 57 , S. R. Hildebrandt 9,65,56 , E. Hivon 52 , M. Hobson 4 , W. A. Holmes 59 , W. Hovest 68 , R. J. Hoyland 56 , K. M. Huffenberger 81 , A. H. Jaffe 49 , M. Juvela 20 ,E.Keih¨anen 20 , R. Keskitalo 59,20 , T. S. Kisner 67 , R. Kneissl 34,5 , L. Knox 23 , H. Kurki-Suonio 20,38 , G. Lagache 51 ,A.L¨ahteenm¨ aki 1,38 , A. Lasenby 4,61 , R. J. Laureijs 36 , C. R. Lawrence 59 , S. Leach 73 , J. P. Leahy 60 , R. Leonardi 35,36,24 , P. B. Lilje 55,10 , M. Linden-Vørnle 13 , M. L´opez-Caniego 57 , P. M. Lubin 24 , J. F. Mac´ ıas-P´ erez 65 , B. Maffei 60 , M. Magliocchetti 39 , D. Maino 28,45 , N. Mandolesi 44 , R. Mann 74 , M. Maris 43 , E. Mart´ ınez-Gonz´alez 57 , S. Masi 27 , M. Massardi 41 , S. Matarrese 26 , F. Matthai 68 , P. Mazzotta 31 , P. R. Meinhold 24 , A. Melchiorri 27 , L. Mendes 35 , A. Mennella 28,43 , M.-A. Miville-Deschˆ enes 51,7 , A. Moneti 52 , L. Montier 79,8 , G. Morgante 44 , D. Mortlock 49 , D. Munshi 75,54 , A. Murphy 70 , P. Naselsky 71,32 , P. Natoli 30,2,44 , C. B. Netterfield 16 , H. U. Nørgaard-Nielsen 13 , F. Noviello 51 , D. Novikov 49 , I. Novikov 71 , I. J. O’Dwyer 59 , S. Osborne 78 , F. Pajot 51 , R. Paladini 77,9 , B. Partridge 37 , F. Pasian 43 , G. Patanchon 3 , T. J. Pearson 9,50 , O. Perdereau 66 , L. Perotto 65 , F. Perrotta 73 , F. Piacentini 27 , M. Piat 3 , E. Pierpaoli 19 , S. Plaszczynski 66 , P. Platania 58 , E. Pointecouteau 79,8 , G. Polenta 2,42 , N. Ponthieu 51 , T. Poutanen 38,20,1 , G. Pr´ ezeau 9,59 , S. Prunet 52 , J.-L. Puget 51 , J. P. Rachen 68 , R. Rebolo 56,33 , M. Reinecke 68 , S. Ricciardi 44 , T. Riller 68 , I. Ristorcelli 79,8 , G. Rocha 59,9 , C. Rosset 3 , M. Rowan-Robinson 49 , J. A. Rubi˜ no-Mart´ ın 56,33 , B. Rusholme 50 , A. Sajina 37 , M. Sandri 44 , D. Scott 18 , M. D. Seiffert 59,9 , S. Serjeant 17 , P. Shellard 11 , G. F. Smoot 22,67,3 , J.-L. Starck 63,12 , F. Stivoli 46 , V. Stolyarov 4 , R. Stompor 3 , R. Sudiwala 75 , J.-F. Sygnet 52 , J. A. Tauber 36 , L. Terenzi 44 , L. Toffolatti 14 , M. Tomasi 28,45 , J.-P. Torre 51 , M. Tristram 66 , J. Tuovinen 69 , M. T¨ urler 48 , G. Umana 40 , L. Valenziano 44 , J. Varis 69 , P. Vielva 57 , F. Villa 44 , N. Vittorio 31 , L. A. Wade 59 , B. D. Wandelt 52,25 , A. Wilkinson 60 , D. Yvon 12 , A. Zacchei 43 , and A. Zonca 24 (Affiliations can be found after the references) .... ABSTRACT The data reported in Planck ’s Early Release Compact Source Catalogue (ERCSC) are exploited to measure the number counts (dN/dS) of extragalactic radio sources at 30, 44, 70, 100, 143 and 217 GHz. Due to the full-sky nature of the catalogue, this measurement extends to the rarest and brightest sources in the sky. At lower frequencies (30, 44, and 70 GHz) our counts are in very good agreement with estimates based on WMAP data, being somewhat deeper at 30 and 70 GHz, and somewhat shallower at 44 GHz. Planck ’s source counts at 143 and 217 GHz join smoothly with the fainter ones provided by the SPT and ACT surveys over small fractions of the sky. An analysis of source spectra, exploiting Planck ’s uniquely broad spectral coverage, finds clear evidence of a steepening of the mean spectral index above about 70 GHz. This implies that, at these frequencies, the contamination of the CMB power spectrum by radio sources below the detection limit is significantly lower than previously estimated. Key words. Surveys - - Radio continuum: general - - Galaxies: active 1. Introduction Planck 1 (Tauber et al. 2010; Planck Collaboration 2011a) is the third-generation space mission to measure the 1 Planck (http://www.esa.int/Planck ) is a project of the European Space Agency (ESA) with instruments provided by two scientific consortia funded by ESA member states (in par- ticular the lead countries: France and Italy) with contributions from NASA (USA), and telescope reflectors provided in a collab- oration between ESA and a scientific consortium led and funded by Denmark. 1
-
Upload
independent -
Category
Documents
-
view
1 -
download
0
Transcript of Planck early results. XIII. Statistical properties of extragalactic radio sources in the Planck...
arX
iv:1
101.
2044
v2 [
astr
o-ph
.CO
] 2
8 Fe
b 20
11Astronomy & Astrophysics manuscript no. 16471 c© ESO 2011March 1, 2011
Planck Early Results: Statistical properties of extragalactic radio
sources in the Planck Early Release Compact Source Catalogue
Planck Collaboration: P. A. R. Ade75, N. Aghanim51, F. Argueso15, M. Arnaud63, M. Ashdown61,4, J. Aumont51,C. Baccigalupi73 , A. Balbi31, A. J. Banday79,8,68, R. B. Barreiro57 , J. G. Bartlett3,59, E. Battaner80, K. Benabed52,
J.-P. Bernard79,8, M. Bersanelli28,45 , R. Bhatia5, A. Bonaldi41, L. Bonavera73,6, J. R. Bond7, J. Borrill67,76 , F. R. Bouchet52,M. Bucher3, C. Burigana44 , P. Cabella31 , B. Cappellini45 , J.-F. Cardoso64,3,52 , A. Catalano3,62 , L. Cayon21, A. Challinor54,61,11 ,
A. Chamballu49, R.-R. Chary50, X. Chen50, L.-Y Chiang53, P. R. Christensen71,32, D. L. Clements49, S. Colafrancesco42 ,S. Colombi52 , F. Couchot66, B. P. Crill59,72 , F. Cuttaia44, L. Danese73, R. D. Davies60, R. J. Davis60, P. de Bernardis27, G. de
Gasperis31, A. de Rosa44, G. de Zotti41,73 , J. Delabrouille3, J.-M. Delouis52, F.-X. Desert47, C. Dickinson60, H. Dole51,S. Donzelli45,55 , O. Dore59,9, U. Dorl68, M. Douspis51, X. Dupac35, G. Efstathiou54, T. A. Enßlin68, H. K. Eriksen55, F. Finelli44,
O. Forni79,8, M. Frailis43 , E. Franceschi44, S. Galeotta43, K. Ganga3,50, M. Giard79,8, G. Giardino36, Y. Giraud-Heraud3,J. Gonzalez-Nuevo73, K. M. Gorski59,82 , S. Gratton61,54, A. Gregorio29 , A. Gruppuso44, F. K. Hansen55, D. Harrison54,61 ,
S. Henrot-Versille66, D. Herranz57, S. R. Hildebrandt9,65,56, E. Hivon52, M. Hobson4, W. A. Holmes59, W. Hovest68,R. J. Hoyland56, K. M. Huffenberger81, A. H. Jaffe49, M. Juvela20, E. Keihanen20, R. Keskitalo59,20 , T. S. Kisner67,R. Kneissl34,5, L. Knox23, H. Kurki-Suonio20,38, G. Lagache51, A. Lahteenmaki1,38, A. Lasenby4,61, R. J. Laureijs36,
C. R. Lawrence59, S. Leach73, J. P. Leahy60, R. Leonardi35,36,24 , P. B. Lilje55,10 , M. Linden-Vørnle13, M. Lopez-Caniego57 ,P. M. Lubin24, J. F. Macıas-Perez65 , B. Maffei60, M. Magliocchetti39 , D. Maino28,45 , N. Mandolesi44 , R. Mann74, M. Maris43,
E. Martınez-Gonzalez57 , S. Masi27, M. Massardi41, S. Matarrese26 , F. Matthai68, P. Mazzotta31 , P. R. Meinhold24,A. Melchiorri27 , L. Mendes35, A. Mennella28,43 , M.-A. Miville-Deschenes51,7 , A. Moneti52, L. Montier79,8, G. Morgante44,
D. Mortlock49, D. Munshi75,54, A. Murphy70, P. Naselsky71,32, P. Natoli30,2,44 , C. B. Netterfield16, H. U. Nørgaard-Nielsen13,F. Noviello51, D. Novikov49, I. Novikov71, I. J. O’Dwyer59, S. Osborne78, F. Pajot51, R. Paladini77,9, B. Partridge37 , F. Pasian43 ,
G. Patanchon3, T. J. Pearson9,50, O. Perdereau66, L. Perotto65, F. Perrotta73, F. Piacentini27, M. Piat3, E. Pierpaoli19 ,S. Plaszczynski66, P. Platania58 , E. Pointecouteau79,8, G. Polenta2,42, N. Ponthieu51, T. Poutanen38,20,1, G. Prezeau9,59,S. Prunet52, J.-L. Puget51, J. P. Rachen68, R. Rebolo56,33, M. Reinecke68, S. Ricciardi44, T. Riller68, I. Ristorcelli79,8 ,
G. Rocha59,9, C. Rosset3, M. Rowan-Robinson49, J. A. Rubino-Martın56,33 , B. Rusholme50, A. Sajina37 , M. Sandri44, D. Scott18,M. D. Seiffert59,9, S. Serjeant17, P. Shellard11, G. F. Smoot22,67,3, J.-L. Starck63,12, F. Stivoli46, V. Stolyarov4, R. Stompor3,R. Sudiwala75, J.-F. Sygnet52, J. A. Tauber36, L. Terenzi44, L. Toffolatti14 , M. Tomasi28,45 , J.-P. Torre51, M. Tristram66,J. Tuovinen69, M. Turler48 , G. Umana40, L. Valenziano44, J. Varis69, P. Vielva57, F. Villa44, N. Vittorio31, L. A. Wade59,
B. D. Wandelt52,25, A. Wilkinson60, D. Yvon12, A. Zacchei43, and A. Zonca24
(Affiliations can be found after the references)
....
ABSTRACT
The data reported in Planck ’s Early Release Compact Source Catalogue (ERCSC) are exploited to measure the number counts(dN/dS) of extragalactic radio sources at 30, 44, 70, 100, 143 and 217 GHz. Due to the full-sky nature of the catalogue, thismeasurement extends to the rarest and brightest sources in the sky. At lower frequencies (30, 44, and 70GHz) our counts are invery good agreement with estimates based on WMAP data, being somewhat deeper at 30 and 70GHz, and somewhat shallowerat 44GHz. Planck ’s source counts at 143 and 217GHz join smoothly with the fainter ones provided by the SPT and ACT surveysover small fractions of the sky. An analysis of source spectra, exploiting Planck ’s uniquely broad spectral coverage, finds clearevidence of a steepening of the mean spectral index above about 70GHz. This implies that, at these frequencies, the contaminationof the CMB power spectrum by radio sources below the detection limit is significantly lower than previously estimated.
Key words. Surveys - - Radio continuum: general - - Galaxies: active
1. Introduction
Planck1 (Tauber et al. 2010; Planck Collaboration 2011a)is the third-generation space mission to measure the
1 Planck (http://www.esa.int/Planck ) is a project of theEuropean Space Agency (ESA) with instruments provided bytwo scientific consortia funded by ESA member states (in par-ticular the lead countries: France and Italy) with contributionsfrom NASA (USA), and telescope reflectors provided in a collab-oration between ESA and a scientific consortium led and fundedby Denmark.
1
Planck Collaboration: Statistical properties of ERS
anisotropy of the cosmic microwave background (CMB).It observes the sky in nine frequency bands cov-ering 30–857GHz with high sensitivity and angu-lar resolution from 31′ to 5′. The Low FrequencyInstrument (LFI; Mandolesi et al. 2010; Bersanelli et al.2010; Mennella et al. 2011) covers the 30, 44, and70GHz bands with amplifiers cooled to 20K. TheHigh Frequency Instrument (HFI; Lamarre et al. 2010;Planck HFI Core Team 2011a) covers the 100, 143, 217,353, 545, and 857GHz bands with bolometers cooled to0.1K. Polarization is measured in all but the highest twobands (Leahy et al. 2010; Rosset et al. 2010). A combina-tion of radiative cooling and three mechanical coolers pro-duces the temperatures needed for the detectors and optics(Planck Collaboration 2011b). Two data processing centres(DPCs) check and calibrate the data and make maps of thesky (Planck HFI Core Team 2011b; Zacchei et al. 2011).Planck ’s sensitivity, angular resolution, and frequency cov-erage make it a powerful instrument for galactic and ex-tragalactic astrophysics as well as cosmology. Early astro-physics results are given in Planck Collaboration, 2011h–z.
The Planck Early Release Compact Source Catalogue(ERCSC, Planck Collaboration (2011c)) reports data onsources detected during the first 1.6 full-sky surveys, andthus offers, among other things, the opportunity of study-ing the statistical properties of extragalactic sources overa broad frequency range never fully explored by blind sur-veys. We will focus here on counts of extragalactic radiosources and on their spectral properties in the 30–217GHzrange.2
Although knowledge of the statistical properties athigh radio frequency for this population of extragalacticsources has greatly improved in the recent past – thanksto many ground-based observational campaigns and to theWilkinson Microwave Anisotropy Probe (WMAP) surveysfrom space – above about 70GHz these properties are stilllargely unknown or very uncertain. This is essentially dueto the fact that very large area surveys at mm wavelengthsare made difficult by the small fields of view of ground-based radio telescopes and by the long integration timesrequired.
The most recent estimates on source number counts upto ∼ 50−70 GHz, and the optical identifications of the cor-responding bright point sources (see, e.g., Massardi et al.(2008, 2010)), show that these counts are dominated byradio sources whose average spectral index is “flat”, i.e.,α ≃ 0.0 (with the usual convention Sν ∝ ν
α). This re-sult confirms that the underlying source population is es-sentially made of Flat Spectrum Radio Quasars (FSRQ)and BL Lac objects, collectively called blazars,3 with mi-nor contributions coming from other source populations(Toffolatti et al. 1998; de Zotti et al. 2005). At frequencies
2 In all our calculations we have used the effective cen-tral frequencies for the Planck channels (Mennella et al. 2011;Planck HFI Core Team 2011a), although we indicate their nom-inal values. The most relevant difference is at 30GHz, with acentral frequency of 28.5.
3 Blazars are jet-dominated extragalactic objects character-ized by a strongly variable and polarized emission of the non-thermal radiation, from low radio energies up to the high en-ergy gamma rays (Urry & Padovani 1995). Detailed analyses ofSpectral Energy Distributions (SEDs) of complete blazar sam-ples built by using simultaneous Planck , Swift and Fermi dataare given in (Planck Collaboration 2011k).
> 100GHz, however, there is now new information forsources with flux densities below about 1 Jy coming fromthe South Pole Telescope (SPT) collaboration (Vieira et al.2010), with surveys over 87 deg2 at 150 and 220GHz, andfrom the Atacama Cosmology Telescope (ACT) survey over455 deg2 at 148GHz (Marriage et al. 2010).
The “flat” spectra of blazars are generally be-lieved to result from the superposition of different com-ponents in the inner part of AGN relativistic jets,each with a different synchrotron self-absorption fre-quency (Kellermann & Pauliny-Toth 1969). At a given fre-quency, the observed flux density is thus dominated bythe synchrotron-emitting component which becomes self-absorbed and, in the equipartition regime, the resultingspectrum is approximately flat. However, this “flat” spec-trum cannot be maintained up to very high frequencies, be-cause of electron energy losses in the dominant jet-emissioncomponent (i.e., electron ageing), or the transition to theoptically-thin regime, with the onset of a “steep” spec-trum with a standard spectral index α = −0.7 to −0.8.A slightly steepened spectrum may also be caused by thesuperposition of many jet components. The redshift movesthe observed steepening to lower frequencies and, thus, agreater fraction of blazar sources are observed with a steepspectrum at sub-mm wavelengths. With current data itis not yet possible to decide among the different scenar-ios. However, given their sensitivity and full sky coverage,Planck surveys are uniquely able to shed light on this tran-sition from an almost “flat” to a “steep” regime in the spec-tra of blazar sources.
The outline of this paper is as follows. In § 2.1 we brieflysketch the main properties of the ERCSC. In § 2.2 we sum-marize the source validation. In § 2.3 we describe the com-plete sample selected at 30GHz, used for the analysis ofspectral properties. In § 3 we present the source counts overthe frequency range 30–217GHz. In § 4 we investigate thespectral index distributions in different frequency intervals.Finally, in § 5 we summarize our main conclusions.
2. The Planck ERCSC
2.1. Overview
The Planck ERCSC (Planck Collaboration 2011c) lists po-sitions and flux densities for the compact sources recoveredfrom the Planck first 1.6 full sky survey maps in nine fre-quency channels between 30 and 857GHz. Thus about 60%of the sources have been covered twice, with a time sepa-ration of about 6 months. Sources near the ecliptic poles,where the scan circles intersect, are often covered multipletimes. ERCSC flux densities are therefore averages over dif-ferent observing time periods. They have been calculatedby aperture photometry, using the most recent definition ofthe beam shapes and sizes (Planck HFI Core Team 2011b;Zacchei et al. 2011). In the frequency range considered inthis paper, the Planck photometric calibration is based onthe CMB dipole and on the modulation induced on it bythe spacecraft orbital motion. According to Zacchei et al.(2011) the absolute photometric calibration at LFI fre-quencies (30, 44 and 70 GHz) is at the ∼ 1% level, whilePlanck HFI Core Team (2011b) reports on a relative photo-metric accuracy, between the frequency channels from 100to 353 GHz, better than 2% and, more likely, at the ∼ 1%level.
2
Planck Collaboration: Statistical properties of ERS
100
101
100
101
Flux PACO [32.2 GHz; Jy]
Flu
x E
RC
SC
[28.
5 G
Hz;
Jy]
100
101
100
101
Flux PACO [39.7 GHz; Jy]
Flu
x E
RC
SC
[44.
1 G
Hz;
Jy]
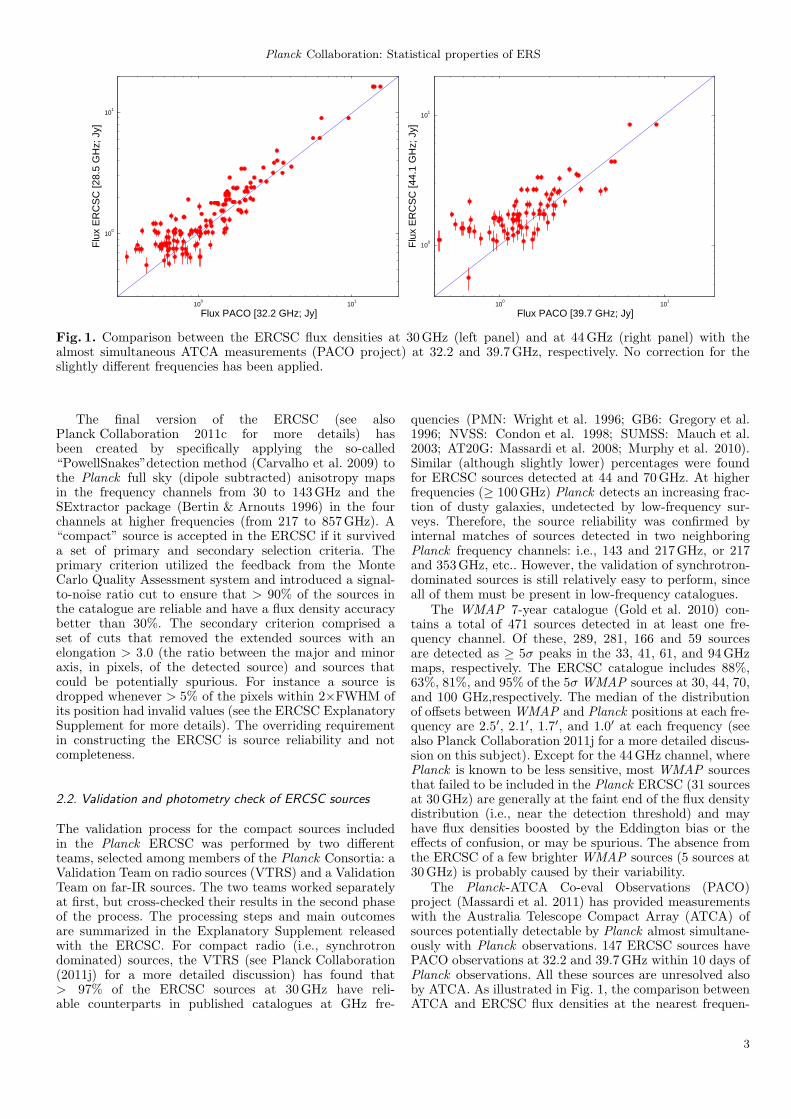
Fig. 1. Comparison between the ERCSC flux densities at 30GHz (left panel) and at 44GHz (right panel) with thealmost simultaneous ATCA measurements (PACO project) at 32.2 and 39.7GHz, respectively. No correction for theslightly different frequencies has been applied.
The final version of the ERCSC (see alsoPlanck Collaboration 2011c for more details) hasbeen created by specifically applying the so-called“PowellSnakes”detection method (Carvalho et al. 2009) tothe Planck full sky (dipole subtracted) anisotropy mapsin the frequency channels from 30 to 143GHz and theSExtractor package (Bertin & Arnouts 1996) in the fourchannels at higher frequencies (from 217 to 857GHz). A“compact” source is accepted in the ERCSC if it surviveda set of primary and secondary selection criteria. Theprimary criterion utilized the feedback from the MonteCarlo Quality Assessment system and introduced a signal-to-noise ratio cut to ensure that > 90% of the sources inthe catalogue are reliable and have a flux density accuracybetter than 30%. The secondary criterion comprised aset of cuts that removed the extended sources with anelongation > 3.0 (the ratio between the major and minoraxis, in pixels, of the detected source) and sources thatcould be potentially spurious. For instance a source isdropped whenever > 5% of the pixels within 2×FWHM ofits position had invalid values (see the ERCSC ExplanatorySupplement for more details). The overriding requirementin constructing the ERCSC is source reliability and notcompleteness.
2.2. Validation and photometry check of ERCSC sources
The validation process for the compact sources includedin the Planck ERCSC was performed by two differentteams, selected among members of the Planck Consortia: aValidation Team on radio sources (VTRS) and a ValidationTeam on far-IR sources. The two teams worked separatelyat first, but cross-checked their results in the second phaseof the process. The processing steps and main outcomesare summarized in the Explanatory Supplement releasedwith the ERCSC. For compact radio (i.e., synchrotrondominated) sources, the VTRS (see Planck Collaboration(2011j) for a more detailed discussion) has found that> 97% of the ERCSC sources at 30GHz have reli-able counterparts in published catalogues at GHz fre-
quencies (PMN: Wright et al. 1996; GB6: Gregory et al.1996; NVSS: Condon et al. 1998; SUMSS: Mauch et al.2003; AT20G: Massardi et al. 2008; Murphy et al. 2010).Similar (although slightly lower) percentages were foundfor ERCSC sources detected at 44 and 70GHz. At higherfrequencies (≥ 100GHz) Planck detects an increasing frac-tion of dusty galaxies, undetected by low-frequency sur-veys. Therefore, the source reliability was confirmed byinternal matches of sources detected in two neighboringPlanck frequency channels: i.e., 143 and 217GHz, or 217and 353GHz, etc.. However, the validation of synchrotron-dominated sources is still relatively easy to perform, sinceall of them must be present in low-frequency catalogues.
The WMAP 7-year catalogue (Gold et al. 2010) con-tains a total of 471 sources detected in at least one fre-quency channel. Of these, 289, 281, 166 and 59 sourcesare detected as ≥ 5σ peaks in the 33, 41, 61, and 94GHzmaps, respectively. The ERCSC catalogue includes 88%,63%, 81%, and 95% of the 5σ WMAP sources at 30, 44, 70,and 100 GHz,respectively. The median of the distributionof offsets between WMAP and Planck positions at each fre-quency are 2.5′, 2.1′, 1.7′, and 1.0′ at each frequency (seealso Planck Collaboration 2011j for a more detailed discus-sion on this subject). Except for the 44GHz channel, wherePlanck is known to be less sensitive, most WMAP sourcesthat failed to be included in the Planck ERCSC (31 sourcesat 30GHz) are generally at the faint end of the flux densitydistribution (i.e., near the detection threshold) and mayhave flux densities boosted by the Eddington bias or theeffects of confusion, or may be spurious. The absence fromthe ERCSC of a few brighter WMAP sources (5 sources at30GHz) is probably caused by their variability.
The Planck -ATCA Co-eval Observations (PACO)project (Massardi et al. 2011) has provided measurementswith the Australia Telescope Compact Array (ATCA) ofsources potentially detectable by Planck almost simultane-ously with Planck observations. 147 ERCSC sources havePACO observations at 32.2 and 39.7GHz within 10 days ofPlanck observations. All these sources are unresolved alsoby ATCA. As illustrated in Fig. 1, the comparison betweenATCA and ERCSC flux densities at the nearest frequen-
3
Planck Collaboration: Statistical properties of ERS
10−2
10−1
100
101
100
101
102
30 GHz
10−2
10−1
100
101
100
101
102
44 GHz
S5/
2 *dN
/dS
[Jy3/
2 sr−
1 ]
10−2
10−1
100
101
100
101
102
70 GHz
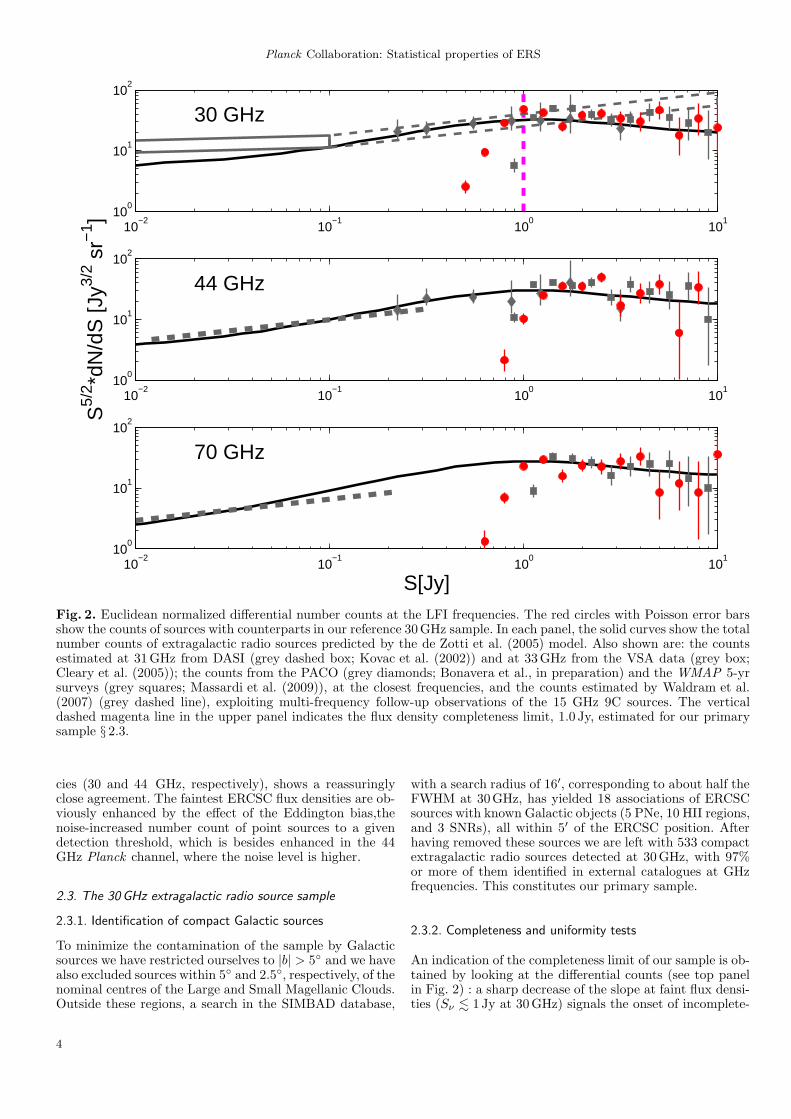
S[Jy]Fig. 2. Euclidean normalized differential number counts at the LFI frequencies. The red circles with Poisson error barsshow the counts of sources with counterparts in our reference 30GHz sample. In each panel, the solid curves show the totalnumber counts of extragalactic radio sources predicted by the de Zotti et al. (2005) model. Also shown are: the countsestimated at 31GHz from DASI (grey dashed box; Kovac et al. (2002)) and at 33GHz from the VSA data (grey box;Cleary et al. (2005)); the counts from the PACO (grey diamonds; Bonavera et al., in preparation) and the WMAP 5-yrsurveys (grey squares; Massardi et al. (2009)), at the closest frequencies, and the counts estimated by Waldram et al.(2007) (grey dashed line), exploiting multi-frequency follow-up observations of the 15 GHz 9C sources. The verticaldashed magenta line in the upper panel indicates the flux density completeness limit, 1.0 Jy, estimated for our primarysample § 2.3.
cies (30 and 44 GHz, respectively), shows a reassuringlyclose agreement. The faintest ERCSC flux densities are ob-viously enhanced by the effect of the Eddington bias,thenoise-increased number count of point sources to a givendetection threshold, which is besides enhanced in the 44GHz Planck channel, where the noise level is higher.
2.3. The 30GHz extragalactic radio source sample
2.3.1. Identification of compact Galactic sources
To minimize the contamination of the sample by Galacticsources we have restricted ourselves to |b| > 5 and we havealso excluded sources within 5 and 2.5, respectively, of thenominal centres of the Large and Small Magellanic Clouds.Outside these regions, a search in the SIMBAD database,
with a search radius of 16′, corresponding to about half theFWHM at 30GHz, has yielded 18 associations of ERCSCsources with known Galactic objects (5 PNe, 10 HII regions,and 3 SNRs), all within 5′ of the ERCSC position. Afterhaving removed these sources we are left with 533 compactextragalactic radio sources detected at 30GHz, with 97%or more of them identified in external catalogues at GHzfrequencies. This constitutes our primary sample.
2.3.2. Completeness and uniformity tests
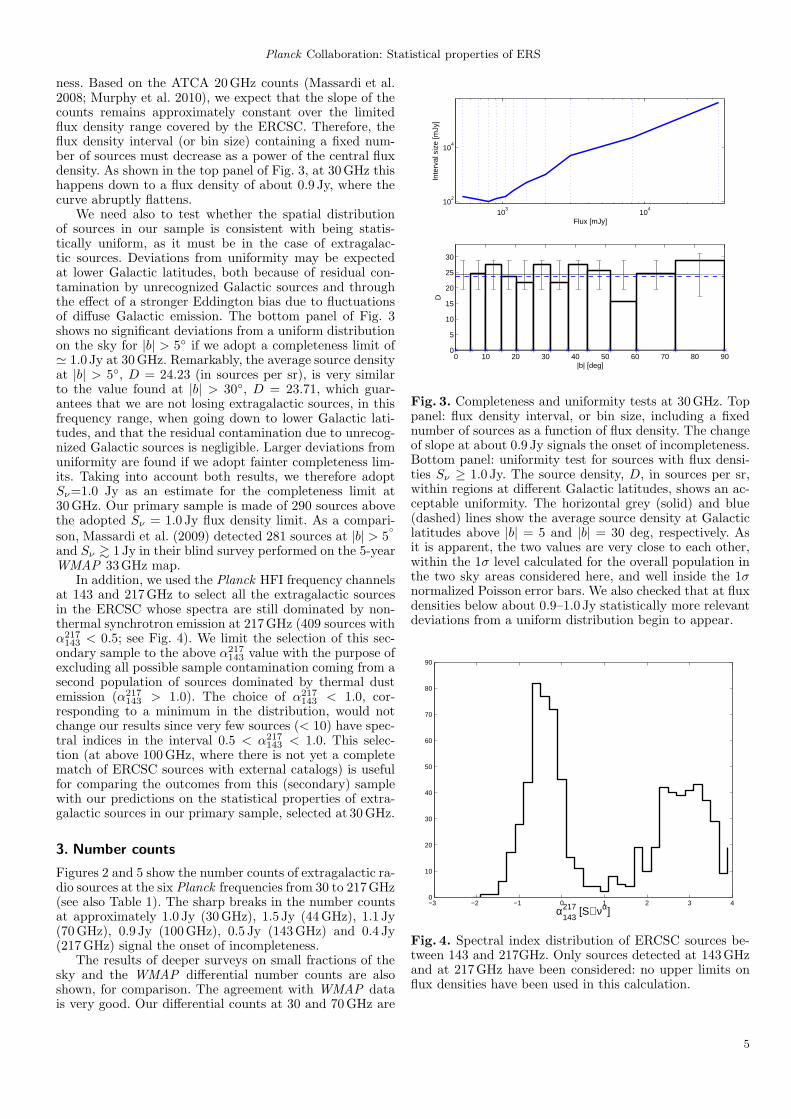
An indication of the completeness limit of our sample is ob-tained by looking at the differential counts (see top panelin Fig. 2) : a sharp decrease of the slope at faint flux densi-ties (Sν
<∼ 1 Jy at 30GHz) signals the onset of incomplete-
4
Planck Collaboration: Statistical properties of ERS
ness. Based on the ATCA 20GHz counts (Massardi et al.2008; Murphy et al. 2010), we expect that the slope of thecounts remains approximately constant over the limitedflux density range covered by the ERCSC. Therefore, theflux density interval (or bin size) containing a fixed num-ber of sources must decrease as a power of the central fluxdensity. As shown in the top panel of Fig. 3, at 30GHz thishappens down to a flux density of about 0.9 Jy, where thecurve abruptly flattens.
We need also to test whether the spatial distributionof sources in our sample is consistent with being statis-tically uniform, as it must be in the case of extragalac-tic sources. Deviations from uniformity may be expectedat lower Galactic latitudes, both because of residual con-tamination by unrecognized Galactic sources and throughthe effect of a stronger Eddington bias due to fluctuationsof diffuse Galactic emission. The bottom panel of Fig. 3shows no significant deviations from a uniform distributionon the sky for |b| > 5 if we adopt a completeness limit of≃ 1.0Jy at 30GHz. Remarkably, the average source densityat |b| > 5, D = 24.23 (in sources per sr), is very similarto the value found at |b| > 30, D = 23.71, which guar-antees that we are not losing extragalactic sources, in thisfrequency range, when going down to lower Galactic lati-tudes, and that the residual contamination due to unrecog-nized Galactic sources is negligible. Larger deviations fromuniformity are found if we adopt fainter completeness lim-its. Taking into account both results, we therefore adoptSν=1.0 Jy as an estimate for the completeness limit at30GHz. Our primary sample is made of 290 sources abovethe adopted Sν = 1.0 Jy flux density limit. As a compari-son, Massardi et al. (2009) detected 281 sources at |b| > 5
and Sν>∼ 1 Jy in their blind survey performed on the 5-year
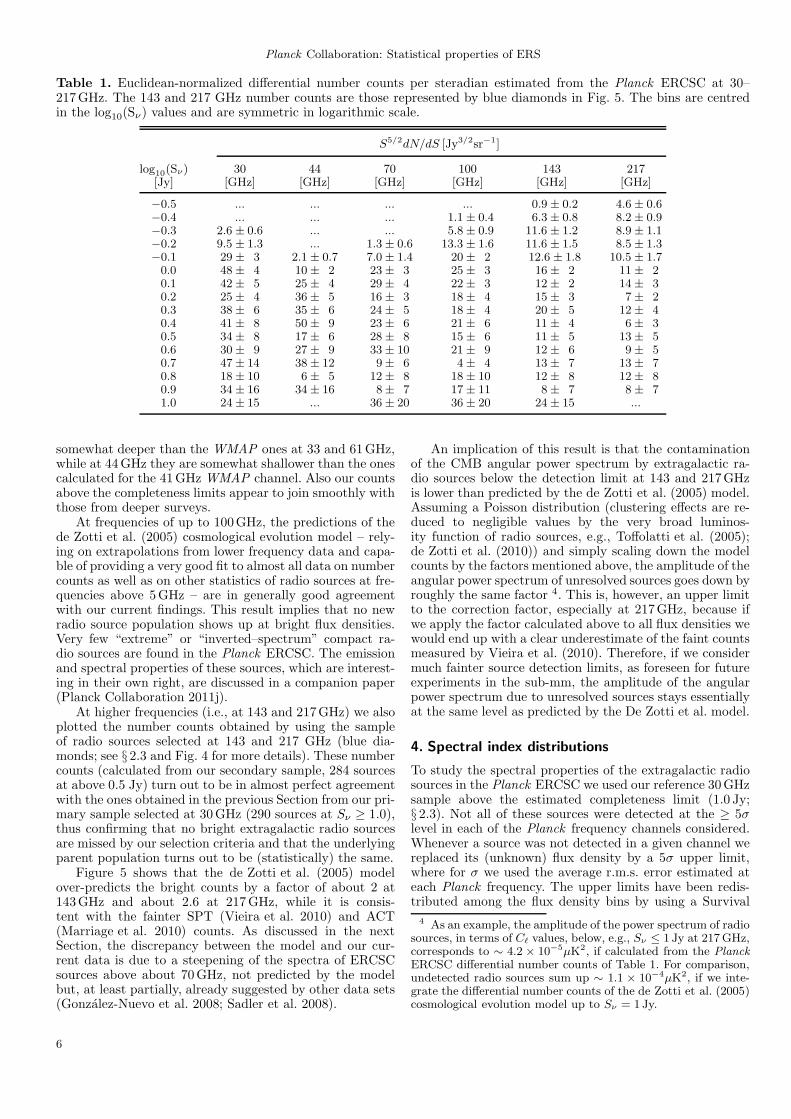
WMAP 33GHz map.In addition, we used the Planck HFI frequency channels
at 143 and 217GHz to select all the extragalactic sourcesin the ERCSC whose spectra are still dominated by non-thermal synchrotron emission at 217GHz (409 sources withα217
143< 0.5; see Fig. 4). We limit the selection of this sec-
ondary sample to the above α217
143 value with the purpose ofexcluding all possible sample contamination coming from asecond population of sources dominated by thermal dustemission (α217
143 > 1.0). The choice of α217
143 < 1.0, cor-responding to a minimum in the distribution, would notchange our results since very few sources (< 10) have spec-tral indices in the interval 0.5 < α
217
143 < 1.0. This selec-tion (at above 100GHz, where there is not yet a completematch of ERCSC sources with external catalogs) is usefulfor comparing the outcomes from this (secondary) samplewith our predictions on the statistical properties of extra-galactic sources in our primary sample, selected at 30GHz.
3. Number counts
Figures 2 and 5 show the number counts of extragalactic ra-dio sources at the six Planck frequencies from 30 to 217GHz(see also Table 1). The sharp breaks in the number countsat approximately 1.0 Jy (30GHz), 1.5 Jy (44GHz), 1.1 Jy(70GHz), 0.9 Jy (100GHz), 0.5 Jy (143GHz) and 0.4 Jy(217GHz) signal the onset of incompleteness.
The results of deeper surveys on small fractions of thesky and the WMAP differential number counts are alsoshown, for comparison. The agreement with WMAP datais very good. Our differential counts at 30 and 70GHz are
103
104
102
104
Flux [mJy]
Inte
rval
siz
e [m
Jy]
0 10 20 30 40 50 60 70 80 900
5
10
15
20
25
30
|b| [deg]
D
Fig. 3. Completeness and uniformity tests at 30GHz. Toppanel: flux density interval, or bin size, including a fixednumber of sources as a function of flux density. The changeof slope at about 0.9 Jy signals the onset of incompleteness.Bottom panel: uniformity test for sources with flux densi-ties Sν ≥ 1.0 Jy. The source density, D, in sources per sr,within regions at different Galactic latitudes, shows an ac-ceptable uniformity. The horizontal grey (solid) and blue(dashed) lines show the average source density at Galacticlatitudes above |b| = 5 and |b| = 30 deg, respectively. Asit is apparent, the two values are very close to each other,within the 1σ level calculated for the overall population inthe two sky areas considered here, and well inside the 1σnormalized Poisson error bars. We also checked that at fluxdensities below about 0.9–1.0 Jy statistically more relevantdeviations from a uniform distribution begin to appear.
−3 −2 −1 0 1 2 3 40
10
20
30
40
50
60
70
80
90
α217143
[S∝ν α]
Fig. 4. Spectral index distribution of ERCSC sources be-tween 143 and 217GHz. Only sources detected at 143GHzand at 217GHz have been considered: no upper limits onflux densities have been used in this calculation.
5
Planck Collaboration: Statistical properties of ERS
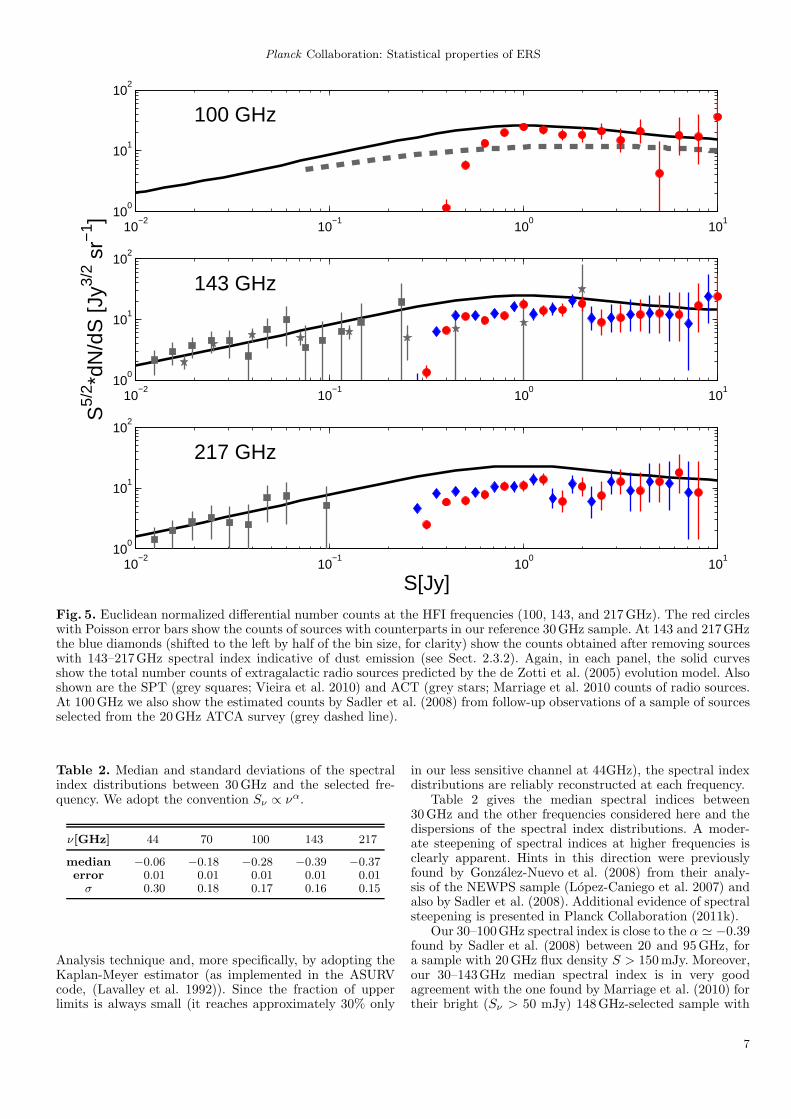
Table 1. Euclidean-normalized differential number counts per steradian estimated from the Planck ERCSC at 30–217GHz. The 143 and 217 GHz number counts are those represented by blue diamonds in Fig. 5. The bins are centredin the log10(Sν) values and are symmetric in logarithmic scale.
S5/2dN/dS [Jy3/2sr−1]
log10(Sν) 30 44 70 100 143 217
[Jy] [GHz] [GHz] [GHz] [GHz] [GHz] [GHz]
−0.5 ... ... ... ... 0.9± 0.2 4.6± 0.6−0.4 ... ... ... 1.1± 0.4 6.3± 0.8 8.2± 0.9−0.3 2.6 ± 0.6 ... ... 5.8± 0.9 11.6 ± 1.2 8.9± 1.1−0.2 9.5 ± 1.3 ... 1.3± 0.6 13.3 ± 1.6 11.6 ± 1.5 8.5± 1.3−0.1 29± 3 2.1± 0.7 7.0± 1.4 20± 2 12.6 ± 1.8 10.5 ± 1.70.0 48± 4 10± 2 23± 3 25± 3 16± 2 11± 20.1 42± 5 25± 4 29± 4 22± 3 12± 2 14± 30.2 25± 4 36± 5 16± 3 18± 4 15± 3 7± 20.3 38± 6 35± 6 24± 5 18± 4 20± 5 12± 40.4 41± 8 50± 9 23± 6 21± 6 11± 4 6± 30.5 34± 8 17± 6 28± 8 15± 6 11± 5 13± 50.6 30± 9 27± 9 33± 10 21± 9 12± 6 9± 50.7 47± 14 38± 12 9± 6 4± 4 13± 7 13± 70.8 18± 10 6± 5 12± 8 18± 10 12± 8 12± 80.9 34± 16 34± 16 8± 7 17± 11 8± 7 8± 71.0 24± 15 ... 36± 20 36± 20 24± 15 ...
somewhat deeper than the WMAP ones at 33 and 61GHz,while at 44GHz they are somewhat shallower than the onescalculated for the 41GHz WMAP channel. Also our countsabove the completeness limits appear to join smoothly withthose from deeper surveys.
At frequencies of up to 100GHz, the predictions of thede Zotti et al. (2005) cosmological evolution model – rely-ing on extrapolations from lower frequency data and capa-ble of providing a very good fit to almost all data on numbercounts as well as on other statistics of radio sources at fre-quencies above 5GHz – are in generally good agreementwith our current findings. This result implies that no newradio source population shows up at bright flux densities.Very few “extreme” or “inverted–spectrum” compact ra-dio sources are found in the Planck ERCSC. The emissionand spectral properties of these sources, which are interest-ing in their own right, are discussed in a companion paper(Planck Collaboration 2011j).
At higher frequencies (i.e., at 143 and 217GHz) we alsoplotted the number counts obtained by using the sampleof radio sources selected at 143 and 217 GHz (blue dia-monds; see § 2.3 and Fig. 4 for more details). These numbercounts (calculated from our secondary sample, 284 sourcesat above 0.5 Jy) turn out to be in almost perfect agreementwith the ones obtained in the previous Section from our pri-mary sample selected at 30GHz (290 sources at Sν ≥ 1.0),thus confirming that no bright extragalactic radio sourcesare missed by our selection criteria and that the underlyingparent population turns out to be (statistically) the same.
Figure 5 shows that the de Zotti et al. (2005) modelover-predicts the bright counts by a factor of about 2 at143GHz and about 2.6 at 217GHz, while it is consis-tent with the fainter SPT (Vieira et al. 2010) and ACT(Marriage et al. 2010) counts. As discussed in the nextSection, the discrepancy between the model and our cur-rent data is due to a steepening of the spectra of ERCSCsources above about 70GHz, not predicted by the modelbut, at least partially, already suggested by other data sets(Gonzalez-Nuevo et al. 2008; Sadler et al. 2008).
An implication of this result is that the contaminationof the CMB angular power spectrum by extragalactic ra-dio sources below the detection limit at 143 and 217GHzis lower than predicted by the de Zotti et al. (2005) model.Assuming a Poisson distribution (clustering effects are re-duced to negligible values by the very broad luminos-ity function of radio sources, e.g., Toffolatti et al. (2005);de Zotti et al. (2010)) and simply scaling down the modelcounts by the factors mentioned above, the amplitude of theangular power spectrum of unresolved sources goes down byroughly the same factor 4. This is, however, an upper limitto the correction factor, especially at 217GHz, because ifwe apply the factor calculated above to all flux densities wewould end up with a clear underestimate of the faint countsmeasured by Vieira et al. (2010). Therefore, if we considermuch fainter source detection limits, as foreseen for futureexperiments in the sub-mm, the amplitude of the angularpower spectrum due to unresolved sources stays essentiallyat the same level as predicted by the De Zotti et al. model.
4. Spectral index distributions
To study the spectral properties of the extragalactic radiosources in the Planck ERCSC we used our reference 30GHzsample above the estimated completeness limit (1.0 Jy;§ 2.3). Not all of these sources were detected at the ≥ 5σlevel in each of the Planck frequency channels considered.Whenever a source was not detected in a given channel wereplaced its (unknown) flux density by a 5σ upper limit,where for σ we used the average r.m.s. error estimated ateach Planck frequency. The upper limits have been redis-tributed among the flux density bins by using a Survival
4 As an example, the amplitude of the power spectrum of radiosources, in terms of Cℓ values, below, e.g., Sν ≤ 1 Jy at 217GHz,corresponds to ∼ 4.2 × 10⁻⁵µK2, if calculated from the PlanckERCSC differential number counts of Table 1. For comparison,undetected radio sources sum up ∼ 1.1 × 10⁻⁴µK2, if we inte-grate the differential number counts of the de Zotti et al. (2005)cosmological evolution model up to Sν = 1Jy.
6
Planck Collaboration: Statistical properties of ERS
10−2
10−1
100
101
100
101
102
100 GHz
10−2
10−1
100
101
100
101
102
143 GHz
S5/
2 *dN
/dS
[Jy3/
2 sr−
1 ]
10−2
10−1
100
101
100
101
102
217 GHz
S[Jy]Fig. 5. Euclidean normalized differential number counts at the HFI frequencies (100, 143, and 217GHz). The red circleswith Poisson error bars show the counts of sources with counterparts in our reference 30GHz sample. At 143 and 217GHzthe blue diamonds (shifted to the left by half of the bin size, for clarity) show the counts obtained after removing sourceswith 143–217GHz spectral index indicative of dust emission (see Sect. 2.3.2). Again, in each panel, the solid curvesshow the total number counts of extragalactic radio sources predicted by the de Zotti et al. (2005) evolution model. Alsoshown are the SPT (grey squares; Vieira et al. 2010) and ACT (grey stars; Marriage et al. 2010 counts of radio sources.At 100GHz we also show the estimated counts by Sadler et al. (2008) from follow-up observations of a sample of sourcesselected from the 20GHz ATCA survey (grey dashed line).
Table 2. Median and standard deviations of the spectralindex distributions between 30GHz and the selected fre-quency. We adopt the convention Sν ∝ να.
ν[GHz] 44 70 100 143 217
median −0.06 −0.18 −0.28 −0.39 −0.37error 0.01 0.01 0.01 0.01 0.01σ 0.30 0.18 0.17 0.16 0.15
Analysis technique and, more specifically, by adopting theKaplan-Meyer estimator (as implemented in the ASURVcode, (Lavalley et al. 1992)). Since the fraction of upperlimits is always small (it reaches approximately 30% only
in our less sensitive channel at 44GHz), the spectral indexdistributions are reliably reconstructed at each frequency.
Table 2 gives the median spectral indices between30GHz and the other frequencies considered here and thedispersions of the spectral index distributions. A moder-ate steepening of spectral indices at higher frequencies isclearly apparent. Hints in this direction were previouslyfound by Gonzalez-Nuevo et al. (2008) from their analy-sis of the NEWPS sample (Lopez-Caniego et al. 2007) andalso by Sadler et al. (2008). Additional evidence of spectralsteepening is presented in Planck Collaboration (2011k).
Our 30–100GHz spectral index is close to the α ≃ −0.39found by Sadler et al. (2008) between 20 and 95GHz, fora sample with 20GHz flux density S > 150mJy. Moreover,our 30–143GHz median spectral index is in very goodagreement with the one found by Marriage et al. (2010) fortheir bright (Sν > 50 mJy) 148GHz-selected sample with
7
Planck Collaboration: Statistical properties of ERS
−2 −1.5 −1 −0.5 0 0.5 1 1.5 20
10
20
30
40
50
60
70
80
90
100
α [S∝ν α]
30−7070−143143−217
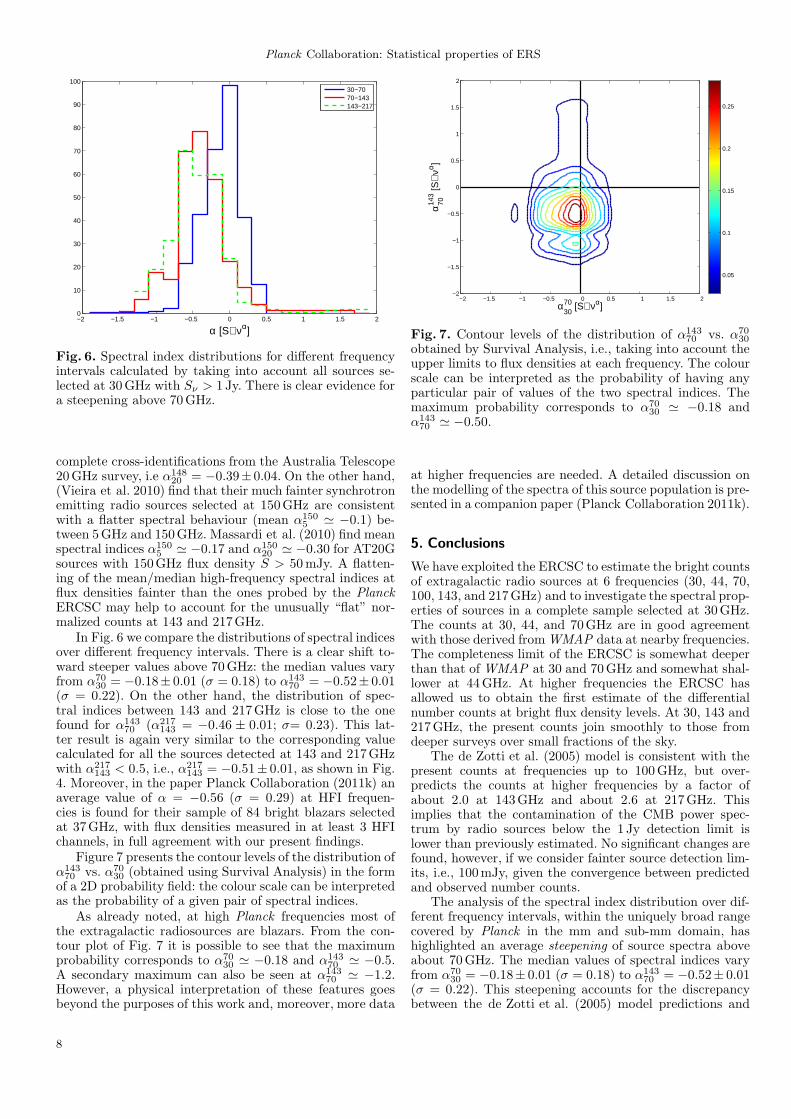
Fig. 6. Spectral index distributions for different frequencyintervals calculated by taking into account all sources se-lected at 30GHz with Sν > 1 Jy. There is clear evidence fora steepening above 70GHz.
complete cross-identifications from the Australia Telescope20GHz survey, i.e α148
20 = −0.39± 0.04. On the other hand,(Vieira et al. 2010) find that their much fainter synchrotronemitting radio sources selected at 150GHz are consistentwith a flatter spectral behaviour (mean α150
5 ≃ −0.1) be-tween 5GHz and 150GHz. Massardi et al. (2010) find meanspectral indices α150
5≃ −0.17 and α150
20≃ −0.30 for AT20G
sources with 150GHz flux density S > 50mJy. A flatten-ing of the mean/median high-frequency spectral indices atflux densities fainter than the ones probed by the PlanckERCSC may help to account for the unusually “flat” nor-malized counts at 143 and 217GHz.
In Fig. 6 we compare the distributions of spectral indicesover different frequency intervals. There is a clear shift to-ward steeper values above 70GHz: the median values varyfrom α70
30 = −0.18± 0.01 (σ = 0.18) to α14370 = −0.52± 0.01
(σ = 0.22). On the other hand, the distribution of spec-tral indices between 143 and 217GHz is close to the onefound for α143
70 (α217143 = −0.46 ± 0.01; σ= 0.23). This lat-
ter result is again very similar to the corresponding valuecalculated for all the sources detected at 143 and 217GHzwith α217
143 < 0.5, i.e., α217143 = −0.51± 0.01, as shown in Fig.
4. Moreover, in the paper Planck Collaboration (2011k) anaverage value of α = −0.56 (σ = 0.29) at HFI frequen-cies is found for their sample of 84 bright blazars selectedat 37GHz, with flux densities measured in at least 3 HFIchannels, in full agreement with our present findings.
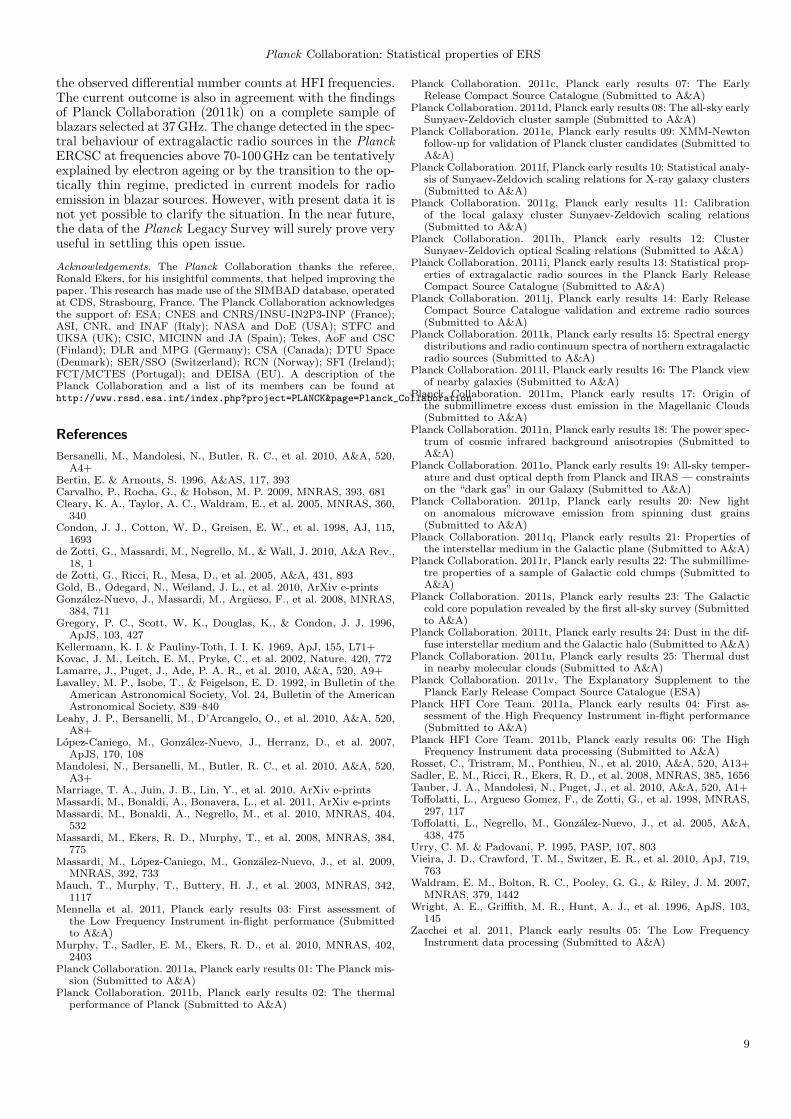
Figure 7 presents the contour levels of the distribution ofα14370 vs. α70
30 (obtained using Survival Analysis) in the formof a 2D probability field: the colour scale can be interpretedas the probability of a given pair of spectral indices.
As already noted, at high Planck frequencies most ofthe extragalactic radiosources are blazars. From the con-tour plot of Fig. 7 it is possible to see that the maximumprobability corresponds to α70
30≃ −0.18 and α143
70≃ −0.5.
A secondary maximum can also be seen at α143
70 ≃ −1.2.However, a physical interpretation of these features goesbeyond the purposes of this work and, moreover, more data
−2 −1.5 −1 −0.5 0 0.5 1 1.5 2 −2
−1.5
−1
−0.5
0
0.5
1
1.5
2
α7030
[S∝ν α]
α143
70 [S
∝να ]
0.05
0.1
0.15
0.2
0.25
Fig. 7. Contour levels of the distribution of α143
70 vs. α70
30
obtained by Survival Analysis, i.e., taking into account theupper limits to flux densities at each frequency. The colourscale can be interpreted as the probability of having anyparticular pair of values of the two spectral indices. Themaximum probability corresponds to α70
30≃ −0.18 and
α143
70 ≃ −0.50.
at higher frequencies are needed. A detailed discussion onthe modelling of the spectra of this source population is pre-sented in a companion paper (Planck Collaboration 2011k).
5. Conclusions
We have exploited the ERCSC to estimate the bright countsof extragalactic radio sources at 6 frequencies (30, 44, 70,100, 143, and 217GHz) and to investigate the spectral prop-erties of sources in a complete sample selected at 30GHz.The counts at 30, 44, and 70GHz are in good agreementwith those derived fromWMAP data at nearby frequencies.The completeness limit of the ERCSC is somewhat deeperthan that of WMAP at 30 and 70GHz and somewhat shal-lower at 44GHz. At higher frequencies the ERCSC hasallowed us to obtain the first estimate of the differentialnumber counts at bright flux density levels. At 30, 143 and217GHz, the present counts join smoothly to those fromdeeper surveys over small fractions of the sky.
The de Zotti et al. (2005) model is consistent with thepresent counts at frequencies up to 100GHz, but over-predicts the counts at higher frequencies by a factor ofabout 2.0 at 143GHz and about 2.6 at 217GHz. Thisimplies that the contamination of the CMB power spec-trum by radio sources below the 1 Jy detection limit islower than previously estimated. No significant changes arefound, however, if we consider fainter source detection lim-its, i.e., 100mJy, given the convergence between predictedand observed number counts.
The analysis of the spectral index distribution over dif-ferent frequency intervals, within the uniquely broad rangecovered by Planck in the mm and sub-mm domain, hashighlighted an average steepening of source spectra aboveabout 70GHz. The median values of spectral indices varyfrom α
70
30 = −0.18± 0.01 (σ = 0.18) to α143
70 = −0.52± 0.01(σ = 0.22). This steepening accounts for the discrepancybetween the de Zotti et al. (2005) model predictions and
8
Planck Collaboration: Statistical properties of ERS
the observed differential number counts at HFI frequencies.The current outcome is also in agreement with the findingsof Planck Collaboration (2011k) on a complete sample ofblazars selected at 37GHz. The change detected in the spec-tral behaviour of extragalactic radio sources in the PlanckERCSC at frequencies above 70-100GHz can be tentativelyexplained by electron ageing or by the transition to the op-tically thin regime, predicted in current models for radioemission in blazar sources. However, with present data it isnot yet possible to clarify the situation. In the near future,the data of the Planck Legacy Survey will surely prove veryuseful in settling this open issue.
Acknowledgements. The Planck Collaboration thanks the referee,Ronald Ekers, for his insightful comments, that helped improving thepaper. This research has made use of the SIMBAD database, operatedat CDS, Strasbourg, France. The Planck Collaboration acknowledgesthe support of: ESA; CNES and CNRS/INSU-IN2P3-INP (France);ASI, CNR, and INAF (Italy); NASA and DoE (USA); STFC andUKSA (UK); CSIC, MICINN and JA (Spain); Tekes, AoF and CSC(Finland); DLR and MPG (Germany); CSA (Canada); DTU Space(Denmark); SER/SSO (Switzerland); RCN (Norway); SFI (Ireland);FCT/MCTES (Portugal); and DEISA (EU). A description of thePlanck Collaboration and a list of its members can be found athttp://www.rssd.esa.int/index.php?project=PLANCK&page=Planck_Collaboration
References
Bersanelli, M., Mandolesi, N., Butler, R. C., et al. 2010, A&A, 520,A4+
Bertin, E. & Arnouts, S. 1996, A&AS, 117, 393Carvalho, P., Rocha, G., & Hobson, M. P. 2009, MNRAS, 393, 681Cleary, K. A., Taylor, A. C., Waldram, E., et al. 2005, MNRAS, 360,
340Condon, J. J., Cotton, W. D., Greisen, E. W., et al. 1998, AJ, 115,
1693de Zotti, G., Massardi, M., Negrello, M., & Wall, J. 2010, A&A Rev.,
18, 1de Zotti, G., Ricci, R., Mesa, D., et al. 2005, A&A, 431, 893Gold, B., Odegard, N., Weiland, J. L., et al. 2010, ArXiv e-printsGonzalez-Nuevo, J., Massardi, M., Argueso, F., et al. 2008, MNRAS,
384, 711Gregory, P. C., Scott, W. K., Douglas, K., & Condon, J. J. 1996,
ApJS, 103, 427Kellermann, K. I. & Pauliny-Toth, I. I. K. 1969, ApJ, 155, L71+Kovac, J. M., Leitch, E. M., Pryke, C., et al. 2002, Nature, 420, 772Lamarre, J., Puget, J., Ade, P. A. R., et al. 2010, A&A, 520, A9+Lavalley, M. P., Isobe, T., & Feigelson, E. D. 1992, in Bulletin of the
American Astronomical Society, Vol. 24, Bulletin of the AmericanAstronomical Society, 839–840
Leahy, J. P., Bersanelli, M., D’Arcangelo, O., et al. 2010, A&A, 520,A8+
Lopez-Caniego, M., Gonzalez-Nuevo, J., Herranz, D., et al. 2007,ApJS, 170, 108
Mandolesi, N., Bersanelli, M., Butler, R. C., et al. 2010, A&A, 520,A3+
Marriage, T. A., Juin, J. B., Lin, Y., et al. 2010, ArXiv e-printsMassardi, M., Bonaldi, A., Bonavera, L., et al. 2011, ArXiv e-printsMassardi, M., Bonaldi, A., Negrello, M., et al. 2010, MNRAS, 404,
532Massardi, M., Ekers, R. D., Murphy, T., et al. 2008, MNRAS, 384,
775Massardi, M., Lopez-Caniego, M., Gonzalez-Nuevo, J., et al. 2009,
MNRAS, 392, 733Mauch, T., Murphy, T., Buttery, H. J., et al. 2003, MNRAS, 342,
1117Mennella et al. 2011, Planck early results 03: First assessment of
the Low Frequency Instrument in-flight performance (Submittedto A&A)
Murphy, T., Sadler, E. M., Ekers, R. D., et al. 2010, MNRAS, 402,2403
Planck Collaboration. 2011a, Planck early results 01: The Planck mis-sion (Submitted to A&A)
Planck Collaboration. 2011b, Planck early results 02: The thermalperformance of Planck (Submitted to A&A)
Planck Collaboration. 2011c, Planck early results 07: The EarlyRelease Compact Source Catalogue (Submitted to A&A)
Planck Collaboration. 2011d, Planck early results 08: The all-sky earlySunyaev-Zeldovich cluster sample (Submitted to A&A)
Planck Collaboration. 2011e, Planck early results 09: XMM-Newtonfollow-up for validation of Planck cluster candidates (Submitted toA&A)
Planck Collaboration. 2011f, Planck early results 10: Statistical analy-sis of Sunyaev-Zeldovich scaling relations for X-ray galaxy clusters(Submitted to A&A)
Planck Collaboration. 2011g, Planck early results 11: Calibrationof the local galaxy cluster Sunyaev-Zeldovich scaling relations(Submitted to A&A)
Planck Collaboration. 2011h, Planck early results 12: ClusterSunyaev-Zeldovich optical Scaling relations (Submitted to A&A)
Planck Collaboration. 2011i, Planck early results 13: Statistical prop-erties of extragalactic radio sources in the Planck Early ReleaseCompact Source Catalogue (Submitted to A&A)
Planck Collaboration. 2011j, Planck early results 14: Early ReleaseCompact Source Catalogue validation and extreme radio sources(Submitted to A&A)
Planck Collaboration. 2011k, Planck early results 15: Spectral energydistributions and radio continuum spectra of northern extragalacticradio sources (Submitted to A&A)
Planck Collaboration. 2011l, Planck early results 16: The Planck viewof nearby galaxies (Submitted to A&A)
Planck Collaboration. 2011m, Planck early results 17: Origin ofthe submillimetre excess dust emission in the Magellanic Clouds(Submitted to A&A)
Planck Collaboration. 2011n, Planck early results 18: The power spec-trum of cosmic infrared background anisotropies (Submitted toA&A)
Planck Collaboration. 2011o, Planck early results 19: All-sky temper-ature and dust optical depth from Planck and IRAS — constraintson the “dark gas” in our Galaxy (Submitted to A&A)
Planck Collaboration. 2011p, Planck early results 20: New lighton anomalous microwave emission from spinning dust grains(Submitted to A&A)
Planck Collaboration. 2011q, Planck early results 21: Properties ofthe interstellar medium in the Galactic plane (Submitted to A&A)
Planck Collaboration. 2011r, Planck early results 22: The submillime-tre properties of a sample of Galactic cold clumps (Submitted toA&A)
Planck Collaboration. 2011s, Planck early results 23: The Galacticcold core population revealed by the first all-sky survey (Submittedto A&A)
Planck Collaboration. 2011t, Planck early results 24: Dust in the dif-fuse interstellar medium and the Galactic halo (Submitted to A&A)
Planck Collaboration. 2011u, Planck early results 25: Thermal dustin nearby molecular clouds (Submitted to A&A)
Planck Collaboration. 2011v, The Explanatory Supplement to thePlanck Early Release Compact Source Catalogue (ESA)
Planck HFI Core Team. 2011a, Planck early results 04: First as-sessment of the High Frequency Instrument in-flight performance(Submitted to A&A)
Planck HFI Core Team. 2011b, Planck early results 06: The HighFrequency Instrument data processing (Submitted to A&A)
Rosset, C., Tristram, M., Ponthieu, N., et al. 2010, A&A, 520, A13+Sadler, E. M., Ricci, R., Ekers, R. D., et al. 2008, MNRAS, 385, 1656Tauber, J. A., Mandolesi, N., Puget, J., et al. 2010, A&A, 520, A1+Toffolatti, L., Argueso Gomez, F., de Zotti, G., et al. 1998, MNRAS,
297, 117Toffolatti, L., Negrello, M., Gonzalez-Nuevo, J., et al. 2005, A&A,
438, 475Urry, C. M. & Padovani, P. 1995, PASP, 107, 803Vieira, J. D., Crawford, T. M., Switzer, E. R., et al. 2010, ApJ, 719,
763Waldram, E. M., Bolton, R. C., Pooley, G. G., & Riley, J. M. 2007,
MNRAS, 379, 1442Wright, A. E., Griffith, M. R., Hunt, A. J., et al. 1996, ApJS, 103,
145Zacchei et al. 2011, Planck early results 05: The Low Frequency
Instrument data processing (Submitted to A&A)
9
Planck Collaboration: Statistical properties of ERS
1 Aalto University Metsahovi Radio Observatory,Metsahovintie 114, FIN-02540 Kylmala, Finland
2 Agenzia Spaziale Italiana Science Data Center, c/o ESRIN,via Galileo Galilei, Frascati, Italy
3 Astroparticule et Cosmologie, CNRS (UMR7164), UniversiteDenis Diderot Paris 7, Batiment Condorcet, 10 rue A.Domon et Leonie Duquet, Paris, France
4 Astrophysics Group, Cavendish Laboratory, University ofCambridge, J J Thomson Avenue, Cambridge CB3 0HE,U.K.
5 Atacama Large Millimeter/submillimeter Array, ALMASantiago Central Offices, Alonso de Cordova 3107, Vitacura,Casilla 763 0355, Santiago, Chile
6 Australia Telescope National Facility, CSIRO, P.O. Box 76,Epping, NSW 1710, Australia
7 CITA, University of Toronto, 60 St. George St., Toronto,ON M5S 3H8, Canada
8 CNRS, IRAP, 9 Av. colonel Roche, BP 44346, F-31028Toulouse cedex 4, France
9 California Institute of Technology, Pasadena, California,U.S.A.
10 Centre of Mathematics for Applications, University of Oslo,Blindern, Oslo, Norway
11 DAMTP, University of Cambridge, Centre for MathematicalSciences, Wilberforce Road, Cambridge CB3 0WA, U.K.
12 DSM/Irfu/SPP, CEA-Saclay, F-91191 Gif-sur-Yvette Cedex,France
13 DTU Space, National Space Institute, Juliane Mariesvej 30,Copenhagen, Denmark
14 Departamento de Fısica, Universidad de Oviedo, Avda.Calvo Sotelo s/n, Oviedo, Spain
15 Departamento de Matematicas, Universidad de Oviedo,Avda. Calvo Sotelo s/n, Oviedo, Spain
16 Department of Astronomy and Astrophysics, University ofToronto, 50 Saint George Street, Toronto, Ontario, Canada
17 Department of Physics & Astronomy, The Open University,Milton Keynes, MK7 6AA, U.K.
18 Department of Physics & Astronomy, University of BritishColumbia, 6224 Agricultural Road, Vancouver, British
Columbia, Canada
19 Department of Physics and Astronomy, University ofSouthern California, Los Angeles, California, U.S.A.
20 Department of Physics, Gustaf Hallstromin katu 2a,University of Helsinki, Helsinki, Finland
21 Department of Physics, Purdue University, 525 NorthwesternAvenue, West Lafayette, Indiana, U.S.A.
22 Department of Physics, University of California, Berkeley,California, U.S.A.
23 Department of Physics, University of California, One ShieldsAvenue, Davis, California, U.S.A.
24 Department of Physics, University of California, SantaBarbara, California, U.S.A.
25 Department of Physics, University of Illinois at Urbana-Champaign, 1110 West Green Street, Urbana, Illinois, U.S.A.
26 Dipartimento di Fisica G. Galilei, Universita degli Studi diPadova, via Marzolo 8, 35131 Padova, Italy
27 Dipartimento di Fisica, Universita La Sapienza, P. le A.Moro 2, Roma, Italy
28 Dipartimento di Fisica, Universita degli Studi di Milano,Via Celoria, 16, Milano, Italy
29 Dipartimento di Fisica, Universita degli Studi di Trieste, viaA. Valerio 2, Trieste, Italy
30 Dipartimento di Fisica, Universita di Ferrara, Via Saragat1, 44122 Ferrara, Italy
31 Dipartimento di Fisica, Universita di Roma Tor Vergata,Via della Ricerca Scientifica, 1, Roma, Italy
32 Discovery Center, Niels Bohr Institute, Blegdamsvej 17,Copenhagen, Denmark
33 Dpto. Astrofısica, Universidad de La Laguna (ULL),E-38206 La Laguna, Tenerife, Spain
34 European Southern Observatory, ESO Vitacura, Alonso deCordova 3107, Vitacura, Casilla 19001, Santiago, Chile
35 European Space Agency, ESAC, Planck Science Office,Camino bajo del Castillo, s/n, Urbanizacion Villafranca del
10
Planck Collaboration: Statistical properties of ERS
Castillo, Villanueva de la Canada, Madrid, Spain
36 European Space Agency, ESTEC, Keplerlaan 1, 2201 AZNoordwijk, The Netherlands
37 Haverford College Astronomy Department, 370 LancasterAvenue, Haverford, Pennsylvania, U.S.A.
38 Helsinki Institute of Physics, Gustaf Hallstromin katu 2,University of Helsinki, Helsinki, Finland
39 IFSI/INAF, via del Fosso Cavaliere 100, 00133, Roma, Italy
40 INAF - Osservatorio Astrofisico di Catania, Via S. Sofia 78,Catania, Italy
41 INAF - Osservatorio Astronomico di Padova, Vicolodell’Osservatorio 5, Padova, Italy
42 INAF - Osservatorio Astronomico di Roma, via di Frascati33, Monte Porzio Catone, Italy
43 INAF - Osservatorio Astronomico di Trieste, Via G.B.Tiepolo 11, Trieste, Italy
44 INAF/IASF Bologna, Via Gobetti 101, Bologna, Italy
45 INAF/IASF Milano, Via E. Bassini 15, Milano, Italy
46 INRIA, Laboratoire de Recherche en Informatique,Universite Paris-Sud 11, Batiment 490, 91405 Orsay Cedex,France
47 IPAG: Institut de Planetologie et d’Astrophysique deGrenoble, Universite Joseph Fourier, Grenoble 1 / CNRS-INSU, UMR 5274, Grenoble, F-38041, France
48 ISDC Data Centre for Astrophysics, University of Geneva,ch. d’Ecogia 16, Versoix, Switzerland
49 Imperial College London, Astrophysics group, BlackettLaboratory, Prince Consort Road, London, SW7 2AZ, U.K.
50 Infrared Processing and Analysis Center, California Instituteof Technology, Pasadena, CA 91125, U.S.A.
51 Institut d’Astrophysique Spatiale, CNRS (UMR8617)Universite Paris-Sud 11, Batiment 121, Orsay, France
52 Institut d’Astrophysique de Paris, CNRS UMR7095,Universite Pierre & Marie Curie, 98 bis boulevard Arago,
Paris, France
53 Institute of Astronomy and Astrophysics, Academia Sinica,Taipei, Taiwan
54 Institute of Astronomy, University of Cambridge, MadingleyRoad, Cambridge CB3 0HA, U.K.
55 Institute of Theoretical Astrophysics, University of Oslo,Blindern, Oslo, Norway
56 Instituto de Astrofısica de Canarias, C/Vıa Lactea s/n, LaLaguna, Tenerife, Spain
57 Instituto de Fısica de Cantabria (CSIC-Universidad deCantabria), Avda. de los Castros s/n, Santander, Spain
58 Istituto di Fisica del Plasma, CNR-ENEA-EURATOMAssociation, Via R. Cozzi 53, Milano, Italy
59 Jet Propulsion Laboratory, California Institute ofTechnology, 4800 Oak Grove Drive, Pasadena, California,U.S.A.
60 Jodrell Bank Centre for Astrophysics, Alan Turing Building,School of Physics and Astronomy, The University ofManchester, Oxford Road, Manchester, M13 9PL, U.K.
61 Kavli Institute for Cosmology Cambridge, Madingley Road,Cambridge, CB3 0HA, U.K.
62 LERMA, CNRS, Observatoire de Paris, 61 Avenue del’Observatoire, Paris, France
63 Laboratoire AIM, IRFU/Service d’Astrophysique -CEA/DSM - CNRS - Universite Paris Diderot, Bat.709, CEA-Saclay, F-91191 Gif-sur-Yvette Cedex, France
64 Laboratoire Traitement et Communication de l’Information,CNRS (UMR 5141) and Telecom ParisTech, 46 rue BarraultF-75634 Paris Cedex 13, France
65 Laboratoire de Physique Subatomique et de Cosmologie,CNRS, Universite Joseph Fourier Grenoble I, 53 rue des
11
Planck Collaboration: Statistical properties of ERS
Martyrs, Grenoble, France
66 Laboratoire de l’Accelerateur Lineaire, Universite Paris-Sud11, CNRS/IN2P3, Orsay, France
67 Lawrence Berkeley National Laboratory, Berkeley,California, U.S.A.
68 Max-Planck-Institut fur Astrophysik, Karl-Schwarzschild-Str. 1, 85741 Garching, Germany
69 MilliLab, VTT Technical Research Centre of Finland,Tietotie 3, Espoo, Finland
70 National University of Ireland, Department of ExperimentalPhysics, Maynooth, Co. Kildare, Ireland
71 Niels Bohr Institute, Blegdamsvej 17, Copenhagen, Denmark
72 Observational Cosmology, Mail Stop 367-17, CaliforniaInstitute of Technology, Pasadena, CA, 91125, U.S.A.
73 SISSA, Astrophysics Sector, via Bonomea 265, 34136,Trieste, Italy
74 SUPA, Institute for Astronomy, University of Edinburgh,Royal Observatory, Blackford Hill, Edinburgh EH9 3HJ,U.K.
75 School of Physics and Astronomy, Cardiff University, QueensBuildings, The Parade, Cardiff, CF24 3AA, U.K.
76 Space Sciences Laboratory, University of California,Berkeley, California, U.S.A.
77 Spitzer Science Center, 1200 E. California Blvd., Pasadena,California, U.S.A.
78 Stanford University, Dept of Physics, Varian Physics Bldg,382 Via Pueblo Mall, Stanford, California, U.S.A.
79 Universite de Toulouse, UPS-OMP, IRAP, F-31028 Toulousecedex 4, France
80 University of Granada, Departamento de Fısica Teorica ydel Cosmos, Facultad de Ciencias, Granada, Spain
81 University of Miami, Knight Physics Building, 1320 CampoSano Dr., Coral Gables, Florida, U.S.A.
82 Warsaw University Observatory, Aleje Ujazdowskie 4,00-478 Warszawa, Poland
12