CIV emission-line properties and systematic trends in quasar ...
19
MNRAS 461, 647–665 (2016) doi:10.1093/mnras/stw1360 Advance Access publication 2016 June 9 C IV emission-line properties and systematic trends in quasar black hole mass estimates Liam Coatman, 1‹ Paul C. Hewett, 1 Manda Banerji 1 and Gordon T. Richards 2 1 Institute of Astronomy, Madingley Road, Cambridge CB3 0HA, UK 2 Department of Physics, Drexel University, 3141 Chestnut Street, Philadelphia PA 19104, USA Accepted 2016 June 3. Received 2016 May 29; in original form 2016 March 1 ABSTRACT Black hole masses are crucial to understanding the physics of the connection between quasars and their host galaxies and measuring cosmic black hole-growth. At high redshift, z 2.1, black hole masses are normally derived using the velocity width of the C IV λλ1548, 1550 broad emission line, based on the assumption that the observed velocity widths arise from virial- induced motions. In many quasars, the C IV emission line exhibits significant blue asymmetries (‘blueshifts’) with the line centroid displaced by up to thousands of km s −1 to the blue. These blueshifts almost certainly signal the presence of strong outflows, most likely originating in a disc wind. We have obtained near-infrared spectra, including the Hαλ6565 emission line, for 19 luminous (L Bol = 46.5–47.5 erg s −1 ) Sloan Digital Sky Survey quasars, at redshifts 2 <z< 2.7, with C IV emission lines spanning the full range of blueshifts present in the population. A strong correlation between C IV velocity width and blueshift is found and, at large blueshifts, >2000 km s −1 , the velocity widths appear to be dominated by non-virial motions. Black hole masses, based on the full width at half-maximum of the C IV emission line, can be overestimated by a factor of 5 at large blueshifts. A larger sample of quasar spectra with both C IV and H β , or Hα, emission lines will allow quantitative corrections to C IV-based black hole masses as a function of blueshift to be derived. We find that quasars with large C IV blueshifts possess high Eddington luminosity ratios and that the fraction of high-blueshift quasars in a flux-limited sample is enhanced by a factor of approximately 4 relative to a sample limited by black hole mass. Key words: galaxies: evolution. 1 INTRODUCTION Supermassive black holes (BHs) are found at the centres of most nearby massive galaxies and the BH mass and mass of the host galaxy spheroid are strongly correlated (Ferrarese & Merritt 2000; Gebhardt et al. 2000; Kormendy & Ho 2013). Although any under- lying causal mechanism(s) responsible for the correlation is yet to be conclusively identified, there is considerable observational and theoretical support for models that involve BH-fuelling, outflows and a ‘feedback’ relationship (e.g. King & Pounds 2015). The num- ber density of quasars, which evolves strongly with redshift, peaks at redshifts 2 z 3 (e.g. Brandt & Hasinger 2005; Richards et al. 2006a) and the most massive (M BH 10 9 M ) present-day BHs experienced much of their growth during this epoch. The star forma- tion rate, which closely follows the cosmological evolution of the quasar luminosity function, also peaks during this epoch (e.g. Boyle & Terlevich 1998). Quantifying the growth rate of massive BHs at E-mail: [email protected] 2 z 3 would therefore help significantly in understanding the role quasars play in galaxy evolution. Reliable estimates of BH masses are a pre-requisite for investi- gating the relationship between BHs and their host galaxies. If the line-emitting clouds in the broad-line region (BLR) are assumed to be virialized and moving in a potential dominated by the central BH, then the BH mass is simply a product of the BLR size and the square of the virial velocity. The reverberation-mapping technique uses the time lag between variations in the continuum emission and corre- lated variations in the broad-line emission to measure the typical size of the BLR (Peterson 1993, 2014). The full width at half-maximum (FWHM) or dispersion (σ ; derived from the second moment) veloc- ity of the prominent broad emission line of H β (4862.7 Å) 1 is used as an indicator of the virial velocity, with extensions to other low- ionization emission lines such as Hα (6564.6 Å) and Mg IIλλ2796.4, 2803.5 (e.g. McLure & Jarvis 2002; Vestergaard 2002; Wu et al. 2004; Kollmeier et al. 2006; Onken & Kollmeier 2008; Wang et al. 1 Vacuum wavelengths are employed throughout the paper. C 2016 The Authors Published by Oxford University Press on behalf of the Royal Astronomical Society
-
Upload
khangminh22 -
Category
Documents
-
view
0 -
download
0
Transcript of CIV emission-line properties and systematic trends in quasar ...

MNRAS 461, 647–665 (2016) doi:10.1093/mnras/stw1360Advance Access publication 2016 June 9
C IV emission-line properties and systematic trends in quasar black holemass estimates
Liam Coatman,1‹ Paul C. Hewett,1 Manda Banerji1 and Gordon T. Richards2
1Institute of Astronomy, Madingley Road, Cambridge CB3 0HA, UK2Department of Physics, Drexel University, 3141 Chestnut Street, Philadelphia PA 19104, USA
Accepted 2016 June 3. Received 2016 May 29; in original form 2016 March 1
ABSTRACTBlack hole masses are crucial to understanding the physics of the connection between quasarsand their host galaxies and measuring cosmic black hole-growth. At high redshift, z � 2.1,black hole masses are normally derived using the velocity width of the C IV λλ1548, 1550 broademission line, based on the assumption that the observed velocity widths arise from virial-induced motions. In many quasars, the C IV emission line exhibits significant blue asymmetries(‘blueshifts’) with the line centroid displaced by up to thousands of km s−1 to the blue. Theseblueshifts almost certainly signal the presence of strong outflows, most likely originating ina disc wind. We have obtained near-infrared spectra, including the Hα λ6565 emission line,for 19 luminous (LBol = 46.5–47.5 erg s−1) Sloan Digital Sky Survey quasars, at redshifts2 < z < 2.7, with C IV emission lines spanning the full range of blueshifts present in thepopulation. A strong correlation between C IV velocity width and blueshift is found and, atlarge blueshifts, >2000 km s−1, the velocity widths appear to be dominated by non-virialmotions. Black hole masses, based on the full width at half-maximum of the C IV emissionline, can be overestimated by a factor of 5 at large blueshifts. A larger sample of quasar spectrawith both C IV and H β, or Hα, emission lines will allow quantitative corrections to C IV-basedblack hole masses as a function of blueshift to be derived. We find that quasars with largeC IV blueshifts possess high Eddington luminosity ratios and that the fraction of high-blueshiftquasars in a flux-limited sample is enhanced by a factor of approximately 4 relative to a samplelimited by black hole mass.
Key words: galaxies: evolution.
1 IN T RO D U C T I O N
Supermassive black holes (BHs) are found at the centres of mostnearby massive galaxies and the BH mass and mass of the hostgalaxy spheroid are strongly correlated (Ferrarese & Merritt 2000;Gebhardt et al. 2000; Kormendy & Ho 2013). Although any under-lying causal mechanism(s) responsible for the correlation is yet tobe conclusively identified, there is considerable observational andtheoretical support for models that involve BH-fuelling, outflowsand a ‘feedback’ relationship (e.g. King & Pounds 2015). The num-ber density of quasars, which evolves strongly with redshift, peaksat redshifts 2 � z � 3 (e.g. Brandt & Hasinger 2005; Richards et al.2006a) and the most massive (MBH � 109 M�) present-day BHsexperienced much of their growth during this epoch. The star forma-tion rate, which closely follows the cosmological evolution of thequasar luminosity function, also peaks during this epoch (e.g. Boyle& Terlevich 1998). Quantifying the growth rate of massive BHs at
� E-mail: [email protected]
2 � z � 3 would therefore help significantly in understanding therole quasars play in galaxy evolution.
Reliable estimates of BH masses are a pre-requisite for investi-gating the relationship between BHs and their host galaxies. If theline-emitting clouds in the broad-line region (BLR) are assumed tobe virialized and moving in a potential dominated by the central BH,then the BH mass is simply a product of the BLR size and the squareof the virial velocity. The reverberation-mapping technique uses thetime lag between variations in the continuum emission and corre-lated variations in the broad-line emission to measure the typical sizeof the BLR (Peterson 1993, 2014). The full width at half-maximum(FWHM) or dispersion (σ ; derived from the second moment) veloc-ity of the prominent broad emission line of H β (4862.7 Å)1 is usedas an indicator of the virial velocity, with extensions to other low-ionization emission lines such as Hα (6564.6 Å) and Mg IIλλ2796.4,2803.5 (e.g. McLure & Jarvis 2002; Vestergaard 2002; Wu et al.2004; Kollmeier et al. 2006; Onken & Kollmeier 2008; Wang et al.
1 Vacuum wavelengths are employed throughout the paper.
C© 2016 The AuthorsPublished by Oxford University Press on behalf of the Royal Astronomical Society

648 L. Coatman et al.
2009; Rafiee & Hall 2011). Extensive reverberation-mapping cam-paigns have provided accurate BH masses for ∼50 active galacticnuclei (AGN) at relatively low redshifts and of modest luminosity(e.g. Kaspi et al. 2000, 2007; Peterson et al. 2004; Bentz et al. 2009;Denney et al. 2010).
Reverberation-mapping campaigns have also revealed a tight re-lationship between the radius of the BLR and the quasar optical [orultraviolet (UV)] luminosity (the R–L relation; e.g. Kaspi et al. 2000,2007). This relation provides a much less expensive method of mea-suring the BLR radius, and large-scale studies of AGN and quasardemographics have thus become possible through the calibration ofsingle-epoch virial-mass estimators using the reverberation-derivedBH masses (e.g. Greene & Ho 2005; Vestergaard & Peterson 2006;Vestergaard & Osmer 2009; Shen et al. 2011; Shen & Liu 2012;Trakhtenbrot & Netzer 2012). The uncertainties in reverberation-mapped BH masses are estimated to be ∼0.4 dex (e.g. Peterson2010), and the uncertainties in virial masses are similar (e.g. Vester-gaard & Peterson 2006). Since the structure and geometry of theBLR is unknown, a virial coefficient f is introduced to transformthe observed line-of-sight velocity inferred from the linewidth intoa virial velocity. This simplification accounts for a significant partof the uncertainty in virial BH masses (in addition to, for example,describing the BLR with a single radius R and scatter in the R–Lrelation; Shen 2013). Furthermore, if the BLR is anisotropic (forexample, in a flattened disc; e.g. Jarvis & McLure 2006) then thelinewidth will be orientation-dependent (e.g. Runnoe et al. 2013a;Shen & Ho 2014; Brotherton et al. 2015).
At redshifts of z � 2.0, the low-ionization hydrogen and Mg II
emission lines are no longer present in the optical spectra of quasarsand it is necessary to employ an emission line in the rest-frame UV.The strong C IVλλ1548.2, 1550.8 emission doublet is visible in theoptical spectra of quasars to redshifts of z ∼ 5 and C IV-derivedBH masses have become the standard (e.g. Vestergaard & Peterson2006; Park et al. 2013) for both individual quasars and in studies ofquasar population demographics.
The luminosities of quasars at redshifts z � 2 are much greaterthan the majority of AGN at lower redshifts for which reverberation-mapping results are available. Therefore, the reliability of the exist-ing calibration involving C IV FWHM velocity measurements andUV luminosity is not established definitively when extrapolatingto high redshifts and luminosities. While some authors have foundgood agreement between BH mass estimates based on C IV and H β
(e.g. Vestergaard & Peterson 2006; Assef et al. 2011; Tilton & Shull2013), others have questioned the consistency (e.g. Baskin & Laor2005; Shen & Liu 2012; Trakhtenbrot & Netzer 2012).
Denney (2012) presented evidence that the interpretation of theFWHM velocity of the C IV emission being due primarily to virialmotions within the quasar BLR requires care. Specifically, both alow-velocity core component and a blue excess to the C IV emission,both of which do not reverberate, can be present and Denney (2012)proposes that a contribution from an accretion disc wind or from amore distant narrow emission-line region is important.
Certainly, in contrast to the hydrogen Balmer lines and Mg II,the C IV emission line in quasar spectra exhibits a broad range ofline shapes, including significant asymmetry, with shifts of the line-centroid to the blue (‘blueshifts’) of up to several thousand km s−1
(Richards et al. 2002; Baskin & Laor 2005; Sulentic et al. 2006).Shen & Liu (2012) found, using a sample of 60 luminous quasars,that the scatter between the FWHM of C IV and H β was correlatedwith the blueshift of C IV relative to H β. Shen et al. (2008) founda similar result by comparing C IV with Mg II for quasars fromSloan Digital Sky Survey (SDSS) DR5. The blueshifting of C IV is
usually interpreted as evidence for strong outflows (e.g. Sulenticet al. 2007; Richards et al. 2011) which, most likely, result from thepresence of a radiation line-driven accretion-disc wind (e.g. Konigl& Kartje 1994; Murray et al. 1995; Proga, Stone & Kallman 2000;Everett 2005; Gallagher et al. 2015). In this picture, the non-virialwind component makes a significant contribution to the observedC IV-emission FWHM in quasars with large C IV blueshifts (‘wind-dominated quasars’) and hence increases the inferred BH masses.A primary goal of this paper is to present the full range of C IV
emission-line blueshifts present among high-luminosity quasars atredshifts z ∼ 2.5 and investigate potential systematic trends in thederived C IV-based BH masses as a function of blueshift.
Changes in the C IV blueshift and equivalent width (EW) are cor-related with changes in the velocity widths and strengths of otheroptical and UV emission lines. In the spectra of lower redshiftAGN, the FWHM of the broad H β emission line and the relativestrengths of optical Fe II and H β have been identified as the fea-tures responsible for the largest variance in the population. Theseparameters form part of ‘Eigenvector 1’ (EV1), the first eigenvectorin a principal component analysis which originated from the workof Boroson & Green (1992). The underlying driver behind EV1 isthought to be the Eddington ratio (e.g. Sulentic et al. 2000b; Shen& Ho 2014). Sulentic, Marziani & Dultzin-Hacyan (2000a) pro-posed a two-population model to classify AGN by their EV1 prop-erties. In this scheme, AGN with FWHM(H β) < 4000 km s−1 andFWHM(H β) > 4000 km s−1 are classified as population A and Bobjects, respectively, although there is a continuous distribution ofparameter values across this divide. Sulentic et al. (2007) added ameasure of the C IV asymmetry to EV1, and found a strong associ-ation between blue-asymmetry and their population A quasars.
Denney (2012) found the level of contamination in single-epochspectra from non-reverberating gas to be correlated with the shape(FWHM/σ ) of the C IV profile. Runnoe et al. (2013b) found thescatter between the C IV and H β linewidths to be correlated with thecontinuum-subtracted peak flux ratio of the UV emission-line blendof Si IV+O IV (at 1400 Å) to that of C IV. Both authors used thesecorrelations to propose empirical corrections to the C IV linewidthwhich can improve the consistency between C IV and H β-basedvirial BH mass estimates. In fact, the shape, peak flux relative to the1400 Å blend, and blueshift of C IV , all correlate with one anotherand with other parameters in EV1. Therefore, EV1 provides a usefulcontext for understanding systematic trends in C IV velocity widths,and hence virial BH masses.
Currently, the number of reverberation-mapped quasars is bothsmall (∼50 quasars; Park et al. 2013) and, as highlighted byRichards et al. (2011), includes a restricted range of the C IV
emission-line shapes seen in the quasar population. In particular,the reverberation-mapped objects generally possess high C IV EWsand low C IV blueshifts. Nevertheless, the derived scaling relationsbased on the reverberation-mapped sample are regularly applied tothe quasar population with low C IV EWs and/or large C IV blueshifts,where any non-virial outflow-related contribution to the dynamicsis significant. Much more complete coverage of the C IV-emissionproperties within the population of luminous quasars will comefrom the new SDSS-IV reverberation-mapping project (Shen et al.2015) but, for now, additional direct comparison of C IV emissionand low-ionization emission-line properties in the same quasarsoffers a way forward.
Near-infrared spectra, including the Hα emission line, for a sam-ple of 19 quasars, at redshifts 2.0 < z < 2.7, have been obtained tocomplement existing SDSS optical spectra covering the C IV emis-sion line. The 19 quasars were chosen to include a broad range of
MNRAS 461, 647–665 (2016)

C IV emission-line properties 649
C IV line blueshifts. Our aim is to directly test the reliability of C IV-based BH-mass estimates at high redshift for objects with a diverserange of C IV-line shapes. In particular, we will investigate poten-tial systematic effects on the C IV-emission-based BH masses forquasars with large, �1200 km s−1, C IV blueshifts, using the prop-erties of the Hα emission line to provide BH-mass estimates for theobjects unbiased by non-virial contributions to the emission-lineprofile. Examining higher redshifts, our work complements otherstudies which attempt to improve the reliability of BH-mass esti-mates which use the C IV line (e.g. Denney 2012; Runnoe et al.2013b). However, the range of C IV blueshifts in our sample is sig-nificantly more extended, which will allow us to study systematicbiases in C IV-based virial BH masses more directly, i.e. as a func-tion of the C IV blueshift. Established relations to derive BH massesfrom emission-line properties are employed but an advantage of ourapproach is that C IV and Hα can be directly compared as a functionof C IV emission-line shape. In Section 2, we describe how quasarswere selected for rest-frame optical spectroscopy, before reviewingthe C IV emission-line properties of high-luminosity quasars in theSDSS surveys in Section 3. The new near-infrared spectroscopicobservations are outlined in Section 4. With spectroscopic coverageof the C IV and Hα emission lines available, the procedures usedto quantify the line parameters are described in Section 5. The re-sults of the spectral analysis in the context of BH masses and C IV
blueshift are presented in Section 6, with a discussion of the sig-nificance of the systematic trends identified included in Section 7.The paper concludes with a summary of the main conclusions inSection 8. Throughout this paper, we adopt a �cold dark mattercosmology with h0 = 0.71, �M = 0.27, and �� = 0.73. All wave-lengths and equivalent width measurements are given in the quasarrest frame, and all emission-line wavelengths are given as measuredin vacuum.
2 SA M P L E SE L E C T I O N
The parent sample for our investigation is the spectroscopic quasarcatalogue of the SDSS (York et al. 2000) Seventh Data Release(DR7; Schneider et al. 2010). The SDSS DR7 catalogue containsmoderate resolution ∼3800–9180 Å spectra for 105 783 quasars.Shen et al. (2011) have compiled a catalogue of properties for theSDSS DR7 quasars including, at z > 1.5, measurements of thebroad C IV λλ1548.2, 1550.8 emission line. Our aim is to explorethe relationship between the Hα and C IV emission-line propertiesover the full dynamic range in C IV-emission shapes, with particularemphasis on quasars possessing large C IV blueshifts (see Section 3).The sample was restricted to objects with redshifts 2.14 < z < 2.51(7258 quasars), to ensure that the H β and Hα emission lines fallwithin the H and K bands, respectively, allowing us to observe bothsimultaneously with the appropriate grism configuration. Given thelimited number of quasars for which near-infrared spectra could beobtained, the quasar sample was further restricted to objects that areradio-quiet (5980 quasars), show no evidence of broad absorptionlines (BALs) in their spectra (5299 quasars), and are free fromsignificant dust extinction. We removed radio-loud objects from oursample using the same radio-loud classification as Shen et al. (2011),and BAL quasars using the classifications of both Shen et al. (2011)and Allen et al. (2011). The removal of quasars with significant dustextinction was achieved by identifying quasars with i − K coloursredder than a parametric spectral energy distributions (SED) model+ Small Magellanic Cloud-like extinction curve with E(B − V) =0.05 (see Maddox et al. 2012). The K-magnitude was taken fromthe UKIRT Infrared Deep Sky Survey (UKIDSS; Lawrence et al.
2007) Large Area Survey (ULAS). The requirement to be in theULAS footprint and have reliable K-band photometry reduced oursample of possible targets to 1683, and the E(B − V) cut left 1204in our sample. Finally, a flux-limit of K < 18.5 (AB) was appliedto ensure that spectra of sufficient signal-to-noise ratio (S/N) couldbe obtained (412 quasars).
We were able to obtain new infrared spectra for 19 quasars fromthis sample of 412 possible targets (Section 4). The quasars includedin this sub-sample were selected to have C IV-emission shapes whichspan the full range observed in the population. Reliably quantifyingthe distribution of C IV-emission shapes has been made possiblethanks to redshift-determination algorithms (Hewett & Wild 2010,Allen & Hewett, in preparation) which are independent of the C IV-emission shape. Calculation of the C IV emission-line parameters isdescribed in detail in the next section.
3 C I V B L U E S H I F T S IN T H E QUA S A RP O P U L AT I O N
Recognition that the C IV emission line in quasars can exhibit signif-icant asymmetric structure, with an excess of flux to the blue of thepredicted rest-frame transition wavelength, extends back to Gaskell(1982). Significant progress in understanding the relationship be-tween changes in C IV-emission shape and quasar properties hascome about through studies in which near-infrared spectra of thehydrogen Balmer lines have been obtained. Such studies typicallyinvolve samples of modest size and the location of the Balmer linesprovides a reliable estimate of the quasar systemic redshifts; recentexamples include Shen & Liu (2012) and Marziani et al. (2016).In Section 5, we adopt the same approach to estimate systemicredshifts for the quasar sample presented here with near-infraredspectra. However, improvements in the estimation of systemic red-shifts from UV quasar spectra means that it is now possible toquantify the distribution of C IV blueshifts in the observed quasarpopulation as a whole.
3.1 Quasar systemic redshifts
Historically, the parametrization of the C IV emission-line propertiesfor quasars in large surveys has not proved straightforward becausethe C IV emission line has itself been used in the determination ofthe quasar redshifts. The SDSS provided the first catalogue of tensof thousands of redshift z >1.6 quasars with spectra of adequatevelocity resolution and S/N that effective statistical studies of therest-frame UV emission-line properties, including line-shape, haveproved possible.
The comprehensive compilation of quasar properties for theSDSS DR7 quasars by Shen et al. (2011) provides a natural startingpoint for population studies. In Fig. 1(a), we plot the C IV blueshiftversus C IV-emission EW using the SDSS pipeline redshifts and theblueshifts calculated by Shen et al. (2011). The grey points show allSDSS DR7 quasars for which measurements exist and the orangecircles show the 19 quasars with near-infrared spectra presented inthis paper. A strong trend in the blueshift values as a function ofline EW is not evident in Fig. 1; structure in the parameter space isbeing masked because the C IV emission line is itself being used inthe determination of the quasar redshifts.
The redshift-determination scheme of Hewett & Wild (2010)provided much improved redshifts, not least because the redshiftestimates for the majority of quasars were derived using emission-lines other than the C IV-line itself. Fig. 1(b) shows SDSS DR7quasars in the same C IV parameter space as Fig. 1(a), but now using
MNRAS 461, 647–665 (2016)

650 L. Coatman et al.
Figure 1. Rest-frame EW versus blueshift of the broad C IV emission line for32 157 SDSS DR7 quasars at 1.6 < z < 3.0 (grey) and our sample (orange).Panel (a) uses C IV line parameters from Shen et al. (2011) and SDSS pipelinesystemic redshifts. Panels (b) and (c) use systemic redshifts from Hewett& Wild (2010) and Allen & Hewett (in preparation), respectively, and C IV
line measurements described in Section 3.2. In regions of high point-density,contours show equally spaced lines of constant probability density generatedusing a Gaussian kernel-density estimator. The three rectangles in panel (b)show the regions of parameter space used to generate the composite spectrashown in Fig. 2.
Hewett & Wild (2010) redshifts. The improved redshift estimatesare predominantly responsible for the differences seen in Figs 1(a)and (b); the appearance in Fig. 1(b) of the extension to high blueshiftfor quasars with low C IV EW is particularly evident.
The large systematic variation in the C IV emission-line profilewithin the population is evident from figs 11 and 12 of Richards et al.(2011). The plots and analysis in Richards et al. (2011) employ thequasar redshifts from Hewett & Wild (2010) but, as is evident fromthe figures, the systematic variation in the C IV shape is correlatedwith changes in the quasar SEDs, including the strengths of the[Si III] λ1892 and [C III] λ1908 emission lines in the rest-frame UV.As a consequence, the redshifts from Hewett & Wild (2010) stillsuffer from systematic errors that are correlated with the shape,and particularly the blueshift, of the C IV emission line. The natureof the systematic variations in the quasar UV SEDs are such thatfor quasars with close-to symmetric C IV profiles and line centroidsclose to the systemic redshift, the Hewett & Wild (2010) redshiftsresult in C IV blueshifts that are overestimated by a few hundredkm s−1, whereas, for quasars with strong blue-asymmetric C IV
profiles and line centroids displaced significantly to the blue of thesystemic redshift, the C IV blueshifts are underestimated by, in themost extreme cases, up to 1200 km s−1.
Fig. 1(c) shows the C IV emission-line parameters calculated usinga new redshift-estimation algorithm (Allen & Hewett, in prepara-tion) that takes account of the quasar SED variations, producingredshifts independent of the large systematic shape changes seenin the C IV emission line. The low-ionization emission lines vis-ible in the rest-frame UV (over wavelengths from Mg II λλ2796,2803 down to the O I λ1304+[Si II] λ1307 blend) using the newredshift-algorithm are located at rest-frame wavelengths in excel-lent agreement with the systemic redshift defined using the rest-frame narrow-line optical [O III] λλ4960, 5008 and broad-line H β
and Hα.The systematic trends seen in Fig. 1(b), in particular the extension
to high blueshift at low C IV EW, become more apparent in Fig. 1(c),as expected from consideration of the known SED-related errors inthe redshifts from Hewett & Wild (2010). A population of quasarswith only modest blueshifts and low EW is also apparently stillpresent.
3.2 C IV emission-line blueshift measurements
The differences in the distribution of C IV emission-line propertiesseen in the three panels of Fig. 1 are due primarily to the changein the systemic redshift estimates. It is also necessary, however, toobtain a measure of the C IV emission-line ‘location’ in order tocalculate the blueshifts. When working with moderately sized sam-ples, parametric fits to the emission-line profile may be undertakenusing careful mask-definition to minimize the effect of absorptionfeatures on the profiles used for the parametrization, and this is theapproach we follow below in Section 5. Effective analysis of thetens of thousands of spectra from SDSS DR7, and now DR12, how-ever, requires a more robust scheme to determine a C IV-blueshiftestimate that is not very sensitive to the range of S/N among thespectra or the presence of narrow absorption systems within the C IV
emission profile. Shen et al. (2011) provide a discussion (their sec-tion 3) of the factors that affect the measurement of broad emissionlines in quasar spectra of modest S/N. Their careful analysis of theC IV emission properties employed the results of parametric fits ofthree Gaussians to the spectra. Our own experiments in quantifyingthe C IV emission properties of SDSS spectra showed that a simplenon-parametric measure of the C IV emission location reduced the
MNRAS 461, 647–665 (2016)

C IV emission-line properties 651
number of outliers significantly. Visual inspection of spectra demon-strated that the improvement is due primarily to the identification of,and interpolation over, associated and outflow absorption systems,which forms part of the non-parametric measurement scheme.
We therefore chose to use a non-parametric scheme to measurethe blueshift of the C IV line, which we will now describe. A con-tinuum is first defined as a power law of wavelength, f(λ) ∝ λ−α ,with the slope, α, determined using the median2 values of the flux intwo continuum windows at 1445–1465 and 1700–1705 Å (the samewavelengths as adopted by Shen et al. 2011). The C IV emission lineis taken to lie within the wavelength interval 1500–1600 Å, a recipethat is commonly adopted (e.g. Shen et al. 2011; Denney et al.2013). To reduce the impact of narrow absorption systems on theemission-line profile, a ‘pseudo continuum’ is defined by applyinga 41-pixel median filter to the quasar spectrum. Pixels within theC IV profile that lie more than 2σ below the pseudo-continuum aredeemed to be affected by absorption and added to an ‘absorber’-mask. Two pixels on either side of each such pixel are also includedin the mask. For each masked pixel, the flux values in the spectrumare replaced by values from the pseudo-continuum.
The wavelength that bisects the cumulative total line flux, λhalf,is recorded and the blueshift (in km s−1) defined as c ×(1549.48-λhalf)/1549.48, where c is the velocity of light and 1549.48 Å isthe rest-frame wavelength for the C IV doublet.3 Positive blueshiftvalues indicate an excess of emitting material moving towards theobserver and hence outflowing from the quasar. Hewett & Wild(2010) redshifts are used to define the quasar rest frame.
3.3 Sample selection – C IV properties
The primary aim of the paper is to investigate the potential system-atic effects on the C IV-emission based BH masses for quasars withlarge, �1200 km s−1, C IV blueshifts, using the properties of the Hα
emission line to provide BH-mass estimates for the objects unbiasedby non-virial contributions to the emission-line profile. The orangesymbols in Fig. 1 show the C IV parameters of our quasar targets forwhich near-infrared spectra of adequate S/N were obtained. Thesequasars were selected using our non-parametric blueshift measures(based on the Hewett & Wild 2010 redshifts). The sample of 19quasars spans the full dynamic range in C IV parameters based onthe Hewett & Wild (2010) systemic redshifts and the coverageis in fact even more complete when using the forthcoming SED-independent redshifts from Allen & Hewett (in preparation). As isevident from the sparsity of quasars with large C IV blueshifts whenthe SDSS pipeline systemic redshifts are used (Fig. 1a), improve-ments in the estimation of systemic redshifts from UV spectra havebeen a crucial factor in allowing us to reliably select a sample ofquasars with a range of C IV blueshifts. In subsequent sections, were-derive the systemic redshifts and C IV blueshifts for this sampleusing parametric fits to the Hα and C IV emission (the former fromour near-infrared observations). Thus, while the systematic trendsin BH masses inferred from measurements of the C IV emission linedepend on the distribution of C IV emission-line properties withinthe quasar population, the results of our analysis of the Hα and C IV
2 The median is used to improve the robustness of the continuum estimatefrom the relatively small wavelength intervals.3 The adopted C IV rest-frame wavelength assumes an optically thick BLR,in which case the contribution from each component is equal. Adoptinga 2:1 ratio (appropriate for an optically thin BLR) changes the blueshiftsby ∼80 km s−1.
Figure 2. Composite spectra of the C IV emission line as a function of C IV
blueshift for SDSS DR7 quasars. The quasars contributing to each compositeare indicated in Fig. 1(b). Virtually, the entire C IV profile appears to shiftblueward and the change in line shape is not simply an enhancement of fluxin the blue wing of a still identifiable symmetric component. In order ofincreasing C IV blueshift, the composite spectra have FWHM 4870, 5610,and 6770 km s−1 and EW 33.1, 31.6, and 28.8 Å.
emission-line properties are independent of the redshifts used toproduce the panels in Fig. 1.
3.4 Relation to virial BH-mass estimates
In general, researchers studying quasar demographics at high red-shift adopt estimates of BH masses based on the width of C IV-emission, without reference to the blueshift of the C IV-emission(e.g. Vestergaard 2004; Kollmeier et al. 2006; Gavignaud et al.2008; Vestergaard et al. 2008; Vestergaard & Osmer 2009; Kellyet al. 2010; Kelly & Shen 2013). The systemic redshift is oftenassumed to be given by the peak of the C IV emission, regardlessof whether there is evidence that the line is shifted or not. Fig. 2shows the shape of the C IV-emission in composite spectra con-structed from SDSS DR7 quasars with EW(C IV) = 25–40 Å, asa function of C IV blueshift. Quasars classified as BALs, or pos-sessing strong associated absorbers have been excluded, and thecomposite spectra shown are derived using an arithmetic mean of aminimum of 200 spectra at each blueshift. The blueshifts and EWsof the quasars contributing to each of the composites are indicatedby the boxes in Fig. 1(b). The profiles show how, at large values ofblueshift (�2000 km s−1), the C IV-profile is displaced to the blueby amounts comparable to the FWHM of the profile.
A possible origin of the blueshifts is the presence of a disc wind(see Gallagher et al. 2015; Higginbottom & Proga 2015, for recentpapers) but, irrespective of the physical origin of the high-blueshiftC IV profiles, measures of the emission-line ‘width’ do not relatesimply to virialized motions of the emitting gas under the grav-itational influence of the BH. On the other hand, Denney et al.(2013) point out that any radiatively driven wind will have a ve-locity comparable to the escape velocity, i.e. approximately twicethe virial velocity. Even if dominated by an outflow component, theC IV linewidth might therefore still be expected to relate to the BHmass.
4 O BSERVATI ONS
Near-infrared spectra were obtained with the Long-slit Intermedi-ate Resolution Infrared Spectrograph (LIRIS) mounted on the 4.2 mWilliam Herschel Telescope (WHT) at the Observatorio del Roquede los Muchachos (La Palma, Spain). Observations took place over
MNRAS 461, 647–665 (2016)

652 L. Coatman et al.
four non-contiguous nights from 2015 March 31 to April 4. Ap-proximately one night was lost due to poor weather and a furtherhalf-night was affected by poor transparency due to cloud. A 1 arc-sec slit-width was employed and the LIRIS H + K low-resolutiongrism was selected, which covers the spectral ranges 1.53–1.79 µmand 2.07–2.44 µm with a dispersion of 9.7 Å pixel−1. The spatialscale of the instrument is 0.25 arcsec pixel−1. Observations were di-vided into 60 s sub-exposures and performed in an ABBA noddingpattern, with the object placed at two positions along the slit 12 arc-sec apart. Bright A0-5V stars were observed at similar airmasses tothe targets in order to provide both telluric absorption correctionsand a flux calibration of the quasar spectra.
The raw LIRIS data frames incorporate a known ‘pixel shift’which was first removed from all frames using the LIRIS datareduction package LIRISDR. Subsequent data reduction was under-taken with standard IRAF4 procedures. The flat-field images, whichwere taken at the beginning of each night via illumination of thedome, were averaged and normalized to remove any wavelength-dependent signature. Each individual two-dimensional spectrumwas then flat-field corrected. Consecutive AB and BA pairs of two-dimensional spectra were subtracted to remove the sky background.All the subtracted AB/BA-pairs for a target were then averaged togive the final two-dimensional spectrum.
The size of the one-dimensional spectrum extraction windows,in the slit direction, varied from 6–10 pixels. To increase the S/N,optimal variance-weighted extraction with sigma clipping was em-ployed. For the fainter objects in our sample, we were unable to tracethe spectrum across the dispersion axis reliably and the trace froma telluric standard-star observation, observed at a similar airmassand time, was used instead. The wavelength calibration, using argonand xenon lamp exposures, resulted in root mean square errors inthe range 1.01–1.71 Å, with a mean of 1.47 Å. The telluric stan-dard star observations were reduced using the same steps describedabove. The stellar continuum was divided out of the standard-starspectrum, which was then divided into the quasar spectrum to re-move telluric absorption features. The spectral type and magnitudeof the standard star were used to flux calibrate the quasar spectrumboth in a relative and absolute sense. Variable atmospheric condi-tions combined with the narrow slit width resulted in a significantlevel of uncertainty in the absolute flux calibration for the quasarobservations. The use of the UKIDSS broad-band magnitudes (Hand K) to normalize the spectra results in a significantly improvedcalibration.
Spectra with sufficient S/N for analysis of the Hα emission-lineproperties were obtained for a total of 19 quasars. Sixteen of the 19quasars have been re-observed in the Sloan Digital Sky Survey-III:Baryon Oscillation Spectroscopic Survey (SDSS-III/BOSS; Daw-son et al. 2013) and the spectra are available in the SDSS DR12quasar catalogue (Paris et al. 2016). As the BOSS spectra havehigher S/N compared to those in DR7, we have used the BOSSspectra when available. A typical reduced LIRIS spectrum is shownin Fig. 3. A log of the observations, the quasar positions, magni-tudes and redshifts, along with the S/N achieved for the H β, Hα andC IV emission-line regions (the last from the optical SDSS/BOSSspectra) are listed in Table 1. The S/N, which is given per resolutionelement, was measured in the continuum in the region around the
4 IRAF is distributed by the National Optical Astronomy Observatory, whichis operated by the Association of Universities for Research in Astronomy(AURA) under a cooperative agreement with the National Science Founda-tion.
Figure 3. LIRIS spectrum of SDSSJ1246+0426. The gap between the Hand K bands (∼5500–6300 Å) has been greyed-out.
emission lines. The full SDSS name is given in Table 1; in the sub-sequent tables and text, we will refer to objects using an abbreviatedname of the form SDSSJHHMM+DDMM.
Although the S/N is similar in the continuum regions adjacent tothe Hα and H β emission lines, in practice, the much lower EW ofH β compared to Hα meant that both parametric and non-parametriccharacterization of the emission-line parameters did not produceresults that could be used in this investigation. The individual H β
profiles were thus not employed, although a composite spectrum ofthe H β region is used below.
5 EMI SSI ON-LI NE MEASUREMENTS
Virial BH-mass estimators are calibrated using either the FWHM ordispersion (σ ; derived from the second-moment velocity) of a broademission line (e.g. Vestergaard & Peterson 2006; Park et al. 2013).Complications which are encountered when measuring linewidthsinclude how to model the ‘continuum’ flux, where to define thelimits of the line emission, and how to deal with absorption. Allof these issues are exacerbated when working with low S/N data(see Denney et al. 2013, for a discussion). In Section 3.2, we mea-sured the blueshift of C IV for tens of thousands of SDSS DR7quasar spectra. This allowed us to quantify the distribution of C IV
blueshift values and hence select a subset for near-infrared obser-vations which have C IV blueshifts spanning the full range of thisdistribution (Fig. 1). A non-parametric scheme was employed be-cause, in comparison to recipes involving the fitting of multipleGaussian (or other parametric) profiles, it was found to be morerobust and less sensitive to the range of S/N among the spectraand to the presence of narrow absorption systems within the C IV
emission profile. In this section, we will use a different approach,and measure the line properties by fitting a parametric model to thedata. When working with a small number of spectra, it is possibleto use careful mask-definition to minimize the effect of absorptionfeatures on the profiles used for the parametrization. The purposeof the model fits is purely to best represent the intrinsic line pro-file, and no physical meaning is attached to the individual modelcomponents. We will now describe the parametric model and fittingprocedure used for each emission line. The models were fit usinga standard variance-weighted least squares minimization procedureemploying the Levenberg–Marquardt algorithm. Prior to the fit, thespectra were visually inspected and regions significantly affectedby absorption were masked and excluded.
MNRAS 461, 647–665 (2016)

C IV emission-line properties 653
Table 1. Summary of near-infrared spectroscopic observations with LIRIS.
SDSS name SDSS DR za iSDSS UTC date Texp (s) S/N(C IV)b S/N(H β)b S/N(Hα)b
073813.19+271038.1 DR12 2.4508 18.80 2015-04-01 720 29.13 17.27 10.0074352.61+245743.6 DR12 2.1659 19.09 2015-04-04 2160 8.64 18.68 11.43080651.54+245526.3 DR12 2.1594 18.91 2015-04-01 1200 10.37 6.04 3.91085437.59+031734.8 DR7 2.2504 18.41 2015-03-31 2520 26.58 5.82 3.09085856.00+015219.4 DR12 2.1675 17.62 2015-04-04 1800 66.16 24.37 12.71110454.73+095714.8 DR12 2.4238 19.12 2015-04-03 1440 19.41 10.75 7.81123611.21+112921.6 DR12 2.1527 18.53 2015-04-04 1680 35.24 21.3 11.51124602.04+042658.4 DR12 2.4473 18.49 2015-04-01 960 35.34 8.1 5.73130618.60+151017.9 DR12 2.4020 19.00 2015-04-05 840 29.83 8.91 5.13131749.78+080616.2 DR12 2.3791 19.04 2015-04-05 2880 19.25 5.6 3.32132948.73+324124.4 DR12 2.1684 18.40 2015-04-01 2520 32.58 10.4 6.96133646.87+144334.2 DR7 2.1422 18.84 2015-04-01 1200 15.2 23.82 16.34133916.88+151507.6 DR12 2.3157 18.52 2015-04-03 2880 20.52 5.79 3.28140047.45+120504.6 DR12 2.1722 18.29 2015-04-02 840 36.64 9.83 5.68152529.17+292813.2 DR12 2.3605 17.52 2015-04-04 1440 80.55 2.17 1.5153027.37+062330.8 DR12 2.2198 18.62 2015-04-04 1800 29.9 21.01 12.58153848.64+023341.1 DR12 2.2419 17.56 2015-04-01 2520 64.82 5.63 3.56161842.44+234131.7 DR7 2.2824 18.49 2015-04-04 1320 23.37 11.1 6.43163456.15+301437.8 DR12 2.4901 18.29 2015-04-01 1920 36.06 9.44 8.63
Notes. aFrom Hewett & Wild (2010).bMeasured in the continuum and quoted per resolution element.
Table 2. Summary of the fitting regions and the parameters of the models used to fit the C IV and Hα emission lines.
Fitting region (km s−1) Continuum region (Å) GH order Gaussians χ2ν
Name C IV Hα C IV Hα C IV Hα C IV Hα
0738+2710 −9570, 9770 −7530, 10 740 1445–1465, 1700–1705 6000–6250, 6800–7000 6 2 0.66 1.00743+2457 −9570, 9770 −7530, 10 740 1445–1465, 1700–1705 6004–6210, 6800–7000 2 2 0.84 1.00806+2455 −9570, 9770 −9219, 10 759 1445–1465, 1700–1705 6000–6250, 6800–7000 3 1 0.87 0.830854+0317 −9570, 9770 −7530, 10 740 1445–1465, 1700–1705 5989–6135, 6800–7000 3 2 0.91 0.850858+0152 −20 000, 7400 −7530, 10 740 1423–1428, 1700–1705 6000–6200, 6800–7000 2 2 0.94 0.961104+0957 −9570, 9770 −7530, 10 740 1445–1465, 1700–1705 6000–6250, 6801–6845 6 2 0.68 0.951236+1129 −15 363, 7650 −8904, 10 590 1445–1465, 1700–1705 6063–6210, 6800–7000 3 2 0.84 0.891246+0426 −9570, 9770 −7530, 10 740 1445–1465, 1700–1705 6000–6250, 6799–6906 4 2 0.66 0.831306+1510 −13 000, 7800 −7530, 10 740 1445–1465, 1700–1705 6000–6250, 6800–7000 2 3 0.73 0.181317+0806 −9198, 9755 −7530, 10 740 1445–1465, 1700–1705 6000–6250, 6800–7000 2 1 0.78 2.161329+3241 −12 000, 9000 −7605, 7406 1445–1461, 1700–1705 6000–6250, 6800–7000 3 2 0.61 0.841336+1443 −14 000, 10 000 −10131, 10 674 1445–1465, 1700–1705 6000–6250, 6800–7000 3 2 0.87 1.511339+1515 −12 000, 11 000 −7530, 10 740 1445–1465, 1700–1705 6046–6250, 6800–7000 4 1 0.69 0.141400+1205 −15 000, 10 000 −2000, 10 815 1445–1465, 1700–1705 6000–6250, 6800–7000 6 2 0.82 0.21525+2928 −9570, 9770 −7586, 8080 1459–1466, 1700–1705 6055–6251, 6800–7000 4 1 0.49 0.391530+0623 −12 000, 10 000 −7530, 10 740 1445–1465, 1700–1705 6127–6186, 6800–7000 4 3 0.84 1.141538+0233 −13 500, 9000 −7530, 10 740 1450–1465, 1700–1705 6000–6250, 6855–7002 4 2 0.61 0.821618+2341 −9190, 9770 −7530, 10 740 1445–1465, 1689–1697 6000–6250, 6800–7000 4 2 1.16 0.931634+3014 −9570, 9770 −8400, 8500 1445–1465, 1700–1705 6000–6250, 6736–6779 3 2 0.59 0.22
5.1 C IV
We first measure and subtract the local continuum emission, by fit-ting a power law to two windows on either side of the line emission,as described in Section 3.2. For a small number of objects, ab-sorption features, or artefacts, in the spectrum-necessitated modestadjustments to the window extents, which are specified in Table 2.The continuum-subtracted spectra are then transformed from wave-length units into units of velocity relative to the rest-frame line-transition wavelength for the C IV doublet (1549.48 Å, assumingequal contributions from both components). The parametric modelis ordinarily fit within the same 1500–1600 Å window used in Sec-tion 3.2, which corresponds to approximately ±10 000 km s−1 fromthe rest-frame transition wavelength. The line-window was ex-tended if significant flux in the profile was present blueward of the
short wavelength limit. The adopted line-fitting windows, in unitsof velocity from the rest-frame transition wavelength, are given inTable 2.
To fit the C IV profile, we employed Gauss–Hermite (GH) poly-nomials, using the normalization of van der Marel & Franx (1993)and the functional forms of Cappellari et al. (2002). We allowed upto six components in the GH polynomial model, but in many cases,a lower order was sufficient; the polynomial order used for eachline is given in Table 2. It is also a common practice to fit the C IV
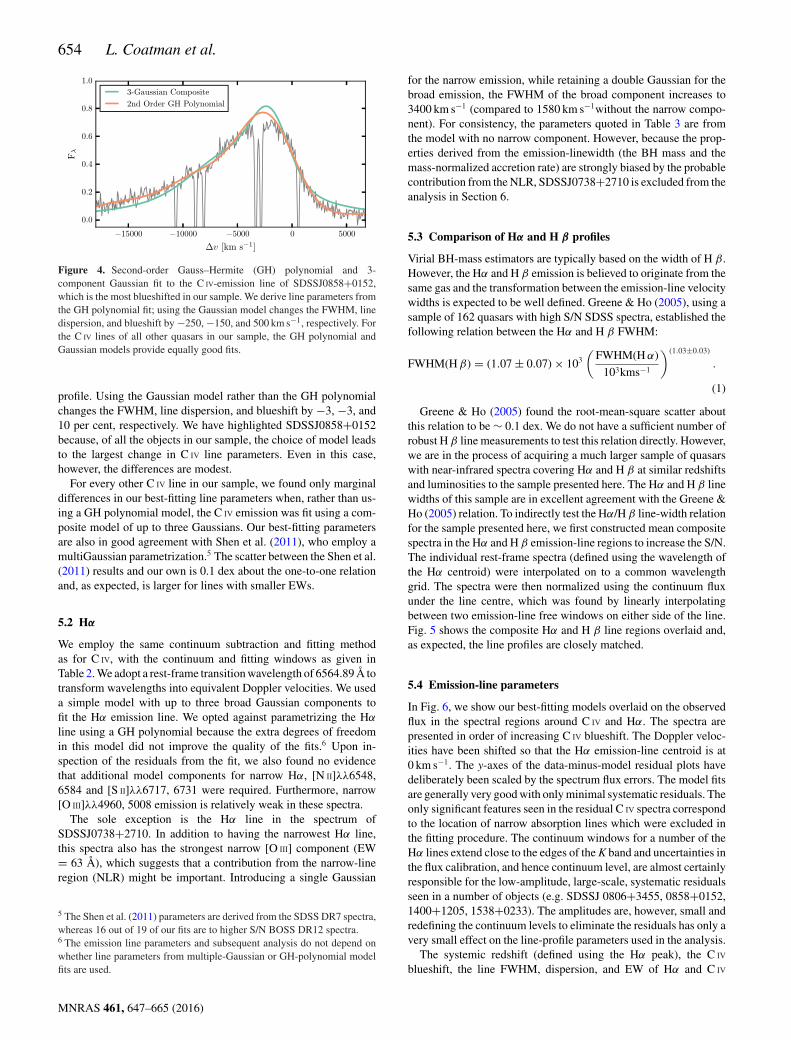
emission profile with two or three Gaussian components (e.g. Shenet al. 2011). We opted to use a GH-polynomial model primarilybecause it provided a significantly better fit to the most blueshiftedand asymmetric C IV line (in SDSSJ0858+0152). Fig. 4 shows howa model with three Gaussian components underestimates the flux inthe blue wing and overestimates the flux in the red wing of the line
MNRAS 461, 647–665 (2016)
654 L. Coatman et al.
Figure 4. Second-order Gauss–Hermite (GH) polynomial and 3-component Gaussian fit to the C IV-emission line of SDSSJ0858+0152,which is the most blueshifted in our sample. We derive line parameters fromthe GH polynomial fit; using the Gaussian model changes the FWHM, linedispersion, and blueshift by −250, −150, and 500 km s−1, respectively. Forthe C IV lines of all other quasars in our sample, the GH polynomial andGaussian models provide equally good fits.
profile. Using the Gaussian model rather than the GH polynomialchanges the FWHM, line dispersion, and blueshift by −3, −3, and10 per cent, respectively. We have highlighted SDSSJ0858+0152because, of all the objects in our sample, the choice of model leadsto the largest change in C IV line parameters. Even in this case,however, the differences are modest.
For every other C IV line in our sample, we found only marginaldifferences in our best-fitting line parameters when, rather than us-ing a GH polynomial model, the C IV emission was fit using a com-posite model of up to three Gaussians. Our best-fitting parametersare also in good agreement with Shen et al. (2011), who employ amultiGaussian parametrization.5 The scatter between the Shen et al.(2011) results and our own is 0.1 dex about the one-to-one relationand, as expected, is larger for lines with smaller EWs.
5.2 Hα
We employ the same continuum subtraction and fitting methodas for C IV, with the continuum and fitting windows as given inTable 2. We adopt a rest-frame transition wavelength of 6564.89 Å totransform wavelengths into equivalent Doppler velocities. We useda simple model with up to three broad Gaussian components tofit the Hα emission line. We opted against parametrizing the Hα
line using a GH polynomial because the extra degrees of freedomin this model did not improve the quality of the fits.6 Upon in-spection of the residuals from the fit, we also found no evidencethat additional model components for narrow Hα, [N II]λλ6548,6584 and [S II]λλ6717, 6731 were required. Furthermore, narrow[O III]λλ4960, 5008 emission is relatively weak in these spectra.
The sole exception is the Hα line in the spectrum ofSDSSJ0738+2710. In addition to having the narrowest Hα line,this spectra also has the strongest narrow [O III] component (EW= 63 Å), which suggests that a contribution from the narrow-lineregion (NLR) might be important. Introducing a single Gaussian
5 The Shen et al. (2011) parameters are derived from the SDSS DR7 spectra,whereas 16 out of 19 of our fits are to higher S/N BOSS DR12 spectra.6 The emission line parameters and subsequent analysis do not depend onwhether line parameters from multiple-Gaussian or GH-polynomial modelfits are used.
for the narrow emission, while retaining a double Gaussian for thebroad emission, the FWHM of the broad component increases to3400 km s−1 (compared to 1580 km s−1without the narrow compo-nent). For consistency, the parameters quoted in Table 3 are fromthe model with no narrow component. However, because the prop-erties derived from the emission-linewidth (the BH mass and themass-normalized accretion rate) are strongly biased by the probablecontribution from the NLR, SDSSJ0738+2710 is excluded from theanalysis in Section 6.
5.3 Comparison of Hα and H β profiles
Virial BH-mass estimators are typically based on the width of H β.However, the Hα and H β emission is believed to originate from thesame gas and the transformation between the emission-line velocitywidths is expected to be well defined. Greene & Ho (2005), using asample of 162 quasars with high S/N SDSS spectra, established thefollowing relation between the Hα and H β FWHM:
FWHM(H β) = (1.07 ± 0.07) × 103
(FWHM(H α)
103kms−1
)(1.03±0.03)
.
(1)
Greene & Ho (2005) found the root-mean-square scatter aboutthis relation to be ∼ 0.1 dex. We do not have a sufficient number ofrobust H β line measurements to test this relation directly. However,we are in the process of acquiring a much larger sample of quasarswith near-infrared spectra covering Hα and H β at similar redshiftsand luminosities to the sample presented here. The Hα and H β linewidths of this sample are in excellent agreement with the Greene &Ho (2005) relation. To indirectly test the Hα/H β line-width relationfor the sample presented here, we first constructed mean compositespectra in the Hα and H β emission-line regions to increase the S/N.The individual rest-frame spectra (defined using the wavelength ofthe Hα centroid) were interpolated on to a common wavelengthgrid. The spectra were then normalized using the continuum fluxunder the line centre, which was found by linearly interpolatingbetween two emission-line free windows on either side of the line.Fig. 5 shows the composite Hα and H β line regions overlaid and,as expected, the line profiles are closely matched.
5.4 Emission-line parameters
In Fig. 6, we show our best-fitting models overlaid on the observedflux in the spectral regions around C IV and Hα. The spectra arepresented in order of increasing C IV blueshift. The Doppler veloc-ities have been shifted so that the Hα emission-line centroid is at0 km s−1. The y-axes of the data-minus-model residual plots havedeliberately been scaled by the spectrum flux errors. The model fitsare generally very good with only minimal systematic residuals. Theonly significant features seen in the residual C IV spectra correspondto the location of narrow absorption lines which were excluded inthe fitting procedure. The continuum windows for a number of theHα lines extend close to the edges of the K band and uncertainties inthe flux calibration, and hence continuum level, are almost certainlyresponsible for the low-amplitude, large-scale, systematic residualsseen in a number of objects (e.g. SDSSJ 0806+3455, 0858+0152,1400+1205, 1538+0233). The amplitudes are, however, small andredefining the continuum levels to eliminate the residuals has only avery small effect on the line-profile parameters used in the analysis.
The systemic redshift (defined using the Hα peak), the C IV
blueshift, the line FWHM, dispersion, and EW of Hα and C IV
MNRAS 461, 647–665 (2016)

C IV emission-line properties 655
Table 3. Summary of emission-line properties derived from parametric model fits to Hα and C IV.
Blueshift FWHM σ EW(km s−1) (km s−1) (km s−1) (Å)
Name z (Hα) C IV C IV Hα C IV Hα C IV Hα
0738+2710 2.4396 50 ± 21 2255 ± 42 1503 ± 95 2916 ± 42 1789 ± 95 54 ± 2 532 ± 430743+2457 2.1662 692 ± 210 5924 ± 536 6036 ± 511 3801 ± 536 3904 ± 511 33 ± 4 351 ± 230806+2455 2.1542 389 ± 115 3435 ± 267 4059 ± 403 3387 ± 267 1724 ± 403 51 ± 4 488 ± 560854+0317 2.2475 − 403 ± 134 3940 ± 354 4436 ± 522 3448 ± 354 3146 ± 522 24 ± 2 617 ± 900858+0152 2.1692 4354 ± 82 8412 ± 384 3155 ± 80 5298 ± 384 3758 ± 80 28 ± 1 622 ± 231104+0957 2.4217 − 299 ± 55 3590 ± 112 3307 ± 334 3259 ± 112 2723 ± 334 70 ± 3 441 ± 721236+1129 2.1559 2828 ± 99 7540 ± 271 3152 ± 131 4168 ± 271 3277 ± 131 28 ± 1 631 ± 291246+0426 2.4393 325 ± 145 4126 ± 88 4268 ± 472 3901 ± 88 2543 ± 472 48 ± 1 536 ± 771306+1510 2.3989 2043 ± 84 6660 ± 158 2626 ± 330 3905 ± 158 2145 ± 330 36 ± 1 349 ± 521317+0806 2.3748 437 ± 289 5256 ± 182 7188 ± 946 3675 ± 182 3033 ± 946 33 ± 2 374 ± 671329+3241 2.1637 652 ± 113 4528 ± 491 4908 ± 410 3819 ± 491 3350 ± 410 35 ± 2 428 ± 351336+1443 2.1466 3668 ± 345 8780 ± 1003 2954 ± 67 3772 ± 1003 3227 ± 67 20 ± 2 523 ± 171339+1515 2.3207 133 ± 184 3865 ± 935 8816 ± 1072 4501 ± 935 3627 ± 1072 44 ± 2 500 ± 981400+1205 2.1672 2492 ± 107 7590 ± 290 3231 ± 227 4363 ± 290 3103 ± 227 25 ± 1 642 ± 551525+2928 2.3572 612 ± 536 5697 ± 128 6360 ± 1915 4303 ± 128 2696 ± 1915 41 ± 1 458 ± 1861530+0623 2.2169 1471 ± 108 5397 ± 302 3073 ± 145 4092 ± 302 2664 ± 145 26 ± 1 499 ± 281538+0233 2.2420 2018 ± 80 5567 ± 100 2892 ± 253 3596 ± 100 2415 ± 253 25 ± 1 465 ± 751618+2341 2.2755 42 ± 53 2516 ± 161 2669 ± 175 3312 ± 161 2359 ± 175 34 ± 2 425 ± 391634+3014 2.5018 1509 ± 223 6835 ± 745 6210 ± 900 4566 ± 745 3236 ± 900 26 ± 1 327 ± 65
Figure 5. The Hα and H β emission-line regions in the median compositespectrum, shown as function of the velocity shift from the respective pre-dicted line peak wavelengths. The line fluxes have been scaled in order forthe profile shapes to be readily compared. The Hα and H β line profiles arevery similar, which suggests a tight correlation between the Hα and H β
linewidths. Quasar narrow-line emission from [O III] λ5008.2 is visible but,overall, the [O III] λλ4960, 5008 emission is relatively weak in these spectra.
are all given in Table 3. Both the FHWM and the dispersion (σ )have been corrected for instrumental broadening by subtracting theFWHM resolution (152 and 477 km s−1 for SDSS/BOSS and LIRIS,respectively) in quadrature.7
Our definition of the C IV blueshift differs slightly in two waysfrom the values plotted for the quasar population in Fig. 1. First, weuse the peak of our parametric model fit to the Hα line to define thequasar systemic-redshift.8 Secondly, the centre of the C IV line isnow defined as the wavelength that bisects the cumulative total fluxof our best-fitting GH-polynomial model rather than of the data.
The monochromatic luminosity of the continuum at 1350 and5100 Å, which are used to calculate virial BH-mass estimates, are
7 For the dispersion, we first divide the FHWM resolution by 2.35, whichassumes that the line profile is Gaussian.8 The Hα-derived redshifts are very closely in agreement with those fromthe forthcoming Allen & Hewett redshifts, which are plotted in Fig. 1(c).
given in Table 4. The luminosity at 1350 Å was taken from the spec-tral fits of Shen et al. (2011). The quasar rest-frame continuum at5100 Å often lies at the edge, or beyond, the wavelength coverageof the LIRIS spectra. Monochromatic 5100 Å luminosities weretherefore calculated from the fit of our parametric quasar model(described in Maddox et al. 2012) to the UKIDSS H- broad-bandmagnitude for each quasar. The model fits to the quasars are excel-lent, with residuals in SDSS and UKIDSS passbands under 10 percent.
5.5 Emission-line parameter uncertainties
The 1σ error bars calculated from the covariance matrix in least-squares minimization will underestimate the true uncertainties onthe line parameters, since they do not account for systematic er-rors such as the significant uncertainty introduced in the continuumsubtraction procedure. To calculate more realistic uncertainties onour fitted variables, we employed a Monte Carlo approach. Arti-ficial spectra were synthesized, with the flux at each wavelengthdrawn from a Normal distribution (mean equal to the measured fluxand standard deviation equal to the known error). Our emission-line fitting recipe was then implemented on 5000 artificial spectra.Our parameter uncertainties are defined as the standard deviationof the best-fitting parameter values from these 5000 realizations.The uncertainty on the monochromatic continuum luminosity at5100 Å was estimated via a very similar method – using the erroron the UKIDSS H-band magnitude to run a number of realisationsof our SED-fitting routine. The uncertainties on all derived quanti-ties, such as the BH mass, are propagated through by assuming thatthe uncertainties are uncorrelated and independent.
Because of its sensitivity to the flux in the wings of the lineprofile, care must be taken to define an appropriate range overwhich to measure the line dispersion. This is particularly true ofLorentzian-like profiles with extended wings. In spectra of onlymoderate S/N, the line limits are difficult to determine unambigu-ously, which introduces an extra degree of uncertainty in linedispersion measurements. In common with previous work (e.g.
MNRAS 461, 647–665 (2016)

656 L. Coatman et al.
Vestergaard & Peterson 2006), by default, the dispersion was calcu-lated within ±10 000 km s−1 of the line centre, but this was extendedwhen appropriate to avoid excluding a significant amount of lineflux.
6 R ESULTS
A fundamental assumption on which single-epoch virial BH-massestimates are based is that the widths of the broad emission linesare directly related to the virial motions of the emitting clouds mov-ing in the gravitational potential of the central BH. However, theC IV line profiles of the quasars in our sample with the largest C IV
blueshifts indicate that non-virial motions, very likely due to out-flows, are having a significant effect on the observed C IV emissionvelocity profile (e.g. Gaskell 1982; Baskin & Laor 2005; Sulenticet al. 2007; Richards et al. 2011; Wang et al. 2013). As shown in
Fig. 2, at fixed emission-line EW, virtually the entire C IV profile ap-pears to shift blueward and the change in line shape is not simply anenhancement of flux in the blue wing of a still identifiable symmetriccomponent. While gravity almost certainly plays a key role, deter-mining the escape velocity for outflowing material, for example, itis clear that the virial assumption, on which single-epoch BH-massmeasurements are predicated, is not straightforwardly applicablefor the C IV emission line in quasars exhibiting large blueshifts.
The main aim of this paper is to investigate potential systematictrends in C IV-based single-epoch virial BH masses as a functionof the C IV blueshift. Calibrations using H β (and therefore alsoHα) are generally accepted to be the most reliable, since mostreverberation-mapping employs the H β line and the R–L relationhas been established using H β. Therefore, we will test the reliabilityof the C IV-based estimates by comparing C IV line profiles to Hα
profiles in the same quasars.
Figure 6. C IV (SDSS/BOSS) and Hα (LIRIS) emission lines and best-fitting model. �v is the velocity shift from the line rest-frame transition wavelength,with the systemic redshift defined using the centroid of the fit to Hα. Objects are presented in order of increasing C IV blueshift relative to the Hα centroid.Below each fit, we plot the data-model residuals, scaled by the errors on the fluxes.
MNRAS 461, 647–665 (2016)

C IV emission-line properties 657
Figure 6 – continued
6.1 Characterising the emission-line profiles
There has been a considerable degree of attention paid to the effec-tiveness of different velocity-width measures of the C IV emission;specifically, the line FWHM and the dispersion, σ , derived from thesecond-moment velocity (e.g. Assef et al. 2011; Denney et al. 2013).The FWHM and line dispersion trace different parts of the broad-line velocity field, with the FWHM relatively more sensitive to anylow-velocity core present and the line dispersion relatively moresensitive to the high-velocity wings. The shape of the line can becharacterized by the ratio FWHM/σ . FWHM/σ � 2.35 for a Gaus-sian profile, while FWHM/σ � 1 for a peakier Lorentzian profile.9
In practice, the line dispersion is almost certainly a more robust ve-locity indicator when the assumptions underlying the virial-originof the emission-line velocity width are true and the spectral S/N andresolution are adequate. This was demonstrated by Denney et al.(2013) for a sample of quasars possessing a significantly smallerrange in C IV blueshift than investigated here.
9 Strictly FWHM/σ → 0 for a Lorentzian profile, but values close to unityare typical when the dispersion is calculated over a velocity range, � ±10 000 km s−1, used to parametrize broad emission lines in quasar spectra.
In reality, however, as highlighted by Denney (2012), contribu-tions to the C IV emission-line profile from gas where virial motionsdo not dominate can be significant. Looking to the future, the resultsof the new reverberation-mapping projects (King et al. 2015; Shenet al. 2015) will show what fraction of the C IV emission line, as afunction of velocity, does reverberate for quasars with an extendedrange of C IV emission shapes. The derivation of quantitative cor-rections to transform velocity-width measures from single-epoch toreverberation-only line profiles should then be possible.
As such information is not yet available, there is a strong ratio-nale for investigating whether the systematic changes in the C IV
emission-line profile can be used to improve the single-epoch BH-mass estimates derived using the C IV line. In the left-hand panelsof Fig. 7, we show how the C IV FWHM, line dispersion, σ , andline shape, FWHM/σ , vary as a function of the blueshift. The C IV
FWHM is correlated with the blueshift, with the median FWHMof quasars with the largest blueshifts a factor of 2 to 3 higher thanquasars with only moderate blueshifts. The dispersion, however,does not show a similarly strong systematic variation.
Without knowledge of the C IV blueshifts, the dynamic rangepresent in the FWHM and line dispersion measurements accordswith the expectations from the study of Denney et al. (2013); the
MNRAS 461, 647–665 (2016)
658 L. Coatman et al.
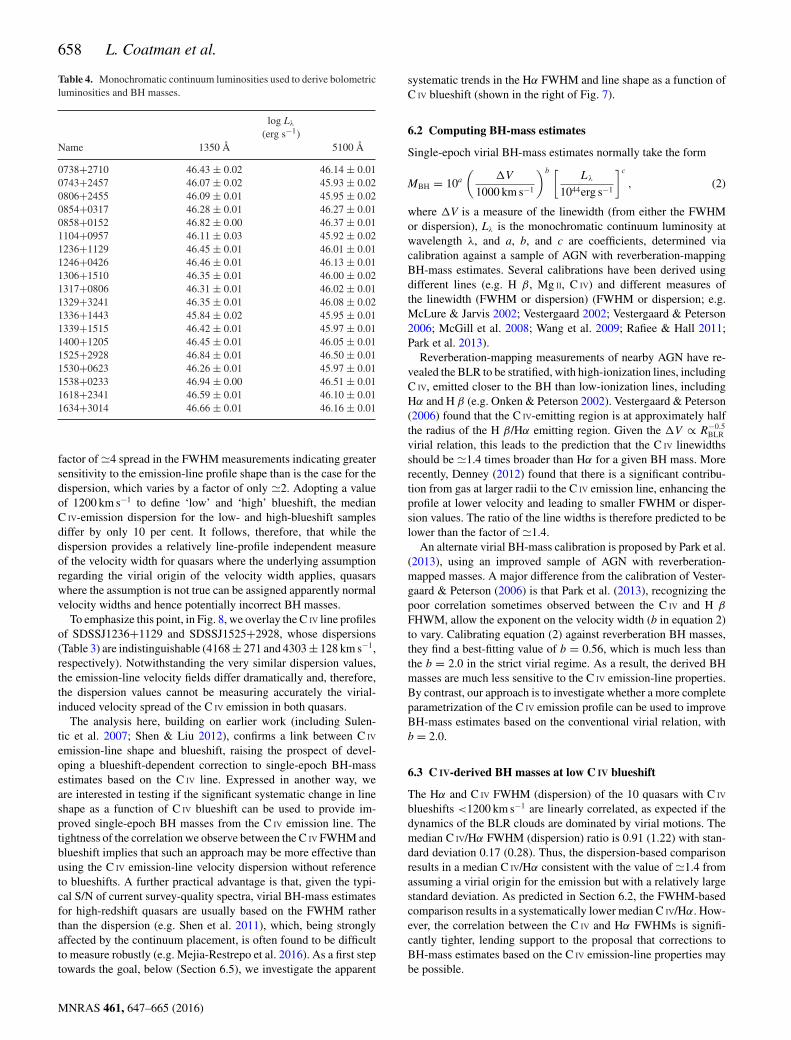
Table 4. Monochromatic continuum luminosities used to derive bolometricluminosities and BH masses.
log Lλ
(erg s−1)Name 1350 Å 5100 Å
0738+2710 46.43 ± 0.02 46.14 ± 0.010743+2457 46.07 ± 0.02 45.93 ± 0.020806+2455 46.09 ± 0.01 45.95 ± 0.020854+0317 46.28 ± 0.01 46.27 ± 0.010858+0152 46.82 ± 0.00 46.37 ± 0.011104+0957 46.11 ± 0.03 45.92 ± 0.021236+1129 46.45 ± 0.01 46.01 ± 0.011246+0426 46.46 ± 0.01 46.13 ± 0.011306+1510 46.35 ± 0.01 46.00 ± 0.021317+0806 46.31 ± 0.01 46.02 ± 0.011329+3241 46.35 ± 0.01 46.08 ± 0.021336+1443 45.84 ± 0.02 45.95 ± 0.011339+1515 46.42 ± 0.01 45.97 ± 0.011400+1205 46.45 ± 0.01 46.05 ± 0.011525+2928 46.84 ± 0.01 46.50 ± 0.011530+0623 46.26 ± 0.01 45.97 ± 0.011538+0233 46.94 ± 0.00 46.51 ± 0.011618+2341 46.59 ± 0.01 46.10 ± 0.011634+3014 46.66 ± 0.01 46.16 ± 0.01
factor of �4 spread in the FWHM measurements indicating greatersensitivity to the emission-line profile shape than is the case for thedispersion, which varies by a factor of only �2. Adopting a valueof 1200 km s−1 to define ‘low’ and ‘high’ blueshift, the medianC IV-emission dispersion for the low- and high-blueshift samplesdiffer by only 10 per cent. It follows, therefore, that while thedispersion provides a relatively line-profile independent measureof the velocity width for quasars where the underlying assumptionregarding the virial origin of the velocity width applies, quasarswhere the assumption is not true can be assigned apparently normalvelocity widths and hence potentially incorrect BH masses.
To emphasize this point, in Fig. 8, we overlay the C IV line profilesof SDSSJ1236+1129 and SDSSJ1525+2928, whose dispersions(Table 3) are indistinguishable (4168 ± 271 and 4303 ± 128 km s−1,respectively). Notwithstanding the very similar dispersion values,the emission-line velocity fields differ dramatically and, therefore,the dispersion values cannot be measuring accurately the virial-induced velocity spread of the C IV emission in both quasars.
The analysis here, building on earlier work (including Sulen-tic et al. 2007; Shen & Liu 2012), confirms a link between C IV
emission-line shape and blueshift, raising the prospect of devel-oping a blueshift-dependent correction to single-epoch BH-massestimates based on the C IV line. Expressed in another way, weare interested in testing if the significant systematic change in lineshape as a function of C IV blueshift can be used to provide im-proved single-epoch BH masses from the C IV emission line. Thetightness of the correlation we observe between the C IV FWHM andblueshift implies that such an approach may be more effective thanusing the C IV emission-line velocity dispersion without referenceto blueshifts. A further practical advantage is that, given the typi-cal S/N of current survey-quality spectra, virial BH-mass estimatesfor high-redshift quasars are usually based on the FWHM ratherthan the dispersion (e.g. Shen et al. 2011), which, being stronglyaffected by the continuum placement, is often found to be difficultto measure robustly (e.g. Mejia-Restrepo et al. 2016). As a first steptowards the goal, below (Section 6.5), we investigate the apparent
systematic trends in the Hα FWHM and line shape as a function ofC IV blueshift (shown in the right of Fig. 7).
6.2 Computing BH-mass estimates
Single-epoch virial BH-mass estimates normally take the form
MBH = 10a
(�V
1000 km s−1
)b [Lλ
1044erg s−1
]c
, (2)
where �V is a measure of the linewidth (from either the FWHMor dispersion), Lλ is the monochromatic continuum luminosity atwavelength λ, and a, b, and c are coefficients, determined viacalibration against a sample of AGN with reverberation-mappingBH-mass estimates. Several calibrations have been derived usingdifferent lines (e.g. H β, Mg II, C IV) and different measures ofthe linewidth (FWHM or dispersion) (FWHM or dispersion; e.g.McLure & Jarvis 2002; Vestergaard 2002; Vestergaard & Peterson2006; McGill et al. 2008; Wang et al. 2009; Rafiee & Hall 2011;Park et al. 2013).
Reverberation-mapping measurements of nearby AGN have re-vealed the BLR to be stratified, with high-ionization lines, includingC IV, emitted closer to the BH than low-ionization lines, includingHα and H β (e.g. Onken & Peterson 2002). Vestergaard & Peterson(2006) found that the C IV-emitting region is at approximately halfthe radius of the H β/Hα emitting region. Given the �V ∝ R−0.5
BLR
virial relation, this leads to the prediction that the C IV linewidthsshould be �1.4 times broader than Hα for a given BH mass. Morerecently, Denney (2012) found that there is a significant contribu-tion from gas at larger radii to the C IV emission line, enhancing theprofile at lower velocity and leading to smaller FWHM or disper-sion values. The ratio of the line widths is therefore predicted to belower than the factor of �1.4.
An alternate virial BH-mass calibration is proposed by Park et al.(2013), using an improved sample of AGN with reverberation-mapped masses. A major difference from the calibration of Vester-gaard & Peterson (2006) is that Park et al. (2013), recognizing thepoor correlation sometimes observed between the C IV and H β
FHWM, allow the exponent on the velocity width (b in equation 2)to vary. Calibrating equation (2) against reverberation BH masses,they find a best-fitting value of b = 0.56, which is much less thanthe b = 2.0 in the strict virial regime. As a result, the derived BHmasses are much less sensitive to the C IV emission-line properties.By contrast, our approach is to investigate whether a more completeparametrization of the C IV emission profile can be used to improveBH-mass estimates based on the conventional virial relation, withb = 2.0.
6.3 C IV-derived BH masses at low C IV blueshift
The Hα and C IV FWHM (dispersion) of the 10 quasars with C IV
blueshifts <1200 km s−1 are linearly correlated, as expected if thedynamics of the BLR clouds are dominated by virial motions. Themedian C IV/Hα FWHM (dispersion) ratio is 0.91 (1.22) with stan-dard deviation 0.17 (0.28). Thus, the dispersion-based comparisonresults in a median C IV/Hα consistent with the value of �1.4 fromassuming a virial origin for the emission but with a relatively largestandard deviation. As predicted in Section 6.2, the FWHM-basedcomparison results in a systematically lower median C IV/Hα. How-ever, the correlation between the C IV and Hα FWHMs is signifi-cantly tighter, lending support to the proposal that corrections toBH-mass estimates based on the C IV emission-line properties maybe possible.
MNRAS 461, 647–665 (2016)

C IV emission-line properties 659
Figure 7. The FWHM, dispersion (σ ) and shape (FWHM/σ ) of C IV and Hα as a function of the C IV blueshift. The vertical line demarcates the ‘high’ and‘low’ C IV blueshift regimes discussed in the text. At high blueshift, it is clear that BH masses estimated from the C IV FWHM (as is typically done at theredshifts considered) will be significantly larger than those estimated from the Hα FWHM.
Virial BH masses were calculated using the widely adoptedVestergaard & Peterson (2006) calibrations. The Vestergaard &Peterson (2006) C IV FWHM calibration uses the monochromaticcontinuum luminosity at 1350 Å to predict the BLR radius andcorresponds to (a = 6.66, b = 2, c = 0.53) in equation (2). Thecalibration coefficient a = 6.73 in their equivalent dispersion-basedrelation. For the H β calibration, Vestergaard & Peterson (2006) usethe monochromatic continuum luminosity at 5100 Å and calibrationcoefficients corresponding to (a = 6.91, b = 2, c = 0.5). BH massesare computed using the line and continuum properties given inTables 3 and 4, and we convert our Hα emission-line velocity-widthmeasures to predicted H β widths using equation (1).
As a direct consequence of the empirically small C IV/Hα FWHMratio, the C IV-derived BH-mass estimates are systematically lowerthan the corresponding Hα-derived masses when the blueshift issmall. This can be seen in Fig. 9, where for every quasar with aC IV blueshift <1200 km s−1(i.e. to the left of the dashed line), theC IV-derived BH mass is smaller than the corresponding Hα-derived
Figure 8. Comparison of the C IV line profiles of SDSSJ1236+1129 andSDSSJ1525+0426. Notwithstanding the essentially identical dispersion val-ues, the emission-line velocity fields differ dramatically and, therefore, thedispersion values cannot be measuring accurately the virial-induced velocityspread of the C IV emission in both quasars.
MNRAS 461, 647–665 (2016)

660 L. Coatman et al.
Figure 9. Comparison of virial BH-mass estimates based on the C IV
FWHM (top) and dispersion σ (bottom) and Hα FWHM as a functionof the C IV blueshift. The horizontal line indicates agreement between C IV
and Hα BH masses, and the vertical line demarcates the ‘high’ and ‘low’C IV blueshift regimes discussed in the text. The BH masses of quasars withmoderate C IV blueshifts are underestimated when using the C IV FWHM,while the masses of quasars with large blueshifts are severely overestimated.This situation cannot be corrected by changing the exponent on the FWHM(e.g. Rafiee & Hall 2011; Park et al. 2013) or the overall scaling in standardvirial BH-mass relations.
mass. The median fractional difference between the two estimatesis 0.60.
For the 10 quasars with low C IV blueshifts, we looked for cor-relations of the C IV/Hα FWHM ratio with other spectral proper-ties. We found marginal evidence for an anticorrelation with theHα FWHM (Spearman coefficient 0.58 with p-value 0.08). Amongthe quasars with Hα FWHM >4000 km s−1, we found the meanC IV/Hα FWHM ratio to be 0.83, compared to 1.01 for the quasarswith Hα FWHM <4000 km s−1. Similar trends have been observedat low-z; in a sample of Boroson & Green (1992) quasars, Baskin& Laor (2005) found the C IV line to be broader than H β whenthe H β FWHM <4000 km s−1and narrower when the H β FWHM>4000 km s−1.
6.4 C IV-derived BH masses at high C IV blueshift
In Section 6.1, we have shown that the C IV emission at large C IV
blueshift is not dominated by virial-induced motions due to theBH. The empirically derived increase in the C IV emission FWHMwith blueshift leads directly to an overestimate of BH mass if thetrend with blueshift is not taken into account. The availability of theHα-spectra for the sample allows the quantification of the bias ininferred BH mass under the assumption that the Hα emission lineprovides a reliable BH mass.
Fig. 9 shows the ratio of the C IV- and Hα-FWHM derived BHmasses as a function of the C IV blueshift. We see that for quasarswith C IV blueshifts >2000 km s−1, the C IV-based masses overesti-mate the Hα-based masses by as much as a factor of ∼5.
The existence of a trend in the C IV-dispersion values with C IV
blueshift is evident from inspection of the bottom-left panel of Fig. 7but the systematic trend relative to the spread at fixed blueshiftis significantly smaller than when using C IV FWHM. Similarly,Fig. 9 shows, at most, only a weak increase in the ratio of C IV-and Hα-derived masses. Without knowledge of the C IV blueshifts,the distribution of C IV- and Hα-dispersion-based BH masses couldbe taken to be reassuring. Including the C IV-blueshift information,however, demonstrates that any such interpretation is inherentlyflawed because the origin of the C IV emission velocity width isnot due to virial motions for a significant range of C IV blueshift.To reiterate the point made above (Section 6.1), we believe thatusing a greater knowledge of the line profile (i.e. both the FWHMand blueshift) is a better motivated (and more practical) approachto obtaining more reliable virial BH-mass estimates from the C IV
line.The number of objects in our sample is small but an important fac-
tor contributing to the significant correlation evident in the FWHMversion of Fig. 9 is a change in the emission-line shape of Hα asthe C IV blueshift increases. By comparing the distributions of theHα FWHM and dispersion as a function of C IV blueshift (shownin the right-hand panels of Fig. 7), there is trend for the Hα linesto become peakier (with FWHM/σ approaching unity) as the C IV
blueshift increases. Whether the size of the true systematic bias inBH masses inferred from C IV-emission FWHM is as large as shownin Fig. 9 will depend on the future parametrization of the reverber-ation component present in H β (and Hα) profiles for quasars withhigh luminosities and large C IV blueshifts.
In summary, Fig. 9 illustrates the extent to which key derivedphysical parameters, including the BH mass and L/LEdd, could besystematically in error when C IV-FWHM measures are used with-out incorporating the information from the C IV blueshifts. Other au-thors have proposed empirical corrections to C IV-based BH massesbased on similar systematic trends seen in the C IV line shape (Den-ney 2012) and the continuum-subtracted peak flux ratio of the UVemission-line blend of Si IV+O IV (at 1400 Å) to that of C IV (Run-noe et al. 2013b). In Section 7.1, we apply these corrections tothe quasars in our sample, and discuss the effect they have on thesystematic bias seen in Fig. 9.
6.5 Population trends with C IV blueshift
Even with the caveat regarding the small sample size, the differencesin the Hα emission profile as a function of C IV blueshift (Fig. 6)appear to be systematic. At C IV blueshift <1200 km s−1, the Hα
FWHM range is � 2700–8800 km s−1, with mean �5200 km s−1.However, amongst the six quasars with C IV blueshift >2000 km s−1,the mean Hα FWHM = 3000 km s−1, with a scatter of just200 km s−1. The apparent trend of peakier Hα-emission, withFWHM/σ close to unity, at large C IV blueshift is enhancedby the modest increase in Hα EW with blueshift (Table 3).Amongst the low-C IV blueshift population, there are, in addition,quasars with broader and more Gaussian-like Hα line profiles, withFWHM/σ � 2.
The change in the Hα emission-line profiles as a function of C IV
blueshift means that the Hα-FWHM derived BH masses at highblueshift are smaller than the sample mean. We transformed the ob-served luminosity into a mass-normalized accretion rate (Eddington
MNRAS 461, 647–665 (2016)

C IV emission-line properties 661
Figure 10. Hα-derived Eddington ratio versus C IV blueshift. At blueshift�2000 km s−1 , all quasars have high accretion rates (L/LEdd � 1). This isin agreement with Kratzer & Richards (2015), but in contrast to what onewould derive from naive use of C IV-based BH-mass scaling relations.
ratio). To convert the monochromatic luminosity, which is observedinto a bolometric luminosity, we use the bolometric correction fac-tor given by Richards et al. (2006b) (Lbol = 9.26L5100). Althoughthere is evidence that the bolometric correction factor is a functionof the luminosity, as well as of other parameters including the C IV
blueshift (Krawczyk et al. 2013), the differences are small over theparameter range covered by our sample, and for simplicity, we adopta constant factor.
The results, shown in Fig. 10, show that at large blueshiftsquasars, are accreting at around their Eddington limits (Fig. 10).The converse is, however, not true, i.e. not all quasars with highEddington ratios possess large C IV blueshifts (see Baskin & Laor2005).
7 D ISCUSSION
7.1 Biases in single-epoch C IV-based BH-mass estimates
The C IV line profiles of the quasars with the largest C IV blueshifts(in the bottom right of Fig. 1) demonstrate that non-virial motionsare having a significant effect on the C IV BLR dynamics. At fixedemission-line EW, almost the entire C IV profile appears to shiftblueward and the change in line shape is not simply an enhance-ment of flux in the blue wing of a symmetric component. It is clearthat the virial assumption, on which single-epoch BH-mass mea-surements are predicated, is not straightforwardly applicable for theC IV-emission line in quasars exhibiting large blueshifts.
Quantitatively, the C IV-shape change is most apparent from theFWHM values, which are strongly correlated with the C IV blueshift.This trend has previously been identified, by comparison with Mg II
at lower redshifts (Shen et al. 2008, 2011) and H β at higher redshifts(Shen & Liu 2012). We find that virial BH-mass estimates based onthe C IV FWHM will overestimate the true mass by a factor of ∼5for objects exhibiting the largest C IV blueshifts.
In contrast, the C IV line dispersion does not show a similarlystrong dependence on the blueshift. This is a result of the shape of theC IV line profile being dependent on the blueshift; the low-blueshiftprofiles are peakier (FWHM/σ � 1) than the high-blueshift profiles(FWHM/σ � 2). Denney (2012) found the level of contaminationin single-epoch spectra from non-reverberating gas to be correlatedwith the shape (FWHM/σ ) of the C IV profile. Their investigationwas based on a sample of reverberation-mapped quasars, whichhave a narrow range of C IV emission-line shapes, including theabsence of any objects with large C IV blueshifts. The FWHM/σ -
Figure 11. Comparison of BH-mass estimates derived from the FWHMof C IV and Hα as a function of the C IV blueshift (black circles), and afterapplying corrections to the C IV-derived mass based on the line shape (bluetriangles; Denney 2012) and the peak flux ratio of the Si IV+O IV blendrelative to C IV (red squares; Runnoe et al. 2013b). While the shape-basedcorrection improves the consistency between BH-mass estimates in the low-blueshift population, only the Si IV+O IV/C IV peak flux-based correction iseffective at high blueshifts (although a weak systematic remains).
based correction to the C IV FWHM proposed by Denney (2012)increases the inferred BH masses by ∼0.2 dex at the low end of ourC IV blueshift distribution, thereby reducing part of the systematictrend in the BH mass (Fig. 11). However, it is not applicable at thehigh C IV blueshift end, where velocity widths are likely dominatedby non-virial motions. Based on the typical line shape of C IV inthese high-blueshift quasars (FWHM/σ � 2), the Denney (2012)correction decreases the predicted BH masses by ∼0.3 dex, whichhas only a moderate decreasing effect on the strong systematic(Fig. 11).
While the C IV-line dispersion is largely independent of theblueshift, it does not follow that dispersion-based BH-mass esti-mates are correct, because the underlying assumption regardingthe virial origin of the C IV emission profile breaks down at largeblueshifts. Furthermore, given the difficulty in obtaining reliabledispersion measurements from survey-quality spectra with limitedS/N (e.g. Mejia-Restrepo et al. 2016), virial BH-mass estimates forexisting large samples of high-redshift quasars are usually basedon the FWHM (e.g. Shen et al. 2011). Our work therefore suggeststhat a viable recipe for obtaining more reliable BH-mass estimatesfor large numbers of quasars at high redshift is to measure both theFWHM and the blueshift, which together can be used to derive anFWHM corrected for the non-virial contribution.
Although we do not have enough quasars in our sample to derivea reliable quantitative correction to BH masses as a function of C IV
blueshift, we are assembling a large sample of quasar spectra withcoverage of both C IV and H β/Hα in order to empirically validatesuch a correction. Both Runnoe et al. (2013b) and Shen & Liu (2012)considered a similar approach, but concluded that a low-ionizationbroad line (e.g. Mg II), or features from the quasar NLR, are requiredto determine the systemic redshift and hence the C IV blueshift.Empirical tests of the reliability of the improved Hewett & Wild(2010) redshifts for the SDSS DR7 quasars (Shen 2016) and theavailability of the largely SED-independent principal componentanalysis redshifts for DR10 and DR12 (Paris et al. 2014, 2016)already allow meaningful corrections to BH-mass estimates forquasars exhibiting large C IV blueshifts. Our intention is, however,to determine a definitive correction formula using the redshifts fromAllen & Hewett (in preparation) for both DR7 and DR12.
MNRAS 461, 647–665 (2016)

662 L. Coatman et al.
Given the difficulty of measuring reliable C IV blueshifts, Runnoeet al. (2013b) opted instead to use the continuum-subtracted peakflux ratio of the UV emission-line blend of Si IV+O IV (at 1400 Å) tothat of C IV to correct for non-virial contributions to the C IV velocitywidth. This parameter was chosen because it showed the strongestcorrelation with the FWHM C IV/H β residuals, as well as with thestrengths of optical [O III] and Fe II. The strengths of optical [O III]and Fe II, being parameters in EV1, are also correlated with theC IV blueshift (Sulentic et al. 2007). As the C IV blueshift increases,the EW decreases systematically (Fig. 1). The Si IV+O IV emission-line blend, however, shows significantly less systematic variation.Therefore, while the Runnoe et al. (2013b) Si IV+O IV-based correc-tion is effective in practice, the C IV blueshift measurement providesa more direct measure of the non-virial contributions to the C IV ve-locity width.
In our sample, we find the 1400 Å/C IV peak flux ratio to bestrongly correlated to the C IV blueshift (the Spearman coefficientfor the correlation is 0.82, p-value 2E-5). As such, the correctionto C IV-based virial masses proposed by Runnoe et al. (2013b,their equation 3) removes a large part of the systematic in theHα/C IV FWHM residuals with the C IV blueshift (Fig. 11); the me-dian C IV/Hα FWHM ratio at large C IV blueshifts (>1200 km s−1)is reduced from 4.5 to 1.5. However, at low (<1200 km s−1) C IV
blueshifts, the trend for C IV to predict lower BH masses persists, andthe scatter between the C IV- and Hα-based masses increases by afactor of 2. In accordance with our expectations, we find the FWHMC IV/Hα residuals to be more tightly correlated to the C IV blueshift(Spearman coefficient 0.82, p-value 3E-5) than to the 1400 Å/C IV
peak flux ratio (Spearman coefficient 0.72, p-value 7E-4).
7.2 Possible systematic trends in Hα BH-mass estimates
In Section 6.5, we found that the quasars with large C IV blueshiftshave systematically narrower Hα FWHM (Fig. 7). Using the stan-dard virial BH-mass calibrations, this implies that the high C IV
blueshift population have high accretion rates (L/LEdd � 1; Fig. 10).This interpretation requires some caution since the emission-lineshape (characterized by the value of FWHM/σ ) of Hα is also chang-ing as a function of the C IV blueshift (Fig. 7). At low C IV blueshifts,there are a range of shapes, but all of the quasars exhibiting largeC IV blueshifts have peaky Hα profiles with FWHM/σ � 1. Thisraises the question of whether the Hα FWHM is a reliable proxyfor the virial-induced velocity dispersion for the full range of Hα
line shapes we have in our sample.When calibrating the virial product to masses derived indepen-
dently using the BH mass – stellar velocity dispersion (M�–σ ) rela-tion, Collin et al. (2006) find that the scaling factor, f, is a factor of ∼2larger for their Population ‘1’ sources (with FWHM/σ < 2.35 andessentially equivalent to population A of Sulentic and co-workersand to the high-blueshift quasars here) than for their Population 2(with FWHM/σ > 2.35). For single-epoch BH-mass estimates, as-suming a constant value of f, as is normally done (e.g. Vestergaard& Peterson 2006), means that Population 1 masses will be under-estimated and Population 2 will be overestimated. In the context ofthis result from Collin et al. (2006), our high-blueshift objects allpossess peaky Hα-lines and, while our quasar sample probes muchhigher luminosities and masses, the true BH masses may also beunderestimated. Adopting such an interpretation, the amplitude ofthe trend seen in Fig. 9 might not be so pronounced.
As mentioned in Section 1 and discussed in Richards et al.(2011), quasars with current reverberation-mapping measurementshave a restricted range of C IV-line shapes. There are currently
very few reverberation-mapping measurements of quasars withlarge C IV blueshifts but the results of the large ongoing statisticalreverberation-mapping projects (e.g. Shen et al. 2015) for luminousquasars at high redshift will go some way to establishing whetherthe quasar BLRs producing Balmer emission look the same forobjects with very different C IV-emission blueshifts.
Although the EV1-trends (Sulentic et al. 2000b; Shen & Ho 2014)are most likely driven by the accretion rate, orientation may alsohave a role to play in determining the observed properties of theBLR. Shen & Ho (2014) argue that a large part of the scatter ob-served in the H β FWHM relates not to a spread in BH masses, butrather to the orientation of the BLR relative to the line of sight. Forthis to be true, the BLR would need to be in a flattened disc-likegeometry, in which case the observed linewidth would increase withthe inclination of the disc relative to the line of sight. Brotherton,Singh & Runnoe (2015) found that the core-dominance of radio-loud quasars, which is believed to be a reliable proxy for orientation,at least in a statistical sense, is significantly correlated with the H β
FWHM and hence with the BH-mass estimates. This raises the ques-tion of whether the narrow Hα emission lines observed in the quasarswith the largest C IV blueshifts could be an orientation effect. How-ever, there is no evidence that the C IV blueshift is dependent on theorientation (inferred from the radio core-dominance; Richards et al.2011; Runnoe et al. 2014). Furthermore, Leighly (2004) showed thatthe He II λ1640 emission-line properties of quasars with large C IV
blueshifts are more consistent with differences in the SED ratherthan differences in the orientation. Collin et al. (2006) showed thatorientation effects were also sub-dominant to the Eddington ratioin determining the shape of the H β line and the Hα line shapetrend we observe is consistent with the finding of Marziani et al.(2003) that the H β emission profiles of high/low Eddington ratiolow-z quasars and type 1 Seyfert nuclei are well fit by Lorentzianand double Gaussian profiles, respectively. Overall, therefore ori-entation does not appear to be the dominant effect in determiningthe C IV blueshift and correlated changes in the Hα line profile.
7.3 Accretion-rate trends in the quasar population
The blueshifting of C IV is usually interpreted as evidence for strongoutflows resulting from the presence of a radiation-driven accretion-disc wind. Richards et al. (2002) found that quasars with large C IV
blueshifts have weak He II. This is evidence for weak soft X-raycontinuum emission (Leighly 2004), which would allow a strongline-driven wind to form. The strength of such a wind is predicted tobe related to the quasar far-UV SED, which, in turn, could be relatedto the mass-accretion rate. This picture is therefore consistent withour finding that the quasars with large C IV blueshifts have highaccretion rates.
All of the objects in our sample which exhibit large C IV blueshiftswould be classified as population A in the Sulentic et al. (2000a)scheme based on the Hα FWHM (see Section 1). Our results there-fore support the idea of the Sulentic et al. (2000a) A/B division beingdriven by the Eddington ratio, with population A sources possess-ing higher accretion rates. However, we also observe a number ofquasars which have high Eddington ratios but do not have line pro-files suggestive of strong outflows in the C IV BLR. This suggeststhat a high accretion rate is a necessary but not sufficient conditionfor the existence of outflows (Baskin & Laor 2005).
The two-dimensional nature of the C IV emission-lineparametrization and the apparent anticorrelation between C IV EWand C IV blueshift suggests that the quasar population exhibits acontinuum of properties. As such, more accurate C IV blueshift
MNRAS 461, 647–665 (2016)

C IV emission-line properties 663
measurements for SDSS quasars should allow an improved mappingbetween the C IV-emission properties and key physical parametersof the quasars. This includes improving our understanding of theorigin of quasars with exceptionally weak, blueshifted C IV emis-sion (weak emission-line quasars; Luo et al. 2015) which could beexotic versions of wind-dominated quasars (Plotkin et al. 2015).
7.4 The BAL parent population
Classical high-ionization BAL (HiBAL) quasars are also predomi-nantly population A objects in the scheme of Sulentic et al. (2000a).There are no HiBAL quasars in our sample by design (Section 2)but it is generally accepted that quasars which show high-ionizationBALs are likely to be radiating with relatively high L/LEdd (e.g.Zhang et al. 2014). We therefore propose that the subset of thequasar population that exhibits large C IV-emission blueshifts, withhigh-EW and narrow-Hα emission lines, may be directly related tothe HiBAL quasar population – perhaps even the ‘parent’ population(Richards 2006). A prediction of such a linkage is that near-infraredobservations of the rest-frame optical spectra of HiBAL quasars willshow strong, relatively narrow, Balmer emission lines, very similarto those of the quasars with high C IV blueshifts presented in thispaper (see Runnoe et al. 2013a, for such a study).
7.5 The frequency of quasars with high accretion rates
Quantifying the frequency of quasars producing outflows as afunction of key parameters, e.g. quasar luminosity, BH mass, red-shift,...will be important to constrain models of quasar-galaxy evo-lution. At fixed BH mass, the intrinsic and the observed fraction ofquasars exhibiting properties that depend on the Eddington ratio candiffer significantly. As an illustration, we consider the implicationsfor the intrinsic fraction of quasars possessing large C IV blueshiftsgiven the observed numbers in the mi < 19.1 flux-limited sub-sample of the SDSS DR7 quasar catalogue, from which our quasarsample is effectively drawn (Section 2). In order to estimate the sizeof the selection effect, we considered the detection probability for amuch-simplified quasar population. We assume that all quasars withC IV blueshifts >1200 km s−1have enhanced accretion rates relativeto the ‘normal’ population (with C IV blueshifts <1200 km s−1). Ifthe accretion rate of the high-blueshift population is double the rateof the low-blueshift population (which is true in an average sense– see Fig. 10), then the high-blueshift population will be brighterby �0.75 mag. Under the assumption that the BH-mass distributionis independent of the C IV blueshift, the high-blueshift populationwill then be overrepresented in a flux-limited sample. To estimatethe size of the bias, we need to know how many more quasars, atredshifts 2 < z < 2.5, there are with mi < 19.1 + 0.75 = 19.85relative to mi < 19.1. This is the fraction of the population which,as a consequence of having enhanced accretion rates, are boostedabove the survey flux limit. The main colour-selected SDSS DR7quasar catalogue extends only to mi = 19.1 and, assuming the lu-minosity function is continuous,10 we thus use the number countsat mi < 19.1 and mi < 18.35, which differ by a factor of � 4.
At redshifts 2 < z < 2.5, there are 3834 quasars with C IV
blueshifts <1200 km s−1and 2484 with blueshifts >1200 km s−1inthe SDSS DR7 mi < 19.1 quasar sample, a ratio of ∼2:1. The abovecalculation, although much idealized, suggests that the intrinsic
10 The luminosity function and number counts vary only smoothly (e.g. Rosset al. 2013) for the magnitude and redshift range used here.
fraction of high-blueshift quasars is a factor of 4 smaller than in theflux-limited sample (i.e. ∼15 per cent of the UV-selected non-BALquasar population).
8 C O N C L U S I O N S
We have presented an analysis of biases in C IV-derived virial BHmasses of high-luminosity (Lbol ∼ 47 erg s−1) quasars at red-shifts ∼2.5 from the SDSS. Many authors have reported a largescatter between C IV- and Hα/H β-based masses, and part of thisscatter has been shown to correlate with the C IV blueshift (Shen &Liu 2012). The blueshifting of C IV is usually interpreted as evidencefor strong outflows which, most likely, result from the presence ofa radiation line-driven accretion-disc wind. Our study is the firstto examine this bias systematically across the full range of C IV
emission-line blueshifts observed in the SDSS sample. In partic-ular, we have used rest-frame optical spectra of 19 quasars in theredshift range 2 < z < 2.7 to directly compare C IV and Hα emissionproperties as a function of the C IV blueshift. We reach the followingconclusions.
(i) A strong correlation between C IV velocity width and blueshiftis found and at large blueshifts, >2000 km s−1, the velocity widthsare dominated by non-virial motions. This suggests that the as-sumption that velocity widths arise from virial-induced motions, onwhich single-epoch BH-mass measurements are predicated, is notstraightforwardly applicable to these high-blueshift quasars.
(ii) We use the Hα emission line to provide BH-mass estimatesthat are unbiased by non-virial contributions to the velocity width.We find that the C IV-based BH masses of quasars with low C IV
blueshifts are systematically underestimated (by a factor of ∼1.7),whereas the masses of quasars with large blueshifts are severelyoverestimated (by a factor of ∼5).
(iii) We find a systematic change in the shape of the Hα lineprofile as a function of the C IV blueshift. Specifically, the Hα lineprofiles of the quasars with high C IV blueshifts are all ‘peaky’ withFWHM/σ close to unity.
(iv) We suggest that the high C IV blueshift quasars arehigh Eddington ratio objects that are inherently rare (compris-ing ∼15 per cent of the UV-selected sample), but are being boostedin number by a factor of ∼4 in the flux-limited SDSS sample.
With a relatively small sample of 19 quasars, we have been able touncover systematic trends in the C IV and Hα emission-line shapes asa function of the C IV blueshift. This confirms the prospect of devel-oping a blueshift-dependent correction to C IV-based single-epochBH-mass estimates using a larger samples of luminous quasarswith both rest-frame UV and rest-frame optical spectroscopy. Weare currently in the process of assembling such a sample, whichwill contain ∼300 luminous quasars, 80 per cent at redshifts z ≥2. A new SED-independent redshift-estimation algorithm (Allen &Hewett, in preparation) makes it possible to quantify the distribu-tion of C IV blueshifts in the observed quasar population as a whole,thereby allowing us to make empirical corrections to C IV-based BHmasses for all luminous, high-redshift SDSS/BOSS quasars.
AC K N OW L E D G E M E N T S
We thank the anonymous referee for a careful and constructivereport that resulted in significant improvements to the paper.
LC thanks the Science and Technology Facilities Council (STFC)for the award of a studentship. MB and PCH acknowledge support
MNRAS 461, 647–665 (2016)
664 L. Coatman et al.
from the STFC via a Consolidated Grant to the Institute of As-tronomy, Cambridge. MB acknowledges support from STFC via anErnest Rutherford Fellowship.
The paper is based on observations made with the 4.2 m WHToperated on the island of La Palma by the ING at the Observatoriodel Roque de los Muchachos of the Instituto de Astrofısica deCanarias.
Funding for the SDSS and SDSS-II has been provided by theAlfred P. Sloan Foundation, the Participating Institutions, the Na-tional Science Foundation, the US Department of Energy, theNational Aeronautics and Space Administration, the JapaneseMonbukagakusho, the Max Planck Society, and the Higher Ed-ucation Funding Council for England. The SDSS Web Site ishttp://www.sdss.org/.
The SDSS is managed by the Astrophysical Research Consor-tium for the Participating Institutions. The Participating Institu-tions are the American Museum of Natural History, AstrophysicalInstitute Potsdam, University of Basel, University of Cambridge,Case Western Reserve University, University of Chicago, DrexelUniversity, Fermilab, the Institute for Advanced Study, the JapanParticipation Group, Johns Hopkins University, the Joint Institutefor Nuclear Astrophysics, the Kavli Institute for Particle Astro-physics and Cosmology, the Korean Scientist Group, the ChineseAcademy of Sciences (LAMOST), Los Alamos National Labora-tory, the Max-Planck-Institute for Astronomy (MPIA), the Max-Planck-Institute for Astrophysics (MPA), New Mexico State Uni-versity, Ohio State University, University of Pittsburgh, Universityof Portsmouth, Princeton University, the United States Naval Ob-servatory, and the University of Washington.
R E F E R E N C E S
Allen J. T., Hewett P. C., Maddox N., Richards G. T., Belokurov V., 2011,MNRAS, 410, 860
Assef R. J. et al., 2011, ApJ, 742, 93Baskin A., Laor A., 2005, MNRAS, 356, 1029Bentz M. C. et al., 2009, ApJ, 705, 199Boroson T. A., Green R. F., 1992, ApJS, 80, 109Boyle B. J., Terlevich R. J., 1998, MNRAS, 293, L49Brandt W. N., Hasinger G., 2005, ARA&A, 43, 827Brotherton M. S., Singh V., Runnoe J., 2015, MNRAS, 454, 3864Brotherton M. S., Runnoe J. C., Shang Z., DiPompeo M. A., 2015, MNRAS,
451, 1290Cappellari M., Verolme E. K., van der Marel R. P., Verdoes Kleijn G. A.,
Illingworth G. D., Franx M., Carollo C. M., de Zeeuw P. T., 2002, ApJ,578, 787
Collin S., Kawaguchi T., Peterson B. M., Vestergaard M., 2006, A&A, 456,75
Dawson K. S. et al., 2013, AJ, 145, 10Denney K. D., 2012, ApJ, 759, 44Denney K. D. et al., 2010, ApJ, 721, 715Denney K. D., Pogge R. W., Assef R. J., Kochanek C. S., Peterson B. M.,
Vestergaard M., 2013, ApJ, 775, 60Everett J. E., 2005, ApJ, 631, 689Ferrarese L., Merritt D., 2000, ApJ, 539, L9Gallagher S. C., Everett J. E., Abado M. M., Keating S. K., 2015, MNRAS,
451, 2991Gaskell C. M., 1982, ApJ, 263, 79Gavignaud I. et al., 2008, A&A, 492, 637Gebhardt K. et al., 2000, ApJ, 539, L13Greene J. E., Ho L. C., 2005, ApJ, 630, 122Hewett P. C., Wild V., 2010, MNRAS, 405, 2302Higginbottom N., Proga D., 2015, ApJ, 807, 107Jarvis M. J., McLure R. J., 2006, MNRAS, 369, 182
Kaspi S., Smith P. S., Netzer H., Maoz D., Jannuzi B. T., Giveon U., 2000,ApJ, 533, 631
Kaspi S., Brandt W. N., Maoz D., Netzer H., Schneider D. P., Shemmer O.,2007, ApJ, 659, 997
Kelly B. C., Shen Y., 2013, ApJ, 764, 45Kelly B. C., Vestergaard M., Fan X., Hopkins P., Hernquist L., Siemigi-
nowska A., 2010, ApJ, 719, 1315King A., Pounds K., 2015, ARA&A, 53, 115King A. L. et al., 2015, MNRAS, 453, 1701Kollmeier J. A. et al., 2006, ApJ, 648, 128Konigl A., Kartje J. F., 1994, ApJ, 434, 446Kormendy J., Ho L. C., 2013, ARA&A, 51, 511Kratzer R. M., Richards G. T., 2015, AJ, 149, 61Krawczyk C. M., Richards G. T., Mehta S. S., Vogeley M. S., Gallagher
S. C., Leighly K. M., Ross N. P., Schneider D. P., 2013, ApJS, 206, 4Lawrence A. et al., 2007, MNRAS, 379, 1599Leighly K. M., 2004, ApJ, 611, 125Luo B. et al., 2015, ApJ, 805, 122McGill K. L., Woo J.-H., Treu T., Malkan M. A., 2008, ApJ, 673, 703McLure R. J., Jarvis M. J., 2002, MNRAS, 337, 109Maddox N., Hewett P. C., Peroux C., Nestor D. B., Wisotzki L., 2012,
MNRAS, 424, 2876Marziani P., Zamanov R. K., Sulentic J. W., Calvani M., 2003, MNRAS,
345, 1133Marziani P., Martınez Carballo M. A., Sulentic J. W., Del Olmo A., Stirpe
G. M., Dultzin D., 2016, Ap&SS, 361, 29Mejia-Restrepo J. E., Trakhtenbrot B., Lira P., Netzer H., Capellupo D. M.,
2016, MNRAS, 460, 187Murray N., Chiang J., Grossman S. A., Voit G. M., 1995, ApJ, 451, 498Onken C. A., Kollmeier J. A., 2008, ApJ, 689, L13Onken C. A., Peterson B. M., 2002, ApJ, 572, 746Paris I. et al., 2014, A&A, 563, A54Paris I. et al., 2016, A&A, in pressPark D., Woo J.-H., Denney K. D., Shin J., 2013, ApJ, 770, 87Peterson B. M., 1993, PASP, 105, 247Peterson B. M., 2010, in Peterson B. M., Somerville R. S., Storchi-Bergmann
T., eds, Proc. IAU Symp. 267, Co-Evolution of Central Black Holes andGalaxies. Kluwer, Dordrecht, p. 151
Peterson B. M., 2014, Space Sci. Rev., 183, 253Peterson B. M. et al., 2004, ApJ, 613, 682Plotkin R. M. et al., 2015, ApJ, 805, 123Proga D., Stone J. M., Kallman T. R., 2000, ApJ, 543, 686Rafiee A., Hall P. B., 2011, ApJS, 194, 42Richards G. T., 2006, preprint (arXiv:e-prints)Richards G. T., Vanden Berk D. E., Reichard T. A., Hall P. B., Schneider
D. P., SubbaRao M., Thakar A. R., York D. G., 2002, AJ, 124, 1Richards G. T. et al., 2006a, AJ, 131, 2766Richards G. T. et al., 2006b, ApJS, 166, 470Richards G. T. et al., 2011, AJ, 141, 167Ross N. P. et al., 2013, ApJ, 773, 14Runnoe J. C., Brotherton M. S., Shang Z., Wills B. J., DiPompeo M. A.,
2013a, MNRAS, 429, 135Runnoe J. C., Brotherton M. S., Shang Z., DiPompeo M. A., 2013b,
MNRAS, 434, 848Runnoe J. C., Brotherton M. S., DiPompeo M. A., Shang Z., 2014, MNRAS,
438, 3263Schneider D. P. et al., 2010, AJ, 139, 2360Shen Y., 2013, Bull. Astron. Soc. India, 41, 61Shen Y., 2016, ApJ, 817, 55Shen Y., Ho L. C., 2014, Nature, 513, 210Shen Y., Liu X., 2012, ApJ, 753, 125Shen Y., Greene J. E., Strauss M. A., Richards G. T., Schneider D. P., 2008,
ApJ, 680, 169Shen Y. et al., 2011, ApJS, 194, 45Shen Y. et al., 2015, ApJS, 216, 4Sulentic J. W., Marziani P., Dultzin-Hacyan D., 2000a, ARA&A, 38, 521Sulentic J. W., Zwitter T., Marziani P., Dultzin-Hacyan D., 2000b, ApJ, 536,
L5
MNRAS 461, 647–665 (2016)

C IV emission-line properties 665
Sulentic J. W., Repetto P., Stirpe G. M., Marziani P., Dultzin-Hacyan D.,Calvani M., 2006, A&A, 456, 929
Sulentic J. W., Bachev R., Marziani P., Negrete C. A., Dultzin D., 2007,ApJ, 666, 757
Tilton E. M., Shull J. M., 2013, ApJ, 774, 67Trakhtenbrot B., Netzer H., 2012, MNRAS, 427, 3081van der Marel R. P., Franx M., 1993, ApJ, 407, 525Vestergaard M., 2002, ApJ, 571, 733Vestergaard M., 2004, ApJ, 601, 676Vestergaard M., Osmer P. S., 2009, ApJ, 699, 800Vestergaard M., Peterson B. M., 2006, ApJ, 641, 689Vestergaard M., Fan X., Tremonti C. A., Osmer P. S., Richards G. T., 2008,
ApJ, 674, L1
Wang H., Xing F., Zhang K., Wang T., Zhou H., Zhang S., 2013, ApJ, 776,L15
Wang J.-G. et al., 2009, ApJ, 707, 1334Wu X.-B., Wang R., Kong M. Z., Liu F. K., Han J. L., 2004, A&A, 424, 793York D. G. et al., 2000, AJ, 120, 1579Zhang S., Wang H., Wang T., Xing F., Zhang K., Zhou H., Jiang P., 2014,
ApJ, 786, 42
This paper has been typeset from a TEX/LATEX file prepared by the author.
MNRAS 461, 647–665 (2016)


![Court of Appeal Judgment [2021] EWCA Civ 29 - Aceris Law](https://static.fdokumen.com/doc/165x107/631ec94625add517740b3564/court-of-appeal-judgment-2021-ewca-civ-29-aceris-law.jpg)