CIV emission-line properties and systematic trends in quasar ...
Upload
khangminh22Category
view
0download
0
Quasar
Quality-of-Service Architectures
Quality of Service Architectures
- Quasar -
Meilenstein 6: QUASAR QoS-Architektur
Projektabschluß mit Abschlußbericht
1
Authors:
Lars Burgstahler, Institut für Nachrichtenvermittlung und Datenverarbeitung (IND), Universität Stuttgart
Cemal Coemert FOKUS, Berlin
Paul Christ, Rechenzentrum Universität Stuttgart (RUS)
Hyung-Woo Kim, Rechenzentrum Universität Stuttgart (RUS)
Lutz Mark, FOKUS, Berlin
Jens Tiemann, FOKUS, Berlin
Rudolf Roth, FOKUS, Berlin
Carsten Schmoll, FOKUS, Berlin
Tanja Zseby, FOKUS, Berlin
2
Table of Contents
Executive Summary ................................................................................................................................ 5
1 Introduction................................................................................................................................... 7
2 QUASAR QoS Architecture ......................................................................................................... 8
2.1 QUASAR QoS Service Model....................................................................................................8
2.1.1 GÉANT Premium IP Service .............................................................................................9
2.1.2 Scavenger Service ............................................................................................................10
2.2 IP QoS monitoring system ........................................................................................................10
2.2.1 FOKUS IP QoS measurement system..............................................................................11
2.2.2 Deployment of the QoS monitoring System within the DFN G-WiN..............................13
3 QUASAR Architecture Demonstration ...................................................................................... 15
3.1 Overview of the Test Series ......................................................................................................15
3.2 Test environment.......................................................................................................................17
3.2.1 Motivation ........................................................................................................................17
3.2.2 Test bed overview.............................................................................................................17
3.2.3 Test components...............................................................................................................18
3.3 Router Configurations...............................................................................................................22
3.4 Measurement Results ................................................................................................................24
3.4.1 Bandwidth ........................................................................................................................24
3.4.2 One-Way-Delay................................................................................................................25
3.5 Evaluation of Results ................................................................................................................25
3.6 Recommendations for Future Work..........................................................................................26
4 QUASAR Simulation Experiments ............................................................................................ 28
4.1 Simulation Scenarios.................................................................................................................28
4.2 Simulation Results ....................................................................................................................31
4.2.1 Static Priority....................................................................................................................31
4.2.2 Self-clocked Fair Queuing................................................................................................35
3
4.3 Conclusions .............................................................................................................................. 41
4.4 Final Remarks .......................................................................................................................... 42
5 Conclusion .................................................................................................................................. 43
6 References................................................................................................................................... 45
7 Annex: Überblick über die QUASAR Arbeitsergebnisse ........................................................... 46
7.1 Projekt Meilensteine................................................................................................................. 46
7.2 Projekt Website ........................................................................................................................ 48
7.3 Vorträge und Berichte .............................................................................................................. 48
7.4 Veranstaltungen........................................................................................................................ 49
4
Executive Summary Dieser abschließende Meilenstein bietet einen zusammenfassenden Überblick über die im Projekt erzielten Ergebnisse und präsentiert die Resultate der in der letzten Phase des Projektes durchgeführten Versuchsreihen.
Das Ziel des Quasar Projektes ist die Entwicklung einer QoS Architektur für das G-WiN. Anforderungen an den QoS Ansatz waren die Berücksichtigung der speziellen Netztopologie und der im G-WiN zum Einsatz kommenden Technologien; es sollte eine schnelle Umsetzbarkeit in diesem vorgegebenen Rahmen möglich sein, und er sollte sich mittels eines vertretbaren zusätzlichen administrativen Aufwandes realisieren lassen. Darüber hinaus sollten die Vorschläge in Übereinstimmung mit der Vorgehensweise anderer europäischer Forschungsnetze und des pan-europäischen Backbones GEANT stehen.
In einer Studie wurde zunächst eine Bewertung der gegenwärtig zur Verfügung stehenden unterschiedliche QoS Ansätze anhand der aufgestellten Kriterien durchgeführt und davon ausgehend eine Auswahl passender Technologien erstellt. In Kooperation mit dem IST Projektes SEQUIN wurde daraufhin ein QoS-Architektur Ansatz entwickelt, der sich aus zwei Säulen zusammensetzt. Es wurde ein IP QoS Dienste-Modell spezifiziert und es wurden Vorschläge zu einer darauf abgestimmten QoS-Messinfrastruktur ausgearbeitet. Wesentliche Charakteristiken des gewählten QoS-Dienste-Modells sind eine pragmatische Herangehensweise, Anwendbarkeit in einer heterogenen Umgebung und Berücksichtigung der Anforderungen mehrfacher, von einander unabhängiger administrativer Netz-Domains.
Das QUASAR-Dienste-Modell verfügt über drei Dienstklassen. Neben dem Best-Effort Dienst werden die Klassen für einen Premium Dienst und einem Scavenger-Dienst eingeführt. Premium IP soll dem Nutzer einen QoS-Dienst ähnlich einer Mietleitung (leased line service) bieten, d.h. eine zugesicherte Bandbreite, geringe Verzögerungszeiten und vernachlässigbare Paketverlustraten. Mittels Scavenger Dienst sollen zeitweise ungenutzte Netzressourcen der anderen Dienstklassen elastischen Anwendungen nutzbar gemacht werden können ohne dass hier durch irgend welche merklichen Einbußen der Dienstqualität bei Anwendungen der anderen Klassen feststellbar sein sollen.
Zur Einführung von QoS in IP-basierten Netzen ist neben der unmittelbaren technologischen Unterstützung von QoS eine komplementäre QoS-Mess-Infrastruktur nötig, die dem Betreiber und dem Endnutzer aktuelle Informationen über die tatsächlich erbrachte QoS liefert. Erst mit dieser zusätzlichen Komponente ergibt sich eine vollständige QoS-Architektur.
Zur Untersuchung dieser Konzepte wurden Testreihen im experimentellen Versuchsaufbau durchgeführt. Dies umfasste sowohl weiträumige Feldversuche wie auch ergänzende Simulationsmodelle. Die erste Versuchsreihe fand in Kooperation mit dem IST Projektes SEQUIN statt. Ziel dieser Feldversuche war die Demonstration einer möglichen Implementierung des vorgeschlagenen Premium IP Dienstes innerhalb einer heterogenen europaweiten Netzumgebung. Die Einbeziehung des Scavenger Dienstes fand zu einem Zeitpunkt nach Ablauf des SEQUIN Projektes statt, so dass diese Versuche nur innerhalb des nationalen QUASAR Testbettes durchgeführt wurden. Zugleich wird in den Versuchsreihen eine geeignete Herangehensweise zur Messproblematik von IP QoS Diensten aufgezeigt.
Als wichtigste Projektergebnisse kann folgendes festgehalten werden. Mit Premium IP wurde der Nachweis erbracht, dass es möglich ist, mit der gegenwärtig installierten Router-Generation eine QoS Unterstützung für Nutzergruppen im europaweiten Umfeld über die europäischen Forschungsnetze zu realisieren. Premium IP basiert auf einem statischen Ansatz und kann innerhalb einer heterogenen Umgebung mittels unterschiedlicher Technologien realisiert werden. Dieser technischen Realisierbarkeit steht jedoch entgegen, dass der dazu nötige
5
Konfigurierungsaufwand sich relativ komplex gestaltet. Vor allem auf dem Gebiet der Fehlerlokalisierung zeigen sich bedeutend größere Anforderungen als im Vergleich zu einer einheitlichen homogenen ende-zu-ende Technologie wie z.B. ATM PVCs, so dass man zum gegenwärtigen Zeitpunkt ein Dienstangebot wie Premium IP hauptsächlich als Forschungsinstrument zu weitergehenden QoS Versuchen zu betrachten hat und weniger als ein breiteres Standard-Dienstangebot.
Aus den Erfahrungen, die in den praktischen Arbeiten gewonnen wurden, rücken vor allem Aspekte der Performance und QoS Validierung sowie deren Überwachung in den Vordergrund, die eine flexible Messinfrastruktur erfordern und nach verbesserter Unterstützung in der Konfiguration von Messaufgaben, der Datensammlung, -Auswertung und Präsentation verlangen.
Ende-zu-ende QoS ist ein komplexes Problem, bei dem in besonderem Maße die Interaktionen zwischen Endapplikation und Netz zu berücksichtigen ist. Zur Problembehandlung ist ein breites Know-how notwendig und es erfordert die engere Koordination unterschiedlicher Expertengruppen. Im Rahmen der Forschungsnetze wird daher die Einrichtung eines sogenannten Performance Response Teams angeregt, das es in Zukunft ermöglichen soll, eine zentrale Bündelung und Sammlung derartiger Expertise zu erreichen.
Als Empfehlung lassen sich aus den gewonnenen Ergebnissen die folgenden Punkte ableiten: Es ist wünschenswert, den Weg, der mit den dargestellten Premium IP Experimenten beschritten wurde, weiter zu verfolgen. Trotz intensiver Forschung auf dem Gebiet von IP QoS konnte in der Vergangenheit oft nur wenig für eine praktische Umsetzung erreicht werden. Mit der gegenwärtigen Generation von Kernnetzroutern ändert sich jedoch diese Situation, und QoS wird in der Praxis realisierbar. Wichtig ist es hier, Forschungsgruppen frühzeitig ein Experimentierfeld bereit zu stellen, dass weiträumige Versuchsaufbauten unterstützen kann. Der Frage der QoS-Messung wird in den Netzen der neuen Generation ein bedeutend größeres Gewicht beigelegt werden müssen. Wichtig sind auf diesem Gebiet weitere Forschungsarbeiten bezüglich Methodik und Herangehensweise, die Entwicklung von Standards und die Ausarbeitung von Best Practises für den geeigneten Einsatz dieser Technologien im Netzbetrieb. Mit der zunehmenden Komplexität und Heterogenität der Netzwerke und der Differenzierung von Netzdiensten steigen die Anforderungen an die Netzadministration und erzeugen einen erweiterten Bedarf an Schulung und Training. Bündelung von Expertise, verstärkte Kooperation und Informationsaustausch im europaweiten Umfeld fördern hier Synergien und effiziente Ressourcennutzung.
Der vorliegende Meilenstein gliedert sich wie folgt.
Nach einer kurzen Einleitung wird eine zusammenfassende Darstellung der im Projekt durchgeführten Untersuchungen und der wichtigsten erzielten Ergebnisse dargelegt. Dies umfasst einen Überblick über die QUASAR QoS Architektur und seines Dienste-Modells.
Im daran anschließenden Teil folgt eine detaillierte Beschreibung des Versuchsaufbaus der abschließenden Testreihe und eine Darstellung der hierbei erzielten Messergebnisse. Im QUASAR Netz wurden hierzu die drei Klassen Premium IP, Best Effort und Scavenger Service realisiert. Als Anwendungen wurde Video Conferencing für die Premium Klasse, Web-browsing als dominierende Anwendung für BE Verkehr und eine peer-to-peer Anwendung zum Download umfangreicher Files für die Scavenger Klasse gewählt. Das Versuchsszenario erlaubt den Einsatz und die Demonstration unterschiedlicher Messmethoden und Messwerkzeuge.
Mittels Simulation wurde untersucht, wie gemischter Echzeit- (UDP) und elastischer (TCP) Verkehr so behandelt werden, kann, dass auf der einen Seite die strengen Anforderungen des Echtzeitverkehrs gewahrt bleiben, auf der anderen Seite aber auch der elastische Verkehr keine unnötigen Nachteile erleidet. Es wurden hierbei verschiedene Pufferprinzipien untersucht, die mit unterschiedlichen Schedulingstrategien kombiniert wurden, und jedes der Szenarien wurde mit verschiedenen Overprovisioning-Faktoren durchgeführt.
6
1 Introduction This final deliverable presents the test trials that have been performed during the last project phase and provides a summary of results that have been achieved in the project.
The objective of the QUASAR project was the development of a QoS architecture suitable for the G-WiN. As requirements for the QoS solution is was necessary to take into account the particular network topology and the deployed technologies. The proposal should be deployable in the short-term timeframe and the demand on required management effort should remain limited. In addition it was necessary to harmonize these approaches on a European level and to develop them in coordination with other European research networks and the pan-European backbone GÉANT.
The derived QUASAR QoS service model comprises three service classes. Besides the Best Effort service it introduces the classes of a Premium IP service and Scavenger, an LBE (less than best effort) service class. Premium IP offers service that is comparable to a leased line providing a guaranteed bandwidth, low delay and low delay variation, and negligible packet losses, as long as a user limits the traffic to the contracted bandwidth. Scavenger Service allows users and applications to take advantage of otherwise unused bandwidth in a manner that will not intrusively affect performance of the default best-effort class of service.
The proposed service model has been implemented in the QUASAR and IST SEQUIN testbed. The viability of the proposed Premium IP model could be demonstrated in these trials; and for the first time, it was possible to test a Diffserv based approach to IP QoS in production networks, on a wide area scale.
This milestone is organised as follows:
A summary of the QUASAR architecture is presented. The subsequent chapter then gives a detailed description of the trials performed during the final project phase and discusses the measurement results that had been received. In the QUASAR testbed three service classes have been configured for Premium IP, Best Effort and Scavenger. Suitable application for each service class have been selected for each class being video conferencing for Premium IP, web-browsing for BE and high-volume file transfer for the Scavenger class. Measurement tools were deployed that captured the QoS parameters for each class and could validate the expected behaviour under high traffic load. In addition to testbed experiments, simulations have been performed that compared two service differentiating approaches for real-time and non-real time traffic.
7
2 QUASAR QoS Architecture The QUASAR project has as objective the definition of a QoS architecture for the G-WiN. A pragmatic approach was adopted in QUASAR that concentrated on capabilities that are readily available on today’s routers. The target solution must match the concrete realities of the research network environment and should respect the requirements of its user community. There is a variety of different technologies that are deployed at different parts of the network and especially that there is a need to interoperate with legacy technologies like ATM. The solution must respect the distributed nature of networking with its division into autonomous administrative domains and there is needed consensus and concertation at the European level of NRENs.
The QUASAR QoS Architecture comprises two main parts: a QoS service model which proposes a set of QoS services that can be offered to network customers. This is complemented by a QoS Measuring platform, which allows to monitor the network performance and to ensure that the assured service quality level is actually met.
2.1 QUASAR QoS Service Model The QUASAR QoS Service Model builds on the Diffserv architectural model. It is assumed that the network distinguishes between a small set of service classes where the service class is indicated in the IP packet header by carrying a certain value in the DSCP header field.
The QoS service model selected for QUASAR reflects the work that has been performed in cooperation on the European level within the IST SEQUIN and the QoS working group of TF-NGN. It proposes three service classes:
• GÉANT Premium IP Service
• Default Best Effort Service
• Scavenger Service
The Premium IP Service in QUASAR is based on the service defined by the GÉANT / SEQUIN consortia. A detailed discussion of Premium IP has been presented in QUASAR M3 and M5.
Service testing presented in this final deliverable has been extended to include also Scavenger Service beside Premium IP and best effort service. The experiments investigate the interplay between all three service classes of Premium, default Best Effort and Scavenger service packets.
QoS monitoring is seen as an integral aspect of high quality service networks. The first step to providing a high quality service is to have a monitoring framework at hand that closely monitors performance and is able to detect and localize degradations at an early stage. Only with this information it becomes possible to respond to detected degradations or potential risks of degradations and to invoke countermeasures that prevent or relieve network congestion. Such a QoS monitoring platform must be flexibly configurable in measurement granularity and measured metrics according to the specific needs of different traffic classes and aggregations.
8
2.1.1 GÉANT Premium IP Service GÉANT Premium IP is realised on the principles of the Diffserv architecture. Diffserv achieves high scalability through aggregation of traffic flows and allows different service classes identified by the Diffserv Code Point (DSCP) value stored in the IP packet header. Packet processing at core nodes and allocation of resources no longer distinguishes micro-flows, but it is based on the packet marking only. For a class-based differentiated forwarding, adequate queuing and scheduling disciplines have to be configured on the routers. Guaranteeing QoS characteristics for some traffic classes requires that certain functions are performed at the domain boundaries in order to control the influx of network traffic, such as traffic shaping, admission control and policing.
The GÉANT Premium IP architecture implementation [SQ-D2.1.1] specifies additions and extensions to the single domain Diffserv standard, to provide an end-to-end service that crosses multiple administrative domains.
• the interface specification between different domains mandates that the inter domain hop behaves according to the EF PHB
• only a small fraction of the total core link capacity is assigned to Premium IP, between 5 and 10 %. This ensures that there is no adverse impact on other traffic classes. For parts in the network where there is less available capacity other technologies have to be chosen to separate traffic, e.g. to assign Premium traffic to dedicated links or ATM PVCs.
• the service will be destination aware, mandating the knowledge of the source and destination addresses in the provisioning phase
The design of Premium IP is targeted towards the particular GÉANT environment and the connected NRENs, whose core topology and deployed technology is comparable in its structure and complexity.
The Premium IP service is based on uni-directional flows and there exists a maximum sending rate that a user is allowed to use. The service model demands a predetermined pair of source and destination IP prefixes following a point-to-point model comparable to ATM-based services like MBS. It does not support a destination unaware scheme that would specify only a maximum access rate, while leaving the actual destination unspecified and allowing the user to freely send to any receiver. The choice of a destination unaware service was dismissed, as it would require too high over-provisioning or might lead to risks of contract violations due to congestion.
The service specification documents [GEA-D9.1] [SQ-D2.1] [SQ-D2.1.1] define the rules apply for the functions of shaping, admission control and policing at the ingress node to a Premium IP domain.
Routers are required to forward Premium IP packets with minimal delay and delay variation. For the contracted Premium IP traffic volumes there must not be any packet loss due to queue overflow. Policing at the ingress points and the choice of a destination-aware service model ensure that the total volume of Premium traffic remains bounded at any time at any nodes along the path. Only a small fraction of the core link capacity is devoted to the Premium IP service. Due to careful planning, the load of Premium packets will never cause starving of other traffic classes.
Preferential treatment of Premium IP packets is realised by allocation of a separate hardware-processing queue. Today’s routers support various scheduling mechanisms that may be used for the implementation of Premium IP assigning in any case the highest priority to Premium traffic. For example:
9
• Strict priority queuing
• Weighted Fair Queuing
• Modified Deficit Round Robin in strict or alternate priority mode
Local lab experiments had been performed to validate those QoS mechanisms under heavy load conditions for high-end router types that have been deployed in GÉANT and the core network of the larger European NRENs. Experiments for rate limiting, packet marking, scheduling mechanisms and congestion control have been performed and a correct behavior could be observed. A summary and evaluation of those results is included in [SQ-D5.1].
2.1.2 Scavenger Service QBONE Scavenger Service [QBSS] allows to let users and applications take advantage of otherwise unused bandwidth in a manner that will not intrusively affect performance of the default best-effort class of service. Migrating a substantial share of applications to Scavenger Service usage helps to improve the quality experienced by applications of the default best-effort class.
QBONE Scavenger Service (QBSS) is realized as an additional class of best-effort service. A small amount of network capacity is allocated. As long as there is under-utilised default best-effort capacity, QBSS is allowed to expand its link share and can consume this unused capacity. The small amount of dedicated capacity ensures that the service is not totally starved during congestion periods. Therefore, long-lived TCP flows will not break, even if there is congestion for a prolonged time, though there may not be much progress for those connections.
QBSS marking may be performed by the end hosts or by edge routers on behalf of end hosts.
Applications that are relatively tolerant of greater loss, delay, and jitter are candidates for marking their traffic for QBSS. Marking traffic for QBSS can be thought of as roughly analogous to the Unix notion of assigning a positive "nice" value to a process.
It is anticipated that the following types of applications might utilize QBSS:
New types of distributed applications that attempt to use idle network capacity in the same manner distributed computations applications make use of users' idle CPU cycles
•
•
•
Bulk data transfers using TCP or employing a TCP-friendly congestion avoidance algorithm
Non-time-critical traffic, such as multimedia peer-to-peer applications, anonymous FTP, HTTP when used to distribute large files, network backups, etc.
Today such applications are often forced to be run outside of regular office hours in order not to aversively interfere with regular business operations. In an international context however it may be difficult to exactly identify the low utilization times to minimize interference. With the QBSS service class at hand, however, such applications can be safely started at any time and they will perform in the background without obstructing the ordinary user.
2.2 IP QoS monitoring system The main task of the IP QoS monitoring system is to verify network quality. This can be done via active tests or via passive monitoring. The measurements have to be done at different locations. This implies that the system is distributed over the network. To ease the administration, the control of the measurements and the collection of the measurement results can be done from a central location.
10
Active and passive measurements
The measurements are performed from two kinds of test servers. Active test servers are able to generate and to receive test traffic. They are able to handle higher protocols like TCP. Passive network probes do not transmit any traffic. They are connected to taps or splitting boxes at special network locations (e.g. at the access routers).
The Quasar project has made no effort in developing active test servers because there is already a fine implementation available: The RIPE test boxes [RIPETTM] can active measure IP network performance.
The passive IP QoS monitoring is done via the IP QoS measurement system of Fraunhofer FOKUS [FOKUSIMP], which has been enhanced for this project.
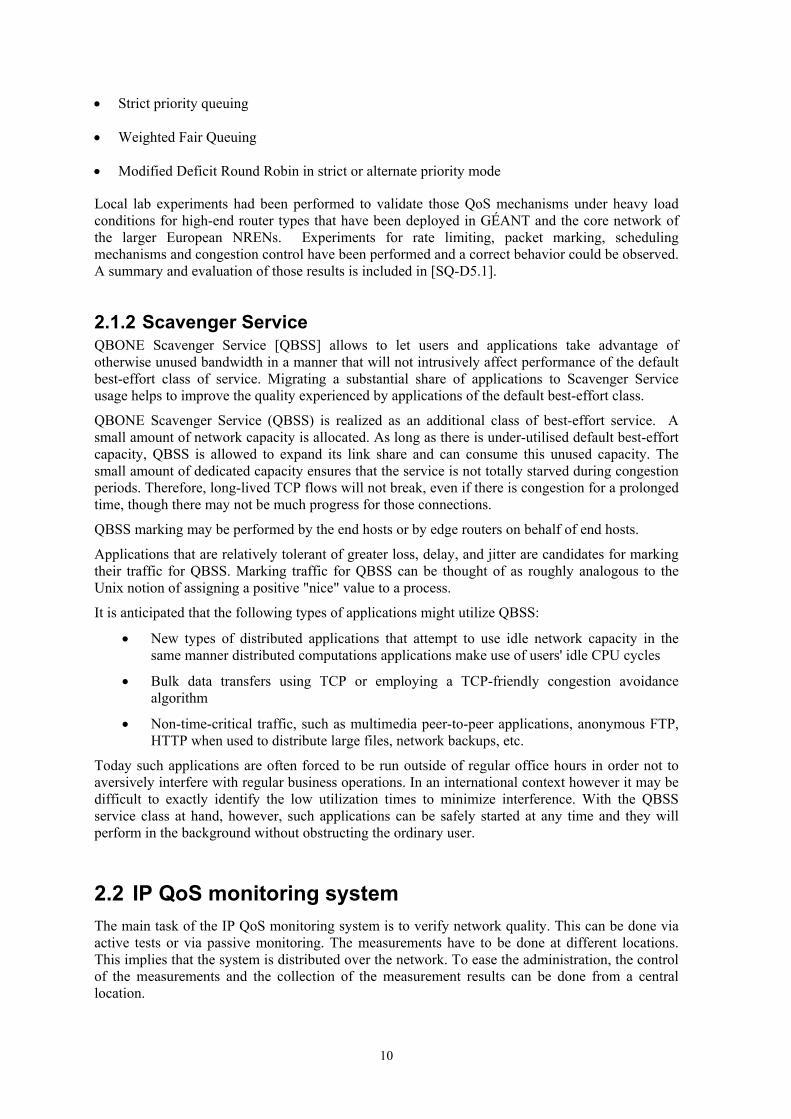
2.2.1 FOKUS IP QoS measurement system The FOKUS IP QoS Measurement System has been designed for distributed IP traffic and quality of service measurements. It supports measurements of traffic volume, one-way-delay, jitter and packet loss.
Eval
u atio
n C o
mpo
n en t
s
Activ
e M
eter
Com
pone
nts
Pass
ive
Met
er C
ompo
nent
s
IP Meter
MeterController
Measurement Control Unit
Hi SpeedMeter
MeterController
Collector
MeterController
QoS Ev aluation
MeterController
LightWeightMeter
MeterController
MeterAPI ov er ControlComm
openSSL
Activ eMeter
MeterController
Sy stem Control
Result Data
MeasurementData
Sy stemManagement
Graphical UserInterf ace
Figure 2.2-1: QoS Measurement Platform - Components
The measurement system consists of the following components (refer to Figure 2.2-1):
• Passive meters are connected to network tabs or optical splitting boxes at special network locations (e.g. at access routers). Passive meters filter incoming traffic and perform special operations like packet counting or packet id generation on the captured flows. Passive meters do not transmit any test traffic. For precise one-way-delay measurements the local clocks of the measurement servers have to be synchronized to a common clock.
• The data collector requests the measurement result data from the distributed meters and stores it in the measurement results database.
11

• The evaluation server calculates IP QoS metrics like one-way-delay, jitter and packet loss.
• A central measurement control unit is used for meter management and to execute complex measurement tasks.
Each component can be accessed via a common control interface, which offers a text based command line interpreter. The measurement tasks are generated on the central measurement controller and downloaded to the distributed test servers. After the completion of a measurement the results are collected from a central collector process, which maybe do some post processing and inserts the measurement data into the central database.
For an easy administration of the IP QoS monitoring system the configuration of the measurement tasks and the display of the measurement results and the current network status can be done via standard web browsers and calling special pages on the central control server.
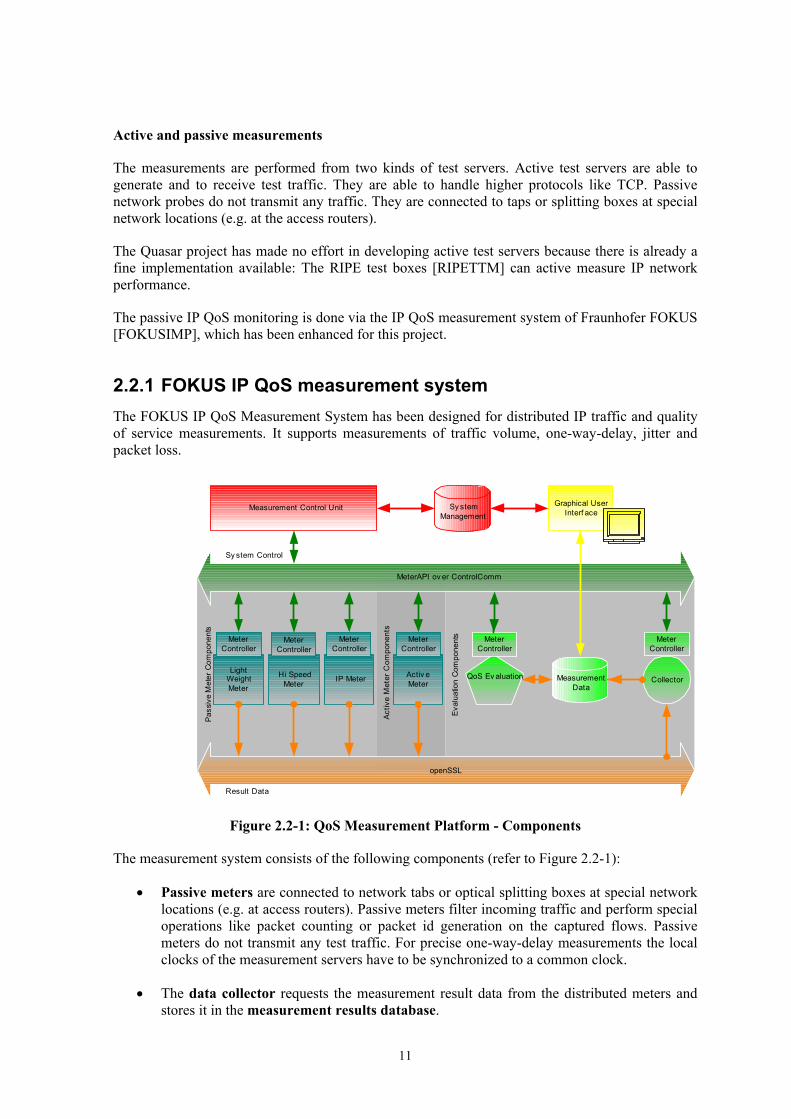
As an example how measurement results are presented Figure 2.2-2 shows the result of a passive One-Way-Delay measurement with two passive probes involved.
Starting from top of the figure, one can see information about the measurement task – its ID and name. The user can select just a certain time interval from the entire measurement in order to have a closer look onto the data. Since we were interested to behold the behaviour of flows with different Diffserv Code Point (DSCP) the examined traffic has been split into flows that are distinguished by the contents of their ToS field – in Figure 2.2-2 we have three different flows. Furthermore the representation accounts for ToS combination on both measurement points as ToS fields could have been changed.
12
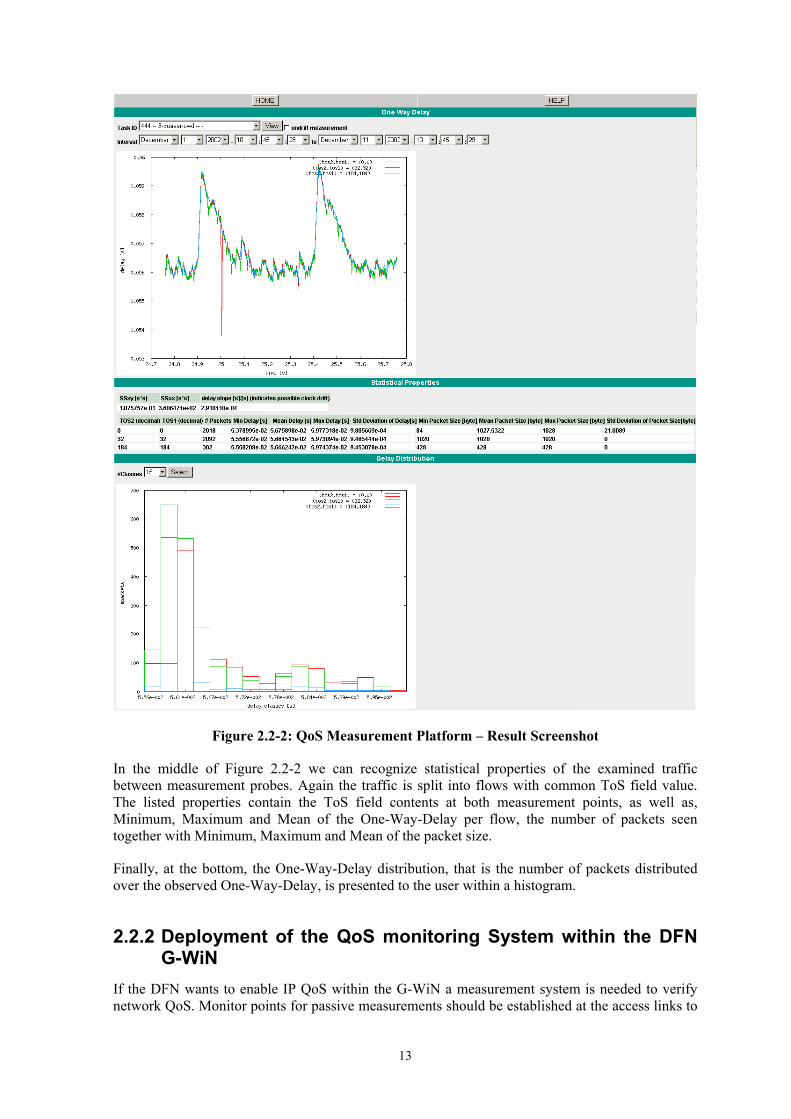
Figure 2.2-2: QoS Measurement Platform – Result Screenshot
In the middle of Figure 2.2-2 we can recognize statistical properties of the examined traffic between measurement probes. Again the traffic is split into flows with common ToS field value. The listed properties contain the ToS field contents at both measurement points, as well as, Minimum, Maximum and Mean of the One-Way-Delay per flow, the number of packets seen together with Minimum, Maximum and Mean of the packet size.
Finally, at the bottom, the One-Way-Delay distribution, that is the number of packets distributed over the observed One-Way-Delay, is presented to the user within a histogram.
2.2.2 Deployment of the QoS monitoring System within the DFN G-WiN
If the DFN wants to enable IP QoS within the G-WiN a measurement system is needed to verify network QoS. Monitor points for passive measurements should be established at the access links to
13

the connected institutes and at the gateways to foreign networks. Active test servers should be installed at dedicated locations within the G-WiN (e.g. at the locations of L2 routers). The measurement controller with the measurement result database and the related web server can be installed at an arbitrary location.
Figure 2.2-3: Example to deploy the monitor system within the G-WiN
The Figure 2.2-3 shows exemplarily the deployment of the QoS measurement system within the G-WiN. The test servers are located at the locations of the L1 or L2 Routers of the Core of the G-WiN. There is additional traffic to control the distributed servers and there is a small amount of traffic between the active test servers.
This section will give an overview about the implemented test environment. The main part of the test environment will be the distributed test network spanned over the three locations of the project partners. This network will be supplemented with special test components.
14
3 QUASAR Architecture Demonstration
3.1 Overview of the Test Series For the final QUASAR test series, the QUASAR service model had been realized on the QUASAR testbed. The three service classes of Premium IP, BE and Scavenger have been implemented on the routers and representative applications were selected for each service class.
The following figures show the bandwidth that typical user applications generate.
Figure 3.1-1: Video Conference
15
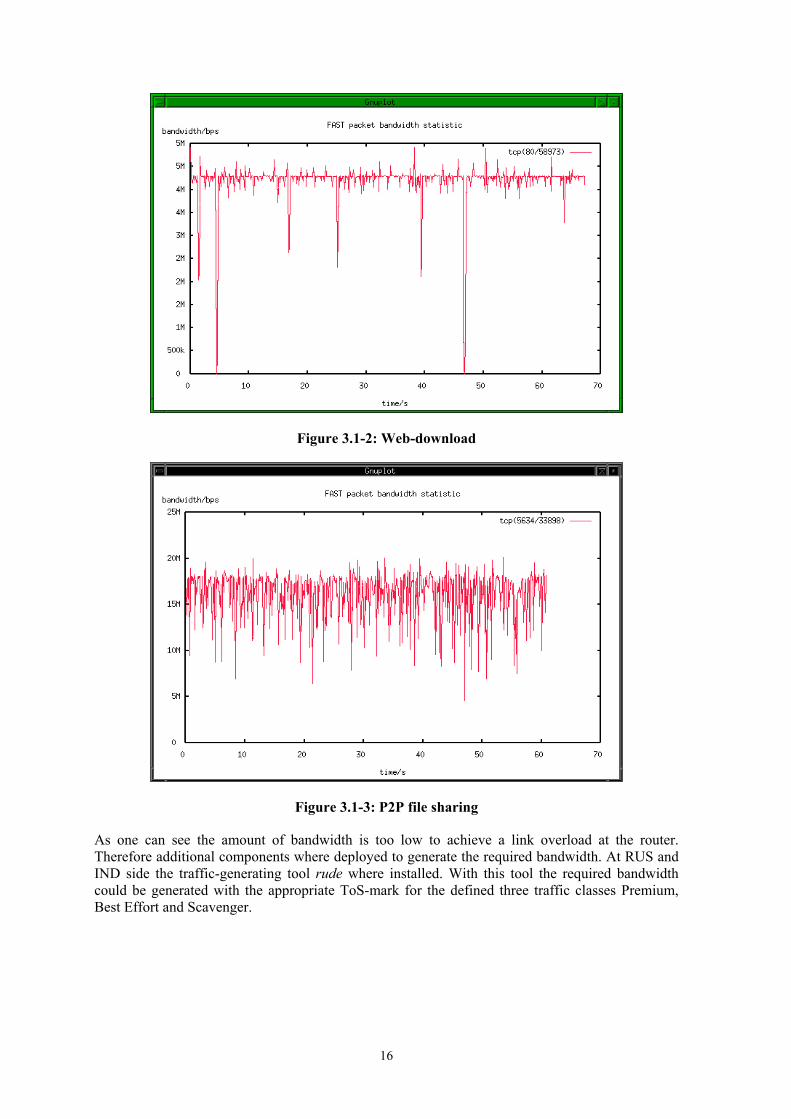
Figure 3.1-2: Web-download
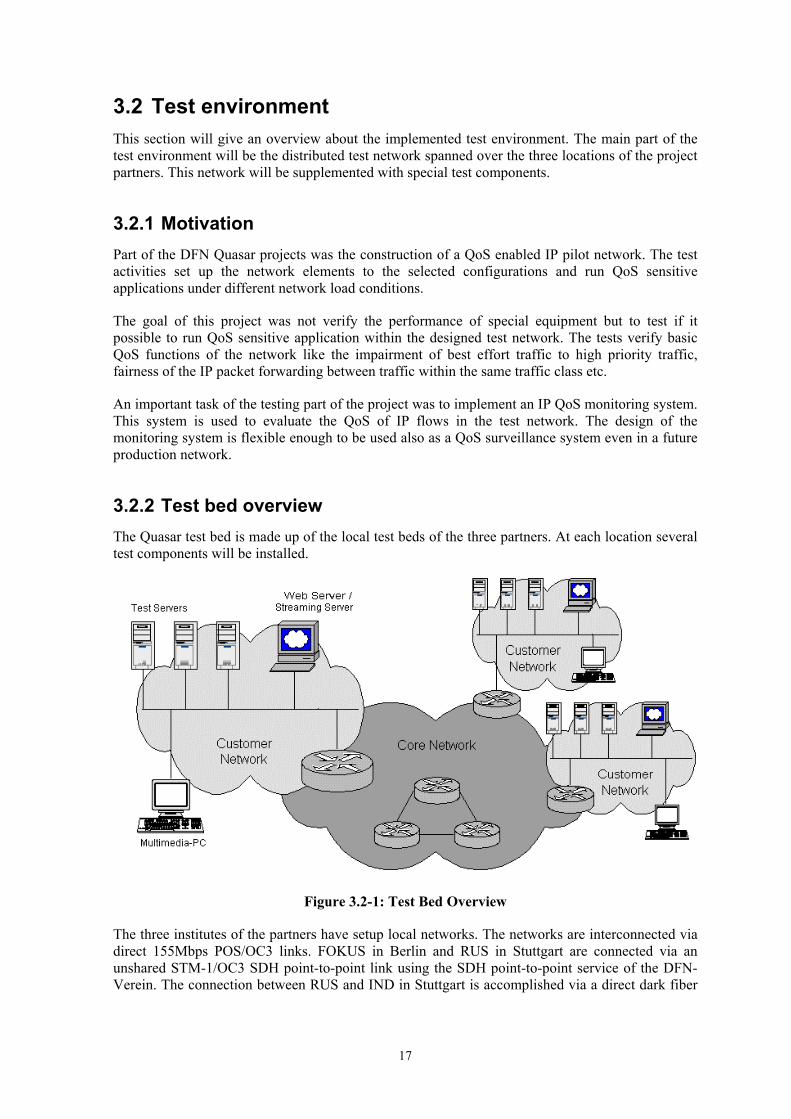
Figure 3.1-3: P2P file sharing
As one can see the amount of bandwidth is too low to achieve a link overload at the router. Therefore additional components where deployed to generate the required bandwidth. At RUS and IND side the traffic-generating tool rude where installed. With this tool the required bandwidth could be generated with the appropriate ToS-mark for the defined three traffic classes Premium, Best Effort and Scavenger.
16
3.2 Test environment This section will give an overview about the implemented test environment. The main part of the test environment will be the distributed test network spanned over the three locations of the project partners. This network will be supplemented with special test components.
3.2.1 Motivation Part of the DFN Quasar projects was the construction of a QoS enabled IP pilot network. The test activities set up the network elements to the selected configurations and run QoS sensitive applications under different network load conditions.
The goal of this project was not verify the performance of special equipment but to test if it possible to run QoS sensitive application within the designed test network. The tests verify basic QoS functions of the network like the impairment of best effort traffic to high priority traffic, fairness of the IP packet forwarding between traffic within the same traffic class etc.
An important task of the testing part of the project was to implement an IP QoS monitoring system. This system is used to evaluate the QoS of IP flows in the test network. The design of the monitoring system is flexible enough to be used also as a QoS surveillance system even in a future production network.
3.2.2 Test bed overview The Quasar test bed is made up of the local test beds of the three partners. At each location several test components will be installed.
Figure 3.2-1: Test Bed Overview
The three institutes of the partners have setup local networks. The networks are interconnected via direct 155Mbps POS/OC3 links. FOKUS in Berlin and RUS in Stuttgart are connected via an unshared STM-1/OC3 SDH point-to-point link using the SDH point-to-point service of the DFN-Verein. The connection between RUS and IND in Stuttgart is accomplished via a direct dark fiber
17
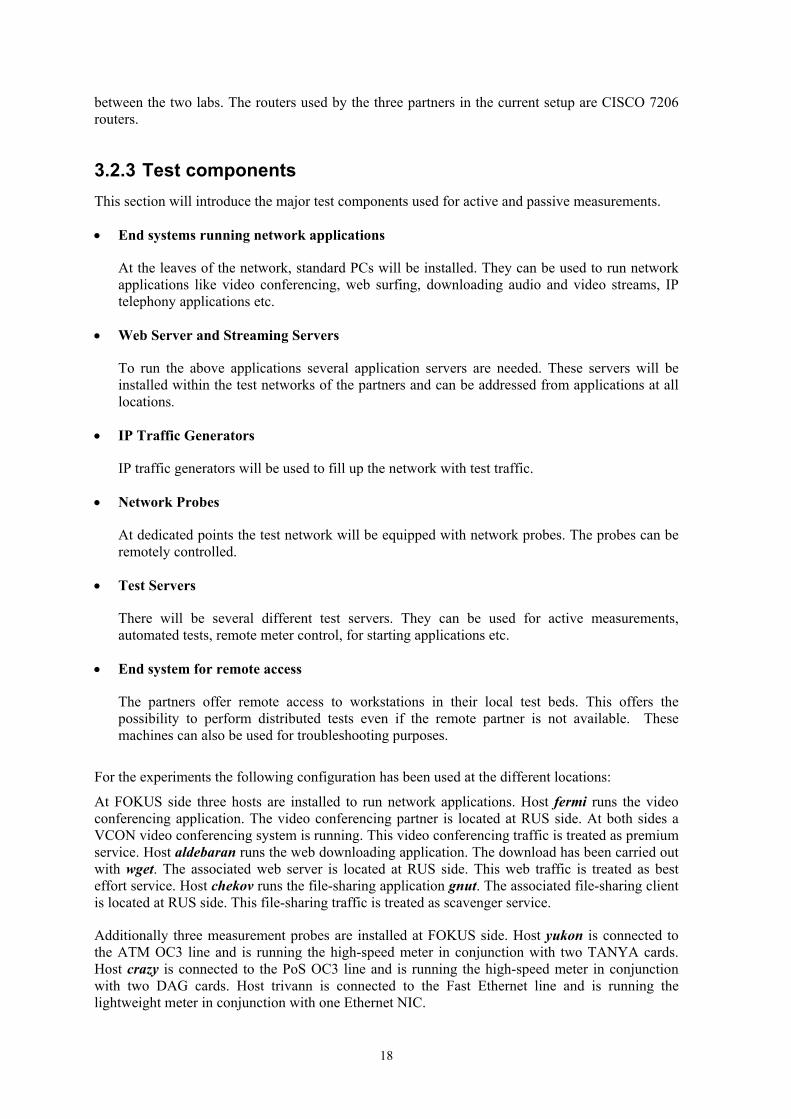
between the two labs. The routers used by the three partners in the current setup are CISCO 7206 routers.
3.2.3 Test components This section will introduce the major test components used for active and passive measurements.
• End systems running network applications
At the leaves of the network, standard PCs will be installed. They can be used to run network applications like video conferencing, web surfing, downloading audio and video streams, IP telephony applications etc.
• Web Server and Streaming Servers
To run the above applications several application servers are needed. These servers will be installed within the test networks of the partners and can be addressed from applications at all locations.
• IP Traffic Generators
IP traffic generators will be used to fill up the network with test traffic.
• Network Probes
At dedicated points the test network will be equipped with network probes. The probes can be remotely controlled.
• Test Servers
There will be several different test servers. They can be used for active measurements, automated tests, remote meter control, for starting applications etc.
• End system for remote access
The partners offer remote access to workstations in their local test beds. This offers the possibility to perform distributed tests even if the remote partner is not available. These machines can also be used for troubleshooting purposes.
For the experiments the following configuration has been used at the different locations:
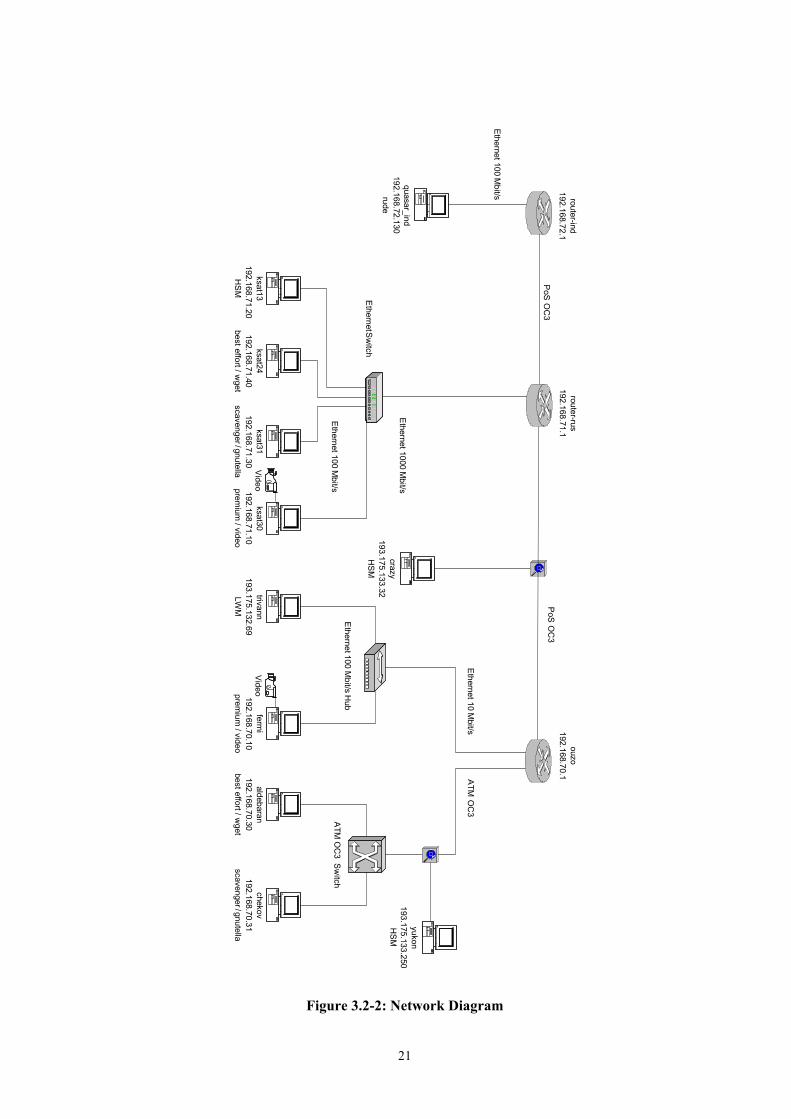
At FOKUS side three hosts are installed to run network applications. Host fermi runs the video conferencing application. The video conferencing partner is located at RUS side. At both sides a VCON video conferencing system is running. This video conferencing traffic is treated as premium service. Host aldebaran runs the web downloading application. The download has been carried out with wget. The associated web server is located at RUS side. This web traffic is treated as best effort service. Host chekov runs the file-sharing application gnut. The associated file-sharing client is located at RUS side. This file-sharing traffic is treated as scavenger service.
Additionally three measurement probes are installed at FOKUS side. Host yukon is connected to the ATM OC3 line and is running the high-speed meter in conjunction with two TANYA cards. Host crazy is connected to the PoS OC3 line and is running the high-speed meter in conjunction with two DAG cards. Host trivann is connected to the Fast Ethernet line and is running the lightweight meter in conjunction with one Ethernet NIC.
18
At RUS side three hosts are installed to run network applications. Host ksat30 runs the video conferencing application. This video conferencing traffic is treated as premium service. Host ksat24 runs the web server application. This web server traffic is treated as best effort service. Host ksat31 runs the file-sharing application gnut. This file-sharing traffic is treated as scavenger service.
Additionally a measurement probe is installed at RUS side. Host ksat13 is connected to the Fast Ethernet line and is running the high-speed meter in conjunction with one Ethernet NIC.
At IND side one host is installed as IP traffic generator. The program RUDE/CRUDE is used to fill up the network with test traffic and to provoke overload. RUDE/CRUDE provides the possibility to mark the generated traffic as premium, best effort or scavenger service.
A detailed test bed view is depicted in Figure 3.2-2 on the following page.
Before we start testing we must be sure that the packets are marked in the manner as described in the router configuration section. For this purpose we send echo request to the involved hosts and observe their echo reply on the PoS link using two DAG3.5 cards.
The following extracts show the output of tcpdump.
Packets marked by the RUS border router (192.168.71.1):
• 192.168.71.10 > 192.168.70.31: icmp: echo reply (DF) [tos 0xb8]
The host 192.168.70.31 (crazy) sends echo requests to the host 192.168.71.10 (ksat30). As expected the echo reply packets are marked as Premium IP (tos 0xb8). This is in contrast to the ToS-value described in the router configuration section, which states ToS-value decimal 46 (0x2E, 0010 1110) as Premium IP. These different values arise from the fact that only the first six bits are used in the router. This is also true for the other ToS-values.
• 192.168.71.30 > 192.168.70.31: icmp: echo reply [tos 0x20]
The host 192.168.70.31 (crazy) sends echo requests to the host 192.168.71.30 (ksat31). As expected the echo reply is marked as scavenger service
• 192.168.71.40 > 192.168.70.31: icmp: echo reply [tos 0x20]
Although the router is configured to mark the traffic of the host ksat24 as best effort the echo reply is instead marked as scavenger service. This seems to be a feature of the ping program. The echo reply packets have the same ToS field as the echo request packets.
Packets marked by the FOKUS border router (192.168.70.1):
• 192.168.70.10 > 192.168.71.30: icmp: echo reply [tos 0xb8]
The host 192.168.71.30 (ksat31) sends echo requests to the host 192.168.70.10 (fermi). As expected the echo reply packets are marked as Premium IP.
• 192.168.70.31 > 192.168.71.30: icmp: echo reply (DF) [tos 0x20]
The host 192.168.71.30 (ksat31) sends echo requests to the host 192.168.70.31 (chekov). As expected the echo reply is marked as scavenger service.
19
• 192.168.70.30 > 192.168.71.30: icmp: echo reply (DF) [tos 0x20]
The host 192.168.71.30 (ksat31) sends echo requests to the host 192.168.70.30 (aldebaran). As above the packets are marked wrongly as scavenger service.
20
yukon193.175.133.250
HS
M
chekov192.168.70.31
scavenger / gnutella
fermi
192.168.70.10prem
ium / video
aldebaran192.168.70.30
best effort / wget
trivann193.175.132.69
LWM
ATM
OC
3 Sw
itchE
thernet 100 Mbit/s H
ub
ATM
OC
3E
thernet 10 Mbit/s
PoS
OC
3
ouzo192.168.70.1
Ethernet S
witch
Ethernet 100 M
bit/s
Ethernet 1000 M
bit/s
router-rus192.168.71.1
ksat30192.168.71.10
premium
/ video
ksat31192.168.71.30
scavenger / gnutella
ksat24192.168.71.40
best effort / wget
ksat13 192.168.71.20
HS
M
quasar_ind192.168.72.130
rude
PoS
OC
3
router-ind192.168.72.1
Video
Video
Ethernet 100 M
bit/s
crazy193.175.133.32
HS
M
Figure 3.2-2: Network Diagram
21
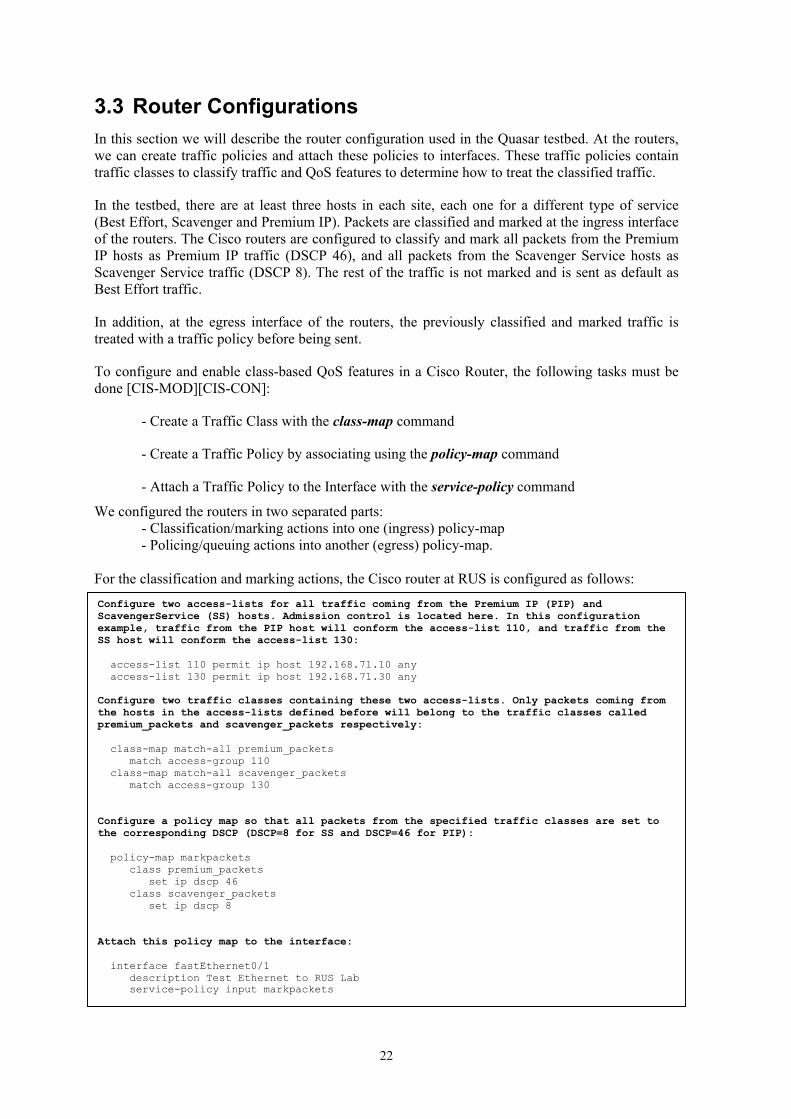
3.3 Router Configurations In this section we will describe the router configuration used in the Quasar testbed. At the routers, we can create traffic policies and attach these policies to interfaces. These traffic policies contain traffic classes to classify traffic and QoS features to determine how to treat the classified traffic.
In the testbed, there are at least three hosts in each site, each one for a different type of service (Best Effort, Scavenger and Premium IP). Packets are classified and marked at the ingress interface of the routers. The Cisco routers are configured to classify and mark all packets from the Premium IP hosts as Premium IP traffic (DSCP 46), and all packets from the Scavenger Service hosts as Scavenger Service traffic (DSCP 8). The rest of the traffic is not marked and is sent as default as Best Effort traffic.
In addition, at the egress interface of the routers, the previously classified and marked traffic is treated with a traffic policy before being sent.
To configure and enable class-based QoS features in a Cisco Router, the following tasks must be done [CIS-MOD][CIS-CON]:
- Create a Traffic Class with the class-map command
- Create a Traffic Policy by associating using the policy-map command
- Attach a Traffic Policy to the Interface with the service-policy command
We configured the routers in two separated parts: - Classification/marking actions into one (ingress) policy-map
- Policing/queuing actions into another (egress) policy-map. For the classification and marking actions, the Cisco router at RUS is configured as follows:
Configure two access-lists for all traffic coming from the Premium IP (PIP) and ScavengerService (SS) hosts. Admission control is located here. In this configuration example, traffic from the PIP host will conform the access-list 110, and traffic from the SS host will conform the access-list 130: access-list 110 permit ip host 192.168.71.10 any access-list 130 permit ip host 192.168.71.30 any Configure two traffic classes containing these two access-lists. Only packets coming from the hosts in the access-lists defined before will belong to the traffic classes called premium_packets and scavenger_packets respectively: class-map match-all premium_packets match access-group 110 class-map match-all scavenger_packets match access-group 130 Configure a policy map so that all packets from the specified traffic classes are set to the corresponding DSCP (DSCP=8 for SS and DSCP=46 for PIP): policy-map markpackets class premium_packets set ip dscp 46 class scavenger_packets set ip dscp 8 Attach this policy map to the interface: interface fastEthernet0/1 description Test Ethernet to RUS Lab service-policy input markpackets
22
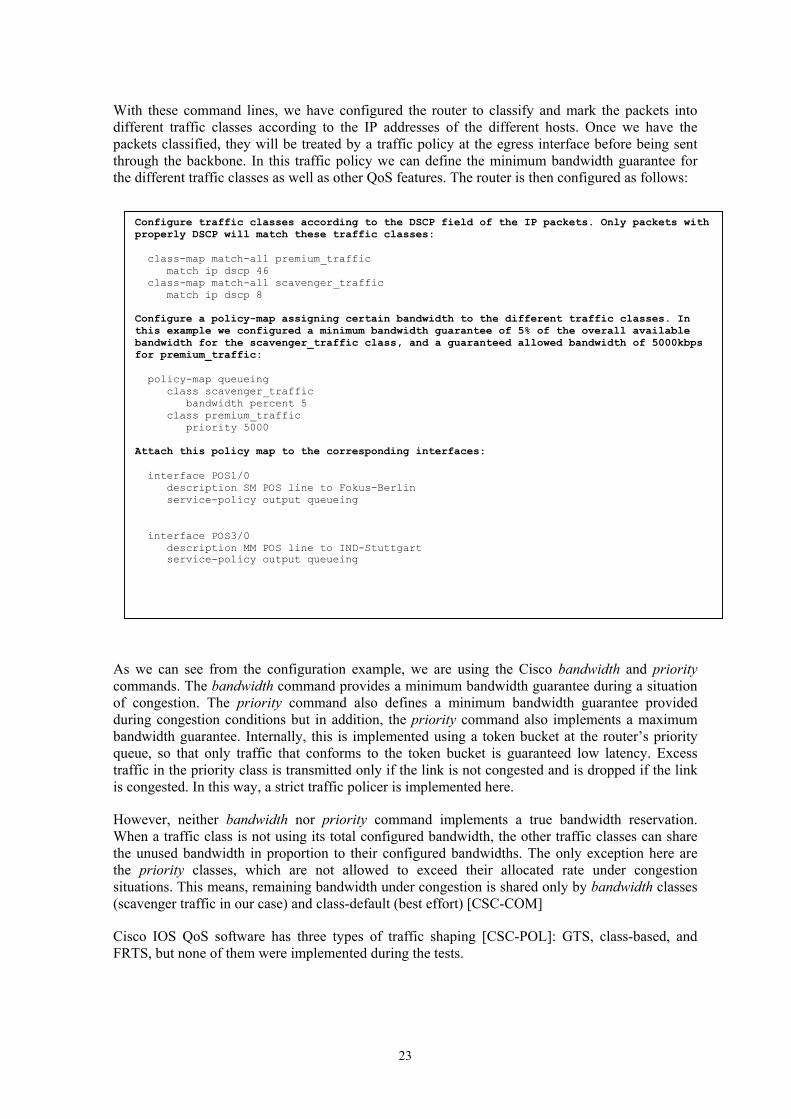
With these command lines, we have configured the router to classify and mark the packets into different traffic classes according to the IP addresses of the different hosts. Once we have the packets classified, they will be treated by a traffic policy at the egress interface before being sent through the backbone. In this traffic policy we can define the minimum bandwidth guarantee for the different traffic classes as well as other QoS features. The router is then configured as follows:
Configure traffic classes according to the DSCP field of the IP packets. Only packets with properly DSCP will match these traffic classes: class-map match-all premium_traffic match ip dscp 46 class-map match-all scavenger_traffic match ip dscp 8 Configure a policy-map assigning certain bandwidth to the different traffic classes. In this example we configured a minimum bandwidth guarantee of 5% of the overall available bandwidth for the scavenger_traffic class, and a guaranteed allowed bandwidth of 5000kbps for premium_traffic: policy-map queueing class scavenger_traffic bandwidth percent 5 class premium_traffic priority 5000 Attach this policy map to the corresponding interfaces: interface POS1/0 description SM POS line to Fokus-Berlin service-policy output queueing interface POS3/0 description MM POS line to IND-Stuttgart service-policy output queueing
As we can see from the configuration example, we are using the Cisco bandwidth and priority commands. The bandwidth command provides a minimum bandwidth guarantee during a situation of congestion. The priority command also defines a minimum bandwidth guarantee provided during congestion conditions but in addition, the priority command also implements a maximum bandwidth guarantee. Internally, this is implemented using a token bucket at the router’s priority queue, so that only traffic that conforms to the token bucket is guaranteed low latency. Excess traffic in the priority class is transmitted only if the link is not congested and is dropped if the link is congested. In this way, a strict traffic policer is implemented here.
However, neither bandwidth nor priority command implements a true bandwidth reservation. When a traffic class is not using its total configured bandwidth, the other traffic classes can share the unused bandwidth in proportion to their configured bandwidths. The only exception here are the priority classes, which are not allowed to exceed their allocated rate under congestion situations. This means, remaining bandwidth under congestion is shared only by bandwidth classes (scavenger traffic in our case) and class-default (best effort) [CSC-COM]
Cisco IOS QoS software has three types of traffic shaping [CSC-POL]: GTS, class-based, and FRTS, but none of them were implemented during the tests.
23
3.4 Measurement Results
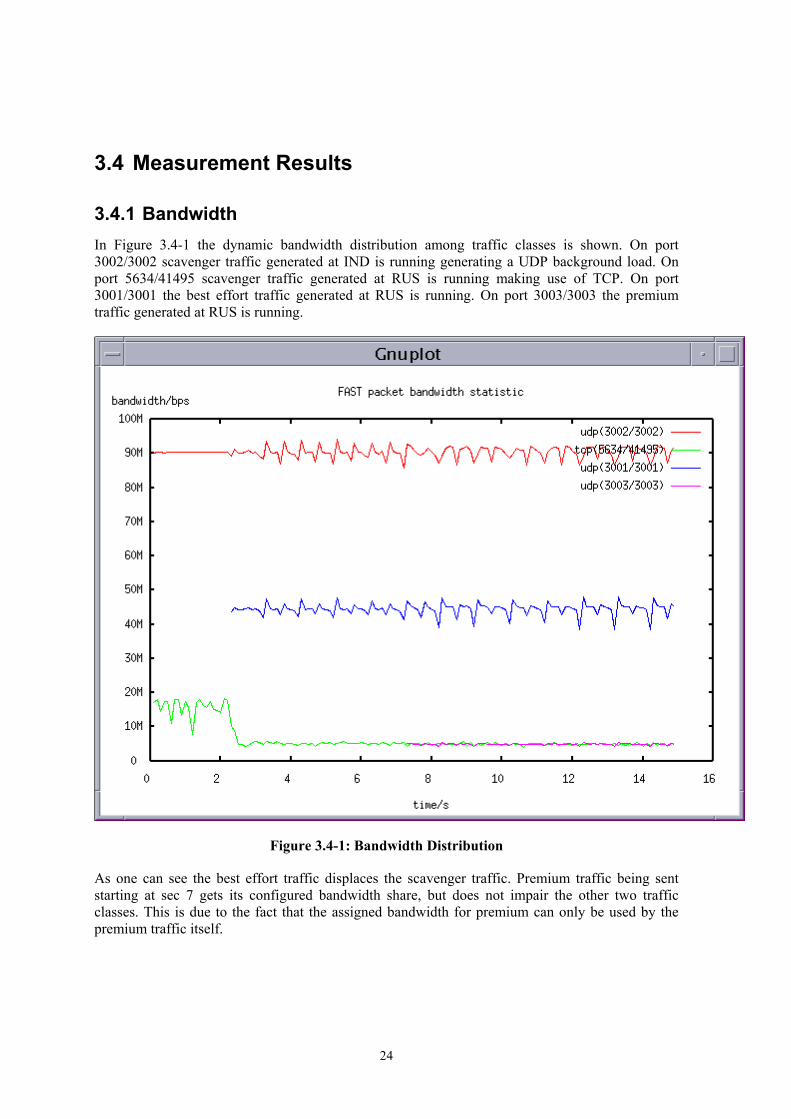
3.4.1 Bandwidth In Figure 3.4-1 the dynamic bandwidth distribution among traffic classes is shown. On port 3002/3002 scavenger traffic generated at IND is running generating a UDP background load. On port 5634/41495 scavenger traffic generated at RUS is running making use of TCP. On port 3001/3001 the best effort traffic generated at RUS is running. On port 3003/3003 the premium traffic generated at RUS is running.
Figure 3.4-1: Bandwidth Distribution
As one can see the best effort traffic displaces the scavenger traffic. Premium traffic being sent starting at sec 7 gets its configured bandwidth share, but does not impair the other two traffic classes. This is due to the fact that the assigned bandwidth for premium can only be used by the premium traffic itself.
24
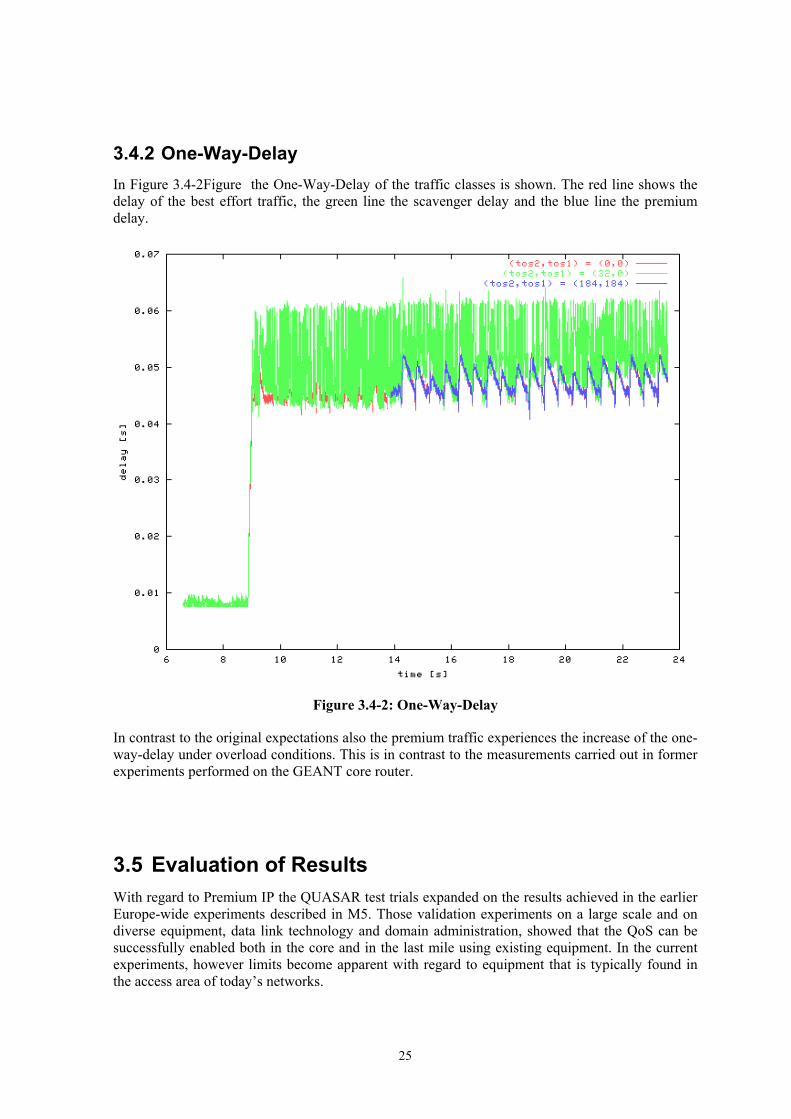
3.4.2 One-Way-Delay In Figure 3.4-2Figure the One-Way-Delay of the traffic classes is shown. The red line shows the delay of the best effort traffic, the green line the scavenger delay and the blue line the premium delay.
Figure 3.4-2: One-Way-Delay
In contrast to the original expectations also the premium traffic experiences the increase of the one-way-delay under overload conditions. This is in contrast to the measurements carried out in former experiments performed on the GEANT core router.
3.5 Evaluation of Results With regard to Premium IP the QUASAR test trials expanded on the results achieved in the earlier Europe-wide experiments described in M5. Those validation experiments on a large scale and on diverse equipment, data link technology and domain administration, showed that the QoS can be successfully enabled both in the core and in the last mile using existing equipment. In the current experiments, however limits become apparent with regard to equipment that is typically found in the access area of today’s networks.
25
The final experimentation included the scavenger service class, which provides a less than best effort (LBE) service. The primary function of this service class is to be able to make use of available bandwidth, but in such a way as to always defer to BE (or better) traffic where congestion occurs (LBE packets are always dropped before BE packets). The results presented in this Chapter are encouraging in that they largely validate the feasibility of operating an LBE service on the network. The LBE traffic in the configuration tested does not adversely affect the regular BE or Premium IP traffic.
3.6 Recommendations for Future Work Important outcomes of the experiments performed in QUASAR and IST SEQUIN collaboration can be summarised in:
• demonstration of the validity of the proposed QoS concepts and Premium IP model in a production environment
• development of a methodology for the provisioning of Premium IP in GÉANT and connected NRENs
• packaging of a set of monitoring modules that support diagnostics and QoS monitoring
• creation of educational material and reference configuration
• set-up of a QoS-enabled core network infrastructure available to researchers in Europe
• realisation of QoS in the access area however is still critical under today’s deploy equipment
For the provisioning of IP QoS services, a significant initial configuration effort and management load has to be scheduled, which will stay high only for the debugging and monitoring subsystem. A widely deployed monitoring system is the key to success of the service. The monitoring system should be available or readily available at every node of the network.
QUASAR experimentation presented in this milestone concentrated on the demonstration of the feasibility of a LBE service. Complementary experimentation with LBE has also been performed within the TF-NGN working group, who concentrated on configurations for LBE service at core networks. In this trials analogous results could be achieved, and together they show that the service could be applicable to NREN and the GÉANT network. However, as most network congestion is occurring at the edges of the network, implementation at the edge (university access links) is particularly important.
It is also important to note that it is the sender of the data that must mark the traffic with the LBE DSCP. Thus a user who wishes to initiate an LBE FTP session requires a way to signal this request to the FTP server. There exist example solution for common application like ftp, which can accommodate such a requirement, but the general question of LBE signalling, and of voluntary against enforced use of LBE, is open for further investigation.
The logical next step is to progress with the implementation of LBE in NRENs and on the GÉANT backbone, to promote its adoption within the NRENs and to encourage end users to start using the service.
Within the TF-NGN working group further experimentation is currently under way that evaluates the use of LBE under conditions, where the intermediate network offer only DCSP transparency
26
(i.e. the routers do not reset the LBE DSCP), and the queuing and drop policy is applied at the network edge (the university) where congestion occurs.
27
4 QUASAR Simulation Experiments This chapter presents the results of the comparative simulation studies between two service differentiating approaches for real-time and non-real time traffic. For each case, over-provisioning is also considered. The results show how the different approaches work for the three class architecture proposed by QUASAR (Q-Bone Scavenger Service, Best Effort, Premium IP). The basic scenario remains as in described in Milestone 5 with the exception of the addition of Scavenger Service sources and appropriate scheduling.
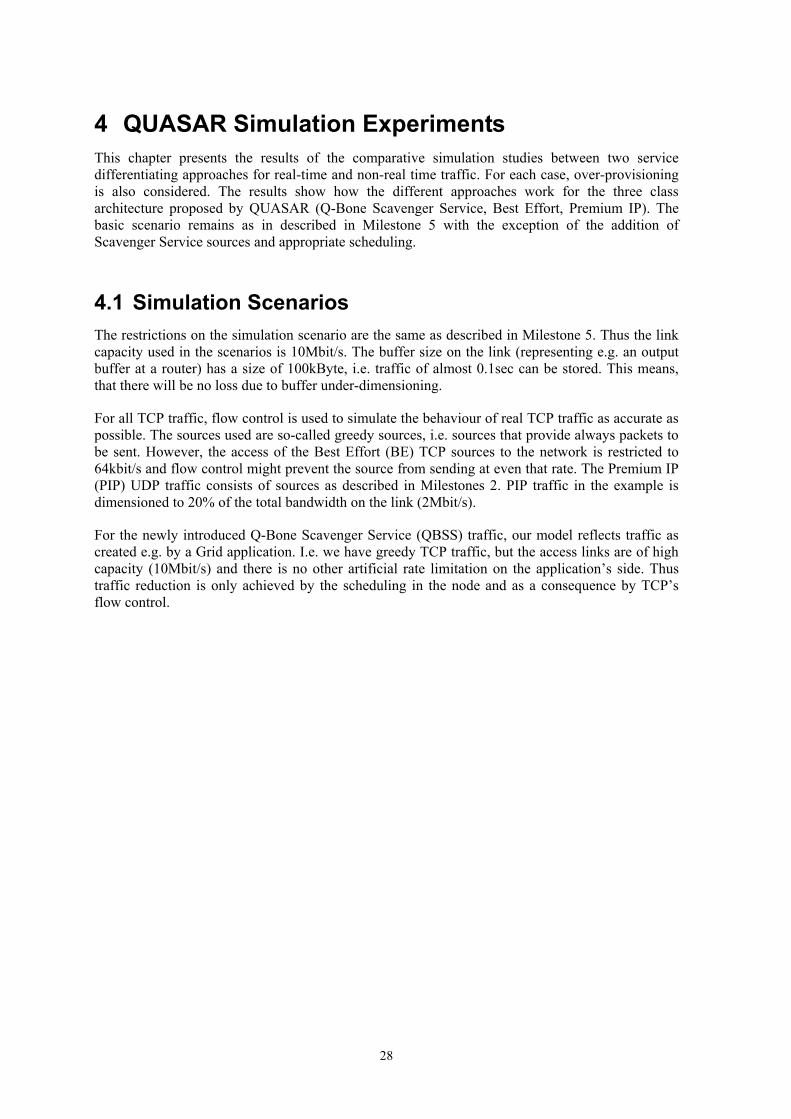
4.1 Simulation Scenarios The restrictions on the simulation scenario are the same as described in Milestone 5. Thus the link capacity used in the scenarios is 10Mbit/s. The buffer size on the link (representing e.g. an output buffer at a router) has a size of 100kByte, i.e. traffic of almost 0.1sec can be stored. This means, that there will be no loss due to buffer under-dimensioning.
For all TCP traffic, flow control is used to simulate the behaviour of real TCP traffic as accurate as possible. The sources used are so-called greedy sources, i.e. sources that provide always packets to be sent. However, the access of the Best Effort (BE) TCP sources to the network is restricted to 64kbit/s and flow control might prevent the source from sending at even that rate. The Premium IP (PIP) UDP traffic consists of sources as described in Milestones 2. PIP traffic in the example is dimensioned to 20% of the total bandwidth on the link (2Mbit/s).
For the newly introduced Q-Bone Scavenger Service (QBSS) traffic, our model reflects traffic as created e.g. by a Grid application. I.e. we have greedy TCP traffic, but the access links are of high capacity (10Mbit/s) and there is no other artificial rate limitation on the application’s side. Thus traffic reduction is only achieved by the scheduling in the node and as a consequence by TCP’s flow control.
28
TCPRcvr
TCPRcvr
BE
PIP
QBSS
UDP
Figure 4.1-1: Simulation model for a non-partitioned buffer
Again, we differentiate between two buffering approaches:
• Non-partitioned buffer (Figure 4.1-1): There is only one buffer for both traffic classes. Packets are tagged upon their arrival depending on their traffic class. The scheduler then always takes the first packet of a class out of the buffer when the respective class is due for service. Thereby each traffic class gets its configured share of the overall bandwidth.
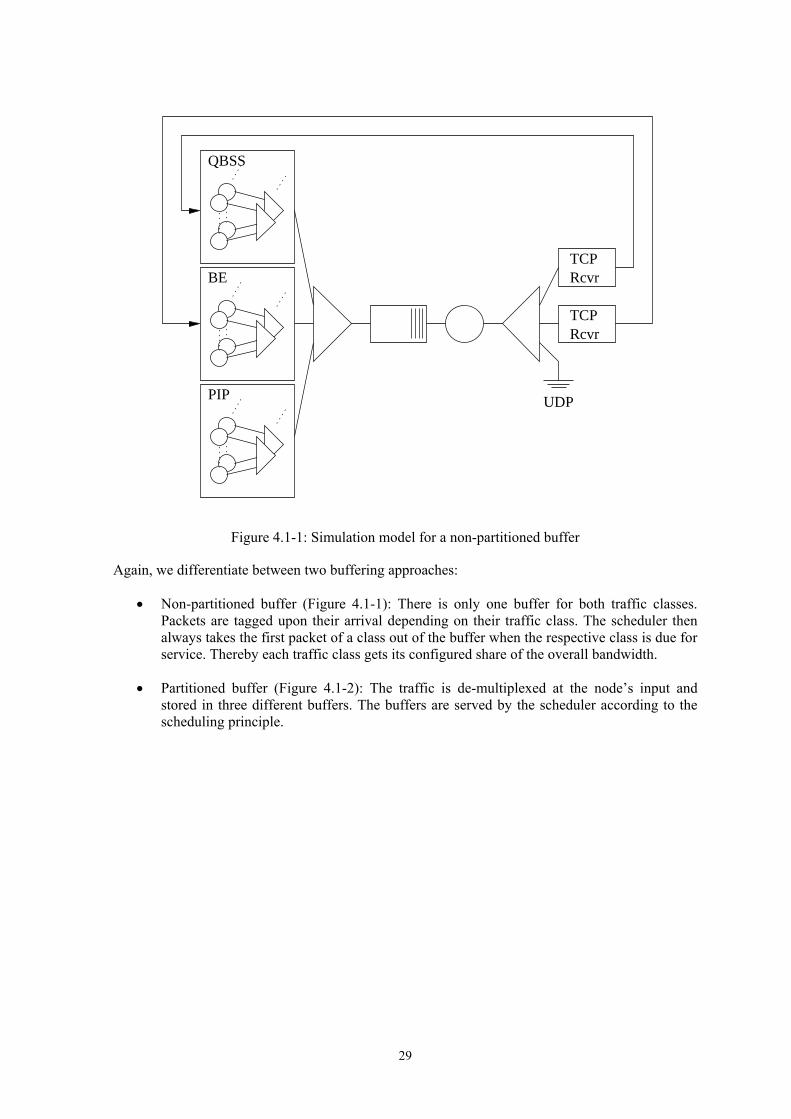
• Partitioned buffer (Figure 4.1-2): The traffic is de-multiplexed at the node’s input and stored in three different buffers. The buffers are served by the scheduler according to the scheduling principle.
29
TCPRcvr
TCPRcvr
BE
PIP
QBSS
UDP
QBSS
BE
PIP
Figure 4.2-2: Simulation model for partitioned buffers
Furthermore, we use two different schedulers to serve the buffer(s):
• Static priority: The three classes are always served in the following order: PIP, BE, QBSS. Lower priority classes are only served when there is no higher priority packet waiting. Due to network access limitations, the danger of starving a lower class is non-existing.
• Self-clocked fair queuing (SCFQ) [GOL]: Each traffic class gets a certain amount of bandwidth on the link. As long as no traffic is available in one class, the other class may use the bandwidth. However, overall distribution of the bandwidth equals the configuration. In this case, lower priority classes can also be served, when there are still higher priority packets waiting.
The following scenarios were evaluated:
• PIP (UDP), BE (TCP) and QBSS (TCP) with static priority: Over-provisioning factors were 1.0, 1.5 and 2.0. UDP traffic was set to 20% of the base bandwidth (i.e. 2Mbit/s). The offered BE load was varied between 50 and 150% of the base bandwidth (i.e. 5Mbit/s to 15Mbit/s) by varying the number of sources. The Scavenger Service applications (we assume a relatively low number of 5 sources but with a high traffic offer each) try to get as much bandwidth as possible. Only one buffer was used. The scheduler uses a strict priority scheme. Three different buffer partitioning schemes were evaluated: no partitioning, 20%-60%-20% (PIP-BE-QBSS), and 30%-50%-20%
• PIP, BE, and QBSS with SCFQ: The same parameters as for static priority were used. We have two different scheduling cases: 0.2-0.6-0.2 and 0.3-0.5-0.2. In both cases, we could either use a non-partitioned or partitioned buffer. In the second case, the partitioning ratio reflected the ratio of the class scheduling.
30
4.2 Simulation Results The graphs in this section show the influence of static priority or service differentiation on mixed UDP/TCP traffic with three service classes. The impact of over-provisioning is also always evaluated. The results of network occupancy, TCP throughput, loss probability and UDP packet inter-arrival time are presented. The offered load value is always related to the amount of the Best Effort traffic in an unloaded network.
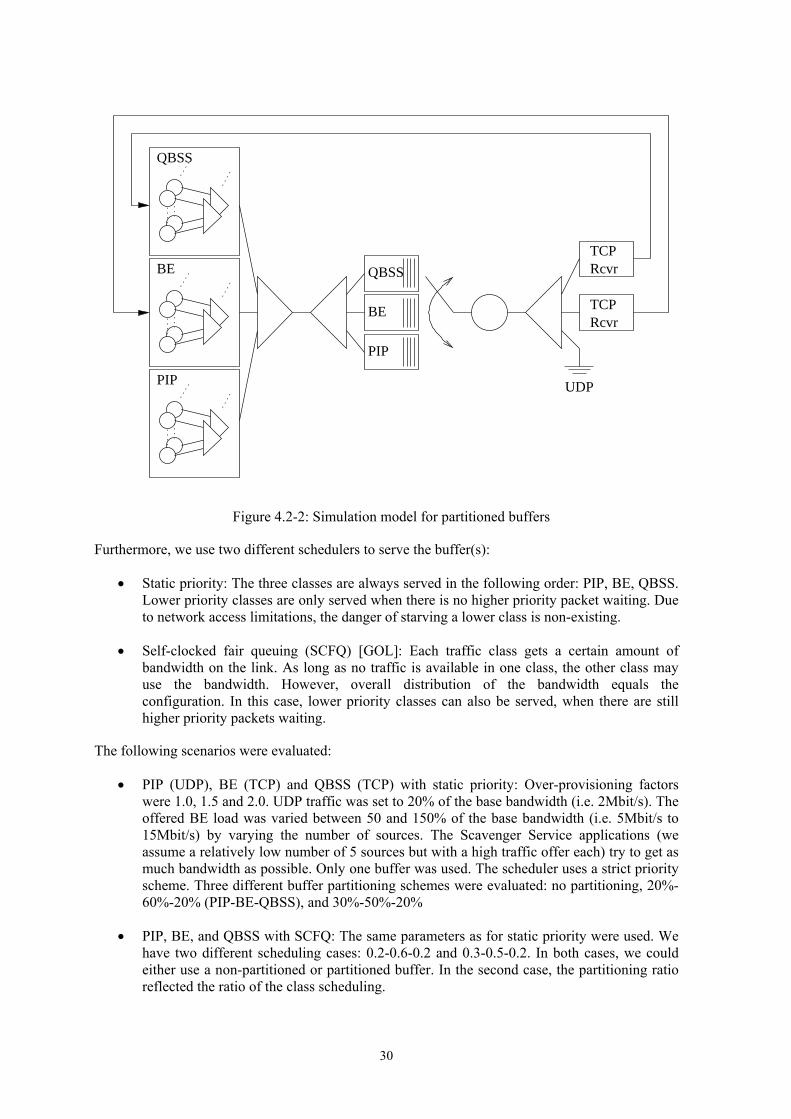
4.2.1 Static Priority Figure 4.2-1 shows the occupancy of the link with respect to different buffer partition schemes and over-provisioning factors. The most important result is, that if no partitioning is provided, the link is always almost fully occupied, no matter how large the over-provisioning factor is. This comes from the QBSS traffic that is only limited by the available link capacity. As bad as this might seem at the first glance, we will later show, that the bandwidth consumption of the QBSS traffic has no impact on the other two traffic classes due to the prioritised scheduling. Using partitioning of the buffer, the results are completely different. Especially the QBSS traffic is now sincerely restricted. PIP as well as BE traffic are always served first. Even though this is alike to the unpartitioned case, now much less QBSS traffic can be buffered, thus losses are higher and TCP flow control starts to decrease the traffic. The higher the partition of the QBSS traffic is, the more bandwidth is occupied. It is thus necessary, to restrict QBSS by partitioning to not lose the advantages of over-provisioning: to keep some free bandwidth available for certain situations. The fact that higher prioritised traffic will edge out the QBSS traffic is only partially helpful. As long as an unpartitioned queue is also occupied by a lot of QBSS packets, there will be also loss for newly arriving higher priority packets. Only when the QBSS traffic starts decreasing, will the higher priority traffic get back its quality of service level.
40 60 80 100 120 140 160
Offered TCP Load (% of 10Mbit/s)
0.5
1
1.5
2
2.5
Occ
upan
cy (
base
d on
10M
bit/s
)
no Part., 1.0 OPno Part., 1.5 OPno Part., 2.0 OP2/6/2, Part., 1.0 OP2/6/2, Part., 1.5 OP2/6/2, Part., 2.0 OP3/5/2, Part., 1.0 OP3/5/2, Part., 1.5 OP3/5/2, Part., 2.0 OP
3 Classes - Static Priority
Figure 4.2-1: Static priority – Occupancy
31

Figures 4.2-2 and 4.2-3 show how the two TCP classes (BE and QBSS) share the available bandwidth. Compared to the results of static priority in [M5] there is no difference in the results for the BE traffic class as long as no partitioning is used. Of course, as soon as partitioning is introduced, BE only gets a certain percentage of the available buffer space and is thus more restricted. Notice, that the BE traffic always gets up to 60% of the available bandwidth, even if it only can get 50% of the buffer space. This is because BE traffic has a higher priority than QBSS traffic and does not need much buffer space up to a certain overload factor (we can see a slight decrease around 150%). In this case, we waste buffer space.
40 60 80 100 120 140 160
Offered TCP Load (% of 10Mbit/s)
0
5
10
15
Thr
ough
put (
TC
P, i
n M
bit/s
)
no Part., 1.0 OPno Part., 1.5 OPno Part., 2.0 OP2/6/2, Part., 1.0 OP2/6/2, Part., 1.5 OP2/6/2, Part., 2.0 OP3/5/2, Part., 1.0 OP3/5/2, Part., 1.5 OP3/5/2, Part., 2.0 OP
3 Classes - Static Priority
Figure 4.2-2: Static priority – BE throughput
As the number of BE sources is much higher than the number of QBSS sources, we can observe a decrease in the bandwidth used by QBSS sources as the BE traffic becomes more and more. We can see this the best for the case with no partitioning. Since there is only one queue, the high number of BE sources successfully edges out the QBSS traffic. As soon as we introduce partitioning, we can only get worse results (for the parameter sets used). Offering the QBSS more buffering space does not really help, since the priority of this traffic is so low compared to BE, that under higher BE load, even larger buffers overflow and degrade the performance even more.
32

40 60 80 100 120 140 160
Offered TCP Load (% of 10Mbit/s)
0
5
10
15
Thr
ough
put (
Grid
, in
Mbi
t/s)
no Part., 1.0 OPno Part., 1.5 OPno Part., 2.0 OP2/6/2, Part., 1.0 OP2/6/2, Part., 1.5 OP2/6/2, Part., 2.0 OP3/5/2, Part., 1.0 OP3/5/2, Part., 1.5 OP3/5/2, Part., 2.0 OP
3 Classes - Static Priority
Figure 4.2-3: Static priority – QBSS throughput
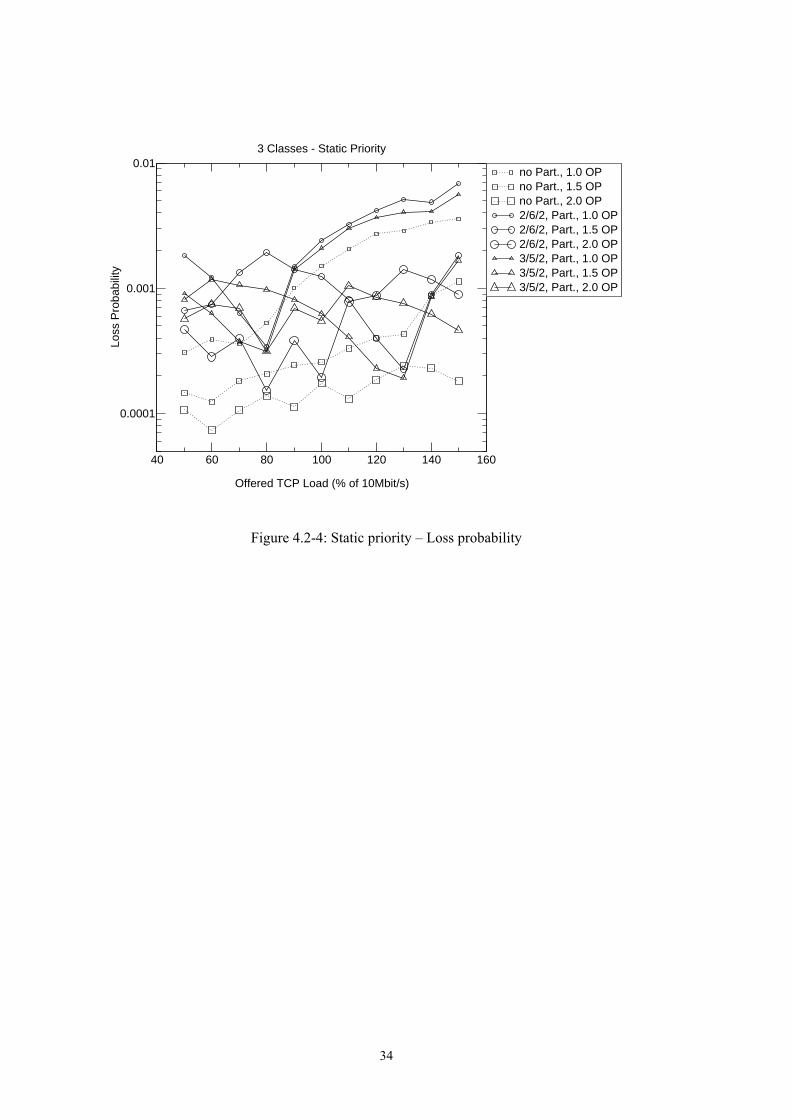
Figure 4.2-4 shows the loss probability for the different cases. Not surprisingly, we can see that the loss rate decreases with a higher over-provisioning factor. At the same time it increases with a higher traffic load. We can also see, that the loss is generally lower when no partitioning is used. The reasons therefore were already explained above. However, the behaviour of loss in cases with partitioning is rather unstable. Although it follows the same basic trend as in the unpartitioned case, the loss sometimes decreases as the BE traffic load becomes higher. So far, we do not have satisfying explanations for this.
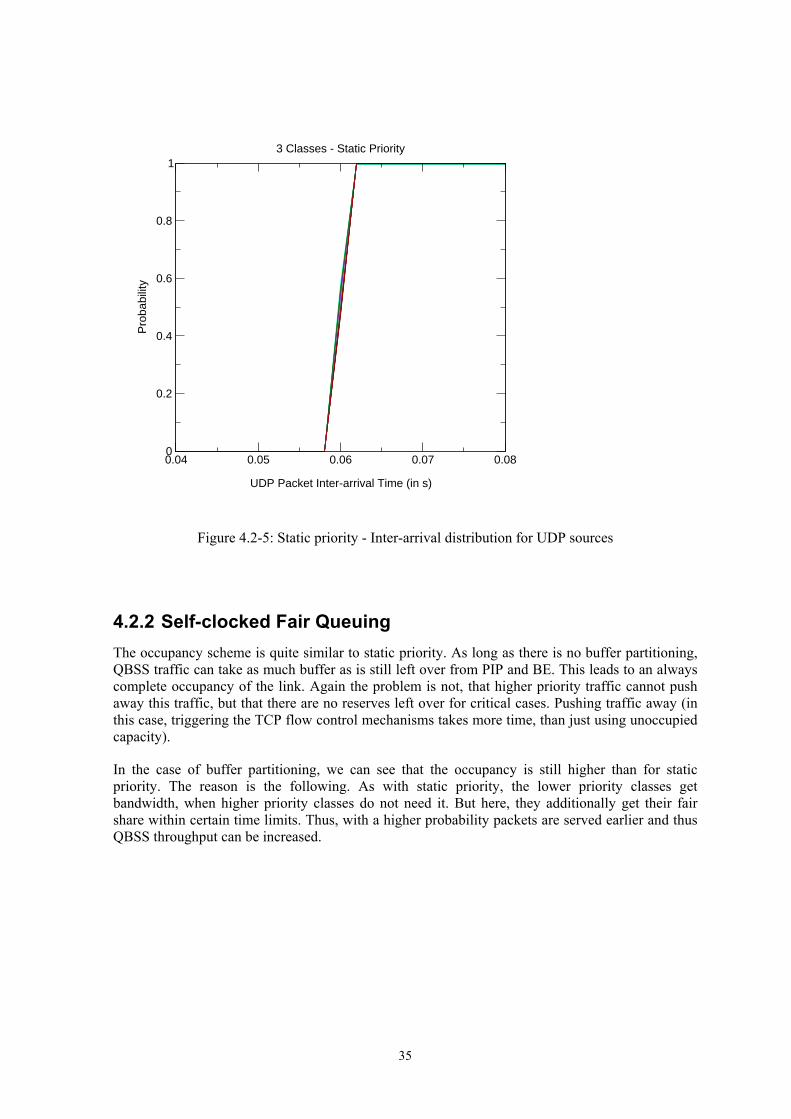
Figure 4.2-5 then shows the inter-arrival distribution of the PIP packets. It shows very well, that due to the static prioritisation this traffic is not at all affected by the new traffic class. Under all circumstances (partitioning, high traffic load), the inter-arrival time remains constant. The reason is that these packets are always served first and almost do not build up any queue.
33
40 60 80 100 120 140 160
Offered TCP Load (% of 10Mbit/s)
0.0001
0.001
0.01
Loss
Pro
babi
lity
no Part., 1.0 OPno Part., 1.5 OPno Part., 2.0 OP2/6/2, Part., 1.0 OP2/6/2, Part., 1.5 OP2/6/2, Part., 2.0 OP3/5/2, Part., 1.0 OP3/5/2, Part., 1.5 OP3/5/2, Part., 2.0 OP
3 Classes - Static Priority
Figure 4.2-4: Static priority – Loss probability
34
0.04 0.05 0.06 0.07 0.08
UDP Packet Inter-arrival Time (in s)
0
0.2
0.4
0.6
0.8
1
Pro
babi
lity
3 Classes - Static Priority
Figure 4.2-5: Static priority - Inter-arrival distribution for UDP sources
4.2.2 Self-clocked Fair Queuing The occupancy scheme is quite similar to static priority. As long as there is no buffer partitioning, QBSS traffic can take as much buffer as is still left over from PIP and BE. This leads to an always complete occupancy of the link. Again the problem is not, that higher priority traffic cannot push away this traffic, but that there are no reserves left over for critical cases. Pushing traffic away (in this case, triggering the TCP flow control mechanisms takes more time, than just using unoccupied capacity).
In the case of buffer partitioning, we can see that the occupancy is still higher than for static priority. The reason is the following. As with static priority, the lower priority classes get bandwidth, when higher priority classes do not need it. But here, they additionally get their fair share within certain time limits. Thus, with a higher probability packets are served earlier and thus QBSS throughput can be increased.
35

40 60 80 100 120 140 160
Offered TCP Load (% of 10Mbit/s)
0.5
1
1.5
2
2.5
Occ
upan
cy (
base
d on
10M
bit/s
)
2/6/2, no Part., 1.0 OP2/6/2, no Part., 1.5 OP2/6/2, no Part., 2.0 OP2/6/2, Part., 1.0 OP2/6/2, Part., 1.5 OP2/6/2, Part., 2.0 OP3/5/2, no Part., 1.0 OP3/5/2, no Part., 1.5 OP3/5/2, no Part., 2.0 OP3/5/2, Part., 1.0 OP3/5/2, Part., 1.5 OP3/5/2, Part., 2.0 OP
3 Classes - SCFQ
Figure 4.2-6: SCFQ – Occupancy
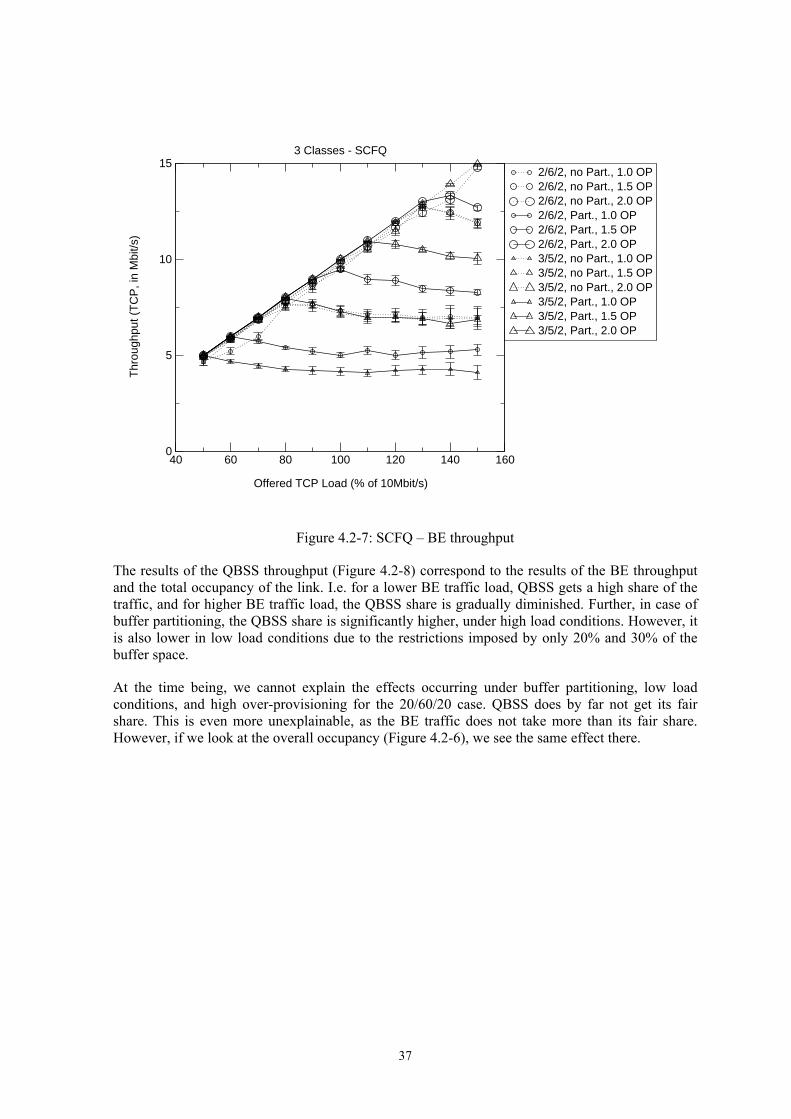
Figure 4.2-7 shows the throughput for BE traffic. Differences for no partitioning cases can be neglected. TCP traffic even gets more bandwidth than its fair share. This is because there are far more sources for BE traffic than for QBSS traffic (both using TCP). As they use one single buffer, the large number of BE sources (especially in the case of high load) can successfully edge out the QBSS traffic. Even though this traffic would also get a fair share of bandwidth at the server, it cannot compete successfully for buffer space. Thus the fair share (20% or 30%) of the bandwidth cannot be used. As a consequence, BE traffic uses also this part of the bandwidth and further discriminates the QBSS traffic.
In the cases with partitioning, the BE traffic does not get more than its fair share. QBSS now gets 20% or 30% of the buffer space respectively and cannot be edged out. As a consequence BE gets 50% and 60% of the available bandwidth respectively. We can observe, that the throughput decreases slightly when the load becomes higher. This is due to higher delay in the queues and higher loss, whereupon TCP flow control sets in.
36
40 60 80 100 120 140 160
Offered TCP Load (% of 10Mbit/s)
0
5
10
15
Thr
ough
put (
TC
P, i
n M
bit/s
)
2/6/2, no Part., 1.0 OP2/6/2, no Part., 1.5 OP2/6/2, no Part., 2.0 OP2/6/2, Part., 1.0 OP2/6/2, Part., 1.5 OP2/6/2, Part., 2.0 OP3/5/2, no Part., 1.0 OP3/5/2, no Part., 1.5 OP3/5/2, no Part., 2.0 OP3/5/2, Part., 1.0 OP3/5/2, Part., 1.5 OP3/5/2, Part., 2.0 OP
3 Classes - SCFQ
Figure 4.2-7: SCFQ – BE throughput
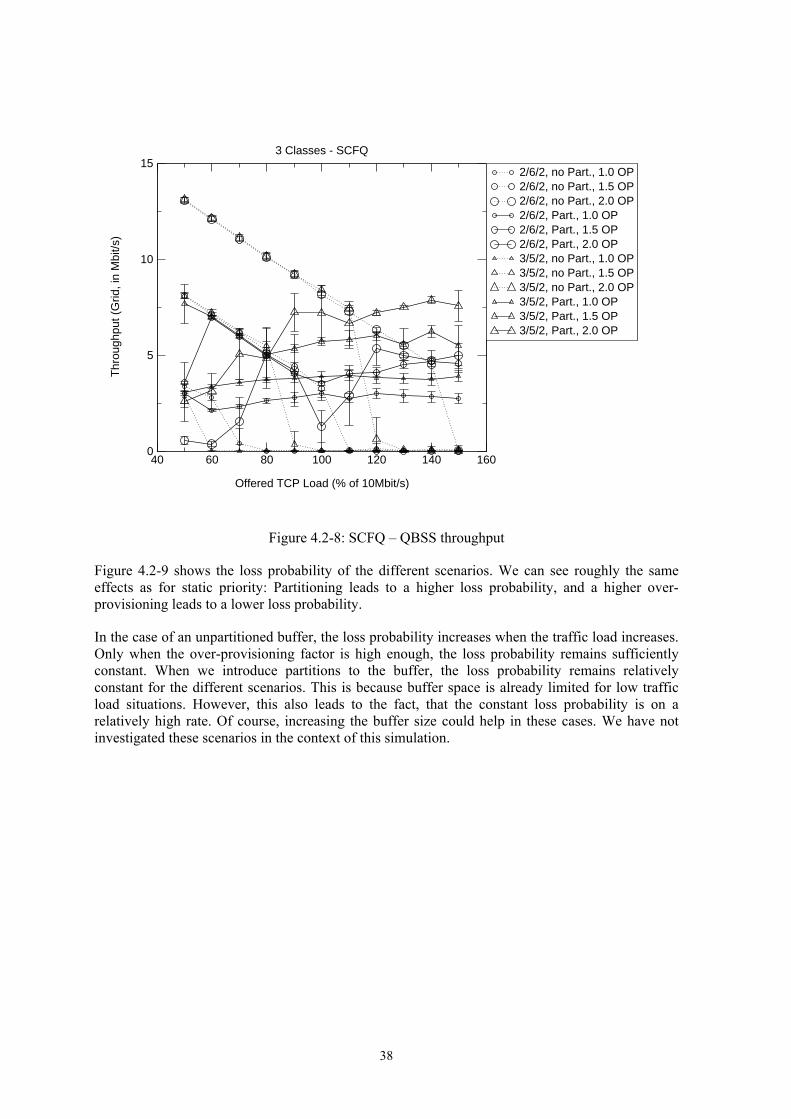
The results of the QBSS throughput (Figure 4.2-8) correspond to the results of the BE throughput and the total occupancy of the link. I.e. for a lower BE traffic load, QBSS gets a high share of the traffic, and for higher BE traffic load, the QBSS share is gradually diminished. Further, in case of buffer partitioning, the QBSS share is significantly higher, under high load conditions. However, it is also lower in low load conditions due to the restrictions imposed by only 20% and 30% of the buffer space.
At the time being, we cannot explain the effects occurring under buffer partitioning, low load conditions, and high over-provisioning for the 20/60/20 case. QBSS does by far not get its fair share. This is even more unexplainable, as the BE traffic does not take more than its fair share. However, if we look at the overall occupancy (Figure 4.2-6), we see the same effect there.
37
40 60 80 100 120 140 160
Offered TCP Load (% of 10Mbit/s)
0
5
10
15
Thr
ough
put (
Grid
, in
Mbi
t/s)
2/6/2, no Part., 1.0 OP2/6/2, no Part., 1.5 OP2/6/2, no Part., 2.0 OP2/6/2, Part., 1.0 OP2/6/2, Part., 1.5 OP2/6/2, Part., 2.0 OP3/5/2, no Part., 1.0 OP3/5/2, no Part., 1.5 OP3/5/2, no Part., 2.0 OP3/5/2, Part., 1.0 OP3/5/2, Part., 1.5 OP3/5/2, Part., 2.0 OP
3 Classes - SCFQ
Figure 4.2-8: SCFQ – QBSS throughput
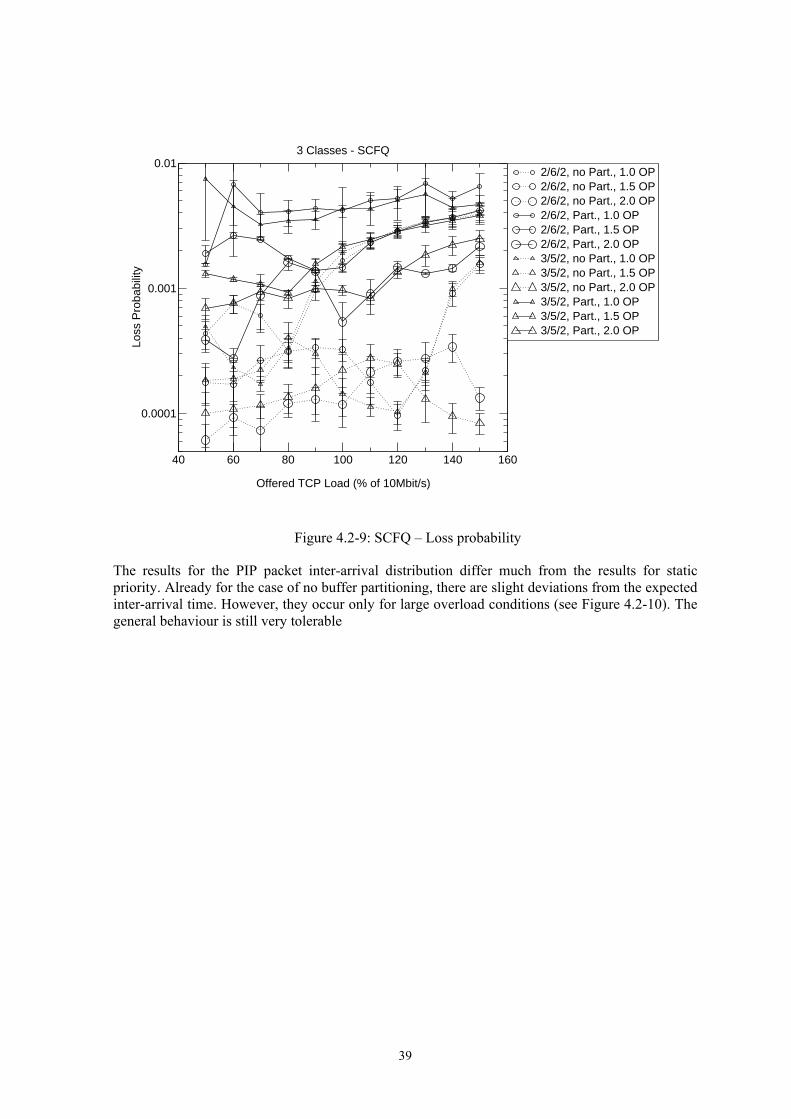
Figure 4.2-9 shows the loss probability of the different scenarios. We can see roughly the same effects as for static priority: Partitioning leads to a higher loss probability, and a higher over-provisioning leads to a lower loss probability.
In the case of an unpartitioned buffer, the loss probability increases when the traffic load increases. Only when the over-provisioning factor is high enough, the loss probability remains sufficiently constant. When we introduce partitions to the buffer, the loss probability remains relatively constant for the different scenarios. This is because buffer space is already limited for low traffic load situations. However, this also leads to the fact, that the constant loss probability is on a relatively high rate. Of course, increasing the buffer size could help in these cases. We have not investigated these scenarios in the context of this simulation.
38
40 60 80 100 120 140 160
Offered TCP Load (% of 10Mbit/s)
0.0001
0.001
0.01
Loss
Pro
babi
lity
2/6/2, no Part., 1.0 OP2/6/2, no Part., 1.5 OP2/6/2, no Part., 2.0 OP2/6/2, Part., 1.0 OP2/6/2, Part., 1.5 OP2/6/2, Part., 2.0 OP3/5/2, no Part., 1.0 OP3/5/2, no Part., 1.5 OP3/5/2, no Part., 2.0 OP3/5/2, Part., 1.0 OP3/5/2, Part., 1.5 OP3/5/2, Part., 2.0 OP
3 Classes - SCFQ
Figure 4.2-9: SCFQ – Loss probability
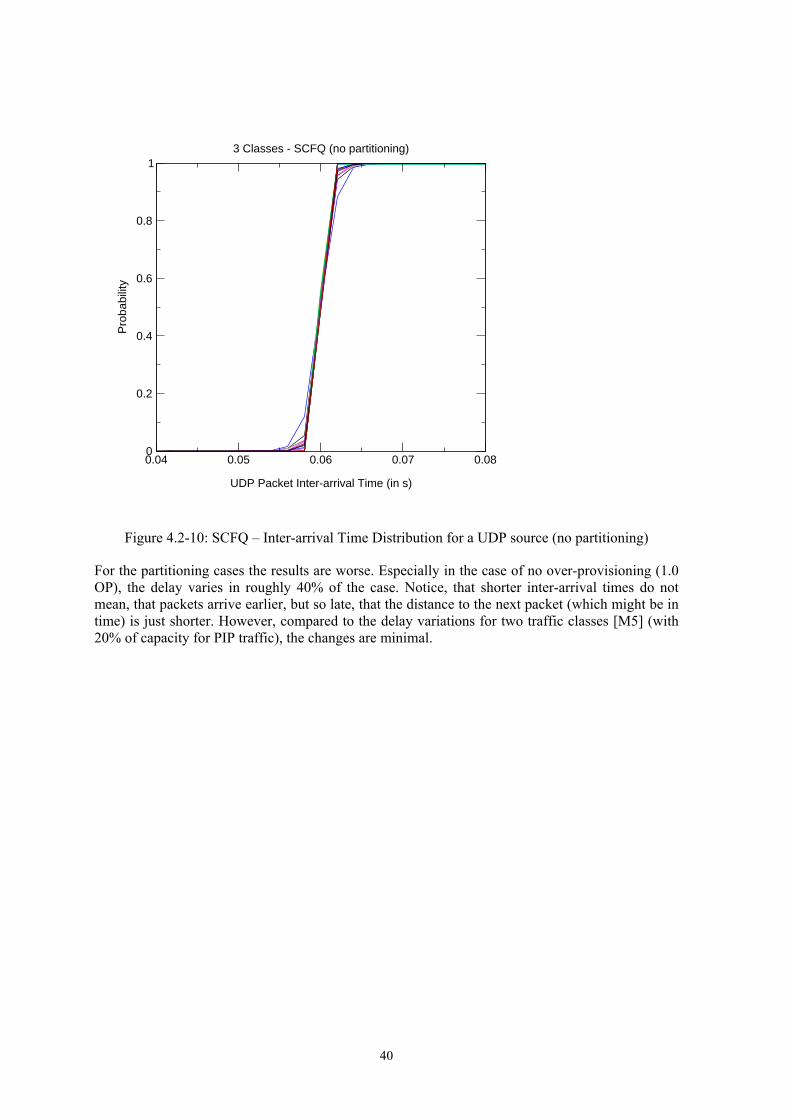
The results for the PIP packet inter-arrival distribution differ much from the results for static priority. Already for the case of no buffer partitioning, there are slight deviations from the expected inter-arrival time. However, they occur only for large overload conditions (see Figure 4.2-10). The general behaviour is still very tolerable
39
0.04 0.05 0.06 0.07 0.08
UDP Packet Inter-arrival Time (in s)
0
0.2
0.4
0.6
0.8
1
Pro
babi
lity
3 Classes - SCFQ (no partitioning)
Figure 4.2-10: SCFQ – Inter-arrival Time Distribution for a UDP source (no partitioning)
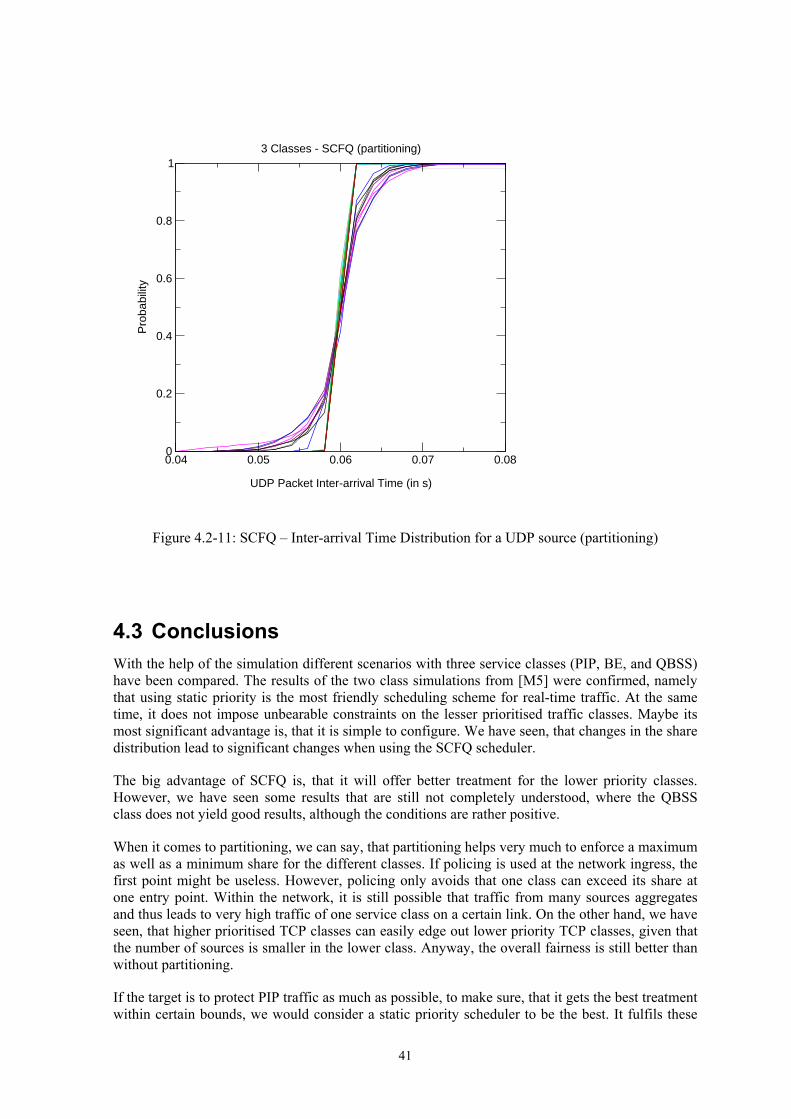
For the partitioning cases the results are worse. Especially in the case of no over-provisioning (1.0 OP), the delay varies in roughly 40% of the case. Notice, that shorter inter-arrival times do not mean, that packets arrive earlier, but so late, that the distance to the next packet (which might be in time) is just shorter. However, compared to the delay variations for two traffic classes [M5] (with 20% of capacity for PIP traffic), the changes are minimal.
40
0.04 0.05 0.06 0.07 0.08
UDP Packet Inter-arrival Time (in s)
0
0.2
0.4
0.6
0.8
1
Pro
babi
lity
3 Classes - SCFQ (partitioning)
Figure 4.2-11: SCFQ – Inter-arrival Time Distribution for a UDP source (partitioning)
4.3 Conclusions With the help of the simulation different scenarios with three service classes (PIP, BE, and QBSS) have been compared. The results of the two class simulations from [M5] were confirmed, namely that using static priority is the most friendly scheduling scheme for real-time traffic. At the same time, it does not impose unbearable constraints on the lesser prioritised traffic classes. Maybe its most significant advantage is, that it is simple to configure. We have seen, that changes in the share distribution lead to significant changes when using the SCFQ scheduler.
The big advantage of SCFQ is, that it will offer better treatment for the lower priority classes. However, we have seen some results that are still not completely understood, where the QBSS class does not yield good results, although the conditions are rather positive.
When it comes to partitioning, we can say, that partitioning helps very much to enforce a maximum as well as a minimum share for the different classes. If policing is used at the network ingress, the first point might be useless. However, policing only avoids that one class can exceed its share at one entry point. Within the network, it is still possible that traffic from many sources aggregates and thus leads to very high traffic of one service class on a certain link. On the other hand, we have seen, that higher prioritised TCP classes can easily edge out lower priority TCP classes, given that the number of sources is smaller in the lower class. Anyway, the overall fairness is still better than without partitioning.
If the target is to protect PIP traffic as much as possible, to make sure, that it gets the best treatment within certain bounds, we would consider a static priority scheduler to be the best. It fulfils these
41
requirements and - at the same time - is still quite favourable for the lower priority TCP services. The use of buffer partitioning can help to make sure, that traffic does not exceed certain limits. However, how large these buffer partitions are, is up to the provider, based on the knowledge of the traffic in his network as well as the content of its service level agreements. Any restrictions (and partitioning is a restriction) should always be introduced with respect to the contracts between clients and provider.
4.4 Final Remarks It would have been very interesting to include the real G-WiN topology into simulation studies. There are two reasons, why this was not done:
• Although there is information about the topology of the G-WiN, there is no information on the traffic matrix. Further, no information is available on the characteristics of the traffic (e.g. UDP, TCP). Thus we could have made up some traffic sources at the different G-WiN access nodes and simulate with the resulting traffic. It is very unlikely, that this traffic would have matched the real traffic and thus the value of the results is rather questionable.
• Simulation of a complete network is very time consuming and creates a large amount of data to evaluate. In the case of the G-WiN, where we have links with a capacity of several Gb/s the amount of events would have been much too large. A description of the problems of simulation of large networks (in this case the B-WiN) can be found in [BELOW]. Based on the results of this work, we assume, that a comparable G-WiN simulation would have taken several weeks. A possible solution to this problem would have been to split up the network into sink trees and to simulate only the traffic on the corresponding links. However, this would have required the knowledge of the traffic matrix (see above).
We therefore restricted ourselves to the more abstract evaluation of the buffer partitioning and scheduling system. We tried to use realistic traffic without being overly specific in order to create a more general result.
.
42
5 Conclusion The wide-scale trials performed by QUASAR in cooperation with IST SEQUIN demonstrated for the first time on a wide area scale that it is possible to introduce a Diffserv based approach to IP QoS in today’s state of the art production networks. These trials were supplemented by additional test series on the national testbed, in which the service model could be expanded to include also a LBE traffic class and to add passive measurement capabilities to the measurement infrastructure. The next steps for a wider deployment will depend on policy decisions of the involved network operators. GÉANT and some NRENs have confirmed here their commitments for further support of Premium IP and a continuation of such research activities. Testing of the QoS infrastructure will continue to fine-tune the network parameters and to evolve the provisioning system.
The work performed by this project cooperation gave stimulating impulses for new activities. The deployment of a QoS monitoring infrastructure is an essential component for the European research network environment independent of any selected QoS approach. First steps are under way to establish a PERT (performance emergency response team) for the European research networks that has the objective to bundle expertise across several areas, which traditionally have been separate, but whose interaction determines end-to-end performance: network performance proper (core/campus), computer/OS architecture, transport and higher-layer protocols, distributed algorithm design.
The challenges for the deployment of QoS in a real environment go well beyond the mere implementation of QoS mechanisms. A viable QoS approach must acknowledge the high heterogeneity of the network environment. The degree of traffic load will vary considerably along the path. NRENs deploy equipment of different vendors, and have their own upgrade cycles. There are legacy technologies, older releases of equipment and software not fully supporting all features, or provider policies, which stand against an immediate activation. The introduction of QoS capabilities into the network must be flexible and pragmatic. One cannot expect a large scale, one-step migration, but must plan for a gradual process.
The proposed GÉANT Premium IP goes along this way, as it does not prescribe a specific implementation, and the provider may choose any suitable realization that fits the required service characteristics. In addition, Premium IP uses a transition strategy that foresees different levels of compliance in order to allow for an early introduction of the service. At a minimum level the only requirement is that the network does not reset or modify the Premium IP packet marking. A supportive operator may choose to map the service request onto a suitable realization with legacy facilities like e.g. ATM PVCs. Also over-provisioning can be applied as a transition technique to the QoS-enabled network.
The implementation of the Diffserv domain needs to be complemented by a QoS monitoring infrastructure for service diagnostics and service validation. QoS monitoring is mandatory for the validation of SLAs between neighboring peers and for the end-to-end SLA. But costs or even lack of rack space will prohibit a wide spread deployment of high-end monitoring and testing equipment for most NRENs. Here the experiments performed by QUASAR followed a light-weight approach and could propose a simple set of readily available tools that can be applied for the task and which can be taken as basis for future enhancements according to the needs of a research network operators.
The provisioning of a QoS service requires a high degree of cooperation between different parties. In the simplest case, when connecting two institutions across the national backbone there are at least three administrative domains involved, and this number easily increases when a group of end-users cooperating in an international context. The provisioning for GÉANT Premium IP had been derived from the model used for MBS. However, it became clear that processes that work for the provisioning of a homogeneous end-to-end technology like ATM PVCs need to be modified to
43
cope with the higher level of diversity as found with Premium IP. Furthermore, there is a strong need for training and education in configuring and operating these new technologies. Nevertheless, the provisioning of Premium IP across GÉANT and the European NRENs will create a valuable infrastructure enabling demanding experiments and innovative applications.
44
6 References
[BELOW] K. Below, U. Killat, „On the Configuration of Simulations of Large Network Models with HTTP/TCP Sources“, 15th ITC Specialist Seminar, July 2002, Würzburg, Germany
[CSC-APP] Applying QoS Features to Ethernet Subinterfaces http://www.cisco.com/warp/public/105/qos_subint.html
[CSC-COM] Comparing the bandwidth and priority Commands of a QoS Service Policy http://www.cisco.com/warp/public/105/priorityvsbw.html
[CSC-CON] Configuring the Modular Quality of Service Command-Line Interface http://www.cisco.com/univercd/cc/td/doc/product/software/ios122/122cgcr/fqos_c/fqcprt8/qcfmcli2.pdf
[CSC-MOD] Modular Quality of Service Command-Line Interface Overview http://www.cisco.com/univercd/cc/td/doc/product/software/ios122/122cgcr/fqos_c/fqcprt8/qcfmdcli.pdf
[CSC-POL] Policing and Shaping Overview http://www.cisco.com/univercd/cc/td/doc/product/software/ios122/122cgcr/fqos_c/fqcprt4/qcfpolsh.htm
[GEA-D9.1] GÉANT D9.1: Specification and implementation plan for a Premium IP service M. Campanella, T. Ferrari, S. Leinen, R. Sabatino, V. Reijs, April 2001. http://www.dante.net/tf-ngn/GEA-01-032.pdf
[GOL] S. Golestani, "A Self-Clocked Fair Queueing Scheme for Broadband Applications", Proc. IEEE INFOCOM'94, June 1994. 103
[IMP] FOKUS IP Measurement Platform, http://www.fokus.gmd.de/glone/products/imp/
[M5] QUASAR Meilenstein 5: QUASAR QoS Architektur
[QBSS] QBone Scavenger Service (QBSS) Definition, Internet2 Technical Report, Proposed Service Definition, March 16, 2001, http://qbone.internet2.edu/qbss/qbss-definition.txt
[RIPETTM] RIPE test box, http://ripe.net/ttm/
[SQ-D2.1] SEQUIN D2.1 “Quality of Service Definition” M. Campanella, P. Chivalier, A. Sevasti and N. Simar, April 2001 - http://www.dante.net/sequin/QoS-def-Apr01.pdf
[SQ-D2.1.1] SEQ-D2.1 addendum 1: Implementation architecture specification for an Premium IP service, M. Campanella, October 2001 http://www.switch.ch/lan/sequin/GEA-D9.1-Addendum-1-v05.pdf/
[SQ-D5.1] SEQ-D5.1 Proof of Concept Testbed M. Przybylski, R. Sabatino, N. Simar, J. Tiemann, S. Trocha, December 2001
45
7 Annex: Überblick über die QUASAR Arbeitsergebnisse
Im vorliegenden Annex gibt eine Übersicht über die im Projekt erstellten Dokumente und der erzielten Arbeitsergebnisse.
7.1 Projekt Meilensteine Meilenstein 1: Technologieübersicht (45 Seiten)
Es werden Ansätze zur Unterstützung von QoS in IP Netzen vorgestellt, insbesondere werden die Integrated Services Architecture, Differentiated Services Architecture, Multiprotocol Label Switching sowie Bandwidth Overprovisioning vorgestellt. Ausgehend von dem QUASAR Referenzmodell werden im folgenden mögliche Kombinationen dieser Ansätze diskutiert. Im Anschluss werden QoS Metriken und Messmethoden dargestellt und es wird ein Überblick über Standardisierungsaktivitäten auf diesem Gebiet gegeben. Grundbegriffe zur SLA/SLS Spezifikation werden erläutert und aktuelle Arbeiten in diesem Bereich betrachtet.
Meilenstein 2: QUASAR QoS Reference Model (64 Seiten)
Es werden Anforderungen an die QoS Architektur identifiziert und die speziellen Gegebenheiten der G-WiN Umgebung herausgestellt. Es wird ein abstraktes Netzmodell vorgestellt und ein Überblick über mögliche IP QoS Dienstklassen geben. Insbesondere werden Anforderung an einen Premium-Dienst zur Unterstützung von Realzeitanwendungen und an Dienste mit zugesicherter Mindestleistung (assured services) neben dem bisherigen Best Effort Dienst betrachtet, und es wird die Einsatzmöglichkeit von Diensten mit explizit verringerter Dienstgüte diskutiert. Um unterschiedliche Ansätze bewerten zu können, werden Kriterien aufgestellt und Faktoren identifiziert, die bestimmenden Einfluss auf die Komplexität der QoS Lösung ausüben, und es werden Anforderungen an die durchzuführenden Experimente identifiziert, die den Nachweis der Leistungsfähigkeit der QoS Dienste und zur Architekturvalidation erbringen sollen.
Im QUASAR-Projekt werden auch simulative Untersuchungen zur Bewertung der Architekturen durchgeführt. Hierzu wird ein geeignetes Abstraktionsmodell definiert und es wird eine erste beispielhafte Simulation betrachtet. Für den messtechnischen Teil des Projekts werden Systeme zur Durchführung von QoS-Messungen vorgestellt. Zur Ermittlung von QoS-Werte mithilfe von passiven Messungen durch verteilte Meter werden Komponenten der Synchronisation von Monitorpunkten, zur Aufzeichnung und Auswertung der gesammelten Daten benötigt. Die Einführung einer Differenzierung mehrerer Dienstgüteklassen im Netz stellt erweiterte Anforderung an die Erfassung der Ressourcennutzung (accounting), hierzu wird eine Übersicht von AAA-Ansätzen erstellt
Meilenstein 3: Preliminary QUASAR QoS Architecture (64 Seiten)
Es werden verschiedene Dienstgütearchitekturen für das G-WiN direkt miteinander verglichen. Es werden die Vor- und Nachteile der einzelnen Architekturen herausgestellt und ein Vorschlag für die Dienstgütearchitektur des G-WiN erarbeitet. Die ersten Untersuchungen konzentrieren sich auf die Erbringung eines Premium IP Dienstes auf der Basis des Diffserv EF Per-Hop-Behaviors, der in Koordination mit den Europäischer Initiativen GÉANT TF-NGN und IST SEQUIN entwickelt wurde.
46
Zur Nachbildung typischer Situationen des G-WiN auf das Testnetz werden unterschiedliche Szenarien betrachtet, und Audio/Video-Konferenzsysteme werden im ersten Schritt als Referenzanwendung für die Validierung des Architekturvorschlags gewählt.
Für den Bereich der simulativen Untersuchung wurden erste Versuche mit der TCP-Bibliothek der IND-SimLib unternommen und es werden Überlegungen zur Parametrisierung realitätsnaher TCP-Anwendungen durchgeführt. In Ergänzung zu den Messwerkzeugen in Meilenstein2 werden Werkzeugen zu Verkehrserzeugung und Steuerung vorgestellt. Es wird die Struktur der Testumgebung beschrieben, und es werden die wesentlichen Komponenten identifiziert, die zur Durchführung der Testreihen benötigt werden,
Meilenstein 4: QUASAR QoS Architecture – First Test Results (23 Seiten)
Es werden Bewertungskriterien aufgelistet, sowie die Eigenschaften der zu realisierenden QoS-Dienste und deren Umsetzung. Die QUASAR Experimente beschränken sich zunächst auf die Erbringung eines Premium IP Dienstes auf der Basis des Diffserv EF Per-Hop-Behaviors. Für die ersten Versuchsreihen wurden Audio/Video-Konferenzsysteme auf der Basis von H.323 gewählt. Hierzu wurde im Rahmen von IST SEQUIN ein internationaler Feldversuch Unterbeteiligung von regulären Endnutzergruppen durchgeführt. Es werden diese Versuchsaufbauten beschrieben und erste Messergebnisse dargestellt.
Die Simulationsmodelle für die Untersuchung von gemischtem Verkehr (Echtzeit- und Nicht-Echtzeitverkehr, d. h. TCP und UDP) wurden erstellt.
Die Erbringung entlang der gesamten Ende-zu-Ende-Strecke erfordert die Kooperation aller beteiligten administrativen Domains. Es müssen Vereinbarungen getroffen werden, die zu einer konsistenten Umsetzung der QoS-Anforderungen führen. Hierzu werden im ersten Schritt sogenannte Service Level Agreements zwischen benachbarten administrativen Domains betrachtet. Im Rahmen von GÉANT/SEQUIN wurde eine Template für SLAs entwickelt, die es erlaubt, die Bedingungen und Anforderungen zur Erbringung von IP Premium Diensten zu beschreiben.
Meilenstein 5: QUASAR QoS Architektur (61 Seiten + 15 Seiten Annex)
Es wird die QUASAR QoS Architektur vorgestellt: das vorgeschlagene QoS-Dienste-Modell und eine darauf angepasste QoS-Mess-Infrastruktur. Der Mess-Infrastruktur-Teil der QoS-Architektur umfasst die Darlegung der anfallenden Messaufgaben, die zum Einsatz kommende Mess-Methodik und die hierbei verwendeten Mess-Werkzeuge.
Der Schwerpunkt der in diesem Meilenstein dargestellten Arbeiten konzentriert sich auf die Untersuchung von IP Diensten im experimentellen Versuchsaufbau, der sowohl weiträumige Feldversuche wie auch ergänzende Simulationsmodelle umfasst. In den Experimenten wurde ein komplexes internationales Testbett aufgebaut und es wurden umfangreiche Messreihen durchgeführt. Als Anwendung wurde H.323 Video Conferencing gewählt und unter internationaler Beteiligung im Rahmen des IST Projektes SEQUIN realisiert. Die Ergebnisse werden im zusammengefasst und bewertet. Durch die Beteilung von QUASAR an diesen Messreihen konnte als besonderen Beitrag der Einsatz von passiven Messkomponenten innerhalb des europäischen SEQUIN Testbetts demonstriert werden.
Mittels Simulation wurde untersucht, wie gemischter Echzeit- (UDP) und elastischer (TCP) Verkehr so behandelt werden, kann, dass auf der einen Seite die strengen Anforderungen des Echtzeitverkehrs gewahrt bleiben, auf der anderen Seite aber auch der elastische Verkehr keine unnötigen Nachteile erleidet.
Der Annex enthält den Artikel QoS-Unterstützung in der neuen Generation von Weitverkehrs-Kernnetzen zu den gemeinsamen QUASAR / IST SEQUIN H.232 Video Conferencing Testreihe,
47

der auf der 16. DFN-Arbeitstagung über Kommunikationsnetze, Düsseldorf, 23-25 Mai 2002 präsentiert wurde.
Meilenstein 6: QUASAR QoS-Architektur – Projektabschluß mit Abschlußbericht
Der abschließende Meilenstein bietet einen zusammenfassenden Überblick über die im Projekt erzielten Ergebnisse und präsentiert die Resultate der in der letzten Phase des Projektes durchgeführten Versuchsreihen.
7.2 Projekt Website Das Projekt QUASAR bietet unter der QUASAR Project Home Page (http://www.ind.uni-stuttgart.de/Content/Quasar/) Zugriff auf die im Projekt erstellten öffentlichen Dokumente. Die Home Page informiert über die allgemeinen Projektziele. Die Seite ’Approaches’ enthält Informationen und Graphiken über die im Projekt verwendeten Testbeds und Messwerkzeuge. ’Publication’ erlaubt den Zugriff auf on-line Versionen der öffentlichen Projektdokumente, wie Meilensteine, Präsentationsfolien und Artikel. ’Links’ bietet Verweise auf weitere Websites von Partnerprojekten bzw. Sites mit Projekt relevanten Informationsangeboten, und unter ’Participants’ finden sich die Kontaktadressen und Ansprechpartner der am Projekt beteiligten Institutionen.
7.3 Vorträge und Berichte DFN Technischer Ausschuss, Berlin, 1. März 2001 QUASAR - Quality of Service Architekturen, Projektpräsentation Rudolf Roth, FOKUS
3. BZVD Workshop (Beratungszentrum Videokonferenz-Dienste), Dresden, 12. März 2001 Vortrag: Quality of Service in IP Netzen, Rudolf Roth, FOKUS
DFN QoS Projekte-Treffen Berlin, 25.Oktober 2001 QUASAR - Quality of Service Architekturen, Projektpräsentation Rudolf Roth, FOKUS
DFN Mitteilungen Heft 57 November 2001, Beitrag: Erster Klasse durchs Netz – Quality of Service Architekturen für das G-WiN Rudolf Roth FOKUS, pp.16-18
16. DFN-Arbeitstagung über Kommunikationsnetze, Düsseldorf, 23-25 Mai 2002 Vortrag: QoS-Unterstützung in der neuen Generation von Weitverkehrs-Kernnetzen Rudolf Roth FOKUS
QoS-Unterstützung in der neuen Generation von Weitverkehrs-Kernnetzen und erste Erfahrungen im europaweiten Einsatz Ergebnisse aus den Projekten DFN – QUASAR und IST – SEQUIN Rudolf Roth FOKUS, in: Knop, Haverkamp (Hrsg.) Zukunft der Netze – Die Verletzbarkeit meistern GI-Edition Lecture Notes in Informatics P-17, pp.217- 232
48
Artikel aus der IST SEQUIN / QUASAR Projektkooperation:
IP QoS Across Multiple Management Domains: Practical Experiences from Pan-European Experiments Rudolf Roth, Fraunhofer FOKUS, Mauro Campanella, INFN-GARR, Simon Leinen, SWITCH, Roberto Sabatino and Nicolas Simar, DANTE, Michal Przybylski and Szymon Trocha, Poznan Supercomputing and Networking Center, Athanassios Liakopoulos and Afrodite Sevasti, Greek Research and Technology Network S.A. in IEEE Communications Magazine, Feature Topic on QoS Advances, January 2003
Multidomain End to End IP QoS and SLA, Mauro Campanella, Michal Przybylski, Rudolf Roth, Afrodite Sevasti, Nicolas Simar, 2nd International Workshop on QoS in Multiservice IP Networks (QoS-IP2003) Milano, Italy, February 24-26 2003 Proceedings to be published in Springer LNCN Series
Folgende Arbeiten entstanden auf der Grundlage von Quasar Ergebnissen; sie basieren auf dem Quasar Quellen-Simulationsmodell und betrachten Methoden zur Bandbreiteabschätzung:
L. Burgstahler, M. Neubauer: "New Modifications of the Exponential Moving Average Algorithm for Bandwidth Estimation", 15th ITC-Specialist Seminar, Würzburg, July 2002
L. Burgstahler, M. Neubauer: "Trend-based Modifications of the Exponential Moving Average Algorithm for Bandwidth Estimation", 2nd Polish-German Teletraffic Symposium, Gdansk, September 2002
7.4 Veranstaltungen Universität Stuttgart, Tag der offenen Tür 2001 Universität Stuttgart, Tag der offenen Tür 2002
An einem Demonstrationsaufbau wurde gezeigt, wie mit Hilfe der QUASAR-Architektur (Premium-IP, Best Effort, QBSS) eine Video-Telefonie-Anwendung vor herkömmlichem Verkehr geschützt werden kann. Dazu wurde ein Router gemäß den Vorschlägen aus QUASAR/SEQUIN konfiguriert. Die Video-Telefonie kam mittels H.323-Endsystemen und einem H.323-Gatekeeper zustande. Begleitend zur Demonstration wurde an Schautafeln das QUASAR-Projekt erklärt
Universität Stuttgart, Uni-Tag 2001 Universität Stuttgart, Uni-Tag 2002
Der Uni-Tag dient dazu Schüler mit der Universität und dem Studium vertraut zu machen. Das IND hat im Rahmen seiner Demonstrationen Forschungsarbeiten auf dem Gebiet "Dienstgüte in IP-Netzen" vorgestellt. Dabei kam Video-Telefonie auf der Basis der QUASAR-Architektur zum Einsatz. Den Schülern wurden die momentan unzureichenden Methoden der Dienstgütesicherung in IP-Netzen demonstriert und danach Ansätze zur Verbesserung vorgestellt.
49
QoS Measurement and Monitoring Workshop, Berlin, 3 July 2002, Event supported by Fraunhofer FOKUS and T-Systems Nova GmbH Berkom Supplementary to TF-NGN Meeting, Berlin 1-2 July 2002 http://www.ip-measurement.org/workshop/
QUASAR Abschlussdemonstration und Workshop zu QoS Measurement Berlin, Fraunhofer FOKUS Januar 2003 (exact date to be confirmed)
50
Copyright © 2022 FDOKUMEN