Nanodiamond Dust and the Far-Ultraviolet Quasar Break
17
NANODIAMOND DUSTAND THE FAR-ULTRAVIOLET QUASAR BREAK Luc Binette, 1 Gladis Magris C., 2 Yair Krongold, 1 Christophe Morisset, 1 Sinhue Haro-Corzo, 1 Jose Antonio de Diego, 1 Harald Mutschke, 3 and Anja C. Andersen 4 Received 2005 March 16; accepted 2005 June 1 ABSTRACT We explore the possibility that the steepening observed shortward of 1000 8 in the energy distribution of quasars may result from absorption by dust, being either intrinsic to the quasar environment or intergalactic. We find that a dust extinction curve consisting of nanodiamonds, composed of terrestrial cubic diamonds or with surface impurities as found in carbonaceous chondrite meteorites, such as Allende, is successful in reproducing the sharp break observed. The intergalactic dust model is partially successful in explaining the shape of the composite energy distribution but must be discarded in the end, as the amount of crystalline dust required is unreasonable and would imply an improbable fine- tuning among the dust formation processes. The alternative intrinsic dust model requires a mixture of both cubic diamonds and Allende nanodiamonds and provides a better fit of the UV break. The gas column densities implied are of the order 10 20 cm 2 , assuming solar metallicity for carbon and full depletion of carbon into dust. The absorption only oc- curs in the ultraviolet and is totally negligible in the visible. The minimum dust mass required is of the order 0.003r 2 pc M , where r pc is the distance in parsecs between the dust screen and the continuum source. The intrinsic dust model reproduces the flux rise observed around 660 8 in key quasar spectra quite well. We present indirect evidence of a shallow continuum break near 670 8 (18.5 eV), which would be intrinsic to the quasar continuum. Subject headings: galaxies: active — intergalactic medium — large-scale structure of universe — radiative transfer — ultraviolet: general 1. INTRODUCTION The spectral energy distribution (SED) of active galactic nuclei (AGNs) contains a significant feature in the optical–ultraviolet region, known as ‘‘the big blue bump.’’ As for the emission lines in AGN spectra, it is generally believed that photoionization is the excitation mechanism of the emission lines superimposed to the continuum. Photoionization calculations that reproduce the AGN line ratios and equivalent widths favor an ionizing SED that peaks (in #F # ) in the extreme-ultraviolet (EUV; e.g., Mathews & Ferland 1987; Binette et al. 1988; Ferland et al. 1996; Korista et al. 1997). Satellite observations of distant qua- sars, however, showed that the big blue bump peaks in #F # around k 1000 8 (k rest ) (O’Brien et al. 1988; Zheng et al. 1997; Telfer et al. 2002, hereafter TZ02). 5 This finding is best illus- trated by the composite quasar SED constructed by TZ02, which was obtained by co-adding 332 Hubble Space Telescope (HST ) Faint Object Spectrograph (FOS) archived spectra of 184 quasars with redshifts between 0.33 and 3.6. The composite (reproduced in Fig. 15 in x 5) is characterized by a mean near-ultraviolet ( NUV) index # of 0.69 (F # / # # ), steepening to ’1:76 0:12 in the far-ultraviolet (FUV). The favored interpretation by TZ02, Zheng et al. (1997), and Shang et al. (2005) is that the observed continuum steepening is intrinsic to quasars. Intriguingly, using archived data from the Far Ultraviolet Spectroscopic Explorer (FUSE ), whose sensitivity window extends further in the UV, Scott et al. (2004) performed a similar compilation for ‘‘nearby’’ AGNs with redshifts z q < 0:7 and report the lack of any evi- dence of a steepening in the FUV! Furthermore, the FUSE com- posite spectrum for nearby AGNs is significantly harder than that of TZ02, with # ’0:56 þ0:38 0:28 in the FUV. Arguably, since nearby AGNs are on average less luminous, they may possess an intrinsically different SED. However, a detailed optical–UV study of a subset of the FUSE sample by Shang et al. (2005) fails to reveal any correlation between the FUV index and black hole mass. Therefore, even though the HST FOS and FUSE sam- ples do not represent equivalent AGN populations, the absence of steepening in the FUV for the nearby sample cannot be explained alone by difference in AGN populations. A plausible explanation for the onset and increasing importance of the break in distant AGNs can be provided by intergalactic absorption, since it would scale with distance. In an earlier paper, Binette et al. (2003) ex- plored the possibility that the break might be the result of H i scattering by a tenuous intergalactic component that the authors associated with the warm-hot intergalactic medium. The models, however, predicted a significant flux discontinuity in the region 1050–1190 8 (k obs ), which is not observed in quasar spectra, as shown by FUSE (e.g., Kriss et al. 2001). Furthermore, the warm- hot intergalactic medium is too ionized to produce the amount of H i absorption needed to reproduce the break. In this paper we explore an alternative interpretation that is based on a different opacity vector, namely, dust, either intrinsic to the quasar envi- ronment or intergalactic. The vector responsible for the absorption will consist of grains made of carbon atoms, a major constituent of the interstellar medium (ISM) dust, albeit here in crystalline form (nanodiamonds). We assume that the intrinsic quasar SED con- sists of a simple power law and that deviations from the power law are caused by absorption from crystalline carbon dust, either as pure cubic diamonds or of the type observed in carbonaceous chondrite meteorites (e.g., Allende, Orgueil, and Murchison). Many mechanisms have been proposed to explain the formation 1 Instituto de Astronomı ´a, Universidad Nacional Auto ´noma de Me ´xico, Apartado Postal 70-264, 04510 Me ´xico, DF, Mexico; [email protected]. 2 Centro de Investigaciones de Astronomı ´a (CIDA), Apartado Postal 264, Me ´rida 5101-A, Venezuela; [email protected]. 3 Astrophysikalisches Institut und Universita ¨ts-Sternwarte (AIU ), Schiller- ga ¨sschen 3, D-07745 Jena, Germany; [email protected]. 4 Dark Cosmology Center, Juliane Maries Vej 30, DK-2100 Copenhagen, Denmark; [email protected]. 5 In the text, k rest and k obs will indicate whether the wavelength refers to the quasar rest frame or the observer frame, respectively; k rest ¼ (1 þ z q ) 1 k obs . 661 The Astrophysical Journal, 631:661–677, 2005 October 1 # 2005. The American Astronomical Society. All rights reserved. Printed in U.S.A.
-
Upload
independent -
Category
Documents
-
view
1 -
download
0
Transcript of Nanodiamond Dust and the Far-Ultraviolet Quasar Break

NANODIAMOND DUST AND THE FAR-ULTRAVIOLET QUASAR BREAK
Luc Binette,1Gladis Magris C.,
2Yair Krongold,
1Christophe Morisset,
1Sinhue Haro-Corzo,
1
Jose Antonio de Diego,1Harald Mutschke,
3and Anja C. Andersen
4
Received 2005 March 16; accepted 2005 June 1
ABSTRACT
We explore the possibility that the steepening observed shortward of 10008 in the energy distribution of quasarsmayresult from absorption by dust, being either intrinsic to the quasar environment or intergalactic. We find that a dustextinction curve consisting of nanodiamonds, composed of terrestrial cubic diamonds or with surface impurities asfound in carbonaceous chondritemeteorites, such asAllende, is successful in reproducing the sharp break observed. Theintergalactic dust model is partially successful in explaining the shape of the composite energy distribution but must bediscarded in the end, as the amount of crystalline dust required is unreasonable and would imply an improbable fine-tuning among the dust formation processes. The alternative intrinsic dust model requires a mixture of both cubicdiamonds and Allende nanodiamonds and provides a better fit of the UV break. The gas column densities implied are ofthe order 1020 cm�2, assuming solar metallicity for carbon and full depletion of carbon into dust. The absorption only oc-curs in the ultraviolet and is totally negligible in the visible. Theminimumdustmass required is of the order�0.003r2pc M�,where rpc is the distance in parsecs between the dust screen and the continuum source. The intrinsic dust modelreproduces the flux rise observed around 660 8 in key quasar spectra quite well. We present indirect evidence of ashallow continuum break near 670 8 (18.5 eV), which would be intrinsic to the quasar continuum.
Subject headings: galaxies: active — intergalactic medium — large-scale structure of universe —radiative transfer — ultraviolet: general
1. INTRODUCTION
The spectral energy distribution (SED) of active galactic nuclei(AGNs) contains a significant feature in the optical–ultravioletregion, known as ‘‘the big blue bump.’’ As for the emission linesin AGN spectra, it is generally believed that photoionization isthe excitation mechanism of the emission lines superimposedto the continuum. Photoionization calculations that reproducethe AGN line ratios and equivalent widths favor an ionizingSED that peaks (in �F�) in the extreme-ultraviolet (EUV; e.g.,Mathews & Ferland 1987; Binette et al. 1988; Ferland et al.1996; Korista et al. 1997). Satellite observations of distant qua-sars, however, showed that the big blue bump peaks in �F�
around k1000 8 (krest) (O’Brien et al. 1988; Zheng et al. 1997;Telfer et al. 2002, hereafter TZ02).5 This finding is best illus-trated by the composite quasar SED constructed by TZ02, whichwas obtained by co-adding 332 Hubble Space Telescope (HST )Faint Object Spectrograph (FOS) archived spectra of 184 quasarswith redshifts between 0.33 and 3.6. The composite (reproducedin Fig. 15 in x 5) is characterized by amean near-ultraviolet (NUV)index �� of�0.69 (F� / ��� ), steepening to’�1:76 � 0:12 inthe far-ultraviolet (FUV). The favored interpretation by TZ02,Zheng et al. (1997), and Shang et al. (2005) is that the observedcontinuum steepening is intrinsic to quasars. Intriguingly, usingarchived data from the Far Ultraviolet Spectroscopic Explorer(FUSE ), whose sensitivity window extends further in the UV,
Scott et al. (2004) performed a similar compilation for ‘‘nearby’’AGNs with redshifts zq < 0:7 and report the lack of any evi-dence of a steepening in the FUV! Furthermore, the FUSE com-posite spectrum for nearby AGNs is significantly harder thanthat of TZ02, with �� ’ �0:56þ0:38
�0:28 in the FUV. Arguably, sincenearby AGNs are on average less luminous, they may possessan intrinsically different SED. However, a detailed optical–UVstudy of a subset of the FUSE sample by Shang et al. (2005)fails to reveal any correlation between the FUV index and blackhole mass. Therefore, even though theHST FOS and FUSE sam-ples do not represent equivalent AGN populations, the absence ofsteepening in the FUV for the nearby sample cannot be explainedalone by difference in AGN populations. A plausible explanationfor the onset and increasing importance of the break in distantAGNs can be provided by intergalactic absorption, since it wouldscale with distance. In an earlier paper, Binette et al. (2003) ex-plored the possibility that the break might be the result of H i
scattering by a tenuous intergalactic component that the authorsassociated with the warm-hot intergalactic medium. The models,however, predicted a significant flux discontinuity in the region1050–1190 8 (kobs), which is not observed in quasar spectra, asshown by FUSE (e.g., Kriss et al. 2001). Furthermore, the warm-hot intergalactic medium is too ionized to produce the amount ofH i absorption needed to reproduce the break. In this paper weexplore an alternative interpretation that is based on a differentopacity vector, namely, dust, either intrinsic to the quasar envi-ronment or intergalactic. The vector responsible for the absorptionwill consist of grainsmade of carbon atoms, amajor constituent ofthe interstellar medium (ISM) dust, albeit here in crystalline form(nanodiamonds). We assume that the intrinsic quasar SED con-sists of a simple power law and that deviations from the power laware caused by absorption from crystalline carbon dust, either aspure cubic diamonds or of the type observed in carbonaceouschondrite meteorites (e.g., Allende, Orgueil, and Murchison).Many mechanisms have been proposed to explain the formation
1 Instituto de Astronomıa, Universidad Nacional Autonoma de Mexico,Apartado Postal 70-264, 04510 Mexico, DF, Mexico; [email protected].
2 Centro de Investigaciones de Astronomıa (CIDA), Apartado Postal 264,Merida 5101-A, Venezuela; [email protected].
3 Astrophysikalisches Institut und Universitats-Sternwarte (AIU), Schiller-gasschen 3, D-07745 Jena, Germany; [email protected].
4 Dark Cosmology Center, Juliane Maries Vej 30, DK-2100 Copenhagen,Denmark; [email protected].
5 In the text, k rest and kobs will indicate whether the wavelength refers to thequasar rest frame or the observer frame, respectively; k rest ¼ (1þ zq)
�1kobs.
661
The Astrophysical Journal, 631:661–677, 2005 October 1
# 2005. The American Astronomical Society. All rights reserved. Printed in U.S.A.

of diamond nanocrystallites (see x 7). About half of them re-quire intense UVirradiation. Interestingly, a significant UV flux ispresent in the two Herbig Ae/Be objects, for which nanodiamondemission bands have been confirmed first (Van Kerckhoven et al.2002). Processes that form nanodiamonds by UV irradiation areparticularly relevant, since quasars are UV powerhouses and theirenvironment might lead to physical conditions that favor the emer-gence of carbon-based nanocrystallite grains.
The paper is structured as follows: Following the introduc-tion in x 1, we describe in x 2 the dust models and the algorithmused to compute the transmission function. The methodologyand classification of the spectra are described in x 3. In xx 4 and 5we present the intrinsic and intergalactic dust absorption mod-els, respectively, and compare themwith the observed spectra. Inx 6 we decide which of the two models is to be preferred, andwe discuss a possible final model. In x 7 we focus on the forma-tion and physical properties of nanodiamonds, and we followwith the conclusions in x 8.
2. PROCEDURE AND CALCULATIONS
2.1. Dust Extinction Curves
In order to account for the sharp SED break by way of dustabsorption, we looked for an absorption vector that peaks in theFUV (k < 10008) and yet causes negligible absorption at wave-lengths longer than 1200 8. Ideally, as it is the case with the ISMdust, the grain particles should be composed of the most abundantelements. In both aspects, the crystalline form of carbon is themost appealing candidate and is the basis of this paper. Weconsider two types of materials: the terrestrial cubic (pure) di-amonds and the nanodiamonds as found in meteorites.
A comparison of the UV extinction properties of the terres-trial diamonds and the meteoritic nanodiamonds can be found inMutschke et al. (2004). The authors separated the nanodiamondsfrom the Allende6 meteorite sample and determined their opti-cal constants. The meteoritic nanodiamonds differ in their opticalproperties from the cubic diamond as a result of chemical impu-rities (e.g., H, N) and of restructured or unsaturated bonds at theirsurface.
Following a standard procedure, we calculated a set of dustextinction curves. We assumed that the grains are spherical andthat a power law describes the differential distribution of grainsizes, dngr(a)/da ¼ CgrnHa
� , where ngr is the volume density ofgrains, nH that of hydrogen, a the grain radius, � the power-law7
index, and Cgr the normalization constant, such that the density ofgrains becomes normalized to the abundance of the dust con-stituents with respect to hydrogen.We adopted the tabulated com-plex refraction indices nþ ik of Mutschke et al. (2004) for theAllende meteorite nanodiamonds and of Edwards & Philipp(1985) for the cubic8 (terrestrial) nanodiamonds. The Mie theory
was used to compute the extinction cross section Qext(a; k; n;k), using a modified version of the published subroutine BHMIEof Bohren & Huffman (1983). The extinction cross section isnormalized with respect to the gas density nH, using the followingintegrals:
nH�Hk ¼ nHCgr
Z amax
amin
�a3þ�Qext(a; k; n; k)d ln a;
Vgr ¼4
3
Z amax
amin
�a4þ�d ln a;
where amin and amax are the minimum and maximum values ofthe grain radii considered. The gas opacity is given by the in-tegration of d�extk ¼ nH�
Hk dr. Neglecting the contribution of
elements other than carbon to the composition of the nano-diamonds, we adopt a meanmolecular weight of �gr ¼ 12for thegrains. The value of the normalization constant Cgr is obtainedby solving the following:
ZC�grmH ¼ �grCgrVgr ;
where ZC is the carbon abundance by number with respect to H,mH is the hydrogen atom mass, and �gr is the density of the grainmaterial. The values adopted for �gr are 2.3 (Lewis et al. 1989)and 3.51 g cm�3 for the Allende and the cubic nanodiamonds,respectively. For the grain size exponent, we adopted � ¼ �3:5.Since we know neither the gas metallicity nor the dust-to-gasmass ratio, we assume that all carbon is locked in dust and adoptthe solar value of 3:63 ;10�4 for the C abundance, for the solepurpose of procuring a convenient normalization.The solid lines in Figure 1 represent the extinction curves
adopted in this paper. The curves labeled D1 and A1 representthe ‘‘small size regime’’ extinction curves for terrestrial dia-monds (red line) and for meteoritic nanodiamonds (blue line),respectively. In both extinction models, amin ¼ 3 8 and amax ¼25 8. In this regime, decreasing further amax would not alterthe extinction curve. Our extinction curve A1 (blue line) is verysimilar in shape to the mass absorption coefficient curve deter-mined by Mutschke et al. (2004; see their Fig. 7 or our scaledversion of it, the green dotted line in Fig. 1). A third dust model,which is also useful, is the Allende curve labeled A3 (orangeline), whose grain sizes extend up to 200 8. The peak cross sec-tions for the curves D1, A1, and A3 occur at wavelengths 640,741, and 7878, respectively. Meteoritic nanodiamonds are knownto possess a median radius a of �15 8. When increasing amax
to a value of �50 (75) 8 for the Allende (terrestrial cubic)nanodiamonds, one finds that the peak absorption starts shiftingnoticeably to the right and the absorption profile widens some-what. This is illustrated by the two long-dashed lines in Figure 1,both calculated with amax ¼ 100 8. The above-mentioned curveA3 further extends the grain size range to amax ¼ 200 8, whichsignificantly shifts the broad absorption peak toward longerwavelengths.As shown in x 4, the extinction curves D1 and A1 (or A3 in
x 5) can reproduce the wide range of continuum steepening ob-served in the FUVin quasar SEDs. Both types can induce a sharpabsorption break, although the cubic diamond is more extreme inthis respect. This does not occur with ISM dust extinction. Forcomparison, we plot an ISM dust model fromMartin & Rouleau(1991) (with � ¼ �3:5) in Figure 1, which consists of silicateand graphite grains of sizes comprised between amax ¼ 2500 8and amin ¼ 50 8 (black short-dashed line). It is evident that thecustomary ISM extinction curve, while reaching a maximum in
6 Carbonaceous chondrite meteorites are relatively rare, at a frequency ofonly�3.5%. The Allendemeteorite, which fell on Earth near the town of Allendein the state of Chihuahua,Mexico, on 1969 February 8, is one of the most studiedmeteorites of its kind.
7 A lognormal distribution is more appropriate (Lewis et al. 1989) for de-scribing the nanodiamond size distribution. However, because we intended toexplore a much broader size range than that found in Allende, we considered itmore convenient to use a power law for this purpose. The reason is that only oneparameter needs to be varied (amax), while in the case of the lognormal distri-bution, we would need to vary two parameters simultaneously (the mean sizevalue and the distribution’s width).
8 The extinction cross sections for cubic diamonds were extrapolated in theFUV, since we could not find published laboratory values of the refractionindices shortward of 413 8.
BINETTE ET AL.662 Vol. 631

the UV, still absorbs significantly longward of the peak, whichgives rise to a shallow change of index, rather than a sharp break.Grain size is not the main cause for such differences in relation tonanodiamonds, but rather the type of material being considered.To illustrate this, we show a small grain extinction curve used byBinette et al. (1993) to study the scattered continuum of PKS2152�69; it has the same composition as the ISMmodel, but thesize range is reduced to amax ¼ 5008 (Fig. 1, black dotted line).The cross section redward of the extinction peak remains tooshallow to reproduce the sharp break of quasars. Shang et al.(2005) explored the possibility that the standard ISM or even anSMC-like extinction curve could reproduce the QSO break.Their conclusion is that reddening by ISM or SMC-like grains‘‘is not able to produce the spectral break seen in the AGNsample, without leaving a clear signature at longer wavelengths’’(which usually is not seen). Notice that the cubic diamond curveshows a rather narrow peak at �650 8 followed by a lower pla-teau at�5008. These particularities of the cubic diamond crosssection, together with the very steep rise shortward of 1000 8,are unique features that should leave a clear imprint wheneverthis material is responsible for the extinction. The extinction atoptical wavelengths due to nanodiamonds is negligible. For in-stance, with an opacity of unity at 912 8, the extinction in the Vband (krest) is as small as AV ¼ 10�4 and 5 ; 10�7 mag in thecase of the A1 and D1 curves, respectively.
The extinction curves D1 and A1 (or A3) as defined abovewill suffice to test the dust absorption hypothesis. Instead of
using optically known materials, one could have treated theabsorption hypothesis as an inverse problem, working out theextinction curve that succeeds best. Considering that the currentstudy is mostly exploratory in nature, we consider that it confersa higher degree of plausibility to use an empirical curve such asthat of the Allende meteorite, rather than an invented crosssection.
2.2. Calculation of the Transmission Curve
The basic assumption behind the current work is that the breakobserved in the spectra is a manifestation of dust absorption andis therefore not an intrinsic feature of the SED. A key aspect inevaluating how well the dust absorption hypothesis fares is toassume that we can extrapolate the power law observed in theNUV to the region underlying the break. Any departure of theobserved spectrum from the extrapolated power law will bemodeled as ‘‘absorption.’’ Only in x 6.3 is a broken power lawconsidered for the FUV. In our notation, the ‘‘true’’ or intrin-sic quasar SED is described by either one of the followingexpressions:
Fq� ¼ A �
�0
� �þ��
;
Fq
k ¼ B kk0
� �k
¼ Bkk0
� �� 2þ��ð Þ;
where �0 and k0 (=912 8) are the ionization thresholds of hy-drogen in frequency and in wavelength units, respectively, while�� and k are the corresponding power-law indices.A and B arenormalization constants, one of which is set to unity accordingto whether Fq
� (i.e., A) or Fq
k (i.e., B) is plotted, respectively.In keeping with the tradition in AGN literature, the index thatwe quote in the text is always ��. On par with the work of TZ02and Zheng et al. (1997), we prefer to plot Fk(k) for most figures.The FUV region beyond the break is better represented using Fkthan F� , as can be appreciated by comparing the two panels ofFigure 2.
2.2.1. Intrinsic Dust Absorption
The (modeled) transmitted flux in the one-dimensional case isgiven by Fmod
k ¼ TkFqk, where Tk is the transmission function,
which for a point source is simply the exponential e�� extk . To com-
pute the opacity �extk ¼ NH�Hk in the case of dust at the redshift
of the quasar, all that is required is to specify the absorptioncolumn NH and select one, or a combination, of the extinctioncurves described in x 2.1.
2.2.2. Intergalactic Dust and the Simulationof the Composite Spectrum
If the dust is intergalactic, it is necessary to integrate the trans-mission along the line of sight to the quasar. Because we alsointend to simulate the process of constructing a composite spec-trum from synthetic quasar SEDs, we developed the followingnumerical procedure. Briefly, the simulation of the compositewill consist in multiplying each synthetic quasar spectrum by theappropriate transmission function and then co-adding them inthe quasar rest frame. The synthetic spectra, before dust absorp-tion, share the exact same SED but differ in redshift and in spec-tral coverage. In the simulation, we adopted the same set ofquasar redshifts as those in the TZ02 sample, as well as the sameset of wavelength limits for the synthetic spectra as those char-acterizing the TZ02 archived spectra. Each synthetic spectrum
Fig. 1.—Extinction cross sections for nanodiamonds of radii in the range3–25 8 from the Allende meteorite (blue solid line labeled A1) and for dustgrains consisting of (terrestrial) cubic diamonds (red solid line labeledD1). Thetwo long-dashed lines illustrate the effect of increasing amax to 100 8, corre-sponding to dust models A2 and D2 (labels not shown). Finally, the curve A3corresponds to the case of increasing amax to 200 8 (orange solid line). Thedotted section of the terrestrial diamond curves shortward of 4138 correspondsto an extrapolation, as the refraction indices are not available. The green dottedline is the Mutschke et al. (2004) mass absorption coefficient curve, which isrenormalized so that its maximum coincides with the A1 curve. The two curvesbarely differ, except longward of 12008. The black dashed line corresponds to amodel of the ISM dust by Martin & Rouleau (1991). The ‘‘small grains’’ dottedline is the same model, but with amax reduced (from 2500 8) to 500 8 (Binetteet al. 1993).
NANODIAMOND DUST AND FUV QUASAR BREAK 663No. 2, 2005

corresponding to a given quasar at redshift zq is divided into en-ergy bins, and for each rest-frame bin kj, we calculate the (mod-eled) transmitted flux Fmod
kj¼ F
q
kjTkj ¼ F
q
k je�� (kj), making use
of the integrated opacity along the line of sight up to zq:
� kj� �
¼R zq0nH zð Þ�H
k
kj1þ z
� �dl
dzdz ;
where �Hk is the dust extinction cross section evaluated at
wavelength kj/(1þ z) and nH(z) is the intergalactic dust den-sity expressed in terms of the hydrogen density.
For the calculations of distances, dl/dz, and baryonic densities,we assume the concordance �CDM cosmology with parametersderived from theWMAP experiment (Spergel et al. 2003), that is,�� ¼ 0:73, �M ¼ 0:27, h ¼ 0:71, with h ¼ H0/100 and a bary-onic mass of �barh
2 ¼ 0:0224 corresponding to a hydrogendensity at zero redshift of n0bar ¼ 2:06 ; 10�7 cm�3.
3. METHODOLOGY
3.1. The Initial Database
The spectral database adopted in this work is that of TZ02,which was kindly lent to us by R. C. Telfer. It comprises 332spectra, mostly HST FOS,9 of 184 quasars, already reduced andcorrected for Galactic dust extinction. The spectra furthermorehave been corrected by TZ02 for the presence of Lyman limitabsorbers (down to � > 0:3) and of the Ly� absorption valley(caused by the cumulated absorption from unresolved Ly� forestlines).
3.2. NUV and FUV Spectral Indices
We define the FUVas the wavelength region shortward of thebreak from 300 to 1000 8, the NUVas the 1000–3200 8 regionlongward of the break, and the optical–UVas the 3200–4200 8region.Throughout this paper we refer to the power-law index long-
ward of the break as �NUV and that shortward as �FUV. We as-sume that the intrinsic SED power-law index, ��, has the samevalue in the region of the break as in theNUV, hence�� ¼ �NUV.Whenever possible, the adopted value for �NUV will be the valuethat we estimate empirically, using the adjacent NUV region ofthe HST FOS spectrum. This value is to be preferred over pub-lished values, which correspond to a forced fit of the combinedoptical–UV region. The HST FOS �NUV indices are usually sig-nificantly harder. They are more appropriate for the exercise athand, which relies on having a dependable SED description im-mediately longward of the break that can be extrapolated oneoctave shortward, in the region of the break itself.
3.3. Preanalysis of the HST FOS Sample
Following a preliminary analysis of the TZ02 sample and ofthe properties of dust models, we established the following:
1. Individual quasar spectra provide stronger constraints tothe models than a single composite spectrum. The process ofco-adding varied spectra to construct the composite inevitablyleads to a loss of valuable information. Modeling the compositespectrum is probably an essential exercise but does not con-stitute a determinant proof of the validity of any model. Forthese reasons, we concentrate here on fitting individual quasarSED.2. Since combined multigrating spectra extend over a larger
wavelength domain, they provide stronger constraints for the mod-els than single-grating spectra. For this reason, this work consid-ers only those 106 spectra of the TZ02 sample that correspondto a combination of two or three HST FOS gratings.10
3. In the process of looking for patterns among the numerousspectral shapes encountered, we found it beneficial to classifythese according to the signs by which dust absorption apparentlymanifests itself. The proposed classification is nothingmore thana convenient and simplified characterization of the big blue bumpphenomenology found among the archived HST FOS spectra.By no means does it imply that the quasars themselves are
Fig. 2.—Qualitative description of the three main spectral classes defined inx 3.4. (a) Arbitrary scale in F� . (b) Arbitrary scale in Fk for the same spectrashown in (a). The Fk representation offers a clearer view of the steepened FUVregion. The dotted line illustrates typical variations within a given class. Of the106 multigrating HST spectra available, only the 61 spectra that extended be-yond the break, down to at least 900 8, could be classified reliably. The verticaldashed line represents the position of the Lyman limit (912 8 k rest).
9 Note that the TZ02 sample includes three HST Space Telescope ImagingSpectrograph (STIS) and six HST Goddard High Resolution Spectrograph(GHRS) spectra.
10 Of particular interest are quasars in the redshift range 0.9–2, for which thespectrum corresponds to a combination of three gratings. In these, the break is infull view and, in most cases, there is sufficient wavelength coverage, longward ofthe break, to infer the spectral index �NUV and, shortward of the break, to dis-tinguish absorption features that the models must reproduce.
BINETTE ET AL.664 Vol. 631

intrinsically different as a result of their spectra belonging toone class or another.
3.4. Classification of Multigrating Spectra into classes A–D
A physical insight on how dust can alter the continuum shapeand account for the break has led to the classification of the multi-grating spectra into four groups. The three most relevant groupsare qualitatively described in Figure 2a. The four classes aredefined as follows:
1. The spectra that show a continuum steepening near 10008(krest) belong to class A. The NUV spectrum is hard in thesespectra and the FUV shows a moderately steepened continuum.PG 1148+549 (zq ¼ 0:969) can be considered the archetype ofthis class (see Fig. 5). We tentatively assign the seven spectra(usually high-redshift quasars), whose NUV FOS spectrum isnot available longward of 1300 8, to class A. HS 1700+6416(z ¼ 2:722), for instance, is classified as class A (Fig. 13). Morethan 60% of quasars, whose spectra extended sufficiently intothe FUV to determine �NUV, belong to class A alone. This mayexplain why the spectra of this class individually resemble theTZ02 composite shape, since the composite is after all the resultof averaging spectra that more often than not belong to class A.
2. The spectra that show a sharp break near 10008, followedby an extremely steep continuum drop shortward of the break,belong to class B. The NUV spectrum is hard in these spec-tra. PG 1248+401 (zq ¼ 1:03) in Figure 3 can be considered thearchetype of this class. Another example is PKS 0122�00(zq ¼ 1:07) in Figure 4. Objects in this class are not that common(only six) yet striking11 by their lack of a significant flux in theFUV.
3. The spectra that show a continuum that is already softlongward of the break, that is, up tok16008, belong to class C.The soft region of the continuum now extends to include thecontinuum beneath the C iv k1549 doublet (or even down toC iii] k1909 in some cases). A representative class C spectrumis the quasar 1130+106Y in Figure 11 (zq ¼ 0:54). In many casesa single power law does not fit the NUV part well, and in othercases the index is very steep (<�1) throughout the whole spec-trum, as exemplified by 3C 279 in Figure 11 (green spectrum). Inthe FUV, these objects show characteristics of either class A orB; that is, they are either flat in Fk or very steeply declining, asillustrated byMC 1146+111 (zq ¼ 0:863; cyan spectrum), whichexhibits a class B–like break. We found eight objects with theabove characteristics.12
4. The high-redshift quasars (three objects) that we could notmake sense of belong to class D. They are objects that show aninflection or wide trough in the FUV. HE 1122�1649 is oneexample (see Fig. 18, blue spectrum). We do not rule out that thetroughs could be associated in some cases with one or more Ly�absorption systems.
Only 61 of the available 106 multigrating spectra extendedsufficiently shortward of the break, that is, down to at least 9008,to ensure proper classification. Therefore, only this subset of61 quasars has been analyzed in detail and modeled. Of these, 44are class A, 6 class B, 8 class C, and 3 class D. We mainly focuson class A and B spectra. These two groups together represent82% of the classified objects and will suffice for the purpose of
testing the dust absorption hypothesis. Many interesting spectrathat could not be shown in this paper will appear elsewhere (e.g.,Binette et al. 2005a, 2005b, 2005c). As for class C, dust appearsto be related to some of the observed characteristics of at leasta fraction of them (x 4.3), but further work will be needed toreach definite conclusions. The few objects that form class Dare puzzling and will not be modeled with dust absorption in thispaper.
3.5. Absorption Models Considered:Intergalactic versus Intrinsic
In order to explore how dust absorption might be the realcause of the observed break, a decision must be made on wherethe dust is located. The answer to this question defines two ba-sic13 types of absorption models: (1) the dust is intrinsic to theenvironment of the quasars, and (2) the dust fills the intergalacticspace. In case 1, the transmission function is derived directlyfrom the extinction curve in the rest frame of the quasar, asmentioned in x 2.2.1. With this category of models, we mayreasonably expect the amount of dust to vary more or less at ran-dom from object to object. In case 2, the dust distribution is in-tergalactic and fills large volumes of space. We therefore expectthat such a dust distribution should be, to first order, homoge-neous, since the dust becomes a cosmological component un-related to the quasars. With case 2, the models predict the sametransmission for objects of comparable redshifts, independentlyof class. The dust density, nH(z), a function of redshift as men-tioned in x 2.2.2, has to be determined, requiring extra con-straints. Intergalactic models imply enormous amounts of dust,since it is cosmological. We first study the intrinsic dust case andthen proceed to the intergalactic case.
In all figures, when overlaying a dust absorbed model to therest-frame spectrum of a particular quasar at redshift zq, we fol-low the following coding: the solid line part depicts the wave-length region corresponding to an idealized FOS spectrographwindow extending from 1250 to 36008 (kobs), while the dashedline represents an extension into the FUV down to 915 8 (kobs ),as would be available using the FUSE satellite. A dotted line isused outside these two observer-frame windows.
4. THE CASE FOR INTRINSIC DUST
The case in favor of intrinsic dust absorption is best madeby going through each class in order of increasing complex-ity of the dust model that it requires, that is, in the order B, A,and C.
4.1. Class B Spectra
Although class B objects are not numerous, they give us animportant clue on how to disentangle various effects resultingfrom dust absorption. What characterizes this class is the verysteep drop of the UV flux shortward of 1000 8 (krest). Class Bobjects can easily be accounted for by simply using the extinc-tion curveD1 consisting of terrestrial cubic nanodiamonds and ad-justing as needed the absorption column14 NH. This is illustrated
11 Ton 34, which was reported to have an index of �FUV ¼ �5:3 by TZ02, isanother example, but only a single-grating spectrum exists.
12 Having access only to the NUV spectrummay suffice for classifying quasarsinto class C, but, in keeping with the above classification rules, we did not considernor classify any spectrum that did not extend down to at least 900 8 in the FUV.
13 Since the spectra have already been corrected for Galactic reddening, thereis no reason to be concerned by Galactic dust absorption.
14 It is likely that only a small fraction of carbon is actually locked intonanodiamond grains. Supposingwe independently knew the dust-to-gas ratio dueto nanodiamonds�C
DTG and that it was smaller than 0.0031, which correspondsto depleting all the carbon onto dust, then the absorption columns quoted in thispaper would have to be multiplied by the factor 0:0031/�C
DTG. The GalacticISM dust is characterized by a much larger�ISM
DTG ’ 0:009, since it contains manyother atomic species than C.
NANODIAMOND DUST AND FUV QUASAR BREAK 665No. 2, 2005

in Figure 3, which shows the spectrum of the archetype class Bquasar, PG 1248+401. The red line corresponds to a model us-ing the curve D1 and an absorption column density NH of 3:2 ;1020 cm�2 (hereafter the notation N20 ¼ 3:2 is used). The as-sumed underlying power-law index is �� ¼ �NUV ¼ 0:0, whichis the index that best fits the emission-line–free continuum long-ward of Ly�. In all our plots, it is the quasar spectrum that wescale, until an overlap with the model is obtained in the NUV.The resulting spectrum scaling factor,Mf 14 , is listed in each cap-tion in units of 1014 erg�1 cm2 s8. Since we assume the intrinsicSED to be described by a simple power law (until x 6.3), the plot-ted models in all figures correspond to the function F mod
k ¼Tk(k /912)
�(2þ�� ), and the y-axis can be used to infer the trans-mission value Tk for any value of k.
The only free parameter of the above D1 dust model is thecolumn N20. The position of the peak in transmission overlapssurprisingly well with that of the observed spectrum. This is theresult of the very sharp drop in cross section of curve D1 long-ward of �1000 8 (see Fig. 1, red line), a property unique tocubic diamonds among dust grains composed of pure carbon. Itis important to note that class B objects cannot be accounted forby making use of the Allende extinction curves A1 or A3 be-cause these are characterized by a broader absorption peak andthe peak itself is shifted toward higher k-values. The blue line
in Figure 3 illustrates the case of using curve A1. The relativesuccess of the D1 dust model is telling us that if dust were indeedresponsible for the break in class B objects, it must mostly con-sist of cubic diamonds. This does not rule out that a small frac-tion of the dust may be of the Allende type. This is demonstratedby the green line, which corresponds to a model with N20 ¼ 2:8and a linear dust mixture of 85% of D1 grains and 15% of A1grains. Hereafter we use the notation of fD1 ¼ 0:85 to repre-sent the fraction of D1 grains, with 1� fD1 being the fraction ofA1 grains.Other class B quasars are PKS 1229�02 and PKS 1424�11,
which are quite similar to PG 1248+401. They require mod-els with dust columns of N20 ¼ 3:6 and 2.0, respectively, and anextinction curve consisting totally or mostly of cubic diamondtype D1. In Figure 4 we show another B-type spectrum, quasarPKS 0122�00, which requires somewhat less dust. For this ob-ject, the green line model has N20 ¼ 2:0 and consists of a dustmixture with fD1 ¼ 0:8. It appears that the model with a mixtureof dust types D1 and A1 results in a fit superior to that of the blueline model with pure cubic diamond extinction (with fD1 ¼ 1:0and N20 ¼ 2:3).In summary, class B spectra require dust that predominantly
consists of cubic diamonds. The particular absorption character-istics of cubic diamonds fit the observed FUV steep drop partic-ularly well. Due to the large dust opacities implied, there subsistslittle or no FUV flux to be observed in these objects shortward of800 8. If photoionization by high-energy UV photons is theexcitation mechanism of the emission lines, it is puzzling to findthat the same high-excitation emission lines are observed in classB quasars, devoid of hard UV, as in other objects that do havea hard continuum (e.g., HS 1700+6416 with �FUV ¼ �0:55;Reimers et al. 1989). A possibility is that the dust lies outside the
Fig. 3.—Spectrum of PG 1248+401 (k rest ). The combined spectrum (gratingsG190H+G270H) of PG 1248+401 is shown by the solid thin black line and hasbeen multiplied by the scaling factor 0:75 ; 1014 erg�1 cm2 s 8 (hereafter thenotation Mf 14 ¼ 0:75 is used). Pointers indicate the position of relevant emissionlines identified by TZ02 in their composite spectrum. Red line: Absorption modelas a function of rest-frame k using extinction curve D1 (cubic diamond), columnN20 ¼ 3:2, and an SED with �� ¼ 0:0. The intrinsic quasar SED assumed (notshown) is a power law F
q
k ¼ (k/912)�( 2þ�� ), hence Fq912 � 1 (in all figures). The
blue line represents an absorption model of equal column N20 ¼ 3:2, which usesthe extinction curve A1 (Allende nanodiamonds). The green line corresponds toa model with N20 ¼ 2:8 and a dust mixture with fD1 ¼ 0:85, that is, 85% D1grains and 15% A1 grains. Underneath the green line lies the intergalactic model(orange line) of x 5.1 combined with intrinsic dust with column N20 ¼ 1:8 andfD1 ¼ 1:0. In all models, the solid line part corresponds to a fiducial spectrographwindow extending from 1250 to 3600 8 (kobs), while the dashed line representsan extension of the model into the FUV, down to 9208 (kobs). A dotted line is usedin models outside these two observer-frame windows (see x 3.5).
Fig. 4.—Spectrum of PKS 0122�00 (gratings G190H+G270H) multipliedbyMf 14 ¼ 1:1. The notation is the same as in Fig. 3. Red line: Absorption modelusing extinction curve D1 (cubic diamond), column N20 ¼ 2:3, and an SEDwith �� ¼ �0:55. The blue line represents a model using the extinction curveA1 (Allende nanodiamonds) and a column N20 ¼ 2:0, while the green line cor-responds to a model with N20 ¼ 2:0 and a dust mixture fD1 ¼ 0:8. Underneaththe green line lies the intergalactic model (orange line) of x 5.1 combined withintrinsic dust with column N20 ¼ 1:0 and fD1 ¼ 1:0.
BINETTE ET AL.666 Vol. 631
broad-line region (BLR). In this case, the emission-line BLRclouds would be exposed to an ionizing continuum that is notabsorbed.
4.2. Class A Spectra
4.2.1. A Mixture of the Two Nanodiamond Grain Types
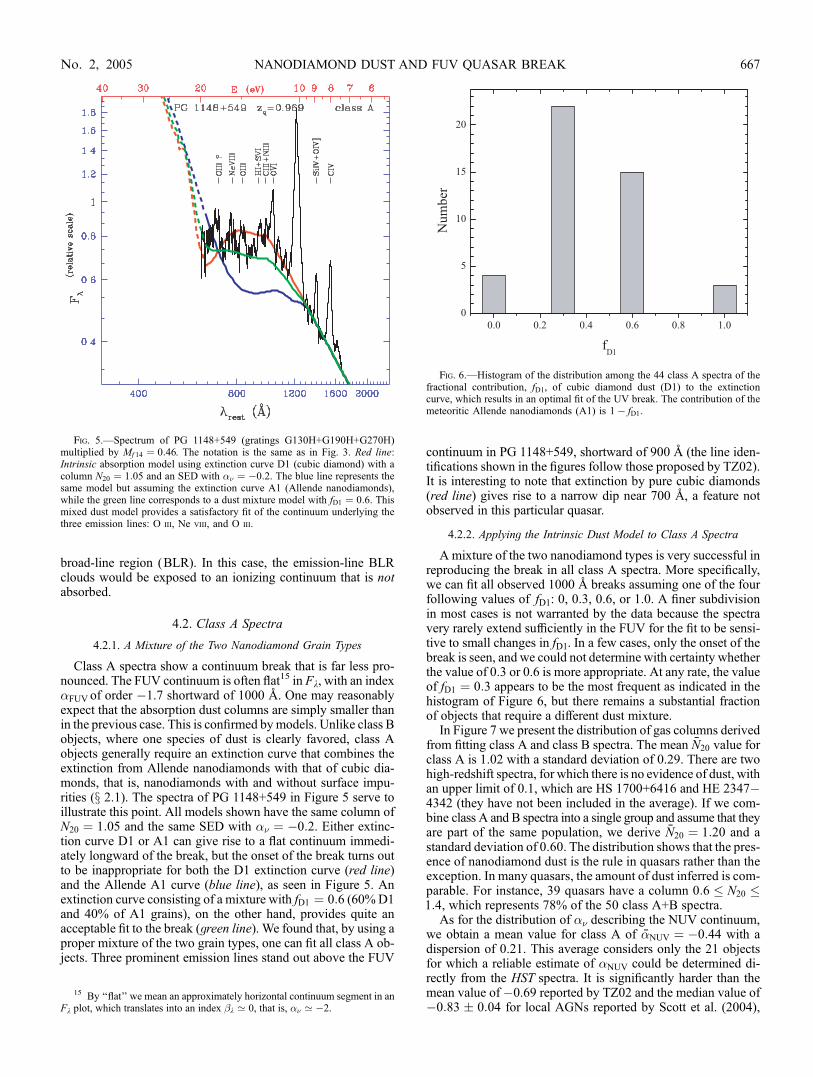
Class A spectra show a continuum break that is far less pro-nounced. The FUV continuum is often flat15 in Fk, with an index�FUV of order �1.7 shortward of 1000 8. One may reasonablyexpect that the absorption dust columns are simply smaller thanin the previous case. This is confirmed bymodels. Unlike class Bobjects, where one species of dust is clearly favored, class Aobjects generally require an extinction curve that combines theextinction from Allende nanodiamonds with that of cubic dia-monds, that is, nanodiamonds with and without surface impu-rities (x 2.1). The spectra of PG 1148+549 in Figure 5 serve toillustrate this point. All models shown have the same column ofN20 ¼ 1:05 and the same SED with �� ¼ �0:2. Either extinc-tion curve D1 or A1 can give rise to a flat continuum immedi-ately longward of the break, but the onset of the break turns outto be inappropriate for both the D1 extinction curve (red line)and the Allende A1 curve (blue line), as seen in Figure 5. Anextinction curve consisting of a mixture with fD1 ¼ 0:6 (60%D1and 40% of A1 grains), on the other hand, provides quite anacceptable fit to the break (green line). We found that, by using aproper mixture of the two grain types, one can fit all class A ob-jects. Three prominent emission lines stand out above the FUV
continuum in PG 1148+549, shortward of 900 8 (the line iden-tifications shown in the figures follow those proposed by TZ02).It is interesting to note that extinction by pure cubic diamonds(red line) gives rise to a narrow dip near 700 8, a feature notobserved in this particular quasar.
4.2.2. Applying the Intrinsic Dust Model to Class A Spectra
Amixture of the two nanodiamond types is very successful inreproducing the break in all class A spectra. More specifically,we can fit all observed 1000 8 breaks assuming one of the fourfollowing values of fD1: 0, 0.3, 0.6, or 1.0. A finer subdivisionin most cases is not warranted by the data because the spectravery rarely extend sufficiently in the FUV for the fit to be sensi-tive to small changes in fD1. In a few cases, only the onset of thebreak is seen, and we could not determine with certainty whetherthe value of 0.3 or 0.6 is more appropriate. At any rate, the valueof fD1 ¼ 0:3 appears to be the most frequent as indicated in thehistogram of Figure 6, but there remains a substantial fractionof objects that require a different dust mixture.
In Figure 7 we present the distribution of gas columns derivedfrom fitting class A and class B spectra. The mean N20 value forclass A is 1.02 with a standard deviation of 0.29. There are twohigh-redshift spectra, for which there is no evidence of dust, withan upper limit of 0.1, which are HS 1700+6416 and HE 2347�4342 (they have not been included in the average). If we com-bine class A and B spectra into a single group and assume that theyare part of the same population, we derive N20 ¼ 1:20 and astandard deviation of 0.60. The distribution shows that the pres-ence of nanodiamond dust is the rule in quasars rather than theexception. In many quasars, the amount of dust inferred is com-parable. For instance, 39 quasars have a column 0:6 � N20 �1:4, which represents 78% of the 50 class A+B spectra.
As for the distribution of �� describing the NUV continuum,we obtain a mean value for class A of �NUV ¼ �0:44 with adispersion of 0.21. This average considers only the 21 objectsfor which a reliable estimate of �NUV could be determined di-rectly from the HST spectra. It is significantly harder than themean value of�0.69 reported by TZ02 and the median value of�0:83 � 0:04 for local AGNs reported by Scott et al. (2004),
Fig. 5.—Spectrum of PG 1148+549 (gratings G130H+G190H+G270H)multiplied by Mf 14 ¼ 0:46. The notation is the same as in Fig. 3. Red line:Intrinsic absorption model using extinction curve D1 (cubic diamond) with acolumn N20 ¼ 1:05 and an SED with �� ¼ �0:2. The blue line represents thesame model but assuming the extinction curve A1 (Allende nanodiamonds),while the green line corresponds to a dust mixture model with fD1 ¼ 0:6. Thismixed dust model provides a satisfactory fit of the continuum underlying thethree emission lines: O iii, Ne viii, and O iii.
Fig. 6.—Histogram of the distribution among the 44 class A spectra of thefractional contribution, fD1, of cubic diamond dust (D1) to the extinctioncurve, which results in an optimal fit of the UV break. The contribution of themeteoritic Allende nanodiamonds (A1) is 1� fD1.
15 By ‘‘flat’’ we mean an approximately horizontal continuum segment in anFk plot, which translates into an index k ’ 0, that is, �� ’ �2.
NANODIAMOND DUST AND FUV QUASAR BREAK 667No. 2, 2005

presumably because the softer class C spectra are not included inour average.
4.2.3. Dust Models Predict a Rise Shortward of �700 8
Due to the rapid decrease in the dust extinction cross section inthe FUV, shortward of the cross section peak (see Fig. 1), aninescapable feature of dust absorption is that a rise in transmittedflux always occurs in the FUV, shortward of ’700 8. Of theseven multigrating spectra that extended down to 600 8 andshowed evidence of dust absorption, we found evidence of asharp flux rise in four of them. This test was not conclusive forthe remaining three spectra. The observation of a steep rise in theFUV is the strongest evidence in favor of dust absorption and ispresented in more detail below.
The first spectrumwith a sharp rise is PG 1008+1319, which isshown in Figure 8.We adopt the value of +0.13 as NUVindex, asdetermined by Neugebauer et al. (1987). The green line correspondsto an intrinsic dust model with fD1 ¼ 0:3, while the gray line cor-responds to fD1 ¼ 0:6. The column in both models is N20 ¼ 1:2.Clearly the model with an extinction dominated by Allendenanodiamonds (red line) gives a better fit to the break. ReducingfD1 further would cause the break’s onset to occur at too long awavelength (e.g., the fD1 ¼ 0 model in Fig. 5).
A second example is PKS 0232�04 of Figure 9. A fit of theNUV continuum favors �� indices in the range�0.2 to�0.4. Tobe definite, we adopt the steeper SEDwith�0.4.We verified thatthe same conclusions are reached when using the harder index.The red line model, which is more satisfactory, corresponds topure D1 dust with fD1 ¼ 1:0 andN20 ¼ 0:90, while the green linemodel corresponds to fD1 ¼ 0:8 and N20 ¼ 0:93. Due to the pre-dominance of cubic diamonds, a narrow dip at 650 8 stands outin models with fD1k0:7. This dip appears to be saddled by twoprominent emission lines, O iii and Ne viii, both of which are alsovisible in the composite SED of TZ02, but not as prominently. In-terestingly, Scott et al. (2004) discuss the nature of a narrow dipseen blueward of the Ne viii emission in their near-AGN compos-ite. The interpretation they favor is that of blueshifted absorptionby Ne viii. Another explanation might be that absorption by cubicnanodiamonds is responsible for this feature. Even though the D1
Fig. 7.—Histogram of the distribution among the 44 class A and 6 class Bspectra of the gas columns, N20, resulting in an optimal fit of the UV break.The first bin at N20 ¼ 0:1 corresponds to objects for which only an upper limitof NH could be determined.
Fig. 8.—Spectrum of quasar PG 1008+1319 (gratings G150L+G270H) mul-tiplied byMf 14 ¼ 0:65. The notation is the same as in Fig. 3. Notice the FUV fluxrecovery shortward of 7208. The assumedNUVindex is�� ¼ 0:13 for all models(Neugebauer et al. 1987). Green line: Absorption model with dust mixture fD1 ¼0:3 and a column N20 ¼ 1:2. The gray line represents a different dust mixture offD1 ¼ 0:6 with same column N20 ¼ 1:2 (it lies in the FUV behind the green line).The orange line is the intergalactic model introduced in x 5.1 to which intrinsic dustwith fD1 ¼ 0:0 and column N20 ¼ 0:50 has been added. The cyan line is a modelthat assumes an SED,modified by a shallow cutoffCk as defined in x 6.3 (eq. [2]), adust mixture with fD1 ¼ 0:3, and a column N20 ¼ 1:2.
Fig. 9.—Spectrum of PKS 0232�04 (gratings G150L+G270H) multipliedbyMf 14 ¼ 0:73 (black line). The notation is the same as in Fig. 3. Notice the FUVflux recovery shortward of 640 8. The assumed NUV index is �� ¼ �0:4 for allmodels. Red line: Absorption model of PKS 0232�04 with column N20 ¼ 0:90and extinction curve D1 ( fD1 ¼ 1:0). The green line represents a different dustmixture with fD1 ¼ 0:8 and columnN20 ¼ 0:93. The dark green line spectrum cor-responds to quasar 1623.7+268B (Mf 14 ¼ 1:1), which also shows a rise in the FUV.
BINETTE ET AL.668 Vol. 631

dip is broader, it might partially be filled by the Ne viii emissionline.
A third example is provided by the much higher redshift qua-sar, HS 1307+4617, at z ¼ 2:129, which is plotted in Figure 10.There is noHST FOS spectrum that covers the NUV. Instead, weadopt the value of �NUV ¼ 0:0 as inferred from a spectrum ofD. Reimers and reproduced in Koratkar & Blaes (1999). Thethree models superimposed to the spectrum in Figure 10 have thesame column N20 ¼ 1:3 and differ only by their proportion ofthe D1 and A1 dust, as follows: fD1 ¼ 0:8 (gray line), 0.6 (greenline), and 0.3 ( purple line). The green line model with fD1 ¼ 0:6provides a better fit. It is interesting to note that the disjointpart ( yellow segment) of the GHRS spectrum (taken with grat-ing G140L) is not consistent with the FUV extrapolation of themodels. A solution to this problem is found in x 6.3. A fourth ex-ample is 1623.7+268B, shown as the dark green spectrum at thebottom of Figure 9.
To summarize, the intrinsic dust model is phenomenologicallyvery successful, as it can not only reproduce the break within thedominant class A spectra but also account for the continuum sud-den rise in the FUV, in the 650–700 8 region. The extinctioncurve that is required to model the FUV consists of a mixture ofthe two nanodiamond grain types: the cubic diamonds and theAllende type.
4.3. Class C Spectra
This class is defined by the NUV shape, which is very soft,taking the appearance of a flat continuum in Fk or, in some cases,of a bump longward of 12008. We have already presented (x 3.4)the three examples shown in Figure 11. The frequent roundedshape of the spectrum from NUV to FUV suggests the possibil-ity that, in some cases at least, the spectra might be reddenedby dust similar to that of the Galactic ISM. One such case is
1130+106Y (black line spectrum in Fig. 11), which we tenta-tively model using the ISM dust model of Martin & Rouleau(1991) (see black dashed line extinction curve in Fig. 1). It con-sists of a mixture of silicate and graphite grains. The magentaline is a better model in the FUV. It combines ISM extinction(80%) with that of cubic diamonds (20% of D1 grains by mass).The column isN20 ¼ 9:0 and the assumed SED has �� ¼ �0:25.Note the significant attenuation of the continuum, which reachesa factor of 5 near 1000 8. The optical extinction in the V banddue to ISM-like dust is relatively modest, with AV ¼ 0:4 mag.Not including the contribution from nanodiamond extinctionwould result in a flatter continuum without much of a break, asillustrated by the yellow line model (pure ISM extinction withN20 ¼ 9:0).
Evidence of reddening by ISM dust appears to be present inclass C spectra, but nanodiamond dust is nevertheless required toexplain the break when it is present. A few class C spectra show asteep drop shortward of 1000 8 as in class B spectra. We havenot explored the possibility of a combination of the three ex-tinction curves A1, D1, and ISM. It is possible that some class Cspectra possess an SED (from NUV to FUV) that is intrinsicallysteeper than in other classes, with �� in the range �2 to �1.2.
5. THE CASE FOR INTERGALACTIC ABSORPTION
The fact that the absorption columns take on similar values inthe intrinsic case for the numerous class A spectra invites us toexplore the hypothesis that the dust pervades the intergalacticspace instead of being confined to the environment of each qua-sar. Following this hypothesis, the distribution of the dust bearsno relation to the quasars but is a function of distance (i.e., z). By
Fig. 10.—Spectrum of HS 1307+4617 (gratings G190H+G270H; black line)multiplied by Mf 14 ¼ 0:75. The yellow disjoint part corresponds to a GHRSspectrum with grating G140L (sameMf 14). The notation is the same as in Fig. 3.Notice the FUV flux recovery shortward of 700 8. The NUV index is 0.0 inall models. Three models are shown that used the same column N20 ¼ 1:3, butdifferent dust mixtures: fD1 ¼ 0:6 (green line), 0.3 ( purple line), and 0.8 (grayline).
Fig. 11.—Three class C spectra: MC 1146+111 (Mf 14 ¼ 1:3; cyan line), 3C279 (Mf 14 ¼ 0:70; green line), and 1130+106Y (Mf 14 ¼ 0:46; black line). Thenotation is the same as in Fig. 3. Both MC 1146+111 and 3C 279 have beensuitably scaled so as not to overlap with the quasar 1130+106Y, which is beingmodeled. 3C 279 is flat inFk, hence�� ’ �2. Yellow line: Dust absorptionmodelof 1130+106Y assuming �� ¼ �0:25 and an extinction curve corresponding topure Galactic ISM extinction with N20 ¼ 9:0. (This last model has been multi-plied by 1.3 before plotting.) The magenta line represents a dust mixture ofISM-type grains (80%) and terrestrial diamond grains D1 (20%). The V-bandextinction implied by this model is AV ¼ 0:4 mag.
NANODIAMOND DUST AND FUV QUASAR BREAK 669No. 2, 2005

the same token, we expect the grain composition to be more uni-form in the intergalactic case than in the intrinsic case. The in-tergalactic model does not, however, imply that there cannot bean additional intrinsic dust component local to some quasars,as appears to be the case for class B and C spectra. On the otherhand, the case for intergalactic dust will be more convincing if aminority of class A spectra require additional absorption abovethe one provided by the intergalactic model.
The predictive value of the intergalactic model resides in thefunction chosen to describe the dust density with redshift. Such afunction will allow not only the modeling of the break in indi-vidual quasars but also the simulation of the composite SEDderived by TZ02, following the procedure defined in x 2.2.2.
5.1. Constraining the Dust Behavior with Redshift
As a working hypothesis, let us assume that the dust is in-tergalactic and for now consider only class A spectra. Since theabsorption occurs along the line of sight to each quasar, its im-pact can extend over the whole FUV domain as a result of theredshift effect and cosmological expansion. In a universe thatevolves and expands, any cosmological quantity such as the den-sity of the Ly� absorbers, the density of quasars, the star-formingrate, etc., is known to evolve strongly with redshift, that is, withtime. The same must apply to the hypothesized intergalactic dust.There should exist an epoch (zp) at which the dust density reachesa peak. To describe such a peak, we adopt a parametric form for thedust density16 nH(z), similar to that used by Baldry & Glazebrook(2003) to describe the cosmological star formation rate. It con-sists of a broken power law joining at redshift zp:
nH zð Þ ¼n0H 1þ zð Þ; z � zp;
n0H 1þ zp� ���
1þ zð Þ�; z > zp;
(ð1Þ
where n0H is the density at zero redshift, and � are the low- andhigh-redshift indices, respectively, and zp is the intersection ofthe two truncated power laws. Hereafter we use n08 in units of10�8 cm�3 to express the density at zero redshift.
To constrain the parameters describing the function nH(z), weproceeded as follows. Since Scott et al. (2004) did not find ev-idence of a continuum break in nearby AGNs (zq < 0:7), thissuggests that the peak in absorption occurred at an earlier epochrather than in the local universe. A positive index for , in whichabsorption increases with look-back time, will have the effect ofreducing the importance of the 1000 8 break within the localuniverse. Another indication of the increase in the importance ofthe break with redshift can be appreciated in Figure 12, where weplot �FUV as measured for each quasar by TZ02. To derive themean values represented by the squares, we distributed the mea-sured indices into five redshift bins and then calculated the av-erage �NUV within each bin. (The solid line simply connects thefive mean values.) After trial and error and varying , we foundthat similar fits to the break could be obtained, using any valuewithin the interval 1:5 < < 3:5. To constrain more effec-tively would have required including the nearby AGN obser-vations with the FUSE satellite (Scott et al. 2004). To be definite,we hereafter adopt the value ¼ þ2.
To determine the behavior of nH(z) at the other redshift end,we can compare the very high redshift quasar spectra (zk 2:5)
with those at intermediate redshifts. As it turns out, most high-zHST FOS spectra are single grating and cannot be used for thatpurpose. Fortunately, there exist two quasars with high signal-to-noise ratio (S/N) and wide spectral coverage that we could an-alyze in greater detail, HS 1700+6416 and HE 2347�4342,which are plotted asF� in Figure 13.
17 The power-law indices forHS 1700+6416 and HE 2347�4342 that we adopt are �� ¼�0:55 (from Reimers et al. 1989) and +1.70 (inferred from thebest model), respectively. The missing parameter values defin-ing nH(z) were arrived at using various constraints, as describedbelow.Because of the redshift effect, the HST FOS spectra of both
HS 1700+6416 and HE 2347�4342 do not cover the typicalbreak region at 1000 8 (k rest). Viewed from the perspective ofintergalactic dust, however, the absorption break should haveshifted to shorter wavelengths (with z), as demonstrated below inx 6.2. As a consequence, the continuum shape’s departure fromthat of a pure power law must be the result of the hypothesizedintergalactic dust, if such a model is to be of any use. Despite theragged appearance of both continua in Figure 13, caused by themany absorption systems along the line of sight, it is clear thatboth show a general curvature18 or change of index, which inter-galactic absorption must be able to explain. It turns out that sucha curvature can be reproduced by intergalactic dust models usingeither of the extinction curves, A1 or D1. To select the appro-priate extinction, we required that the dust model successfullyreproduced the break observed in the lower redshift spectrum ofPG 1148+549, which is the archetype of class A. This secondconstraint effectively rules out cubic diamonds as shown by the
Fig. 12.—FUV power-law indices �FUVof the quasar sample, as determinedby TZ02, as a function of redshift. The gray filled squares (connected by a solidline) represent an average of �NUV within five redshift interval bins. The long-dashed line is the spectral index at the fixed wavelength of 800 8, calculated forthe standard intergalactic model (n08 ¼ 3:4).
16 The density nH as defined in this work is not a comoving but rather a localquantity.
17 Because of the hardness of HE 2347�4342 (k � �3), using Fobs� is
much more convenient than Fobsk .
18 Note that if we attempt to fit the above curvature using intrinsic dust, theabsorption actually goes the wrong way, making the transmitted spectrum appeareven harder, as illustrated by the green line model calculated with N20 ¼ 0:5 andfD1 ¼ 0:3.
BINETTE ET AL.670 Vol. 631

red line model of PG 1148+549 in Figure 14. In the case ofintergalactic models with dust curve A1, the break occurs atsomewhat too short a wavelength (see Fig. 14, blue line). To com-pensate for the redshift smearing effect, we extended the grainsize range of the Allende nanodiamonds, extending it up toa max ¼ 200 8. This defines the new extinction curve A3 (seeFig. 1, orange line) used in all our intergalactic calculations.This extinction curve A3 was found to provide an overall betterfit to class A objects, in the intergalactic case.
Having selected the optimal extinction curve, strong con-straints on zp and n
0H can now be derived by varying these param-
eters until an acceptable fit of the two high-z quasars is found.Wefound that � is loosely constrained to negative values P�1.4.To further constrain the function nH(z) and �, we made use ofthe composite quasar SED of TZ02 (shown in Fig. 15).We simu-lated this composite by co-adding synthetic dust-absorbed SEDsof the same redshifts and spectral widths as those in the actualTZ02 sample, following the procedure described in x 2.2.2. Thisexercise indicated a preference for somewhat larger values of� than the range favored above using the two high-z quasars.To be definite, we adopted the value of � ¼ �1:5, which cor-responds to the overlap between the two types of constraints.The result of combining these different constraints in an iterativefashion has been that an acceptable fit to the broad curvatureof both high-z quasars of Figure 13 occurs when using the valuezp ’ 0:4 for the peak dust redshift. The resulting orange linemodel, which requires n08 ¼ 3:4, now overlays both continua inFigure 13, as well as the outline of the break in PG 1148+549(Fig. 14). In conclusion, the intergalactic dust model can account
for the progressive steepening of the power-law index observedshortward of 500 8 in HE 2347�4342.
5.2. Applying the Intergalactic Model
A reasonable expectation of the intergalactic dust model isthat it should apply to all the classes defined in x 3.4. This is notto say that additional absorption by a local dust component can-not take place in some quasars. For instance, class B quasars,although dominated by intrinsic dust, as shown in x 4.1, can alsobe modeled as the sum of intergalactic absorption and absorp-tion by intrinsic D1 dust. An example of such complementarityis given by class B quasar PKS 0122�00 in Figure 4. An orangeline model is plotted, which includes absorption by both inter-galactic A3 dust and intrinsic D1 dust of column N20 ¼ 1:0. Ex-cept toward the FUV, this orange line model (mostly hidden bythe foreground red line!) is almost identical to the previouslydescribed green line model (x 4.1), which consisted of an intrin-sic dust mixture with fD1 ¼ 0:8 and columnN20 ¼ 2:0. A similarcomparison can be established with the intergalactic orange linemodel of PG 1248+401 (Fig. 3).
When attempting to simulate the composite SED of Figure 15,it turns out that n08 must be increased, from 3.4 to 4.7. If not,the model lay significantly above the composite. Such a modelwith n08 increased to 4.7 is shown by the purple solid line in Fig-ure 15. This simulation, although imperfect, is encouraging, ifwe consider that our simulation assumed a single power-lawindex�� ¼ �0:6while the TZ02 composite sampled widely dif-ferent energy distributions. Furthermore, TZ02 have combinedspectra of classes A–D, while the pure intergalactic model isintended for class A objects. It is presumably for that reason that
Fig. 13.—Spectrum in F� of (a) HS 1700+6416 (Mf 14 ¼ 0:75) and (b) HE2347�4342 (Mf 14 ¼ 7:8) as a function of k. The yellow disjoint segment cor-responds to a GHRS spectrum with grating G140L (Mf 14 ¼ 7:8). Orange line:Absorption model assuming extinction curve A3 and intergalactic distributionof dust with n08 ¼ 3:4 (in units of 10�8 cm�3), zp ¼ 0:4, ¼ þ2, and � ¼ �1:5(see x 5.1). The quasar energy distribution assumed is described by the magentadotted lines and corresponds to �� ¼ �0:55 (Reimers et al. 1989) and +1.70 forHS 1700+6416 and HE 2347�4342, respectively. The green dashed lines il-lustrate the effect of having intrinsic rather than intergalactic dust. The column isN20 ¼ 0:5 and the dust composition is fD1 ¼ 0:3. Increasing this column resultsin selectively more absorption at the longer wavelength end, the opposite ofwhat is required.
Fig. 14.—Spectrum of PG 1148+549 multiplied by Mf 14 ¼ 0:46. The nota-tion is the same as in Fig. 3. The models represent intergalactic absorption cal-culations, using three different extinction curves and assuming the same SEDwith �� ¼ �0:2 as in the earlier Fig. 5 of the same quasar. Blue line: Extinctioncurve A1. Red line: Extinction curve D1.Orange line: Extinction curve A3. Thebest fit is provided by the orange line model based on the curve A3, for which thegrain sizes extend up to amax ¼ 2008 (see Fig. 1). The values of zp that providean acceptable fit to the two high-redshift quasars of Fig. 13 are 0.8, 0.6, and 0.4in the cases of the models that use the curves D1, A1, and A3, respectively. Inthese models, ¼ þ2 and � ¼ �1:5, as defined in x 5.1.
NANODIAMOND DUST AND FUV QUASAR BREAK 671No. 2, 2005

a significant improvement is obtained, as shown by the orangeline model in Figure 15, when one combines intergalactic ab-sorption with intrinsic absorption by a column as small as N20 ¼0:15 of D1 dust.
We have repeated the same exercise as for the intrinsic case(x 4.2) of applying the intergalactic model to all class A spectra.We found that 20 spectra could be reasonably fitted with theproposed value n08 ¼ 3:4 (the standard model), while 14 spectrarequired either an increase of ’10% in n08 or the addition of anintrinsic column of dust, most frequently of type D1. Further-more, four and six spectra required n08 to be reduced (approxi-mately) to 2.4 and 3.0, respectively. The database is therefore notentirely consistent with the expectation of a homogeneous dis-tribution of intergalactic dust.
6. MERITS OF INTERGALACTIC VERSUSINTRINSIC MODELS
Which model is to be preferred? We compare the merits andproblems of each type of model and, in conclusion of this sec-tion, present a final model for the 1000 8 break of quasars.
6.1. The Intrinsic Dust Hypothesis
We have shown that intrinsic dust models could account notonly for the break but also for the flux rise at shorter wavelengths(e.g., Figs. 8–10). Overall, the intrinsic model is extremely suc-cessful across the whole class A and class B samples. The fit tothe FUV rise in HS 1307+4617, on the other hand, is not entirelysatisfactory.
Is it possible to simulate the TZ02 composite assuming onlyintrinsic dust? One difficulty is that the intrinsic model is muteabout how other parameters like N20, fD1, or �� might vary withincreasing z. However, since each class A spectrum can be fittedquite well by varying fD1 and N20, which is an approach that weconsider superior to that of simply fitting the TZ02 composite, itcan then be argued that not being successful in the simulation ofthe composite is of secondary importance. Althoughwe considerthis to be true, we nevertheless attempted to simulate the com-posite because it reveals real trends in quasar SEDs. The fact thatthe TZ02 composite remains very soft at very short wavelengthsinstead of showing an FUV rise must be explained somehow.The silver dashed line in Figure 15 illustrates our initial at-
tempt to simulate19 the composite SED, assuming �� ¼ �0:6and keeping all the input parameters constant with z. The columnisN20 ¼ 1:0 and fD1 ¼ 0:3. The FUV flux is obviously predictedtoo strong. This happens because the extinction cross section fallsoff too rapidly at very short wavelengths, and a steep rise in Fkbecomes unavoidable shortward of 600 8. The simulated com-posite simply tends toward the slope given by the index ��. Ifwe vary the column with redshift, by defining a function N20(z),we obtain the absurd result that, in order for the simulated com-posite to overlap the TZ02 composite, the dust column wouldhave to increase sharply with redshift. This is not only an ad hocdust behavior, but it is also contradictory to the absence of anyincrease with zq of the columns determined in x 4.2. In addition,it is at odds with the lack of absorption in the two high-z spectraof HS 1700+6416 and HE 2347�4342, for which we deter-mined absorption upper limits of N20 � 0:1. Attempts to modelthe curvature in these two spectra with intrinsic dust result inabsorption features at the wrong end of the spectrum. In effect,local dust makes both spectra appear even harder than they al-ready are, as illustrated by the green line model in Figure 13calculated with N20 ¼ 0:5 and fD1 ¼ 0:3.
6.2. The Intergalactic Dust Hypothesis
The few shortcomings mentioned above for the intrinsic casedisappear with intergalactic dust. By construction, the contin-uum of the two high-redshift quasars, HS 1700+6416 and HE2347�4342, can be reproduced. On the other hand, the break canbe fitted only for a qualified majority of class A spectra, while theother spectra usually require intrinsic dust to be added to themodel. The TZ02 composite can be reproduced, albeit with a den-sity n08 increased by 40% (for which we have no satisfactory ex-planation to propose). The FUV index �FUV, when evaluated atthe fixed wavelength of 8008, exhibits the correct trend with red-shift, as shown by the long-dashed line in Figure 12. One mayargue that the amount of dust implied by the intergalactic model isexcessive if not plainly unreasonable, but it is not an impossibleamount. The fraction of the baryonic mass that the value n08 ¼ 3:4corresponds to is 17% (see x 6.3), assuming that the mean cosmiccarbon metallicity is about solar and that the dust is intergalac-tic, because it was expelled from galaxies by radiation pressure(Ferrara et al. 1991) or through Type II supernovae.The intergalactic model, on the other hand, makes stringent
predictions about how the break ought to shift (and soften) withincreasing redshift. This is shown in Figure 16, in which thetransmission function is plotted at representative zq values. The
Fig. 15.—Black thin line: Composite energy distribution derived by TZ02and scaled here by a factor of 0.61. It combines both radio-loud and radio-quietquasars. Purple line: Simulated composite absorption model assuming that thedust is exclusively intergalactic with n08 ¼ 4:7 (x 5.2). Each synthetic spectrum,before being absorbed and averaged, had the same SED consisting of a powerlaw of index �� ¼ �0:6, which is represented by the magenta dotted line. Thespectral window limits (kobs) and the corresponding redshift of each spectrum,before being averaged, were taken from the sample of TZ02. The orange line isthe same intergalactic model but combined with absorption by a column, N20 ¼0:15, of dust intrinsic to each quasar ( fD1 ¼ 1:0). Silver dashed line: Simulatedcomposite absorption model assuming that the dust is intrinsic and not inter-galactic. The column is N20 ¼ 1:0 and the mixture fD1 ¼ 0:3, both remaininginvariant with redshift.
19 In a situation in which none of the parameters defining the intrinsic modelvary with redshift (as for the silver dashed line model in Fig. 15), all the absorbedSEDs are identical and there is no need to co-add the spectra in order to simulatethe composite.
BINETTE ET AL.672 Vol. 631

continuous part of each Tk curve corresponds to the fiducialspectrograph window of 1250–3600 8 (kobs; see x 3.5) andshows what part of the break is visible at a given redshift zq.Notice that when the redshift exceeds values of ’1.5, the breakis markedly shifted toward shorter wavelengths. Of the three spec-tra presented in x 4.2.3, which showed a clear flux rise in theFUV, only one is of sufficiently high redshift to test this, HS1307+4617 with z ¼ 2:129. Its spectrum is shown again in Fig-ure 17 and can be compared with the pure intergalactic modelwith n08 ¼ 3:4, which is represented by the brown dashed line.The SED is the same as earlier, that is, �� ¼ 0:0.
The gradual break (or curvature) seen in the brown dashed linemodel in Figure 17 not only occurs at very short wavelengths(�550 8) but is extremely shallow. Obviously, in order to fit thesharp break characterizing the HS 1307+4617 spectrum, addi-tional intrinsic absorption must be considered. Such a model isrepresented by the orange line, which is a model that combinesintergalactic with intrinsic dust. The local dust column is N20 ¼0:8 with a dust composition fD1 ¼ 0:6. The fit to the observedflux rise is surprisingly good, much better even than with thepure intrinsic case represented by the green line in the previousFigure 10 of the same quasar. Even more suggestive is the dis-joint spectrum obtained with GHRS grating G140L (Fig. 17,yellow spectrum), which despite its lower S/N appears to pro-long the FUV rise of the multigrating spectrum (black line). Theintergalactic model is marginally consistent with the continuumlevel set by this spectrum segment, in contrast with the pure in-trinsic model, which rises too steeply (see Fig. 10, green line).The green dashed line in Figure 17 represents the contribution ofintrinsic dust absorption that is present in the orange line mixedmodel. In summary, even though intrinsic dust is the main con-tributor to the sharp break observed in HS 1307+4617, the sig-nature at the shortest wavelengths expected in high-z spectra as a
result of intergalactic dust appears to be independently con-firmed in this quasar.
Is the intergalactic hypothesis vindicated? It turns out notto be the case. In effect, a rather poor fit is provided for the twoother quasar spectra that showed an FUV flux rise, PG 1008+1319 and PKS 0232�04. As is the case for HS 1307+4617, thesetwo quasars require additional intrinsic absorption, with dustcolumns (N20) of 0.5 and 0.25 and dust mixtures ( fD1) of 0.0and 1.0, respectively. However, even when combining this ad-ditional absorption with intergalactic dust, the FUV rise cannotbe reproduced at all, as shown by the corresponding orangelines in Figure 8 of PG 1008+1319 and in the new Figure 18of PKS 0232�04. The FUV continuum level is predicted toolow in the PKS 0232�04 model and, in both figures, the flux rise(orange lines) occurs at too short a wavelength.
6.3. Evidence of a Higher Energy Break?
As indicated above, the discrepancy of the intergalactic modelfor reproducing the FUV rise in PG 1008+1319 and PKS 0232�04 could not be resolved. This inadequacy of the model is suf-ficiently significant to reject the intergalactic dust hypothesisat the assumed density.20 Moreover, in more than one aspect,the intergalactic model is implausible. Assuming that the meanmetallicity of matter (stars and interstellar gas) in galaxies at cur-rent epochs is near solar, as derived by Calura &Matteucci (2004a,
Fig. 16.—Transmission functions Tk(zq) for zq values of 0.1, 0.2, 0.5, 1.0, 1.5,2.0, 2.8, 3.5, and 5.0, assuming the standard intergalactic dust model and theextinction curve A3. The parameters used to define the function nH(z) are zp ¼0:4, ¼ þ2, and � ¼ �1:5 (eq. [1] in x 5.1). The solid part of each line cor-responds to the fiducial spectrograph window of 1250–3600 8 (kobs) at thecorresponding quasar redshift. The thick gray dashed line is a fit of the zq ¼ 2:8transmission curve using the cutoff function Ck defined in eq. (2), with kbrk ¼670 8, � ¼ �1:6, and f ¼ 2:8.
Fig. 17.—Repetition of the spectrum of HS 1307+4617 of Fig. 10. In allmodels, the assumed NUV index is 0.0, as in Fig. 10. The brown dashed linecorresponds to the standard intergalactic model introduced in x 5.1. The orangeline is the same intergalactic model, but combined with an intrinsic dust columnof N20 ¼ 0:8 with fD1 ¼ 0:6. The green dashed line shows the contribution byintrinsic dust in the case of this combined intergalactic model (orange line). Thecyan line is the intrinsic dust model, but assuming that the power law is modifiedby a shallow cutoff, as described in x 6.3 (eq. [2] with kbrk ¼ 6708, f ¼ 2:8, and� ¼ �1:6). The column is N20 ¼ 1:0 and the dust mixture fD1 ¼ 0:6.
20 If we adopt an intergalactic model that uses significantly less dust thann08 ¼ 3:4, it would be at the cost of havingmore intrinsic dust present and this in alarger fraction of class A spectra, if not the majority of them. Hence, such amodelwould not contribute in an essential way to explaining the break and would haveto be discarded on account of Occam’s razor principle.
NANODIAMOND DUST AND FUV QUASAR BREAK 673No. 2, 2005

2004b), then the fraction of cosmic carbon required is n0H/n0bar ¼
3:4 ; 10�8/2:06 ; 10�7 ¼ 0:17. Apart from the unreasonable frac-tion of cosmic carbon that must exist in crystalline form (17%),it would require an improbable fine-tuning so that this dustwould not be accompanied by larger amounts of the more com-mon flavors (silicates, graphites, polycyclic aromatic hydro-carbons [PAHs], etc.) as one would expect if it was formed insupernovae and later expelled in the intergalactic space. Theanalysis of cosmological supernovae has ruled out the existenceof large quantities21 of intergalactic dust of ‘‘normal’’ compo-sition (Perlmutter et al. 1999).
Ruling out the intergalactic model in favor of the intrinsicmodel has an additional interesting consequence. The curvaturepresent in the spectra of HS 1700+6416 and HE 2347�4342must now be considered an intrinsic feature of the energy distri-bution in these two quasars, rather than the manifestation of in-tergalactic absorption.
We are left with the intrinsic dust hypothesis to account for the10008 break in quasars.What could be missing from this modelso that the few remaining problems it has could be resolved?We hypothesize that the shallow rollover observed in the FUVin HS 1700+6416 and HE 2347�4342 is a manifestation of a
universal high-energy cutoff present in all quasar SEDs. To testthis, we first model the cutoff in a way that does not dependon the �NUVof the underlying SED. This is achieved by singlingout the transmission curve calculated at zq ¼ 2:8 (correspondingto the average redshift value of the two high-z quasars) and con-sidering it to be a valid description of the continuum softeningthat might also apply to the other quasars. We obtained a para-metric fit of this transmission curve at that redshift, using thefollowing expression:
Ck ¼ 1þ k=kbrkð Þ f �h i�f �1
; ð2Þ
where � is the power-law index change and f is a form factor,which may vary from object to object. In essence, when aquasar SED is multiplied byCk and � < 0, a shallow steepeningtakes place at kbrk, which increases the underlying power-lawindex by �. The sharpness of the cutoff is set by the form factorf � 1. Hereafter we assume that the true intrinsic quasar con-tinuum is given by CkF
qk, where F
qk is the quasar power law that
we have been using so far and �� the index set by the NUVcontinuum. To illustrate the role of the form factor, let us take thespectrum (Fig. 18, blue spectrum) of class D quasar HE 1122�1649 as an example, given that it shows a clear FUV cutoff.Longward of the cutoff, the power-law index is �� ¼ �0:6,reaching �2.6 shortward of the break situated at ’670 8.Hence, the parametric function Ck is characterized by � ¼ �2:0and kbrk ¼ 670 8. The gray and magenta lines in Figure 18correspond to form factors of f ¼ 2:8 and 10, respectively.Turning our attention to the Tk curve at a redshift zq ¼ 2:8
in Figure 16, the parametric fit using equation (2) yields the val-ues � ¼ �1:6, f ¼ 2:8, and kbrk ¼ 670 8. It is shown by thethick gray dashed line. This cutoff can now be applied, not onlyto HS 1700+6416 and HE 2347�4342, but to any other quasaras well. It will result in a new SED that is characterized by thesame NUV power law as before, but with a shallow FUV cutoffcentered on 670 8, that is, at 18.5 eV.If we incorporate the above FUV rollover into our pre-
vious quasar SED of index �� ¼ �0:6, we obtain the distribu-tion represented by the black dotted line in Figure 19. Assumingthis modified SED, a remarkable improvement in the simulatedcomposite is now obtained, as shown by the dark gray solid linein Figure 19. (The silver dashed line model represents the earliercase without the FUV intrinsic cutoff.) Further improvements ofthe simulated composite can be obtained by varying some ofthe input parameters with redshift. The study of these more com-plex models, however, exceeds the scope of this paper and willbe reported elsewhere.It is important to emphasize that the intrinsic model with a
shallow cutoff fits markedly better two of the three quasar spec-tra that showed an FUV rise. For instance, the earlier problemencountered (x 4.2.3) in fitting the FUV rise in HS 1307+4617(Fig. 10, green line) has now disappeared, as shown by the cyanline model in Figure 17, which assumes the SED with the aboveFUV rollover. An improvement of the fit to the FUV rise inPKS 0232�04 is also obtained, as shown by the cyan line modelin Figure 18. In the case of PG 1008+1319, it makes little dif-ference whether the high-energy cutoff is there or not (comparethe cyan and green line models in Fig. 8).In summary, the whole database as represented by the TZ02
composite, as well as the individual spectra showing the FUVrise, are both consistent with the presence of an 18.5 eV cutoff inquasars. This proposed new cutoff is being masked in the vastmajority of quasars with redshift P2.5 by the more prominent
21 We have calculated the extinction that ISM dust would produce if it fol-lowed the same intergalactic distribution as the nanodiamonds (x 5.1) with n08 ¼3:4, that is, in amounts that correspond to 17% of the Galactic dust-to-gas ratio.We find that for an object at z ¼ 0:5, the selective extinction is EB�V ¼ 0:022(kobs), much in excess of the value of 0.002 inferred from cosmological super-novae by Perlmutter et al. (1999).
Fig. 18.—Repetition of the spectrum of PKS 0232�04 of Fig. 9. In allmodels, the assumed NUV index is �� ¼ �0:2, as in Fig. 9. The orange linecorresponds to the standard intergalactic model introduced in x 5, but combinedwith an intrinsic dust column of N20 ¼ 0:18 with mixture fD1 ¼ 1:0. The cyanline is the intrinsic dust model, but assuming that the power law is modified bya shallow cutoff, as described in x 6.3 (eq. [2] with kbrk ¼ 670 8, f ¼ 2:8, and� ¼ �1:6). The column is N20 ¼ 0:62 and the dust mixture fD1 ¼ 1:0. The blueline spectrum at the bottom corresponds to the class D spectrum of HE 1122�1649 (Mf 14 ¼ 0:44). The gray and magenta lines correspond to a power lawwith�� ¼ �0:6, multiplied by the cutoff functionCk of eq. [2], assuming a form fac-tor f of 2.8 and 10, respectively. In both cases, the break wavelength is kbrk ¼670 8 and the index change � ¼ �2:0.
BINETTE ET AL.674 Vol. 631

1000 8 break, which we believe is entirely due to nanodiamonddust absorption.
7. NANODIAMONDS:THE INFRARED-UV CONNECTION
Nanodiamonds are, to date, the most abundant presolar grains,in both mass and numbers, that have been extracted from prim-itive carbonaceous meteorites (Mutschke et al. 2004 and refer-ences therein), but their detection in the ISM has been elusive.Diamond crystallite emission bands in the 3.3–3.6 �m regiondue to surface C–H stretching modes of hydrogenated nano-diamonds have been established with confidence for a few HerbigAe/Be objects and one carbon-rich post-AGB star HR 4049(Guillois et al. 1999; Van Kerckhoven et al. 2002; Acke & vanden Ancker 2004). Van Kerckhoven et al. (2002) presented a de-tailed analysis of the Infrared Space Observatory SWS spectraof the two Herbig objects, HD 97048 and Elias I, as well as ofthe post-AGB HR 4049. They applied a physical model to theemission profile of the 3.53 �m band and inferred a temperatureof 950 and 1000 K for HD 97048 and Elias I, respectively.Assuming radiative equilibrium between photoheating and far-infrared cooling for the grains, the authors could estimate the UVradiation flux impinging upon the diamonds in these three ob-jects. The diameter range they inferred for the crystallite dia-monds is 2a � 10 100 8. Interestingly, the multiwavelengthdata for both HD 97048 and Elias I, as well as for the post-AGBstar HR 4049, indicate that the 3.53 �m emission takes placewithin a disklike structure. The distance between the star and theemission region is �9 and �22 AU in HD 97048 and Elias I,respectively. The formation site that these authors favor for the
crystallite diamonds is in situ formation within the disk ratherthan within the ISM or via ejection from stars. In the field ofAGNs, subarcsecond VLT observations by Rouan et al. (2004)using NAOS+CONICA revealed wavelike structures in the mid-infrared, which the authors propose might be due to emission bynanodiamonds at a temperature close to sublimation.
To explain the predominance of nanodiamond grains in prim-itive meteorites, several formation mechanisms have been pro-posed, such as (1) chemical vapor deposition from stellar outflows(Lewis et al. 1987), (2) impact shock metamorphism driven bysupernovae (Tielens et al. 1987), (3) energetic ion bombardmentby a supernova (Daulton et al. 1995), (4) UVannealing of carbo-naceous grains (Nuth&Allen 1992), (5) nucleation in organic icemixtures by UV photolysis (Kouchi et al. 2005), and (6) chem-ical conversion of PAH clusters to nanodiamonds in the presenceof UV radiation (Duley & Grishko 2001). It is interesting to notethat the last three processes involve UVradiation. The above post-AGB and the two Herbig Ae/Be stars emit UV radiation (VanKerckhoven et al. 2002), a fact that is possibly related to the for-mation of the observed nanodiamonds.
Could a similar formation process operate within the UV-intense environment of quasars? The indication that cubic diamondsdominate in class B quasars might be related to an evolutionarysequence of the grains. A possible scenario might be the fol-lowing. Via the process of dehydrogenation of PAH clusters byquasar UV radiation, hydrogenated nanodiamonds form, withoptical properties similar to the Allende type. If the UV radia-tion heats up the nanodiamonds beyond 1300 K, a process ofsurface dehydrogenation begins, which may cause the grain op-tical properties to becomemore similar to that of cubic diamonds.Finally, the disappearance of H stretch cooling may result in arunaway heating, followed by graphitization and eventually sub-limation of the grains.
To confirm the existence of nanodiamond grains in AGNs,one could attempt to detect the far-infrared emission bands causedby hydrogenated nanodiamonds (Van Kerckhoven et al. 2002;Jones et al. 2004). However, AGNs are intrinsically very strongfar-infrared emitters, and the signature of any narrow emissionband will certainly be diluted. For instance, the dust silicate fea-ture at 9.7 �m predicted by calculations (Laor & Draine 1993) isnot observed as often as expected in AGNs. The UV radiationabsorbed by nanodiamonds represents at most 10% of the energyintegrated over the whole SED. Let us assume the AGN unifi-cation picture with a bi-cone opening angle of 45
�. If the nano-
particles are located outside the BLR, then a fraction of only0:10½1� cos (45�/2)P 0:01 of the quasar bolometric luminositywill be reprocessed into far-infrared emission by nanodiamonds.Assuming a uniform covering factor of unity within the radiationbi-cone, the minimum dust mass required by the intrinsic model isgiven by 0:044N20r
2pc½1� cos (45�/2) M�, where rpc is the dis-
tance in parsecs separating the dust screen from the central UVsource. For an arbitrary distance of 1 pc and N20 of unity, the dustmass implied is 0.0033 M�, a value independent of the assumeddust-to-gas ratio (see footnote 14).
To the extent that Allende-type nanodiamonds might be a can-didate carrier (see Jones & d’Hendecourt 2004) for the extendedred emission observed in nebulae between 5400 and 9500 8, it isconceivable that a fraction of the UV flux absorbed by dust mightbe reemitted by photoluminescence.
8. CONCLUSIONS
We have presented evidence that indicates that dust absorp-tion by nanodiamonds is successful in reproducing the 1000 8
Fig. 19.—Black thin line: Composite energy distribution. Black dotted line:SED consisting of a power law of index �� ¼ �0:6 multiplied by the cutofffunction Ck described by eq. (2). The parameters are the same as those inferredfrom the z ¼ 2:8 transmission curve in Fig. 16, that is, kbrk ¼ 670 8, � ¼ �1:6,and f ¼ 2:8. The darker gray line is a composite simulation, assuming intrinsicdust and the above power law modified by the function Ck. The dust column isN20 ¼ 0:8with a mixture fD1 ¼ 0:3. Silver dashed line: Composite simulation ofprevious Fig. 15, assuming intrinsic dust, but without an intrinsic cutoff (purepower law).
NANODIAMOND DUST AND FUV QUASAR BREAK 675No. 2, 2005

break, as well as the FUVrise seen at shorter wavelengths. Couldthe agreement between the intrinsic dust models and the spectrabe simply the result of a coincidence between the break loca-tion and the FUV extinction properties of nanodiamonds? Torule out such a possibility will require that an independent con-firmation of the presence of nanodiamonds be found. Detec-tion of grain emission in the far-infrared, at 3.43 and 3.53 �m, isone possibility, although this emission mechanism works onlywith surface-hydrogenated grains (see x 7). Another possibleroute would be to observe selected quasars in order to extendthe UV coverage in objects for which only the onset of the breakis seen so far. The idea would be to look for a confirmation ofa flux rise shortward of 700 8 in as many quasars as possible.This would require high-quality observations using a satellitewith FUV sensitivity. One possibility might be the R ¼ 1000spectrometer on board the projected World Space Observatorysatellite, which is expected to offer a sensitivity window cov-ering the range 1100–3500 8 (kobs) (Barstow et al. 2003).
We have ruled out that the dust causing the 1000 8 break ispredominantly intergalactic on the basis that it is not requiredper se and that the FUV rise could not be modeled satisfactorilyusing intergalactic dust. Furthermore, the amount of crystallinecarbon that is needed turns out to be improbably large. Sinceintergalactic dust is not responsible for the continuum rolloverobserved in HS 1700+6416 and HE 2347�4342, at z ’ 2:8, wehave proposed that this feature is a manifestation of a higherenergy break, near 18.5 eV, which is presumably intrinsic. In-cluding the same break in the other quasar SEDs markedly im-proves the simulation of the composite, as well as the detailedmodeling of the FUV rise in PG 1008+1319 and PKS 0232�04.At any rate, such a break is bound to take place somewhere inthe FUV so that the quasar SED connects smoothly with the softX-rays. In effect, the optical–X-ray index, �ox, which relates themonochromatic continuum flux at 2500 8 to that at 2 keV, ischaracterized by values in the range 1.3–1.6 (equivalent to an ��
between �1.3 and �1.6). Given that our mean �NUV index forclass A is much harder, with �0.44, a continuum turnover musttake place somewhere in the FUV. Our results suggest that suchturnover occurs at 18.5 eV. We are currently in the processof studying how the FUVand the soft X-rays may join together(S. Haro-Corzo et al. 2005, in preparation).
Intrinsic dust models require gas columns of the order1020 cm�2, assuming solar C abundance and full depletion ontonanodiamond grains. For comparison, in the solar neighbor-hood, a V-band extinction of a tenth of a magnitude by ISM dustcorresponds to a gas column of 1:9 ; 1020 cm�2 (Whittet 2003).Larger columns (but the same dust masses) would be implied forour models, if we assumed smaller dust-to-gas ratios. To the ex-tent that the nanodiamond dust lies in the vicinity of the AGN,the minimum dust mass required by intrinsic models is small,’0:003N20r
2pc M� (see x 7). This value is independent of the as-
sumed dust-to-gas ratio because the absorption gas columnsscale inversely with it (see footnote 14).
We have shown evidence that ISM-like dust might beplaying a role in explaining the continuum appearance of a frac-tion of quasars, the so-called class C quasars. To confirm thissuggestion will require more complex models than presentedhere, in which more extinction components might have to be con-templated (ISM, SMC, nanodiamonds, SiC, etc.). An alternativeis that class C quasars emit with an intrinsically much softerSED.
How does the intrinsic dust hypothesis fare in relation to theresult of Scott et al. (2004), in which the break is apparently
absent in local universe AGNs? An interesting scenario comes tomind. An inspection of the 45 multigrating spectra, which couldnot be classified because their spectra did not extend down to900 8 (krest; see x 3.4), reveals that the softer class C spectra aremore frequent at lower redshifts. Interestingly, a fraction of classC quasars do not show any break (see spectrum of 3C 279 inFig. 11). A possibility might be that there is a secular evolutionof the dust properties, with nanodiamonds being absent in qua-sars with zqk 2:5, later becoming predominant at zq < 2, and,finally, being progressively replaced by ISM-like dust forzqP 0:7.Interpreting the 1000 8 break in terms of dust absorption
may contribute to resolving the following issues in the AGNfield:
1. The continuum rise in the 650–700 8 region, seen in afew individual quasar spectra, is not predicted by any accretiondiskmodel or any other continuum emissionmodel known to theauthors. Such a rise, on the other hand, is expected with nano-diamond dust absorption.2. If the 10008 break is intrinsic to the ionizing continuum of
quasars, the mean ionizing photon energy turns out rather small,making it difficult to account for the observed luminosities of thehigh-excitation lines (e.g., Korista et al. 1997). With the alter-native interpretation of dust absorption, the SED turnover ispushed to higher energies and the break is an artifact of line-of-sight dust absorption.3. The puzzling fact that the high-excitation emission lines in
UV-deficient quasars (e.g., class B quasars such as PG 1248+401in Fig. 3) are comparatively as luminous as in other quasars. Thisis easily explained by dust absorption provided that the dust liesoutside the BLR or under any geometry, in which dust only af-fects the observer’s line of sight and not the BLR lines of sightto the UV source.4. The FUV rise observed in a few quasars, HS 1307+4617,
PG 1008+1319, and PKS 0232�04, must be followed by an SEDturnover at higher energies. A detailed modeling of this fluxrise, assuming dust absorption, and the shallow rollover seen inHS1700+6416 and HE 2347�4342 (as well as the sharper cut-off in class D object HE 1122�1649; Fig. 18) are both consistentwith the presence of a continuum cutoff at 18.5 eV. Even if sucha cutoff is not directly perceptible in individual spectra in the restof the sample, it is consistent with the FUV slope seen in the TZ02composite.5. The narrow continuum dip shortward of the Ne viii emis-
sion line in the composite spectra of TZ02 and Scott et al. (2004)is not accompanied by a similar absorption dip blueward of O vi
in emission, as one might expect if the trough was due to absorp-tion by an outflowing ionized wind. Instead, the Ne viii troughcould be the result of the narrow absorption peak that charac-terizes the cubic diamond (D1) extinction curve.
This work was supported by the CONACyT grant 40096-Fand the UNAM PAPIIT grants IN113002 and IN118601. We areespecially indebted to Randal Telfer for sharing his reducedHSTFOS spectra used throughout this paper.Diethild Starkmeth helped us with proofreading.We acknowl-
edge the technical support of Liliana Hernandez and CarmeloGuzman for configuring the Linux workstation Deneb and ofVeronica Mata Acosta and Gloria Xochitl Perez for the biblio-graphical research.
BINETTE ET AL.676 Vol. 631
REFERENCES
Acke, B., & van den Ancker, M. E. 2004, A&A, 426, 151Baldry, I. K., & Glazebrook, K. 2003, ApJ, 593, 258Barstow, M. A., et al. 2003, Proc. SPIE, 4854, 364Binette, L., Andersen, A. C., Mutschke, H., & Haro-Corzo, S. 2005c, Astron.Nachr., in press
Binette, L., Krongold, Y., Magris C., G., & de Diego, J. A. 2005a, Rev. Mex.AA Conf. Ser., in press
Binette, L., Magris, G., & Martin, P. 1993, in First Light in the Universe: Starsor QSOs?, ed. B. Rocca-Volmerange et al. (Paris: Editions Frontieres), 243
Binette, L., Morisset, C., & Haro-Corzo, S. 2005b, Rev. Mex. AA Conf. Ser., inpress
Binette, L., Robinson, A., & Courvoisier, T. J.-L. 1988, A&A, 194, 65Binette, L., Rodrıguez-Martınez, M., Haro-Corzo, S., & Ballinas, I. 2003, ApJ,590, 58
Bohren, C. F., & Huffman, D. R. 1983, Absorption and Scattering of Light bySmall Particles (New York: Wiley)
Calura, F., & Matteucci, F. 2004a, MNRAS, 350, 351———. 2004b, MNRAS, 351, 384Daulton, T. L., Ozima, M., & Shukolyukov, Y. 1995, Lunar Planet. Sci. Conf.,26, 313
Duley, W. W., & Grishko, V. I. 2001, ApJ, 554, L209Edwards, D. F., & Philipp, H. R. 1985, in Handbook of Optical Constants ofSolids, ed. E. D. Palik (Orlando: Academic), 665
Ferland, G. J., Baldwin, J. A., Korista, K. T., Hamann, F., Carswell, R. F.,Phillips, M., Wilkes, B., & Williams, R. E. 1996, ApJ, 461, 683
Ferrara, A., Ferrini, F., Barsella, B., & Franco, J. 1991, ApJ, 381, 137Guillois, O., Ledoux, G., & Reynaud, C. 1999, ApJ, 521, L133Jones, A. P., & d’Hendecourt, L. B. 2004, in ASP Conf. Ser. 309, Astrophysicsof Dust, ed. A. N. Witt, G. C. Clayton, & B. T. Draine (San Francisco: ASP),589
Jones, A. P., d’Hendecourt, L. B., Sheu, S.-Y., Chang, H.-C., Cheng, C.-L., &Hill, H. G. M. 2004, A&A, 416, 235
Koratkar, A., & Blaes, O. 1999, PASP, 111, 1Korista, K., Ferland, G., & Baldwin, J. 1997, ApJ, 487, 555
Kouchi, A., Nakano, H., Kimura, Y., & Kaito, C. 2005, ApJ, 626, L129Kriss, G. A., et al. 2001, Science, 293, 1112Laor, A., & Draine, B. T. 1993, ApJ, 402, 441Lewis, R. S., Anders, E., & Draine, B. T. 1989, Nature, 339, 117Lewis, R. S., Ming, T., Wacker, J. F., Anders, E., & Steel, E. 1987, Nature, 326,160
Martin, P. G., & Rouleau, F. 1991, in Extreme Ultraviolet Astronomy, ed. R. F.Malina & S. Bowyer (Oxford: Pergamon), 341
Mathews, W. G., & Ferland, G. J. 1987, ApJ, 323, 456Mutschke, H., Andersen, A. C., Jager, C., Henning, T., & Braatz, A. 2004,A&A, 423, 983
Neugebauer, G., Green, R. F., Matthews, K., Schmidt, M., Soifer, B. T., &Bennett, J. 1987, ApJS, 63, 615
Nuth, J. A., & Allen, J. E. 1992, Ap&SS, 196, 117O’Brien, P. T., Wilson, R., & Gondhalekar, P. M. 1988, MNRAS, 233, 801Perlmutter, S., et al. 1999, ApJ, 517, 565Reimers, D., Clavel, J., Groote, D., Engels, D., Hagen, H. J., Naylor, T.,Wamsteker, W., & Hopp, U. 1989, A&A, 218, 71
Rouan, D., et al. 2004, A&A, 417, L1Scott, J., Kriss, G. A., Brotherton, M. S., Green, R. F., Hutchings, J., Shull, J. M.,& Zheng, W. 2004, ApJ, 615, 135
Shang, Z., et al. 2005, ApJ, 619, 41Spergel, D. N., et al. 2003, ApJS, 148, 175Telfer, R. C., Zheng, W., Kriss, G. A., & Davidsen, A. F. 2002, ApJ, 565, 773(TZ02)
Tielens, A. G. G. M., Seab, C. G., Hollenbach, D. J., & McKee, C. F. 1987,ApJ, 319, L109
Van Kerckhoven, C., Tielens, A. G. G. M., & Waelkens, C. 2002, A&A, 384,568
Whittet, D. C. B. 2003, Dust in the Galactic Environment (2nd ed.; Bristol:IOP)
Zheng, W., Kriss, G. A., Telfer, R. C., Grimes, J. P., & Davidsen, A. F. 1997,ApJ, 475, 469
NANODIAMOND DUST AND FUV QUASAR BREAK 677No. 2, 2005