SULIT 1119/1 2 Part 1 Questions 1 to 8 Read the text carefully ...
Upload
independentCategory
view
2download
0
The Astrophysical Journal, 758:69 (10pp), 2012 October 10 doi:10.1088/0004-637X/758/1/69C© 2012. The American Astronomical Society. All rights reserved. Printed in the U.S.A.
BAL PHOSPHORUS ABUNDANCE AND EVIDENCE FOR IMMENSE IONIC COLUMN DENSITIES INQUASAR OUTFLOWS: VLT/X-SHOOTER OBSERVATIONS OF QUASAR SDSS J1512+1119∗
Benoit C. J. Borguet1, Doug Edmonds1, Nahum Arav1, Chris Benn2, and Carter Chamberlain11 Department of Physics, Virginia Tech, Blacksburg, VA 24061, USA; [email protected]
2 Isaac Newton Group, E-38700 Santa Cruz de La Palma, SpainReceived 2012 May 22; accepted 2012 August 26; published 2012 September 26
ABSTRACT
We present spectroscopic analysis of the broad absorption line (BAL) outflow in quasar SDSS J1512+1119. Inparticular, we focus our attention on a kinematic component in which we identify P v and S iv/S iv* absorptiontroughs. The shape of the unblended phosphorus doublet troughs and the three S iv/S iv* troughs allow us to obtainreliable column density measurements for these two ions. Photoionization modeling using these column densitiesand those of He i* constrain the abundance of phosphorus to the range of 0.5–4 times the solar value. The totalcolumn density, ionization parameter, and metallicity inferred from the P v and S iv column densities lead to largeoptical depth values for the common transition observed in BAL outflows. We show that the true C iv optical depthis ∼1000 times greater in the core of the absorption profile than the value deduced from its apparent optical depth.
Key words: galaxies: individual (SDSS J1512+1119) – line: formation – quasars: absorption lines
Online-only material: color figures
1. INTRODUCTION
Active galactic nucleus (AGN) outflows have been detected asblueshifted broad absorption lines (BALs) in the UV spectra of∼20% of quasars (Hewett & Foltz 2003; Dai et al. 2008; Kniggeet al. 2008) and as narrow absorption lines in ∼50% of Seyfertgalaxies (Crenshaw et al. 2003; Dunn et al. 2008). There isgrowing evidence that these ubiquitous sub-relativistic ionizedoutflows play an important role on sub-parsec as well as kilo-parsec scales in controlling the growth of the central black hole,the evolution of the host galaxy, and the chemical enrichmentof the intergalactic medium (e.g., Elvis 2006; Moe et al. 2009;Ostriker et al. 2010). Moreover, the study of the abundances ofmetals in these outflows observed over a range of redshifts (up toz ∼ 5) provides us with a unique probe to investigate the historyand evolution of the chemical enrichment over cosmologicalscales, which constrains star formation scenarios and evolutionof the host galaxy (Hamann 1997, 1998; Hamann & Ferland1999; Hamann et al. 2003, 2007; Di Matteo et al. 2004; Germainet al. 2009; Barai et al. 2011).
Studying absorption lines from AGN outflows is the mostdirect way to determine chemical abundances in the AGN envi-ronment. This is done by comparing the column densities asso-ciated with ionized species of the different elements observedacross the spectrum, combined with photoionization analysis.The major advantage of using absorption lines over emissionlines in abundance studies resides in the fact that they providediagnostics that largely do not depend on temperature and den-sity (Hamann 1998). Early abundance studies in BAL outflowsimplied particularly high abundances of heavy elements relativeto hydrogen. In several cases, enhancement of carbon, nitrogen,oxygen, and silicon by factors of tens to hundreds of times thesolar values were reported in several objects (e.g., Turnshek1986; Turnshek et al. 1996; Hamann 1998), in contrast to theorder of magnitude or less, generally derived from the analysisof the quasar emission lines (e.g., Hamann & Ferland 1993;Hamann et al. 2002; Dietrich et al. 2003; Juarez et al. 2009).
∗ Based on observations collected at the European Southern Observatory,Chile, PID:87.B-0229.
Perhaps the most puzzling observation was the detectionof BALs associated with P v (Junkkarinen et al. 1995; Aravet al. 2001b; Hamann 1998; Hamann et al. 2003). Phosphorusis ∼900 times less abundant than carbon in the solar photo-sphere (Lodders et al. 2009). Since P v and C iv have similarionization potentials they are formed in similar environments.This suggests, based on direct comparison of the measured col-umn densities, an overabundance of phosphorus over carbonof �100 times the solar value (e.g., Junkkarinen et al. 1995,1997; Turnshek et al. 1996; Hamann 1998). Shields (1996)suggested a scenario consistent with the reported phosphorusoverabundances in which the enrichment of the BAL materialis mainly controlled by a population of galactic novae. How-ever, our group (Arav 1997; Arav et al. 1999a, 1999b, 2001a,2001b, 2002, 2003; de Kool et al. 2001; Scott et al. 2004; Gabelet al. 2005a) and others (Barlow & Sargent 1997; Hamann et al.1997; Telfer et al. 1998; Churchill et al. 1999; Ganguly et al.1999) showed that column densities derived from the apparentoptical depth (AOD) analysis of BAL troughs are unreliabledue to non-black saturation in the troughs. Therefore, Hamann(1998), Hamann & Ferland (1999), Hamann et al. (2003), andLeighly et al. (2009) suggested that the extreme overabundanceof phosphorous relative to carbon is an artifact of very high lev-els of saturation in the C iv troughs, compared to only mild (ornon) saturation in the P v troughs. Subsequent measurements ofabundances in Seyfert and quasar outflows accounted for non-black saturation and yielded abundances of only a few timessolar in the outflows (Gabel et al. 2006; Arav et al. 2007).
The non-black saturation hypothesis was largely accepted bythe community to explain the C iv/P v BAL observations. Butthis scenario implies that the actual optical depth in the C ivtrough is roughly 1000 times larger than the apparent one, anassertion that was never verified empirically. In this paper, westudy the UV outflow of SDSS J1512+1119, which exhibits deepabsorption troughs from P v as well as S iv. In particular, wereport the detection of the excited S iv λ1073.51 line, a transition10 times weaker than the excited S iv λ1072.96. Together withestimates of the number density provided by the analysis ofabsorption troughs from excited states of C iii and Fe iii, we
1
The Astrophysical Journal, 758:69 (10pp), 2012 October 10 Borguet et al.
pinpoint the S iv column density. Photoionization modeling,using the derived column densities as input, shows that thephosphorus abundance is close to the solar values. This allows usto confirm that the true C iv optical depth is ∼1000 times greaterin the core of the absorption profile than the value deduced fromAOD measurements.
The plan of the paper is as follows. In Section 2, we presentthe Very Large Telescope (VLT)/X-Shooter observations ofSDSS J1512+1119 along with the reduction of the data. InSection 3, we identify the spectral features and estimate thecolumn density associated with each ionic species. We discussthe photoionization solution for the absorber and the impliedphosphorus abundance in Section 4. We conclude the paper bysummarizing the key points of the analysis in Section 5.
2. OBSERVATION AND DATA REDUCTION
SDSS J1512+1119 (J2000: R.A. = 15 12 49.29; decl. =+11 19 29.36; z = 2.1062 ± 0.0020; Hewett & Wild 2010;V = 17.7), also identified as Q1510+115, is one of the objectsoriginally discovered in the spectroscopic survey conducted byHazard using objective prism plates with the UK Schmidt tele-scope (cf. Sargent et al. 1988). Later spectroscopic observationswith the double spectrograph at the Palomar Hale telescoperevealed the presence of broad (Δv ∼ 1700 km s−1 in C iv)absorption troughs associated with Lyα, C iv, and N v whileseveral resolved components were identified in Si iv (Sargentet al. 1988).
We observed the quasar SDSS J1512+1119 with the VLT/X-Shooter spectrograph on 2011 April 26 as part of our program87.B-0229 (PI: Benn). X-Shooter is the second-generation,wide-band (3000–24000 Å), medium-resolution (R ∼ 6000)spectrograph installed at the Cassegrain focus of VLT/UT2. Inthis instrument, the incoming light is split into three independentarms, each arm consisting of a prism-cross-dispersed echellespectrograph optimized for the UV-blue, visible, and near-IR wavelengths (UVB, VIS, and NIR, respectively) whichallows for coverage of the full bandwidth in a single exposure.A detailed description of the instrument and performancecan be found in Vernet et al. (2011). The total integrationtime for the UVB, VIS, and NIR arms are 8400, 8400, and8700 s, respectively. The observations were performed in the slitnodding mode with two positions using a slit width of 0.′′8 in theUVB and 0.′′9 in the VIS and NIR, leading to respective resolvingpowers R = Δλ/λ of 6200, 8800, and 6100. Except for a linefrom the metastable 2 3S excited state of He i (He i* λ3889.80,discussed in a forthcoming paper), no additional diagnostic linesare observed within the NIR range so that we limit the currentstudy to the UVB and VIS range of the data.
The observations were reduced in nodding mode using theESO Reflex3 workflow (Ballester et al. 2011) and the ESOX-Shooter pipeline version 1.4.5 (Modigliani et al. 2010) inorder to obtain the rectified and wavelength calibrated two-dimensional spectra for each arm. After manually flaggingthe remaining cosmic ray hits in the individual frames, weextracted one-dimensional spectra using an optimal extractionalgorithm based on the method outlined in Horne (1986). Anidentical treatment was performed on the observation of thespectroscopic standard star LTT79874 observed on the sameday as the quasar, allowing us to flux calibrate the spectra in the
3 Reflex is available at http://www.eso.org/sci/software/pipelines/.4 The flux calibrated reference spectrum can be found athttp://www.eso.org/sci/observing/tools/standards/spectra/ltt7987.html.
range 3200–9500 Å. We present the reduced X-shooter spectrain Figure 1.
3. ANALYSIS OF THE ABSORBER
Comparing the unblended line profile of the Si iv doublet, wedistinguish five main kinematic components associated with theintrinsic outflow in our VLT/X-Shooter data. The centroid of theabsorption features are located at radial velocities v ∼ −2100,−1850, −1500, −1050, and −520 km s−1 in the rest frame ofSDSS J1512+1119 (see Figure 2). Using the Si iv componentsas a template, we identify absorption troughs associated withthe kinematic components in a series of ions spanning a rangeof ionization. While the kinematic components are deep andblended together in the ubiquitous Lyα, Lyβ, O vi, N v, andC iv transitions, some of the components are resolved in theMg ii, C ii, Si ii, Si iii, Al ii, Al iii, and He i* lines (see Figure 3).We report the detection of deep absorption troughs associatedwith the P v doublet in the component located at −1850 km s−1
(component 2, see Figure 3), as well as absorption associatedwith ground state and excited S iv, and excited C iii and Fe iii.Of particular interest in this component is the detection ofthe high ionization excited S iv λ1073.51 transition, a line10 times weaker than the S iv λ1072.96 arising from the sameexcited level. The combined detection of these lines allows usto accurately determine the total S iv column density for thatsystem (see Section 3.2). In the remainder of this analysis wewill focus our attention on component 2, deferring the study ofthe other components to a forthcoming paper.
3.1. Ionic Column Densities
In order to compute the column densities, we first need toestimate the spectrum of the background source (continuumand emission lines) illuminating the absorbing material. Wemodel the unabsorbed and dereddened (E(B − V ) = 0.051Schlegel et al. 1998) continuum by a single power law (PL) ofthe form Fλ = F1100(λ/1100)α , where F1100 = 77.01 ± 0.05 ×10¹⁷ erg cm−2 s−1 Å−1 is the observed flux at 1100 Å (rest frame)and the PL index α = −0.403 ± 0.004. Given the overall highsignal-to-noise ratio (S/N) of the X-Shooter data (S/N ∼ 30–70over most of the UVB/VIS range), we then fit the unabsorbedline emission using a smooth third-order spline fit. We constrainthe emission model over the broader troughs associated withLyβ, O vi, Lyα, N v, and C iv by using the profiles derived fromthe unabsorbed red wings of each emission line. This fittingprocedure is particularly effective given the tight constraints onthe unabsorbed emission due to the high S/N and the presenceof mainly narrow absorption features across the spectrum.
Once normalized by the emission profile, we extract theionic column densities N [ion] for each species by modeling theobserved residual intensity Ii (see Figure 3) inside the troughsas a function of the radial velocity. We use three differentmodels in order to account for inhomogeneities in the absorbingmaterial: AOD, partial covering (PC), and a PL model (seeEdmonds et al. 2011; Borguet et al. 2012 for details). Weintegrate the line-of-sight-averaged column density (Hamann& Sabra 2004; Edmonds et al. 2011) over the radial velocityrange v ∈ [−2030,−1570] km s−1 corresponding to kinematiccomponent 2 and report the values in Table 1. We only reportlower limits derived with the AOD model on column densitiesfor singlet lines (Al ii, C ii, Si ii) as well as for deep/self-blendedtroughs such as O vi, C iv, and N v.
2

The Astrophysical Journal, 758:69 (10pp), 2012 October 10 Borguet et al.
Figure 1. Reduced UVB+VIS X-shooter spectra of the quasar SDSS J1512+1119. We indicate the position of most of the absorption lines associated with the intrinsicoutflow (see Section 3). The VIS spectrum has not been corrected for atmospheric absorption (the “+” indicates the location of the major O2 and H2O atmosphericbands within the spectral range). This does not affect our study since our diagnostic lines are located in regions free of such contamination.
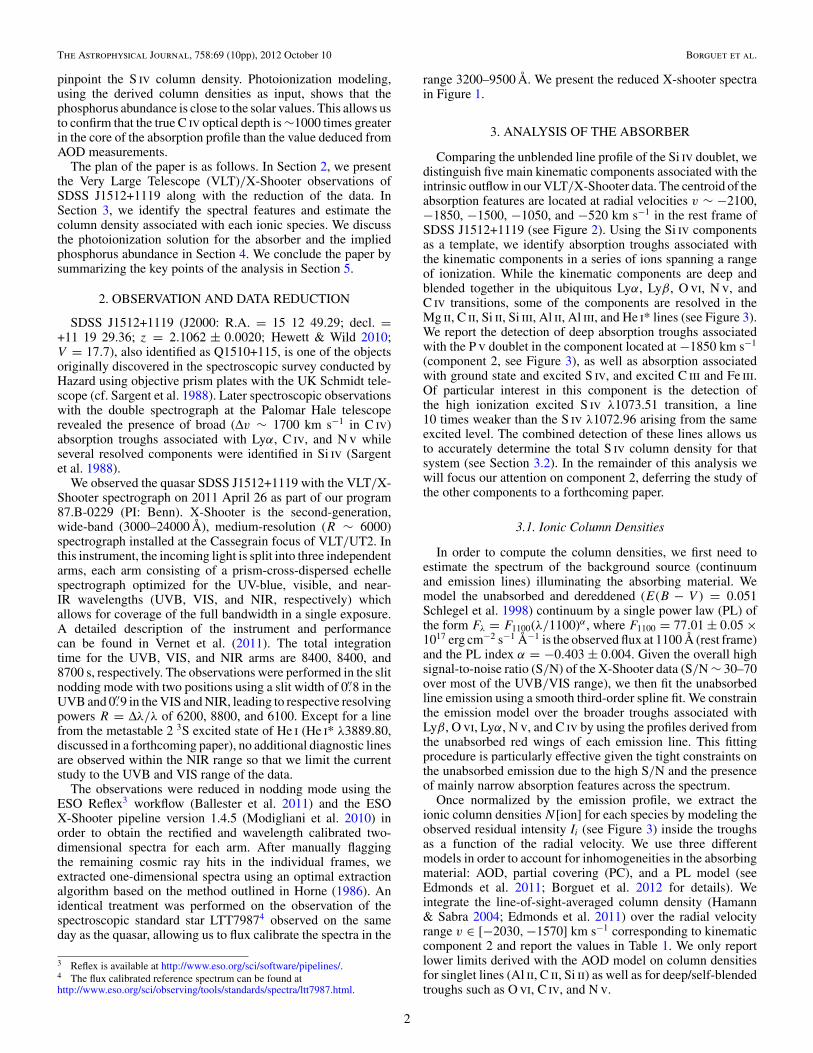
For photoionization modeling, actual N [ion] measurementswith robust error bars are much more useful than lower (orupper) limits. We now demonstrate that the troughs of Al iii, P v,and He i* are not heavily saturated and therefore reliable N [ion]measurements can be extracted for them. In Section 3.2 we showthat this is also the case for S iv*. Let us first examine the Al iii,and P v doublets, where the oscillator strength (f ) of the bluetransition is twice that of the red transition. From Figure 3 we caninfer that in both cases the residual intensity of the red doublet
component (Ir) is significantly higher than the residual intensityof the blue doublet component (Ib) along essentially the entireabsorption trough. Such a situation implies the true ionic columndensity in the trough cannot be much larger than 2–3 times thatof an AOD estimate (see detailed treatment of this issue in Aravet al. 2005, 2008). Our Table 1 shows that this is indeed the casefor Al iii and P v, where we are able to measure robust N [ion]for these ions using all three absorption models. If we definethe saturation as S ≡ N [ion](PL)/N[ion](AOD), then the level
3
The Astrophysical Journal, 758:69 (10pp), 2012 October 10 Borguet et al.
Figure 2. Intrinsic absorption troughs associated with Si iv in the VLT/X-Shooter spectrum of SDSS J1512+1119. At the resolution of the instrument,the outflow is resolved in five unblended components spanning a range ofvelocities between −2100 and −520 km s−1. The continuous line representsthe unabsorbed emission model we built (see Section 3.1), and the dashed linesrepresents the continuum and emission line models.
(A color version of this figure is available in the online journal.)
of saturation in these troughs (from Table 1) is less than 1.2 forAl iii and less than 3 for P v (even when taking the large uppererror bar on the P v measurement). Similarly, He i* is even lesssaturated (S < 1.1). Under these conditions, the exact behaviorof the covering fraction as a function of velocity (C(v)) acrossthe trough for the PC model, or that of the exponent a(v) ofthe PL method, does not affect the robustness of the derivedN [ion].
While Si iv does not seem particularly saturated in Figure 3,we have to stress the fact that the normalization of the line profilewas performed under the assumption that the absorbing materialcovers the emission sources (continuum and emission lines) bythe same fraction. A closer inspection of the non-normalizedO vi and C iv absorption troughs, however, reveals the existenceof residual emission indicating that at least part of the emissionlines (the intermediate/narrow emission component) are notfully covered by the absorber as observed in other outflows(e.g., Arav et al. 1999a; Gabel et al. 2006). Failure to accountfor this observation leads to an underestimation of the total Si ivcolumn density since the weaker line emission under the blueabsorption trough relative to the red would mislead the observerby making the doublet appear non-saturated (see Figure 2). Forthis reason, we report a lower limit on the Si iv column densityin Table 1. Another transition that could be affected by thisproblem is Mg ii, although in this case, the weaker underlyingline emission would only affect the absorption profile of thered component of the doublet. Other non-saturated species (P v,Al iii, etc.) are located farther away from significant emissionlines in the SDSS J1512+1119 spectrum and are therefore notaffected by this problem. In the last column of Table 1, wereport the column densities used in the photoionization analysis.Those column densities are selected according to the followingprocedure: We use the values reported in the PC column asthe measurements and the PL measurement and error as theupper error in order to account for possible inhomogeneitiesin the absorber (see Borguet et al. 2012). When only AOD
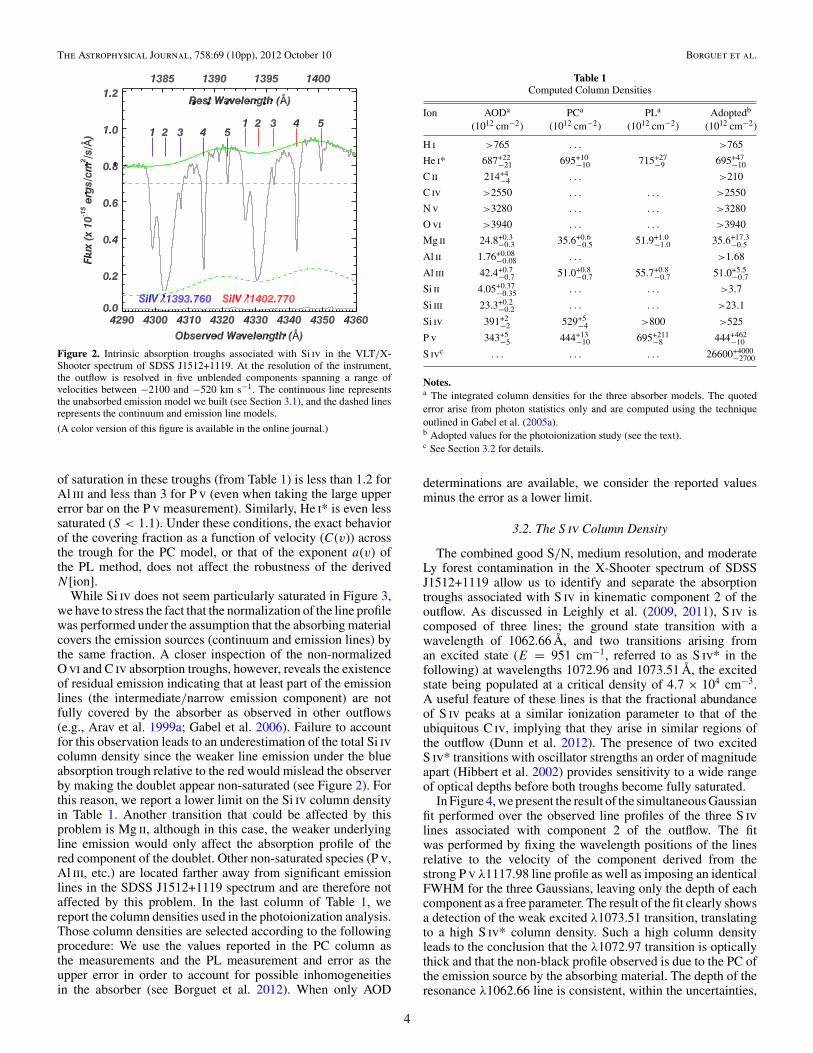
Table 1Computed Column Densities
Ion AODa PCa PLa Adoptedb
(1012 cm−2) (1012 cm−2) (1012 cm−2) (1012 cm−2)
H i >765 . . . >765
He i* 687+22−21 695+10
−10 715+27−9 695+47
−10
C ii 214+4−4 . . . >210
C iv >2550 . . . . . . >2550
N v >3280 . . . . . . >3280
O vi >3940 . . . . . . >3940
Mg ii 24.8+0.3−0.3 35.6+0.6
−0.5 51.9+1.0−1.0 35.6+17.3
−0.5
Al ii 1.76+0.08−0.08 . . . >1.68
Al iii 42.4+0.7−0.7 51.0+0.8
−0.7 55.7+0.8−0.7 51.0+5.5
−0.7
Si ii 4.05+0.37−0.35 . . . . . . >3.7
Si iii 23.3+0.2−0.2 . . . . . . >23.1
Si iv 391+2−2 529+5
−4 >800 >525
P v 343+5−5 444+13
−10 695+211−8 444+462
−10
S ivc . . . . . . . . . 26600+4000−2700
Notes.a The integrated column densities for the three absorber models. The quotederror arise from photon statistics only and are computed using the techniqueoutlined in Gabel et al. (2005a).b Adopted values for the photoionization study (see the text).c See Section 3.2 for details.
determinations are available, we consider the reported valuesminus the error as a lower limit.
3.2. The S iv Column Density
The combined good S/N, medium resolution, and moderateLy forest contamination in the X-Shooter spectrum of SDSSJ1512+1119 allow us to identify and separate the absorptiontroughs associated with S iv in kinematic component 2 of theoutflow. As discussed in Leighly et al. (2009, 2011), S iv iscomposed of three lines; the ground state transition with awavelength of 1062.66 Å, and two transitions arising froman excited state (E = 951 cm−1, referred to as S iv* in thefollowing) at wavelengths 1072.96 and 1073.51 Å, the excitedstate being populated at a critical density of 4.7 × 104 cm−3.A useful feature of these lines is that the fractional abundanceof S iv peaks at a similar ionization parameter to that of theubiquitous C iv, implying that they arise in similar regions ofthe outflow (Dunn et al. 2012). The presence of two excitedS iv* transitions with oscillator strengths an order of magnitudeapart (Hibbert et al. 2002) provides sensitivity to a wide rangeof optical depths before both troughs become fully saturated.
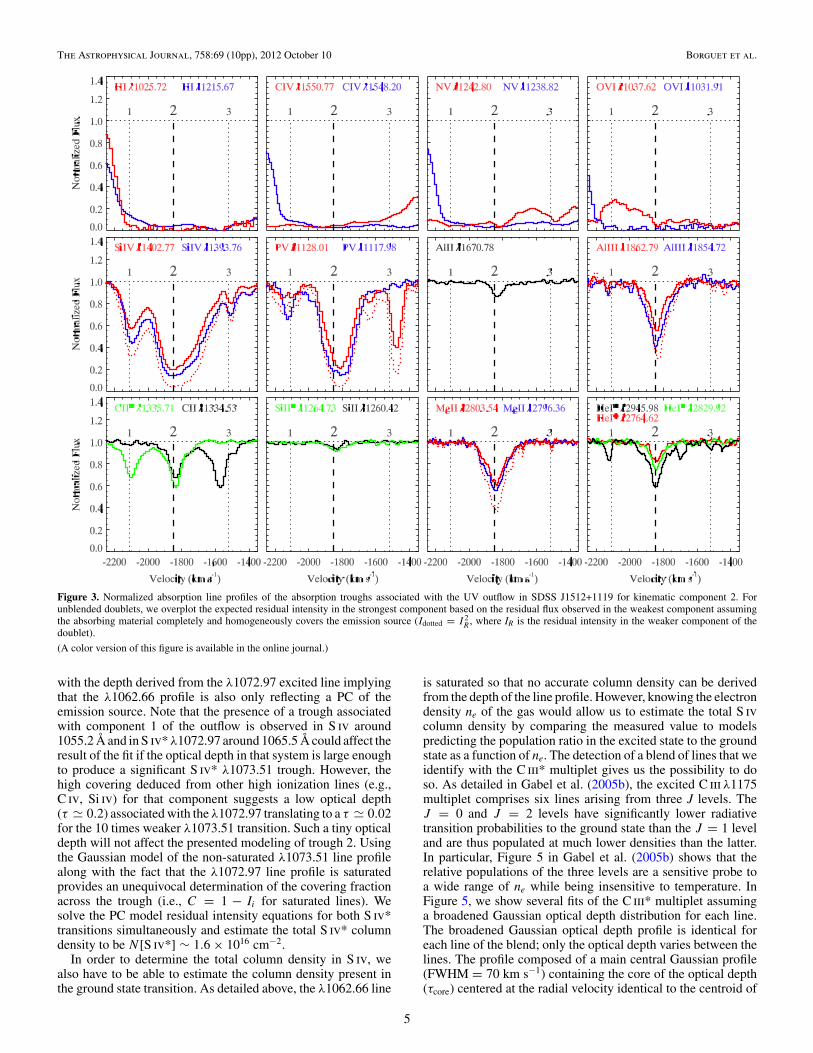
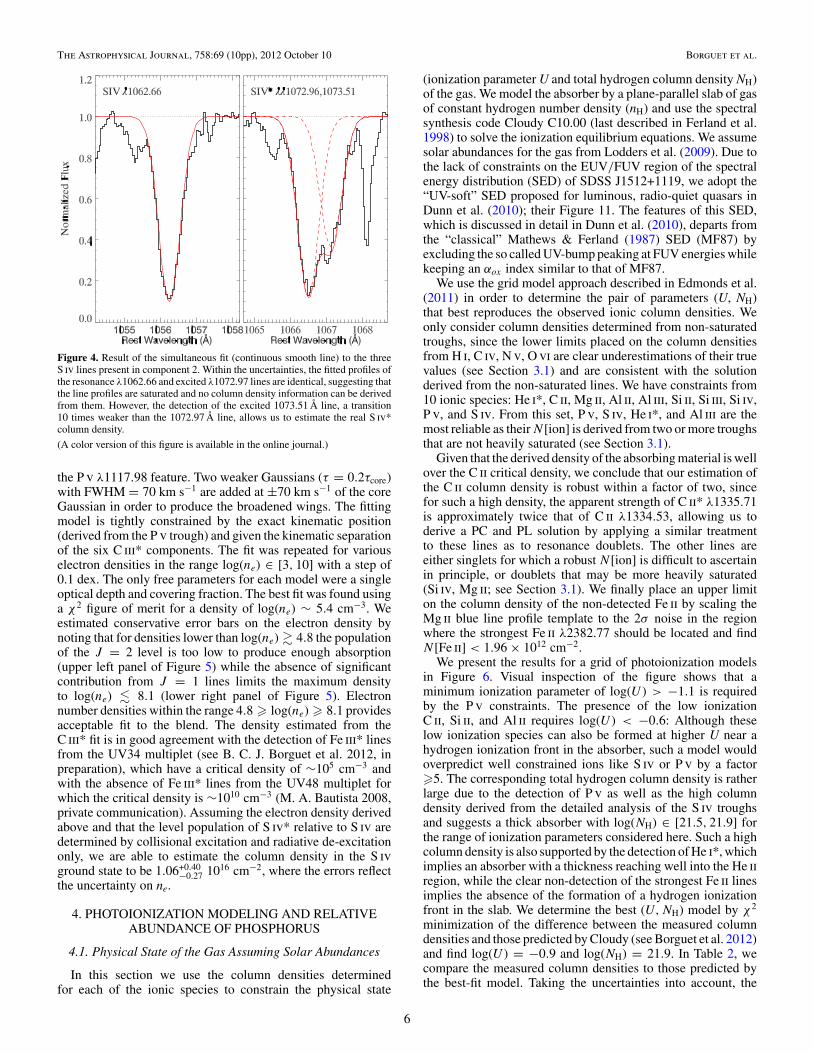
In Figure 4, we present the result of the simultaneous Gaussianfit performed over the observed line profiles of the three S ivlines associated with component 2 of the outflow. The fitwas performed by fixing the wavelength positions of the linesrelative to the velocity of the component derived from thestrong P v λ1117.98 line profile as well as imposing an identicalFWHM for the three Gaussians, leaving only the depth of eachcomponent as a free parameter. The result of the fit clearly showsa detection of the weak excited λ1073.51 transition, translatingto a high S iv* column density. Such a high column densityleads to the conclusion that the λ1072.97 transition is opticallythick and that the non-black profile observed is due to the PC ofthe emission source by the absorbing material. The depth of theresonance λ1062.66 line is consistent, within the uncertainties,
4
The Astrophysical Journal, 758:69 (10pp), 2012 October 10 Borguet et al.
Figure 3. Normalized absorption line profiles of the absorption troughs associated with the UV outflow in SDSS J1512+1119 for kinematic component 2. Forunblended doublets, we overplot the expected residual intensity in the strongest component based on the residual flux observed in the weakest component assumingthe absorbing material completely and homogeneously covers the emission source (Idotted = I 2
R , where IR is the residual intensity in the weaker component of thedoublet).
(A color version of this figure is available in the online journal.)
with the depth derived from the λ1072.97 excited line implyingthat the λ1062.66 profile is also only reflecting a PC of theemission source. Note that the presence of a trough associatedwith component 1 of the outflow is observed in S iv around1055.2 Å and in S iv* λ1072.97 around 1065.5 Å could affect theresult of the fit if the optical depth in that system is large enoughto produce a significant S iv* λ1073.51 trough. However, thehigh covering deduced from other high ionization lines (e.g.,C iv, Si iv) for that component suggests a low optical depth(τ � 0.2) associated with the λ1072.97 translating to a τ � 0.02for the 10 times weaker λ1073.51 transition. Such a tiny opticaldepth will not affect the presented modeling of trough 2. Usingthe Gaussian model of the non-saturated λ1073.51 line profilealong with the fact that the λ1072.97 line profile is saturatedprovides an unequivocal determination of the covering fractionacross the trough (i.e., C = 1 − Ii for saturated lines). Wesolve the PC model residual intensity equations for both S iv*transitions simultaneously and estimate the total S iv* columndensity to be N [S iv*] ∼ 1.6 × 1016 cm−2.
In order to determine the total column density in S iv, wealso have to be able to estimate the column density present inthe ground state transition. As detailed above, the λ1062.66 line
is saturated so that no accurate column density can be derivedfrom the depth of the line profile. However, knowing the electrondensity ne of the gas would allow us to estimate the total S ivcolumn density by comparing the measured value to modelspredicting the population ratio in the excited state to the groundstate as a function of ne. The detection of a blend of lines that weidentify with the C iii* multiplet gives us the possibility to doso. As detailed in Gabel et al. (2005b), the excited C iii λ1175multiplet comprises six lines arising from three J levels. TheJ = 0 and J = 2 levels have significantly lower radiativetransition probabilities to the ground state than the J = 1 leveland are thus populated at much lower densities than the latter.In particular, Figure 5 in Gabel et al. (2005b) shows that therelative populations of the three levels are a sensitive probe toa wide range of ne while being insensitive to temperature. InFigure 5, we show several fits of the C iii* multiplet assuminga broadened Gaussian optical depth distribution for each line.The broadened Gaussian optical depth profile is identical foreach line of the blend; only the optical depth varies between thelines. The profile composed of a main central Gaussian profile(FWHM = 70 km s−1) containing the core of the optical depth(τcore) centered at the radial velocity identical to the centroid of
5
The Astrophysical Journal, 758:69 (10pp), 2012 October 10 Borguet et al.
Figure 4. Result of the simultaneous fit (continuous smooth line) to the threeS iv lines present in component 2. Within the uncertainties, the fitted profiles ofthe resonance λ1062.66 and excited λ1072.97 lines are identical, suggesting thatthe line profiles are saturated and no column density information can be derivedfrom them. However, the detection of the excited 1073.51 Å line, a transition10 times weaker than the 1072.97 Å line, allows us to estimate the real S iv*column density.
(A color version of this figure is available in the online journal.)
the P v λ1117.98 feature. Two weaker Gaussians (τ = 0.2τcore)with FWHM = 70 km s−1 are added at ±70 km s−1 of the coreGaussian in order to produce the broadened wings. The fittingmodel is tightly constrained by the exact kinematic position(derived from the P v trough) and given the kinematic separationof the six C iii* components. The fit was repeated for variouselectron densities in the range log(ne) ∈ [3, 10] with a step of0.1 dex. The only free parameters for each model were a singleoptical depth and covering fraction. The best fit was found usinga χ2 figure of merit for a density of log(ne) ∼ 5.4 cm−3. Weestimated conservative error bars on the electron density bynoting that for densities lower than log(ne) � 4.8 the populationof the J = 2 level is too low to produce enough absorption(upper left panel of Figure 5) while the absence of significantcontribution from J = 1 lines limits the maximum densityto log(ne) � 8.1 (lower right panel of Figure 5). Electronnumber densities within the range 4.8 � log(ne) � 8.1 providesacceptable fit to the blend. The density estimated from theC iii* fit is in good agreement with the detection of Fe iii* linesfrom the UV34 multiplet (see B. C. J. Borguet et al. 2012, inpreparation), which have a critical density of ∼105 cm−3 andwith the absence of Fe iii* lines from the UV48 multiplet forwhich the critical density is ∼1010 cm−3 (M. A. Bautista 2008,private communication). Assuming the electron density derivedabove and that the level population of S iv* relative to S iv aredetermined by collisional excitation and radiative de-excitationonly, we are able to estimate the column density in the S ivground state to be 1.06+0.40
−0.27 1016 cm−2, where the errors reflectthe uncertainty on ne.
4. PHOTOIONIZATION MODELING AND RELATIVEABUNDANCE OF PHOSPHORUS
4.1. Physical State of the Gas Assuming Solar Abundances
In this section we use the column densities determinedfor each of the ionic species to constrain the physical state
(ionization parameter U and total hydrogen column density NH)of the gas. We model the absorber by a plane-parallel slab of gasof constant hydrogen number density (nH) and use the spectralsynthesis code Cloudy C10.00 (last described in Ferland et al.1998) to solve the ionization equilibrium equations. We assumesolar abundances for the gas from Lodders et al. (2009). Due tothe lack of constraints on the EUV/FUV region of the spectralenergy distribution (SED) of SDSS J1512+1119, we adopt the“UV-soft” SED proposed for luminous, radio-quiet quasars inDunn et al. (2010); their Figure 11. The features of this SED,which is discussed in detail in Dunn et al. (2010), departs fromthe “classical” Mathews & Ferland (1987) SED (MF87) byexcluding the so called UV-bump peaking at FUV energies whilekeeping an αox index similar to that of MF87.
We use the grid model approach described in Edmonds et al.(2011) in order to determine the pair of parameters (U, NH)that best reproduces the observed ionic column densities. Weonly consider column densities determined from non-saturatedtroughs, since the lower limits placed on the column densitiesfrom H i, C iv, N v, O vi are clear underestimations of their truevalues (see Section 3.1) and are consistent with the solutionderived from the non-saturated lines. We have constraints from10 ionic species: He i*, C ii, Mg ii, Al ii, Al iii, Si ii, Si iii, Si iv,P v, and S iv. From this set, P v, S iv, He i*, and Al iii are themost reliable as their N [ion] is derived from two or more troughsthat are not heavily saturated (see Section 3.1).
Given that the derived density of the absorbing material is wellover the C ii critical density, we conclude that our estimation ofthe C ii column density is robust within a factor of two, sincefor such a high density, the apparent strength of C ii* λ1335.71is approximately twice that of C ii λ1334.53, allowing us toderive a PC and PL solution by applying a similar treatmentto these lines as to resonance doublets. The other lines areeither singlets for which a robust N [ion] is difficult to ascertainin principle, or doublets that may be more heavily saturated(Si iv, Mg ii; see Section 3.1). We finally place an upper limiton the column density of the non-detected Fe ii by scaling theMg ii blue line profile template to the 2σ noise in the regionwhere the strongest Fe ii λ2382.77 should be located and findN [Fe ii] < 1.96 × 1012 cm−2.
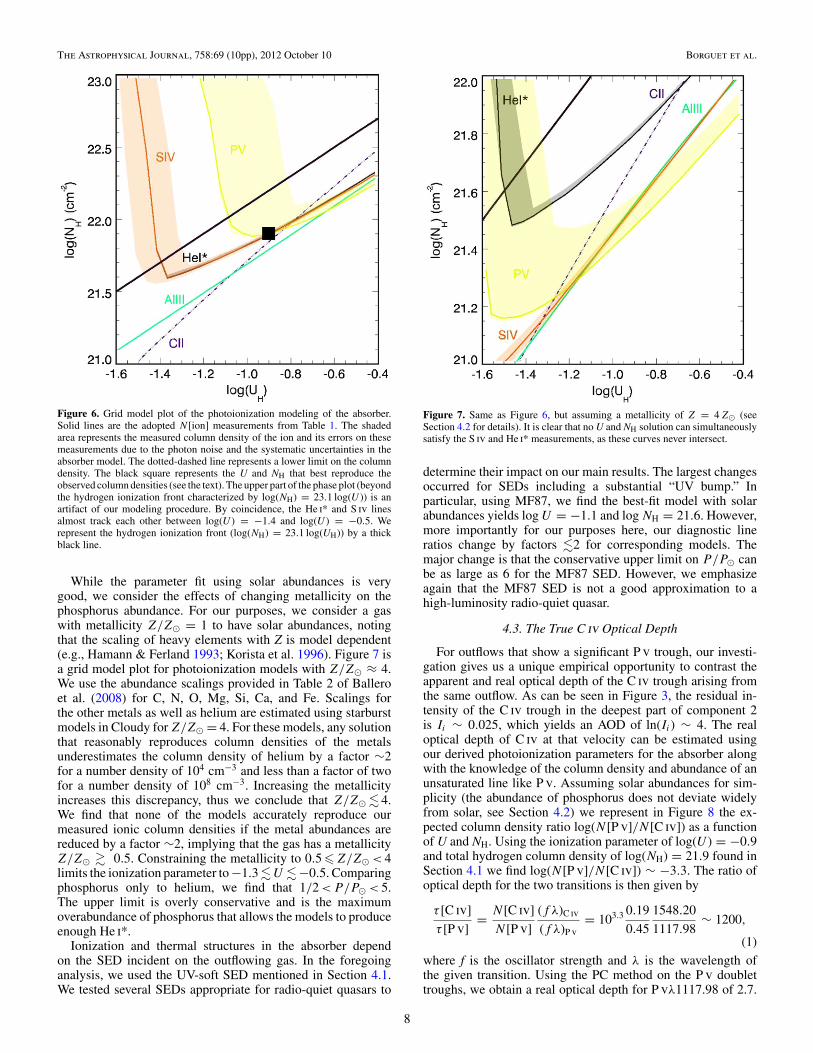
We present the results for a grid of photoionization modelsin Figure 6. Visual inspection of the figure shows that aminimum ionization parameter of log(U ) > −1.1 is requiredby the P v constraints. The presence of the low ionizationC ii, Si ii, and Al ii requires log(U ) < −0.6: Although theselow ionization species can also be formed at higher U near ahydrogen ionization front in the absorber, such a model wouldoverpredict well constrained ions like S iv or P v by a factor�5. The corresponding total hydrogen column density is ratherlarge due to the detection of P v as well as the high columndensity derived from the detailed analysis of the S iv troughsand suggests a thick absorber with log(NH) ∈ [21.5, 21.9] forthe range of ionization parameters considered here. Such a highcolumn density is also supported by the detection of He i*, whichimplies an absorber with a thickness reaching well into the He iiregion, while the clear non-detection of the strongest Fe ii linesimplies the absence of the formation of a hydrogen ionizationfront in the slab. We determine the best (U,NH) model by χ2
minimization of the difference between the measured columndensities and those predicted by Cloudy (see Borguet et al. 2012)and find log(U ) = −0.9 and log(NH) = 21.9. In Table 2, wecompare the measured column densities to those predicted bythe best-fit model. Taking the uncertainties into account, the
6

The Astrophysical Journal, 758:69 (10pp), 2012 October 10 Borguet et al.
Figure 5. Fits to the normalized C iii* multiplet blend (continuous line) for component 2. The vertical lines plotted under each sub-component of the multiplet showthe location of the centroid of the line and the length of the mark indicates the relative oscillator strength of the line. The absorption line located at 1170.6 Å is anunrelated line belonging to the Ly forest. We present the fit of the blended profile assuming the ratio between the J levels for four representative electron numberdensities. The lower limit on the possible ne is constrained by the inability of the model to fit the absorption associated with the longer wavelength J = 2 transition(upper left). The upper limit on the ne range is fixed by the apparition of significant absorption associated with the J = 1 level for log(ne) � 8.1 (lower right). Thebest fit of the blend is obtained for log(ne) = 5.1 (upper right panel). Other densities within the range 4.8 � log(ne) � 8.1 lead to acceptable fits of the blend (lowerleft panel).
(A color version of this figure is available in the online journal.)
Table 2Photoionization Model of the Absorber
Ion log(Nobs) (cm−2) log(Nmod) (cm−2) log(
NmodNobs
)
Adopteda Cloudy
log (U ) . . . −0.90b
log (NH) . . . 21.9b
H i >14.88 17.51 2.63He i* 14.84+0.03
−0.01 14.86 0.02C ii ∼14.33 14.50 0.19C iv >15.41 17.91 2.50N v >15.52 16.91 1.40O vi >15.60 17.81 2.21Mg ii 13.55+0.17
−0.01 14.34 0.79Al ii >12.23 12.45 0.22Al iii 13.71+0.05
−0.01 14.13 0.42Si ii >12.57 12.96 0.39Si iii >13.36 15.09 1.73Si iv >14.71 16.24 1.52P v 14.65+0.31
−0.01 14.65 0.00
S iv 16.43+0.06−0.04 16.45 0.02
Notes.a Adopted column densities reported in Table 1. Ions with robust measurementsare marked in boldface.b Best-fit Cloudy model.
column densities associated with the ions for which we havea robust measurement are matched well within a factor of twowhile the Al iii column density is reproduced within a factor ofthree. The computation also shows an underestimation by factorsof hundreds for the usual high ionization lines, underlining thefact that AOD measurements yield a poor estimate of the actualcolumn densities for these species.
4.2. Constraining the Relative Phosphorus Abundance
In this section, we use our knowledge of the photoionizationsolution and the measurements of the column densities ofP v and mainly He i* in order to constrain the abundance ofphosphorus in the outflowing material. Let us first assume thatall elements except phosphorus have solar abundances. Giventhe photoionization solution determined in Section 4.1, theabundance of phosphorus relative to helium is constrained bythe upper limit on the column density of P v to be �2 timesthe solar value. In these models, we use a hydrogen numberdensity of 104 cm−3, which is close to the lower limit determinedin Section 3.2. Increasing the hydrogen number density to108 cm−3, the upper limit on the number density, increasesU and NH by 0.1 dex each and reduces the upper limit on theabundance ratio P/P. We therefore conclude that, for solarabundances of the other elements, the phosphorus abundance isapproximately solar.
7
The Astrophysical Journal, 758:69 (10pp), 2012 October 10 Borguet et al.
Figure 6. Grid model plot of the photoionization modeling of the absorber.Solid lines are the adopted N [ion] measurements from Table 1. The shadedarea represents the measured column density of the ion and its errors on thesemeasurements due to the photon noise and the systematic uncertainties in theabsorber model. The dotted-dashed line represents a lower limit on the columndensity. The black square represents the U and NH that best reproduce theobserved column densities (see the text). The upper part of the phase plot (beyondthe hydrogen ionization front characterized by log(NH) = 23.1 log(U )) is anartifact of our modeling procedure. By coincidence, the He i* and S iv linesalmost track each other between log(U ) = −1.4 and log(U ) = −0.5. Werepresent the hydrogen ionization front (log(NH) = 23.1 log(UH)) by a thickblack line.
While the parameter fit using solar abundances is verygood, we consider the effects of changing metallicity on thephosphorus abundance. For our purposes, we consider a gaswith metallicity Z/Z = 1 to have solar abundances, notingthat the scaling of heavy elements with Z is model dependent(e.g., Hamann & Ferland 1993; Korista et al. 1996). Figure 7 isa grid model plot for photoionization models with Z/Z ≈ 4.We use the abundance scalings provided in Table 2 of Balleroet al. (2008) for C, N, O, Mg, Si, Ca, and Fe. Scalings forthe other metals as well as helium are estimated using starburstmodels in Cloudy for Z/Z = 4. For these models, any solutionthat reasonably reproduces column densities of the metalsunderestimates the column density of helium by a factor ∼2for a number density of 104 cm−3 and less than a factor of twofor a number density of 108 cm−3. Increasing the metallicityincreases this discrepancy, thus we conclude that Z/Z � 4.We find that none of the models accurately reproduce ourmeasured ionic column densities if the metal abundances arereduced by a factor ∼2, implying that the gas has a metallicityZ/Z � 0.5. Constraining the metallicity to 0.5 � Z/Z < 4limits the ionization parameter to −1.3 � U � −0.5. Comparingphosphorus only to helium, we find that 1/2 < P/P < 5.The upper limit is overly conservative and is the maximumoverabundance of phosphorus that allows the models to produceenough He i*.
Ionization and thermal structures in the absorber dependon the SED incident on the outflowing gas. In the foregoinganalysis, we used the UV-soft SED mentioned in Section 4.1.We tested several SEDs appropriate for radio-quiet quasars to
Figure 7. Same as Figure 6, but assuming a metallicity of Z = 4 Z (seeSection 4.2 for details). It is clear that no U and NH solution can simultaneouslysatisfy the S iv and He i* measurements, as these curves never intersect.
determine their impact on our main results. The largest changesoccurred for SEDs including a substantial “UV bump.” Inparticular, using MF87, we find the best-fit model with solarabundances yields log U = −1.1 and log NH = 21.6. However,more importantly for our purposes here, our diagnostic lineratios change by factors �2 for corresponding models. Themajor change is that the conservative upper limit on P/P canbe as large as 6 for the MF87 SED. However, we emphasizeagain that the MF87 SED is not a good approximation to ahigh-luminosity radio-quiet quasar.
4.3. The True C iv Optical Depth
For outflows that show a significant P v trough, our investi-gation gives us a unique empirical opportunity to contrast theapparent and real optical depth of the C iv trough arising fromthe same outflow. As can be seen in Figure 3, the residual in-tensity of the C iv trough in the deepest part of component 2is Ii ∼ 0.025, which yields an AOD of ln(Ii) ∼ 4. The realoptical depth of C iv at that velocity can be estimated usingour derived photoionization parameters for the absorber alongwith the knowledge of the column density and abundance of anunsaturated line like P v. Assuming solar abundances for sim-plicity (the abundance of phosphorus does not deviate widelyfrom solar, see Section 4.2) we represent in Figure 8 the ex-pected column density ratio log(N [P v]/N [C iv]) as a functionof U and NH. Using the ionization parameter of log(U ) = −0.9and total hydrogen column density of log(NH) = 21.9 found inSection 4.1 we find log(N [P v]/N [C iv]) ∼ −3.3. The ratio ofoptical depth for the two transitions is then given by
τ [C iv]
τ [P v]= N [C iv]
N [P v]
(f λ)C iv
(f λ)P v= 103.3 0.19
0.45
1548.20
1117.98∼ 1200,
(1)
where f is the oscillator strength and λ is the wavelength ofthe given transition. Using the PC method on the P v doublettroughs, we obtain a real optical depth for P vλ1117.98 of 2.7.
8

The Astrophysical Journal, 758:69 (10pp), 2012 October 10 Borguet et al.
Figure 8. Contours of the logarithm of the predicted ratio of column densitybetween P v and C iv, log(N [P v]/N [C iv]), as a function of the ionizationparameter U and the total hydrogen column density of the absorber NH.Assuming solar abundances and the photionization solution found in Section 4.1(represented by a solid diamond), Cloudy models predict a ratio of columndensity of log(N [P v]/N [C iv]) ∼ −3.3.
(A color version of this figure is available in the online journal.)
Therefore, Equation (1) yields a real C iv λ1548.20 optical depthof ∼3200! That is a value almost 1000 times larger than the AODof C iv(∼4). Thus the detection of P v troughs will indeed resultin heavily saturated C iv line profiles, with a real optical depthroughly a thousand times higher than the apparent one.
5. SUMMARY
In this paper, we studied the UV outflow associated withthe quasar SDSS J1512+1119 on the basis of new, medium-resolution VLT/X-Shooter data. The extended wavelength cov-erage of the instrument allowed us to detect the outflow com-ponents in a multitude of ionic species. In particular, we reportthe detection of deep P v absorption troughs in kinematic com-ponent 2 as well as the detection of S iv and S iv*. A detailedanalysis of the S iv* line profile allowed us to detect the weakλ1073.51 transition, revealing a S iv column density larger thansuggested by the apparent depth of the absorption troughs of theλ1072.97 transition.
Photoionization modeling of the absorber revealed that the ab-sorber is thick, though the non-detection of significant Fe ii ab-sorption troughs guarantees the absence of a significant amountof H i bound-free opacity. Our accurate determination of thetotal P v S iv He i* and lower ionization species column densi-ties allowed us to characterize the physical state of the gas. Wefind that for the range of ionization parameters relevant for thepresent absorber, the phosphorus abundance relative to heliumis consistent with the solar value. Using the parameter derivedfrom the photoionization analysis, we show, as suggested inHamann (1998), that a line such as the ubiquitous C iv is heav-ily saturated. The C iv column density derived from the apparentdepth of the absorption line profile underestimates the columndensity by a factor of ∼1000, providing a very poor estimate ofits true column density.
The phosphorus abundance we find is in disagreement withthe extreme phosphorus abundances reported in the early litera-ture (e.g., Junkkarinen et al. 1995, 1997; Hamann 1998). Otherelemental abundances are found to be in agreement with thesolar values. The fact that the abundances are similar to the
solar values for an odd (P v) and even (S iv) element points toenrichment by relatively “normal” galactic stellar populations(e.g., Hamann 1997) rather than the more exotic mechanismproposed by Shields (1996) that would significantly enhancethe P/S ratio (Hamann 1998).
B.B. thanks Pat Hall for suggesting looking at the Fe iii* lines,Manuel Bautista for providing critical densities for these lines,and also Martino Romaniello and the ESO Back-end OperationsDepartment for pointing out the existence of ESO-Reflex. Wethank the anonymous referee for valuable suggestions thatimproved the paper as well as the suggestion to use a diagnosticplot similar to the one presented in Figure 8. We acknowledgesupport from NASA STScI grants GO 11686 and GO 12022 aswell as NSF grant AST 0837880.
REFERENCES
Arav, N. 1997, in ASP Conf. Ser. 128, Mass Ejection from Active GalacticNuclei, ed. N. Arav, I. Shlosman, & R. J. Weymann (San Francisco, CA:ASP), 208
Arav, N., Becker, R. H., Laurent-Muehleisen, S. A., et al. 1999a, ApJ, 524,566
Arav, N., Brotherton, M. S., Becker, R. H., et al. 2001a, ApJ, 546, 140Arav, N., de Kool, M., Korista, K. T., et al. 2001b, ApJ, 561, 118Arav, N., Gabel, J. R., Korista, K. T., et al. 2007, ApJ, 658, 829Arav, N., Kaastra, J., Kriss, G. A., et al. 2005, ApJ, 620, 665Arav, N., Kaastra, J., Steenbrugge, K., et al. 2003, ApJ, 590, 174Arav, N., Korista, K. T., & de Kool, M. 2002, ApJ, 566, 699Arav, N., Korista, K. T., de Kool, M., Junkkarinen, V. T., & Begelman, M. C.
1999b, ApJ, 516, 27Arav, N., Moe, M., Costantini, E., et al. 2008, ApJ, 681, 954Ballero, S. K., Matteucci, F., Ciotti, L., Calura, F., & Padovani, P. 2008, A&A,
478, 335Ballester, P., Bramich, D., Forchi, V., et al. 2011, in ASP Conf. Ser. 442,
Astronomical Data Analysis Software and Systems XX, ed. I. N. Evanset al. (San Francisco, CA: ASP), 261
Barai, P., Martel, H., & Germain, J. 2011, ApJ, 727, 54Barlow, T. A., & Sargent, W. L. W. 1997, AJ, 113, 136Borguet, B. C. J., Edmonds, D., Arav, N., Dunn, J., & Kriss, G. A. 2012, ApJ,
751, 107Churchill, C. W., Mellon, R. R., Charlton, J. C., et al. 1999, ApJ, 519, L43Crenshaw, D. M., Kraemer, S. B., & George, I. M. 2003, ARA&A, 41, 117Dai, X., Shankar, F., & Sivakoff, G. R. 2008, ApJ, 672, 108de Kool, M., Arav, N., Becker, R. H., et al. 2001, ApJ, 548, 609Di Matteo, T., Croft, R. A. C., Springel, V., & Hernquist, L. 2004, ApJ, 610,
80Dietrich, M., Appenzeller, I., Hamann, F., et al. 2003, A&A, 398, 891Dunn, J. P., Arav, N., Aoki, K., et al. 2012, ApJ, 750, 143Dunn, J. P., Bautista, M., Arav, N., et al. 2010, ApJ, 709, 611Dunn, J. P., Crenshaw, D. M., Kraemer, S. B., & Trippe, M. L. 2008, AJ, 136,
1201Edmonds, D., Borguet, B., Arav, N., et al. 2011, ApJ, 739, 7Elvis, M. 2006, Mem. Soc. Astron. Italiana, 77, 573Ferland, G. J., Korista, K. T., Verner, D. A., et al. 1998, PASP, 110, 761Gabel, J. R., Arav, N., Kaastra, J. S., et al. 2005a, ApJ, 623, 85Gabel, J. R., Arav, N., & Kim, T. 2006, ApJ, 646, 742Gabel, J. R., Kraemer, S. B., Crenshaw, D. M., et al. 2005b, ApJ, 631, 741Ganguly, R., Eracleous, M., Charlton, J. C., & Churchill, C. W. 1999, AJ, 117,
2594Germain, J., Barai, P., & Martel, H. 2009, ApJ, 704, 1002Hamann, F. 1997, ApJS, 109, 279Hamann, F. 1998, ApJ, 500, 798Hamann, F., Barlow, T. A., Junkkarinen, V., & Burbidge, E. M. 1997, ApJ, 478,
80Hamann, F., & Ferland, G. 1993, ApJ, 418, 11Hamann, F., & Ferland, G. 1999, ARA&A, 37, 487Hamann, F., Korista, K. T., Ferland, G. J., Warner, C., & Baldwin, J. 2002, ApJ,
564, 592Hamann, F., & Sabra, B. 2004, in ASP Conf. Ser. 311, AGN Physics with the
Sloan Digital Sky Survey, ed. G. T. Richards & P. B. Hall (San Francisco,CA: ASP), 203
9

The Astrophysical Journal, 758:69 (10pp), 2012 October 10 Borguet et al.
Hamann, F., Sabra, B., Junkkarinen, V., Cohen, R., & Shields, G. 2003,arXiv:astro-ph/0304564
Hamann, F., Warner, C., Dietrich, M., & Ferland, G. 2007, in ASP Conf. Ser.373, The Central Engine of Active Galactic Nuclei, ed. L. C. Ho & J.-W.Wang (San Francisco, CA: ASP), 653
Hewett, P. C., & Foltz, C. B. 2003, AJ, 125, 1784Hewett, P. C., & Wild, V. 2010, MNRAS, 405, 2302Hibbert, A., Brage, T., & Fleming, J. 2002, MNRAS, 333, 885Horne, K. 1986, PASP, 98, 609Juarez, Y., Maiolino, R., Mujica, R., et al. 2009, A&A, 494, L25Junkkarinen, V. T., Beaver, E. A., Burbidge, E. M., et al. 1995, BAAS, 27, 872Junkkarinen, V., Beaver, E. A., Burbidge, E. M., et al. 1997, in ASP Conf. Ser.
128, Mass Ejection from Active Galactic Nuclei, ed. N. Arav, I. Shlosman,& R. J. Weymann (San Francisco, CA: ASP), 220
Knigge, C., Scaringi, S., Goad, M. R., & Cottis, C. E. 2008, MNRAS, 386,1426
Korista, K., Hamann, F., Ferguson, J., & Ferland, G. 1996, ApJ, 461, 641Leighly, K. M., Dietrich, M., & Barber, S. 2011, ApJ, 728, 94Leighly, K. M., Hamann, F., Casebeer, D. A., & Grupe, D. 2009, ApJ, 701, 176
Lodders, K., Palme, H., & Gail, H.-P. 2009, in Landolt-Bornstein—Group VIAstronomy and Astrophysics Numerical Data and Functional Relationshipsin Science and Technology Volume, ed. J. E. Trumper (Berlin: Springer-Verlag), 44
Mathews, W. G., & Ferland, G. J. 1987, ApJ, 323, 456Modigliani, A., Goldoni, P., Royer, F., et al. 2010, Proc. SPIE, 7737, 56Moe, M., Arav, N., Bautista, M. A., & Korista, K. T. 2009, ApJ, 706, 525Ostriker, J. P., Choi, E., Ciotti, L., Novak, G. S., & Proga, D. 2010, ApJ, 722,
642Sargent, W. L. W., Boksenberg, A., & Steidel, C. C. 1988, ApJS, 68, 539Schlegel, D. J., Finkbeiner, D. P., & Davis, M. 1998, ApJ, 500, 525Scott, J. E., Kriss, G. A., Lee, J. C., et al. 2004, ApJS, 152, 1Shields, G. A. 1996, ApJ, 461, L9Telfer, R. C., Kriss, G. A., Zheng, W., Davidsen, A. F., & Green, R. F. 1998, ApJ,
509, 132Turnshek, D. A. 1986, in IAU Symp. 119, Quasars, ed. G. Swarup & V. K.
Kapahi (Cambridge: Cambridge Univ. Press), 317Turnshek, D. A., Kopko, M., Jr., Monier, E., et al. 1996, ApJ, 463, 110Vernet, J., Dekker, H., D’Odorico, S., et al. 2011, A&A, 536, A105
10
Copyright © 2022 FDOKUMEN