
QOS REPRESENTATION, NEGOTIATION AND ASSURANCE ...
183
QOS REPRESENTATION, NEGOTIATION AND ASSURANCE IN CLOUD SERVICES by XIANRONG ZHENG A thesis submitted to the School of Computing In conformity with the requirements for the degree of Doctor of Philosophy Queen’s University Kingston, Ontario, Canada February 2014 Copyright © Xianrong Zheng, 2014
-
Upload
khangminh22 -
Category
Documents
-
view
3 -
download
0
Transcript of QOS REPRESENTATION, NEGOTIATION AND ASSURANCE ...
QOS REPRESENTATION, NEGOTIATION AND ASSURANCE IN
CLOUD SERVICES
by
XIANRONG ZHENG
A thesis submitted to the
School of Computing
In conformity with the requirements for
the degree of Doctor of Philosophy
Queen’s University
Kingston, Ontario, Canada
February 2014
Copyright © Xianrong Zheng, 2014
ii
Abstract
Cloud services are Internet-based IT services. Infrastructure as a Service (IaaS), Platform as a
Service (PaaS), and Software as a Service (SaaS) are three representative examples. As the cloud
market becomes more open and competitive, Quality of Service (QoS) will be more important.
However, cloud providers and cloud consumers have different and sometimes opposite
preferences. If such a conflict occurs, a Service Level Agreement (SLA) cannot be established
without negotiation.
To allow service consumers to express their QoS requirements, and negotiate them with service
providers, we argue for cloud service negotiation. It aims to establish and enforce SLAs for cloud
services. Specifically, we study how to measure, negotiate, and enforce QoS requirements for
cloud services, and so formulate three research problems, i.e., QoS measurement, QoS
negotiation, and QoS assurance. In terms of its scope, the topic covers business side automated
negotiation and technical side resource allocation techniques. As a result, it has a potential impact
on cloud service adoption.
To address QoS measurement, we initiate a quality model named CLOUDQUAL for cloud
services. It is a model with quality dimensions and metrics that targets general cloud services.
CLOUDQUAL contains six quality dimensions, i.e., usability, availability, reliability,
responsiveness, security, and elasticity, of which usability is subjective, whereas the others are
objective.
To address QoS negotiation, we present a mixed negotiation approach for cloud services, which is
based on the “game of chicken”. In particular, if a party is uncertain about the strategy of its
counterpart, it is best to mix concession and tradeoff strategies in negotiation. In fact, the mixed
iii
approach, which exhibits a certain degree of intelligence, can achieve a higher utility than a
concession approach, while incurring fewer failures than a tradeoff approach.
To address QoS assurance, we propose a QoS-driven resource allocation method for cloud
services. It can meet users’ QoS requirements while minimizing resources consumed. Especially,
to honor a QoS specified in a SLA, we develop QoS assurance mechanisms, and determine the
minimum resources that should be allocated. As a result, the method makes both technical and
economic sense for cloud providers.
iv
Co-Authorship
[1] Xianrong Zheng, Patrick Martin, and Kathryn Brohman, “Cloud Service Negotiation — A
QoS Assurance Mechanism,” International Conference on XXX (to be submitted), 2014
[2] Xianrong Zheng, Patrick Martin, and Kathryn Brohman, “Cloud Service Negotiation — A
Research Report,” International Journal of Business Process Integration and Management
(IJBPIM), vol. XX, no. XX (to be published), 2014
[3] Xianrong Zheng, Patrick Martin, and Kathryn Brohman, “Cloud Service Negotiation — A
QoS-driven Resource Allocation Method,” International Journal of Services Computing (IJSC),
vol. XX, no. XX (invited for publication), 2014
[4] Xianrong Zheng, Patrick Martin, and Kathryn Brohman, “Cloud Service Negotiation in IoT
Environment — A Mixed Approach,” IEEE Transactions on Industrial Informatics (TII), vol.
XX, no. XX (accepted for publication), 2013
[5] Xianrong Zheng, Patrick Martin, and Kathryn Brohman, “CLOUDQUAL — A Quality Model
for Cloud Services,” IEEE Transactions on Industrial Informatics (TII), vol. XX, no. XX
(accepted for publication), 2013
[6] Xianrong Zheng, Patrick Martin, and Kathryn Brohman, “Cloud Service Negotiation — A
Research Roadmap,” In Proc. of the 10th IEEE International Conference on Services Computing
(SCC’13), Santa Clara, California, USA, 2013
v
[7] Xianrong Zheng, Patrick Martin, and Kathryn Brohman, “Cloud Service Negotiation —
Concession vs. Tradeoff Approaches,” In Proc. of the 12th IEEE/ACM International Symposium
on Cluster, Cloud and Grid Computing (CCGrid’12), Ottawa, Ontario, Canada, 2012

vi
Acknowledgements
It is said that “a mentor is one who propagates the doctrine, imparts professional knowledge, and
resolves doubts”. I could not agree more. Indeed, I am so fortunate to study under the guidance of
my supervisor Dr. Patrick Martin, who is such a mentor and is not far from perfect. In terms of
professional knowledge, I benefit a lot from his insightful advice and comments on my research.
His knowledge and expertise make an impression on me. Also, when I have some difficulties in
my study, he is always helpful. I am gratitude for his many academic and nonacademic supports.
Last but not the least, I receive a lot of guidance from him in academic ethics. His
professionalism and integrity leave a mark on me.
Next, I want to express my gratitude to my co-supervisor, Dr. Kathryn Brohman, who is a
knowledgeable and caring advisor. I learn a lot from her very helpful advice, and appreciate
greatly the flexibility that she offers me. Her expertise and supports inspire me a lot. Also, I am
indebted to my supervision committee members Dr. David Skillicorn, whose incisive advice
spurs me on, and Dr. Mohammad Zulkernine, whose encouraging advice stimulates me a lot. In
addition, I am grateful to my examination committee members Dr. Peter Boag, Dr. Robin Dawes,
Dr. James Stewart, Dr. Sandy Staples, and Dr. Michael Bauer.
Still, I would like to thank all my instructors, my classmates, and the members of the School of
Computing, especially the Database Systems Laboratory, Queen’s University for their help and
supports. Especially, I would like to thank Dr. Selim Akl for his great help, Wendy Powley for
her many supports, Mingyi Zhang for his fruitful discussions, and Farhana Zulkernine and Khalid
Elgazzar for their sincere help. Special thanks to Dr. Michael Roth of the Department of
Mathematics and Statistics, Queen’s University for his expertise in the clarification and the
defense of an unconventional proof, Dr. Patrick Hung of the Faculty of Business and Information
vii
Technology, University of Ontario Institute of Technology for his expertise in the improvement
and the recognition of our work, and Dr. Lida Xu of the Department of Information Technology
and Decision Sciences, Old Dominion University for his always sincere and considerate help.
I would like to thank Mr. Jiazhou Mei of the China Railway Sixth Group Co., Ltd. for his help
and many supports.
Thanks to my family members for their understanding, supports, and sacrifices.
viii
Statement of Originality
I hereby certify that all of the work described within this thesis is the original work of the author.
Any published (or unpublished) ideas and/or techniques from the work of others are fully
acknowledged in accordance with the standard referencing practices.
Xianrong Zheng
February 2014

ix
Table of Contents
Abstract ............................................................................................................................................ ii
Co-Authorship ................................................................................................................................ iv
Acknowledgements ......................................................................................................................... vi
Statement of Originality ................................................................................................................ viii
List of Tables ................................................................................................................................ xiii
List of Figures ............................................................................................................................... xiv
List of Abbreviations ..................................................................................................................... xv
Chapter 1 Introduction ..................................................................................................................... 1
1.1 Motivations ............................................................................................................................ 5
1.2 Thesis Contributions .............................................................................................................. 7
1.3 Thesis Outline ........................................................................................................................ 9
Chapter 2 Background and Literature Review ............................................................................... 11
2.1 Service Innovation ............................................................................................................... 11
2.1.1 Service Innovation in Business ..................................................................................... 11
2.1.2 Service Innovation in Computer Science ...................................................................... 13
2.1.3 Discussion ..................................................................................................................... 14
2.2 Automated Negotiation ........................................................................................................ 15
2.2.1 Agent-Based Approaches .............................................................................................. 16
2.2.1.1 Heuristic Approaches ............................................................................................. 16
2.2.1.2 Argumentation-Based Approaches ........................................................................ 17
2.2.1.3 Learning Approaches ............................................................................................. 18
2.2.2 Game-Theoretic Approaches ........................................................................................ 18
2.3 Negotiation Strategies .......................................................................................................... 19
2.3.1 Concession Strategies ................................................................................................... 20
2.3.1.1 Time-Dependent Tactics ........................................................................................ 21
2.3.1.2 Resource-Dependent Tactics .................................................................................. 24
2.3.1.3 Counterpart-Dependent Tactics ............................................................................. 25
2.3.1.4 Discussion .............................................................................................................. 26
2.3.2 Tradeoff Strategies ........................................................................................................ 27
2.3.2.1 Altruistic Strategies ................................................................................................ 27
2.3.2.2 Selfish Strategies .................................................................................................... 29
2.3.2.3 Discussion .............................................................................................................. 30
x
2.4 Web Service Negotiation ..................................................................................................... 31
2.4.1 WS-Agreement ............................................................................................................. 32
2.4.2 WS-Negotiation ............................................................................................................ 32
2.4.3 Document-Based Approach .......................................................................................... 33
2.4.4 Semantic Approach ....................................................................................................... 33
2.4.5 COWS ........................................................................................................................... 34
2.5 Cloud Service Negotiation ................................................................................................... 35
2.5.1 QoS Measurement ......................................................................................................... 35
2.5.2 QoS Negotiation ............................................................................................................ 37
2.5.3 QoS Assurance .............................................................................................................. 38
2.6 Summary .............................................................................................................................. 40
Chapter 3 QoS Measurement ......................................................................................................... 42
3.1 Introduction .......................................................................................................................... 43
3.2 Service Quality Models ........................................................................................................ 44
3.2.1 Service Features ............................................................................................................ 44
3.2.2 Quality Model for Traditional Services ........................................................................ 45
3.2.3 Quality Model for Electronic Services .......................................................................... 47
3.3 Cloud Quality Model ........................................................................................................... 48
3.3.1 Functional vs. Nonfunctional Properties ....................................................................... 49
3.3.2 Cloud Quality Dimensions and Metrics ........................................................................ 50
3.3.2.1 Usability (USAB) ................................................................................................... 50
3.3.2.2 Availability (AVAL) .............................................................................................. 51
3.3.2.3 Reliability (REL) ................................................................................................... 51
3.3.2.4 Responsiveness (RESP) ......................................................................................... 52
3.3.2.5 Security (SECY) .................................................................................................... 53
3.3.2.6 Elasticity (ELAS) ................................................................................................... 54
3.3.2.7 Discussion .............................................................................................................. 54
3.4 Empirical Case Studies ........................................................................................................ 55
3.4.1 Case Studies .................................................................................................................. 55
3.4.2 Experimental Setup ....................................................................................................... 56
3.4.3 QoS Evaluation ............................................................................................................. 57
3.4.3.1 USAB Evaluation ................................................................................................... 58
3.4.3.2 AVAL Evaluation .................................................................................................. 59
3.4.3.3 REL Evaluation ...................................................................................................... 60
xi
3.4.3.4 RESP Evaluation .................................................................................................... 63
3.4.3.5 SECY Evaluation ................................................................................................... 70
3.4.3.6 ELAS Evaluation ................................................................................................... 72
3.5 Metrics Validation ............................................................................................................... 75
3.5.1 Validity Criteria ............................................................................................................ 76
3.5.1.1 Correlation ............................................................................................................. 76
3.5.1.2 Consistency ............................................................................................................ 76
3.5.1.3 Discriminative Power ............................................................................................. 77
3.5.2 Metrics Validation ........................................................................................................ 77
3.6 Summary .............................................................................................................................. 81
Chapter 4 QoS Negotiation ............................................................................................................ 83
4.1 Introduction .......................................................................................................................... 84
4.2 Motivating Example ............................................................................................................. 85
4.2.1 Storage Cloud Example ................................................................................................ 85
4.2.2 Utility Functions ........................................................................................................... 89
4.3 Multi-Attribute Bilateral Negotiation .................................................................................. 94
4.3.1 Negotiation Protocol ..................................................................................................... 95
4.3.2 Negotiation Strategies ................................................................................................... 96
4.4 Mixed Negotiation Approach .............................................................................................. 99
4.4.1 Two-Player Negotiation Game ................................................................................... 100
4.4.2 Game-Theoretic Description ....................................................................................... 107
4.4.3 Algorithmic Description ............................................................................................. 109
4.5 Evaluation and Analysis .................................................................................................... 117
4.5.1 Experimental Setup ..................................................................................................... 117
4.5.2 Parameter Setup .......................................................................................................... 119
4.5.3 Monte Carlo Simulations ............................................................................................ 126
4.6 Summary ............................................................................................................................ 132
Chapter 5 QoS Assurance ............................................................................................................ 134
5.1 Introduction ........................................................................................................................ 135
5.2 QoS-Driven Resource Allocation Method ......................................................................... 136
5.2.1 AVAL Assurance Mechanism .................................................................................... 136
5.2.2 REL Assurance Mechanism ........................................................................................ 137
5.2.3 RESP Assurance Mechanism ...................................................................................... 138
5.2.4 SECY Assurance Mechanism ..................................................................................... 139
xii
5.2.5 ELAS Assurance Mechanism ..................................................................................... 141
5.3 Summary ............................................................................................................................ 143
Chapter 6 Conclusions and Future Work ..................................................................................... 144
6.1 Thesis Work ....................................................................................................................... 145
6.2 Thesis Contributions .......................................................................................................... 146
6.3 Thesis Limitations .............................................................................................................. 146
6.4 Future Work ....................................................................................................................... 147
6.4.1 Service Negotiation ..................................................................................................... 148
6.4.2 Service Recommendation ........................................................................................... 148
Bibliography ................................................................................................................................ 149
Appendix A Metrics Validation ................................................................................................... 158
A.1 AVAL Validation .............................................................................................................. 158
A.2 REL Validation ................................................................................................................. 160
A.3 SECY Validation............................................................................................................... 162
A.4 ELAS Validation ............................................................................................................... 164
xiii
List of Tables
Table 3.1 Comparisons of Three Quality Models .......................................................................... 54
Table 3.2 Usability Comparisons of Three Storage Clouds ........................................................... 59
Table 3.3 Time Spent and Responsiveness Reached of Three Storage Clouds (10 MB) .............. 67
Table 3.4 Time Spent and Responsiveness Reached of Three Storage Clouds (1 MB) ................ 67
Table 3.5 Time Spent and Responsiveness Reached of Three Storage Clouds (100 MB) ............ 67
Table 3.6 Storage Requested and Reached in Amazon S3 ............................................................ 72
Table 3.7 Storage Requested and Reached in Azure Blob ............................................................. 73
Table 3.8 Storage Requested and Reached in Aliyun OSS ............................................................ 73
Table 3.9 Time Spent and Responsiveness Reached of Three Storage Clouds (10 MB) .............. 78
Table 3.10 The Working Table to Determine Spearman’s Rank Correlation Coefficient ............. 79
Table 3.11 The Contingency Table to Determine the Chi-Square Statistic ................................... 80
Table 4.1 QoS Conflicts between SP and SC ................................................................................ 86
Table 4.2 The “Game of Chicken”............................................................................................... 101
Table 4.3 Two-Player Negotiation Game .................................................................................... 101
Table 4.4 The Impact of Rates λ1 and λ2 ...................................................................................... 120
Table 4.5 The Impact of Tolerance τ ........................................................................................... 121
Table 4.6 The Impact of p-mix .................................................................................................... 122
Table 4.7 The Impact of SP’s Preferred Values ........................................................................... 124
Table 4.8 The Impact of SC’s Preferred Values .......................................................................... 125
Table 4.9 The Impact of Variance δ ............................................................................................. 127
Table 4.10 Negotiation Results (CC, CT, and CM) ..................................................................... 128
Table 4.11 Negotiation Results (TC, TT, and TM) ..................................................................... 129
Table 4.12 Negotiation Results (MC, MT, and MM) .................................................................. 131
Table A.1 The Working Table to Determine AVAL’s Rank Correlation Coefficient ................. 158
Table A.2 The Contingency Table to Determine AVAL’s Chi-Square Statistic ......................... 158
Table A.3 The Working Table to Determine REL’s Rank Correlation Coefficient .................... 160
Table A.4 The Contingency Table to Determine REL’s Chi-Square Statistic............................. 160
Table A.5 The Working Table to Determine SECY’s Rank Correlation Coefficient .................. 162
Table A.6 The Contingency Table to Determine SECY’s Chi-Square Statistic .......................... 162
Table A.7 The Working Table to Determine ELAS’s Rank Correlation Coefficient .................. 164
Table A.8 The Contingency Table to Determine ELAS’s Chi-Square Statistic .......................... 164
xiv
List of Figures
Figure 1.1 Cloud Service Negotiation ............................................................................................. 5
Figure 2.1 The Negotiation Process ............................................................................................... 22
Figure 3.1 QoS Measurement ........................................................................................................ 42
Figure 3.2 End-to-End Reliability Comparisons of Three Storage Clouds.................................... 62
Figure 3.3 End-to-End Responsiveness Comparisons of CRUD Operations ................................ 66
Figure 3.4 End-to-End Responsiveness Comparisons of Upload Operations ................................ 68
Figure 3.5 End-to-End Responsiveness Comparisons of Download Operations ........................... 69
Figure 3.6 End-to-End Responsiveness Comparisons of Delete Operations ................................. 70
Figure 3.7 Cumulative Distribution Function FT (t) ...................................................................... 71
Figure 3.8 Actually Reachable Elasticity Comparisons of Three Storage Clouds ......................... 74
Figure 4.1 QoS Negotiation ........................................................................................................... 83
Figure 4.2 QoS Conflict over Availability ..................................................................................... 87
Figure 4.3 Utility Function u1(x) with a1=1 ................................................................................... 90
Figure 4.4 Utility Function u2(x) with a2=1 ................................................................................... 91
Figure 4.5 Alternating-offers Protocol ........................................................................................... 96
Figure 4.6 Concession Negotiation Approach ............................................................................... 98
Figure 4.7 Tradeoff Negotiation Approach .................................................................................... 99
Figure 4.8 Player 2’s Best Response to σ1 ................................................................................... 106
Figure 4.9 Player 1’s Best Response to σ2 ................................................................................... 106
Figure 4.10 Nash Equilibrium Point (p1*, p2*) ............................................................................ 107
Figure 4.11 Mixed Negotiation Approach ................................................................................... 108
Figure 4.12 Agent i’s Mixed Behavior ........................................................................................ 116
Figure 4.13 The Negotiation Interface ......................................................................................... 119
Figure 5.1 QoS Assurance ........................................................................................................... 134
xv
List of Abbreviations
ABLE Agent Building and Learning Environment
Aliyun OSS Aliyun Open Storage Service
Amazon EC2 Amazon Elastic Compute Cloud
Amazon S3 Amazon Simple Storage Service
AP Accept Proposal
API Application Programming Interface
App Engine Google App Engine
ASE Azure Storage Explorer
AVAL Availability
AWS Amazon Web Services
Azure Blob Microsoft Windows Azure Blob Storage
BR Best Response
CA Coordinator Agent
CFP Call for Proposal
COWS Calculus for Orchestration of Web Services
CRUD Create, Read, Update, and Delete
ELAS Elasticity
EU FP7 European Union Seventh Framework Programme
FIPA Foundation for Intelligent Physical Agents
G-D logic Goods-Dominant logic
GUI Graphical User Interface
IaaS Infrastructure as a Service
IPsec Internet Protocol Security
MTBF Mean Time Between Failures
xvi
MTTF Mean Time To Failure
NA Negotiator Agent
NetSuite ERP NetSuite Enterprise Resource Planning
PaaS Platform as a Service
PP Propose Proposal
QoS Quality of Service
REL Reliability
RESP Responsiveness
SaaS Software as a Service
Salesforce CRM Salesforce Customer Relationship Management
SC Storage Consumer
SDK Software Developer’s Kit
S-D logic Service-Dominant logic
SECY Security
SLA Service Level Agreement
SMI Service Measurement Index
SNOBASE Semantic Network Ontology Base
SOA Service-Oriented Architecture
SOI Service-Oriented Infrastructure
SP Storage Provider
SQL Azure Microsoft SQL Azure
SSME Service Science, Management, and Engineering
USAB Usability
VM Virtual Machine
Windows Azure Microsoft Windows Azure Platform
WS-Agreement Web Services Agreement Specification
xvii
WS-Negotiation Web Services Negotiation Standard
WS-Policy Web Services Policy Framework
WUI Web User Interface
XaaS X as a Service
XP Reject Proposal

1
Chapter 1
Introduction
Cloud ― a popular yet vague term in the ICT industry ― is used informally and inaccurately to
refer to the Internet. Cloud computing refers to a large pool of virtualized resources that can be
dynamically reconfigured to provide elastic services over the Internet [12, 107]. In particular,
service consumers are allowed to procure and release resources on demand, and pay only for what
they use. As a result, service consumers do not need to worry about “overprovisioning for a
service whose popularity does not meet their predictions, thus wasting costly resources, or
underprovisioning for one that becomes wildly popular, thus missing potential customers and
revenue” [12]. For those reasons and beyond, cloud computing gains strategic attention and
investments from academia, industries, and governments [125].
Cloud services are Internet-based IT services. Infrastructure as a Service (IaaS), Platform as a
Service (PaaS), and Software as a Service (SaaS) are three representative examples [12, 107].
Cloud providers own the resources, and perform the development and maintenance work. Cloud
consumers can access those resources, but have no ownership over them. Compared with other
models, cloud services are easier to access and use, cost-efficient, and environmentally
sustainable. As they eliminate large upfront expenses in hardware and expensive labor costs for
maintenance, cloud services are beneficial to small- and medium-sized enterprises. Moreover,
large-sized enterprises with computationally intensive tasks can obtain results quickly, since their
applications can scale up in minutes, not hours or days.
IaaS represents the lowest layer in the cloud stack, where raw compute, storage, and network
resources are provided as services to end users [30, 107]. Amazon Elastic Compute Cloud
CHAPTER 1 INTRODUCTION
2
(Amazon EC2) [5] and Amazon Simple Storage Service (Amazon S3) [6] are two examples. PaaS
represents the next layer up in the cloud stack, where system software and/ or development
environments on top of the bare-bones infrastructure are provided as services to end users [30,
107]. Microsoft Windows Azure Platform (Windows Azure) [65] and Google App Engine (App
Engine) [40] are two examples. SaaS represents the highest layer in the cloud stack, where
application software is provided as services to end users [30, 107]. NetSuite Enterprise Resource
Planning (NetSuite ERP) [75] and Salesforce Customer Relationship Management (Salesforce
CRM) [92] are two examples.
Compared with other models, cloud services have three advantages. First of all, cloud services are
easier to access and use than grid services. Grid requires a specific middleware running on both
the client’s and the provider’s sides, so access to grid resources is quite complex [114]. In
contrast, cloud is built upon standard web protocols, which are easier to use. In fact, grid is
limited to scientific applications. Ease of use is not a big issue for grid in that its users are more
knowledgeable and skillful. However, as cloud targets general customers, ease of use is more
important for cloud services.
Second, cloud services are cost-efficient. Cloud requires little or no upfront investment, so
developers with novel ideas of new Internet services do not need large capital outlays to deploy
their services [12]. In contrast, grid requires large upfront investment, which may be one of the
reasons why it has not yet achieved business success [114]. The pay-per-use model also enables
customers to utilize resources more efficiently. It allows customers to add resources when their
businesses are on the increase, and reduce them when their businesses are on the decrease. In this
way, resources procured by customers are utilized to the fullest extent.
CHAPTER 1 INTRODUCTION
3
Third, cloud services are environmentally sustainable. Distributed resources and control
mechanisms characterize grid [114]. To economize on scale and scope, however, cloud moves
back towards centralization of servers and data processing facilities in data centers. As a result,
power consumption and electronic waste are reduced [122].
There are three pillars underpinning cloud services. The first one is virtualization. It aims to
achieve optimum resources utilization, and serves as the technical pillar. With virtualization, a
virtual machine can be created for each user, such that a computer can be shared among multiple
users. The second pillar is economies of scale. It aims to drive prices down for cloud consumers
and profits up for cloud providers, and serves as the economic pillar. The higher the number of
consumers, the higher the utilization of cloud resources, and the lower the expenditure per
consumer. The third pillar is elastic service. It aims to meet consumers’ changing resources
requirements, and serves as the business pillar. Cloud consumers are allowed to procure and
release resources on demand, and can pay only for what they use.
The transition of computer hardware, software, and applications as products towards services
reflects an economic shift from a focus on products to a focus on services, which play a
predominant role in developed economies now [20, 109]. There are two distinct logics that can be
used to view services: Goods-Dominant (G-D) logic and Service-Dominant (S-D) logic [109]. G-
D logic “views goods as the primary focus of economic exchange, and services as either a
restricted type of (intangible) goods or an add-on that enhances the value of a good”. In contrast,
S-D logic “considers service in its own right, without reference to goods, and regards service as
the primary focus of exchange activity”. As a result, service is defined as “the application of
competences (skills and knowledge) for the benefit of another party (or for oneself)”, and service
system “a dynamic configuration of resources that co-creates value through interaction with its
stakeholders” [1]. In this sense, cloud services express S-D logic.
CHAPTER 1 INTRODUCTION
4
Cloud services can be described with their functional and nonfunctional properties. Functional
properties detail what is offered, whereas nonfunctional properties detail how well a service is
performed. For instance, the storage access offered by Amazon S3 is its functional properties,
whereas reliability is one of its nonfunctional properties. As the cloud market becomes more open
and competitive, Quality of Service (QoS) will be more important. However, cloud providers and
cloud consumers have different and sometimes opposite preferences. For example, a cloud
consumer usually prefers a high reliability, whereas a cloud provider may only guarantee a less
than maximum reliability in order to reduce costs and maximize profits. If such a conflict occurs,
a Service Level Agreement (SLA) cannot be reached, without a dispute resolution mechanism.
Fortunately, conflicts over QoS can be resolved via negotiation. It is a decision-making process,
where a group of agents attempt to reach a mutually acceptable agreement. In fact, negotiation is
necessary whenever we cannot achieve our objectives without the cooperation of others [103]. It
is widely used to establish business contracts, resolve territorial disputes, handle nuclear
disarmament, etc. If multiple issues are under consideration, complex preferences are involved,
and time is critical, negotiation becomes a process which is beyond manual labor. Automated
negotiation occurs, when software agents negotiate on behalf of their human counterparts. It has
been studied in electronic commerce and artificial intelligence for many years, and is considered
as the most flexible approach to procure products and services [58].
To allow service consumers to express their QoS requirements, and negotiate them with service
providers, we argue for cloud service negotiation. It aims to establish and enforce SLAs for cloud
services. In terms of its scope, the topic covers business side automated negotiation and technical
side resource allocation techniques. As a result, it has a potential impact on cloud service
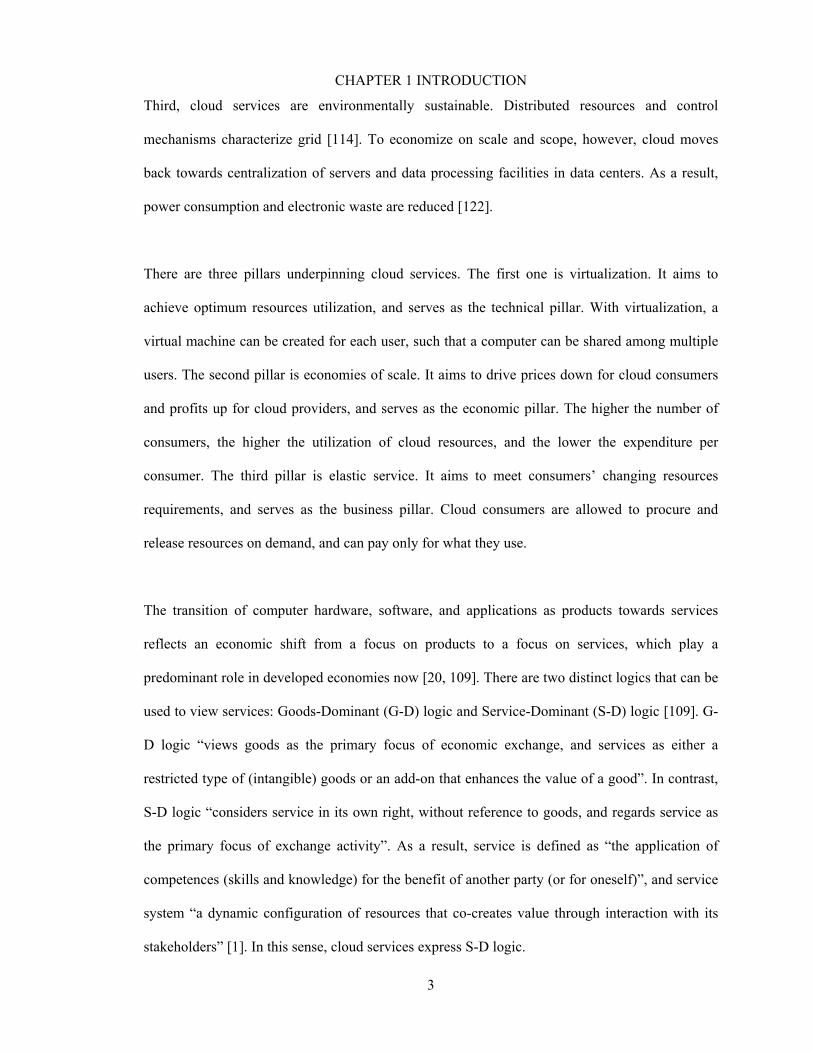
adoption. Three research problems that we want to address are: (1) QoS measurement for cloud
CHAPTER 1 INTRODUCTION
5
Figure 1.1 Cloud Service Negotiation
services, (2) QoS negotiation for cloud services, and (3) QoS assurance for cloud services. The
three problems together draw a research roadmap of cloud service negotiation, as illustrated in
Figure 1.1.
The rest of this chapter describes the motivations of our research, summarizes the contributions of
our work, and outlines the structure of the thesis.
1.1 Motivations
First of all, QoS measurement aims to define a standard method, i.e., a quality model, to gauge
QoS, such that a mutual understanding can be established among cloud stakeholders. A quality
model specifies quality dimensions to detail QoS, and quality metrics to quantify it. It thus helps
to create a common knowledge of QoS between two parties, that is, what it means and how to
measure it. As cloud consumers care about QoS, cloud providers who follow a quality model
have more competitive advantages than those who make little or no commitments. In fact,
without a quality model, cloud consumers cannot confirm whether services are actually of high
quality claimed by providers. Likewise, without a quality model, cloud providers cannot assure
themselves that their truly superior services are not repudiated.
CHAPTER 1 INTRODUCTION
6
As an example, for a storage cloud, an important quality dimension is reliability. If a cloud
provider claims that its storage service is no less than 90% reliable without telling how it is
calculated, then it is hard to earn customers’ confidence in the number. Furthermore, if another
cloud provider adopts a different metric to calculate its reliability, it is unable to compare them to
select the most reliable one. As a result, a quality model is imperative for cloud services. This is
the first research problem that needs to be addressed for cloud service negotiation.
Second, QoS negotiation aims to develop a negotiation technique to reach a SLA, such that a
certain level of assurance is promised to cloud consumers. In fact, cloud consumers differ with
cloud providers in their preferences over QoS. For instance, cloud consumers usually prefer high
reliability ― an important quality dimension for cloud services. However, for cloud providers,
high reliability means more investments in hardware and/ or software resources, and thus
increased costs. To maximize profits and avoid overcommitments, cloud providers may only
guarantee a less than maximum level of reliability. When conflicts over QoS occur, without
negotiation, it is impossible to reach an agreement between two parties.
Take, again, a storage cloud as an example. Assume that a cloud provider wants to offer its
storage service with reliability no less than 70% at a certain price, and can offer the service with
reliability no less than 97% at a higher price. Assume, also, that a cloud consumer, who is price-
insensitive, needs a storage service whose reliability should be no less than 90%. Then, it is
impossible for them to reach an agreement without negotiation. Furthermore, if multiple issues
are under consideration and time is critical, negotiation becomes a process which is beyond
manual labor. As a result, automated negotiation becomes essential for cloud services. This is the
second research problem that needs to be addressed for cloud service negotiation.
CHAPTER 1 INTRODUCTION
7
Third, QoS assurance aims to develop a resource allocation method to honor the QoS promised,
such that service level commitments are fulfilled while no extra resources are spent. A SLA
defines quantitative service level commitments between cloud providers and cloud consumers
[29]. Once it is reached, cloud providers are required to enforce it. In other words, cloud
providers need to honor their QoS with certain mechanisms. If the QoS delivered goes beyond
expectations, cloud providers spend more resources than necessary. If the QoS delivered falls
short of expectations, cloud providers may incur some penalties. As a result, an important issue
here is how to allocate resources such that QoS requirements are met while no extra resources are
spent.
Take, once again, a storage cloud as an example. Assume that a single storage device is 70%
reliable, and that an agreed-upon reliability is no less than 90%. The problem now becomes how
to allocate storage resources to meet the 90% reliability, while minimizing the amount of
resources used. In fact, if a cloud provider replicates its data two times, it can guarantee a
reliability of 1 − (1 − 70%) = 91%, which is sufficient to meet the 90% reliability. If it
replicates its data three or more times, it will guarantee a reliability beyond expectations (more
than 97%), but additional storage resources will be consumed. As the cloud provider wants to
reduce costs and maximize profits, it does not make sense to do so. Therefore, resource allocation
becomes crucial for cloud services. This is the third research problem that needs to be addressed
for cloud service negotiation.
1.2 Thesis Contributions
This thesis outlines a research roadmap, reviews the state of the art, and reports our work on
cloud service negotiation. Its main contributions are as follows:
CHAPTER 1 INTRODUCTION
8
1) We initiate a quality model for cloud services, called CLOUDQUAL, which specifies six
quality dimensions and five quality metrics. It is a model with quality dimensions and
metrics that targets general cloud services. CLOUDQUAL comprises six quality
dimensions, i.e., usability, availability, reliability, responsiveness, security, and elasticity.
A formal specification is given for each quality dimension. Also, a quality metric is
defined for quality dimensions except usability. In fact, since it is hard to give usability a
quantitative description, it remains subjective.
2) We present a mixed negotiation approach for cloud services, which is based on the “game
of chicken” and can balance utility and success rate. In particular, if a party has no
knowledge of which strategy that its counterpart will play, it is best to mix concession
and tradeoff strategies in negotiation. In fact, it is a mixed strategy Nash equilibrium of a
negotiation game with two pure strategies. Indeed, the mixed approach, which exhibits a
certain degree of intelligence, can achieve a higher utility than a concession approach,
while incurring fewer failures than a tradeoff approach.
3) We propose a QoS-driven resource allocation method for cloud services, which can meet
users’ QoS requirements while minimizing resources consumed. To honor the QoS
specified in a SLA, we develop QoS assurance mechanisms, and determine the minimum
resources that should be allocated. In particular, the method allows cloud providers to
maximize their profits, without sacrificing users’ satisfaction, and so makes both
technical and economic sense for cloud providers.
CHAPTER 1 INTRODUCTION
9
1.3 Thesis Outline
The rest of this thesis is organized as follows. Chapter 2 provides the background knowledge, and
reviews related work on cloud service negotiation. Chapter 3 deals with QoS measurement,
namely, how to measure QoS for cloud services. It presents a quality model named
CLOUDQUAL for cloud services. CLOUDQUAL contains six quality dimensions, i.e., usability,
availability, reliability, responsiveness, security, and elasticity, of which usability is subjective
whereas the others are objective. For each quality dimension, we give a formal description. Also,
a quality metric is specified for each objective quality dimension. It is demonstrated that
CLOUDQUAL can evaluate and differentiate service quality.
Chapter 4 deals with QoS negotiation, namely, how to negotiate QoS for cloud services. It
presents a mixed negotiation approach for cloud services, which is based on the “game of
chicken” and can balance utility and success rate. In other words, if a party’s counterpart uses a
concession approach, it is best to adopt a tradeoff one; if a party’s counterpart uses a tradeoff
approach, it is best to adopt a concession one; if a party is uncertain about the strategy of its
counterpart, it is best to mix the two strategies. In fact, those are the three Nash equilibria of a
negotiation game with two pure strategies. It is shown that the mixed approach, which plays
concession with a certain probability and tradeoff with another probability, can achieve a higher
utility than the concession approach, while incurring fewer failures than the tradeoff approach.
Chapter 5 deals with QoS assurance, namely, how to enforce QoS for cloud services. It presents a
QoS-driven resource allocation method, which allows cloud providers to maximize their profits,
without sacrificing users’ satisfaction. Given a QoS specified in a SLA, we develop QoS
assurance mechanisms to honor it. First, we determine the resources that can be used to support it.
CHAPTER 1 INTRODUCTION
10
Second, we determine the techniques that can be adopted to support it. Third, we determine the
minimum resources that should be allocated to support it. It is demonstrated that the method can
meet users’ QoS requirements while minimizing resources consumed. Chapter 6 concludes this
thesis, mentions potential limitations, and discusses some future work.
11
Chapter 2
Background and Literature Review
In recognizing the importance of the service economy, which plays a critical role in the global
economy, service research has received attention from both academia and industry. This chapter
provides some background knowledge to better understand our research topic — cloud service
negotiation. Section 2.1 introduces service innovation, which provides the economic background
for cloud services. Section 2.2 introduces automated negotiation, which provides the technical
background for cloud service negotiation. Section 2.3 describes two negotiation strategies —
concession and tradeoff — on which our mixed negotiation approach is based. Sections 2.4 and
2.5 review related work on web service negotiation and cloud service negotiation, respectively.
2.1 Service Innovation
This section provides socio-economic and socio-technical background for the emergence and
development of service innovation. Two questions are answered here: (1) What are the driving
forces of service innovation? (2) What role can computer science play in service innovation? In
response to the two questions, we first examine the economic impetus underlying service
innovation, and then scrutinize the technical momentum underpinning service innovation.
2.1.1 Service Innovation in Business
Over the past three decades, the service sector has dominated advanced economies [16, 33, 99]. It
accounts for more than 70 percent of Gross Domestic Product (GDP) and approximately the same
percentage of labor force in many developed countries [101]. For instance, service industries
CHAPTER 2 BACKGROUND AND LITERATURE REVIEW
12
represent 71 percent of GDP and 76 percent of employment in Canada [115]. Even in emerging
countries like China, the service sector is also rapidly growing [23, 74]. In recognizing the
importance of the service economy, especially knowledge-based services, service research has
received attention from both academia and industry [23, 26, 91, 93].
A new mindset, currently, is changing the way companies do business — to succeed in today’s
marketplace, every business must become a service business, and firms must shift from Goods-
Dominant (G-D) logic to Service-Dominant (S-D) logic [91, 109]. The two logics differ in
significant ways. G-D logic views goods as the primary focus of economic exchange and services
as “special forms of intangible goods”, whereas S-D logic regards service as “a process of the co-
creation of reciprocal value” and service as the primary focus of exchange activity [109].
The distinction between the two logics lies in the conceptualization of services [109]. In G-D
logic, services represent somewhat inferior goods, as they cannot be standardized and
inventoried. By contrast, in S-D logic, service is defined as “the application of competences for
the benefit of another party”. G-D logic views services as units of output, whereas S-D logic
views service as a process – “doing something for another party, sometimes with the aid of
goods”. In S-D logic, “it is the knowledge and skills (competences) of the providers that represent
the essential source of value creation, not goods, which are only sometimes used to convey
them”. Therefore, goods are still important in S-D logic, but service is superordinate.
G-D logic leads business toward standardization, and its success is defined as producing the same
good at a lower cost [91]. In contrast, S-D logic demands customization, and its success depends
on revenue expansion through improved service rather than just productivity and cost reduction.
In short, in the new mindset, core competences are not physical assets, but intangible processes,
which represents a fundamental shift in the logic of exchange [60, 108]. As the focus in business
CHAPTER 2 BACKGROUND AND LITERATURE REVIEW
13
disciplines is shifted from G-D logic to S-D logic, it will have a great impact on both business
services and IT services.
2.1.2 Service Innovation in Computer Science
It is argued that computer science plays a central role in service innovation, by “facilitating the
communication, storage, and processing of information” [91]. It allows companies to improve
profits by “providing high quality, personalized service more easily and affordably than ever
before”. For instance, Amazon’s online recommendation systems personalize the online store for
each customer, showing programming books to a software engineer and baby toys to a new
mother [57]. In this way, not only the cost of service is lowered, but also new avenues that
enhance revenue through better service are created.
The FedEx online package tracking system is another example [26]. By utilizing an online
tracking system, FedEx can respond to customers’ needs very rapidly without any human
intervention, and customers after providing some information can get the latest, accurate, and
authoritative information as well. As a result, FedEx saves money, as it does not need to update
and notify customers when packages arrive, whereas customers are much more satisfied, as they
can obtain the status of their packages at any time.
Services computing and cloud computing further exemplify service innovation in computer
science. Services computing attempts to bridge the gap between business services and IT services
[124]. Web services—autonomous, platform-independent entities that can be accessed over the
Internet — serve as one of its core technology suites. Cloud computing advocates XaaS (X as a
Service) services, where X can be hardware, software or applications [107]. To some extent,
cloud computing embodies the philosophy of services computing. It has “the potential to
CHAPTER 2 BACKGROUND AND LITERATURE REVIEW
14
transform a large part of the IT industry, making software even more attractive as a service and
shaping the way IT hardware is designed and purchased” [12]. Especially, “developers with
innovative ideas for new Internet services no longer require the large capital outlays in hardware
to deploy their service or the human expense to operate it”. Moreover, “they need not be
concerned about overprovisioning for a service whose popularity does not meet their predictions,
thus wasting costly resources, or underprovisioning for one that becomes wildly popular, thus
missing potential customers and revenue”.
2.1.3 Discussion
In short, service innovation is intended to make the overall service experience more productive
and of higher quality. Efficient, effective, and sustainable service systems thus become critical,
which are value-co-creation networks of people, technology, and organizations connected
internally and externally by value propositions and shared information [42, 62]. Families, firms,
and nations all are instances of service systems. Early in 1980s, Shostack argued that “even
though they are intangible, services can be subjected to the same rigorous analysis as other
management operations” [94].
Because of the complexity of modelling people, their knowledge, and their activities, formal
representation of service systems remains hard [62]. Moreover, a theory of service systems has
not been developed as yet [99]. Just as the industrial and information revolutions had historic
impacts on human society in the 1800s and 1900s, respectively, the service revolution may
initiate another great socio-economic change, notwithstanding the above difficulties [26, 87].
CHAPTER 2 BACKGROUND AND LITERATURE REVIEW
15
In response to service innovation, IBM recently initiated Service Science, Management, and
Engineering (SSME), or Service Science for short. It has been defined as the application of
scientific, management, and engineering disciplines to tasks that one organization performs
beneficially for another [101]. It is also a proposed academic discipline that complements, but not
replaces, many disciplines that contribute to the knowledge of service. Web services and cloud
services serve as two examples of technical innovation under the umbrella of service innovation.
The next section gives an introduction to automated negotiation, where two negotiation
approaches — agent-based and game-theoretic — are discussed.
2.2 Automated Negotiation
In terms of psychology, negotiation is an interpersonal decision-making process necessary
whenever people cannot achieve their objectives without the cooperation of others [103]. It is a
common social phenomenon that surrounds our everyday life. It can be “simple and ordinary, as
in haggling over a price in the market or deciding on a meeting time”, or it can be “complex and
extraordinary, perhaps involving international disputes and nuclear disarmament issues that affect
the well-being of millions” [56].
Actually, research on negotiation has been influenced by multiple disciplines, including
mathematics, management, psychology, economics, and political science [103]. Two approaches
are adopted in studying negotiation, i.e., the normative approach and the descriptive approach.
The descriptive approach derives from social psychology and organizational behavior, whereas
the normative approach arises from game theory, economics, and mathematics. This thesis adopts
the normative approach, where negotiation is represented as a game.
CHAPTER 2 BACKGROUND AND LITERATURE REVIEW
16
Automated negotiation happens when the negotiation function is performed by computers. It has
been studied mostly in electronic commerce and multi-agent systems [46]. In this thesis, we deal
with automated negotiation among parties with conflicting preferences over some alternatives.
Below, we introduce agent-based and game-theoretic approaches to automated negotiation.
2.2.1 Agent-Based Approaches
“An agent is anything that can be viewed as perceiving its environment through sensors and
acting upon that environment through actuators” [90]. It is assumed to be rational and
autonomous, and is utilized to engineer complex, distributed systems [46]. In fact, agents have
been employed to facilitate negotiation for years [18]. They are expected to alleviate some of the
efforts required of humans during negotiations, assist individuals who are less qualified for
negotiation, and in some situations, replace human negotiators altogether [56]. Three types of
agent-based approaches to automated negotiation, i.e., heuristic, argument-based, and learning-
based, are discussed below.
2.2.1.1 Heuristic Approaches
To reduce the cost of computation, a heuristic approach is used to search a negotiation space in a
non-exhaustive way to produce good, rather than optimal solutions [46]. A possible agreement is
represented by a potential contract having a value for each issue, which is rated by an agent
according to its preference structure. After that, proposals and counter proposals are offered over
a point, i.e., a contract, in the negotiation space, and search terminates when a mutually
acceptable point has been agreed upon or the deadline has been reached.
CHAPTER 2 BACKGROUND AND LITERATURE REVIEW
17
Two negotiation mechanisms, i.e., responsive and deliberative, have been employed. Responsive
mechanisms are based on a linear combination of some functions called tactics, which manipulate
the utility of a contract. Deliberative mechanisms further include tradeoff and issue manipulation
mechanisms. A tradeoff mechanism attempts to make a proposal more attractive to an opponent
by providing a contract that is close to its last offer; whereas the issue manipulation mechanism
increases the likelihood of an agreement being accepted by adding some issues into, or removing
some issues from a negotiation object (i.e., a set of issues agents haggle over), which, in effect,
alters the structure of the negotiation object, and helps to escape the local minima of a negotiation
space.
2.2.1.2 Argumentation-Based Approaches
To make a deal possible, an agent sometimes uses arguments to justify its negotiation stance, or
persuade an opponent to change its negotiation stance [46]. Arguments allow additional
information to be exchanged over proposals, and thus have the potential to increase the likelihood
and speed of reaching an agreement. Threat, reward, and appeal are three common types of
arguments. A threat implies that something negative will happen, if an agent rejects a proposal; a
reward means that something positive will occur, if an agent accepts a proposal; an appeal means
that an agent should prefer one proposal over another for some reason.
Indeed, arguments provide some guidance for agents in exploring a negotiation space [46].
Specifically, when a proposal is rejected, an argument can be attached by one agent to explain
why it is unacceptable, which enables the other agent to identify an entire area that is not worth
further exploration. Likewise, an argument can be enclosed with a proposal to tell the other agent
why it should accept the proposal, which may change its acceptance space by altering its
preference structure or modify the negotiation space itself by adding or removing some
CHAPTER 2 BACKGROUND AND LITERATURE REVIEW
18
negotiation issues. In fact, a logic-based mechanism that allows arguments to fit into a general
negotiation process has been developed [46]. Though arguments add overhead to a negotiation
process, they provide agents with the ability to be persuasive.
2.2.1.3 Learning Approaches
An agent that can improve its negotiation competence through learning from its interactions with
other agents is highly desirable in automated negotiation [123]. In fact, a sequential decision
making paradigm is adopted to model learning in negotiation, where a sequence of decision
making points are dependent on each other, and agents update their knowledge based on the
received feedback, so that they can make a more informed decision at the next stage. It can work
in an open world — agents do not need to have complete information of the environment at the
beginning of negotiation. Whenever new information comes in, an agent can learn the new
knowledge by itself, and can make use of the newly acquired knowledge at the next decision
making point. Bazaar, a sequential decision model that is able to learn, explicitly models beliefs
about the negotiation environment under a probabilistic framework, using the Bayesian learning
mechanism [123].
2.2.2 Game-Theoretic Approaches
Game theory studies interactions that occur between selfish agents. It is relevant to automated
negotiation, since participants in a negotiation can be reasonably assumed to be self-interested
[46]. To find the optimal negotiation strategies and the corresponding equilibria, agents must
reason strategically [46, 51]. Given a negotiation scenario, game theory can be applied to two
critical aspects [46]. On the one hand, it can be utilized to design an appropriate negotiation
CHAPTER 2 BACKGROUND AND LITERATURE REVIEW
19
protocol, which governs the interactions among negotiation agents. On the other hand, it can be
employed to contrive negotiation strategies, which agents can adopt to maximize their payoffs.
Mechanism design, a branch of game theory, can be employed to design negotiation protocols
with certain desirable properties [10, 46, 77]. As an example, one such desired property is Pareto-
optimality, where an outcome cannot be improved for one agent without making the other agent
worse off. Informally speaking, the goal of mechanism design is to devise rules that “lead to good
results even in settings where agents are strategic”, that is, an agent may lie about its preferences,
if this is in its best interest [27]. The next section gives a general description of two negotiation
strategies — concession and tradeoff — where basic negotiation concepts are introduced.
2.3 Negotiation Strategies
Basic concepts in automated negotiation include negotiation agent, negotiation object, negotiation
protocol, and negotiation strategy [35, 46, 58]. The relative importance of each concept varies
according to the negotiation context, that is, in some cases, negotiation protocol is the dominant
concern, whereas in other cases negotiation strategy becomes decisive.
1) Negotiation Agent refers to the participants involved in a negotiation, which includes
service providers, service consumers, and, in some situations, a mediator or a third party
in the context of web services and cloud services.
2) Negotiation Object is a set of issues over which an agreement must be reached between
negotiation agents [46]. Issues (or attributes), which are assumed to be independent in
this thesis, refer to nonfunctional properties of web services and cloud services. In a
simple case, it could be a single issue like price; whereas in a complex case, it may cover
hundreds of issues such as price, service quality, penalties, and constraints.
CHAPTER 2 BACKGROUND AND LITERATURE REVIEW
20
3) Negotiation Protocol specifies the “rules of encounter” between negotiation agents [58].
It defines the permissible types of participants, the negotiation states, the events that
cause negotiation states to change, and the valid actions of participants in a particular
state.
4) Negotiation Strategy is the decision-making technique that negotiation agents employ to
achieve their objectives, under a given negotiation protocol.
Technically, negotiation can be considered as a distributed search through a negotiation space of
potential agreements [46]. The negotiation space is determined by the structure of a negotiation
object, where each attribute, i.e., an issue, represents one dimension. When a new attribute is
added to (or an old one removed from) the negotiation object during a negotiation process, a
dimension is added to (or removed from) it, and the negotiation space contracts (or expands),
accordingly. Likewise, when the value of an attribute within a proposal is altered, it moves from
one point in the negotiation space to another.
Concession and tradeoff negotiation strategies are discussed below, with web service negotiation
serving as the application domain. However, the ideas discussed have general applications,
including cloud service negotiation.
2.3.1 Concession Strategies
The main idea of concession strategies is that, in preparing a counter proposal, the total utility of
a reference proposal is reduced for one party, and, accordingly, the values of some of its attributes
are adjusted to favor the other party. Indeed, to stimulate the other party to accept the counter
proposal, a certain amount of utility is deducted from the reference proposal, when one party
makes a concession. It should be mentioned that, either a proposal preferred by one party or one
CHAPTER 2 BACKGROUND AND LITERATURE REVIEW
21
received from the other party can be set as the reference proposal, but the choice matters, as it
may affect the utility the first party can gain.
Concession strategies have been used to acquire web services [119, 120, 129]. When something
unfavorable happens, for instance, the deadline approaches, concession strategies can be applied.
Two concession scenarios are discussed here. In the first scenario, Zulkernine et al. (2008)
propose a policy-based approach to acquire services, where time-dependent tactics are employed.
In the second scenario, Yao and Ma (2008) present a fuzzy set based approach to acquire
services, where time-, resource-, and counterpart-dependent tactics are employed. Time-,
resource-, and counterpart-dependent tactics are examined below.
2.3.1.1 Time-Dependent Tactics
Time-dependent tactics are employed by Zulkernine et al. (2008) to acquire a service. A subset of
the Foundation for Intelligent Physical Agents (FIPA) protocol is adopted as the negotiation
protocol to support multi-attribute, one-to-one negotiations. For each party, its high level goals,
preferences, and constraints are expressed as policy specifications built upon the Web Service
Policy Framework (WS-Policy) [111]; a negotiation broker then translates them into low level
parameters over which the two parties negotiate. The negotiation process runs as follows.
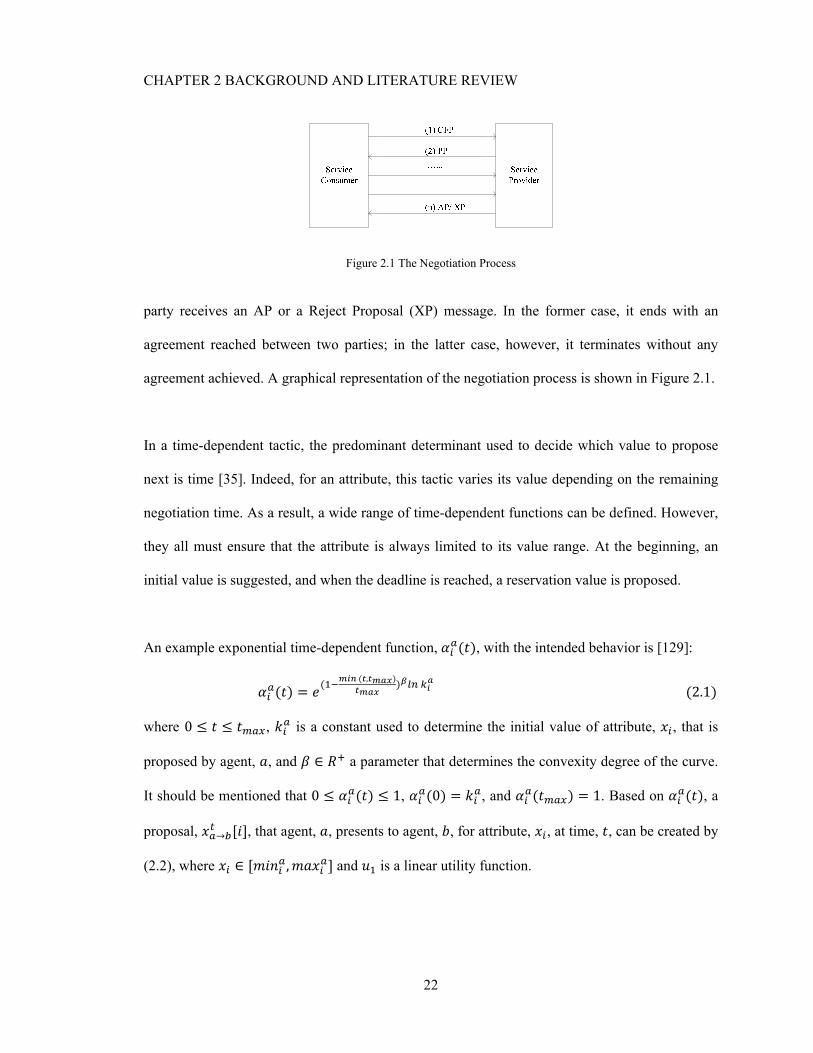
Initially, a service consumer requests a proposal from a service provider by sending a Call for
Proposal (CFP) message. Once the service provider receives a CFP, it creates a proposal and
sends it back with a Propose Proposal (PP) message. If the proposal is acceptable, the service
consumer acknowledges with an Accept Proposal (AP) message, and negotiation ends.
Otherwise, it provides a counter proposal with a PP, and the negotiation process repeats until one
CHAPTER 2 BACKGROUND AND LITERATURE REVIEW
22
Figure 2.1 The Negotiation Process
party receives an AP or a Reject Proposal (XP) message. In the former case, it ends with an
agreement reached between two parties; in the latter case, however, it terminates without any
agreement achieved. A graphical representation of the negotiation process is shown in Figure 2.1.
In a time-dependent tactic, the predominant determinant used to decide which value to propose
next is time [35]. Indeed, for an attribute, this tactic varies its value depending on the remaining
negotiation time. As a result, a wide range of time-dependent functions can be defined. However,
they all must ensure that the attribute is always limited to its value range. At the beginning, an
initial value is suggested, and when the deadline is reached, a reservation value is proposed.
An example exponential time-dependent function, ( ), with the intended behavior is [129]:
( ) = ( ( , )) (2.1) where 0 ≤ ≤ , is a constant used to determine the initial value of attribute, , that is
proposed by agent, , and ∈ a parameter that determines the convexity degree of the curve.
It should be mentioned that 0 ≤ ( ) ≤ 1, (0) = , and ( ) = 1. Based on ( ), a
proposal, → [ ], that agent, , presents to agent, , for attribute, , at time, , can be created by
(2.2), where ∈ [ , ] and is a linear utility function.
CHAPTER 2 BACKGROUND AND LITERATURE REVIEW
23
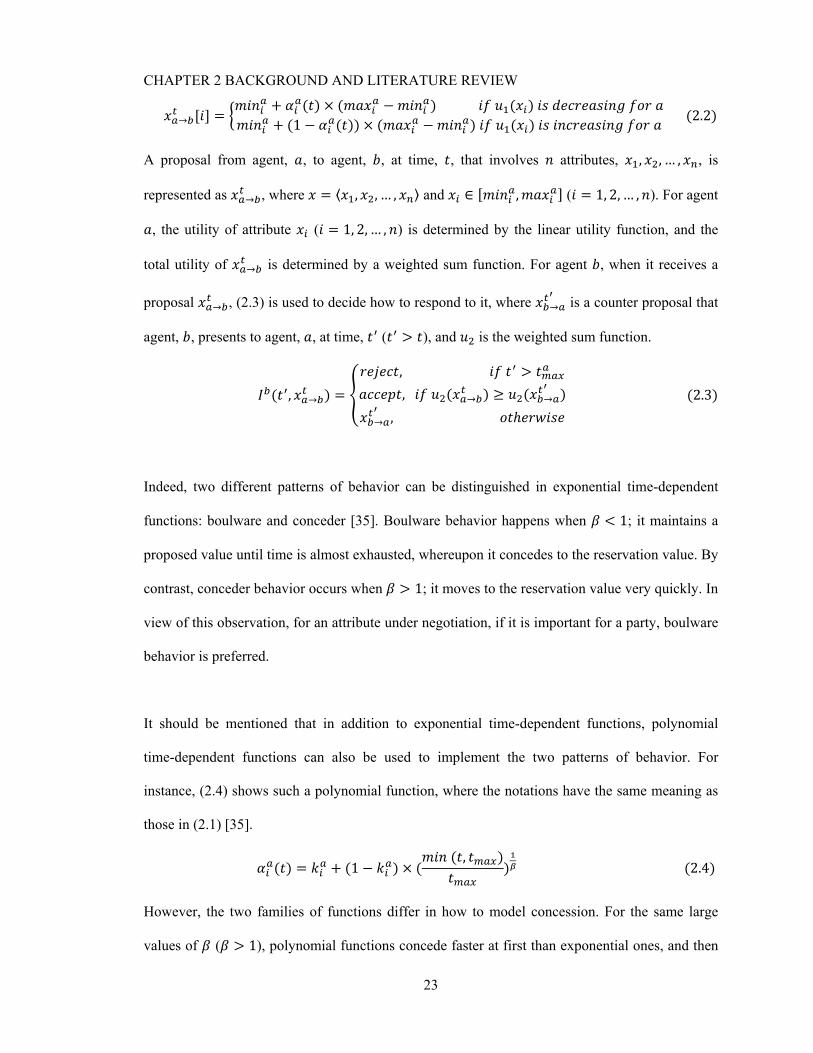
→ [ ] = + ( ) × ( − ) ( ) + (1 − ( )) × ( − ) ( ) (2.2) A proposal from agent, , to agent, , at time, , that involves attributes, , , … , , is
represented as → , where = ⟨ , , … , ⟩ and ∈ [ , ] ( = 1, 2, … , ). For agent
, the utility of attribute ( = 1, 2, … , ) is determined by the linear utility function, and the
total utility of → is determined by a weighted sum function. For agent , when it receives a
proposal → , (2.3) is used to decide how to respond to it, where → is a counter proposal that
agent, , presents to agent, , at time, ( > ), and is the weighted sum function.
( , → ) = , >, ( → ) ≥ ( → )→ , ℎ (2.3)
Indeed, two different patterns of behavior can be distinguished in exponential time-dependent
functions: boulware and conceder [35]. Boulware behavior happens when < 1; it maintains a
proposed value until time is almost exhausted, whereupon it concedes to the reservation value. By
contrast, conceder behavior occurs when > 1; it moves to the reservation value very quickly. In
view of this observation, for an attribute under negotiation, if it is important for a party, boulware
behavior is preferred.
It should be mentioned that in addition to exponential time-dependent functions, polynomial
time-dependent functions can also be used to implement the two patterns of behavior. For
instance, (2.4) shows such a polynomial function, where the notations have the same meaning as
those in (2.1) [35].
( ) = + (1 − ) × ( ( , )) (2.4) However, the two families of functions differ in how to model concession. For the same large
values of ( > 1), polynomial functions concede faster at first than exponential ones, and then
CHAPTER 2 BACKGROUND AND LITERATURE REVIEW
24
behave almost the same as their counterparts. Likewise, for a small value of ( < 1),
exponential functions wait longer than polynomial ones before they start to yield. Especially,
when = 1, polynomial functions concede linearly, whereas exponential ones behave in a
nonlinear manner, whose behavior is similar to that when < 1.
2.3.1.2 Resource-Dependent Tactics
Resource-dependent tactics are employed by Yao and Ma (2008) to acquire services. An
alternating-offers protocol that supports multi-attribute, one-to-one negotiations is adopted as the
negotiation protocol. Here, constraints imposed on a service under negotiation are described as
fuzzy truth propositions; truth functions then associate those propositions with a truth value
between zero and one. The negotiation process works as follows.
Initially, when a negotiation agent receives a proposal, it needs to determine the degree to which
its constraints can be satisfied by the proposal, the extent to which it can satisfy the constraints
requested by the proposal, and the utility of the proposal, denoted as , , and , respectively.
After that, if { , , } ≥ , where is a threshold that a proposal must exceed to be
acceptable, then the proposal will be accepted and negotiation ends with an agreement reached.
Otherwise, a counter proposal is prepared, if the deadline has not been reached. In doing so, three
decisions must be made. For constraints requested by the negotiation agent, hard ones are kept,
but soft ones that cannot be satisfied are removed. For constraints requested by the proposal,
those that cannot be satisfied are indicated, which, in a sense, can be viewed as an argument. For
attributes under negotiation, time, resource, and counterpart determinants are considered together
to decide a utility to be conceded, which is then distributed to those attributes based on their
weights. Once the counter proposal is created, the negotiation process repeats until an agreement
is reached, or the deadline is reached.
CHAPTER 2 BACKGROUND AND LITERATURE REVIEW
25
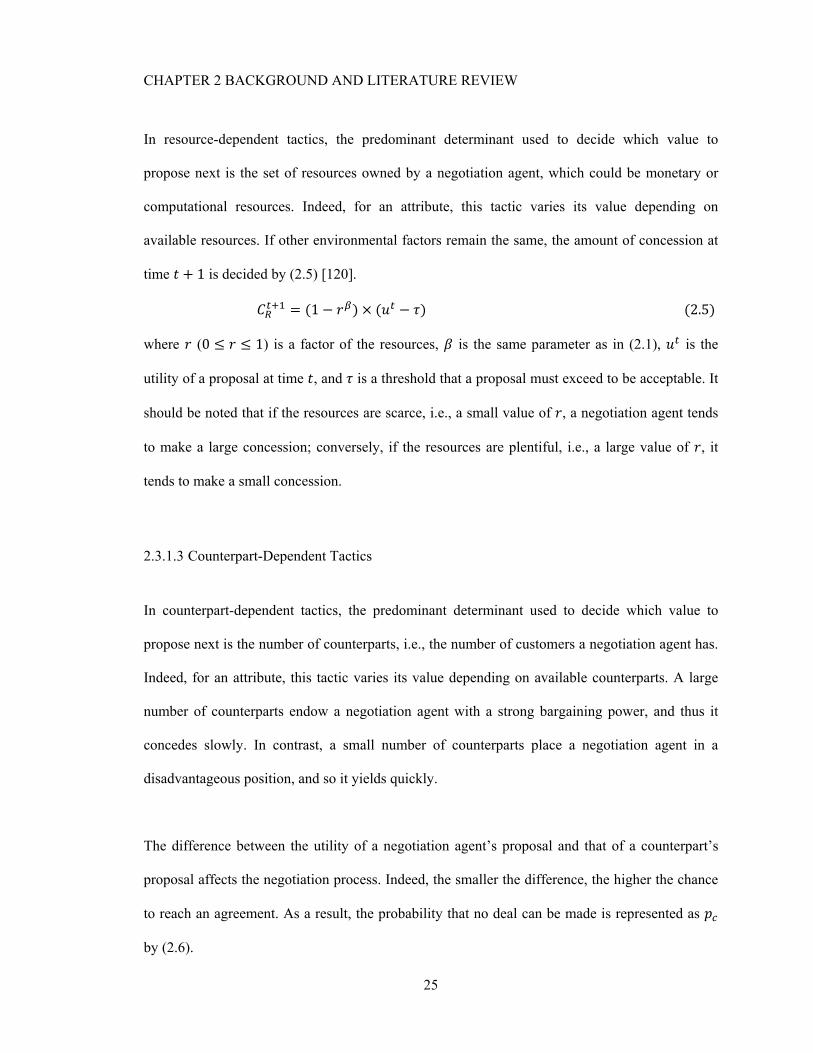
In resource-dependent tactics, the predominant determinant used to decide which value to
propose next is the set of resources owned by a negotiation agent, which could be monetary or
computational resources. Indeed, for an attribute, this tactic varies its value depending on
available resources. If other environmental factors remain the same, the amount of concession at
time + 1 is decided by (2.5) [120]. = (1 − ) × ( − )(2.5) where (0 ≤ ≤ 1) is a factor of the resources, is the same parameter as in (2.1), is the
utility of a proposal at time , and is a threshold that a proposal must exceed to be acceptable. It
should be noted that if the resources are scarce, i.e., a small value of , a negotiation agent tends
to make a large concession; conversely, if the resources are plentiful, i.e., a large value of , it
tends to make a small concession.
2.3.1.3 Counterpart-Dependent Tactics
In counterpart-dependent tactics, the predominant determinant used to decide which value to
propose next is the number of counterparts, i.e., the number of customers a negotiation agent has.
Indeed, for an attribute, this tactic varies its value depending on available counterparts. A large
number of counterparts endow a negotiation agent with a strong bargaining power, and thus it
concedes slowly. In contrast, a small number of counterparts place a negotiation agent in a
disadvantageous position, and so it yields quickly.
The difference between the utility of a negotiation agent’s proposal and that of a counterpart’s
proposal affects the negotiation process. Indeed, the smaller the difference, the higher the chance
to reach an agreement. As a result, the probability that no deal can be made is represented as
by (2.6).
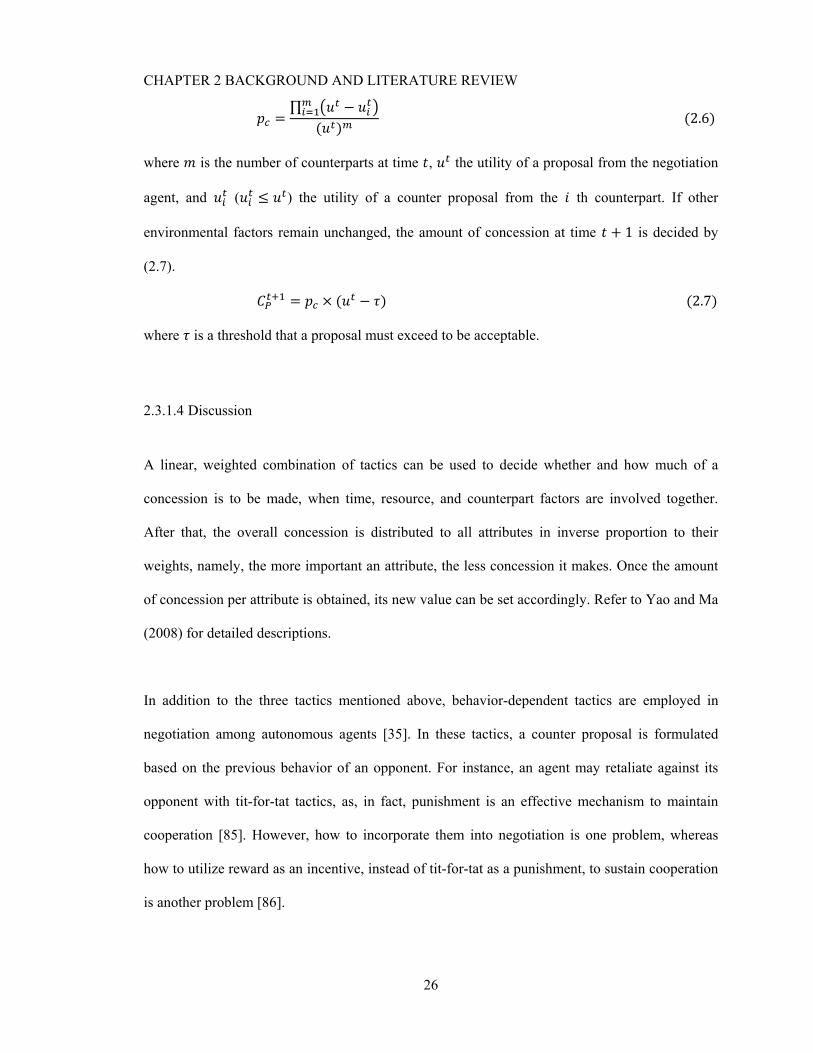
CHAPTER 2 BACKGROUND AND LITERATURE REVIEW
26
= ∏ −( ) (2.6) where is the number of counterparts at time , the utility of a proposal from the negotiation
agent, and ( ≤ ) the utility of a counter proposal from the th counterpart. If other
environmental factors remain unchanged, the amount of concession at time + 1 is decided by
(2.7). = × ( − )(2.7) where is a threshold that a proposal must exceed to be acceptable.
2.3.1.4 Discussion
A linear, weighted combination of tactics can be used to decide whether and how much of a
concession is to be made, when time, resource, and counterpart factors are involved together.
After that, the overall concession is distributed to all attributes in inverse proportion to their
weights, namely, the more important an attribute, the less concession it makes. Once the amount
of concession per attribute is obtained, its new value can be set accordingly. Refer to Yao and Ma
(2008) for detailed descriptions.
In addition to the three tactics mentioned above, behavior-dependent tactics are employed in
negotiation among autonomous agents [35]. In these tactics, a counter proposal is formulated
based on the previous behavior of an opponent. For instance, an agent may retaliate against its
opponent with tit-for-tat tactics, as, in fact, punishment is an effective mechanism to maintain
cooperation [85]. However, how to incorporate them into negotiation is one problem, whereas
how to utilize reward as an incentive, instead of tit-for-tat as a punishment, to sustain cooperation
is another problem [86].
CHAPTER 2 BACKGROUND AND LITERATURE REVIEW
27
2.3.2 Tradeoff Strategies
The key point of tradeoff strategies is that, in preparing a counter proposal, the total utility of a
reference proposal remains the same for one party, but the values of some of its attributes are
adjusted in favor of the other party. If, for this reason, the utility of one attribute is decreased by a
certain amount and that of another increased by the same amount, the total utility may not change
for the first party. Even so, this strategy can encourage the second party to accept the counter
proposal, since its utility is increased in this case. It should be noted that either a proposal
preferred by one party or one received from the other party can be set as the reference proposal;
however, the choice matters in that it may affect the utility the first party can gain.
Tradeoff strategies have been used to procure web services [84, 118]. Two tradeoff scenarios are
discussed here. In the first scenario, a tradoff-based approach is proposed to acquire a single
service, where altruistic strategies are employed. In the second scenario, an agent-based approach
is presented to acquire multiple services, where selfish strategies are adopted.
2.3.2.1 Altruistic Strategies
Altruistic strategies, whose reference proposal is built upon the other party’s ideal proposal, are
employed by Patankar and Hewett (2008) to acquire a single service. An alternating bilateral
protocol that supports multi-attribute, one-to-one negotiations is adopted as the negotiation
protocol. Indeed, an iterative tradeoff mechanism is utilized by one party to evaluate a proposal
received from the other party, and generate a counter proposal of mutual gain when necessary.
The negotiation process works as follows.
CHAPTER 2 BACKGROUND AND LITERATURE REVIEW
28
When a proposal received is not acceptable to one party, a collection of counter proposals with
the same utility are created and sent to the other party. After the second party receives them, it
chooses the one that is closest to its preferences. If the utility of the selected counter proposal is
not less than that of the proposal suggested by itself in the previous negotiation round, it accepts
the counter proposal. Otherwise, it creates a set of counter proposals and the negotiation process
repeats. Negotiation ends once a proposal or counter proposal is accepted. If no proposals or
counter proposals satisfy both parties, no agreement is achieved.
Let denote the difference between the utility of a proposal preferred by one party and that of
one received from the other party. A counter proposal can be generated by splitting among
attributes. It takes two steps:
1) Determination of Utility Difference. For each attribute , is set as the difference
between the utility of an ideal value and that of an offered value. Accordingly, is set as
a weighted sum of ( = 1, 2, … , ), namely, = ∑ × , where is the weight
of attribute .
2) Redistribution of Utility Difference. Each attribute consumes a certain amount of At
this point, one party’s knowledge of the other party’s preferences can be applied. Indeed,
if is distributed to those attributes more important to itself, but less important to its
opponent, a party creates a counter proposal with the same utility as the current proposal,
but a better utility for the opponent. The rationale, here, is that the opponent only makes a
large concession on its less important attributes, but a small concession on the important
attributes.
Instead of relying on heuristics to create a counter proposal, the altruistic strategies described
above consider the other party’s preferences, and provide a flexible search for a set of alternative
CHAPTER 2 BACKGROUND AND LITERATURE REVIEW
29
proposals, which makes negotiation efficient. However, they may not work in a competitive
environment, since they give more benefit to a party’s opponent.
2.3.2.2 Selfish Strategies
Selfish strategies, whose reference proposal is built upon a party’s ideal proposal, are employed
by Yan et al. (2007) to acquire multiple services for service composition. An extended FIPA
protocol that supports multi-attribute negotiations is adopted as the negotiation protocol. In
contrast with the alternating bilateral protocol mentioned above, this protocol supports one-to-
many negotiations, as well as one-to-one negotiations. To achieve end-to-end QoS requirements
in service composition, software agents are employed to negotiate QoS constraints imposed upon
each service. The negotiation process operates as follows.
As the standard FIPA protocol is unable to coordinate multiple negotiations, it is insufficient to
support SLA negotiation in service composition. For this reason, it is extended to allow a
Coordinator Agent (CA) to decompose end-to-end QoS requirements into local QoS requirements
placed on individual services. Then, the CA starts negotiation for each service. A Negotiator
Agent (NA) is employed to bargain with several service providers; proposals and counter
proposals are exchanged among them until a deal is made or a deadline reached. After that, a
successful deal is sent to the CA for confirmation. If the overall QoS requirements are satisfied,
the CA confirms with the NA that its deal is acceptable, and the NA further informs the provider
involved. Otherwise, the CA modifies local QoS requirements for one or more services, and
restarts the negotiation.
As for an individual service, a counter proposal can be generated as follows. The NA first
identifies for one party, in the utility plane of the current proposal, a point that is closer to its
CHAPTER 2 BACKGROUND AND LITERATURE REVIEW
30
preferred proposal, which is actually the perpendicular projection point from the preferred
proposal to the utility plane. If this point is acceptable, a counter proposal is created from it.
Otherwise, the NA sets this point and the center point of the utility plane as two reference points.
It then locates the midpoint of the two reference points and sets it as a new reference point, and
the process repeats. Eventually, a new point within the acceptable range is identified, and, based
on that point, a counter proposal is created. Indeed, the counter proposal created by one party has
the same utility for the other party, but a better utility for the first party.
2.3.2.3 Discussion
In contrast to altruistic strategies, selfish strategies employed by a party are better suited to a
competitive environment, since they give more benefit for the party itself, rather than its
opponent. However, both the standard and the extended FIPA protocols are not efficient for one-
to-many negotiation. The CA, which is employed to coordinate multiple negotiations, could also
be a single point of failure or a performance bottleneck.
The next section gives an overview of web service negotiation, where five negotiation
mechanisms — WS-Agreement, WS-Negotiation, a document-based approach, a semantic
approach, and COWS — are introduced. The reason that we study web service negotiation is that
cloud service negotiation is a new topic, and so relevant work is limited. However, web service
negotiation has been studied for years. As it is relevant to our topic, the techniques discussed can
be applied to cloud service negotiation too.
CHAPTER 2 BACKGROUND AND LITERATURE REVIEW
31
2.4 Web Service Negotiation
Web services are software systems that support interoperable machine-to-machine interaction
over a network [110]. As organizations are increasingly exporting their businesses as web
services, it is possible that users may find several services that can satisfy their functional
requirements [24]. When users have multiple choices, nonfunctional requirements become critical
for web service selection, where conflicts over nonfunctional requirements necessitate
negotiation. To avoid ambiguity, we make it clear here that the term “web service negotiation”
means “negotiation for a web service”, not “negotiation as a web service”, and that the term
“cloud service negotiation” implies “negotiation for a cloud service”, not “negotiation as a cloud
service”. But, certainly, negotiation can be implemented as a service.
Web service negotiation involves an exchange of proposals and counter proposals among
negotiation agents, with an aim to establish a SLA over nonfunctional properties of web services
[70]. Generally, nonfunctional properties include price, response time, throughput, availability,
reliability, security, etc. [63, 113]. An achieved SLA is a collection of service level requirements
that have been negotiated and mutually agreed upon between a service provider and a service
consumer [24].
Below, the main ideas of five web service negotiation mechanisms, i.e., WS-Agreement, WS-
Negotiation, a document-based approach, a semantic approach, and COWS are introduced.
CHAPTER 2 BACKGROUND AND LITERATURE REVIEW
32
2.4.1 WS-Agreement
Web Services Agreement Specification (WS-Agreement) is an XML based language that
provides a negotiation approach to access web services [78]. It defines a negotiation language and
a negotiation protocol, which supports multi-attribute, one-to-one negotiations. It works as
follows. First, an initiator requests available templates from a service provider, and selects a
suitable one to create a proposal, which is then sent back to the service provider. If the proposal is
acceptable, the service provider creates an agreement based on the proposal, which is
implemented and returned to the initiator afterwards. Otherwise, the initiator repeats the process.
Last, the status of the agreement is monitored to determine whether a violation has occurred or
not. However, WS-Agreement does not specify any negotiation strategy.
2.4.2 WS-Negotiation
Web Service Negotiation Standard (WS-Negotiation) is an XML based language proposed to
facilitate web service negotiation. It supports multi-attribute, bilateral negotiations [43]. It
consists of three parts, i.e., a set of negotiation messages, a negotiation protocol, and a negotiation
decision model. A negotiation message describes the format of messages exchanged among
negotiation agents, but their schema and semantics have not been defined as yet. A negotiation
protocol describes the interaction rules among agents, where a third party called the negotiation
support system is used to support the exchange of negotiation messages. A set of negotiation
primitives are to be included to facilitate communications between a service provider and a
service consumer, which have more rich semantics than negotiation messages. A negotiation
decision model is a decision process based on a cost-benefit model or other strategies, but they
have not been specified as yet.

CHAPTER 2 BACKGROUND AND LITERATURE REVIEW
33
2.4.3 Document-Based Approach
A document-based approach based on WS-Agreement is proposed for resource negotiation [69].
It can deal with multi-attribute, one-to-many negotiations in a dynamic environment, where
available resources and agents (including resource providers, mediators, and resource consumers)
change over time. A resource provider negotiates with a mediator, which represents a virtual
organization in negotiation with resource consumers. Here, a virtual organization is an abstract
representation of a number of resource providers. A resource consumer can contact one or more
mediators to initiate negotiation, with an aim to obtain an offer that fulfills its requirements.
This approach consists of four phases, where each phase is associated with a negotiation
document type. In the advertisement phase, a resource consumer informs the mediator of the
resource types it needs, and then the mediator retrieves advertisements in its virtual organization.
In the request phase, the service consumer responds to the advertisements with a lease request,
which describes the resources it wants to access and the corresponding conditions. In the offer
phase, resource providers analyze the lease request received from the mediator and create lease
offers, which are returned to the service consumer thereafter by the mediator. In the acceptance
phase, the service consumer accepts one of the offers, and then the mediator creates a domain
lease document which details the actual resources and conditions. The approach is simple, but
suffices for some cases.
2.4.4 Semantic Approach
A semantic approach based on WS-Agreement is presented to achieve rich and accurate matches
between a service provider and a service consumer [79]. It supports multi-attribute, one-to-one
CHAPTER 2 BACKGROUND AND LITERATURE REVIEW
34
negotiations, and has been used to facilitate agricultural trade between farmers and merchants in
India. Rule-based reasoning is used to implement negotiation, where Semantic Network Ontology
Base (SNOBASE) is employed to reason about domain ontologies, and Agent Building and
Learning Environment (ABLE) rule language is used to write rules. It contains three phases:
parsing, matching, and searching. First, ontologies are loaded into SNOBASE, and a service
provider’s agreements, i.e., templates, are parsed and loaded into it as agreement instances.
Second, when a new instance is created, the ABLE rule engine triggers those rules whose
preconditions are met by it, and accordingly some assertions (i.e., postconditions) are added. Last,
when a service consumer searches for a service provider, its agreement is parsed and loaded into
SNOBASE as another agreement instance. A search algorithm then considers those assertions
previously established and the instance newly created, and returns a list of service providers
whose agreements match that of the service consumer.
2.4.5 COWS
Calculus for Orchestration of Web Services (COWS), a process calculus for specifying and
analysing web services, is proposed as a uniform formalism for modelling all relevant phases of
the life cycle of service-oriented applications, including publication, discovery, negotiation,
deployment, and execution [52]. It supports multi-attribute, one-to-many negotiations, and
provides a set of elegant meta-theories, proof techniques, and analytical tools for modelling
Service-Oriented Architecture (SOA) systems and applications. To conduct negotiation, service
level requirements are expressed as constraints, and their consistency implies that an agreement
has been reached. A constraint, here, is a restriction on the possible values that a set of variables
can assume, for instance, ≥ 350 and = 0.05 × ℎ are two simple
constraints. It should be noted that when soft or relaxed constraints are adopted, COWS can
return an optimal solution.
CHAPTER 2 BACKGROUND AND LITERATURE REVIEW
35
The next section gives an overview of cloud service negotiation, where related work on QoS
measurement, QoS negotiation, and QoS assurance are discussed.
2.5 Cloud Service Negotiation
Cloud services are Internet-based XaaS services. As the cloud market becomes more open and
competitive, QoS will be more important. However, cloud providers and cloud consumers have
different and sometimes opposite preferences. If such a conflict occurs, a SLA cannot be reached,
without negotiation. Below, we give a literature review for QoS measurement, QoS negotiation,
and QoS assurance for cloud services.
2.5.1 QoS Measurement
To measure service performance, Parasuraman and Zeithaml (1988) propose SERVQUAL for
assessing customer perceptions of service quality in service and retailing businesses. It defines
five quality dimensions, i.e., tangibles, reliability, responsiveness, assurance, and empathy.
However, its quality dimensions are all subjective, not objective. For this reason and others, its
quality dimensions cannot be applied to cloud services without reconstruction [126].
The provision of services over electronic networks is referred to as electronic services. It is
argued that, for electronic services, quality is the most important determinant of long-term
success. To measure their quality, Swaid and Wigand (2009) restructure the quality dimensions of
SERVQUAL, and propose an e-service quality model. It consists of six quality dimensions, i.e.,
website usability, information quality, reliability, responsiveness, assurance, and personalization.
However, its quality dimensions are still subjective, not objective. Also, electronic services,
CHAPTER 2 BACKGROUND AND LITERATURE REVIEW
36
which provide services at large, are more generic than cloud services, which deliver IT services in
particular. For these two reasons, its quality dimensions cannot be applied to cloud services
without re-establishment.
In fact, it would be better to specifically define a quality model for cloud services. Initial efforts
in this direction are discussed below. Armstrong and Djemame (2009) argue that knowledge and
lessons learnt from grid can be applied to QoS research in cloud. The relevance of QoS research
in the two architectures is discussed. However, no quality dimensions are specified. Ferretti et al.
(2010) design a middleware that can respond effectively to QoS requirements of customer
applications, which are hosted in an execution platform constructed out of cloud resources. As to
quality dimensions, only availability and response time are considered, but important ones like
reliability and security are not covered. Alhamad, Dillon, and Chang (2010) develop a SLA
framework for cloud, where quality dimensions like availability, reliability, security, etc. are
specified. However, its quality dimensions lack theoretical justifications, and no quality metrics
are specified.
Lee et al. (2009) propose a quality model to evaluate SaaS, where five quality dimensions and
metrics are specified, i.e., reusability, availability, scalability, reliability, and efficiency.
However, its quality dimensions lack sound justifications such that security is left out. Also, the
quality metric for efficiency needs improvements. Last, the quality model targets SaaS in
particular, not cloud services in general. To help customers select cloud services that meet their
needs, and create healthy competition among cloud providers, Garg, Versteeg, and Buyya (2011)
propose a framework called SMICloud to measure QoS for cloud services. SMICloud is based on
Service Measurement Index (SMI) [29]. Although SMI formally specifies quality dimensions, it
does not define any quality metrics. As SMICloud lacks sound justifications, important quality
CHAPTER 2 BACKGROUND AND LITERATURE REVIEW
37
dimensions like availability and security are left out. Last, SMICloud targets IaaS in particular,
not cloud services in general.
2.5.2 QoS Negotiation
Automated negotiation occurs when software agents negotiate on behalf of their human
counterparts [125]. It has been studied in artificial intelligence and electronic commerce for many
years [35, 58]. Jennings et al. (2001) argue that negotiation is the most fundamental mechanism to
manage runtime dependencies among agents, and thus underpins cooperation and coordination.
Lomuscio, Wooldridge, and Jennings (2003) argue that automated negotiation underpins the next
generation of electronic commerce systems, and develop a classification scheme for negotiation
in electronic commerce. It offers a systematic basis on which different negotiation mechanisms
can be compared and contrasted.
Automated negotiation has been proposed as an ideal approach to procure cloud resources. Sim
(2010, 2012) proposes a market-driven, agent-based negotiation mechanism to procure resources
and services in the cloud marketplace. In particular, the mechanism supports parallel negotiation
activities, namely, multiple negotiations at the same time. It is reported that with it, agents can
achieve a higher utility and a higher success rate. An et al. (2010) design a distributed negotiation
mechanism, which allows consumers to negotiate with providers over cloud resources. In
particular, consumers can revoke a contract at their expense. It is shown that the proposed method
outperforms both combinatorial auction mechanisms and Amazon’s fixed price model, in terms
of total utility. Macias and Guitart (2010) propose a negotiation mechanism, which utilizes
resource level information to make an informed decision, when negotiating for cloud resources
and services. It can perform complex decisions with the help of nonadditive utility functions.
CHAPTER 2 BACKGROUND AND LITERATURE REVIEW
38
Several papers now deal with QoS negotiation for cloud services. Elfatatry and Layzell (2002)
argue that SaaS consumers can tailor their needs and QoS requirements via negotiation with SaaS
providers. However, no negotiation approaches are mentioned. To build adaptable services,
Brandic, Music, and Dustdar (2009) define meta-negotiations and SLA mappings for cloud
services. Meta-negotiation specifies negotiation participants, protocols, languages, etc. SLA
mapping allows inconsistent parts of one document to be mapped to another document, and thus
eliminates semantic inconsistencies among negotiation participants. Again, no negotiation
approaches are discussed. Stantchev and Schröpfer (2009) propose an approach for SLA mapping
between business processes and IT infrastructures. It aims to formalize, negotiate, and enforce
QoS requirements for cloud services. Once again, no negotiation approaches are specified.
The European Union Seventh Framework Program (EU FP7) project SLA@SOI develops a SLA
management framework for Service-Oriented Infrastructure (SOI) [100]. It aims to enable service
providers to negotiate SLAs with service consumers, and map top-level SLAs to lower-level
metrics and parameters [21, 100]. The research focuses on a general management framework, but
no negotiation strategies are detailed. Yaqub et al. (2011) present a generic negotiation platform
for SLA@SOI. However, it focuses on negotiation protocols, not negotiation strategies, which we
deal with in this thesis, where a mixed approach based on the “game of chicken”, which can
balance utility and success rate, is proposed for cloud service negotiation.
2.5.3 QoS Assurance
Resource allocation is an important issue in cloud computing. Tsakalozos et al. (2011) propose a
microeconomic approach to allocate Virtual Machines (VMs) for cloud consumers who have a
budget constraint. An equilibrium point is determined, where both cloud providers and cloud
consumers are able to maximize their benefits. That is, cloud providers can maximize their
CHAPTER 2 BACKGROUND AND LITERATURE REVIEW
39
profits, and cloud consumers can maximize their QoS. Minarolli and Freisleben (2011) propose a
utility-based approach to allocate CPU resources for IaaS clouds. It can meet QoS requirements
while minimizing operating costs.
Niehörster et al. (2010) develop an agent-based architecture to allocate VMs for a scientific
cloud. It can check whether QoS requirements are reachable, and, if so, guarantee their
fulfillment. Van, Tran, and Menaud (2009) propose an automatic virtual resource manager for
cloud. It aims to optimize a global utility function that considers both SLA fulfillment and
operating costs. VM provisioning and packing are formulated as two constraint satisfaction
problems. Reig, Alonso, and Guitart (2010) propose a resource allocation mechanism, which can
translate service level terms into resource level terms. Based on an online prediction system that
includes a fast analytical predictor and a learning-based predictor, it allows cloud providers to
make the most of their resources.
Bonvin, Papaioannou, and Aberer (2011) propose an economic approach to adapt resources for
applications hosted in a cloud. VMs are replicated, migrated or terminated based on economic
fitness. It is reported that the approach can meet performance objectives statistically even under
load spikes and failures. Goudarzi and Pedram (2011) propose a heuristic approach to allocate
resources for applications deployed in cloud. A force-directed search algorithm is presented to
meet SLAs while maximizing profits. Wu, Garg, and Buyya (2011) propose an approach based
on scheduling to allocate resources for SaaS cloud. It can minimize infrastructure costs and SLA
violations for SaaS providers who want to maximize profits. Buyya, Garg, and Calheiros (2011)
are the first to argue for SLA-driven resource allocation for cloud services. However, most work
reviewed above only deals with response time, which is not sufficient to offer quality services.
The EU FP7 project SLA@SOI develops a SLA management framework for SOI [97]. It aims to
CHAPTER 2 BACKGROUND AND LITERATURE REVIEW
40
map top-level SLAs to lower-level metrics and parameters, but no resource allocation techniques
are specified.
2.6 Summary
The service sector plays an increasingly important role in the global economy. In recognizing its
importance, service research has received attention from both academia and industry. To better
understand our research topic, we provide background knowledge for cloud service negotiation.
First, we introduce service innovation, which provides the economic background for cloud
services. As the focus in business disciplines is shifted from G-D logic to S-D logic, it will have a
great impact on both business services and IT services. In fact, services computing and cloud
computing are technical innovation under the umbrella of service innovation. Services computing
attempts to bridge the gap between business services and IT services, whereas cloud computing
advocates X as a service, where X can be hardware, software or applications.
Next, we introduce automated negotiation and negotiation strategies, which provide the technical
background for cloud service negotiation. Automated negotiation occurs, when software agents
negotiate on behalf of their human counterparts. We introduce two negotiation approaches —
agent-based and game-theoretic, and give a general description of two negotiation strategies —
concession and tradeoff.
Last, we review related work on web service negotiation and cloud service negotiation. For web
service negotiation, we introduce five negotiation mechanisms. For cloud service negotiation, we
discuss related work on QoS measurement, QoS negotiation, and QoS assurance. The next
CHAPTER 2 BACKGROUND AND LITERATURE REVIEW
41
chapter deals with QoS measurement, where cloud consumers can express their QoS
requirements, with the help of a quality model.
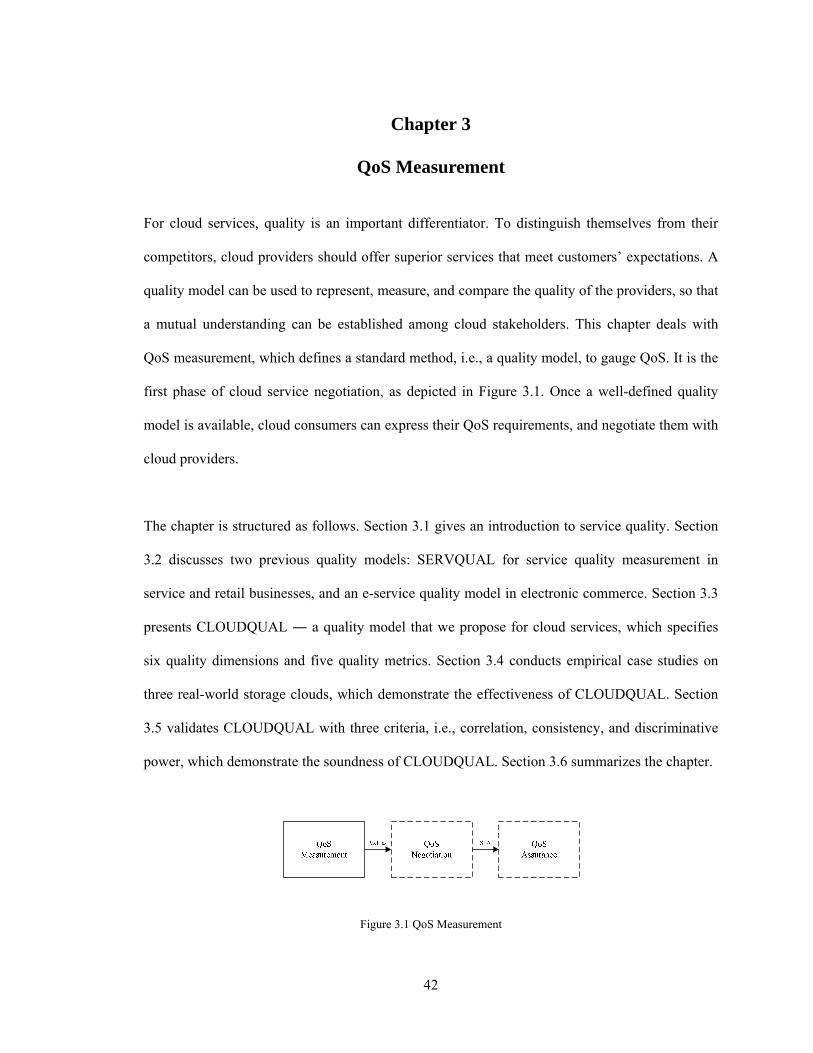
42
Chapter 3
QoS Measurement
For cloud services, quality is an important differentiator. To distinguish themselves from their
competitors, cloud providers should offer superior services that meet customers’ expectations. A
quality model can be used to represent, measure, and compare the quality of the providers, so that
a mutual understanding can be established among cloud stakeholders. This chapter deals with
QoS measurement, which defines a standard method, i.e., a quality model, to gauge QoS. It is the
first phase of cloud service negotiation, as depicted in Figure 3.1. Once a well-defined quality
model is available, cloud consumers can express their QoS requirements, and negotiate them with
cloud providers.
The chapter is structured as follows. Section 3.1 gives an introduction to service quality. Section
3.2 discusses two previous quality models: SERVQUAL for service quality measurement in
service and retail businesses, and an e-service quality model in electronic commerce. Section 3.3
presents CLOUDQUAL ― a quality model that we propose for cloud services, which specifies
six quality dimensions and five quality metrics. Section 3.4 conducts empirical case studies on
three real-world storage clouds, which demonstrate the effectiveness of CLOUDQUAL. Section
3.5 validates CLOUDQUAL with three criteria, i.e., correlation, consistency, and discriminative
power, which demonstrate the soundness of CLOUDQUAL. Section 3.6 summarizes the chapter.
Figure 3.1 QoS Measurement
CHAPTER 3 QOS MEASUREMENT
43
3.1 Introduction
To succeed in the competitive market, cloud providers should offer superior services that meet
customers’ expectations. Traditional services are carried out in human-based environments like
stores, restaurants, and hotels, where human interactions are common. In contrast, cloud services
are delivered in Internet-based environments, with little or no direct human interaction. In fact,
cloud services, which advocate computation, in a general meaning, as a service, expand the
spectrum of services. So, how to define and measure their quality becomes a new problem.
A quality model of cloud services specifies quality dimensions and metrics to detail and quantify
service quality. It helps to create common knowledge of service quality, i.e., what it means and
how to measure it, such that when a quality dimension like reliability is mentioned, it means
exactly the same thing to two parties, and the same metric is adopted to measure it. With a quality
model, cloud consumers can confirm whether services are provided with the expected quality.
For example, a cloud provider could guarantee an availability of 99.999%, or five minutes of
unavailability in a year, with a 10% discount on its charges for any month in which it is not
achieved [30]. However, if its infrastructure is not designed to reach five nines of uptime, it is
effectively offering a 10% discount on its services in exchange for the benefit of claiming that
level of availability. This misrepresentation of availability by the cloud provider could be
considered as unethical behavior [15]. So, a quality model is required to protect consumers’
interests.
Indeed, without a quality model it is hard to establish trust between two parties, which is essential
to conducting business in Internet-based environments. If cloud providers still make little or no
CHAPTER 3 QOS MEASUREMENT
44
commitment [30], as they do today, it inevitably harms their businesses. As consumers care about
QoS, those who do not adopt a quality model and make no commitment in today’s market may
not survive. In fact, without a quality model cloud providers cannot assure themselves that their
truly superior services are not repudiated. In this sense, a quality model benefits both cloud
providers and cloud consumers.
Low prices characterize current cloud offerings, but the next-generation of offerings targets
quality services [36]. As it aims to deliver high performance, highly available, and secure services
for business-critical applications, a quality model is indispensable. The model can build trust
between two parties, and make possible a large-scale adoption of cloud services.
It should be noted that even if some quality dimensions of CLOUDQUAL are not brand-new, we
regard them from a new perspective, i.e., a service perspective, and redefine, accordingly, the
quality dimensions and metrics. So, it is an innovation without doubt.
3.2 Service Quality Models
In this section, we describe two quality models that are used to measure service quality for
traditional services and electronic services, respectively. The study provides insights into the
properties needed in a quality model for cloud services. Below, we first examine service features
at large, and then introduce the two quality models.
3.2.1 Service Features
Unlike goods or products, which are tangible and have physical dimensions, services are
“intangibles” whose output is viewed as an experience [83, 102]. For a tangible product like a
CHAPTER 3 QOS MEASUREMENT
45
tablet computer, consumers can visualize its physical attributes before purchase. In contrast,
services cannot be touched, tasted, smelt or seen. So, it is hard to determine their quality. For
example, it is usually more difficult to compare the quality of the education provided by two
universities.
A service is regarded as an activity rather than a physical object, and so has four unique features:
1) Intangibility means that services are “something that you cannot drop on your foot” [83].
For example, a software application is generally, if not always, considered as a service,
whereas the computer hardware running the application is a product.
2) Heterogeneity refers to the multi-faceted experience that comes from the same type of
service. It is considered as a factor that distinguishes services from products. In fact,
services may vary with consumers’ requirements and providers’ capabilities, whereas
products are generally standardized.
3) Inseparability indicates that the production and consumption of services occur at the same
time. In other words, providers cannot offer their services until consumers appear. By
contrast, a manufacturer can make products without consumers’ participation.
4) Perishability implies that services are not a stock of fixed assets, and that it is not possible
to store services in inventories. In other words, services perish in the moment of their
termination. In contrast, products can be stored and resold in the future.
3.2.2 Quality Model for Traditional Services
For products, their quality can be measured objectively and engineered in the production process
[82]. However, it is usually hard to establish and enforce precise specifications to guarantee
uniform quality for services. The reason is that service quality is highly dependent on the
performance of service employees.
CHAPTER 3 QOS MEASUREMENT
46
Service is defined as applying competence for the benefit of another [101], and service quality is
a comparison of consumer service expectations with perceived service performance [49].
Parasuraman, Zeithaml, and Berry (1988) develop SERVQUAL for measuring service quality in
service and retail businesses [102]. It enables service companies to evaluate consumer
perceptions of service quality, and helps them to identify areas that need improvements. In spite
of some criticisms, SERVQUAL remains as a major reference model to judge the superiority of a
service [34, 72]. SERVQUAL includes five quality dimensions [82]:
1) Tangibles: physical facilities, equipment, and appearance of personnel.
2) Reliability: ability to perform promised services dependably and accurately.
3) Responsiveness: willingness to help customers and provide prompt service.
4) Assurance: knowledge and courtesy of employees and their ability to inspire trust and
confidence.
5) Empathy: caring, individualized attention the firm provides its customers.
SERVQUAL calculates service quality over each quality dimension based on the gap between
customer perception and expectation. In other words, service quality is measured over each
quality dimension by = − (3.1) where represents perceived quality, and denote the ratings of the corresponding perception
and expectation, respectively.
Traditional services are human powered services, whose quality is highly dependent on the
performance of service employees, so subjective quality dimensions are employed to evaluate
service quality. In contrast, cloud services are machine powered services, whose quality is not
tightly linked to the performance of service employees, and so can be engineered. So, cloud
CHAPTER 3 QOS MEASUREMENT
47
services require objective quality dimensions, with which cloud consumers can compare QoS
delivered with QoS promised by cloud providers.
3.2.3 Quality Model for Electronic Services
Networked software applications that perform business activities are termed electronic services or
e-services for short [102]. Online retailing websites like eBay are such e-services. From the
marketing perspective, e-service quality means the extent to which the Internet facilitates efficient
delivery of products and/ or services. Unlike traditional services that are delivered in human-
based environments, e-services are offered in Internet-based environments. For this reason, their
characteristics are different from those of traditional ones. In fact, e-services are less intangible,
more homogeneous, separably consumed, and inventoried. Based on SERVQUAL, Swaid and
Wigand (2009) define the following quality dimensions for e-services:
1) Website usability: Online shoppers value a well-designed website. It should be easily
navigated, so that customers can easily find their required information. Usable websites
should provide search and comparison engines as well.
2) Information quality: Customers rely on websites to deliver important information like
product description, price, and delivery times. To make informed decisions, accurate,
relevant, and updated information should be presented on websites.
3) Reliability: In traditional stores, “reliability is the strongest predictor of customer
satisfaction and the second strongest predictor of loyalty”. In e-services, reliability
requires that services should be offered on time and as promised.
4) Responsiveness: Communication tools such as emails, message boards, discussion
forums, toll free numbers, click-to-call, and click-to-chat that enable customers to ask
questions and receive accurate, prompt, and error-free responses are essential.
CHAPTER 3 QOS MEASUREMENT
48
5) Assurance: Assurance is considered as one of the most important drivers of customer
loyalty. In e-services, assurance refers to the degree to which customers believe that a
website is safe from intrusion, and that personal information is protected. It affects the
reputation and customers’ confidence in the website. Security and privacy policies, third-
party seals, and affiliation with known retailers can inspire trust.
6) Personalization: In e-services, personalization is the ability of a website to tailor its
service in line with customers’ preferences. Indeed, personalized services enhance the
perception of e-service quality. Customers are more satisfied when a website can suggest
products based on their interests. As e-services are delivered in Internet-based
environments, it is possible to collect customers’ information, and analyze their
preferences.
The quality model described above is an effective tool to evaluate e-service quality. It enables
consumers to rate service experience for e-services. As its six quality dimensions are all
subjective, it suffers the same drawback as SERVQUAL ― it is unable to offer objective quality
measurements. So, it cannot be applied to cloud services without reconstruction.
3.3 Cloud Quality Model
Cloud services are carried out in Internet-based environments. For this reason, they share few
similarities with traditional services that are delivered in human-based environments. Instead,
they share more similarities with e-services that are delivered in Internet-based environments too.
As cloud services advocate computation, in a general meaning, as a service, objective quality
dimensions are required to measure their quality. So, it is necessary to rebuild the e-service
quality model for cloud services. A quality model for cloud services should be objective,
CHAPTER 3 QOS MEASUREMENT
49
computable, and verifiable, so that cloud providers can gauge their QoS delivered, and cloud
consumers can validate their QoS received.
3.3.1 Functional vs. Nonfunctional Properties
Cloud services can be described with their functional and nonfunctional properties. Functional
properties detail what is offered. For instance, Amazon S3 [6] provides storage services; Amazon
EC2 [5] offers compute services; Microsoft SQL Azure (SQL Azure) [65] provides database
services. In fact, if functional properties fail, cloud consumers’ requirements cannot be fulfilled.
So, it is not surprising that functional properties have received a great deal of attention.
In contrast, nonfunctional properties detail how well a service is performed. For instance,
Amazon S3 guarantees “a monthly uptime percentage of at least 99.9% during any monthly
billing cycle” [6]. Here, an availability of at least 99.9% is promised, which is one of the
important nonfunctional properties of cloud services. Likewise, Microsoft asserts that data stored
in Windows Azure is replicated to three separate nodes to minimize the impact of hardware
failures [48]. Here, replication is used to enhance reliability, which is another important
nonfunctional property of cloud services.
Cloud vendors, however, do not yet give similar consideration to nonfunctional properties of their
services. Of the SLAs typically specified with cloud services, most deal with availability and
some consider reliability [30]. Indeed, nonfunctional properties matter, because they determine
service quality. For instance, if a network connection breaks down or performance becomes poor,
it may affect availability [59]. Also, if hardware failures or software faults occur, they may
decrease reliability. Still, if attacks or intrusions happen, they may harm security. In short, if
CHAPTER 3 QOS MEASUREMENT
50
nonfunctional properties become problematic, service experience can be poor, which negatively
impacts a provider’s reputation.
3.3.2 Cloud Quality Dimensions and Metrics
Inspired by SERVQUAL and the e-service quality model described earlier, we propose the
following quality dimensions and metrics for cloud services.
3.3.2.1 Usability (USAB)
Definition 3.1 (Usability). Usability describes how easy, efficient, and enjoyable the interface to
a cloud service is to use, or assesses the ease of invocation if the functionality of a cloud service
is exposed as APIs.
For an end user who has no expertise in cloud services, a Graphical User Interface (GUI) serves
them better than an Application Programming Interface (API). It should be noted that this is
typical of most cloud consumers, and cloud providers cannot achieve business success without
treating them as first-class citizens.
Still, a Web User Interface (WUI) is better than a GUI. For instance, end users have to install a
client GUI to visualize their files stored in a storage cloud, whereas a WUI does not require extra
effort from users.
In short, cloud interfaces should not cause too much cognitive pain to end users. Accurate and
helpful information can aid users to interact with them. Since it is hard to give usability a
quantitative description, it remains subjective.
CHAPTER 3 QOS MEASUREMENT
51
3.3.2.2 Availability (AVAL)
Definition 3.2 (Availability). Availability is the uptime percentage of cloud services during a
time interval, which can be measured by = (3.2) where 0 ≤ ≤ 1 represents availability, and denote the uptime and the total time of an
operational period, respectively. The closer the value of is to 1, the higher the availability.
As cloud services are delivered over the Internet, where network outages could happen, cloud
consumers value a highly available service. In other words, cloud services, ideally, should be
interruption-free.
3.3.2.3 Reliability (REL)
Definition 3.3 (Reliability). Reliability is the assurance that cloud services are free from
hardware failures, software faults, and other defects that could make them break down. For
operation-based services, it can be measured by = 1 − (3.3) where 0 ≤ ≤ 1 represents reliability, and denote the number of failed and total
operations that occurred in a time interval, respectively. The closer the value of is to 1, the
higher the reliability.
Another two measurements of reliability are the Mean Time Between Failures (MTBF) and the
Mean Time To Failure (MTTF) [28]. Both MTBF and MTTF can be used for continuously
running services. The difference is that the former assumes that a failed system is immediately
repaired, whereas the latter assumes that the system is non-repairable. From a service perspective,
CHAPTER 3 QOS MEASUREMENT
52
a measurement from an end-user’s viewpoint like the one specified above is better than those
from a system perspective like MTBF and MTTF.
As cloud services are based on hardware and software, where unknown defects could occur,
consumers value a highly reliable service. In other words, cloud services, ideally, should be fault-
free.
3.3.2.4 Responsiveness (RESP)
Definition 3.4 (Responsiveness). Responsiveness is the promptness with which cloud services
perform a request during a time interval, which can be measured by = 1 − ( )(3.4) where 0 ≤ ≤ 1 represents responsiveness, denotes the time between the submission and the
completion of the th request, is a parameter that specifies the maximum acceptable time to
complete a request ( ≥ ), is the number of requests issued in an operational period, and
is a function that measures the central tendency of a set of data, such as the mean and the
median. The closer the value of is to 1, the better the responsiveness.
Instead of a maximum possible time from a system perspective, we use the maximum acceptable
time from an end-user’s viewpoint to formulate responsiveness. For cloud services, a
measurement from an end-user’s viewpoint is better than one from a system perspective.
Few cloud services, currently, mention responsiveness in their SLAs. As cloud services advocate
computation, in a general meaning, as a service, where a quick response indicates high
performance, consumers value an accurate and prompt service.
CHAPTER 3 QOS MEASUREMENT
53
3.3.2.5 Security (SECY)
Definition 3.5 (Security). Security is the assurance that cloud services are free from viruses,
intrusions, spyware, attacks, and other security vulnerabilities that could put them at risk, which
can be measured by = 1 − ( )(3.5) where represents security, and ( ) denotes a cumulative distribution function of a random
variable indicating the time until the first security breach occurs, measured in unit time.
For simplicity, we assume that security issues occur at random and uniformly in cloud services
throughout a time interval. That is, there is no clustering of security issues. The occurrence of
security issues, then, can be modelled as a Poisson process with mean > 0. Let a random
variable denote the time from the start of an operational period until the first security breach
occurs. now follows an exponential distribution with parameter , whose cumulative
distribution function is described as [71] ( ) = 1 − , ≥ 0(3.6) Alternatively, its probability density function is determined, by differentiation, as ( ) = , ≥ 0(3.7) If security issues follow different patterns, we can model them with regression techniques [71]. It
should be cautioned here that we do not intend to detect security issues, nor do we intend to
enforce security mechanisms for cloud services, which are beyond the scope of this thesis.
Rather, we use history information, which is publicly available or can be obtained from a third
party, to approximate their security level from an end user’s viewpoint.
Some cloud providers, currently, claim that their services are secure, but none cover security in
their SLAs. As cloud services may store and process users’ sensitive data, where security
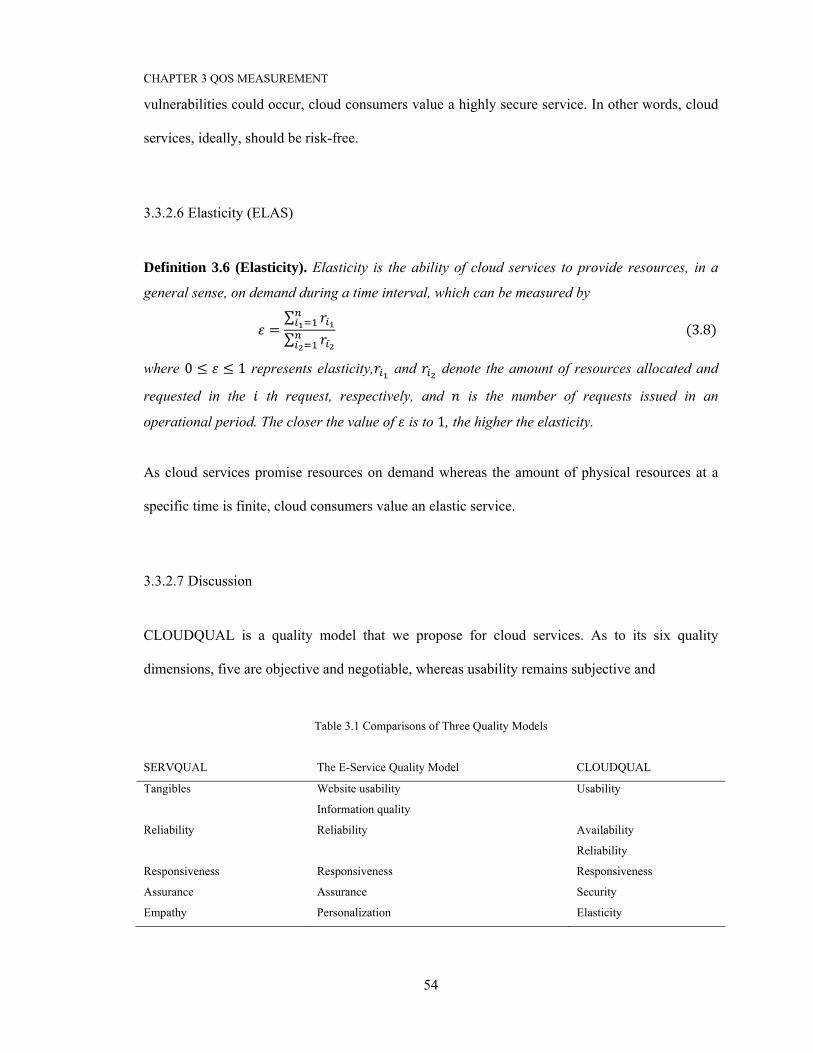
CHAPTER 3 QOS MEASUREMENT
54
vulnerabilities could occur, cloud consumers value a highly secure service. In other words, cloud
services, ideally, should be risk-free.
3.3.2.6 Elasticity (ELAS)
Definition 3.6 (Elasticity). Elasticity is the ability of cloud services to provide resources, in a
general sense, on demand during a time interval, which can be measured by = ∑∑ (3.8) where 0 ≤ ≤ 1 represents elasticity, and denote the amount of resources allocated and
requested in the th request, respectively, and is the number of requests issued in an
operational period. The closer the value of is to 1, the higher the elasticity.
As cloud services promise resources on demand whereas the amount of physical resources at a
specific time is finite, cloud consumers value an elastic service.
3.3.2.7 Discussion
CLOUDQUAL is a quality model that we propose for cloud services. As to its six quality
dimensions, five are objective and negotiable, whereas usability remains subjective and
Table 3.1 Comparisons of Three Quality Models
SERVQUAL The E-Service Quality Model CLOUDQUAL
Tangibles Website usability Usability
Information quality
Reliability Reliability Availability
Reliability
Responsiveness Responsiveness Responsiveness
Assurance Assurance Security
Empathy Personalization Elasticity
CHAPTER 3 QOS MEASUREMENT
55
nonnegotiable. Table 3.1 compares the quality dimensions of SERVQUAL, the e-service quality
model, and CLOUDQUAL.
While some quality dimensions of CLOUDQUAL like availability and reliability are used in
other papers, we take a new perspective on them in this thesis. Instead of a system perspective
assumed in most papers, we regard them from a service perspective, i.e., an end user’s viewpoint,
and redefine, accordingly, the quality dimensions and metrics. So, even if they are not brand-new,
they are from a new angle. Just as Albert Einstein (1938) pointed out in The Evolution of Physics,
“To raise new questions, new possibilities, to regard old problems from a new angle, requires
creative imagination and marks real advance in science”.
3.4 Empirical Case Studies
In this section, we first describe three real-world storage clouds, which serve as our case studies.
After that, we demonstrate how to use CLOUDQUAL to evaluate their quality. Last, we use the
three storage clouds to validate CLOUDQUAL.
3.4.1 Case Studies
Three well-known storage clouds, namely, Amazon S3, Microsoft Windows Azure Blob Storage
(Azure Blob), and Aliyun Open Storage Service (Aliyun OSS) are chosen as the case studies.
Amazon S3 is an online storage service launched in March 2006 by Amazon.com, Inc. It is used
to store and retrieve “any amount of data, at any time, from anywhere on the web” [8]. Amazon
S3 is intended for content storage and distribution, storage for data analysis, backup, archiving,
and disaster recovery. It is built to be “secure, reliable, scalable, fast, inexpensive, and simple”.
CHAPTER 3 QOS MEASUREMENT
56
Azure Blob is another online storage service released in February 2010 by Microsoft Corporation.
It is used to store “large amounts of unstructured data that can be accessed from anywhere in the
world via HTTP or HTTPS” [67]. Azure Blob is intended for serving images or documents
directly to a browser, storing files for distributed access, streaming video and audio, performing
secure backup and disaster recovery, and storing data for analysis by an on-premise or Windows
Azure-hosted service.
Aliyun OSS is yet another online storage service launched in July 2011 by Alibaba Group, whose
flagship company — Alibaba.com — is the world’s largest online business-to-business trading
platform. It offers “large-scale, secure, low-cost, highly reliable storage services”, which can be
accessed “at any time, in any place” [3]. Aliyun OSS is intended for storing large text, image,
video and audio files, and hosting websites. It is built to be “secure, reliable, elastic, cost-
efficient, and high-performance”.
3.4.2 Experimental Setup
All experiments are conducted on a Lenovo® ThinkCentre™ desktop with a 2.80 GHz Intel®
Pentium™ Dual-Core CPU and a 2.96 GB RAM, running Microsoft® Windows 7 Professional™
Operating System. The machine is located in Kingston, Ontario, Canada. Both Amazon S3 and
Azure Blob under test are in the US East, whereas Aliyun OSS is in eastern China. The Internet
connection is 100 Mbps. All operations are done by invoking the API methods of the three
storage clouds with Java programs implemented by us under NetBeans IDE 6.9.1 with JDK 6u21
[80].
It should be cautioned here that we do know the degree to which network distance has a negative
impact on quality dimensions like responsiveness and elasticity, especially for Aliyun OSS.
CHAPTER 3 QOS MEASUREMENT
57
However, for Amazon S3 and Azure Blob, which are both located in Virginia, we assume the
impact is minimal and can be ignored. For two reasons, we keep Aliyun OSS in our case studies.
First, we want to collect some data to validate CLOUDQUAL. Second, from a service
perspective, it is the quality delivered, not network distance, that matters to an end user. In other
words, a cloud consumer should not have to worry about the location of a cloud provider’s
physical machines. In fact, this is what the term “cloud” really means. If network distance or
performance does have a big impact, then the provider needs to consider moving “cloud”
resources closer to its customers or improving its network performance.
The experiments were conducted between 10 a.m. and 10 p.m. during 1 October 2012 to 31
October 2012. Four operations (i.e., upload, download, update, and delete) are performed each
day on Amazon S3, Azure Blob, and Aliyun OSS. The sizes of files under operation are 1 MB, 10
MB, 100 MB, 1GB or 10 GB. For a file of small size, a short operation can take a few seconds to
finish, whereas for a file of large size, a long operation may take more than one hour to complete.
So, the total number of operations that we can perform each day is limited. For each storage
cloud, the testing time is about three hours, and the total time nine to ten hours per day.
3.4.3 QoS Evaluation
We use CLOUDQUAL to evaluate the QoS offered by Amazon S3, Azure Blob, and Aliyun
OSS. As CLOUDQUAL targets general cloud services, its quality dimensions need to be refined
for storage clouds.
CHAPTER 3 QOS MEASUREMENT
58
3.4.3.1 USAB Evaluation
The first quality dimension, i.e., usability, assesses the ease of use and efficiency of a storage
cloud’s interface.
At the time of our experiments, Amazon S3 provided both an API for developers and a WUI for
web users. In fact, the Amazon Web Services (AWS) Software Developer’s Kit (SDK) for Java
provides a Java API for Amazon S3. With it, developers can get started in minutes with a single,
downloadable package that includes the AWS Java library, code samples, and documentation.
Amazon S3 also offers a WUI for web users. With it, users can easily perform Create, Read,
Update, and Delete (CRUD) operations on Amazon S3.
At the time of our experiments, Azure Blob provided an API for developers, but does not offer a
WUI or a GUI. Windows Azure SDK for Java provides a Java API for Azure Blob, which is quite
similar to AWS SDK for Java. To visualize the files stored in Azure Blob, a third-party GUI
called Azure Storage Explorer (ASE) can be installed. ASE allows users to perform CRUD
operations with a similar level of ease as Amazon S3.
At the time of our experiments, Aliyun OSS provided both an API for developers and a GUI for
end users. In fact, Aliyun SDK for Java provides a Java API for Aliyun OSS, which is quite
similar to AWS SDK for Java too. Aliyun OSS also offers a GUI called OSS Browser for end
users. With it, users can perform CRUD operations with the same level of enjoyment that
Amazon S3 can offer.
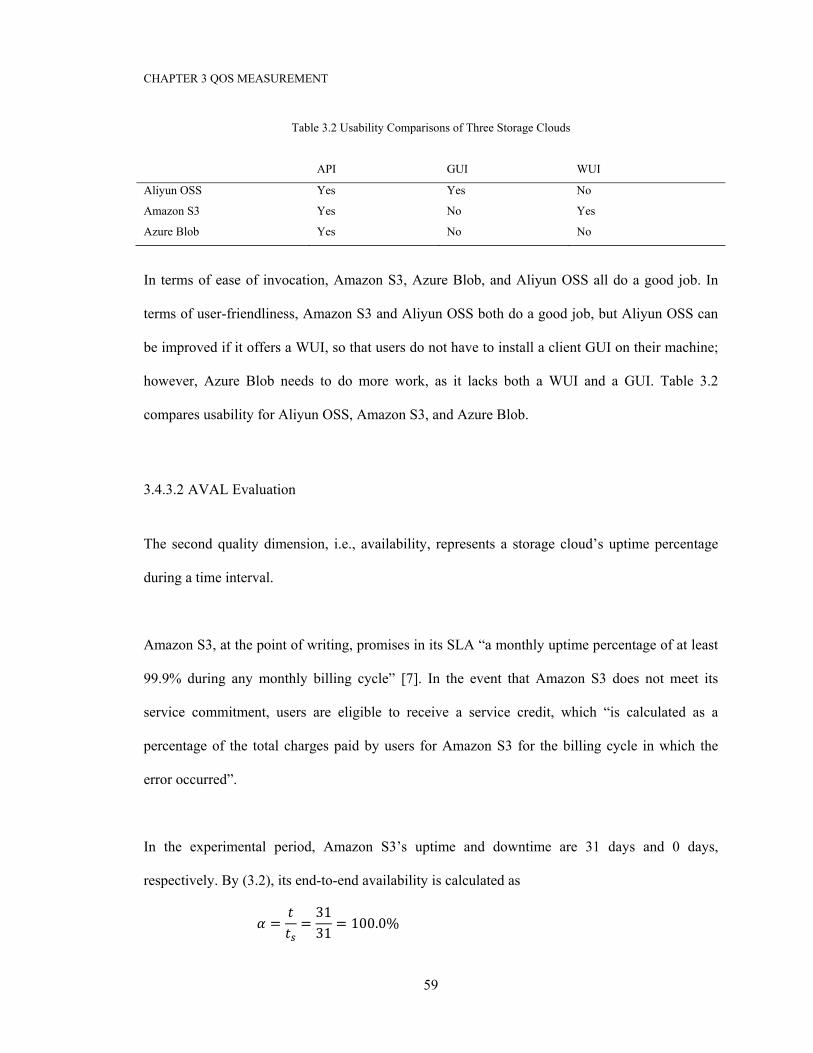
CHAPTER 3 QOS MEASUREMENT
59
Table 3.2 Usability Comparisons of Three Storage Clouds
API GUI WUI
Aliyun OSS Yes Yes No
Amazon S3 Yes No Yes
Azure Blob Yes No No
In terms of ease of invocation, Amazon S3, Azure Blob, and Aliyun OSS all do a good job. In
terms of user-friendliness, Amazon S3 and Aliyun OSS both do a good job, but Aliyun OSS can
be improved if it offers a WUI, so that users do not have to install a client GUI on their machine;
however, Azure Blob needs to do more work, as it lacks both a WUI and a GUI. Table 3.2
compares usability for Aliyun OSS, Amazon S3, and Azure Blob.
3.4.3.2 AVAL Evaluation
The second quality dimension, i.e., availability, represents a storage cloud’s uptime percentage
during a time interval.
Amazon S3, at the point of writing, promises in its SLA “a monthly uptime percentage of at least
99.9% during any monthly billing cycle” [7]. In the event that Amazon S3 does not meet its
service commitment, users are eligible to receive a service credit, which “is calculated as a
percentage of the total charges paid by users for Amazon S3 for the billing cycle in which the
error occurred”.
In the experimental period, Amazon S3’s uptime and downtime are 31 days and 0 days,
respectively. By (3.2), its end-to-end availability is calculated as
= = 3131 = 100.0%
CHAPTER 3 QOS MEASUREMENT
60
It should be mentioned that an availability of 100.0% means Amazon S3 fulfills its service
commitment, which is 30.97 days available in 31 days. It does not mean, however, that Amazon
S3 is always available in that period, since we observe it for about three hours per day, which is
still a short time window. However, it is sufficient for the purpose of illustration.
Azure Blob, at the point of writing, does not have a SLA available, and thus we have no
knowledge of its promised availability. In the experimental period, Azure Blob’s uptime and
downtime are 31 days and 0 days, respectively. So, its end-to-end availability is also 100.0%.
Aliyun OSS has a SLA available now, but it does not mention its availability there. So, we have
no information about it. In the experimental period, Aliyun OSS’s uptime and downtime are 31
days and 0 days, respectively. So, its end-to-end availability is 100.0% too.
3.4.3.3 REL Evaluation
The third quality dimension, i.e., reliability, means the assurance that a storage cloud is free from
hardware failures, software faults, and network outages.
Errors could occur when we perform CRUD operations on a storage cloud. In order to detect
them, we uploaded a zipped file of 1 GB from our desktop to Amazon S3 on 1 October 2012. It
takes 3,916,143 milliseconds, i.e., about 1.09 hours, to complete the operation. But that is not the
worst case at all, as it succeeds anyway. It should be cautioned that for such a long time
operation, a socket exception could occur.
In fact, we encountered a socket write error, when we uploaded the same zipped file of 1 GB to
Amazon S3 on 2 October 2012. The returned error message says, “The difference between the
CHAPTER 3 QOS MEASUREMENT
61
request time and the current time is too large”. Unfortunately, Amazon S3 may not be responsible
for such an error, as the error type is labelled as “Client”, neither “InternalError” nor
“ServiceUnavailable” that is stipulated in its SLA. However, that would not be fair to an end user.
For such an operation, it is reasonable to expect that it takes a long time to complete. But Amazon
S3 rejects the request and asks the user to assume the responsibility, just because “the request
time is too skewed”. Anyway, no matter who should take the responsibility, such an error could
cause users to experience frustration and dissatisfaction.
To stress-test its reliability, in the experimental period, we perform four operations (i.e., upload,
download, update, and delete) on Amazon S3 with four zipped files (i.e., 1 MB, 10 MB, 100 MB,
and 1 GB files). To our surprise, we encounter at least one failure on 26 out of 31 days, when we
perform the four operations on the 1 GB file. No failures occur on the other three files. By (3.3),
the end-to-end reliability of Amazon S3 is determined as
= 1 − = 1 − 774 × 4 × 31 = 84.5%
on the four files, where = 77 and = 4 × 4 × 31, and 100% on the first three files. It should
be noted that a reliability of 84.5% here does not mean that Amazon S3 is responsible for all the
errors that occur, since some errors are labelled as the “Client” side.
In our experiments, Azure Blob seems more reliable than Amazon S3. However, we still
encountered a failure, when we updated a zipped file of 10 GB on Azure Blob on 3 October 2012.
The returned message says that an exception occurs without more details about it. As Azure Blob
does not have a SLA to stipulate the exception, we are not sure who should be responsible for the
failure.
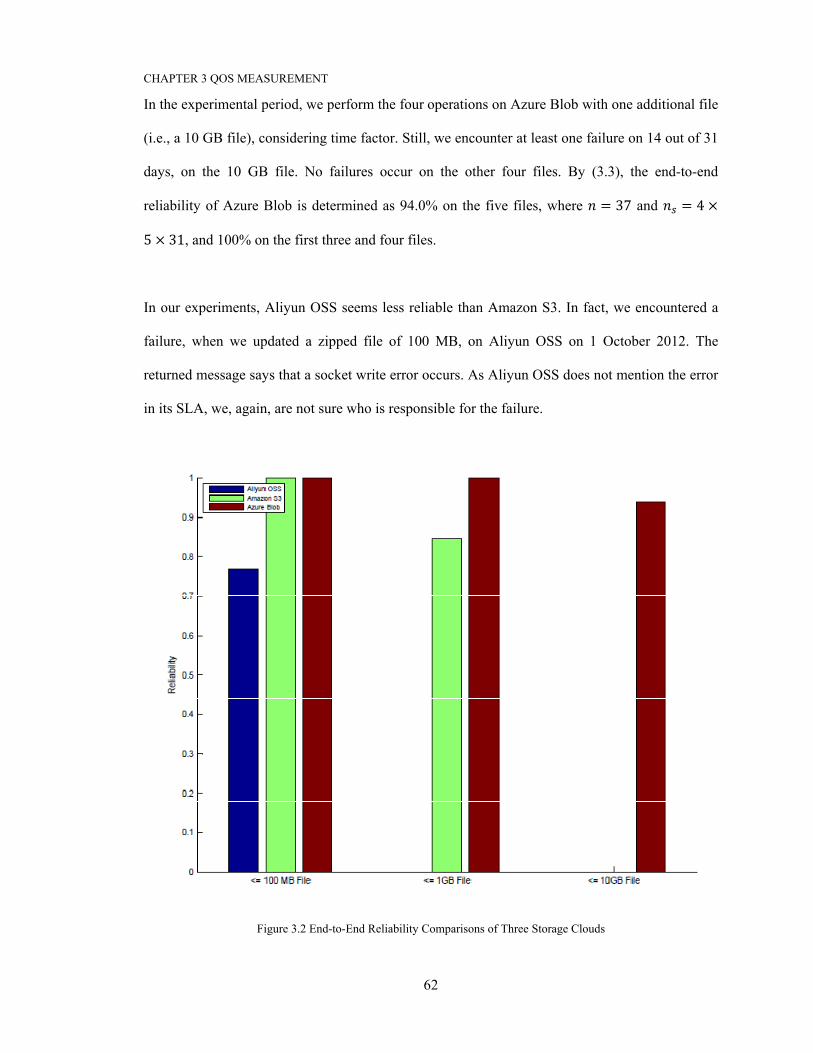
CHAPTER 3 QOS MEASUREMENT
62
In the experimental period, we perform the four operations on Azure Blob with one additional file
(i.e., a 10 GB file), considering time factor. Still, we encounter at least one failure on 14 out of 31
days, on the 10 GB file. No failures occur on the other four files. By (3.3), the end-to-end
reliability of Azure Blob is determined as 94.0% on the five files, where = 37 and = 4 ×5 × 31, and 100% on the first three and four files.
In our experiments, Aliyun OSS seems less reliable than Amazon S3. In fact, we encountered a
failure, when we updated a zipped file of 100 MB, on Aliyun OSS on 1 October 2012. The
returned message says that a socket write error occurs. As Aliyun OSS does not mention the error
in its SLA, we, again, are not sure who is responsible for the failure.
Figure 3.2 End-to-End Reliability Comparisons of Three Storage Clouds
CHAPTER 3 QOS MEASUREMENT
63
In the experimental period, we perform the four operations on Aliyun OSS with one less file (i.e.,
the 1 GB file), due to time limitations. Still, we encounter at least one failure on 27 out of 31
days, on the 100 MB file. No failures occur on the other two files. By (3.3), the end-to-end
reliability of Aliyun OSS is determined as 76.9% on the three files, where = 86 and = 4 ×3 × 31.
The failures that occur in Azure Blob and Aliyun OSS could incur potential disputes between
cloud providers and cloud consumers, since the exceptions are not stipulated in a SLA. It should
be cautioned here that the failures that occur in the three storage clouds are not from the network
outages, nor are they from hardware failures. It is the way in which a storage cloud handles a
long-time operation that causes the exceptions. So, the failures are from the storage clouds, even
if their storage systems do not fail in that period. Figure 3.2 compares end-to-end reliability for
Aliyun OSS, Amazon S3, and Azure Blob.
3.4.3.4 RESP Evaluation
The fourth quality dimension, i.e., responsiveness, indicates the promptness with which a storage
cloud’s user completes a CRUD operation.
Upload, download, and delete operations are examined below to illustrate responsiveness.
Assume here that the maximum acceptable time to complete each operation is 500 seconds. First,
we perform an upload operation on Amazon S3. In the experimental period, we transfer a zipped
file of 10 MB from our desktop to Amazon S3. It takes 38.940 seconds on average with a
standard deviation of 3.565 to complete the operation. By (3.4), Amazon S3’s end-to-end
responsiveness is calculated as
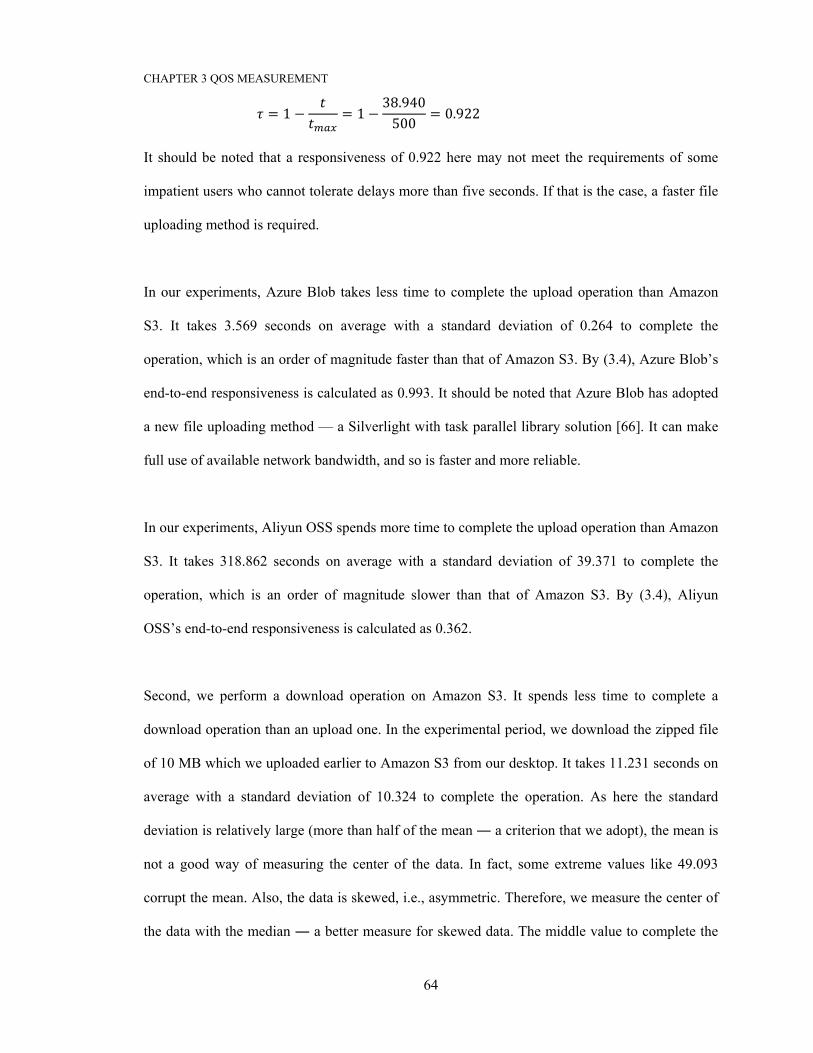
CHAPTER 3 QOS MEASUREMENT
64
= 1 − = 1 − 38.940500 = 0.922
It should be noted that a responsiveness of 0.922 here may not meet the requirements of some
impatient users who cannot tolerate delays more than five seconds. If that is the case, a faster file
uploading method is required.
In our experiments, Azure Blob takes less time to complete the upload operation than Amazon
S3. It takes 3.569 seconds on average with a standard deviation of 0.264 to complete the
operation, which is an order of magnitude faster than that of Amazon S3. By (3.4), Azure Blob’s
end-to-end responsiveness is calculated as 0.993. It should be noted that Azure Blob has adopted
a new file uploading method — a Silverlight with task parallel library solution [66]. It can make
full use of available network bandwidth, and so is faster and more reliable.
In our experiments, Aliyun OSS spends more time to complete the upload operation than Amazon
S3. It takes 318.862 seconds on average with a standard deviation of 39.371 to complete the
operation, which is an order of magnitude slower than that of Amazon S3. By (3.4), Aliyun
OSS’s end-to-end responsiveness is calculated as 0.362.
Second, we perform a download operation on Amazon S3. It spends less time to complete a
download operation than an upload one. In the experimental period, we download the zipped file
of 10 MB which we uploaded earlier to Amazon S3 from our desktop. It takes 11.231 seconds on
average with a standard deviation of 10.324 to complete the operation. As here the standard
deviation is relatively large (more than half of the mean ― a criterion that we adopt), the mean is
not a good way of measuring the center of the data. In fact, some extreme values like 49.093
corrupt the mean. Also, the data is skewed, i.e., asymmetric. Therefore, we measure the center of
the data with the median ― a better measure for skewed data. The middle value to complete the

CHAPTER 3 QOS MEASUREMENT
65
operation is 7.254 seconds, which is faster by a factor of 5 than the mean of an upload operation.
By (3.4), Amazon S3’s end-to-end responsiveness, for the download operation, is determined as
0.985.
In our experiments, Azure Blob spends less time to complete the download operation than
Amazon S3. It takes 2.586 seconds on average with a standard deviation of 0.677 to complete the
operation, which is faster by a factor of 3 than the median of Amazon S3. By (3.4), Azure Blob’s
end-to-end responsiveness, for the download operation, is determined as 0.995.
In our experiments, Aliyun OSS spends much more time to complete the download operation
than Amazon S3. It takes 229.943 seconds on average with a standard deviation of 356.000 to
complete the operation. As the standard deviation is relatively large, we measure the center of the
data with the median. The middle value to complete the operation is 33.208 seconds, which is
slower by a factor of 5 than that of Amazon S3. By (3.4), Aliyun OSS’s end-to-end
responsiveness, for the download operation, is determined as 0.934.
Third, we perform a delete operation on Amazon S3. It spends much less time to complete a
delete operation than an upload one. In the experimental period, we delete the zipped file of 10
MB which we uploaded earlier to Amazon S3. It takes 0.200 seconds on average with a standard
deviation of 0.265 to complete the operation. As the standard deviation is relatively large, we
measure the center of the data with the median. The middle value to complete the operation is
0.078 seconds. By (3.4), Amazon S3’s end-to-end responsiveness, for the delete operation, is
calculated as 1.000.
In our experiments, Azure Blob spends the same time to complete the delete operation as Amazon
S3. It takes 0.078 seconds on average with a standard deviation of 0.014 to complete the

CHAPTER 3 QOS MEASUREMENT
66
operation. By (3.4), Azure Blob’s end-to-end responsiveness, for the delete operation, is also
calculated as 1.000.
In our experiments, Aliyun OSS spends more time to complete the delete operation than Amazon
S3. It takes 2.365 seconds on average with a standard deviation of 4.493 to complete the
operation. As the standard deviation is relatively large, we measure the center of the data with the
median. The middle value to complete the operation is 1.272 seconds, which is slower by a factor
of 16 than that of Amazon S3. By (3.4), Aliyun OSS’s end-to-end responsiveness, for the delete
operation, is calculated as 0.997. Figure 3.3 shows the end-to-end responsiveness reached in
completing the upload, download, and delete operations for the three storage clouds. For the ease
Figure 3.3 End-to-End Responsiveness Comparisons of CRUD Operations
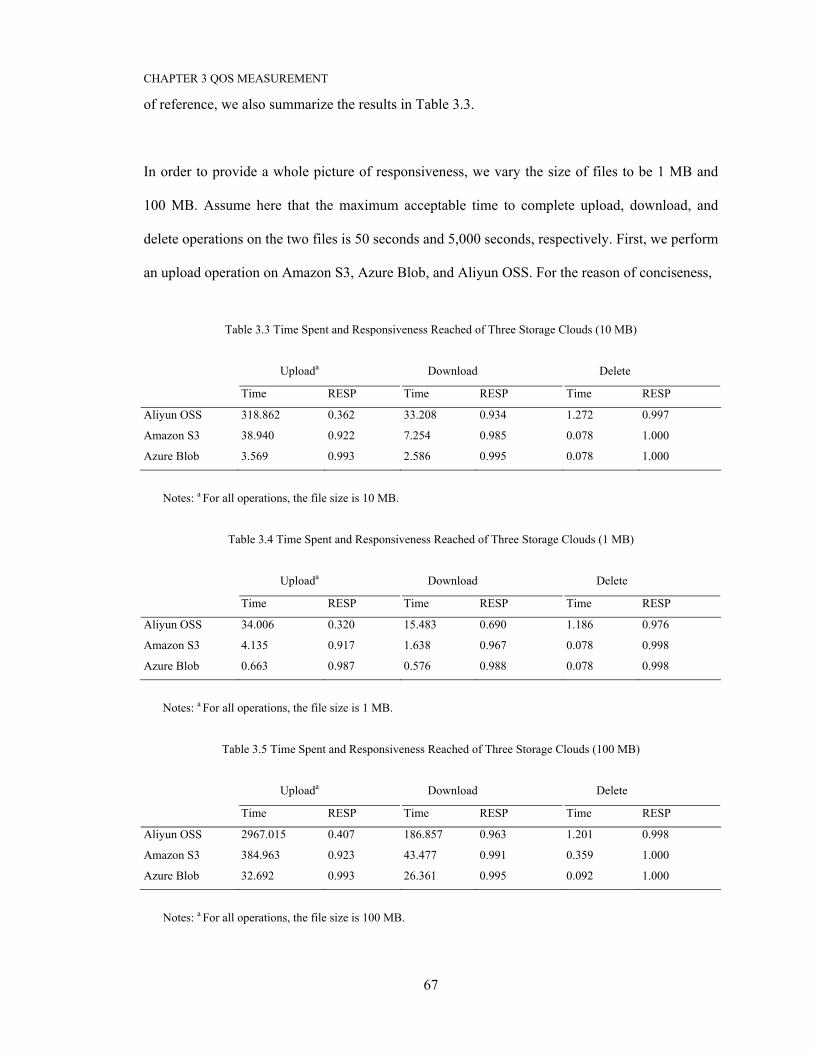
CHAPTER 3 QOS MEASUREMENT
67
of reference, we also summarize the results in Table 3.3.
In order to provide a whole picture of responsiveness, we vary the size of files to be 1 MB and
100 MB. Assume here that the maximum acceptable time to complete upload, download, and
delete operations on the two files is 50 seconds and 5,000 seconds, respectively. First, we perform
an upload operation on Amazon S3, Azure Blob, and Aliyun OSS. For the reason of conciseness,
Table 3.3 Time Spent and Responsiveness Reached of Three Storage Clouds (10 MB)
Uploada Download Delete
Time RESP Time RESP Time RESP
Aliyun OSS 318.862 0.362 33.208 0.934 1.272 0.997
Amazon S3 38.940 0.922 7.254 0.985 0.078 1.000
Azure Blob 3.569 0.993 2.586 0.995 0.078 1.000
Notes: a For all operations, the file size is 10 MB.
Table 3.4 Time Spent and Responsiveness Reached of Three Storage Clouds (1 MB)
Uploada Download Delete
Time RESP Time RESP Time RESP
Aliyun OSS 34.006 0.320 15.483 0.690 1.186 0.976
Amazon S3 4.135 0.917 1.638 0.967 0.078 0.998
Azure Blob 0.663 0.987 0.576 0.988 0.078 0.998
Notes: a For all operations, the file size is 1 MB.
Table 3.5 Time Spent and Responsiveness Reached of Three Storage Clouds (100 MB)
Uploada Download Delete
Time RESP Time RESP Time RESP
Aliyun OSS 2967.015 0.407 186.857 0.963 1.201 0.998
Amazon S3 384.963 0.923 43.477 0.991 0.359 1.000
Azure Blob 32.692 0.993 26.361 0.995 0.092 1.000
Notes: a For all operations, the file size is 100 MB.
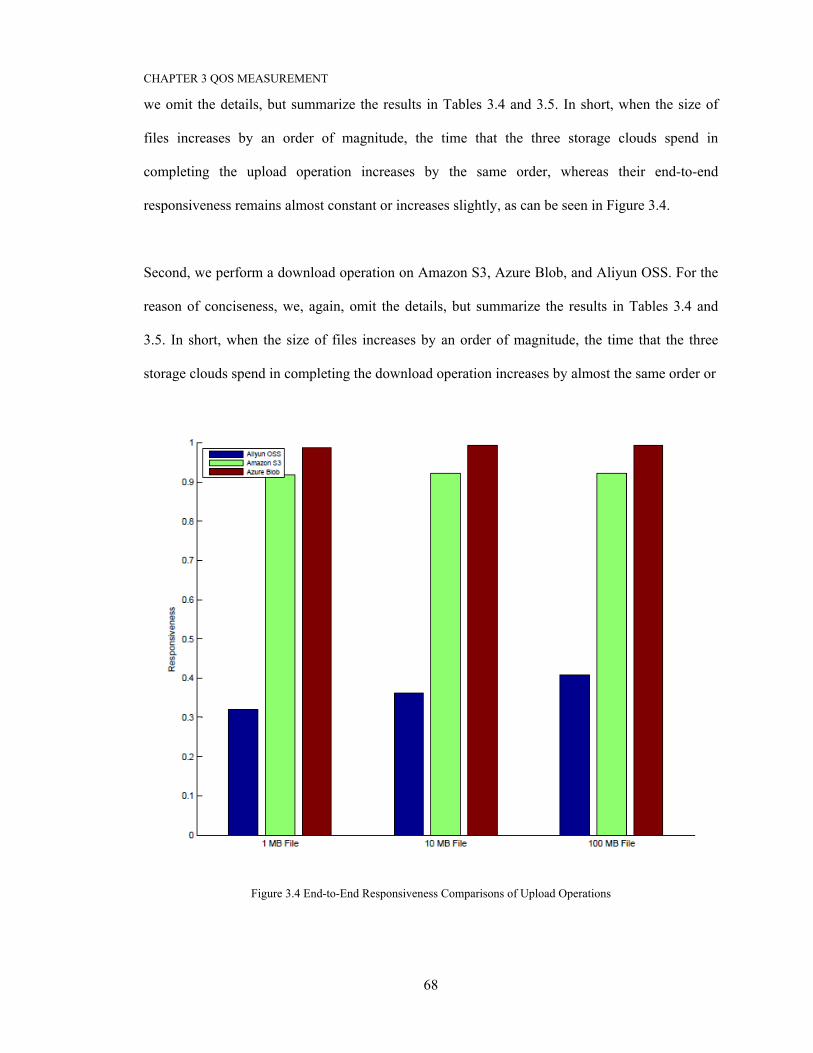
CHAPTER 3 QOS MEASUREMENT
68
we omit the details, but summarize the results in Tables 3.4 and 3.5. In short, when the size of
files increases by an order of magnitude, the time that the three storage clouds spend in
completing the upload operation increases by the same order, whereas their end-to-end
responsiveness remains almost constant or increases slightly, as can be seen in Figure 3.4.
Second, we perform a download operation on Amazon S3, Azure Blob, and Aliyun OSS. For the
reason of conciseness, we, again, omit the details, but summarize the results in Tables 3.4 and
3.5. In short, when the size of files increases by an order of magnitude, the time that the three
storage clouds spend in completing the download operation increases by almost the same order or
Figure 3.4 End-to-End Responsiveness Comparisons of Upload Operations
CHAPTER 3 QOS MEASUREMENT
69
less, whereas their end-to-end responsiveness remains almost constant or increases slightly, as
can be seen in Figure 3.5.
Third, we perform a delete operation on Amazon S3, Azure Blob, and Aliyun OSS. For the
reason of conciseness, we, once again, omit the details, but summarize the results in Tables 3.4
and 3.5. In short, when the size of files increases by an order of magnitude, the time that the three
storage clouds spend in completing the delete operation varies, but not significantly, whereas
their end-to-end responsiveness remains almost constant, as can be seen in Figure 3.6.
Figure 3.5 End-to-End Responsiveness Comparisons of Download Operations
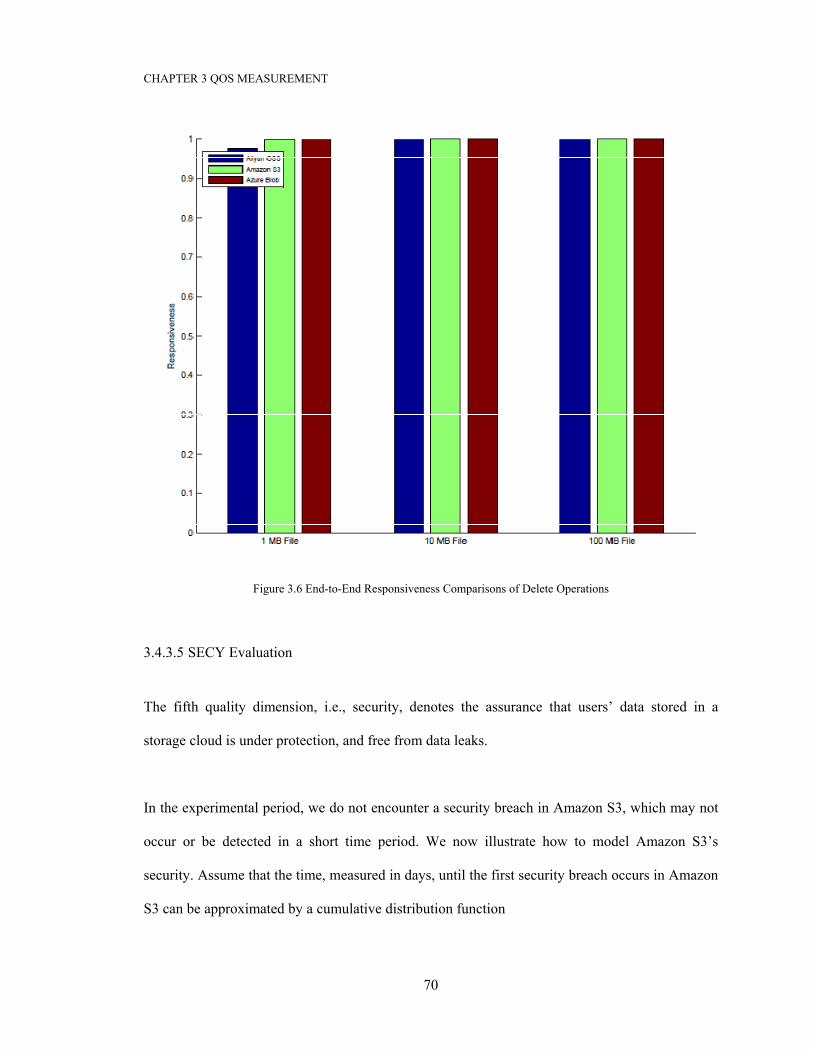
CHAPTER 3 QOS MEASUREMENT
70
Figure 3.6 End-to-End Responsiveness Comparisons of Delete Operations
3.4.3.5 SECY Evaluation
The fifth quality dimension, i.e., security, denotes the assurance that users’ data stored in a
storage cloud is under protection, and free from data leaks.
In the experimental period, we do not encounter a security breach in Amazon S3, which may not
occur or be detected in a short time period. We now illustrate how to model Amazon S3’s
security. Assume that the time, measured in days, until the first security breach occurs in Amazon
S3 can be approximated by a cumulative distribution function
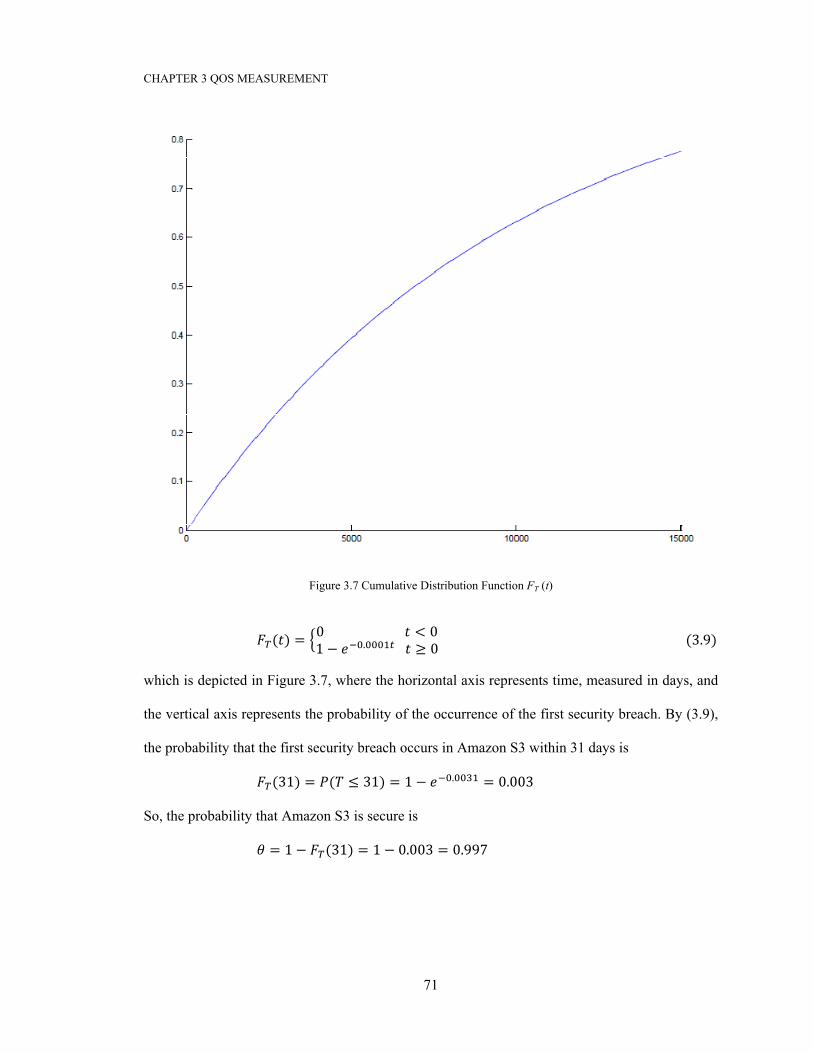
CHAPTER 3 QOS MEASUREMENT
71
Figure 3.7 Cumulative Distribution Function FT (t)
( ) = 0 < 01 − . ≥ 0(3.9) which is depicted in Figure 3.7, where the horizontal axis represents time, measured in days, and
the vertical axis represents the probability of the occurrence of the first security breach. By (3.9),
the probability that the first security breach occurs in Amazon S3 within 31 days is (31) = ( ≤ 31) = 1 − . = 0.003
So, the probability that Amazon S3 is secure is = 1 − (31) = 1 − 0.003 = 0.997
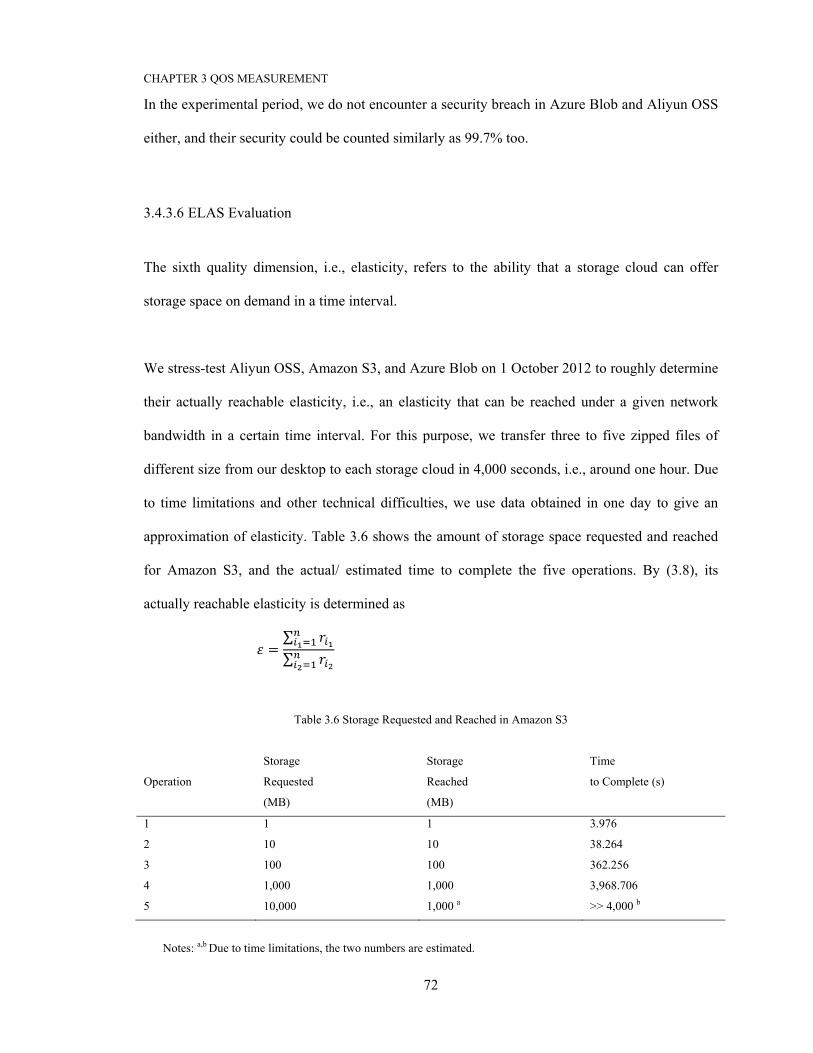
CHAPTER 3 QOS MEASUREMENT
72
In the experimental period, we do not encounter a security breach in Azure Blob and Aliyun OSS
either, and their security could be counted similarly as 99.7% too.
3.4.3.6 ELAS Evaluation
The sixth quality dimension, i.e., elasticity, refers to the ability that a storage cloud can offer
storage space on demand in a time interval.
We stress-test Aliyun OSS, Amazon S3, and Azure Blob on 1 October 2012 to roughly determine
their actually reachable elasticity, i.e., an elasticity that can be reached under a given network
bandwidth in a certain time interval. For this purpose, we transfer three to five zipped files of
different size from our desktop to each storage cloud in 4,000 seconds, i.e., around one hour. Due
to time limitations and other technical difficulties, we use data obtained in one day to give an
approximation of elasticity. Table 3.6 shows the amount of storage space requested and reached
for Amazon S3, and the actual/ estimated time to complete the five operations. By (3.8), its
actually reachable elasticity is determined as
= ∑∑
Table 3.6 Storage Requested and Reached in Amazon S3
Operation
Storage
Requested
(MB)
Storage
Reached
(MB)
Time
to Complete (s)
1 1 1 3.976
2 10 10 38.264
3 100 100 362.256
4 1,000 1,000 3,968.706
5 10,000 1,000 a >> 4,000 b
Notes: a,b Due to time limitations, the two numbers are estimated.
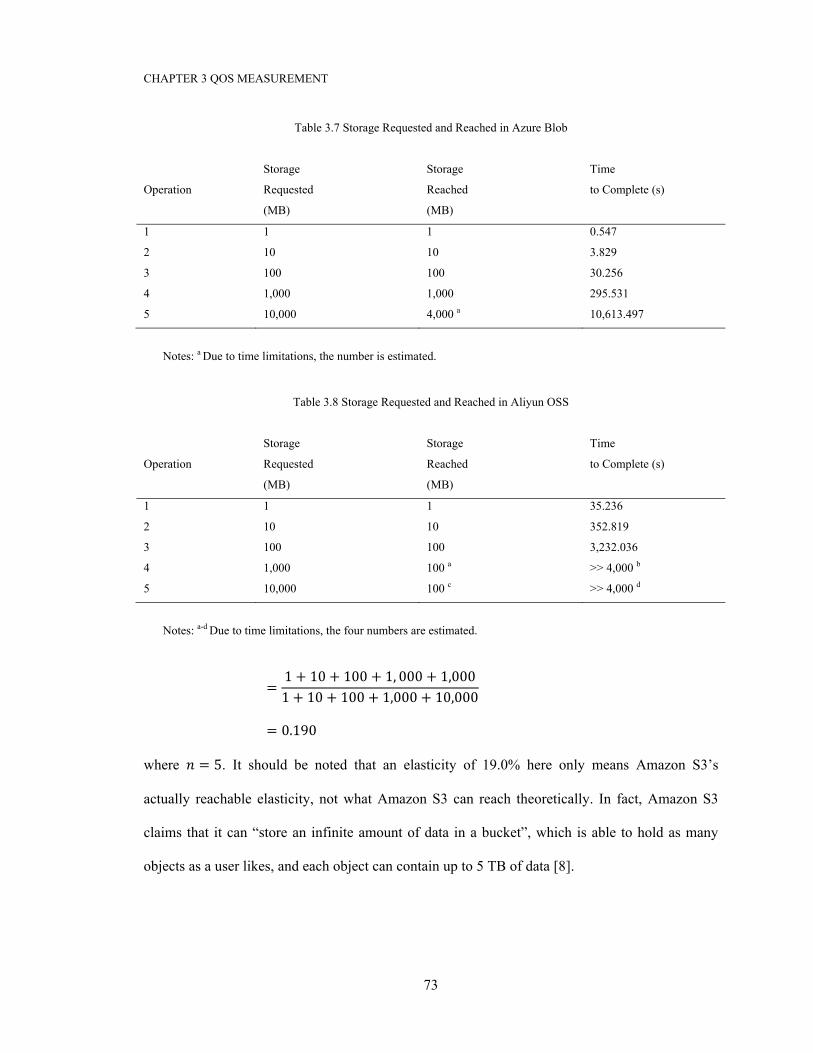
CHAPTER 3 QOS MEASUREMENT
73
Table 3.7 Storage Requested and Reached in Azure Blob
Operation
Storage
Requested
(MB)
Storage
Reached
(MB)
Time
to Complete (s)
1 1 1 0.547
2 10 10 3.829
3 100 100 30.256
4 1,000 1,000 295.531
5 10,000 4,000 a 10,613.497
Notes: a Due to time limitations, the number is estimated.
Table 3.8 Storage Requested and Reached in Aliyun OSS
Operation
Storage
Requested
(MB)
Storage
Reached
(MB)
Time
to Complete (s)
1 1 1 35.236
2 10 10 352.819
3 100 100 3,232.036
4 1,000 100 a >> 4,000 b
5 10,000 100 c >> 4,000 d
Notes: a-d Due to time limitations, the four numbers are estimated.
= 1 + 10 + 100 + 1, 000 + 1,0001 + 10 + 100 + 1,000 + 10,000
= 0.190
where = 5. It should be noted that an elasticity of 19.0% here only means Amazon S3’s
actually reachable elasticity, not what Amazon S3 can reach theoretically. In fact, Amazon S3
claims that it can “store an infinite amount of data in a bucket”, which is able to hold as many
objects as a user likes, and each object can contain up to 5 TB of data [8].
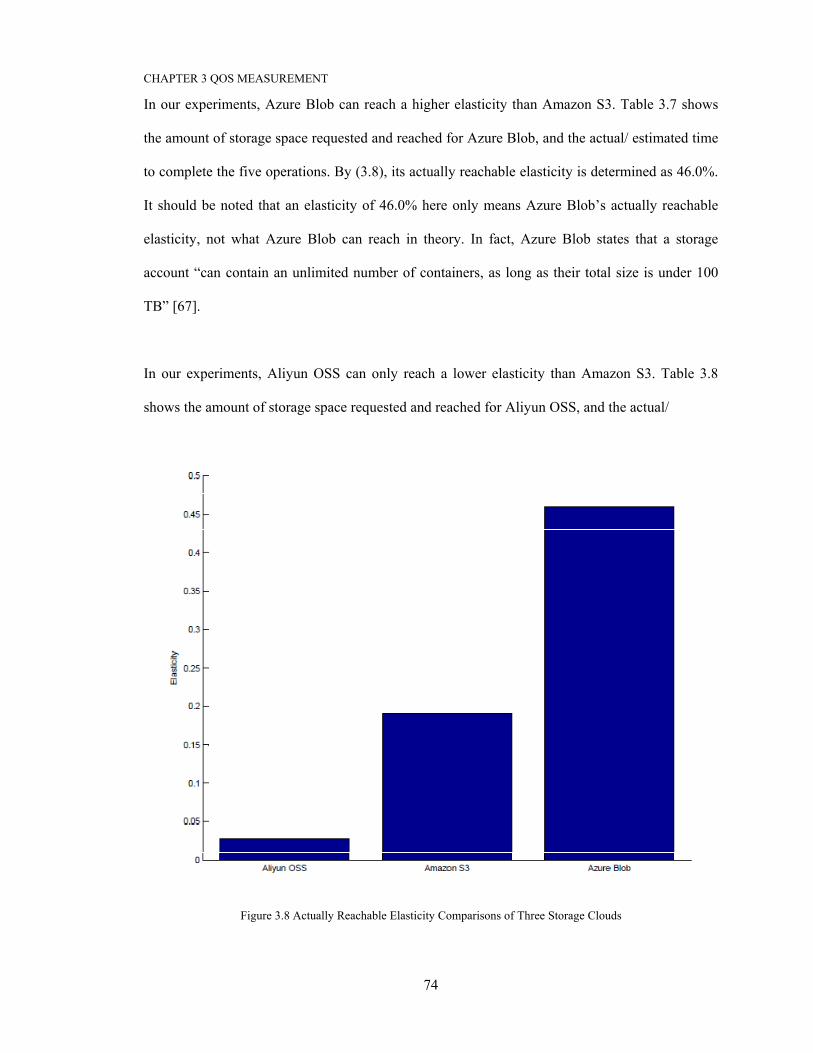
CHAPTER 3 QOS MEASUREMENT
74
In our experiments, Azure Blob can reach a higher elasticity than Amazon S3. Table 3.7 shows
the amount of storage space requested and reached for Azure Blob, and the actual/ estimated time
to complete the five operations. By (3.8), its actually reachable elasticity is determined as 46.0%.
It should be noted that an elasticity of 46.0% here only means Azure Blob’s actually reachable
elasticity, not what Azure Blob can reach in theory. In fact, Azure Blob states that a storage
account “can contain an unlimited number of containers, as long as their total size is under 100
TB” [67].
In our experiments, Aliyun OSS can only reach a lower elasticity than Amazon S3. Table 3.8
shows the amount of storage space requested and reached for Aliyun OSS, and the actual/
Figure 3.8 Actually Reachable Elasticity Comparisons of Three Storage Clouds
CHAPTER 3 QOS MEASUREMENT
75
estimated time to complete the five operations. By (3.8), its actually reachable elasticity is
determined as 2.8%. It should be noted that an elasticity of 2.8% here only means Aliyun OSS’s
actually reachable elasticity, not what Aliyun OSS can reach theoretically. In fact, Aliyun OSS
claims that it can “offer an infinite amount of storage space” [3]. Figure 3.8 compares actually
reachable elasticity for Aliyun OSS, Amazon S3, and Azure Blob.
3.5 Metrics Validation
In this section, we validate CLOUDQUAL based on the empirical data that we present in Section
3.4. In other words, we want to determine whether our quality model can differentiate service
quality, in terms of the quality dimensions and metrics specified in CLOUDQUAL. The technical
standard that we adopt to validate CLOUDQUAL is IEEE Std 1061TM-1998 (R2009) (i.e., IEEE
Standard for a Software Quality Metrics Methodology). The standard provides “a methodology
for establishing quality requirements and identifying, implementing, analyzing, and validating
process and product software quality metrics” [44]. It “applies to all software at all phases of any
software life cycle”, and aims for “measuring or assessing the quality of software”. In particular,
a metric should have a high degree of association with the quality dimension that it represents in
order to be considered valid. As a result, we are concerned with three validity criteria specified in
the standard, i.e., correlation, consistency, and discriminative power. Below, we first detail the
three validity criteria. After that, we illustrate how to validate CLOUDQUAL with them.
CHAPTER 3 QOS MEASUREMENT
76
3.5.1 Validity Criteria
3.5.1.1 Correlation
Let be the linear correlation coefficient between a quality dimension and a metric. The
correlation criterion requires that the variation in the quality dimension values explained by the
variation in the metric values, i.e., , should exceed a predefined threshold . In fact, this
criterion assesses whether a sufficiently strong linear association exists between a quality
dimension and a metric, such that the metric can be used as an indicator for the quality
dimension.
3.5.1.2 Consistency
Let be the rank correlation coefficient of paired values of a quality dimension and a metric,
where a quality dimension and a metric pair is measured for the same service. The consistency
criterion requires that the absolute value of should exceed a predefined threshold . In fact, this
criterion assesses whether a metric can accurately rank a set of services by a quality dimension.
More specifically, if quality dimension values , , … , of services 1, 2, … , , respectively,
have the relationship > > ⋯ > , then the relationship > > ⋯ > should hold
for the metric values. In other words, the rank of the metric values should be consistent with that
of the quality dimension values.
CHAPTER 3 QOS MEASUREMENT
77
3.5.1.3 Discriminative Power
Let be a confidence level. Use a contingency table to hold quality dimension and metric values,
and compute the chi-square ( ) statistic. The discriminative power criterion requires that this
value should exceed the chi-square statistic corresponding to . In fact, this criterion assesses
whether a metric can separate a set of high-quality services from a set of low-quality ones by a
quality dimension. In other words, the set of metric values of the former should be significantly
higher (or lower) than those of the latter.
3.5.2 Metrics Validation
The empirical data, which we present in Section 3.4, is used to validate quality metrics specified
in CLOUDQUAL, with the three validity criteria described above. Here, we show the validation
for one quality dimension, and the remaining ones are validated in a similar manner.
We first validate RESP with the correlation criterion, where is a threshold of square of the
linear correlation coefficient (0 ≤ ≤ 1). For ease of reference, we show, again, the time that
Aliyun OSS, Amazon S3, and Azure Blob spent and the responsiveness reached in completing
upload, download, and delete operations in Table 3.9, where the file size is 10 MB. From (3.4),
we find that the time metric calculated by function and the responsiveness are negatively
linearly related, and thus their correlation coefficient = −1. It follows that = 1. As 0 ≤ ≤ 1, we always have ≥ , no matter what value is. So, correlation between the time
metric and the responsiveness is confirmed. ∎
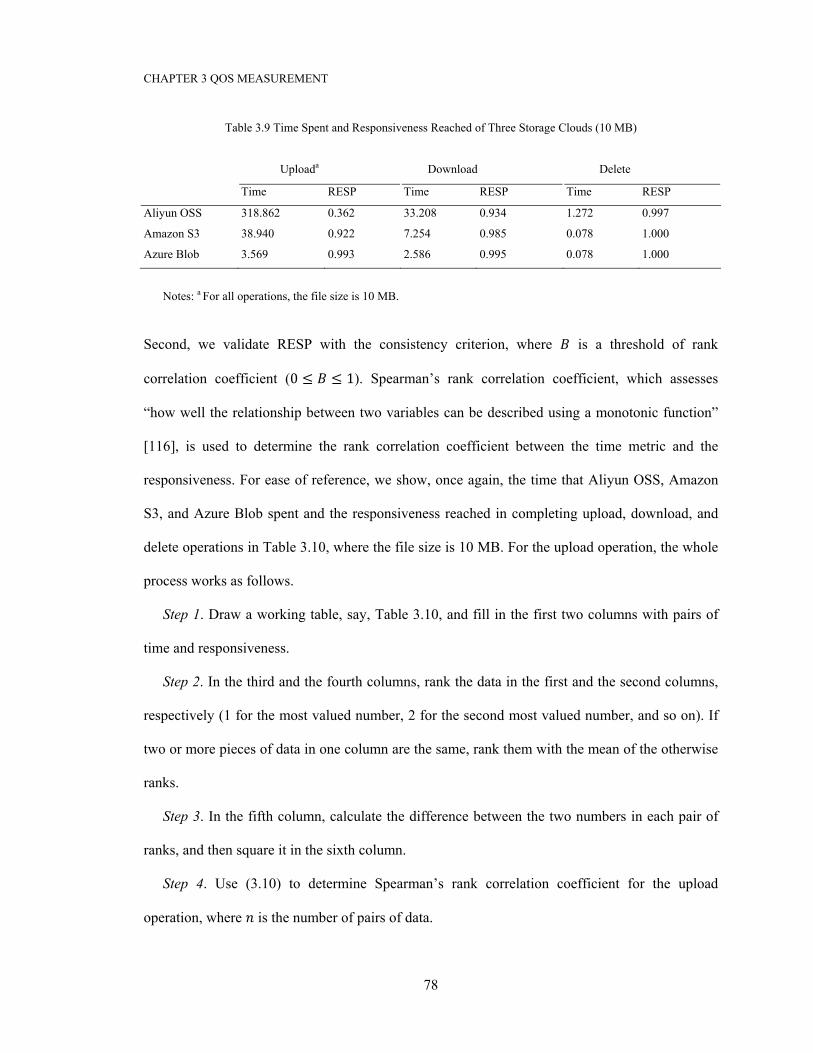
CHAPTER 3 QOS MEASUREMENT
78
Table 3.9 Time Spent and Responsiveness Reached of Three Storage Clouds (10 MB)
Uploada Download Delete
Time RESP Time RESP Time RESP
Aliyun OSS 318.862 0.362 33.208 0.934 1.272 0.997
Amazon S3 38.940 0.922 7.254 0.985 0.078 1.000
Azure Blob 3.569 0.993 2.586 0.995 0.078 1.000
Notes: a For all operations, the file size is 10 MB.
Second, we validate RESP with the consistency criterion, where is a threshold of rank
correlation coefficient (0 ≤ ≤ 1). Spearman’s rank correlation coefficient, which assesses
“how well the relationship between two variables can be described using a monotonic function”
[116], is used to determine the rank correlation coefficient between the time metric and the
responsiveness. For ease of reference, we show, once again, the time that Aliyun OSS, Amazon
S3, and Azure Blob spent and the responsiveness reached in completing upload, download, and
delete operations in Table 3.10, where the file size is 10 MB. For the upload operation, the whole
process works as follows.
Step 1. Draw a working table, say, Table 3.10, and fill in the first two columns with pairs of
time and responsiveness.
Step 2. In the third and the fourth columns, rank the data in the first and the second columns,
respectively (1 for the most valued number, 2 for the second most valued number, and so on). If
two or more pieces of data in one column are the same, rank them with the mean of the otherwise
ranks.
Step 3. In the fifth column, calculate the difference between the two numbers in each pair of
ranks, and then square it in the sixth column.
Step 4. Use (3.10) to determine Spearman’s rank correlation coefficient for the upload
operation, where is the number of pairs of data.
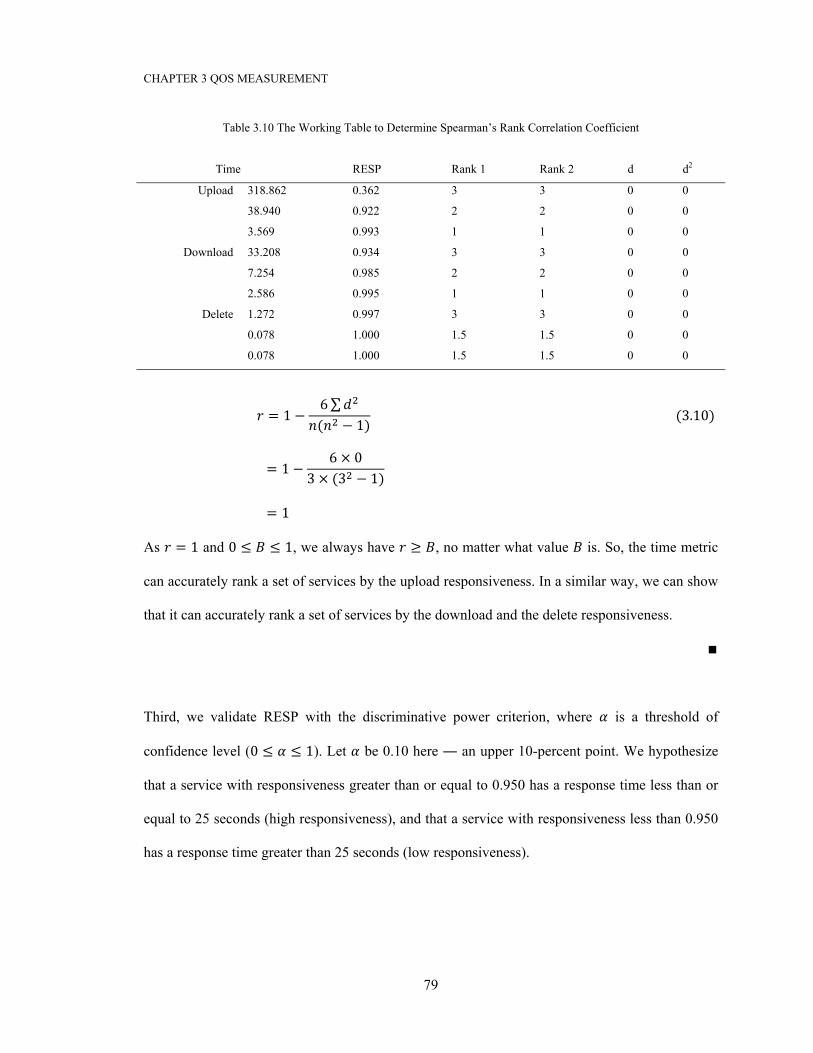
CHAPTER 3 QOS MEASUREMENT
79
Table 3.10 The Working Table to Determine Spearman’s Rank Correlation Coefficient
Time RESP Rank 1 Rank 2 d d2
Upload 318.862 0.362 3 3 0 0
38.940 0.922 2 2 0 0
3.569 0.993 1 1 0 0
Download 33.208 0.934 3 3 0 0
7.254 0.985 2 2 0 0
2.586 0.995 1 1 0 0
Delete 1.272 0.997 3 3 0 0
0.078 1.000 1.5 1.5 0 0
0.078 1.000 1.5 1.5 0 0
= 1 − 6∑( − 1)(3.10) = 1 − 6 × 03 × (3 − 1) = 1
As = 1 and 0 ≤ ≤ 1, we always have ≥ , no matter what value is. So, the time metric
can accurately rank a set of services by the upload responsiveness. In a similar way, we can show
that it can accurately rank a set of services by the download and the delete responsiveness. ∎
Third, we validate RESP with the discriminative power criterion, where is a threshold of
confidence level (0 ≤ ≤ 1). Let be 0.10 here ― an upper 10-percent point. We hypothesize
that a service with responsiveness greater than or equal to 0.950 has a response time less than or
equal to 25 seconds (high responsiveness), and that a service with responsiveness less than 0.950
has a response time greater than 25 seconds (low responsiveness).
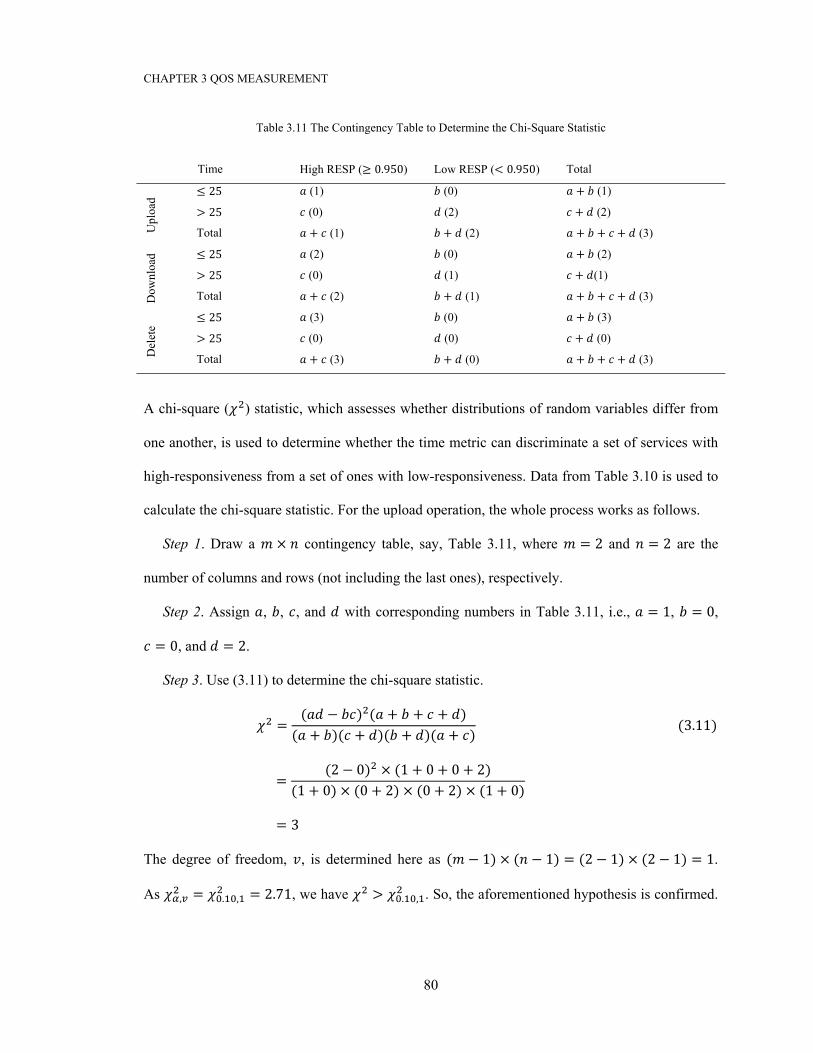
CHAPTER 3 QOS MEASUREMENT
80
Table 3.11 The Contingency Table to Determine the Chi-Square Statistic
Time High RESP (≥ 0.950) Low RESP (< 0.950) Total U
ploa
d
≤ 25 (1) (0) + (1) > 25 (0) (2) + (2)
Total + (1) + (2) + + + (3)
Dow
nloa
d ≤ 25 (2) (0) + (2) > 25 (0) (1) + (1)
Total + (2) + (1) + + + (3)
Del
ete
≤ 25 (3) (0) + (3) > 25 (0) (0) + (0)
Total + (3) + (0) + + + (3)
A chi-square ( ) statistic, which assesses whether distributions of random variables differ from
one another, is used to determine whether the time metric can discriminate a set of services with
high-responsiveness from a set of ones with low-responsiveness. Data from Table 3.10 is used to
calculate the chi-square statistic. For the upload operation, the whole process works as follows.
Step 1. Draw a × contingency table, say, Table 3.11, where = 2 and = 2 are the
number of columns and rows (not including the last ones), respectively.
Step 2. Assign , , , and with corresponding numbers in Table 3.11, i.e., = 1, = 0, = 0, and = 2.
Step 3. Use (3.11) to determine the chi-square statistic.
= ( − ) ( + + + )( + )( + )( + )( + )(3.11) = (2 − 0) × (1 + 0 + 0 + 2)(1 + 0) × (0 + 2) × (0 + 2) × (1 + 0) = 3
The degree of freedom, , is determined here as ( − 1) × ( − 1) = (2 − 1) × (2 − 1) = 1.
As , = . , = 2.71, we have > . , . So, the aforementioned hypothesis is confirmed.
CHAPTER 3 QOS MEASUREMENT
81
In terms of the upload operation, the time metric can discriminate a set of services with high-
responsiveness from those with low-responsiveness. ∎
In a similar way, we can demonstrate that for the download operation, the time metric can
discriminate Aliyun OSS, Amazon S3, and Azure Blob. However, for the delete operation, the
metric cannot discriminate them. The reason is that all of them take a few seconds to complete the
delete operation, whereas the maximum acceptable time is much larger — 500 seconds. So, their
delete responsiveness is so high that it is indistinguishable. For the reason of conciseness, we
omit those parts.
In a similar way, we can show that AVAL and REL meet the correlation criterion, and under an
appropriate threshold ELAS could meet it too. However, lacking sufficient data, we cannot
confirm it for SECY. Also, we can demonstrate that AVAL, REL, SECY, and ELAS meet the
consistency criterion. Still, we can show that REL and ELAS meet the discriminative power
criterion, but both AVAL and SECY do not meet this criterion. The reason is that availability and
security are very high in the case studies. It should be noted that this does not mean that AVAL
and SECY cannot discriminate good services from poor ones. Rather, it only means that it cannot
discriminate those with high availability and security, which is fine in general. Refer to Appendix
A for validation of those parts.
3.6 Summary
Unlike traditional services that are carried out in human-based environments, cloud services are
delivered in Internet-based environments, where face-to-face interactions are no longer possible.
CHAPTER 3 QOS MEASUREMENT
82
As the spectrum of cloud services expands, how to define and measure their quality becomes an
important problem.
SERVQUAL and the e-service quality model introduced are two frameworks that can be used to
measure service quality in service businesses and electronic commerce. However, both quality
models are unable to offer objective quality measurements, and thus cannot be applied to cloud
services without reconstructions. In view of these issues, we take a service perspective, and
initiate a quality model named CLOUDQUAL for cloud services. It comprises six quality
dimensions, i.e., usability, availability, reliability, responsiveness, security, and elasticity. A
formal specification is given for each quality dimension. Also, a quality metric is defined for
quality dimensions except usability.
To demonstrate the effectiveness of CLOUDQUAL, we conduct empirical case studies on three
storage clouds. Empirical results show that CLOUDQUAL is able to evaluate their quality. In
fact, all of them can offer high availability, without a security breach. However, their
responsiveness differs significantly. Also, their elasticity varies greatly. Still, we encounter many
socket write errors. Last, their usability varies too. To demonstrate the soundness of
CLOUDQUAL, we validate it with three criteria, i.e., correlation, consistency, and discriminative
power. It shows that CLOUDQUAL can differentiate service quality.
In brief, CLOUDQUAL is a quality model with quality dimensions and metrics that targets
general cloud services. The model defines a standard method to gauge QoS, and thus can
eliminate potential disputes among cloud stakeholders. The next chapter deals with QoS
negotiation, where cloud consumers negotiate their QoS requirements with cloud providers, with
an aim to establish a SLA.
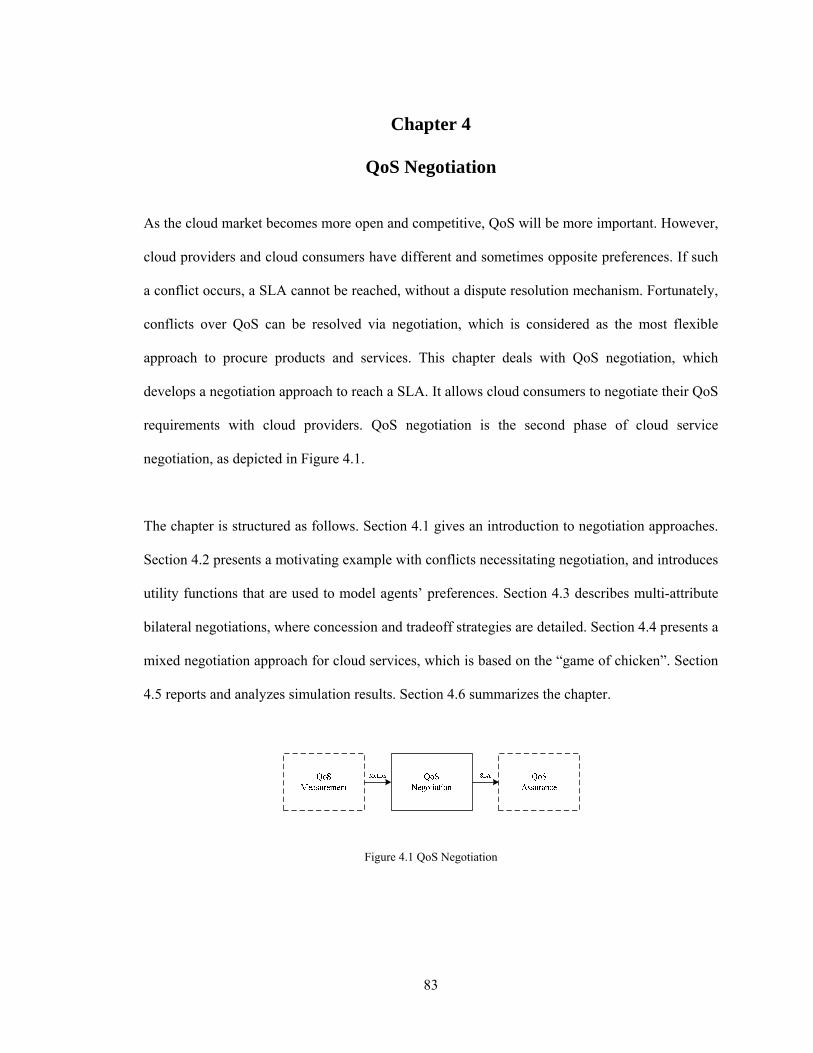
83
Chapter 4
QoS Negotiation
As the cloud market becomes more open and competitive, QoS will be more important. However,
cloud providers and cloud consumers have different and sometimes opposite preferences. If such
a conflict occurs, a SLA cannot be reached, without a dispute resolution mechanism. Fortunately,
conflicts over QoS can be resolved via negotiation, which is considered as the most flexible
approach to procure products and services. This chapter deals with QoS negotiation, which
develops a negotiation approach to reach a SLA. It allows cloud consumers to negotiate their QoS
requirements with cloud providers. QoS negotiation is the second phase of cloud service
negotiation, as depicted in Figure 4.1.
The chapter is structured as follows. Section 4.1 gives an introduction to negotiation approaches.
Section 4.2 presents a motivating example with conflicts necessitating negotiation, and introduces
utility functions that are used to model agents’ preferences. Section 4.3 describes multi-attribute
bilateral negotiations, where concession and tradeoff strategies are detailed. Section 4.4 presents a
mixed negotiation approach for cloud services, which is based on the “game of chicken”. Section
4.5 reports and analyzes simulation results. Section 4.6 summarizes the chapter.
Figure 4.1 QoS Negotiation
CHAPTER 4 QOS NEGOTIATION
84
4.1 Introduction
In the process of acquiring resources, cloud providers and cloud consumers have different and
sometimes opposite preferences. If such a conflict occurs, a SLA cannot be reached, without a
dispute resolution mechanism. Fortunately, conflicts over QoS can be resolved via negotiation.
Automated negotiation occurs, when software agents negotiate on behalf of their human
counterparts. Compared to human negotiation, automated negotiation is more time-efficient and
less error-prone, and can handle more effectively multiple issues and complex preferences.
In bilateral negotiations, negotiation strategies are critical for negotiation agents. To create a
proposal, a negotiation agent can adopt two strategies. If no alternatives exist or the deadline
approaches, it can use a concession strategy to gradually reduce its utility, until no conflicts exist.
However, if preference gaps exist between two parties, it is possible to resolve conflicts without
concession. Instead, the agent can use a tradeoff strategy to yield, strategically, on its less
important attributes, but demand more on its more important attributes. If the agent’s counterpart
has different, if not opposite, preferences, the less important attributes, surprisingly, generate
more utility for its counterpart. As a result, a proposal attractive to its counterpart is created, but
no utility is lost.
A tradeoff negotiation approach can outperform a concession one in terms of utility [126, 128].
However, if information is incomplete, it may cause miscalculations, and so underperform the
concession one in terms of success rate. To balance utility and success rate, we, in this chapter,
present a mixed negotiation approach for cloud services, which is based on the “game of
chicken”. In other words, if a party’s counterpart uses a concession strategy, it is best to adopt a
tradeoff one; if a party’s counterpart uses a tradeoff strategy, it is best to adopt a concession one;
CHAPTER 4 QOS NEGOTIATION
85
if a party is uncertain about the strategy of its counterpart, it is best to mix concession and
tradeoff strategies in negotiation. In fact, those are the three Nash equilibria of a negotiation game
with two pure strategies.
It should be noted that the mixed approach that we adopt in negotiation exhibits a certain degree
of intelligence. So, the innovation of this work cannot be underestimated.
4.2 Motivating Example
In this section, we first present a motivating example, where a storage consumer negotiates over
QoS with a storage provider. It contains conflicts that cannot be resolved without negotiation.
Next, we discuss utility functions adopted in the chapter.
4.2.1 Storage Cloud Example
Internet startups are able to reside on a cloud to build their services even without their own
infrastructure. A storage cloud allows users to store their data in data centers without worrying
about backup, such that they can focus on their core businesses. Amazon S3, Azure Blob, and
Aliyun OSS are three well-known storage clouds.
Suppose that, five attributes, i.e., quality dimensions, are used to describe a storage cloud, as
shown in Table 4.1, where the numbers are built upon our experiences with real-world storage
clouds [127]. Assume that the minimum and the maximum availability are 0 and 100%,
respectively. A Storage Provider (SP) has the ability to provide an availability of 99%, but it only
wants to offer an availability of 84%. In other words, its preferred value and reserved value of
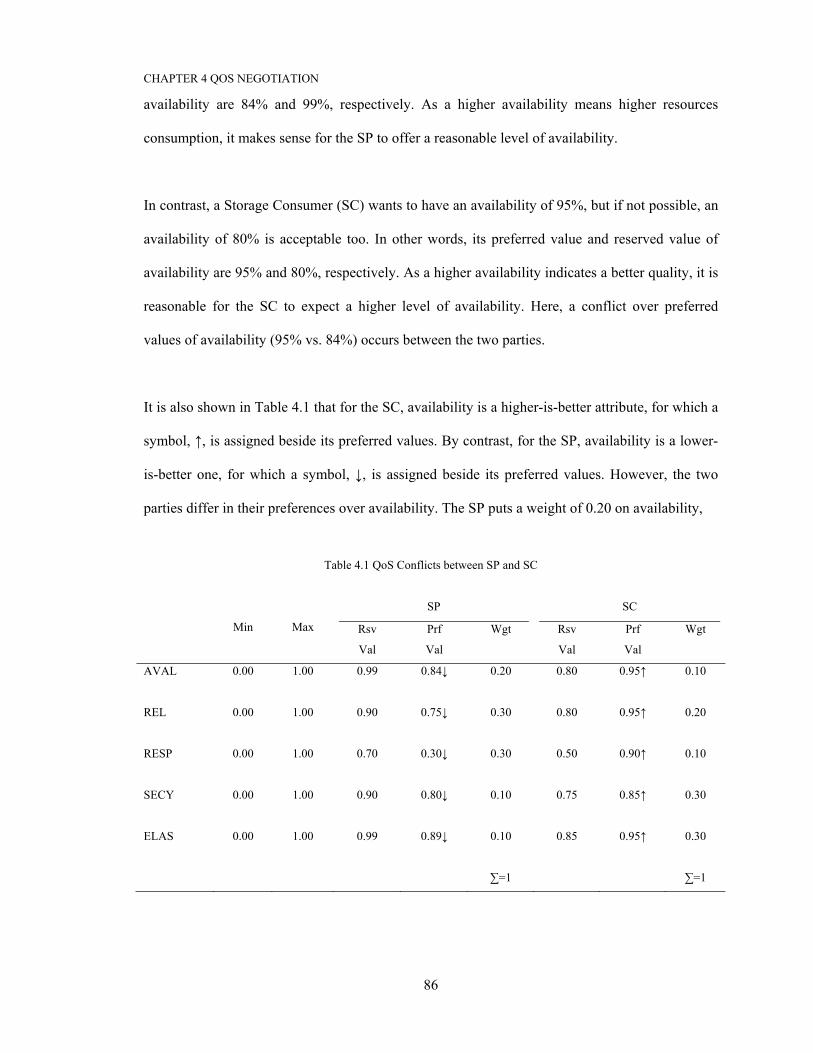
CHAPTER 4 QOS NEGOTIATION
86
availability are 84% and 99%, respectively. As a higher availability means higher resources
consumption, it makes sense for the SP to offer a reasonable level of availability.
In contrast, a Storage Consumer (SC) wants to have an availability of 95%, but if not possible, an
availability of 80% is acceptable too. In other words, its preferred value and reserved value of
availability are 95% and 80%, respectively. As a higher availability indicates a better quality, it is
reasonable for the SC to expect a higher level of availability. Here, a conflict over preferred
values of availability (95% vs. 84%) occurs between the two parties.
It is also shown in Table 4.1 that for the SC, availability is a higher-is-better attribute, for which a
symbol, ↑, is assigned beside its preferred values. By contrast, for the SP, availability is a lower-
is-better one, for which a symbol, ↓, is assigned beside its preferred values. However, the two
parties differ in their preferences over availability. The SP puts a weight of 0.20 on availability,
Table 4.1 QoS Conflicts between SP and SC
Min
Max
SP SC
Rsv
Val
Prf
Val
Wgt Rsv
Val
Prf
Val
Wgt
AVAL 0.00 1.00 0.99 0.84↓ 0.20
0.80 0.95↑ 0.10
REL 0.00 1.00 0.90 0.75↓ 0.30
0.80 0.95↑ 0.20
RESP 0.00 1.00 0.70 0.30↓ 0.30
0.50 0.90↑ 0.10
SECY 0.00 1.00 0.90 0.80↓ 0.10
0.75 0.85↑ 0.30
ELAS 0.00 1.00 0.99 0.89↓ 0.10
0.85 0.95↑ 0.30
∑=1 ∑=1
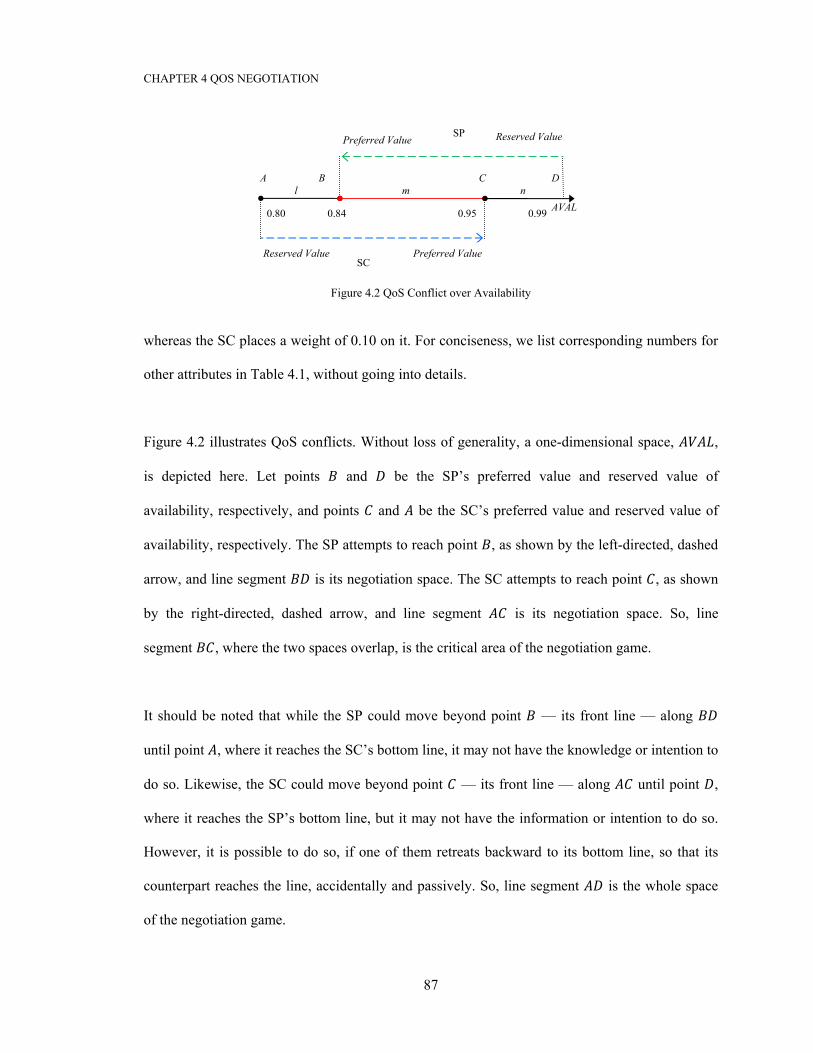
CHAPTER 4 QOS NEGOTIATION
87
Figure 4.2 QoS Conflict over Availability
whereas the SC places a weight of 0.10 on it. For conciseness, we list corresponding numbers for
other attributes in Table 4.1, without going into details.
Figure 4.2 illustrates QoS conflicts. Without loss of generality, a one-dimensional space, ,
is depicted here. Let points and be the SP’s preferred value and reserved value of
availability, respectively, and points and be the SC’s preferred value and reserved value of
availability, respectively. The SP attempts to reach point , as shown by the left-directed, dashed
arrow, and line segment is its negotiation space. The SC attempts to reach point , as shown
by the right-directed, dashed arrow, and line segment is its negotiation space. So, line
segment , where the two spaces overlap, is the critical area of the negotiation game.
It should be noted that while the SP could move beyond point — its front line — along
until point , where it reaches the SC’s bottom line, it may not have the knowledge or intention to
do so. Likewise, the SC could move beyond point — its front line — along until point ,
where it reaches the SP’s bottom line, but it may not have the information or intention to do so.
However, it is possible to do so, if one of them retreats backward to its bottom line, so that its
counterpart reaches the line, accidentally and passively. So, line segment is the whole space
of the negotiation game.
l
0.99 AVAL
D
Preferred Value SP Reserved Value
n m
0.80 0.84 0.95
SC
A B C
Preferred Value Reserved Value
CHAPTER 4 QOS NEGOTIATION
88
Our example scenario is based upon our experiences with real-world storage clouds [127], and so
cannot be dismissed as a toy example. Indeed, the conflicts shown in Table 4.1 cannot be
resolved without negotiation. Human negotiation becomes inefficient and error-prone, due to the
inclusion of five attributes, complex preferences, and time constraints. This necessitates
automated negotiation.
Here, we give a formal description for important concepts introduced above, and make four
assumptions.
Definition 4.1 (Preferred Value). For an agent, , its preferred value, (0 ≤ ≤ 1), of an
attribute, , is the minimum (lower-is-better) or maximum (higher-is-better) value that strives to
obtain from a deal.
Definition 4.2 (Reserved Value). For an agent, , its reserved value, (0 ≤ ≤ 1), of an
attribute, , is the minimum (higher-is-better) or maximum (lower-is-better) value that strives to
obtain from a deal.
Definition 4.3 (Weight). For an agent, , the weight, (0 ≤ ≤ 1), of an attribute, , is a
number indicating ’s importance to . If we let be a component of a vector, , then forms ’s
weight vector with property ∑ = 1.
Assumption 4.1 (SP’s Value). Assume that a SP’s preferred value of an attribute, , is not less
than a SC’s reserved value of and not greater than the SC’s preferred value of , where is
lower-is-better for the SP, and higher-is-better for the SC.
Assumption 4.2 (SC’s Value). Assume that a SC’s preferred value of an attribute, , is not
greater than a SP’s reserved value of and not less than the SP’s preferred value of , where is
lower-is-better for the SP, and higher-is-better for the SC.
CHAPTER 4 QOS NEGOTIATION
89
Assumption 4.3 (Preference Gap). Assume that there exists a preference gap between a SP and
a SC. In other words, the SP and the SC have a different, if not opposite, weight over an attribute,
.
Assumption 4.4 (Incomplete Information). Assume that a SP and a SC are self-interested, and
so always keep important parameters secret. In other words, both parties do not disclose their
reserved values, weights, and exact preferences, but can indicate their preference direction.
It should be observed that Assumptions 4.1 and 4.2 are reasonable. Without them, we cannot
compare concession, tradeoff, and mixed negotiation approaches, since no negotiation is needed
at all, or no agreement can be reached without concession. Assumption 4.3 is also reasonable,
since we only assume some gaps about agents’ preferences. Without it, there is no chance to
make a tradeoff. Assumption 4.4 is reasonable too, since we only assume incomplete information
about agents’ preferences, which is more realistic and practical than assuming complete
information.
4.2.2 Utility Functions
In economics, a utility function can be used to represent preferences. It measures “the level of
satisfaction a consumer receives from any basket of goods and services” [14]. It is adopted here
to measure the level of satisfaction that a user receives from a cloud service provider. However, it
is usually difficult to specify an accurate utility function for agents [47]. For this reason, we use a
general exponential function to model an agent’s preferences over a single attribute. It should be
mentioned that other similar functions could be used too, as long as they are continuous,
transitive, and complete [47]. For a lower-is-better attribute, its utility is measured by ( ) = × ( − )(4.1)
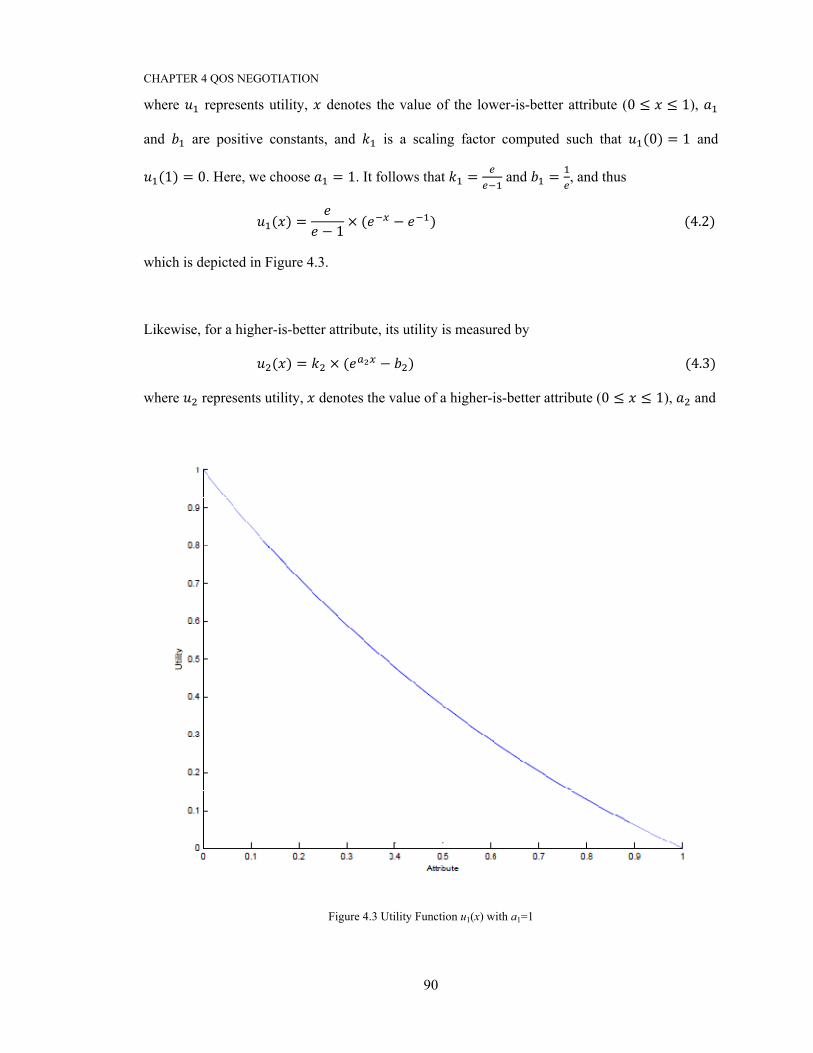
CHAPTER 4 QOS NEGOTIATION
90
where represents utility, denotes the value of the lower-is-better attribute (0 ≤ ≤ 1),
and are positive constants, and is a scaling factor computed such that (0) = 1 and (1) = 0. Here, we choose = 1. It follows that = and = , and thus
( ) = − 1 × ( − )(4.2) which is depicted in Figure 4.3.
Likewise, for a higher-is-better attribute, its utility is measured by ( ) = × ( − )(4.3) where represents utility, denotes the value of a higher-is-better attribute (0 ≤ ≤ 1), and
Figure 4.3 Utility Function u1(x) with a1=1
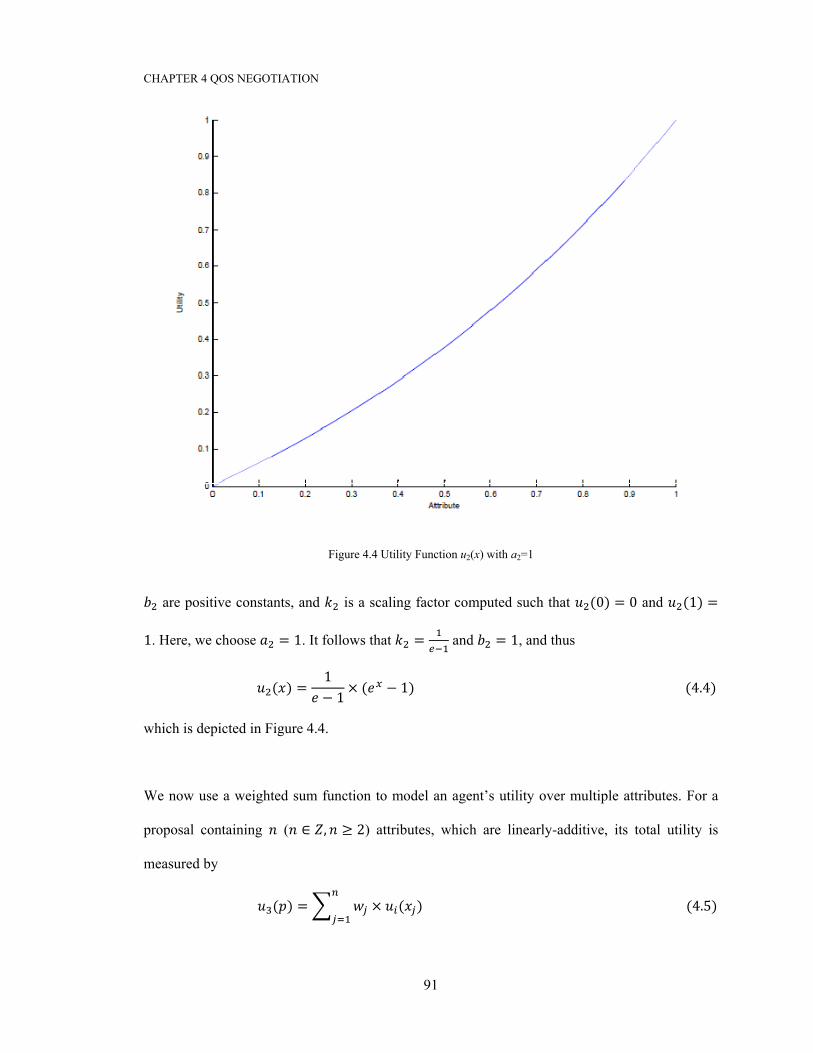
CHAPTER 4 QOS NEGOTIATION
91
Figure 4.4 Utility Function u2(x) with a2=1
are positive constants, and is a scaling factor computed such that (0) = 0 and (1) =1. Here, we choose = 1. It follows that = and = 1, and thus
( ) = 1− 1 × ( − 1)(4.4) which is depicted in Figure 4.4.
We now use a weighted sum function to model an agent’s utility over multiple attributes. For a
proposal containing ( ∈ , ≥ 2) attributes, which are linearly-additive, its total utility is
measured by
( ) = × ( )(4.5)
CHAPTER 4 QOS NEGOTIATION
92
where represents utility, denotes a proposal, is the weight and the utility function of
attribute ( = 1, 2, … , ). If is a lower-is-better attribute, then = 1; if is a higher-is-better
one, then = 2.
In the motivating example, availability is a lower-is-better attribute for the SP. The SP’s preferred
value of availability is 0.84, so its utility is determined as (0.84) = − 1 × ( . − ) = 2.7182.718 − 1 × (0.432 − 0.368) = 0.101
Likewise, the SP’s preferred utility of reliability, responsiveness, security, and elasticity is
determined as 0.165, 0.590, 0.128, and 0.068, respectively. We assume that the SP’s weights for
availability, reliability, responsiveness, security, and elasticity are 0.20, 0.30, 0.30, 0.10, and 0.10,
respectively. So, the total utility of the SP’s preferred proposal, , is determined as
( ) = × ( ) = 0.20 × 0.101 + 0.30 × 0.165 + 0.30 × 0.590 + 0.10 × 0.128 + 0.10 × 0.068 = 0.266
In the same way, the utility of the SP’s reserved proposal, , is determined as 0.087. In the
motivating example, availability is a higher-is-better attribute for the SC. Without going into
detail, the utilities of the SC’s preferred proposal and reserved proposal are determined as 0.873
and 0.681, respectively.
It should be noted that since ( ) and ( ) are monotonic, we can easily map between a value
of an attribute and its utility. Without this property, we cannot make an effective concession or
CHAPTER 4 QOS NEGOTIATION
93
tradeoff. Moreover, since ( ) is additive, we can easily extend the motivating example to
handle as many attributes as needed.
Here, we give a formal description for three important concepts, and make another two
assumptions.
Definition 4.4 (Proposal). For an agent, , and its value, (0 ≤ ≤ 1), of an attribute,
( = 1, 2, … ), if we let be a component of an n-dimensional vector, , then forms a proposal
of .
Definition 4.5 (Preferred Proposal). For an agent, , and its preferred value, (0 ≤ ≤ 1),
of an attribute, ( = 1, 2, … , ), if we let be a component of an n-dimensional vector, , then
forms ’s preferred proposal.
Definition 4.6 (Reserved Proposal). For an agent, , and its reserved value, (0 ≤ ≤ 1), of
an attribute, ( = 1, 2, … ), if we let be a component of an n-dimensional vector, , then
forms ’s reserved proposal.
Assumption 4.5 (Nonlinear Preference). Assume that the utilities of attributes AVAL, REL,
RESP, SECY, and ELAS change nonlinearly with their values, and (4.2) and (4.4) can be used by
a SP and a SC to measure the utilities of the five attributes, respectively.
Assumption 4.6 (Linearly-Additive Attribute). Assume that attributes AVAL, REL, RESP,
SECY, and ELAS are additive, and (4.5) can be used by a SP and a SC to measure the utility of a
proposal containing the five attributes.
We observe that Assumption 4.5 is reasonable, since agents’ preferences in most cases are
nonlinear. Assumption 4.6 is also reasonable, since agents usually, if not always, are willing to
substitute the utility of one attribute for that of another, and their reserved values stop them going
beyond bottom lines. This justifies using a weighted sum function to measure the utility of a
proposal containing multiple attributes.
CHAPTER 4 QOS NEGOTIATION
94
It should be cautioned that even (4.5) could cause the compensation problem, where a poor QoS
can be counterbalanced by a good QoS, reserved values in our example can keep the negative
impact of compensation within bounds. In fact, without a certain degree of compensation, it is
impossible to adopt a tradeoff negotiation approach, since it utilizes the positive impact of
compensation to exploit preference gaps. So, the compensation problem cannot be considered as
a serious drawback.
4.3 Multi-Attribute Bilateral Negotiation
In this section, we introduce a multi-attribute bilateral negotiation, with a focus on its negotiation
protocol and negotiation strategies. It should be mentioned that auction ― another important
mechanism that agents may use to procure goods and services ― is beyond the scope of this
thesis. The reason is that auction usually focuses on a single issue, i.e., price, and underestimates
the importance of other factors such as quality, which makes it unsuitable for our case.
In a bilateral negotiation, two agents have a common interest in cooperation, but have conflicting
interests regarding the particular way of doing so [55]. In a multi-attribute negotiation, multiple
issues are negotiated among agents, where a win-win solution is possible [50]. However, a multi-
attribute negotiation is more complex and challenging than a single-attribute one, because of
complex preferences over multiple issues and the multiple-dimensional solution space. For a
multi-attribute bilateral negotiation, which we deal with in this thesis, its negotiation protocol and
negotiation strategies merit special attention [35, 46, 58].
CHAPTER 4 QOS NEGOTIATION
95
4.3.1 Negotiation Protocol
A negotiation protocol specifies the “rules of encounter” among agents [58]. In this thesis, we
adopt an alternating-offers protocol for cloud service negotiation. It works as follows [89]. In a
simple case with one issue, two agents bargain over a pie of size 1. An agent makes a proposal
(0 ≤ ≤ 1), and its counterpart can accept or reject it. If it is accepted, the bargaining ends with
the agent receiving and its counterpart 1 − ; otherwise, the counterpart makes a counter
proposal, and the process repeats. If multiple issues are involved and information is incomplete
(size is not known, and preferences are kept private), the bargaining process becomes more
complex. However, the rules that govern the bargaining process remain the same.
In a multi-attribute bilateral negotiation, two agents alternately exchange their proposals and
counter proposals, until one of them accepts a proposal or a counter proposal, a failure to reach an
agreement happens, or the deadline is reached. If the first case occurs, the negotiation ends
successfully with an agreement established; otherwise, it fails and terminates with no deal made.
Three points should be mentioned here. First, a failure could happen if a party cannot suggest a
valid proposal, because of incomplete information. Second, instead of time, a predefined
maximum negotiation round is used to model the deadline. In fact, automated negotiation can
complete in seconds, which makes time unsuitable to model the deadline in our case. Third, in
each negotiation round, multiple attributes are negotiated simultaneously, which would be
tedious, if not impossible, for a human negotiator to do so. Figure 4.5 illustrates the alternating-
offers protocol.
Here, we give a formal description for the concept of a valid proposal introduced above.
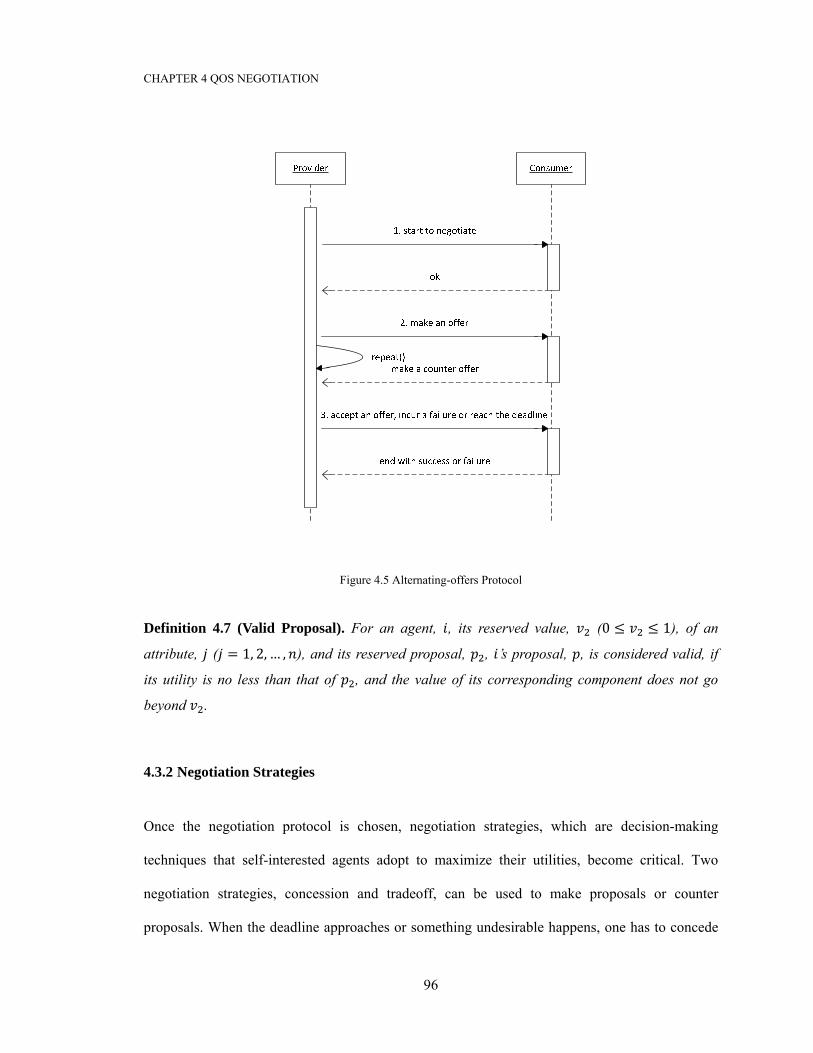
CHAPTER 4 QOS NEGOTIATION
96
Figure 4.5 Alternating-offers Protocol
Definition 4.7 (Valid Proposal). For an agent, , its reserved value, (0 ≤ ≤ 1), of an
attribute, ( = 1, 2, … , ), and its reserved proposal, , ’s proposal, , is considered valid, if
its utility is no less than that of , and the value of its corresponding component does not go
beyond .
4.3.2 Negotiation Strategies
Once the negotiation protocol is chosen, negotiation strategies, which are decision-making
techniques that self-interested agents adopt to maximize their utilities, become critical. Two
negotiation strategies, concession and tradeoff, can be used to make proposals or counter
proposals. When the deadline approaches or something undesirable happens, one has to concede

CHAPTER 4 QOS NEGOTIATION
97
in order to make a deal. With a concession strategy, a party gradually reduces its utility until no
conflicts exist. Indeed, the party who adopts the concession strategy can move towards the
preferences of its counterpart, even under incomplete information. If no miscalculations happen,
its proposal has a higher chance of being accepted. As the concession strategy decreases a party’s
utility, it is considered when no alternatives exist.
However, if preference gaps exist between two parties, it is possible to resolve conflicts without
concession. With a tradeoff strategy, a party yields on its less important attributes, but demands
more on its more important attributes. As a result, a proposal more attractive to its counterpart is
created, but utility is not reduced. In particular, if it succeeds, the tradeoff strategy can generate
more utility than a concession one [128]. However, if information is incomplete, the party who
adopts the tradeoff strategy could move away from the preferences of its counterpart, or in the
worst case, move in the opposite direction. So, its proposal becomes less attractive, and it is very
likely that a failure happens.
We now give an economic description of the two negotiation approaches. A concession
negotiation approach works as follows. In preparing a proposal, a party reduces the utility of its
reference proposal, and adjusts, accordingly, the values of its attributes in favor of its counterpart.
So, the party can encourage the counterpart to accept the proposal at its own cost. Here, the
reference proposal is built upon the party’s preferred proposal. In fact, a proposal received from
its counterpart could be used as the reference proposal too, if the received utility is no less than
that of its preferred proposal. It should be mentioned that some differences could happen, if the
latter is adopted. However, it is beyond the scope of this thesis.
A graphical representation of the concession negotiation approach is depicted in Figure 4.6.
Without loss of generality, a two-dimensional space, , is assumed here, where and
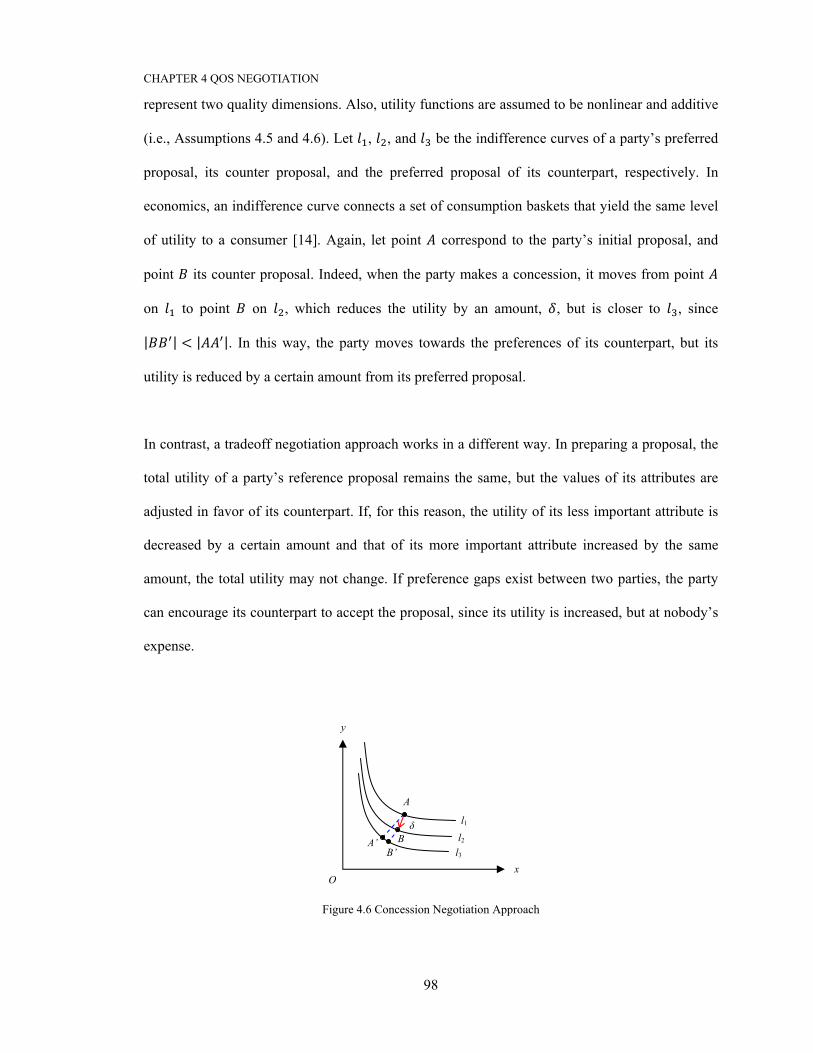
CHAPTER 4 QOS NEGOTIATION
98
represent two quality dimensions. Also, utility functions are assumed to be nonlinear and additive
(i.e., Assumptions 4.5 and 4.6). Let , , and be the indifference curves of a party’s preferred
proposal, its counter proposal, and the preferred proposal of its counterpart, respectively. In
economics, an indifference curve connects a set of consumption baskets that yield the same level
of utility to a consumer [14]. Again, let point correspond to the party’s initial proposal, and
point its counter proposal. Indeed, when the party makes a concession, it moves from point
on to point on , which reduces the utility by an amount, , but is closer to , since | | < | |. In this way, the party moves towards the preferences of its counterpart, but its
utility is reduced by a certain amount from its preferred proposal.
In contrast, a tradeoff negotiation approach works in a different way. In preparing a proposal, the
total utility of a party’s reference proposal remains the same, but the values of its attributes are
adjusted in favor of its counterpart. If, for this reason, the utility of its less important attribute is
decreased by a certain amount and that of its more important attribute increased by the same
amount, the total utility may not change. If preference gaps exist between two parties, the party
can encourage its counterpart to accept the proposal, since its utility is increased, but at nobody’s
expense.
Figure 4.6 Concession Negotiation Approach
l3 l2 l1
x
y
O
BB’
δA’
A
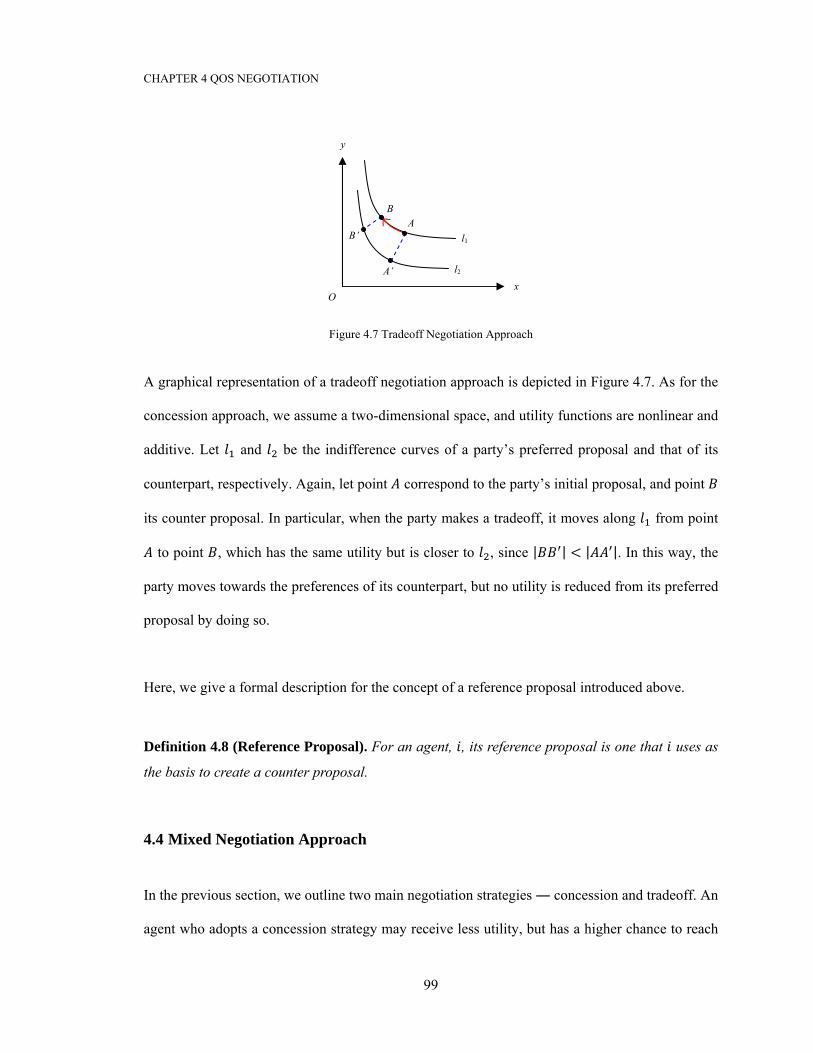
CHAPTER 4 QOS NEGOTIATION
99
Figure 4.7 Tradeoff Negotiation Approach
A graphical representation of a tradeoff negotiation approach is depicted in Figure 4.7. As for the
concession approach, we assume a two-dimensional space, and utility functions are nonlinear and
additive. Let and be the indifference curves of a party’s preferred proposal and that of its
counterpart, respectively. Again, let point correspond to the party’s initial proposal, and point
its counter proposal. In particular, when the party makes a tradeoff, it moves along from point
to point , which has the same utility but is closer to , since | | < | |. In this way, the
party moves towards the preferences of its counterpart, but no utility is reduced from its preferred
proposal by doing so.
Here, we give a formal description for the concept of a reference proposal introduced above.
Definition 4.8 (Reference Proposal). For an agent, , its reference proposal is one that uses as
the basis to create a counter proposal.
4.4 Mixed Negotiation Approach
In the previous section, we outline two main negotiation strategies ― concession and tradeoff. An
agent who adopts a concession strategy may receive less utility, but has a higher chance to reach
y
xO
l2
l1
B
B’
A’
A
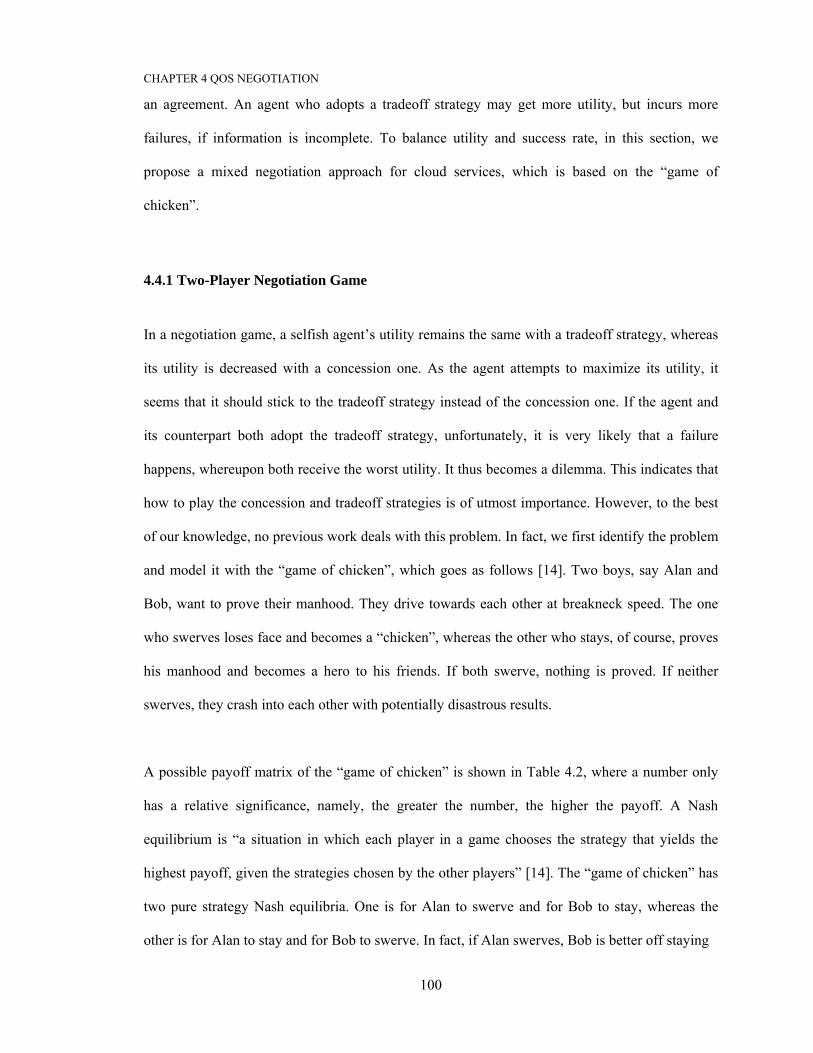
CHAPTER 4 QOS NEGOTIATION
100
an agreement. An agent who adopts a tradeoff strategy may get more utility, but incurs more
failures, if information is incomplete. To balance utility and success rate, in this section, we
propose a mixed negotiation approach for cloud services, which is based on the “game of
chicken”.
4.4.1 Two-Player Negotiation Game
In a negotiation game, a selfish agent’s utility remains the same with a tradeoff strategy, whereas
its utility is decreased with a concession one. As the agent attempts to maximize its utility, it
seems that it should stick to the tradeoff strategy instead of the concession one. If the agent and
its counterpart both adopt the tradeoff strategy, unfortunately, it is very likely that a failure
happens, whereupon both receive the worst utility. It thus becomes a dilemma. This indicates that
how to play the concession and tradeoff strategies is of utmost importance. However, to the best
of our knowledge, no previous work deals with this problem. In fact, we first identify the problem
and model it with the “game of chicken”, which goes as follows [14]. Two boys, say Alan and
Bob, want to prove their manhood. They drive towards each other at breakneck speed. The one
who swerves loses face and becomes a “chicken”, whereas the other who stays, of course, proves
his manhood and becomes a hero to his friends. If both swerve, nothing is proved. If neither
swerves, they crash into each other with potentially disastrous results.
A possible payoff matrix of the “game of chicken” is shown in Table 4.2, where a number only
has a relative significance, namely, the greater the number, the higher the payoff. A Nash
equilibrium is “a situation in which each player in a game chooses the strategy that yields the
highest payoff, given the strategies chosen by the other players” [14]. The “game of chicken” has
two pure strategy Nash equilibria. One is for Alan to swerve and for Bob to stay, whereas the
other is for Alan to stay and for Bob to swerve. In fact, if Alan swerves, Bob is better off staying
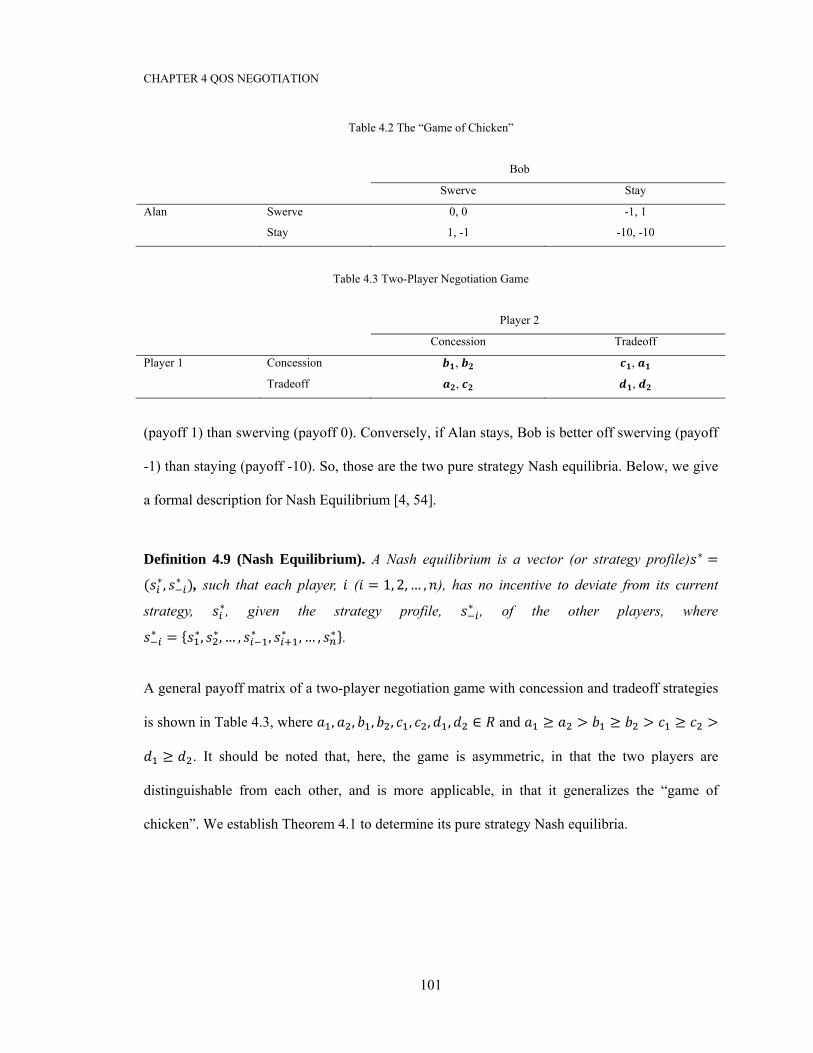
CHAPTER 4 QOS NEGOTIATION
101
Table 4.2 The “Game of Chicken”
Bob
Swerve Stay
Alan Swerve 0, 0 -1, 1
Stay 1, -1 -10, -10
Table 4.3 Two-Player Negotiation Game
Player 2
Concession Tradeoff
Player 1 Concession , ,
Tradeoff , ,
(payoff 1) than swerving (payoff 0). Conversely, if Alan stays, Bob is better off swerving (payoff
-1) than staying (payoff -10). So, those are the two pure strategy Nash equilibria. Below, we give
a formal description for Nash Equilibrium [4, 54].
Definition 4.9 (Nash Equilibrium). A Nash equilibrium is a vector (or strategy profile) ∗ =( ∗, ∗ ), such that each player, ( = 1, 2, … , ), has no incentive to deviate from its current
strategy, ∗, given the strategy profile, ∗ , of the other players, where ∗ = { ∗, ∗, … , ∗ , ∗ , … , ∗}.
A general payoff matrix of a two-player negotiation game with concession and tradeoff strategies
is shown in Table 4.3, where , , , , , , , ∈ and ≥ > ≥ > ≥ >≥ . It should be noted that, here, the game is asymmetric, in that the two players are
distinguishable from each other, and is more applicable, in that it generalizes the “game of
chicken”. We establish Theorem 4.1 to determine its pure strategy Nash equilibria.
CHAPTER 4 QOS NEGOTIATION
102
Theorem 4.1 (Negotiation with Complete Information). Let be a two-player negotiation
game, whose payoff matrix is shown in Table 4.3. There exist two pure strategy Nash equilibria
for . One is for Player 1 to make a concession and for Player 2 to make a tradeoff, whereas the
other is for Player 1 to make a tradeoff and for Player 2 to make a concession.
Proof. Suppose, here, that information is complete, namely, a player knows the strategy of its
counterpart. It follows that, if Player 1 makes a concession, it is best for Player 2 to make a
tradeoff (payoff ) than make a concession (payoff ), since > ; conversely, if Player 1
makes a tradeoff, it is best for Player 2 to make a concession (payoff ) than make a tradeoff
(payoff ), since > . Likewise, if Player 2 moves first, it can be confirmed that the results
hold too. So, those are the two pure strategy Nash equilibria for . ∎
In the above negotiation game, the best move of a player is to do the opposite of what its
counterpart decides. So, it is important for the player not to have its behavior anticipated by its
counterpart. In other words, its behavior should be unpredictable. A good way to achieve this is to
let chance decide. In contrast to the case with pure strategies, where a player attempts to
maximize its payoff, a player, here, employs a mixed strategy to maximize its expected payoff
[4].
Below, we give a formal description for three important concepts and introduce two established
lemmas [4].
Definition 4.10 (Mixed Strategy). For a player, , its mixed strategy, = ( , , … , ), is a
probability distribution over a set of pure strategies, = { , , … , }, where plays
( = 1, 2, … ) with probability ( ≥ 0 and ∑ = 1).
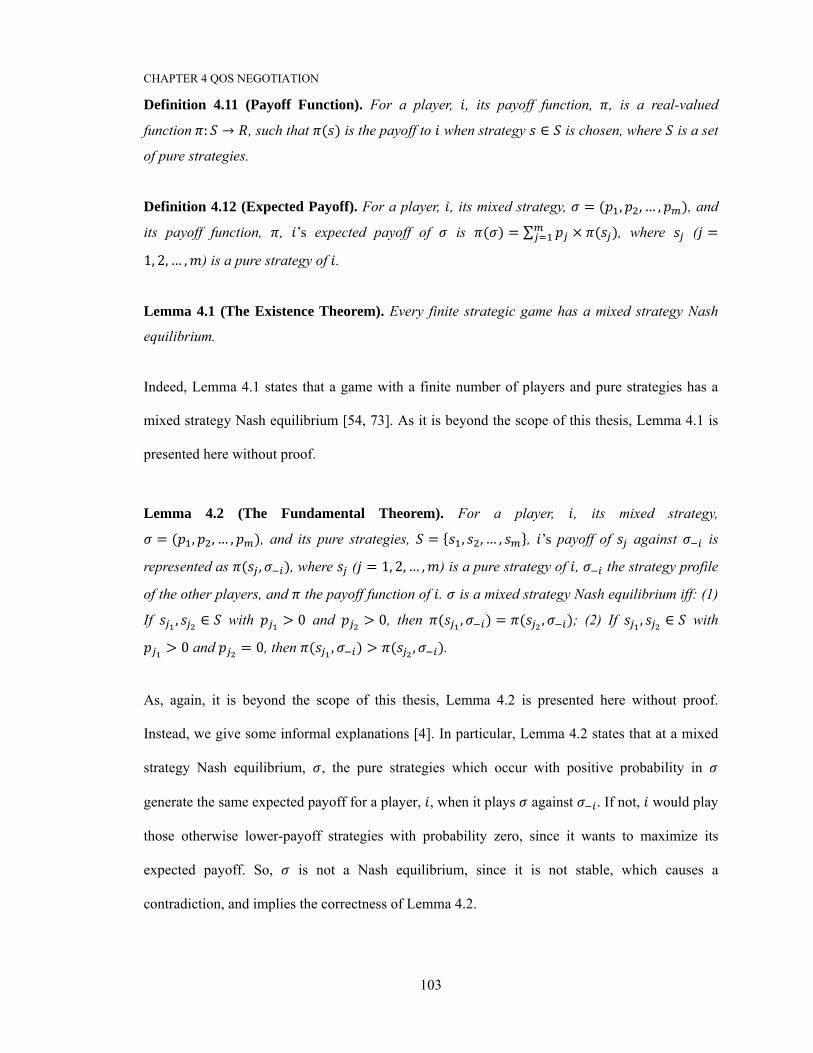
CHAPTER 4 QOS NEGOTIATION
103
Definition 4.11 (Payoff Function). For a player, , its payoff function, , is a real-valued
function : → , such that ( ) is the payoff to when strategy ∈ is chosen, where is a set
of pure strategies.
Definition 4.12 (Expected Payoff). For a player, , its mixed strategy, = ( , , … , ), and
its payoff function, , ’s expected payoff of is ( ) = ∑ × ( ), where ( =1, 2, … , ) is a pure strategy of .
Lemma 4.1 (The Existence Theorem). Every finite strategic game has a mixed strategy Nash
equilibrium.
Indeed, Lemma 4.1 states that a game with a finite number of players and pure strategies has a
mixed strategy Nash equilibrium [54, 73]. As it is beyond the scope of this thesis, Lemma 4.1 is
presented here without proof.
Lemma 4.2 (The Fundamental Theorem). For a player, , its mixed strategy, = ( , , … , ), and its pure strategies, = { , , … , }, ’s payoff of against is
represented as ( , ), where ( = 1, 2, … , ) is a pure strategy of , the strategy profile
of the other players, and the payoff function of . is a mixed strategy Nash equilibrium iff: (1)
If , ∈ with > 0 and > 0, then ( , ) = ( , ); (2) If , ∈ with > 0 and = 0, then ( , ) > ( , ).
As, again, it is beyond the scope of this thesis, Lemma 4.2 is presented here without proof.
Instead, we give some informal explanations [4]. In particular, Lemma 4.2 states that at a mixed
strategy Nash equilibrium, , the pure strategies which occur with positive probability in
generate the same expected payoff for a player, , when it plays against . If not, would play
those otherwise lower-payoff strategies with probability zero, since it wants to maximize its
expected payoff. So, is not a Nash equilibrium, since it is not stable, which causes a
contradiction, and implies the correctness of Lemma 4.2.

CHAPTER 4 QOS NEGOTIATION
104
Lemma 4.2 also states that at the mixed strategy Nash equilibrium, , the pure strategies which
occur with positive probability in generate a higher expected payoff for the player, , than those
are played with probability zero. If not, would play those otherwise higher-payoff strategies
with nonzero probability, since it wants to maximize its expected payoff. So, is not a Nash
equilibrium, since it is not stable either. This implies that the above assumption is not true either.
It follows that the Nash equilibrium, , implies conditions 1 and 2. It can be verified that the
other direction of implication holds too [4]. In fact, there is no incentive for the play, , to change
its strategy. First, rearranging the probability of pure strategies which are played with positive
probability will have no effect on the expected payoff. Second, increasing the probability of a
pure strategy which is played with probability zero will decrease its expected payoff. So, is a
Nash equilibrium, since it is stable for and every other player. It follows that conditions 1 and 2
imply that is a Nash equilibrium. We establish Theorem 4.2 to determine the mixed strategy
Nash equilibrium of a two-player negotiation game with concession and tradeoff strategies.
Theorem 4.2 (Negotiation with Incomplete Information). Let be a two-player negotiation
game, whose payoff matrix is shown in Table 4.3. There exists a mixed strategy Nash equilibrium ∗ = ( ∗, ∗) for , where Player 1 and Player 2 play ∗ and ∗, respectively, and ∗ =( , ), and ∗ = ( , ).
Proof. Suppose that information is incomplete, namely, a player does not know the strategy of its
counterpart. Player 1 and Player 2 play tradeoff strategies with probabilities and ,
respectively, and so they play concession strategies with probabilities 1 − and 1 − ,
respectively. In other words, they play mixed strategies = ( , 1 − ) and = ( , 1 − ), respectively.
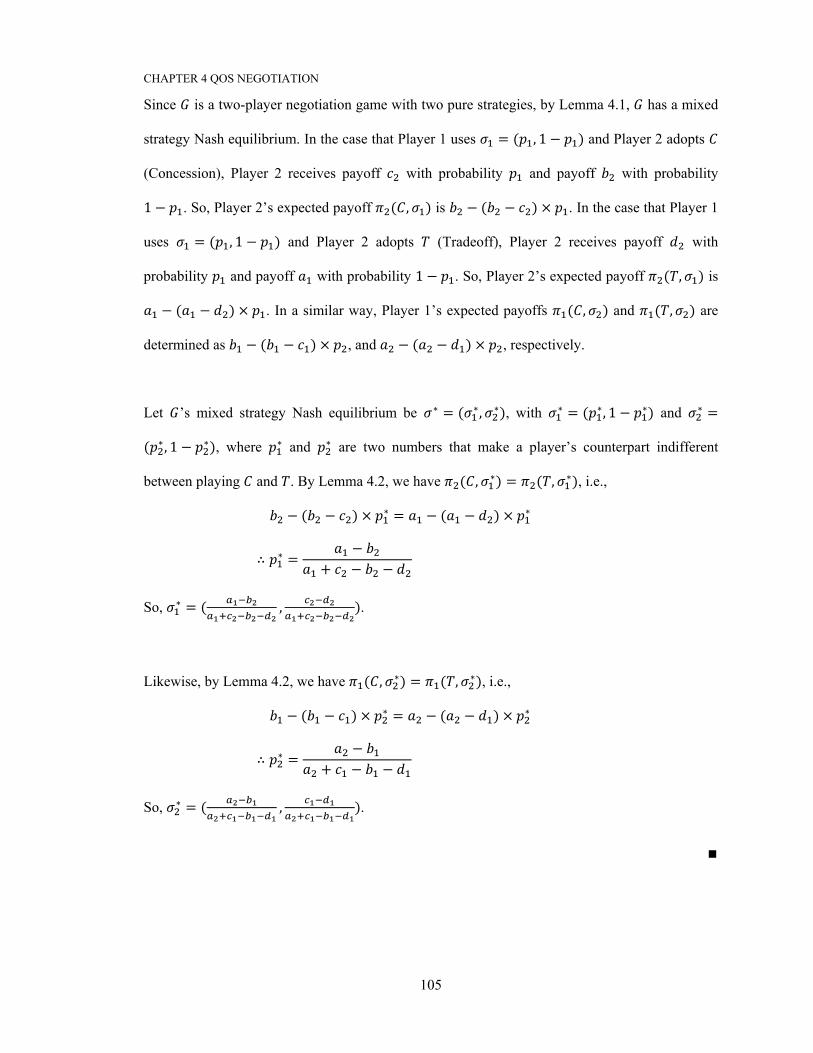
CHAPTER 4 QOS NEGOTIATION
105
Since is a two-player negotiation game with two pure strategies, by Lemma 4.1, has a mixed
strategy Nash equilibrium. In the case that Player 1 uses = ( , 1 − ) and Player 2 adopts
(Concession), Player 2 receives payoff with probability and payoff with probability 1 − . So, Player 2’s expected payoff ( , ) is − ( − ) × . In the case that Player 1
uses = ( , 1 − ) and Player 2 adopts (Tradeoff), Player 2 receives payoff with
probability and payoff with probability 1 − . So, Player 2’s expected payoff ( , ) is − ( − ) × . In a similar way, Player 1’s expected payoffs ( , ) and ( , ) are
determined as − ( − ) × , and − ( − ) × , respectively.
Let ’s mixed strategy Nash equilibrium be ∗ = ( ∗, ∗), with ∗ = ( ∗, 1 − ∗) and ∗ =( ∗, 1 − ∗), where ∗ and ∗ are two numbers that make a player’s counterpart indifferent
between playing and . By Lemma 4.2, we have ( , ∗) = ( , ∗), i.e., − ( − ) × ∗ = − ( − ) × ∗ ∴ ∗ = −+ − −
So, ∗ = ( , ).
Likewise, by Lemma 4.2, we have ( , ∗) = ( , ∗), i.e., − ( − ) × ∗ = − ( − ) × ∗ ∴ ∗ = −+ − −
So, ∗ = ( , ). ∎
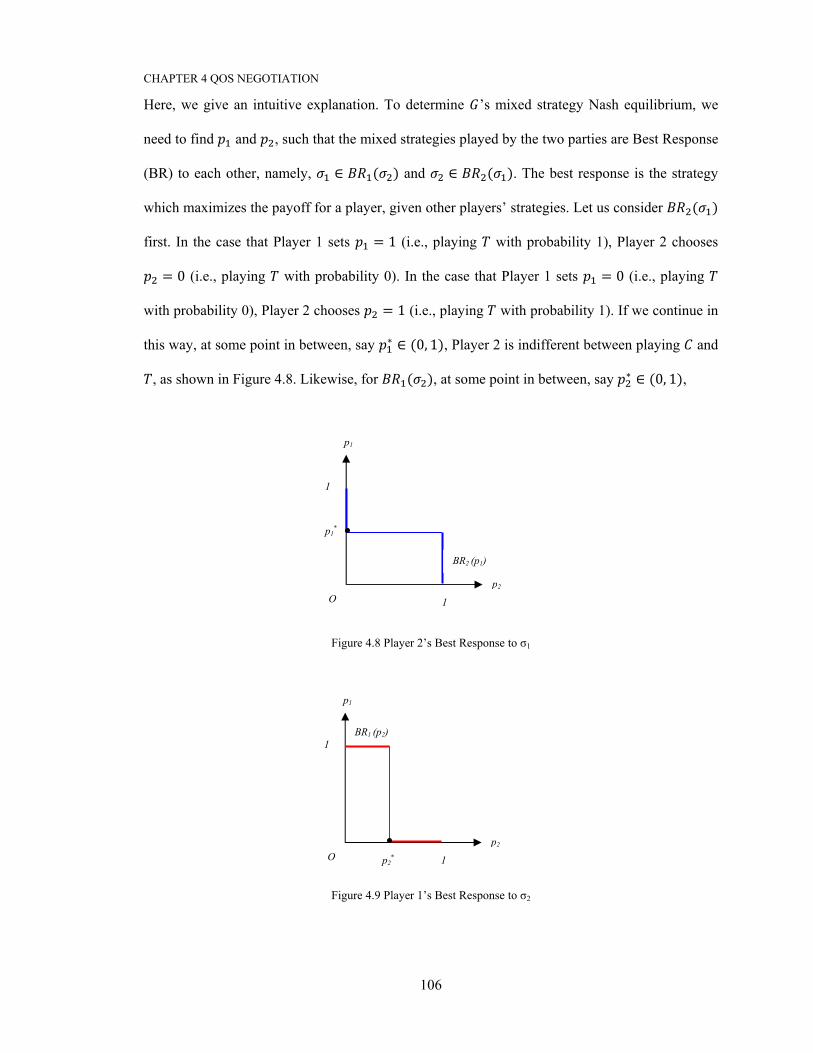
CHAPTER 4 QOS NEGOTIATION
106
Here, we give an intuitive explanation. To determine ’s mixed strategy Nash equilibrium, we
need to find and , such that the mixed strategies played by the two parties are Best Response
(BR) to each other, namely, ∈ ( ) and ∈ ( ). The best response is the strategy
which maximizes the payoff for a player, given other players’ strategies. Let us consider ( ) first. In the case that Player 1 sets = 1 (i.e., playing with probability 1), Player 2 chooses = 0 (i.e., playing with probability 0). In the case that Player 1 sets = 0 (i.e., playing
with probability 0), Player 2 chooses = 1 (i.e., playing with probability 1). If we continue in
this way, at some point in between, say ∗ ∈ (0, 1), Player 2 is indifferent between playing and
, as shown in Figure 4.8. Likewise, for ( ), at some point in between, say ∗ ∈ (0, 1),
Figure 4.8 Player 2’s Best Response to σ1
Figure 4.9 Player 1’s Best Response to σ2
p1*
p1
p2
O
1
1
BR2 (p1)
BR1 (p2)
p1
p2
O
1
1 p2*
CHAPTER 4 QOS NEGOTIATION
107
Figure 4.10 Nash Equilibrium Point (p1*, p2*)
Player 1 is indifferent between playing and , as shown in Figure 4.9. It follows that the two
best response curves cross at the equilibrium point ( ∗, ∗), as shown in Figure 4.10.
4.4.2 Game-Theoretic Description
A mixed strategy is “a choice among two or more pure strategies according to prespecified
probabilities”, where a pure strategy is a specific choice of possible strategies [14]. Our mixed
negotiation approach works as follows. In preparing a proposal, a party plays a concession
strategy with a certain probability and a tradeoff strategy with another probability. In the case that
a concession strategy is played, the utility of its reference proposal is reduced; in the case that a
tradeoff strategy is played, the utility of its reference proposal remains the same. In this way, the
values of its attributes are adjusted, accordingly, in favor of its counterpart. So, the party can
encourage its counterpart to accept the proposal with a higher probability, but at a reasonable
price. In fact, the idea of mixed strategies can be traced back to Nash’s 1950 seminal paper on
Equilibrium Points in -Person Games, where a mixed strategy is defined as probability
distributions over a finite set of pure strategies [73], or even as far as Maintaining Perfect
BR1 (p2)
p1*
p1
p2
O
1
1 p2*
BR2 (p1)
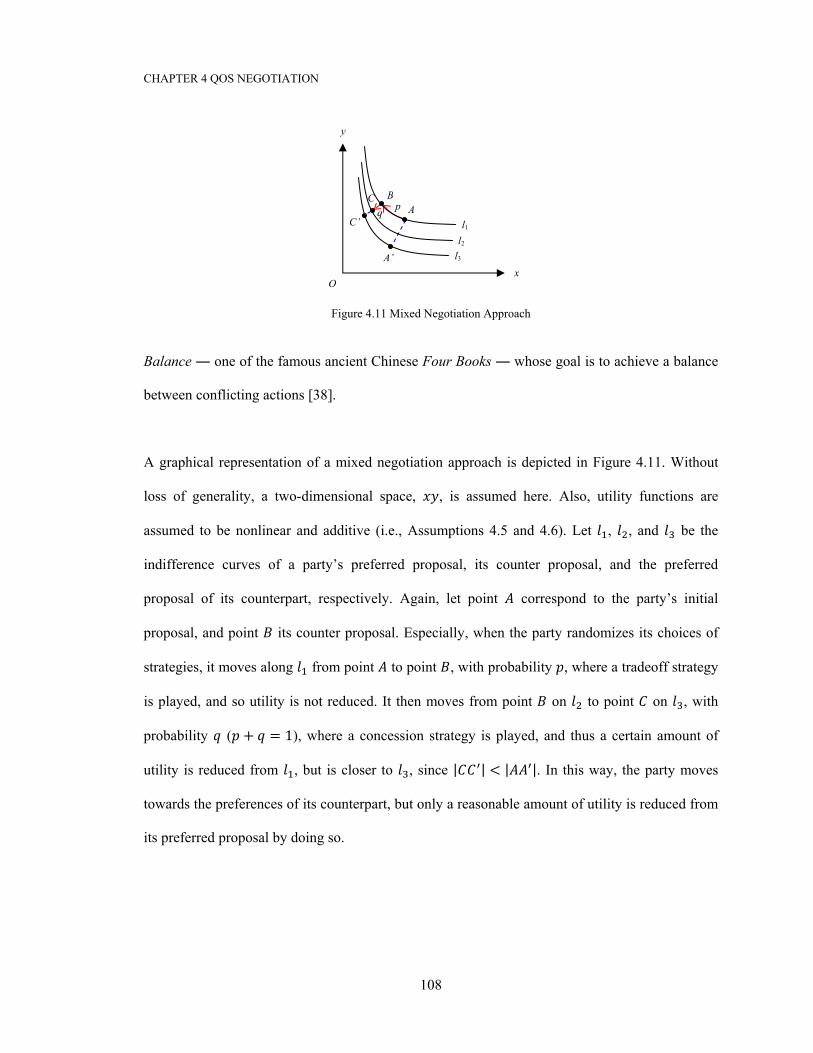
CHAPTER 4 QOS NEGOTIATION
108
Figure 4.11 Mixed Negotiation Approach
Balance ― one of the famous ancient Chinese Four Books ― whose goal is to achieve a balance
between conflicting actions [38].
A graphical representation of a mixed negotiation approach is depicted in Figure 4.11. Without
loss of generality, a two-dimensional space, , is assumed here. Also, utility functions are
assumed to be nonlinear and additive (i.e., Assumptions 4.5 and 4.6). Let , , and be the
indifference curves of a party’s preferred proposal, its counter proposal, and the preferred
proposal of its counterpart, respectively. Again, let point correspond to the party’s initial
proposal, and point its counter proposal. Especially, when the party randomizes its choices of
strategies, it moves along from point to point , with probability , where a tradeoff strategy
is played, and so utility is not reduced. It then moves from point on to point on , with
probability ( + = 1), where a concession strategy is played, and thus a certain amount of
utility is reduced from , but is closer to , since | | < | |. In this way, the party moves
towards the preferences of its counterpart, but only a reasonable amount of utility is reduced from
its preferred proposal by doing so.
q C
C’
y
xO
l3
l1
B
A’
A
l2
p
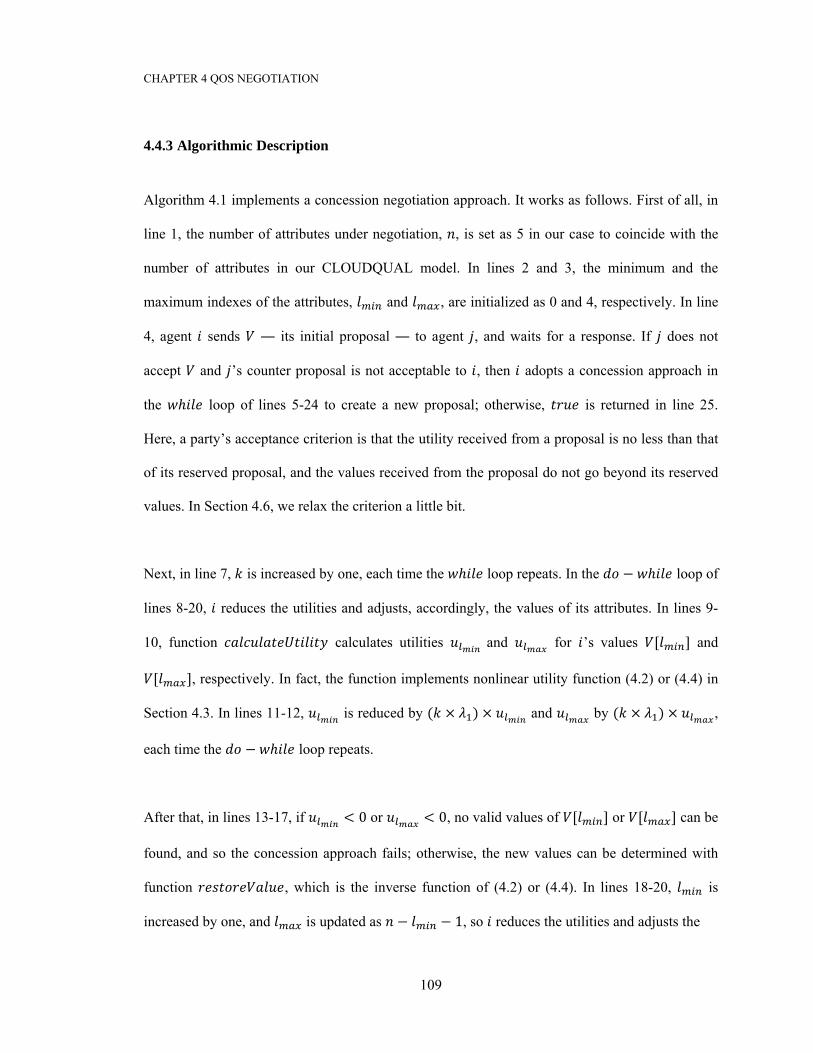
CHAPTER 4 QOS NEGOTIATION
109
4.4.3 Algorithmic Description
Algorithm 4.1 implements a concession negotiation approach. It works as follows. First of all, in
line 1, the number of attributes under negotiation, , is set as 5 in our case to coincide with the
number of attributes in our CLOUDQUAL model. In lines 2 and 3, the minimum and the
maximum indexes of the attributes, and , are initialized as 0 and 4, respectively. In line
4, agent sends ― its initial proposal ― to agent , and waits for a response. If does not
accept and ’s counter proposal is not acceptable to , then adopts a concession approach in
the ℎ loop of lines 5-24 to create a new proposal; otherwise, is returned in line 25.
Here, a party’s acceptance criterion is that the utility received from a proposal is no less than that
of its reserved proposal, and the values received from the proposal do not go beyond its reserved
values. In Section 4.6, we relax the criterion a little bit.
Next, in line 7, is increased by one, each time the ℎ loop repeats. In the − ℎ loop of
lines 8-20, reduces the utilities and adjusts, accordingly, the values of its attributes. In lines 9-
10, function calculates utilities and for ’s values [ ] and [ ], respectively. In fact, the function implements nonlinear utility function (4.2) or (4.4) in
Section 4.3. In lines 11-12, is reduced by ( × ) × and by ( × ) × ,
each time the − ℎ loop repeats.
After that, in lines 13-17, if < 0 or < 0, no valid values of [ ] or [ ] can be
found, and so the concession approach fails; otherwise, the new values can be determined with
function , which is the inverse function of (4.2) or (4.4). In lines 18-20, is
increased by one, and is updated as − − 1, so reduces the utilities and adjusts the
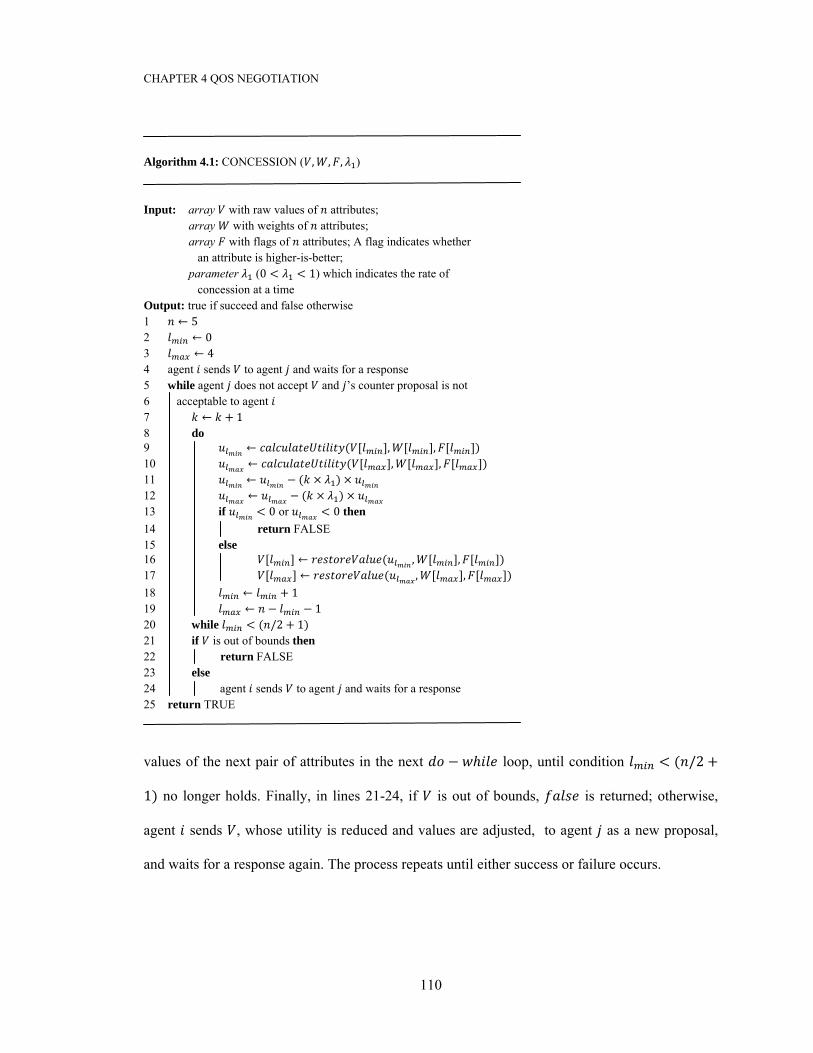
CHAPTER 4 QOS NEGOTIATION
110
Algorithm 4.1: CONCESSION ( , , , ) Input: array with raw values of attributes; array with weights of attributes; array with flags of attributes; A flag indicates whether an attribute is higher-is-better; parameter (0 < < 1) which indicates the rate of concession at a time Output: true if succeed and false otherwise 1 ← 5 2 ← 0 3 ← 4 4 agent sends to agent and waits for a response 5 while agent does not accept and ’s counter proposal is not 6 acceptable to agent 7 ← + 1 8 do 9 ← ( [ ], [ ], [ ]) 10 ← ( [ ], [ ], [ ]) 11 ← − ( × ) × 12 ← − ( × ) × 13 if < 0 or < 0 then 14 return FALSE 15 else 16 [ ] ← ( , [ ], [ ]) 17 [ ] ← ( , [ ], [ ]) 18 ← + 1 19 ← − − 1 20 while < ( /2 + 1) 21 if is out of bounds then 22 return FALSE 23 else 24 agent sends to agent and waits for a response 25 return TRUE
values of the next pair of attributes in the next − ℎ loop, until condition < ( /2 +1) no longer holds. Finally, in lines 21-24, if is out of bounds, is returned; otherwise,
agent sends , whose utility is reduced and values are adjusted, to agent as a new proposal,
and waits for a response again. The process repeats until either success or failure occurs.
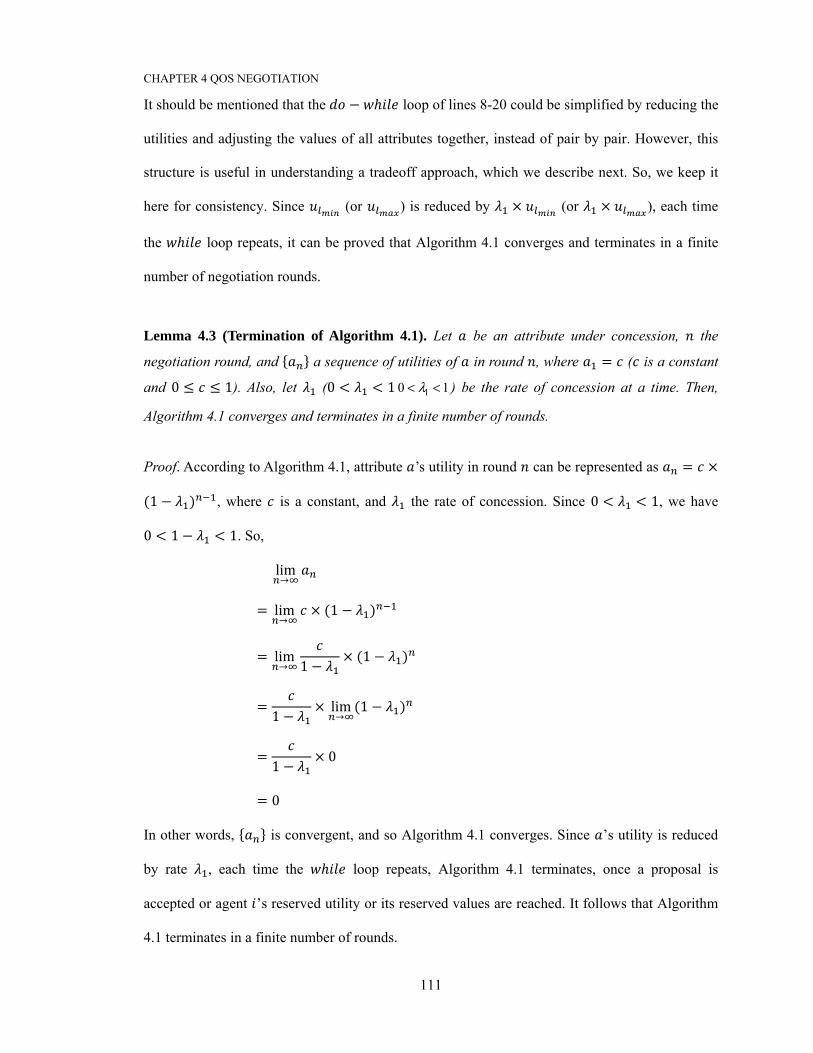
CHAPTER 4 QOS NEGOTIATION
111
It should be mentioned that the − ℎ loop of lines 8-20 could be simplified by reducing the
utilities and adjusting the values of all attributes together, instead of pair by pair. However, this
structure is useful in understanding a tradeoff approach, which we describe next. So, we keep it
here for consistency. Since (or ) is reduced by × (or × ), each time
the ℎ loop repeats, it can be proved that Algorithm 4.1 converges and terminates in a finite
number of negotiation rounds.
Lemma 4.3 (Termination of Algorithm 4.1). Let be an attribute under concession, the
negotiation round, and { } a sequence of utilities of in round , where = ( is a constant
and 0 ≤ ≤ 1). Also, let (0 < < 1 10 1λ< < ) be the rate of concession at a time. Then,
Algorithm 4.1 converges and terminates in a finite number of rounds.
Proof. According to Algorithm 4.1, attribute ’s utility in round can be represented as = ×(1 − ) , where is a constant, and the rate of concession. Since 0 < < 1, we have 0 < 1 − < 1. So, lim→ = lim→ × (1 − )
= lim→ 1 − × (1 − )
= 1 − × lim→ (1 − )
= 1 − × 0
= 0
In other words, { } is convergent, and so Algorithm 4.1 converges. Since ’s utility is reduced
by rate , each time the ℎ loop repeats, Algorithm 4.1 terminates, once a proposal is
accepted or agent ’s reserved utility or its reserved values are reached. It follows that Algorithm
4.1 terminates in a finite number of rounds.
CHAPTER 4 QOS NEGOTIATION
112
∎
Algorithm 4.2 implements a tradeoff negotiation approach, which differs with Algorithm 4.1 in
three parts. First, in lines 8 and 9, arrays and are copied to and for later use. In line
10, function ranks, in nondecreasing order, , according to its values.
Second, in lines 12-13, function determines indexes and of two attributes in ,
whose weights are the smallest and the biggest, respectively, in the current − ℎ loop. In
lines 14-15, function calculates their utilities and , respectively. In
lines 16-18, is reduced by ( × ) × , which is added to next, each time the − ℎ loop repeats. It thus ensures that agent ’s less important attribute generates more
utility for agent , and ’s more important attribute creates more utility for itself.
Third, in lines 19-23, if < 0 or < 0, no valid values of [ ] or [ ] can be
found, and so the tradeoff approach fails; otherwise, the new values can be found with function
. In lines 24-26, is increased by one, and is updated as − − 1, so
exchanges the utilities and adjusts the values of the next pair of attributes in the next − ℎ
loop, until condition < ( /2 + 1) no longer holds. The rest is similar to that of Algorithm
4.1. It can be proved that Algorithm 4.2 converges and terminates in a finite number of rounds
too.
Lemma 4.4 (Termination of Algorithm 4.2). Let and be a pair of attributes under tradeoff,
the negotiation round, and { } and { } two sequences of utilities of and in round ,
respectively, where = and = ( and are two constants, 0 ≤ ≤ 1 and 0 ≤ ≤1). Also, let (0 < < 1) be the rate of tradeoff at a time. Then, Algorithm 4.2 converges and
terminates in a finite number of rounds.
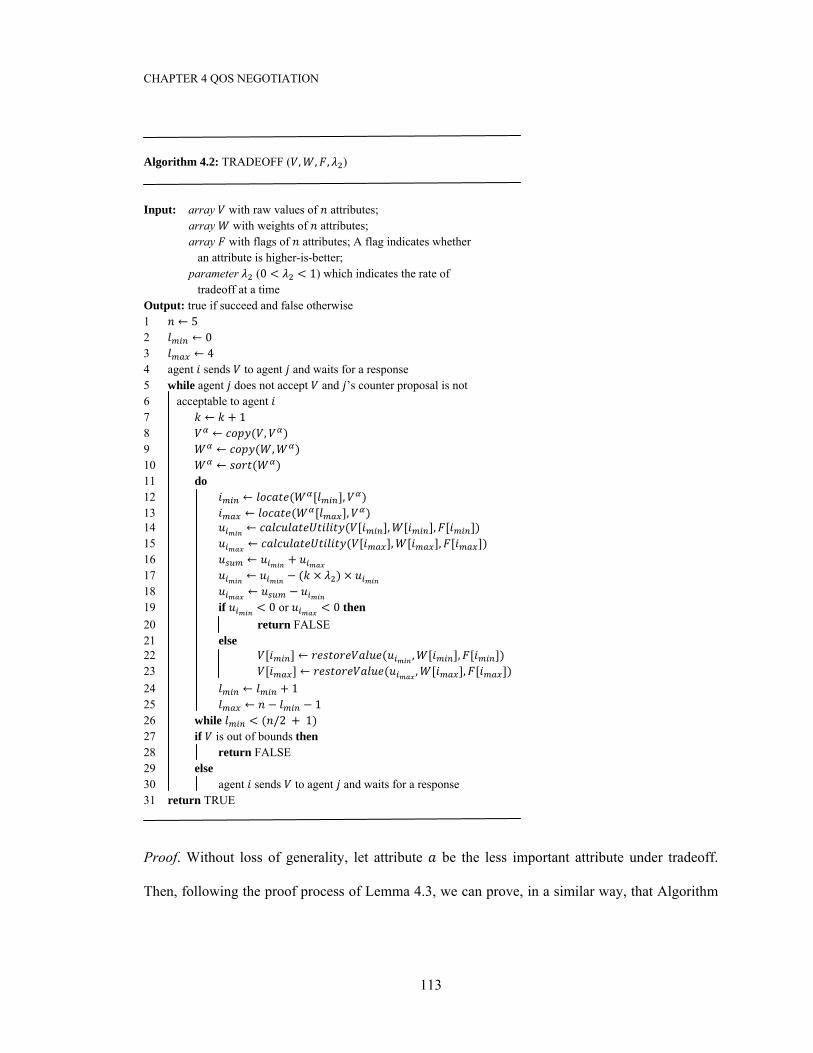
CHAPTER 4 QOS NEGOTIATION
113
Algorithm 4.2: TRADEOFF ( , , , ) Input: array with raw values of attributes; array with weights of attributes; array with flags of attributes; A flag indicates whether an attribute is higher-is-better; parameter (0 < < 1) which indicates the rate of tradeoff at a time Output: true if succeed and false otherwise 1 ← 5 2 ← 0 3 ← 4 4 agent sends to agent and waits for a response 5 while agent does not accept and ’s counter proposal is not 6 acceptable to agent 7 ← + 1 8 ← ( , ) 9 ← ( , ) 10 ← ( ) 11 do 12 ← ( [ ], ) 13 ← ( [ ], ) 14 ← ( [ ], [ ], [ ]) 15 ← ( [ ], [ ], [ ]) 16 ← + 17 ← − ( × ) × 18 ← − 19 if < 0 or < 0 then 20 return FALSE 21 else 22 [ ] ← ( , [ ], [ ]) 23 [ ] ← ( , [ ], [ ]) 24 ← + 1 25 ← − − 1 26 while < ( /2 + 1) 27 if is out of bounds then 28 return FALSE 29 else 30 agent sends to agent and waits for a response 31 return TRUE
Proof. Without loss of generality, let attribute be the less important attribute under tradeoff.
Then, following the proof process of Lemma 4.3, we can prove, in a similar way, that Algorithm
CHAPTER 4 QOS NEGOTIATION
114
4.2 converges and terminates in a finite number of rounds too. For conciseness, we omit the
process here. ∎
Algorithm 4.3 implements a mixed negotiation approach. It works as follows. First, in line 1,
agent sends ― its initial proposal ― to agent , and waits for a response. If does not accept
and ’s counter proposal is not acceptable to , then adopts a mixed approach in the ℎ
loop of lines 2-15 to create a new proposal; otherwise, is returned in line 16.
Next, in line 4, uses function to generate a random number between 0 and 1 for
variable . In lines 5-10, if < 1 − , which implies that a concession strategy is triggered, uses
function to create a new proposal, where { < 1 − } = 1 − . In line 6, is
increased by one, each time the condition is triggered. In fact, is quite similar to the
body of the ℎ loop of lines 7-20 in Algorithm 4.1, if it is run just once. So, we do not
elaborate it further here. If ≥ 1 − , which implies that a tradeoff strategy is triggered, uses
function to create a new proposal, where { ≥ 1 − } = . In line 9, is
increased by one, each time the condition is triggered. In fact, is quite similar to the
body of the ℎ loop of lines 7-26 in Algorithm 4.2, if it is run just once. So, we do not
elaborate it further either. In line 11, counts the total number of negotiation rounds.
Last, in lines 12-15, if is out of bounds, is returned; otherwise, agent sends , whose
values are adjusted, to agent as a new proposal, and waits for a response again. The process
repeats until either success or failure occurs. In this process, ’s utility of the current proposal can
remain the same ( moves along its current indifference curve), or be reduced ( moves down to
its next indifference curve). In fact, ’s mixed behavior can be described as a regular expression
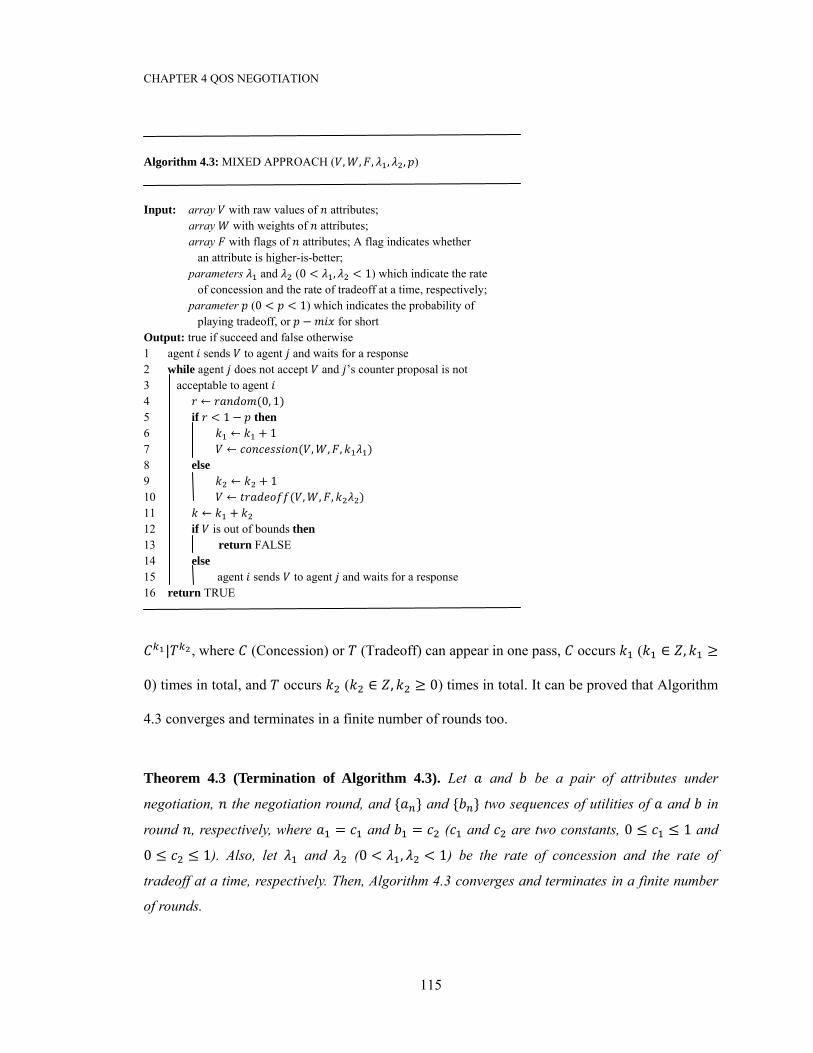
CHAPTER 4 QOS NEGOTIATION
115
Algorithm 4.3: MIXED APPROACH ( , , , , , ) Input: array with raw values of attributes; array with weights of attributes; array with flags of attributes; A flag indicates whether an attribute is higher-is-better; parameters and (0 < , < 1) which indicate the rate of concession and the rate of tradeoff at a time, respectively; parameter (0 < < 1) which indicates the probability of playing tradeoff, or − for short Output: true if succeed and false otherwise 1 agent sends to agent and waits for a response 2 while agent does not accept and ’s counter proposal is not 3 acceptable to agent 4 ← (0, 1) 5 if < 1 − then 6 ← + 1 7 ← ( , , , ) 8 else 9 ← + 1 10 ← ( , , , ) 11 ← + 12 if is out of bounds then 13 return FALSE 14 else 15 agent sends to agent and waits for a response 16 return TRUE | , where (Concession) or (Tradeoff) can appear in one pass, occurs ( ∈ , ≥0) times in total, and occurs ( ∈ , ≥ 0) times in total. It can be proved that Algorithm
4.3 converges and terminates in a finite number of rounds too.
Theorem 4.3 (Termination of Algorithm 4.3). Let and be a pair of attributes under
negotiation, the negotiation round, and { } and { } two sequences of utilities of and in
round , respectively, where = and = ( and are two constants, 0 ≤ ≤ 1 and 0 ≤ ≤ 1). Also, let and (0 < , < 1) be the rate of concession and the rate of
tradeoff at a time, respectively. Then, Algorithm 4.3 converges and terminates in a finite number
of rounds.
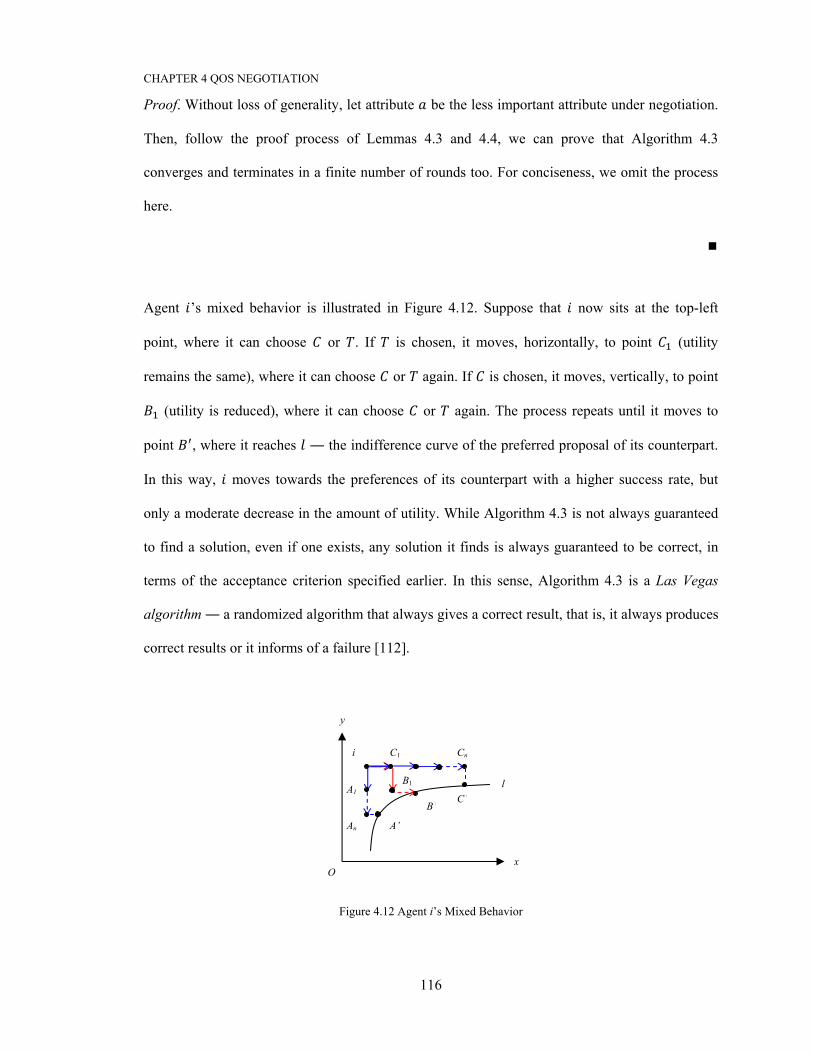
CHAPTER 4 QOS NEGOTIATION
116
Proof. Without loss of generality, let attribute be the less important attribute under negotiation.
Then, follow the proof process of Lemmas 4.3 and 4.4, we can prove that Algorithm 4.3
converges and terminates in a finite number of rounds too. For conciseness, we omit the process
here. ∎
Agent ’s mixed behavior is illustrated in Figure 4.12. Suppose that now sits at the top-left
point, where it can choose or . If is chosen, it moves, horizontally, to point (utility
remains the same), where it can choose or again. If is chosen, it moves, vertically, to point
(utility is reduced), where it can choose or again. The process repeats until it moves to
point , where it reaches ― the indifference curve of the preferred proposal of its counterpart.
In this way, moves towards the preferences of its counterpart with a higher success rate, but
only a moderate decrease in the amount of utility. While Algorithm 4.3 is not always guaranteed
to find a solution, even if one exists, any solution it finds is always guaranteed to be correct, in
terms of the acceptance criterion specified earlier. In this sense, Algorithm 4.3 is a Las Vegas
algorithm ― a randomized algorithm that always gives a correct result, that is, it always produces
correct results or it informs of a failure [112].
Figure 4.12 Agent i’s Mixed Behavior
B1
y
xO
C1 Cn
l
A’
B’C’
An
i
A1
CHAPTER 4 QOS NEGOTIATION
117
It should be noted that the mixed approach we adopt in negotiation exhibits a certain degree of
intelligence. Just as Alan Turing (1950) pointed out in Computing Machinery and Intelligence,
“Intelligent behavior presumably consists in a departure from the completely disciplined behavior
involved in computation, but a rather slight one, which does not give arise to random behavior, or
to pointless repetitive loops”.
4.5 Evaluation and Analysis
In this section, we conduct extensive simulations to evaluate the mixed approach for cloud
service negotiation. First, we describe the experimental setup. Next, we describe the parameter
setup. Last, we report and analyze simulation results.
4.5.1 Experimental Setup
All simulations are conducted on a Lenovo® ThinkCentre™ desktop with a 2.80 GHz Intel®
Pentium™ Dual-Core CPU and a 2.96 GB RAM, running Microsoft® Windows 7 Professional™
Operating System. The simulations are implemented with Java under NetBeans IDE 7.2.1 with
JDK 7u13 [81].
An alternating-offers protocol is adopted as the negotiation protocol, and a mixed strategy is
compared with concession and tradeoff strategies. The negotiation process works as follows. First
of all, without loss of generality, a SP sends its initial proposal to a SC. Next, if the proposal is
accepted by the SC, negotiation ends successfully; otherwise, the SC uses either mixed, tradeoff
or concession negotiation approach to create a counter proposal. After that, the SC sends back the
counter proposal to the SP, and the negotiation process repeats. The process ends once a proposal
or a counter proposal is accepted, and it fails if no proposal is acceptable to both parties.
CHAPTER 4 QOS NEGOTIATION
118
Java multithreading, which allows multiple tasks in a program to be executed concurrently, is the
ideal technique to simulate the negotiation process. A thread is the flow of execution, from
beginning to end, of a task. So, we model the behaviors of the SP and the SC as two threads. In
particular, we use thread synchronization techniques to coordinate their behaviors, and a shared
object to exchange their proposals and counter proposals. Figure 4.13 shows the negotiation
interface of our software prototype. On the top is a QoS matrix to be negotiated, where the SP and
the SC can specify their QoS preferences, i.e., their preferred values, reserved values, and weights
over quality dimensions AVAL, REL, RESP, SECY, and ELAS. In a real negotiation, those
values would be kept private. In our simulations, we attempt to resolve QoS conflicts in the
motivating example. In other words, we use Table 4.1 as the QoS matrix to be negotiated. Also,
on the top is parameter (0 < < 1) which can be used to generate a random number
within a certain interval of a value, such that the impact of a specific data set on negotiation
results can be reduced, if not completely removed.
On the left are negotiation strategies to be employed, where the SP and the SC can choose a
concession, a tradeoff, or a mixed approach. So, in total, there exist nine combinations, i.e., , , , , , , , , where stands for a concession approach, a tradeoff
one, and a mixed one. Also, on the left are parameters the rate of concession (0 < < 1),
the rate of tradeoff (0 < < 1), and the probability of playing tradeoff (0 < < 1) (or − for short).
On the right are negotiation results, where success or failure can happen. In the case that success
occurs, QoS conflicts are resolved, and the new values agreed to by the SP and the SC are output.
In the case that failure happens, relevant information about the failure is output. Also, on the right
is parameter (0 < < 1), within which a solution whose values go beyond a party’s
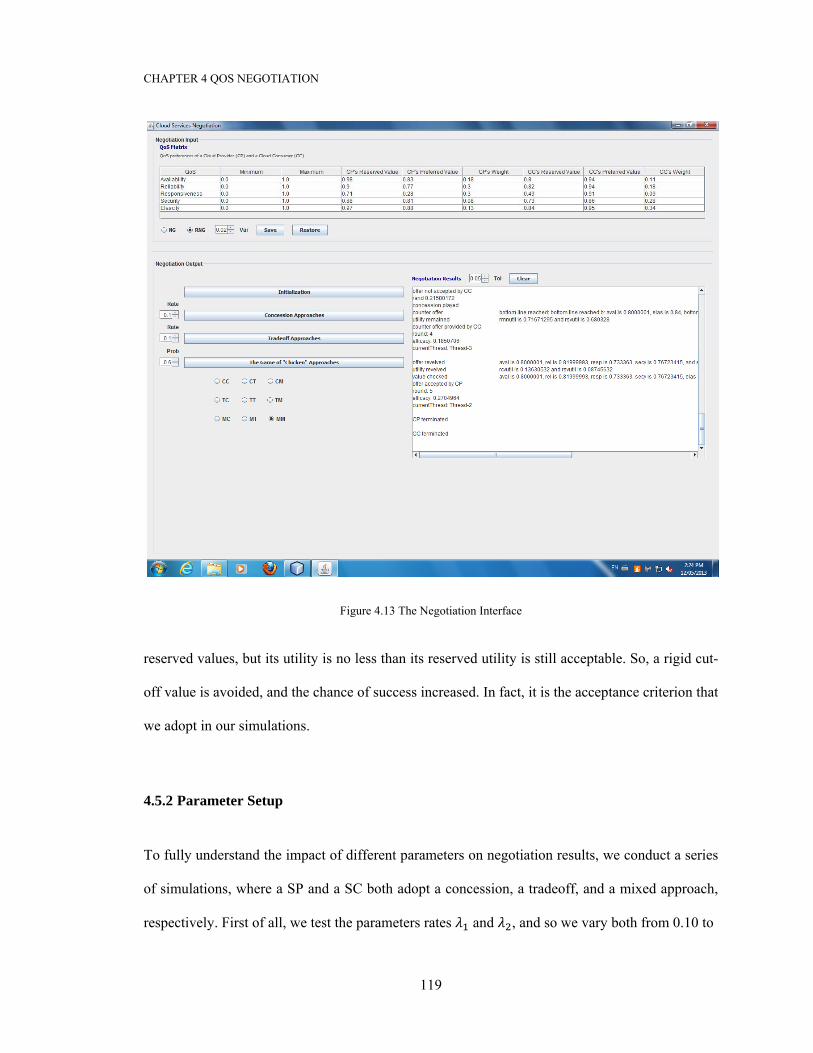
CHAPTER 4 QOS NEGOTIATION
119
Figure 4.13 The Negotiation Interface
reserved values, but its utility is no less than its reserved utility is still acceptable. So, a rigid cut-
off value is avoided, and the chance of success increased. In fact, it is the acceptance criterion that
we adopt in our simulations.
4.5.2 Parameter Setup
To fully understand the impact of different parameters on negotiation results, we conduct a series
of simulations, where a SP and a SC both adopt a concession, a tradeoff, and a mixed approach,
respectively. First of all, we test the parameters rates and , and so we vary both from 0.10 to
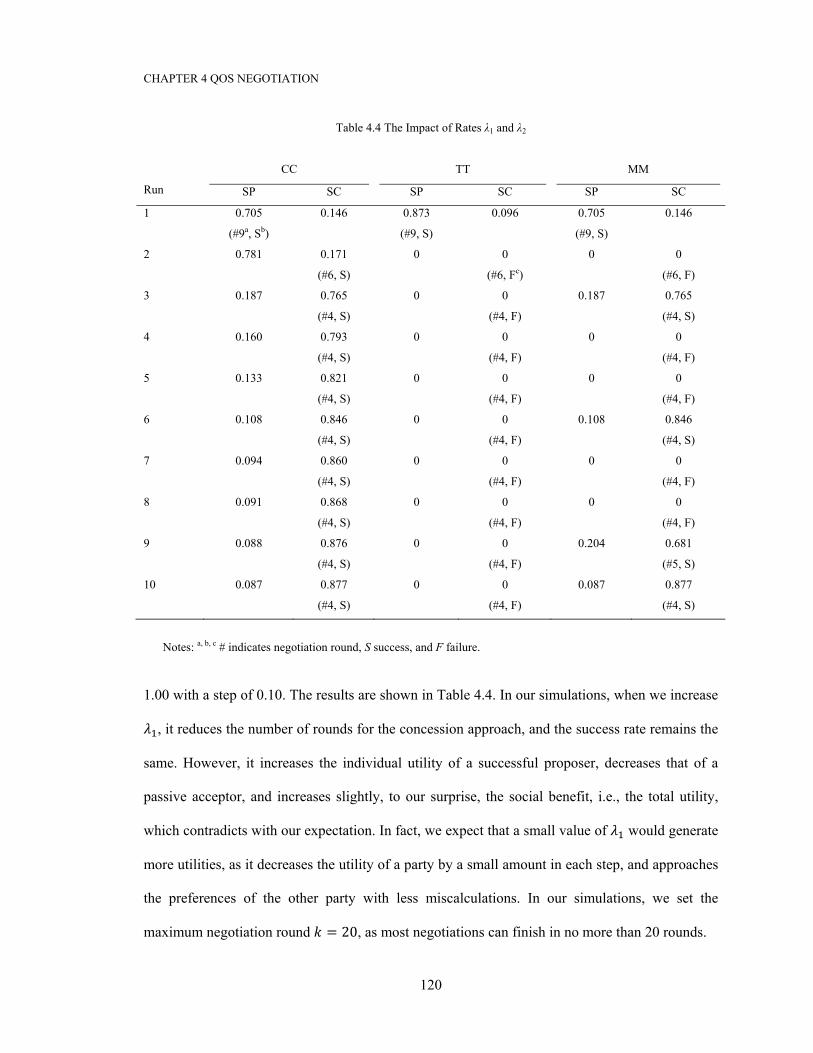
CHAPTER 4 QOS NEGOTIATION
120
Table 4.4 The Impact of Rates λ1 and λ2
Run
CC TT MM
SP SC SP SC SP SC
1 0.705
(#9a, Sb)
0.146 0.873
(#9, S)
0.096 0.705
(#9, S)
0.146
2 0.781
0.171
(#6, S)
0
0
(#6, Fc)
0
0
(#6, F)
3 0.187 0.765
(#4, S)
0 0
(#4, F)
0.187 0.765
(#4, S)
4 0.160 0.793
(#4, S)
0 0
(#4, F)
0 0
(#4, F)
5 0.133 0.821
(#4, S)
0 0
(#4, F)
0 0
(#4, F)
6 0.108 0.846
(#4, S)
0 0
(#4, F)
0.108 0.846
(#4, S)
7 0.094 0.860
(#4, S)
0 0
(#4, F)
0 0
(#4, F)
8 0.091 0.868
(#4, S)
0 0
(#4, F)
0 0
(#4, F)
9 0.088 0.876
(#4, S)
0 0
(#4, F)
0.204 0.681
(#5, S)
10 0.087 0.877
(#4, S)
0 0
(#4, F)
0.087 0.877
(#4, S)
Notes: a, b, c # indicates negotiation round, S success, and F failure.
1.00 with a step of 0.10. The results are shown in Table 4.4. In our simulations, when we increase
, it reduces the number of rounds for the concession approach, and the success rate remains the
same. However, it increases the individual utility of a successful proposer, decreases that of a
passive acceptor, and increases slightly, to our surprise, the social benefit, i.e., the total utility,
which contradicts with our expectation. In fact, we expect that a small value of would generate
more utilities, as it decreases the utility of a party by a small amount in each step, and approaches
the preferences of the other party with less miscalculations. In our simulations, we set the
maximum negotiation round = 20, as most negotiations can finish in no more than 20 rounds.
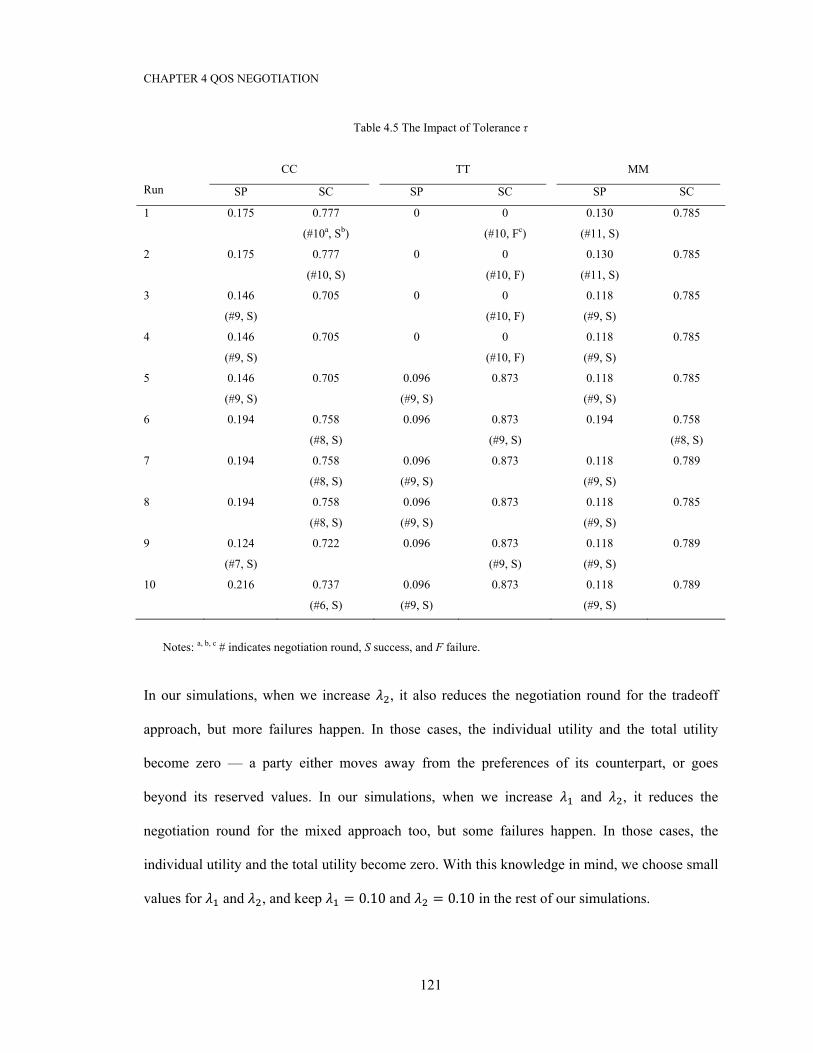
CHAPTER 4 QOS NEGOTIATION
121
Table 4.5 The Impact of Tolerance τ
Run
CC TT MM
SP SC SP SC SP SC
1 0.175
0.777
(#10a, Sb)
0
0
(#10, Fc)
0.130
(#11, S)
0.785
2 0.175
0.777
(#10, S)
0
0
(#10, F)
0.130
(#11, S)
0.785
3 0.146
(#9, S)
0.705
0 0
(#10, F)
0.118
(#9, S)
0.785
4 0.146
(#9, S)
0.705
0 0
(#10, F)
0.118
(#9, S)
0.785
5 0.146
(#9, S)
0.705
0.096
(#9, S)
0.873
0.118
(#9, S)
0.785
6 0.194 0.758
(#8, S)
0.096 0.873
(#9, S)
0.194 0.758
(#8, S)
7 0.194 0.758
(#8, S)
0.096
(#9, S)
0.873
0.118
(#9, S)
0.789
8 0.194 0.758
(#8, S)
0.096
(#9, S)
0.873
0.118
(#9, S)
0.785
9 0.124
(#7, S)
0.722
0.096 0.873
(#9, S)
0.118
(#9, S)
0.789
10 0.216 0.737
(#6, S)
0.096
(#9, S)
0.873
0.118
(#9, S)
0.789
Notes: a, b, c # indicates negotiation round, S success, and F failure.
In our simulations, when we increase , it also reduces the negotiation round for the tradeoff
approach, but more failures happen. In those cases, the individual utility and the total utility
become zero — a party either moves away from the preferences of its counterpart, or goes
beyond its reserved values. In our simulations, when we increase and , it reduces the
negotiation round for the mixed approach too, but some failures happen. In those cases, the
individual utility and the total utility become zero. With this knowledge in mind, we choose small
values for and , and keep = 0.10 and = 0.10 in the rest of our simulations.

CHAPTER 4 QOS NEGOTIATION
122
Table 4.6 The Impact of p-mix
Run
MM
SP SC Total
1 0.146
(#11a, Sb)
0.705 0.851
2 0.138
(#11, S)
0.722 0.860
3 0.118
(#11, S)
0.789 0.907
4 0.140
(#11, S)
0.714 0.854
5 0.118
(#11, S)
0.785 0.903
6 0.096
(#11, S)
0.873 0.969
7 0.118
(#11, S)
0.789 0.907
8 0.118
(#11, S)
0.785 0.903
9 0.096
(#11, S)
0.873 0.969
10 0.096
(#11, S)
0.873 0.969
Notes: a, b # indicates negotiation round and S success.
Second, we test the parameter , and so we vary it from 0.01 to 0.10 with a step of
0.01. The results are shown in Table 4.5. In our simulations, when we increase , it reduces the
negotiation round for the concession approach, and its success rate remains the same. However, it
increases the individual utility of a successful proposer, decreases that of a passive acceptor, and
decreases slightly, sometimes, the total utility. In our simulations, when we increase , it also
reduces the negotiation round for the tradeoff approach, but fewer failures happen. Both the
individual utility and the total utility are increased. So, the use of tolerance is justified. In our
simulations, when we increase , it reduces the negotiation round for the mixed approach too, and
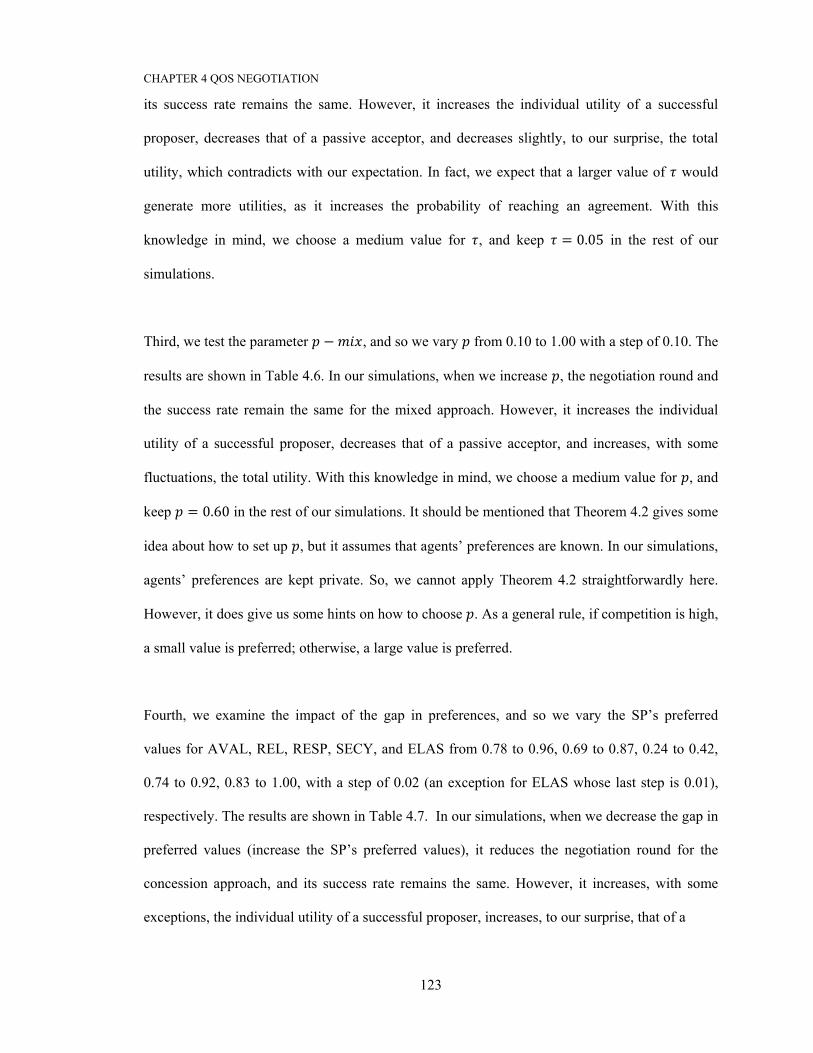
CHAPTER 4 QOS NEGOTIATION
123
its success rate remains the same. However, it increases the individual utility of a successful
proposer, decreases that of a passive acceptor, and decreases slightly, to our surprise, the total
utility, which contradicts with our expectation. In fact, we expect that a larger value of would
generate more utilities, as it increases the probability of reaching an agreement. With this
knowledge in mind, we choose a medium value for , and keep = 0.05 in the rest of our
simulations.
Third, we test the parameter − , and so we vary from 0.10 to 1.00 with a step of 0.10. The
results are shown in Table 4.6. In our simulations, when we increase , the negotiation round and
the success rate remain the same for the mixed approach. However, it increases the individual
utility of a successful proposer, decreases that of a passive acceptor, and increases, with some
fluctuations, the total utility. With this knowledge in mind, we choose a medium value for , and
keep = 0.60 in the rest of our simulations. It should be mentioned that Theorem 4.2 gives some
idea about how to set up , but it assumes that agents’ preferences are known. In our simulations,
agents’ preferences are kept private. So, we cannot apply Theorem 4.2 straightforwardly here.
However, it does give us some hints on how to choose . As a general rule, if competition is high,
a small value is preferred; otherwise, a large value is preferred.
Fourth, we examine the impact of the gap in preferences, and so we vary the SP’s preferred
values for AVAL, REL, RESP, SECY, and ELAS from 0.78 to 0.96, 0.69 to 0.87, 0.24 to 0.42,
0.74 to 0.92, 0.83 to 1.00, with a step of 0.02 (an exception for ELAS whose last step is 0.01),
respectively. The results are shown in Table 4.7. In our simulations, when we decrease the gap in
preferred values (increase the SP’s preferred values), it reduces the negotiation round for the
concession approach, and its success rate remains the same. However, it increases, with some
exceptions, the individual utility of a successful proposer, increases, to our surprise, that of a
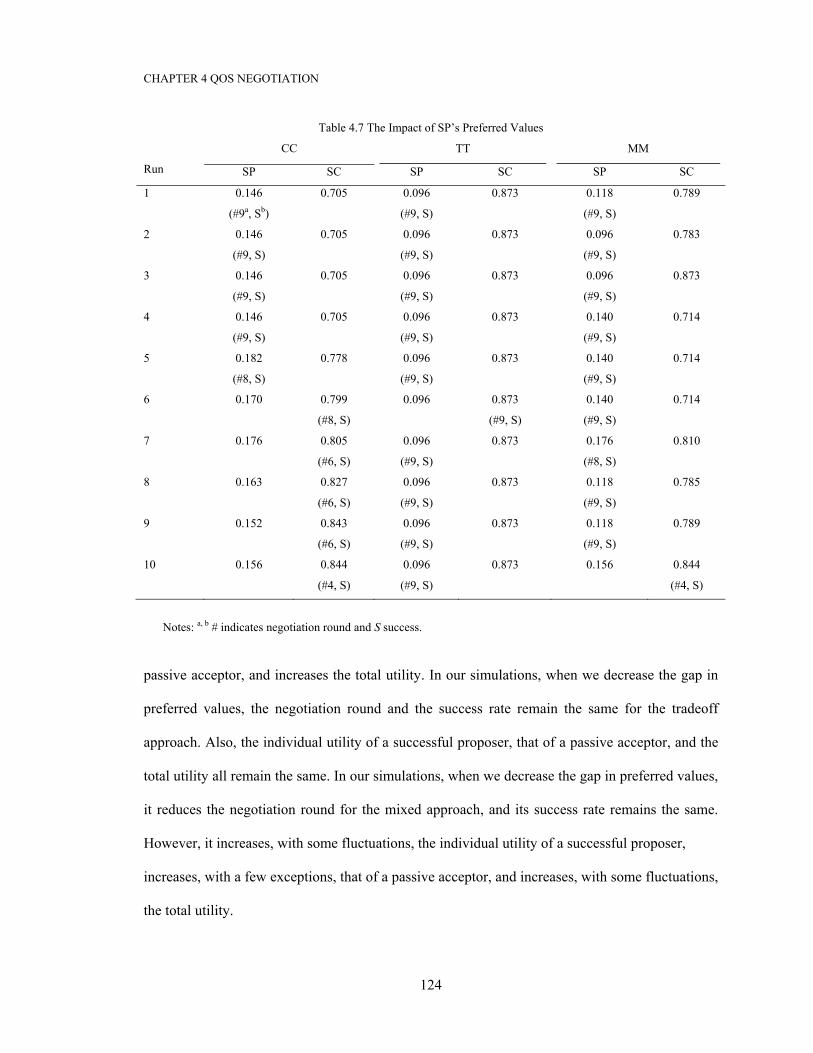
CHAPTER 4 QOS NEGOTIATION
124
Table 4.7 The Impact of SP’s Preferred Values
Run
CC TT MM
SP SC SP SC SP SC
1 0.146
(#9a, Sb)
0.705 0.096
(#9, S)
0.873
0.118
(#9, S)
0.789
2 0.146
(#9, S)
0.705
0.096
(#9, S)
0.873
0.096
(#9, S)
0.783
3 0.146
(#9, S)
0.705
0.096
(#9, S)
0.873
0.096
(#9, S)
0.873
4 0.146
(#9, S)
0.705
0.096
(#9, S)
0.873
0.140
(#9, S)
0.714
5 0.182
(#8, S)
0.778
0.096
(#9, S)
0.873
0.140
(#9, S)
0.714
6 0.170 0.799
(#8, S)
0.096 0.873
(#9, S)
0.140
(#9, S)
0.714
7 0.176 0.805
(#6, S)
0.096
(#9, S)
0.873
0.176
(#8, S)
0.810
8 0.163 0.827
(#6, S)
0.096
(#9, S)
0.873
0.118
(#9, S)
0.785
9 0.152
0.843
(#6, S)
0.096
(#9, S)
0.873
0.118
(#9, S)
0.789
10 0.156 0.844
(#4, S)
0.096
(#9, S)
0.873
0.156
0.844
(#4, S)
Notes: a, b # indicates negotiation round and S success.
passive acceptor, and increases the total utility. In our simulations, when we decrease the gap in
preferred values, the negotiation round and the success rate remain the same for the tradeoff
approach. Also, the individual utility of a successful proposer, that of a passive acceptor, and the
total utility all remain the same. In our simulations, when we decrease the gap in preferred values,
it reduces the negotiation round for the mixed approach, and its success rate remains the same.
However, it increases, with some fluctuations, the individual utility of a successful proposer,
increases, with a few exceptions, that of a passive acceptor, and increases, with some fluctuations,
the total utility.
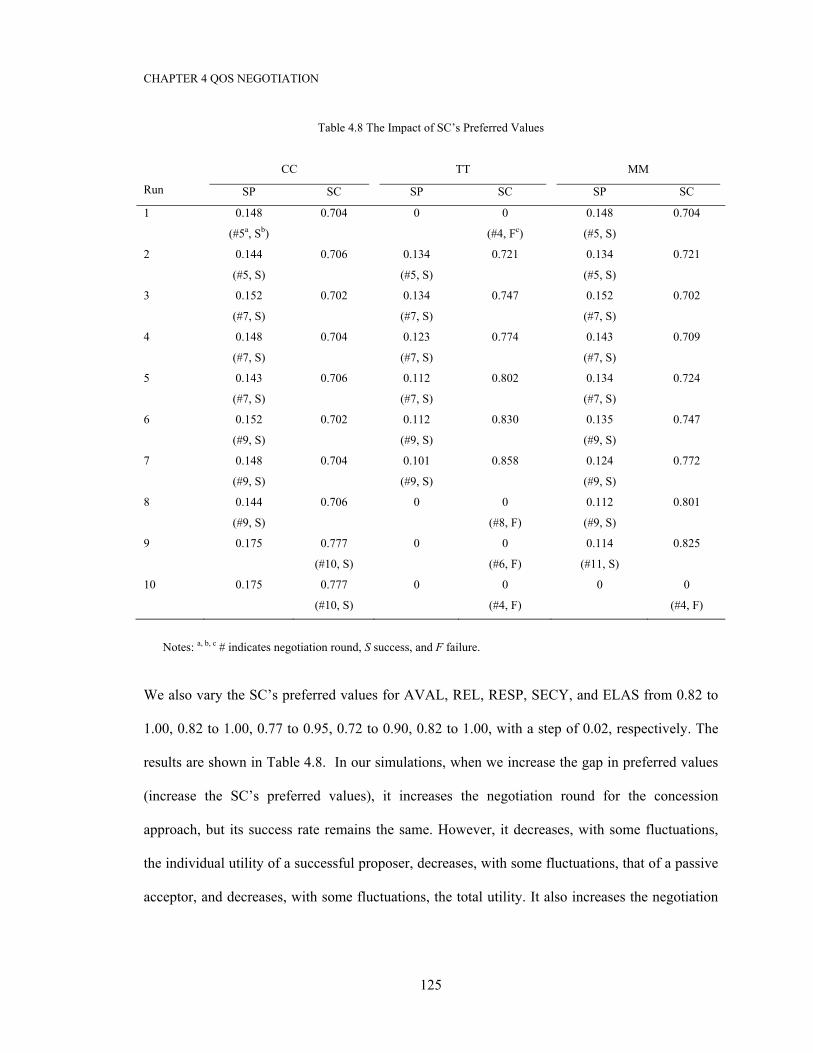
CHAPTER 4 QOS NEGOTIATION
125
Table 4.8 The Impact of SC’s Preferred Values
Run
CC TT MM
SP SC SP SC SP SC
1 0.148
(#5a, Sb)
0.704 0
0
(#4, Fc)
0.148
(#5, S)
0.704
2 0.144
(#5, S)
0.706
0.134
(#5, S)
0.721
0.134
(#5, S)
0.721
3 0.152
(#7, S)
0.702
0.134
(#7, S)
0.747
0.152
(#7, S)
0.702
4 0.148
(#7, S)
0.704
0.123
(#7, S)
0.774
0.143
(#7, S)
0.709
5 0.143
(#7, S)
0.706
0.112
(#7, S)
0.802
0.134
(#7, S)
0.724
6 0.152
(#9, S)
0.702
0.112
(#9, S)
0.830
0.135
(#9, S)
0.747
7 0.148
(#9, S)
0.704 0.101
(#9, S)
0.858
0.124
(#9, S)
0.772
8 0.144
(#9, S)
0.706
0
0
(#8, F)
0.112
(#9, S)
0.801
9 0.175
0.777
(#10, S)
0
0
(#6, F)
0.114
(#11, S)
0.825
10 0.175 0.777
(#10, S)
0
0
(#4, F)
0
0
(#4, F)
Notes: a, b, c # indicates negotiation round, S success, and F failure.
We also vary the SC’s preferred values for AVAL, REL, RESP, SECY, and ELAS from 0.82 to
1.00, 0.82 to 1.00, 0.77 to 0.95, 0.72 to 0.90, 0.82 to 1.00, with a step of 0.02, respectively. The
results are shown in Table 4.8. In our simulations, when we increase the gap in preferred values
(increase the SC’s preferred values), it increases the negotiation round for the concession
approach, but its success rate remains the same. However, it decreases, with some fluctuations,
the individual utility of a successful proposer, decreases, with some fluctuations, that of a passive
acceptor, and decreases, with some fluctuations, the total utility. It also increases the negotiation
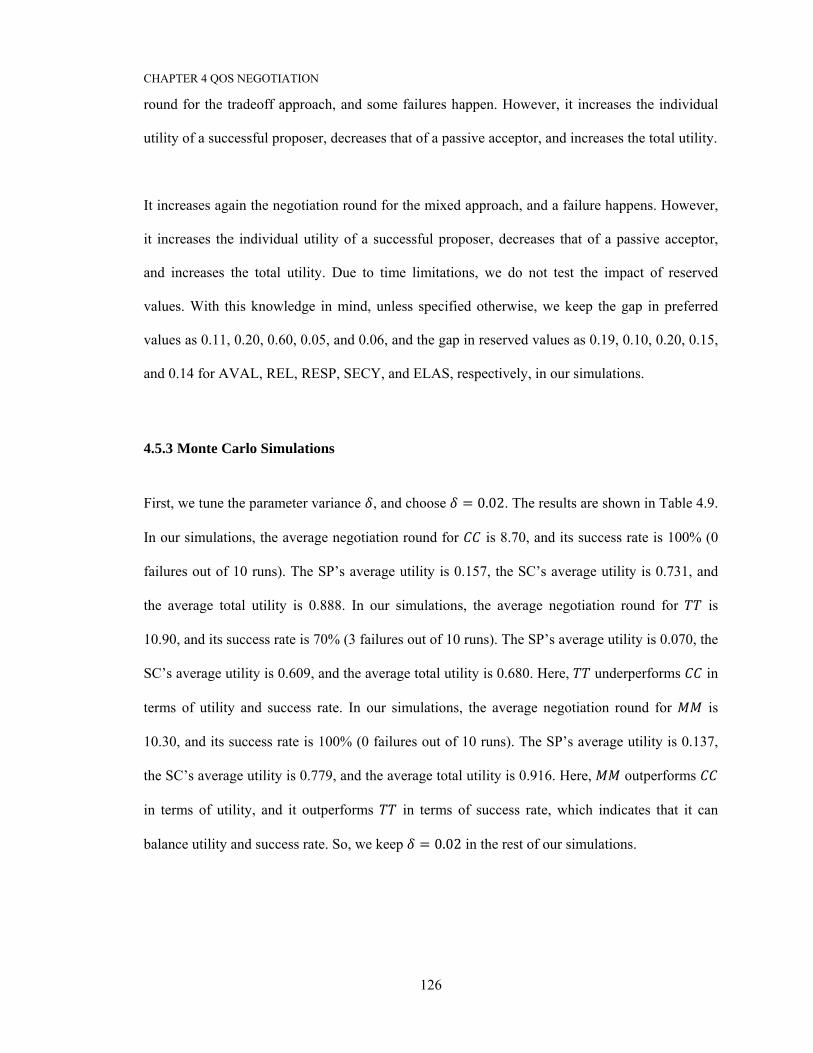
CHAPTER 4 QOS NEGOTIATION
126
round for the tradeoff approach, and some failures happen. However, it increases the individual
utility of a successful proposer, decreases that of a passive acceptor, and increases the total utility.
It increases again the negotiation round for the mixed approach, and a failure happens. However,
it increases the individual utility of a successful proposer, decreases that of a passive acceptor,
and increases the total utility. Due to time limitations, we do not test the impact of reserved
values. With this knowledge in mind, unless specified otherwise, we keep the gap in preferred
values as 0.11, 0.20, 0.60, 0.05, and 0.06, and the gap in reserved values as 0.19, 0.10, 0.20, 0.15,
and 0.14 for AVAL, REL, RESP, SECY, and ELAS, respectively, in our simulations.
4.5.3 Monte Carlo Simulations
First, we tune the parameter variance , and choose = 0.02. The results are shown in Table 4.9.
In our simulations, the average negotiation round for is 8.70, and its success rate is 100% (0
failures out of 10 runs). The SP’s average utility is 0.157, the SC’s average utility is 0.731, and
the average total utility is 0.888. In our simulations, the average negotiation round for is
10.90, and its success rate is 70% (3 failures out of 10 runs). The SP’s average utility is 0.070, the
SC’s average utility is 0.609, and the average total utility is 0.680. Here, underperforms in
terms of utility and success rate. In our simulations, the average negotiation round for is
10.30, and its success rate is 100% (0 failures out of 10 runs). The SP’s average utility is 0.137,
the SC’s average utility is 0.779, and the average total utility is 0.916. Here, outperforms
in terms of utility, and it outperforms in terms of success rate, which indicates that it can
balance utility and success rate. So, we keep = 0.02 in the rest of our simulations.
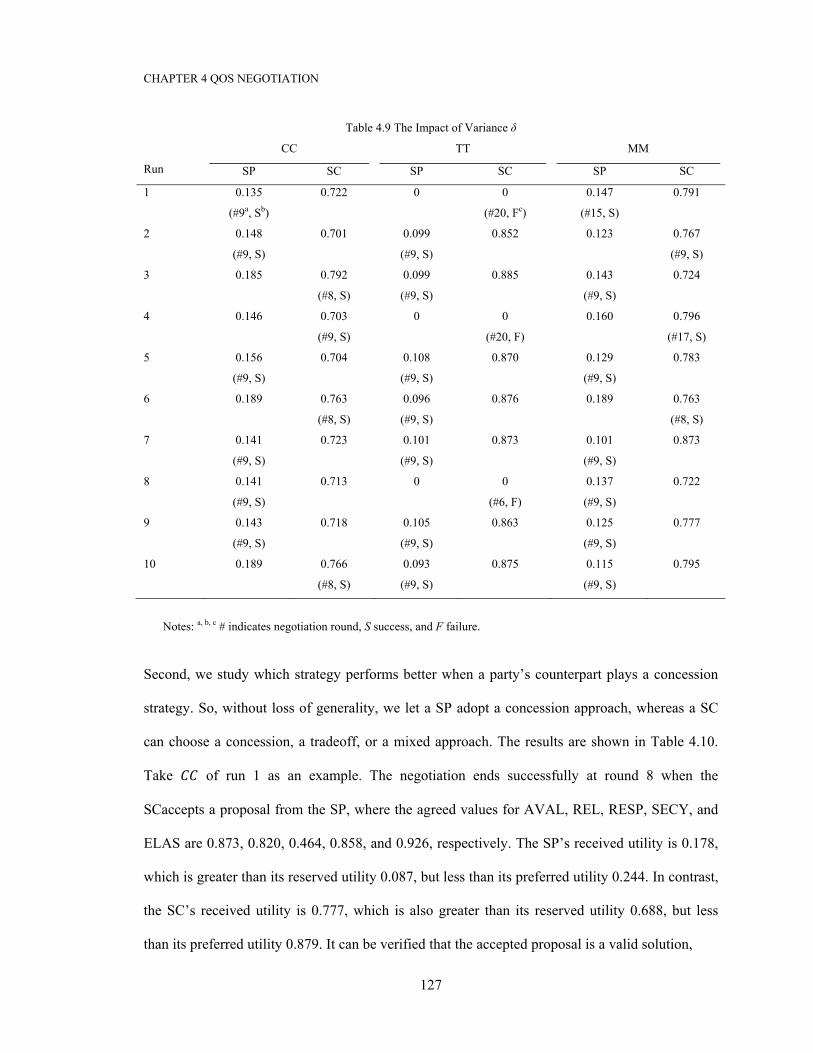
CHAPTER 4 QOS NEGOTIATION
127
Table 4.9 The Impact of Variance δ
Run
CC TT MM
SP SC SP SC SP SC
1 0.135
(#9a, Sb)
0.722 0
0
(#20, Fc)
0.147
(#15, S)
0.791
2 0.148
(#9, S)
0.701
0.099
(#9, S)
0.852
0.123
0.767
(#9, S)
3 0.185
0.792
(#8, S)
0.099
(#9, S)
0.885
0.143
(#9, S)
0.724
4 0.146
0.703
(#9, S)
0
0
(#20, F)
0.160
0.796
(#17, S)
5 0.156
(#9, S)
0.704
0.108
(#9, S)
0.870
0.129
(#9, S)
0.783
6 0.189
0.763
(#8, S)
0.096
(#9, S)
0.876
0.189
0.763
(#8, S)
7 0.141
(#9, S)
0.723 0.101
(#9, S)
0.873
0.101
(#9, S)
0.873
8 0.141
(#9, S)
0.713
0
0
(#6, F)
0.137
(#9, S)
0.722
9 0.143
(#9, S)
0.718
0.105
(#9, S)
0.863
0.125
(#9, S)
0.777
10 0.189 0.766
(#8, S)
0.093
(#9, S)
0.875
0.115
(#9, S)
0.795
Notes: a, b, c # indicates negotiation round, S success, and F failure.
Second, we study which strategy performs better when a party’s counterpart plays a concession
strategy. So, without loss of generality, we let a SP adopt a concession approach, whereas a SC
can choose a concession, a tradeoff, or a mixed approach. The results are shown in Table 4.10.
Take of run 1 as an example. The negotiation ends successfully at round 8 when the
SCaccepts a proposal from the SP, where the agreed values for AVAL, REL, RESP, SECY, and
ELAS are 0.873, 0.820, 0.464, 0.858, and 0.926, respectively. The SP’s received utility is 0.178,
which is greater than its reserved utility 0.087, but less than its preferred utility 0.244. In contrast,
the SC’s received utility is 0.777, which is also greater than its reserved utility 0.688, but less
than its preferred utility 0.879. It can be verified that the accepted proposal is a valid solution,
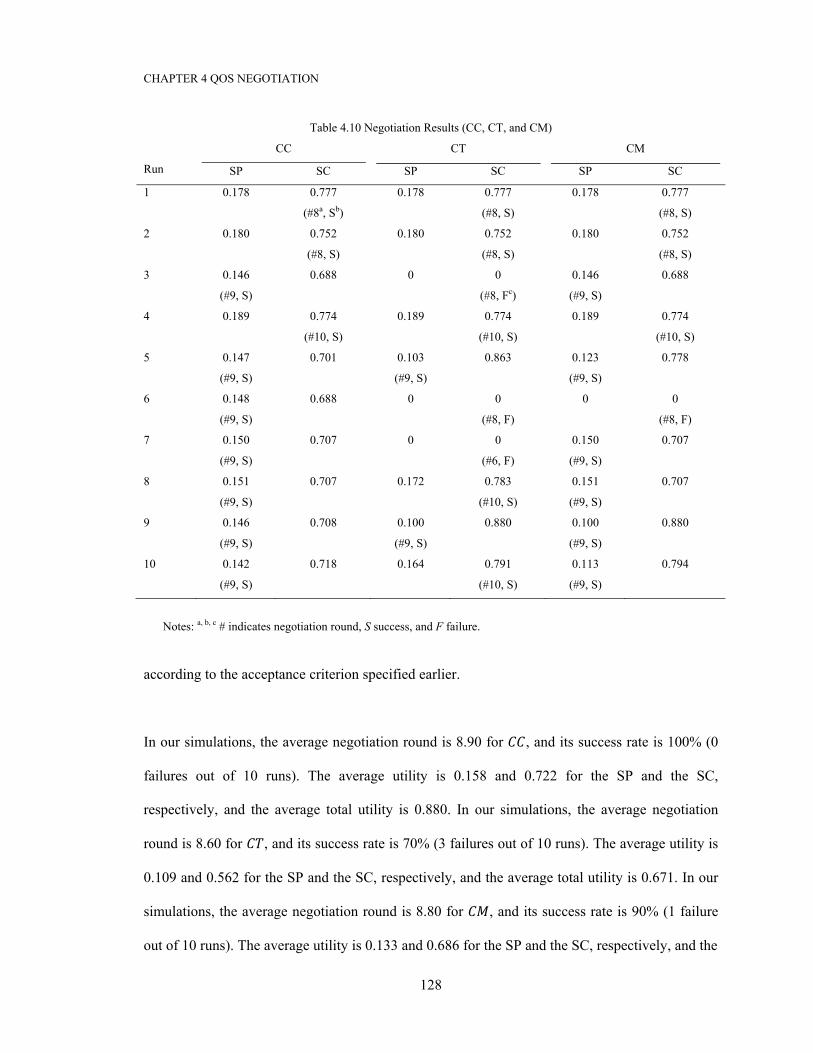
CHAPTER 4 QOS NEGOTIATION
128
Table 4.10 Negotiation Results (CC, CT, and CM)
Run
CC CT CM
SP SC SP SC SP SC
1 0.178
0.777
(#8a, Sb)
0.178
0.777
(#8, S)
0.178
0.777
(#8, S)
2 0.180
0.752
(#8, S)
0.180
0.752
(#8, S)
0.180
0.752
(#8, S)
3 0.146
(#9, S)
0.688
0
0
(#8, Fc)
0.146
(#9, S)
0.688
4 0.189
0.774
(#10, S)
0.189
0.774
(#10, S)
0.189
0.774
(#10, S)
5 0.147
(#9, S)
0.701
0.103
(#9, S)
0.863
0.123
(#9, S)
0.778
6 0.148
(#9, S)
0.688
0
0
(#8, F)
0
0
(#8, F)
7 0.150
(#9, S)
0.707 0
0
(#6, F)
0.150
(#9, S)
0.707
8 0.151
(#9, S)
0.707
0.172
0.783
(#10, S)
0.151
(#9, S)
0.707
9 0.146
(#9, S)
0.708
0.100
(#9, S)
0.880
0.100
(#9, S)
0.880
10 0.142
(#9, S)
0.718
0.164
0.791
(#10, S)
0.113
(#9, S)
0.794
Notes: a, b, c # indicates negotiation round, S success, and F failure.
according to the acceptance criterion specified earlier.
In our simulations, the average negotiation round is 8.90 for , and its success rate is 100% (0
failures out of 10 runs). The average utility is 0.158 and 0.722 for the SP and the SC,
respectively, and the average total utility is 0.880. In our simulations, the average negotiation
round is 8.60 for , and its success rate is 70% (3 failures out of 10 runs). The average utility is
0.109 and 0.562 for the SP and the SC, respectively, and the average total utility is 0.671. In our
simulations, the average negotiation round is 8.80 for , and its success rate is 90% (1 failure
out of 10 runs). The average utility is 0.133 and 0.686 for the SP and the SC, respectively, and the
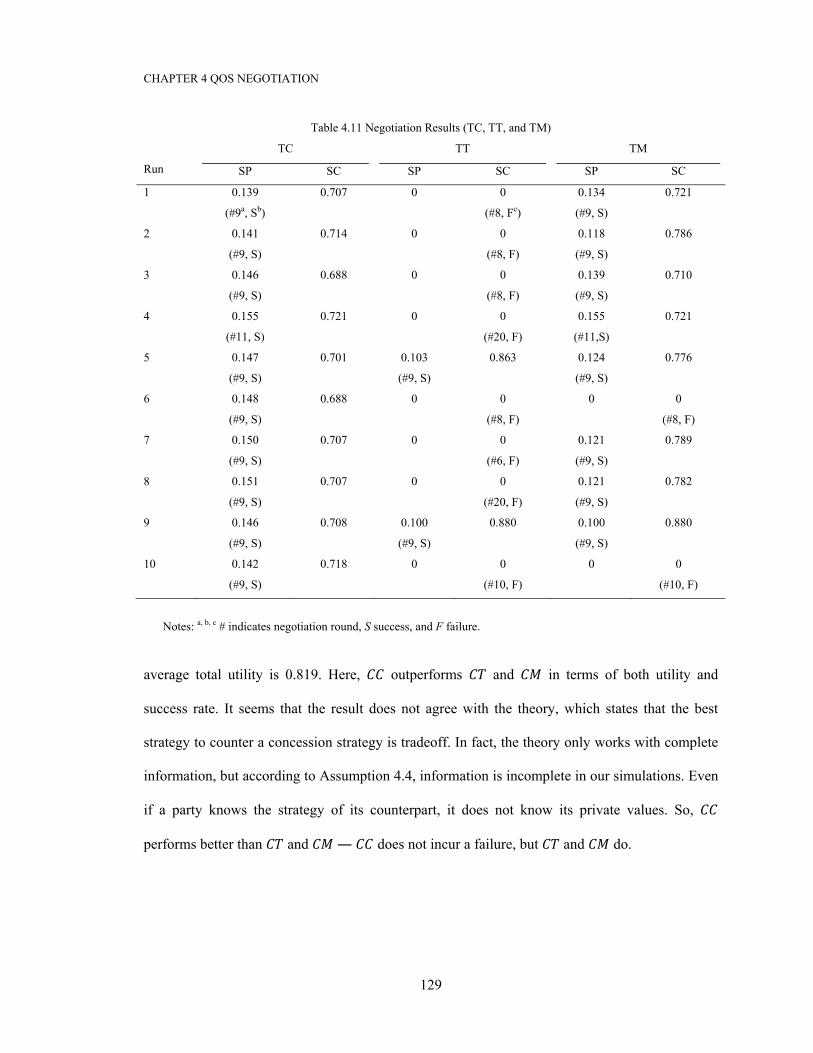
CHAPTER 4 QOS NEGOTIATION
129
Table 4.11 Negotiation Results (TC, TT, and TM)
Run
TC TT TM
SP SC SP SC SP SC
1 0.139
(#9a, Sb)
0.707
0
0
(#8, Fc)
0.134
(#9, S)
0.721
2 0.141
(#9, S)
0.714
0
0
(#8, F)
0.118
(#9, S)
0.786
3 0.146
(#9, S)
0.688
0
0
(#8, F)
0.139
(#9, S)
0.710
4 0.155
(#11, S)
0.721
0
0
(#20, F)
0.155
(#11,S)
0.721
5 0.147
(#9, S)
0.701
0.103
(#9, S)
0.863
0.124
(#9, S)
0.776
6 0.148
(#9, S)
0.688
0
0
(#8, F)
0
0
(#8, F)
7 0.150
(#9, S)
0.707 0
0
(#6, F)
0.121
(#9, S)
0.789
8 0.151
(#9, S)
0.707
0
0
(#20, F)
0.121
(#9, S)
0.782
9 0.146
(#9, S)
0.708
0.100
(#9, S)
0.880
0.100
(#9, S)
0.880
10 0.142
(#9, S)
0.718
0
0
(#10, F)
0
0
(#10, F)
Notes: a, b, c # indicates negotiation round, S success, and F failure.
average total utility is 0.819. Here, outperforms and in terms of both utility and
success rate. It seems that the result does not agree with the theory, which states that the best
strategy to counter a concession strategy is tradeoff. In fact, the theory only works with complete
information, but according to Assumption 4.4, information is incomplete in our simulations. Even
if a party knows the strategy of its counterpart, it does not know its private values. So,
performs better than and ― does not incur a failure, but and do.
CHAPTER 4 QOS NEGOTIATION
130
Third, we study which strategy performs better when a party’s counterpart plays a tradeoff
strategy. Without loss of generality, we let a SP adopt a tradeoff approach, whereas a SC can
choose a concession, a tradeoff, or a mixed approach. The results are shown in Table 4.11. In our
simulations, the average negotiation round is 9.20 for , and its success rate is 100% (0 failures
out of 10 runs). The average utility is 0.147 and 0.706 for the SP and the SC, respectively, and the
average total utility is 0.852. In our simulations, the average negotiation round is 10.60 for ,
and its success rate is 20% (8 failures out of 10 runs). The average utility is 0.020 and 0.174 for
the SP and the SC, respectively, and the average total utility is 0.195. In our simulations, the
average negotiation round is 9.20 for , and its success rate is 80% (2 failures out of 10 runs).
The average utility is 0.101 and 0.617 for the SP and the SC, respectively, and the average total
utility is 0.718. Here, outperforms and in terms of both utility and success rate. It
should be noted that the result agrees with the theory, which states that the best strategy to
counter a tradeoff strategy is concession. In fact, the theory works with both compete and
incomplete information, as in our simulations. So, performs better than and ―
does not incur a failure, but and do.
Fourth, we study which strategy performs better when a party’s counterpart plays a mixed
strategy. Without loss of generality, we let a SP adopt a mixed approach, whereas a SC can
choose a concession, a tradeoff, or a mixed approach. The results are shown in Table 4.12. In our
simulations, the average negotiation round is 9.20 for , and its success rate is 100% (0 failures
out of 10 runs). The average utility is 0.147 and 0.706 for the SP and the SC, respectively, and the
average total utility is 0.852. In our simulations, the average negotiation round is 10.60 for ,
and its success rate is 20% (8 failures out of 10 runs). The average utility is 0.020 and 0.174 for
the SP and the SC, respectively, and the average total utility is 0.195. In our simulations, the
average negotiation round is 9.60 for , and its success rate is 100% (0 failures out of 10 runs).

CHAPTER 4 QOS NEGOTIATION
131
Table 4.12 Negotiation Results (MC, MT, and MM)
Run
MC MT MM
SP SC SP SC SP SC
1 0.139
(#9a, Sb)
0.707
0
0
(#8, Fc)
0.111
(#9, S)
0.791
2 0.141
(#9, S)
0.714
0
0
(#8, F)
0.118
(#9, S)
0.786
3 0.146
(#9, S)
0.688
0
0
(#8, F)
0.139
(#9, S)
0.710
4 0.155
(#11, S)
0.721
0
0
(#20, F)
0.150
(#11,S)
0.740
5 0.147
(#9, S)
0.701
0.103
(#9, S)
0.863
0.143
(#9, S)
0.710
6 0.148
(#9, S)
0.688
0
0
(#8, F)
0.126
(#9, S)
0.760
7 0.150
(#9, S)
0.707 0
0
(#6, F)
0.150
(#9, S)
0.707
8 0.151
(#9, S)
0.707
0
0
(#20, F)
0.143
(#13, S)
0.788
9 0.146
(#9, S)
0.708
0.100
(#9, S)
0.880
0.121
(#9, S)
0.792
10 0.142
(#9, S)
0.718
0
0
(#10, F)
0.133
(#9, S)
0.735
Notes: a, b, c # indicates negotiation round, S success, and F failure.
The average utility is 0.133 and 0.752 for the SP and the SC, respectively, and the average total
utility is 0.885. Here, outperforms in terms of utility, with one exception (The SP’s
utility of is less than that of ), and it outperforms in terms of both utility and success
rate. It should be noted that the result agrees with the theory, which states that the best strategy to
counter a mixed strategy is a mixed one. In fact, the theory works with incomplete information, as
in our simulations. So, performs better than and ― and do not incur a
failure, but does.
CHAPTER 4 QOS NEGOTIATION
132
In short, the “game of chicken” has two pure strategy Nash equilibria, and one mixed strategy
Nash equilibrium, where the former works with complete information, and the latter incomplete
information. In real negotiations, however, information is not complete — an agent may not
know the payoffs and strategies of its counterpart — in most cases, if not all. So, a mixed
approach based on the “game of chicken” becomes a promising approach for cloud service
negotiation. In fact, as demonstrated here, a mixed approach, which can balance utility and
success rate, achieves a higher utility than a concession one, while incurring fewer failures than a
tradeoff one.
4.6 Summary
To succeed in a competitive market, cloud providers need to offer superior services that meet
customers’ expectations. However, cloud providers and cloud consumers have different and
sometimes opposite QoS preferences. If such a conflict occurs, an agreement cannot be reached,
without negotiation, which is considered as the most flexible approach to procure products and
services.
Concession and tradeoff are two strategies that an agent can adopt in negotiation. A tradeoff
approach can outperform a concession one in terms of utility, but may incur more failures if
information is incomplete. To balance utility and success rate, we propose a mixed approach for
cloud service negotiation, which is based on the “game of chicken”. In particular, if a party is
uncertain about the strategy of its counterpart, it is best to mix concession and tradeoff strategies.
In fact, it is a mixed strategy Nash equilibrium of a negotiation game with two pure strategies,
which provides the theoretical basis for our approach.
CHAPTER 4 QOS NEGOTIATION
133
To demonstrate the effectiveness of the mixed approach, we conduct extensive simulations.
Results show that when a party has no knowledge of the strategy of its counterpart, a mixed
approach outperforms a concession one in terms of utility, and it outperforms a tradeoff one in
terms of success rate. It should be noted that the mixed approach works under incomplete
information, and so is applicable for real negotiations, where information is generally not
complete.
In brief, when a party is uncertain about the strategy of its counterpart, a mixed negotiation
approach, which exhibits a certain degree of intelligence, can achieve a higher utility than a
concession one, while incurring fewer failures than a tradeoff one. It thus becomes a promising
approach for cloud service negotiation. The next chapter deals with QoS assurance, where cloud
providers allocate resources with an aim to honor QoS promised while minimizing costs.
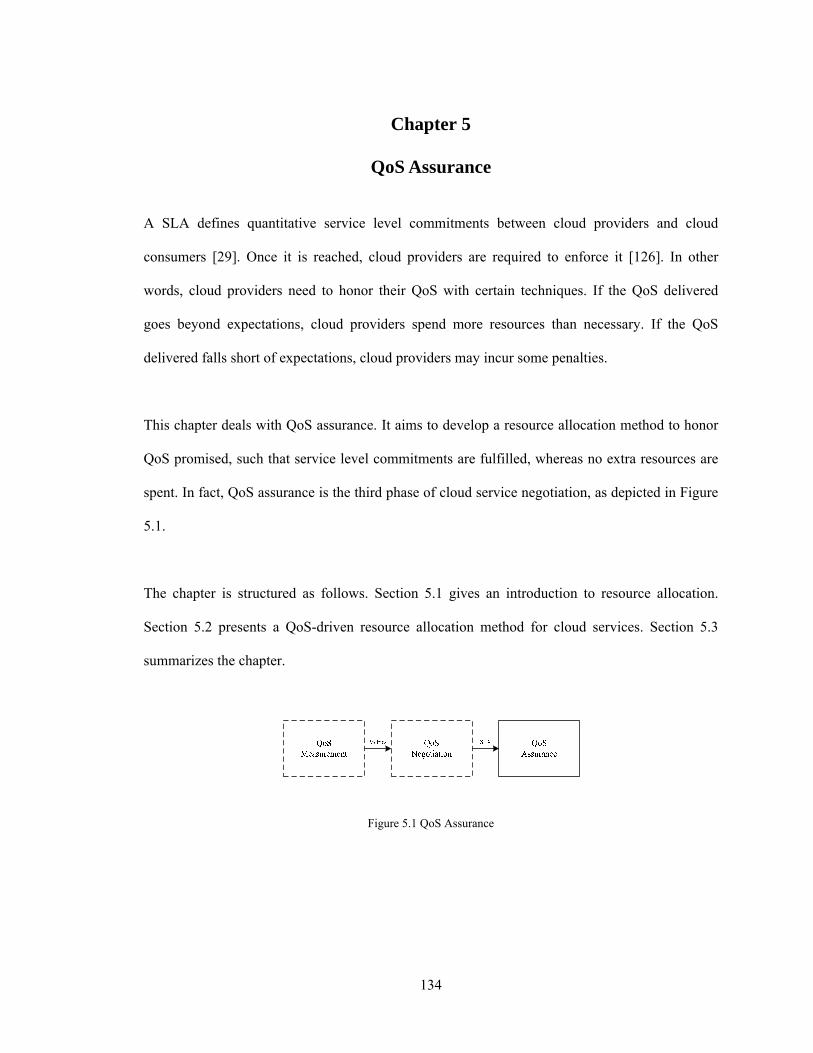
134
Chapter 5
QoS Assurance
A SLA defines quantitative service level commitments between cloud providers and cloud
consumers [29]. Once it is reached, cloud providers are required to enforce it [126]. In other
words, cloud providers need to honor their QoS with certain techniques. If the QoS delivered
goes beyond expectations, cloud providers spend more resources than necessary. If the QoS
delivered falls short of expectations, cloud providers may incur some penalties.
This chapter deals with QoS assurance. It aims to develop a resource allocation method to honor
QoS promised, such that service level commitments are fulfilled, whereas no extra resources are
spent. In fact, QoS assurance is the third phase of cloud service negotiation, as depicted in Figure
5.1.
The chapter is structured as follows. Section 5.1 gives an introduction to resource allocation.
Section 5.2 presents a QoS-driven resource allocation method for cloud services. Section 5.3
summarizes the chapter.
Figure 5.1 QoS Assurance
CHAPTER 5 QOS ASSURANCE
135
5.1 Introduction
Once a SLA is established, cloud providers need to honor their QoS promised [37, 64, 98]. Take,
once again, a storage cloud as an example. Assume that a single storage device is 70% reliable,
and that an agreed-upon reliability is no less than 90%. The problem now becomes how to
allocate storage resources to meet the 90% reliability, while minimizing the amount of resources
used.
In fact, if a cloud provider replicates its data two times, it can guarantee a reliability of 1 −(1 − 70%) = 91%, which is sufficient to meet the 90% reliability. If it replicates its data three
or more times, it will guarantee a reliability beyond expectations (more than 97%), but additional
storage resources will be consumed. As the cloud provider wants to reduce costs and maximize
profits, it does not make sense to do so. So, resource allocation becomes crucial for cloud
services.
The problem for QoS assurance is how to allocate resources such that QoS requirements are met
whereas no extra resources are spent. To address it, we propose a QoS-driven resource allocation
method for cloud services. It aims to meet users’ QoS requirements while minimizing resources
consumed. It allows cloud providers to maximize their profits, without sacrificing users’
satisfaction.
Given a QoS specified in a SLA, we need to develop a QoS assurance mechanism to honor it, and
determine the minimum resources that should be allocated to support it. As a result, QoS-driven
resource allocation makes both technical and economic sense for cloud providers. It should be
noted that different clouds may require different QoS assurance mechanisms. The next section
CHAPTER 5 QOS ASSURANCE
136
illustrates how to implement QoS-driven resource allocation for storage clouds. The ideas
presented will be helpful for other clouds too.
5.2 QoS-Driven Resource Allocation Method
It takes three steps to honor a QoS specified in a SLA. First, we need to determine what kind of
resources can be used to support it. It is possible that one and/ or more resources may be used.
Second, we need to determine what kind of techniques can be adopted to support it. Again, it is
possible that one and/ or more techniques may be adopted. Third, we need to determine the
amount of resources that should be allocated to support it.
5.2.1 AVAL Assurance Mechanism
For availability, the resource that can be used to support it is bandwidth, and the technique that
can be adopted to support it is replication, i.e., multiple Internet connections. For instance, a
storage provider can offer more than one Internet connections in different regions of its global
data centers to improve its network reliability, and so the availability of its service.
Assume that a single Internet connection is (0 < < 1) available, as defined in (3.2), and
that a storage provider needs to honor an availability of (0 < < 1). Since 0 < < 1, it
follows that 0 < 1 − < 1, which indicates the probability of failure with one connection, and (1 − ) < 0. So, 1 − (1 − ) , which indicates the probability that at least one connection
is available among , which denotes the number of connections required, should be no less than
1 − (1 − ) ≥ (5.1) ∴ (1 − ) ≤ 1 −
CHAPTER 5 QOS ASSURANCE
137
× (1 − ) ≤ (1 − ) ≥ (1 − )(1 − )
In other words, the minimum number of Internet connections that the storage provider should
offer is ( )( ) .
Assume further that the cost of a single connection is ( > 0) during a time interval. So,
the cost of bandwidth, , can be determined as
= × (1 − )(1 − ) (5.2) For example, suppose that a single connection is 90.0% reliable. Then, it needs one Internet
connection to honor an availability of 87.3%. However, it needs ( . )( . ) = 3 Internet
connections, if a storage provider needs to honor a three-nine availability.
5.2.2 REL Assurance Mechanism
For reliability, the resource that can be used to support it is storage, and the technique that can be
adopted to support it is replication, i.e., multiple data replicas. For instance, a storage provider
can store more than one copy of data in its data centers to improve its storage reliability, and so
the reliability of its service.
Assume that a single storage device is (0 < < 1) reliable, as defined in (3.3), and that a
storage provider needs to honor a reliability of (0 < < 1). In a similar way as with
availability, we can show that the minimum number of storage devices that the storage provider
should offer is ( )( ) .
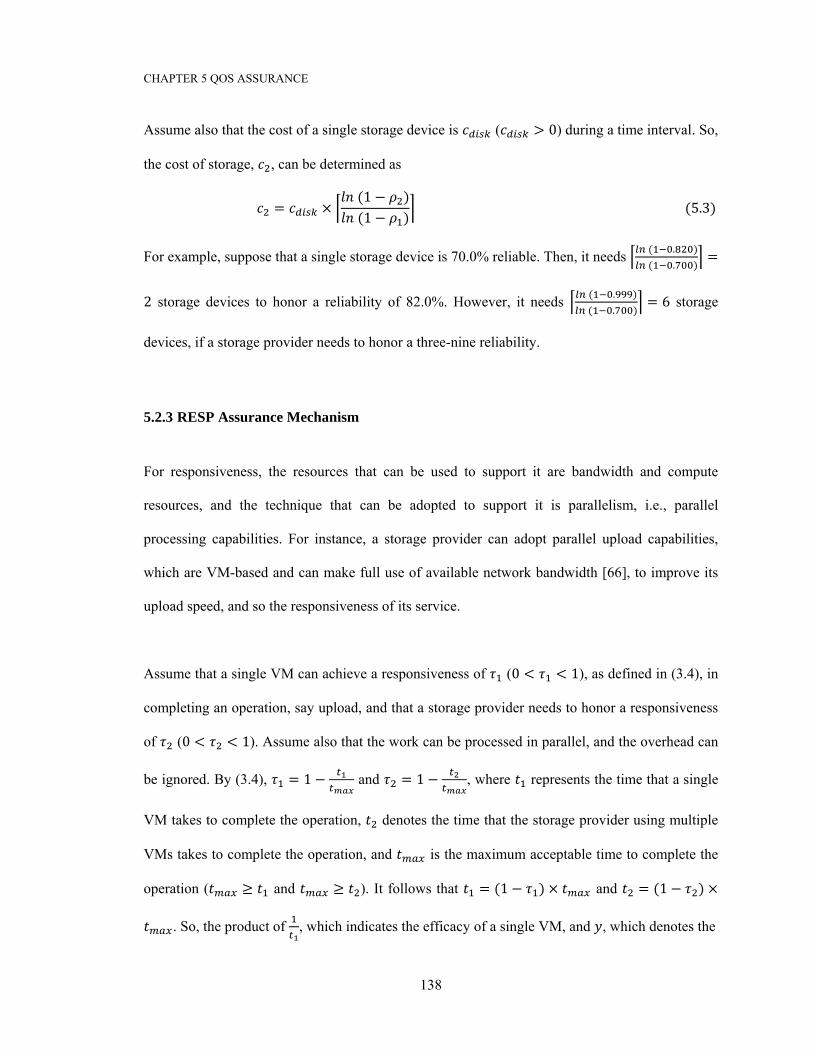
CHAPTER 5 QOS ASSURANCE
138
Assume also that the cost of a single storage device is ( > 0) during a time interval. So,
the cost of storage, , can be determined as
= × (1 − )(1 − ) (5.3) For example, suppose that a single storage device is 70.0% reliable. Then, it needs ( . )( . ) =2 storage devices to honor a reliability of 82.0%. However, it needs ( . )( . ) = 6 storage
devices, if a storage provider needs to honor a three-nine reliability.
5.2.3 RESP Assurance Mechanism
For responsiveness, the resources that can be used to support it are bandwidth and compute
resources, and the technique that can be adopted to support it is parallelism, i.e., parallel
processing capabilities. For instance, a storage provider can adopt parallel upload capabilities,
which are VM-based and can make full use of available network bandwidth [66], to improve its
upload speed, and so the responsiveness of its service.
Assume that a single VM can achieve a responsiveness of (0 < < 1), as defined in (3.4), in
completing an operation, say upload, and that a storage provider needs to honor a responsiveness
of (0 < < 1). Assume also that the work can be processed in parallel, and the overhead can
be ignored. By (3.4), = 1 − and = 1 − , where represents the time that a single
VM takes to complete the operation, denotes the time that the storage provider using multiple
VMs takes to complete the operation, and is the maximum acceptable time to complete the
operation ( ≥ and ≥ ). It follows that = (1 − ) × and = (1 − ) ×. So, the product of , which indicates the efficacy of a single VM, and , which denotes the
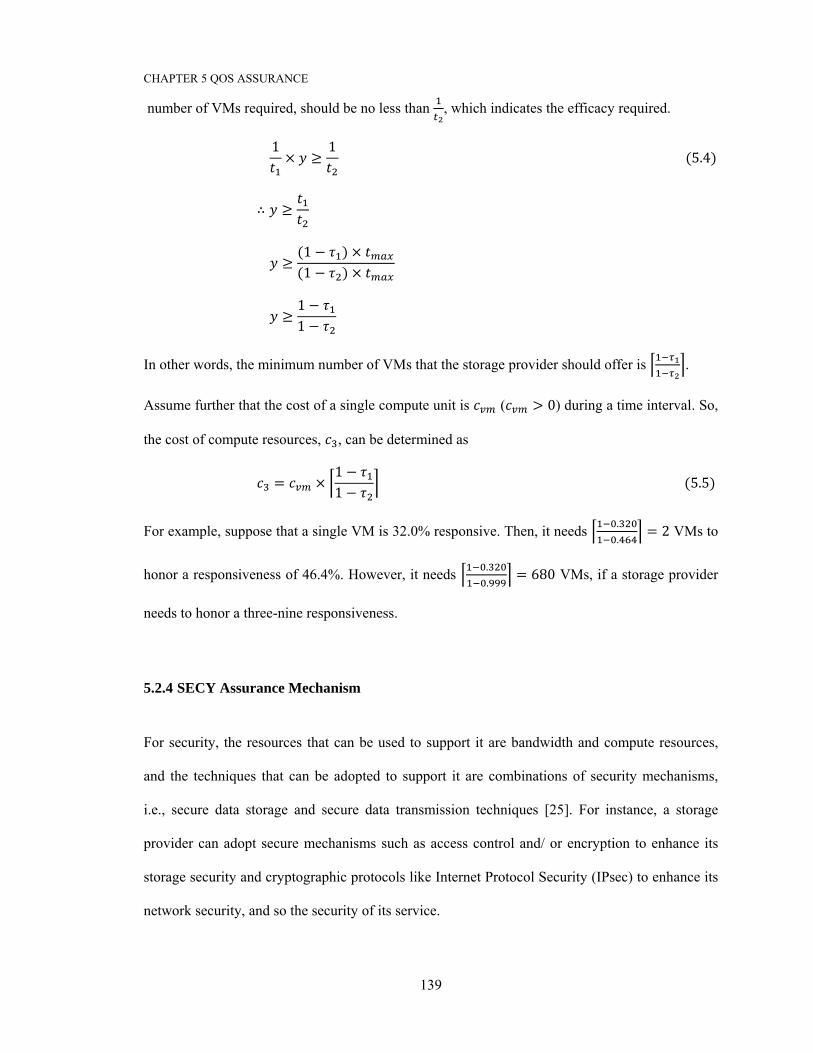
CHAPTER 5 QOS ASSURANCE
139
number of VMs required, should be no less than , which indicates the efficacy required.
1 × ≥ 1 (5.4) ∴ ≥
≥ (1 − ) ×(1 − ) ×
≥ 1 −1 −
In other words, the minimum number of VMs that the storage provider should offer is .
Assume further that the cost of a single compute unit is ( > 0) during a time interval. So,
the cost of compute resources, , can be determined as
= × 1 −1 − (5.5) For example, suppose that a single VM is 32.0% responsive. Then, it needs .. = 2 VMs to
honor a responsiveness of 46.4%. However, it needs .. = 680 VMs, if a storage provider
needs to honor a three-nine responsiveness.
5.2.4 SECY Assurance Mechanism
For security, the resources that can be used to support it are bandwidth and compute resources,
and the techniques that can be adopted to support it are combinations of security mechanisms,
i.e., secure data storage and secure data transmission techniques [25]. For instance, a storage
provider can adopt secure mechanisms such as access control and/ or encryption to enhance its
storage security and cryptographic protocols like Internet Protocol Security (IPsec) to enhance its
network security, and so the security of its service.
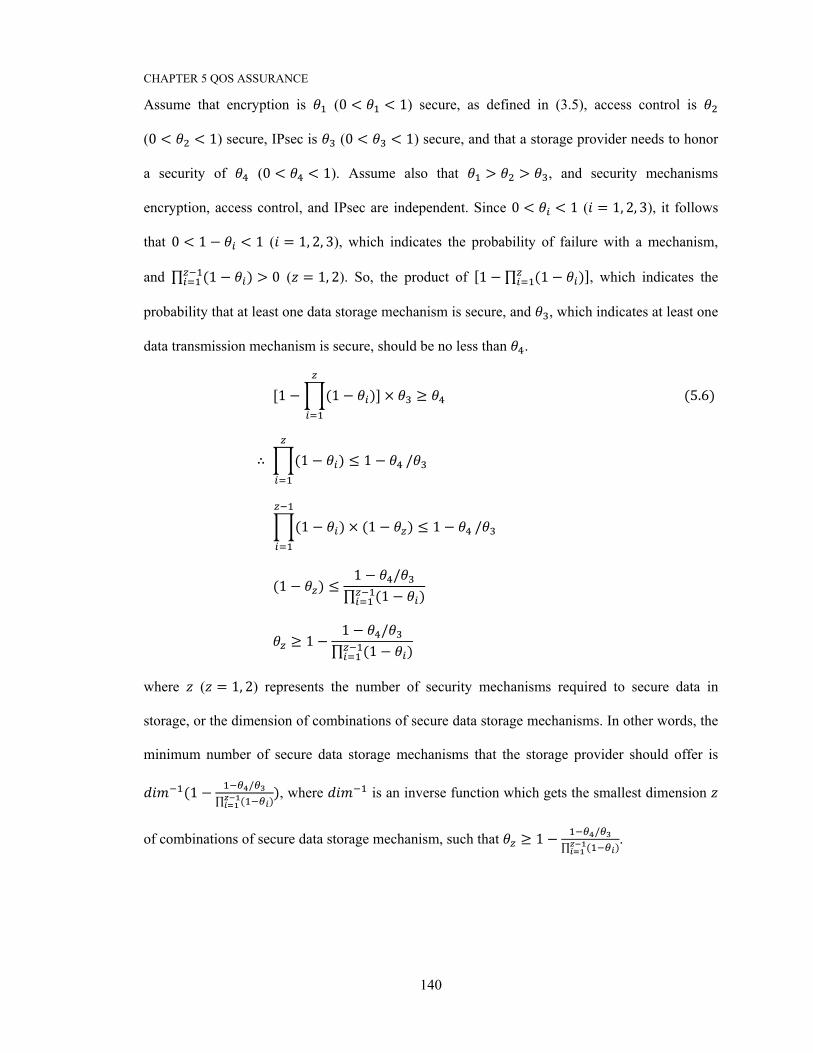
CHAPTER 5 QOS ASSURANCE
140
Assume that encryption is (0 < < 1) secure, as defined in (3.5), access control is
(0 < < 1) secure, IPsec is (0 < < 1) secure, and that a storage provider needs to honor
a security of (0 < < 1). Assume also that > > , and security mechanisms
encryption, access control, and IPsec are independent. Since 0 < < 1 ( = 1, 2, 3), it follows
that 0 < 1 − < 1 ( = 1, 2, 3), which indicates the probability of failure with a mechanism,
and ∏ (1 − ) > 0 ( = 1, 2). So, the product of [1 − ∏ (1 − )], which indicates the
probability that at least one data storage mechanism is secure, and , which indicates at least one
data transmission mechanism is secure, should be no less than .
[1 − (1 − )] × ≥ (5.6) ∴ (1 − ) ≤ 1 − /
(1 − ) × (1 − ) ≤ 1 − /
(1 − ) ≤ 1 − /∏ (1 − ) ≥ 1 − 1 − /∏ (1 − )
where ( = 1, 2) represents the number of security mechanisms required to secure data in
storage, or the dimension of combinations of secure data storage mechanisms. In other words, the
minimum number of secure data storage mechanisms that the storage provider should offer is (1 − /∏ ( )), where is an inverse function which gets the smallest dimension
of combinations of secure data storage mechanism, such that ≥ 1 − /∏ ( ).
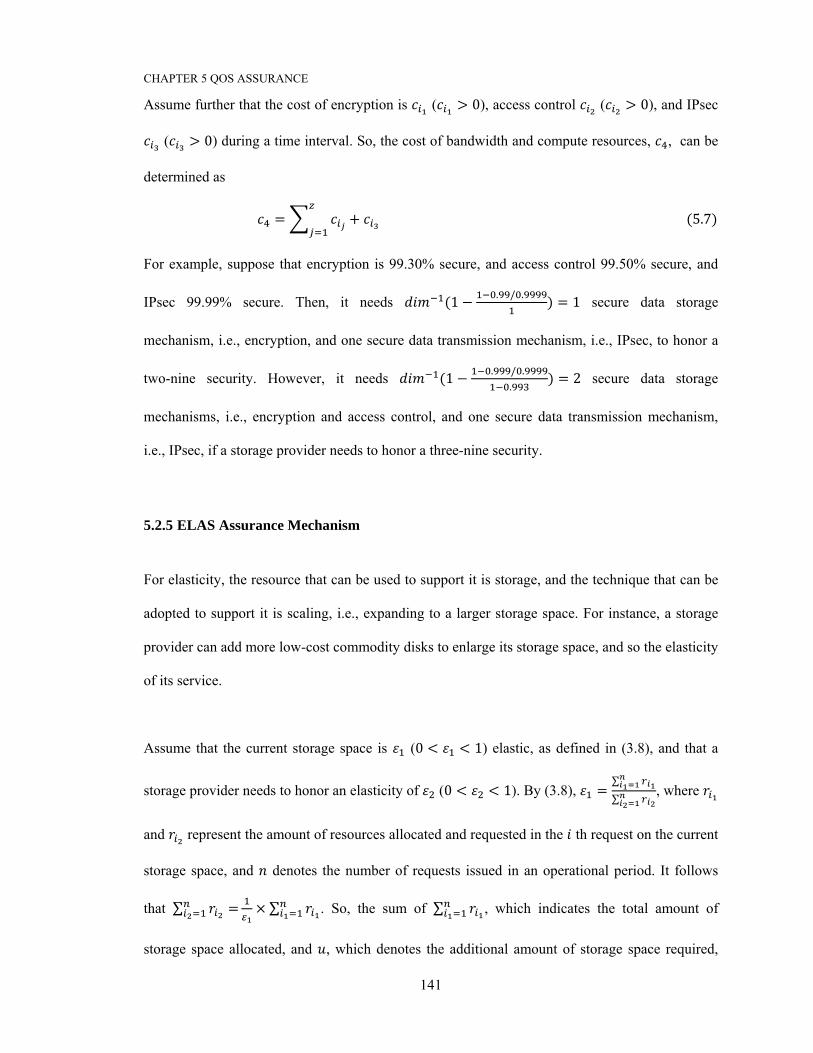
CHAPTER 5 QOS ASSURANCE
141
Assume further that the cost of encryption is ( > 0), access control ( > 0), and IPsec
( > 0) during a time interval. So, the cost of bandwidth and compute resources, , can be
determined as
= + (5.7) For example, suppose that encryption is 99.30% secure, and access control 99.50% secure, and
IPsec 99.99% secure. Then, it needs (1 − . / . ) = 1 secure data storage
mechanism, i.e., encryption, and one secure data transmission mechanism, i.e., IPsec, to honor a
two-nine security. However, it needs (1 − . / .. ) = 2 secure data storage
mechanisms, i.e., encryption and access control, and one secure data transmission mechanism,
i.e., IPsec, if a storage provider needs to honor a three-nine security.
5.2.5 ELAS Assurance Mechanism
For elasticity, the resource that can be used to support it is storage, and the technique that can be
adopted to support it is scaling, i.e., expanding to a larger storage space. For instance, a storage
provider can add more low-cost commodity disks to enlarge its storage space, and so the elasticity
of its service.
Assume that the current storage space is (0 < < 1) elastic, as defined in (3.8), and that a
storage provider needs to honor an elasticity of (0 < < 1). By (3.8), = ∑∑ , where
and represent the amount of resources allocated and requested in the th request on the current
storage space, and denotes the number of requests issued in an operational period. It follows
that ∑ = × ∑ . So, the sum of ∑ , which indicates the total amount of
storage space allocated, and , which denotes the additional amount of storage space required,
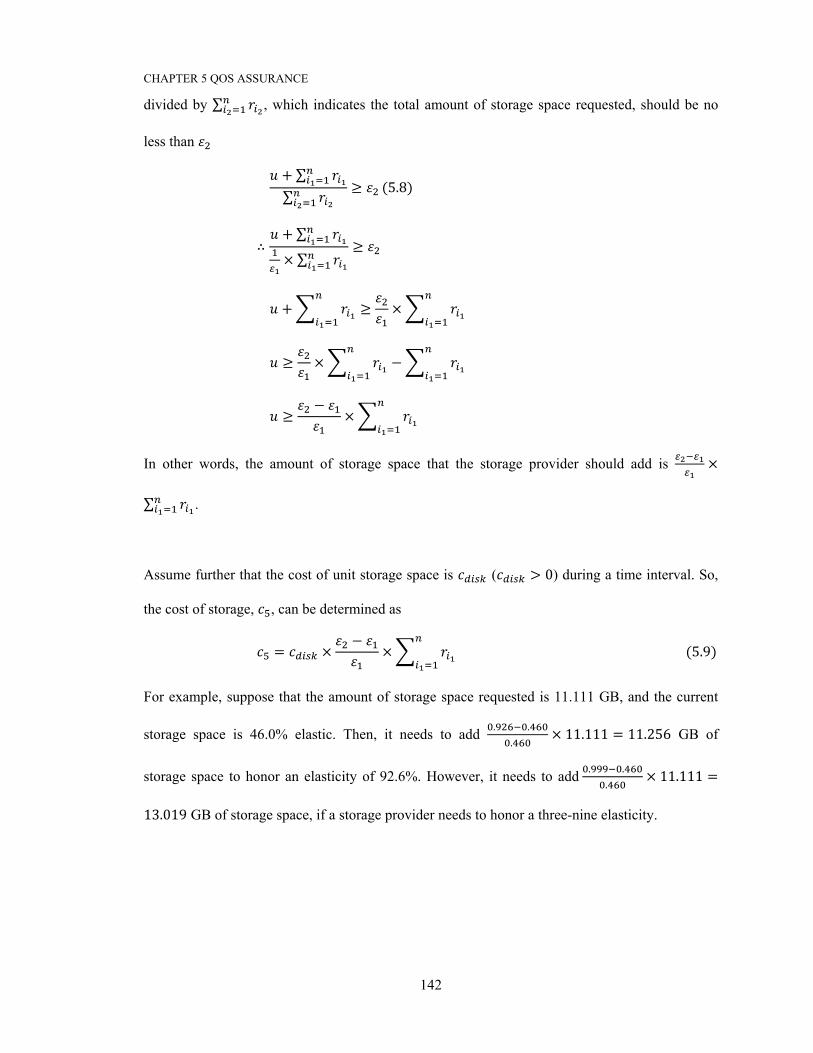
CHAPTER 5 QOS ASSURANCE
142
divided by ∑ , which indicates the total amount of storage space requested, should be no
less than + ∑∑ ≥ (5.8) ∴ + ∑× ∑ ≥
+ ≥ ×
≥ × −
≥ − ×
In other words, the amount of storage space that the storage provider should add is ×∑ .
Assume further that the cost of unit storage space is ( > 0) during a time interval. So,
the cost of storage, , can be determined as
= × − × (5.9) For example, suppose that the amount of storage space requested is 11.111 GB, and the current
storage space is 46.0% elastic. Then, it needs to add . .. × 11.111 = 11.256 GB of
storage space to honor an elasticity of 92.6%. However, it needs to add . .. × 11.111 =13.019 GB of storage space, if a storage provider needs to honor a three-nine elasticity.
CHAPTER 5 QOS ASSURANCE
143
5.3 Summary
Once a SLA is established, cloud providers need to honor their QoS promised. If the QoS
delivered goes beyond expectations, cloud providers spend more resources than necessary. If the
QoS delivered falls short of expectations, cloud providers may incur some penalties. So, how to
allocate resources becomes an important problem.
To address QoS assurance, we propose a QoS-driven resource allocation method for cloud
services. It can meet users’ QoS requirements while minimizing resources consumed. In
particular, for each quality dimension, we develop a QoS assurance mechanism to honor it. First,
we determine the resources can be used to support it. Second, we determine the techniques can be
adopted to support it. Third, we determine the minimum resources that should be allocated to
support it. In addition, we determine the cost of resources for each QoS assurance mechanism,
such that a price, at least beyond the cost, can be set and/ or negotiated, using the approaches
presented in the previous section. It should be noted that different clouds may require different
QoS assurance mechanisms, but the ideas presented will be helpful for other clouds too.
In brief, a QoS-driven resource allocation method can honor service level commitments, while
minimizing resources spent. It allows cloud providers to maximize their profits, without
sacrificing users’ satisfaction. So, it makes both technical and economic sense for cloud
providers. The next chapter summarizes this thesis, mentions potential limitations, and discusses
some future work.
144
Chapter 6
Conclusions and Future Work
Cloud services are Internet-based IT services. IaaS, PaaS, and SaaS are three representative
examples. Cloud providers own the resources, and perform the development and maintenance
work. Cloud consumers can access those resources, but have no ownership over them. Compared
with other models, cloud services are easier to access and use, cost-efficient, and environmentally
sustainable.
There are three pillars underpinning cloud services. The first one is virtualization, which aims to
achieve optimum resources utilization, and serves as the technical pillar. The second one is
economies of scale, which aims to drive prices down for cloud consumers and profits up for cloud
providers, and serves as the economic pillar. The third one is elastic service, which aims to meet
consumers’ changing resources requirements, and serves as the business pillar.
The transition of computer hardware, software, and applications as products towards services
reflects an economic shift from a focus on products to a focus on services. G-D logic views goods
as the primary focus of economic exchange, whereas S-D logic regards service as the primary
focus of exchange activity, and so service is defined as the application of competences for the
benefit of another party. In this sense, cloud services express S-D logic, and expand the spectrum
of services.
As the cloud market becomes more open and competitive, QoS will be more important. However,
cloud providers and cloud consumers have different and sometimes opposite preferences. If such
a conflict occurs, a SLA cannot be reached without negotiation, which is considered as the most
CHAPTER 6 CONCLUSIONS AND FUTURE WORK
145
flexible approach to procure products and services. Automated negotiation occurs, when software
agents negotiate on behalf of their human counterparts.
To allow service consumers to express their QoS requirements, and negotiate them with service
providers, we argue for cloud service negotiation in this thesis. It aims to establish and enforce
SLAs for cloud services. Three research problems that we address are QoS measurement, QoS
negotiation, and QoS assurance. In fact, the three problems together draw a whole picture of
cloud service negotiation.
6.1 Thesis Work
Chapter 1 gives an introduction and describes the motivations of our research. Chapter 2 provides
the background knowledge and reviews related work on cloud service negotiation. Chapter 3
deals with QoS measurement. It presents a quality model named CLOUDQUAL for cloud
services. CLOUDQUAL contains six quality dimensions, i.e., usability, availability, reliability,
responsiveness, security, and elasticity. For each quality dimension, we give a formal description.
Also, a quality metric is specified for each objective quality dimension. It is demonstrated that
CLOUDQUAL can evaluate and differentiate service quality.
Chapter 4 deals with QoS negotiation. It presents a mixed negotiation approach for cloud
services, which is based on the “game of chicken” and can balance utility and success rate. In
particular, if a party is uncertain about the strategy of its counterpart, it is best to mix concession
and tradeoff strategies in negotiation. In fact, it is a mixed strategy Nash equilibrium of a
negotiation game with two pure strategies. It is shown that the mixed approach can achieve a
higher utility than a concession approach, while incurring fewer failures than a tradeoff approach.

CHAPTER 6 CONCLUSIONS AND FUTURE WORK
146
Chapter 5 deals with QoS assurance. It presents a QoS-driven resource allocation method, which
can meet users’ QoS requirements while minimizing resources consumed. For each quality
dimension specified in a SLA, we develop a QoS assurance mechanism to honor it, and determine
the cost of resources for each mechanism. It is proved that the method can honor service level
commitments, while minimizing resources spent.
6.2 Thesis Contributions
This thesis reports our work on cloud service negotiation. Its main contributions are:
1) We initiate a quality model for cloud services, called CLOUDQUAL, which specifies six
quality dimensions and five quality metrics. It is a model with quality dimensions and
metrics that targets general cloud services.
2) We present a mixed negotiation approach for cloud services, which is based on the “game
of chicken” and can balance utility and success rate. In particular, the mixed approach
exhibits a certain degree of intelligence.
3) We propose a QoS-driven resource allocation method for cloud services, which can meet
users’ QoS requirements while minimizing resources consumed. Indeed, the method
makes both technical and economic sense for cloud providers.
6.3 Thesis Limitations
This thesis, however, has some potential limitations. First, for QoS measurement, the impact of
network distance on responsiveness and elasticity is not separated from that of storage systems.
So, we are not sure of the magnitude of the potential impact of network distance on Aliyun OSS.
For Amazon S3 and Azure Blob, since both are located in Virginia, USA, we do our best to keep
CHAPTER 6 CONCLUSIONS AND FUTURE WORK
147
the impact to a minimum. Also, the experimental period is one month, which is too short to
provide sufficient data to evaluate availability and security.
Second, for QoS negotiation, the impact of different parameters on negotiation results is not
tested against all nine strategy combinations. In our simulations, the SP and the SC have different
values, weights, preferences, and thus different acceptable values and utilities. To give a fair
comparison, we test the impact of those parameters against , , and . Also, nonlinear
utility functions that we adopt in our simulations are general ones, which may not be able to
represent a specific agent’s preferences.
Third, for QoS assurance, we only conduct theoretical studies, and present a QoS-driven resource
allocation method, which is based on mathematical models. Future work could conduct empirical
studies to evaluate the effectiveness of the method. Even with above limitations, the main results
and conclusions of the thesis are not affected.
6.4 Future Work
In addition to address above limitations, we discuss one issue in implementing our approach in
practice, and mention two research directions for future work. QoS measurement is the first and a
critical phase of our approach. It requires that a QoS should be measured objectively and
accurately. In practice, if a storage consumer has no confidence in the QoS value provided by a
storage provider, or a storage provider is not sure about the QoS value reported by a storage
consumer, then it is impossible to start negotiation. In that case, a third-party broker can be
employed to establish trust and confidence between the two parties.

CHAPTER 6 CONCLUSIONS AND FUTURE WORK
148
SOA and SaaS are perfect complement to each other [11]. In fact, SaaS providers can use various
web services — an implementation of SOA — available on the Internet to build SaaS solutions.
Also, when SOA is coupled with SaaS, it provides the ideal platform to deliver software. As a
result, research topics such as service negotiation and service recommendation become important.
6.4.1 Service Negotiation
SOA and SaaS introduce new challenges for service negotiation. For example, how to negotiate
and deliver quality composite services composed from multiple services. Future work could
expand the current research on service negotiation from storage clouds to SaaS, and make some
new contributions.
6.4.2 Service Recommendation
SOA and SaaS introduce many services on the Internet, and so may cause information overload
problem. As a result, service recommendation becomes important. It can save users’ effort and
time in finding a suitable service. Future work could expand recommender systems [45] from
products to services, and make some new contributions.
149
Bibliography
[1] S. Akter and P. Ray, “Viewing Systems as Services: The Role of Service Quality,” In Proc. of the 32nd International Conference on Information Systems, Shanghai, China, 2011.
[2] M. Alhamad, T. Dillon, and E. Chang, “Conceptual SLA Framework for Cloud Computing,”
In Proc. of the 4th IEEE International Conference on Digital Ecosystems and Technologies, Dubai, United Arab Emirates, 2010.
[3] Aliyun. (2013, October 20). Aliyun Open Storage Service (Aliyun OSS). Available:
http://www.aliyun.com/product/oss/?spm=5176.683009.2.4.Wma3SL. [4] S. Alizon and D. Cownden. (2013, October 20). Evolutionary Game Theory. Available:
http://dcownden.wordpress.com/course-notes. [5] Amazon. (2013a, October 20). Amazon Elastic Compute Cloud (Amazon EC2). Available:
http://aws.amazon.com/ec2/. [6] Amazon. (2013b, October 20). Amazon Simple Storage Service (Amazon S3). Available:
http://aws.amazon.com/s3/. [7] Amazon. (2013c, October 20). Amazon S3 Service Level Agreement. Available:
http://aws.amazon.com/s3-sla/. [8] Amazon. (2013d, October 20). Introduction to Amazon S3. Available:
http://docs.amazonwebservices.com/AmazonS3/latest/dev/Introduction.html. [9] B. An, V. Lesser, D. Irwin, and M. Zink, “Automated Negotiation with Decommitment for
Dynamic Resource Allocation in Cloud Computing,” In Proc. of the 9th International Conference on Autonomous Agents and Multiagent Systems, Toronto, Ontario, Canada, 2010.
[10] G. Anthes, “Mechanism Design Meets Computer Science,” Communications of ACM, vol.
53, no. 8, pp. 11-13, 2010. [11] Apprenda. (2013, October 20). Enterprise Software Deployment. Available:
http://apprenda.com/library/cloud/enterprise-software-deployment/. [12] M. Armbrust, A. Fox, R. Griffith, A. D. Joseph, R. Katz, A. Konwinski, G. Lee, D.
Patterson, A. Rabkin, I. Stoica, and M. Zaharia, “A View of Cloud Computing,” Communications of ACM, vol. 53, no. 4, pp. 50-58, 2010.
[13] D. Armstrong and K. Djemame. (2013, October 20). Towards Quality of Service in the
Cloud. Available: http://www.comp.leeds.ac.uk/ukpew09/papers/18.pdf. [14] D. Besanko and R. R. Braeutigam, “Microeconomics,” 3rd ed., John Wiley & Sons
Publisher, Hoboken, New Jersey, USA, 2008.
BIBLIOGRAPHY
150
[15] G. Bissonette, “Ethics and Corporate Social Responsibility,” In Business: Strategy, Development, Application, Chapter 5, McGraw-Hill Ryerson, New York City, New York, USA, 2012.
[16] M. J. Bitner and S. W. Brown, “The Evolution and Discovery of Services Science in
Business Schools,” Communications of the ACM, vol. 49, no. 7, 2006. [17] N. Bonvin, T. G. Papaioannou, and K. Aberer, “Autonomic SLA-Driven Provisioning for
Cloud Applications,” In Proc. of the 11th IEEE/ACM International Symposium on Cluster, Cloud and Grid Computing, Newport Beach, California, USA, 2011.
[18] T. Bosse and C. M. Jonker, “Human vs. Computer Behavior in Multi-Issue Negotiation,” In
Proc. of the 1st International Workshop on Rational, Robust, and Secure Negotiation Mechanisms in Multi-Agent Systems, Amsterdam, The Netherlands, 2005.
[19] I. Brandic, D. Music, and S. Dustdar, “Service Mediation and Negotiation Bootstrapping as
First Achievements towards Self-Adaptable Grid and Cloud Services,” In Proc. of the Grid Meets Autonomic Computing Workshop, Barcelona, Spain, 2009.
[20] F. J. Buera and J. P. Kaboski, “The Rise of the Service Economy,” American Economic
Review, vol. 102, no. 6, 2012. [21] J. M. Butler, R. Yahyapour, and W. Theilmann, “Motivation and Overview,” In Service
Level Agreements for Cloud Computing, P. Wieder et al., Eds, Springer Publisher, New York City, New York, USA, 2011.
[22] R. Buyya, S. K. Garg, and R. N. Calheiros, “SLA-Oriented Resource Provisioning for Cloud
Computing: Challenges, Architecture and Solutions,” In Proc. of the International Conference on Cloud and Service Computing, Hong Kong, China, 2011.
[23] H. Cai, J. Y. Chung, and H. Su, “Relooking at Services Science and Services Innovation,”
Service Oriented Computing and Applications, vol. 2, no. 1, pp. 1-14, 2008. [24] C. Cappiello, M. Comuzzi, and P. Plebani, “On Automated Generation of Web Service Level
Agreements,” In Proc. of the 19th International Conference on Advanced Information Systems Engineering, Trondheim, Norway, 2007.
[25] J. Chen, Y. Wang, and X. Wang, “On-Demand Security Architecture for Cloud Computing,”
Computer, vol. 45, no. 7, pp. 73-78, 2012. [26] H. Chesbrough and J. Spohrer, “A Research Manifesto for Services Science,”
Communications of the ACM, vol. 49, no. 7, pp. 35-40, 2006. [27] V. Conitzer, “Making Decisions Based on the Preferences of Multiple Agents,”
Communications of the ACM, vol. 53, no. 3, pp. 84-94, 2010. [28] S. D. Conte, H. E. Dunsmore, and V. Y. Shen, “Software Engineering Metrics and Models,”
Benjamin/Cummings Publishing Company, Menlo Park, California, USA, pp. 102-105, 1986. [29] CSMIC. (2013, October 20). Service Measurement Index Version 1.0. Available:
http://www.cloudcommons.com/documents/10508/186d5f13-f40e-47ad-b9a6-4f246cf7e34f.
BIBLIOGRAPHY
151
[30] D. Durkee, “Why Cloud Computing Will Never Be Free,” Communications of the ACM, vol. 53, no. 5, pp. 62-69, 2010.
[31] A. Einstein and L. Infeld, “The Evolution of Physics,” Cambridge University Press,
Cambridge, England, UK, 1938. [32] A. Elfatatry and P. Layzell, “Software as a Service: A Negotiation Perspective,” In Proc. of
the 26th Annual International Computer Software and Applications Conference, Oxford, England, UK, 2002.
[33] K. Engelmann, “Services Science — Where Practice Meets Theory,” In Services Science:
Fundamentals, Challenges and Future Developments, B. Stauss et al., Eds, Springer Publisher, Berlin, Germany, 2007.
[34] Q. Fan, J. Y. Lee, and J. I. Kim, “The Impact of Web Site Quality on Flow-Related Online
Shopping Behaviors in C2C E-Marketplaces: A Cross-National Study,” Managing Service Quality, vol. 23, no. 5, 2013.
[35] P. Faratin, C. Sierra, and N. R. Jennings, “Negotiation Decision Functions for Autonomous
Agents,” International Journal of Robotics and Autonomous Systems, vol. 24, no. 3-4, 1997. [36] S. Ferretti, V. Ghini, F. Panzieri, M. Pellegrini, and E. Turrini, “QoS-Aware Clouds,” In
Proc. of the 3rd International Conference on Cloud Computing, Miami, Florida, USA, 2010. [37] A. L. Freitas, N. Parlavantzas, and J. L. Pazat, “An Integrated Approach for Specifying and
Enforcing SLAs for Cloud Services,” In Proc. of the 15th IEEE International Conference on Cloud Computing, Honolulu, Hawaii, USA, 2012.
[38] D. K. Gardner, “The Four Books: The Basic Teachings of the Later Confucian Tradition,”
Hackett Publishing Company, Indianapolis, Indiana, USA, 2007. [39] S. K. Garg, S. Versteeg, and R. Buyya, “SMICloud: A Framework for Comparing and
Ranking Cloud Services,” In Proc. of the 4th IEEE International Conference on Utility and Cloud Computing, Melbourne, Australia, 2011.
[40] Google. (2013a, October 20). Google App Engine. Available: https://developers.google.-
com/appengine/. [41] H. Goudarzi and M. Pedram, “Multi-Dimensional SLA-Based Resource Allocation for
Multi-Tier Cloud Computing Systems,” In Proc. of the 4th IEEE International Conference on Cloud Computing, Washington DC, USA, 2011.
[42] B. Hefley and W. Murphy, “Service Science, Management and Engineering: Education for
the 21st Century,” Springer Publisher, Berlin, Germany, 2008. [43] P. C. K. Hung, H. Li, and J. J. Jeng, “WS-Negotiation: An Overview of Research Issues,” In
Proc. of the 37th Annual Hawaii International Conference on System Sciences, Big Island, Hawaii, USA, 2004.
BIBLIOGRAPHY
152
[44] IEEE Computer Society (IEEE CS), “IEEE Standard for a Software Quality Metrics Methodology,” IEEE Std 1061TM-1998 (R2009), 2009. Available: http://ieeexplore.ieee.org/xpl/-articleDetails.jsp?arnumber=749159.
[45] D. Jannach, M. Zanker, A. Felfernig, and G. Friedrich, “Recommender Systems: An
Introduction,” Cambridge University Press, Cambridge, England, UK, 2010. [46] N. R. Jennings, P. Faratin, A. R. Lomuscio, S. Parsons, M. Wooldridge, and C. Sierra,
“Automated Negotiation: Prospects, Methods and Challenges,” Group Decision and Negotiation, vol. 10, no. 2, 2001.
[47] T. C. Johnson. (2013, October 20). Utility Functions. Available: http://www.macs.hw.ac.-
uk/macshome/ams/msc_actsci/utility_final.pdf. [48] C. Kaufman and R. Venkatapathy. (2013, October 20). Windows Azure Security Overview
(v1.01). Available: http://go.microsoft.com/?linkid=9740388. [49] W. J. Kettinger and C. C. Lee, “Perceived Service Quality and User Satisfaction with the
Information Services Function,” Decision Sciences, vol. 25, no. 5-6, 1994. [50] G. Lai, “Literature Review on Multi-Attribute Negotiations,” Technical Report, Carnegie
Mellon University (CMU-RI-TR-04-66), 2004. Available: http://www.ri.cmu.edu/pub_files/-pub4/lai_guoming_2004_1/lai_guoming_2004_1.pdf.
[51] G. M. Lai and K. Sycara, “A Generic Framework for Automated Multi-Attribute
Negotiation,” Group Decision and Negotiation, vol. 18, no. 2, pp. 169-187, 2009. [52] A. Lapadula, R. Pugliese, and F. Tiezzi, “Service Discovery and Negotiation with COWS,”
Electronic Notes in Theoretical Computer Science, vol. 200, no. 3, pp. 133-154, 2007. [53] J. Y. Lee, J. W. Lee, D. W. Cheun, and S. D. Kim, “A Quality Model for Evaluating
Software-as-a-Service in Cloud Computing,” In Proc. of the 7th ACIS International Conference on Software Engineering Research, Management and Applications, Haikou, Hainan, China, 2009.
[54] K. Leyton-Brown and Y. Shoham, “Essentials of Game Theory: A Concise,
Multidisciplinary Introduction,” Morgan and Claypool Publishers, San Rafael, California, USA, 2008.
[55] C. Li, “A Review of Research Literature on Bilateral Negotiations,” Technical Report,
Carnegie Mellon University (CMU-RI-TR-03-41), 2003. Available: http://www.cs.cmu.edu/-~softagents/papers/negotiation_lit.pdf.
[56] R. Lin and S. Kraus, “Can Automated Agents Proficiently Negotiate with Humans?”
Communications of ACM, vol. 53, no. 1, pp. 78–88, 2010. [57] G. Linden, B. Smith, and J. York, “Amazon.com Recommendations: Item-to-Item
Collaborative Filtering,” IEEE Internet Computing, vol. 7, no. 1, pp. 76–80, 2003. [58] A. R. Lomuscio, M. Wooldridge, and N. R. Jennings, “A Classification Scheme for
Negotiation in Electronic Commerce,” Group Decision and Negotiation, vol. 12, no. 1, 2003.
BIBLIOGRAPHY
153
[59] J. Lu and S. S. Gokhale, “Hierarchical Availability Analysis of Multi-Tiered Web Applications,” Software Quality Journal, vol. 21, no. 2, pp. 355-376, 2013.
[60] R. F. Lusch and S. L. Vargo, “The Service-Dominant Mindset,” In Service Science,
Management and Engineering Education for the 21st Century, B. Hefley and W. Murphy, Eds, Springer Publisher, New York City, New York, USA, 2008.
[61] M. Macias and J. Guitart, “Using Resource-Level Information into Nonadditive Negotiation
Models for Cloud Market Environments,” In Proc. of the 12th IEEE/IFIP Network Operations and Management Symposium, Osaka, Japan, 2010.
[62] P. P. Maglio, S. Srinivasan, J. T. Kreulen, and J. Spohrer, “Service Systems, Service
Scientists, SSME, and Innovation,” Communications of the ACM, vol. 49, no. 7, 2006. [63] A. Mani and A. Nagarajan. (2013, October 20). Understanding Quality of Service for Web
Services: Improving the Performance of Your Web Services. Available: http://www.ibm.com/developerworks/library/ws-quality.html.
[64] M. Maurer, I. Brandic, and R. Sakellariou, “Self-Adaptive and Resource-Efficient SLA
Enactment for Cloud Computing Infrastructures,” In Proc. of the 15th IEEE International Conference on Cloud Computing, Honolulu, Hawaii, USA, 2012.
[65] Microsoft. (2013a, October 20). SQL Azure Database. Available:
http://www.windowsazure.com/en-us/home/features/data-management/. [66] Microsoft. (2013b, October 20). Parallel Uploads to Windows Azure Blob Storage via a
Silverlight Control. Available: http://msdn.microsoft.com/en-us/library/windowsazure/-hh697509.aspx.
[67] Microsoft. (2013c, October 20). How to Use Blob Storage from Java. Available:
http://www.windowsazure.com/en-us/develop/java/how-to-guides/blob-storage/. [68] D. Minarolli and B. Freisleben, “Utility-Based Resource Allocation for Virtual Machines in
Cloud Computing,” In Proc. of the 16th IEEE Symposium on Computers and Communications, Kerkyra, Greece, 2011.
[69] D. G. A. Mobach, B. J. Overeinder, F. M. T. Brazier, and F. P. M. Dignum, “A Two-Tiered
Model of Negotiation Based on Web Service Agreements,” In Proc. of the 3rd European Workshop on Multi-Agent Systems, Brussels, Belgium, 2005.
[70] H. Mohanty, R. Kurra, and R. K. Shyamasundar, “A Framework for Web-Based
Negotiation,” In Proc. of the 6th International Conference on Distributed Computing and Internet Technology, Bhubaneswar, India, 2010.
[71] D. C. Montgomery and G. C. Runger, “Applied Statistics and Probability for Engineers,”
John Wiley & Sons Publisher, Hoboken, New Jersey, USA, pp. 132-133, 2011. [72] B. Narteh, “Service Quality in Automated Teller Machines: An Empirical Investigation,”
Managing Service Quality, vol. 23, no. 1, 2013.
BIBLIOGRAPHY
154
[73] J. F. Nash, “Equilibrium Points in N-Person Games,” Proceedings of the National Academy of Sciences, vol. 36, 1950.
[74] NBSC (National Bureau of Statistics of China). (2013, October 20). National Data.
Available: http://www.stats.gov.cn. [75] NetSuit. (2013, October 20). NetSuit Enterprise Resource Planning. Available:
http://www.netsuite.com/portal/products/netsuite/erp/main.shtml. [76] O. Niehörster, A. Brinkmann, G. Fels, J. Krüger, and J. Simon, “Enforcing SLAs in
Scientific Clouds,” In Proc. of the IEEE International Conference on Cluster Computing, Heraklion, Greece, 2010.
[77] Nobel Media. (2013, October 20). Mechanism Design Theory. Available:
http://www.nobelprize.org/nobel_prizes/economic-sciences/laureates/2007/press.html. [78] OGF (Open Grid Forum). (2013, October 20). Web Services Agreement Specification (WS-
Agreement). Available: http://www.ogf.org/documents/GFD.107.pdf. [79] N. Oldham, K. Verma, A. Sheth, and F. Hakimpour, “Semantic WS-Agreement Partner
Selection,” In Proc. of the 15th International World Wide Web Conference, Edinburgh, Scotland, UK, 2006.
[80] Oracle. (2013a, October 20). NetBeans IDE 6.9.1 Release Information. Available:
https://netbeans.org/community/releases/69/. [81] Oracle. (2013b, October 20). NetBeans IDE 7.2.1 Release Information. Available:
https://netbeans.org/community/releases/72/. [82] A. Parasuraman, V. A. Zeithaml, and L. L. Berry, “SERVQUAL: A Multiple-Item Scale for
Measuring Consumer Perceptions of Service Quality,” Journal of Retailing, vol. 64, no. 1, 1988.
[83] G. Parry, L. Newnes, and X. Huang, “Goods, Products and Services,” In Service Design and
Delivery, Service Science: Research and Innovations in the Service Economy, M. Macintyre et al., Eds, Springer Publisher, New York City, New York, USA, pp. 19-29, 2011.
[84] V. Patankar and R. Hewett, “Automated Negotiation in Web Service Procurement,” In Proc.
of the 3rd International Conference on Internet and Web Applications and Services, Athens, Greece, 2008.
[85] E. Pennisi, “On the Origin of Cooperation,” Science, vol. 525, no. 5945, pp. 1196-1199,
2009. [86] D. G. Rand, A. Dreber, T. Ellingsen, D. Fudenberg, and M. Nowak, “Positive Interactions
Promote Public Cooperation,” Science, vol. 325, no. 5945, pp. 1272-1275, 2009. [87] W. J. Regan, “The Service Revolution,” The Journal of Marketing, vol. 27, no. 3, pp. 57-62,
1963.

BIBLIOGRAPHY
155
[88] G. Reig, J. Alonso, and J. Guitart, “Prediction of Job Resource Requirements for Deadline Schedulers to Manage High-Level SLAs on the Cloud,” In Proc. of the 9th IEEE International Symposium on Network Computing and Applications, Cambridge, Massachusetts, USA, 2010.
[89] A. Rubinstein, “Perfect Equilibrium in a Bargaining Model,” Econometrica, vol. 50, no. 1,
1982. [90] S. Russell and P. Norvig, “Artificial Intelligence: A Modern Approach,” 3rd ed., Prentice
Hall Publisher, Upper Saddle River, New Jersey, USA, 2009. [91] R. T. Rust and C. Miu, “What Academic Research Tells Us about Service,” Communications
of the ACM, vol. 49, no. 7, pp. 49-54, 2006. [92] Salesforce. (2013, October 20). Salesforce Customer Relationship Management. Available:
http://www.salesforce.com. [93] J. Sheehan, “Understanding Service Sector Innovation,” Communications of the ACM, vol.
49, no. 7, pp. 43-47, 2006. [94] G. L. Shostack, “Designing Services that Deliver,” Harvard Business Review, vol. 62, no. 1,
pp. 133-139, 1984. [95] K. M. Sim, “Towards Complex Negotiation for Cloud Economy,” In Proc. of the 5th
International Conference on Grid and Pervasive Computing, LNCS 6104, Hualien, Taiwan, China, 2010.
[96] K. M. Sim, “Agent-Based Cloud Computing,” IEEE Transactions on Services Computing,
vol. 5, no. 4, 2012. [97] SLA@SOI. (2013, October 20). Reference Architecture for an SLA Management
Framework. Available: http://sourceforge.net/apps/trac/sla-at-soi/export/3052/platform/trunk/-doc/SLA@SOI-Reference_Architecture.pdf.
[98] S. Son and S. C. Jun, “Negotiation-Based Flexible SLA Establishment with SLA-Driven
Resource Allocation in Cloud Computing,” In Proc. of the 13th IEEE/ACM International Symposium on Cluster, Cloud, and Grid Computing, Delft, The Netherlands, 2013.
[99] J. Spohrer, P. P. Maglio, J. Bailey, and D. Gruhl, “Steps toward a Science of Service
Systems,” Computer, vol. 40, no. 1, pp. 71-77, 2007. [100] V. Stantchev and C. Schröpfer, “Negotiating and Enforcing QoS and SLAs in Grid and
Cloud Computing,” In Proc. of the 4th International Conference on Grid and Pervasive Computing, LNCS 5529, Geneva, Switzerland, 2009.
[101] B. Stauss, K. Engelmann, A. Kremer, and A. Luhn, “Services Science: Fundamentals,
Challenges and Future Developments,” Springer Publisher, Berlin, Germany, 2007.
BIBLIOGRAPHY
156
[102] S. I. Swaid and R. T. Wigand, “The Customer Perspective of E-Service Quality: An Empirical Study,” In Electronic Markets: Benefits, Costs and Risks, Craig Standing, Ed., Palgrave Macmillan, New York City, New York, USA, pp. 36-61, 2009.
[103] L. L. Thompson, J. Wang, and B. C. Gunia, “Negotiation,” Annual Review of Psychology,
vol. 61, pp. 491-515, 2010. [104] K. Tsakalozos, H. Kllapi, E. Sitaridi, M. Roussopoulos, D. Paparas, and A. Delis, “Flexible
Use of Cloud Resources through Profit Maximization and Price Discrimination,” In Proc. of the 27th IEEE International Conference on Data Engineering, Hannover, Germany, 2011.
[105] A. M. Turing, “Computing Machinery and Intelligence,” Mind, vol. 59, no. 236, 1950. [106] H. N. Van, F. D. Tran, and J. M. Menaud, “SLA-Aware Virtual Resource Management for
Cloud Infrastructures,” In Proc. of the 9th IEEE International Conference on Computer and Information Technology, Xiamen, Fujian, China, 2009.
[107] L. M. Vaquero, L. Rodero-Merino, J. Caceres, and M. Lindner, “A Break in the Clouds:
Towards a Cloud Definition,” ACM SIGCOMM Computer Communication Review, vol. 39, no. 1, 2009.
[108] S. L. Vargo and R. F. Lusch, “Evolving to a New Dominant Logic for Marketing,” Journal
of Marketing, vol. 68, no. 1, pp. 1-17, 2004. [109] S. L. Vargo and R. F. Lusch, “A Service Logic for Service Science,” In Service Science,
Management and Engineering Education for the 21st Century, B. Hefley and W. Murphy, Eds, Springer Publisher, New York City, New York, USA, 2008.
[110] W3C (World Wide Web Consortium). (2013a, October 20). Web Services Architecture.
Available: http://www.w3.org/TR/ws-arch/#whatis. [111] W3C (World Wide Web Consortium). (2013b, October 20). Web Services Policy 1.2
Framework. Available: http://www.w3.org/Submission/WS-Policy/. [112] X. Wang, “Probabilistic Algorithms,” In Design and Analysis of Computer Algorithms (in
Chinese), Chapter 7, Publishing House of Electronics Industry, Beijing, China, pp. 216-222, 2001.
[113] P. Wang, K. Chao, C. Lo, C. Huang, and Y. Li, “A Fuzzy Model for Selection of QoS-
Aware Web Services,” In Proc. of the 2nd IEEE International Conference on E-Business Engineering, Washington DC, USA, 2006.
[114] C. Weinhardt et al., “Cloud Computing ― A Classification, Business Models, and Research
Directions,” Business & Information Systems Engineering, vol. 1, no. 5, 2009. [115] Wikipedia. (2013a, October 20). Economy of Canada. Available: http://en.wikipedia.org/-
wiki/Economy_of_Canada. [116] Wikipedia. (2013b, October 20). Spearman’s correlation coefficient. Available:
http://en.wikipedia.org/wiki/Spearman%27s_rank_correlation_coefficient.
BIBLIOGRAPHY
157
[117] L. Wu, S. K. Garg, and R. Buyya, “SLA-Based Resource Allocation for Software as a Service Provider (SaaS) in Cloud Computing Environments,” In Proc. of the 11th IEEE/ACM International Symposium on Cluster, Cloud and Grid Computing, Newport Beach, California, USA, 2011.
[118] J. Yan, R. Kowalczyk, J. Lin, M. Chhetri, S. Goh, and J. Zhang, “Autonomous Service
Level Agreement Negotiation for Service Composition Provision,” Future Generation Computer Systems, vol. 23, no. 6, pp. 748–759, 2007.
[119] Y. Yao and L. Ma, “Automated Negotiation for Web Services,” In Proc. of the 11th IEEE
Singapore International Conference on Communication Systems, Guangzhou, Guangdong, China, 2008.
[120] Y. Yao, F. Yang, and S. Su, “Flexible Decision Making in Web Services Negotiation,” In
Proc. of the 12th International Conference on Artificial Intelligence: Methodology, Systems, Applications, Varna, Bulgaria, 2006.
[121] E. Yaqub et al., “A Generic Platform for Conducting SLA Negotiations,” In Service Level
Agreements for Cloud Computing, P. Wieder et al., Eds, Springer Publisher, New York City, New York, USA, 2011.
[122] E. Zainuddin and P. Gonzalez, “Configurablility, Maturity, and Value Co-Creation in SaaS:
An Exploratory Case Study,” In Proc. of the 32nd International Conference on Information Systems, Shanghai, China, 2011.
[123] D. Zeng and K. Sycara, “Bayesian Learning in Negotiation,” AAAI Technical Report SS-96-
01, 1996. Available: http://www.aaai.org/Library/Symposia/Spring/1996/ss96-01-019.php. [124] L. J. Zhang, J. Zhang, and H. Cai, “Services Computing,” Tsinghua University Press,
Beijing, China and Springer Publisher, Berlin, Germany, 2007. [125] X. Zheng, P. Martin, and K. Brohman (2013a), “Cloud Service Negotiation in IoT
Environment — A Mixed Approach,” IEEE Transactions on Industrial Informatics (accepted for publication), 2013.
[126] X. Zheng, P. Martin, and K. Brohman (2013b), “Cloud Service Negotiation: A Research
Roadmap,” In Proc. of the 10th IEEE International Conference on Services Computing, Santa Clara, California, USA, 2013.
[127] X. Zheng, P. Martin, and K. Brohman (2013c), “CLOUDQUAL — A Quality Model for
Cloud Services,” IEEE Transactions on Industrial Informatics (accepted for publication), 2013.
[128] X. Zheng, P. Martin, and K. Brohman, “Cloud Service Negotiation: Concession vs.
Tradeoff Approaches,” In Proc. of the 12th IEEE/ACM International Symposium on Cluster, Cloud, and Grid Computing, Ottawa, Ontario, Canada, 2012.
[129] F. Zulkernine, P. Martin, C. Craddock, and K. Wilson, “A Policy-Based Middleware for
Web Services SLA Negotiation,” In Proc. of the 6th IEEE International Conference on Web Services, Beijing, China, 2008.
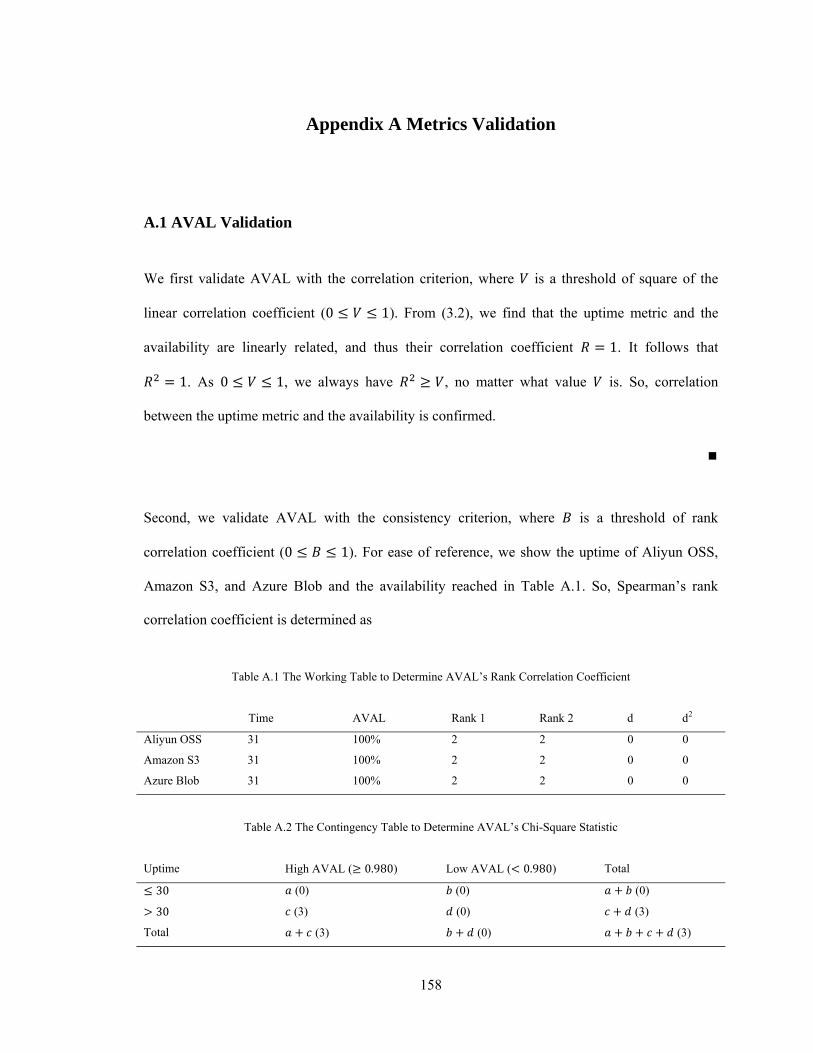
158
Appendix A Metrics Validation
A.1 AVAL Validation
We first validate AVAL with the correlation criterion, where is a threshold of square of the
linear correlation coefficient (0 ≤ ≤ 1). From (3.2), we find that the uptime metric and the
availability are linearly related, and thus their correlation coefficient = 1. It follows that = 1. As 0 ≤ ≤ 1, we always have ≥ , no matter what value is. So, correlation
between the uptime metric and the availability is confirmed. ∎
Second, we validate AVAL with the consistency criterion, where is a threshold of rank
correlation coefficient (0 ≤ ≤ 1). For ease of reference, we show the uptime of Aliyun OSS,
Amazon S3, and Azure Blob and the availability reached in Table A.1. So, Spearman’s rank
correlation coefficient is determined as
Table A.1 The Working Table to Determine AVAL’s Rank Correlation Coefficient
Time AVAL Rank 1 Rank 2 d d2
Aliyun OSS
Amazon S3
Azure Blob
31 100% 2 2 0 0
31 100% 2 2 0 0
31 100% 2 2 0 0
Table A.2 The Contingency Table to Determine AVAL’s Chi-Square Statistic
Uptime High AVAL (≥ 0.980) Low AVAL (< 0.980) Total ≤ 30 > 30
Total
(0) (0) + (0)
(3) (0) + (3) + (3) + (0) + + + (3)
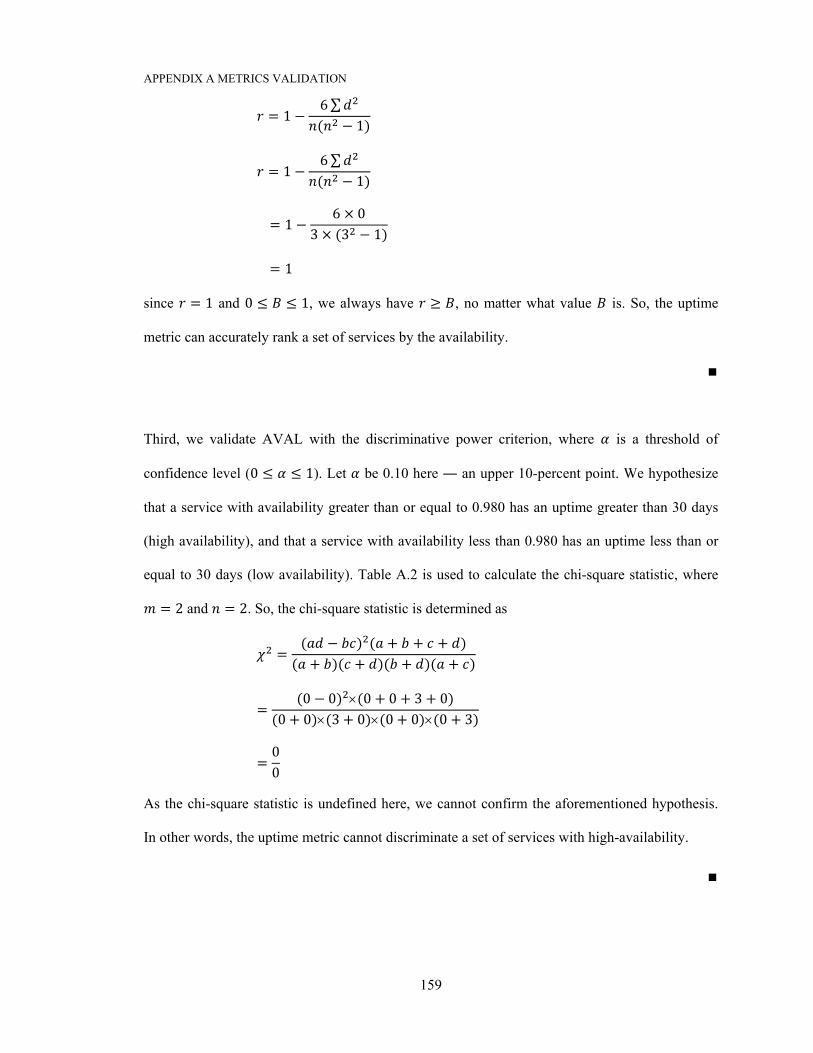
APPENDIX A METRICS VALIDATION
159
= 1 − 6∑( − 1) = 1 − 6∑( − 1)
= 1 − 6 × 03 × (3 − 1) = 1
since = 1 and 0 ≤ ≤ 1, we always have ≥ , no matter what value is. So, the uptime
metric can accurately rank a set of services by the availability. ∎
Third, we validate AVAL with the discriminative power criterion, where is a threshold of
confidence level (0 ≤ ≤ 1). Let be 0.10 here ― an upper 10-percent point. We hypothesize
that a service with availability greater than or equal to 0.980 has an uptime greater than 30 days
(high availability), and that a service with availability less than 0.980 has an uptime less than or
equal to 30 days (low availability). Table A.2 is used to calculate the chi-square statistic, where = 2 and = 2. So, the chi-square statistic is determined as
= ( − ) ( + + + )( + )( + )( + )( + ) = (0 − 0) ×(0 + 0 + 3 + 0)(0 + 0)×(3 + 0)×(0 + 0)×(0 + 3) = 00
As the chi-square statistic is undefined here, we cannot confirm the aforementioned hypothesis.
In other words, the uptime metric cannot discriminate a set of services with high-availability. ∎
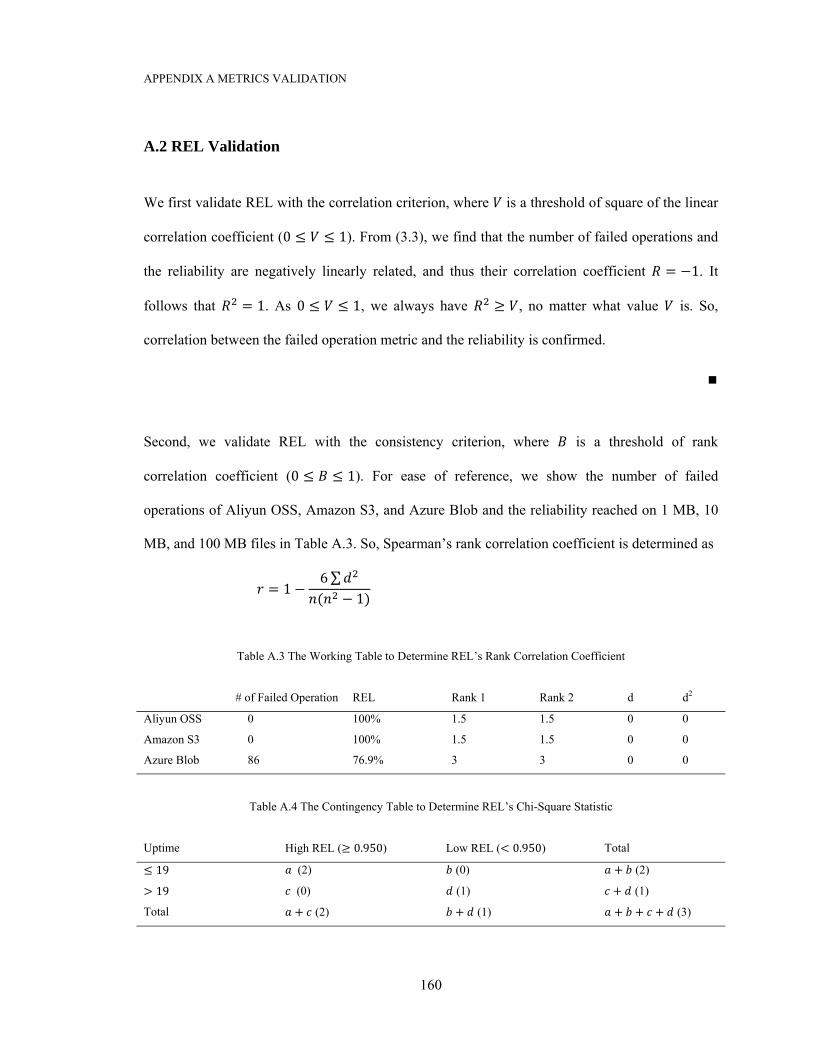
APPENDIX A METRICS VALIDATION
160
A.2 REL Validation
We first validate REL with the correlation criterion, where is a threshold of square of the linear
correlation coefficient (0 ≤ ≤ 1). From (3.3), we find that the number of failed operations and
the reliability are negatively linearly related, and thus their correlation coefficient = −1. It
follows that = 1. As 0 ≤ ≤ 1, we always have ≥ , no matter what value is. So,
correlation between the failed operation metric and the reliability is confirmed. ∎
Second, we validate REL with the consistency criterion, where is a threshold of rank
correlation coefficient (0 ≤ ≤ 1). For ease of reference, we show the number of failed
operations of Aliyun OSS, Amazon S3, and Azure Blob and the reliability reached on 1 MB, 10
MB, and 100 MB files in Table A.3. So, Spearman’s rank correlation coefficient is determined as
= 1 − 6∑( − 1)
Table A.3 The Working Table to Determine REL’s Rank Correlation Coefficient
# of Failed Operation REL Rank 1 Rank 2 d d2
Aliyun OSS
Amazon S3
Azure Blob
0 100% 1.5 1.5 0 0
0 100% 1.5 1.5 0 0
86 76.9% 3 3 0 0
Table A.4 The Contingency Table to Determine REL’s Chi-Square Statistic
Uptime High REL (≥ 0.950) Low REL (< 0.950) Total ≤ 19 > 19
Total
(2) (0) + (2) (0) (1) + (1) + (2) + (1) + + + (3)
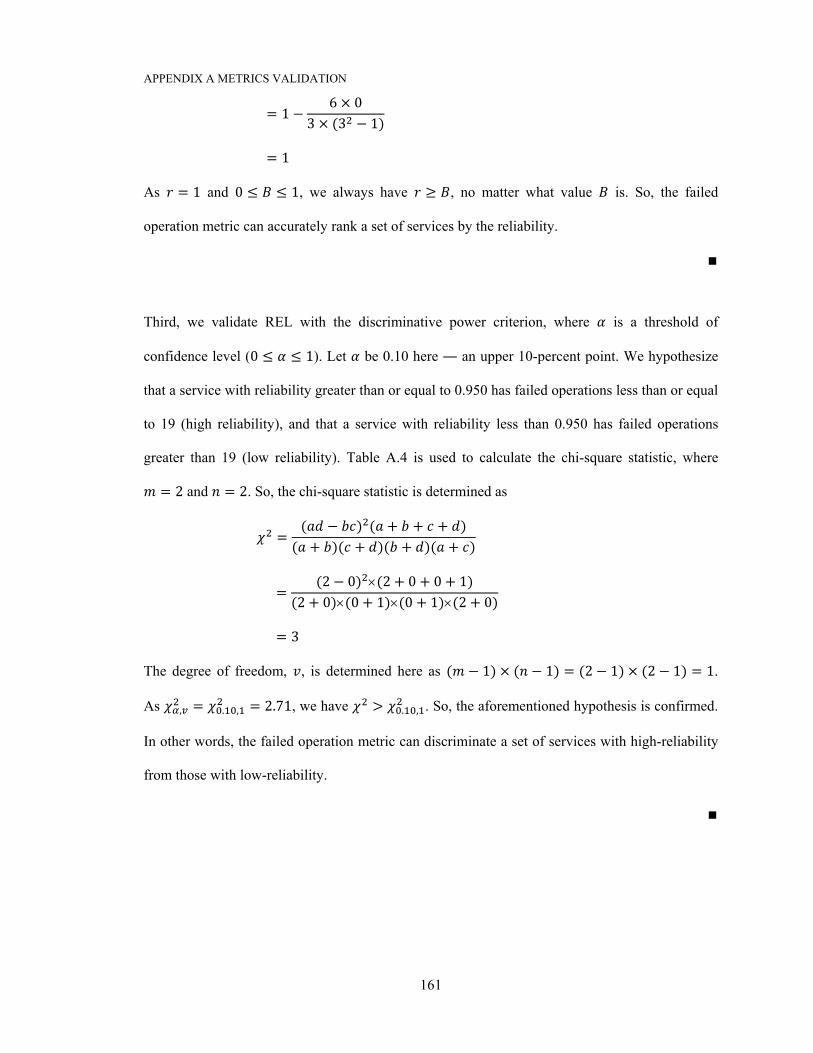
APPENDIX A METRICS VALIDATION
161
= 1 − 6 × 03 × (3 − 1) = 1
As = 1 and 0 ≤ ≤ 1, we always have ≥ , no matter what value is. So, the failed
operation metric can accurately rank a set of services by the reliability. ∎
Third, we validate REL with the discriminative power criterion, where is a threshold of
confidence level (0 ≤ ≤ 1). Let be 0.10 here ― an upper 10-percent point. We hypothesize
that a service with reliability greater than or equal to 0.950 has failed operations less than or equal
to 19 (high reliability), and that a service with reliability less than 0.950 has failed operations
greater than 19 (low reliability). Table A.4 is used to calculate the chi-square statistic, where = 2 and = 2. So, the chi-square statistic is determined as
= ( − ) ( + + + )( + )( + )( + )( + ) = (2 − 0) ×(2 + 0 + 0 + 1)(2 + 0)×(0 + 1)×(0 + 1)×(2 + 0) = 3
The degree of freedom, , is determined here as ( − 1) × ( − 1) = (2 − 1) × (2 − 1) = 1.
As , = . , = 2.71, we have > . , . So, the aforementioned hypothesis is confirmed.
In other words, the failed operation metric can discriminate a set of services with high-reliability
from those with low-reliability. ∎
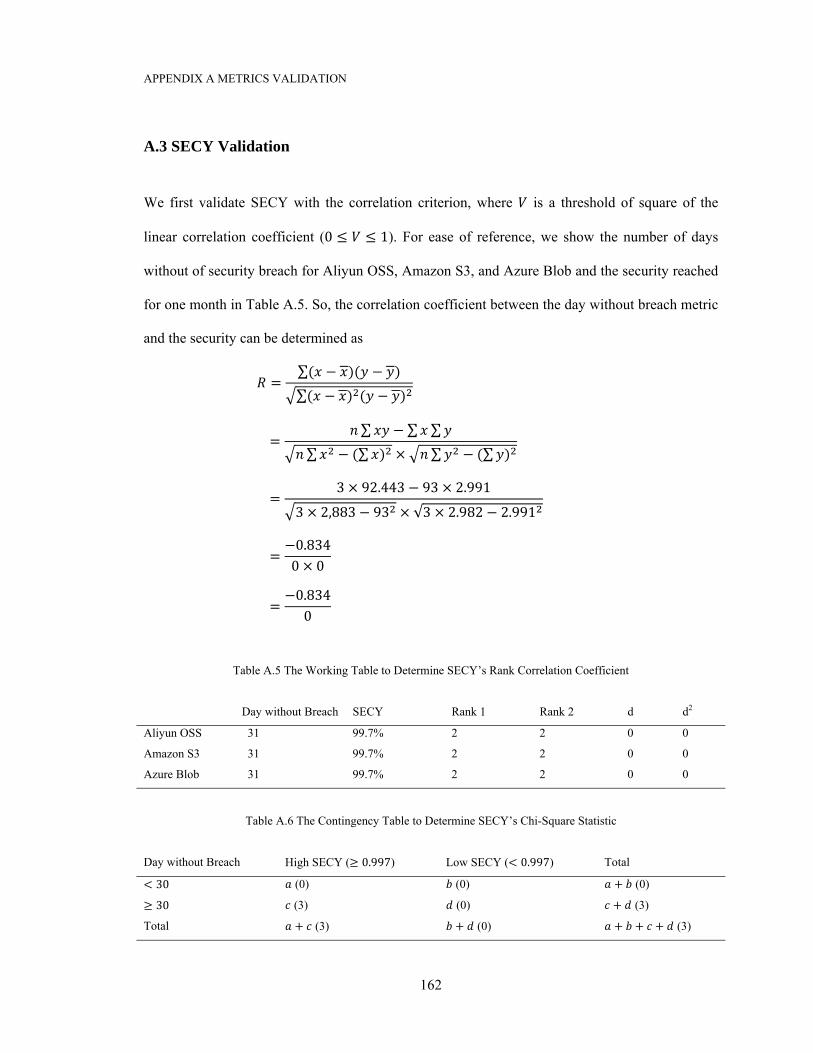
APPENDIX A METRICS VALIDATION
162
A.3 SECY Validation
We first validate SECY with the correlation criterion, where is a threshold of square of the
linear correlation coefficient (0 ≤ ≤ 1). For ease of reference, we show the number of days
without of security breach for Aliyun OSS, Amazon S3, and Azure Blob and the security reached
for one month in Table A.5. So, the correlation coefficient between the day without breach metric
and the security can be determined as
= ∑( − )( − )∑( − ) ( − )
= ∑ − ∑ ∑∑ − (∑ ) × ∑ − (∑ )
= 3 × 92.443 − 93 × 2.9913 × 2,883 − 93 × √3 × 2.982 − 2.991
= −0.8340 × 0
= −0.8340
Table A.5 The Working Table to Determine SECY’s Rank Correlation Coefficient
Day without Breach SECY Rank 1 Rank 2 d d2
Aliyun OSS
Amazon S3
Azure Blob
31 99.7% 2 2 0 0
31 99.7% 2 2 0 0
31 99.7% 2 2 0 0
Table A.6 The Contingency Table to Determine SECY’s Chi-Square Statistic
Day without Breach High SECY (≥ 0.997) Low SECY (< 0.997) Total < 30 ≥ 30
Total
(0) (0) + (0)
(3) (0) + (3) + (3) + (0) + + + (3)
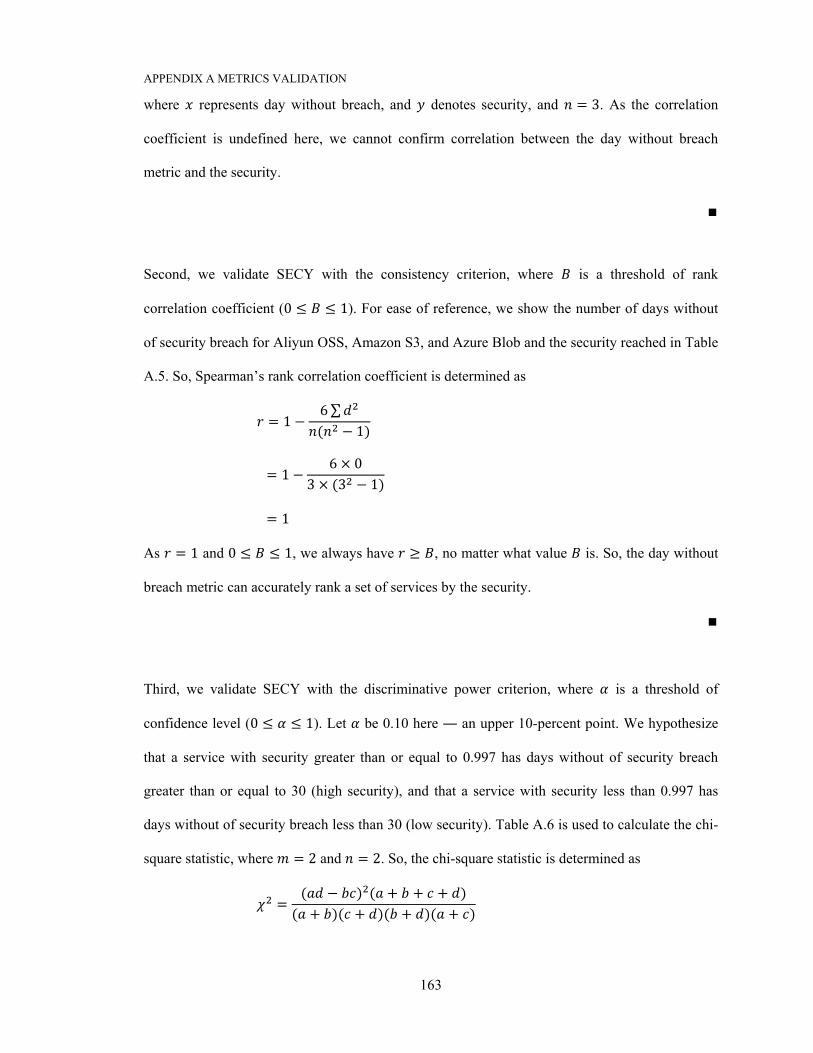
APPENDIX A METRICS VALIDATION
163
where represents day without breach, and denotes security, and = 3. As the correlation
coefficient is undefined here, we cannot confirm correlation between the day without breach
metric and the security. ∎
Second, we validate SECY with the consistency criterion, where is a threshold of rank
correlation coefficient (0 ≤ ≤ 1). For ease of reference, we show the number of days without
of security breach for Aliyun OSS, Amazon S3, and Azure Blob and the security reached in Table
A.5. So, Spearman’s rank correlation coefficient is determined as
= 1 − 6∑( − 1) = 1 − 6 × 03 × (3 − 1) = 1
As = 1 and 0 ≤ ≤ 1, we always have ≥ , no matter what value is. So, the day without
breach metric can accurately rank a set of services by the security. ∎
Third, we validate SECY with the discriminative power criterion, where is a threshold of
confidence level (0 ≤ ≤ 1). Let be 0.10 here ― an upper 10-percent point. We hypothesize
that a service with security greater than or equal to 0.997 has days without of security breach
greater than or equal to 30 (high security), and that a service with security less than 0.997 has
days without of security breach less than 30 (low security). Table A.6 is used to calculate the chi-
square statistic, where = 2 and = 2. So, the chi-square statistic is determined as
= ( − ) ( + + + )( + )( + )( + )( + )
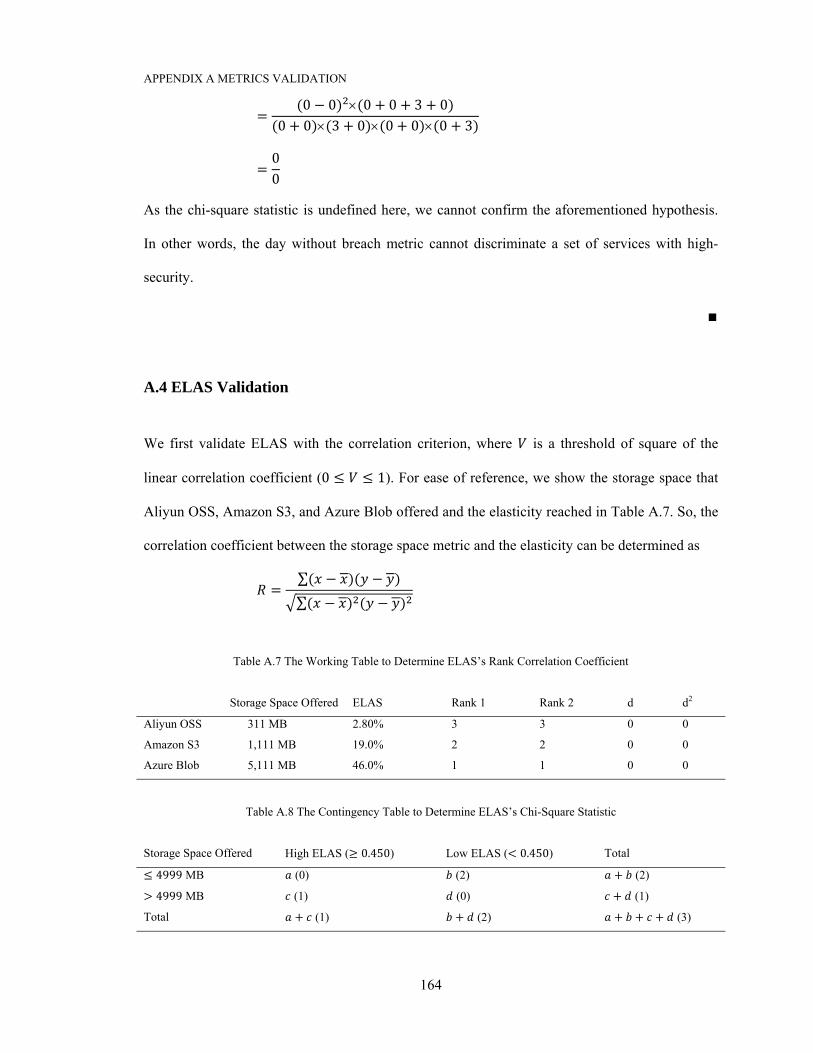
APPENDIX A METRICS VALIDATION
164
= (0 − 0) ×(0 + 0 + 3 + 0)(0 + 0)×(3 + 0)×(0 + 0)×(0 + 3) = 00
As the chi-square statistic is undefined here, we cannot confirm the aforementioned hypothesis.
In other words, the day without breach metric cannot discriminate a set of services with high-
security. ∎
A.4 ELAS Validation
We first validate ELAS with the correlation criterion, where is a threshold of square of the
linear correlation coefficient (0 ≤ ≤ 1). For ease of reference, we show the storage space that
Aliyun OSS, Amazon S3, and Azure Blob offered and the elasticity reached in Table A.7. So, the
correlation coefficient between the storage space metric and the elasticity can be determined as
= ∑( − )( − )∑( − ) ( − )
Table A.7 The Working Table to Determine ELAS’s Rank Correlation Coefficient
Storage Space Offered ELAS Rank 1 Rank 2 d d2
Aliyun OSS
Amazon S3
Azure Blob
311 MB 2.80% 3 3 0 0
1,111 MB 19.0% 2 2 0 0
5,111 MB 46.0% 1 1 0 0
Table A.8 The Contingency Table to Determine ELAS’s Chi-Square Statistic
Storage Space Offered High ELAS (≥ 0.450) Low ELAS (< 0.450) Total ≤ 4999 MB > 4999 MB
Total
(0) (2) + (2)
(1) (0) + (1) + (1) + (2) + + + (3)
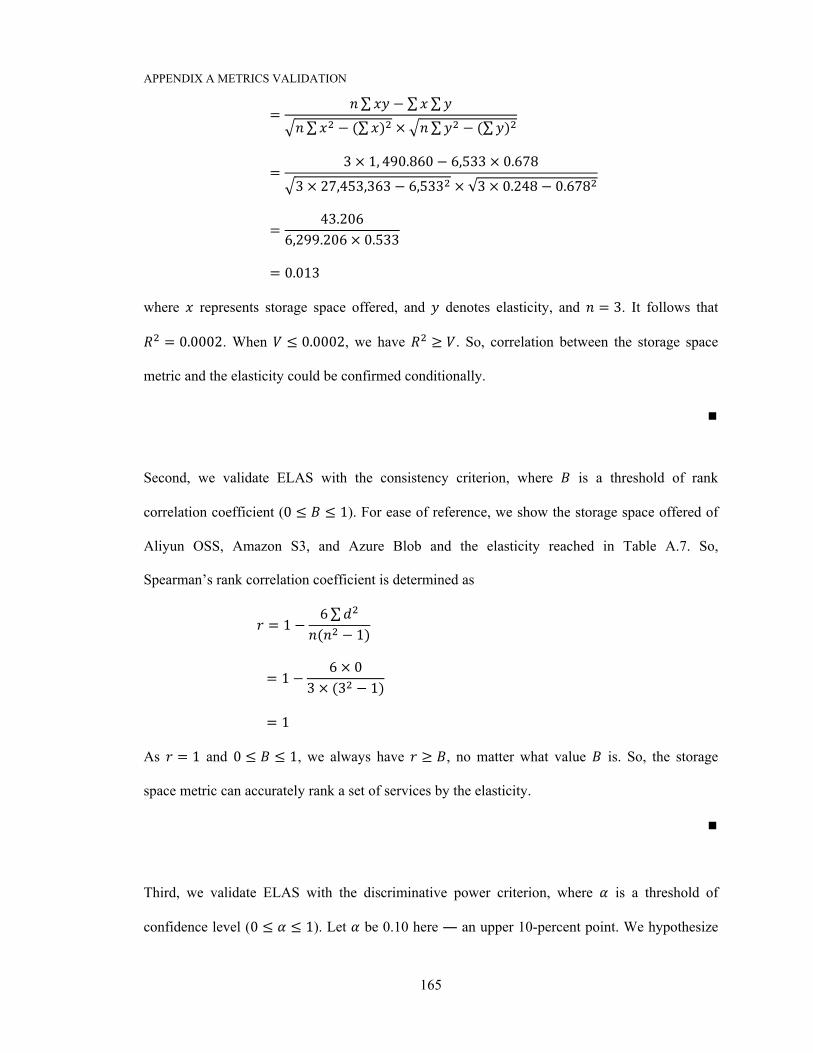
APPENDIX A METRICS VALIDATION
165
= ∑ − ∑ ∑∑ − (∑ ) × ∑ − (∑ )
= 3 × 1, 490.860 − 6,533 × 0.6783 × 27,453,363 − 6,533 × √3 × 0.248 − 0.678
= 43.2066,299.206 × 0.533
= 0.013
where represents storage space offered, and denotes elasticity, and = 3. It follows that = 0.0002. When ≤ 0.0002, we have ≥ . So, correlation between the storage space
metric and the elasticity could be confirmed conditionally. ∎
Second, we validate ELAS with the consistency criterion, where is a threshold of rank
correlation coefficient (0 ≤ ≤ 1). For ease of reference, we show the storage space offered of
Aliyun OSS, Amazon S3, and Azure Blob and the elasticity reached in Table A.7. So,
Spearman’s rank correlation coefficient is determined as
= 1 − 6∑( − 1) = 1 − 6 × 03 × (3 − 1) = 1
As = 1 and 0 ≤ ≤ 1, we always have ≥ , no matter what value is. So, the storage
space metric can accurately rank a set of services by the elasticity. ∎
Third, we validate ELAS with the discriminative power criterion, where is a threshold of
confidence level (0 ≤ ≤ 1). Let be 0.10 here ― an upper 10-percent point. We hypothesize

APPENDIX A METRICS VALIDATION
166
that a service with elasticity greater than or equal to 0.450 can offer more than or equal to 4999
MB storage space in a day (high elasticity), and that a service with elasticity less than 0.450 can
offer less than 4999 MB storage space in a day (low elasticity). Table A.8 is used to calculate the
chi-square statistic, where = 2 and = 2. So, the chi-square statistic is determined as
= ( − ) ( + + + )( + )( + )( + )( + ) = (0 − 2) ×(0 + 2 + 1 + 0)(0 + 2)×(1 + 0)×(2 + 0)×(0 + 1) = 3
The degree of freedom, , is determined here as ( − 1) × ( − 1) = (2 − 1) × (2 − 1) = 1.
As , = . , = 2.71, we have > . , . So, the aforementioned hypothesis is confirmed.
In other words, the storage space metric can discriminate a set of services with high-elasticity
from those with low-elasticity. ∎