
Tuning of the interaction potential in complex plasmas
154
HAL Id: tel-00831697 https://tel.archives-ouvertes.fr/tel-00831697 Submitted on 7 Jun 2013 HAL is a multi-disciplinary open access archive for the deposit and dissemination of sci- entific research documents, whether they are pub- lished or not. The documents may come from teaching and research institutions in France or abroad, or from public or private research centers. L’archive ouverte pluridisciplinaire HAL, est destinée au dépôt et à la diffusion de documents scientifiques de niveau recherche, publiés ou non, émanant des établissements d’enseignement et de recherche français ou étrangers, des laboratoires publics ou privés. Tuning of the interaction potential in complex plasmas Lisa Wörner To cite this version: Lisa Wörner. Tuning of the interaction potential in complex plasmas. Other [cond-mat.other]. Uni- versité d’Orléans, 2012. English. NNT : 2012ORLE2052. tel-00831697
-
Upload
khangminh22 -
Category
Documents
-
view
1 -
download
0
Transcript of Tuning of the interaction potential in complex plasmas

HAL Id: tel-00831697https://tel.archives-ouvertes.fr/tel-00831697
Submitted on 7 Jun 2013
HAL is a multi-disciplinary open accessarchive for the deposit and dissemination of sci-entific research documents, whether they are pub-lished or not. The documents may come fromteaching and research institutions in France orabroad, or from public or private research centers.
L’archive ouverte pluridisciplinaire HAL, estdestinée au dépôt et à la diffusion de documentsscientifiques de niveau recherche, publiés ou non,émanant des établissements d’enseignement et derecherche français ou étrangers, des laboratoirespublics ou privés.
Tuning of the interaction potential in complex plasmasLisa Wörner
To cite this version:Lisa Wörner. Tuning of the interaction potential in complex plasmas. Other [cond-mat.other]. Uni-versité d’Orléans, 2012. English. �NNT : 2012ORLE2052�. �tel-00831697�

Tuning the interaction Potential incomplex Plasmas
Lisa Worner
Munchen 2012


iii
ÉCOLE DOCTORALE MATHEMATIQUES, INFORMATIQUE, PHYSIQUE THEORIQUE ET
INGENIERIE DES SYSTEMES
GREMI, Orléans / MPE, Munich
THÈSE EN COTUTELLE INTERNATIONALE présentée par :
Lisa WÖRNER
soutenue le : 07 décembre 2012
pour obtenir le grade de :
Docteur de l’Université d’Orléans et de l’Université de Munich (LMU)
Discipline : Physique
Tuning of the Interaction Potential
THÈSE dirigée par :
M. Gregor E. MORFILL Professeur, MPE, Garching, Allemagne M. Laifa BOUFENDI Professeur, GREMI, Orléans, France
RAPPORTEURS :
M. Gregor E. MORFILL Professeur, MPE, Garching, Allemagne M. Laifa BOUFENDI Professeur, GREMI, Orléans, France
_____________________________________________________________________ JURY (indiquez tous les membres du jury – y compris directeur(s) thèse et rapporteurs) :
M. Hartmut ZOHM Professeur, IPP, Garching, Allemagne Président du jury (sur version définitive) M. Gregor E. MORFILL Professeur, MPE, Garching, Allemagne M. Laifa BOUFENDI Professeur, GREMI, Orléans, France M. Hartmut RUHL Professeur, LMU, München, Allemagne

iv

v
Lisa WÖRNER
Modulation du Potentiel d’Interaction
Résumé en français
A côté des solides, des liquides et des gaz, le plasma est le quatrième état de la matière. Il est généré en
ionisant un gaz. Dans l’univers, 99% de la matière est à l’état de plasma. L’émergence de plusieurs types
de plasmas artificiels est due aux multiples et différentes applications, très intéressantes les unes que les
autres, des plasmas dans des secteurs aussi variés que l’industrie, l’énergie, le biomédical et la science. Très
souvent, des particules solides peuvent se former dans les plasmas. Ceci a tout particulièrement été observé
dans ceux utilisés dans l’industrie. La compréhension des mécanismes de leur nucléation et croissance est
d’une importance capitale en vue de trouver des solutions pour inhiber leur formation ou d’éviter qu’elles
ne se déposent sur les surfaces en cours de traitement.
L’objectif du travail de recherche entrant dans le cadre de cette thèse est l’étude de la formation de
particules dans un plasma généré par décharge électrique continue. Il a été observé que ce phénomène
dépend du flux de gaz neutre injecté dans l’enceinte du réacteur. Nous avons mis en évidence que la
fréquence de formation est liée à ce paramètre. Les observations enregistrées à l’aide d’un spectroscope
sont complétées et corrélées aux photographies obtenues par microscopie électronique à balayage.
L’injection de particules dans le plasma plutôt que de procéder à les faire croitre présente certains
avantages. On peut contrôler leur taille y compris du cas de mélanges de particules. On tout
particulièrement injecter des particules ayant des tailles beaucoup plus importantes que celles que l’on
forme sur des gammes de durées raisonnables des plasmas utilisés.
Plusieurs expériences réalisées avec des particules injectées ont mis en exergue le caractère
pluridisciplinaire du milieu plasma. Afin de comprendre les interactions mutuelles entre particules il est
crucial de déterminer la charge portée par les particules.
Plusieurs expériences réalisées au cours de cette thèse et présentées ici ont porté sur la détermination
de ce paramètre fondamental. Dans ce cadre une série d’expérience a été réalisée à bord de la Station
Spatiale Internationale (ISS) dans le but de déterminer la charge résiduelle des particules dans la phase de
post-décharge.
Dans la dernière partie, seront présentées et discutées des expériences portant sur l’observation de la
rotation de clusters de particules soumis à un confinement supplémentaire. On montre que les particules
tendent à former des alignements verticaux dus au faible champ qui se forme en aval de chaque particule.
Enfin, les connaissances acquises sur les possibilités de moduler le potentiel d’interaction par
l’intermédiaire d’un champ électrique seront discutées. Les résultats sont comparés aux prédictions des
simulations.
Mots-clés : plasma poudreux, formation des particules, potentiel d’interaction

vi

vii
Lisa WÖRNER
Tuning of the Interaction Potential
Résumé en anglais
Plasmas are next to the solid, liquid and gaseous phase the fourth state of matter. It is established by
ionizing a gas. About 99% of the visible matter in the universe is in the state of plasma. The industrial,
medical and scientific benefits of plasmas led to a variety of artificially produced plasmas. In plasmas dust
particles can grow. Especially in industrial plasmas particle formation in the plasma gas phase is very
common. The fundamental understanding of the growth is of vital importance in order to suppress
undesired particle formation or to deposit particles and films in a certain region.
In terms of this thesis the particle growth in a direct current (DC) discharge by using acetylene will be
discussed. It has been observed that the particle growth depends on the neutral gas flow fed into the plasma
chamber. Depending on the applied flow different growth frequencies and transport phenomena are shown.
The observations recorded by a spectrometer will then be complimented by pictures from the particles taken
by a scanning electron microscope.
Introducing artificial particles into a plasma rather than growing them there yields several advantages. The
particle sizes can be controlled, including the possibility of particle mixtures. Furthermore, particles with
bigger diameter can be introduced than what can be grown on reasonable time scales in a plasma.
Several possible experiments with injected particles underline the interdisciplinary character of the plasma
environment. To understand the inter particle interactions the particle charge is a crucial parameter.
In this thesis several experiments determining the particle charge will be discussed. In this frame the
experiments on board of the International Space Station have been performed to measure the residual
charge in the particle afterglow. In the last section experiments on particle cluster rotation as observed in an
additional confinement will be discussed. It will be shown that the particles tend to form vertical strings due
to the wake field that forms downstream of each particle. Finally the insight gained on the possibilities of
tuning of the interaction potential by electric fields will be discussed. The results are then compared to the
predictions of earlier simulations.
Mots-clés : Complex / Dusty Plasmas, Formation of Particles, Interaction Potential
GREMI
14 rue d'Issoudun
B.P. 6744
45067 Orléans Cedex 2
France
MPE
Giessenbachstrasse
85748 Garching
Allemagne

viii
Tuning the interaction Potential incomplex Plasmas
Dissertation
conducted in the framework
of a joint supervision (co-tutelle)
at the Fakultat fur Physik
der Ludwig–Maximilians–Universitat Munchen
and the
Universite d’Orleans
handed in by
Lisa Worner
born in Darmstadt.
Munich, the 26. October 2012

First Referee: Prof. Dr. G. E. Morfill
Second Referee: Prof. Dr. L. BoufendiDate of the oral Exam: 7. 12. 2012

Contents
Abstract xv
Resume xvii
Kurzbeschreibung xix
Outline xxi
1 Plasmas 11.1 States of Matter . . . . . . . . . . . . . . . . . . . . . . . . . . . . . . . . . 11.2 Temperatures . . . . . . . . . . . . . . . . . . . . . . . . . . . . . . . . . . 21.3 Low temperature Plasmas . . . . . . . . . . . . . . . . . . . . . . . . . . . 2
1.3.1 General . . . . . . . . . . . . . . . . . . . . . . . . . . . . . . . . . 21.3.2 Ionization . . . . . . . . . . . . . . . . . . . . . . . . . . . . . . . . 31.3.3 Potentials . . . . . . . . . . . . . . . . . . . . . . . . . . . . . . . . 41.3.4 Regions . . . . . . . . . . . . . . . . . . . . . . . . . . . . . . . . . 5
1.4 Plasma Chemistry . . . . . . . . . . . . . . . . . . . . . . . . . . . . . . . 101.5 Probing Plasmas . . . . . . . . . . . . . . . . . . . . . . . . . . . . . . . . 121.6 Summary . . . . . . . . . . . . . . . . . . . . . . . . . . . . . . . . . . . . 141.7 Resume . . . . . . . . . . . . . . . . . . . . . . . . . . . . . . . . . . . . . 141.8 Zusammenfassung . . . . . . . . . . . . . . . . . . . . . . . . . . . . . . . . 15
2 Particles in Plasmas 172.1 Particles . . . . . . . . . . . . . . . . . . . . . . . . . . . . . . . . . . . . . 172.2 Charging . . . . . . . . . . . . . . . . . . . . . . . . . . . . . . . . . . . . . 192.3 Forces . . . . . . . . . . . . . . . . . . . . . . . . . . . . . . . . . . . . . . 222.4 Particle Interactions . . . . . . . . . . . . . . . . . . . . . . . . . . . . . . 242.5 Summary . . . . . . . . . . . . . . . . . . . . . . . . . . . . . . . . . . . . 292.6 Resume . . . . . . . . . . . . . . . . . . . . . . . . . . . . . . . . . . . . . 292.7 Zusammenfassung . . . . . . . . . . . . . . . . . . . . . . . . . . . . . . . . 29
3 Dust Particle Formation 313.1 Introduction . . . . . . . . . . . . . . . . . . . . . . . . . . . . . . . . . . . 313.2 Growth Process . . . . . . . . . . . . . . . . . . . . . . . . . . . . . . . . . 32

xii CONTENTS
3.2.1 General . . . . . . . . . . . . . . . . . . . . . . . . . . . . . . . . . 323.2.2 Nucleation . . . . . . . . . . . . . . . . . . . . . . . . . . . . . . . . 323.2.3 Coagulation . . . . . . . . . . . . . . . . . . . . . . . . . . . . . . . 343.2.4 Accretion . . . . . . . . . . . . . . . . . . . . . . . . . . . . . . . . 343.2.5 Generations . . . . . . . . . . . . . . . . . . . . . . . . . . . . . . . 34
3.3 Influence on the Plasma . . . . . . . . . . . . . . . . . . . . . . . . . . . . 353.4 Influence on the Growth . . . . . . . . . . . . . . . . . . . . . . . . . . . . 363.5 Summary . . . . . . . . . . . . . . . . . . . . . . . . . . . . . . . . . . . . 373.6 Resume . . . . . . . . . . . . . . . . . . . . . . . . . . . . . . . . . . . . . 373.7 Zusammenfassung . . . . . . . . . . . . . . . . . . . . . . . . . . . . . . . . 38
4 Particle Formation in a DC Discharge 394.1 Previous Experiments . . . . . . . . . . . . . . . . . . . . . . . . . . . . . . 394.2 Experimental Setup . . . . . . . . . . . . . . . . . . . . . . . . . . . . . . . 404.3 Results . . . . . . . . . . . . . . . . . . . . . . . . . . . . . . . . . . . . . . 41
4.3.1 Observation . . . . . . . . . . . . . . . . . . . . . . . . . . . . . . . 414.3.2 Particle Transport . . . . . . . . . . . . . . . . . . . . . . . . . . . 424.3.3 Absence of Growth . . . . . . . . . . . . . . . . . . . . . . . . . . . 454.3.4 Scanning Electron Microscope Results . . . . . . . . . . . . . . . . 464.3.5 Transportation Time . . . . . . . . . . . . . . . . . . . . . . . . . . 474.3.6 Plasma Instabilities . . . . . . . . . . . . . . . . . . . . . . . . . . . 48
4.4 Possible further Experiments . . . . . . . . . . . . . . . . . . . . . . . . . . 494.5 Summary . . . . . . . . . . . . . . . . . . . . . . . . . . . . . . . . . . . . 504.6 Resume . . . . . . . . . . . . . . . . . . . . . . . . . . . . . . . . . . . . . 514.7 Zusammenfassung . . . . . . . . . . . . . . . . . . . . . . . . . . . . . . . . 51
5 Decharging 535.1 Previous Experiments . . . . . . . . . . . . . . . . . . . . . . . . . . . . . . 535.2 Experimental Setup . . . . . . . . . . . . . . . . . . . . . . . . . . . . . . . 545.3 Experimental Procedure . . . . . . . . . . . . . . . . . . . . . . . . . . . . 555.4 Analysis . . . . . . . . . . . . . . . . . . . . . . . . . . . . . . . . . . . . . 555.5 Results . . . . . . . . . . . . . . . . . . . . . . . . . . . . . . . . . . . . . . 595.6 Possible further Experiments . . . . . . . . . . . . . . . . . . . . . . . . . . 615.7 Summary . . . . . . . . . . . . . . . . . . . . . . . . . . . . . . . . . . . . 625.8 Resume . . . . . . . . . . . . . . . . . . . . . . . . . . . . . . . . . . . . . 625.9 Zusammenfassung . . . . . . . . . . . . . . . . . . . . . . . . . . . . . . . . 62
6 Confined Particle Clusters 63
7 Cluster Rotation 697.1 Experimental Setup . . . . . . . . . . . . . . . . . . . . . . . . . . . . . . . 697.2 Observation . . . . . . . . . . . . . . . . . . . . . . . . . . . . . . . . . . . 707.3 Analysis . . . . . . . . . . . . . . . . . . . . . . . . . . . . . . . . . . . . . 71

CONTENTS xiii
7.4 Results . . . . . . . . . . . . . . . . . . . . . . . . . . . . . . . . . . . . . . 737.4.1 Frequency Dependence . . . . . . . . . . . . . . . . . . . . . . . . . 737.4.2 Driving Mechanisms . . . . . . . . . . . . . . . . . . . . . . . . . . 747.4.3 Height Dependence . . . . . . . . . . . . . . . . . . . . . . . . . . . 767.4.4 Vertical Resonance Frequency . . . . . . . . . . . . . . . . . . . . . 767.4.5 Suspending a Single Particle . . . . . . . . . . . . . . . . . . . . . . 77
7.5 Possible further Experiments . . . . . . . . . . . . . . . . . . . . . . . . . . 787.6 Summary . . . . . . . . . . . . . . . . . . . . . . . . . . . . . . . . . . . . 787.7 Resume . . . . . . . . . . . . . . . . . . . . . . . . . . . . . . . . . . . . . 787.8 Zusammenfassung . . . . . . . . . . . . . . . . . . . . . . . . . . . . . . . . 78
8 Competing Cluster Symmetries 818.1 Experimental Setup . . . . . . . . . . . . . . . . . . . . . . . . . . . . . . . 818.2 Parameters . . . . . . . . . . . . . . . . . . . . . . . . . . . . . . . . . . . 838.3 Rotation . . . . . . . . . . . . . . . . . . . . . . . . . . . . . . . . . . . . . 848.4 String Analysis . . . . . . . . . . . . . . . . . . . . . . . . . . . . . . . . . 87
8.4.1 Spatial Correlation . . . . . . . . . . . . . . . . . . . . . . . . . . . 878.4.2 Temporal Correlations . . . . . . . . . . . . . . . . . . . . . . . . . 88
8.5 Description of Strings . . . . . . . . . . . . . . . . . . . . . . . . . . . . . . 908.5.1 String Identification . . . . . . . . . . . . . . . . . . . . . . . . . . 908.5.2 String Lifetimes . . . . . . . . . . . . . . . . . . . . . . . . . . . . . 938.5.3 Individual String Geometry . . . . . . . . . . . . . . . . . . . . . . 93
8.6 Global Cluster Symmetry . . . . . . . . . . . . . . . . . . . . . . . . . . . 998.7 Possible further Experiments . . . . . . . . . . . . . . . . . . . . . . . . . . 1008.8 Summary . . . . . . . . . . . . . . . . . . . . . . . . . . . . . . . . . . . . 1008.9 Resume . . . . . . . . . . . . . . . . . . . . . . . . . . . . . . . . . . . . . 1018.10 Zusammenfassung . . . . . . . . . . . . . . . . . . . . . . . . . . . . . . . . 101
Summary 103
Resume 105
Zusammenfassung 107
A Synchronization 109A.1 Motivation . . . . . . . . . . . . . . . . . . . . . . . . . . . . . . . . . . . . 109A.2 Without Function Generators . . . . . . . . . . . . . . . . . . . . . . . . . 109A.3 With Function Generators . . . . . . . . . . . . . . . . . . . . . . . . . . . 110A.4 Pictures . . . . . . . . . . . . . . . . . . . . . . . . . . . . . . . . . . . . . 110A.5 Calculations . . . . . . . . . . . . . . . . . . . . . . . . . . . . . . . . . . . 112
A.5.1 General . . . . . . . . . . . . . . . . . . . . . . . . . . . . . . . . . 112A.5.2 Without function Generators . . . . . . . . . . . . . . . . . . . . . 113A.5.3 With function Generators . . . . . . . . . . . . . . . . . . . . . . . 114

xiv Inhaltsverzeichnis
List of Figures 118
Bibliography 130
Acknowledgements 131

Abstract
Plasmas are next to the solid, liquid and gaseous phase the fourth state of matter. It isestablished by ionizing a gas. About 99% of the visible matter in the universe is in thestate of plasma. The industrial, medical and scientific benefits of plasmas led to a variety ofartificially produced plasmas. In plasmas dust particles can grow. Especially in industrialplasmas particle formation in the plasma gas phase is very common. The fundamentalunderstanding of the growth is of vital importance in order to suppress undesired particleformation or to deposit particles and films in a certain region.
In terms of this thesis the particle growth in a direct current (DC) discharge by usingacetylene will be discussed. It has been observed that the particle growth depends on theneutral gas flow fed into the plasma chamber. Depending on the applied flow differentgrowth frequencies and transport phenomena are shown. The observations recorded by aspectrometer will then be complimented by pictures from the particles taken by a scanningelectron microscope.
Introducing artificial particles into a plasma rather than growing them there yieldsseveral advantages. The particle sizes can be controlled, including the possibility of particlemixtures. Furthermore, particles with bigger diameter can be introduced than what canbe grown on reasonable time scales in a plasma.
Several possible experiments with injected particles underline the interdisciplinary char-acter of the plasma environment. To understand the inter particle interactions the particlecharge is a crucial parameter.
In this thesis several experiments determining the particle charge will be discussed. Inthis frame the experiments on board of the International Space Station have been performedto measure the residual charge in the particle afterglow.
In the last section experiments on particle cluster rotation as observed in an additionalconfinement will be discussed. It will be shown that the particles tend to form verticalstrings due to the wake field that forms downstream of each particle. Finally the insightgained on the possibilities of tuning of the interaction potential by electric fields will bediscussed. The results are then compared to the predictions of earlier simulations.

xvi Abstract

Resume
A cote des solides, des liquides et des gaz, le plasma est le quatrieme etat de la matiere.Il est genere en ionisant un gaz. Dans l’univers, 99% de la matiere est l’etat de plasma.L’emergence de plusieurs types de plasmas artificiels est due aux multiples et differentesapplications, tres interessantes les unes que les autres, des plasmas dans des secteurs aussivaries que l’industrie, l’energie, le biomedical et la science. Tres souvent, des particulessolides peuvent se former dans les plasmas. Ceci a tout particulierement ete observe dansceux utilises dans l’industrie. La comprehension des mecanismes de leur nucleation etcroissance est d’une importance capitale en vue de trouver des solutions pour inhiber leurformation ou d’eviter qu’elles ne se deposent sur les surfaces en cours de traitement.
L’objectif du travail de recherche entrant dans le cadre de cette these est l’etude dela formation de particules dans un plasma genere par decharge electrique continue. Il aete observe que ce phenomene depend du flux de gaz neutre injecte dans l’enceinte dureacteur. J’ai mis en evidence que la frequence de formation est liee a ce parametre.Les observations enregistrees a l’aide d’un spectroscope sont completees et correlees auxphotographies obtenues par microscopie electronique a balayage.
L’injection de particules dans le plasma plutot que de proceder a les faire croitre presentecertains avantages. On peut controler leur taille y compris de la cas de melanges departicules. On tout particulierement injecter des particules ayant des tailles beaucoup plusimportantes que celles que l’on forme sur des gammes de durees raisonnables des plasmasutilises.
Plusieurs experiences realisees avec des particules injectees ont mis en exergue le car-actere pluridisciplinaire du milieu plasma. Afin de comprendre les interactions mutuellesentre particules il est crucial de determiner la charge portee par les particules.
Plusieurs experiences realisees au cours de cette these et presentees ici ont porte sur ladetermination de ce parametre fondamental. Dans ce cadre une serie d’experience a eterealisee a bore de la Station Spatiale Internationale (ISS) dans le but de determiner lacharge residuelle des particules dans la phase de post-decharge.
Dans la derniere partie, seront presentees et discutees des experiences portant surl’observation de la rotation de clusters de particules soumis a un confinement supplementaire.On montre que les particules tendent a former des alignements verticaux dus au faiblechamp qui se forme en aval de chaque particule. Enfin, les connaissances acquises sur lespossibilites de moduler le potentiel d’interaction par l’intermediaire d’un champ electriqueseront discutees. Les resultats sont compares aux predictions des simulations.

xviii Resume

Kurzbeschreibung
Neben fester, flussiger und gasformiger Phase sind Plasmen der vierte Aggregatzustandder Materie. Ionisierte Gase machen etwa 99% der sichtbaren Materie im Universum aus.Neben den naturlich vorkommenden Plasmen fuhrte der industrielle, wissenschaftliche undmedizinische Nutzen zu einer Vielzahl von kunstlich erzeugten Plasmen. Teilchenwachstumist ein haufiges Phanoman in Plasmen. Besonders in der Gasphase industrieller Plasmen istes weit verbreitet. Das grundlegende Verstandnis des Wachstums ist von unmittelbarer Be-deutung fur die Vermeidung der Bildung unerwunschter Partikel sowie fur die Deponierungvon Teilchen und Filmen in erwunschten Bereichen.
Im Zuge dieser Arbeit wird das Wachstum von Partikeln in einer Gleichstrom (DC) Ent-ladung unter Verwendung von Acetylen beschrieben. Die Abhangigkeit des Wachstums vondem Neutralgasfluß, die erreichten Teilchengrossen und die, aus dem repetetiven Charak-ter des Wachstumsprozesses resultierende, Wachstumsfrequenz werden gezeigt. Des Weit-eren werden Veranderungen des Plasmas und der Teilchentransport entlang der Kammerbeschrieben. Die von einem Spektrometer aufgenommenen Daten werden durch Rasterelek-tronenmikroskopbilder der Teilchen erganzt.
Neben der Teilchenformation konnen Teilchen injiziert werden. So kann die Teilchen-grosse von vorneherein festgelegt werden und auch Mischungen aus Teilchen verschiedenerGrossen sind moglich. Zusatzlich konnen Experimente mit Teilchen grosseren Durchmessersdurchgefuhrt werden.
Die zahlreichen moglichen Experimente mit injizierten Teilchen betonen den interdiszi-plinaren Charakter komplexer Plasmen. Die Ladung der Teilchen dominiert ihre Wechsel-wirkung und ist daher ein entscheidender Faktor.
In dieser Arbeit werden verschiedene Experimente zur Bestimmung der Teilchenladungvorgestellt. In diesem Zusammenhang wurden Experimente an Bord der InternationalenRaumstation durchgefuhrt. Die Restladung der Teilchen nach Erloschen des Plasmas wirdbestimmt. Verschiedene Situation mit und ohne zusatzlichem elektrischen Feld wurdenuntersucht. Ohne zusatzliches Feld verteilen sich die Ladungen um null, mit Feld zeigt sichein Trend zu positiver Teilchenladung.
Im letzten Abschnitt werden Experimente zur Clusterrotation besprochen. Auftretendevertikale Teilchenketten und Experimente mit einzelnen Teilchen vervollstandigen das Bild.Anhand der gewonnenen Daten wird abschließend eine Aussage uber die moglichen Veran-derung des Teilchenwechselwirkungspotentials anhand eines Vergleichs mit fruheren Sim-ulationen gemacht.

xx Kurzbeschreibung

Outline
The main objective of this thesis is the tuning of the particle interaction potential incomplex / dusty plasmas.
To understand the particle behavior, first an introduction on the basic plasma princi-ples, chapter 1, will be given. Afterwards the behavior of particles levitated in a plasmawill be discussed, chapter 2. This includes charging and particle interactions.
This is followed by a description of particle formation in plasmas in general, chapter 3.The results of the experiments on particle formation in a DC discharge are then discussedin chapter 4.
Since the particle charge is one of the most fundamental parameters in complex/dustyplasmas a way to determine the charge in the plasma afterglow will be described in chap-ter 5.
In chapter 6 earlier experiments on the tuning of the interaction potential are discussed.The final two chapters 7 and 8 are then dedicated to experiments on the interaction
potential. Furthermore, interesting side effects will be discussed.
I have to refer to my own publications throughout the description of my experiments.My publications are designated different numbers to distinguish them easily from the restof the references.
• [MY1]: Effect of Rotating Electric Field on 3D Complex (Dusty) Plasma
• [MY2]: The Formation and Transport Phenomena of nanometer-sized Particles in aDC Plasma
• [MY3]: String Formation in Response to Rotating Electric Fields

xxii Outline

Chapter 1
Plasmas
1.1 States of Matter
Molecules and atoms tend to organize themselves according to their properties and thesurrounding conditions, e.g. pressure, temperature, and volume. The three basic states inwhich matter occurs are solid, liquid and gas.
Phase transitions can be displayed using a phase diagram. Phase diagrams describethe state of a given material depending on two thermodynamical parameters, e.g. pressureand temperature [136]. Transitions from one to another state occur along certain lines inthese diagrams. In case of a phase transition the temperature and the pressure will stayconstant until the system has been changed completely. The only difference is the criticalpoint beyond which the system passes into a supercritical fluid where gaseous and liquidphase are no longer distinguished. This has for instance been reported by C. Eckert et al.,[59].
Ionizing a gas leads to a fourth state: the plasma. Even in an only weakly ionized gasthe charged species dominate the behavior of the system. In difference to the other threestates the border between a system being a plasma or a gas is not sharp since the gas willundergo a slow transition while being (partly) ionized.
Plasmas differ from gases in some major respects. Since the gas molecules are ionizedmore than one active species occur in the plasma. Collisions and external forces leadto a non-Maxwellian ion and electron velocity distribution inside the plasma. Collectivephenomena in response to electromagnetic fields are characteristic for plasmas.
Plasmas are a very common state of matter. Actually about 99% of the visible1 matterin the universe is in the state of plasma. Plasmas occur in astrophysical environments aswell as on earth. In addition artificial plasmas are employed for instance in industrial,medical, and scientific applications.
Typical astrophysical plasmas are stars [56, 172], comet tails, supernova explosions [14],planetary spokes [74, 157], and interstellar nebulae [81]. Dust has been found responsible
1In this thesis the visible range means any wavelength in the regime visible to the human eye, i.e.450nm - 700nm)

2 1. Plasmas
for comet and planetesimal formation in nebulae [215]. The simulations by Supulver et al.[202] demonstrate the condensation of sub micrometer sized particles from present gas andtheir coagulation in nebulae, forming planetesimal. In their paper the necessity of chargedspecies during this process is emphasized. In earths environment flames, polar auroras,and lightning [175] are naturally occurring plasmas. Artificially produced plasmas includefluorescent lights, industrial processing [19], spacecraft propulsion [126], plasma torches,particle sources [11] particle beam collisions [84], and acceleration [23]. In addition to theindustrial and every day life applications, plasmas have shown to be useful in health care[193]. This includes sterilization, skin treatment, wound healing, cancer treatment anddental care.
1.2 Temperatures
In systems being in thermal equilibrium the temperature describes the particles kineticenergy. Even though many plasmas are not in thermal equilibrium, and therefore thevelocity distributions are far from being Maxwellian, a temperature for electrons and ionscan be approximated. Depending on the relation between the temperatures of the electrons,ions and the remaining neutral gas atoms2 plasmas can be classified.
If electron and ion temperatures do not differ much the plasma is called thermal. Theopposite situation is called a non-thermal plasma. There the ion temperature is almostat the level of the neutral temperature whereas the electron temperature is much higher.In most cases the ion temperature in non-thermal plasmas is therefore the same as thesurrounding room temperature.
The degree of ionization is linked to the ion and electron temperature as well as to theelectron density. If the electron kinetic energy is too low the ions and electrons recombineand the plasma turns into gas.
1.3 Low temperature Plasmas
1.3.1 General
It is possible to produce thermodynamically open low temperature plasmas. In this casethe ions are almost in thermal equilibrium with the neutral gas atoms and thus leading toa situation in which the plasma is operated at room temperature. However, the electronkinetic energy is much higher than the ion kinetic energy.
Collisions of ions with neutrals are dominating the ion-ion and ion-electron collisionsleading to a temperature of the plasma of the order of that of the neutral gas. To achievean environment like this a gas at up to atmospheric pressures is exposed to electric powers
2As it has been previously stated plasmas are (partly) ionized gases and include still some neutral gasatoms. These may however be in an excited state. These neutrals are in thermal equilibrium and theirtemperature can be estimated assuming a Maxwellian velocity distribution.

1.3 Low temperature Plasmas 3
of several Watts. The simplest way to ionize a gas is to apply a direct current. This type ofdischarge is hence also called DC discharge or DC plasma. If the applied voltage is alter-nated with a frequency in the order of several MHz it is called RF (radio frequency driven)plasma. Due to availability of industrial and therefore cheaper generators, RF plasmas areusually ignited at frequencies of 13.56 MHz and 81.6 MHz. There are different types of RFplasmas depending on the way of ionization. In capacitively coupled discharges the plasmais ignited in between two electrodes. If both electrodes are powered the discharge canbe operated in push-push or push-pull mode depending on the phase shift of the appliedvoltages. Different from this works the inductively coupled discharge. This discharge isignited using a coil and the induction of magnetic and electric fields.
In most of the laboratory environments plasmas are based on noble gases as Neon, Kryp-ton, and Argon. In addition reactive gases, such as Acetylene or Methane can be injectedinto the plasma changing its properties. Some applications have shown that electronega-tive plasmas have advantages with respect to the ones based on noble gases. Especially forsputtering and etching plasmas based on Oxygen are of advantage [42].
1.3.2 Ionization
By delivering energy to a gas its molecules can be excited. The excitation of a givenmolecule is determined by the electron energy levels. The levels are defined by the inhabitedorbitals. An orbital describes the probability of electron appearance in the vicinity of theatoms nuclei. They are characterized by quantum numbers corresponding to the electronsenergy and angular momentum. According to the angular momentum the orbitals arenamed s, p, d, and f orbital. They differ in shape and population [179].
An excited atom will regain its ground state by releasing energy in form of photonicemission. Since the energy levels are discrete a certain atom or molecule will emit photonsof discrete energy and thereby wavelength. This can be used to determine the compoundsof a given material as well as for calibrating optical tools. In case of argon the mostimportant transitions lead to emissions at 751 nm and 811 nm [152].
If the energy delivered to a molecule is high enough electrons can be removed completely.In addition positive ions and neutrals can pick up electrons. However, in most cases thevolume recombination is negligible compared to the loss of charged species on the confiningwalls. Thus ionization and recombination are present at all times and the plasma is onlysustained by constantly applying an electric field of sufficient intensity.
The degree of ionization α is described by the number density of neutral gas atoms (nn)and ions (ni). The formula is given as:
α =ni
ni + nn
(1.1)
If α � 1 the plasma is considered to be weakly ionized [68, 190]. Throughout the experi-ments described in this thesis the ionization degree α ≈ 10−5 − 10−7.
Since there are equal numbers of positive and negative charges in the plasma it is ina state of quasi-neutrality. This can be mathematically simplified by setting the number

4 1. Plasmas
density of free electrons ne equal to the number density of ions times the average ionization.Using the Boltzmann equation and the plasma potential the number densities can also
be written as [68, 159]:
ne = ne0 · exp(−eΦ
kBTe)
ni = ni0 · exp(−eΦ
kBTi)
(1.2)
In this equation ne0,i0 are the initial electron and ion densities. Due to thermal lossesthese are reduced depending on the plasma potential, and the electron respectively iontemperatures Te,i.
1.3.3 Potentials
Plasmas being determined by electro-magnetic fields are best described by the Maxwellequations [200].
~∇ · ~E =ρ
ε0~∇ · ~B = 0
~∇× ~E = −∂~B
∂t
~∇× ~E = µ0~j + µ0ε0
∂ ~E
∂t
(1.3)
In these equations ρ and ~j are the charge and current densities.In plasmas the time variation of the magnetic field can usually be neglected [66]. Hence
the electric field can be derived from a scalar potential Φ
E = −∇Φ (1.4)
leading to the Poisson equation.
∆Φ =ρ
ε0(1.5)
The solution to this equation is in linear approximation the so-called Debye-Huckel (Yukawa)potential [159].
Φ(r) =q
4πε0rexp(− r
λD) (1.6)
With
λD = (λ−2De + λ−2
Di)− 1
2 (1.7)
being the total Debye length. The individual Debye lengths for ions and electrons respec-tively are given by
λDi,e =
√ε0kBTi,eni,ee2
(1.8)

1.3 Low temperature Plasmas 5
The total Debye length describes the distance in which the measured charge of a particle isdeclined to 1
eof the original value [159]. Hence it is a measure of the screening of a particle.
Therefore the Debye length is also called Debye screening length or screening length. Thescreening length is the typical length along which particles see the strong electric field ofanother particle. Since plasmas are quasi-neutral the individual particle charge is of highimportance. The interaction is described by the plasma condition [68]
Ne =4π
3λ3Dne � 1, (1.9)
giving the total number of electrons inside the Debye radius around a certain particle.In addition collective phenomena can be observed. A typical phenomenon are charge
density oscillations traveling at a characteristic frequency, the so-called plasma frequency
ωp i,e =
√e2ni,e
ε0mi,e
. (1.10)
If any field with a frequency above the ion (electron) plasma frequency is applied, the ions(electrons) can not follow the excitation any more. As the plasma frequency is proportionalto the square root of the inverse particle mass, the ion plasma frequency is much lower thanthe electron plasma frequency. Since this thesis has been dedicated on the manipulationof the ions in the plasma the plasma frequency will be of high importance.
1.3.4 Regions
General
Containing equal numbers of positively and negatively charged particles parts of plasmasare quasi-neutral. The volume in which the quasi-neutrality is preserved is called bulkplasma [128]. The combination of quasi-neutrality and free charge carriers leads to asituation of almost infinite electric conductivity of the bulk plasma.
However, every laboratory plasma interacts with the surrounding confinement. Closeto the walls a positive space charge builds up introducing a potential barrier confining theelectrons inside the plasma. This results in strong electric fields. The volume in whichthese fields are present and the quasi-neutrality is violated is called sheath [128]. In thesheath basically no electrons are present. Thus electron impact ionization, dissociation,and excitation take place only in the bulk plasma. The bulk can thus be distinguishedfrom the sheath due to the increased glow level.
The electrons are responsible for impact dissociation and ionization. These two pro-cesses lead to the increased plasma glow in the vicinity of higher electron density. Electronsare mainly present in the bulk, see e.g. figure 1.3. Thus, the sheath edge can be distin-guished from the bulk plasma by the increased luminosity.
In order to fulfill energy conservation, ion continuity, and to preserve the quasi-neutralityin the bulk plasma D. Bohm [24] showed that ions have to enter the sheath with velocities

6 1. Plasmas
higher than the Bohm velocity
v ≥ uB =
√kBTemi
. (1.11)
To fulfill Bohms criteria the electric field of the sheath has to penetrate into the bulkplasma forming a pre-sheath.
Due to the electric field in the sheath the ion stream velocity is very high. Thus,their contribution to the absolute screening is reduced. The Debye length in the sheathis therefore dominated by the electron Debye length. In the bulk the opposite behaviorappears. The electron temperature in the bulk is much higher than the one of the ions.Hence the electron contribution to the Debye length can be neglected and the screening isdetermined by ions [128, 174].
DC Discharges
In direct current (DC) plasmas the axial plasma is not uniform. If a DC plasma is producedinside a long cylinder eight regions occur along the tube: anode dark space, anode glow,positive column, Faraday dark space, negative glow, Crookes dark space, cathode glow,and Aston dark space. The regions are shown in a sketch in figure 1.1 as reproduced from[128].
The strongest voltage drop occurs along the Crookes dark space3. In this dark spaceeven the high energetic electrons are repelled and can not reach the cathode. The dischargeis maintained by the production of secondary electrons by ions emerging from the cathode.Due to the current induced by the ionization the electron density and flux grow along thedark space. This exponential growth leads to the initial breakdown starting the discharge.The occurring hysteresis shown in figure 1.2 are due to the initial breakdown conditions ofthe discharge.
The increasing density of fast electrons leads to a bright region close to the cathode, thenegative glow. In this region ionization and excitation of the gas is enhanced. In order tofulfill the conditions as present in the following positive column the fast electrons have tobe dissipated and the electric field has to drop. Thus the electrons first loose their energydue to collisions and are then re-accelerated in the weak field. The acceleration lengthis approximately their mean free path. The resulting dark region is called Faraday darkspace.
The conditions in the positive column are quite similar to the conditions in the ones inthe bulk plasma. The electric field balances the energy loss due to ionization and excitation.The axial uniform plasma is sustained by a weak electric field.
Since the electron drift velocity in the weak electric field of the positive column issmaller than the thermal electron velocity an electric field is needed to prevent the thermalelectrons from hitting the anode. This region is called anode fall. It has a double layerstructure since the anode has to be positive with respect to the positive column in orderto sustain the current.
3The Crookes dark space is also called cathode fall or cathode sheath.

1.3 Low temperature Plasmas 7
Figure 1.1: The different regions (a) in a DC glow discharge and the distribution of the fieldsand space charges(b), [128].
The remaining regions do not determine the behavior of the discharge and will not bediscussed here. Any interested reader might read the according sections in Refs. [128, 174]from which also the information on the described regions has been taken.
In addition the characteristics of the discharge as a whole depend on the applied current.The established voltage depends on the pressure. A typical distribution for a pressure of1 Torr (≈ 133 Pa) is shown in figure 1.2. At low currents the glow discharge slowly buildsup. Beneath IA the discharge is called Townsend or dark discharge. At intermediatecurrents (IA < I < IB), where the slope of the distribution is negative, the normal glowestablishes. This is the region in which most of the low temperature experiments areperformed. It is followed by the abnormal glow (IB < I < IC) before the voltage dropssuddenly and the plasma is called arc discharge.
DC discharges however are not always as uniform as discussed above. In the positivecolumn regions of higher and lower emission intensity can occur. The brighter regionsare called striations [100, 130, 216]. The striations form if electrons loose energy dueto collisions with neutrals leading to regions of increased electron density. The increasein the electron intensity leads to higher electric fields and thereby a (re-)acceleration ofelectrons. The number and elongation of the striations depends on the applied current.The higher the current the more striations occur. The formation of striations is enhancedby lower energy loss in the collisions followed by an earlier establishing of the necessaryexcitation energy. Due to the distribution of the initial electron energy the dark and bright

8 1. Plasmas
Figure 1.2: The graph demonstrates the U-I characteristics of a DC discharge, [128].
regions of the striations are sharply divided. The typical triangle or round shape of thestriations is caused by a focusing effect. That the striations reach out to the walls is dueto radial electron diffusion. The electrons far from the center experience weaker fields andneed longer distances before having reached the energy necessary for excitation. Thus, thedistances between the striations off-center are wider. Often moving or instable striationsare observed, leading to a smearing of the glow.
RF Discharges
A plasma can also be induced by applying an alternating current to a gas-filled volume.The usual alternation frequencies are 13.56 and 81.6 MHz. Hence these plasmas are calledradio frequency driven plasmas or RF plasmas. If the current is applied to one or twoplanar electrodes the discharge is called capacitively coupled. The choice of exact excitationfrequencies is due to availability of industrial generators. In principle any RF current canbe employed to induce a plasma with similar properties.
To excite and ionize gas atoms or molecules energy has to be delivered to them. Incase of capacitively coupled RF discharges this is mainly due to two processes: ohmicand stochastic heating [128]. In a rather simple model in the bulk plasma the energy istransfered by electron-neutral collisions. This is called ohmic heating. In contrast to thisthe momentum transfer in the sheath is mainly due to the alternating high electric field.The process is therefore called stochastic heating [162].
Due to their higher mobility electrons react to the alternating electric field. In contrastto this ions can only react to time integrated potentials. Thus the electron density can beconsidered to be constant in the bulk plasma and zero in the sheath. This assumption isonly true if the electron temperature is much lower than the potential across the sheathresulting in an electron Debye length much shorter than the time averaged sheath width.The ion density is almost constant over the whole volume. Furthermore the electric fieldsamong the electrodes can be assumed constant neglecting phenomena such as the skineffect [128].

1.3 Low temperature Plasmas 9
Figure 1.3: Sketch of a radio frequency driven plasma(a). Plot (b) displays the distribution ofthe electron and ion density along the plasma and the sheath, [128]. Next to it a more realisticdistribution of the electron and ion densities in the sheath is given. This figure is reproducedfrom [127]. Furthermore, the development of the applied RF voltage Vp, the resulting plasmapotential Vp, the corresponding time average Vp, and the self bias Vdc is shown,[71].
A sketch of the situation in a RF discharge is shown in figure 1.3(a). The sheaththat forms next to the powered electrode (left hand side) is usually bigger than the onethat forms next to the grounded plate (right hand side). In between the two sheaths thequasi-neutral bulk plasma forms. Since the electron mobility is high enough to follow theelectric fields the electrons will stay in the central region of the plasma whereas the slowerions penetrate into the sheath region. An ideal representation of this is shown in figure1.3(b), [128]. A more realistic picture of the ion and electron density as well as the spaceaveraged electron density in the sheath is shown in figure 1.3(c), [127]. Several simulationsof the electrons passing through the volume between two electrodes including their density,temperature, and impact on the carrier gas have been conducted, [71, 212].
The strong potential difference between the electrode and the plasma results in a biasvoltage which can be measured on the electrode. The bias voltage depends on the plasmaparameters. Thus, further information on the plasma state and change can be gained bymeasuring it over time [125]. The development of the RF voltage Vrf and the plasmapotential Vp are displayed in figure 1.3(d), [71]. Furthermore, it shows the time averagedplasma potential Vp and the constant self bias Vdc.
A radio frequency power cannot be applied without losses to the electrodes. Thusa matching network consisting of tunable capacitors and inductors is attached to the RFgenerator. With this matching network the power reflected and introduced into the plasmacan be tuned. Furthermore, the attached generator can be protected from possible high

10 1. Plasmas
Figure 1.4: Sketch of the electrical network of a radio frequency driven plasma with the matchingnetwork (a), [214]. Panel (b) shows a more general electrical description of the plasma itself. Inthis the sheaths are equal to an array of a capacitor and a resistor whereas the bulk is representedby a resistor alone, [71].
currents. A scheme of the matching network as attached between a RF generator and adischarge chamber is displayed in figure 1.4(a), [214].
Electrically the plasma can be described as the neutral bulk plasma of almost infiniteconductivity and two capacitors representing the sheaths. This is represented by the sketchin figure 1.4(a). Even if the electric plasma description displayed there might be correctfor this special case, the description of the plasma (sheath and bulk) given in (b) is moregeneral and accurate. The figures are reproduced from [214](a) and [71](b).
Another way of igniting a plasma is by using a coil wrapped around a gas filled volume.If a RF current is applied to the coil a magnetic field is induced. The magnetic field isthen responsible for the ionization and acceleration of ions. Since this method induceselectromagnetic fields a chamber operated in this way is called inductively coupled.
1.4 Plasma Chemistry
Depending on the neutral gas mixture and the plasma parameters a lot of different chemicalreactions occur in plasmas. Some of these processes are endothermic, others exothermic.The energy delivered by the plasma enables all of these processes. Thus depending on theapplied power the probability of a process and thereby the concentration of certain speciescan be influenced. It is important to note that some reactions are reversible while otherscannot be undone. This is of special significance if a desired species shall be produced.
Two reactions have to be distinguished: those in the gas phase and those including thesurfaces. In both cases dissociation, ionization, and attachment lead to new molecules.This is especially true if the plasma is not run by using a pure noble gas but in air orin a composition including portions of other gases such as acetylene or methane. Etchingrate, occurring anisotropies, and composition depend on the concentration and energydistribution amongst the species in the plasma.
In the gas phase the main reactions are initialized by electron excitation, ionization,

1.4 Plasma Chemistry 11
and dissociation:
e− + AB → AB+ + 2e− ion-electron pair production (1.12)
e− + AB → A+B+ + 2e− dissociative ionization (1.13)
e− + AB → A∗ +B∗ + e− radical production (1.14)
e− + AB → A− +B negative ion production (1.15)
Due to vibrational and rotational modes auto dissociation
AB+ → A+B+ or A+ +B, (1.16)
auto ionizationAB → AB+ + e− and (1.17)
auto detachment after endothermic negative ion production
A− → A+ e− (1.18)
can occur. In case the ion production is exothermic the electron is not probable to detachfrom the ion again. Electrons can also be removed from negative ions by dissociation. Thecollision with another electron or any other particle can lead to detaching the electron fromthe negative ion leaving a neutral atom or a radical.
In addition, to the processes involving electrons chemical reactions in the gas phase arecommon:
A+B ⇀↽ C +D (1.19)
These do not necessarily take place until the total amount of initial molecules (here: Aand B) is transformed. According to the chemical energies necessary to produce eithercombination a chemical equilibrium will be reached in which usually all four componentsare present in the plasma.
Reactions including atoms from the surrounding surfaces are exclusively exothermic.Only if energy is delivered to the surface atoms can be released (etching / sputtering). Thereversed reaction (deposition) may be endothermic, too.
A(gas) + S(surface) ⇀↽ A : S(gas). (1.20)
Several consecutive reactions might be necessary for some of the very general reactionsintroduced above. In some cases even catalysts may be necessary. Similarly the presenceof certain molecules or atoms may inhibit otherwise common reactions.
All of the chemical reactions given above are taken from Lieberman et al. [128]. In thisbook a more complete list of chemical reactions in the gas phase and on the surface includingthe thermodynamic properties and bond dissociation energies is given. According to thetables given there the probabilities of the occurrence of certain species can be calculateddepending on the initial gas composition and supplied power.

12 1. Plasmas
1.5 Probing Plasmas
Gaining informations on what is going on in a plasma is very important with respect tocontrolling and reproducing certain conditions. In this section several probing methodswill be introduced and discussed. The most preferable ones are the non-intrusive ones, butas it will be shown the information gained by these are not sufficient for complete plasmacharacterization.
As mentioned above the electron temperature and density strongly influence the plasmaemission. Hence optical measurements are performed investigating the intensity and energylevels of the emission. This method does not deliver absolute values but provides compara-tive measurements. Here the change in electron temperature and density can be monitoredinstantly and without changing the plasma properties. In addition the composition can beestimated by monitoring the specific atomic excitation lines. As described in the sectionabove the gas composition might strongly be affected over time. Thus, the surveillance byoptical means provides a very effective way of controlling the ongoing chemical reactions.This can be supported by measurements with mass spectrometers both, before and behindthe plasma volume.
Furthermore, light transmission and absorption spectra can be recorded. These aregained by mounting a laser of a specific wavelength and recording the transmitted andabsorbed spectra. The changes in energy (i.e. frequency) and intensity carry informationson the plasma parameters.
Other, non-intrusive methods are external electric measurements. The applied voltageand the reflected portion can be monitored by means of oscilloscopes. In case of RF plasmasthe self bias can be of interest, too. This is the continuous voltage formed at the poweredelectrode due to the presence of the plasma, see figure 1.3.
Getting absolute, but admittedly very rough, values for the plasma parameters (e.g.plasma potential, ion and electron density and temperature) intrusive probes have to beemployed.
One of the easiest ways is to introduce artificial particles of known size and mass andmonitor their behavior in the plasma [15, 135, 186]. In order to make optical observationof such particles levitated in a plasma as easy as possible the most common choice areplastic (usually Melamineformaldehyde) particles with radii of several micrometer. Theirproperties and other possible particle choices will be discussed in section 2.
Particles introduced into a plasma charge up. Being levitated in the sheath where theelectric field balanced gravitation the thickness of the sheath can be probed by introducingparticles with different radii and mass. Note, that the particle charge might substantiallyvary with sheath penetration depth. Next to the sheath thickness the dust plasma fre-quency, possible confinements, and electric fields can be probed by introduced particles.Please note, that an exact knowledge of the particle properties (size, mass, charge) are ofcrucial importance for any of these experiments. As it will be discussed in the followingchapter the particles are not completely mono disperse and inherit thus a distribution insize and mass. Also, since they are subjected to a highly reactive environment, see sub-section 1.4, their mass and radius might shrink or increase over time. Possibilities and
1.5 Probing Plasmas 13
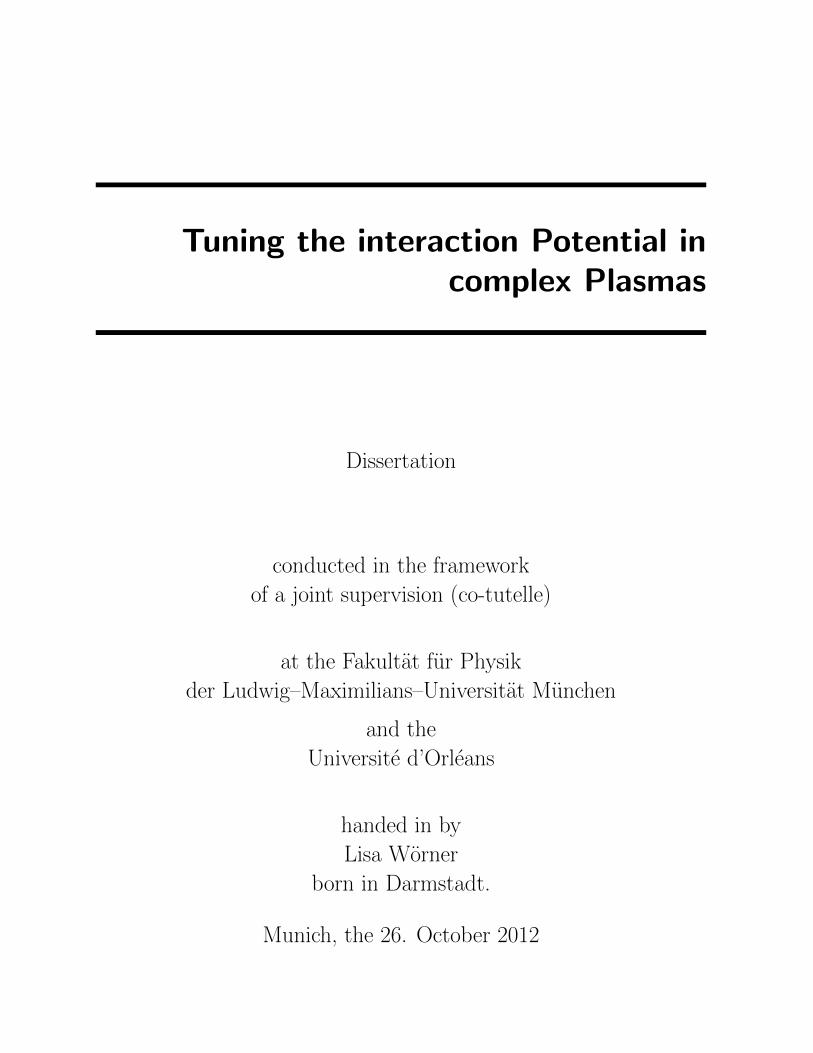
Figure 1.5: An ideal I-U characteristic for a low temperature plasma. (a) displays the totalelectron current towards the probe. The red dots indicate a rounding of the saturation currentdue to noise. Panels (b) and (c) show extended regions of special interest of this curve. From theplot shown in (b) the plasma potential and the ion saturation current can be deduced. From (c)the ion saturation current can be extrapolated. The figure is taken from [143]
limitations of calculating the particle charge will be discussed at length in the followingsections. Further descriptions of the particles in question as well as their production,interactions, and applications in experimental studies will be discussed there, too.
Another intrusive measurement is the usage of so-called Langmuir probes [161]. Inprinciple a Langmuir probe consists of a small wire to which a voltage is applied and thecorresponding current is measured.
If the probe is introduced it is exposed to ion and electron fluxes. The theory describingthe fluxes towards and the formation of a sheath around the probe are quite similar to theone for the charging of introduced particles (see section 2.2), [27, 43, 161]. But since theLangmuir probe is biased electrons and ions can be attracted or repelled depending on theapplied voltage [143]. The resulting I-U characteristic is shown in figure 1.5.
In figure 1.5(a) the total electron current towards the probe is displayed. If the biasvoltage on the probe is negative electrons are repelled. Thus the resulting current isnegative. In figure 1.5(c) displays exactly this region. From the distribution there the ionsaturation current can be gained.
As the bias voltage increases so does the electron current until a situation of electronsaturation is reached. This is shown in the extended section displayed in figure 1.5(b).In experimental conditions the knee at which the current is saturated is smeared out,indicated in figure 1.5(a) by the dashed red line. The voltage corresponding to the electronsaturation current is the plasma potential VP .
From the saturation currents the ion and electron density can be obtained by
Ii,e =1
4eni,evT i,eAprobe. (1.21)
The slope of the curve leads to the electron temperature using
Te =V2 − V1ln(
I2I1
) , (1.22)

14 1. Plasmas
where V1,2 are two voltages with 0 < V1 < V2 < Vp and the corresponding currents I1,2,[143].
Langmuir probe measurements are mainly performed in the bulk plasma. In a situ-ation of quasi neutrality the given equations provide values which are correct within anorder of magnitude. This situation being already bad, it is worsened in the sheath wherethe electric field might be anisotropic leading to rather complicated electron and ion cur-rents. Furthermore, particles and Langmuir probes alike change the plasma propertiessignificantly.
Thus, probing plasmas is a big issue to which no very clear solution can yet be given.
1.6 Summary
Ionized gases are called plasmas. Plasmas occur in several environments next to which theyare employed in laboratory setups for scientific, industrial, and medical purposes. Theycan be discriminated by the degree of ionization and the ion kinetic energy. Throughoutthe experiments conducted for this thesis low temperature plasmas have been employed.Likewise plasmas are usually produced by applying alternating or continuous voltages toa gas filled volume at pressures ranging from several Pascal up to atmospheric pressures.In the central part of the discharge ions and electrons are of almost equal density, leadingto quasi-neutrality and thereby very high conductivity. Between this bulk plasma and thesurrounding walls a strong electric field - the sheath - builds up. The fast electrons do notpenetrate the sheath, whereas the ions slowly drift outwards. This accounts for the differentdensity profiles. The resulting potentials can be probed by monitoring several differentplasma parameters such as the emitted light, the electrical properties, or the chemicalcomposition. As it is explained in the following chapters, particles can be employed asprobes, too.
1.7 Resume
Les gaz ionises sont appele Plasmas. Ils peuvent etre rencontres dans differentes conditionset utilises tant dans le domaine scientifique de la recherche que dans les secteurs indus-triel et medical. Il est possible de les classer selon le degre d’ionisation ou la temperatureelectronique. Ainsi, dans le cadre du travail de recherche entrant dans le cadre de cettethese nous avons mis en uvre un plasma froid. Les plasmas sont generes decharge electriqueen appliquant aussi bien une tension continue qu’alternative a un gaz, contenu dans uneenceinte de volume donne, a une pression pouvant aller de quelques Pascals a la pres-sion atmospherique. Dans le milieu plasma la densite des ions positifs est egale a celledes electrons assurant ainsi la condition de quasi-neutralite et une grande conductiviteelectrique. Entre le plasma et toutes les surfaces en contact s’etablit un champ electrique(les gaines de charges d’espace) qui va confiner les electrons et permettre aux ions de deriverlentement vers les parois. Il en resulte ainsi une difference entre les profils des densites de

1.8 Zusammenfassung 15
ces especes dans les gaines. Il est par consequent possible de sonder le potentiel dans ceszones en suivant l’evolution de certains parametres tels que l’emission lumineuse, les pro-prietes electrique de la decharge ou la composition chimique du milieux. Comme expliquedans les chapitres de la these il est possible d’utiliser les particules comme des sondes a ceteffet.
1.8 Zusammenfassung
Ionisierte Gase werden Plasmen genannt. Neben den naturlichen Vorkommen werden Plas-men in Laboren zu wissenschaftlichen, industriellen und medizinischen Zwecken verwendet.Eine Klassifizierung kann anhand des Ionisationsgrades und der kinetischen Energie der Io-nen vorgenommen werden. In der vorgestellten Arbeit wurden Experimente in Niedertem-peraturplasmen durchgefuhrt. Solche Plasmen werden normalerweise in einer mit Gasgefullten Kammer durch Anlegen von alternierendem oder konstantem Strom erzeugt. ImZentrum der Entladung sind die Elektronen - und Ionendichte etwa gleich, was zu quasi-Neutralitat und damit hoher Leitfahigkeit fuhrt. In der Plasma Randschicht baut sich einstarkes elektrisches Feld auf. Die schnellen Elektronen dringen nicht in diese Randschichtein, wahrend die Ionen nach aussen driften. Das ist der Grund fur die Dichteverteilungen.Der Potentialverlauf kann durch Messungen verschiedener Parameter, wie das emittierteLicht, die elektrischen Parameter, und die chemische Zusammensetzung, ermittelt wer-den. Wie in den folgenden Kapiteln dargestellt, konnen auch Teilchen zu diesem Zweckverwendet werden.

16 1. Plasmas

Chapter 2
Particles in Plasmas
2.1 Particles
Plasmas containing particles are called complex or dusty plasmas. Due to their interactionsparticles levitated in a plasma show a variety of different motions and arrangements thatresemble in many cases the ones of bound atoms or other phenomena observed in nature.Hence complex plasmas provide a unique possibility for interdisciplinary studies as well asfor fundamental research [68, 159, 196].
Particles can form in plasma environments either by introducing special gases such asacetylene and methane or by etching material previously introduced into the chamber, e.g.carbon-covered electrodes [8, 146] or particles from earlier experiments [28]. Pictures ofgrown particles are shown in figure 2.1, [19, 37]. One can clearly see the cauliflower likesurface structure of the particle in figure 2.1(a) and the more even surface structure of theparticle in figure 2.1(b). The grown structure depends on the composition of carbon, hy-drogen, and oxygen. The non-diamond, diamond, and no growth regimes can be displayedby a C-H-O phase diagram, as it has been shown by S. C. Eaton and M. K. Sunkara [58].The growth process and the different possible surface structures are described in greaterdetail in section 3.
Instead of growing particles one can introduce them artificially into the plasma. Themost common material of the introduced particles is Melamineformaldehyde (MF). Themono disperse plastic spheres were originally used to calibrate scanning electron micro-scopes. A picture of MF particles is shown in figure 2.2(a). In some cases particles madefrom other materials are of use. Depending on the desired effects hollow glass spheres andparticles made from Polystyrol (PS) are employed. The main reason to employ hollowglass spheres instead of plastic particles is their increased radius to mass ratio. Particlesmade from other materials, e. g. silica particles, are mainly employed due to their reducedetching rate or fluorescent properties. A picture of the hollow glass spheres is shown infigure 2.2(b). It can be seen that these particles are not quite as mono disperse as the MFparticles in 2.2(a). To overcome this problem the particles are filtered by using severalmeshes of different grid sizes, refining the particle size distribution.

18 2. Particles in Plasmas
Figure 2.1: Two different grown particles. (a) Picture of a particle grown in a gas mixtureof acetylene in argon. The surface shows the typical cauliflower structure, [19]. (b) Picture ofdiamond grown in a hydrogen / methane mixture, [37]
Figure 2.2: Pictures of two different kinds of artificial particles taken by means of a scanningelectron microscope (SEM): Melaminformaldehyde (MF) particles (a), [83], and hollow glassspheres (b), [120]. Note, that the scales in both pictures are very similar.
Particles introduced into a plasma can get etched and material can be deposited ontheir surface. A picture of a MF particle with smaller particles grown on its destroyedsurface as observed during the experiments on dust particle growth is shown in figure 2.3.The zoom allows to show only a small portion of the original MF particle. Thus, the wholefield of view is basically showing a zoom on the particles surface. As it can be seen holesas well as additional bumps occur. The holes are a result of etching the particles surfaceunder the influence of oxygen plasmas. The bumps are particles growing from acetylene.Note the difference in surface structure between the MF and the grown particles. Similarsurface growth has been observed if employing a magnetron for sputtering aluminum [99].
However, the particle displayed in figure 2.3 is an exception. Usually deformations ofthe surface are very small compared to the particles diameter and of no importance in thisand the following chapters.
A more serious problem is due to the etching rate. Particles introduced into a plasma

2.2 Charging 19
Figure 2.3: A picture of a MF particle which has been exposed to several plasma runs in aDC discharge. Due to the high zoom only a small fraction of the original particle can be seen(compare figure 2.2 for complete view on several MF particles). Some of the plasma runs wereperformed using oxygen. Hence the particles surface is being etched. During other runs acetylenewas employed to trigger particle growth. It can be seen that on the disturbed surface some newparticles grew.
are etched/sputtered. This depends strongly on their position and might even vary forparticles being levitated at the same height. No further study on this matter has yet beenperformed and the effect will be neglected in the following discussions.
It has been shown that particles introduced into a vacuum loose mass due to out gassingof water [70]. This is especially true for particles introduced into a plasma. The loss dueto the loss of water is substantial. In order to collect the least water amount possibleoutside the plasma the particles are kept in dry chambers. Also the particle dispenserslater installed to introduce the particles are kept there if not in use. In order to reducethe impact of this effect on the experiments the particles are usually introduced into theplasma some time before the experiment is started. However, as mentioned above they arenot to be left there too long due to the reduction caused by anisotropic etching.
For most experiments the initial distribution of mass and size among the introduced,almost mono disperse, particles is more prominent then any gain or loss during the exper-iment.
2.2 Charging
In isotropic plasmas, e.g. the bulk plasma, the electron thermal flux is higher than theone of ions. Once particles are subjected to a plasma their charge increases until the ionand the electron flux towards the particles are balanced. As a result a stationary surfacepotential Φs forms. This potential provides a barrier from which electrons are reflected.Thus, the negatively charged particles are surrounded by a region depleted of electrons.
The orbital motion limited (OML) approximation describes the charging of particles incollision-less plasmas. It is based on three assumptions [3, 68, 161]:
• The dust grains do not interfere with the electrons and ions in the vicinity of other

20 2. Particles in Plasmas
Figure 2.4: The prediction of OML, represented by the dotted line, compared to several simu-lation and measurements on the particle charge, [68].
dust grains: The dust grains are isolated.
• In the vicinity of the particles the electrons and ions are assumed to be collision-less.
• No barriers are present in the effective potential.
These three assumptions allow to calculate the cross section for electron and ion collectionfrom the conservation of energy and the angular momentum. The cross section is indepen-dent from the plasma potential around the probe but depends on the surface potential Φs.With the Maxwell equations the fluxes towards the particle can be calculated. Once thefluxes towards the particle are equal the charge is constant. However small fluctuationsaround this value are to be expected [51, 156, 185, 208].
For small particles (r � λD) the vacuum relation
Ze = rΦs (2.1)
is a suited particle charge approximation [68].As the OML theory is an assumption its compliance with real experiments has to be
discussed. In figure 2.4 the result from different experiments and simulations are comparedto the predictions of the OML theory (dotted line), [68].
Determine the charge experimentally is tricky, since the particles are bound by manyelectromagnetic forces and the interaction with other particles in the plasma. Furthermore,it has been shown, that the particle charge is affected by the particle levitation height aswell as the interaction with other particles [41, 122].
However, several different methods exist to measure the charge including using hy-per [18] and micro gravity environments [101, 220], particle collisions [67, 112], verticalresonances [39, 40, 41], oscillations [93], and the particle speed [65].
Some of the results from these determinations are displayed in figure 2.4. The actualvalues differ very much from the one predicted by OML. This is mainly due to three reasons:

2.2 Charging 21
1. Finite Dust DensityThe dust levitated in a complex plasma contributes to the quasi-neutrality of thesystem.
ni = ne + |Z|nd (2.2)
with nd being the grain number density carrying an intermediate charge |Z|. Thusthe ratio of ion to electron flux on the particle is increased leading to a reducedparticle charge. This is described by the Havnes parameter [78]:
P = |Z| nd
ne
. (2.3)
The particle charge is the one of an individual particle for P � 1 and reduced forP < 1.
2. Barriers in the Effective PotentialIons streaming towards a negatively charged particle are attracted. However, the an-gular momentum of the ions leads to a repulsive centrifugal potential. The interplaybetween these forces can lead to a reflection of low energetic ions. Thus, the flow ofions towards the particle is reduced and the particle charge increases [95].
3. CollisionsIons collide with electrons and neutrals. While the electron-ion collisions can be ne-glected, ion-neutral collisions can lead to an ion energy reduction. These ions, beingattracted by the negatively charged micro particles, are trapped in the vicinity of theparticle or even fall onto their surface. In addition, further ions can be produced byion-neutral collisions. This increases the ion flux towards the particle. The combi-nation of these effects reduces the particle charge [176].In the collisional regimes thecalculation of charge is different as for instance shown by Khrapak et al. [104].
Other effects such as thermionic emissions, photoelectric emissions and secondary elec-tron emissions influence the particle charging [68].
Due to the limitations of OML theory several other charging models have been devel-oped [2, 76, 224, 227] to solve the problems listed above.
In the anisotropic plasma regions, e.g. sheath, presheath, and striations, the electricfields dominate the plasma behavior. For this regime no self-consistent analytic solutionexists. However, some approximations can be done. Due to the electric field the ion driftis large compared to the electron drift and the charge is determined by the ion velocity [7].If approaching the electrode positive space charges build up in the sheath where
ni
ne
> 1. (2.4)
Thus, if particles penetrate deep into the sheath their particle charge approaches a maxi-mum before it decreases. Very close to the electrode the ion flow becomes dominant andthe particle charge should finally be positive [191]. Particles can then no longer be levitatedand are accelerated towards the electrode.

22 2. Particles in Plasmas
2.3 Forces
Particles levitated in a plasma are influenced by several different forces. The differentforces and the possibility of additional confinements will be discussed in the following.
In normal1 ground based experiments gravitation is present at all times. For particlesof certain mass2 it dominates over all other forces in the bulk plasma.
FG = mdg (2.5)
The particles are levitated in the sheath where gravitation and electric forces are in equi-librium. Hence the electric force is of high importance in ground based experiments
FE = ZeE. (2.6)
Due to the plasma polarization in the vicinity of a particle corrections to the electricfield have to be introduced [53]. Close to the particles the magnitude of the electric fieldincreases, leading to a dipole moment along the direction of the field. In contrast, theelectric field is reduced due to plasma shielding in the Debye sphere. The effect of plasmapolarization can thus be neglected for most of the experiments.
Several possibilities exist to overcome gravity. One can use small particles which will bekept levitated above the sheath. If however bigger particles are necessary in the experimentsmicro gravity conditions have to be employed. To dispose of gravity sounding rockets, droptowers, parabolic flights, and the International Space Station (ISS) are accessible.
Additionally the levitation of particles above the sheath can be achieved by heatingor cooling the electrodes introducing a thermal gradient resulting in an asymmetry in themomentum transfer of the neutrals [182]. The thermophoretic force is always directedtowards the lower gas temperature:
Fth = −4√
4π
15
r2
vTn
κn∇Tn, (2.7)
with κn being the thermal conductivity coefficient and ∇Tn the temperature gradient [182].
The different temperatures introduce inhomogeneous flows into the plasma. Interestingphenomena such as shear flow [80] and thermal creep [153] are the consequence. Of courselikewise inhomogeneities are disturbing experiments and cannot replace micro gravity en-vironments.
1The term ’normal’ is employed in this case to emphasize that the experiments in question are performedin a lab without any special means to reduce gravity such as parabolic flights or drop towers.
2The particle mass at which the levitation level and the behavior will not be dominated by gravitationanymore depends on the plasma parameters. In most cases the influence on particles with a diameter ofless then 2 µm will be negligible. This is especially true for grown particles. To reduce the mass whileincreasing the particle radius glass hollow spheres are employed. However their mass is too big for themto stay levitated in multilayer systems without additional confinements. This will be discussed in sections7 and 8.

2.3 Forces 23
Since plasmas are governed by ions and electrons the momentum transfer of both to-wards the particle have to be considered. Due to their small mass the electron drag isneglected in most cases.
Fed = mdγdeue, (2.8)
with γde being the momentum transfer rate from electrons to particles [68].The ion drag force however, is considerable even though in usual low temperature
plasmas the number density of ions is much lower than the number density of neutral gasatoms. The momentum transfer from ions to particles is mainly due to two processes [195]:
1. Direct Ion Impact or Collection of IonsIn this case the ions hit the dust particles, transferring momentum by mechanicalinteraction. Assuming that the ion - dust cross section is equal to the cross sectionduring charging the resulting transfer can be described by:
F collid = πr2dnimiui
√v2i +
8kBTiπmi
(1− 2eΦs
miu2i
). (2.9)
2. Coulomb InteractionHere the momentum is transfered by electro - static ion - particle interactions. Ionswith large drift speeds compared to the ion thermal speed cannot form a sheatharound a negatively charged particle. The Debye sphere around a particle is thereforebest described by a region of low electron density. Consequently the ion drag forcedue to Coulomb interactions can be calculated by:
F coulid = 2πrdnimiuiα
√u2i +
8kBTiπmi
ln
((rdα)2 + λ2De
(rdα)2 + (rd√
1− 2α)2
), (2.10)
with
α =eΦs
miu2i. (2.11)
The complete ion drag force is a combination of the two processes:
Fid = F collid + F coul
id . (2.12)
One of the most prominent examples of the ion drag force acting on the particles is theformation of the void in the bulk under micro gravity conditions [52, 77, 124, 129]. Thevoid describes a dust free region in the center of the discharge. As it has been discussedin the previous chapter ions are moving towards the confining (grounded) walls. Therebythey introduce an outward acting force on the dust particles. An example of the void isshown in figure A.1.
The momentum transfer from neutrals to the dust leads to the neutral drag force:
Fnd = −mdγnud. (2.13)

24 2. Particles in Plasmas
It depends on the particle mass, the relative particle velocity ud and the neutral damping(momentum exchange rate) [60]
γn = δ8√
2π
3
mn
md
nnvTnr2d. (2.14)
The neutral damping rate depends on the mass, number density, and thermal velocity of theneutrals and the mass and radius of the dust particles. Dependant on the collision type theEpstein coefficient δ varies between 1 (specular reflection) and 1 + π / 8 (diffuse reflection)[60]. Several experiments have been performed determining the Epstein coefficient. In thefollowing the results of measurements by Konopka [111], showing that δ = 1.48 ± 0.05 incase of MF particles levitated in an argon plasma at room temperature, are going to beused in the calculations.
Please note that these estimations of the neutral drag force are only valid if the meanfree path of the neutrals is big compared to the particle radius and if the velocity of theparticles is well below the thermal velocity of the neutrals. In the low temperature plasmasdiscussed throughout this thesis this can be assumed to be the case. If the particles movemuch faster than the neutrals the friction is in the form of Stokes friction [200].
In some cases the neutral gas friction can be neglected or easily subtracted while postprocessing the data. However, it can render certain experiments difficult or even impossibleas well as being an important effect in others.
Additional forces, such as for instance magnetic or electric fields, can be applied tomanipulate the plasma and the particles therein. The shape of the confinement resultingfrom the shape of the plasma chamber can be changed by introducing objects such asglass cylinders [92, 118, 110], metal bars or by drilling holes into the electrodes [112].Especially additional confinements only influence the plasma and the particles in theirclose vicinity. But since in most cases the behavior under the changed conditions is ofspecial interest the observation tools are usually adjusted to match the extension of theadditional confinements.
2.4 Particle Interactions
As described above particles levitated in a plasma carry certain (usually negative) charges.Thus, they are entitled to interact with each other as well as with the surrounding plasmaand potential additional electromagnetic forces. Since the particles are all like-chargedthey repulse each other3.
Towards all particles a constant flow of ions is present. The ions approach a particlefrom all sides. If however two particles are fairly close to each other they disturb the ionflux and shadow each other from the streaming ions.
3Note, that in case of very small particles (≈1 nm) the charge fluctuations lead to a situation in whichthe mean overall charge can be assumed zero. In this case the particles repulse as well as attract eachother.

2.4 Particle Interactions 25
Figure 2.5: Wake field as it forms downstream a particle situated at (0,0). In this plot the ionsstream from the left to the right. Downstream the negatively charged particle a positive potentialforms. This is the so-called wake field which attracts other negatively charged particles and isresponsible for string formation, [151].
Similar to the ion shadowing the neutrals can be shadowed by particles, as proposed byFortov et al. [66]. If the gas temperature is smaller than the particle surface temperaturethe neutral shadowing force would be repulsive. In the opposite case the force is consid-ered to be attractive. The proposed attractive shadowing force could then overcome therepulsive electrostatic force at large distances.
The particle charge is determined by the flux of electrons and ions towards it. Dueto the higher electron mobility they usually carry negative charges in the order of severalthousand electron charges depending on their size. Around each particle a positive spacecharge (Debye sphere, see figure 2.6(a)) with a radius of the ion Debye length buildsup. Thus, the interaction of particles in the bulk plasma are best described by screenedCoulomb (Yukawa) interaction [159, 196].
The most important inter particle interaction in this thesis besides the screened Coulomb(Yukawa, see equation (1.6)) interaction is the wake field potential. Ions streaming past theinserted particles deform the Debye sphere around the particle. Downstream the particlethe ions are focused, introducing a positive wake potential [91, 122, 123, 151, 199]. Theshape of the wake field is shown in figure 2.5 as it has been taken from [151]. This non-reciprocal positive potential does not comply with Newtons third law leading to a situationin which the system can no longer be described by a Hamilton equation [34, 98, 108].
The positive wake potential forms behind any negatively charged particle in a streamingplasma. But, it has also been observed if the particles move in the plasma. Thus, it canre-accelerate electrons in particle beam accelerators. In these facilities the plasma is ignited

26 2. Particles in Plasmas
Figure 2.6: The potential distribution around a particle without any field (a), with the defor-mation due to the streaming ions (b) and in a time averaged reciprocal form due to an alternatingelectric field (c). This graphic is taken from [95]
either by strong lasers or by preceding electrons or ions [23].
The positive potential that forms downstream the particle attracts other negativelycharged particles. Particle ensembles can form vertical strings [110, 122, 123], lanes [13, 95]or internal structures in clusters [92, 118] in response to the wake. Due to shadowing effectsthe charge of the lower particle is reduced. Thus, the focusing effect of the wake, dependingon the particle charge, is reduced, too. This leads to an increase in the inner-string interparticle distance along a string. Charge depletion has been observed in particle clusters[22, 118] as well as in single strings [40, 41].
Since the wake field forms exclusively downstream the particle [22, 122, 139, 151] it isnot reciprocal [107]. However, there exist possibilities to introduce a reciprocal deformationof the positive wake potential [33, 35, 95, 98]. In order to achieve this an alternating currentwith frequencies lower than the ion plasma frequency (see Equation 1.10) but higher thanthe dust plasma frequency4 has to be applied. A like-wise alternating electric field willhave an impact on the ions but does not change the particle positions [34].
The time averaged deformation of the wake field in response to an electric field isdisplayed in figure 2.6 (c), [95]. It is compared to the non - distorted Debye sphere (a), asit usually occurs in the bulk plasma, and the deformation as in response to ions streamingpast a negatively charged particle (b), as it usually occurs in the sheath region wherethe electric fields are very strong, [95]. It can be seen that in difference to the usualdeformation caused by ions streaming only in one direction past the particle the wakepotential is symmetric in case of applying an (additional) alternating current.
If an alternating electric field is applied to a particle cloud an orientation along theelectric field axis is observed [95, 98]. The resulting system is called an ’electrorheologicalplasma’ 5. Similar situations have earlier been observed in colloids [192, 178, 217]. Nextto the alternation of orientation by electric fields comparative results can be gained byapplying magnetic fields. A corresponding system is called magnetorheological system
4The dust plasma frequency is defined analogue to the ion and electron plasma frequency given inEquation 1.10.
5A picture of an observed electrorheological plasma is displayed in figure 6.1

2.4 Particle Interactions 27
[211]. In line with the results from experiments on colloidal suspensions with electric fieldsalternating not only in one but in more dimensions (in-plane [133] and spherical rotatingelectric fields [170]) have been proposed.
Due to the tunable viscosity and electric and magnetic properties the advantages of like-wise systems can be used in medical as well as in industrial applications[45, 171, 198, 222].
Electrorheological systems differ from other systems with orientated dipoles. For in-stance the magnetic dipoles in unordered ferro magnetic systems are stochastically orien-tated but present if no external field is applied. Once such a magnet is subjected to amagnetic field the internal dipoles are orientated along the external field axis. However,the dipoles are never as perfectly aligned as in electrorheological systems. Furthermore,the dipoles are introduced by the additional field and not present before [34].
In electrorheological plasmas a particle and the positive wake potential behind it forma dipole. These dipoles are, due to the additional electric field, perfectly aligned. Thusthe isotropic interaction potential (usually Yukawa interaction) has to be extended by ananisotropic potential due to dipole-dipole interaction, leading to the time averaged potential[34]:
V (r, θ) = Φi − ξΦaP2(cosθ). (2.15)
In this equation ξ gives the relative strength of the anisotropy. The anisotropic potentialscales with
Φa ∝M2
T
r3. (2.16)
The angular distribution is best described by the Legendre polynomial
P2(cosθ) =3
2cos2θ − 1
2. (2.17)
It is an exact description if the dipoles are perfectly aligned along one well defined axis.If this is not the case Equation 2.15 will only describe the first approximation of theinteraction potential.
As it has been shown by Kompaneets et al. [109] the isotropic interaction potential Φi
changes depending on the thermal Mach number:
MT =Ion Drift Speed
Ion Thermal Velocity=
uivT i
, (2.18)
Depending on the surrounding plasma the Mach number varies. In the bulk plasma,for instance, it is close to zero, whereas it increases in the sheath, where the ions areaccelerated towards the electrode or the confining walls. If the thermal Mach numberequals zero the isotropic potential is described by Yukawa interaction, if it equals one thebest approximation is a Lennard-Jones potential:
ΦLJ ∝(σr
)n−(σr
)m, (2.19)
with σ ∝ λD. In figure 2.7 the particle interaction for increasing Mach numbers is given.To the curves displayed there a 6-12-Lennard-Jones potential (n = 12 and m = 6) has been

28 2. Particles in Plasmas
Figure 2.7: Isotropic interaction potential for different Mach numbers [109].
fitted. A like-wise potential is often employed to describe the interaction potential betweentwo atoms. It can be seen that even the isotropic interaction potential has an attractivepart if the thermal Mach number is high enough [13, 109].
In the horizontal plane, parallel to the electrodes, the interaction is not dominatedby the wake field effect but by an interplay of attractive and repulsive forces. In groundbased experiments negatively charged particles of sufficient mass6 levitate in the sheath atthe height where the electric field balances gravitation. Assuming that further introducedparticles are of the same mass and size as the initial one they will all carry the samecharge7 and be therefore levitated at the same height in the plasma sheath. Due to theircharge, the electrostatic confinement, and their interaction potential these particles tend toorganize themselves in 2D lattices. To describe the particle behavior a coupling parameterdescribing the ratio of the interaction potential and the kinetic particle energy can beintroduced [88, 209]. If the kinetic particle energy is samller than the potential energythe system is called strongly coupled. Furthermore the occurring patterns in the particlearrangement (phase transitions) can be predicted by the coupling parameter. The morethe interaction potential of neighboring particles exceeds the kinetic energy, the higher isthe ordering in the system. Such ordered systems (2D plasma crystals) have been observedby Thomas et al. [204, 205], Chu et al. [46], and Hayashi et al. [79]. In further studiesdifferent crystalline structures as well as phase transitions have been observed in 2D and in3D systems [50, 86, 103, 106, 167]. If the wake field is not changed a particle downstreama layer of other particles is situated in the center of the particle configuration upstream.Thus, the most common 3D crystal arrangements are fcc (face centered cubic) and hcp(hexagonal closed packed) structures, [86].
6Very small (light) particles will be distributed homogeneously over the plasma. This behavior can beintroduced also by using thermophoretic forces or by micro gravity experiments as for instance in droptower experiments, parabolic flights, or on board the ISS.
7The charge and size distribution among the particles has at length been discussed above. However, forthe following considerations particles of a certain parameter are assumed to have equal mass and size. If asituation is encountered in which the error made by this assumption is considerable this will be mentioned.

2.5 Summary 29
2.5 Summary
Several different types of particles can be formed or artificially introduced into a plasma.The resulting system is then called a dusty or complex plasma. In the plasma particlesare subjected to electron and ion fluxes. Due to the higher electron mobility the parti-cles tend to charge up negatively. Thus, the particles are subjected to several differentforces caused by gravitation and electric fields as well as by impacts of neutrals, ions, andelectrons. Furthermore, additional forces can be introduced such as thermal gradients orelectromagnetic fields. Around each particle a positive space charge, the so-called Debyesphere, forms, leading to a screened coulomb inter-particle interaction. If positive ionsstream past a negative particle they are focused depending on the ion velocity. This leadsto a deformation of the Debye sphere. Furthermore, the Debye sphere and thereby theparticle interaction potential can be manipulated by additional fields.
2.6 Resume
Plusieurs types de particules peuvent etre synthetisees ou injectees dans un plasma. Lesysteme qui en resulte est denomme ”Plasma poussiereux” ou ”Plasma complexe”. Desleur formation ou injection, les particules sont soumises aux flux des electrons et des ionsarrivant a leur surface. A cause de la grande mobilite des electrons, comparee a celledes ions plus massifs, la charge acquise par les particules est negative. Elles sont parconsequent soumises a differentes forces liees au champ gravitationnel, au champ electrique,aux collisions avec les especes neutres, les ions et les electrons presents dans le milieuplasma. Il aussi possibles de les soumettre a d’autres forces telles celles lies a des champselectromagnetiques ou a des gradients de temperature (thermophorese). Chaque particuleest entouree d’une gaine de charges d’espace positives, appelee sphere de Debye, qui ecrantele potentiel electrique genere par la charge qu’elle porte et ainsi affecte l’interaction entreparticule. Selon leur vitesse, des ions positifs peuvent etre devies, et focalises, par leurinteraction avec les particules. Cela se traduit aussi par la deformation de la sphere deDebye. Ainsi, la sphere de Debye et par voie de consequence l’interaction entre particulepeut etre modulee a l’aide de champs additionnels.
2.7 Zusammenfassung
Verschiedene Teilchen konnen in Plasmen erzeugt oder eingefugt werden. Das resultierendeSystem wird als ”komplexes” oder ”staubiges” Plasma bezeichnet. Im Plasma sind dieTeilchen einem Flußvon Elektronen und Ion- en ausgesetzt. Die hohere kinetische Energieder Elektronen fuhrt zu einer negativen Ladung auf den Teilchen. Die geladenen Teilchenim Plasma sind verschiedenen Kraften, verursacht von Gravitation, elektrischen Feldernund dem Impulsubertrag von neutralen Teilchen, Ionen und Elektronen auf das Teilchen,ausgesetzt. Des Weiteren konnen zusatzliche Krafte durch thermische Gradienten oderexterne elektromagnetische Felder eingebracht werden. Um jedes negativ geladene Teilchen

30 2. Particles in Plasmas
baut sich eine positive Raumladung, die sogennante Debye - Kugel, auf. Das fuhrt zueiner abeschirmten Coulomb - Wechselwirkung (Yukawa - Wechselwirkung) zwischen denTeilchen. Wenn die positiven Ionen an den Teilchen vorbeistromen werden sie fokussiert.Dadurch verandert sich die Form der positiven Raumladung. Diese, und dadurch dieTeilchenwechselwirkung, konnen durch externe Felder beeinflusst werden.
Chapter 3
Dust Particle Formation
3.1 Introduction
Dust particles in plasma environments have first been studied in astrophysical environ-ments [156, 202, 215], explaining planetary and star formation in nebulae from dust formingin the surrounding plasma [57]. Later on particle formation has been discovered in plasmaprocessing before it became a major field of research [28, 32, 62]. Especially during theproduction of silicon chips and solar cells, dust damages the processed material renderingit useless for the dedicated purpose. In addition, the presence of particles in fusion devicescauses problems [218]. Much later the use of formed particles and their benefits have beendiscovered. Nowadays the controlled deposition of dust is a useful tool as for example inproducing thin films [90, 219], nano-tubes [28], or super hard nano-composites [210].
To trigger particle formation certain molecular species are needed. Very common isthe employment of carbon-rich molecules by either introducing a corresponding precursorgas (e.g. acetylene ore methane) or by etching previously introduced materials1. Growthhas not only been observed from carbon based material but also from silane [19, 213] andfrom metallic materials, leading for instance to the deposition of titanium [99]. It hasbeen shown that the three stepped growth process is independent from the initial materialemployed [19, 28, 31, 113, 114, 115].
The radial growth by accretion of molecules is considered to be linear [19]. Due tothe usual experimental conditions particles reach a limited size before they are no longerconfined at the initial place of formation and a new generation forms [28]. The newgeneration occurs at the initial point of formation [19]. Since the process and timing of thegrowth in each generation is the same for all the particles a very narrow size distributionis expected.
Growth has been observed in different plasma conditions such as RF (e.g. refs. [29,149, 19]), DC (e.g. refs. [8, 163, 194]), arc (e.g. ref. [184]), and microwave plasmas (e.g.ref. [173]). The maximal observed particle sizes depend on the plasma parameters and the
1In the laboratory experiments these are mainly MF particles [148], but also electrodes made fromcarbon can be employed [145].

32 3. Dust Particle Formation
Figure 3.1: The different stages during particle growth.
plasma run time. The particle diameters vary from nanometers to micrometers.The pressures in RF plasmas range from several Pascal up to atmospheric pressures.
As in low pressures triggering the growth is the main challenge, igniting plasmas becomesproblematic at atmospheric pressures, where delivering the necessary ionization energy ischallening. In such conditions many experiments in air are performed, since for instancemedical devices are operated in air. Particle formation in atmospheric pressure plasmas istherefore an interesting topic [155, 160, 221, 225].
Under micro gravity conditions experiments on the particle growth in plasmas have beenperformed, [148]. However, due to their low mass and the big particle amount (respectivelydensity) grown particles tend to be homogeneously distributed among the plasma andbehave in ground-based experiments quite similar to injected particles under micro gravityconditions. For instance the formation of a dust free region (void) in the central regioncan be observed. The void is not stable and shows different kinds of instabilities, such asperiodic contractions [49, 149].
3.2 Growth Process
3.2.1 General
Particle growth is in principle divided into three stages: Nucleation, Coagulation andAccretion, [19, 28, 30]. A sketch to illustrate the three stages is shown in figure 3.1.
In addition to particle formation film production upon the surrounding surfaces hasbeen observed. It has been found that the film production takes more time than theparticle formation in the bulk plasma [19]. Films occur on surfaces and form due to thedeposition of protoparticles on the surface [32, 90, 219].
3.2.2 Nucleation
The nucleation process describes a plasma chemical reaction during which the moleculesinside the plasma are dissociated by electrons and polymerize afterwards [28, 75, 87, 164].In general this can be divided into two steps: initiation, during which primary ions, ex-cited molecules and radicals are formed, and propagation. In the second step the activated

3.2 Growth Process 33
Figure 3.2: Chemical reactions during nucleation. They are caused by association, dissociation,ionization, and attachment, [54]. Further possible reactions leading to similar results can befound e.g. in ref. [54, 128, 201].
molecules2 bond with other species (activated and not activated molecules) in the plasma.The newly formed bigger molecules than undergo the same process of initiation and propa-gation. This leads to the formation of so-called protoparticles [63, 201]. The nucleation ofdust is due to avalanche condensation and can therefore also be triggered by introducingmaterial into the plasma [116, 223].
During nucleation particles of several nanometer in diameter form. Since it is mainlya chemical reaction the particles are molecules of random charge. Positively, negativelycharged molecules as well as neutral radicals exist. These protoparticles are chains as wellas rings and are produced as long as the original species is present in the gas volume.
As discussed in section 1.4 several different ions and radicals form in the plasma. Theirrole during polymerization depends on their density and formation probability. Thus nucle-ation can be influenced by the plasma power, composition, gas temperature, and pressure.It has been found, that the most important role in triggering particle formation is due tonegative ion production [19, 44, 54, 87]. Different possible chemical reactions are discussede.g. in refs. [19, 28, 54, 116, 121, 201]. Possible reactions taking place due to dissociation,ionization, and attachment are displayed in figure 3.2, [54]. Note, that the reactions dis-played here are only one possibility out of several (some of equal probability) that lead to
2Molecules in this context are described as activated if they are either ionized, excited or a radical.
34 3. Dust Particle Formation
comparable results.
3.2.3 Coagulation
In difference to nucleation coagulation is dominated not by chemical reactions but byphysical effects. The protoparticles collide with each other forming mainly negativelycharged particles of several tens of nanometers in diameter [28, 29, 168, 177, 201]. Thecoagulation can be described by the general dynamic equation for aerosols [19, 113]. Fromit the particle number density depending on the particle size and its development (lossand gain in density of particles with a certain size) due to coagulation can be deduced.It has been found that the coagulation process is much faster for charged particles thanfor neutrals [19]. As discussed in the previous section the protoparticles carry randomcharges. The collision probability is therefore increased with respect to a situation inwhich the particles carry the same charges. The growth rate during this phase is very highwhile the particle density is rapidly decreasing in time. Particles formed during the stageof coagulation are already negatively charged. Their size is of the order of several tens ofnanometers in diameter.
3.2.4 Accretion
In the last step of the formation the particles grow in size by collecting positively chargedions and radicals from the plasma. The molecules attracted from the plasma are thoseproduced during both steps of nucleation. The bigger the particles get the more negativelythey tend to be charged. Assuming that the growth during this stage is mainly due toradicals the radial growth is considered to be linear [19].
dmd
dt∝ nradicalsr
2d mass growth rate
drddt
= const. radial growth rate
(3.1)
If after this stage the particles are observed by means of a scanning electron microscope(SEM) a typical cauliflower structure for particles grown from carbon rich environmentsappears [116]. In addition the size distribution of the particles is almost mono dispersesince the particle charging is as fast as the coagulation process [19]. The observed mi-cro structures are seen as a hint that accretion of particles happens rather by ballisticdeposition than by diffusion limited aggregation [72].
3.2.5 Generations
The grown particles are subject to the forces in the plasma. The growth always (re-)starts at one particular region in the plasma. This is where the active molecules can betrapped. If the particles reach a certain size they will be pushed away from the place offormation by (external) forces. As the charge carried by a particle scales with its radius the

3.3 Influence on the Plasma 35
particles are influenced by the ion drag. Thus, the ion drag, acting outwards, pushes theparticles out of the center of the discharge. The resulting particle free region is called thevoid. It has especially been observed under micro gravity conditions, where the particlesare distributed (almost) homogeneously among the bulk plasma. A picture of the void isshown in figure A.1. If the particles reached a size (charge) large enough to be pushedout of the central region of the chamber by the ion drag their mass is still relatively small.Thus, they act very much like particles under micro gravity conditions. Since the particleskeep growing in size even after being removed from their initial place of formation theycan reach a size (mass) at which they are affected strongly by gravity.
Depending on the geometry, plasma excitation mechanism, and gas composition theparticles can then even fall out of the plasma instead of only being pushed away from theplace of formation.
A second generation grows in the now empty place of initial formation until they arepushed out, too. This behavior is observed for any further particle generation. Thus,particle growth is (usually) periodic. However, under certain circumstances only a limitedamount of generations (or even only a single one) are observed. This can be influenced bythe choice of the carrier gas, power, pressure, and gas composition.
3.3 Influence on the Plasma
Besides changing the plasma chemistry (e.g. by depletion of certain gas components)the plasma parameters are strongly influenced during the formation process. The powerabsorption, the sheath properties, the density of excited states, the electron temperatureand density, as well as their spatial distributions can change [9, 28, 31, 85, 214].
Particles in a plasma tend to charge up negatively. The negative charge is explainedby the higher electron mobility. As it has been discussed the particle charge is constantonce the electron and ion flux towards the particle are in equilibrium. If the particlescarry mostly negative charges the plasma is depleted of electrons, which equals a reductionof the electron density. To compensate for these losses and to sustain the discharge theelectron temperature increases3. Since the heating in the bulk plasma depends on theelectron density this leads to an increased power consumption in the bulk and thereby toa change in the sheath size [55]. The plasma change has also been reported on in the caseof introduced particles [6].
The correlation of the electron density and the dust particle growth in a Ar/C2H2
plasma is displayed in figure 3.3, [116]. The results of a Fourier transform infrared spec-troscopy are correlated to the measured electron density. It can be seen that if the dust ispresent the electron density is rather low. If the particles are grown to a certain size theplasma is not capable to compensate for gravity anymore and the particles are removed
3The explanation of the resulting increase in the electron temperature can also be discussed the otherway around: As the collision cross section of electrons and particles decreases with increasing electronenergy mainly the low energetic electrons participate in the charging. Thus only the high energetic electronsremain in the vicinity of the particle.

36 3. Dust Particle Formation
Figure 3.3: Electron density during particle formation in an Ar/C2H2 mixture. The green linemarks the time the acetylene is added to the plasma resulting in immediate particle formation.The particle presence is seen both by the change in the absorbency of the plasma (red) and thedrop in the electron density (black). Fourier transform infrared spectroscopy (FITR) is a verycommon method to observe particle formation. If the red curve increases the particles increasein size. As soon as it drops the particles have reached a critical size and are removed from theactive volume, [116].
from the discharge. Once this happens the electron density increases, accompanied by anew generation of particles.
While new molecules are formed the initial ones are transformed. Thus, during theprocess of nucleation the precursor gas is depleted. Furthermore, the carrier gas is affectedby the growth. In RF discharges an influence on atomic lines at the example of the Balmeralpha line of Hydrogen has been observed [55].
3.4 Influence on the Growth
As mentioned above particle growth can be triggered in many different environments. Ifportions of a highly electronegative gas such as oxygen are introduced into the plasma theparticle formation can be inhibited. This is very useful for instance to clean the plasmachamber after having performed experiments. However the reactions of the particles andfilms consisting mainly of carbon or other inflammable components with the introducedoxygen may lead to undesired side effects.
Most of the experiments are performed by using noble gases as carrier gas. Due to thefull outer shell the ionization energies of these are rather high. The growth characteristicsdiffer depending on the carrier gas. For instance no periodicity in the growth has beenobserved if a He/C2H2 mixture is employed rather than a Ar/C2H2 mixture. A differencebetween the first and every further cycle has been observed in every gas composition. Thisis mainly due to the initial precursor gas (e.g. acetylene, methane, or silane) concentration.If the same precursor gas is introduced heavier molecules are found to be formed in argon-based mixtures than in helium-based ones. This combined with the observation of higher

3.5 Summary 37
amount of carbon double bonds in helium-based mixtures is the reason for the absence offurther generations [116]. If no noble gas but for instance nitrogen is employed as carriergas much faster growth has been observed. This is due to the difference in the ionizationenergy and might also indicate an alternate way of polymerization [116]. The observation ofgrowth in nitrogen-based mixtures is of high interest since it also resembles the atmosphereof Titan [89].
In addition to the gas composition the temperature of the surrounding walls and therebythe neutral gas temperature can be changed. Changes in the neutral gas temperature canaccelerate or inhibit the growth as it has been shown by refs. [17, 62]. Furthermore, alsothe structure and polymerization of the particles can be influenced by the temperature[201].
As mentioned above the surface structure can be influenced by the choice of the initialgas, see e.g. figure 2.1. Changing the surface structure can influence particle propertiessuch as charging and interaction. Thus, the electrical as well as optical and mechanicalparticle properties can be manipulated by tuning the gas composition and the plasmaparameters [28].
Several studies on the chemical properties of the particles indicate that the molecularstructure is another property that can be addressed by the plasma parameters [116]. Forexample several experiments are conducted trying to grow diamond like structures andfilms from carbon based portions in the plasma [10, 12, 37, 90, 219].
3.5 Summary
Particle growth experiments have successfully been conducted in several different plasmaenvironments. The formation process can be divided into three steps: nucleation, coagu-lation, and accretion. During the first stage proto-particles of several nanometer diameterare formed by ionization and polymerization. These proto-particles cluster due to colli-sions in the second step. They reach sizes of several tens of nanometers and carry mainlynegative charges. Finally the particles acquire further molecules and positive ions fromthe plasma. Thereby sizes of up to several micrometers in diameter can be established.Even though the general process is independent of the origin of the initial molecules, theparticle properties can be manipulated by plasma parameters such as power, pressure, andgas composition.
3.6 Resume
Des experiences de croissance de particules ont ete menees avec succes dans differentsenvironnements plasmas. Le mecanisme de leur croissance s’effectue en trois phases: lanucleation, l’agglomeration et l’accretion. Dans la premiere phase, des particules primairesde quelques nanometres de diametre se forment grce a la dissociation et la polymerisation.Ces dernieres s’agglomerent par collisions durant la second phase pour atteindre une taille

38 3. Dust Particle Formation
moyenne de quelques dizaines de nanometres et une charge electrique negative qui aug-mente avec leur taille. Puis, durant la troisieme phase, elles continuent de grossir pardept moleculaire et d’ions arrivant a leur surface. Ainsi leur taille moyenne peut attein-dre quelques micrometres dans certaines conditions. Bien que le mecanisme general soitindependant de la nature de la molecule du precurseur, les proprietes des particules formeespeuvent etre modulees en faisant varier la composition chimique des gaz, la pression et lapuissance electrique injectee.
3.7 Zusammenfassung
Wachstumsexperimente wurden erfolgreich in verschiedenen Plasmen durchgefuhrt. DerProzess kann in drei Stufen unterteilt werden: Nukleation, Koagulation und Akkretion. Inder ersten Stufe werden Proto-Teilchen mit mehreren nanometern Durchmesser durch Ion-isation und Polymerisation gebildet. Durch Stoße werden aus diesen Proto-Teilchen in derzweiten Stufe hauptsachlich negativ geladene Teilchen. Zuletzt wachsen diese Teilchen inder dritten Stufe durch Anlagerung weiterer Radikale und Ionen. Dadurch konnen Teilchenmit einem Durchmesser von mehreren Mikrometern entstehen. Obwohl der Wachstum-sprozess unabhangig von den usprunglichen Bedingungen ist, konnen die Teilcheneigen-schaften durch die Plasmaparameter wie Druck, Leistung und Neutralgaskomposition bee-influsst werden.

Chapter 4
Particle Formation in a DC Discharge
4.1 Previous Experiments
As discussed in the previous chapter growth can be triggered in various environments. Tostart formation a sufficient amount of certain molecules and ions are necessary. In thischapter the focus will be on particle formation in direct current (DC) discharges. Thesediffer from RF discharges in some major respects as it has been discussed in chapter 1.The ion bombardment on the surfaces in DC discharges is not as intense as in RF dis-charges. This leads to a situation in which initial production of active molecules and theirconfinement at some place inside the discharge are not obvious.
If however carbon covered electrodes are employed the flux towards the electrode ishigh enough to trigger particle formation as demonstrated by C. Arnas et al. [8, 26, 144,145, 146]. They reported on mono disperse particles with diameters of several hundrednanometers after exposure times of about 30 minutes. More common is to employ additivesof carbon rich gases such as methane [163, 194] and acetylene [154]. In case of employing amixture of 2 percent methane in argon nanometer sized particles up to 1000 nm diameterduring an exposure time of several hours were reported [163].
The experiments by S. Mitic et al. [154] demonstrated the investigation of particleformation in the RF field of PK-4 using a premixed gas of argon and acetylene (4 percent)by means of Mie scattering1. In these experiments at low pressures and low flow ratesparticle sizes of several hundred nanometers have been accomplished.
In terms of this thesis the growth in PK-4 using acetylene and the influence of theneutral gas flow will be discussed. The results of these investigations are discussed in thefollowing sections. Some of the results that will be discussed here have previously beenpublished, [MY1].
1Mie scattering describes the angular dependent light scattering with wavelengths comparable to theobjects radius, [147].

40 4. Particle Formation in a DC Discharge
Figure 4.1: A sketch (a) and a picture (b) of the PK-4 setup as mounted at GREMI in Orleans.
4.2 Experimental Setup
The ’Plasma Kristall 4’ (PK-4, [69]) experiment is the successor of PK-3 Plus [206] de-scribed in chapter 5. As such PK-4 will follow PK-3 Plus in operation on board theInternational Space Station (ISS) and allow experiments under micro gravity conditions.
PK-4 is a glass cylinder of 3 cm diameter and an overall length of about 71 cm. Inorder to save space it is bend into an u-shape. The sidearms have a length of 13 cm,the long central part has an overall length of 45 cm. At both ends hollow electrodes aremounted. Inside the electrodes small grids are installed. These grids prevent the plasmafrom penetrating into the gas line out of the observed volume. The grids are placed closeenough to each other preventing a plasma to be ignited in between. Thus the distanceis chosen according to the I-U characteristics which can be calculated by the so-calledPaschen-curve [128].
One of the electrodes is grounded (’passive electrode’) at all times whereas a constantcurrent between +3 mA and -3 mA is applied to the other (’active electrode’). The maximalvoltage reached is plus or minus 3 kV respectively. The current is set whereas the voltagearranges itself depending on the resistivity of the plasma. The gas is fed into the chamberthrough the active (powered) electrode and pumped out through the passive (grounded)electrode. A constant gas flow of up to 10 sccm2 is possible. The pressures establishedduring the experiments presented in this work range from 20 Pa to 150 Pa. Due to thehollow cathode design and the more fluid like behavior of the introduced particles3 intoPK-4 the growth in the DC field is triggered by using a premixed gas of argon and 2 %acetylene. In addition to the DC current an inductively coupled RF field can be appliedby a coil wrapped around the cylinder. A sketch and a picture of the setup as used in
2Standard cubic centimeter per minute is a unit of flux. However, it does not give an estimate of theactual gas velocity which depends also on the tubes diameter, pressure, and the installed pump. The pumpinstalled in Orleans is able to establish pressures of 20 Pa even at 10 sccm neutral gas flow, whereas thepump in Munich is not.
3For further experiments in PK-4 please see e.g. ref. [203]

4.3 Results 41
Figure 4.2: Growth as observed by a CCD camera. The particles emerge (a) from the anode(left hand side of the pictures) and move along the tube(b)-(e).
Orleans can be seen in figure 4.1.
During the preparation of this thesis particle growth in the pure DC field has beenobserved. The grown particles were illuminated by a laser (405 nm). The scattered laserlight and the plasma glow has been recorded by a spectrometer and a CCD camera. Inaddition silicon wafers were introduced into the chamber to collect particles. The wafersare placed on the bottom of the glass tube and do not influence the plasma nor the particlegrowth. Particles re collected at three different positions: close to the active electrode, closeto the passive electrode and in the central region of the tube. For the following discussionsonly the results gained from the wafer placed close to the anode are of interest. Thecollected particles are then investigated by means of a scanning electron microscope (SEM).As it will be discussed later the particles are kept in a sensitive equilibrium between theelectric field and the neutral gas drag. If either one is removed the particles are transportedalong the other.
4.3 Results
4.3.1 Observation
The electron temperature and density are influenced by the formation of particles. Anincrease in electron temperature results in an increased intensity of the plasma emission.In figure 4.2 the change in the emission in the vicinity of the moving particle cloud isdemonstrated. The particles are illuminated by a laser at 406 nm in the center region ofthe tube. If particles are present the laser light is scattered from the particles leading to aregion of increased brightness in the center of the cloud. Note, that the particles are notilluminated by a laser sheet but only by a laser beam.
Another effect shown in figure 4.2 is the observed transport of particles along the tubeafter having reached a critical size. Note, that the particles move together in ’dust bullets’.This is an indicator for inter particle interactions, confinement of the cloud in itself, andmono disperse size distribution amongst the formed particles. It can be assumed that theparticles keep growing while being transported along the tube. It is therefore preferableto collect particles not after the same time for the different settings discussed but at thesame distance to the place of formation.

42 4. Particle Formation in a DC Discharge
4.3.2 Particle Transport
The particle formation and transport can be manipulated by changing the neutral gas flow.If no flow is applied no particle growth has been observed. It seems that in this case theamount of acetylene is not sufficient to form particles that can be seen by the availablemeans.
In case of low flow rates the particles grow in front of the active electrode (anode) andgain size without being swept along the tube. The neutral gas drag at these flow rates isnot strong enough to overcome the electric field. Thus the particle radii increase linear insize as it is displayed in figure 4.7(a). Since in this regime no transport is observed it isgoing to be referred to as the ’static case’ throughout this chapter.
If increasing the flow the system passes into a regime of periodical behavior. In thiscase the formed particles are kept in balance between the electric field and the neutral gasdrag and are transported along the tube if their size becomes too big to be captured in theequilibrium. Since the particle charge, and thereby the impact of an electric field, scaleswith the radius whereas the cross section of the neutral gas drag scales with the radiussquared, the particles are transported along the neutral gas drag once they reach what iscalled a ’critical size’. After the particles left the vicinity of the active electrode the nextgeneration starts growing there. This regime, in which particles grow, reach a critical sizeand are transported away is called ’periodic case’.
In between these two cases a transition occurs. In this transitional regime severalgrowth cycles were observed before the growth stops. This is due to an insufficient amountof acetylene fed into the tube but a rather high flow. If switching on the discharge theinitial acetylene amount in the chamber is high enough to trigger several growth cycles.But it is not enough acetylene delivered to the chamber to establish periodic growth. Thus,particle formation in this regime is neither static nor periodic.
At low flow rates possible turbulent flows and the confinement introduced by the glasswalls may slow down the transport. This effect may also be responsible when it comes tothe transition region in which some growth cycles have been observed before the amountof acetylene delivered to the chamber is too low to enhance further particle formation.
An example for each of the three cases is shown in figure 4.3. In all three plots the timeevolution of the same three lines as observed by a spectrometer are shown: red (751 nm -plasma emission line), green (811 nm - plasma emission line), and blue (405 nm - scatteredlaser light). On the y-axis the measured intensity in arbitrary units is shown. Note, thatwhile the y-axis is chosen to be the same, the time scales and the plasma on and off timesare different in all three plots. In panel (a) the behavior at 2 sccm is displayed. After theinitial growth the plasma emission and the scattered laser light stay constant over time.Panel (c) shows the periodic behavior as observed at 6 sccm neutral gas drag. In betweenthe two the transitional case at 5 sccm is displayed. Several cycles occur before the growthstops and no further particle formation is observed.
The difference in the first peak observed in all cases is a very well known phenomenaand is due to the higher initial amount of acetylene than provided during the later stagesof the experiments [116].

4.3 Results 43
Figure 4.3: Three different behaviors of dust particle growth depending on the neutral gas flow.The particle presence is indicated by an increase in the scattered laser light (405 nm, blue line).It is set into relation to the emission intensity of two significant Argon lines (751 nm, red and811 nm, green). (a) shows the static behavior at 2 sccm. (b) shows the transition stage at 5 sccm.(c) shows the periodic regime at a flow of 6 sccm. Please note that the switching on and off timesare different at all four graphs shown here.

44 4. Particle Formation in a DC Discharge
Figure 4.4: Growth cycle appearance frequency versus the neutral gas flow for three differentpressures: 60 Pa (red), 80 Pa (green), and 100 Pa (blue) (a). The distribution of the scatteredlaser light intensity as a function of the applied neutral gas flow for four different pressures: 40 Pa(yellow), 60 Pa (red), 80 Pa (green), and 100 Pa (blue) (b).
To further illustrate this transition figure 4.4(a) shows the frequency of the growthcycles and is thereby also a measure of the growth rate. In this figure the frequencies asdeduced from plots similar to those in figure 4.3(c) are shown for three different pressures.As the penetration depth of the inflowing gas increases with decreasing flow the transportvelocity and thereby the frequency increases, too. Nevertheless, the critical flow, describingthe flow at which the periodical behavior starts, is the same for all three pressures.
Even though some cycles appear at 5 sccm it is considered to have no frequency in thesense that the growth is not endlessly repeating itself. According to this argument all themeasurements at lower flow rates are assumed to have zero growth frequency.
The higher the pressure the lower is the growth frequency. This is caused by the higherresidence time and the increased neutral gas friction at higher pressures.
As it has been shown in figure 4.3 the intensity of the scattered light changes if the flowincreases. It includes information about size, density and refractive indexes of the formedparticles. The scattering cross section is proportional to the particle radius to the powerof six [116]. To illustrate the change in the intensity figure 4.4(b) displays the distributionfor all flow rates.
Starting from 1 sccm the intensity of the scattered laser light rises until the saturation ofthe spectrometer is reached before the periodic behavior starts at 5 sccm and the intensitydecreases. It can be assumed that the particle size, being proportional to the scatteredlight intensity, first increases in the static case. As the spectrometer goes into saturationthe information on further growth is lost. However, the particle size keeps increasing aslong as the neutral gas flow stays below the critical flux. If the neutral gas flow exceeds thecritical flow the particle size decreases. The higher neutral gas drag removes the particlesat an earlier stage from the confinement in front of the active electrode. This is accountedfor by the decrease of the scattered laser light intensity in figure 4.4(b). Again it canbe seen that the situation depends on the pressure as well as on the gas flux. From the
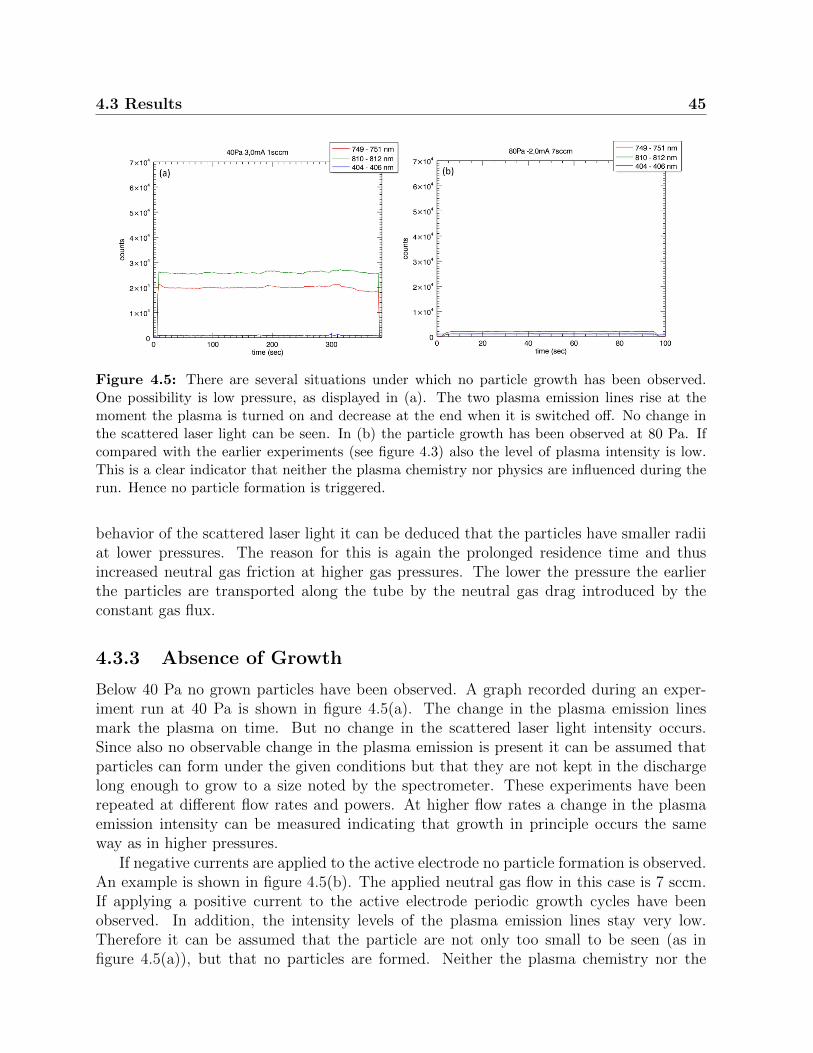
4.3 Results 45
Figure 4.5: There are several situations under which no particle growth has been observed.One possibility is low pressure, as displayed in (a). The two plasma emission lines rise at themoment the plasma is turned on and decrease at the end when it is switched off. No change inthe scattered laser light can be seen. In (b) the particle growth has been observed at 80 Pa. Ifcompared with the earlier experiments (see figure 4.3) also the level of plasma intensity is low.This is a clear indicator that neither the plasma chemistry nor physics are influenced during therun. Hence no particle formation is triggered.
behavior of the scattered laser light it can be deduced that the particles have smaller radiiat lower pressures. The reason for this is again the prolonged residence time and thusincreased neutral gas friction at higher gas pressures. The lower the pressure the earlierthe particles are transported along the tube by the neutral gas drag introduced by theconstant gas flux.
4.3.3 Absence of Growth
Below 40 Pa no grown particles have been observed. A graph recorded during an exper-iment run at 40 Pa is shown in figure 4.5(a). The change in the plasma emission linesmark the plasma on time. But no change in the scattered laser light intensity occurs.Since also no observable change in the plasma emission is present it can be assumed thatparticles can form under the given conditions but that they are not kept in the dischargelong enough to grow to a size noted by the spectrometer. These experiments have beenrepeated at different flow rates and powers. At higher flow rates a change in the plasmaemission intensity can be measured indicating that growth in principle occurs the sameway as in higher pressures.
If negative currents are applied to the active electrode no particle formation is observed.An example is shown in figure 4.5(b). The applied neutral gas flow in this case is 7 sccm.If applying a positive current to the active electrode periodic growth cycles have beenobserved. In addition, the intensity levels of the plasma emission lines stay very low.Therefore it can be assumed that the particle are not only too small to be seen (as infigure 4.5(a)), but that no particles are formed. Neither the plasma chemistry nor the

46 4. Particle Formation in a DC Discharge
Figure 4.6: Two pictures taken by means of a scanning electron microscope (SEM). (a) is asingle particle as grown at 80 Pa, 1 sccm, and 3 mA. Picture (b) demonstrates the mono dispersegrowth observed.
plasma physics are changed during the run, rendering the presence of dust very unlikely.This can be explained by the force balance. In case of a negatively biased active
electrode the electric field and the neutral drag force point along the same direction. Henceno place of trapping can be established. The molecules are not trapped and cannot formany protoparticles, the growth process cannot start.
Furthermore the trapping of molecules at the initial place of formation can be under-stood based on the lack of changes in the plasma emission, as displayed in figure 4.5. Asshown in figure 1.1 a negative potential builds up in front of the anode. In this region theion bombardment is higher than in any other region. Thus the acetylene molecules can bedissociated and kept there. If the pressure is too low too few and too small protoparticlesare formed before being swept away. Thus the particles cannot be detected and no changein the scattered light intensity is observed. If negative currents are applied the moleculesare not kept to be destroyed. Thus the plasma chemistry and therefore the emission doesnot change. Due to this argument it can be assumed that the particle growth starts infront of the powered electrode in case it is positively biased.
4.3.4 Scanning Electron Microscope Results
To follow on the periodic behavior as seen in figure 4.3 particle sizes at different flow rateswere measured by means of a scanning electron microscope (SEM). Particles were collectedon silicon wafers introduced into the glass tube. An example of collected particles can beseen in figure 4.6. The particle size distribution is mono disperse. A particle diameter ofroughly 400 nm has been observed after running a plasma at 1 sccm, 80 Pa, and 3 mA.The exposure time in this case was 1 min. The cauliflower like surface structure resemblesthe commonly known structure of particles formed in carbon rich environments [116].

4.3 Results 47
Figure 4.7: Dependence of the size on plasma run time (a) and neutral gas flow (b) as deducedfrom pictures made by means of a SEM. As suspected in figure 4.4 the particle radius decreaseswith increasing flow. The measurements were performed at 80 Pa, 1 sccm, and 3 mA. Accordingto this picture a linear particle growth can be assumed.
Using this method the dependence of the particle size is demonstrated versus the flowin figure 4.7(b). As suspected from figure 4.4 the particle size decreases with increasingflow.
The main problem with this collection technique is due to the experimental procedure.A constant gas flow is kept throughout the whole experiment since no growth was observedwithout a constant flow of acetylene. This leads to a sensitive equilibrium between theelectric field and the neutral gas drag in which the particles are kept. If removing eitherone the particles are transported along the other. Hence the particles falling onto the wafersmight not be the biggest ones in the cloud. But the mono disperse size distribution whichcan be seen in figure 4.6(b) indicates that the results gained from the SEM measurementsare reliable.
Figure 4.7(a) shows the growth of particles for different plasma run times. In differenceto the critical size demonstrated in figure 4.7(b) the flow was kept at 1 sccm during theseexperiments to demonstrate the increase in size in the static case. It can be seen thatthe growth is linear. As mentioned before a linear particle growth can be assumed to bemainly due to radicals in the accretion phase [19, 28].
4.3.5 Transportation Time
If measured at different positions in the tube a delay in the transport can be seen. This isillustrated for the first cycle in figure 4.8. The characteristic argon emission lines appearin both figures ((a): close to the anode and (b): close to the cathode) in the moment theplasma is switched on. But it can be seen that the arrival of the first particle cloud isdelayed in 4.8(b) with respect to 4.8(a). This clearly shows that the formation of particlesstarts close to the anode from where the particles are transported along the tube. In

48 4. Particle Formation in a DC Discharge
Figure 4.8: Two graphs displaying the data taken close to the anode (a) and close to the cathode(b). It can be seen that the appearance of the growth in (b) is delayed with respect to the plasmaon time if compared to the behavior in (a). Please note that the zero line in (b) is no physicaleffect but caused by reflections of the laser at the electrode. In addition the time scales are notthe same for the two graphs.
addition, the clearly pronounced cycles close to the anode merge into a more homogeneouscloud close to the cathode. This can be interpreted as a hint on the non-uniform transportalong the tube. Especially if passing around the corners the cloud almost stops beforebeing ’caught’ by the next cycle.
4.3.6 Plasma Instabilities
As mentioned above the plasma changes when particles appear. In addition to the changein the electron temperature plasma instabilities comparable to the known phenomena ofstriations occur [64, 96, 100, 165, 180, 187]. The distribution of plasma emission intensityis not homogeneous in the vicinity of particles anymore but shows strong oscillations alongthe vertical and horizontal axis. Pictures of such phenomena are displayed in figure 4.9.
Panel (b) shows the striations that occur close to the grounded electrode. The samepicture is shown in panel (a) with inverted colors and red circles to enhance the striations.An increased intensity in the center of the striations can be seen. This is due to particleskept in the striations where the confinement is enhanced [100].
Panel (c) shows a filamentation of the plasma. It is due to the increased particle density.As mentioned above the electron density increases if particles are confined in the plasma.If a situation is reached in which the particle density is so high the plasma cannot besustained anymore first filamentations as displayed here occur before the plasma breaksdown.
Further instabilities such as plasma contraction precede the filamentation. The phe-nomenon looks very similar to what has been observed by Mikikian et al. [150] in RFdischarges. In his experiments the void in the center of the cloud contracts. This is ac-companied by a change in the plasma emission. Due to the repetitive character of the in-

4.4 Possible further Experiments 49
Figure 4.9: Instabilities as they occur in the vicinity of grown particles. (a) and (b): Striationsclose to the passive electrode. The picture (b) is shown again with inverted colors and redcircles enhancing the striations in (a). (c) Plasma filamentation previous to the breakdown of thedischarge. Note, that only in (a) and (b) the scattered laser light can be seen, while in (c) a filteris employed to show the plasma glow only.
stabilities observed they are called heartbeat instabilities. The decreasing electron densityleads first to strong instabilities (as contractions and filamentations) before the dischargebreaks down.
4.4 Possible further Experiments
As demonstrated by M. Mikikian et al. [148] growing particles under micro gravity con-ditions differ from experiments performed in ground based setups. Hence growth in thePK-4 setup in micro gravity will certainly be one of the future topics. The main problemthen occurs due to the regulations on board of airplanes and the ISS. The inflammable gasused in the experiments described above is usually forbidden. Hence the growth has tobe triggered from existing material. Unfortunately this has not yet worked out in groundbased experiments. Thus a lot of time has to be invested into understanding the dustformation in PK-4. The knowledge gained in the process can then also be used to improvethe cleaning process important for long time operation of the tube. It is crucial to be ableto clean the tube without having to open it if several years of experimentation on boardof the ISS are discussed.
The experiments performed with 2.2 percent of acetylene in argon showed a certaincritical size at which the particles are swept away. The extension to these are experimentswith a higher percentage of acetylene which should increase the growth rate. The flowat which the critical size is reached should be lowered and the frequency of periodicity

50 4. Particle Formation in a DC Discharge
increased.Next to acetylene experiments in methane are being discussed. The initial growth differs
strongly for the two gases as it has been previously been reported on by J. Berndt et al. [20].Establishing growth from methane in PK-4 turned out to be almost impossible. Only if anadditional RF discharge is ignited growth from methane can be observed. The observedparticles are much smaller than the ones observed in acetylene. And the distribution alongthe chamber differs, too. While particles in acetylene grow very fast filling the wholeplasma, those growing in methane are divided by the streaming gas. At the borders of thisformed channel turbulent and laminar flow phenomena can be observed. As however atthis stage the quality of the data is insufficient further experiments are necessary beforeclear statements can be made.
The investigation of the film formation on the glass surfaces is another topic worthstudying. So far a film has only been observed at high flow rates. The chemical andphysical properties of this film as well as the formation rate and the destruction are veryinteresting. Not only can these experiments reveal the fundamental processes but theymay also help in reducing film production in other environments.
As described above a transition from the static to periodic behavior occurred. Thereason for the growth to stop after a few cycles is not yet understood and will certainly besubject to further studies in PK-4.
As mentioned above not only the chemical properties of the plasma but also the electri-cal properties change. Direct measurements of the electron density and temperature willhave to be performed in order to gain a complete picture of the growth in this particularenvironment.
Changing the chemical properties also changes the resistivity of the plasma. Investiga-tions of the voltage characteristics will therefore give an additional insight on the chemicalgrowth processes.
Since the particle formation can be influenced by changing the gas temperature a para-metric study in dependence on the gas temperature will be a future research topic.
In figure 2.3 a Melamine Formaldehyde (MF) particle is shown which was in the plasmaduring the growth process. The surface is strongly deformed. Parts of the particle havebeen etched, and particles have been grown on the surface. The properties and physicalprocesses leading to this particular surface growth will surely trigger further investigations.
4.5 Summary
The experiments conducted on particle formation in a continuous discharge revealed astrong dependence of size and growth frequency on the neutral gas flux, the neutral gaspressure, and the applied power. If a certain ’critical’ gas flow is applied the formedparticles leave the initial place of formation and are transported along the tube. Abovethis critical flow a periodic growth has been found. Along with the increasing growthfrequency and transport velocity the particle size decreases. Below the critical flow theparticles grow in front of the electrode without being removed. In between this static and

4.6 Resume 51
the periodic regime a transitional regime occurs at which the particles are removed fromthe original place of formation but no periodicity has been found.
4.6 Resume
Les travaux experimentaux realises sur la formation de particules, dans une decharge con-tinue, ont revele une forte dependance de la taille et de la frequence de formation de lavitesse du flux de gaz neutre, de la pression et de la puissance appliquee. Au dela d’unevaleur critique du flux de gaz, les particules formees quittent la zone initiale de leur crois-sance et sont transportees le long du tube a decharge. Pour des valeurs du flux superieursa la valeur critique la formation devient cyclique. Avec l’augmentation de la frequence deformation et la vitesse de transport la taille des particules diminue. En dessous de la valeurcritique, les particules restent piegees et localisees dans la zone de leur formation. Entreces deux situations extremes, il existe un regime dans lequel les particules sont liberees dela zone de formation mais sans qu’aucune periodicite ne soit observee
4.7 Zusammenfassung
Die Experimente zum Teilchenwachstum in einer DC Entladung zeigten eine starke Abhang-igkeit der Teilchengroße und der Wachstumsfrequenz von dem angelegten Neutralgasfluss,dem Druck und der angelegten Spannung. Sobald ein ”kritischer” Fluss uberstiegen ist,werden die Teilchen von dem ursprunglichen Wachstumsort weggeschwemmt und entlangder Rohre transportiert. Oberhald des kritischen Flusses wird periodisches Wachstumbeobachtet. Mit zunehmendem Fluss nimmt die Transportgeschwindigkeit entlag der Rohrezu und die Teilchengroße ab. Unterhalb des kritischen Flusses verweilen die Teilchen vor derElektrode. Zwischen diesem statischen und dem periodischen Verhalten wurden Teilchengeformt und weggeschwemmt, aber keine Periodizitat trat auf.

52 4. Particle Formation in a DC Discharge

Chapter 5
Decharging
5.1 Previous Experiments
The particle charge is one of the most important parameters in complex plasmas. Earlierexperiments investigated the charge in the plasma by various methods [18, 41, 65, 67,101, 112, 93, 220]. In this chapter the charge reduction in the plasma after glow will bediscussed.
Particles injected into a plasma charge up negatively (see e.g. chapter 2). Once theplasma is switched off, and no energy is delivered anymore to the gas, the ions and electronsdiffuse towards the confining walls [174] and recombine on the surface of the introducedparticles [137, 207]. As a consequence the levitated dust particles loose their charge. Theyare decharged.
From earlier discussions by Ivlev et al. [94] it is known that for micrometer sizedparticles in a millibar plasma afterglow are expected to carry charges of about 10−2 z0,with z0 being their equilibrium charge in the plasma. However, if the plasma loss timescale is of the order of the charge fluctuations the charge can be frozen at values closer tothe initial one.
As mentioned above the plasma is lost due to surface recombination and ambipolardiffusion to the walls. Thus, the time scales for ion and electron diffusion, relaxation,surface recombination, and attachment determine the remaining charge. Ions are mainlylost due to attachment to the negatively charged particles (in the order of 10 µs) whileelectrons are mainly lost due to diffusion (in the order of 0.1 µs) [73].
Unpublished 1D numerical simulations by Girshik et al. [73] show that the averagecharge of particles grown from silane (assumed diameter: 70 nm) in the plasma afterglowis +0.008 e1 per particle. They found that 100 ms after switching off the discharge onlyabout 21 % of the particles are neutral, whereas the rest carries positive and negativecharges.
Particle decharging has been investigated in experiments on ground using grown parti-cles [47, 48] and under micro gravity conditions on board the ISS [94]. In their experiments
1e in this case is the absolute value of the electron charge; e = 1.602 · 10−19 C [200].

54 5. Decharging
Figure 5.1: Sketch of the PK-3 plus chamber taken from [206]. One sketch shows the dimensionsin 2D, whereas the second sketch is a 3D scheme of the setup.
they report on charges in the order of -20 e (for the smaller grown particles) and -150 e(in case of introduced particles) per particle. The difference between the observed chargesand the predicted ones by Girshik et al. are mainly due to the particle sizes. The particlecharges are expected to be distributed around zero, but the individual values depend onthe particle size.
5.2 Experimental Setup
Experiments on the distribution of particle charges in the afterglow were investigated onboard of the ISS (International Space Station) in a variety of plasma parameters. Theexperiments were conducted in a Plasma Kristall 3 Plus (PK-3 Plus) chamber. A sketchof the experimental setup is shown in figure 5.1.
PK-3 Plus is a capacitively coupled discharge chamber operated in push-pull mode.The diameter of the electrodes is 6 cm and their distance is 3 cm. They are surrounded byan insulated guard ring. In addition to the RF generator, function generators are attachedto the electrodes. Particles of several different sizes can be injected into the chamber. Thegas is not introduced by a constant gas flow but by indirect gas puffs. In order to reducethe disturbance to the system the gas is first introduced into a secondary volume. Fromthere is streams slowly into the chamber.
To the chamber several optical and electrical survey systems are attached. Three cam-eras are recording the reflected light of a red laser. Since they are aligned on one opticaltranslation stage scans through the active volume without having to readjust the camerasare possible. One additional camera is mounted to record the plasma glow.
During operation the chamber heats up due to the heat produced by the installedelectronics. In this process one side heats up stronger than the other. To compensate forthis the other electrode is heated after some time of operation. Throughout the experimentsdescribed here the thermal gradient is therefore of minor importance. However the impactof the gradient will be visible and discussed in the following sections.
The electrical properties and settings are monitored and saved to a log file for later

5.3 Experimental Procedure 55
reference. The synchronization of the recorded pictures and the log files is explained inappendix A. A detailed description of the setup is given in ref. [206].
5.3 Experimental Procedure
In case of the experiments conducted here the pressure was adjusted to 20 Pa and 100 Pa.By the time the pressure is constant the plasma is ignited and the particles are injected.After having been given enough time for relaxation the plasma is switched off. The particlesstay levitated in the central volume of the chamber. Afterwards an ac field with a frequencyof 1 Hz is applied to the system. From the reaction of the particles to this field the residualparticle charge can be deduced.
Since in earlier parabolic flight experiments a dependence of the particle charge on themoment of extinction of the plasma has been observed different switching off conditionswere introduced. The three different conditions are displayed in figure 5.2.
In some cases a constant electric field is applied while the plasma is still in operation.Since this field is employed to remove electrons and ions from the active volume it will becalled ’clearing field’ in the following.
1. No Clearing FieldThe plasma is switched off and followed by the alternating electric field at two dif-ferent strengths. This configuration is displayed in figure 5.2(a)
2. Low Clearing Field (6.67 V/cm)While the plasma is still in operation, a DC electric field is applied. After the plasmais switched off the same alternating electric fields as in condition 1 are applied. Thisconfiguration is displayed in figure 5.2(b)
3. High Clearing Field (13.3 V/cm)The applied electric fields resemble those in condition 2. Only the electric fieldstrength of the DC field is increased. This configuration is displayed in figure 5.2(c)
5.4 Analysis
In reaction to the field the particles perform a sinusoidal motion. The analysis of the motionis performed in four stages before the actual particle charge is calculated. The sinusoidalparticle motion is overlayed by a thermal drift caused by thermal gradients introduced bythe design of the experimental setup4.To correct on the resulting linear upward drift of theparticles a linear fit on the data is performed. The new particle track is then determinedby the original track minus the individual linear drift. The intermediate track position inX and Y before correcting is kept for further display of the data. The linear fit however
4The physical processes, use, advantages and disadvantages of thermal gradients and the thereby in-troduced thermophoretic forces are explained in section 2.3

56 5. Decharging
Figure 5.2: The three different switching off conditions. The voltages applied to the lower(black) and upper (red) electrode3 are displayed. Three different conditions exist: no (a), a low(b), and a high (c) clearing field being applied before the plasma is switched off and the excitationstarts.

5.4 Analysis 57
Figure 5.3: All tracks after correcting on the thermal gradient. The different colors indicatedifferent behaviors of the particles in question. Between the motion of these particles a phaseshift of 180 ◦ occurs. This clearly indicates that negatively as well as positively charged particlesare observed. The amount of particles with opposite charges is approximately equal.
can cause severe problems. Since the particles move inside the cloud they are very likely toleave and reappear in the limited region illuminated by the laser. Hence the particle tracksare not visible at all times. This leads to a possible misfitting due to the starting andending phase of the analyzed track. To correct on this possible misfit, a second functionconsisting of a sinusoidal and a linear part is fitted to the resulting data. Again the trackis corrected by the second linear part. In the first step the linear slope dominates thesinusoidal motion leading to a situation in which the immediate fit with a sinusoidal anda linear part does not work properly.
As a result the reconstructed tracks are a sinusoidal motion around zero. This isdisplayed in figure 5.3. The different colored tracks underline the behavior of the tracks.There are only two kinds of tracks observed which have a phase shift of π between them.This shows the presence of positively and negatively charged particles only.
Now that the motion is purely sinusoidal the particle motion can be treated differently.With time the amplitude of the particle motion declines. This is due to a decline in theparticle charge with time. Neglecting the thermal upward drift the particle motion isdetermined by the electric field Fel, the neutral gas drag Fnd, and the particle inertia Fin.The equation of motion can thus be written as:
Fel − Fnd = Fin (5.1)
With the equations for the forces
Fel = qE(t) = qE0sin(ω0t)
Fnd = mdγnx
Fin = mdx
(5.2)
and the particle trackx(t) = A0sin(ω0t+ φ) (5.3)

58 5. Decharging
Figure 5.4: The result of the fit (red) to the corrected data (black) as given in equation 5.6.
the equations for the charge and the phase shift can be calculated [36]
q =A0ω0md
√ω0 + γn
E0
(5.4)
γn =
(ω0
φ
). (5.5)
In these equations ω0 = 2πf = 2π Hz is the driving frequency, A0 is the amplitude of thetrack, φ is a possible phase shift between the driver and the reaction of the particles, andγn describes the neutral gas damping according to Epstein [60].
The data is then fitted with equation 5.3. In a first step only the amplitude is fitted.This is to make sure that the resulting amplitude has the correct sign.
In the last step the amplitude and the phase shift as well as an additional exponentialdecrease are fitted.
x(t) = A0exp
(− tτ
)sin(ω0t+ φ) (5.6)
During the process of analyzing the data also fits of the frequency were performed. Theserevealed that the given frequency is almost kept by the fit. Hence removing this fit param-eter granted a higher degree of accuracy. The result of the fit according to equation 5.6 isdemonstrated by figure 5.4.
In red the fit to the black track is shown. It can be seen that the fit is very good andthat irregularities occurring in the track5 are corrected by the fit. Hence in the furtherconsiderations only the tracked amplitudes will be taken for calculation.
In principle the fit includes all the favored information:
• the particle charge, depending on the damping and the amplitude,
5Defects or irregularities in the track may be caused by ’pixel locking’ or mistracking during the analysis.Additional effects caused by the reaction of the particle may also disturb the pure sinusoidal motioninteresting in this analysis.

5.5 Results 59
Figure 5.5: Charge distribution in the three switching off conditions displayed in figure 5.2. Inthe upper row the resulting charge distributions and an according Gaussian fit is displayed. Inthe lower row the charge distribution in the X-Y plane is demonstrated.
• the charge decline,
• and the spatial and time resolved damping, depending on the phase shift.
However accessing those informations in a sensible manner the synchronization betweenthe excitation and the video files from which the particle tracks are gained has to bedone properly. A detailed explanation on how the synchronization is performed and whichproblems still exist is given in Appendix A
5.5 Results
The particles exposed to the alternating electric field move in the observed volume. Firstthe case without any clearing field applied will be discussed. The charge distribution for6.8 µm particles at a pressure of 20 Pa is displayed in figure 5.5.
The charges in this case are distributed around +0.3 e per particle. Before switchingoff the particles carry negative charges in the order of several thousand electron chargesper particle. The particle charge distribution in a plasma is Gaussian. After switching offthe plasma the electrons and ions recombine on the surfaces of the particles. As discussedbefore the ions are drifting slower than the electrons. Even if no clearing field is applied theparticles carry slightly more positively charge after switching off the plasma. This happensin dependence on the particle position in the volume.
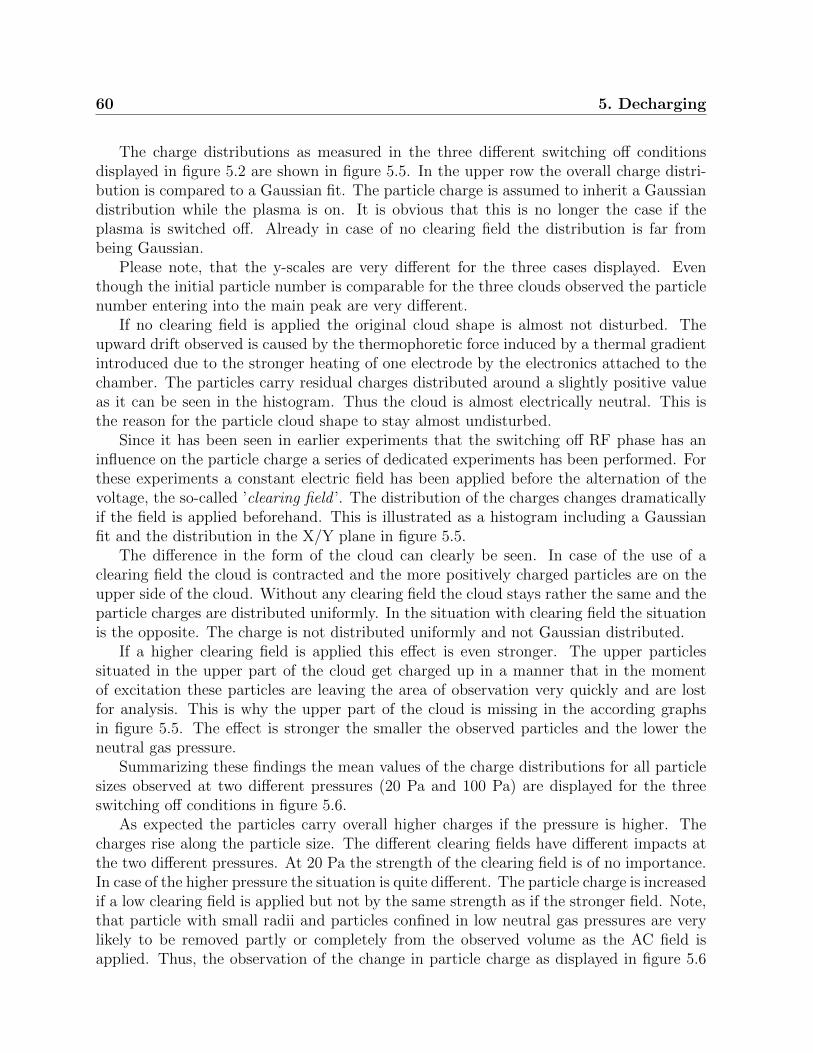
60 5. Decharging
The charge distributions as measured in the three different switching off conditionsdisplayed in figure 5.2 are shown in figure 5.5. In the upper row the overall charge distri-bution is compared to a Gaussian fit. The particle charge is assumed to inherit a Gaussiandistribution while the plasma is on. It is obvious that this is no longer the case if theplasma is switched off. Already in case of no clearing field the distribution is far frombeing Gaussian.
Please note, that the y-scales are very different for the three cases displayed. Eventhough the initial particle number is comparable for the three clouds observed the particlenumber entering into the main peak are very different.
If no clearing field is applied the original cloud shape is almost not disturbed. Theupward drift observed is caused by the thermophoretic force induced by a thermal gradientintroduced due to the stronger heating of one electrode by the electronics attached to thechamber. The particles carry residual charges distributed around a slightly positive valueas it can be seen in the histogram. Thus the cloud is almost electrically neutral. This isthe reason for the particle cloud shape to stay almost undisturbed.
Since it has been seen in earlier experiments that the switching off RF phase has aninfluence on the particle charge a series of dedicated experiments has been performed. Forthese experiments a constant electric field has been applied before the alternation of thevoltage, the so-called ’clearing field ’. The distribution of the charges changes dramaticallyif the field is applied beforehand. This is illustrated as a histogram including a Gaussianfit and the distribution in the X/Y plane in figure 5.5.
The difference in the form of the cloud can clearly be seen. In case of the use of aclearing field the cloud is contracted and the more positively charged particles are on theupper side of the cloud. Without any clearing field the cloud stays rather the same and theparticle charges are distributed uniformly. In the situation with clearing field the situationis the opposite. The charge is not distributed uniformly and not Gaussian distributed.
If a higher clearing field is applied this effect is even stronger. The upper particlessituated in the upper part of the cloud get charged up in a manner that in the momentof excitation these particles are leaving the area of observation very quickly and are lostfor analysis. This is why the upper part of the cloud is missing in the according graphsin figure 5.5. The effect is stronger the smaller the observed particles and the lower theneutral gas pressure.
Summarizing these findings the mean values of the charge distributions for all particlesizes observed at two different pressures (20 Pa and 100 Pa) are displayed for the threeswitching off conditions in figure 5.6.
As expected the particles carry overall higher charges if the pressure is higher. Thecharges rise along the particle size. The different clearing fields have different impacts atthe two different pressures. At 20 Pa the strength of the clearing field is of no importance.In case of the higher pressure the situation is quite different. The particle charge is increasedif a low clearing field is applied but not by the same strength as if the stronger field. Note,that particle with small radii and particles confined in low neutral gas pressures are verylikely to be removed partly or completely from the observed volume as the AC field isapplied. Thus, the observation of the change in particle charge as displayed in figure 5.6

5.6 Possible further Experiments 61
Figure 5.6: Charge distributions for all particle sizes depending on the pressure and switchingoff conditions.
does not show the accurate situation. However, it can be assumed that the trend displayedis correct: If no clearing field is applied the particle charge is distributed around zerowith positive charges being slightly more probable. If a clearing field is applied the chargeincreases. Even though the upper part of the cloud, containing the particles carryinghigher charges, is very likely to be lost in the moment the alternation is applied, theobserved charges are higher than without the clearing field. furthermore, the particles arealmost exclusively positively charged in case a clearing field has been applied prior to theobservation of the particle motion.
In the moment the plasma is turned off the clearing field is still active. Ions, havinglower mobility, traverse the active volume slower than the electrons. While doing so theypass through the whole cloud. Since the upper electrode is negatively biased, see figure 5.2,the ions move upwards. Therefore the upper more particles in the cloud are surroundedby the positively charged ions longer than the lower ones, leading to the more positivelycharged particles on the upper side of the cloud. The fact that the whole cloud is driftingdownwards instead of following the thermophoretic force as discussed before is caused bythe capacitive character of the chamber. The charges introduced during the on-time of theclearing field cannot be removed afterwards. A positive space charge builds up close to theupper electrode due to ions being attracted. The now positively charged particles recognizea repulsive electric force and move downwards. This is the reason for the disturbed cloudshape, as displayed for the low clearing field in figure 5.5, and the non-Gaussian chargedistribution.
5.6 Possible further Experiments
Since the previously discussed PK-4 setup is going to be operated in micro gravity envi-ronments a similar series on the decharging properties in DC discharges might be nice forcomparison. Especially since then the switching off phase will play no role on the devel-

62 5. Decharging
opment of the charges. The experiments could then be compared to the results discussedabove.
Another series with smaller clouds and different additional particles sizes will also beof advantage.
Furthermore the careful analysis of the remaining data has to be done.
5.7 Summary
Particles suspended in a plasma charge up negatively. The series of experiments describedin this chapter are devoted to the duration of decharging in the plasma afterglow. It hasbeen found that this process strongly depends on whether or not a constant field has beenapplied before the measurement was performed. If no field is employed the residual particlecharges are distributed around zero. In case a field is applied, the charge per particle isincreased and mainly positive. If the field is high enough the upper part of the cloud iseven removed due to the high positive charging in the afterglow.
5.8 Resume
Les particules piegees et en levitation dans le plasma sont chargees negativement. Lesexperiences decrites dans ce chapitre ont ete consacrees a la mesure du temps de dechargedes particules dans la phase de post-decharge du plasma. Il a ete demontre que ce parametredepend fortement de l’existence ou non d’un champ electrique constant entre les electrodesdu reacteur avant l’extinction du plasma. En l’absence de champ electrique, la chargeresiduelle des particules est distribuee autour de zero. Par contre en presence de ce champ,cette charge augmente et est principalement positive. Si le champ est assez intense, unepartie du nuage de particules peut etre attire vers l’electrode superieure a cause de cettecharge positive acquise en post-decharge.
5.9 Zusammenfassung
Teilchen in einem Plasma laden sich negativ auf. Die Experimentserie, die in diesem Kapitelbeschrieben wurde, beschaftigt sich mit der Entladung der Teilchen im Nachgluhen. Einestarke Abhangigkeit dieses Prozesses von der Prasenz eines konstanten elektrischen Feldeswurde gezeigt. Falls kein Feld angelegt wurde, sind die Ladungen der Teilchen um Nullherum verteilt. Sobald ein Feld angelegt wurde, steigt die Ladung pro Teilchen stark an.Ist das angelegte Feld stark genug kann die obere Halfte der Teilchenwolke entfernt werden.

Chapter 6
Confined Particle Clusters
As discussed at length in chapter 2 the interaction potential can be influenced by applyingadditional electric fields to the plasma. So far this has only been established along oneaxis leading to electrorheological plasmas [95, 97, 98]. A picture of the occurring phasetransition of these string fluids in PK-3 Plus is displayed in figure 6.1.
It can be seen that, as the AC field increases the internal ordering in the systemincreases. This is caused by the character of the wake field interaction. In colloids thesestring fluids employing electric fields in higher dimensions have been observed [133, 170].As predicted by Brandt et al., [33, 34, 35] particle arrangements in plasmas subjected to 2Drotating electric fields should attract each other due to dipole-dipole interaction betweenneighboring particles and form discrete layers parallel to the rotational plane. The ion fluxin this case is perpendicular to the rotational plane The results of these simulations aredisplayed in figure 6.2.
A rotating electric field perpendicular to the sheath electric field of sufficient strengthresults in time averaged ’donut’-like positive potential around the particle. Upstream anddownstream the particle a time averaged attractive force forms [34]. Thus, once the appliedelectric field is strong enough layers along the ion flow direction are to be expected.
To apply a like-wise electric field configuration additional means have to be introducedinto the plasma. In the following the rotating wall technique first utilized by Nosenko et
Figure 6.1: Phase transition as it occurs for increasing AC fields applied to a particle systemlevitated in PK-3 Plus [95].

64 6. Confined Particle Clusters
Figure 6.2: Layers in electrorheological plasmas as simulated by Brandt, [34]. The strengthof the anisotropic interaction ξ increases from the unordered towards the ordered system. Thedifferent colors indicate the degree of order determined by the number of next neighbors.
al. [166] will be employed. In this case the electric field is applied by placing a glass boxon the electrode. Each plate is covered with Indium Tin Oxide, providing a conductivesurface on the inside of the box. They are insulated from each other allowing any electricfield configuration inside the box.
Particles confined by additional means, such as conductive or non-conductive glassboxes, metallic rings, or holes drilled in the electrode, tend to form vertical strings [91, 110],zig-zag structures [110, 141, 142], 2D planar [166, 188], or 3D spherical clusters [4, 92, 142,118]. Confined particles interact with each other due to the wake field introduced by theions streaming past them. The usual internal structure that is found in such clusters areonion-like shells. The shell structure of a cluster as observed by Arp et al. [4] is displayedin figure 6.3. The particles in an undisturbed cluster tend to form spherical shells. Thus, ifthe radial particle position is plotted against the vertical position, disregarding the angulardistribution, clear half-circles can be seen, figure 6.3(a). In panels (b) and (c) the particlepositions in the bottom view for two different shells are displayed. It can be seen that theparticles inherit a structural ordering on the surface of the shell. This ordering is indicatedby the light gray (hexagons) and the dark gray (pentagons) shaded forms. The regularpattern in the cluster shell surface has been investigated further. It has been found thatthe pattern changes according to the plasma parameters [142] and the particle number [21].Furthermore, competing structures as strings [118, 120], order transitions [16, 131, 21], andphase transitions [138, 189] in clusters have been observed. In addition instabilities as wavephenomena can be observed in confined particle clusters [183].
The electro static confinement provided by a non-conductive glass box has been simu-lated and probed by Arp et al. [5]. In principle the box provides a parabolic potential wellin the center of the box. Figure 6.4(a) shows a superimposition of the simulation of allforces present in the box (gravity, electric field, ion and neutral drag). The potential energyof a sample particle, carrying about 2000 electron charges, is indicated by the contour lines.In figure 6.4(b) the resulting potential well (crosses: data, solid line: fit) inside the boxis displayed. The dimensions of the simulated cluster are indicated by the vertical lines.The solid line shows the expected elongation if pure Coulomb interaction is assumed, thedotted line the one for Yukawa interaction with a Debye length of 0.5 mm. It can be seenthat a cluster is confined in the center of the box. The screened interaction, producing

65
Figure 6.3: Spherical shell structure of a cluster containing 190 particles. (a) Projection ofall particle positions in the rz- plane, disregarding their angular position. Panels (b) and (c)show a bottom view of the cluster for two different shells. The small circles indicate the particlepositions; the cell coloring is according to the number of next neighbors, [4].
reduced repulsion, leads to a more compact cluster.The presence of particles in a plasma decreases the electron density. To sustain the
discharge the electron temperature has to be increased. This results in an increased plasmaemission in the vicinity of the particles [6]. Thus, the number of free charges is reduced.If many particles are introduced the electron flux to each is reduced due to the presenceof the others. This leads to a charge depletion in the plane. In response a particle clusteris reduced in size since the repulsion between the particles is reduced due to the lowerparticle charge.
Along the direction of the streaming ions a wake field is induced downstream the parti-cles. This positive potential reduces the electron flux towards the particle and thereby thecharge [40, 41, 134, 131, 151]. The charge reduction found by Carstensen et al. [40, 41] isin the order of 30 % for single strings composed of two particles.
In addition to the behavior of single particles, particle chains, and stationary clusterstheir motion has been a subject of investigation. Confined clusters show several internalmodes of motion [92]. Especially rotation can be excited externally [38, 112, 166]. Sincethe particles carry negative charges they can be set into motion by additional electric andmagnetic fields. Konopka et al. [112] demonstrated the rotation of confined particle clustersin response to magnetic fields. Another possibility to set a cluster in motion is by excitingthe neutral gas [38, 39]. In this case a rotating electrode was employed. The neutral gasrotating then sets the cluster in motion.
The excitation of 2D layers by rotating electric fields has been shown by Nosenko etal. [166]. In this case an electric field is introduced to the confined particle cloud by using

66 6. Confined Particle Clusters
Figure 6.4: Simulations and measurements on the confinement in a non-conductive glass box.(a) Distribution of all present forces (gravity, electric field, ion and neutral drag) superimposed.The contour lines describe the energy potential to a test particle with q = 2000 e in 10−15 J. (b)Resulting potential well. The crosses show the data points fitted with a parabolic function (solidline). A cluster (200 particles, each with q = 2000 e) suspended in this confinement would havethe extensions given by the solid (pure Coulomb) and the dotted (Yukawa) vertical lines, [5]
a box consisting of four conductive yet transparent plated. Note, that the confinementshown in figure 6.4 is strongly affected in this situation. It further varies depending on thepotential applied to the individual plates. Nosenko et al. reported that the particle clouddoes not always show rotation in direction of the applied field. To describe the situationinside of the box they introduced two main rotation mechanisms: torque due to the iondrag and due to the electric field. The rotation against the direction of the electric fieldis due to an introduced dipole on the cluster in the box, whereas the rotation in directionof the field is explained by the ion drag force. Only if the charging of the cloud by theadditional electric field is asymmetric the dipole can result in a rotation. Depending onthe orientation of the dipole with respect to the electric field the cluster rotates with oragainst the electric field. In order to gain further insight into the asymmetric charging theyprobed the plasma shielding. Therefore a single particle was levitated inside of the box.To one electrode a constant voltage is applied while the others are grounded. They foundthe asymmetric plasma shielding explaining the reversed rotation direction. Experimentsfollowing this procedure will also be discussed throughout the following chapter. Eventhough a lot of effort has been put into these investigations no conclusive results can begiven on the origin of the asymmetry at this point.
Particles confined by additional means tend to form spherical clusters. The excitation ofsuch clusters is predicted to result in layering perpendicular to the applied field. However,the past results mainly demonstrated the rotation induced by magnetic and electric fieldsas well as by rotation of the neutral gas.
Les particules piegees par des moyens additionnels, aux effets du plasma, tendent aformer des clusters spheriques. Il a ete predit que l’excitation de ce type de cluster conduit aun arrangement en couches perpendiculaires a la direction du champ applique. Cependant,les resultats precedents avaient montre l’induction de mouvements de rotation dus a un

67
champ magnetique, un champ electrique et meme a la rotation du gaz neutre.Teilchen, die in einem zusatzlichen Konfinement eingefangen werden neigen dazu spher-
ische Wolken zu formen. Die Anregung solcher Wolken sollte zu der Formation von einzel-nen Schichten fuhren. Fruhere Experimente zeigten aber die Anregung von Rotation durchexterne elektrische oder magnetische Felder sowie durch Anregung des umgebenden Gases.
In the following two chapters the work of Nosenko et al. [166] will be extended. Themain goal of the performed experiments is to tune the interaction potential in a way tointroduce the layer structure predicted by Brandt [34]. Since this requires to apply arotating electric field to the cluster the rotation is the first observation. The results willbe discussed in chapter 7. Please note, that these are published in [MY1]. Afterwardsthe results on smaller clusters investigated by stereoscopic digital in-line holography in acollaboration with the colleagues from Kiel will be discussed. The main results shown hereare to be published [MY3]1.
1Please note that this very paper has been edited while this thesis has been written. Thus, chapter 8and the draft of [MY3] will be very similar or even equal in parts. This is true in some extend also forchapter 4 / ref. [MY2] and chapter 7 / ref. [MY1].

68 6. Confined Particle Clusters
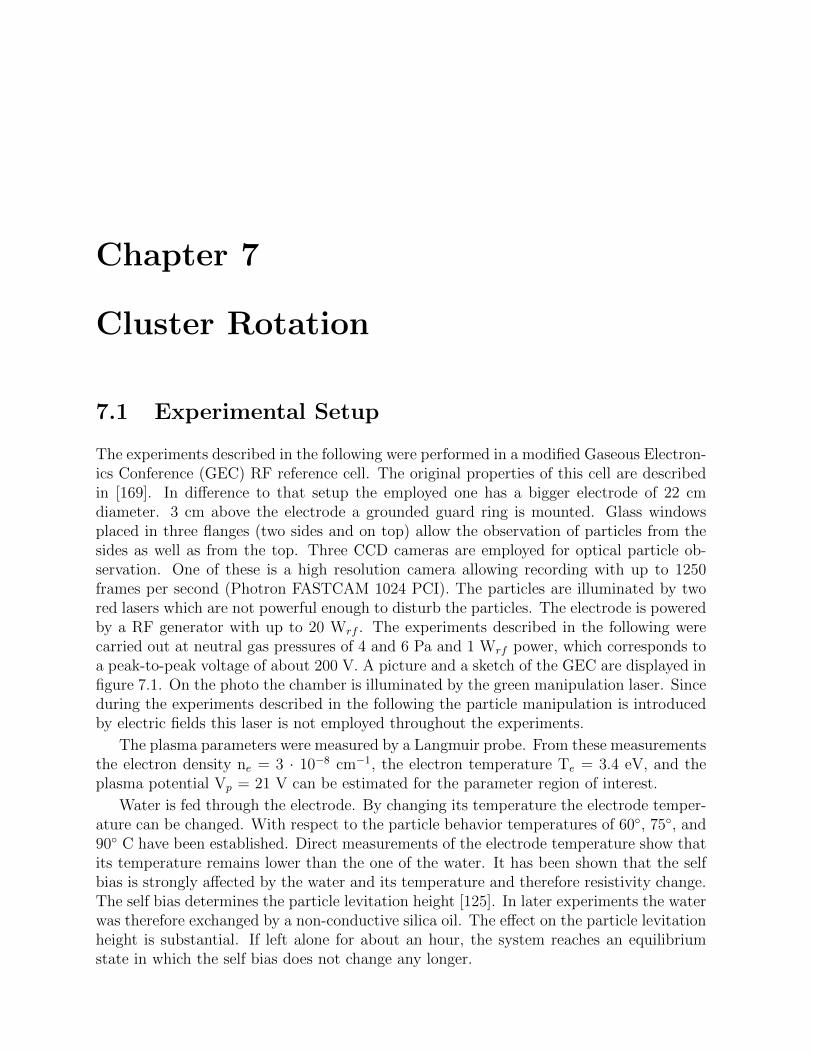
Chapter 7
Cluster Rotation
7.1 Experimental Setup
The experiments described in the following were performed in a modified Gaseous Electron-ics Conference (GEC) RF reference cell. The original properties of this cell are describedin [169]. In difference to that setup the employed one has a bigger electrode of 22 cmdiameter. 3 cm above the electrode a grounded guard ring is mounted. Glass windowsplaced in three flanges (two sides and on top) allow the observation of particles from thesides as well as from the top. Three CCD cameras are employed for optical particle ob-servation. One of these is a high resolution camera allowing recording with up to 1250frames per second (Photron FASTCAM 1024 PCI). The particles are illuminated by twored lasers which are not powerful enough to disturb the particles. The electrode is poweredby a RF generator with up to 20 Wrf . The experiments described in the following werecarried out at neutral gas pressures of 4 and 6 Pa and 1 Wrf power, which corresponds toa peak-to-peak voltage of about 200 V. A picture and a sketch of the GEC are displayed infigure 7.1. On the photo the chamber is illuminated by the green manipulation laser. Sinceduring the experiments described in the following the particle manipulation is introducedby electric fields this laser is not employed throughout the experiments.
The plasma parameters were measured by a Langmuir probe. From these measurementsthe electron density ne = 3 · 10−8 cm−1, the electron temperature Te = 3.4 eV, and theplasma potential Vp = 21 V can be estimated for the parameter region of interest.
Water is fed through the electrode. By changing its temperature the electrode temper-ature can be changed. With respect to the particle behavior temperatures of 60◦, 75◦, and90◦ C have been established. Direct measurements of the electrode temperature show thatits temperature remains lower than the one of the water. It has been shown that the selfbias is strongly affected by the water and its temperature and therefore resistivity change.The self bias determines the particle levitation height [125]. In later experiments the waterwas therefore exchanged by a non-conductive silica oil. The effect on the particle levitationheight is substantial. If left alone for about an hour, the system reaches an equilibriumstate in which the self bias does not change any longer.

70 7. Cluster Rotation
Figure 7.1: Sketch of the GEC setup with the glass box and the illumination system (a), ref.[MY1]. Picture of the chamber illuminated by the strong green laser (b) and the glass boxmounted on the electrode (c). Both pictures are courtesy of V. Nosenko.
On top of the electrode a glass box is placed. A sketch of the setup including the glassbox and the illumination system is displayed in figure 7.1(a). The glass box consists offour ITO (Indium Tin Oxide) covered plates. Each plate is 3 cm long, 2 cm high, and0.1 cm thick. The glass plates are electrically insulated from each other by plastic polesallowing the introduction of an additional electric field. It is mounted in a way that theinside of the box is conductive and can supply any wished electric field configuration. Thepoles are attached to the plates in a way that a gap of about 0.4 cm is kept between thelower edge of the plates and the electrode. Each plate is connected to a function generator.To sustain a rotating electric field a sinusoidal voltage is applied to each plate keeping aconstant phase shift of π/2 between the alternation of two neighboring plates. The platesare powered with a peak-to-peak voltage of Vpp = 20 V at frequencies between 0.1 and1000 kHz. A cluster being introduced into this field can start to rotate. The first time this’rotating wall’ technique has been reported by Nosenko et al. [166]. A picture of the glassbox as mounted in the GEC is shown in figure 7.1(c).
7.2 Observation
The confined cluster consists of about 1500 particles and has a radius of roughly 5 mm. Theintroduced particles are MF micro spheres with a diameter of 8.77 ± 0.14 µm. In response

7.3 Analysis 71
to the temperature gradient applied to the chamber the cluster position and shape changes.The higher the temperature the higher the levitation height of the cluster. Additionallythe initial spherical cluster deforms with increasing temperature and becomes more cigar-like. Images of the cluster at the three temperatures (60◦ C top, 75◦ C center, and 90◦ Cbottom) are displayed in figure 7.2. The vertical position of the illuminated horizontal crosssections (left hand side) are indicated by the arrows in figure 7.7. On the right hand sidethe vertical cross section at each temperature is displayed. The deformation of the clustercan be seen in this projection. Note, that the very same cluster is discussed throughoutthis chapter. It has been shown that this is very important regarding the comparability ofthe results. Even a small variation in particle number can change the cluster [142].
In response to the applied electric field the cluster contracts. The additional confine-ment introduced by the electric field changes the potentials inside the box. The potentialsin a non-conductive box have been discussed by Arp et al. [5]. Their estimation on theparabolic confinement is displayed in figure 6.4.
As demonstrated by Nosenko et al. [166] 2D clusters show rotation in and againstthe direction of the electric field depending on the applied frequency. For the 3D clustersdiscussed in the following rotation has been observed only in direction of the field. Thereaction of the cluster depends on the frequency:
• Low frequency (< ∼ 50 Hz)The cluster shows a sloshing motion inside the glass box following the electric field.
• ∼ 50 Hz - ∼ 500 HzThe cluster remains static in the center of the glass box. No rotation has beenobserved.
• ∼ 500 Hz - ∼ 1 MHzThe cluster remains in the center of the glass box. The rotation shown by the clusterhas always been observed in direction of the field.
• High frequency (> ∼ 1 MHz)The cluster rotation stops. It remains, beside some residual rotation, stationary inthe center of the box.
In this chapter the frequency and height dependence of the rotation will be discussed.Furthermore, the results on plasma shielding and vertical dust resonance frequency will beshown.
7.3 Analysis
In figure 7.3 the analysis of the recorded data is displayed. The distributions of the veloc-ities in x and y are plotted versus the particle position in y and x, respectively. In case ofrigid body rotation the plots would show straight lines. Since real data are regarded herea certain distribution is observed. Since the particle cluster behavior is mainly fluid-like,

72 7. Cluster Rotation
Figure 7.2: A sequence of side (right) and top view (left) images of the cluster as confined inthe box. From top to bottom the temperature increases (60◦ C top, 75◦ C center, and 90◦ Cbottom). In all three cases the same cluster is used. The displayed horizontal cross section ofcluster is illuminated at the equatorial level (marked by the arrows in figure 7.7). Please note thechange of the cluster shape in the side view images, [MY1].

7.4 Results 73
Figure 7.3: The fit (red) of the vx,y vs y, x distribution. The black points are the particlepositions. The picture is taken from ref. [MY1].
the rotation is not completely rigid. Due to the high number of particles in the cluster(≈ 5000) the statistics in the central area is very good. Hence, the linear fit results inthe mean rotation speed of the illuminated layer. For a more detailed description of thismethod please see ref. [228]
The slope of the linear fit is used to calculate the rotation speed. With the 2D obser-vation method only one horizontal layer can be illuminated at a time. For the frequencyscan the equatorial plane is chosen as representative for the cluster rotation. For a chosenfrequency more horizontal slices of the particle cluster are recorded. The rotation speed iscalculated for each slice. By this a height distribution of the rotation speed is gained.
7.4 Results
7.4.1 Frequency Dependence
As discussed above the cluster reaction changes depending on the applied frequency. Atlow excitation frequencies in the order of 10 Hz the cluster follows the excitation and movesaround inside the glass box (’sloshing’ ). If the electric field frequency is too fast for thecluster to be able to follow the motion the rotation stops and the cluster remains staticin the center of the box. Using thermophoretic forces the cluster rotation starts at about500 Hz. The distribution of rotation speed for the three different electrode temperaturesis shown in figure 7.4(a).
The cluster rotates in direction of the field at all times. At about 5 kHz the rotationspeed is maximal. Note, that even the maximal rotation speed is much lower than theexcitation frequency. At higher frequencies the rotation speed declines. Above frequenciesof about 1 MHz the cluster rotation stops almost completely and only a residual rotationremains. The direction of the residual rotation is independent of the direction of rotation ofthe electric field. This residual rotation can be observed at all frequencies. To display thisthe measured rotation speeds are summed up considering clockwise rotation as negative.The result is displayed in figure 7.4(b). This residual rotation is driven by the neutral drag

74 7. Cluster Rotation
Figure 7.4: The rotation of the cluster in response to the applied electric field (a). A residualrotation has been observed. (b) displays the sum of clockwise (cw) and counter clockwise (ccw)rotation speeds. The picture is taken from ref. [MY1].
Figure 7.5: Schematic pictures to illustrate the ion drag force (a) and the electric force (b) as itoccurs in the box. Due to the depletion of Ions by the walls the center-of-mass of the ion cloud isshifted. Following the electric field the Ions set the cluster into rotation in direction of the field.Due to the delayed charging the charge variation on the positive region is more positive than inthe negative region. Hence a dipole moment d almost parallel to the field occurs which causesthe cluster to rotate in direction of the field.
and the magnetic field of the Earth.
The electric field is introduced by four function generators which can provide a maximalpeak-to-peak voltage of 20 V. If the amplitude of the electric field is reduced the clusterrotations slows down until the cluster is completely at rest. The electric field affects notonly the particles but also the plasma. Thus, if the electric field amplitude would be muchhigher, the plasma would be strongly disturbed and the particle cluster would be lost.Even though higher electric field amplitudes would be possible without loosing the clusterthe rotation is clearly pronounced with the accessible means.
7.4.2 Driving Mechanisms
As described by Nosenko et al. [166], the rotation is mainly driven by two different mech-anisms: the ion drag and the electric force.

7.4 Results 75
Figure 7.6: The horizontal (a) and vertical (b) displacement of a single particle as response toa constant electric inside the box. The zero in (a) is set as all four plates are grounded. Thepicture is taken from ref. [MY1].
• Ion Drag ForceIons streaming trough the glass box are affected by the sheath and the applied ro-tating electric field. The depletion of ions close to the glass box walls leads to ahorizontal shift in the ion density. The non-homogeneous ion density distributionleads to an ion drag force which depends on the rotational phase. By this ion dragforce acting on the particles a rotation in direction of the field is induced. Themechanism is demonstrated in figure 7.5(a).
• Electric Field ForceThe electric field rotating with frequencies in the order of several kHz induces a dipolemoment on the particle cloud as indicated in figure 7.5(b). The charging of the cloudis delayed with respect to the electric field frequency. The plasma shielding insidethe box is asymmetric, [166]. This asymmetric shielding leads to an asymmetry inthe charging and thereby to a non-zero torque.To probe the confinement and the electric field penetration inside the box a singleparticle is introduced. Three of the four glass plates are grounded whereas a constantvoltage ranging from -10 V to +10 Vis applied to the last plate. The displacementof this is displayed for the three different temperatures in figure 7.6 for both thehorizontal and the vertical direction. Along the remaining axis no displacement wasobserved. The particle always stayed in the laser illumination sheet. An asymmetryas displayed in figure 7.6(a) leads to a delayed charging of the cluster and a dipolemoment as sketched in figure 7.5(b). The dipole moment is hence induced parallel tothe electric field. Thus the particle rotation caused by the electric field is in directionof the field.
Due to the time of flight of ions in the box the ion torque peaks at about 30 - 60 kHz.As shown in figure 7.4 the observed rotation peaks at 5 kHz. This is the frequency rangeis associated with the charging time. In contrast to the previous experiments by Nosenko

76 7. Cluster Rotation
Figure 7.7: The distribution of rotation speeds along the clusters height for two different clusters.The height distribution of the cluster described in figure 7.4 is displayed in panel (a). It can beseen that the cluster rotates at different speeds on the upper and the lower portion. The picturesare taken from ref. [MY1].
et al. [166] no rotation has been observed at high frequencies. In the earlier studies theion drag force has been found responsible for the rotation at these frequencies. Thus, theelectric field is considered to be the main rotation mechanism throughout the observations.
With increasing temperature the particle levitation height is increased. At the higherposition in the sheath the charging time is reduced. In addition, the ion time of flight isshorter. This results in an increased rotation frequency.
7.4.3 Height Dependence
In addition to the observation of the rotation speed in dependence on the driving frequencyheight scans at 5.19 kHz have been performed. The height scan reveals a differentialrotation which decreases with height. The measurements have been performed for twodifferent clusters displayed in figure 7.7(a) and (b). The decline in the rotation speed issimilar in both clusters and for all temperatures. Thus, it can be assumed that the heightdistribution of the rotation is dominated by the difference in levitation height of the cluster.
The increase in the rotation speed is due to the energy gain of the ions penetratingdeeper into the sheath and the increased effect of the delayed charging. Moving a clusterthrough the plasma sheath by means of thermophoretic forces can thus be used to probethe sheath.
7.4.4 Vertical Resonance Frequency
In addition to the response to an electric field a single particle captured can be used to probethe vertical dust resonance frequency of the plasma. Therefore an additional generator isattached to the electrode. It supplies a low voltage alternation. The vertical resonance is

7.4 Results 77
Figure 7.8: The vertical resonance frequency as depending on the applied voltage. The pictureis taken from ref. [MY1].
Figure 7.9: A sequence showing the positions of a particle string as the lowest particles aredropped one by one. The picture is taken from ref. [MY1].
then taken from the particles response. The outcome of the measurement as dependent onthe voltage applied to one plate is displayed in figure 7.8. The change in the resonance islinked to the vertical and horizontal position of the particles. Thus the penetration depthin the sheath changes the particle behavior.
7.4.5 Suspending a Single Particle
It is necessary to suspend a single particle in the glass box in order to perform the experi-ments discussed above. As it is possible to introduced only a particle cloud and not a singleone the experimental procedure is described here. Starting with small particle numberssimplifies the procedure. Once a small particle cloud is suspended the plasma confinementis weakened by de-matching the the RF power.
Once very few particles are suspended they will levitate above one another due tothe attractive wake field potential. By de-matching the power further one can drop the

78 7. Cluster Rotation
particles one by one. After dropping one particle the original matching is reestablished.The remaining particles will then regain their original position. A sequence of this behavioris shown in figure 7.9.
7.5 Possible further Experiments
Further experiments on the cluster rotation and behavior in response to other excitationssuch as e.g. dipoles or quadrupole are of interest. In addition the shell and vertical stringrotation as suspected from the data will be in the center of interest. Also the initial phaseof the cluster rotation has to be investigated in order to distinguish between the two drivingmechanisms.
Experiments on the shielding of the box will also be conducted. A series of suchexperiments has already been performed at a wide range of parameters but no conclusiveoutcome can yet be reported.
7.6 Summary
A particle cluster suspended inside a conductive box has been set into rotation by applyinga rotating electric field. The rotation has found to be always in the direction of the appliedelectric field. This is caused by the ion drag and a dipole moment induced due to delayedcharging. The latter has been investigated by steady state single particle measurements.Furthermore, the height dependence of the rotation has been discussed. It has been foundthat the cluster is rotating faster on the lower than on the upper edge. This is due to theacceleration of ions along their path through the box.
7.7 Resume
Un cluster de particules piegees dans une boites conductrice a ete mis en rotation grace aun champ electrique tournant. Il a ete demontre que la rotation s’effectue toujours dansle sens que le champ electrice. Ceci est d a la force de poussee des ions et au diple induit.Ce dernier phenomene a ete etudie par des mesures effectuees dans des conditions d’etatd’equilibre d’une particule seule. De plus, la dependance de la rotation avec la hauteur aete etudiee et est presentee. Il a ete ainsi montre que la partie basse du cluster tourne plusvite que sa partie superieure. Ceci est d a l’acceleration des ions le long de leur trajet dansla boite.
7.8 Zusammenfassung
Eine Teilchenwolke wurde durch ein elektrisches Feld in Rotation versetzt. Die Wolkedrehte sich immer in der gleichen Richtung wie das angelegte rotierende elektrische Feld.

7.8 Zusammenfassung 79
Die Rotation wird durch Impulsubertragung der Ionen und durch Entstehung eines Dipolsin der Wolke getrieben. Letzteres wurde durch Versuche mit einzelnen Teilchen unter-sucht. Des Weiteren wurde die Hohenabhangigkeit der Rotation bestimmt. Die Rotations-geschwindigkeit ist am unteren Ende der Wolke hoher als am oberen. Das wird durch denZuwachs der Ionenenergie entlang des Weges durch die Wolke verursacht.

80 7. Cluster Rotation

Chapter 8
Competing Cluster Symmetries
8.1 Experimental Setup
To get further information on a cluster 3D diagnostics are employed. During these experi-ments the particle cluster is investigated by the digital in-line holography at the Universityin Kiel. In this setup the region of interest is illuminated by a laser and the interferencepatterns of the scattered light are collected by a CCD camera. The resulting image con-tains information about the x, y and z position of each particle which can be extractedby careful Fourier analysis. A picture and a sketch of the experimental setup with thechamber mounted in the center of an optical table is shown in figure 8.1
The particle positions are reconstructed from the interference patterns observed on thecamera chip. Figure 8.2(a) shows an image of a cluster as taken by the cameras. In panel(b) the interference pattern corresponding to a single particle is displayed. The depthinformation is artificially gained by introducing slices along the laser beam direction inthe analysis. This is displayed in figure 8.2(c). The two cameras are synchronized. Fromeach camera the full 3D analysis can be gained. However, the depth information gets
Figure 8.1: Picture (b) and sketch (a) of the chamber and the illuminations system as mountedin Kiel. The green illumination laser is in operation. In front the chamber surrounded by the twocameras can be seen. In the back the illumination system is mounted. The picture is courtesy ofJ. Schablinski.

82 8. Competing Cluster Symmetries
more accurate if it can be compared to the reconstruction from a second camera. Thisrecording method requires big particles. To increase the radius while keeping the massas low as possible hollow glass spheres are employed. Given the physical and geometricalparameters of the hollow glass spheres provided by the manufacturer [132] (Scotchlite S22glass with a density ρ=2.5 g/cm3 and a wall thickness of s≈0.3 µm, which are sorted laterto get a mostly monodisperse particle size distribution with a diameter of d=22±2 µm.),it is straightforward to estimate the particle mass:
M =4
3πρ
[(d
2
)3
−(d
2− s)3]≈ 1.11± 0.23 ng, (8.1)
and the gas drag friction coefficient. Obtaining the value of the gas drag coefficient onehas to take into account that the particle is hollow, compared to that suggested in [60].The generalization shown in text is rather straightforward. At 4 Pa argon gas pressure itis:
γeff = γnd3
d3 − (d− 2s)3= 17.5 s−1. (8.2)
A picture of these particles has been shown in figure 2.2(b).
Due to the limitations of the recording system the chamber has to be rather small ifcompared to the GEC cell used in the experiments at the MPE in Munich. The innerdimensions of the chamber are 14 cm x 14 cm x 26 cm [117, 119, 120]. The lower electrodediameter is 7 cm. The upper electrode is mounted at a distance of 7.2 cm. Its diameteris 9.6 cm. The lower electrode is powered by a RF generator at 13.56 MHz at 120 Vpp.The upper electrode and the surrounding walls are grounded. In the center of the upperelectrode a grid is installed through which particles can be transfered into the chamber.
In the center of the electrode a smaller glass box is placed. Its side length is reducedto 2 cm due to the smaller electrode diameter. Besides, the box is the same as the oneemployed in Munich. In Kiel two experimental series have been performed. During thefirst series the connectors to the function generators were fixed to the center of the glassbox. During the second series the connectors were attached at the poles. In combinationwith the finite conductivity of the ITO glass plates an asymmetry in the rotating electricfield is introduced. This results in an asymmetry in the cluster reaction as it is displayedin figure 8.4.
In difference to the experiments discussed in chapter 7 the usage of thermophoreticforces led to a non spherical shape of the cluster. If the lower electrode was heated theparticles moves upward at the edges of the box rather than form a spherical cloud in thecenter of the box.
Even though the confined cluster is of roughly the same spacial size it is composed ofless than 100 particles. Since the particles are much bigger than the ones employed in theexperiment described in the previous section the inter particle spacing is higher.

8.2 Parameters 83
Figure 8.2: Sketch to explain the particle identification method. In plane the particles arerecognized by the interference patterns of a cluster as shown in (a). In panel (b) the interferencepattern of a single particle is displayed. To gain the particle positions along the laser beamimaginary slices are introduced to the cluster. This is displayed in panel (c), [118].
8.2 Parameters
For the given discharge settings (118 V peak-to-peak voltage applied to electrode; 32◦Cbottom electrode temperature; 20 V peak-to-peak voltage applied to each ITO plate, con-trolled by function generators) in the performed experiments the plasma parameters havebeen estimated as follows1: the electron temperature is Te ≈3 eV, the electron-to-iontemperature ratio Te/Ti ≈100, the plasma density n≈109 cm−3. Subsequently, one canestimate the electron Debye (screening) length to be of the order of λDe ≈400 µm and theion mean free path λia ≈770 µm 2.
The particle charge is expected to be of the order of Z=(40000-50000) elementarycharges, as ’standard’ theoretical approximations, OML [25], DML [158], or ’modified’OML [102], allows to estimate. Note that in the presented conditions the ratio Nd/Z∼2-3 is not that big. (Nd is the ’standard’ number of electrons inside the Debye sphere).Therefore, due to depletion [1], the real charges can be expectedly smaller.
In experiments with small clusters, constituted by 2-3 charged particles, the particlecharge and the damping rate can be measured directly by exploring the reaction of theclusters (actually the single particle strings) to the harmonic excitation applied to thelower electrode [40, 41]. The measurements are based on the well-known vertical resonancemethod testing the phase resolved reaction of the particles to the excitation. In this verysetup a series of such measurements has been performed with a single particle, two particlesand three particles confined in the box. Based on the estimated plasma parameters theexperiments allow to determine the charge of the particles. The upper particle charge is inthe order of the 40000 electrical charges, while the charge of the lower particle is reducedby 30%. As discussed in chapter 6 the situation might be quite different for the confinedparticle cluster.
1Note that those are normally the typical bulk plasma parameters obtained, see, e.g. [161].2ion-atom charge-exchange collisions [181, 174] are assumed to be dominant

84 8. Competing Cluster Symmetries
The effective damping (∼10 s−1) was calculated to be in a fairly good agreement withthe predictions in relationship (8.2).
8.3 Rotation
The resulting particle positions in the clockwise or counter clockwise rotating cluster asobserved during the first, symmetric sequence at 5 kHz are displayed in figure 8.3(a) and(c). The two rotation directions differ a bit which is caused by the neutral gas drag, themagnetic field of the earth and other possible forces acting on the particles. A similarasymmetry has been observed in the previous chapter.
The complete information on the particle positions at all times helps to understandthe internal mechanisms of the cluster. This revealed a shell rotation which has not beenobserved this way in the previous experiments.
Throughout this chapter the three cases displayed in figure 8.3 are discussed. The tworotating clusters (top and bottom) are compared to a static case. In this case a rotatingelectric field with a frequency of 1 kHz is applied. The cluster does not rotate in responseto this field. Thus, it is referred to as the ’static’ or ’non-rotating’ case. The rotation speedfor the cluster subjected to a frequency of 5 kHz is calculated to about 0.2 s−1. This is ingood agreement with the results displayed in figure 7.4.
In figure 8.4 the rotation of a cluster recorded during the second, asymmetric sequenceis displayed for different electric field rotation frequencies. The cluster is subjected toelectric fields rotating clockise (left hand side, figure 8.4) and counter clockwise (righthand side, figure 8.4). It can be seen that the cluster rotates in discrete shells. As thefrequency increases the inner particles of clockwise rotating clusters are more and more atrest. However if the frequency is increased further and the cluster rotation behavior flips.If applying a counter clockwise rotating field at this frequency the cluster is static.
In difference to the earlier experiments in Munich a stronger asymmetry on the clusterreaction can be observed. This is be due to the asymmetric wiring of the glass box. Thefunction generators were attached to the corners of the box. Since the conductivity of theITO coating is finite the distribution of the voltage above the plate is decreasing.
Furthermore, the plasma and the confined cluster are different to the cluster observed atMunich. The observed behavior is quite similar to the observations of Nosenko et al. [166]where the rotation direction flips at a certain frequency. Above this frequency the cluster isconsidered to be mainly driven by the ion drag. That the rotation reversal is not observedfor the two rotation directions at the same frequency is due to the asymmetric wiring of thebox. It can be concluded, that the asymmetric wiring suppresses the effect of the delayedcharging and thereby the torque due to the electric field force.
As discussed in the previous chapter the rotation speed varies depending on the height.The results displayed in figure 7.7 indicate that the liquid-like cluster suspended in the glassbox at Munich rotates faster on the lower edge than on the upper one. In the situationdisplayed in figure 8.4 is quite opposite. The lower particles move slower than the uppermore ones. It has also been found that the motion of the lowest particles is rather chaotic.

8.3 Rotation 85
Figure 8.3: A spherical cluster as recorded and analyzed during a collaboration with the groupin Kiel. It is subjected to a clockwise (upper most graph) and a counter clockwise (bottom)rotating electric field at 5 kHz. In the middle the same cluster is presented. In this case theapplied electric field is rotating at a frequency of 1 kHz. This rotation frequency is too low forthe cluster to rotate in response. Each line represents the track of an individual particle.

86 8. Competing Cluster Symmetries
Figure 8.4: Shell rotation as seen in a cluster for different excitation electric field frequencies(Right hand side: clockwise rotation, left hand side: counter clockwise rotation). The time isdisplayed by the color coding. Early particle positions are given by blue, later by red colors.

8.4 String Analysis 87
This is not surprising, but, as the cluster is very small and the particles are very big theportion of particles showing this motion rather than following the electric field is relativelyhigh. Nevertheless, the differential rotation observed in the displayed cases is also causedby the dragging effect.
In the following only the cluster displayed in figure 8.3 will be discussed.
8.4 String Analysis
8.4.1 Spatial Correlation
The particle ordering is studied by using the procedure schematically sketched in fig-ure 8.5(a). Two different coordinate systems are introduced to describe the particle posi-tions. The center of mass system (CMS) of the cluster is calculated by averaging over allparticle positions at all frames. Therefore the origin of this coordinates system remainsimmobile while the actual position of the center of mass might deviate from one frame tothe next. The radial distance of each particle to the origin of this coordinate system iscalculated. Around each particle a vertical cylinder with radius of rcyl=200 µm is placedas shown in figure 8.5(a). If a second particle is found inside this cylinder it is consideredto be in pair with the first one. By this method the particle pairs and combinations withhigher particle numbers can be identified. In figure 8.5(b) some examples taken from theexperimental data are displayed. The strings are composed of two, three, and four particlesand are elongated mainly along the z-axis.
The cylinder radius rcyl=200 µm introduces a geometric limitation to the strings. Theparticle strings are considered ruptured once a particle moves out of the cylinder. Toemphasize this limitation the actual radius of the cylinder (r) is plotted versus the polarangle (θ ·r) for the three discussed cases, see figure 8.6. The geometric limits to the analysisare indicated by the red and the blue lines in these plots. However, considering interactingstrings rather than only accidentally paired ones the geometric limit is sufficient. Accordingto the vertical ordering parameter as introduced by refs. [105, 131] a particle combinationwith a polar angle θ of less than 10◦ is considered a string. Thus, an interacting particlestring is expected to be within the set limitations. The angular distributions will bediscussed later.
The criteria of counting several particles as a string are illustrated in figure 8.7. Firstthe distances between all particles in the xy-projection (top view) are calculated, resultingin a distance matrix. Two particles are considered to be in a string if their distance isbelow threshold. Every black dot in figure 8.7(a) indicates that the distance between thetwo particles i and j is below the threshold introduced by the cylinder radius, see Fig. 8.5.The maximal distance (threshold) is indicated by the radius of the cylinder rcyl shown infigure 8.5. In what follows, rcyl is chosen to be 200 µm, that is about half of the Debyeradius, see section 8.2.
Figure 8.7(b) shows a top view of the actual particle positions. If the distance be-tween two or more particles is below threshold they are marked red. The shown circle

88 8. Competing Cluster Symmetries
Figure 8.5: (a) Coordinate systems together with a sketch illustrating the string identificationprocedure. The center of mass system (CMS) has been obtained by ’global’ averaging over allframes and all particle positions. It is used as a convenient ’bench mark’ to describe the particlepositions (the corresponding spherical coordinate system is introduced by the capital letters asR, Θ, and Φ). To analyze the vertical particle arrangement, around every particle comprisingthe cluster (filled circles in the figure), a cylinder is centered around its position (with a radiusrcyl=200 µm well below the inter-particle distance). Everything within that cylinder is consideredto be a string. To describe the strings interior structure an additional internal coordinate system(conventionally originated at the lowest particle of the string, and designated as l, θ, and ϕ)is introduced. (b) Three examples of the strings composed from two, three, and four particlestracked by the procedure described above. The strings scaled spatially as indicated in the figure.
demonstrates the radius of the cylinder employed in the analysis as introduced in figure8.5. Importantly, the circle diameter is way below the mean inter particle distance in thexy-plane.
The top view of the cluster in figure 8.7(b) shows that basically all particles are or-ganized in vertical strings. Only very few particles remain alone. Furthermore, the spacein-between two strings is larger than the usual horizontal elongation of a string. Thus,most of the particles are well aligned in vertical direction (along the z-axis).
8.4.2 Temporal Correlations
Another important criterion is the life time of a particle string. Studying the lifetimeof particle associations one can easily distinguish particle pairs, which only occasionallyhappened to be close to each other, from persistent particle pairs or strings which areinteracting with each other by wake field attraction. The easiest way to distinguish thetwo is via the time the particle distance is below threshold. If two or more particles arefairly close for a considerable amount of time and follow the motion of the applied electricfield, they can be assumed to be a string.
Examples of three particles (A, B, and C) being part of different identified strings are

8.4 String Analysis 89
Figure 8.6: Geometric limitations are displayed for three cluster rotations: (a) clockwise rota-tion, (b) static, (c) counter clockwise rotation. The red and the blue lines indicate the geometricstring limitation.
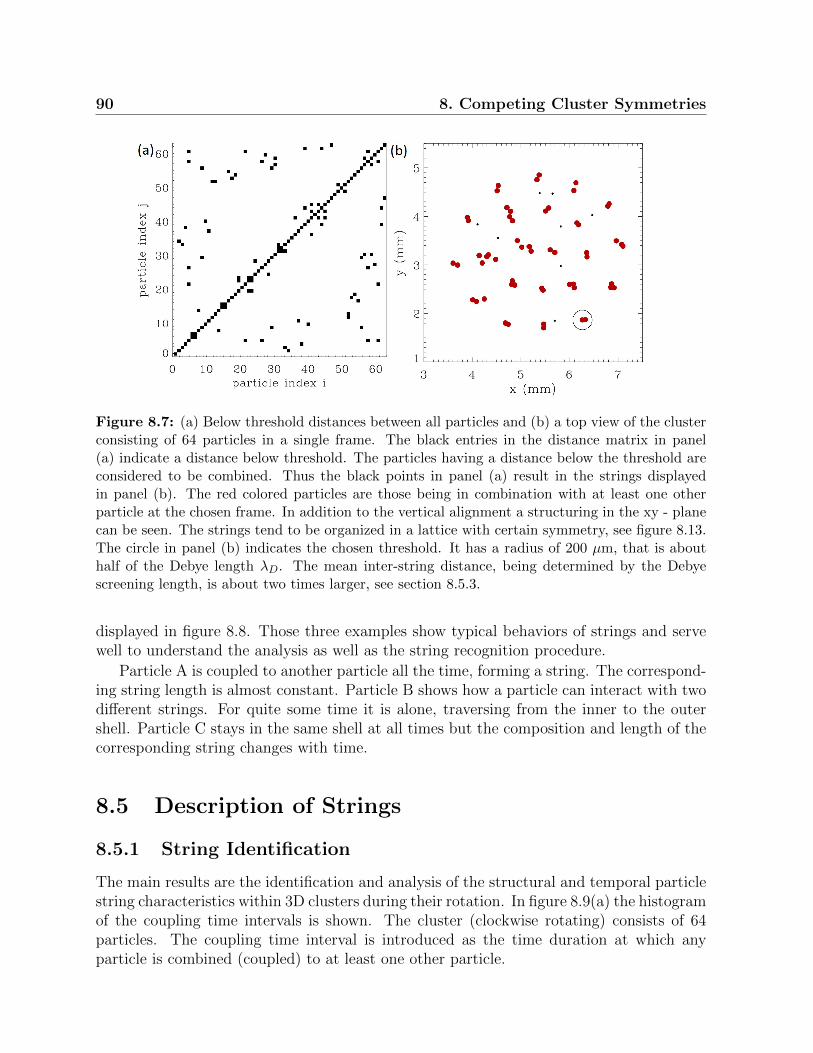
90 8. Competing Cluster Symmetries
Figure 8.7: (a) Below threshold distances between all particles and (b) a top view of the clusterconsisting of 64 particles in a single frame. The black entries in the distance matrix in panel(a) indicate a distance below threshold. The particles having a distance below the threshold areconsidered to be combined. Thus the black points in panel (a) result in the strings displayedin panel (b). The red colored particles are those being in combination with at least one otherparticle at the chosen frame. In addition to the vertical alignment a structuring in the xy - planecan be seen. The strings tend to be organized in a lattice with certain symmetry, see figure 8.13.The circle in panel (b) indicates the chosen threshold. It has a radius of 200 µm, that is abouthalf of the Debye length λD. The mean inter-string distance, being determined by the Debyescreening length, is about two times larger, see section 8.5.3.
displayed in figure 8.8. Those three examples show typical behaviors of strings and servewell to understand the analysis as well as the string recognition procedure.
Particle A is coupled to another particle all the time, forming a string. The correspond-ing string length is almost constant. Particle B shows how a particle can interact with twodifferent strings. For quite some time it is alone, traversing from the inner to the outershell. Particle C stays in the same shell at all times but the composition and length of thecorresponding string changes with time.
8.5 Description of Strings
8.5.1 String Identification
The main results are the identification and analysis of the structural and temporal particlestring characteristics within 3D clusters during their rotation. In figure 8.9(a) the histogramof the coupling time intervals is shown. The cluster (clockwise rotating) consists of 64particles. The coupling time interval is introduced as the time duration at which anyparticle is combined (coupled) to at least one other particle.

8.5 Description of Strings 91
Figure 8.8: String formation and dynamics. Three representative examples of the evolutionof the particles labeled as A, B, and C and their trajectories illustrate the string formationdiscussed in the text. The particle A is in a 2-particle string which remains stable all over theobservation time. Particle B during evolution interacts (collides) with two different strings alongtime. Particle C contributes to one string which is composed from two, three, and four particles.The panels on the left: Top view of the cluster with the superimposed (over all 500 frames)particle positions. The panels on the right: Time evolution of the string length and the particleassociations. The particle positions and the association to other particles are highlighted by color:(black) single, (red) two, (green) three, and (yellow) four particles.

92 8. Competing Cluster Symmetries
Figure 8.9: Life times and string composition demonstrated at the example of a clockwise ro-tating cluster at 5 kHz (20 V peak-to-peak on each plate) electric field rotation. (a) Histogram(bin size = 0.4 s) of the coupling time intervals ∆t (irrespective to the string composition num-ber): (black bars) all entries with the time intervals shorter than 10 s, (red bar) the 23 entriescorresponding to the long-term coupling, ∆t=10 s. Every particle is counted as many times as itappeared to be coupled. The most of strings are apparently short-living, 0-0.4 s. (b) Histogram(bin size = 1 s) of the time intervals ∆tstrings computed exclusively for the particles the entiretime coupled (comprising the red bar in the panel (a)). The strings composing of 2, 3, or 4particles are shown only. ∆tstrings is calculated in the same manner as ∆t in (a), see text fordetails.
It is worth noting that, to understand the composition of the histograms shown infigure 8.9 better, figure 8.8 helps a lot. The key point is to explain the differences betweenthe number of entries per particle. For instance, particle A (the upper two panels infigure 8.8) evidently contributes to both histograms (a) and (b) in figure 8.9 since it wascoupled to exactly one particle for all 500 frames (equals 10 s). Particle C (two bottompanels in figure 8.8), making only one entry in panel (a), being an element of a few stringshaving different composition numbers, makes several entries in panel (b). Whereas particleB (two middle panels in figure 8.8) would make no entry in panel (b), because only theentries marked ’red’ in (a) were taken into account. Note also that the integral of theentries shown in panel (b) gives the total number of realizations (23·500) in the red bar in(a). The strings considered are composed from two, three or four particles.
The black bars in figure 8.9(a) indicate particle pairs, at the most not coupled, whereasthe red bar represents the particles remaining combined with another one during the wholeobservation time, for all possible string composition numbers. (The string compositionnumber is introduced as the number of the particle comprising the string.) It can be seenthat many particles stay in combination with another particle for very short times only [theshort-time peak in figure 8.9(a), ∆t<2 s], or merely ’fly-by’ with ∆t=0-0.4 s. Importantly,there is another peak of the long-living coupling events at ∆t=10 s. In between the twopeaks basically no entries are observed. Thus particles are either combined throughout thewhole observation time or for very short time intervals only. Note that during the 10 s ofobservation the cluster performs a little more than half a turn, leading to a rotation periodof about 14.9 s.
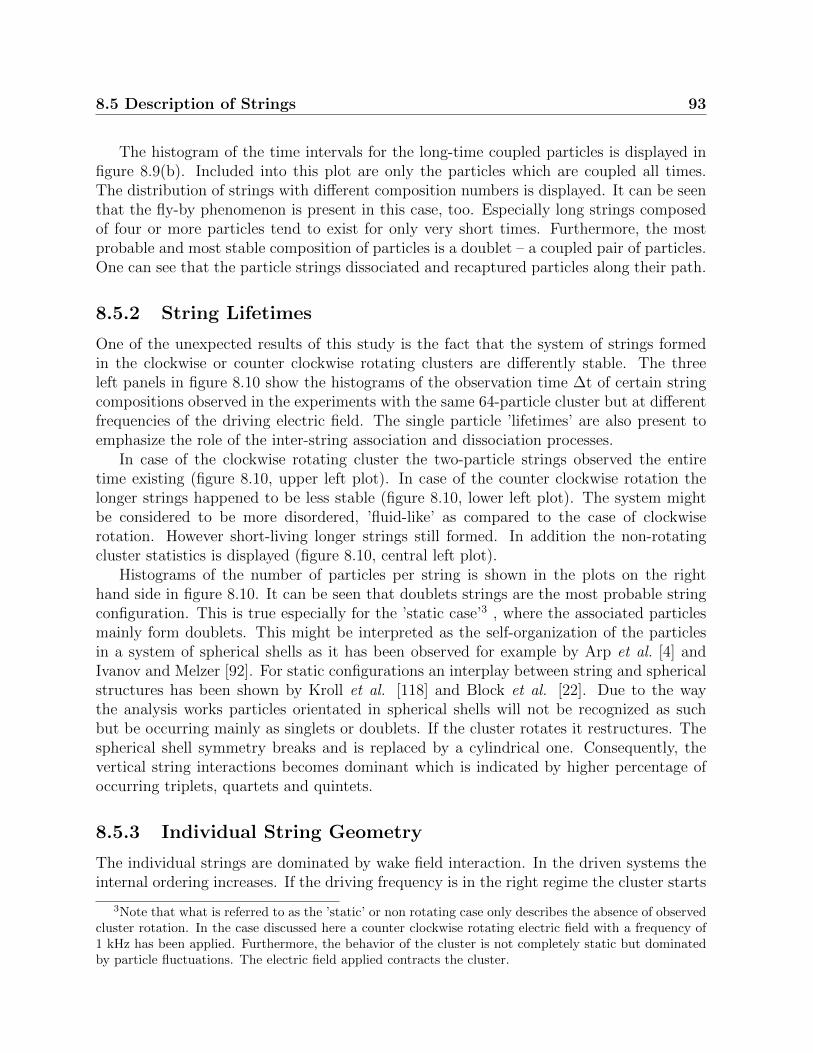
8.5 Description of Strings 93
The histogram of the time intervals for the long-time coupled particles is displayed infigure 8.9(b). Included into this plot are only the particles which are coupled all times.The distribution of strings with different composition numbers is displayed. It can be seenthat the fly-by phenomenon is present in this case, too. Especially long strings composedof four or more particles tend to exist for only very short times. Furthermore, the mostprobable and most stable composition of particles is a doublet – a coupled pair of particles.One can see that the particle strings dissociated and recaptured particles along their path.
8.5.2 String Lifetimes
One of the unexpected results of this study is the fact that the system of strings formedin the clockwise or counter clockwise rotating clusters are differently stable. The threeleft panels in figure 8.10 show the histograms of the observation time ∆t of certain stringcompositions observed in the experiments with the same 64-particle cluster but at differentfrequencies of the driving electric field. The single particle ’lifetimes’ are also present toemphasize the role of the inter-string association and dissociation processes.
In case of the clockwise rotating cluster the two-particle strings observed the entiretime existing (figure 8.10, upper left plot). In case of the counter clockwise rotation thelonger strings happened to be less stable (figure 8.10, lower left plot). The system mightbe considered to be more disordered, ’fluid-like’ as compared to the case of clockwiserotation. However short-living longer strings still formed. In addition the non-rotatingcluster statistics is displayed (figure 8.10, central left plot).
Histograms of the number of particles per string is shown in the plots on the righthand side in figure 8.10. It can be seen that doublets strings are the most probable stringconfiguration. This is true especially for the ’static case’3 , where the associated particlesmainly form doublets. This might be interpreted as the self-organization of the particlesin a system of spherical shells as it has been observed for example by Arp et al. [4] andIvanov and Melzer [92]. For static configurations an interplay between string and sphericalstructures has been shown by Kroll et al. [118] and Block et al. [22]. Due to the waythe analysis works particles orientated in spherical shells will not be recognized as suchbut be occurring mainly as singlets or doublets. If the cluster rotates it restructures. Thespherical shell symmetry breaks and is replaced by a cylindrical one. Consequently, thevertical string interactions becomes dominant which is indicated by higher percentage ofoccurring triplets, quartets and quintets.
8.5.3 Individual String Geometry
The individual strings are dominated by wake field interaction. In the driven systems theinternal ordering increases. If the driving frequency is in the right regime the cluster starts
3Note that what is referred to as the ’static’ or non rotating case only describes the absence of observedcluster rotation. In the case discussed here a counter clockwise rotating electric field with a frequency of1 kHz has been applied. Furthermore, the behavior of the cluster is not completely static but dominatedby particle fluctuations. The electric field applied contracts the cluster.

94 8. Competing Cluster Symmetries
Figure 8.10: Histograms of the string lifetimes obtained with: (top panels) a 5 kHz ac rotatingelectric field, the clockwise rotating cluster, (middle panels) a 1 kHz ac rotating electric field,the non-rotating cluster, and (bottom panels) a 5 kHz ac rotating electric field, the counterclockwise rotating cluster. The left panels: The lifetime histograms of the strings with a rangeof the composition numbers from 1 to 6 (if occurring). The associations with the single particlesare indicated as well. The right panels: The occurrence plots of the number of particles perstring. The doublets and the triplets are the most probable composition of the strings in therotating complex plasma, whereas the non-rotating cluster is dominated only by doublets. Allthree experiments were performed with the same 64-particle cluster.

8.5 Description of Strings 95
Figure 8.11: Azimuthal ∆φ = Φ−φ (a) and polar θ (b) angle probability density for all particlestrings as introduced in figure 8.5. The probability density is calculated from the distributionby normalizing the area under the curve. It is displayed for three situations: counter clockwiserotation (red), clockwise rotation (blue), and no rotation (black). The azimuthal probabilitydistribution in the static case the main peak is located at zero, whereas the main peak is shiftedtowards π/2 (-π/2) for clockwise (counter clockwise) rotation. This can be interpreted as thelower particle being towed behind the upper more one. For the polar angle the way the analysisworks on the data a upper limit at about 0.3 rad (≈20◦) of the angular distribution is introduced.The absence of entries at θ=0 is due to the carousel effect caused by the rotation. Furthermore,it can be seen that in the static case the most probable polar angle is much higher than inthe rotating ones. It seems that the introduction of additional forces leads to a more straightorientation of strings.
to rotate. As it will be described in this section this leads to a more vertical orientation ofthe strings (polar angle θ ≈ 10◦), see figure 8.11(a). The rotation has another effect on thestring structure. As wake field interaction is supposed to be dominant the lower particle isconnected to the upper one at all times leading to a dragging of the lower particle. Thusthe azimuthal angle ∆φ = Φ−φ of the strings is shifted towards π/2 (−π/2) for clockwise(counter clockwise) rotation, see figure 8.11(b).
The distribution of strings along the radius of the cluster varies. According to theirposition in the cluster the probability of particles being combined with another varies aswell. Due to the spherical shape of the cloud more layers of particles exist in the centralregion. Thus, the string length is expected to be longer at the cluster center. As it canbe seen in figure 8.12(a) the string lengths distribution is discrete. Furthermore, it can beseen that the longest strings do not occur in the center but at an intermediate positionof the cluster. This is due to the fact that the particles in the cluster do not inherit theinner most position but rather a cylindrical shell a little space apart, as it can be seen for

96 8. Competing Cluster Symmetries
instance in figure 8.8. The color coding in figure 8.12(a) is the same as in figures 8.8, 8.9,8.10: Strings composed of two particles are marked red. Those composed of three particlesare green. Four particle strings are yellow and those with five blue. As it can be seenthe discrete particle string length is not only linked to the radial position but also to thenumber of particles in the string. In case of the rotating clusters strings with a certainnumber of particles mostly have the same length. Thus, it can be assumed that the interparticle distance along the particle string is nearly always constant. This is enhanced bythe fact that the layers are equidistant. Hence any additional particle elongates the stringby the same length. This is due to the distance of the wake interaction being responsiblefor the vertical confinement.
Since the particle strings have discrete lengths an inter particle distance ∆lpart in astring can be calculated from them:
∆lpart =l
n− 1. (8.3)
With l being the length of the string and n ≥ 2 the number of particles in the string.The resulting distributions are displayed in figures 8.12(a) for clockwise rotation, (b) forthe non-rotating cluster, and (c) for counter clockwise rotation. From these distributionsit can be seen that the length of the string increases with the string composition numberwhile the inner inter-particle distance shrinks (i.e. the string shrinks when further particlesare added to it). Furthermore, the presence of rotation leads to a drastic change in thedistributions. While very broad in the non-rotating case, clear peaks in the distributionsappear if the cluster is set into rotation. This can be accounted for by the change in theeffective potential induced by the rotation. The mean inter particle distances for the threecases are shown in table 8.1. It is about 0.9±0.1 mm if all events are taken into account. Itincreases a bit if only doublets are concerned and shrinks for triplets. In this table no errorbars are given since the distributions of the inter particle distances are quite broad, seefigure 8.12. Hence no reasonable error estimations for the mean inter particle distances forthe values given in table 8.1 corresponding to strings containing more than three particlescan be given. The overall length of a string composed, e.g. from three particles, may belonger than the one composed of only two particles, but on average, three-particle stringsare internally more compact. The shrinkage of particle strings with higher particle numbersis of the order of 30 % if compared to doublets. Note, that 2D plasma crystals are nearlyincompressible in the elasticity sense [226].
From the angular distributions the vertical particle interaction can be proven. In figure8.11(a) the development of the azimuthal angle ∆φ = Φ−φ in all three cases are displayed.This angular distribution describes the orientation of the lower particle with respect to theupper one. Remember, that the capital Φ describes the azimuthal angle of the projectionin the center of mass system, while φ describes this angle in the inner string system, seefigure 8.5. In figure 8.11(a) it can be seen that the main peak for the rotating clustersis slightly different from zero. Dependent on the rotation direction the asymmetry in thedistribution changes. If two particles would be perfectly aligned, and the upper wouldalways precede the lower particle, the azimuthal angle ∆φ would display a phase shift

8.5 Description of Strings 97
Figure 8.12: String length and in-string inter-particle distance. Distribution of the length ofthe strings vs. radial (XY-projected) distance to the CMS, shown for the clockwise rotatingcluster (a). Two main effects can be seen immediately:(i) the discreteness of the string lengthdistribution is well pronounced and (ii) surprisingly, the longer strings are located dominantlynot in the middle of the cluster. (b, c, d) Histograms of the in-string inter particle distance∆lpart computed for: (b) the cw-rotating cluster, 5 kHz driving ac-field [same as in (a)], (c)non-rotating cluster,1 kHz driving ac-field, (d) ccw-rotation, 5 kHz driving ac-field. Note thatstatistically the triplets are relatively more compact ’constructed’ than the doublets, for all cases⟨∆ldoubletpart
⟩>⟨
∆ltripletpart
⟩. For longer strings the statistics is poor. Color coding: (black) all
events, (red) doublets, (green) triplets, (yellow) quartets, (blue) quintets, and (orange) sextets

98 8. Competing Cluster Symmetries
Table 8.1: Mean inner-string inter-particle distances expressed in mm for the cases: clockwiserotation (cw), no rotation (nr), counter clockwise rotation (ccw). The mean distances calculated:(i) for all strings irrespective to their length, and (ii) separately for the strings consisting only oftwo, three, four, five, and six particles (if available). As it is shown in figure 8.12 the distributionsof the inter particle distances are quite broad. For any string consisting of more than threeparticles the distribution even gets too broad to determine any reasonable width. This is alsotrue for the static case. Thus, no error bar will be given in these cases. Taking into accountall events, only doublets, or only triplets the width of the main peak is in the order of 0.2 mm.Thus, the error in these cases can be estimated to about ±0.1 mm. For the other cases the erroris quite large as is can be seen in figure 8.12.
case all events doublets triplets quartets quintets sextets
cw 0.83 0.87 0.78 0.85 0.64 –nr 0.96 0.99 0.86 1.09 – –
ccw 0.84 0.99 0.74 0.62 0.64 0.51
of plus or minus π/2, depending on the rotation direction. It can be deduced that therotation is due to ’towing’ of lower particles in contrast to previous experiments. In theseexperiments the cluster was almost liquid-like. Thus the vertical coupling of the particles islimited and the rotation is driven on each layer. Hence the ion energy gain while traversingthe cluster is responsible for higher rotation velocities on the lower edge of the cluster.
In the experimental series reported here the vertical coupling is determined by thewake field interaction. The lower particles are attracted by the positive wake potentialdownstream the upper particles. Thus the motion of the lower particles is not drivenindividually but dominated by the rotation of the upper ones. This is described as the’dragging effect’.
Due to the rotation the lower particles inherits a position a little different than in thestatic case. This is shown in figure 8.11(b). The particles are drawn inwards as the clusterrotates with respect to the static case (black curve). The maximal angle displayed showsthe rupturing of strings and is below the geometric limitations. The overall 10◦ degreesdifference, as observed for the rotating clusters, are way below the string rupture anglediscussed in ref. [151]. According to refs. [105, 131] a vertical ordering parameter (VOP)is introduced. It describes the ratio of strings with a polar angle of less than 10◦ to allobserved particle pairs. According to this almost the entire particle cloud shows a highvertical order.
In addition to the mentioned dragging effect a string constant could be calculated.The estimations of this constant rely on inner-string oscillations. Due to very strong pixel-locking, for a review see e.g. Feng et al. [61], in the reconstructed particle positions no valuefor it can be given at this point. Further investigations and refining of the experimentalmethod as well as of the reconstruction are necessary to gain insight into the inner-stringinteractions.

8.6 Global Cluster Symmetry 99
[ht]
Figure 8.13: Competing symmetries in a rotating cluster. (a) X,Y projected particle positions(black dots) are structured either as a system of cylindrical shells (dashed lines) or squares (dottedlines). The dotted and dashed lines are included to guide the eye and are not calculated from thecluster symmetry. The inner dashed circle has a radius of 850 µm, the outer of 1700 µm. Thedotted lines grid has a box side length of 770 µm. Both symmetries are meta-stable, the resultingsymmetry alternates from shells to squares while the cluster rotates. (b) The wall of the stringin the cluster center (Side-view is taken for: -500 µm<(y-〈y〉)<500 µm). The shadowed circle (of0.4 mm diameter) in (a) and the shadowed rectangle (of 0.4 mm width)in (b) indicate positionof the tracked three-element particle string.
8.6 Global Cluster Symmetry
Global symmetry in the cluster has been observed. In the top view displayed in figure 8.7it can be seen that the particles are organized. Several different structures can be seen.The most striking is a cylindrical shell structure which is emphasized in figure 8.13(a) bythe dashed circles. Next to it the strings tend to organize themselves in squares whilethe cluster rotates. These are indicated by the dotted lines. Both structures are meta-stable and the symmetry of the cluster changes from one to the other while it rotates. Abehavior like this, where two interactions are constantly in competition which each otherforming structures, can also be found in colloids [192, 178, 217] and in quantum states insuperconductors [197].
In figure 8.13(b) the central section of the cluster along the z-axis is displayed. Thevertical strings are very obvious. But in addition to the strings secondary structure occur.The organization of particles in hexagons in this plane can be seen. This competition ofstructures resembles the phase transitions observed in electrohereological plasmas [95].
The observed cylindrical shells are very similar to the predictions by Brandt [34], seefigure 6.2. The layers are cylindrical due to the additional confinement. The separation ofthe cylindrical layers is also in quite good agreement with the predictions.
Thus, it can be concluded that the structure of a rotating system is dominated by

100 8. Competing Cluster Symmetries
cylindrical rather than spherical shells leading to the observation of longer strings than inthe non-rotating but driven system. In contrast to this a non-driven system is dominatedby the spherical shells [4]. Furthermore, it can be assumed that the rotating electric fieldintroduces an anisotropic electric field of sufficient strength. Thus, an attractive dipole-dipole interaction as described in equation (2.15) with ξ < 0 may be responsible for thecylindrical shell structure.
As predicted, the interaction potential responsible for the ordering in cylindrical shellsand vertical strings can be tuned by the rotation frequency. The larger the difference be-tween the optimal and the applied frequency the stronger the spherical shell structure ispronounced. Furthermore, the vertical string alignment is less straight for lower frequen-cies. This has been displayed for 1 kHz in comparison to an excitation frequency of 5 kHz.In subsequent experiments this trend has been observed, too. If a rotating electric fieldwith a frequency of only 500 Hz is employed the cluster structure is almost not affected4.The distribution of the polar angle θ has shown to be completely homogeneous inside thepossible range5.
8.7 Possible further Experiments
The purpose of the experiments was to determine the particles at all times gaining moreinformation on the driving mechanism. Besides the string configurations found some hintson this have also been found. However experiments dedicated to the rotation have to berepeated. Therefore the initial moment of excitation is of great interest.
In addition different kinds of sloshing modes are interesting. The response of the clusterto dipole and quadrupole excitation has thus already been measured. But as mentionedabove the analysis of the data is rather complicated. Thus no results from these measure-ments can be given yet.
Furthermore the confinement inside of the box is not fully understood. Further exper-iments on this employing particles as probes are therefore preferable.
Another frequency scan increasing the dipole-dipole interaction has to be performed.In this series the ordering in vertical layers and the phase transition could be investigated.
8.8 Summary
As it has been shown in the previous chapter, a confined cluster can be set into rotation byrotating electric fields. If the electric field frequency is adjusted an increased order in theparticle cluster can be observed. To do so a rather small cluster has been recorded by meansof stereoscopic digital in-line holography. The reconstructed particle positions have beensearched for vertical strings. Therefore a cylinder has been placed around each particle.
4Since this cluster behavior has been observed with another cluster it is not shown in this discussion.However, the description of the cluster structure by the discussed properties is complete.
5The range is determined by the cylinder introduced in the analysis.

8.9 Resume 101
All the other particles inside the cylinder are then considered to by in a string with thefirst one. The strings have then be characterized according to their lifetime. Furthermore,it has been found, that if set into motion the lower particles are dragged along due to thewake field interaction. This is in difference to what has been found previously, where theupper particles moved slower than the lower ones.
Overall it can be concluded, that the structural properties of a cluster can be changedby subjecting it to an additional electric field. Thus, the glass box can be a useful toolto investigate the simulations done by Brandt et al., even though the predicted ordertransitions have not yet been found.
8.9 Resume
Comme il a ete demontre dans le chapitre precedent, un cluster de particules peut etre misen mouvement de rotation a l’aide de champs electriques rotatifs. Lorsque la frequence duchamp electrique est ajustee a une certaine valeur on observe une augmentation de l’ordredu cluster de particules. Afin d’effectuer cette observation, le mouvement d’un cluster depetite taille a ete enregistre par holographie stereoscopique. La reconstruction des positionsdes particules a ete realisee de faon a avoir des alignements verticaux. Par consequent, uncylindre a ete place autour de chaque particule. Toutes les particules se trouvant dans lecylindre qui entoure la particule seront consideree comme faisant parties de l’alignementde celle-ci. Ces alignements ont ete caracterises selon leur duree de vie. De plus, il a etemontre que si les particules sont mises en mouvement alors elles sont entrainees le long deces alignements a cause de la interaction dans le sillage du champ. Ceci est different parrapport a ce qui avait ete observe auparavant o les particules du dessus se deplaaient pluslentement que celles du bas.
Nous pouvons conclure que les proprietes structurales d’un cluster de particules peuventetre modifiees par l’action d’un champ electrique additionnel. Ainsi une boite de verre danslaquelle est forme le cluster peut etre utilisee pour etudier experimentalement les resultatstheorique de Brandt et al. obtenus par simulation meme si les transitions d’ordre preditesn’ont pas ete observees.
8.10 Zusammenfassung
Wie zuvor gezeigt kann eine Teilchenwolke durch externe elektrische rotierende Felderin Rotation versetzt werden. In einem bestimmten Frequenzbereich kann eine hohereOrdnung im System festgestellt werden. Dafur wurde eine relativ kleine Teilchenwolkemit Hilfe von Holographie beobachtet. Die rekonstruierten Teilchenpositionen wurdenauf Strings untersucht. Dazu wurde um jedes Teilchen ein Zylinder mit festem Radiusgelegt. Alle weiteren Teilchen innerhalb dieses Zylinders gehoren zu einem String mit demErsten. Die gefundenen Strings wurden dann anhand der Zeit wahrend derer sie existierencharakterisiert. Des Weiteren zeigte sich, dass die unteren Teilchen von den Oberen gezogen

102 8. Competing Cluster Symmetries
werden. Das steht im Gegensatz zu den Erkenntnissen des vorigen Kapitels, in dem deruntere Teil der Wolke schneller rotierte als der Obere.
Insgesammt kann zusammengefasst werden, dass die Struktur einer Teilchenwolke durchexterne Felder beeinflusst werden kann. Daher ist die Glassbox ein gutes Mittel um dieSimulationen von P. Brandt et al. experimentell zu untersuchen, auch wenn bisher dievorhergesagten Ubergange nicht beobachtet werden konnten.

Summary
Throughout this thesis experiments in a wide variety of setups has been performed. Themain aim was to tune and describe the particle interaction potential. After showing thebasic plasma concepts and particle formation experiments on a main parameter, the par-ticle charge, are discussed. In the final three chapters the interaction potential has beenaddressed.
During this thesis first some basic plasma concepts have been discussed. This wasfollowed by a detailed discussion about the dust particle formation and the behavior atdifferent flows. The dependence on the applied flow has been shown. Possible reasons forthe observed behavior were discussed. In addition the plasma behavior has been investi-gated.
As the charge is a major parameter the de-charging of particles in the plasma after-glow has been described. The influence of a clearing field has been conclusively shown.In addition the charge dependence on the particle size and position has been a topic ofinvestigation.
Afterwards the impact on the interaction potential by electric fields has been discussed.The concept of experiments on electric fields applied along direction of the electric field inthe sheath and simulations on perpendicular rotating electric fields have been introduced.In order to apply a comparable rotating electric field the usage of a glass box has beenproposed. The observed structures of clusters confined in such boxes has been discussed.
The first attempts on applying rotating electric fields to a confined cluster led to clusterrotation. The dependence of the rotation velocity on the electric field frequency has beenshown.
In a further experimental series a stereoscopic digital in-line holography was used.The 3D data includes vertical strings and can hold for understanding the initial drivingmechanism. Furthermore, a higher internal order of the cluster in cylindrical rather thanspherical shells has been observed. The experimental observations have been compared tothe predictions of earlier simulations.

104 Summary

Resume
Dans les plasmas plusieurs experiences differentes peuvent etre realisees. Il est un environ-nement excellent pour la recherche interdisciplinaire.
Au cours de cette these d’abord quelques concepts de base de plasma ont ete discutes.Ils ont ete suivis par une discussion detaillee sur la formation des particules et leur com-portement a differents fluxes. La dependance sur le flux applique a ete montre. Les raisonspossibles pour le comportement observe ont ete discutees. En plus, le changement duplasma a ete etudie.
Les striations qui se produisent et des phenomenes de transport ne sont pas encoreentierement compris. D’autres etudes sur le changement dans les parametres du plasmasont certainement necessaires. Les processus de croissance dans des conditions de micro-gravite et sous l’utilisation d’autres gaz sont des sujets de recherche supplementaires. Lesconnaissances acquises peuvent egalement conduire a un moyen plus efficace de nettoyer letube.
Sur la section des plasmas complexes les charges des particules dans le plasma remanentont ete decrites. L’influence d’un champ electrique a ete demontree de facon concluante. Enplus, la dependance a l’egard de la charge sur la taille des particules et de la position a eteun sujet d’enquete. Malheureusement, certains des parametres etudies ne comportait pasde particules. En plus, il est souhaitable d’etudier la charge des particules dans les nuagesaussi petits que possible. Les nuages plus petits et des tailles des particules manquantespeuvent completer les experiences discutees.
Les experiences sur la rotation des nuages des particules ont montre la dependancesur le champ electrique applique. Les donnees 3D ont des informations sur l’interactionverticale des particules et peuvent aider a la comprehension du mecanisme d’entraınementinitial. Aussi la reponse aux autres excitations, par example dipoles et quadruples, reste aetre etudiee. Les possibilites d’analyse 3D complete peuvent etre illimitees si les problemesavec la vitesse d’enregistrement et le post-traitement seront fixes.

106 Resume

Zusammenfassung
Die vorliegende Dissertation beschreibt Erkenntnisse aus einer Vielzahl verschiedener Ex-perimente. Das Hauptziel dieser Arbeit galt der Beeinflussung des Teilchenwechselwirkungs-potentials. Hierfur wurden zunachst grundlegenden Prinzipien der Plasmaphysik und desTeilchenwachstums beschrieben. Die durchgefuhrten Experimente zur Teilchenladung,einem der wichtigsten Parameter, wurden analysiert. Abschliessend wurden die Unter-suchungen zum Wechselwirkungspotential dargestellt.
Zunachst wurden Konzepte zum Partikelwachstum und den damit verbundenen Veran-derungen des Plasmas diskutiert. Des weiteren wurde das Verhalten der Partikel bei ver-schiedenen Neutralgasflußen beschrieben. Mogliche Ursachen fur das beobachtete Par-tikelverhalten und die Beeinflussung des Plasmas wurden diskutiert.
Da die Teilchenladung einer der wichtigesten Parameter in komplexen Plasmen ist, wur-den Untersuchungen zur Ladungsreduktion durchgefuhrt. Die Teilchen wurden untersuchtnachdem das umgebende Plasma relaxierte. Der Einfluss konstanter elektrischer Felder,der Teilchengroße, der Position und der Plasmaparameter auf die verbleibende Ladungwurden gezeigt.
In den verbleibenden Kapiteln wurden die Moglichkeiten zur Gestaltung des Wechsel-wirkungspotentials beschrieben. In fruheren Experimenten wurde der Einfluss eines al-ternierenden Feldes entlang des elektrischen Feldes in der Plasmarandschicht gezeigt. Dasveranderte Potential fuhrte in diesem Fall zu langen Ketten entlang des angelegten elek-trischen Feldes. Simulationen zu rotierenden elektrischen Feldern wurden durchgefuhrt.Um diese mit Experimenten zu vergleichen wurde eine zusatzliche leitende Glasbox einge-bracht.
Zunast wurde die Rotation des Clusters in Reaktion zu dem zusatzlichen elektrischenFeld beobachtet. Die Abhangingkeit der Rotationsgeschwindigkeit von der angelegten Fre-quenz wurde aufgezeigt.
In einer weiteren Serie wurden unter Verwendung holographischer Methoden 3D Datender untersuchten Cluster gewonnen. Diese beinhalten Informationen uber die interne Struk-tur des Clusters in vertikalen Teilchenketten und zylindrischen Schalen. Diese erhohte in-nere Ordnung des Clusters ahnelt der strukturellen Veranderung des simulierten Systems.

108 Zusammenfassung

Appendix A
Synchronization
A.1 Motivation
The Plasma Kristall 3 Plus (PK-3 Plus) setup saves next to the taken pictures also theparameters set as well as measured. These are saved to log files. Since the plasma pa-rameters and environmental conditions are of vital importance to understand the particlebehavior proper synchronization of the entries in the log files and the recorded pictures isnecessary. The pictures and the log files can be synchronized by using the format numbers.These numbers are given both in the log files and in the pictures.
The rate the format numbers are written to the log files is however not constant. It isproduced according to two programs which are used depending on whether the functiongenerators are employed (’Modtab.ini ’) or not (’Sorttab.ini ’). In both cases an internalclock is employed to call the entries in the according file and set values accordingly.
The two cases, the camera data format, the calculation, and the limitations will bediscussed in this appendix.
A.2 Without Function Generators
If no function generators are used the entries in the log files are created and written oneafter the other according to Sorttab.ini. In total 128 data words can be written.The formatnumber is set at every first data word. The time necessary for recording these is determinedby the pick up period (’Abholperiode’) ppick and the period of one sort cycle psort. The valuesfor these are given in ’System.ini ’. The time necessary to transfer and record all 128 datawords is thus given by:
trec =ppickpsort
=3716
1189200s = 0.4s
⇒ frec = 2.5Hz
(A.1)

110 A. Synchronization
A.3 With Function Generators
In case function generators are employed to manipulate the particle behavior the entrieswritten to the log files are chosen according to ’Modtab.ini’. The readout timing is alteredif function generators are used. It is now determined by the phase set 128 times permodulation (128 sampling points). It is divided into 128 phases as this is the numberof data words that can be written. This is independent of whether or not the functiongenerators are employed. Thus, also the time necessary to transfer and record these datawords (trec) remains the same.
The sampling point distance is calculated if the generators are switched on, their fre-quency is changed, or if the amplitude is adjusted. The firs modulation phase once thetiming of Sorttab.ini is finished. The modulation always starts with phase 32. The sam-pling point frequency fsam is adjusted with respect to the modulation frequency fmod:
fsam = 128 · fmod. (A.2)
If the modulation frequency is too high not every phase is set anymore and samplingpoints are left out. Assuming that n sampling points remain the sampling point frequencyis reduced to:
fsam = n · fmod. (A.3)
This can be adjusted by reducing the set value ’stepwidthexponent’, which gives the sam-pling step width in a power of two. The sampling point frequency is the time intervalbetween setting the phase and production of all according measured values.
In difference to the way the entries are written if no function generators are employednow the entries are written in 32 quadruples. In each quadruples the phase of the func-tion generator, the measured ion currents I0 and I1 and a measured value according toModtab.ini are recorded. In the first quadruples this value always is the Modtab.ini num-ber. The remaining 31 values can be chosen. For synchronization it is preferable if theformat number is written at least once to this file.
The build-in computer is capable of transferring and saving to the log file with a fre-quency of frec = 2.5 Hz. In case it is not able to process the log files as fast as themodulation requires or the modulation cannot be filled by a normal number of quadruplesa complicated sequence is written in order to write every phase of the modulation at leastonce. To a possible human reader of the log files this sequence caused by oversamplingmight look random.
A.4 Pictures
Every picture is taken during a 40 ms period. Afterwards the PAL (phase alternating line1)signal is read. In order to increase the frame rate to 50 Hz the even and odd lines of the
1for further explanations see for instance the wikipedia entry on the standard:http://en.wikipedia.org/wiki/PAL

A.4 Pictures 111
Figure A.1: A picture as recorded by the cameras in the PK3 plus setup. On the lower edgethe format number can be seen.
picture are read by two ports in parallel. The odd lines of the first picture are read by onechannel, the even by the other. For the second picture this situation is reversed. In thelower edge the format number (FN ), used as the main part in synchronizing the picturesand the housekeeping data, is given. Figure A.1 shows a picture as taken by the camerawith the format number on the lower left corner as decoded in bright and dark regions.
The format number given on the picture is the one valid in the moment the rows inwhich it is present are read out and transfered and not in the moment the picture isactually taken. This has to be remembered when trying to synchronize the pictures withthe housekeeping data later.
At some times the picture is read out in the moment the format number changes. Insuch cases half format numbers, as displayed in figure A.2(a), occur in the pictures. Thebroken format number is compared in this figure to the normal one, see figure A.2(b).
Note that in the PAL standard different amounts of lines are put between two picturesby the analog-to-digital converter (ADC) for synchronization. Before the odd frames 5lines are included whereas before the even frames only 4 lines are included. To reach aframe rate of 50 Hz the pictures with 576 lines each as recorded by the camera are readby two PAL signal readout channels. If recording at 50 Hz an additional white line is

112 A. Synchronization
Figure A.2: Portion of pictures as shown in figure A.1 including only the format numbers. Eachformat number display in a picture consists of two rows. In the upper row a scale is displayed.From the white and black squares in the lower row the format number can be read. A whitesquare represents a 0, a black one a 1. From left to right the square value decreases. Thus theformat number displayed in (b) is an odd number. Panel (a) shows a broken format number.These are used to synchronize the pictures with the log files. In comparison to that a normalunbroken format number is shown in (b).
introduced on top or on bottom of the frames in order not to loose any information. Thiswhite line can be seen on the bottom in figure A.1. A sketch of the way the PAL standardis synchronized and the times needed to read a certain number of lines is displayed infigure A.3.
The three cameras are all controlled by one master chip. This ensures that these aresynchronized. However, the chip also ensures that a picture has been taken to be readout if the PAL readout is ready. Thus it is possible that the cameras transmits slightlyfaster than the set frame rate which leads to uncertainties in the synchronization. Sincethe programming of the chip can neither be changed nor accessed anymore it is going tobe assumed that the set frame rate is the one achieved. This assumption is of coursefor simplification. For further experiments it is advised to take as much care during theprogramming of the cameras and the log file saving routines as it has been taken in writingthe log file routines in this setup.
A.5 Calculations
A.5.1 General
The aim of synchronization is to gain an information of the time elapsed until a certainnumber of frames has been taken:
First the broken format numbers are searched in the videos. These mark the times atwhich a new format number is generated and thus the old and the new format number aredisplayed in the video. Hence the format number is known to be an integer value. Since inthe video only integer values can be displayed the broken numbers are the ones where thetime of setting the new format number is best known. One frame recorded with a framerate of 50 Hz is read out by two PAL channels. Of the first image one channel reads theodd, the other the even lines. For the second image the situation is mirrored. Since thiswould then, when combining the two images from both channels, lead to a gibbering in

A.5 Calculations 113
Figure A.3: Scheme to illustrate the PAL signal readout. This scheme is reproduced from [82].
the video additional white lines are saved.
If a broken format number occurs each readout channels read 285 lines before the formatnumber has been changed. For the PAL synchronization 4 or 5 additional lines are takendepending on the frame number written. To write one line it takes 0.064 ms. The time ittakes for the PAL readout to reach the line in which the new format number is set is thengiven by:
tPAL = (4(5) + 285) · 0.064ms, (A.4)
depending on the frame number.
A.5.2 Without function Generators
In this case the format number frequency is constant. Thus the calculation of the numberof frames recorded between setting two format numbers is:
nframes =fcamera
frec, (A.5)
with fcamera being the camera frame rate. If this is set to 50 Hz the resulting frame numberis 20 frames. This ratio is very constant. Based on it the time elapses between producingtwo format numbers and thereby a correlation between the values in the log files and thecameras can be found.

114 A. Synchronization
Figure A.4: Limitation to the synchronization as calculated from sequences recorded at 50 Hz.The ideal ratio of the phase set frequency to the camera frame rate minus the real ratio isdisplayed. The absolute mean difference between the two equals 0.00604.
A.5.3 With function Generators
As discussed the most constant frequency in case of employing the function generatorsfound are the set values of the generators. Thus in the log files the integer format numberand the corresponding phase and cycle number have to be found. Each cycle consists of128 set points or phases. The first cycle starts with phase 32 since the current flowing to orfrom the chamber has to be zero for safety reasons on board the ISS. The following cyclesstart at phase 0. Since 128 phases are set to describe one cycle the time elapsed for eachphase is determined by the phase set frequency:
tphase =ncycles · 128 + nphase − 33
fphase. (A.6)
Since the frequency of the function generators is set by 128 phases the phase set frequencyfphase can be calculated depending on the set generator modulation frequency falternation:
fphase = 128 · falternation (A.7)
The number of full cycles ncycles starts at zero. Since the first phase starts at 32, and thecount there starts as well at 0 another 33 phases have to be subtracted to find the initialpoint of excitation. Knowing all these times the time elapsed between the beginning of theexcitation and the change into a given format number is:
tel = tphase + tPAL. (A.8)
By multiplying this with the frame rate of 50 Hz one gains the number of frames takensince the excitation is on. Comparing this value to which the frame number in which thebroken format number taken for synchronization has been observed results in the framenumber in which the excitation has initially been introduced.

A.5 Calculations 115
Please note that a change in amplitude should not change the relations whereas achange in frequency or switching the generators will. In these cases the synchronizationhas to be renewed.
Since the synchronization has been performed in a variety of cases throughout thisthesis a good estimate of the synchronization limit can be given. The number of phasesset per taken frame is calculated. If the camera would run at exactly 50 Hz this ratio at asampling point frequency of 128 Hz would lead to a ratio of:
rideal =fphasefcamera
=128Hz
50Hz= 2.56 (A.9)
In figure A.4 the difference between the ideal ratio and the synchronization is displayed.The absolute mean difference is calculated to be 0.00604. Assuming that the phase
set frequency is constant a time limit to the synchronization can be calculated to about0.27 frames which is equal to 5.4 ms. This is the reason for the inability of calculatingthe phases correctly in chapter 5. However, it is sufficient for most of the experimentsconducted in this setup.

116 A. Synchronization

List of Figures
1.1 Regions of a dc discharge. The sketch is taken from ref. [128] . . . . . . . . 71.2 U-I characteristics of a DC discharge . . . . . . . . . . . . . . . . . . . . . 81.3 Sketch of a radio frequency driven plasma, [71, 127, 128]. . . . . . . . . . . 91.4 Sketch of the electrical configuration of a RF plasma, [71, 214] . . . . . . . 101.5 Langmuir probe measurement . . . . . . . . . . . . . . . . . . . . . . . . . 13
2.1 Grown particles,[19, 37] . . . . . . . . . . . . . . . . . . . . . . . . . . . . . 182.2 Melaminformaldehyde (MF) particles and glass hollow spheres, [83, 120] . . 182.3 A deformed MF particle . . . . . . . . . . . . . . . . . . . . . . . . . . . . 192.4 Orbital motion limiting theory accuracy test, [68]. . . . . . . . . . . . . . . 202.5 Wake field as it forms downstream a particle, [151]. . . . . . . . . . . . . . 252.6 The wake field potential distribution . . . . . . . . . . . . . . . . . . . . . 262.7 Interaction potential for different Mach numbers [109] . . . . . . . . . . . . 28
3.1 Growth stages . . . . . . . . . . . . . . . . . . . . . . . . . . . . . . . . . . 323.2 Chemical reactions during nucleation, [54]. . . . . . . . . . . . . . . . . . . 333.3 Electron density during particle formation, [116] . . . . . . . . . . . . . . . 36
4.1 PK-4 setup . . . . . . . . . . . . . . . . . . . . . . . . . . . . . . . . . . . 404.2 Pictures of the growth cycle . . . . . . . . . . . . . . . . . . . . . . . . . . 414.3 Examples for each of the three observed growth cases. . . . . . . . . . . . . 434.4 Growth frequency and scattered light intensity. . . . . . . . . . . . . . . . 444.5 Absence of particle growth. . . . . . . . . . . . . . . . . . . . . . . . . . . 454.6 SEM pictures . . . . . . . . . . . . . . . . . . . . . . . . . . . . . . . . . . 464.7 Particle size dependence on the plasma runtime and the neutral gas flow. . 474.8 Transportation time. . . . . . . . . . . . . . . . . . . . . . . . . . . . . . . 484.9 Instabilities as they occur in the vicinity of grown particles. . . . . . . . . . 49
5.1 PK-3 Plus setup [206] . . . . . . . . . . . . . . . . . . . . . . . . . . . . . . 545.2 Decharging conditions . . . . . . . . . . . . . . . . . . . . . . . . . . . . . 565.3 All tracks after correcting on the thermal gradient. . . . . . . . . . . . . . 575.4 Fit result . . . . . . . . . . . . . . . . . . . . . . . . . . . . . . . . . . . . 585.5 Charge distribution for the three switching off conditions. . . . . . . . . . . 595.6 Charge distributions for all observed particle sizes . . . . . . . . . . . . . . 61

118 List of Figures
6.1 Phase transition in an electrorheological plasma, [95] . . . . . . . . . . . . 636.2 Layers in electrorheological plasmas as simulated by Brandt, [34]. . . . . . 646.3 Cluster shell structure, [4] . . . . . . . . . . . . . . . . . . . . . . . . . . . 656.4 Confinement in a non-conductive glass box, [5] . . . . . . . . . . . . . . . . 66
7.1 The GEC setup . . . . . . . . . . . . . . . . . . . . . . . . . . . . . . . . . 707.2 Side and top view of the particle cluster, [MY1] . . . . . . . . . . . . . . . 727.3 Fit of the vx,y vs y, x distribution, [MY1]. . . . . . . . . . . . . . . . . . . . 737.4 The distribution of cluster rotation frequency, [MY1]. . . . . . . . . . . . . 747.5 Ion drag force and electric force in the box, [MY1]. . . . . . . . . . . . . . 747.6 Plasma shielding inside the glass box, [MY1]. . . . . . . . . . . . . . . . . . 757.7 Rotation speed distribution along the cluster height, [MY1]. . . . . . . . . 767.8 Vertical resonance frequency . . . . . . . . . . . . . . . . . . . . . . . . . . 777.9 Sequence on the technique to levitate a single particle, [MY1]. . . . . . . . 77
8.1 Picture and sketch of the chamber in Kiel. . . . . . . . . . . . . . . . . . . 818.2 Sketch of the particle identification method, [118]. . . . . . . . . . . . . . . 838.3 Result of the 3D cluster analysis. . . . . . . . . . . . . . . . . . . . . . . . 858.4 Shell rotation in the cluster. . . . . . . . . . . . . . . . . . . . . . . . . . . 868.5 Global and string coordinate systems. . . . . . . . . . . . . . . . . . . . . . 888.6 Geometric limitations . . . . . . . . . . . . . . . . . . . . . . . . . . . . . . 898.7 Example of the string identification in one frame. . . . . . . . . . . . . . . 908.8 Three representative examples of the evolution of the particles. . . . . . . . 918.9 String life times . . . . . . . . . . . . . . . . . . . . . . . . . . . . . . . . . 928.10 String life times for the three cases. . . . . . . . . . . . . . . . . . . . . . . 948.11 Angular (∆φ = Φ− φ and θ) distributions . . . . . . . . . . . . . . . . . . 958.12 Radial distribution and mean inter particle distances. . . . . . . . . . . . . 978.13 Competing global cluster symmetries. . . . . . . . . . . . . . . . . . . . . . 99
A.1 A picture as recorded by the cameras in the PK3 plus setup. . . . . . . . . 111A.2 Two format numbers . . . . . . . . . . . . . . . . . . . . . . . . . . . . . . 112A.3 Scheme of the PAL signal . . . . . . . . . . . . . . . . . . . . . . . . . . . 113A.4 Synchronization limitation. . . . . . . . . . . . . . . . . . . . . . . . . . . . 114

Bibliography
[MY1] L. Worner, V. Nosenko, A. V. Ivlev, S. K. Zhdanov, H. M. Thomas, G. E. Morfill,M.Kroll, J. Schablinski, and D. Block, Phys. Plasmas 18, 063706 (2011)
[MY2] L. Worner, E. Kovacevic, J. Berndt, H. M. Thomas, M. H. Thoma, L. Boufendi,and G. E. Morfill, New J. Phys. 14, 023024 (2012)
[MY3] L. Worner, C. Rath, V. Nosenko, S. K. Zhdanov, H. M. Thomas, J. Schablinski, D.Block, and G. E. Morfill, accepted by Europ. Phys. Lett.
[1] E. Allahyarov, I. D’Amico, and H. Lowen, Phys. Rev. Lett. 81, 1334 (1998)
[2] J. E. Allen, R. L. F. Boyd, and P. Reynolds, Proc. Phys. Soc. B70, 297 (1957)
[3] J. E. Allen, Physica Scripta. Vol. 45, 497 (1992)
[4] O. Arp, D. Block, and A. Piel, Phys. Rev. Lett. 93, 165004 (2004)
[5] O. Arp, D. Block, M. Klindworth, and A. Piel, Phys. Plasmas 12, 122102 (2005)
[6] O. Arp, D. Caliebe, K. O. Menzel, A. Piel, J. A. Goree, IEEE Transactions on PlasmaScience 38, No. 4, 842 (2009)
[7] C. Arnas, M. Mikikian, and F. Doveil, Phys. Rev. E 60, No. 6, 7420 (1999)
[8] C. Arnas, A. Mouberi, K. Hassouni, A. Michau, G. Lombardi, X. Bonnin, F. Benedicand B. Pegourie, J. Nucl. Mater. 390-391, 140-143 (2009)
[9] C. Arnas, M. Mikikian, G. Bachet, and F. Doveil, Phys. Plasmas 7, 4418 (2000)
[10] Y. Ando, J. Kuwabara, K. Suzuki, and A. Sawabe, Diamond and Rel. Mat. 13, 1975(2004)
[11] N. Angert, CERN 94-01, 619 (1994)
[12] J. C. Angus and C. C. Hayman, Science 241, 913 (1988)
[13] B. M. Annaratone, T. Antonova, C. Arnas, P. Bandyopadhyay, M. Chaudhuri, C.-R.Du, Y. Elskens, A. V. Ivlev, G. E. Morfill, V. Nosenko, K. R. Sutterlin, M. Schwabeand H. M. Thomas, Plasma Sources Sci. Technol. 19, 065026 (2010)

120 BIBLIOGRAPHY
[14] W. D. Arnett and D D. Clayton, Nature 227, 780(1970)
[15] R. Basner, F. Sigeneger, D. Loffhagen, G. Schubert, H. Fehske, and H. Kersten, NewJ. Phys. 11, 013041 (2009)
[16] H. Baumgartner, D. Block, and M. Bonitz, Contrib. Plasma Phys. 49, 281 (2009)
[17] J. Beckers, W. W. Stoffels, and G. M. W. Kroesen, J. Phys. D: Appl. Phys. 42,155206 (2009)
[18] J. Beckers, T. Ockenga, M. Wolter, W. W. Stoffels, J. van Dijk, H. Kersten, and G.M. W. Kroesen, Phys. Rev. Lett. 106, 115002 (2011)
[19] J. Berndt, E. Kovavcevic, I. Stefanovic, O. Stepanovic, S. H. Hong, L. Boufendi, andJ. Winter, Contrib. Plasma Phys. 49, No. 3 (2009)
[20] J. Berndt, E. Kovacevic, and L. Boufendi, J. Appl. Lett. 106, 063309 (2009)
[21] D. Block, S. Kading, A. Melzer, A. Piel, H. Baumgartner, and M. Bonitz, Phys.Plasmas 15, 040701 (2008)
[22] D. Block, J. Carstensen, P. Ludwig, W. J. Miloch, F. Greiner, A. Piel, M. Bonitz,and A. Melzer, accepted by Contr. Plasma Phys.
[23] B. E. Blue, C. E. Clayton, C. L. OConnell, F.-J. Decker, M. J. Hogan, C. Huang, R.Iverson, C. Joshi, T. C. Katsouleas, W. Lu, K. A. Marsh, W. B. Mori, P. Muggli, R.Siemann, and D.Walz, Phys. Rev. Lett. 90, 214801 (2003)
[24] D. Bohm, E. H. S. Burhop, and H. S. W. Massey, McGraw-Hill Book Company, Inc.,New York (1949)
[25] M. Bonitz, C. Henning, and D. Block, Rep. Prog. Phys. 73, 066501 (2010)
[26] X. Bonnin, G. Lombardi, K. Hassouni, A. Michau, F. Benedic, and C. Arnas, J. Nuc.Mat. 363-365, 1191 (2007)
[27] J. E. Borovsky, Phys. Fluids 29, 718 (1986)
[28] A. Bouchoule, Dusty Plasmas, John Wiley and Sons LTD, Chichester, first edition(1999)
[29] L. Boufendi, A. Plain, J. Ph. Blondeau, A. Bouchoule, C. Laure, and M. Toogood,Appl. Phys. Lett. 60, 169 (1992)
[30] L. Boufendi, A. Bouchoule, and T. Hbid, J. Vac. Sci. Technol. A 14, 572 (1996)
[31] L. Boufendi, J. Gaudin, S. Huet, G. Viera, and M. Dudemaine, Appl. Phys. Lett.79, 4301 (2001)

BIBLIOGRAPHY 121
[32] L. Boufendi and A. Bouchoule, Plasma Sources Sci. Technol. 11, A211 (2002)
[33] P. C. Brandt, A.V. Ivlev, and G.E. Morfill, J. Chem. Phys. 130, 204513 (2009)
[34] P. C. Brandt, Dissertation, Ludwig Maximilian Universitat, Munchen (2010)
[35] P. C. Brandt, A.V. Ivlev, and G.E. Morfill, J. Chem. Phys. 132, 234709 (2010)
[36] I. N. Bronstein, K. A. Semendjajew, G. Musiol, and H. Muhlig, WissenschaftlicherVerlag Harri Deutsch GmbH, 7. Auflage (2008)
[37] M. A. Cappelli, T. G. Owano, and C. H. Kruger, J. Mater. Res. 5(11), 2326 (1990)
[38] J. Carstensen, F. Greiner, L.-J. Hou, H. Maurer, and A. Piel, Phys. Plasmas 16,013702 (2009)
[39] J. Carstensen, F. Greiner, and A. Piel, Phys. Plasmas 17, 083703 (2010)
[40] J. Carstensen, H. Jung, F. Greiner, and A. Piel, Phys. Plasmas 18, 033701 (2011)
[41] J. Carstensen, F. Greiner, D. Block, J. Schablinski, W. J. Miloch, and A. Piel, Phys.Plasmas 19, 033702 (2012)
[42] P. Casavecchia, N. Balucani, M. Alagia, L. Cartechini, and G. G. Volpi, Acc. Chem.Res. 32, 503 (1999)
[43] F. F. Chen, Plasma Sources Sci. Technol. 18, 035012 (2009)
[44] S. J. Choi and M. J. Kushner, J. Appl. Phys 74, 853 (1993)
[45] S. J. Choi, P. L. G. Ventzek, R. J. Hoekstra, and M. J. Kushner, Plasma SourcesSci. Technol. 3), 418 (1994)
[46] J. H. Chu and I. Lin, Phys. Rev. Lett., 72, 4009 (1994)
[47] L. Couedel, M. Mikikian, and L. Boufendi, Physical Review E 74, 026403 (2006)
[48] L. Couedel, A. Mezeghrane, A. A. Samarian, M. Mikikian, Y. Tessier, M. Cavarroc,and L. Boufendi, Contrib. Plasma Phys. 49, No.4-5, 235 (2009)
[49] L. Couedel, M. Mikikian, A.A. Samarian, and L. Boufendi, Phys. Plasmas 17, 083705(2010)
[50] L. Couedel, V. Nosenko, A. V. Ivlev, S. K. Zhdanov, H. M. Thomas, and G. E.Morfill, Phys. Rev. Lett. 104, 195001 (2010)
[51] C. Cui and J. Goree, IEEE Trans. Plasma Sci. 22, 151 (1994)
[52] R. P. Dahiya, G. V. Paeva, W. W. Stoffels, E. Stoffels, G. M. W. Kroesen, K. Avinash,and A. Bhattacharjee, Phys. Rev. Lett. 89, 125001 (2002)

122 BIBLIOGRAPHY
[53] J. E. Daugherty, R. K. Porteus, and D. B. Graves, J. Appl. Phys. 73, 1617 (1993)
[54] K. de Bleecker, A. Bogaerts, and W. Goedheer, Phys. Rev. E 73, 026405 (2006)
[55] I. Denysenko, J. Berndt, E. Kovacevic, I. Stefanovic, V. N. Selenin, and J. Winter,Phys. Plasmas 13, 073507 (2006)
[56] M. A. Dopita, B. A. Groves, R. S. Sutherland, and L. J. Kewley, The Astrophys.Journal 583, 727 (2003)
[57] J. Dorschner and T. Henning, The Astron. Astrophys. Rev. 6, 271 (1995)
[58] S. C. Eaton and M. K. Sunkara, Diamond and Related Materials 9, 1320 (2000)
[59] C. A. Eckert, B. L. Knutson, and P. G. Debenedetti, Nature 383, 313(1996)
[60] P. S. Epstein, Phys. Rev. 23, 710 (1924)
[61] Y. Feng, J. Goree, and B. Liu, Rev. Sci. Instr. 78, 053704 (2007)
[62] A. A. Fridman, L. Boufendi, T. Hbid, B. V. Potapkin, and A. Bouchoule, J. Appl.Phys, 79 (3), 1303 (1996)
[63] T. Fujii, J. Appl. Phys. 82, 2056 (1997)
[64] V. E. Fortov, A. P. Nefedov, V. M Tochinskii, V. I. Molotkov, A. G. Khrapak, O. F.Petrov, and K. F. Volykhin, JETP Lett. 64, 92 (1996)
[65] V. E. Fortov, A. P. Nefedov, V. I. Molotkov, M.Y. Poustylnik, and V. M. Torchinsky,Phys. Rev. Lett. 87, 205002 (2001)
[66] V. E. Fortov, A. G. Khrapak, S. A. Khrapak, V. I. Molotkov, and O. F. Petrov,Physics - Uspekhi 47, 447 (2004)
[67] V. E. Fortov, O. F. Petrov, A. D. Usachev, and A. V. Zobnin, Phys. Rev. E 70,046415 (2004)
[68] V. E. Fortov, A. V. Ivlev, S. A. Khrapak, A. G. Khrapak, and G. E. Morfill, PhysicsReports 421, 1-103 (2005)
[69] V. Fortov, G. Morfill, O. Petrov, M. Thoma, A. Usachev, H. Hoefner, A. Zobnin, M.Kretschmer, S. Ratynskaia, M. Fink, K. Tarantik, Yu. Gerasimov, and V. Esenkov,Plasma Phys. Contrl. Fusion 47, B537 (2005)
[70] B. Friedel and S. Greulich-Weber, small 7, 859(2006)
[71] D. Gahan, S. Daniels, C. Hayden, D. O’Sullivan, and M. B. Hopkins, Plasma SourcesSci. Technol. 21, 015002 (2012)

BIBLIOGRAPHY 123
[72] A. Garscadden, B. Ganguly, P. Haarland, and J. Williams, Plasma Sources Sci.Technol. 3, 239 (1994)
[73] S. Girshik and P. Agarwal, private communications, ICOPS and WPDP (2012)
[74] C. K. Goertz and G. E. Morfill, Icarus 53, 219 (1983)
[75] A. de Graaf, M. F. A. M. van Hest, M. C. M. van de Sanden, K. G. Y. Letourneur,and D. C. Schram, Appl. Phys. Lett. 74, 2927 (1999)
[76] J. Goree, Plasma Sources Sci. Technol. 3, 400 (1994)
[77] J. Goree, G. E. Morfill, V. N. Tsytovich, and S. V. Vladimirov, Phys. Rev. E 59,7055 (1999)
[78] O. Havnes, C. K. Goertz, G. E. Morfill, E. Grun, and W. Ip, J. Geophys. Res. 92,2281 (1987)
[79] Y. Hayashi and K. Tachibana, Jpn. J. Appl. Phys. 33, L804 (1994)
[80] R. Heidemann, S. Zhdanov, K. R. Sutterlin, H. M. Thomas and G. E. Morfill, Europ.Phys. Lett. 96, 15001 (2011)
[81] R. Hewins, R. Jones, and E. Scott, Cambridge University, Cambridge (1996)
[82] http://martin.hinner.info/vga/pal.html
[83] http://www.microparticles.de/
[84] S. Hofmann and G. Munzenberg, Rev. Mod. Phys., 72, 733 (2000)
[85] S. Hong, J. Berndt, and J. Winter, Plasma Sources Sci. Technol. 12, 46 (2003)
[86] P. Huber, Dissertation, Ludwig Maximilian Universitat, Munchen (2011)
[87] M. Hundt, P. Sadler, I. Levchenko, M.Wolter, H. Kersten, and K. Ostrikov, J. Appl.Phys. 109, 123305 (2011)
[88] H. Ikezi, Physics of Fluids 29, 1764 (1986)
[89] H. Imanaka, B. N. Khare, J. E. Elsila, E. L. O. Bakes, C. P. McKay, D. P. Cruikshank,S. Sugita, T. Matsui, and R. N. Zare, Icarus 168, 344 (2004)
[90] T. Inoue, H. Tachibana, K. Kumagai, K. Miyata, K. Nishimura, K. Kobashi, and A.Nakaue, J. Appl. Phys. 67, 7329 (1990)
[91] C.-W. Io, C.-L. Chan, and L. I, Phys. Plasmas 17, 053703 (2010)
[92] Y. Ivanov and A. Melzer, Phys. Rev. E 79, 036402 (2009)

124 BIBLIOGRAPHY
[93] A. V. Ivlev, U. Konopka, and G. Morfill, Phys. Rev. E 62, 2739 (2000)
[94] A. V. Ivlev, M. Kretschmer, M. Zuzic, G. E. Morfill, H. Rothermel, H. M. Thomas,V. E. Fortov, V. I. Molotkov, A. P. Nefedov, A. M. Lipaev, O. F. Petrov, Yu. M.Baturin, A. I. Ivanov, and J. Goree, Phys. Rev. Lett. 90, 055003 (2003)
[95] A. V. Ivlev, G. E. Morfill, H. M. Thomas, C. Rath, G. Joyce, P. Huber, R. Kom-paneets, V. E. Fortov, A. M. Lipaev, V. I. Molotkov, T. Reiter, M. Turin, and P.Vinogradov, Phys. Rev. Lett. 100, 095003 (2008)
[96] J. A. Johnson and R. Ramaiah, Phys. Rev. A 36, No. 2, 774 (1987)
[97] A. V. Ivlev, P. C. Brandt, G. E. Morfill, C. Rath, H. M. Thomas, G. Joyce, V.E. Fortov, A. M. Lipaev, V. I. Molotkov, and O. F. Petrov, IEEE Transactions onPlasma Science 38, 733 (2010)
[98] A. V. Ivlev, M. H. Thoma, C. Rath, G. Joyce, and G. E. Morfill, Phys. Rev. Lett.106, 155001 (2011)
[99] H. Kersten, H. Steffen, D. Vender, and H. E. Wagner, Vacuum 48(3), 305 (1995)
[100] T. Kewitz and H. Kersten, Galvanotechnik 4, 866 (2010)
[101] S. A. Khrapak, D. Samsonov, G. Morfill, H. Thomas, V. Yaroshenko, H. Rothermel,T. Hagl, V. Fortov, A. Nefedov, V. Molotkov, O. Petrov, A. Lipaev, A. Ivanov, andY. Baturin, Phys. Plasmas 10, 1-4 (2003)
[102] S. A. Khrapak, S. V. Ratynskaia, A. V. Zobnin, A. D. Usachev, V. V. Yaroshenko,M. H. Thoma, M. Kretschmer, H. Hofner, G. E. Morfill, O. F. Petrov, and V. E.Fortov, Phys. Rev. E 72, 016406 (2005)
[103] S. A. Khrapak, H. M. Thomas, and G. E. Morfill, Europ. Phys. Lett. 91, 25001(2010)
[104] S. A. Khrapak, P. Tolias, S. Ratynskaia, M. Chaudhuri, A. Zobnin, A. Usachev, C.Rau, M. H. Thoma, O. F. Petrov, V. E. Fortov, and G. E. Morfill, Europ. Phys. Lett.97, 35001 (2012)
[105] C. Killer, A. Schella, T. Miksch, and A. Melzer, Phys. Rev. B 84, 054104 (2011)
[106] B. Klumov, P. Huber, S. Vladimirov, H. Thomas, A. Ivlev, G. Morfill, V. Fortov, A.Lipaev, and V. Molotkov, Plasma Phys. Control. Fusion 51, 124028 (2009)
[107] R. Kompaneets, S. V. Vladimirov, A. V. Ivlev, V. Tsytovich, and G. Morfill, Phys.Plasmas 13, 072104 (2006)
[108] R. Kompaneets, Dissertation, Ludwig Maximilian Universitat, Munchen (2007)

BIBLIOGRAPHY 125
[109] R. Kompaneets, G.E. Morfill und A.V. Ivlev, Physics of Plasmas 16, 043705 (2009)
[110] J. Kong, T. W. Hyde, L. Matthews, K. Qiao, Z. Zhang, and A. Douglass, PhysicalReview E 84, 016411 (2011)
[111] U. Konopka, Dissertation, Ruhr Universitat, Bochum (2000)
[112] U. Konopka, G. E. Morfill, and L. Ratke, Phys. Rev. Lett. 84, 891 (2000)
[113] U. Kortshagen and U. Bhandarkar, Phys. Rev. E 60, 887 (1999)
[114] E. Kovacevic, I. Stefanovic, J. Berndt, and J. Winter, J. Appl. Lett. 93, 2924 (2003)
[115] E. Kovacevic, I. Stefanovic, J. Berndt, Y. Pendleton, and J. Winter, Astrophys. J.623, 242 (2005)
[116] E. Kovacevic, Dissertation, Ruhr Universitat, Bochum (2006)
[117] M. Kroll, S. Harms, D. Block, and A. Piel, Phys. Plasmas 15, 063703 (2008)
[118] M. Kroll, J. Schablinski, D. Block, and A. Piel, Phys. of Plasmas 17, 013702 (2010)
[119] M. Kroll, L. Muhlfeld, and D. Block, IEEE Trans. Plasma Sci. 38, 897 (2010)
[120] M. Kroll, Dissertation, Christian Albrecht Universitat, Kiel (2010)
[121] M. J. Kushner, J. Appl. Phys. 63, 2532 (1988)
[122] M. Lampe, G. Joyce, G. Ganguli, and V. Gavrishchaka, Phys. Plasmas 7, 3851 (2000)
[123] M. Lampe, G. Joyce, and G. Ganguli, IEEE Transactions on Plasma Science 33, 57(2005)
[124] V. Land and W. J. Goedheer, New J. Phys. 10, 123028 (2008)
[125] V. Land, B. Smith, L. Matthews, and T. Hyde, IEEE Trans. Plasma Sci. 38, 768(2010)
[126] E. J. Lerner, Ind. Phys. 6, 16 (2000)
[127] M. A. Lieberman and V. A. Godyak, IEEE Transactions on Plasma Science 26, 955(1998)
[128] M. A. Lieberman and A. J. Lichtenberg, Principles of Plasma Discharges and Ma-terials Processing, John Wiley and Sons, Inc, Hoboken, New Jersey, second edition(2005)
[129] A. M. Lipaev, S. A. Khrapak, V. I. Molotkov, G. E. Morfill, V. E. Fortov, A. V.Ivlev, H. M. Thomas, A. G. Khrapak, V. N. Naumkin, A. I. Ivanov, S. E. Tretschev,and G. I. Padalka, Phys. Rev. Lett. 98, 265006 (2007)

126 BIBLIOGRAPHY
[130] L. B. Loeb, Phys. Rev. 76, No. 2, 255 (1949)
[131] P. Ludwig, H. Kahlert, and M. Bonitz, Plasma Phys. Control. Fusion 54, 045011(2012)
[132] 3M GMBH Deutschland, Industriestraße, 55743 Idar-Oberstein
[133] J. E. Martin, J. Odinek, T. C. Halsey, and R. Kamien, Phys. Rev. E 57, 756 (1998)
[134] K. Matyash, R. Schneider, R. Ikkurthi, L. Lewerentz, and A. Melzer, Plasma Phys.Control. Fusion 52, 124016 (2010)
[135] H. R. Maurer, V. Schneider, M. Wolter, R. Basner, T. Trottenberg, and H. Kersten,Contrib. Plasma Phys. 51, No. 2-3, 218 (2011)
[136] P. F. McMillan and H. E. Stanley, Nature Physics 6, 479 (2010)
[137] F. Melandsø, T. Aslaksen, and O. Havnes, Planet. Space Sci. 41, 321 (1993)
[138] A. Melzer, A. Hofmann, and A. Piel, Phys. Rev. E 53, 2757 (1996)
[139] A. Melzer, V. A. Schweigert, and A. Piel, Phys. Rev. Lett. 83, 3194 (1999)
[140] A. Melzer, Plasma Souces Sci Technol. 10, 303 (2001)
[141] A. Melzer, Phys. Rev. E 73, 056404 (2006)
[142] A. Melzer, B. Buttenschon, T. Miksch, M. Passvogel, D. Block, O. Arp, and A. Piel,Plasma Phys. Control. Fusion 52, 124028 (2010)
[143] R. L. Merlino, Am. J. Phys. 75, 12(2007)
[144] A. Michau, G. Lombardi, C. Arnas, L. Colina Delacqua, M. Redolfi, X. Bonnin, andK. Hassouni, Plasma Sources Sci. Technol. 19, 034023 (2010)
[145] A. Michau, G. Lombardi, C. Arnas, X. Bonnin, K. Hassouni, J. Nucl. Mater. 415,pp. S1077-S1080 (2011)
[146] A. Michau, G. Lombardi, L. C. Delacqua, M. Redolfi, C. Arnas, P. Jestin, X. Bonnin,K. Hassouni, Plamsa Chemnistry and Plasma Processing 32, 451(2012)
[147] G. Mie, Ann. Phys. 25, 377 (1908)
[148] M. Mikikian, L. Boufendi, A. Bouchoule, H. M. Thomas, G. E. Morfill, A. P. Nefedov,V. E. Fortov, and the PKE Nefedov team, New J. Phys. 5, 19 (2003)
[149] M. Mikikian, L. Couedel, M. Cavarroc, Y. Tessier, and L. Boufendi, New. J. Phys.9, 268 (2007)

BIBLIOGRAPHY 127
[150] M. Mikikian, L. Couedel, M. Cavarroc, Y. Tessier, and L. Boufendi, Eur. Phys. J.Appl. Phys. 49, 13106 (2010)
[151] W. J. Miloch, M. Kroll, and D. Block, Phys. Plasmas 17, 103703 (2010)
[152] L. Minnhagen, Journal of the Optical Society of America 63, No 10, 1185 (1973)
[153] S. Mitic, R. Sutterlin, A. V. Ivlev, H. Hoffner, M. H. Thoma, S. Zhdanov, and G. E.Morfill, Phys. Rev. Lett. 101, 235001 (2008)
[154] S. Mitic, M. Y. Pustylnik, G. E. Morfill, and E. Kovacevic, Optics letters 36, No.18, 3699 (2011)
[155] M. Moravej and R. F. Hicks, Chem. Vap. Deposition 11, 469 (2005)
[156] G. E. Morfill, E. Grun, and T. V. Johnson, Planet. Space Sci. 28, 1087 (1980)
[157] G. E. Morfill and H. M. Thomas, Icarus 2, 539 (2005)
[158] G. E. Morfill, U. Konopka, M. Kretschmer, M. Rubin-Zuzic, H. M. Thomas, S. K.Zhdanov, and V. Tsytovich, New J. Phys. 8, 7 (2006)
[159] G. E. Morfill, A. V. Ivlev, Reviews of Mod. Physics 81, 1353 (2009)
[160] Y. Mori, K. Yoshii, K. Yasutake, H. Kakiuchi, H. Ohmi, K. Wada, Thin Solid Films444, 138 (2003)
[161] H. M. Mott-Smith and I. Langmuir, Physical Review 28, 727 (1926)
[162] T. Mussenbrock, R. P. Brinkmann, M. A. Lieberman, A. J. Lichtenberg, and E.Kawamura, Phys. Rev. Lett. 101, 085004 (2008)
[163] T. Nagai, Z. Feng, A. Kono, and F. Shoji, Phys. Plasmas 15, 050702 (2008)
[164] Y. Nakamura, J. Phys. D: Appl. Phys. 43, 365201 (2010)
[165] W. L. Nighan and W. J. Wiegand, Phys. Rev. A 10, No. 3, 922 (1974)
[166] V. Nosenko, A. V. Ivlev, S. K. Zhdanov, M. Fink, and G. E. Morfill, Phys. Plasmas16, 083708 (2009)
[167] V. Nosenko, S. K. Zhdanov, A. V. Ivlev, C. A. Knapek, and G. E. Morfill, Phys.Rev. Lett. 103, 015001 (2009)
[168] M. A. Olevanov, Yu. A. Mankelevich, and T. V. Rakhimova, Tech. Phys. 48, 1270(2003)
[169] J. K. Olthoff and K. E. Greenberg, J. Res. Natl. Inst. Stand. Technol. 100, No. 4,327 (1995)
128 BIBLIOGRAPHY
[170] N. Osterman, I. Poberaj, J. Dobnikar, D. Frenkel, P. Ziherl und D. Babic, Phys. Rev.Lett. 103, 228301 (2009)
[171] C. Plank, Biological Chemistry 384, 737 (2003)
[172] B. Povh, K. Rith, C. Scholz, F. Zetsche, Springer, 8. Auflage, XII, (2009)
[173] L. C. Qin, D. Zhou, A. R. Krauss, and D. M. Gruen, Appl. Phys. Lett. 72, 3437(1998)
[174] Yu. P. Raizer, Gas Discharge Physics, Springer, Berlin (1991)
[175] V. A. Rakov and M. A. Uman, Cambrige University Press, Thrid printing (2005)
[176] S. Ratynskaia, S. Khrapak, A. Zobnin, M. H. Thoma, M. Kretschmer, A. Usachev,V. Yaroshenko, R. A. Quinn, G. E. Morfill, O. Petrov, and V. Fortov, Phys. Rev.Lett. 93, No. 8, 085001 (2004)
[177] L. Ravi and S. L. Girshik, Phys Rev. E 79, 026408 (2009)
[178] C. J. Olson Reichhardt, C. Reichhardt, A. R. Bishop, Phys. Rev. Lett. 92, 016801(2004)
[179] E. Riedel, Anorganische Chemie, de Gruyter, Berlin-New York, 5. Aufl. (2002)
[180] H. S. Robertson, Phys. Rev. 105, No. 2, 386 (1957)
[181] S. Robertson and Z. Sternovsky, Phys. Rev. E 67, 046405 (2003)
[182] H. Rothermel, T. Hagl, G. E. Morfill, M. H. Thoma, and H. M. Thomas, Phys. Rev.Lett. 87, No. 17, 175001 (2002)
[183] W. D. Suranga Ruhunusiri and J. Goree, Phys. Rev. E 85, 046401 (2012)
[184] Y. Saito, T. Yoshikawa, M. Inagaki, M. Tomita, and T. Hayashi, Chem. Phys. Lett.204, 277 (1993)
[185] A. A. Samarian, O. S. Vaulina, A. P. Nefedov, V. E. Fortov,1 B. W. James, and O.F. Petrov, Phys. Rev. E 64, 056407 (2001)
[186] A. A. Samarian and B. W. James, Plasma. Phys. Controlled Fusion 47, B629 (2005)
[187] D. Samsonov and J. Goree, Phys. Rev. E 59, No. 1, 1047 (1999)
[188] J. Schablinski, D. Block, A. Piel, A. Melzer, H. Thomsen, H. Kahlert, and M. Bonitz,Phys. Plasmas 19, 013705 (2012)
[189] A. Schella, T. Miksch, A. Melzer, J. Schablinski, D. Block, A. Piel, H. Thomsen, P.Ludwig, and M. Bonitz, Phys. Rev. E 84, 056402 (2011)

BIBLIOGRAPHY 129
[190] M. Schwabe, Dissertation, Ludwig Maximilian Universitat, Munchen (2009)
[191] H. Setyawan, M. Shimada, Y. Hayashi, K. Okuyama, and S. Winardi, J. Appl. Phys.97, 043306 (2005)
[192] P. Sheng and W. Wen, Annu. Rev. Fluid Mech. 44, 143 (2012)
[193] T. Shimizu, J. L. Zimmermann and G. E. Morfill, New J. Phys. 13, 023026 (2011)
[194] F. Shoji, Z. Feng, A. Kono, and T. Nagai, Appl. Phys. Lett. 89, 171504 (2006)
[195] P. K. Shukla and A. A. Mamun, Introduction to Dusty Plasma Physics, Institute ofPhysics Publishing, London (2002)
[196] P. K. Shukla and B. Eliasson, Rev. Mod. Phys. 81, 25 (2009)
[197] A.V. Silhanek, M. V. Milosevic, R. B. G. Kramer, G. R. Berdiyorov, J. Van deVondel, R. F. Luccas, T. Puig, F. M. Peeters, and V. V. Moshchalkov, Phys. Rev.Lett. 104, 017001 (2010)
[198] R. Stanway, J. L. Sproston, und A. K. El-Wahed, Smart Materials and Structures 5,464 (1996)
[199] V. Steinberg, R. Sutterlin, A. V. Ivlev, and G. E. Morfill Phys. Rev. Lett. 86, 4540(2001)
[200] H. Stocker, Bibliografische Information Der Deutschen Bibliothek, 5. Auflage (2004)
[201] S. Stoykov, C. Eggs, and U. Kortshagen, J. Phys. D: Appl. Phys. 34, 2160 (2001)
[202] K. D. Supulver and D. N.C. Lin, Icarus 146, 525 (2000)
[203] M. Thoma, H. Hoffner, M. Kretschmer, S. Ratynskaia, G. E. Morfill, A. Usachev, A.Zobin, O. Petrov, and V. Fortov, Microgravity Sci. Technol. XVII-3/4, 47 (2006)
[204] H. M. Thomas, G. E. Morfill, V. Demmel, J. Goree, B. Feuerbacher, and D.Mohlmann, Phys. Rev. Lett., 73(5), 652 (1994)
[205] H. M. Thomas and G. E. Morfill, Nature 379, 806(1996)
[206] H. M. Thomas, G. E. Morfill, V. E. Fortov, A. V. Ivlev, V. I. Molotkov, A. M.Lipaev, T. Hagl, H. Rothermel, S. A. Khrapak, R. K. Suetterlin, M. Rubin-Zuzic, O.F. Petrov, V. I. Tokarev, and S. K. Krikalev, New J. Phys. 10, 033036 (2008)
[207] V. N. Tsytovic, Phys. Usp. 40, 53 (1997)
[208] O. S. Vaulina, S. A. Khrapak, A. A. Samarian, and O. F. Petrov, Phys. Scripta T84, 229 (2000)

130 BIBLIOGRAPHY
[209] O. Vaulina und S. Khrapak, J. Exp. Theor. Phys. 90, 287 (2000)
[210] S. Veprek, S. Reiprich, and L. Shizi, Appl. Phys. Lett. 66, 2640 (1995)
[211] Z. W. Wang, H. P. Fang, Z. F. Lin, L. W. Zhou Phys. Rev. E 61,6837 (2000)
[212] J. Waskoenig and T. Gans, Appl. Phys. Lett. 96, 181501 (2010)
[213] Y. Watanabe, M. Shiratani, and K. Koga, Plasma Sources Sci. Technol. 11, A229(2002)
[214] G. Wattieaux and L. Boufendi, Phys. Plasmas 19, 033701(2012)
[215] S. J. Weidenschilling, Icarus 127, 290 (1997)
[216] R. B. Wilson IV and N. K. Podder, Phys. Rev. E 76, 046405 (2007)
[217] W. M. Winslow, J. Appl. Phys. 20, 1137 (1949)
[218] J. Winter, Phys. Plasmas 7, 3862 (2000)
[219] W. A. Yarbrough and R. Messier, Science 247, 688 (1990)
[220] V. V. Yaroshenko, B. M. Annaratone, S. A. Khrapak, H. M. Thomas, G. E. Morfill,V. E. Fortov, A. M. Lipaev, V. I. Molotkov, O. F. Petrov, A. I. Ivanov, M. V. Turin,Phys. Rev. E 69, 066401 (2004)
[221] K. Yasutake, H. Ohmi, Y. Kirihata, H. Kakiuchi, Thin Solid Films 517, 242 (2008)
[222] J. H. Yoo und N. M. Wereley, J. Intelligent Mat. Syst. and Structures 13, 679 (2002)
[223] T. Yoshida, Y. Kousaka, and K. Okuyama, Ind. Eng. Chem. Fundam. 15, 37 (1976)
[224] C. Yunming and L. Ming, J. Phys. D Appl. Phys. 26, 1007 (1993)
[225] Yi Zeng, S. W. Lee, L. Gao, and C. X. Ding, J. Eurp. Ceramic Society 22, 347 (2002)
[226] S. Zhdanov, M. H. Thoma, C. A. Knapek, and G. E. Morfill, New Journal Phys. 14,023030 (2012)
[227] A. V. Zobnin, A. D. Usachev, O. F. Petrov, and V. E. Fortov, Phys. Plasmas 15,043705 (2008)
[228] M. Rubin-Zuzic, H. M. Thomas, S. K. Zhdanov, and G. E. Morfill, New J. Phys. 9,39 (2007)

Acknowledgements
First of all I want to thank Prof. Dr. Dr. h. c. G. E. Morfill and Prof. Dr. L. Boufendifor offering me the possibility to study at both their institutes. I am very grateful for theopportunities, support, and guidance offered by them during my thesis.
Next, I want to thank Dr. H. M. Thomas for his patience and support. I want to takethis opportunity to tell how much I appreciate his guidance.
My special thanks go to Dr. E. Kovacevic without whom the time in France wouldnot have been half as much fun as it was. She and her husband Dr. J. Berndt knew theanswers to all my questions.
Many thanks go to Dr. V. Nosenko who introduced me to the concepts of plasmaphysics. He is the best supervisor any student can possibly ask for.
I want to thank Dr. A. V. Ivlev, Dr. S. Zhdanov, Dr. M. H. Thoma, Dr. C. Rath,Dr. R. Sutterlin, Dr. L. Couedel, Dr. P. Huber, and Dr. P. Brandt for their patience andpersistence in helping me solving my problems.
I want to thank J. Schablinski, Dr. M. Kroll, and Dr. D. Block for the good cooperationand the great time we spend together in Kiel.
I want to thank C. Du and Dr. L. Talizadeh, for being the best office mates. I hadan amazing time with the two of you! Thank you for lightening up my mood wheneverneeded!
Furthermore, I want to thank Dr. U. Konopa, Dr. C. Knapek, Dr. M. Schwabe, Dr.S. Mitic, R. Heideman, J. Jeon, M. Fink, Dr. T. Antonova, Dr. L. Balika, H. Tawidian,and the remaining colleagues from MPE Munich, IHED Moscow, Gremi Orleans, and CAUKiel. Working in such a lively group of experts has inspired me.
Special thanks to Dr. J. Zimmerman for coffee breaks. Thank you for listening andbeing there when I needed support! In line with her I want to thank A. Langer for morethan only administrative help.
I want to thank H. Modest, A. Weißmann, and Dr. G. ’Dr. Gre’ Rossmanith, formany controversial discussions. The time spend with you in the office, on the Wiesn andanywhere else was great!
Last but definitely not least I want to thank the engineers at both institutes, namelyC. Rau, C. Deysenroth, K. Taratnik, T. Hagl, S. Dozias, and T. Lecas. I want to thankespecially S. Albrecht for technical support, scientific explanations, and thrilling ideas.