Landsat Detection of Oil from - 1 Natural Seeps - ASPRS
10
MORRIS DEUTSCH U.S. Geological Survey Reston, VA 22090 JOHN E. ESTES University of California Santa Barbara, CA 93106 Landsat Detection of Oil from 1 Natural Seeps Digital contrast-stretch enhancement showed the distribution of oil on the surface of the Santa Barbara Channel, California. INTRODUCTION S INCE THE launch of the first Earth Resources Technology Satellite (since renamed Landsat 1) on 23 July 1972, scientists have observed oil slicks on coastal and inland waters at different lo- cations around the world (Deutsch et al., 1977). These oil slicks were interpreted by the inves- tigators as having originated from man-made sources, including accidental spills and discharges from ships, oil-well platforms, and broken pipelines. Results of studies of the oil-detection capability of Landsats 1 and 2 indicate a potential natural sources in coastal, estuarine, or inland waters?'Halbouty (1976, p. 764) observed that "Landsat imagery may make possible the identifi- cation of natural marine-oil seeps with consequent improvement in the efficiency of offshore oil ex- ploration." A Landsat capability to detect offshore oil seeps would be significant, because archival Landsat data might contain valuable information for this application. Such information could prove significant as the world continues its search for new sources of energy. In order to more fully evaluate this potentially ABSTRACT: Oil on the ocean surface from the natural seeps in the Santa Bar- bara Channel, California, could not be detected on frames of any of the four bands of standard Landsat positive or negative film transparencies, nor could the slicks be detected using digital scaling, density slicing, or ratioing tech- niques. Digital contrast-stretch enhancement, however, showed the distribution of oil on the surface. Aerial observations made within a few hours of the Land- sat overpass confirmed the distribution of floating oil. The detection (on Land- sat images) offloating oil from submarine seeps indicates a potentially valuable application for offshore oil exploration and environmental monitoring. application of Earth-satellite data for environ- mental monitoring (Goldman and Horvath, 1975). Other applications include locating man-induced spills, planning cleanup operations, and assisting in the determination of the source or mode of ori- gin of the spills. Operational remote sensing for these applications would require repetitive cover- age with increased frequency-and real-time or near real-time data collection, processing, and dis- semination capabilities. An obvious question then follows, "If Landsat sensors have detected oil in the form of man-made pollution of the marine surface, have they not also detected upwelling or floating oil derived from PHOTOGRAMMETRIC ENGINEERING AND REMOTE SENSING, Vol. 46, No. 10, October 1980, pp. 1313-1322. valuable application, the U.S. Geological Survey, in collaboration with the Goddard Space Flight Center and the University of California, undertook a study of the ability of Landsat sensors to detect the surface expression of natural oil seeps. The test site for the experiment was the Santa Barbara Channel off the southern California coast. Natural oil seeps in this channel are well known and well documented. No natural oil seep was known to have been previously detected by Landsat-including those in the Santa Barbara Channel-despite many at- tempts to do so. Detection of a natural seep is far more difficult than detection of a major oil spill,
-
Upload
khangminh22 -
Category
Documents
-
view
3 -
download
0
Transcript of Landsat Detection of Oil from - 1 Natural Seeps - ASPRS

MORRIS DEUTSCH U.S. Geological Survey
Reston, VA 22090 JOHN E. ESTES
University of California Santa Barbara, CA 93106
Landsat Detection of Oil from 1 Natural Seeps
Digital contrast-stretch enhancement showed the distribution of oil on the surface of the Santa Barbara Channel, California.
INTRODUCTION
S INCE THE launch of the first Earth Resources Technology Satellite (since renamed Landsat
1) on 23 July 1972, scientists have observed oil slicks on coastal and inland waters at different lo- cations around the world (Deutsch et al., 1977). These oil slicks were interpreted by the inves- tigators as having originated from man-made sources, including accidental spills and discharges from ships, oil-well platforms, and broken pipelines. Results of studies of the oil-detection capability of Landsats 1 and 2 indicate a potential
natural sources in coastal, estuarine, or inland waters?'Halbouty (1976, p. 764) observed that "Landsat imagery may make possible the identifi- cation of natural marine-oil seeps with consequent improvement in the efficiency of offshore oil ex- ploration." A Landsat capability to detect offshore oil seeps would be significant, because archival Landsat data might contain valuable information for this application. Such information could prove significant as the world continues its search for new sources of energy.
In order to more fully evaluate this potentially
ABSTRACT: Oil on the ocean surface from the natural seeps in the Santa Bar- bara Channel, California, could not be detected on frames of any of the four bands of standard Landsat positive or negative film transparencies, nor could the slicks be detected using digital scaling, density slicing, or ratioing tech- niques. Digital contrast-stretch enhancement, however, showed the distribution of oil on the surface. Aerial observations made within a few hours of the Land- sat overpass confirmed the distribution of floating oil. The detection (on Land- sat images) offloating oil from submarine seeps indicates a potentially valuable application for offshore oil exploration and environmental monitoring.
application of Earth-satellite data for environ- mental monitoring (Goldman and Horvath, 1975). Other applications include locating man-induced spills, planning cleanup operations, and assisting in the determination of the source or mode of ori- gin of the spills. Operational remote sensing for these applications would require repetitive cover- age with increased frequency-and real-time or near real-time data collection, processing, and dis- semination capabilities.
An obvious question then follows, "If Landsat sensors have detected oil in the form of man-made pollution of the marine surface, have they not also detected upwelling or floating oil derived from
PHOTOGRAMMETRIC ENGINEERING AND REMOTE SENSING, Vol. 46, No. 10, October 1980, pp. 1313-1322.
valuable application, the U.S. Geological Survey, in collaboration with the Goddard Space Flight Center and the University of California, undertook a study of the ability of Landsat sensors to detect the surface expression of natural oil seeps. The test site for the experiment was the Santa Barbara Channel off the southern California coast. Natural oil seeps in this channel are well known and well documented.
No natural oil seep was known to have been previously detected by Landsat-including those in the Santa Barbara Channel-despite many at- tempts to do so. Detection of a natural seep is far more difficult than detection of a major oil spill,

PHOTOGRAMMETRIC ENGINEERING & REMOTE SENSING, 1980
because the seep represents discharge of rela- tively small quantities of oil from extensive sources over a long period of time, whereas a major oil slick represents discharge of a large quantity from a single static or moving source over a short time. Furthermore, the differences be- tween the seep-affected and the unaffected marine environment tend to be much more subtle because the characteristics of the oil are constantly altered by evaporation, oxidation, and other environmen- tal interactions. These complex interactions result in extreme variability of the characteristics of the oil and hence complicate its detection. The results discussed herein, however, demonstrate that, de- spite previous failures to detect natural oil seeps, Landsat did indeed record them with its multi- spectral scanner, but that specialized computer- assisted digital enhancement of the data was needed to depict visually the seeps on the Landsat data products. The success of Landsat in detecting oil seeps and of the computer processing tech- niques employed to depict them demonstrates the usefulness of future satellites as oil monitoring platforms.
PURPOSE AND SCOPE OF STUDY
The fundamental purpose of the study was to determine whether or not Landsats 1 or 2 have detected the floating oil known to have originated from naturally occurring submarine seeps. A corollary objective was to develop techniques of data processing and analysis that could be used with confidence to delineate oil floating in the vi- cinity of natural seeps. The scope of this paper is limited to the description of a digital analysis of Landsat 2 image 2267-17541, acquired on 16 Oc- tober 1975, over the Santa Barbara Channel, California (Figure 1). The authors failed to detect oil seeps during several earlier attempts in which they performed a photo-optical and densitometric analysis of Landsat images. Photo-optical en- hancement techniques, however, were used suc- cessfully by several investigators, whose studies are cited herein, to depict the larger and thicker man-induced oil slicks shown on Landsat imagery.
No attempt is made to cite all of the significant studies of oil-slick detection by airborne sensors operating in a wide variety of spectral bands ranging from ultraviolet to microwave. Such an effort would be far beyond the scope of this paper. A detailed description of the computer software programs employed, the mathematics involved, system electronics and engineering characteris- tics, and their relation to the multispectral scanner data is also beyond the scope of this paper. For such details, the reader is referred to the Data Analysis Laboratory of the U.S. Geological Sur- vey's EROS Data Center at Sioux Falls, South
PACIFIC OCEAN loud
FIG. 1. Annotated Landsat 2 ~ s s 5 negative print of image 2267-17541, depicting the area under investiga- tion.
Dakota, and to the Landsat Data Useis Handbook (NASA, 1976), or to the manufacturers of the equipment used herein.*
Goldman and Horvath (1975, p. 10) studied the optical properties of oil-coated versus nonoil- coated waters during their assessment of the feasi- bility of using satellite data for detecting and monitoring oil spills on oceans and estuaries. For more information on this subject, the reader is re- ferred to their description of the spectral charac- teristics of oil-water and nonoil-coated waters and to the references cited in their report to the Na- tional Aeronautics and Space Administration.
APPROACH TO THE PROBLEM
The Santa Barbara Channel was chosen as the test site for the study because of the occurrence of numerous submarine natural oil and gas seeps. Also, the area was readily accessible to the inves- tigators for surface and aerial observations and from the University of California at Santa Barbara, which provided additional field personnel and logistical support. It was assumed that imaging conditions would have to be almost ideal for Landsat to detect and delineate the distribution of the seeps. Adverse cloud, haze, wind, sea-state, or current conditions were observed during Landsat overpasses throughout the summer and early au- tumn of 1975. Finally, on 16 October 1975, the date of a Landsat 2 overpass, imaging conditions were
* The use of trade names in this report is for descrip- tive purposes only and is not intended as a product en- dorsement by the U.S. Geological Survey.

LANDSAT DETECTION OF OIL FROM NATURAL SEEPS
considered favorable for the experiment. NASA's Goddard Space Flight Center was requested to provide the investigators with computer-com- patible tapes (CCT'S) and film imagery for opti- cal and digital analysis and for comparison with field data of the Santa Barbara Channel.
Petroleum and petroleum by-products have historically been associated with human culture in the Santa Barbara region. The waters between the nearshore islands-San Miguel, Santa Rosa, Santa Cruz, and Anacapa-and the California mainland from Point Conception to Ventura are commonly referred to as the Santa Barbara Channel. Natural seeps of tar, oil, and gas are present along the mar- gins of the channel. The greatest natural seepage occurs near Point Conception and Coal Oil Point, both in Santa Barbara County (Yerkes, 1969).
The study examined imagery which encom- passed that portion of the Santa Barbara Channel between El Capitan and Richfield Islands (Figure 2A). Many of the field observations and much of subsequent data analysis, however, was concen- trated on an area of natural oil seepage off Coal Oil Point (Figure 2B). This area was designated the primary test site because of the number and diver- sity of seeps. Major oil-seeps lie in the channel within 2 km of Coal Oil Point, roughly along a line about 10 degrees west of true north. Allen and Schlueter (1969) estimated the rates of flow to vary between 8 and 11 m3 (50 to 70 barrels) per day from the seeps near Coil Oil Point. Three distinct seep areas were observed in this region during this study, corroborating the findings of Allen and Schlueter (1969). The mean water depth in the seep area is about 14m (45 ft).
FIELD OBSERVATIONS DURING THE LANDSAT
2 OVERPASS
Marine observations for the experiment were made from a Cessna-172 light aircraft coincident with the overpass of Landsat 2. Information was acquired between 1000 hours and 1200 hours PDT. Data collected during the low-altitude (1000 m) flight included oblique aerial photographs, sketch maps of the distribution of surface oil, and field notes on oil seep and sea conditions. Photo- graphs were taken and visual observations were made from altitudes ranging from 300 to 900 m (1,000 to 3,000 ft).
When a globule of oil surfaces, it may spread out into a thin irridescent film on open water or ac- cumulate with previously discharged oil into a thicker mass. The distribution and movement of oil films and streamers is controlled largely by local surface winds, ocean currents, and sea state.
Weather conditions prior to the 16 October 1975 Landsat 2 overpass were conducive to a maximum accumulation of surface-oil films and streamers. Light offshore winds, a low sea state, clear skies, and favorable weather resulted in good satellite imaging conditions.
On 16 October 1976, clear, warm weather (tem- perature about 21°C), light offshore winds (2-7 k d h r , 2-4 knots), and a calm sea combined to pro- duce favorable imaging conditions at a time of sig- nificant near-shore oil accumulations (Plate 1). A record of the occurrence and distribution of float- ing oil was obtained from a low-flying aircraft by visual observation and by hand-held 35 mm oblique aerial photographs of the slicks. Although Figure 2 shows oil streamers near oil well produc- tion platforms, it should be noted that the oil wells were drilled near natural oil seeps. Atmospheric and sea conditions combine to disperse oil ac- cumulations continually from their discharge or source areas within the Santa Barbara channel. All of the floating oil observed during the experiment apparently originated from natural seeps.
Past experience indicated that several fildfilter combinations should be used with the 35 mm cam- eras in order to enhance the contrast between oil, kelp, sediment, and water (Estes and Senger, 1972). Three different film and filter combinations were used, including Kodak Panatomic-X with a Wratten 47 filter, Kodachrome 64 with a Wratten 12 filter, and infrared Ektachrome with a Wratten 12 filter. The area of aerial observation extended from Richfield Island on the east, to beyond the oil production platforms to the south and west, to El Capitan State Beach on the west (Figure 2A).
Oil distribution sketch maps were based exclu- sively on visual observations from the aircraft. These observations were noted on large-scale outline maps of the coast on which reference targets within the area of overlight were plotted for quick reference and scale. The oil on the sea surface on the morning of 16 October 1975 con- sisted of thick black, ropy streamers interspersed with thinner films, running almost parallel to the coast and trending seaward off El Capitan (Figure 2A). All types of reflectance characteristics that Estes and Senger (1972) had related to oil thick- ness were observed at Coal Oil Point test site. These included bright Bands of color to dull sheen for thin films and dense browns to black for heavy co.ncentratjons of oil and lumps of tar. Areas offshore from the University of California at Santa Barbara to El Capitan (Figure 2A) contained the largest slicks observable from the air. Although oil samples were not collected, past experience left no doubt in the authors' minds that oil slicks were present on the surface of the Santa Barbara Chan- nel. (Estes and Golomb, 1970; Estes et al., 1972; Ryerson et al., 1973; and Estes et al., 1973.)

PHOTOGRAMMETRIC ENGINEERING & REMOTE SENSING, 1980
EXPLANATION
Visible Oil Slicks and Streonam A: Data wrces for oil depicted
include 35rnn sli&s, fleld Areas of Kelp Concentration notes, and observotions
E : ~ c o v a e d b y l M P n 1 0 0 Oil Well Plotforms video ahnmmnl of
STREAMERS MOVING
_ >--- COLORATION OR A SILVERY
E X P L A N A T I O N
Vls~ble 011 Slicks and Streamers
Reglrms of Contlnwxs T h ~ n 011 Fllrn Areas of Kelp Concentrat~on 011 Wel l P l a t f o r m
FIG. 2. Sketch maps compiled from field data depicting the distribution of oil on the surface of the Santa Barbara Channel, California, 16 October 1975.
EVALUATION OF FILM DATA
Landsat images in the form of 1:1,000,000-scale positive transparencies for each of the four multi- spectral scanner (MSS) bands and different types of spectral (color) composites were inspected visu- ally. None of the images indicated the presence of the oil known to be floating on the surface of the Santa Barbara Channel near Coal Oil Point at the time of the satellite overpass (see Figure 1). Kelp
beds, which were observed from the aircraft and recorded on 35 mm color and color-infrared photographs (Plate 2) could be delineated on the positive transparency of band 6, and to a lesser degree on band 5. Because earlier attempts at photo-optical enhancement and analysis of Land- sat film products collected over the Santa Barbara Channel failed to show evidence of the oil known to be present, no further attempt at optical analysis was made. As noted in the "Introduction," how- ever, photo-optical techniques have been suc- cessfully employed in the detection and delinea-

ANDSAT DETECTION OF OIL FROM NATURAL SEEPS
IN OCEAN FLOOR
PLATE 1. Floating oil in the Santa Barbara Channel near Coal Oil Point, California on 16 October 1975. (a) Oil slicks from submarine fissures offshore from Coal Oil Point. Camera altitude, approximately 600 m. Film, Kodak IE-135 infarared Ektachrome; filter, Wratten 12. (b) Streamers of oil from natural seeps near Ellwood. Camera altitude. a~~roximatelv 300 m. Film. IGxlak IE-135 infrared Ektachrome; filter, Wratten 12. (c) Floating ropy str%ners of 21 near ~ l l w o d . Camera altitude, approximately 500 m. Film, Kodak KR-135; filter, Wratten 12. (d) Petroleum production platform Holly. Oil was drifting by platform Holly from the natural seeps in the vicinity of Coal Oil Point about 3 km to the north. Camera altitude, approximately 500 m. Film, Kodak IE-135 infarared E k h r o m e ; filter, Wmtten 12.
PLATE 2. Kelp beds along the California Coast near Goleta Point, 16 October 1975. (a) Oblique, low altitude, color aerial photograph. Camera altitude, approximately 300 m. Film, Kodak KR-135; filter, Wratten 1A. (b) Oblique, low altitude, color infrared aerial photograph. Camera altitude, approximately 500 m. Film, Kodak IE-135 infrared Ektachrome; filter, Wratten 12.
PHOTOGRAMMETRIC ENGINEERING & REMOTE SENSING, 1980
tion of oil slicks on Landsat imanerv. which were - . a
larger and more prominent than those in the Santa Barbara Channel (Deutsch et al., 1977).
DIGITAL ANALYSIS OF COMPUTER-COMPATIBLE TAPES
CCT's provided by NASA for this study con- sisted of four 800-byte per inch seven-track tapes. Analysis of the data was performed on the U.S. Geological Survey's Multispectral Image Analyzer (General Electric Image-100) and PDP 11/35 computer at the EROS Data Center, Sioux Falls, South Dakota. Analytical results obtained by the Image-100 system are displayed on a color cathode ray tube (CRT), which is basically a closed circuit TV monitor. All Landsat imagery used as figures in this paper was recorded photographically from the CRT on 35 mm slides. Nevertheless, the CRT pre- sentation of scenes and subscenes of Landsat CCT'S
exhibits substantial geometric distortion. Raw data. Digital analysis of Landsat data is
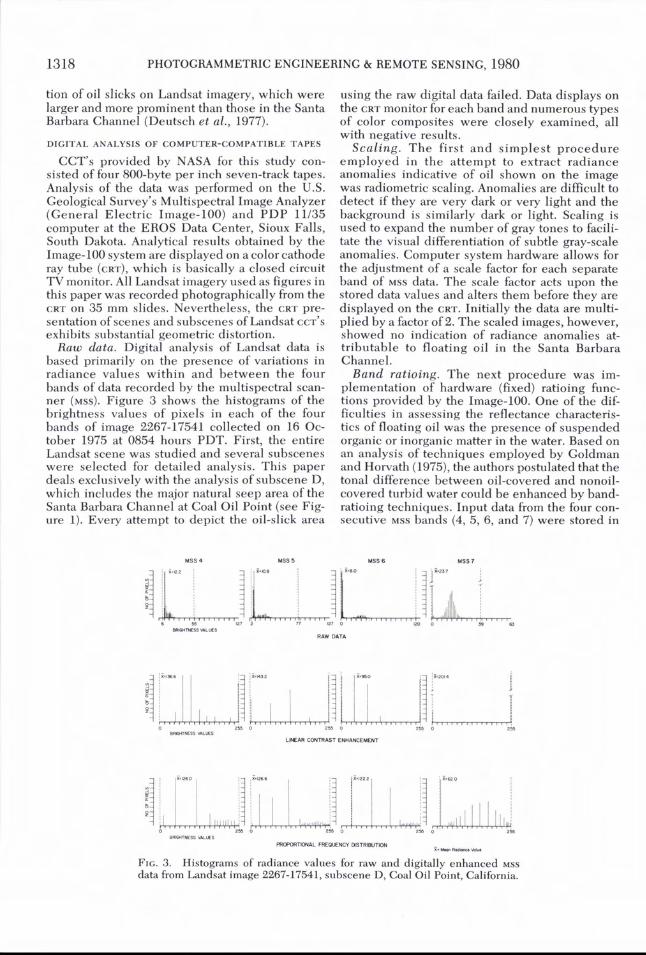
based primarily on the presence of variations in radiance values within and between the four bands of data recorded by the multispectral scan- ner (MSS). Figure 3 shows the histograms of the brightness values of pixels in each of the four bands of image 2267-17541 collected on 16 Oc- tober 1975 at 0854 hours PDT. First, the entire Landsat scene was studied and several subscenes were selected for detailed analysis. This paper deals exclusively with the analysis of subscene D, which includes the major natural seep area of the Santa Barbara Channel at Coal Oil Point (see Fig- ure 1). Every attempt to depict the oil-slick area
WSS 4
using the raw digital data failed. Data displays on the CRT monitor for each band and numerous types of color composites were closely examined, all with negative results.
Scaling. The first and simplest procedure employed in the attempt to extract radiance anomalies indicative of oil shown on the image was radiometric scaling. Anomalies are difficult to detect if they are very dark or very light and the background is similarly dark or light. Scaling is used to expand the number of gray tones to facili- tate the visual differentiation of subtle gray-scale anomalies. Computer system hardware allows for the adjustment of a scale factor for each separate band of MSS data. The scale factor acts upon the stored data values and alters them before they are displayed on the CRT. Initially the data are multi- plied by a factor of 2. The scaled images, however, showed no indication of radiance anomalies at- tributable to floating oil in the Santa Barbara Channel.
Band ratioing. The next procedure was im- plementation of hardware (fixed) ratioing func- tions provided by the Image-100. One of the dif- ficulties in assessing the reflectance characteris- tics of floating oil was the presence of suspended organic or inorganic matter in the water. Based on an analysis of techniques employed by Goldman and Horvath (1975), the authors postulated that the tonal difference between oil-covered and nonoil- covered turbid water could be enhanced by band- ratioing techniques. Input data from the four con- secutive MSS bands (4, 5, 6, and 7) were stored in
M H CONTRAST E-T
RKRYm(hUL FRPUENM U S T R B U M li.Yn-w
FIG. 3. Histograms of radiance values for raw and digitally enhanced ~ s s data from Landsat image 2267-17541, subscene D, Coal Oil Point, California.

LANDSAT DETECTION OF OIL FROM NATURAL SEEPS
four adjacent channels in the Image-100. No evi- dence of known slicks appeared on the monitor during the ratioing of data from adjacent channels. The ratio of the difference of data values from ad- jacent channels divided by the sum of data values from adjacent channels was then carried out. The results were viewed in various combinations, and the data in the channels exchanged. None of the band ratioing procedures revealed any floating oil in subscene D.
Linear contrast stretch enhancement. In their study of the detection of floating oil by Landsat sensors, Deutsch et al. (1977) employed a linear contrast stretch enhancement to delineate oil spills in the Gulf of Suez and Lake Ontario. The purpose of the procedure was to enhance very small differences in reflectance between oil- covered and the surrounding nonoil-covered water.
It was decided, therefore, to perform the same type of analysis for the Coal Oil Point area. Sub- scene D was enlarged so that every pixel could be easily recognized on the screen.
A description of the following technique was adapted from David Greenlee (1978). A linear contrast stretch enhancement is produced by reas- signing brightness values to each pixel after mul- tiplying the original raw Landsat radiance values by amplitude scale factor and adding (or subtract- ing) a constant bias factor. Within the context of this research employing the Image-100 system, the amplitude scale factor can be termed a "range multiplier" because it increases the range of brightness values to 253. The role of the bias factor is to translate the brightness values to the range 2-255, the limit the system saturates. By then, carefully selecting intermediate minimum and maximum values, the analyst may selectively satu- rate unwanted information or noise from the lower and upper tails of the frequency distribution. This saturation decreases the range of brightness and increases the range multiplier and resulting visual contrast.
The h e a r contrast stretch enhancement pro- gram employed a linear multiplier for the range of digital values of all gray levels which defined ocean and oil characteristics. Before enhance- ment, water appeared dark gray to black in the images of all four bands. Each band of Landsat data for subscene D was displayed individually, and the gray scale was stretched for that portion of the histogram that represents water. After contrast enhancement, the water area appeared as a broader range of gray tones. Land in the scene appeared white with no detail. The technique re- vealed a faint pattern of seeps similar to the pat- terns observed during aerial observations. The patterns appeared faintly on the monitor after the linear contrast stretch of MSS data from bands 4, 5, and 6, but were most obvious in the data &om
band 4 (Plate 3). Ocean areas in the band 7 image (0.8-1.1 micrometres) were extremely dark, and even though the data were contrast-stretched, no recognizable pattern related to oil was observed.
Landsat ~ s s band 4 has a spectral sensitivity from 0.5-0.6 micrometres and is in the spectral re- gion of the greatest penetration of water at all Landsat MSS bands. Based on empirical evidence gained by comparing the field vertification data with the Landsat data, it appears that, in the MSS
band 4 image, oil and the turbidity of the water south and west of Coal Oil Point combine to pro- duce a lighter signature than those of the other bands, suggesting that the multispectral scanner is detecting oil as well as particulate matter in the water column.
In the MSS band 5 (0.6-0.7 micrometres) image a pattern similar to the oil distribution observed ae- rially was only very faintly evident. The pattern included several east-west trending linear stream- ers from east to Goleta Point to the western edge of the subscene. An area of heavy concentration of oil was inferred from the light signature of water be- tween Ellwood and Coal OiI Point. Although a pattern representing surface oil films was present on the image, a problem with electronic noise (in the form of severe banding) ruled out a definitive interpretation. In the area of the image to the south and west of Coal Oil Point, however, a strong suggestion of a pattern attributable to oil was observed. Despite the favorable indications described above, the linear contrast stretch en- hancement was inadequate for positive delinea- tion from Landsat image 2267-17541 of the oil- covered areas in the Santa Barbara Channel ob- served on 16 October 1975.
Proportional frequency distribution. Propor- tional frequency distribution (PFD) is used to reas- sign brightness values to each pixel, based on the frequency distribution of Landsat radiance values in the scene (Greenlee, 1978). In this specific case PFD stretching gives the visual impression that all brightness values are equally represented in the scene, thereby resulting in a dramatic contrast en- hancement. In preliminary reports on the present study (Deutsch et al., 1976; Deutsch et al., 1977) this technique was referred to as a "histogram equalization stretch." This terminology is now discarded in favor of the more appropriate term, "proportional frequency distribution." PFD does not "equalize the distribution of individual radiance values" for the entire range of brightness levels. What PFD does is separate one brightness level from an adjacent brightness level in propor- tion to the area covered by the brightness level. This means that a PFD is optimal for those features within a scene which have a large areal extent. Also, brightness levels are maintained from input to output, so that when the brightness of two pixels are compared, brightness levels that are equal

PHOTOGRAMMETRIC ENGINEERING & REMOTE SENSING, 1980
NEBR S T R E T C
d C
PLATE 3. Linear contrast stretch enhancements of ~ s s data from Landsat image 2267-17541, subscene D, depicted in red on the General Electric Image 100 CRT monitor. (a) Band 4 (0.5-0.6 pm). (b) Band 5 (0.6-0.7 pm). (c) Band 6 (0.7-0.8 pm). (d) Band 7 (0.8-1.1 pm). -
067- l 7 b r ) l D L I N I T E D H I f T = S T F E T C H
PLATE 4. Distribution of oil from natural seeps in the Santa Barbara Channel, 16 October 1975. The data of this Landsat 2 image were enhanced by use of the proportional frequence distribution (PFD)
program. (a) Color composite of ~ s s bands 4 (blue), 5 (green), and 6 (red). (b) Complementary color composite of MSS bands 4 (yellow), 5 (magenta), and 6 (cyan).

LANDSAT DETECTION OF OIL FROM NATURAL SEEPS
before stretching are equal after stretching. How- ever, since PFD is non-linear although equal brightness levels will remain equal, unequal brightness levels will not remain relative to each other.
An enhancement of the Coal Oil Point area (sub- scene D), employing a PFD stretch of data from ~ s s bands 4, 5, and 6 of Landsat image 2267-17541, produced the most definitive results obtained in the study. By combining the data from MSS band 4 (in blue), ~ s s band 5 (in green), and ~ s s band 6 (in red), a pattern of floating oil corresponding in major details to that photographed and sketched during aerial surveillance flights (see Figure 2) was produced (Plate 4A). The enhancement was further improved by combining MSS band 4 (in the complement of blue-yellow), ~ s s band 5 (in the complement of green-magenta), and ~ s s band 6 (in the complement of red-cyan) (Plate 4b). In this complementary mode (Plate 4b), oil stringers are depicted somewhat more sharply than in Plate 4a. However, the yellow in ~ s s band 4 is subdued somewhat by the green of MSS band 6, thereby producing a less distinctive turbidity pattern than is present when the MSS band 4 image is viewed alone. Finally, the noise pattern in the ~ s s band 6 image is suppressed somewhat through the addi- tion of data from bands 4 and 5. On this image the pattern of kelp is also prominent and easily inter- pretable against the water background. Parallel streamers of oil trending east-west off Goleta Point can be seen, as can the continuous thin film of oil, containing some darker streamers, west and southwest of Coal Oil Point. There is no doubt that the dark area and dark streamers depicted on Plate 4a represent oil from natural marine seeps at the time of imaging. The discontinuous oil-contami- nated surface covers an area about 16 km (10 mi) long and 11 km (7 mi) wide.
The oil slick southwest of Coal Oil Point and elsewhere in the Santa Barbara Channel appeared as spectrally lighter (higher reflectance) than sur- rounding (non oil-covered) water on the computer- enhanced Landsat imagery. The same was true of the man-made oil slicks identified by Deutsch et al. (1977).
Figure 2 shows the distribution of oil slicks plotted by the field investigator from oblique ae- rial observations and photographs taken over a pe- riod of several hours. The difference between the oil distribution depicted on the hand-drawn field map and that inferred from the best of the computer-enhanced digital images (Plate 4) are undoubtedly the result of differences between the mapping ability of an investigator in a low-flying aircraft over water and that of Landsat, which synoptically, orthographically, and almost instan- taneously (within 25 s), records the characteristics
of an area of a 185 km (115 mi) by 185 km (115 mi) area on the Earth's surface. It should be noted that the detectability of the oil slick by its contrast with the surrounding water depends upon the obliq- uity, angle, and direction of view of the human eye or mechanical sensor. Because the airborne investigator and his hand-held camera did not ob- serve or record the oil-covered water from a near- vertical vantage point, or at the same angle relative to the sun, it was not possible to obtain informa- tion identical to that collected by Landsat.
Results of the digital analysis of image 2267- 17541 demonstrate that Landsat 2 did, in fact, de- tect oil floating on the surface of the Santa Barbara Channel. The distribution of the displayed radiance anomalies resulting from two of the dig- ital analyses cannot be logically attributed to any other cause. Because the oil is known to have originated from natural seeps, it is concluded that existing or future Landsat satellites4r data from future Earth satellites with more sophisticated sensors-have a potential for oil exploration in marine coastal areas.
This experiment represents an initial attempt at an evaluation of the capability of the Landsat mul- tispectral scanner to detect oil from natural seeps. Many difficult problems remain to be solved in the interpretation of very small differences in bright- ness values within a noisy signal (primarily small detector variations resulting in severe "banding" on the image). Further experimentation on the digital-processing techniques used in the study is definitely needed. More data for the Santa Barbara Channel and other geographic areas of interest to government agencies, the petroleum industry, and conservationists need to be acquired. Such data should include a variety of oil types, volumes, and spatial distributions under different sea-state, cur- rent, sea-surface, and atmospheric conditions.
The authors also conclude that remote sensing by satellite constitute a potentially practical and cost-effective tool for oil exploration along the continental margins in addition to its better devel- oped application in environmental monitoring.
The authors wish to express their gratitude to the following persons who contributed signifi- cantly to the investigation and preparation of this paper: Dr. Stanley Freden of NASA's Goddard Space Flight Center provided the Landsat film data and computer-compatible tapes used in this study; Ms. Charlotte Muchow, presently of the University of California, Riverside, and Mr. David D. Greenlee of Technicolor Graphic Services, Sioux Falls, South Dakota, proposed and per- formed some of the digital data analyses described herein; and Mr. Gerald K. Moore and Dr. Richard

PHOTOGRAMMETRIC ENGINEERING & REMOTE SENSING, 1980
S. Williams, Jr., of the Geological Survey's Water Resources Division, and EROS Program Office, respectively, assisted i n t h e analysis a n d in- terpretations of the data and thoroughly reviewed the manuscript.
Allen, A. A., and S. R. Schlueter, 1969. Estimates of Surface Pollution Resulting from Submarine Oil Seeps at Platform A and Coal Oil Point, Technical Memorandum 1230, General Research Corp., Santa Barbara, California, 14 p.
Deutsch, Morris, J. E. Estes, and Charlotte Muchow, 1976. "Landsat Detection and Surface Verification of Natural Oil Seeps in the Santa Barbara Chan- nel, California, U.S.A.," (abs), Program Abstracts, COSPAR, 19th Plenary Meeting, p. 413.
Deutsch, Morris, A. E. Strong, and J. E. Estes, 1977. Use of Landsat Data for the Detection of Marine Oil Slicks, Ninth Offshore Technology Conference, Paper 2763, pp. 311-318.
Estes, J. E., and Berl Golomb, 1970. Oil spills: Method for Measuring their Extent on the Sea Surface, Sci- ence, v. 169, pp. 676-678.
Estes, J. E., Paul Mikolaj, R. R. Thaman, and L. W. Senger, 1973. Volumetric Determination of a Marine Oil Spill using Coordinated Airborne and Surface Sampling Data, Proceedings 1973 Conference on Prevention and Control of Oil Spills, Washington, D.C., pp. 117-125.
Estes, J. E., and L. W. Senger, 1972. The Multispectral
Concept as Applied to Marine Oil Spills, Remote Sensing of the Environment, v. 2, pp. 141-163.
Estes, J. E., W. L. Senger, and Patrick Fortune, 1972. Potential Applications of Remote Sensing Tech- niques for the Study of Marine Oil Pollution, Geoforum, v. 9, pp. 69-80.
Goldman, G. C., and Robert Horvath, 1975. Oil Pollution Detection and Monitoring from Space Using ERTS-1, Environmental Research Institute of Michigan, Final Rept., NASA Contract NAS5-21783, Task IXC 57 p.
Greenlee, D. D., 1978. Personal Communication, Technicolor Graphic Services, Inc., Sioux Falls, South Dakota.
Halbouty, M. T., 1976. Application of Landsat Imagery to Petroleum and Mineral Exploration, Bulletin American Association Petroleum Geologists, v. 60, no. 5, pp. 754-793.
National Aeronautics and Space Administration, 1976. Landsat Data Users Handbook, Document no. 76SD5425B, Goddard Space Flight Center, Green- belt, Maryland.
Ryerson, J. M., R. R. Thaman, and J. E. Estes, 1973. Marine Oil Accumulation, Photogrammetric Engi- neering, v. 39, no. 10, pp. 1035-1040.
Yerkes, R. F., H. C. Wagner, and D. A. Yenne, 1969. Pe- troleum Development in the Santa Barbara Chan- nel Region, U.S. Geological Survey Professional Paper 697, pp. 13-17.
(Received 7 November 1979; revised and accepted 22 April 1980)
Workshop Advanced Geological Remote Sensing Techniques
EROS Data Center Sioux Falls, South Dakota
17-21 November 1980
The course is designed to introduce the applications of multilevel data bases in geological investiga- tions. Analytic and interpretive techniques applied to integrated topographic, geophysical, geochemical, and remotely sensed data will be emphasized. A working knowledge of geologic concepts and prin- ciples is assumed. Previous experience in the analysis and interpretation of geophysical data or geo- chemical data or remotely sensed data is required.
For further information please contact
Mr. Charles M. Trautwein Applications Branch EROS Data Center Sioux Falls, S D 57198 Tele. (605) 594-6511, Ext. 114