Automated Mapping System Implementation - ASPRS
12
TOMMIE F. HOWELL, P.E. Texas Highway Department Austin Texas 78701 Automated Mapping System Implementation Placing the system into the production environment provides an effective method for collection, storage and retrieval of large volumes of map data, and offers the engineer flexibility for manipulation of the map data heretofore unavailable. INTRODUCTION the existing Computer and Reproduction HE TEXAS Highway Department began Sections to form the new Division ofAutoma- T u r i n g aerial photography for preliminary tion in 1965, automated techniques were engineering planning surveys around 1930 being utilized already in film processing, with most of the photographs being obtained ground control, aerotriangulation and photo- from the U. S. Department of Agriculture. grammetric earthwork measurements. Sophistication of photogrammetric instru- Compilation of map sheets has always ments enabled accurate engineering data to been predominantly a manual operation with be extracted from the vast amount of informa- the map being drawn on a stable-base man- tion visible in the aerial photographs, and uscript by the stereoplotter operator, the subsequent requests for this information penciled lines scribed by a draftsman and a ABSTRACT: Manual methods of photogrammetric map compilation and graphics for highway engineering are known to have objectionable limitations including the allocation of manpower resources and in- flexibility of the maps for automated manipulation for data analysis. The Automated Mapping System as developed and implemented into the production environment of the Texas Highway Department offers the engineer new dimensions and concepts for graphics presentation andlor data manipulation heretofore unavailable from manually produced maps. Implementation of the Automated Mapping System was designed for modular conversion of existing individual stereo- plotter units to permit progressive implementation minimizing the interruption of existing map schedule commitments. prompted the formation of the Photogram- metry Section within the Highway Design Division in 1957. The Department obtained its initial stereoplotter in early 1958. Increasing acceptance of this highway en- gineering tool of photogrammetry prompted continued expansion of equipment and per- sonnel. Highway engineers became increas- ingly more automation-oriented and conse- quently the Department's existing photo- grammetric systems were enhanced to ac- commodate these demands. When the Photogrammetry Section was combined with film positive reproduced from the base man- uscript. Although this method of map compi- lation offers numerous advantages over field methods, many objectionable limitations should be eliminated or minimized. Perhaps the most serious limitation to manually produced maps is in their inflexi- bility. The tremendous amount of detail that can be captured very accurately from an aer- ial photograph for a manually produced map is not available for any type of automated manipulation or analysis. Another limitation of manually produced maps is in the alloca-
-
Upload
khangminh22 -
Category
Documents
-
view
4 -
download
0
Transcript of Automated Mapping System Implementation - ASPRS

TOMMIE F. HOWELL, P.E. Texas Highway Department
Austin Texas 78701
Automated Mapping System Implementation Placing the system into the production environment provides an effective method for collection, storage and retrieval of large volumes of map data, and offers the engineer flexibility for manipulation of the map data heretofore unavailable.
INTRODUCTION the existing Computer and Reproduction H E TEXAS Highway Department began Sections to form the new Division ofAutoma-
T u r i n g aerial photography for preliminary tion in 1965, automated techniques were engineering planning surveys around 1930 being utilized already in film processing, with most of the photographs being obtained ground control, aerotriangulation and photo- from the U. S. Department of Agriculture. grammetric earthwork measurements. Sophistication of photogrammetric instru- Compilation of map sheets has always ments enabled accurate engineering data to been predominantly a manual operation with be extracted from the vast amount of informa- the map being drawn on a stable-base man- tion visible in the aerial photographs, and uscript by the stereoplotter operator, the subsequent requests for this information penciled lines scribed by a draftsman and a
ABSTRACT: Manual methods of photogrammetric map compilation and graphics for highway engineering are known t o have objectionable limitations including the allocation of manpower resources and in- flexibility of the maps for automated manipulation for data analysis. The Automated Mapping Sys tem as developed and implemented into the production environment of the Texas Highway Department offers the engineer new dimensions and concepts for graphics presentation andlor data manipulation heretofore unavailable from manually produced maps. Implementation of the Automated Mapping System was designed for modular conversion of existing individual stereo- plotter units to permit progressive implementation minimizing the interruption of existing map schedule commitments .
prompted the formation of the Photogram- metry Section within the Highway Design Division in 1957. The Department obtained its initial stereoplotter in early 1958.
Increasing acceptance of this highway en- gineering tool of photogrammetry prompted continued expansion of equipment and per- sonnel. Highway engineers became increas- ingly more automation-oriented and conse- quently the Department's existing photo- grammetric systems were enhanced to ac- commodate these demands. When the Photogrammetry Section was combined with
film positive reproduced from the base man- uscript. Although this method of map compi- lation offers numerous advantages over field methods, many objectionable limitations should be eliminated or minimized.
Perhaps the most serious limitation to manually produced maps is in their inflexi- bility. The tremendous amount of detail that can be captured very accurately from an aer- ial photograph for a manually produced map is not available for any type of automated manipulation or analysis. Another limitation of manually produced maps is in the alloca-

PHOTOGRAMMETRIC ENGINEERING, 1974 tion of manpower resources. Photograminet- ric map cartography requires considerable manpower and is usually in an environment of fluctuating workloads, thus affecting time schedules, sheet quality and certainly the overall economics of mapping. Therefore, a more flexible system for collecting, storing, retrieving and presenting map graphics was needed to improve planning, coordination and management of the information, em- phasizing the use of the Department's exist- ing photogrammetric equipment.
The overall objective for implementing an Automated Mapping System into the produc- tion environment of the Texas Highway De- partment was to provide an effective method for collection, storage, manipulation and re- trieval of large volumes of map data. Existing Automated Mapping systems were reviewed and evaluated and, although these systems yielded some suggestions for implementa- tion of a Texas Highway Department system, they were dedicated to a different map pro- duction environment and made use of equipment not readily available to the De- partment.
The Department had already developed automated capabilities for processing the preliminary data necessary for map produc- tion as follows:
The aerial film obtained using Wild RC-8 aerial cameras is processed by GAF Trans- flo automated processors. Photographic prints and diapositive plates are prepared using a LogEtronic Mark I11 printer. Primary ground control is obtained using various types of electronic distance measur- ing units with the traverse data processed and adjusted in the computer by specialized software programs. Supplemental mapping control is accom- plished through aerotriangulation tech- niques for strip and block photography ad- justments. The desired coordinate readouts for the required control points are obtained through computer programming dedicated to this purpose. Map sheet layout work is semi-automated through the use of digital readout equip- ment.
The next step in the development of an Automated Mapping System was to convert map compilation and drafting from the stan- dard graphics imagery presentation to nu- merical imagery for computer processing and map data manipulation. This conversion would represent a significant departure from previous map-oriented information system approaches which have been primarily dedi-
cated to yield limited types of data for specific operational applications.
EQUIPMENT
Inasmuch as the Texas Highway Depart- ment has 15 projection type stereoplotters in operation and five ofthese stereoplotters had already been converted for automation to yield Y-Z numerical values for terrain analysis (cross-sections for earthwork meas- urements), emphasis was directed toward modifying the remaining units for automated map compilation. Preliminary investigations using an existing stereoplotter with the Y-Z digital output modified to yieldx-Y data dem- onstrated that numerical information could successfully b e captured with this type equipment configuration.
The Automated Mapping System de- veloped for implementation into the produc- tion environment of the Texas Highway De- partment was designed as a modular conver- sion of existing individual stereoplotter units to permit progressive implementation that could readily be adapted to a total automated system when desired. This conversion scheme minimized the interruption of exist- ing schedule commitments and allowed ample time for operator familiarization and training.
Using the aforementioned modular con- version program the Department has mod- ified six of ten map compilation stereoplotter units for automated map production with each unit containing an equipment config- uration as shown in Figure 1. Figures 2 through 7 further detail the individual com- ponents of the digital and plotting equipment configurations.
The Texas Highway Department had made some progress in the development of compu- ter programs for automating map graphics through in-house research. The objective of these earlier efforts had been to produce graphics in order to permit studying proce- dures for digitizing map data and to deter- mine if the stereoplotter operators could suc- cessfully capture and identify the required data. Crude preliminary plots from this dig- itized data satisfactorily demonstrated that both of these requirements could be met.
This preliminary software package was dedicated to testing graphics output and al- lowed no data manipulation. Expansion of this software package has allowed the further testing of map plots and introduced new capabilities into the software package to permit edit, data storage and manipulation

AUTOMATED MAPPING SYSTEM IMPLEMENTATION 1437
FIG. 1. Stereoplotter Unit Converted for Automated Data Collection. (1)X-Y Coordinate Arm Assembly. (2) Tracing able Recording Interface. (3) Remote Data Control Switch System. (4) Electronic Data Display. (5) Recording Interface. (6) IBM 029 Keypunch.
a n d also opt imized t h e graphics generation computations.
This expanded Texas Automated Plotting System (TAPS) software package was designed a n d deve loped t o perform t h e following func- tions:
Edit and Special Routines. The digitized data are initially subjected to an edit analysis for the detection of various stereo- plotter operator input errors such as dupli- cations, closure gaps, squaring techniques, insufficient data, improper coding & omis- sions. These errors are noted and corrected within the edit procedure. Also during the edit routine a coordinate transformation ad- justment occurs wherein the X-Y machine coordinate values of the various map fea- tures are converted to project ground coor- dinates. Special sub-routines within the TAPS software package are designed to op-
timize selective line work computations and further reduce the computer time that is required to generate a plot tape. These subroutines include a procedure for com- puting vegetation boundaries, one for de- fining the double lines required for curbs and railroad tracks and one for simplifying computations required for locating simple and complex curves. Storage. The project data-base file is con- structed from the edited data and stored on a disk. The data file is readily accessible for manipulation such as the generation of a plot tape for obtaining a graphic presenta- tion of map features. Manipulation. The project data base col- lected by translating photographic imagery to a series of numerics, edited and op- timized by the computer software pro- grammingandstoredona disk file is readily available to yield a variety of engineering

1438 PHOTOGRAMMETRIC ENGINEERING, 1974
FIG 2. Standard Projection-type stereoplotter with X-Y Coordinate Arm Assembly. The X-Y coordinate arm assembly is designed for high accuracy positioning anywhere on the stereoplotter drawing surface to 0.001 inch per foot of arm length. The arms have rack and pinion activated non-contacting rotary optical encoders. The stereo- plotter tracing table is attached to the X axis arm. The dimensions of the arms are customized to utilize the maximum amount of drawing surface afforded by each stereoplotter and each arm is equipped with fine adjustment motion for precise positioning.
management and ~lanning functions. Man- ipulative capabilities include total graphics, selective graphics yielding land use information and classification levels, variable scale formats for transportation route analyses, perimeter and area compu- tations and environmental resources for corridor access studies.
The software functions heretofore outlined are dedicated to the conversion ofmap data to a computer format for the manipulation of the desired output as shown in Figure 8. Addi- tional software techniques will be designed and developed as the user needs are iden- tified.
The production requirements of a mapping project to be prepared using the Automated
Mapping System are very similar to the re- quirements of a project using manual photo- grammetr ic procedures wi th respect to ground control, aerial photography and aero- triangulation. Beyond the aerotriangulation step, however, the procedures required to complete the map differ considerably and a brief description of the two methods is out- lined as follows:
MANUSCRIPT PREPARATION
Manual. Map compilation using manual techniques requires the preparation of a map manuscript on a stable-base scribecoat mate- rial. All the ground control points and sup- plemental control points obtained by aero- triangulation are plotted on the manuscript and oriented to a coordinate grid system.

AUTOMATED MAPPING SYSTEM IMPLEMENTATION
FIG 3. Stereoplotter Tracing Table Recording Interface is a mechanical attachment to the X axis coordinate arm and contains two 0-9 manual data switches; one three-position switch; and the record, the final record and clear buttons. The two 0-9 manual data switches are used to enter the identification codes of the features being dig- itized. This enables the data to be entered for manipulation through routine software programs. The three positional switch allows the operator to enter the direction the stereo model will be tied to the adjacent stereomodel and the features that will be included in the tie. The record button enters each set of X-Y coordinate data for the feature being digitized; and depression of the final record button enters the final X-Y coordinates for the feature and releases the card.
Sheet lengths and widths are also noted on the base manuscript.
Automated. With automated techniques the stereoplotter operator is furnished a film positive sheet with the stereomodel's princi- pal points plotted on it. This base sheet is furnished to permit "rough" scaling. The ac- tual precision scaling is done in the computer using software routines similar to those used in the aerotriangulation solution.
MAP COMPILATION
Manual. After the projected photographic control points are adjusted to fit the control points as plotted on the map manuscript, the stereomodel is ready for compilation. This procedure is accomplished by optically trans- ferring the photographic imagery to the map manuscript using the stereoplotter tracing table. This line work is then intensified by the operator.
Automated. The stereomodel is "roughly" scaled to fit the control points plotted on the film positive base sheet. The project request number and model numbers (constant data) are set for entry onto the punch cards using the remote data switch system described in Figure 4. This constant data information is automatically entered at the beginning of each card when the initial X-Y coordinate values for that card are recorded. The model is now ready for "compilation." Initially the operator will digitize the model principal points and control points to establish the scale factor which is determined from in- teraction with the Department's aerotriangu- lation adjustment program. The operator then proceeds to transfer the photographic imagery into a numerical "manuscript" using feature codes. The recorded X-Y coordinate positions are machine values that will be converted to project coordinates in the com-
1440 PHOTOGRAMMETRIC ENGINEERING, 1974
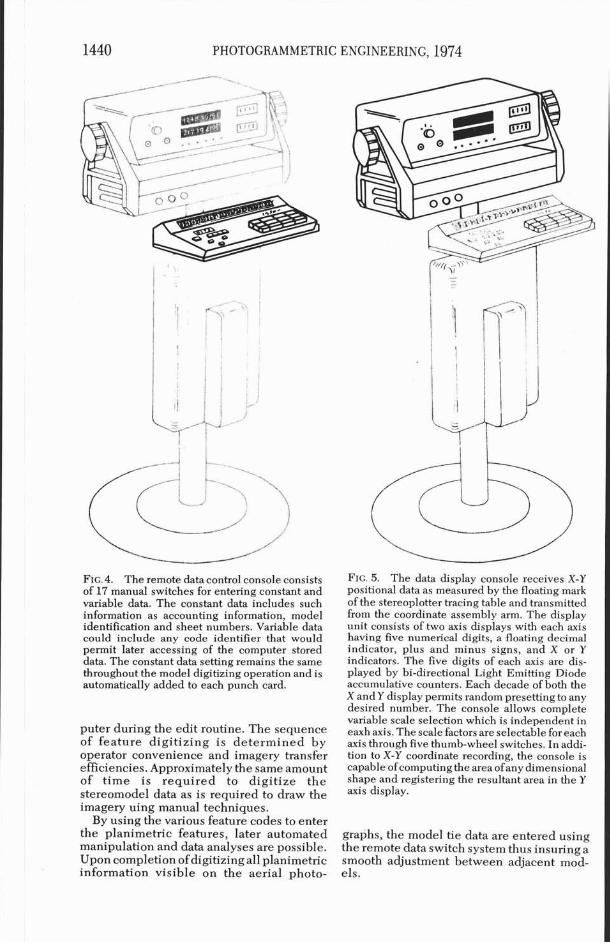
FIG. 4. The remote data control console consists of 17 manual switches for entering constant and variable data. The constant data includes such information as accounting information, model identification and sheet numbers. Variable data could include any code identifier that would permit later accessing of the computer stored data. The constant data setting remains the same throughout the model digitizing operation and is automatically added to each punch card.
puter during the edit routine. The sequence of feature digitizing is determined by operator convenience and imagery transfer efficiencies. Approximately the same amount of time is required to digitize the stereomodel data as is required to draw the imagery uing manual techniques.
By using the various feature codes to enter the planimetric features, later automated manipulation and data analyses are possible. Upon completion of digitizing all planimetric information visible on the aerial photo-
FIG. 5. The data display console receives X-Y positional data as measured by the floating mark of the stereoplotter tracing table and transmitted from the coordinate assembly arm. The display unit consists of two axis displays with each axis having five numerical digits, a floating decimal indicator, plus and minus signs, and X or Y indicators. The five digits of each axis are dis- played by bi-directional Light Emitting Diode accumulative counters. Each decade of both the X andY display permits random presetting to any desired number. The console allows complete variable scale selection which is independent in eaxh axis. The scale factors are selectable for each axis through five thumb-wheel switches. In addi- tion to X-Y coordinate recording, the console is capable of computing the area ofany dimensional shape and registering the resultant area in the Y axis display.
graphs, the model tie data are entered using - the remote data switch system thus insuring a smooth adjustment between adjacent mod- els.

AUTOMATED MAPPING SYSTEM IMPLEMENTATION
FIG. 6. The recording interface and IBM 029 Keypunch provide the means for data collection in the desired card format. A patch panel is included with the recording interface to permit card format modifica- tions.
Gerber Model 32 Precision Flat Bed Pbtter
ColComp 1136 Drum Plottar FIG. 7. Digital Plotters Used For Graphic Presentations.

1442 PHOTOGRAMMETRIC ENGINEERING, 1974
DIGITIZED 1-1 EDIT & SPECIAL CORRECTED ROUTINES
EDITED (-(
GENERATE PLOT TAPE(S)
REQUESTED n FIG. 8. Texas Automated Plotting System (TAPS)
Software.
EDIT
Manual. The completed map manuscript is edited to check for omissions and obvious blunders by the stereo operator using aerial photographs identical to the diapositive plates used in the stereoplotter. This edit check is accomplished while the stereomodel remains set up in the machine. Corrections are made during this initial orientation to minimize reset expenses.
Automated. With the present equipment configuration, the digitized data which have
been collected on punch cards are processed through the Automated Map System software on one of the Department's two IBM 370 computers, wherein certain edit processes take place as described previously under "Software." During this edit run, blunders are detected and adjusted, machine X-Y coordinates are converted to project X-Y coordinates and a plot tape is generated. The plot tape is then loaded onto the Department's CalComp 1136 drum plotter to produce an edit plot. This edit map from the CalComp 1136 plotter is drawn approxi- mately 50 times faster than the map informa- tion can be digitized by the stereo operator. Minor discrepancies may be corrected on the edit sheet if no additional plots will be re- quired or deferred for correction on the final sheet. Some major discrepancies require cor- recting the card data and building a new plot tape with an additional computer run.
GRAPHICS
Manual. The map manuscript as drawn and edited by the stereoplotter operator is given to the Cartography Sectionforfurtherprocess- ing. This section completes the manuscript by scribing the stereo operator's line work. The scribed manuscript is then copied by standard reproduction techniques to obtain a film positive. This scribing technique offers some flexibility as exemplified by the fact that a film positive ofthe planimetric data can be obtained prior to scribing the elevation data for the composite map. The scribed manuscript is retained for future reference to the project.
Automated. Ifno significant errors are pres- ent, the plot tape generated for use in the edit procedure is also used to generate the final graphics on a CalComp 1136 drum plot- ter or a precision flatbed plotter. (The De- partment does not own a flatbed plotter at the present time. These plots are obtained through a Service Center.) Frequently the final graphics output is obtained directly from the CalComp 1136 drum plotter as many engineering applications do not require the precision line work and superior accuracies available from a flatbed plotter. If the Cal- Comp 1136 is to be used for the final output, the plot is immediately photographically re- produced onto a film positive to minimize scale deficiencies due to paper instability.
Engineering map graphics requiring superior accuracies and line quality are ob- tained on a ~recis ion Gerber 1232 flatbed plotting system with an optical exposure head. The optical head offers excellent line quality and line weights and also has the abil-

AUTOMATED MAPPING SYSTEM IMPLEMENTATION 1443
FIG. 9. 100 feet-per-inch Plot, Plotted on CalComp 1136 Drum Plotter.
ity to "flash" symbols for various planimetric obtained using manual photogrammetric tech- features such as manholes, poles and guard niques. posts. Graphics obtained from the flatbed Selective Map Graphics. Differential levels of plotter are drawn directly on a film positive. management information can be extracted from
Graphics from either plotter can be ob- the "data bank" project file. These selective
tained at various scales and line weights. graphics might include separate maps showing
~i~~~~ g is a typical output from a calcomp only the transportation networks, recreation
1136 drum plotter; Figure from a Gerber areas, buildings, utilities orany otherclassifica-
32 flatbed plotter. tion of land use or combinations of classifica- tions.
Implementation of this Automated Map- ping System offers the engineer new dimen- sions and concepts for graphic presentations andlor data manipulation heretofore unavail- able in manually produced maps. Through digitizing methodology and sophisticated computer software routines, the imagery ex- tracted from the aerial ~hotography is depos- ited into a "data bank" (project file) for use in multi-disciplinary engineering manage- ment applications. Examples of how this data may be manipulated and presented are as follows:
Total Map Graphics. The engineer can obtain a photogrammetric map containing all planimet- ric and topographic features extracted from the aerial photograph similar to maps heretofore
Selective Area Graphics. Specific areas can be extracted from the project file and plotted with- out requiring a plot of the entire area. This "windowing" feature will be very useful to the traffic engineer for extracting selective inter- changes for signalization studies and design, and to the safety engineer for accident site evaluations. Additions and Deletions. The project file can be accessed to update land use applications as new subdivisions, parks, transportation routes or industrial changes occur. Differential Scales. The system offers the en- gineer the flexibility of selectingthe scale ofthe graphic presentations within the accuracies as dictated by the photographic scale at the point of data entry. Several areas from the same proj- ect file can be obtained at varying scales. Data Analysis. The engineer will be able to analyze environmental and economic problems

1444 PHOTOGRAMMETRIC ENGINEERING, 1974
Fig. 10. 100 feet-per-inch Plot, Plotted on Gerber Model 32 Precision Flat Bed Plotter.
through combining the selective areas and fea- ture uses. This would display a certain area, the type of improvements and transportation routes available.
These are only a few examples of how the stored data can be manipulated. The im- plementation of this system opens the possi- bility of developing capabilities that will permit engineers and managers (1) to obtain information heretofore unavailable or in an undesirable form and, (2) to make decisions based on this information.
Implementation of the Automated Map- ping System into the production environ- ment of the Texas Highway Department pro- vides an effective method for collection, stor- age and retrieval of large volumes of map data, and offers the engineer flexibility for automated manipulation of the map data heretofore unavailable.
The cost involved in obtaining map data using automated methodology is comparable to the cost of maps produced using manual techniques. The added expenses of equip- ment depreciation for the digitizing acces- sories, computer time, editing and precision
plotting are offset by the substantial reduc- tion in the number of man hours required to complete the job manually.
Attempting to compare the economics of an Automated Mapping System to conventional mapping techniques is similar to comparing photogrammetric mapping to conventional field mapping. Appraisal values for the ad- vanced methods depend on the resourceful- ness of the user in performing the variety of manipulative processes available.
Graphics produced by automated manipu- lation of map data offer new concepts and dimensions for presentation. These plots can be obtained at different scales, line weights and line t v ~ e s in a time frame much faster , . than an identical map manuscript can be scribed using standard cartographic tech- niques. This time comparison ranges from 10 times faster using a precision flatbed plotter with the optical exposure head to 50 times faster for edit plotting on the CalComp 1136 drum plotter.
The limited amount of manual drating used with automated graphics permits personnel previously restricted to drafting duties the opportunity to be trained and assigned to other production areas in the Photogram-

AUTOMATED MAPPING SYSTEM IMPLEMENTATION 1445
STEREO PLOTTER UNITS
MINI - COMPUTER FIG. 11. Automated Station.
metry operations. The flexibility of person- nel allocation is especially beneficial in Texas where photogrammetry is in an envi- ronment of fluctuating workloads primarily influenced by seasonal ground cover condi- tions.
Although the use of automated graphics has substantially reduced the numberofdraft-
ing personnel heretofore required and per- mitted reallocation of manpower resources, conversion to an Automated Mapping System also has necessarily upgraded and expanded the responsibilities ofall personnel involved. In addition to the limited manual carto- graphic drafting duties which will always be necessary, personnel assigned to the drafting

1446 PHOTOGRAMMETRIC ENGINEERING, 1974
AUTOMATED AUTOMATED
STATION STATION -1 - HOST COMPUTER
AUTOMATED AUTOMATED
(EARTHWORK)
PLOTTER
FIG. 12. Total Automated Information Management System.
section must assume additional respon- sibilities in editing and quality control. This will require the draftsman to be thoroughly familiar with digitizing techniques, auto- mated plotter operation and the overall proj- ect requirements. Digitizing methodology requires the stereoplotter operator to acquire the added skills of a photo interpreter, or image analyst, for accurately entering the correct identification code for each feature. Useful manipulation of the data for presenta- tion of selective graphics or statistical analyses is totally dependent on this digital input.
The modular conversion program for mod- ifying individual stereoplotter units for au- tomated mapping has worked very well with little interruption to the Department's exist- ing schedule commitments. With the host IBM 370 computer readily accessible in the same building, card handling from each in- dependent stereoplotter unit offers no seri- ous production problems; however, use of the keypunch collection system limits rapid editing capabilities, consequently reducing the potential efficiency of the system.
To overcome edit deficiencies and op- timize the overall system, it is the Department's intent to replace the individual keypunch data collectors with multiple au- tomated stations. The automated stations would permit the use of all existing digital
hardware with the exception ofthe keypunch interface which would necessarily be re- placed with a computer interface. Each au- tomated station could consist of three to five stereoplotter units with digitizing acces- sories, a cathode ray tube (CRT) display with a hard copy unit and a minicomputer as shown in Figure 11.
This equipment configuration will permit each stereoplotter operator interaction be- tween the digitizer, mini-computer and the CRT display. In congested areas hard copies of the digitized data can be obtained by the operator for editing purposes. This will avoid extended use of the display tube by any one operator. The edited data will be transmitted by the stereo operator to the host IBM 370 computer for final processing, disk storage and further manipulation as required. The use of several automated stations with small- er mini-computers is preferable over having a total system with one larger computer in order to minimize production delays caused by the inevitable down time of electronic equipment. Figure 12 represents the pro- posed multiple automated stations which will utilize the host IBM 370 computer, disk files, magnetic tapes and a precision flatbed plotter for graphics.
The Texas Highway Department is pres- ently preparing specifications to purchase or lease a precision flatbed plotter for use in conjunction with the CalComp 1136 drum plotter purchased by the Department several months ago.