Maintenance Mapping
64
4/22/09 Maintenance Mapping
-
Upload
khangminh22 -
Category
Documents
-
view
3 -
download
0
Transcript of Maintenance Mapping

4/22/09
Maintenance
Mapping

Automotive
Castings
Freight
Wood/Paper
Aerospace
Shipyard
Dairy
Plastic
forming
Consumer
film
Battery
plants
Nuclear
Bearings
Heat Treat
Food
Automotive
Tubes
Metal
Scrap yards
Office
Furniture
Sheet
Metal
Tools
Aerospace
Steel
Plating
Nuclear
AerospaceFreight
Freight
Freight
Extrusions
Office
Furniture
Wood
Working
Greeting Cards
Plastic
forming
Plastic
forming
Printing
Chemical
Chemical
Chemical
Chemical
Medical
Chemical Automotive
Printing
Pharmaceutical
Industries
working with
Fuss & O’Neill
Manufacturing Solutions LLC

In the U.S. - 2008:
• Equipment productivity < 50%
• Over $200 billion spent on
wasteful maintenance
related practices.

1. Stabilize Failure Intervals
2. Improve Equipment Productivity
3. Maintenance Excellence
4. Predict Equipment Life
Zero Equipment Stoppages

1. Establish Basic Conditions by Cleaning, Lubricating
& Tightening - Inspection.
2. Expose Safety Concerns Through Cleaning/Inspection
3. Expose Abnormalities & Restore New Conditions.
4. Understand & Simplify Operating Conditions and
Operate Accordingly.
5. Eliminate the Environment Causing Accelerated
Deterioration (Control Contamination Source).
6. Establish Daily Inspection & Lubricating Standards.
7. Initiate and Implement Extensive Visual Controls.
8. Gather OEE Data & Prioritize Improvements
Stabilize Failure Intervals

Typical conditions:
• Breakdowns occur regularly
• Temporary repairs are the norm
• There is often a run-to-failure
mentality
• Constant adjustments interrupt
production
• Minor stoppages occur frequently
• Processing speed decreases
• Equipment does not repeat
• Operator training may not be
adequate
• No one is accountable for tracking
these losses
Current State of Manufacturing

Y AXIS WAYS
1200mm 155446 38x100x1862mm
1500mm 155447 38x100x2162mm
Y TRUCK
1025586
LH 53250
Y TRUCK
1-25587
RH 53200
DOUBLE WIPER KIT
front of x & front z only
38x100............4-18650-01
X/Z WAY PLUG EPOXY
silver 500.............234233
empty cartridge 234284
one of each per way unit
Z TRUCK
1-25586
LH 53250
REAR
Z TRUCK
1-25587
RH 53200
FRONT
X FRONT WAY
1200mm 155450 75x100x2920mm
1500mm 155452 75x100x3220mm
2400mm 608647 75x100x4132mm
X TRUCK
1-25584
LH 52250
REAR
X REAR WAY
1200mm 155450 75x100x2920mm
1500mm 155452 75x100x3220mm
2400mm 608647 75x100x4132mm
Z AXIS WAY(2)
155444 38x100x2034
609238 38x100x2334
Y TRUCK
1-25587
RH 53200
Y TRUCK
1-25586
LH 53250
Z TRUCK
1-25587
RH 53200
REAR
Z TRUCK
1-25586
LH 53250
FRONT
X TRUCK
1-25585
RH 52200
REAR
X TRUCK
1-25582
LH 54250
FRONT
ORION 2300X TRUCK
1-25583
RH 54200
FRONT

Is everything OK under
this guard??

Can this be a K&T Orion
common occurrence??
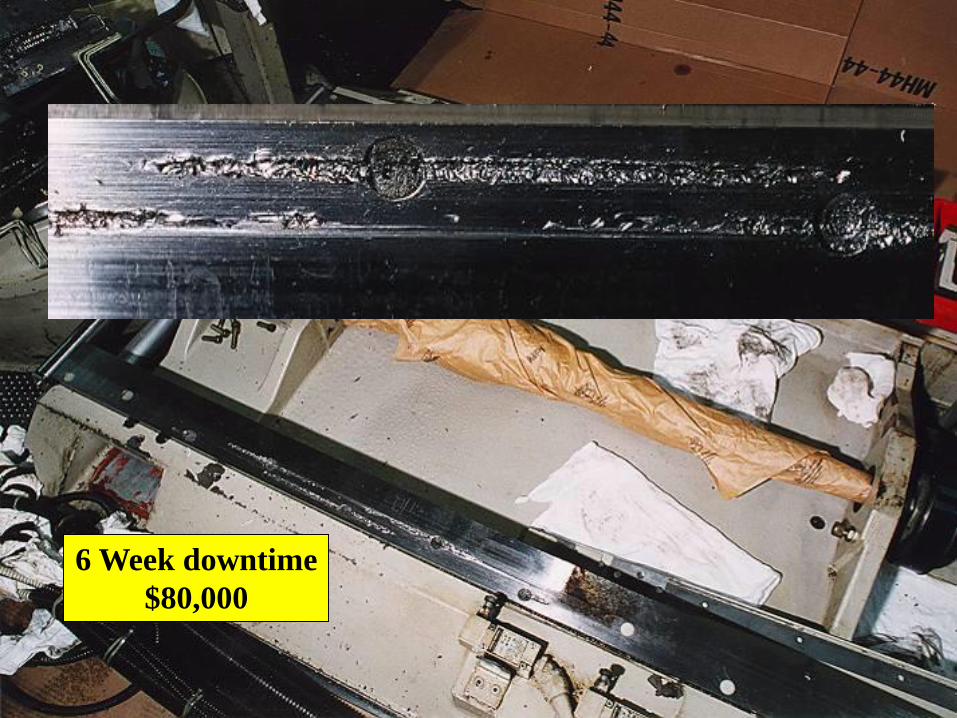
6 Week downtime
$80,000

1. Pareto failures by seriousness.
- Prevent major breakdowns from recurring.
2. Correct equipment design weaknesses.
- Develop countermeasures
- against contamination
- make equipment more accessible
3. Eliminate the 6 major losses per OEE roadmap.
Improve Equipment Productivity

39%24%
15%
16% 6%
Running Time
Minor Stoppages
Break Downs
Set-up
Scrap
Typical Overall Equipment Effectiveness
Lost Capacity - 60%

90%
2%3%4%
1%
Running Time
Minor Stoppages
Break Downs
Set-up
Scrap
“World Class” O.E.E. Measurements
More Capacity-130%The Same Equipment

10 X
Leverage
Point

• Equipment productivity < 50%
• Over $200 billion spent on
wasteful maintenance
related practices.
In the U.S. - 2008:

2003 Department of Commerce

Over $180 billion spent on wasteful maintenance related practices.
What are some of these??
• Waiting at the parts crib
• Looking for parts
• Looking for consumables; bolts, nuts, pipe fittings, set screws, etc.
• Looking for and getting out maintenance tools; drills, saws, etc.
• Travel time.
• Making repairs that could have been prevented with PM.
• Making repairs that are larger and more costly (10X) than earlier
during a PM.
• Making incorrect repairs.
• Replacing parts that do not need replacing.
• Replacing parts with poor quality (low cost) parts.
• Replacing parts with bad (broken) parts, by mistake.
• Emergency parts shipment (Fed-ex) costs.
• Maintenance overtime performing emergency repairs.
• Switching from one emergency to another.
• Making temporary repairs.
• Lack of maintenance training.
• Poor lubrication basics.
• Poor communication between shifts.

Maintenance Excellence
(Quality Maintenance)
1. Evaluate & develop Maintenance Excellence.
- Maintenance Mapping (VSM)
- Maintenance 5’S
- Skills matrix
- Skills training
- Control spare parts
2. Develop a planned maintenance system.
- Perform periodic servicing & inspection
- Perform condition based servicing & inspection
- Establish work standards
- Computerize maintenance information processing
3. Develop guidelines for purchasing & installing new equipment.
- Maintenance specifications for new equipment
- Procedure for new installations

Improve safety and
working conditions
Maximize
Overall Equipment
Effectiveness
Improve
regulatory compliance
Improve the MTTR
(Mean Time to Repair)
1
2
3
Maintenance
Excellence
Objectives
4
• Response time
•Availability of:
- materials
- tools
- parts
• Troubleshooting time
• Paperwork time
• ISO
• OSHA
• Calibrations
• PM’s
•Accidents
• Close calls
• Lost work days
• Workers compensation costs
• Equipment productivity
• Equipment capacity
• Equipment quality

Maintenance Management
Office
Supv.
attend.
Skills
matrix
W.O.
System
Failure
history
Equip.
docum.
Manuals,
prints,
etc.
Maintenance
tools :
hydraulic jacks,
bearing puller,
power wash,
drills, saws, etc.
Machining
area:
lathes,
drill,
grinder,
arbor press
etc.
Lubrication
area:
Oils, greases,
dispensing
Waste
area:
Rags,
oil, grease,
speedi-
dry
Fasteners
Plumbing
Adhesives
Spare parts
Inventory
Repairable
spare
parts
Production line
breakdown
Utilization – %
OEE - %
Planned vs unplanned – %
Walking
Telephone
Electronic
Maintenance
$$ per hour down - $
Parts
ordering
system
D.T. -
V.A. -
Regular parts
shipment
Emergency air
Shipment
Safety area:
ladders,
slings, lifts,
PPE,
LOTO
center, etc.


Maintenance Excellence - Maintenance Mapping – Example
We followed 5 maintenance technicians on some routine trouble calls.
Here is a typical example.
Production calls in to the maintenance supervisor by phone, that Plastic Container Line B is down.
A lube fault light is on.
Maintenance supervisor waits for the next available electrician (this has happened before). The
Electrician gets out to Line B in 60 minutes. The Electrician needs the Operator to jog the equipment
for him – 30 minutes. He then troubleshoots & finds a problem with the lube fault feed hold relay –
30 minutes.
He walks to the crib for a replacement part. Parts are altogether in a bin. It looks OK so he goes
back to the machine, plugs in the relay, but he sees the same problem – 60 minutes. He goes back to
the crib for another relay, takes two this time and returns, and installs the next one – 30 minutes.
The lube fault light is out, everything looks OK. The Electrician goes back to the crib, puts back
the second relay & tells his supervisor Line B is running – 30 minutes.
The Maintenance supervisor calls up the Production Manager and leaves a message that Line B is
OK to run…
• This processing line runs 20 hours per day
• Running @ 1,100 fpm it should produce 10,000 lbs of product/shift. They average 4,500 lbs/shift
• 20 maintenance jobs out of every 100 are planned
• Every minute of stoppage on this line is $100 of product lost

Maintenance Management
Office
Supv.
attend.
Skills
matrix
W.O.
System
Failure
history
Equip.
docum.
Manuals,
prints,
etc.
Maintenance
tools :
hydraulic jacks,
bearing puller,
power wash,
drills, saws, etc.
Machining
area:
lathes,
drill,
grinder,
arbor press
etc.
Lubrication
area:
Oils, greases,
dispensing
Waste
area:
Rags,
oil, grease,
speedi-
dry
Fasteners
Plumbing
Adhesives
Spare parts
Inventory
Repairable
spare
parts
Production line
breakdown
Utilization – %
OEE - %
Planned vs unplanned – %
Walking
Telephone
Electronic
Maintenance
$$ per hour down -
60 min 30 min
30 min
60 min
30 min
Parts
ordering
system
D.T. - 240 minutes
V.A. - 60 minutes
Regular parts
shipment
Emergency air
Shipment
Safety area:
ladders,
slings, lifts,
PPE,
LOTO
center, etc.
83
45
20
$6,000
30 min
Current State
Maintenance Map


Maintenance Excellence - Maintenance Mapping – Case Study
We followed 10 maintenance technicians on some routine trouble calls.
Here is a typical example.
The Production supervisor walks over to Maintenance office to report a production line down.
It stopped 5 minutes ago, and he sent the operator to another line to “help out”. This production
supervisor doesn’t have a clue as to the problem. This is a critical line – 15 minutes.
The Maintenance supervisor sends his best available electronic technician, who walks out to
the equipment – 15 minutes.
She troubleshoots for 60 minutes & thinks it is a mechanical problem – walks back to tell the
supervisor to get a mechanic out to the line.
A mechanic is pulled off of another job and gets to the line in 60 minutes. He begins to trouble-
shoot & believes the problem is a failed bearing – 60 minutes. He needs a bearing puller & walks
back to the main maintenance area to retrieve one. We follow close behind. He finally finds one, on
the floor, located behind some nylon slings. He walks back to the downed line – 90 minutes.
It only takes him 30 minutes to pull the bearing out of the machine. He now walks to the parts crib
to find a replacement. Finding no bearings, he fills out a requisition for a new one. He locates the
supervisor to get his signature, gets to the parts ordering office & they call in the order by telephone.
The bearing is air shipped in & gets to the machine 24 hours later.
The mechanic installs the new bearing & starts up the equipment – 150 minutes. He then walks
back to the Maintenance office & tells the supervisor – 15 minutes, who walks out to the production
supervisor to tell him it is OK to run – 15 minutes.
• This equipment is run 2 shifts out of 3 ( 16 hours)
• Output should be 10,000 pieces per shift – they average 5,200 per shift
• 1 out of every 10 maintenance jobs is planned
• The company loses $2,000 for each hour the line is down

Maintenance Management
Office
Supv.
attend.
Skills
matrix
W.O.
System
Failure
history
Equip.
docum.
Manuals,
prints,
etc.
Maintenance
tools :
hydraulic jacks,
bearing puller,
power wash,
drills, saws, etc.
Machining
area:
lathes,
drill,
grinder,
arbor press
etc.
Lubrication
area:
Oils, greases,
dispensing
Waste
area:
Rags,
oil, grease,
speedi-
dry
Fasteners
Plumbing
Adhesives
Spare parts
Inventory
Repairable
spare
parts
Production line
breakdown
Utilization – %
OEE - %
Planned vs unplanned – %
Walking
Telephone
Electronic
Maintenance
$$ per hour down -
30 min 60 min 60 min
60 min
90 min
30 min
Pull
bearing
Parts
ordering
system
24 hours
150 min
D.T. - 32 hours +
V.A. - 240 minutes
Replace
bearing
Regular parts
shipment
Emergency air
Shipment
Safety area:
ladders,
slings, lifts,
PPE,
LOTO
center, etc.
67
52
10
$2,000
30 min
Current State
Maintenance Map

Maintenance Management
Office
Supv.
attend.
Skills
matrix
W.O.
System
Failure
history
Equip.
docum.
Manuals,
prints,
etc.
Maintenance
tools :
hydraulic jacks,
bearing puller,
power wash,
drills, saws, etc.
Machining
area:
lathes,
drill,
grinder,
arbor press
etc.
Lubrication
area:
Oils, greases,
dispensing
Waste
area:
Rags,
oil, grease,
speedi-
dry
Fasteners
Plumbing
Adhesives
Spare parts
Inventory
Repairable
spare
parts
Production line
Office
Utilization – %
OEE - %
Planned vs unplanned – %
Walking
Telephone
Electronic
Maintenance
$$ per hour down -
45 min 5 min 30 min 30 min
Parts
ordering
system
180 minutes
150 min D.T. - 3 hours
V.A. - 300 minutes
Regular parts
shipment
Safety area:
ladders,
slings, lifts,
PPE,
LOTO
center, etc.
67
82
70
$2,000
Potential Future State
Maintenance Map P
lan
ner
ord
ers
be
ari
ng
Planner kits
parts
10 min
Planner/Scheduler/
Reliability Engineer
30 min
Reliability Engineer
determines that this bearing
should be part of a vibration
analysis route. At some point the
bearing starts to fail and is picked
up by the vibration analysis
equipment.

Potential Future State Maintenance Map
This is a critical line. The Reliability Engineer chose this bearing, as part of a vibration analysis
Predictive Maintenance route. A quarterly vibration analysis check, from a Predictive Maintenance
supplier, showed that this bearing was deteriorating.
The Planner/Scheduler:
• estimated the replacement bearing job @ 180 minutes (3 hours) – 15 minutes.
• opened a work order (job) – 5 minutes.
• ordered the bearing – 15 minutes.
• checked the availability of a bearing puller – 10 minutes.
4 days later (regular shipping) the bearing was delivered. The Planner/Scheduler sent an e-mail
to the Production Supervisor, asking for 180 minutes (3 hours) of downtime for the required
bearing replacement – 5 minutes.
The machine was scheduled for Friday from 9AM to 12 Noon. The Planner/Scheduler kitted the
Bearing & puller, etc. for Maintenance & scheduled a mechanic for Friday morning – 30 minutes.
The mechanic picked up the Planned Maintenance Kit @ 8:30AM on Friday and was ready at
the machine @ 9AM. Production had planned a short employee meeting and a set up during the
planned downtime. The mechanic pulled the bearing – 30 minutes & installed the new bearing –
150 minutes. Machine was ready to start back up @ 12 Noon.
The mechanic returned the bearing puller and deteriorated bearing to the crib – 10 minutes.
The Reliability Engineer inspected the bearing to determine the cause of failure – 30 minutes.
• This equipment is run 2 shifts out of 3 ( 16 hours)
• Output should be 10,000 pieces per shift – they average 8,200 per shift
• 7 out of every 10 maintenance jobs is planned
• The company loses $2,000 for each hour the line is down

Maintenance Excellence
(Quality Maintenance)
1. Evaluate & develop Maintenance Excellence.
- Maintenance Mapping (VSM)
- Maintenance 5’S
- Skills matrix
- Skills training
- Control spare parts
2. Develop a planned maintenance system.
- Perform periodic servicing & inspection
- Perform condition based servicing & inspection
- Establish work standards
- Computerize maintenance information processing
3. Develop guidelines for purchasing & installing new equipment.
- Maintenance specifications for new equipment
- Procedure for new installations

5’sThe Foundation of all Improvement Activities
o Sort - Eliminate what is not needed
o Straighten - A place for everything &
Set in order everything in its place
o Shine - Cleaning/Inspection. Easy
to identify trouble
o Standardize - Maintain & monitor
o Sustain - Management support is
absolute! Becomes way of life.

SORT
Divide items into
two categories
Necessary Unnecessary
Discard
Unnecessary
items
Categorize the
Necessary items
o Rarely
o Occasionally
o Frequently
Used:
1.

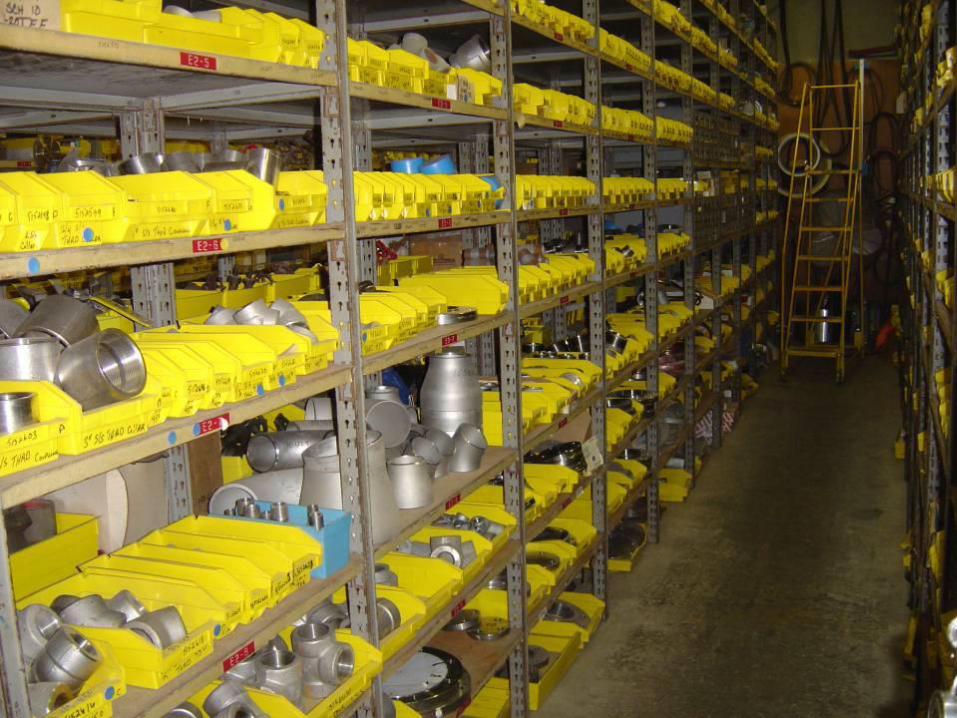
Some of the obsolete equipment!!!

Let’s sort…

2.Set in Order
Determine
Location for
Needed Items
Tools or
Fixtures
Point of Use Storage
Identification
Lines

Maintenance Storage
room, crammed with
needed Items … ?


Shine
3.Eliminate Dirt
Cleaning is Inspection
Builds Pride
in Work Areas


Cleaned, repaired, filtered,
And we know coolant is flowing!!

4.StandardizeAssign
Responsibilities
(Schedule)
Integrate “3 S” Duties into
Regular Work Schedule
(10 Minutes/Day)
Use Checklists
(Operator PM)
Check
Monitor
Inspect

Maintenance Stores ….
5’S


5.Sustain
Management
Committed
To 5’S
Training
Develop
Buy-in
From All
Workers
Correct Actions Become a Habit
5’S

Maintenance Management
Office
Supv.
attend.
Skills
matrix
W.O.
System
Failure
history
Equip.
docum.
Manuals,
prints,
etc.
Maintenance
tools :
hydraulic jacks,
bearing puller,
power wash,
drills, saws, etc.
Machining
area:
lathes,
drill,
grinder,
arbor press
etc.
Lubrication
area:
Oils, greases,
dispensing
Waste
area:
Rags,
oil, grease,
speedi-
dry
Fasteners
Plumbing
Adhesives
Spare parts
Inventory
Repairable
spare
parts
Production line
breakdown
Utilization – %
OEE - %
Planned vs unplanned – %
Walking
Telephone
Electronic
Maintenance
$$ per hour down - $
30 min 60 min 60 min
60 min
90 min
30 min
Pull
bearing
Parts
ordering
system
24 hours
150 min
D.T. - 32 hours
V.A. - 240 minutes
Replace
bearing
Safety area:
ladders,
slings, lifts,
PPE,
LOTO
center, etc.
Regular parts
shipment
Emergency air
Shipment

A bearing puller - we didn’t know where it was…..

Now we do…..

Shared Maintenance
tools…

Maintenance 5’S

Maintenance Management
Office
Supv.
attend.
Skills
matrix
W.O.
System
Failure
history
Equip.
docum.
Manuals,
prints,
etc.
Maintenance
tools :
hydraulic jacks,
bearing puller,
power wash,
drills, saws, etc.
Machining
area:
lathes,
drill,
grinder,
arbor press
etc.
Lubrication
area:
Oils, greases,
dispensing
Waste
area:
Rags,
oil, grease,
speedi-
dry
Fasteners
Plumbing
Adhesives
Spare parts
Inventory
Repairable
spare
parts
Production line
breakdown
Utilization – %
OEE - %
Planned vs unplanned – %
Walking
Telephone
Electronic
Maintenance
$$ per hour down - $
30 min 60 min 60 min
60 min
90 min
30 min
Pull
bearing
Parts
ordering
system
24 hours
150 min
D.T. - 32 hours
V.A. - 240 minutes
Replace
bearing
Safety area:
ladders,
slings, lifts,
PPE,
LOTO
center, etc.
Regular parts
shipment
Emergency air
Shipment

What’s new, what’s broken??
What has been rebuilt???
Need a Repairable parts system…..


Maintenance Management
Office
Supv.
attend.
Skills
matrix
W.O.
System
Failure
history
Equip.
docum.
Manuals,
prints,
etc.
Maintenance
tools :
hydraulic jacks,
bearing puller,
power wash,
drills, saws, etc.
Machining
area:
lathes,
drill,
grinder,
arbor press
etc.
Lubrication
area:
Oils, greases,
dispensing
Waste
area:
Rags,
oil, grease,
speedi-
dry
Fasteners
Plumbing
Adhesives
Spare parts
Inventory
Repairable
spare
parts
Production line
breakdown
Utilization – %
OEE - %
Planned vs unplanned – %
Walking
Telephone
Electronic
Maintenance
$$ per hour down - $
30 min 60 min 60 min
60 min
90 min
30 min
Pull
bearing
Parts
ordering
system
24 hours
150 min
D.T. - 32 hours
V.A. - 240 minutes
Replace
bearing
Safety area:
ladders,
slings, lifts,
PPE,
LOTO
center, etc.
Regular parts
shipment
Emergency air
Shipment

Ladders, cleaning tools, chains, etc…..
Can we organize better??? These
ladders are located on the inside of
the maintenance area…

New ladder storage,
close to the main aisle…
easier/quicker access….

Maintenance Management
Office
Supv.
attend.
Skills
matrix
W.O.
System
Failure
history
Equip.
docum.
Manuals,
prints,
etc.
Maintenance
tools :
hydraulic jacks,
bearing puller,
power wash,
drills, saws, etc.
Machining
area:
lathes,
drill,
grinder,
arbor press
etc.
Lubrication
area:
Oils, greases,
dispensing
Waste
area:
Rags,
oil, grease,
speedi-
dry
Fasteners
Plumbing
Adhesives
Spare parts
Inventory
Repairable
spare
parts
Production line
breakdown
Utilization – %
OEE - %
Planned vs unplanned – %
Walking
Telephone
Electronic
Maintenance
$$ per hour down - $
30 min 60 min 60 min
60 min
90 min
30 min
Pull
bearing
Parts
ordering
system
24 hours
150 min
D.T. - 32 hours
V.A. - 240 minutes
Replace
bearing
Safety area:
ladders,
slings, lifts,
PPE,
LOTO
center, etc.
Regular parts
shipment
Emergency air
Shipment

Simple machines were scattered…

Moved them together, based on usage…..

Over $180 billion spent on wasteful maintenance related practices.
What are some of these??
• Waiting at the parts crib
• Looking for parts
• Looking for consumables; bolts, nuts, pipe fittings, set screws, etc.
• Looking for and getting out maintenance tools; drills, saws, etc.
• Travel time.
• Making repairs that could have been prevented with PM.
• Making repairs that are larger and more costly (10X) than earlier
during a PM.
• Making incorrect repairs.
• Replacing parts that do not need replacing.
• Replacing parts with poor quality (low cost) parts.
• Replacing parts with bad (broken) parts, by mistake.
• Emergency parts shipment (Fed-ex) costs.
• Maintenance overtime performing emergency repairs.
• Switching from one emergency to another.
• Making temporary repairs.
• Lack of maintenance training.
• Poor lubrication basics.
• Poor communication between shifts.
Impact
Impact
Impact
Impact
Impact
Impact
Impact
Impact
Impact
Impact
Reduced MTTR by 15%!!!

MTTR/OEE
0
1
2
3
4
5
6
7
8
9
10
Oct Nov Dec Jan Feb Mar Apr May Jun Jul Aug Sep Oct
MT
TR
60
62
64
66
68
70
72
74
76
OE
E
/Maintenance
5S Focus

Predict Equipment Life
1. Develop a Predictive Maintenance System.
o Introduce Predictive Equipment & Techniques.
o Train Equipment Diagnosticians.
o Perform Condition Monitoring.
2. Consolidate Improvement Activities.
o Perform Failure Analysis Using Specific
Engineering Techniques.
o Extend Equipment Life by Developing New
Materials and Technologies.

Total Equipment Maintenance Program
Cost Summary
$-
$100,000
$200,000
$300,000
$400,000
$500,000
$600,000
$700,000
$800,000
1999 2000 2001 2002
Autonomous
Predictive
Preventive
Vended
In House
10% reduction -
maintenance costs
With the same Maintenance workforce: performed less preventive (enhanced the PM’s to be more
effective), more predictive maintenance, more autonomous (operator) checks, and less vended
maintenance services.