Hot Spot Determination - ASPRS
10
GORDON R. HEATH Aerospace Systems Division Lockheed Electronics Co. Houston, Texas Hot Spot Determination A solution to the hot spot problem is presented with tables and graphs to aid in planning photographic missions. INTRODUCTION tant goal for earth resources investigators. THE COMPUTATIONS SHOWN here for locating A serious problem in securing high qudir/ fie hot spot area have been developed aerial photography over forested areas is the for the Houston vicinity, but it is a relatively damage which "hot spots" may do to the easy task to work them out for other loca- ~hotogra~~y. A "hot when to tions. It is particularly important that aerial aerial photography, may be defined as an photographers in the tier of states elliptical area of bright reflections which ap- in this country, and in the tropics, be aware pears on vertical aerial photography at the of hot spot problems and their solutions, be- antisolar point, 180" from the direction of cause hot spots are only troublesome in high the sun." The hot spot appears at the same sun-angle areas. It is increasingly important vertical angle from the principal point of the ABSTRACT: Hot spots pose serious problems in the photography of forested areas, where color films are used and high sun angles are en- countered. A hot spot, when applied to aerial photography, is a bright reflection 180" away from the direction of the sun. Aerial photo- graphers operating in the southern tier of the states in this country, and in the tropics, need to be aware of the hot spot problem and its solution. It is important to avoid this exposure anomaly if high quality products are desired for analysis by photometry and densitometry. The hot spot phenomenon has received very little attention b y aerial photographers largely because it is most troublesome over forested area in latitudes where the sun angle is high, such as in the Houston area. A sun altitude nomogram may be used to graphically compute the hot-spot-free time. The paper presents as an example a solution for 30" latitude areas, but similar solutions can be easily worked out for other latitudes. A table and graphs of hot-spot-free times are presented and these can be used to plan photographic missions. Small amounts of hot spotting can occasionally be tolerated for mosaic purposes, and directions are given for computing permissible amounts. Hot spot and sun reflections also aflect the data from electro-optical scanners, but this is beyond the scope of this paper. to secure high quality color ~ h o t o g r a p h ~ free photography as the solar reflection point, from exposure anomalies, so that scientific although in the opposite direction. These analysis, by means of photometry and densi- angular relationships are shown in Figure 1. tometry, may be conducted. This type of At the center of the hot spot is a point, analysis is leading toward one of several where the strongest reflections occur, which automatic interpretation methods, an impor- is also called the "no-shadow-point." The " The term "hot spot" is an unfortunate choice metric literature (see References 3, 4, and 5), it for a number of reasons. Instead of a spot it is is continued here to prevent confusion. A better a wide area of high reflectiveness around a cen- term wolild have been "retro-reflection," a term tral hot spot. The term is also used by ~hotog- recently adopted by researchers in aerospace raphers as a synonym for a highlight. However, optics. This new term is used here only to since the term has been used in the ~hotogram- identify the reflective area around the hot spot. 1205
-
Upload
khangminh22 -
Category
Documents
-
view
0 -
download
0
Transcript of Hot Spot Determination - ASPRS
GORDON R. HEATH Aerospace Systems Division
Lockheed Electronics Co. Houston, Texas
Hot Spot Determination A solution to the hot spot problem is presented with tables and graphs to aid in planning photographic missions.
INTRODUCTION tant goal for earth resources investigators.
T H E COMPUTATIONS SHOWN here for locating A serious problem in securing high qudir/ fie hot spot area have been developed aerial photography over forested areas is the
for the Houston vicinity, but it is a relatively damage which "hot spots" may do to the easy task to work them out for other loca- ~ h o t o g r a ~ ~ y . A "hot when to tions. I t is particularly important that aerial aerial photography, may be defined as an photographers in the tier of states elliptical area of bright reflections which ap- in this country, and in the tropics, be aware pears on vertical aerial photography at the of hot spot problems and their solutions, be- antisolar point, 180" from the direction of cause hot spots are only troublesome in high the sun." The hot spot appears at the same sun-angle areas. I t is increasingly important vertical angle from the principal point of the
ABSTRACT: Hot spots pose serious problems in the photography of forested areas, where color films are used and high sun angles are en- countered. A hot spot, when applied to aerial photography, is a bright reflection 180" away from the direction of the sun. Aerial photo- graphers operating in the southern tier of the states in this country, and in the tropics, need to be aware of the hot spot problem and its solution. It is important to avoid this exposure anomaly if high quality products are desired for analysis by photometry and densitometry. T h e hot spot phenomenon has received very little attention b y aerial photographers largely because it is most troublesome over forested area in latitudes where the sun angle is high, such as in the Houston area. A sun altitude nomogram may be used to graphically compute the hot-spot-free time. The paper presents as an example a solution for 30" latitude areas, but similar solutions can be easily worked out for other latitudes. A table and graphs o f hot-spot-free times are presented and these can be used to plan photographic missions. Small amounts o f hot spotting can occasionally be tolerated for mosaic purposes, and directions are given for computing permissible amounts. Hot spot and sun reflections also aflect the data from electro-optical scanners, but this is beyond the scope of this paper.
to secure high quality color ~ h o t o g r a p h ~ free photography as the solar reflection point, from exposure anomalies, so that scientific although in the opposite direction. These analysis, by means of photometry and densi- angular relationships are shown in Figure 1. tometry, may be conducted. This type of At the center of the hot spot is a point, analysis is leading toward one of several where the strongest reflections occur, which automatic interpretation methods, an impor- is also called the "no-shadow-point." The
" The term "hot spot" is an unfortunate choice metric literature (see References 3, 4, and 5 ) , it for a number of reasons. Instead of a spot it is is continued here to prevent confusion. A better a wide area of high reflectiveness around a cen- term wolild have been "retro-reflection," a term tral hot spot. The term is also used by ~hotog- recently adopted by researchers in aerospace raphers as a synonym for a highlight. However, optics. This new term is used here only to since the term has been used in the ~hotogram- identify the reflective area around the hot spot.
1205

shadow of the photographic aircraft is oc- casionally visible in the center of this point. This phenomenon is particularly noticeable on photography of forest areas, because of the shadows of the trees, as well as the overall dark color of the foliage, make the forested areas appear much darker than most of the other terrain features, as shown in Figure 2. The tree shadows in the no-shadow-point are blocked out because they fall directly behind each tree and cannot be recorded by the camera. If all the shadows in one area are blocked out, this area then appears lighter than its surroundings. Not all the high re- flectivity in the hot spot area is due to lack of shadows, however. There is also an actual increase in reflectivity where there are no trees to cast shadows. This effect is appar- ently caused by solar energy backscatter, but the physical relationship between the target, the atmosphere, and the camera are not well understood. There are many similarities be- tween hot spots and two phenomena which have been observed by meteorologists for years, called heiligenschein and anti-corona (or glory).l Meteorologists explain both these phenomena as caused by diffraction through water droplets. However, the same effect has been observed in lunar photog- raphy taken by Apollo astronauts as they circled the moon.2 The phenomena therefore cannot be explained by a water droplet the- ory, but it may be one or both of these phenomena, nevertheless.
The hot spot phenomena appears most often on aerial photography when wide angle cameras are in use. It is also more troublesome when color IR film is in use, be- cause the exposure latitude of this film is narrower than that of normal color or of black and white films, and any change in brightness is en-iphasized. There is also a large amount of infrared light reflected by hot spots, as will be shown later. Because hot spots present problems mainly under this rather narrow set of conditions, the phenom- enon has received very little attention by aerial photographers. There have been only three publications in the photogrammetric literature devoted to this subject. In Sub- chapter 2.2 of the Manual of Color Aerial Photography,3 there is an article on this sub- ject by E. A. Fleming, entitled Solar Altitude Nomograms, and there is an abbreviated ver- sion by Fleming of the same information in Photogrammetric Engineering.4 The problem was first called to the attention of the aerial photography community in 1953 by Mason.5 In these treatments hot spots were described as spots or points only, and no mention was made of the wide area of high reflectivity around them, which is now called "retro- reflection."* Therefore, in the discussion that
* There apparently has been little or no com- munication between aerial photographers, astro- physicists, meteorologists, and optical researchers on this subject. Each discipline uses different terminology, and they do not refer to each other's work in their publications.
FIG. 1. Angular relationships between sun, camera, hot spot, and reflection point. Angles A and B are equal.

HOT SPOT DETERMINATION
F R A M E 2 - 1 0 3 , IY;X 200, M A Y 3 1 , 1 9 1 2 , H W K U X . U Y u u L U L U L >UIP I l l ' i i
FIG. 2. Vertical photo taken by NASA C-130 over Sam Houston National Forest from an altitude of 2,000 feet. The camera was a 6" f.1. Wild HC-8 with 2443 color IH film.
follows a strong distinction is made between the hot spot and the retro-reflective area, with emphasis on the latter. It is the purpose of this paper to give directions for determining the size of the retro-reflective area, and for planning photographic missions so that retro- reflections may be avoided or minimized.
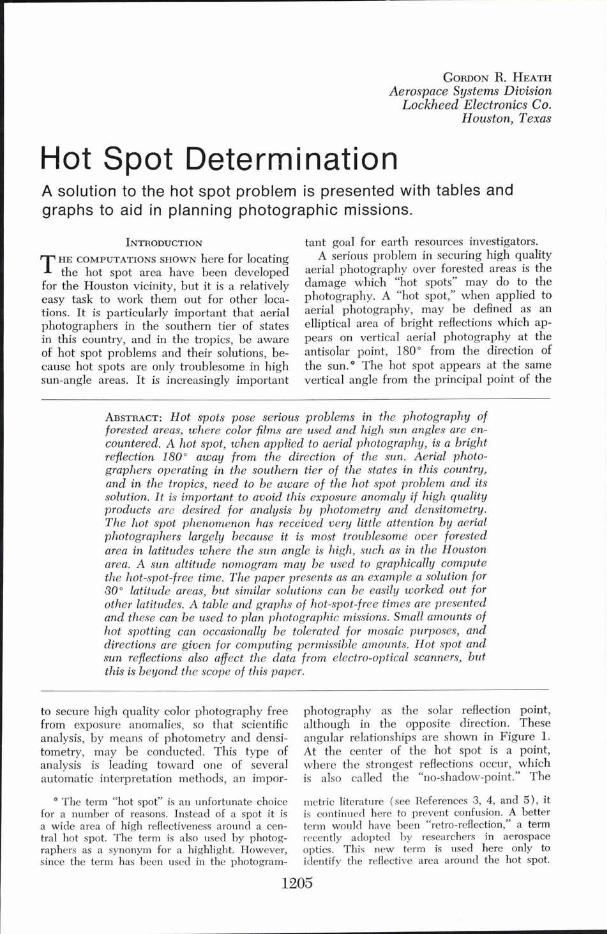
Observation of representative retro-reflec- tions on photography taken with a 6 inch focal length RC-8 camera at 2,000 and 10,000 feet altitude, shows that the retro- reflective area is approximately 67" from edge to edge with respect to the geometry of the camera. (See Figure 3 for an example taken at 10,000 feet). This is an approxi-
mate figure because retro-reflection gradually decreases in intensity toward the outer edge, and the amount of contrast in the photo- graphic print influences its size. The RC-8 camera has a field of view (FOV) of 91°, therefore the retro-reflective area is slightly more than half the size of the field of view, or 8 inches in diameter on a 9x9 format. (Since the ellipse of the retro-reflective area is nearly circular when it is viewed in vertical photography, it is treated as though it were a circle in this paper). The same diameter dimension relationships hold true for cameras with other focal lengths, because the physical cause of the phenomenon is independent of the camera. However, the angular relation- ship varies with the focal length of the cam-
FRAME 2734 . M X 182. A U G . 8 , 1 9 7 1 , 0 9 3 0 LOCAL SUN T I M E
FIG. 3. Vertical photograph taken by NASA C-130 over the Sam Houston National Fol~st from an altitude of 10,000 feet. The camera was a 6" f.1. Wild RC-8 with 2443 color IR film.
era. For example, if the focal length doubles the angle subtended by the diameter of the retro-reflective circle doubles. Such a camera would be the 12 inch focal length Zeiss camera.
The following computations hold true for photographic missions flown with a 6 inch focal length camera between 2,000 and 10,000 feet, and they are approximately valid up to 20,000 feet. For higher altitudes the angular diameter decreases in size, as shown in Figure 4. To make a graphical solution possible for 2,000 to 20,000 foot altitudes, a template was drawn representing a 67" diameter circle for placement over the solar altitude nomogram published in the previ- ously mentioned manual. (See Figure 5) The
template for the camera is first placed over the principal point of the nomogram for the area to be surveyed. For this discussion the 30" latitude nomogram was used because this is the latitude of the Houston Area Test Site.
The retro-reflective area template is then placed with its center point A on the date line of the nomogram in question. The cir- cumference of the circle is permitted to touch the edge of the frame of the camera tem- plate, with the line B passing through the principal point. The time on the date line of the nomogram at point A is then read. This is the time when the retro-reflective area is just outside the frame. A series of these times was determined graphically, and they appear

HOT SPOT DETERMINATION
D I A M E T E R I N FEET ( S O L I D L I N E )
FIG. 4. A graph of the size of retro-reflections recorded from varying altitudes for 6" focal length cameras, or the equivalent.
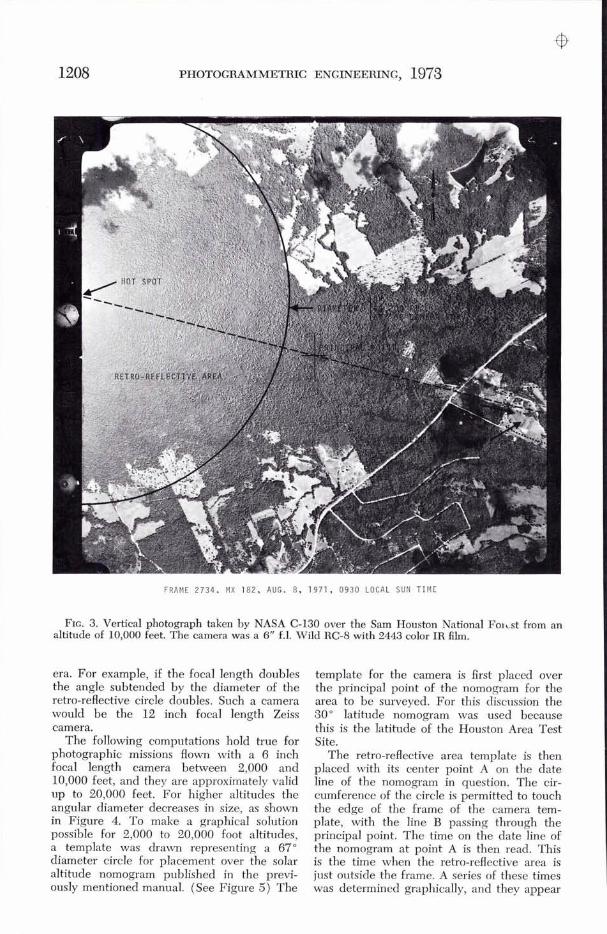
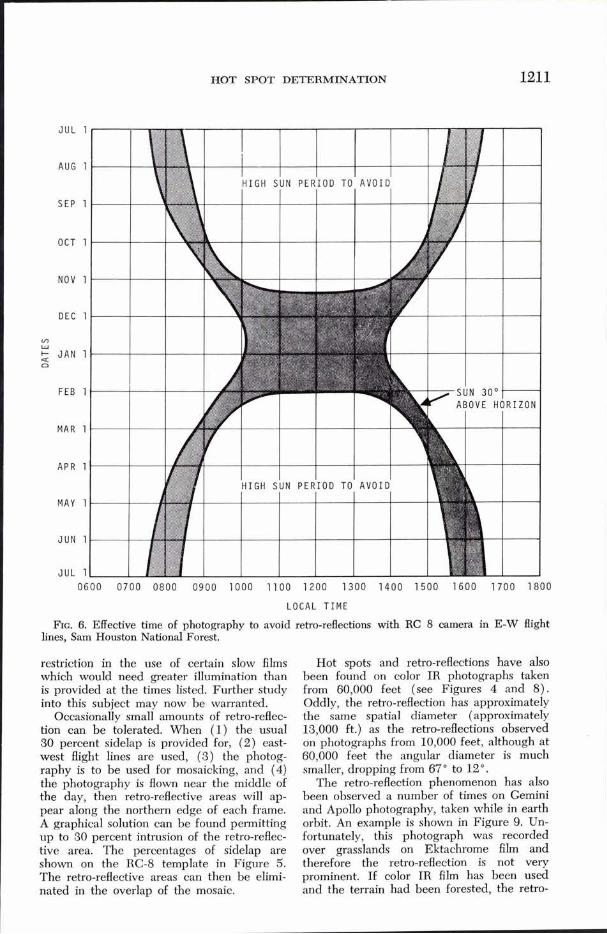
in Table 1 and plotted as graphs in Figures 6 and 7. All times are local sun times and they can be converted to standard time by use of the following formula:
Standard Time = Solar Time + Local Longitude
15
These graphs also show the times when the
sun is 30" above the horizon, the lower limit generally accepted by aerial photographers for good photography. These graphs can be used to determine hot-spot-free flying time. This presents severe restrictions in the Hous- ton area because flying time is reduced to an hour in the morning and an hour in the afternoon, except for the low sun angle pe- riod from November 10 to February 1, when the RC-8 camera is to be used. Flying time

TABLE 1. TIMES WHEN SUN IS 30' ABOVE HORIZON AND RETRO-REFLECTIVE AREAS WILL APPEAR ON PHOTOGRAPHY OF HOUSTON AREA TEST SITE
30" above HOT. RC-8 Zeiss
Jun 22 0730-1630 0825-1535 0910-1450 Jul 22 0740-1620 0830-1530 0920-1440
Aug 13 0747-1613 0840-1520 0925-1435 Aug 27 0755-1605 0850-1510 0930-1430 Sep 10 0810-1550 0900-1500 0940-1420 Sep 24 0820-1540 0905-1455 1000-1400 Oct 6 0835-1525 0910-1450 1030-1330 Oct 20 0845-1515 0930-1430 Nov 4 0915-1445 1000-1400 NOV 22 0945-1415 Dec 22 1005-1355 Jan 21 0945-1415
Feb 10 0915-1445 1000-1400 Feb 23 0845-1515 0930-1430 Mar 8 0835-1525 0910-1450 1030-1330 Mar 20 0820-1540 0905-1455 1000-1400 Apr 3 0810-1550 0900-1500 0940-1420 Apr 16 0755-1605 0850-1510 0930-1430 May 1 0747-1613 0840-1520 0925-1435 May 21 0740-1620 0830-1530 0920-1440 Jun 22 0730-1630 0825-1535 0910-1450
Z E I S S FRAME T E M P L A T E
T E M P L A T E
I B
FIG. 5. Solar altitude nomogram and templates.
is only slightly longer for the longer length afternoon, except for October 1 to March 5, Zeiss camera. There is a one and a half hour when the sun is low enough to present no period in the morning and the same in the problems. These times may also present a
J U L 1
A U G 1
S E P 1
QCT 1
N O V 1
D E C 1
W 2 J A N 1 n
FEB 1
M A R 1
M A Y 1
J U N 1
J U L 1
HOT SPOT DETERMINATION
L O C A L T I M E
FIG. 6. Effective time of photography to avoid retro-reflections with RC 8 camera in E-W flight lines, Sam Houston National Forest.
restriction in the use of certain slow films which would need greater illumination than is provided at the times listed. Further study into this subject may now be warranted.
Occasionally small amounts of retro-reflec- tion can be tolerated. When (1 ) the usual 30 percent sidelap is provided for, ( 2 ) east- west flight lines are used, (3) the photog- raphy is to be used for mosaicking, and (4) the photography is flown near the middle of the day, then retro-reflective areas will ap- pear along the northern edge of each frame. A graphical solution can be found permitting up to 30 percent intrusion of the retro-reflec- tive area. The percentages of sidelap are shown on the RC-8 template in Figure 5. The retro-reflective areas can then be elimi- nated in the overlap of the mosaic.
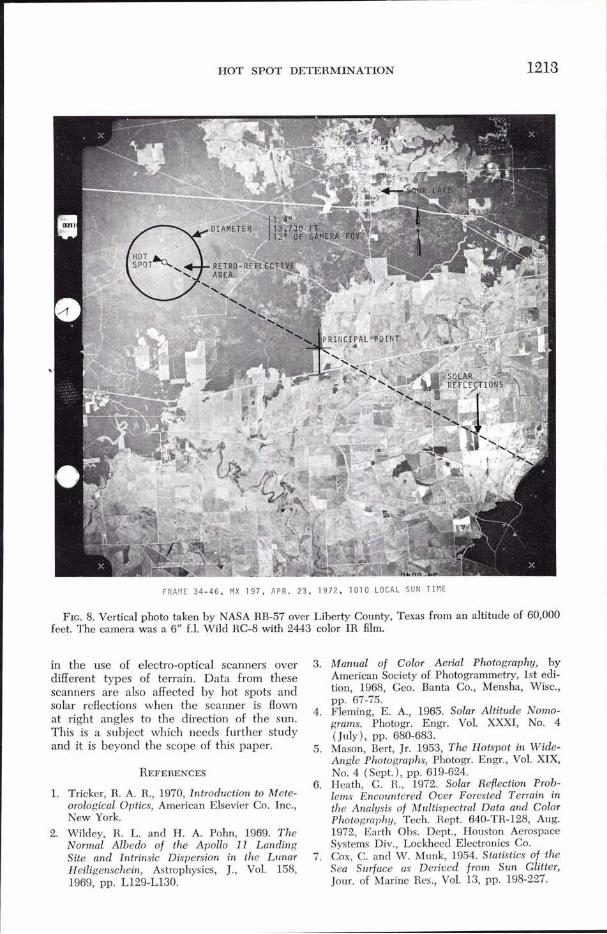
Hot spots and retro-reflections have also been found on color IR photographs taken from 60,000 feet (see Figures 4 and 8) . Oddly, the retro-reflection has approximately the same spatial diameter (approximately 13,000 ft.) as the retro-reflections observed on photographs from 10,000 feet, although at 60,000 feet the angular diameter is much smaller, dropping from 67" to 12".
The retro-reflection phenomenon has also been observed a number of times on Gemini and Apollo photography, taken while in earth orbit. An example is shown in Figure 9. Un- fortunately, this photograph was recorded over grasslands on Ektachrome film and therefore the retro-reflection is not very prominent. If color IR film has been used and the terrain had been forested, the retro-

J U L 1
A U G 1
S E P 1
O C T 1
NOV 1
O E C 1
Ln
J A N 1 =t 0
M A R 1
A P R 1
M A Y 1
J U N 1
J U L 1
L O C A L T I M E
FIG. 7. Effective time of photography to avoid retro-reflections with Zeiss camera in E-W flight lines, Sam Houston National Forest.
reflection would undoubtedly have been larger in diameter and brighter.
A recent mission in which a multispectral scanner was used provided an unusual op- portunity to measure the spectra of the edge or tail of a retro-reflective area as it trailed off into infinity over a forested area.6 On November 11, 1971 Mission 51M was flown with the Michigan 12 channel scanner. After- ward it was discovered that a hot spot and the major portion of the retro-reflective area lay just outside the field of view of both the scanner and the camera which was exposed at the same time. The effects of the tail of the retro-reflection were visible on both rec- ords, however, and it permitted a measure-
ment of the spectral distribution of the light in this reflection to be made. As shown in the graph in Figure 10, the infrared values were the greatest, followed by the red, green, and blue light values. This is the first conclusive evidence that the retro-reflection is largely infrared light.
There are times when hot spots, and solar reflections, are desirable. This is because oceanographers are able to analyze sea state from the solar reflection, or sun glint, ob- served on a water surface.? For such an ap- plication the hot spot and solar reflection phenomenon should be sought instead of avoided.
There is related problems, as shown above,
HOT SPOT DETERMINATION
FRAME 34 -46 , M X 197 , A P R . 2 3 , 1 9 7 2 , 1 0 1 0 LOCAL SUN TIME
FIG. 8. Vertical photo taken by NASA RB-57 over Liberty County, Texas from an altitude of 60,000 feet. The camera was a 6" f.1. Wild RC-8 with 2443 color IR film.
in the use of electro-optical scanners over different types of terrain. Data from these scanners are also affected by hot spots and solar reflections when the scanner is flown at right angles to the direction of the sun. This is a subject which needs further study and it is beyond the scope of this paper.
1. Tricker, R. A. R., 1970, Introduction to Mete- orological Optics, American Elsevier Co. Inc., New York.
2. Wildey, R. L. and H. A. Pohn, 1969. The Normal Albedo of the Apollo 11 Landing Site and Intrinsic Dispersion in the Lunar Heiligenschein, Astrophysics, J., Vol. 158, 1969, pp. L129-L130.
3. Manual of Color Aerial Photography, by American Society of Photogrammeby, 1st edi- tion, 1968, Geo. Banta Co., Mensha, Wisc., pp. 67-75.
4. Fleming, E. A., 1965. Solar Altitude Norno- grams. Photogr. Engr. Vol. XXXI, NO. 4 (July ) , pp. 680-683.
5. Mason, Bert, Jr. 1953, The Hotspot in Wide- Angle Photographs, Photogr. Engr., Vol. XIX, No. 4 (Sept. ), pp. 619-624.
6. Heath, G. R., 1972. Solar Rdection Prob- lems Encountered Over Forested Terrain in the Analysis of Multispectral Data and Color Photography, Tech. Rept. 640-TR-128, Aug. 1972, Earth Obs. Dept., Houston Aerospace Systems Div., Lockheed Electronics Co.
7. Cox, C. and W. Munk, 1954. Statistics of the Sea Surface as Derived from Sun Glitter, Jour. of Marine Res., Vol. 13, pp. 198-227.

FRAME A S 9 - 2 2 - 3 3 3 4 , MAR. 8, 1 9 6 9 , 1 3 5 6 LOCAL SUN TIME
FIG. 9. Oblique photo taken by Apollo 9 over northwest Texas from an altitude of 105 n.m. The camera was a Hasselblad 500E with a 80mm f.1. lens and Ektachrome film.
RED BAN0 (0 .58 - 0.70urn)
. . . . . . . . . . GREEN BAND ( 0 . 5 0 - 0.60urn)
..-..
Y
98 - - 94 -
Y) - 0
!$ 92 - 4
2 90 - + DIRECTION OF HOT SPOT w
L 8 8 1 1 1 1 1 1 1 I I I I I I I I I I
Y ,I5 j5 3 5 4 5 55 65 75 85 95 105 115 125 1 3 5 145 155 1 6 5 175 lB5 lg5 m. Y) SCANNER RECORDER COLUMN NUMBERS
FIG. 10. Curves of spectral response from the means of four spectral bands in the tail of retro- reflectance, recorded by the Michigan 12 Channel Scanner.