Automated Video Interview Personality Assessments
82
Automated Video Interview Personality Assessments: Reliability, Validity, and Generalizability Investigations Louis Hickman 1 , Nigel Bosch 2 , Vincent Ng 3 , Rachel Saef 4 , Louis Tay 1 , & Sang Eun Woo 1 1 Purdue University, 2 University of Illinois Urbana–Champaign, 3 University of Houston, 4 Northern Illinois University Author Note This work was supported by a National Science Foundation Early-Concept Grant for Exploratory Research (grant number 1921111). An earlier version of this paper was presented at the Society for Industrial and Organizational Psychology 2020 Conference. Thank you to Chelsea Song and Chen Tang for their helpful comments on an earlier version of this paper. Thank you to the many members of the Well-being and Measurement Lab and the Laboratory for Understanding Careers and Individual Differences who assisted with data collection and rating the interviewees in the study. © 2021, American Psychological Association. This paper is not the copy of record and may not exactly replicate the final, authoritative version of the article. Please do not copy or cite without authors' permission. The final article will be available, upon publication, via its DOI: 10.1037/apl0000695
-
Upload
khangminh22 -
Category
Documents
-
view
2 -
download
0
Transcript of Automated Video Interview Personality Assessments

Automated Video Interview Personality Assessments: Reliability, Validity, and
Generalizability Investigations
Louis Hickman1, Nigel Bosch2, Vincent Ng3, Rachel Saef4, Louis Tay1, & Sang Eun Woo1
1Purdue University, 2University of Illinois Urbana–Champaign, 3University of Houston,
4Northern Illinois University
Author Note
This work was supported by a National Science Foundation Early-Concept Grant for
Exploratory Research (grant number 1921111). An earlier version of this paper was presented at
the Society for Industrial and Organizational Psychology 2020 Conference. Thank you to
Chelsea Song and Chen Tang for their helpful comments on an earlier version of this paper.
Thank you to the many members of the Well-being and Measurement Lab and the Laboratory for
Understanding Careers and Individual Differences who assisted with data collection and rating
the interviewees in the study.
© 2021, American Psychological Association. This paper is not the copy of record and may
not exactly replicate the final, authoritative version of the article. Please do not copy or cite
without authors' permission. The final article will be available, upon publication, via its
DOI: 10.1037/apl0000695

Abstract
Organizations are increasingly adopting automated video interviews (AVIs) to screen job
applicants despite a paucity of research on their reliability, validity, and generalizability. In this
study, we address this gap by developing AVIs that use verbal, paraverbal, and nonverbal
behaviors extracted from video interviews to assess Big Five personality traits. We developed
and validated machine learning models within (using nested cross-validation) and across three
separate samples of mock video interviews (total N = 1,073). Also, we examined their test–retest
reliability in a fourth sample (N = 99). In general, we found that the AVI personality assessments
exhibited stronger evidence of validity when they were trained on interviewer-reports rather than
self-reports. When cross-validated in the other samples, AVI personality assessments trained on
interviewer-reports had mixed evidence of reliability, exhibited consistent convergent and
discriminant relations, used predictors that appear to be conceptually relevant to the focal traits,
and predicted academic outcomes. On the other hand, there was little evidence of reliability or
validity for the AVIs trained on self-reports. We discuss the implications for future work on
AVIs and personality theory, and provide practical recommendations for the vendors marketing
such approaches and organizations considering adopting them.
Keywords: automated video interviews, personality, machine learning, selection, validation

Automated Video Interview Personality Assessments: Reliability, Validity, and
Generalizability Investigations
Organizations are adopting automated video interviews (AVIs) that use machine learning
to evaluate interviewees for early-stage applicant screening because AVIs can reduce time to hire
and save organizations time and money. The use of machine learning and artificial intelligence
for personnel selection can potentially provide utility beyond human-based methods and
traditional assessments (e.g., Campion et al., 2016; Speer, 2018), and AVI vendors often claim
that AVIs have good reliability, are free from bias, are more engaging for applicants than
traditional assessments, and predict job performance (Mulfinger et al., 2020). For these reasons,
AVIs have been increasing in popularity in industry. One vendor of AVIs had conducted over a
million AVIs by mid-2019 (Harwell, 2019), and several other vendors are actively marketing
AVI platforms (Raghavan et al., 2020). Despite their popularity, there is little psychometric
evidence regarding the reliability and validity of AVIs (Chamorro-Premuzic et al., 2016; Oswald
et al., 2020). This gap, together with concerns about measurement bias and fairness, has led
many (including United States senators and consumer advocacy groups) to question the legality
of AVIs (EPIC, 2019; Harris et al., 2019).
The present study's primary purpose is to critically evaluate the psychometric properties
of automated video interview personality assessments (AVI-PAs). Specifically, we examine the
following three properties: reliability (i.e., test–retest reliability; generalized coefficient of
equivalence and stability); validity (i.e., convergent and discriminant relations with other
variables, test content, and nomological network); and generalizability across different interview
contexts. We chose to focus on personality because it predicts performance in a wide range of
jobs (Barrick & Mount, 1991; Judge & Zapata, 2015), ample theory and research ties it to
interviewee behavior (e.g., Bourdage et al., 2018; Huffcutt et al., 2011), it is commonly assessed

by AVI vendors (e.g., HireVue; MyInterview; Yobs), and computer scientists have begun to
investigate AVI-PAs (e.g., Nguyen et al., 2014; Ponce-Lopez et al., 2016). The overall process
for these investigations is illustrated in Figure 1, which serves as a validation framework for
developing AVI-PAs. Notably, although our study focuses on evaluating AVI-PAs, personality
represents just one type of construct that can be assessed by AVIs (i.e., the method and construct
are distinct; Arthur & Villado, 2008). The framework in Figure 1 can be extended and applied to
AVIs that assess other important applicant attributes—often referred to as knowledge, skills,
abilities, and other characteristics (KSAOs).
To conduct our investigations, we collected four samples of mock video interviews1
(using Mechanical Turk workers and students), each comprised of different interview questions,
and self- and interviewer-reported (as judged from watching the videos) Big Five personality
traits. We trained machine learning models to predict interviewee self- and interviewer-reported
traits in the first three samples and evaluated two sources of validity evidence (convergent and
discriminant relations) using nested k-fold cross-validation. Next, we used those models to assess
personality traits in the fourth sample to evaluate test–retest reliability and the generalized
coefficient of equivalence and stability (GCES). Then we examined whether the psychometric
properties (i.e., convergent and discriminant evidence of validity) of these models generalized
when applied to the other samples, with each representing a unique interview context. In
addition, we explored the content of the models by investigating the relative importance of
verbal, paraverbal, and nonverbal behavior within the models, as well as detailing predictors
common to the same-trait models. Finally, we evaluated the nomological network of AVI-PAs in
relation to academic outcomes as an initial step toward investigating workplace relevant criteria.
1 Many prior studies of interviews rely on student samples and mock interviews (e.g., Barrick et al., 2010; Cuddy et
al., 2015; Madera & Hebl, 2012; Swider et al., 2016; Swider et al., 2011; Van Iddekinge et al., 2005).

This study makes several contributions to applied psychology. First, by examining the
psychometric properties of AVI-PAs, this study addresses a practice-research gap, wherein the
adoption of AVIs has outpaced research on the topic (Chamorro-Premuzic et al., 2016; Rotolo et
al., 2018). In doing so, this study provides validation data to inform research and practice in this
emerging area. Critically, some AVI vendors allow organizations to deploy AVIs to assess
interviewees who answer interview questions that differ from those used to train the machine
learning models. The present study is the first we are aware of to test whether the validity
evidence of AVIs trained on one set of interview questions generalizes when tested on a new set
of interview questions. Second, this study illustrates the potential value of AVIs as an alternative
to self-reported personality in selection settings. Relying on self-reports in high-stake situations
like personnel selection has been criticized for its susceptibility to socially desirable responding
and faking (Morgeson et al., 2007; Ployhart et al., 2017; Vazire, 2010). The current investigation
serves as an initial effort toward developing and validating a behavior-based personality
assessment method to mitigate such concerns. Third, the paper contributes to a growing stream
of research within organizational science using machine learning to automate existing
assessment procedures (e.g., Campion et al., 2016; Sajjadiani et al., 2019; Speer, 2018).
Automated Video Interview Personality Assessments
Figure 1 illustrates our conceptual and operational model for investigating the construct
validity of AVI-PAs. The model draws on prior theory from personality psychology (Connelly &
Ones, 2010; Funder, 1995; Vazire, 2010) and human resource management (Huffcutt et al.,
2011). Our approach assumes that individuals have a true standing on the Big Five traits that is
not directly observable (trait realism; Funder, 2012; Tellegen, 1991), making these traits the
causal starting point of Figure 1, affecting interviewee qualifications, interviewee performance,

self perception, and academic outcomes. Notably, Big Five personality traits represent just one
example of latent constructs that AVIs could assess under this model.
Figure 1
Operational model of automated video interviews
Note: RQ = research question. GCES = generalized coefficient of equivalence and stability.
Figure is adapted from Huffcutt et al. (2011) and Connelly & Ones (2010) for the automated
video interview psychometric validation process. The lower panels provide details for how the
first, second, third, and sixth Research Questions are addressed. “within” = within-sample cross-
validation; “cross” = cross-sample cross-validation. rtt = correlations between AVI personality
assessments at Time 1 and AVI personality assessments at Time 2. GCES = generalized
coefficient of equivalence and stability. For all analyses, RQs are examined separately for self-
reported (with models trained on self-reports) and interviewer-reported (with models trained on
interviewer-reports) traits.
Following Connelly and Ones (2010), the model in Figure 1 recognizes that neither self-
nor interviewer-reports are direct representations of latent traits. The Realistic Accuracy Model
(RAM; Funder, 1995) posits that only certain behavioral cues can be considered expressions of a

given trait (i.e., relevance). Further, only some of the relevant behavioral cues are directly
observable, and such cues differ in the quantity of their expression (i.e., availability). This
process affects both self perception and the interviewer’s perception (Connelly & Ones, 2010)
because internal behaviors relating to thoughts and feelings are not readily available to observers,
while many outward behaviors, such as facial expressions, are not available to the self (per the
self-other knowledge asymmetry model of personality judgment; SOKA; Vazire, 2010).
Therefore, self-reports may provide more accurate information than observer-reports for less
visible, internal traits (e.g., openness, emotional stability). In contrast, the reverse may be true for
highly visible traits (e.g., extraversion) for which many behavioral cues are available.
Within employment interviews, personality traits affect interviewee performance (i.e., the
interviewee's in situ behavior) both directly and indirectly through their effects on acquiring job-
relevant interviewee qualifications, including declarative knowledge, procedural knowledge, and
motivation (Huffcutt et al., 2011). Different interview questions represent different situational
features—for example, the use of situational or past behavioral questions affects the type of
impression management interviewees tend to use, regardless of their personality (Peeters &
Lievens, 2006). Interview questions may differ in how trait-relevant they are, which can cause
differences in the relevance and availability of behaviors elicited by a given set of interview
questions (e.g., Tett & Burnett, 2003). In other words, interviewee performance is a function of
both the interviewee’s individual differences and interview design (i.e., the person and the
situation; Mischel & Shoda, 1995; Huffcutt et al., 2011). Therefore, AVI-PAs trained on one set
of interview questions may not generalize to a new set of interview questions to the extent that
the interview questions in the training data affect the relationship between personality and
interviewee performance.

In addition to differences in behavior relevance and availability between interview
questions, raters differ in their ability to notice trait-relevant behavioral cues (detection) and to
combine the cues appropriately to form trait impressions (utilization; Funder, 1995). Again, as
illustrated in Figure 1, this process affects both self perception and the interviewer’s perception
(Connelly & Ones, 2010). The limitations of self-reports are well-known—even outside of
employment contexts where faking is a concern (e.g., Morgeson et al., 2007). People are
motivated by self-serving biases to protect and enhance their self-view, which can bias self-
reports (although not always via simple score elevation; Vazire, 2010). In other words, both self-
and interviewer-reports are affected by the rater’s ability to utilize cues2.
Further, both the self and observers must then take these trait impressions and convert
them into measurement scores (i.e., self-report; k interviewer-reports). Self-report involves one’s
identity and self-serving biases, whereas interviewer-reports are based on the reputation (Hogan,
1991) gleaned from observing interviewee performance in addition to any potential perceptual
biases. Both operationalizations involve some degree of measurement error and different types of
biases (Connelly & Ones, 2010; Huffcutt et al., 2011). Simply, both self- and interviewer-reports
are imperfect sources of trait information, each with distinct strengths and weaknesses that may
affect the validity of AVI-PAs trained on them.
2 Self-serving biases are particularly likely to affect the proper utilization of cues when self-reporting traits for which
social value is attached to one’s trait standing, known as evaluative traits. Therefore, self-reports of personality may
provide more accurate information compared to observer-reports for non-evaluative traits (e.g., extraversion,
emotional stability), whereas the reverse may be true for highly evaluative traits (e.g., agreeableness,
conscientiousness, and the intellect facet of openness; e.g., John & Robins, 1993).
Research on the good judge vis-à-vis observers has uncovered several, albeit somewhat inconsistent, findings
regarding who tends to be better at detecting and utilizing cues for trait perception. For example, observers tend to
provide more accurate personality judgments when they have higher general mental ability and, more specifically,
dispositional intelligence (i.e., knowledge about how personality traits relate to behavior; Christiansen et al., 2005;
De Kock et al., 2015; Powell & Bourdage, 2016). The rationale is that higher levels of ability improve one’s
capacity for “perceiving relations between past and present activities, between expressive behavior and inner traits,
between cause and effect” (Allport, 1937, p. 514).

Automated video interviews use computers to quantify interviewees’ verbal, paraverbal
(e.g., speech rate, voice quality) and nonverbal (e.g., smiles, visual attention) behaviors. Table 1
summarizes the interviewee behaviors that are operationalized in the present study. These verbal,
paraverbal, and nonverbal behaviors are then used as predictors in machine learning models, a
form of empirical keying, to assess interviewee (i.e., AVI scores) personality traits and other
important KSAOs (e.g., Naim et al., 2018; Nguyen et al., 2014). Because AVI scores and
interviewer-reports use interviewee performance as direct inputs for person perception, AVI-PAs
are likely to model interviewer-reports more successfully.
For AVI-PAs to successfully model either self- or interviewer-reports, the focal KSAOs
must be reflected in interviewee performance, which consists of verbal, paraverbal, and
nonverbal behaviors (Huffcutt et al., 2011). Our assumption here is that personality (directly and
indirectly) affects interviewee performance, and computers can capture useful information about
personality in a video interview by extracting these three types of behavior (see Figure 1). In line
with this, research has shown that interviewees with high self-reported conscientiousness tend to
engage in more honest and less deceptive self-promotion impression management (i.e., verbal
behavior; Bourdage et al., 2018). Interviewees with high self-reported emotional stability speak
faster and pause less (i.e., paraverbal behavior; Feiler & Powell, 2016). Further, interviewees
with high self-reported agreeableness display more eye contact, open postures, and friendly
facial expressions (i.e., nonverbal behavior; Kristof-Brown et al., 2002). These relationships are
important, as interviewee performance (i.e., verbal, paraverbal, and nonverbal behavior)
influences interviewer judgments of interviewee personality, judgments that are commonly made
in personnel selection (Cortina et al., 2000; Huffcutt et al., 2001). For instance, certain
paraverbal behaviors (i.e., pitch variability, higher speech rate, amplitude variability; DeGroot &

Gooty, 2009) influence interviewer judgments of extraversion, emotional stability, and openness.
Further, nonverbal behavior (e.g., open posture, eye contact) influences interviewer judgments of
all Big Five interviewee traits (DeGroot & Gooty, 2009).
Table 1
Descriptions and operationalizations of three types of interviewee behavior in present study
Behavior Definition Operationalization Tools for
Extracting
Verbal What interviewees say;
the content of their
response
• Word count
• Proportion of words longer than
six letters
• 70 LIWC dictionaries
• n-grams with n = 1, 2 (i.e.,
words and two-word phrases)
• IBM Watson
Speech to Text
• LIWC
• tm R package
Paraverbal How interviewees sound
when delivering their
responses
• Pitch
• Jitter
• Frequency
• Shimmer
• Loudness
• Harmonics-to-Noise ratio
• Alpha ratio
• Hammarberg index
• Spectral slope
• Loudness peaks per second
• Length of continuously voiced
regions
• Length of continuously
unvoiced regions
• Voiced segments per second
• openSMILE
Nonverbal What interviewees do
(e.g., facial expressions,
posture)
• Head pose
• 19 facial action units activation
intensity
• Mean
• Standard deviation
• Kurtosis
• Skewness
• Facial action unit
cooccurrences
• OpenFace
In terms of applying AVIs to assess Big Five personality traits, prior studies in computer

science found that AVI-PAs can converge strongly with interviewer-reported traits when cross-
validated on holdout data drawn from the same sample (see Table 2 for a review of AVI-PA
studies; Biel et al., 2013; Chen et al., 2016, 2018; Nguyen et al., 2014; Nguyen & Gatica-Perez,
2016; Ponce-López et al., 2016). For example, Chen et al. (2018) found that their machine
learning models accurately classified interviewees as having high or low standing on
interviewer-reported traits (macro F-1 score, or the harmonic mean of precision and recall, was
approximately .80 for each trait). However, despite this promising initial evidence, critical
psychometric issues remain in terms of reliability, validity, and generalizability that still need to
be examined (Hickman, Saef, et al., 2020).
Table 2
Review of prior studies of AVI-PAs (all trained and tested on interviewer-reports)
Study N Interview
characteristics
Cross-validation
strategy
Reported accuracy
Biel et al.
(2013)
408 Video blogs from
YouTube
10-fold E = .48; A = .39; C = .22;
ES = .23; O = .17 (R2)
Chen et al.
(2016)
36 Video interview; 12
PBQs
Leave-one-out E = .44; A = .38; C = .34;
ES = .40; O = .35 (r)
Chen et al.
(2018)
260 Video interview; 8
PBQs
20% holdout test
sample
E = .78; A = .84; C = .86;
ES = .83; O = .81 (F-1
score; used median split
to classify high/low)
Nguyen &
Gatica-Perez
(2016)
939 Video resumes from
YouTube (123.5 s
median length)
10-fold E = .27; A = .06; C = .03;
ES = .00; O = .20 (R2)
Nguyen et al.
(2014)
62 Face-to-face; 4
unstructured questions
& 4 PBQs
Leave-one-out C = .04; ES = .27 (R2)
Ponce-Lopez
et al. (2016)
10,000 15 second clips from
YouTube videos
20% holdout test
sample
E = .52; A = .34; C = .54;
ES = .47; O = .44 (R2)
Note: PBQ = past behavioral question. E = extraversion. A = agreeableness. C =
conscientiousness. ES = emotional stability. O = openness. In some of these studies, R2 is not
directly translatable to r because the formula they used to calculate the coefficient of
determination allows it to take on negative values.

Reliability
Reliability is an essential piece of psychometric evidence for any assessment, as
assessments must be reliable to be valid (Lord & Novick, 1968; AERA et al., 2014). Yet, to our
knowledge, there is no evidence to suggest that scores generated from AVIs are reliable. This is
also a shortcoming of most research using machine learning and digital footprints (e.g.,
Facebook likes) to assess personality traits (Bleidorn & Hopwood, 2019; Tay et al., 2020), which
still would not address the reliability of AVIs.
Test–retest Reliability
The machine learning algorithms used to develop AVIs engage in a form of empirical
keying by selecting and weighting behavioral cues (i.e., verbal, paraverbal, and nonverbal
behaviors) to maximize convergence with human reported personality assessments. Researchers
generally use Cronbach’s alpha to index scale reliability, but this may not be appropriate for
empirically keyed scales. Empirically keyed scales tend to select heterogeneous items that a)
maximize overall correlation with criteria and thus lead to b) low interitem correlations, resulting
in scales that tend not to be internally consistent (Simms, 2008).
Test–retest reliability (i.e., coefficient of stability) is used to examine construct-irrelevant
variance specific to occasions (see the lower-left panel of Figure 1). Occasions represent a source
of construct-irrelevant variance that may contaminate measures (i.e., transient error). Test–retest
reliability is fundamental to testing because the central concern of reliability is whether a
person’s scores would converge if tested more than once (Cronbach, 1990). Indeed, test–retest
reliability is more predictive of personality scale validity than internal consistency reliability
(McCrae et al., 2011). Further, test–retest reliability is considered the ideal index of empirically
keyed scales’ reliability (Cucina et al., 2019). Consequently, test–retest reliability is arguably

more appropriate than internal consistency for estimating AVI-PA reliability.
However, interview test–retest reliability is often low since interviewees may practice
and improve, have fluctuations in anxiety and mood, or (as noted by a reviewer) simply talk
about different events than the prior interview because constructed response format assessments
allow for a wider range of responses than multiple-choice tests or Likert-type scales. Further,
interviewers may be replaced with new ones. For instance, Schleicher et al. (2010) found that
behavioral, situational, and experience/interest interviews conducted one year apart had test–
retest reliabilities of r = .30, .35, and .26, respectively (N = 2,060). These values would generally
be unacceptable for other types of assessments. Unfortunately, considering the paucity of
research on the subject, it is unclear what makes for adequate test–retest reliability in
employment interviews (Huffcutt et al., 2013). On the other hand, personality scales tend to
exhibit relatively high test–retest reliability. Costa and McCrae (1991) reported 6-year test–retest
reliabilities ranging from a low of r = .63 for agreeableness to a high of r = .83 for emotional
stability and openness. High test–retest reliability increases confidence that a measure captures
true score variance across occasions.
Generalized Coefficient of Equivalence and Stability (GCES)
While test–retest reliability is useful, it is also important to ascertain the extent that AVI
scores are stable over time when using different AVI-PA models. In other words, we are
conceptually interested in the generalizability of the test–retest reliability, not merely in a single
AVI-PA but across alternate forms (i.e., similar measures of the same construct). In this case,
AVI-PA models trained on different data that use the same set of behaviors as potential
predictors can be considered alternate forms. The GCES provides such an estimate (see the
lower-center panel of Figure 1) by correlating the scores of an AVI-PA at one time point with the

scores of another AVI-PA at a second time point. In doing so, the GCES calibrates multiple
sources of error and estimates the proportion of construct variance to observed variance (Le et
al., 2009)3. We adopt the GCES and use it alongside test–retest reliability to provide initial
evidence regarding the reliability of AVI-PAs.
Research Question 1: How reliable are AVI-PAs, in terms of (a) test–retest reliability and
(b) the generalized coefficient of equivalence and stability?
Notably, high reliability estimates can be observed in the absence of construct validity
due to method variance and other causes of inflated intercorrelations. Due to this limitation, it is
critical to go beyond reliability and investigate multiple sources of validity evidence.
Validity
Validity evidence regarding an assessment procedure should show that scores derived
from the procedure adequately represent the constructs of interest. Such evidence provides the
basis for interpreting score meaning and using the procedure for decision-making (e.g., personnel
selection; Messick, 1989). Therefore, in the current context, we are not so much interested in
verbal, paraverbal, and nonverbal behaviors per se, but rather how indicative the scores produced
by models trained to use these behaviors are of Big Five personality traits and, thus, justifiable
for use in personnel selection. Following the Standards for Educational and Psychological
Testing (in short, the Standards; AERA et al., 2014) and the Principles for the Validation and
Use of Personnel Selection Procedure (SIOP, 2018), we examine several sources of AVI-PA
validity evidence in this study, including convergent and discriminant relations, machine
learning model content, and nomological network in relation to academic outcomes (as shown in
the lower-right panel of Figure 1). Under the unitarian conception of validity, this study’s
3 Although the GCES assumes parallel forms with identical factor structure, the use of alternate forms that are not
exactly parallel merely results in a slight underestimation of the GCES (Le et al., 2009).

evidence is “based on relationships with measures of other variables … [and] test content”
(SIOP, 2018, p. 9).
Convergent Relations
While past work on AVI-PAs provided some convergent evidence of validity, the work
has focused solely on interviewer-reported personality and not self-reports (e.g., Biel et al., 2013;
Chen et al., 2018; Ponce-Lopez et al., 2016). Yet, to maximize the utility of AVIs, it is critical to
examine AVI-PAs trained on both self- and interviewer-reports. According to socioanalytic
theory, self- and observer-reports (interviewer-reports being one example) represent two
important aspects of personality: identity and reputation, respectively (Hogan, 1991). As
mentioned earlier, the interviewers glean a context-specific reputation based on interviewee
performance that corresponds closely to the behaviors used as inputs to AVI-PAs. However,
prior AVI-PA research has not provided a clear rationale for focusing solely on interviewer-
reports. Theoretically, both self- and observer-reports are critical for understanding applicant
personality, as each provides unique information about inward and outward expressions of
personality traits, and practically, both are useful for predicting behavior (Connelly & Ones,
2010). Therefore, the utility of AVI-PAs can be expanded if models trained on self-reported
traits have substantial convergence, apart from models trained on interviewer-reports.
An important question at this point is what counts as substantial convergence? To
address this question, we draw on automatic essay grading and its application to selection and
assessment (Campion et al., 2016). Campion et al. (2016) applied text mining to automatically
score achievement record essays and sought to develop a system that was at least as accurate as
single raters, as indexed by single rater one-way random effects intraclass correlation (referred to
as ICC(1) by McGraw & Wong, 1996 and ICC(1, 1) by Shrout & Fleiss, 1979). In their case, the

average single rater one-way random effects intraclass correlation was .61, and their automatic
scoring system converged, on average, r = .63 with human raters in the testing data. We adopt
their metric and aim to develop AVI-PAs that converge as highly as single raters in our study.
Research Question 2 involves replicating and extending prior work by investigating the
convergent evidence of validity for machine learning models trained not just on interviewer-
reports but also on self-reports.
Research Question 2: Do AVI-PAs (trained on either self- or interviewer-reports) exhibit
adequate convergence, as compared to single rater one-way random effects intraclass
correlations?
Discriminant Relations
To our knowledge, there has not been any research examining AVIs’ discriminant
evidence of validity. This is a crucial psychometric property because validity will be
questionable if test scores converge highly with measures of distinct constructs (Campbell &
Fiske, 1959). Indeed, a plausible source of construct-irrelevant variance is the assessment
method itself (Messick, 1989). This systematic variance could inflate correlations between
measures of purportedly distinct constructs to the point where they are empirically redundant
(Raykov et al., 2016; Shaffer et al., 2016).
Concerningly, interview ratings often have substantial method variance, resulting in poor
construct discrimination (Hamdani et al., 2014). Further, the machine learning models
undergirding AVIs seek to maximize convergence with human ratings (Bleidorn & Hopwood,
2019), similar to empirical keying. However, empirical keying often results in poor discriminant
evidence (Simms, 2008). Park and colleagues (2015) examined the discriminant evidence for
machine learning trait assessments derived from the language used in Facebook posts. The

machine learning trait assessments exhibited inflated method variance compared to the self-
reports on which the models were trained. Together, these concerns suggest a need to investigate
the discriminant evidence of AVI-PAs.
Research Question 3: Do AVI-PAs exhibit adequate discriminant evidence?
Generalizability Across Contexts
In the case of AVIs, it is critical to determine whether a trained model generalizes to new
samples for different interview contexts (Bleidorn & Hopwood, 2019; Tay et al., 2020). This is
because some AVI vendors train machine learning models on one or more sets of interview
questions, then deploy them in hiring contexts where client organizations write new interview
questions specific to the focal job. The Standards state that validity evidence should be provided
for all intended uses and interpretations of a test, including any major alterations to tests, such as
changing test questions (AERA et al., 2014). For example, language-based personality models
trained on Twitter do not appear to generalize to transcriptions of mock interviews (Hickman et
al., 2019). In the case of AVIs, they need to be similarly reliable and valid when they are applied
to different interview questions. In addition to these practical concerns, behavior is a function of
both the person and the situation (Mischel & Shoda, 1995), even in interview contexts (Huffcutt
et al., 2011). Therefore, the psychometric properties of AVIs must be investigated for cross-
sample predictions to justify their use.
Allowing organizations to supply job-relevant questions follows interview best practices
(Campion et al., 1997). Still, it raises concerns that models trained on one set of interview
questions will not generalize to new interviews. Prior studies of AVIs have focused on within-
sample cross-validation, and to our knowledge, no evidence is available to suggest that the
models generalize to new interview questions. In particular, verbal behavior likely differs

between interviews because the interview questions exert considerable influence on what
interviewees say. For instance, some evidence suggests that interviewees use more impression
management tactics in behavioral (asking about prior actions) than situational (hypothetical
scenario) interviews (Peeters & Lievens, 2006). Therefore, different interview questions (i.e.,
situations) may cause differences in how interviewee personality relates to their behavior.
In the present study, each of the four samples of interviews involved different interview
questions. Interview questions in Sample 1 were not intended to tap a particular set of constructs.
Interview questions in Sample 2 were designed to tap constructs relevant to many jobs and some
Big Five traits (i.e., leadership and teamwork). Finally, interview questions in Samples 3 and 4
were explicitly designed to tap the Big Five traits. Due to the effects of situations on behavior,
machine learning models trained on one sample’s set of interview questions may contain
question-specific variance that is trait-irrelevant, resulting in models with psychometric
properties that do not generalize to other interview questions.
Research Question 4: Do the psychometric properties of AVI-PAs trained on one set of
interview questions generalize to different sets of interview questions? Specifically, does
evidence generalize in terms of (a) test–retest reliability, (b) generalized coefficient of
equivalence and stability, (c) convergent relations, and (d) discriminant relations?
Content Coverage
Another critical concern in AVIs is the content of the predictive models. Concerns have
been raised, for example, that overreliance on nonverbal behavior in such models may
discriminate against certain groups of applicants (EPIC, 2019; Harris et al., 2019). To assuage
such concerns, some vendors have claimed that their assessments are mostly driven by what
interviewees say (i.e., verbal behavior; Bell, 2019), yet those same vendors have, at times, made

conflicting statements regarding the relative contributions of verbal, paraverbal, and nonverbal
behavior to AVI assessments (cf. Harwell, 2019). Ickes (2016) summarized evidence that
suggests all three types of behavior contribute to interpersonal judgment accuracy, with verbal
behavior contributing the most information (50-60%), followed by paraverbal behavior
(approximately 30%), and nonverbal behavior (10-20%). Therefore, it is vital to explore the
content of the models to understand the relative contribution of each type of behavior.
Although the relative contribution of verbal, paraverbal, and nonverbal behavior is one
important element of AVI model content, it does not address whether the behaviors used in AVI-
PAs are related to the intended trait. Validity evidence based on test content involves examining
the correspondence between test content and the construct it purports to measure (AERA et al.,
2014). Therefore, it is critical to explore the predictors (i.e., interviewee behaviors) included in
final models, for example, by exploring what predictors (if any) consistently emerge in same-
trait models.
Research Question 5: In AVI-PAs, (a) how much weight is afforded to each type of
behavior, and (b) what behavioral predictors (if any) are common to all same-trait
models, and are they conceptually relevant to the focal trait?
Nomological Network
Another key metric for judging the utility of personality assessments is whether
personality scores relate to other constructs and relevant behaviors in meaningful ways (Connelly
& Ones, 2010; Funder, 2012). For instance, conscientiousness predicts job performance across a
wide range of jobs (Barrick & Mount, 1991), and the remaining Big Five traits predict
performance in jobs with relevant contextual demands (Judge & Zapata, 2015).
In the present study, we collect self-reported academic performance and standardized test

scores to provide initial evidence relating AVI-PAs to external variables known to be associated
with Big Five traits. Relating AVI-PAs to standardized test scores and academic outcomes
represents a first step toward investigating workplace relevant criteria. Theoretically,
conscientiousness predicts greater persistence, and openness predicts intellectual exploration.
Further, agreeableness leads to more interpersonally cooperative behavior, which could improve
academic performance through participation and group work scores. Conscientiousness is
strongly related to high school and college grade point average (GPA), while agreeableness and
openness are weakly positively related to high school and college GPA (Noftle & Robins, 2007;
Poropat, 2009). Additionally, openness is positively related to SAT verbal test scores because
open individuals acquire more vocabulary. Emotional stability and extraversion tend to be
weakly and inconsistently related to academic outcomes. Therefore, we take initial steps toward
examining the nomological network of AVI-PAs by regressing academic performance (i.e., high
school and college GPA) and standardized test scores (i.e., SAT and ACT scores) on cross-
sample AVI-PAs.
Research Question 6: Do AVI-PAs correlate with academic outcomes, and do they do so
incrementally beyond self- and interviewer-reported traits?
Method
Sample 1
The first sample consists of two groups of master-status Amazon Mechanical Turk
workers (Turkers; total N = 337; 58% female) who participated in open-ended interviews as part
of an unrelated project by a private company. The first group was paid $1 for participating, and
the second group was paid $1 for completing a survey and another $1 when their video (and
audio) submissions were confirmed. The two sets of open-ended questions represent relatively

unstructured interviews (e.g., Blackman, 2002). The first set of 157 Turkers responded to the
following prompt, “Talk about a topic or a story that you know and is personal to you. Do not
hesitate to talk about your feelings and do not limit your answer to simple descriptions. Options
include: 1. A personal experience (traveling, childhood memory, recent event). 2. Your dreams
(career, love, friends, hobbies). 3. Your general views on a matter you feel strongly about.”
Hickman et al. (2019) used this first set of Turkers to investigate the validity of Twitter-based
algorithm for assessing personality in the interview context. The second set of 179 Turkers
completed a self-report personality inventory and responded to the following prompt, “1) Tell me
about your dream job, and why you think you would be successful in this job? 2) Tell us about a
time when things didn’t go the way you wanted—like a promotion you wanted and didn’t get, or
a project that didn’t turn out how you had hoped. Describe what approach you took to solve the
problem.” These Turkers were mostly employed (76.8%) at the time of the study. Of the Turkers
who were employed, 15.6% worked in education, 13.7% worked in health care, 12.2% worked in
“other services (except public administration),” 10.8% worked in professional, scientific, or
technical services, 9.4% worked in retail, 7.2% worked in arts, entertainment, or recreation, and
the remaining industry groups each comprised less than 5% of the sample. Across the two
groups, the average interview length was 3 min 8 s and 404 words. After the data was cleaned
and shared with the research team, two participants were dropped because they read responses
directly from a website. Additionally, due to technical issues in extracting verbal, paraverbal, or
nonverbal behavior (e.g., poor camera or audio quality), a further 11 participants were excluded,
resulting in a final sample N = 324, with self-report N = 170. Reliability information for all self-
and interviewer-reported traits is provided in the Results section.
Sample 2
We recruited 490 undergraduate students (50% female) who participated in the study for
course credit (Purdue University IRB protocol 1806020758, Automated Assessment of Candidate
Interviews). Participants were randomly assigned to complete the study remotely or proctored in
the lab to maximize the number of interviews conducted. Participants self-reported their
personality traits. Then, each participant recorded three 2-3 minute videos, one video for each of
the following prompts, “Please tell us about yourself,” “Please tell us about a time you
demonstrated leadership,” and “Please tell us about a time you worked effectively in a team.”
The average total interview length was 6 min 51 s and 951 words. Four hundred sixty-seven
participants completed the study in full. Thirty-five interviews were unusable due to technical
difficulties experienced during the study (e.g., no sound), leaving a total of N = 432. Fifty
participants’ self-reported traits were excluded for failing one or more attention check questions,
leaving N = 382.
Sample 3
We recruited 361 undergraduate students (52% female) who participated in the study for
course credit (Purdue University IRB protocol 18110213366, Automatically Assessing
Behavioral and Situational Interviews). Participants were randomly assigned to conditions of a 2
(location: remote interview versus proctored in lab interview) x 2 (question type: past behavioral
versus situational questions) factorial design. The remote condition was again used to maximize
the amount of data collected, and changing the question type was done to reduce the influence of
the situation on the resulting models by sampling from multiple situations (but neither condition
was treated as an independent variable in the present study). All participants self-reported
personality traits. Then, each participant recorded five 1-3 minute videos, one video for each of
the prompts designed to tap into the Big Five traits. For those who received behavioral interview
questions, the prompts were: “Think of a time you had a need to learn about something that was
new to you? Why did you pursue it? What kept you persistent?” (openness); “Think of a time a
coworker asked you to set aside your own work to help him or her with a project that was very
important to them. What did you do? Why did you do that?” (agreeableness); “Tell me about a
recent uncomfortable or difficult work situation. How did you approach this situation? What
happened?” (emotional stability); “Tell me about a situation when you had to speak up in order
to get a point across that was important to you or crucial to your customer. How did you go about
this?” (extraversion); and “Describe a long-term project that you managed. What did you do to
keep everything moving along in a timely manner?” (conscientiousness). To turn the past
behavioral questions into situational questions, we asked interviewees to “imagine” that the
scenarios posed in the questions occurred, and asked them “what would you do,” following prior
research (e.g., Van Iddekinge et al., 2005). The average total interview length was 7 min 29 s and
883 words. Forty-four participants were dropped because their videos were unusable due to
technical difficulties, leaving a total of N = 317. A further 28 participants’ self-reports were
dropped for failing one or more attention check questions, leaving N = 289. A subset of these
participants (N = 110) gave us permission to share their video recordings on Databrary, which
are available at http://doi.org/10.17910/b7.1171
Sample 4
We recruited 101 undergraduate students (43% female) who participated twice in the
mock interview for course credit (Purdue University IRB protocol 1907022479, Advancing
Video Interviews Toward Computerized Assessment). Participants completed the study in the lab,
and they answered the same interview questions on both occasions. The first administration
occurred one to 93 days prior to the second administration, with an average of 15.6 days (median

= 11 days) between them. Each participant recorded six 1-3 minute videos, one each for the five
behavioral questions in Sample 3, as well as, “Think of a time you were a member of a
successful team. Describe the role you played on the team and in its success.” Two participants
were dropped because their videos were unusable due to technical difficulties, leaving a final
sample size N = 99. The data from Samples 2, 3, and 4 are part of broader data collection efforts.
Although we know less about the motivation of Turkers in Sample 1, in all three samples
of students, students appeared to consider these mock interviews as a serious opportunity to
improve their interviewing skills. Many students either took considerable time preparing their
responses before recording them or re-recorded their answers (sometimes upwards of three
times) to improve the impression they would make.
Measures
Self-reported Personality
The second group of Sample 1 Turkers responded to a 60-item composite of the 50-item
Big Five markers (Goldberg, 1992) and the ten-item personality inventory (TIPI; Gosling et al.,
2003) using a 7-point Likert scale. The first group of Turkers in Sample 1 did not self-report
their personality traits. Participants in Samples 2 and 3 responded to the 50-item Big Five
markers obtained from the IPIP (Goldberg, 1992, 1999) using a five-point Likert scale.
Interviewer-reported Personality
For Sample 1, three Industrial-Organizational Psychology Ph.D. students watched and
rated each interviewee on the TIPI (N = 324). For Sample 2, at least four undergraduate research
assistants from a pool of eleven (range: 4-7) watched and rated each interviewee on the TIPI (N
= 432). For Sample 3, four undergraduate research assistants watched and rated each interviewee
on the TIPI (N = 317). In all three cases, raters underwent 1-2 hours of frame of reference

training that consisted of defining the Big Five traits, reviewing the scale items and response
format, conducting practice ratings, and discussing ways of interpreting interviewee behavior in
relation to Big Five traits. Participants who failed attention checks had their self-reports excluded
but were included in the interviewer-reports to maximize sample size.
Self-reported Academic Performance
In Samples 2 and 3, participants self-reported their high school grade point average
(GPA) and college GPA. Additionally, participants self-reported their SAT verbal, SAT math,
and ACT scores if they took one or both tests. Self-reported academic outcomes converge to a
high degree (r > .8) with actual scores (Kuncel et al., 2005). We excluded the college GPAs of
students in their first semester of college.
Verbal Behavior
Participant responses were transcribed using IBM Watson Speech to Text (IBM, 2019),
and their full interview response was combined into a single document. Then, we first used
Linguistic Inquiry and Word Count (LIWC; Pennebaker et al., 2015) to quantify verbal behavior.
We used all directly counted non-punctuation variables from LIWC, including word count.
However, after inspecting the data, we noticed that several LIWC categories that are likely
irrelevant to employment interviews tended to have very low base rates, and therefore, low
variability, so these variables were not included in subsequent analyses (i.e., death, netspeak,
cursewords, and fillers).
Second, we used the tm R package (Feinerer et al., 2008) and procedures described in
Speer (2018) to count one- and two-word phrases (i.e., n-grams with n = 1 or 2) in the text.
Before extracting the words and phrases, we first removed all numbers and punctuation from the
transcripts, removed common stop words, transformed all text to lowercase, handled negation by

appending words preceded by “not,” “n’t,” “cannot,” “never,” and “no” with the negator and an
underscore, and stemmed the corpus. We removed all one- and two-word phrases that did not
occur in at least 2% of the interviews. The resulting document-term matrices were populated by
the counts of the remaining words and phrases (e.g., if job occurred five times in a participant’s
response, it was assigned a value of 5 for that participant).
Paraverbal Behavior
We extracted paraverbal behaviors with openSMILE (Eyben, 2014; Eyben et al., 2016),
which was developed using multiple baseline feature sets to train the system to measure acoustic
features. We utilized openSMILE to extract a common, relatively low-dimensional set of
features called the Geneva Minimalistic Acoustic Parameter Set (Eyben et al., 2016). These
features included pitch, indices of voice quality like jitter and harmonics-to-noise ratio,
frequency, loudness, speech rate, and more, as detailed in Table 1. We extracted features in
overlapping 30-second windows of time, sliding windows in 1-second steps, then aggregated the
results using means, standard deviations, skewness, and kurtosis.
Nonverbal Behavior
Recently, concerns have been raised over the use of emotion analytics software that
extracts discrete facial emotions (Barrett et al., 2019). For example, facial expressions may be
heavily influenced by context, such as social pressure to appear calm while stressed during an
interview. Therefore, we used the raw features described by the software rather than the emotion-
level abstractions to avoid a priori assumptions about the context-specific interpretation of
particular facial expressions. OpenFace describes 19 facial action units (AUs) in addition to head
pose features (Baltrušaitis et al., 2018). For each facial action unit, we calculated the mean
intensity, as well as its standard deviation, kurtosis, and skewness. Additionally, we extracted

cooccurrence distributions (Bosch & D’Mello, 2019) for each pair of AUs, represented as the
distribution similarity between two AUs measured via Jensen-Shannon divergence (Lin, 1991).
Cooccurrence distributions represent the degree to which two AUs activate in similar ways
within a video. Cooccurrences capture more complex facial expressions than individual AUs. For
example, similar distributions for smile and eye-related AUs may differentiate genuine (i.e.,
Duchenne) smiles from acted smiles wherein the mouth moves independently of the muscles
around the eyes (Messinger et al., 2001). Finally, we also extracted head pose information along
vertical (yaw), horizontal (pitch), and depth (roll) dimensions, again using the mean, standard
deviation, kurtosis, and skewness to describe these features.
Analytic Strategy
Model Development and Within-Sample Validation
In total, we trained 30 predictive models using elastic net regression to predict self-
reported and interviewer-reported [2] Big Five traits [5] in three datasets [3] (2×5×3 = 30). In
each case, we used the verbal, paraverbal, and nonverbal behavior indicators listed in Table 1 as
predictors, and all these predictors were calculated using the entire interview response (i.e., at the
interviewee-level). Within each sample for each trait, we used the caret R package (Kuhn, 2008)
and a loop to conduct nested k-fold cross-validation with k = 10 for both the inner and outer
folds. Figure 2 illustrates this process, and the Online Supplement includes the code we used to
conduct nested cross-validation.
Figure 2
Nested cross-validation where k = 10 for inner and outer folds

Nested cross-validation with k = 10 involves splitting the data into ten equally sized parts
(the outer folds). Then, nine of these parts (the outer training folds) are used to conduct a
separate 10-fold (the inner folds) cross-validation to select the optimal elastic net
hyperparameters (i.e., model selection) based solely on these nine outer folds. Next, the final
model is trained on those nine folds using the optimal hyperparameters, and then that model’s
accuracy is estimated on the outer test fold (i.e., model assessment). This process is repeated 10
times, using each of the ten outer folds only once for testing. k-fold cross-validation balances
model bias and variance to maximize out-of-sample accuracy (Chapman et al., 2016; Putka et al.,
2018), and nested cross-validation ensures that information about model accuracy is not used for
hyperparameter tuning, reducing the likelihood that accuracy will be overestimated. Within self-
and interviewer-reports in each sample, the composition of the 10 outer folds was held constant
across the five traits so that, for example, the first test fold for the extraversion model contained
the same participants as the first test fold for the other four trait models.
The predictions from each of the final elastic net models were then correlated with the
traits they were trained to predict (i.e., self- or interviewer-reported) in each test fold to generate

multi-trait multimethod correlation matrices. These correlations were averaged across the ten test
folds to examine within-sample convergent- and discriminant relations. The average of the
correlation matrices from each test fold was used because, in nested 10-fold cross-validation, a
separate model is trained and tested for each test fold, each with its own set of hyperparameters,
which is, essentially, ten replications of the same procedure. Calculating model performance by
averaging across the test folds in k-fold cross-validation follows the practices of two of the most
popular software packages for machine learning (Kuhn, 2008; Pedregosa et al., 2011).
Cross-sample Trait Assessments and Validation
We trained separate models on each of the full sets of participants in Samples 1, 2, and 3.
The optimal hyperparameters for these models were identified separately for each sample via 10-
fold cross-validation, and the trained models were applied to assess self- and interviewer-
reported Big Five traits in the other three samples (i.e., Sample 1 models were applied to
Samples 2, 3, and 4; Sample 2 models were applied to Samples 1, 3, and 4; Sample 3 models
were applied to Samples 1, 2, and 4). Concerning reliability, we applied trained models derived
from Samples 1, 2, and 3 to Sample 4 (test–retest sample). To calculate overall test–retest
reliability, we did the following: (a) for each model derived from Samples 1, 2, and 3, we applied
them to assess traits at each of the two time points in Sample 4; and (b) we calculated the test–
retest correlation for each trait for scores from each of the models derived from Samples 1, 2,
and 3. We calculated GCES by averaging the alternate forms (i.e., models derived from different
samples; Sample 1 & 2; Sample 2 & 3; Sample 1 & 3) time 1-time 2 same-trait correlations in
Sample 4. For instance, to estimate GCESs1s2 for Sample 1 and 2 extraversion models, we
averaged (a) the correlation of Sample 1 models’ Time 1 extraversion scores with Sample 2
models’ Time 2 extraversion scores and (b) the correlation of Sample 2 models’ Time 1

extraversion scores with Sample 1 models’ Time 2 extraversion scores. Because we had three
sets of trait assessments, we averaged all three alternate form pairs to obtain overall GCES for
extraversion.
With regard to validity, we applied the trained models derived from Samples 1, 2, and 3
to predict self- and interviewer-reported traits in the other two samples (e.g., Sample 1 models
were applied to Samples 2 and 3). We calculated multitrait-multimethod matrices using the trait
predictions and the traits they were trained to predict to analyze convergent and discriminant
relations.
To explore the content of AVI-PAs, we generated standardized regression weights by
standardizing the predictors (i.e., by subtracting each predictor’s mean and dividing by the
standard deviation) in Samples 1, 2, and 3 before training models on the full set of participants in
each sample. Then, we separately summed the standardized regressions weights for verbal
behavior predictors, paraverbal behavior predictors, and nonverbal behavior predictors and
divided each by the total sum of regression weights to estimate the relative contribution of each
type of behavior to the final models.
Finally, to inspect the nomological network of AVI-PAs, we first examined the bivariate
correlations between AVI-PAs and academic outcomes. Then, we regressed academic outcomes
in Samples 2 and 3 onto the cross-sample trait predictions (e.g., Sample 2 ACT scores were
regressed separately onto the Sample 2 trait scores from models trained on Samples 1 and 3).
Elastic Net Regression
Elastic net regression is a hybrid of ridge and least absolute shrinkage and selection
operator (LASSO) regression (Zou & Hastie, 2005). It has two hyperparameters. One
hyperparameter determines whether elastic net acts more like ridge regression, by shrinking

regression coefficients toward zero in response to collinearity and model complexity, or more
like LASSO, by shrinking regression coefficients to zero (i.e., performing variable selection).
The second hyperparameter determines how severely regression weights are penalized. We
determined the optimal hyperparameters by searching through 10 values of each during k-fold
cross-validation. Elastic net is useful when the n-to-p ratio (i.e., ratio of the number of
observations to the number of predictors) is low because it reduces model complexity (e.g.,
Oswald et al., 2020; Speer, 2018).
Results
Descriptive Statistics of Self- and Interviewer-Reports
Tables 3, 4, and 5 present descriptive statistics, intercorrelations, and reliabilities for self-
and interviewer-reported traits in each of the first three samples. Tables 4 and 5 also include
correlations with academic outcomes. In all cases, the convergent correlations between self- and
interviewer-reported traits were positive, and in most cases, the convergent correlations were
significant. Self-other agreement was lowest for conscientiousness (�̅� = .09), followed by
openness (�̅� = .15), and emotional stability (�̅� = .20). Extraversion had the highest level of self-
other convergence (�̅� = .33), followed by agreeableness (�̅� = .30). With the exception of
agreeableness, these findings largely align with the RAM (Funder, 1995)—self-other
convergence will be lower for more evaluative traits where self-reports may be less accurate, like
conscientiousness, as well as for internal, less-visible traits where interviewer-reports may be
less accurate, like openness and emotional stability. Overall, self-report reliabilities were
acceptable (Sample 1 α range: .83-.93, M = .89; Sample 2 α range: .76, .90, M = .83; Sample 3 α
range: .76-.89, M = .82) and the interrater reliabilities met or exceeded .60 for all traits except
emotional stability in Sample 2 and agreeableness, emotional stability, and openness in Sample 3

Table 3
Sample 1: Correlation matrix of self- and interviewer-reported personality Variable M SD 1 2 3 4 5 6 7 8 9 10
Self-reports
1. Extraversion 4.02 1.27 (.92)
2. Agreeableness 5.53 0.90 .31** (.86)
3. Conscientiousness 5.05 1.09 .11 .21** (.90)
4. Emotional stability 4.21 1.35 .35** .29** .53** (.93)
5. Openness 5.49 0.81 .33** .45** .26** .15* (.83)
Interviewer-reports
6. Extraversion 4.27 1.17 .22** .14 .01 .13 .19* (.76)
7. Agreeableness 4.62 0.91 .09 .13 .04 .02 -.09 .21** (.74)
8. Conscientiousness 4.74 0.93 .10 .03 .07 .11 .06 .21** .34** (.80)
9. Emotional stability 4.66 0.95 .19* .05 .22** .29** .05 .28** .33** .44** (.63)
10. Openness 4.26 0.97 .16* .04 -.14 -.07 .13 .26** .25** .19** .11 (.67)
Note. Interviewer-report N = 324. Self-report N = 170. M and SD are used to represent mean and standard deviation, respectively. *
indicates p < .05. ** indicates p < .01. Reliabilities reported in diagonal—for self-reports, Cronbach’s alpha, and for interviewer-
reports, ICC(2, k).

Table 4
Sample 2: Correlation matrix of self- and interviewer-reported personality and self-reported academic outcomes
Note. Interviewer-report N = 432. Self-report N = 382. College GPA N = 161. High school GPA N = 375. SAT verbal N = 302. SAT
math N = 306. ACT N = 222. M and SD are used to represent mean and standard deviation, respectively. * indicates p < .05. **
indicates p < .01. Reliabilities reported in diagonal—for self-reports, Cronbach’s alpha, and for interviewer-reports, ICC(1, k).
Variable M SD 1 2 3 4 5 6 7 8 9 10 11 12 13 14
Self-reports
1. Extraversion 3.18 0.84 (.90)
2. Agreeableness 4.03 0.59 .29** (.83)
3. Conscientiousness 3.54 0.63 .11* .14** (.80)
4. Emotional stability 3.01 0.72 .15** .02 .14* (.84)
5. Openness 3.68 0.55 .21** .25** .11* .03 (.76)
Interviewer-reports
6. Extraversion 4.55 1.16 .41** .28** .08 -.02 .07 (.89)
7. Agreeableness 4.80 0.70 .14* .43** .06 -.02 .02 .29** (.62)
8. Conscientiousness 5.45 0.62 .02 .07 .04 -.03 .04 .29** .14** (.60)
9. Emotional stability 5.09 0.62 .21** .18* .11* .11* .04 .40** .24** .35** (.58)
10. Openness 4.56 0.87 .12 .19** -.16** -.07 .17** .43** .17** .38** .36** (.72)
Academic Outcomes
11. College GPA 3.35 0.48 -.14 -.01 .08 -.13 -.04 -.04 -.03 .15* -.13 -.09
12. High school GPA 3.75 0.26 -.05 .15** .22** .02 .12* .15** .15** .09 .04 .10 .20**
13. SAT Verbal 628.0 79.0 -.08 -.04 -.01 -.06 .19** .04 -.04 .17* -.02 .15* .08 .18**
14. SAT Math 645.3 102 -.18** -.24** -.02 .00 .02 -.08 -.24** .24** -.04 .10 .18** .16** .50**
15. ACT 27.90 4.02 -.13 -.02 .05 .01 .15 .09 -.05 .17** .10 .29** .03 .33** .52** .46**

Table 5
Sample 3: Correlation matrix of self- and interviewer-reported personality and self-reported academic outcomes Variable M SD 1 2 3 4 5 6 7 8 9 10 11 12 13 14
Self-reports
1. Extraversion 3.34 0.82 (.89)
2. Agreeableness 4.02 0.60 .42** (.83)
3. Conscientiousness 3.53 0.59 .10 .13* (.76)
4. Emotional stability 3.05 0.81 .20** -.03 .24** (.87)
5. Openness 3.68 0.55 .27** .29** .15** .16** (.76)
Interviewer-reports
6. Extraversion 4.43 1.16 .30** .28** .09 -.04 .15* (.78)
7. Agreeableness 4.96 0.70 .24** .34** .12* .04 .15* .30** (.58)
8. Conscientiousness 5.30 0.70 .02 .08 .15* .03 .14* .27** .34** (.65)
9. Emotional stability 5.09 0.63 .13 .13* .09 .20** .17** .20** .42** .45** (.51)
10. Openness 4.34 0.78 .16 .23** .08 -.01 .16** .45** .34** .41** .20** (.49)
Academic Outcomes
11. College GPA 3.15 0.61 .01 -.02 .20** .05 -.07 .09 .21** .19* .06 .17*
12. High school GPA 3.71 0.26 .00 .13 .25** .01 .01 .06 .12 .10 .03 .05 .28**
13. SAT Verbal 626.5 74.2 -.01 -.04 .06 .02 .27** .10 .03 .19** .13 .01 .13 .15
14. SAT Math 641.6 102 -.01 -.21** .00 .15 .09 -.06 -.16 .08 -.04 -.03 .22** .10 .37**
15. ACT 27.22 4.37 .05 .10 .15 .15 .30** .10 .12 .23* .21* .10 .20* .15 .61** .53**
Note. Interviewer-report N = 317. Self-report N = 289. College GPA N = 270. High school GPA N = 282. SAT verbal N = 225. SAT
math N = 226. ACT N = 162. M and SD are used to represent mean and standard deviation, respectively. * indicates p < .05. **
indicates p < .01. Reliabilities reported in diagonal—for self-reports, Cronbach’s alpha, and for interviewer-reports, ICC(2, k).

(Sample 1 ICC(2, k) range: .63-.80, M = .72; Sample 2 ICC(1, k) range: .58-.89, M = .68; Sample
3 ICC(2, k) range: .49-.78, M = .60).
Within-Sample Nested Cross-Validation
The first step in developing our predictive algorithms involved nested cross-validation,
using 10 outer folds for testing and 10 inner folds for hyperparameter tuning. In nested 10-fold
cross-validation, 10 iterations of 10-fold cross-validation are conducted using nine folds of the
data, and the accuracy of the resulting models is tested on the remaining fold. The models used
for analysis are those with the hyperparameters that maximized cross-validated accuracy during
the inner 10-fold cross-validation. Appendix Table A1 reports the within-sample cross-validated
convergence in the outer test folds by trait for both self- and interviewer-report models.
Convergent and Discriminant Relations
To address Research Questions 2 and 3 (Research Question 1 is addressed later with
Research Question 4), we summarize multitrait-multimethod (MTMM; Campbell & Fiske, 1959)
matrices using convergence, discrimination, and method variance indices (Woehr et al., 2012) in
Table 6 for each set of outer 10-fold cross-validated AVI-PAs and the corresponding self- or
interviewer-reports. The convergence index (C1) is the average of the monotrait-heteromethod
correlations. C1 should be positive and sufficiently large to show convergence, a necessary
condition for further exploration of validity (Woehr et al., 2012). The first discrimination index
(D1) indicates the amount of variance attributable to traits by comparing C1 to the average
magnitude of heterotrait-heteromethod correlations. The second discrimination index (D2)
indicates the amount of variance attributable to traits by comparing C1 to the average magnitude
of heterotrait-monomethod correlations. D1 and D2 should be positive, and higher values suggest
better construct discrimination. Method variance (MV) is calculated by comparing the average

magnitude of heterotrait-monomethod correlations to the average magnitude of heterotrait-
heteromethod correlations. Higher values indicate greater method variance.
Table 6
Multitrait-multimethod statistics for AVI-PAs during within-sample cross-validation
C1 D1 D2 MV D2a MVa
Van Iddekinge et al. (2005) .32 .12 -.11 .23 -.25 .37
Park et al. (2015) .38 .27 .15 .11 .10 .16
Sample 1 Self-report Models .06 .00 -.15 .15 -.03 .03
Sample 2 Self-report Models .11 .02 -.02 .04 -.01 .03
Sample 3 Self-report Models .19 .11 .03 .08 .06 .05
Sample 1 Interviewer-report Models .41 .23 .16 .07 .17 .06
Sample 2 Interviewer-report Models .42 .23 .10 .13 .09 .14
Sample 3 Interviewer-report Models .38 .15 .02 .13 .00 .15
Note: C1 = convergence index (average of monotrait-heteromethod correlations). D1 =
discrimination index 1 (average of monotrait-hetermethod correlations minus the average
magnitude of heterotrait-heteromethod correlations). D2 = discrimination index 2 (average of
monotrait-heteromethod correlations minus the average magnitude of heterotrait-monomethod
correlations). MV = method variance (average magnitude of heterotrait-monomethod
correlations minus the average magnitude of heterotrait-heteromethod correlations). D2a =
discrimination index 2 calculated using only automated video interviews’ heterotrait-
monomethod correlations. MVa = method variance for automated video interviews.
For self-report models, C1 averaged M = .12 and ranged from .06 (Sample 1) to .19
(Sample 3). D1 averaged M = .04 and ranged from .00 (Sample 1) to .11 (Sample 3), and D2
averaged M = -.05 and ranged from -.15 (Sample 1) to .03 (Sample 3). MV averaged M = .09 and
ranged from .04 (Sample 2) to .15 (Sample 1). D2a averaged M = .01 and ranged from -.03
(Sample 1) to .06 (Sample 3), and MVa averaged M = .03 and ranged from .03 (Sample 1) to .05
(Sample 3). None of the models trained on self-reports exhibited strong convergent relations, and
the remaining indices only satisfied Woehr et al.’s (2012) criteria for the models from Sample 3.
For interviewer-report models, C1 averaged M = .40 and ranged from .38 (Sample 3) to
.42 (Sample 2). D1 averaged M = .20 and ranged from .15 (Sample 3) to .23 (Samples 1 & 2),
and D2 averaged M = .09 and ranged from .02 (Sample 3) to .16 (Sample 1). MV averaged M =
.11 and ranged from .07 (Sample 1) to .13 (Samples 2 & 3). D2a averaged M = .09 and ranged

from .00 (Sample 3) to .17 (Sample 1), and MVa averaged M = .12 and ranged from .06 (Sample
1) to .15 (Sample 3). Of the models trained on interviewer-reports, all three showed appropriate
patterns of convergent and discriminant relations, but the evidence was weakest for the Sample 3
models and strongest for the Sample 1 models.
As can be seen in Table 6, none of the self-report models exhibited C1 or D1 superior to
Van Iddekinge et al.’s (2005) results. On the other hand, all three sets of interviewer-report
models exhibited superior convergent and discriminant evidence of validity compared to Van
Iddekinge et al.’s (2005) results. Further, the interviewer-report models from Samples 1 and 2
exhibited convergent and discriminant evidence of validity comparable or superior to Park et
al.’s (2015) language-based personality models trained on nearly 70,000 self-reports.
Notably, however, the summary indices mask considerable variation among traits in
terms of convergence, as summarized in Appendix Table A1. To judge the level of convergence,
we consider the average of the single rater one-way random effects intraclass correlations from
interviewer-reports—in Sample 1, the average ICC(1, 1) = .46 (however, in Sample 3, the
average ICC(1, 1) = .27). In self-report models, conscientiousness was least accurately assessed
(�̅� = .01), and emotional stability was most accurately assessed (�̅� = .21). The models trained on
self-reports in Sample 3 conform to the predictions of SOKA, as emotional stability and
openness were most accurately inferred (rs = .31 and .25 respectively in Sample 3), whereas
extraversion and agreeableness were most accurately inferred in Sample 2 (rs = .30 and .25,
respectively). However, in no case did the convergence of self-report models exceed ICC(1, 1)s
from Sample 1.
In interviewer-report models, emotional stability was least accurately assessed (�̅� = .27),
and extraversion was most accurately assessed (�̅� = .65). Across all three samples, the

convergence of extraversion predictions exceeded ICC(1, 1) values. In Samples 1 and 2, the
convergence of agreeableness was comparable to ICC(1, 1) (�̅� = .43), but Sample 3 was
considerably lower (r = .17). Across all three samples, the convergence of conscientiousness
models was comparable to ICC(1, 1) (�̅� = .42), and the convergence of emotional stability
models was lower than ICC(1, 1) (�̅� = .27). The convergence of Sample 3’s openness model was
comparable to ICC(1, 1) (r = .41), while the convergence of Samples 1 and 2’s openness models
were somewhat lower (rs = .27 and .37, respectively). Overall, there is evidence that AVI-PAs
trained on interviewer-reports can converge at least as high as a single interviewer for some
traits. The evidence is by far the strongest for extraversion models.
On average, interviewer-report models had higher convergence than self-report models (�̅�
= .41 vs. �̅� = .10; z = 7.3, two-tailed p < .01 for Fisher r-to-z transformation). However, the
difference was not significant for emotional stability (�̅� = .21 vs. �̅� = .27; z = 1.38, p = .17). We
now turn to examine how well the psychometric properties of AVI-PAs generalized to new
interviews by investigating their reliability, replicating and extending the convergent and
discriminant evidence provided within each sample for cross-sample assessments in new
interviews, exploring AVI-PA model content, and examining their nomological network with
regard to academic outcomes.
Cross-Sample Generalizability of Automated Video Interview Trait Assessments
To examine Research Question 4, we trained models on the full data available in each
sample using the optimal hyperparameters identified by 10-fold cross-validation.
Test–retest Reliability
To address test–retest reliability (Research Questions 1a and 4a), we used the elastic net
models trained on Samples 1-3 to assess personality traits separately for the two interviews

completed by Sample 4 participants at each time point. Then we calculated the correlation (rtt)
between these two trait scores for each Big Five trait to index test–retest reliability, as reported in
Table 7 and summarized here. Of the models developed on Sample 1, test–retest reliability for
self-report models averaged �̅�tt = .36 and ranged .01-.69, and for interviewer-report models
averaged �̅�tt = .49 and ranged .37-.70. Of the models developed on Sample 2, test–retest
reliability for self-report models averaged �̅�tt = .51 and ranged .16-.85, and for interviewer-report
models averaged �̅�tt = .54 and ranged .09-.76. Of the models developed on Sample 3, test–retest
reliability for self-report models averaged �̅�tt = .50 and ranged .24-.85, and for interviewer-report
models averaged �̅�tt = .48 and ranged .23-.65. On average, self- and interviewer-report models
exhibited similar test–retest reliability (�̅�tt Self = .46; �̅�tt Interviewer = .50). These test–retest
correlations are, on average, higher than those observed in prior studies of interviews that
occurred over a much longer duration (Schleicher et al., 2010), yet noticeably lower than self-
report personality scales.
Self-report models exhibited the lowest test–retest reliability for conscientiousness (�̅�tt =
.30), openness (�̅�tt = .32), and extraversion (�̅�tt = .34), and highest for emotional stability (�̅�tt =
.76). On the other hand, interviewer-report models exhibited the lowest test–retest reliability for
emotional stability (�̅�tt = .23) and highest for extraversion (�̅�tt = .70) and conscientiousness (�̅�tt =
.65)4.
Generalized Coefficient of Equivalence and Stability
To address Research Questions 1b and 4b, we used the same trait estimates described in
4 Notably, an earlier version of this paper used only LIWC variables as verbal behavior predictors, finding higher
test–retest reliability than the present investigation (Sample 1 self-report models �̅�tt = .63, interviewer-report models
�̅�tt = .56; Sample 2 self-report models �̅�tt = .68, interviewer-report models �̅�tt = .63; Sample 3 self-report models �̅�tt =
.51, interviewer-report models �̅�tt = .56). This likely occurs because n-grams are likely to vary more than the
conceptual categories to which words belong, which is relevant to the fact that interviews provide interviewees with
an open-ended prompt that may elicit vastly different responses depending on the occasion.

Table 7
Test–retest reliability and generalized coefficient of equivalence and stability estimates for AVI-
PAs applied to Sample 4
rtt GCESs1s2 GCESs1s3 GCESs2s3 GCES Self-report models
Sample 1
Extraversion .31 .00 -.08 .02
Agreeableness .29 .06 -.15 .04
Conscientiousness .51 .08 .09 .09
Emotional Stability .69 .14 .28 .29
Openness .01 -.11 -.06 -.03
Sample 2
Extraversion .45 .00 .15 .02
Agreeableness .85 .06 .21 .04
Conscientiousness .16 .08 .09 .09
Emotional Stability .75 .14 .46 .29
Openness .34 -.11 .06 -.03
Sample 3
Extraversion .26 -.08 .15 .02
Agreeableness .55 -.15 .21 .04
Conscientiousness .24 .09 .09 .09
Emotional Stability .85 .28 .46 .29
Openness .60 -.06 .06 -.03
rtt GCESs1s2 GCESs1s3 GCESs2s3 GCES
Interviewer-report models
Sample 1
Extraversion .70 .69 .62 .66
Agreeableness .45 .21 .13 .19
Conscientiousness .54 .50 .43 .53
Emotional Stability .37 .07 .01 .05
Openness .40 .17 .26 .31
Sample 2
Extraversion .74 .69 .65 .66
Agreeableness .60 .21 .25 .19
Conscientiousness .76 .50 .66 .53
Emotional Stability .09 .07 .03 .05
Openness .53 .17 .50 .31
Sample 3
Extraversion .65 .62 .65 .66
Agreeableness .24 .13 .25 .19
Conscientiousness .65 .43 .66 .53
Emotional Stability .23 .01 .03 .05
Openness .62 .26 .50 .31
Note: All statistics based on AVI-PA scores for the two interviews in Sample 4. rtt = test–retest reliability.
GCESs1s2 = GCES calculated using only the models from samples 1 and 2. GCESs1s3 = GCES calculated
using only the models from samples 1 and 3. GCESs2s3 = GCES calculated using only the models from
samples 2 and 3. GCES = GCES calculated using all three samples’ models.

the test–retest reliability section but calculated cross-model test–retest correlations and averaged
them together to derive the GCES, as reported in Table 7. The GCES is estimated by correlating
two different measures of a construct administered at two different time points. Because AVI-
PAs can be applied to both time points, we calculated the average of such correlations for all
three AVI-PAs (GCES), as well as for each pair of AVI-PAs (GCESs1s2, GCESs2s3, and
GCESs2s3). For example, GCESs1s2 was calculated by correlating Sample 1 models’ trait scores of
Sample 4 at Time 1 with the Sample 2 models’ trait scores of Sample 4 at Time 2, correlating
Sample 2 models’ trait scores of Sample 4 at Time 1 with Sample 1 models’ trait scores of
Sample 4 at Time 2, then averaging these two correlations.
Because GCES estimates all sources of error (i.e., transient, random, and scale-specific)
simultaneously and seeks to estimate a generalizable test–retest reliability statistic (across
different AVI-PA models), GCES will typically be lower than test–retest correlations (Le et al.,
2009). As can be seen in Table 7, the GCES for self-report models was extremely low. The
strongest (yet still weak) evidence of reliability was for emotional stability assessments
(GCESs2s3 = .46). Although there are not readily available benchmarks for comparing GCES,
there is little evidence here to suggest that AVI-PAs trained on self-reports are reliable or that the
different models score self-reports similarly.
The GCES for interviewer-report models was better for extraversion, conscientiousness,
and openness, but not for agreeableness and emotional stability. Both the overall and paired
GCES estimates for extraversion exceeded .60. The paired Sample 2 and 3 GCESs2s3 = .66 for
conscientiousness, while the overall conscientiousness GCES = .53. The GCESs2s3 = .50 for
openness, but the overall openness GCES = .31. None of the agreeableness GCES estimates
exceeded .25, and none of the emotional stability GCES estimates exceeded .07.

In response to Research Questions 1b and 4b, there is promising evidence of reliability
for the AVI-PAs trained on interviewer-reports for extraversion, conscientiousness, and to a
lesser extent, openness. But for the remaining source-trait pairs, reliability is poor to absent.
Convergent and Discriminant Relations Generalizability
To investigate cross-sample convergent and discriminant relations (Research Questions
4c-4d), we used MTMM indices (Woehr et al., 2012) to summarize cross-sample trait
assessments in Samples 1-3. First, we calculated the average convergence between reported traits
and AVI-PAs (as reported in Appendix Table A2). For self-report models, C1 was .07, .09, and
.07. With regard to specific traits, the lowest cross-validated convergence was observed for
conscientiousness (�̅� = .04) and the highest convergence was observed for emotional stability (�̅�
= .10). Because convergence was so low and is a necessary condition to further explore validity
(Woehr et al., 2012), we did not further investigate the generalizability of the validity evidence
for self-report models.
For interviewer-report models, we again calculated the C1, D1, D2, and MV MTMM
indices, as reported in Table 8. We calculated them for each set of assessments, then calculated
their sample size weighted average. Appendix Tables A3-A5 report the MTMM matrices for the
cross-sample assessments by the three sets of models (e.g., the top half of Table A3 contains
correlations between Sample 1’s AVI-PAs of Sample 2’s participants and Sample 2’s
interviewer-reports, and the bottom half contains correlations between Sample 1’s AVI-PAs of
Sample 3’s participants and Sample 3’s interviewer-reports).
For these models, C1 averaged M = .37 and ranged from .34 (Sample 1) to .41 (Sample
2). D1 averaged M = .17 and ranged from .14 (Sample 3) to .20 (Sample 2), and D2 averaged M
= .06 and ranged from .02 (Sample 3) to .09 (Sample 2). MV averaged M = .10 and ranged from

Table 8
Multitrait-multimethod statistics for AVI-PAs during cross-sample cross-validation
C1 D1 D2 MV D2a MVa
Sample 1 Interviewer-report Models .34 .17 .08 .08 .15 .02
Sample 2 Interviewer-report Models .41 .20 .09 .11 .08 .12
Sample 3 Interviewer-report Models .36 .14 .02 .12 -.03 .17
Note. C1 = convergence index. D1 = discrimination index 1. D2 = discrimination index 2. MV =
method variance. D2a = discrimination index 2 calculated using only automated video
interviews’ heterotrait-monomethod correlations. MVa = method variance for automated video
interviews. Values are the sample size weighted average of the two sets of cross-sample
assessments.
.08 (Sample 1) to .12 (Sample 3). D2a averaged M = .07 and ranged from -.03 (Sample 3) to .15
(Sample 1), and MVa averaged M = .10 and ranged from .02 (Sample 1) to .17 (Sample 3).
Models trained on Sample 1 exhibited the largest drop in convergence (ΔC1 = -.07), largely due
to significant decreases in convergence for agreeableness (rwithin = .41 vs. rbetween = .28; z = 2.22,
p = .03) and emotional stability (rwithin = .32 vs. rbetween = .18; z = 2.25, p = .02). Convergence
dropped only slightly for models trained on Sample 2 (ΔC1 = -.01), with a significant decrease in
convergence for agreeableness (rwithin = .44 vs. rbetween = .28; z = 2.96, p = .003) but a significant
increase in convergence for conscientiousness (rwithin = .41 vs. rbetween = .52; z = 2.25, p = .02).
Convergence dropped slightly more for models trained on Sample 3 (ΔC1 = -.02), primarily due
to a significant decrease in convergence for openness (rwithin = .41 vs. rbetween = .27; z = 2.38, p =
.02). The interviewer-report models from Samples 2 and 3 had consistent MTMM indices when
calculated within- and between-samples, although the models from Sample 1 still exhibited
better discriminant evidence and less method variance compared to the models from Sample 3.
In line with the within-sample investigations, the convergent evidence of validity was strongest
for extraversion and second strongest for conscientiousness. Specifically, the convergence of the
AVI extraversion assessments again exceeded ICC(1, 1) (�̅� = .64), and Sample 2’s AVI
conscientiousness assessment exceeded ICC(1, 1) (r = .52), while Sample 3’s AVI

conscientiousness assessment was very similar to ICC(1, 1) (r = .45).
Test Content: Relative Contribution of Verbal, Paraverbal, and Nonverbal Behavior and
Common Predictors
To address Research Question 5a, we explored the relative contribution of each type of
behavior to the final interviewer-report elastic net regression models. To do so, we trained
models on a version of the data with all variables standardized by subtracting their within-sample
mean and dividing by their standard deviation. Then, we summed the regression weights from
each type of behavior (i.e., verbal, paraverbal, and nonverbal) within each model and divided
that value by the overall sum of regression weights in that model. The proportion of regression
weights accounted for by each type of behavior is summarized in Figure 3. To answer Research
Question 6b, we checked whether same-trait interviewer-report models exhibit overlap across
samples in terms of the predictors selected by elastic net regression.
Figure 3
Relative contribution of each type of behavior in interviewer-report models
a. Sample 1
b. Sample 2
c. Sample 3

Note: Relative contribution calculated by summing all standardized regression weights in the
final model from each type of behavior, then dividing that sum by the sum of the standardized
regression weights from all three types of behavior in the model. Percentages represent the
percentage of standardized regression weights given to predictors of that type.
As shown in Figure 3, there were relatively consistent differences between traits in the
relative contribution of each type of behavior. On average, extraversion models weighted
paraverbal behavior highest (38%), verbal behavior second highest (34%), and nonverbal
behavior lowest (28%). Only extraversion models did not weight verbal behavior highest of the
three types of behavior. Interestingly, although extraversion models exhibited the highest cross-
validated convergent correlations, they also exhibited the most within-trait differences in relative
contributions, as verbal behavior regression weights comprised 17.5% of all weights in Sample 1
but 60.0% of all weights in Sample 3 (SD = 22.7%). In other words, extraversion models had the
highest variance in terms of the relative contribution of each type of behavior. Four behavioral
cues were positive predictors of extraversion in all three interviewer-report models: word count,
average loudness (i.e., volume), average loudness peaks per second (i.e., speech rate), and the
standard deviation of facial AU12 (zygomatic major; the mouth part of a smile) activation
intensity. No other set of same-trait models had more than three common predictors.
On average, conscientiousness models utilized verbal behavior for over half of the total
regression weights (54.3%). Nonverbal behavior comprised just 9.3% of the regression weights,
and paraverbal behavior comprised 36.4% of the regression weights. In all three samples, the
final models included word count and proportion of words longer than six letters as positive

predictors, and the assent (e.g., agree, OK, yes) category from LIWC as a negative predictor.
The remaining models, on average, utilized verbal behavior for over four-fifths of the
regression weights (87.2%, 80.1%, and 86.7% respectively for agreeableness, emotional
stability, and openness models). As regards Research Question 6a, models tended to be
dominated by verbal behavior, except for extraversion models. For these remaining models,
some meaningful predictors emerged across multiple samples. For agreeableness models, the n-
gram love and average harmonics to noise ratio (i.e., lack of hoarseness) were positive predictors
in all three samples’ models. Additionally, stemmed n-grams containing help were positive
predictors in all three agreeableness models (help in Sample 1; help, abl help, help peopl, peopl
help, help like, way help, help need, and help one in Sample 2; help just, help well, help peopl,
and go help in Sample 3). For emotional stability models, the cooccurrence of facial AU 20
(risorius; lip stretcher) and AU 25 (depressor labii, relaxation of mentalis, and orbicularis oris;
lips part) was a negative predictor in all three samples’ models, albeit with low weight. Facial
AU 20 is associated with fear (Ekman & Friesen, 1978), and cooccurrence with AU 25 suggests
some negative emotions or tension while speaking. Additionally, the anxiety and negative
emotion LIWC categories were negative predictors of emotional stability in two of the three
models.
For openness models, n-grams containing one and love were positive predictors in all
three samples’ models (thing one and realli love in Sample 1; work one and realli love in Sample
2; one first, one, and love in Sample 3). Further, the stemmed n-gram creativ was positively
predictive of openness and was weighted highest of all predictors in Sample 1’s openness model
and second highest in Sample 2’s openness model. As regards Research Question 6b, common
predictors were found in same-trait models for all five traits. Overall, these common predictors

appeared intuitively to be conceptually relevant to their respective focal trait.
Nomological Network
Regarding Research Question 6, we examined bivariate correlations and used multiple
regression to examine how AVI-PAs related to academic outcomes in Samples 2 and 3. Table 9
reports the bivariate correlations between AVI-PA scores and academic outcomes for models
trained on interviewer-reports in Samples 1 and 3, assessing Sample 2 participants’ traits, and
Table 10 reports the results of hierarchical regression. Tables 11 and 12 report the same results
for models trained on interviewer-reports in Samples 1 and 2, assessing Sample 3 participants’
traits. In the regression results, Model 1 is multiple regression with one set of AVI-PA scores as
predictors (e.g., either Sample 1 or Sample 3’s AVI scores of Sample 2 participants’ traits were
entered as predictors). Model 2 is multiple regression with self- and interviewer-reported traits as
predictors (only reports R2 for simplicity of presentation), and Model 3 tests whether AVI-PAs
increment beyond self- and interviewer-reported traits in predicting these outcomes.
Table 9
Bivariate correlations between Sample 2 academic outcomes and cross-sample AVI-PA scores
(interviewer-report models)
College
GPA
HS
GPA
SAT
Verbal
SAT
Math ACT
Sample 1 AVI Extraversion -.04 .22** .02 -.14* .18*
Agreeableness .06 .14* -.07 -.24** -.09
Conscientiousness .11 .11* .10† .00 .09
Emotional Stability .02 .07 .07 .07 .15*
Openness -.03 .07 -.07 -.09 .08
Sample 3 AVI Extraversion -.01 .21** -.03 -.18** .12†
Agreeableness .02 .12* -.10† -.22** -.06
Conscientiousness .04 .21** .11† .02 .20**
Emotional Stability .00 .09† -.04 .10† .11
Openness .04 .16** .05 -.05 .15*
Note: † p < .1. * p < .05. ** p < .01

48
Sample 2. Table 9 reports the bivariate correlations for participants in Sample 2. In terms
of specific trait-outcome effect sizes, Bosco et al. (2015) suggest that correlations between
psychological characteristics, like personality, and performance outcomes are medium in size
when r > .10 and < .23. Here we summarize all effects at least medium in size. Sample 1 model’s
predictions of conscientiousness correlated with Sample 2 college GPA r = .11. Sample 1
models’ predictions of extraversion, agreeableness, and conscientiousness correlated with
Sample 2 high school GPA rs = .22, .14, and .11 respectively, and Sample 3 models’ predictions
of extraversion, agreeableness, conscientiousness, and openness correlated with Sample 2 high
school GPA rs = .21, .12, .21, and .16. Sample 3 model’s predictions of conscientiousness
correlated with Sample 2 SAT verbal scores r = .11. Sample 1 and 3 models’ predictions of
extraversion and agreeableness were correlated with SAT math rs = -.14 and -.24 (Sample 1
models) and rs = -.18 and -.22 (Sample 3 models). Sample 1 models’ predictions of extraversion
and emotional stability correlated with ACT scores rs = .18 and .15, and Sample 3 models’
predictions of extraversion, conscientiousness, emotional stability, and openness correlated with
ACT scores rs = .12, .20, .11, and .15, respectively.
Table 10 reports the regression results for Sample 2. The interviewer-report model
assessments from Samples 1 and 3 were significant predictors of high school GPA, SAT math,
and ACT scores, and trait estimates derived from Sample 3 models were also significant
predictors of SAT verbal scores (R2 = .06). Both sets of model assessments incrementally
predicted high school GPA and SAT math scores beyond reported traits (ΔR2 = .02 & .06 for
Sample 1 models; ΔR2 = .03 & .07 for Sample 3 models). For all outcomes except college GPA,
Sample 3 models’ predictions explained at least half as much variance (in absolute terms) as both
self- and interviewer-reports.

49
Table 10
Regression estimates predicting academic outcomes: Sample 2 cross-sample AVI-PA scores
(interviewer-report models) College GPA
(N = 161)
HS GPA
(N = 375)
SAT Verbal
(N = 302)
SAT Math
(N = 306)
ACT
(N = 222)
M 1 M 2/3 M 1 M 2/3 M 1 M 2/3 M 1 M 2/3 M 1 M 2/3
Self-reports
Interviewer-reports
R2 .11† .12** .10** .18** .17**
Sample 1 AVI
Extraversion -.07 -.16 .19** .17* .02 -.05 -.12† -.19** .17* .12
Agreeableness .07 .09 .08 .05 -.08* -.07 -.22** -.16** -.15* -.13†
Conscientiousness .11 .08 .07 .04 .09 .04 .01 -.08 .04 .02
Emotional Stability .01 -.02 .01 .02 .05 .03 .11† .06 .10 .09
Openness -.03 .00 .03 .01 -.08 -.10† -.06 -.05 .06 .06
R2 .02 .13 .06** .14** .02 .12** .08** .24** .07** .20**
ΔR2 .02 .02** .02 .06** .03
Sample 3 AVI
Extraversion -.09 -.09 .14† .09 -.17* -.20* -.30** -.28** -.00 -.05
Agreeableness .01 .03 .02 .04 -.15* -.09 -.24** -.16** -.19** -.14*
Conscientiousness .06 .02 .11 .12 .26** .18* .19* .05 .20* .17†
Emotional Stability .01 .02 .03 .03 -.09 -.10† .10† .06 .05 .04
Openness .07 .07 .00 .00 .10 .06 .13† .06 .13 .11
R2 .01 .12 .06** .15** .06** .13** .11** .25** .08** .21**
ΔR2 .01 .03* .03† .07** .04
Note: † p < .1. * p < .05. ** p < .01. Table entries are standardized regression coefficients. AVI =
automated video interviews. M 1 = model 1, using one set of interviewer-report AVI-PAs only as
predictors. M 2/3 = models 2 and 3. Model 2 uses self- and interviewer-reported traits only, and Model 3
adds one set of AVI-PAs.
Sample 3. Table 11 reports the bivariate correlations for participants in Sample 3. In
terms of specific trait-outcome effect sizes, Sample 1 models’ predictions of extraversion,
agreeableness, and openness correlated with Sample 3 high school GPA rs = .12, .11, and .13,
and Sample 2 models’ predictions of extraversion and conscientiousness correlated with high
school GPA rs = .13 and .11. Sample 1 models’ predictions of extraversion and
conscientiousness correlated with SAT verbal rs = .12 and .19, and Sample 2 models’ predictions
of agreeableness and conscientiousness correlated with SAT verbal rs = -.17 and .19. Sample 1
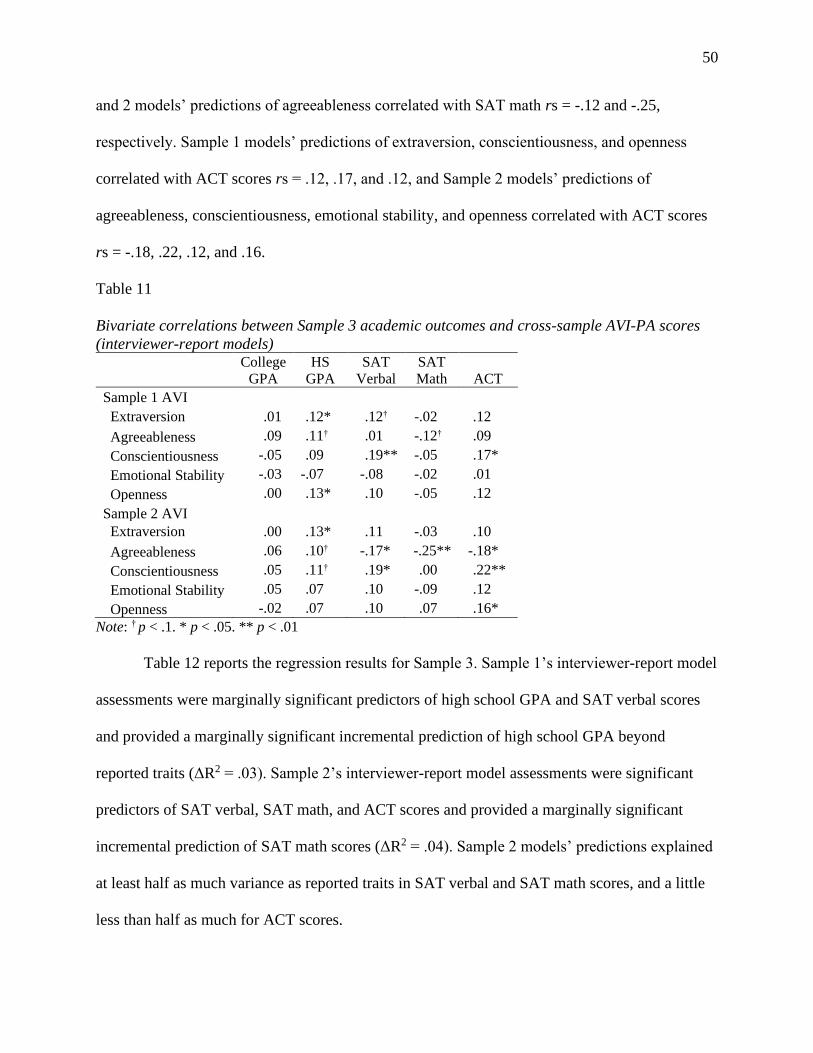
50
and 2 models’ predictions of agreeableness correlated with SAT math rs = -.12 and -.25,
respectively. Sample 1 models’ predictions of extraversion, conscientiousness, and openness
correlated with ACT scores rs = .12, .17, and .12, and Sample 2 models’ predictions of
agreeableness, conscientiousness, emotional stability, and openness correlated with ACT scores
rs = -.18, .22, .12, and .16.
Table 11
Bivariate correlations between Sample 3 academic outcomes and cross-sample AVI-PA scores
(interviewer-report models)
College
GPA
HS
GPA
SAT
Verbal
SAT
Math ACT
Sample 1 AVI Extraversion .01 .12* .12† -.02 .12
Agreeableness .09 .11† .01 -.12† .09
Conscientiousness -.05 .09 .19** -.05 .17*
Emotional Stability -.03 -.07 -.08 -.02 .01
Openness .00 .13* .10 -.05 .12
Sample 2 AVI Extraversion .00 .13* .11 -.03 .10
Agreeableness .06 .10† -.17* -.25** -.18*
Conscientiousness .05 .11† .19* .00 .22**
Emotional Stability .05 .07 .10 -.09 .12
Openness -.02 .07 .10 .07 .16*
Note: † p < .1. * p < .05. ** p < .01
Table 12 reports the regression results for Sample 3. Sample 1’s interviewer-report model
assessments were marginally significant predictors of high school GPA and SAT verbal scores
and provided a marginally significant incremental prediction of high school GPA beyond
reported traits (ΔR2 = .03). Sample 2’s interviewer-report model assessments were significant
predictors of SAT verbal, SAT math, and ACT scores and provided a marginally significant
incremental prediction of SAT math scores (ΔR2 = .04). Sample 2 models’ predictions explained
at least half as much variance as reported traits in SAT verbal and SAT math scores, and a little
less than half as much for ACT scores.

51
Table 12
Regression estimates predicting academic outcomes: Sample 3 cross-sample AVI-PA scores
(interviewer-report models) College GPA
(N = 270)
HS GPA
(N = 282)
SAT Verbal
(N = 225)
SAT Math
(N = 226)
ACT
(N = 162)
M 1 M 2/3 M 1 M 2/3 M 1 M 2/3 M 1 M 2/3 M 1 M 2/3
Self-reports
Interviewer-reports
R2 .12** .09* .14** .11* .19**
Sample 1 AVI
Extraversion .02 -.06 .07 .13 .08 .05 .02 -.00 .09 .01
Agreeableness .09 .03 .08 .05 -.03 .00 -.12† -.08 .05 .07
Conscientiousness -.09 -.15* .02 .04 .16* .10 -.06 -.09 .19* .12
Emotional Stability .05 .03 .02 -.00 -.00 .00 -.05 -.07 .14 .15†
Openness .00 -.03 .10 .12* .05 .05 -.03 -.03 .06 .04
R2 .01 .14** .03† .12** .05† .15** .01 .12* .06 .21**
ΔR2 .02 .03† .01 .01 .02
Sample 2 AVI
Extraversion -.03 -.00 .10 .18† .02 .04 -.06 -.03 -.07 -.02
Agreeableness .05 -.03 .09 .07 -.20** -.14* -.24** -.17* -.16* -.07
Conscientiousness .08 -.08 .05 .01 .20** .13 .06 .03 .22* -.10
Emotional Stability .02 .05 -.00 .03 .02 -.04 -.09 -.12 .04 .21
Openness -.05 -.13 -.01 -.02 -.01 -.03 .10 .04 .05 -.05
R2 .01 .14** .03 .11** .07** .16** .08** .14** .08* .21**
ΔR2 .02 .02 .02 .04† .02
Note: † p < .1. * p < .05. ** p < .01. Table entries are standardized regression coefficients. AVI =
automated video interviews. M 1 = model 1, using one set of interviewer-report AVI-PAs only as
predictors. M 2/3 = models 2 and 3. Model 2 uses self- and interviewer-reported traits only, and Model 3
adds one set of AVI-PAs.
Discussion
Automated video interviews are increasingly being adopted by organizations for early-
stage applicant screening due to their potential to decrease costs and improve the quality of
applicant screening. However, little evidence has been available to suggest that AVIs are
psychometrically valid. This research's objective was to critically examine the psychometric
properties of AVI-PAs as an example of one set of constructs that could be assessed with AVIs.
The first part of these investigations (i.e., within-sample) assessed the convergent and

52
discriminant evidence of validity for AVI-PAs when tested with nested k-fold cross-validation.
Among the models trained on self-reports, convergent evidence was minimal, with the most
optimistic evidence for the less visible trait of emotional stability in Sample 1, emotional
stability and openness in Sample 3, and the more visible traits of extraversion and agreeableness
in Sample 2. By comparison, all three sets of interviewer-report models exhibited superior
convergence. Regarding discriminant evidence for the AVI-PAs trained on self-reports, only
those from Sample 3 had positive MTMM discrimination indices. These indices are positive
when construct variance (i.e., monotrait-hetermethod correlations; C1) exceeds higher-
order/common factor variance (i.e., heterotrait-heteromethod correlations; D1) and method
variance (i.e., heterotrait-monomethod correlations; D2). All interviewer-report models had
positive discrimination indices, and those from Samples 1 and 2 had larger discrimination indices
than Sample 3’s self-report models.
The second part of these investigations (i.e., cross-sample) examined the generalizability
of the psychometric properties of AVI-PAs by applying the trained machine learning models to
new interviews. We applied the thirty predictive models (trained separately on the self- and
interviewer-reported Big Five traits from Samples 1, 2, and 3) to assess traits in a sample of
participants (Sample 4) who completed a video interview twice to examine reliability. Overall,
self-report models exhibited poor test–retest reliability for all traits except emotional stability (�̅�tt
= .76), and GCES was low for all traits except emotional stability models from Samples 2 and 3
(GCESs2s3 = .46). Interviewer-report models exhibited evidence of test–retest reliability for
extraversion (�̅�tt = .70), conscientiousness (�̅�tt = .65), and, to a lesser extent, openness (�̅�tt = .52),
but little evidence of test–retest reliability for agreeableness (�̅�tt = .43) and emotional stability
(�̅�tt. = 23). GCES was high for interviewer-report models of extraversion (GCES = .66),

53
conscientiousness models from Samples 2 and 3 (GCESs2s3 = .66), and to a lesser extent,
openness models from Samples 2 and 3 (GCESs2s3 = .50).
Regarding convergent relations, models trained on self-reports exhibited virtually no
convergence with self-reported traits when applied to new samples (�̅� = .07), whereas models
trained on interviewer-reports exhibited cross-sample convergence similar to, but slightly lower
than, when they were tested using nested k-fold cross-validation (�̅� = .37). Because convergence
is a necessary condition for further investigations of validity, we only investigated the
generalizability of discriminant evidence for interviewer-report models. All interviewer-report
models again demonstrated positive MTMM discrimination indices, although scores from
Sample 3’s models did not when isolating the properties of the AVI-PAs (i.e., D2a and MVa).
Regarding the content of the AVI-PAs, the verbal, paraverbal, and nonverbal predictors
across the models for each trait appeared to be conceptually relevant to the focal trait, and with
the exception of extraversion, interviewer-report models used verbal behavior more than
paraverbal or nonverbal behavior. However, there were inconsistencies in the relative
contribution of verbal behavior in extraversion models, as the weight of verbal behavior in
interviewer-report extraversion models changed by about 40% between Samples 1 and 3. This
suggests that, while the models trained on interviewer-reports may consistently predict
interviewer-reported extraversion, the degree to which relevant verbal behaviors are used to
make such ratings vary. Such inconsistency may be due to differences in interview questions, yet
this did not appear to affect the convergence of the models. The interviewer-report model
assessments predicted multiple academic outcomes beyond self- and interviewer-reported traits
in Samples 2 and 3, and numerous medium-sized effects (Bosco et al., 2015) were observed
between AVI-PAs and academic outcomes. Together, these sources of evidence lend initial

54
support to interpreting AVI-PAs as substantively tapping into personality constructs.
Theoretical Implications
While some of the methods used in the present study are novel to many applied
psychologists, AVIs are simply quantifying and selecting behaviors extracted from video clips
and then weighting them as predictors in statistical models. This is an empirically-keyed
assessment, in that machine learning algorithms select and weight behaviors to maximize the
prediction of (i.e., convergence with) human reported traits, without regard for other
psychometric properties. Therefore, for all AVIs, it is important to recognize the mediating
processes that affect their reliability and validity. Figure 1 provides an initial conceptual
framework that draws on prior personality (Connelly & Ones, 2010; Funder, 1995) and
employment interview (Huffcutt et al., 2011) research to identify some of these processes.
Drawing on Funder’s RAM (1995) and its emphasis on the trait relevance and availability
of behaviors, as well as the ability of observers to detect and utilize the behaviors to make trait
judgments, we can understand the theoretical implications of our findings by characterizing
AVIs as a special kind of rater that assesses personality by using behaviors to replicate human
ratings. AVI-PAs will be more accurate to the extent that 1) personality-relevant behaviors are
available and vary across participants and 2) the computer is able to detect personality-relevant
behaviors. For example, the source of personality information (i.e., interviewer versus
interviewee) appeared to affect the availability of personality-relevant behaviors by affecting
which and how many behaviors were personality-relevant. Interviewees self-reported their
context-independent traits, whereas interviewers gleaned an interview context-specific view of
personality. Similar to how contextualized personality self-reports can improve criterion
prediction (Shaffer & Postlethwaite, 2012; Woo et al., 2015), the greater convergence of

55
interviewer-reports suggests the importance of contextualized personality for understanding
context-specific behaviors.
Situational characteristics can moderate the psychometric properties of AVI-PAs to the
extent that they affect the relationship between personality and behavior. Situational
characteristics in our study that may have had such effects include question consistency and
question trait relevance. Question consistency is an aspect of interview structure (Chapman &
Zweig, 2005), and Sample 1 used relatively inconsistent questions as each group of respondents
was encouraged to respond to one or more questions. In contrast, Sample 2 and 3’s mock
interviews were more consistent since all respondents within each sample answered the same
prompts. Question trait relevance regards whether questions elicit behavioral expressions of
specific traits (Tett & Burnett, 2003; Tett & Guterman, 2000). Only the questions in Sample 3
were designed to be directly relevant to the Big Five traits.
Because other elements changed between samples that may also affect the psychometric
properties of AVI-PAs (e.g., sample size, number of questions), we can only offer tentative
interpretations of these effects. For example, there were differences in convergent evidence
during our within-sample investigations across traits for the self-report models. Emotional
stability was relatively accurately assessed in Samples 1 and 3, extraversion and agreeableness
were accurately assessed in Sample 2, and openness was accurately assessed in Sample 3.
However, these effects were less evident for interviewer-reports as within-sample convergence
was much more consistent across samples for those models. The cross-sample investigations
suggest that the relationship between self-reported personality and interview performance (i.e.,
behavior) may not be consistent across situations. In contrast, the relationship between
interviewer-reported traits and interview performance appears to be relatively more consistent.

56
Such, cross-sample consistency may actually reflect trait-like perceiver effects on rating targets,
shared stereotypes based on physical appearance, and common schema for interpreting
behavioral cues (Kenny, 1991, 2004; Wood et al., 2010). These and other rater “errors” could
actually reflect true construct variance (e.g., halo effects reflecting the accurate perception of the
covariation of socially desirable qualities; Funder, 1995; Funder & West, 1993).
Practical Implications
Automating video interviews hold the potential to save organizations time and money,
and the present study provided initial evidence regarding AVI-PAs’ reliability, convergent
relations, discriminant relations, test content, and relationships with academic outcomes.
Assessment at scale can bring considerable long-term benefits, even if slightly less valid than
other approaches (Chamorro-Premuzic et al., 2017). Our study provides some initial evidence
suggesting that AVI-PAs may validly assess some traits, but the evidence is mixed and many
questions remain unanswered.
One promising area of evidence for AVI-PAs was construct discrimination. Practically,
construct discrimination is a challenge in employment interviews (Hamdani et al., 2014). Yet,
evidence of construct discrimination was much greater for the AVI-PAs than the facet-level
personality interviews investigated by Van Iddekinge et al. (2005). Analyzing AVI models may
help with identifying specific behaviors relevant to one KSAO but not another, and such insights
could be used in the future to enhance interviewer frame-of-reference training.
The promising construct discrimination evidence was specific to AVI-PAs trained on
interviewer-reports, making it clear that development choices affect the psychometric properties
of AVI-PAs. If the goal of using AVI-PAs is to overcome issues with self-reported personality in
selection, then interviewer-reports should likely be used. Encouragingly, compared to models

57
trained on self-reports, models trained on interviewer-reports exhibited much stronger evidence
of construct validity and generalized to new interview questions.
Another consideration is whether AVI vendors should allow clients to tailor interview
questions for specific roles. Our results suggest that the psychometric properties of AVI-PAs
may remain relatively consistent when models trained on one set of questions are used to assess
interviewees who were asked a different set of questions. Samples 1 and 3’s AVI-PA
interviewer-report models exhibited worsened psychometric properties when used to assess
cross-sample personality. Yet, the psychometric properties of Sample 2’s AVI-PAs decreased
only minimally when applied cross-sample (ΔC1 = -.01, ΔD1 = -.03, and ΔD2 = -.01) and, in
fact, exhibited higher convergence for conscientiousness (Δr = .11) and less method variance
(ΔMV = -.02) compared to the within-sample investigations. Standardizing questions in AVIs
may improve their psychometric properties, but the present study suggests that allowing clients
to use interview questions different from those used to train the AVI-PAs may be justifiable.
However, more pieces of evidence are needed to justify the use of AVIs in personnel
selection. Evidence based on response processes (AERA et al., 2014) could shed light on the
ability of AVIs to discriminate between good and poor interview performance. This is also
related to the content of AVIs—the behavioral predictors common to interviewer-report models
for a given trait appeared intuitively related to the focal traits. For example, the extraversion
models included behaviors related to talkativeness (i.e., word count, speech rate) and social
energy (i.e., volume, mouth smiles). Future research should specify trait-relevant behaviors a
priori and explore response processes to generate more robust content evidence of validity.
Second, although AVI-PAs can serve as an alternative to fakeable self-reports, it is not
known whether AVI-PAs can be faked. Interviews appear to be less fakeable than self-reports

58
(e.g., Van Iddekinge et al., 2005). However, this may not hold for AVI-PAs. Future studies that
include faking or applicant-like conditions, as well as adversarial examples—inputs meant to
fool trained machine learning models into making mistakes (e.g., Goodfellow et al., 2014)—may
help determine the extent to which faking affects the psychometric properties of AVIs.
Third, several vendors of AVIs promote their products as being fairer and less biased
than traditional assessments (Raghavan et al., 2019). However, little evidence is generally made
available beyond mean-level comparisons across legally protected groups, even though the
Principles and Standards reject the equal outcomes definition of fairness (AERA et al., 2014;
SIOP, 2018). Initial evidence suggests that automated interviews are associated with lower
applicant reactions and perceived as less fair than traditional interviews (Langer et al., 2019).
Additionally, algorithmic bias continues to be a widespread concern, and AVIs may be biased
against Blacks and African Americans due to their use of facial recognition software that
measures nonverbal behavior (EPIC, 2019; Harris et al., 2019). Such software tends to be less
accurate for people with darker skin tones because less light reflects into the camera, making it
more challenging to observe the contours of the face (cf. Buolamwini & Gebru, 2018). Concerns
also exist for complying with the Americans with Disabilities Act (ADA; 1989)—to the extent
that disabilities affect speech, movement, and facial expressions, individuals protected by the
ADA may be discriminated against or adversely affected by the use of AVIs. Practitioners must
consider evidence beyond group means when evaluating AVI bias and discrimination, and they
should carefully consider and question AVI vendors regarding how disabled applicants will be
assessed.
Fourth, criterion-related validity evidence that relates AVIs to important workplace
criteria such as turnover and job performance is necessary to justify their use in selection.

59
Although the unitarian conception of validity values multiple sources of validity evidence,
criterion-related evidence is often considered synonymous with validity. A rigorous criterion
validation study first requires establishing that the focal KSAOs are job relevant. If and until
such evidence is available, AVIs will be open to legal challenge. By the nature of AVIs being
automated, they may receive additional scrutiny from applicants and regulators.
As mentioned above, development choices affect the psychometric properties of AVIs,
although the present study is limited in its design. More research is needed, but we can offer
tentative suggestions for the development of AVIs. One of the most important decisions in AVI
development pertains to the ground truth. The first question to ask is, what construct(s) will be
assessed? We suggest that AVIs should be developed to assess visible constructs predictive of
workplace criteria. Focusing on visible constructs will enhance the availability of relevant cues.
Personality traits predict performance in jobs with relevant demands (Judge & Zapata, 2015).
Yet, other constructs like cognitive ability and interpersonal skills will tend to predict job
performance better than broad personality traits. Regardless of the KSAOs assessed by an AVI,
organizations must use job analysis (SIOP, 2018) to determine which constructs assessed by a
given AVI (if any) are relevant to the focal job.
Another important consideration beyond the choice of target construct(s) is the choice of
ground truth for training the algorithms (i.e., what measure(s) of the target construct(s) should be
used for model training?). The present study used observer ratings on an existing Likert-type
personality scale, but using a wider variety of questions or questions that are contextualized for
the context of interest may influence the accuracy and generalizability of models, which is an
empirical question that remains to be tested.
One might consider training AVIs on ground truth external to the interview context—

60
such as job performance. In other words, the interviews can be empirically keyed to predict job
performance, and this could possibly be more resistant to faking. However, extra caution should
be taken in implementing such approaches, as they may perpetuate or exacerbate demographic
imbalances and past discrimination (cf. Dastin, 2018) because the model will inherit any biases
in the ground truth used for training (e.g., as found in some supervisor ratings; Stauffer &
Buckley, 2005).
For some workplace relevant KSAOs, it may be beneficial to train the algorithms to
model behaviorally anchored rating scale (BARS) scores from interview performance. Using
BARS raises a concern regarding whether models will generalize to new interview questions.
Some vendors allow question customization; others require the same set of questions to be used
in all interviews; and yet others conduct local optimization of models for each focal job. In the
case of models trained on BARS, AVIs may be less likely to generalize to new questions because
they would be trained to model BARS anchors that describe behaviors specific to that question.
In terms of AVI-PAs, the psychometric properties for extraversion and conscientiousness
models trained on interviewer-reports showed cross-sample convergence consistent with the
within-sample investigations, suggesting that such models may generalize to new interview
questions. These results align with the SOKA model, which states that observer-reports of more
visible traits will be most predictive of relevant behaviors (Vazire, 2010). Thus, trait visibility is
a necessary (but not sufficient) consideration when deciding whether client organizations can use
new questions in subsequent applications of existing models trained on interviewer-reports. If a
less visible trait is to be assessed, the SOKA model would suggest that self-reports will be more
predictive of behaviors. Self- and interviewer-reports represent different components of
personality (Hogan, 1991), so another option is to train AVI-PAs on interviewer-reports and

61
have client organizations supplement the AVI-PAs with self-reports of less visible traits.
A final recommendation regards validation and reporting practices. While this study
suggests that some AVI-PAs can exhibit good validity evidence for scoring some traits, “the
psychometric properties of one behavior-based measure cannot be generalized to another”
(Ortner & van de Vijver, 2015, p. 7). Therefore, vendors should provide interested organizations
with validation information, as required by both the Principles (SIOP, 2018) and Standards
(AERA et al., 2014). This should include all of the foundational validation information, as well
as the key design choices made and the rationale behind them. This should include, first, the data
source (e.g., self- vs. interviewer-report) used as the “ground truth” to develop the assessment
models. Second, the specific interview questions in the training data along with the rationale for
the degree of interview structure (e.g., question consistency) and trait relevance should be
provided. Third, if vendors allow users to tailor the interview questions, then cross-sample
validation evidence must be provided.
Fourth, if vendors conduct local optimization of the algorithms, validity evidence must be
generated and analyzed for the resultant, new test. Otherwise, when these procedures are
eventually challenged in court, organizations may be held responsible for failing to do their due
diligence when adopting AVIs.
Limitations and Future Directions
Below we highlight several directions for future research considering limitations of our
current investigation. First, the scope of our research did not include AVI-PA’s relationships
with organizationally relevant outcomes (e.g., supervisory ratings of performance), which will be
needed to justify the use of AVIs in personnel selection. Because there are additional concerns
for AVIs, including their automated nature and potential for bias (Raghavan et al., 2019), it will

62
be important to directly compare them to existing selection procedures. As AVIs are generally
deployed as early-stage selection screening tools, they should be compared to self-report
personality tests, biodata, and other forms of early-stage screening. Further, to understand if they
hold potential for later stages of the selection process, they can be compared to general mental
ability tests, assessment centers, and structured interviews. Criterion-related evidence of validity
must be considered with other validity evidence such as provided by the present study, as well as
evidence of (lack of) bias, fairness, and practical considerations in a cost-benefit analysis (SIOP,
2018) to decide whether or not adopting AVIs is justified.
Second, in some cases, the reliability of interviewer-reports in the present study was low.
For instance, ICC(1, k) was below .60 for interviewer-reports of emotional stability in Sample 2,
as well as for agreeableness, emotional stability, and openness in Sample 3. Low interrater
reliability appeared to affect the psychometric properties of AVI-PAs. The within-sample
investigations found that Sample 3 agreeableness models exhibited the lowest convergence of all
interviewer-report models, and Samples 2 and 3 emotional stability models exhibited the next
lowest convergence. Agreeableness is a highly evaluative, moderately visible trait, and emotional
stability is a low visibility trait, which may have caused these low reliabilities and convergent
correlations. Overall, Sample 3 had the lowest interrater reliabilities and the worst psychometric
properties of all interviewer-report models in terms of construct discrimination and method
variance. Therefore, collecting more raters to achieve higher reliability could lead to improved
psychometric properties for interviewer-report models. However, the quality of raters and
characteristics of the interview may also matter—raters in Sample 1 were I-O psychology PhD
students, and although Sample 1’s mock interview was relatively unstructured (i.e., gave a
choice of prompts to respond to), interrater reliability was highest in Sample 1. Other rating

63
formats, such as using BARS, may also bring interrater reliability more in line with meta-
analytic estimates of interview interrater reliability for high structure interviews (i.e., .76;
Huffcutt et al., 2013).
Third, some weaknesses in our research design limit the generalizability of our findings.
Because we did not fully cross conditions relating to rater quality, question consistency, question
trait relevance, and response length, the findings may be specific to our design and sample. More
work is needed in the future to assess constructs with AVIs using multiple types of questions and
samples to ensure that the findings generalize beyond the measures and samples used in the
present study. For example, although we designed Sample 3’s questions to elicit trait-relevant
behaviors, we did not formally assess their trait relevance (i.e., trait activation potential).
Relatedly, we did not distinguish between generalizing across populations vs.
generalizing across questions, although this may represent the real-world application of some
AVIs. In the present study, Samples 2 and 3 included different interview questions while holding
the population (i.e., undergraduate students) constant, whereas Sample 1 differed from Samples 2
and 3 in both interview questions and population (i.e., Turkers). This may have contributed to
Sample 1’s interviewer-report models exhibiting the worst convergent evidence of the
interviewer-report models during the cross-sample investigations. Future research should address
the extent to which the population studied, the questions used, and the interaction of the two
affect the construct validity of AVIs. For instance, AVIs trained on entry-level applicants may
not yield strong validity evidence when tested on C-suite applicants, even if the interview
questions are held constant. Even AVIs trained on incumbents may generalize poorly to
applicants due to potential range restriction in the incumbents and differences in their
motivations for performing well in the interview.

64
Fourth, we encourage more research to be conducted in this domain with larger samples.
While the current study entails the largest number of mock video interviews to date in the
domain of AVI research, it is possible that AVI-PAs could be more accurate if trained on larger
samples, particularly in the case of AVI-PAs trained on self-reports (e.g., Jayaratne &
Jayatilleke, 2020). Larger samples also enable the detection of more complex relationships, such
as nonlinear and interaction terms (that are included by default in the random forest algorithm;
Breiman, 2001) as well as more granular trait-verbal behavior relationships in n-gram text
mining.
Fifth, more work is needed to clarify how different modeling decisions may affect the
psychometric properties of AVIs. Such investigation should include comparing results from
different algorithms (e.g., random forest, support vector machines) as well as with different ways
in which data are aggregated. For example, the present study used interviewee-level data (i.e.,
data aggregated across all interview questions) to infer interviewee characteristics, yet it would
also be possible to develop question-level models using only the responses to questions meant to
elicit the focal KSAO. Similarly, each question could be used to model all characteristics, and
then, those predictions could be averaged together or directly evaluated. Besides different levels
of analysis, methods for analyzing verbal, paraverbal, and nonverbal behavior are evolving
rapidly. Linguistic analyses, especially, are growing at a rapid pace. For example, probabilistic
topic models may provide interpretable methods that better capture response content (e.g.,
Campion et al., 2016). Recently, transfer learning and transformer language models (e.g., BERT;
GPT-3) have emerged that hold promise for better capturing semantics in organizational text
analysis (Hickman, Thapa, et al., 2020) and achieve high performance on a wide variety of tasks
(Brown et al., 2020; Devlin et al., 2018). However, similar to how AVIs can exhibit bias, such

65
transfer learning language models appear to reflect societal prejudices and biases that are
embedded in the natural language texts used to develop the models (Kurita et al., 2019).
Sixth, bias concerns suggest important directions for future research: (1) investigating
adverse impact and bias at both the behavioral predictor and outcome level, (2) intentionally
oversampling from minority groups to ensure diversity in the training data, and (3) investigating
AVIs that only use verbal behavior as predictors, considering that existing legal concerns have
focused on the use of nonverbal behavior in personnel selection (e.g., EPIC, 2018) and that
BARS are designed to focus on the verbal response. Initial research on written interview
responses suggests that this is a promising direction (Jayaratne & Jayatilleke, 2020).
Conclusion
Although computer scientists have provided convergent evidence of validity for AVI-
PAs, other important psychometric properties such as reliability, discriminant relations, content,
nomological network, and generalizability were still largely unexplored. Our investigation
provides initial evidence regarding the psychometric properties of AVI-PAs. Critically, the
evidence for AVI-PAs trained on interviewer-reported traits generalized to new interviews,
providing initial evidence that they hold promise for use in applied settings.

66
References
Allport, G. W. (1937). Personality: A psychological interpretation. New York: Holt.
American Educational Research Association (AERA), American Psychological Association
(APA), & National Council on Measurement in Education (NCME). (2014). Standards for
educational and psychological testing. Washington, D.C.: American Educational Research
Association.
Arthur Jr, W., & Villado, A. J. (2008). The importance of distinguishing between constructs and
methods when comparing predictors in personnel selection research and practice. Journal of
Applied Psychology, 93(2), 435-442.
Attali, Y. (2013). Validity and reliability of automated essay scoring. In M. D. Shermis & J.
Burstein (Eds.), Handbook of automated essay evaluation: Current applications and new
directions (pp. 181-198). Taylor & Francis.
Baltrusaitis, T., Zadeh, A., Lim, Y. C., & Morency, L. P. (2018, May). Openface 2.0: Facial
behavior analysis toolkit. In 2018 13th IEEE International Conference on Automatic Face
& Gesture Recognition (FG 2018) (pp. 59-66). IEEE.
Barrett, L. F., Adolphs, R., Marsella, S., Martinez, A. M., & Pollak, S. D. (2019). Emotional
Expressions Reconsidered: Challenges to Inferring Emotion From Human Facial
Movements. Psychological Science in the Public Interest, 20(1), 1–68.
https://doi.org/10.1177/1529100619832930
Barrick, M. R., & Mount, M. K. (1991). The big five personality dimensions and job
performance: A meta-analysis. Personnel Psychology, 44(1), 1–26.
https://doi.org/10.1111/j.1744-6570.1991.tb00688.x
Barrick, M. R., Swider, B. W., & Stewart, G. L. (2010). Initial Evaluations in the Interview:
Relationships with Subsequent Interviewer Evaluations and Employment Offers. Journal of
Applied Psychology, 95(6), 1163–1172. https://doi.org/10.1037/a0019918
Bell, T. (2019, January 15). This bot judges how much you smile during your job interview.
https://www.fastcompany.com/90284772/this-bot-judges-how-much-you-smile-during-
your-job-interview
Biel, J.-I., Tsiminaki, V., Dines, J., & Gatica-Perez, D. (2013). Hi YouTube! Personality
impressions and verbal content in social video. In International Conference on Multimodal
Interaction (ICMI’13) (pp. 119–126). https://doi.org/10.1145/2522848.2522877
Blackman, M. C. (2002). Personality judgment and the utility of the unstructured employment
interview. Basic and Applied Social Psychology, 24(3), 241–250.
https://doi.org/10.1207/S15324834BASP2403_6
Bleidorn, W., & Hopwood, C. J. (2019). Using Machine Learning to Advance Personality
Assessment and Theory. Personality and Social Psychology Review, 23(2), 190–203.

67
https://doi.org/10.1177/1088868318772990
Bommer, W. H., Johnson, J. L., Rich, G. A., Podsakoff, P. M., & MacKenzie, S. B. (1995). On
the interchangeability of objective and subjective measures of employee performance: A
meta‐analysis. Personnel Psychology, 48(3), 587-605.
Bosch, N., & D'Mello, S. (2019). Automatic detection of mind wandering from video in the lab
and in the classroom. IEEE Transactions on Affective Computing.
https://doi.org/10.1109/TAFFC.2019.2908837
Bosco, F. A., Aguinis, H., Singh, K., Field, J. G., & Pierce, C. A. (2015). Correlational effect
size benchmarks. Journal of Applied Psychology, 100(2), 431–449.
https://doi.org/10.1037/a0038047
Bourdage, J. S., Roulin, N., & Tarraf, R. (2018). “I (might be) just that good”: Honest and
deceptive impression management in employment interviews. Personnel Psychology, (July
2016), 1–36. https://doi.org/10.1111/peps.12285
Breiman, L. (2001). Random forests. Machine Learning, 45(1), 5–32.
https://doi.org/10.1023/A:1010933404324
Brown, T. B., Mann, B., Ryder, N., Subbiah, M., Kaplan, J., Dhariwal, P., ... & Agarwal, S.
(2020). Language models are few-shot learners. arXiv preprint arXiv:2005.14165.
Buolamwini, J., & Gebru, T. (2018, January). Gender shades: Intersectional accuracy disparities
in commercial gender classification. In Conference on fairness, accountability and
transparency (pp. 77-91).
Campbell, D. T., & Fiske, D. (1959). Convergent and discriminant validation by the multitrait-
multimethod matrix. Psychological Bulletin, 59(2), 81–105. Retrieved from
http://www.ncbi.nlm.nih.gov/pubmed/19586159
Campion, M. A., Palmer, D. K., & Campion, J. E. (1997). A review of structure in the selection
interview. Personnel Psychology, 50(3), 655–702. https://doi.org/10.1111/j.1744-
6570.1997.tb00709.x
Campion, M. C., Campion, M. A., Campion, E. D., & Reider, M. H. (2016). Initial investigation
into computer scoring of candidate essays for personnel selection. Journal of Applied
Psychology, 101(7), 958–975. https://doi.org/10.1037/apl0000108
Chamorro-Premuzic, T., Akhtar, R., Winsborough, D., & Sherman, R. A. (2017). The
datafication of talent: how technology is advancing the science of human potential at work.
Current Opinion in Behavioral Sciences, 18, 13–16.
https://doi.org/10.1016/j.cobeha.2017.04.007
Chamorro-Premuzic, T., Winsborough, D., Sherman, R. A., & Hogan, R. (2016). New talent
signals: Shiny new objects or a brave new world? Industrial and Organizational
Psychology, 9(3), 621–640. https://doi.org/10.1017/iop.2016.6

68
Chapman, B. P., Weiss, A., & Duberstein, P. R. (2016). Statistical learning theory for high
dimensional prediction: Application to criterion-keyed scale development. Psychological
Methods, 21(4), 603–620. https://doi.org/10.1037/met0000088
Chapman, D. S., & Zweig, D. I. (2005). Developing a nomological network for interview
structure: Antecedents and consequences of the structured selection interview. Personnel
Psychology, 58(3), 673–702. https://doi.org/10.1111/j.1744-6570.2005.00516.x
Chen, L., Feng, G., Leong, C. W., Lehman, B., Martin-Raugh, M., Kell, H., … Yoon, S.-Y.
(2016). Automated scoring of interview videos using Doc2Vec multimodal feature
extraction paradigm. Proceedings of the 18th ACM International Conference on Multimodal
Interaction - ICMI 2016, 161–168. https://doi.org/10.1145/2993148.2993203
Chen, L., Zhao, R., Leong, C. W., Lehman, B., Feng, G., & Hoque, M. (2018). Automated video
interview judgment on a large-sized corpus collected online. 2017 7th International
Conference on Affective Computing and Intelligent Interaction, ACII 2017, 504–509.
https://doi.org/10.1109/ACII.2017.8273646
Christiansen, N. D., Wolcott-Burnam, S., Janovics, J. E., Burns, G. N., & Quirk, S. W. (2005).
The good judge revisited: Individual differences in the accuracy of personality judgments.
Human Performance, 18(2), 123-149.
Connelly, B. S., & Ones, D. S. (2010). An other perspective on personality: Meta-analytic
integration of observers’ accuracy and predictive validity. Psychological Bulletin, 136(6),
1092–1122. https://doi.org/10.1037/a0021212
Cortina, J. M., Goldstein, N. B., Payne, S. C., Davison, H. K., & Gilliland, S. W. (2000). The
incremental validity of interview scores over and above cognitive ability and
conscientiousness scores. Personnel Psychology, 53, 325–351.
Cronbach, L. J. (1990). Essentials of Psychological Testing (Fifth). New York: Harper & Row.
Cucina, J. M., Vasilopoulos, N. L., Su, C., Busciglio, H. H., Cozma, I., DeCostanza, A. H., …
Shaw, M. N. (2019). The Effects of Empirical Keying of Personality Measures on Faking
and Criterion-Related Validity. Journal of Business and Psychology, 34(3), 337–356.
https://doi.org/10.1007/s10869-018-9544-y
Cuddy, A. J. C., Wilmuth, C. A., Yap, A. J., & Carney, D. R. (2015). Preparatory power posing
affects nonverbal presence and job interview performance. Journal of Applied Psychology,
100(4), 1286–1295. https://doi.org/10.1037/a0038543
Dastin, J. (2018). Amazon scraps secret AI recruiting tool that showed bias against women.
Reuters, October 2018.
De Kock, F. S., Lievens, F., & Born, M. P. (2015). An in-depth look at dispositional reasoning
and interviewer accuracy. Human Performance, 28(3), 199-221.
DeGroot, T., & Gooty, J. (2009). Can nonverbal cues be used to make meaningful personality

69
attributions in employment interviews? Journal of Business and Psychology, 24(2), 179–
192. https://doi.org/10.1007/s10869-009-9098-0
DeGroot, T., & Kluemper, D. (2007). Evidence of predictive and incremental validity of
personality factors, vocal attractiveness and the situational interview. International Journal
of Selection and Assessment, 15(1), 30–39. https://doi.org/10.1111/j.1468-
2389.2007.00365.x
Devlin, J., Chang, M. W., Lee, K., & Toutanova, K. (2018). Bert: Pre-training of deep
bidirectional transformers for language understanding. arXiv preprint arXiv:1810.04805.
Ekman, P., & Friesen, W. V. (1978). Facial Action Coding System: A technique for the
measurement of facial action. Palo Alto, CA: Consulting Psychologists Press.
Electronic Privacy Information Center (EPIC). (2019). Complaint and request for investigation,
injunction, and other relief. https://www.washingtonpost.com/context/epic-s-ftc-complaint-
about-hirevue/9797b738-e36a-4b7a-8936-667cf8748907/
Eyben, F. (2014). Real-time speech and music classification by large audio feature space
extraction. https://doi.org/10.1007/978-3-319-27299-3
Eyben, F., Scherer, K. R., Schuller, B. W., Sundberg, J., Andre, E., Busso, C., … Truong, K. P.
(2016). The Geneva Minimalistic Acoustic Parameter Set (GeMAPS) for Voice Research
and Affective Computing. IEEE Transactions on Affective Computing, 7(2), 190–202.
https://doi.org/10.1109/TAFFC.2015.2457417
Feiler, A. R., & Powell, D. M. (2016). Behavioral Expression of Job Interview Anxiety. Journal
of Business and Psychology, 31(1), 155–171. https://doi.org/10.1007/s10869-015-9403-z
Feinerer, I., Hornik, K., & Meyer, D. (2008). Text mining infrastructure in R. Journal of
Statistical Software, 25(5), 1–54.
Funder, D. C. (1995). On the accuracy of personality judgment: A realistic approach.
Psychological Review, 102(4), 652–670.
Funder, D. C. (2012). Accurate Personality Judgment. Current Directions in Psychological
Science, 21(3), 177–182. https://doi.org/10.1177/0963721412445309
Funder, D. C., & West, S. G. (1993). Consensus, self‐other agreement, and accuracy in
personality judgment: An introduction. Journal of Personality, 61(4), 457–476.
https://doi.org/10.1111/j.1467-6494.1993.tb00778.x
Goldberg, L. R. (1992). The development of markers for the big-five factor structure.
Psychological Assessment, 4(1), 26–42.
Goldberg, L. R. (1999). A broad-bandwidth, public domain, personality inventory measuring the
lower-level facets of several five-factor models. Personality Psychology in Europe, 7(1), 7–
28.

70
Goodfellow, I. J., Shlens, J., & Szegedy, C. (2014). Explaining and harnessing adversarial
examples. ArXiv Preprint ArXiv:1412.6572.
Gosling, S. D., Rentfrow, P. J., & Swann Jr., W. B. (2003). A very brief measure of the Big-Five
personality domains. Journal of Research in Personality, 37(6), 504–528.
https://doi.org/10.1016/S0092-6566(03)00046-1
Hamdani, M. R., Valcea, S., & Buckley, M. R. (2014). The relentless pursuit of construct
validity in the design of employment interviews. Human Resource Management Review,
24(2), 160–176. https://doi.org/10.1016/j.hrmr.2013.07.002
Harris, K. D., Murray, P., & Warren, E. (2019). Letter to U.S. Equal Employment Opportunity
Commission regarding risks of facial recognition technology. Retrieved from
https://www.scribd.com/document/388920670/SenHarris-EEOC-Facial-Recognition-2
Harwell, D. (2019, November 6). A face-scanning algorithm increasingly decides whether you
deserve the job. https://www.washingtonpost.com/technology/2019/10/22/ai-hiring-face-
scanning-algorithm-increasingly-decides-whether-you-deserve-job/
Hickman, L., Saef, R., Ng, V., Tay, L., Woo, S. E., & Bosch, N. (2020). Developing and
evaluating language-based machine learning algorithms for inferring applicant personality
in video interviews. Manuscript submitted for publication.
Hickman, L., Tay, L., & Woo, S. E. (2019). Validity investigation of off-the-shelf language-
based personality assessment using video interviews: Convergent and discriminant
relationships with self and observer ratings. Personnel Assessment and Decisions, 5(3), 12-
20. https://doi.org/10.25035/pad.2019.03.003
Hickman, L., Thapa, S., Tay, L., Cao, M., & Srinivasan, P. (2020). Text preprocessing for text
mining in organizational research: Review and recommendations. Organizational Research
Methods, 1-33. https://doi.org/10.1177/1094428120971683
Hogan, R. T. (1991). Personality and personality measurement. In M. D. Dunnette & L. M.
Hough (Eds.), Handbook of Industrial and Organizational Psychology (Vol. 2) (2nd ed., pp.
873–919). Palo Alto, CA: Consulting Psychologists Press, Inc.
Huffcutt, A. I., Conway, J. M., Roth, P. L., & Stone, N. J. (2001). Identification and Meta-
Analytic Assessment of Psychological Constructs Measured in Employment Interviews.
Journal of Applied Psychology, 86(5), 897–913.
Huffcutt, A. I., Culbertson, S. S., & Weyhrauch, W. S. (2013). Employment interview reliability:
New meta-analytic estimates by structure and format. International Journal of Selection and
Assessment, 21(3), 264–276. https://doi.org/10.1111/ijsa.12036
Huffcutt, A. I., Van Iddekinge, C. H., & Roth, P. L. (2011). Understanding applicant behavior in
employment interviews: A theoretical model of interviewee performance. Human Resource
Management Review, 21(4), 353-367.

71
IBM. (2019). IBM Watson Speech to Text. Available at
https://www.ibm.com/watson/services/speech-to-text/
Ickes, W. (2016). Empathic accuracy: Judging thoughts and feelings. In J. A. Hall, M. Schmid
Mast, & T. V. West (Eds.), The social psychology of perceiving others accurately (pp. 52-
70). Cambridge University Press.
Jayaratne, M., & Jayatilleke, B. (2020). Predicting personality using answers to open-ended
interview questions. IEEE Access, 8, 115345-115355.
John, O. P., & Robins, R. W. (1993). Determinants of interjudge agreement on personality traits:
The Big Five domains, observability, evaluativeness, and the unique perspective of the
self. Journal of Personality, 61(4), 521-551.
Judge, T. A., & Zapata, C. P. (2015). The person-situation debate revisited: Effect of situation
strength and trait activation on the validity of the big five personality traits in predicting job
performance. Academy of Management Journal, 58(4), 1149–1179.
https://doi.org/10.5465/amj.2010.0837
Kenny, D. A. (1991). A general model of consensus and accuracy in interpersonal perception.
Psychological Review, 98(2), 155–163. https://doi.org/10.1037//0033-295x.98.2.155
Kenny, D. A. (2004). PERSON: A general model of interpersonal perception. Personality and
Social Psychology Review, 8(3), 265–280. https://doi.org/10.1207/s15327957pspr0803_3
Kim, H., Di Domenico, S. I., & Connelly, B. S. (2019). Self–other agreement in personality
reports: A meta-analytic comparison of self-and informant-report means. Psychological
Science, 30(1), 129-138.
Kristof-Brown, A., Barrick, M. R., & Franke, M. (2002). Applicant impression management:
Dispositional influences and consequences for recruiter perceptions of fit and similarity.
Journal of Management, 28(1), 27–46. https://doi.org/10.1016/S0149-2063(01)00131-3
Kuhn, M. (2008). Building predictive models in R using the caret package. Journal of Statistical
Software, 28(5), 1–26. https://doi.org/10.1053/j.sodo.2009.03.002
Kuncel, N. R., Credé, M., & Thomas, L. L. (2005). The validity of self-reported grade point
averages, class ranks, and test scores: A meta-analysis and review of the literature. Review
of Educational Research, 75(1), 63–82. https://doi.org/10.3102/00346543075001063
Kurita, K., Vyas, N., Pareek, A., Black, A. W., & Tsvetkov, Y. (2019). Measuring bias in
contextualized word representations. arXiv preprint arXiv:1906.07337.
Langer, M., König, C. J., & Papathanasiou, M. (2019). Highly automated job interviews:
Acceptance under the influence of stakes. International Journal of Selection and
Assessment, 27(3), 217-234.
Le, H., Schmidt, F. L., & Putka, D. J. (2009). The multifaceted nature of measurement artifacts
72
and its implications for estimating construct-level relationships. Organizational Research
Methods, 12(1), 165-200.
Lievens, F., Chasteen, C. S., Day, E. A., & Christiansen, N. D. (2006). Large-scale investigation
of the role of trait activation theory for understanding assessment center convergent and
discriminant validity. Journal of Applied Psychology, 91(2), 247–258.
https://doi.org/10.1037/0021-9010.91.2.247
Lin, J. (1991). Divergence measures based on the Shannon entropy. IEEE Transactions on
Information Theory, 37(1), 145–151.
Lord, F. M., & Novick, M. R. (1968). Statistical theories of mental test scores. Reading, MA:
Addison-Wesley.
Madera, J. M., & Hebl, M. R. (2012). Discrimination against facially stigmatized applicants in
interviews: An eye-tracking and face-to-face investigation. Journal of Applied Psychology,
97(2), 317–330. https://doi.org/10.1037/a0025799
McCrae, R. R., Kurtz, J. E., Yamagata, S., & Terracciano, A. (2011). Internal Consistency,
Retest Reliability, and their implications. Personality and Social Psychological Bulletin,
15(1), 28–50. https://doi.org/10.1177/1088868310366253.Internal
McGraw, K. O., & Wong, S. P. (1996). Forming inferences about some intraclass correlation
coefficients. Psychological Methods, 1(1), 30–46. https://doi.org/10.1037/1082-989X.1.1.30
Messick, S. (1989). Meaning and Values in Test Validation: The Science and Ethics of
Assessment. Educational Researcher, 18(2), 5–11.
https://doi.org/10.3102/0013189X018002005
Messinger, D. S., Fogel, A., & Dickson, K. (2001). All smiles are positive, but some smiles are
more positive than others. Developmental Psychology, 37(5), 642-653.
Mulfinger, E., Wu, F., Alexander, L., III, & Oswald, F. L. (2020, February). AI technologies in
talent management systems: It glitters but is it gold? Poster presented at Work in the 21st
Century: Automation, Workers, and Society, Houston, TX.
Mischel, W., & Shoda, Y. (1995). A cognitive-affective system theory of personality:
reconceptualizing situations, dispositions, dynamics, and invariance in personality
structure. Psychological Review, 102(2), 246-268.
Morgeson, F. P., Campion, M. A., Dipboye, R. L., Hollenbeck, J. R., Murphy, K., & Schmitt, N.
(2007). Reconsidering the use of personality tests in personnel selection contexts. Personnel
…, 60, 683–729. Retrieved from http://onlinelibrary.wiley.com/doi/10.1111/j.1744-
6570.2007.00089.x/full
Naim, I., Tanveer, I., Gildea, D., & Hoque, M. E. (2018). Automated Analysis and Prediction of
Job Interview Performance. IEEE Transactions on Affective Computing, 9(2), 191–204.
https://doi.org/10.1109/TAFFC.2016.2614299

73
Nguyen, L. S., Frauendorfer, D., Mast, M. S., & Gatica-Perez, D. (2014). Hire me:
Computational inference of hirability in employment interviews based on nonverbal
behavior. IEEE Transactions on Multimedia, 16(4), 1018–1031.
https://doi.org/10.1109/TMM.2014.2307169
Nguyen, L. S., & Gatica-Perez, D. (2016). Hirability in the Wild: Analysis of Online
Conversational Video Resumes. IEEE Transactions on Multimedia, 18(7), 1422–1437.
https://doi.org/10.1109/TMM.2016.2557058
Noftle, E. E., & Robins, R. W. (2007). Personality predictors of academic outcomes: Big five
correlates of GPA and SAT scores. Journal of Personality and Social Psychology, 93(1),
116–130. https://doi.org/10.1037/0022-3514.93.1.116
Ortner, T. M., & van de Vijver, F. J. R. (2015). Assessment beyond self-reports. In T. M. Ortner
& F. J. R. van de Vijver (Eds.), Behavior-based assessment in psychology: Going beyond
self-report in the personality, affective, motivation, and social domains (pp. 3–14). Hogrefe
Publishing.
Oswald, F. L., Behrend, T. S., Putka, D. J., & Sinar, E. (2020). Big Data in Industrial-
Organizational Psychology and Human Resource Management: Forward Progress for
Organizational Research and Practice. Annual Review of Organizational Psychology and
Organizational Behavior, 7(1). https://doi.org/10.1146/annurev-orgpsych-032117-104553
Park, G., Schwartz, H. A., Eichstaedt, J. C., Kern, M. L., Kosinski, M., Stillwell, D. J., …
Seligman, M. E. P. (2015). Automatic personality assessment through social media
language. Journal of Personality and Social Psychology, 108(6), 934–952.
https://doi.org/10.1037/pspp0000020
Pedregosa, F., Varoquaux, G., Gramfort, A., Michel, V., Thirion, B., Grisel, O., ... &
Vanderplas, J. (2011). Scikit-learn: Machine learning in Python. The Journal of Machine
Learning Research, 12, 2825-2830.
Peeters, H., & Lievens, F. (2006). Verbal and nonverbal impression management tactics in
behavior description and situational interviews. International Journal of Selection and
Assessment, 14(3), 206–222. https://doi.org/10.1111/j.1468-2389.2006.00348.x
Pennebaker, J. W., Boyd, R. L., Jordan, K., & Blackburn, K. (2015). The development and
psychometric properties of LIWC2015. University of Texas at Austin.
Ployhart, R. E., Schmitt, N., & Tippins, N. T. (2017). Solving the Supreme Problem: 100 Years
of selection and recruitment at the Journal of Applied Psychology. Journal of Applied
Psychology, 102(3), 291–304. https://doi.org/10.1037/apl0000081
Ponce-López, V., Chen, B., Oliu, M., Corneanu, C., Clapés, A., Guyon, I., … Escalera, S.
(2016). Chalearn LAP 2016: First round challenge on first impressions - Dataset and results.
Lecture Notes in Computer Science, 9915 LNCS(October), 400–418.
https://doi.org/10.1007/978-3-319-49409-8_32

74
Poropat, A. E. (2009). A meta-analysis of the five-factor model of personality and academic
performance. Psychological Bulletin, 135(2), 322–338. https://doi.org/10.1037/a0014996
Powell, D. M., & Bourdage, J. S. (2016). The detection of personality traits in employment
interviews: Can “good judges” be trained?. Personality and Individual Differences, 94, 194-
199.
Putka, D. J., Beatty, A. S., & Reeder, M. C. (2018). Modern Prediction Methods: New
Perspectives on a Common Problem. Organizational Research Methods, 21(3), 689–732.
https://doi.org/10.1177/1094428117697041
Raghavan, M., Barocas, S., Kleinberg, J., & Levy, K. (2020). Mitigating bias in algorithmic
employment screening: Evaluating claims and practices. In 2020 Conference on Fairness,
Accountability, and Transparency (FAT) (pp. 469–481).
https://doi.org/10.2139/ssrn.3408010
Raykov, T., Marcoulides, G. A., & Tong, B. (2016). Do two or more multicomponent
instruments measure the same construct? Testing construct congruence using latent variable
modeling. Educational and Psychological Measurement, 76(5), 873–884.
https://doi.org/10.1177/0013164415604705
Rotolo, C. T., Church, A. H., Adler, S., Smither, J. W., Colquitt, A. L., Shull, A. C., … Foster,
G. (2018). Putting an End to Bad Talent Management: A Call to Action for the Field of
Industrial and Organizational Psychology. Industrial and Organizational Psychology, 11(2),
176–219. https://doi.org/10.1017/iop.2018.6
Sajjadiani, S., Sojourner, A. J., Kammeyer-Mueller, J. D., & Mykerezi, E. (2019). Using
Machine Learning to Translate Applicant Work History Into Predictors of Performance and
Turnover. Journal of Applied Psychology. https://doi.org/10.1037/apl0000405
Schleicher, D. J., Van Iddekinge, C. H., Morgeson, F. P., & Campion, M. A. (2010). If at first
you don’t succeed, try, try again: Understanding race, age, and gender differences in
retesting score improvement. Journal of Applied Psychology, 95(4), 603–617.
https://doi.org/10.1037/a0018920
Shaffer, J. A., DeGeest, D., & Li, A. (2016). Tackling the problem of construct proliferation: A
guide to assessing the discriminant validity of conceptually related constructs.
Organizational Research Methods, 19(1), 80–110.
https://doi.org/10.1177/1094428115598239
Shaffer, J. A., & Postlethwaite, B. E. (2012). A matter of context: A meta-analytic investigation
of the relative validity of contextualized and noncontextualized personality measures.
Personnel Psychology, 65(3), 445–493. https://doi.org/10.1111/j.1744-6570.2012.01250.x
Simms, L. J. (2008). Classical and modern methods of psychological scale construction. Social
and Personality Psychology Compass, 2(1), 414–433. https://doi.org/10.1111/j.1751-
9004.2007.00044.x

75
Society for Industrial and Organizational Psychology (SIOP). (2018). Principles for the
Validation and Use of Personnel Selection Procedures (Fifth). American Psychological
Association. https://doi.org/10.1017/iop.2018.195
Speer, A. B. (2018). Quantifying with words: An investigation of the validity of narrative-
derived performance scores. Personnel Psychology, 71(3), 299–333.
https://doi.org/10.1111/peps.12263
Stauffer, J. M., & Buckley, M. R. (2005). The Existence and Nature of Racial Bias in
Supervisory Ratings. Journal of Applied Psychology, 90(3), 586–591.
https://doi.org/10.1037/0021-9010.90.3.586
Swider, B. W., Barrick, M. R., & Brad Harris, T. (2016). Initial impressions: What they are,
what they are not, and how they influence structured interview outcomes. Journal of
Applied Psychology, 101(5), 625–638. https://doi.org/10.1037/apl0000077
Swider, B. W., Barrick, M. R., Harris, T. B., & Stoverink, A. C. (2011). Managing and creating
an image in the interview: The role of interviewee initial impressions. Journal of Applied
Psychology, 96(6), 1275–1288. https://doi.org/10.1037/a0024005
Tay, L., Woo, S. E., Hickman, L., & Saef, R. (2020). Psychometric and validity issues in
machine learning approaches to personality assessment: A focus on social media text
mining. European Journal of Personality, 1-19. https://doi.org/10.1002/per.2290
Tellegen, A. (1991). Personality traits: Issues of definition, evidence, and assessment. In
Thinking clearly about psychology: Essays in honor of Paul E. Meehl, Vol. 1: Matters of
public interest (pp. 10–35). Minneapolis: University of Minnesota Press.
Tett, R. P., & Burnett, D. D. (2003). A personality trait-based interactionist model of job
performance. The Journal of Applied Psychology, 88(3), 500–517.
https://doi.org/10.1037/0021-9010.88.3.500
Tett, R. P., & Guterman, H. A. (2000). Situation trait relevance, trait expression, and cross-
situational consistency: Testing a principle of trait activation. Journal of Research in
Personality, 34(4), 397–423. https://doi.org/10.1006/jrpe.2000.2292
Van Iddekinge, C. H., Raymark, P. H., & Roth, P. L. (2005). Assessing personality with a
structured employment interview: Construct-related validity and susceptibility to response
inflation. Journal of Applied Psychology, 90(3), 536–552. https://doi.org/10.1037/0021-
9010.90.3.536
Vazire, S. (2010). Who knows what about a person? The self-other knowledge asymmetry
(SOKA) model. Journal of Personality and Social Psychology, 98(2), 281–300.
https://doi.org/10.1037/a0017908
Woehr, D. J., Putka, D. J., & Bowler, M. C. (2012). An examination of g-theory methods for
modeling multitrait-multimethod data: Clarifying links to construct validity and
confirmatory factor analysis. Organizational Research Methods, 15(1), 134–161.

76
https://doi.org/10.1177/1094428111408616
Woo, S. E., Jin, J., & LeBreton, J. M. (2015). Specificity Matters: Criterion-Related Validity of
Contextualized and Facet Measures of Conscientiousness in Predicting College Student
Performance. Journal of Personality Assessment, 0(0), 1–9.
https://doi.org/10.1080/00223891.2014.1002134
Wood, D., Harms, P., & Vazire, S. (2010). Perceiver effects as projective tests: What your
perceptions of others say about you. Journal of Personality and Social Psychology, 99(1),
174–190. https://doi.org/10.1037/a0019390
Zou, H., & Hastie, T. (2005). Regularization and variable selection via the elastic net. Journal of
the Royal Statistical Society. Series B: Statistical Methodology, 67(2), 301–320.
https://doi.org/10.1111/j.1467-9868.2005.00527.x

77
Appendices
Table A1
Within-sample 10-fold cross-validated convergence
Sample 1 Sample 2 Sample
3
r ρ r Ρ r ρ �̅�
Self-reports
Extraversion .09 .09 .30 .32 .01 .01 .13
Agreeableness -.08 -.09 .25 .27 .16 .18 .11
Conscientiousness -.05 -.05 .05 .06 .02 .02 .01
Emotional Stability .28 .29 .05 .05 .31 .33 .21
Openness .05 .05 -.11 -.13 .25 .29 .06
Interviewer-reports
Extraversion .65 .75 .65 .69 .65 .74 .65
Agreeableness .41 .48 .44 .56 .17 .22 .34
Conscientiousness .41 .46 .41 .53 .43 .53 .42
Emotional Stability .32 .40 .24 .32 .25 .35 .27
Openness .27 .33 .37 .44 .41 .59 .35
Note. r = mean observed correlation between predicted and actual traits averaged across the 10 folds. ρ =
mean observed correlation corrected for unreliability (using Cronbach’s alpha for self-reports and
interrater reliability for interviewer-reports).

78
Table A2
Cross-sample convergence
Sample 1
Models
Sample 2
Models
Sample 3
Models
𝑟 𝑟 𝑟 �̅�
Self-reports
Extraversion .07 .10 .04 .07
Agreeableness .08 .10 .09 .09
Conscientiousness .01 .06 .06 .04
Emotional Stability .04 .14 .13 .10
Openness .13 .04 .04 .07
Interviewer-reports
Extraversion .64 .65 .63 .64
Agreeableness .28 .28 .22 .26
Conscientiousness .34 .52 .45 .44
Emotional Stability .18 .24 .22 .21
Openness .24 .35 .27 .29
Note: 𝑟 = the sample size weighted mean observed correlation between cross-sample predictions and
reported traits. �̅� = mean observed correlation across the six cross-sample predictions and reported traits.

79
Table A3
Multitrait-multimethod matrix of Sample 1 AVI-PA scores and interviewer-reported traits in
Samples 2 & 3
1 2 3 4 5 6 7 8 9 10
AVI-based
1. Extraversion – .26 .21 .28 .17 .64 .19 .28 .19 .30
2. Agreeableness .26 – .10 .14 .09 .25 .32 .17 .12 .07
3. Conscientiousness .34 .14 – .25 .11 .17 .04 .32 .14 .13
4. Emotional stability .27 .09 .40 – .02 .21 .04 .21 .13 .11
5. Openness .21 .13 .25 .10 – .14 .16 .09 .06 .22
Interviewer-reports
6. Extraversion .63 .25 .38 .24 .27 – .29 .29 .40 .43
7. Agreeableness .21 .24 .14 .12 .12 .30 – .14 .24 .17
8. Conscientiousness .28 .11 .37 .31 .11 .27 .34 – .35 .38
9. Emotional stability -.12 .07 -.21 .24 .07 .20 .42 .45 – .36
10. Openness .30 .19 .17 .13 .26 .45 .34 .41 .20 –
Note: AVI-based = automated video interview personality assessments. Sample 2 correlations are
above the diagonal, and Sample 3 correlations are below the diagonal. Convergent correlations
are in bold.
Table A4
Multitrait-multimethod matrix of Sample 2 AVI-PA scores and interviewer-reported personality
in Samples 1 & 3
1 2 3 4 5 6 7 8 9 10
AVI-based
1. Extraversion – .24 .51 .42 .55 .64 .12 .18 .19 .14
2. Agreeableness .11 – .06 .14 .07 .26 .28 -.01 .00 .01
3. Conscientiousness .61 .10 – .40 .49 .35 .17 .50 .33 .22
4. Emotional stability .37 .16 .53 – .39 .26 .08 .21 .21 .15
5. Openness .61 -.06 .52 .23 – .35 .12 .25 .15 .35
Interviewer-reports
6. Extraversion .66 .19 .54 .37 .45 – .21 .21 .28 .26
7. Agreeableness .15 .28 .30 .16 .13 .30 – .34 .33 .25
8. Conscientiousness .26 .03 .54 .32 .36 .27 .34 – .44 .19
9. Emotional stability .10 .00 .29 .28 .12 .20 .42 .45 – .11
10. Openness .30 .14 .36 .16 .34 .45 .34 .41 .20 –
Note: AVI-based = automated video interview personality assessments. Sample 1 correlations are
above the diagonal, and Sample 3 correlations are below the diagonal. Convergent correlations
are in bold.

80
Table A5
Multitrait-multimethod matrix of Sample 3 AVI-PA scores and interviewer-reported personality
in Samples 1 & 2
1 2 3 4 5 6 7 8 9 10
AVI-based
1. Extraversion – .48 .56 .14 .62 .59 .13 .28 .22 .16
2. Agreeableness .40 – .52 .17 .50 .34 .26 .28 .26 .07
3. Conscientiousness .58 .40 – .31 .61 .29 .16 .43 .31 .19
4. Emotional stability .15 .12 .34 – .10 .12 .06 .19 .26 .22
5. Openness .68 .44 .56 .08 – .42 .22 .31 .27 .23
Interviewer-reports
6. Extraversion .65 .25 .37 .10 .46 – .21 .21 .28 .26
7. Agreeableness .17 .18 .10 -.12 .15 .29 – .34 .33 .25
8. Conscientiousness .26 .19 .46 .18 .32 .29 .14 – .44 .19
9. Emotional stability .22 .12 .27 .20 .17 .40 .24 .35 – .11
10. Openness .29 .07 .25 .07 .30 .43 .17 .38 .36 –
Note: AVI-based = automated video interview personality assessments. Sample 1 correlations are
above the diagonal, and Sample 2 correlations are below the diagonal. Convergent correlations
are in bold.

81
Online Supplement: Nested cross-validation code
#custom caret scoring function that allows Pearson or Spearman correlations
to be used to identify optimal hyperparameters
metric_r <- function(trainobj, lev=NULL, model=NULL)
{
isNA <- is.na(trainobj$pred)
trainobj$pred <- trainobj$pred[!isNA]
trainobj$obs <- trainobj$obs[!isNA]
pearson <- cor(trainobj$pred, trainobj$obs, use="pairwise.complete.obs")
spearman <- cor(trainobj$pred, trainobj$obs, use="pairwise.complete.obs",
method="spearman")
out <- c(pearson, spearman)
names(out) <- c("pearson_r", "spearman_r")
return(out)
}
nested_kfold_fun <- function(y, x, outer_folds, num_outer_folds, glmgrid,
inner_folds){
#takes as input: matrix-like y, matrix-like x, pre-specified outer folds,
number of outer folds, hyperparameter grid for elastic net, and number of
inner folds
#create lists for storing y-yhat correlations and predicted values in outer
folds
accuracies <- vector("list", num_outer_folds)
preds <- vector("list", num_outer_folds)
obs <- vector("list", num_outer_folds)
library(caret)
library(glmnet)
#for each resampling iteration do
for(i in 1:num_outer_folds){
#create outer fold train and test sets
train_x <- x[outer_folds[[i]],]
train_y <- y[outer_folds[[i]],]
test_x <- x[-outer_folds[[i]],]
test_y <- y[-outer_folds[[i]],]
train.control <- trainControl(method="cv", number=inner_folds,
verboseIter=F, summaryFunction=metric_r)
#fit the model on the remainder
mod <- train(x=train_x, y=train_y, method="glmnet",
trControl=train.control, tuneGrid=glmgrid, metric="pearson_r")
#predict the holdout sample
yhat <- predict(mod, newdata=test_x)
#correlate the predictions with observations
accuracy <- cor(yhat, test_y)
#store the predictions
preds[[i]] <- yhat
#store the observed values
obs[[i]] <- test_y
#store the correlations between y and yhat
accuracies[[i]] <- accuracy
}
#calculate the average performance across hold-out predictions
avg_accuracy = mean(accuracies)
fold_cors <- accuracies

82
#outputs an object that contains: 1) the correlation between predicted and
observed values for each outer fold, 2) the average accuracy across the outer
folds, 3) the predicted values of y, and 4) the observed values of y
out <- c("fold validation correlations", fold_cors, "avg accuracy",
avg_accuracy, "predicted values", preds, "observed values", obs)
return(out)
}
#create pre-defined outer folds
set.seed(1218)
dataindex <- createFolds(data$y, k=10, returnTrain=T)
#create glm grid
library(caret)
glmelnetGrid <- expand.grid(alpha = c(.1, .2, .3, .4, .5, .6, .7, .8, .9, 1),
#lambda values are drawn from what caret’s glmnet
automatically uses
lambda = c(.01593, .024214, .0368, .055938,
.08502, .12922, .196408,
.29852, .4537, .689626))
#example use of the nested k-fold function, where x = list of predictor
variables in data
nestedresults_y <- nested_kfold_fun(data$y, data[,x], dataindex, 10,
glmelnetGrid, 10)