On the criterion and incremental validity of trait emotional intelligence
Upload
independentCategory
view
6download
0
Uncor
recte
d Pr
oof
1
2
3
4
5
6
7
8
9
10
11
12
13
14
15
16
17
18
19
20
21
22
23
24
25
26
27
28
29
30
31
32
33
34
35
36
37
38
39
40
41
42
43
44
45
46
47
48
49
50
51
52
53
54
55
56
57
58
59
60
61
62
63
64
65
66
67
European Journal of Personality
Eur. J. Pers. 19: 1–15 (2005)
Published online in Wiley InterScience (www.interscience.wiley.com). DOI: 10.1002/per.565
Incremental Validity of the Structured Interview for theFive Factor Model of Personality (SIFFM)
STEPHANIE D. STEPP, TIMOTHY J. TRULL*, RACHEL M. BURR,MIMI WOLFENSTEIN and ANGELA Z. VIETH
University of Missouri—Columbia, USA
Abstract
This study examined the incremental validity of the Structured Interview for the Five-
Factor Model (SIFFM; Trull & Widiger, 1997) scores in the prediction of borderline,
antisocial, and histrionic personality disorder symptoms above and beyond variance
accounted for by scores from the Schedule for Nonadaptive and Adaptive Personality
(SNAP; Clark, 1993), a self-report questionnaire that includes items relevant to both
normal (i.e. Big Three) and abnormal personality traits. Approximately 200 participants
(52 clinical outpatients, and 149 nonclinical individuals from a borderline-features-
enriched sample) completed the SIFFM, the SNAP, and select sections of the Personality
Disorder Interview—IV (PDI-IV; Widiger, Mangine, Corbitt, Ellis, & Thomas, 1995). We
found support for the incremental validity of SIFFM scores, further indicating the clinical
utility of this instrument. However, results also supported the incremental validity of SNAP
scores in many cases. We discuss the implications of the findings in terms of dimensional
approaches to personality disorder assessment. Copyright # 2005 John Wiley & Sons, Ltd.
INTRODUCTION
Since the introduction of the personality disorder section in the DSM-III (APA, 1980),
researchers have attempted to devise measures for the reliable and valid assessment of
these conditions (see Zimmerman, 1994). The majority of personality disorder measures
are questionnaires and interviews that operationalize the DSM-IV criteria and provide cut-
offs to identify the presence or absence of a diagnosis. However, the categorical model of
personality disorder embodied in the versions of the diagnostic manual starting with DSM-
III has been subject to a number of criticisms (Clark, 1999; Trull & Durrett, in pressQ1).
Over the years, various individuals have advocated the adoption of a dimensional
Received 7 January 2005
Copyright # 2005 John Wiley & Sons, Ltd. Accepted 30 March 2005
*Correspondence to: Timothy J. Trull, 210 McAlester Hall, Department of Psychology, University of Missouri,Columbia, MO 65211, USA. E-mail [email protected]
Contract/grant sponsor: National Institute of Mental Health; contract/grant number: MH52695.
Q1
Uncor
recte
d Pr
oof
1
2
3
4
5
6
7
8
9
10
11
12
13
14
15
16
17
18
19
20
21
22
23
24
25
26
27
28
29
30
31
32
33
34
35
36
37
38
39
40
41
42
43
44
45
46
47
48
49
50
51
52
53
54
55
56
57
58
59
60
61
62
63
64
65
66
67
classification for personality disorders (Frances, 1982; Widiger, 1993; Widiger & Frances,
1994). Several personality researchers (e.g. McCrae, 1994; Trull & Widiger, 1997;
Widiger, 1993) have suggested that the Five-Factor Model of personality (FFM) may be
particularly attractive as an alternative dimensional classification of Axis II disorders. The
five higher-order factors or domains of the FFM include Neuroticism, Extraversion,
Openness to Experience, Agreeableness, and Conscientiousness, and each one of these
higher-order traits includes first-order personality trait facets. A substantial literature has
begun to accrue on the relationship between various personality disorders and the domains
and facets of the FFM (e.g. Widiger & Costa, 2002). Overall, this literature suggests that
the FFM may be a valuable tool for the dimensional characterization of Axis II disorders.
One potential limitation of most instruments that assess the FFM is that they tend to
focus on ‘normal’ variations of these traits. To address this and other concerns, the
Structured Interview for the Five-Factor Model (SIFFM; Trull & Widiger, 1997, 2002)
was developed. The SIFFM is an alternative measure of the FFM, one that may have
several advantages over the paper-and-pencil measures of the FFM. First, due to its semi-
structured interview format, data obtained via the SIFFM may have greater validity than
the data typically obtained through questionnaires. This is because it is possible to ask
additional probes, clarify answers, and ask for specific examples of each trait. Second, and
most relevant to the present study, the SIFFM was developed to tap maladaptive aspects of
each FFM trait. Therefore, its scores may be more relevant to personality pathology.
Finally, SIFFM scores not only indicate the level of a trait, but also suggest degrees of
dysfunction. This provides more information as to the clinical significance of the
maladaptive trait.
Although many personality researchers acknowledge that the FFM shows promise for
personality disorder diagnosis, other investigators have advocated alternative personality
models for the dimensional diagnosis of personality disorder. For example, a Big Three
model of personality (three higher-order factors of positive emotionality, negative
emotionality, and constraint) has been cited as a dimensional model that might aid in the
definition and measurement of personality pathology and disorder (see e.g. DiLalla,
Gottesman, Carey, & Volger, 1993).
Building on the conceptual personality framework of Tellegen and Waller (in pressQ1),
which focuses on these higher-order personality dimensions, Clark (1993) developed a
questionnaire to assess a Big Three model of personality as well as other maladaptive
personality traits: the Schedule for Nonadaptive and Adaptive Personality (SNAP; Clark,
1993). Although conceptually similar to other Big Three measures, Clark (1993) labelled
the three higher-order dimensions of the SNAP Negative Temperament (NT), Positive
Temperament (PT), and Disinhibition (DIS; versus Constraint). It is important to note that
researchers have found a strong relationship between Eysenck’s Super Three model and
the Big Three model of personality of Tellegen, Waller, and Clark (Markon, Krueger, &
Watson, 2005).
There have been relatively few studies published that have directly examined the
relations between SNAP scores and the DSM-IV personality disorders. The reason for this
probably stems from the fact that many of the SNAP items are ‘criterial’ in nature (Clark &
Livesley, 2002); items were generated from the DSM criteria for personality disorders. In
fact, there are supplemental scales that can be calculated from the SNAP that represent
each of the DSM personality disorders. Therefore, assessing the concordance between
SNAP scores and the DSM personality disorders has not been a primary focus of SNAP
research.
Q1
2 S. D. Stepp et al.
Copyright # 2005 John Wiley & Sons, Ltd. Eur. J. Pers. 19: 1–15 (2005)

Uncor
recte
d Pr
oof
1
2
3
4
5
6
7
8
9
10
11
12
13
14
15
16
17
18
19
20
21
22
23
24
25
26
27
28
29
30
31
32
33
34
35
36
37
38
39
40
41
42
43
44
45
46
47
48
49
50
51
52
53
54
55
56
57
58
59
60
61
62
63
64
65
66
67
Nevertheless, Clark (1993) has presented hypotheses regarding SNAP scale correlates
of the DSM personality disorders. Existing evidence supports these propositions and
suggest that the SNAP may be particularly adept (versus general personality measures) at
tapping into maladaptive variants of personality traits that are characteristic of the DSM
personality disorders (see e.g. Reynolds & Clark, 2001).
Just as each personality disorder is characterized by certain criteria in the DSM-IV
(APA, 1994), each disorder can also be associated with a trait profile from the perspective
of both the FFM and Big Three models of personality. The current study compares the
ability of the FFM scores to predict borderline (BPD), antisocial (APD), and histrionic
(HPD) personality disorder pathology above and beyond SNAP scores, which represent
both normal and abnormal personality traits. In this way, the relevance of the FFM and Big
Three model of personality to select personality disorders can be compared, and, in
addition, the relative relevance of select SIFFM and SNAP trait scores that target these
disorders can be evaluated. Although several sets of predictions exist regarding asso-
ciations between the FFM trait profiles and personality disorders (Lynam & Widiger,
2001; Trull & Widiger, 1997, 2002; Widiger, Trull, Clarkin, Sanderson, & Costa, 1994,
2002), the present study’s predictions are based on the hypotheses offered by Trull and
Widiger (1997, 2002).
Personality trait and personality disorder relations
From the perspective of the FFM (Trull & Widiger, 1997), borderline personality disorder
(BPD) is predicted to be highly positively related to Neuroticism scores, including the five
facets of Anxiety, Hostility, Depression, Impulsivity, and Vulnerability. BPD is also
believed to be positively related to the Extraversion facets of Warmth, Assertiveness, and
Gregariousness as well as the Openness facets of Fantasy and Feelings. On the other hand,
BPD appears to be negatively related to Agreeableness scores, including the Trust,
Compliance, and Straightforwardness facet scores, as well as negatively related to the
Conscientiousness facets of Achievement Striving and Deliberation. Regarding the SNAP
model of personality, BPD is believed to be significantly related to the higher-order trait of
Negative Temperament (NT; Clark 1993). In addition, BPD is predicted to be positively
correlated with Aggression, Self-Harm, and Impulsivity (Clark, 1993).1
Antisocial personality disorder (APD) appears to be negatively related to the FFM
dimensions of Agreeableness and Conscientiousness (Trull & Widiger, 1997). APD scores
are believed to be negatively related to all facets of Agreeableness: Trust, Straightfor-
wardness, Altruism, Compliance, Modesty, and Tender-Mindedness. Negative relations
are also predicted between APD scores and the Conscientiousness facets Order,
Dutifulness, Achievement-Striving, Self-Discipline, and Deliberation (Trull & Widiger,
1997). These relations are consistent with the conceptualization of APD as oppositional,
dishonest, cruel, and manipulative (Trull & Widiger, 1997; Widiger & Costa, 2002). APD
scores are predicted to be positively related to the Neuroticism facets Hostility and
Impulsiveness. However, APD is expected to be negatively related to the Neuroticism
facets Anxiety, Depression, Self-Consciousness, and Vulnerability. Finally, APD is also
expected to be positively related to the Excitement-Seeking facet of Extraversion (Trull &
Widiger, 1997; Widiger & Costa, 2002). From the perspective of the SNAP, a positive
relationship between APD scores and the higher-order SNAP factor Disinhibition as well
1It is important to note that the SNAP items from the higher-order temperament scales (NT, PT, DIS) do notoverlap with those from the 12 lower-order trait scales.
Incremental validity of the SIFFM 3
Copyright # 2005 John Wiley & Sons, Ltd. Eur. J. Pers. 19: 1–15 (2005)

Uncor
recte
d Pr
oof
1
2
3
4
5
6
7
8
9
10
11
12
13
14
15
16
17
18
19
20
21
22
23
24
25
26
27
28
29
30
31
32
33
34
35
36
37
38
39
40
41
42
43
44
45
46
47
48
49
50
51
52
53
54
55
56
57
58
59
60
61
62
63
64
65
66
67
as positive relations between APD and scores on Manipulativeness, Aggression,
Entitlement, and Impulsivity are expected (Clark, 1993).
Histrionic personality disorder (HPD) appears to be a manifestation of extreme
Extraversion within the FFM (Trull & Widiger, 1997; Widiger & Costa, 2002). HPD is
characterized by the Extraversion facets of high Warmth, Gregariousness, extreme
Activity, being prone to Excitement-Seeking, and an elevated score on Positive Emotions.
HPD is also related to Agreeableness, correlating negatively with the facets of
Straightforwardness and Altruism (Trull & Widiger, 1997; Widiger & Costa, 2002), but
correlating positively with the facet Trust and Tender-Mindedness. Individuals with HPD
may also score high on the facets Fantasy, Feelings, and Actions, but low on Openness to
Ideas. Those with HPD are expected to also be low in Self-Discipline and Deliberation.
Finally, individuals with HPD may also have elevations on the Neuroticism facets
Hostility, Self-Consciousness, and Vulnerability (Trull & Widiger, 1997; Widiger &
Costa, 2002). According to Clark (1993), HPD is related to SNAP Positive Temperament,
and exhibits positive relations with the scales Exhibitionism and Entitlement. Finally, HPD
also appears to be positively associated with SNAP Impulsivity.
The current study compares and contrasts the variance accounted for by the FFM and
the SNAP model of personality and personality pathology in predicting borderline,
antisocial, and histrionic personality pathology. Table 1 presents the predicted relations
between each of the three personality disorders and respective lower-order scales from
the SIFFM and from the SNAP. In order to compare the predictive ability of the FFM and
the SNAP model of personality, we conducted two sets of analyses. First, we compared the
ability of five SIFFM domain scores to predict borderline, antisocial, and histrionic
personality pathology with the ability of the three temperament scores from the SNAP (i.e.
Big Three) in a combined sample of clinical outpatients and nonclinical participants.
Second, we examined the ability of select SIFFM facets scores to predict borderline,
antisocial, and histrionic personality pathology above and beyond that of the relevant
scores from the SNAP that target these disorders.
METHOD
Sampling procedure
Nonclinical sample
This sample was first described in a dissertation study (Vieth, 2000) that focused on an
alternative personality measure (Tellegen’s Multidimensional Personality Questionnaire)
that is not the focus of the present study. Nonclinical participants were screened from a
total pool of 1772 incoming, 18-year-old freshmen participating in mass testing
procedures during the academic year. In return for their participation, students received
credit toward their introductory psychology course or $5 per hour. Participants provided
their written consent to participate in a brief assessment of personality features. In
addition, individuals completed demographic information which included contact infor-
mation. The screening battery included items from the Personality Assessment
Inventory—Borderline features (PAI-BOR; Morey, 1991). The PAI-BOR is a 24-item
measure that assesses four features of BPD: Affective Instability, Identity Problems,
Negative Relationships, and Self-Harm. This measure has demonstrated reliability and
validity (see e.g. Morey, 1991; Trull, 1995). The screening battery also included validity
4 S. D. Stepp et al.
Copyright # 2005 John Wiley & Sons, Ltd. Eur. J. Pers. 19: 1–15 (2005)

Uncor
recte
d Pr
oof
1
2
3
4
5
6
7
8
9
10
11
12
13
14
15
16
17
18
19
20
21
22
23
24
25
26
27
28
29
30
31
32
33
34
35
36
37
38
39
40
41
42
43
44
45
46
47
48
49
50
51
52
53
54
55
56
57
58
59
60
61
62
63
64
65
66
67
items from the Personality Diagnostic Questionnaire—Revised (PDQ-R; Hyler & Rieder,
1987) to assess the veracity of the responses by identifying individuals who tended to
present themselves in an overly favorable light (Too Good subscale) or who responded in a
haphazard way (Suspect Questionnaire scale).
From the screening pool, individuals who scored above threshold on the PAI-BOR (i.e.
�38, or two or more standard deviations above the mean of the community standardization
sample) and those who scored below threshold (<38) were identified. Researchers have
reported that a score above threshold is indicative of clinically significant borderline
features (Morey, 1991; Trull, 1995). From the lists of above- and below-threshold scorers,
individuals were randomly selected to be contacted regarding the laboratory phase of the
study. An effort was made to over-sample the above-threshold individuals, and to sample
an approximately even number of men and women from each threshold group. When a
person agreed to participate in the laboratory phase, she/he was required to first complete
the PAI-BOR a second time to ensure that the individual scored in the same range (either
above or below threshold) at retest. The purpose of this procedure was to ensure that the
Table 1. Predicted associations between borderline, antisocial, and histrionic personality disordersand selected SIFFM and SNAP scales
SIFFM scales SNAP scales
Borderline Anxiety, Hostility, Depression, Negative Temperament,Impulsivity, Vulnerability, Aggression, Self-Harm,Warmth, Gregariousness, ImpulsivityAssertiveness, Fantasy, Feelings,Trust (Low),Straightforwardness (Low),Compliance (Low),Achievement Striving (Low),Deliberation (Low)
Antisocial Anxiety (Low), Hostility, Manipulativeness,Depression (Low), Aggression, Entitlement,Self-Consciousness (Low), Disinhibition, ImpulsivityImpulsivity, Vulnerability (Low),Excitement Seeking, Trust (Low),Straightforwardness (Low),Altruism (Low),Compliance (Low), Modesty (Low),Tender-Mindedness (Low),Order (Low), Dutifulness (Low),Achievement-Striving (Low),Self-Discipline (Low),Deliberation (Low)
Histrionic Hostility, Self-Consciousness, Positive Temperament,Vulnerability, Warmth, Exhibitionism, Entitlement,Gregariousness, Activity, ImpulsivityExcitement-Seeking,Positive Emotions, Fantasy,Feelings, Actions, Ideas (Low),Trust, Straightforwardness (Low),Altruism (Low),Tender-Mindedness,Self-Discipline (Low),Deliberation (Low)
Incremental validity of the SIFFM 5
Copyright # 2005 John Wiley & Sons, Ltd. Eur. J. Pers. 19: 1–15 (2005)

Uncor
recte
d Pr
oof
1
2
3
4
5
6
7
8
9
10
11
12
13
14
15
16
17
18
19
20
21
22
23
24
25
26
27
28
29
30
31
32
33
34
35
36
37
38
39
40
41
42
43
44
45
46
47
48
49
50
51
52
53
54
55
56
57
58
59
60
61
62
63
64
65
66
67
participants were not exhibiting statelike score elevations on the PAI-BOR because the
features of BPD are reputed to be traitlike. Participants scoring above threshold on both
administrations of the PAI-BOR were designated as Bþ, and those scoring below threshold
on both administrations were designated as B�. Project personnel who interviewed
participants were unaware of their borderline feature status. Of the 93 participants scoring
above threshold, 44 were male and 49 were female. Of the 57 individuals scoring below
threshold, 31 were male and 26 were female. The ages of the participants ranged from 17
to 23 (M¼ 18.41, SD¼ 0.75). The sample was predominately white (82.0%) and never
married (94.0%). Complete data were available for a total of 149 individuals.
Clinical sample
These participants were recruited from community mental health clinics and a university
clinic in a medium-sized US midwestern town. Recruitment techniques included placing
advertisements in local periodicals, leaving flyers in waiting rooms, and posting notices.
Exclusionary criteria included chronic substance abuse, brain injury, or psychotic disorder.
In order to screen for these criteria and to ensure that participants were in psychiatric
treatment, participants were asked to sign a release allowing the researchers to request
information concerning treatment history from the participants’ mental health profes-
sionals. Information about treatment history was obtained for 83% of this sample.
The final clinical sample included 52 participants (12 males and 40 females). The mean
age was 36 years, ranging from 18 to 74. Participants had been in outpatient treatment for a
mean of 50.63 months (SD¼ 64.57). Of these participants, 22 reported having had a
previous psychiatric hospitalization (17 women and five men). The mean number of
psychiatric hospitalizations was 4.55 (SD¼ 7.01). Thirty-five participants were on
psychiatric medications (24 women and 11 men) at the time of the assessment.
Measures
All participants provided written consent, which outlined the requirements, risks, and
limits of confidentiality. In addition, the consent form allowed for the interviews to be
audiotaped for reliability purposes. The laboratory session required approximately 3 hours
and involved the completion of several self-report questionnaires and the administration of
two interviews. Participants were paid $10 per hour or were offered, in the case of
nonclincal participants, credit toward their introductory psychology class. Approximately
half of the participants were interviewed before completing the self-report questionnaires,
and the other half completed self-report measures first.
Training
Before the project began, interviewers were trained extensively by the second author (Tim
Trull), ensuring standardization in administration and scoring. In addition, he closely
supervised the interviews and met regularly with the interviewers to discuss any questions
they had about administering the SIFFM or the PDI-IV. Over the duration of the study, the
protocols of approximately one-quarter of the participants receiving each interview
administered (38 SIFFMs and 36 PDI-IVs) were selected in order to assess inter-rater
reliability. In each case, one trained interviewer reviewed (via audiotape) and
independently rated an interview conducted by another interviewer.
Personality disorder features
Three sections of a semi-structured interview, the Personality Disorder Interview-IV
(PDI-IV; Widiger et al., 1995) were administered to both samples to evaluate features of
6 S. D. Stepp et al.
Copyright # 2005 John Wiley & Sons, Ltd. Eur. J. Pers. 19: 1–15 (2005)
Uncor
recte
d Pr
oof
1
2
3
4
5
6
7
8
9
10
11
12
13
14
15
16
17
18
19
20
21
22
23
24
25
26
27
28
29
30
31
32
33
34
35
36
37
38
39
40
41
42
43
44
45
46
47
48
49
50
51
52
53
54
55
56
57
58
59
60
61
62
63
64
65
66
67
borderline (BPD), antisocial (APD), and histrionic (HPD) personality disorders based on
DSM-IV criteria. Most PDI-IV questions are in ‘yes/no’ format, and even though follow-up
questions are provided for some of the questions the PDI-IV manual encourages the
interviewer to follow every endorsement with further questions (Widiger et al., 1995). On
the basis of responses to the provided questions and additional probes, each criterion is
scored on a three-point scale, 0–2. A score of ‘0’ demonstrates that the individual does not
meet the DSM-IV criterion, a ‘1’ indicates that the person has met the criterion, and a ‘2’
signifies that the respondent exceeds the criterion (Widiger et al., 1995). For this study, the
inter-rater reliability of the PDI-IV for the combined sample (clinical and nonclinical),
intraclass correlation coefficients (ICC; Shrout & Fleiss, 1979) for the symptom counts,
were 0.75 (BPD symptom counts), 0.88 (APD symptom counts), and 0.65 (HPD symptom
counts).
Personality traits
The Structured Interview for the Five-Factor Model of Personality (SIFFM; Trull &
Widiger, 1997) is a 120-item interview used to assess adaptive and maladaptive
personality traits. This measure evaluates the five dimensions of personality: Neuroticism,
Extraversion, Openness, Agreeableness, and Conscientiousness. Each dimension includes
six facets, and each facet is evaluated using four questions (Trull & Widiger, 1997).
Therefore, each dimension is assessed with 24 questions. The SIFFM is scored using a
three-point scale (0–2). A score of ‘0’ indicates the absence of a trait or that the trait is only
minimally present. A score of ‘1’ illustrates the presence of a trait, but not to the degree
that it would be considered pathological or dysfunctional. Last, a score of ‘2’ demonstrates
that the trait is present and exists at such a high level that it causes the individual problems.
Thirty-two items are reverse scored (Trull & Widiger, 1997). In the present study, inter-
rater reliability checks indicated excellent agreement for all SIFFM facet and domain
scores (all ICCs> 0.90).
The SIFFM scores have been shown to be internally consistent and reliable over time,
and evidence supports the convergent validity with the NEO-PI-R (Costa & McCrae,
1992). In addition, the SIFFM domain and facet scores have demonstrated relevance to
Axis II psychopathology (see e.g. Trull, Widiger, & Burr, 2001; Trull et al., 1998). The
internal consistency for each dimension of the SIFFM in the combined sample was 0.85
(Neuroticism), 0.83 (Extraversion), 0.77 (Openness), 0.77 (Agreeableness), and 0.81
(Conscientiousness). Mean internal consistency scores for the facet scores (made up of
four items each) of the combined sample were 0.67 (Neuroticism facets), 0.65
(Extraversion facets), 0.52 (Openness facets), 0.52 (Agreeableness facets), and 0.52
(Conscientiousness facets).2
The Schedule for Nonadaptive and Adaptive Personality (SNAP; Clark, 1993) was also
administered to both samples. The SNAP is a 375-item self-report questionnaire utilizing a
true–false format that evaluates personality characteristics and general temperament. The
SNAP contains three higher-order temperament scales, 12 trait scales, and six validity
scales. In this study, the internal consistency of the higher-order temperament scales in the
combined sample was 0.67 (Negative Temperament; NT), 0.88 (Positive Temperament;
PT), and 0.84 (Disinhibition; DIS). The internal consistencies for the SNAP trait scales
ranged from 0.68 (Impulsivity) to 0.90 (Mistrust).
2The lower internal consistency values for the SIFFM facets probably reflect the fact that only four itemscomprise each scale.
Incremental validity of the SIFFM 7
Copyright # 2005 John Wiley & Sons, Ltd. Eur. J. Pers. 19: 1–15 (2005)

Uncor
recte
d Pr
oof
1
2
3
4
5
6
7
8
9
10
11
12
13
14
15
16
17
18
19
20
21
22
23
24
25
26
27
28
29
30
31
32
33
34
35
36
37
38
39
40
41
42
43
44
45
46
47
48
49
50
51
52
53
54
55
56
57
58
59
60
61
62
63
64
65
66
67
RESULTS
Descriptive analyses
The combined sample included 13 individuals with DSM-IV BPD (10 females, three
males) and six males with APD. No participants met full diagnostic criteria for HPD. In the
combined sample, the mean number of BPD symptoms was 1.29 (SD¼ 1.64), the mean
number of APD symptoms was 1.20 (SD¼ 1.54), and the mean number of HPD symptoms
was 0.42 (SD¼ 0.78). As expected, clinical participants, as a group, endorsed a higher
number of symptoms for each of the personality disorders. In the clinical sample, the mean
number of BPD symptoms was 1.85 (SD¼ 1.85), the mean number of APD symptoms was
1.23 (SD¼ 1.45), and the mean number of HPD symptoms was 0.65 (SD¼ 0.97). In the
nonclinical sample, the mean number of BPD symptoms was 1.11 (SD¼ 1.52), the mean
number of APD symptoms was 1.20 (SD¼ 1.57) and the mean number of HPD symptoms
was 0.34 (SD¼ 0.70).3
Regression analyses
In order to examine the respective relationships of the SIFFM and the SNAP scores to the
PDI-IV personality disorder symptom counts, two sets of regression analyses were per-
formed using the combined clinical and nonclinical data. To examine whether the variables
of age and biological sex covary as a function of the personality disorder symptom counts,
bivariate correlations between these variables and the personality disorder symptom
counts were computed. Because age was significantly correlated with the PDI-IV BPD
symptom counts (r¼ 0.16, p< 0.05), age was controlled for in the regressions using BPD
symptom counts as the criterion. In addition, biological sex (0¼ female, 1¼male) was
significantly correlated with the PDI-IV APD symptom counts (r¼ 0.17, p< 0.05). Thus,
age was entered as the first step in those regressions in which BPD was the dependent
variable, and sex was entered as the first step in those regressions in which APD was the
dependent variable. The PDI-IV HPD symptom count was not significantly correlated with
either age or sex.
Domains
First, the five SIFFM domain and three SNAP temperament scale scores, respectively,
were used to predict the variance of each of the PDI-IV three personality disorder symp-
tom counts. These results are presented in Table 2, and indicate the extent to which the
FFM and Big Three model, respectively, can account for variance in each of the three
personality disorder symptom counts.
In the first analysis, all five SIFFM domains were entered as a block to predict
each PDI-IV symptom count. SIFFM domains significantly predicted BPD features
when controlling for age (F�(5, 193)¼ 22.20, p< 0.0001; �R2¼ 0.34), APD features
when controlling for sex (F�(5, 193)¼ 16.72, p< 0.0001; �R2¼ 0.28), and HPD
features (F�(5, 194)¼ 12.58, p< 0.0001; �R2¼ 0.23). Likewise, when the three SNAP
higher-order temperament scales were entered as a block to predict PDI-IV symptom
counts (bottom half of Table 2), these SNAP higher-order scales significantly predicted
BPD features when controlling for age (F�(3, 195)¼ 23.23, p< 0.0001; �R2¼ 0.24),
APD features when controlling for sex (F�(3, 195)¼ 22.80, p< 0.0001; �R2¼ 0.24), and
HPD features (F�(3, 196)¼ 8.11, p< 0.0001; �R2¼ 0.10).
3Bivariate correlations matrices for the predictor variables are available from the second author.
8 S. D. Stepp et al.
Copyright # 2005 John Wiley & Sons, Ltd. Eur. J. Pers. 19: 1–15 (2005)

Uncor
recte
d Pr
oof
1
2
3
4
5
6
7
8
9
10
11
12
13
14
15
16
17
18
19
20
21
22
23
24
25
26
27
28
29
30
31
32
33
34
35
36
37
38
39
40
41
42
43
44
45
46
47
48
49
50
51
52
53
54
55
56
57
58
59
60
61
62
63
64
65
66
67
Tab
le2
.In
crem
enta
lval
idit
yo
fS
IFF
Md
om
ain
and
SN
AP
tem
per
amen
tsc
ale
PD
I-IV
reg
ress
ion
anal
yse
s:co
mb
ined
clin
ical
and
no
ncl
inic
alsa
mp
lesa
Cri
teri
on
sym
pto
mS
tep
/pre
dic
tors
df
�R
2F�
Sig
nifi
can
tin
div
idu
alp
red
icto
rsco
un
t(a
dju
sted
)af
ter
fin
alst
ep
Bo
rder
lin
e(B
PD
)1
.A
ge
1,
19
80
.02
5.5
1*
*2
.S
IFF
Md
om
ain
s5
,1
93
0.3
42
2.2
0*
**
*3
.S
NA
Pte
mp
eram
ent
scal
es3
,1
90
0.0
01
.01
(see
bel
ow
)A
nti
soci
al(A
PD
)1
.S
ex1
,1
98
0.0
26
.10
**
2.
SIF
FM
do
mai
ns
5,
19
30
.28
16
.72
**
**
3.
SN
AP
tem
per
amen
tsc
ales
3,
19
00
.02
2.9
0*
*(s
eeb
elow
)H
istr
ion
ic(H
PD
)1
.S
IFF
Md
om
ain
s5
,1
94
0.2
31
2.5
8*
**
*2
.S
NA
Pte
mp
eram
ent
scal
es3
,1
91
0.0
00
.53
(see
bel
ow
)B
ord
erli
ne
(BP
D)
1.
Ag
e1
,1
98
0.0
25
.51
**
2.
SN
AP
tem
per
amen
tsc
ales
3,
19
50
.24
23
.23
**
**
3.
SIF
FM
do
mai
ns
5,
19
00
.09
6.8
0*
**
*S
IFF
MN
euro
tici
sm(þ
þþþ
);S
IFF
MC
on
scie
nti
ou
snes
s(�
�)
An
tiso
cial
(AP
D)
1.
Sex
1,
19
80
.02
6.1
0*
*2
.S
NA
Pte
mp
eram
ent
scal
es3
,1
95
0.2
42
2.8
0*
**
*3
.S
IFF
Md
om
ain
s5
,1
90
0.0
64
.17
**
*S
IFF
MN
euro
tici
sm(þ
þ);
SIF
FM
Co
nsc
ien
tio
usn
ess
(��
);S
NA
PD
isin
hib
itio
n(þ
þ)
His
trio
nic
(HP
D)
1.
SN
AP
tem
per
amen
tsc
ales
3,
19
60
.10
8.1
1*
**
*2
.S
IFF
Md
om
ain
s5
,1
90
0.1
27
.18
**
**
SIF
FM
Neu
roti
cism
(þþþ
);S
IFF
MO
pen
nes
s(þ
þ)
an¼
20
2.*
*p<
0.0
5,*
**p<
0.0
05
,*
**
*p<
0.0
00
1;þþ
po
siti
vel
yre
late
d,p<
0.0
5;þþþ
posi
tivel
yre
late
d,p<
0.0
05
;þþþþ
posi
tivel
yre
late
d,p<
0.0
01
;��
neg
ativ
ely
rela
ted
,
p<
0.0
5;���
neg
ativ
ely
rela
ted
,p<
0.0
05
.
Incremental validity of the SIFFM 9
Copyright # 2005 John Wiley & Sons, Ltd. Eur. J. Pers. 19: 1–15 (2005)

Uncor
recte
d Pr
oof
1
2
3
4
5
6
7
8
9
10
11
12
13
14
15
16
17
18
19
20
21
22
23
24
25
26
27
28
29
30
31
32
33
34
35
36
37
38
39
40
41
42
43
44
45
46
47
48
49
50
51
52
53
54
55
56
57
58
59
60
61
62
63
64
65
66
67
Table 2 also presents the results of the hierarchical analyses that ascertained whether or
not the SIFFM domain scores predicted variance in symptom counts above and beyond
that accounted for by the SNAP temperament scores (or vice versa). In the first set of
hierarchical regressions (top of table, last step), the SNAP temperament scales accounted
for a significant amount of the variance above and beyond the SIFFM domains only for the
APD symptom count (F�(3, 190)¼ 2.90, p< 0.001; �R2¼ 0.02). An examination of the
last column (Significant Individual Predictors after Final Step) reveals that this is probably
due to the unique contribution of SNAP Disinhibition scores in the prediction of APD
symptoms. In contrast, the SIFFM domain scores accounted for a significant amount of
variance beyond that accounted for by the SNAP temperament scores in the case of all
three criterion symptom counts (Table 2, bottom half). An examination of the significant
predictors after the last step (last column) reveals that high SIFFM Neuroticism and low
SIFFM Conscientiousness scores were significantly related to BPD symptoms; high
SIFFM Neuroticism, high SNAP Disinhibition, and low SIFFM Conscientiousness scores
were significantly related to APD symptoms; and high SIFFM Neuroticism and high
SIFFM Openness scores were significantly related to HPD symptoms.
FFM lower-order traits and SNAP scales
Next, selected SIFFM facet scores and SNAP scale scores targeting each of the three
personality disorders (see Table 1) were included in prediction models of the three PDI-IV
symptom counts. The results of these regression analyses are presented in Table 3.4
As indicated in the top half of Table 3, the selected SIFFM facet scores significantly
predicted BPD symptoms when controlling for age (F�(15, 182)¼ 9.97, p< 0.0001;
�R2¼ 0.44), APD features when controlling for sex (F�(18, 178)¼ 6.25, p< 0.0001;
�R2¼ 0.32), and HPD features (F�(18, 180)¼ 3.42, p< 0.0001; �R2¼ 0.18). Focusing
on the bottom half of the table, the selected SNAP scale scores significantly predicted BPD
features when controlling for age (F�(4, 193)¼ 80.62, p< 0.0001; �R2¼ 0.28), APD
features when controlling for sex (F�(5, 191)¼ 17.77, p< 0.0001; �R2¼ 0.30), and HPD
features (F�(4, 194)¼ 6.62, p< 0.0001; �R2¼ 0.10).
Table 3 also presents the results of the hierarchical analyses that ascertained whether or
not the SIFFM facet scores targeting each personality disorder, respectively, predicted
variance above and beyond that accounted for by the selected SNAP scale scores (or vice
versa). In the first set of hierarchical regressions (top of table), the SNAP scales accounted
for variance above and beyond the SIFFM facet scores in the case of BPD symptom counts
(F�(4, 178)¼ 7.03, p< 0.0001; �R2¼ 0.02), APD symptom counts (F�(5, 173)¼ 2.65,
p< 0.05; �R2¼ 0.03), and HPD symptom counts (F�(4, 176)¼ 6.12, p< 0.0001;
�R2¼ 0.08). Similarly, the SIFFM facet scores accounted for a significant amount of
variance beyond that accounted for by the SNAP scores in the case of all three criterion
symptom counts (Table 3, bottom half).
An examination of the last column (Significant Individual Predictors after Final Step)
reveals that individual scores significantly related to BPD symptoms included SIFFM
Depression, SIFFM Assertiveness, SIFFM Achievement Striving (negative coefficient),
SIFFM Gregariousness, and SNAP Self-Harm. Scores significantly related to APD
4A few of the values presented here differ from those mentioned by Trull and Widiger (2002), who summarizedpreliminary findings from these samples. The unpublished study mentioned by Trull and Widiger (2002) usedslightly different subsets of SNAP items in the prediction models. The present study, however, includes in therespective models those SNAP scales that Clark (1993, Table 2, p. 16) reports as corresponding conceptually tothe three personality disorders of interest.
10 S. D. Stepp et al.
Copyright # 2005 John Wiley & Sons, Ltd. Eur. J. Pers. 19: 1–15 (2005)

Uncor
recte
d Pr
oof
1
2
3
4
5
6
7
8
9
10
11
12
13
14
15
16
17
18
19
20
21
22
23
24
25
26
27
28
29
30
31
32
33
34
35
36
37
38
39
40
41
42
43
44
45
46
47
48
49
50
51
52
53
54
55
56
57
58
59
60
61
62
63
64
65
66
67
Tab
le3
.In
crem
enta
lval
idit
yo
fS
IFF
Mfa
cet
and
SN
AP
scal
eP
DI-
IVre
gre
ssio
nan
aly
ses:
com
bin
edcl
inic
alan
dn
on
clin
ical
sam
ple
sa
Cri
teri
on
sym
pto
mS
tep
/pre
dic
tors
df
�R
2F�
Sig
nifi
can
tin
div
idu
alp
red
icto
rsco
un
t(a
dju
sted
)af
ter
fin
alst
ep
Bo
rder
lin
e(B
PD
)1
.A
ge
1,
19
0.0
25
.36
**
2.
SIF
FM
BP
Dfa
cets
15
,1
82
0.4
49
.97
**
**
3.
SN
AP
BP
Dsc
ales
4,
17
80
.02
7.0
3*
**
*(s
eeb
elow
)A
nti
soci
al(A
PD
)1
.S
ex1
,1
96
0.0
25
.52
**
2.
SIF
FM
AP
Dfa
cets
18
,1
78
0.3
26
.25
**
**
3.
SN
AP
AP
Dsc
ales
5,
17
30
.03
2.6
5*
*(s
eeb
elow
)H
istr
ion
ic(H
PD
)1
.S
IFF
MH
PD
face
ts1
8,
18
00
.18
3.4
2*
**
*2
.S
NA
PH
PD
scal
es4
,1
76
0.0
86
.12
**
**
(see
bel
ow
)B
ord
erli
ne
(BP
D)
1.
Ag
e1
,1
97
0.0
25
.36
**
2.
SN
AP
BP
Dsc
ales
4,
19
30
.28
80
.62
**
**
3.
SIF
FM
BP
Dfa
cets
15
,1
78
0.1
84
.11
**
**
SIF
FM
Dep
ress
ion
(þþ
);S
IFF
MA
sser
tiven
ess
(þþ
);S
IFF
MA
chie
vem
ent-
Str
ivin
g(�
�);
SIF
FM
Gre
gar
iou
snes
s(þ
þ);
SN
AP
Sel
f-H
arm
(þþþþ
)A
nti
soci
al(A
PD
)1
.S
ex1
,1
96
0.0
25
.52
**
2.
SN
AP
AP
Dsc
ales
5,
19
10
.30
17
.77
**
**
3.
SIF
FM
AP
Dfa
cets
18
,1
73
0.0
51
.92
**
SIF
FM
Dep
ress
ion
(þþ
);S
IFF
MIm
pu
lsiv
enes
s(þ
þ);
SN
AP
Ag
gre
ssio
n(þ
þ)
His
trio
nic
(HP
D)
1.
SN
AP
HP
Dsc
ales
4,
19
40
.10
6.6
2*
**
*2
.S
IFF
MH
PD
face
ts1
8,
17
60
.16
3.3
7*
**
*S
IFF
MS
elf-
Co
nsc
iou
snes
s(þ
þ);
SIF
FM
Vuln
erab
ilit
y(þ
þ);
SN
AP
Ex
hib
itio
nis
m(þ
þþ
);S
NA
PE
nti
tlem
ent
(þþ
)
See
Tab
le1
for
sele
cted
SIF
FM
and
SN
AP
pre
dic
tors
.an¼
20
2,
**p<
0.0
5,
**
*p<
0.0
05
,*
**
*p<
0.0
00
1;þþ
posi
tivel
yre
late
d,
p<
0.0
5;þþþ
po
siti
vel
yre
late
d,
p<
0.0
05
;
þþþþ
posi
tivel
yre
late
d,
p<
0.0
01
;��
neg
ativ
ely
rela
ted,
p<
0.0
5;���
neg
ativ
ely
rela
ted
,p<
0.0
05
.
Incremental validity of the SIFFM 11
Copyright # 2005 John Wiley & Sons, Ltd. Eur. J. Pers. 19: 1–15 (2005)
Uncor
recte
d Pr
oof
1
2
3
4
5
6
7
8
9
10
11
12
13
14
15
16
17
18
19
20
21
22
23
24
25
26
27
28
29
30
31
32
33
34
35
36
37
38
39
40
41
42
43
44
45
46
47
48
49
50
51
52
53
54
55
56
57
58
59
60
61
62
63
64
65
66
67
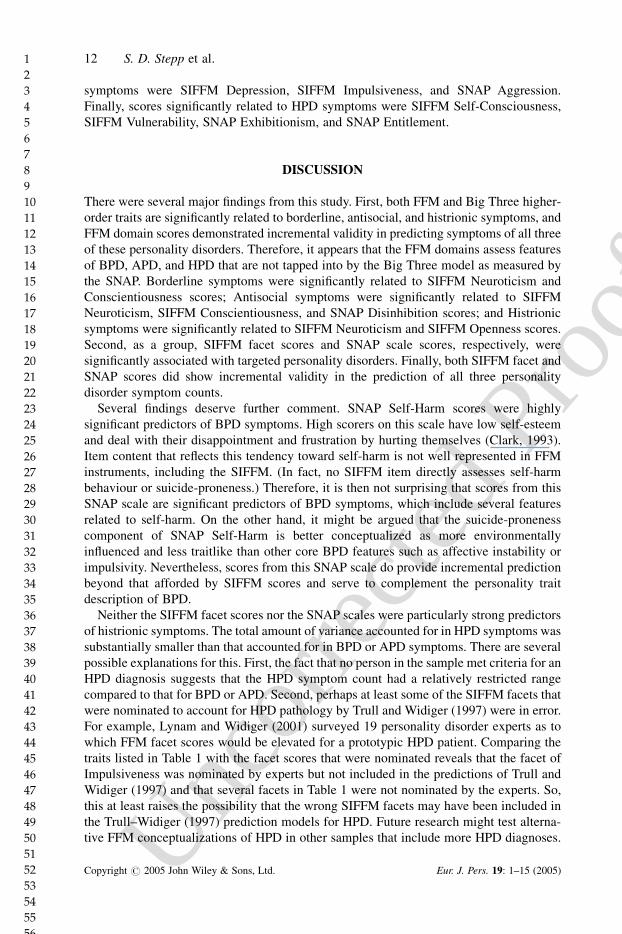
symptoms were SIFFM Depression, SIFFM Impulsiveness, and SNAP Aggression.
Finally, scores significantly related to HPD symptoms were SIFFM Self-Consciousness,
SIFFM Vulnerability, SNAP Exhibitionism, and SNAP Entitlement.
DISCUSSION
There were several major findings from this study. First, both FFM and Big Three higher-
order traits are significantly related to borderline, antisocial, and histrionic symptoms, and
FFM domain scores demonstrated incremental validity in predicting symptoms of all three
of these personality disorders. Therefore, it appears that the FFM domains assess features
of BPD, APD, and HPD that are not tapped into by the Big Three model as measured by
the SNAP. Borderline symptoms were significantly related to SIFFM Neuroticism and
Conscientiousness scores; Antisocial symptoms were significantly related to SIFFM
Neuroticism, SIFFM Conscientiousness, and SNAP Disinhibition scores; and Histrionic
symptoms were significantly related to SIFFM Neuroticism and SIFFM Openness scores.
Second, as a group, SIFFM facet scores and SNAP scale scores, respectively, were
significantly associated with targeted personality disorders. Finally, both SIFFM facet and
SNAP scores did show incremental validity in the prediction of all three personality
disorder symptom counts.
Several findings deserve further comment. SNAP Self-Harm scores were highly
significant predictors of BPD symptoms. High scorers on this scale have low self-esteem
and deal with their disappointment and frustration by hurting themselves (Clark, 1993).
Item content that reflects this tendency toward self-harm is not well represented in FFM
instruments, including the SIFFM. (In fact, no SIFFM item directly assesses self-harm
behaviour or suicide-proneness.) Therefore, it is then not surprising that scores from this
SNAP scale are significant predictors of BPD symptoms, which include several features
related to self-harm. On the other hand, it might be argued that the suicide-proneness
component of SNAP Self-Harm is better conceptualized as more environmentally
influenced and less traitlike than other core BPD features such as affective instability or
impulsivity. Nevertheless, scores from this SNAP scale do provide incremental prediction
beyond that afforded by SIFFM scores and serve to complement the personality trait
description of BPD.
Neither the SIFFM facet scores nor the SNAP scales were particularly strong predictors
of histrionic symptoms. The total amount of variance accounted for in HPD symptoms was
substantially smaller than that accounted for in BPD or APD symptoms. There are several
possible explanations for this. First, the fact that no person in the sample met criteria for an
HPD diagnosis suggests that the HPD symptom count had a relatively restricted range
compared to that for BPD or APD. Second, perhaps at least some of the SIFFM facets that
were nominated to account for HPD pathology by Trull and Widiger (1997) were in error.
For example, Lynam and Widiger (2001) surveyed 19 personality disorder experts as to
which FFM facet scores would be elevated for a prototypic HPD patient. Comparing the
traits listed in Table 1 with the facet scores that were nominated reveals that the facet of
Impulsiveness was nominated by experts but not included in the predictions of Trull and
Widiger (1997) and that several facets in Table 1 were not nominated by the experts. So,
this at least raises the possibility that the wrong SIFFM facets may have been included in
the Trull–Widiger (1997) prediction models for HPD. Future research might test alterna-
tive FFM conceptualizations of HPD in other samples that include more HPD diagnoses.
12 S. D. Stepp et al.
Copyright # 2005 John Wiley & Sons, Ltd. Eur. J. Pers. 19: 1–15 (2005)

Uncor
recte
d Pr
oof
1
2
3
4
5
6
7
8
9
10
11
12
13
14
15
16
17
18
19
20
21
22
23
24
25
26
27
28
29
30
31
32
33
34
35
36
37
38
39
40
41
42
43
44
45
46
47
48
49
50
51
52
53
54
55
56
57
58
59
60
61
62
63
64
65
66
67
Like the SIFFM the SNAP also accounted for a significant portion of the variance in
each of the criterion symptom counts, and like the SIFFM the selected SNAP scales did
account for variance in the criterion measures above and beyond the SIFFM. Thus,
although the SIFFM accounts for distinct variance other than that accounted for by the
SNAP, the current study does not support the idea that the predictive ability of the SNAP
scales can be entirely accounted for by the SIFFM in the context of predicting personality
disorder features. Although our results support the incremental validity of SIFFM scores in
predicting symptoms of these three personality disorders, the results do not suggest that
the SIFFM is better than the SNAP or vice versa. Rather, our results suggest that the two
instruments complement each other and each provides some unique predictive ability not
afforded by the other.
Reynolds and Clark (2001) reported that the 15 SNAP scales outperformed an FFM
measure, the NEO PI-R facet scales, in predicting personality disorder symptoms.
However, they noted that ‘the maladaptive personality traits assessed by the SNAP were
strongly represented in the facet scales of the NEO PI-R’ (Reynolds & Clark, 2001, p.
216). They suggested that the primary reason that the SNAP outperformed the NEO PI-R
was that ‘the FFM measures assess normal-range traits [whereas] the SNAP primarily
assesses extreme variants of normal-range traits that are maladaptive and clinically
relevant’ (Reynolds & Clark, 2001, p. 218). Similarly, although the SIFFM was designed
to assess more maladaptive variants of the traits included in the FFM, the SNAP scales
contain many more items that focus on these maladaptive variants. Thus, in general, SNAP
scores may provide a richer picture of the maladaptive realms of these traits. On the other
hand, it is impressive that that SIFFM facet scores do so well in predicting personality
pathology given the limited number of items included in these scales.
If one’s goal is to arrive at a DSM-IV diagnosis of BPD, APD, or HPD, then a DSM-IV
based semi-structured interview should be used. Why then even consider using the SIFFM
or the SNAP? We believe that these instruments (as well as others) provide an alternative
means of assessing personality pathology. On the one hand, because they do account for
variance in DSM-IV personality disorder symptoms, they can help us understand the
nature of the disorders, provide a better description of the traits involved, and help us
understand why certain disorders tend to co-occur (because they share underlying traits).
On the other hand, measures of alternative dimensional models of personality pathology
can aid in the identification of forms of personality pathology or disorder that are not
represented in DSM-IV (Trull & Durrett, in pressQ1). Further, these measures, through
their connection to well established personality models and traits that have been around for
decades, can inform our aetiological theories, given the abundance of research that has
been conducted on these traits.
In conclusion, the SIFFM scores do show incremental validity in predicting three
personality disorder symptom counts. Further, specific SIFFM trait scores provided unique
diagnostic information above and beyond scores from another alternative personality
measure. These findings indicate that the SIFFM may be a useful tool for the assessment of
personality disorders and personality pathology, especially for those clinicians and
researchers who prefer interview-based assessments. Future research should assess the
incremental validity of SIFFM scores in a larger clinical sample with more and a broader
range of personality disorder diagnoses. Finally, given that the SIFFM currently is
administered in an interview format, future research may attempt to distinguish the vari-
ance accounted for by the content of the measure and possible methodological variance
specific to the interview format. For example, a study could specifically re-examine the
Q1
Incremental validity of the SIFFM 13
Copyright # 2005 John Wiley & Sons, Ltd. Eur. J. Pers. 19: 1–15 (2005)

Uncor
recte
d Pr
oof
1
2
3
4
5
6
7
8
9
10
11
12
13
14
15
16
17
18
19
20
21
22
23
24
25
26
27
28
29
30
31
32
33
34
35
36
37
38
39
40
41
42
43
44
45
46
47
48
49
50
51
52
53
54
55
56
57
58
59
60
61
62
63
64
65
66
67
predictive power of the SNAP and the SIFFM using a self-report measure of DSM-IV
personality disorder symptoms. Furthermore, a self-report format of the SIFFM could be
created. This new self-report measure could be compared not only with other self-report
measures of personality, but with the current interview version of the SIFFM itself.
ACKNOWLEDGEMENT
This research was partially supported by National Institute of Mental Health grant
MH52695 awarded to Timothy J. Trull.
REFERENCES
American Psychiatric Association (APA). (1980). Diagnostic and statistical manual of mentaldisorders (3rd ed.). Washington, DC: Author.
American Psychiatric Association (APA). (1994). Diagnostic and statistical manual of mentaldisorders (4th ed.). Washington, DC: Author.
Clark, L. A. (1993). Manual for the schedule for nonadaptive and adaptive personality. Minneapolis,MN: University of Minnesota Press.
Clark, L. A. (1999). Dimensional approaches to personality disorder assessment and diagnosis. In C.R. Cloninger (Ed.), Personality and psychopathology (pp. 219–244). Washington, DC: AmericanPsychiatric Press.
Clark, L. A., & Livesley, W. J. (2002). Two approaches to identifying the dimensions of personalitydisorder: Convergence on the five-factor model. In P. T. Costa, Jr., & T. A. Widiger (Eds.),Personality disorders and the five-factor model of personality (2nd ed., pp. 161–176). Washington,DC: American Psychological Association.
Costa, P. T., & McCrae, R. R. (1992). Revised NEO Personality Inventory (NEO-PI-R) and NEOFive-Factor Inventory (NEO-FFI) professional manual. Odessa, FL: Psychological AssessmentResources.
DiLalla, D. L., Gottesman, I. I., Carey, G., & Volger, G. P. (1993). Joint factor structure of theMultidimensional Personality Questionnaire and the MMPI in a psychiatric and high-risk sample.Psychological Assessment, 5, 207–215.
Frances, A. (1982). Categorical and dimensional systems of personality diagnosis: A comparison.Comprehensive Psychiatry, 23, 516–527.
Hyler, S. E., & Rieder, R. O. (1987). Personality Diagnostic Questionnaire—Revised (PDQ-R). NewYork: Author.
Lynam, D. R., & Widiger, T. A. (2001). Using the five-factor model to represent the DSM-IVpersonality disorders: An expert consensus. Journal of Abnormal Psychology, 110, 401–412.
Markon, K. E., Krueger, R. F., & Watson, D. (2005). Delineating the structure of normal andabnormal personality: An integrative hierarchical approach. Journal of Personality and SocialPsychology, 88, 139–157.
McCrae, R. R. (1994). Psychopathology from the perspective of the five-factor model. In S. Strack,& M. Lorr (Eds.), Differentiating normal and abnormal personality (pp. 26–39). New York:Springer.
Morey, L. C. (1991). Personality Assessment Inventory: Professional manual. Odessa, FL:Psychological Assessment Resources.
Reynolds, S. K., & Clark, L. A. (2001). Predicting dimensions of personality disorder from domainsand facets of the five-factor model. Journal of Personality, 69, 199–222.
Shrout, P. E., & Fleiss, J. L. (1979). Intraclass correlations: Uses in assessing rater reliability.Psychological Bulletin, 86, 420–428.
Tellegen, A., & Waller, N. G. (in pressQ1). Exploring personality through test construction:Development of the Multidimensional Personality Questionnaire. In S. R. Briggs, & J. M. Cheek(Eds.), Personality measures: Development and evaluation (Vol. 1). Greenwich, CT: JAI Press.
Q1
14 S. D. Stepp et al.
Copyright # 2005 John Wiley & Sons, Ltd. Eur. J. Pers. 19: 1–15 (2005)

Uncor
recte
d Pr
oof
1
2
3
4
5
6
7
8
9
10
11
12
13
14
15
16
17
18
19
20
21
22
23
24
25
26
27
28
29
30
31
32
33
34
35
36
37
38
39
40
41
42
43
44
45
46
47
48
49
50
51
52
53
54
55
56
57
58
59
60
61
62
63
64
65
66
67
Trull, T. J. (1995). Borderline personality disorder features in nonclinical young adults: 1.Identification and validation. Psychological Assessment, 7, 33–41.
Trull, T. J., & Durrett. C. (in pressQ1). Categorical and dimensional models of personality disorders.Annual Review of Clinical Psychology.
Trull, T. J., Useda, J. D., Conforti, K., & Doan, B. T. (1997). Borderline personality disorderfeatures in nonclinical young adults: 2. Two-year outcome. Journal of Abnormal Psychology, 106,307–314.
Q2Trull, T. J., & Widiger, T. A. (1997). SIFFM: Structured Interview for the Five-Factor Model ofPersonality, professional manual. Odessa, FL: Psychological Assessment Resources.
Trull, T. J., & Widiger, T. A. (2002). The structured interview for the five factor model of personality(SIFFM). In B. De Raad, & M. Perugini (Eds.), Big five assessment (pp. 148–166). Gottingen,Germany: Hogrefe & Huber.
Trull, T. J., Widiger, T. A., & Burr, R. (2001). A structured interview for the assessment of the five-factor model of personality: Facet-level relations to the Axis II personality disorders. Journal ofPersonality, 69, 175–198.
Trull, T. J., Widiger, T. A., Useda, J. D., Holcomb, J., Doan, B.-T., Axelrod, S. R., Stern, B. L., &Gershuny, B. S. (1998). A structured interview for the assessment of the five-factor model ofpersonality. Psychological Assessment, 10, 229–240.
Vieth, A. Z. (2000). Using measures of personality to predict borderline personality traits: Acomparison of the SIFFM and the MPQ. Dissertation Abstracts International: Section B: TheSciences and Engineering, 60, 5824.
Widiger, T. A. (1993). The DSM-III-R categorical personality disorder diagnoses: A critique and analternative. Psychological Inquiry, 4, 75–90.
Widiger, T. A., & Costa, P. T., Jr. (2002). Five factor model personality disorder research. In P. T.Costa, & T. A. Widiger (Eds.), Personality disorders and the five factor model of personality (2nded., pp. 59–87). Washington, DC: American Psychological Association.
Widiger, T. A., & Frances, A. J. (1994). Toward a dimensional model for the personality disorders. InP. T. Costa, Jr., & T. A. Widiger (Eds.), Personality disorders and the five-factor model ofpersonality (pp. 19–40). Washington, DC: American Psychological Association.
Widiger, T. A., Mangine, S., Corbitt, E. M., Ellis, C. G., & Thomas, G. V. (1995). PersonalityDisorder Interview—IV: A semistructured interview for the assessment of personality disorders.Odessa, FL: Psychological Assessment Resources.
Widiger, T. A., Trull, T. J., Clarkin, J. F., Sanderson, C., & Costa, P. T., Jr. (1994). A description of theDSM-III-R and DSM-IV personality disorders with the five-factor model of personality. In P. T.Costa, Jr., & T. A. Widiger (Eds.), Personality disorders and the five-factor model of personality(pp. 41–56). Washington, DC: American Psychological Association.
Widiger, T. A., Trull, T. J., Clarkin, J. F., Sanderson, C., & Costa, P. T., Jr. (2002). A description ofthe DSM-IV personality disorders with the five-factor model of personality. In P. T. Costa, Jr., &T. A. Widiger (Eds.), Personality disorders and the five-factor model of personality (2nd ed.,pp. 89–99). Washington, DC: American Psychological Association.
Zimmerman, M. (1994). Diagnosing personality disorders: A review of issues and research methods.Archives of General Psychiatry, 51, 225–245.
Q1
Q2
Incremental validity of the SIFFM 15
Copyright # 2005 John Wiley & Sons, Ltd. Eur. J. Pers. 19: 1–15 (2005)
Uncor
recte
d Pr
oof
1
2
3
4
5
6
7
8
9
10
11
12
13
14
15
16
17
18
19
20
21
22
23
24
25
26
27
28
29
30
31
32
33
34
35
36
37
38
39
40
41
42
43
44
45
46
47
48
49
50
51
52
53
54
55
56
57
58
59
60
61
62
63
64
65
66
67
Author Query Form (PER/565)
Special Instructions: Author please write responses to queries directly
on Galley proofs.
Q1: Author: Any more details?
Q2: Author: Is this referred to in text?
Copyright © 2022 FDOKUMEN