Construct Validity of Psychometric Instruments
72
SAJEMS SS No 1 (1999) S - 1 Construct Validity of Psychometric Instruments Developed in the United States, when Applied to Professional People in South Africa ________________________________________________________________ R van Wyk and A B Boshoff Department of Business Management, University of Pretoria J H Owen Department of Information Technology, University of Pretoria JEL L84 TABLE OF CONTENTS 1 INTERCULTURAL VALIDITY OF MEASURING INSTRUMENTS S1 2 METHOD S10 3 PARTICIPANTS S10 4 MEASURING INSTRUMENTS S14 5 PROCEDURE S21 6 TYPE A BEHAVIOUR PATTERN S23 7 STATISTICAL PROPERTIES OF THE LOCUS OF CONTROL S27 QUESTIONNAIRE 8 CAREER ORIENTATION INVENTORY S34 9 KANUNGO JOB INVOLVEMENT QUESTIONNAIRE S37 10 MINNESOTA SATISFACTION QUESTIONNAIRE S39 11 SIX-FACTOR SELF-CONCEPT SCALE FOR ADULTS S44 12 THE ENTREPRENEURIAL ATTITUDE ORIENTATION SCALE S51 13 CONCLUSION S57 14 DISCUSSION S66 REFERENCES S68 1 INTERCULTURAL VALIDITY OF MEASURING INSTRUMENTS The study reported in this paper was part of a joint research programme by the Universities of Pretoria, Orange Free State and the Rand Afrikaans University. The aim of the joint programme was to examine the values, motives and work experiences of highly educated individuals in professional occupations. The structures of seven psychometric instruments used in the joint programme are investigated here. These instruments measure the following variables: Type A Behaviour, Locus of Control, Career Orientation, Job Involvement, Job Satisfaction, Self-Concept and Entrepreneurial Attitude.
-
Upload
johannesburg -
Category
Documents
-
view
2 -
download
0
Transcript of Construct Validity of Psychometric Instruments

SAJEMS SS No 1 (1999)
S - 1
Construct Validity of Psychometric Instruments Developed in the United States, when Applied to Professional People in South Africa ________________________________________________________________ R van Wyk and A B Boshoff Department of Business Management, University of Pretoria J H Owen Department of Information Technology, University of Pretoria
JEL L84
TABLE OF CONTENTS
1 INTERCULTURAL VALIDITY OF MEASURING INSTRUMENTS S1 2 METHOD S10 3 PARTICIPANTS S10 4 MEASURING INSTRUMENTS S14 5 PROCEDURE S21 6 TYPE A BEHAVIOUR PATTERN S23 7 STATISTICAL PROPERTIES OF THE LOCUS OF CONTROL S27
QUESTIONNAIRE 8 CAREER ORIENTATION INVENTORY S34 9 KANUNGO JOB INVOLVEMENT QUESTIONNAIRE S37 10 MINNESOTA SATISFACTION QUESTIONNAIRE S39 11 SIX-FACTOR SELF-CONCEPT SCALE FOR ADULTS S44 12 THE ENTREPRENEURIAL ATTITUDE ORIENTATION SCALE S51 13 CONCLUSION S57 14 DISCUSSION S66 REFERENCES S68 1 INTERCULTURAL VALIDITY OF MEASURING INSTRUMENTS The study reported in this paper was part of a joint research programme by the Universities of Pretoria, Orange Free State and the Rand Afrikaans University. The aim of the joint programme was to examine the values, motives and work experiences of highly educated individuals in professional occupations. The structures of seven psychometric instruments used in the joint programme are investigated here. These instruments measure the following variables: Type A Behaviour, Locus of Control, Career Orientation, Job Involvement, Job Satisfaction, Self-Concept and Entrepreneurial Attitude.

SAJEMS SS No 1 (1999)
S - 2
All the psychometric instruments used in the study, except the questionnaire for measuring Locus of Control, were developed in the United States. It is therefore important to compare the constructs of the instruments used in the South African sample to those identified in the United States by the developers of these various instruments. A retest of the South African Locus of Control instrument developed by Schepers (1995) was also required and carried out. Triandis, Vassiliou, Vassiliou, Tanaka & Shanmugam (1972) have made the point that different cultural groups also show differences in behaviour. These authors refer to this phenomenon as the subjective culture of a cultural group, that is, the characteristic way in which its social environment is perceived. They argue that cross-cultural studies imply the need for a scale to be constructed for each culture, and for the independent validation of such scales. Anastasi (1990) argues that cross-cultural testing is not only associated with sub-cultures within a dominant culture. This author also emphasises the need for cross-cultural testing in newly developing nations in Africa and elsewhere. She points out that this is of particular importance with increased industrialisation, where psychometric instruments serve as aids in job selection and personnel placement in the professional, mechanical and clerical fields of employment. The application of psychometric instruments to people from different cultural backgrounds has been questioned by Samuda (1983), Taylor (1987) and Anastasi (1990). Samuda (1983) states that the issue of cross-cultural measurement in multicultural societies is of universal concern. Anastasi (1990) argues that cultural differences may lead to group differences that affect responses to particular psychometric instruments, thus reducing the validity of a particular instrument for specific groups. She also argues that it would be futile to try to devise an instrument that is free from cultural influences, seeing that the behaviour of the individual is affected by the cultural milieu, which encourages and fosters certain abilities and forms of behaviour and discourages others. One may therefore infer that it is risky to apply a psychometric instrument developed in an American culture to a South African culture, without validating the instrument. Bhagat, Kedia, Crawford and Kaplan (1990) emphasise that as the realities of competition in a global marketplace come closer, the more rapidly must cross-cultural and cross-national issues and the importance of their measurement be addressed. These authors warn that it is no longer acceptable for unexplained variances to be conveniently related to an error term, adding that psychometric instruments should be evaluated in terms of the true theoretical significance of their characteristics. These authors state that growing international economic interdependence makes it imperative for management to take informed decisions

SAJEMS SS No 1 (1999)
S - 3
about human resources. Towards this end, accurate measurement of the variables involved in the management of people becomes highly significant. Malpass and Poortinga (1986) assert that the application of psychometric instruments in different cultures is used for the evaluation of intercultural differences on the one hand, and the determination whether measurement procedures yield equivalent results on the other. They refer to three different meanings of the term “equivalence” in cross-cultural research, namely, functional equivalence of activities, conceptual equivalence of the meaning of behaviour and metric equivalence indicated by the properties of psychometric instruments. This paper describes an investigation of the metric equivalence of psychometric instruments, with a view to identifying the psychometric properties of the data and preventing quantitative method bias effects when the instruments are used. The intercultural use of instruments has been questioned in the South African context (Taylor, 1987; Edwards & Riordan, 1994; Edwards & Leger, 1995), just as doubt has been thrown on the portability of certain psychometric instruments in Industrial and Organisational Psychology between the United States and South Africa (Boshoff, Julyan, & Botes, 1996; Boshoff & Hoole, 1998b; Kamfer, Venter & Boshoff, 1998). The operational objective of this particular study, as an autonomous part of a larger national research programme, is to determine the portability of the factorial structures and the internal consistency of six psychometric instruments developed in the United States. One South African instrument is re-tested in order to determine reliability. These instruments are then applied to a sample of South African professionals in the accountancy and pharmacy occupations. The constructs or structures to be measured are individually discussed. Type A Behaviour: The term Type A Behaviour was coined by two cardiology researchers, Friedman and Rosenman (1959). In their work with cardiac patients they realised that most of these patients showed a discernible behaviour pattern, and they named it Type A Behaviour. Friedman and Rosenman (1959: 1286) described the manifestation of this as: (1) an intense drive for achieving self-selected though poorly defined goals; (2) eagerness to compete, even in non-competitive situations; (3) persistent aspiration towards recognition and advancement; (4) involvement in more than one activity at a time; (5) habitual inclination to accelerate the rate of simultaneous mental and physical functions; and (6) exceptional physical and mental alertness. De Beer, Steyn, Rossouw, Ferreira, Swanepoel, Nel & Kotze (1981) found that the measurement of Type A Behaviour is quite complex because it entails a

SAJEMS SS No 1 (1999)
S - 4
large variety of behavioural activities. Thoresen and Öhman (1987) are of the opinion that the precise composition of the Type A Behaviour pattern is not definitive, as researchers have not yet reached consensus on its conceptualisation. Assessment of this behaviour pattern is therefore not cut and dried. The Structured Interview (Rosenman, Swan & Carmelli, 1988) was the first instrument developed to measure Type A Behaviour. However, the time-consuming nature of this measurement technique and problems of expense in administering an interview for purely research purposes, ruled out the use of this instrument in the present study. Another instrument is the Jenkins Activity Survey. This is a pre-coded, self-administered questionnaire developed in collaboration with the authors of the Structured Interview (Jenkins, Zyzanski & Rosenham, 1979). Jenkins et al. (1979) developed the Jenkins Activity Survey as a 52-item self-report inventory to measure Type A Behaviour. According to the authors, a person scoring high on this inventory is characterised by extremely hurried, impatient, competitive, aggressive and restless emotions, feelings of high responsibility and being challenged, experiencing time pressure in a continuous striving for achievement. According to its authors, the Jenkins Activity Survey measures three statistically independent factors, namely: Speed and Impatience, Job Involvement, and Hard-Driving and Competitive behaviour (Jenkins et al., 1979). These factors are characterised as follows: • Speed and Impatience (Factor S): This factor indicates the Type A
individual’s urgent manner of behaviour. This includes rapid speaking, walking and eating, easily irritated, as well as being strong-willed and hurrying other people along. It is an expression of the Type A Behaviour components: time urgency and low irritability threshold. The Speed and Impatience component typifies an individual who often attempts to do more than one thing at a time, and inclined to anticipate what is likely to take place next in order to react in advance.
• Job Involvement (Factor J): The Job Involvement factor evaluates the
element of devotion in occupational activity. A high score on this factor is an indication of an individual’s preference for high-pressured and challenging tasks, working against tight deadlines and doing overtime. This factor indicates the level of planning, motivation, challenge and dedication that are part of one’s occupational activities.

SAJEMS SS No 1 (1999)
S - 5
• Hard Driving and Competitive behaviour (Factor H). This dimension relates to a compulsive attraction to involvement in challenges and competition. It is also associated with self-perceptions of putting in more effort than others do, being hard driving, responsible, competitive, serious and conscientious. This kind of behaviour suggests self-assessment of how seriously a person is taking his/her job and the associated efforts, competitiveness and feelings of responsibility concerning the job.
A shortened version of the Jenkins Activity Survey was developed by Pred, Spence and Helmreich (1986). These authors identified two factors that measure Type A Behaviour, namely Achievement Striving and Impatience/ Irritability. Locus of Control: Anastasi (1990) writes that the “Locus of Control” construct came into prominence when Rotter (1966) published his assessment scale of an individual’s generalised expectancies of reinforcement. According to Rotter (1966) reinforcement could be perceived as being either internally or externally controlled. The Rotter instrument, said to measure “Locus of Control” was developed on the basis of the social-learning theory (Anastasi, 1990 & Schepers, 1995). The term itself may be seen as part of the concept of causal attribution (Anastasi, 1990). According to Anastasi (1990) Internal Control refers to the perception that it is one’s own characteristics or behaviour that cause and lead to certain events. On the other hand, External Control indicates the belief that external positive or negative reinforcement takes place. This is perceived as the result of control by powerful individuals, chance, fate, luck or unpredictable forces. Anastasi (1990) identifies three major dimensions of causal attribution, namely “Locus of Control”, “Stability” and “Controllability”. According to the author the “Locus of Control” dimension is either internally caused by aptitude, health or effort; or externally caused by luck, task difficulty or help from others. The second dimension, which the author also classifies as internal but calls “stability”, is described as differentiating between the enduring permanent causes of aptitude and its modifiable, changeable causes such as mood, effort or health. The third dimension of “controllability” is described by the author as different degrees of controllability perceived by a person. An example would be task failure attributed to an individual either for lack of effort or temporary conditions beyond the individual’s control, like illness. A variety of Locus of Control scales have been designed to measure this variable in different populations. A South African “Locus of Control” scale was developed by Schepers (1995). This was called the Locus of Control Inventory.
SAJEMS SS No 1 (1999)
S - 6
Schepers sees the Social Learning and Attribution Theories as the foundation of this measuring instrument. This author outlines the perception of Locus of Control according to the Social Learning Theory as the way in which reinforcement takes place from the social environment, and the effect it has on future behaviour. According to the author, the Social Learning Theory in conjunction with the Attribution Theory explains the way in which a person selects information according to inherently stable or invariant characteristics. Schepers (1995) developed his Locus of Control Inventory on the responses of 1662 first-year university students. Schepers (1995) divides the incentives for personal behaviour into the two categories of dispositional and situational causes. Dispositional causes are seen as the organic attributes of a person, that is, all his/her natural characteristics. Situational causes are seen as the environmental factors influencing the individual. According to Schepers (1995) the Locus of Control Inventory measures three factors, namely Internal Control, External Control and Autonomy. Plug, Meyer, Louw and Gouws (1986) describe the term “autonomy” as a condition of the independence and self-determination of an individual, and add that it also refers to something that is self-regulating and free from external control. Career Orientations: Schein (1975, 1977) coined the term “career anchor” as the occupational self-concept of the individual, meaning the interaction between the perceptions of the individual and his/her work experiences. The term career anchor is used by Schein (1975) to describe the phenomenon of powerful anchoring of career decisions in certain patterns of perceptions. According to the author the occupational self-concept develops into clear and stable perceptual patterns of (a) talents and abilities, (b) motives and needs, and (c) attitudes and values. Schein (1975, 1977) identifies the career anchor of the individual as a dynamic guide that operates either as a conductor or a constraint in personal career decisions in the course of a lifetime. The career anchor is said to eventually become a broad occupational self-concept, the result of the interaction of different patterns of talents, motives and values. Schein (1975, 1977) identified nine different career anchors. DeLong (1982a, 1982b) again developed an instrument, the Career Orientations Inventory, in an attempt to accurately measure these dimensions. Kaplan (1990) in turn describes the distinction between the two terms Career Anchor and Career Orientations as being based on theory and empirical measurement, respectively. DeLong (1982a) conceives the Career Orientation Inventory as consisting of nine sub-scales that depict the general career orientation of self-perceived needs, attitudes and values (DeLong, 1982b). The self-perceived talents and abilities

SAJEMS SS No 1 (1999)
S - 7
element of Schein’s conceptualisation of the career anchor notion, is not measured by the Career Orientations Inventory developed by DeLong (1982a, 1982b). Job Involvement: This is defined by Plug et al. (1986) as the degree of emotional commitment that a person makes in a specific work situation. The authors see this kind of involvement as the participation of a worker in decision-making and problem-solving processes. Kanungo (1979, 1982a) takes the analysis of involvement further. He sees work alienation as the opposite pole of job involvement and argues that a distinction should be made between what he calls (a) involvement in a particular job context and (b) involvement in work generally. He regards Job Involvement as a term descriptive of an individual’s belief about one’s present job, a function of the satisfaction of the individual’s present needs. He goes on to argue that job involvement is a specific belief resulting from the relationship with one’s present job. According to Kanungo (1979, 1982a) this is different from organisational commitment, which should be seen as the general attitude toward an organisation as a whole. This author relates job involvement to the importance of a person’s intrinsic and extrinsic needs. On the other hand he sees work involvement as the result of socialisation, which he warns must not be confused with intrinsic motivation. Work involvement is however also seen as satisfaction with work in general, and the perceptions a person has about the need-satisfying potential of his/her work. In the light of these arguments and the lack of distinction between (a) job and (b) work involvement of existing instruments, Kanungo (1982a) felt it necessary to develop new instruments to measure the two variables that were valid and reliable. According to him such an instrument should measure both job and work involvement, and this resulted in the development of the Kanungo Job Involvement Questionnaire and the Kanungo Work Involvement measure. The author states that a scale which measures both job and work involvement would achieve the following objectives in future research: • explore the nature of antecedents and consequences of both job and work
involvement; • emphasise alienation and involvement in the various life spheres, for
example work, family and community; • enable theoretical predictions relating to alienation and involvement to be
made more accurately; and • promote cross-cultural validity and allow findings related to both job and
work involvement to be determined more meaningfully.

SAJEMS SS No 1 (1999)
S - 8
Job Satisfaction: Landy (1985) emphasises the importance of work satisfaction (having one’s ability recognised) to human beings. He refers to the Hawthorne studies that found the following: (a) workers’ feelings affect their work behaviour, and (b) their perception of objective reality is more important than the facts of objective reality itself. McCormick and Illgen (1985) describe “intrinsic” satisfaction as the experience of a sense of competence, and “extrinsic” satisfaction as contentment derived from external rewards. General satisfaction should be seen as the sum total of intrinsic and extrinsic satisfaction. Landy (1985) again defines general job satisfaction as the total combination of worker feelings from all the important facets of his/her job. The Minnesota Satisfaction Questionnaire is one of the many questionnaires that measure the extent to which people are satisfied with their jobs. It was developed by Weiss, Dawis, England and Lofquist (1967), based on previously published job satisfaction scales. These authors constructed their job satisfaction theory around the assumption that individuals have a need to achieve and maintain correspondence with their environment. The individual’s interchange with the work environment is described in terms of fulfilment of environmental requirements (satisfactoriness), as well as individual requirements (satisfaction). Weiss et al. (1967) have a long (100 items) and a short (20 items) version of the Minnesota Satisfaction Questionnaire, measuring twenty and two dimensions respectively. The authors assert that the twenty-item short questionnaire assesses three dimensions, namely intrinsic, extrinsic and general satisfaction, where the last-mentioned is the sum of intrinsic and extrinsic satisfaction. Self-Concept: According to Loevinger (1966) the ability to form of a self-concept increases with age, socio-economic level, education and intelligence. This author sees the infant at the lowest point of self-conceptualisation, which develops to a stereotypically conventional self-concept in adolescence. With the increase in maturity, the individual is seen to advance beyond the stereotyped concept formed in adolescence to a more differentiated and realistic self-concept in adulthood. Anastasi (1990) remarks that a resurgence of interest in the self-concept has been witnessed during the 1980s, especially concentrating on the degree of self-acceptance by the individual. The aim of the selection of a Self-Concept scale in the present study, was to obtain a multifaceted scale, in order to do justice to the multivariate nature of the construct. The Six-Factor Self-Concept Scale for Adults developed by Stake (1994) was selected here, as a comprehensive instrument that provides a

SAJEMS SS No 1 (1999)
S - 9
multifaceted view of the individual’s self-concept across life settings, roles and activities. Stake (1994:56) defines the term self-concept in relation to the Six-Factor Self-Concept Scale for Adults as “the domain of self-descriptions that have a self-evaluative connotation”. The author argues that the global measurement of self-worth has proved less successful in research studies than domain-specific measures for the prediction of behaviour, hence the development of a multi-faceted adult self-concept scale. She holds that the need for an adult self-concept scale is inferred from the argument that maturity leads to self-evaluation from a broad range of life experiences, roles and relationships. It is further argued that measurement can be generally applied only if it pertains to a wide variety of adult roles, relationships, situations and occasions. According to Stake (1994) the development of this scale was aimed at the identification of sub-scales to represent self-evaluation (a) of universal relevance to adults, and (b) significant in a broad range of life experiences. Entrepreneurial Attitude: The Entrepreneurial Attitude Orientation Scale (EAOS) was developed by Robinson, Stimpson, Huefner and Hunt (1991) as a means of evaluating the attitudes of entrepreneurs, closely associated with business entrepreneurship in particular. Attitude is described by Shaver (1987) as the predisposition of behaving in a favourable or unfavourable manner towards a particular class of social objects. The authors of the EAOS see the general principles of the learning of attitudes applied here, namely those of association, reinforcement and imitation. They argue that behaviour is influenced by preferences that lead to attitudes, and that entrepreneurial attitude is therefore a potentially important predictor of entrepreneurial behaviour. Robinson et al. (1991) identified four entrepreneurial attitudes closely associated with business entrepreneurship: attitudes towards Economic Innovation, Achievement, Control and Self-Esteem. These variables are measured on the Entrepreneurial Attitude Orientation Scale by means of 26, 23, 12 and 14 items respectively. The notion that machiavellianism is an important element in entrepreneurial behaviour was added later by Stimpson (1993). It was however not included in the scale used in the present study, as little is known about the psychometric properties of the revised scale and the machiavellian sub-scale.

SAJEMS SS No 1 (1999)
S - 10
2 METHOD The present study explores various constructs of psychometric instruments developed in the United States with a view to determining their portability to a South African sample of professional people. The psychometric variables measured are those discussed above, namely: Type A Behaviour, Career Orientations, Job Involvement, Job Satisfaction, the Self-Concept and Entrepreneurial Attitude. The retest reliability of a South African-developed Locus of Control instrument is also examined. A group of professional people was selected in accordance with the aim of the study. A random sample was thus selected from the national registers of two occupational categories (sub-groups) - pharmacists and accountants. A survey research design was used. 3 PARTICIPANTS The biographical characteristics of the sample and sub-samples of participants are next discussed in order to gain a clear impression of the survey group(s). Information on the following biographic/demographic characteristics of the participants is given in table form below: professional occupation, age, gender, home language, private practitioner or employee status, number of jobs, number of years, number of organisations, marital status, urban or rural origin and province where respondents grew up. The respondents are classified into the two occupational groups shown in Table 1: Table 1 Distribution of Occupations
Occupation Number (N) Percent (%) Pharmacists 200 53.3 Accountants 175 46.7
Two hundred pharmacists and one hundred and seventy five accountants therefore took part in this study, respectively forming 53.3% and 46.7% of the total sample. Male participants represented a somewhat larger portion (58,9%) of the respondents than females (41.1%) in the total sample. The age distribution of the participants is as follows: The mean age of males was 45.72 years (SD = 12.79) and that of females 35.70 years (SD = 9.52 years). The age ranges of males and females were respectively 22 to 84 and 22 to 72
SAJEMS SS No 1 (1999)
S - 11
years. The mean age for the total sample is 41.6 years with a standard deviation of 12.46. The age variable is also differentiated according to occupation and employee status as shown below.
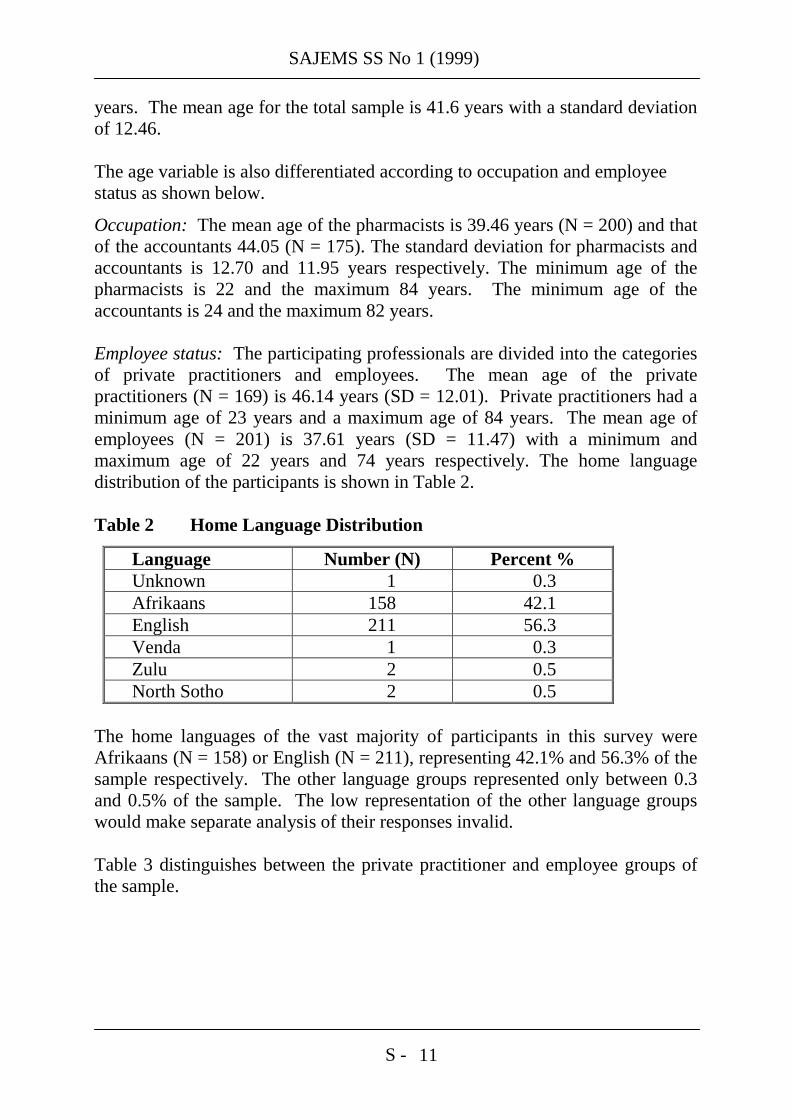
Occupation: The mean age of the pharmacists is 39.46 years (N = 200) and that of the accountants 44.05 (N = 175). The standard deviation for pharmacists and accountants is 12.70 and 11.95 years respectively. The minimum age of the pharmacists is 22 and the maximum 84 years. The minimum age of the accountants is 24 and the maximum 82 years. Employee status: The participating professionals are divided into the categories of private practitioners and employees. The mean age of the private practitioners (N = 169) is 46.14 years (SD = 12.01). Private practitioners had a minimum age of 23 years and a maximum age of 84 years. The mean age of employees (N = 201) is 37.61 years (SD = 11.47) with a minimum and maximum age of 22 years and 74 years respectively. The home language distribution of the participants is shown in Table 2. Table 2 Home Language Distribution
Language Number (N) Percent % Unknown 1 0.3 Afrikaans 158 42.1 English 211 56.3 Venda 1 0.3 Zulu 2 0.5 North Sotho 2 0.5
The home languages of the vast majority of participants in this survey were Afrikaans (N = 158) or English (N = 211), representing 42.1% and 56.3% of the sample respectively. The other language groups represented only between 0.3 and 0.5% of the sample. The low representation of the other language groups would make separate analysis of their responses invalid. Table 3 distinguishes between the private practitioner and employee groups of the sample.

SAJEMS SS No 1 (1999)
S - 12
Table 3 Distribution of Private Practitioner and Employee Status of Participants
Employment Number (N) Percent % Private practitioner 169 45.1 Employee 201 53.6 Unknown 5 1.3
The entire group of participants therefore consisted of 169 private practitioners and 201 employees, representing 45.7% and 54.3% of the total sample respectively, with the occupational status of five (1.3%) of the participants unknown. Table 4 shows the number of jobs previously and currently held by the participants, whether in the same or different organisations. Table 4 Distribution of Number of Jobs Held by Participants
Number of jobs Number (N) Percent % One 81 21.6 Two 73 19.5 Three 91 24.3 Four 67 17.9 Five 38 10.1 Six 15 4.0 Seven 5 1.3 Eight 1 0.3 Unknown 4 1.1
This table shows that the majority of persons participating in this project held between one and four jobs (21.8, 19.7, 24.5 and 18.1% of the total sample respectively) before the date of the present study. A smaller number of participants held between five and eight jobs, representing 10.2, 4.0, 1.3 and 0.3% of the total sample respectively. The mean number of years worked by participants is 18.07 (SD = 12.56). The number of organisations to which the participants have been attached is shown in Table 5.

SAJEMS SS No 1 (1999)
S - 13
Table 5 Number of Organisations to which Participants have been Attached
Number of orga-nisations
Number (N) Percent %
0 1 0.3 1 91 24.3 2 74 19.7 3 92 24.5 4 56 14.9 5 33 8.8 6 14 3.7 7 6 1.6 8 2 0.5 Unknown 6 1.6
This table shows that a large proportion of participants had worked for between 1 and 5 different organisations. The mean number of organisations worked for is 2.83 with a standard deviation of 1.56. The marital status of the participants is represented in Table 6. Table 6 Marital Status of Participants
Marital status Number (N) Percent % Single 62 16.5 Married 295 78.7 Divorced 10 2.7 Widow/er 6 1.6 Cohabiting 2 0.5
According to the above data the great majority of the participants were married (78.7%) and less than one-fifth (16.5%) single. An even smaller number were divorced, widowed or cohabiting, respectively forming only 2.7, 1.6 and 0.5% of the sample. The majority of participants (77.6%) grew up in an urban environment. The largest single group of participants (57.0%) are currently working in the Gauteng Province. This is in line with the proportion of the South African population living in this province, which is the main urban area in the country.

SAJEMS SS No 1 (1999)
S - 14
4 MEASURING INSTRUMENTS The statistical properties of the instruments tested in the study (and outlined above) are as follows. Type A Behaviour: The shortened version of the Jenkins Activity Survey, as developed by Pred, Spence and Helmreich (1986), was used in the present study. The reliability and internal consistency coefficient of the global score of the Jenkins Activity Survey, developed by Jenkins, Rosenman & Zyzanski (1974) ranges between 0.73 and 0.83. Jenkins et al. (1979) reported that, in different studies, the internal consistency of the Jenkins Activity Survey varied between 0.83 and 0.85. The authors also report test-retest reliabilities of 0.65 and 0.82 after intervals of four to six months respectively. Pred et al. (1986) who developed the shortened version of the Jenkins Activity Survey, took the items assigned to the factors Achievement and Impatience/Irritability from the original survey and applied these to 713 students. The responses were factor analysed by means of a Principal Axis solution and an oblinum (oblique) rotation. An eigenvalue-one criterion was used and a two-factor solution preferred. For men, eight items loaded on the Achievement factor using a 0.35 criterion and 5 items loaded on the Impatience/Irritability factor (N = 362). In the female sample (N = 351), the authors identified 7 items loading on the Achievement factor and 5 items on the Impatience/Irritability factor. The data were subjected to Confirmatory Factor Analysis and the results validated the two-factor structure. All the items loaded 0.30 or more on either of the two factors for both the male and female samples. The Chronbach Alpha coefficients for the scales were: 0.79 for the achievement striving scale for both men and women, and 0.65 and 0.64 for the impatience/irritability scale for men and women respectively. Pred et al. (1986) determined correlations between the long version of the Jenkins Activity Survey (measuring A-B Types, Hard-Driving Competitive Behaviour, Speed and Impatience and Achievement Striving) and the shortened version developed by them (measuring Achievement Striving and Impatience/Irritability). These correlations are shown in Table 7.

SAJEMS SS No 1 (1999)
S - 15
Table 7 Correlations Between the Three Original Jenkins Activity Survey Scales and the New Jenkins Activity Survey Scales (Male & Female) (Spence, Helmreich & Pred 1987)
Original New JAS Scale JAS Scale A-B H S AS II A-B 0.73** 0.80** 0.76** 0.43** H 0.68** 0.58** 0.83** 0.37** S 0.78** 0.53** 0.57** 0.70** AS 0.73** 0.82** 0.52** 0.21** II 0.40** 0.30** 0.67** 0.13**
** r = 0.01. H = Hard-Driving Competitiveness; S = Speed and Impatience; AS = Achievement Striving; I/I = Impatience/Irritability. Correlations for males (N = 362) are above the diagonal. Correlations for females (N = 351) are below the diagonal. Locus of Control: The Locus of Control Inventory developed by Schepers (1995) standardised on 1662 first-year university students, and is used in this study to revalidate the instrument in the South African working environment. The questionnaire used consisted of eighty items with a seven-point Likert-type response scale. This scale varies from “not at all” to “very strongly”. The reliability of the Locus of Control questionnaire was reported by Schepers (1995) as having a Cronbach Alpha of 0.841 for the External Control scale, 0.832 for the Internal Control scale and 0.866 for the Autonomy scale. This author reported the standard deviation of the scores to range between 13.359 and 17.079, and the mean scores between 79.730 and 148.001 on the three respective factors (Schepers, 1995). Career Orientations: The Career Orientations Inventory (Schein, 1995) was used in this study. It measures eight Career Anchors namely: “Security”; “Pure Challenge”; “Entrepreneurship”; “Lifestyle Integration”; “Managerial Competence”; “Technical/Functional Competence”; “Service Dedication” and “Autonomy/Independence”. The Career Orientations Inventory used here consists of forty items on a six-point scale. The response scale varies between “never true for me” and “always true for me”. Schein disclosed in a personal communication with Boshoff (1996) that the 40-item inventory actually measures eight career orientations, with the two security factors regarded as one variable, rather than nine orientations as was the case with the 1985 instrument. DeLong (1982b) verified the test-retest reliability coefficients of the Career Orientations Inventory sub-scales to lie between 0.71 and 0.91. Schein (1985) reported a revised 10-point Career Orientations Inventory to measure the

SAJEMS SS No 1 (1999)
S - 16
following nine Career Orientations: Geographic Security; Job Security; Pure Challenge; Entrepreneurship; Lifestyle Integration; Managerial Competence; Technical/Functional Competence; Service Dedication and Autonomy/ Independence. Boshoff, Kaplan and Kellerman (1988) found the Alpha coefficients for eight career orientations on the revised instrument to range from 0.73 to 0.86. According to these authors, only the Lifestyle Integration factor had an unacceptable internal reliability of r = 0.45. Kaplan (1990) used Varimax Rotation in his factor analysis of the Career Orientation Inventory in his South African study of fourteen professions (N = 1771). In this case, the Career Orientation Inventory factor-analysed into nine factors and the different factors accounted for between 5 and 16 per cent of the total variance. The psychometric properties of the later slightly revised instrument (Schein, 1995) consisted of eight factors. In the case of this instrument, the geographic and job security factors measure as one factor, namely security. The other seven factors are the same as on the previous scale and the psychometric qualities of these sub-scales can also be assumed the same as in earlier studies. Job Involvement: Only the Job Involvement scale of the Kanungo Job and Work involvement questionnaire was used in the current study. The Kanungo Job Involvement Questionnaire consists of ten items on a ten-point scale measuring one factor, namely “Job Involvement”. The response scale categories vary between “do not agree/not applicable to me” to “fully agree/fully applicable”. The Job and Work Involvement Questionnaire is reported by Kanungo (1982b) to have reasonably high levels of internal consistency, test-retest reliability, as well as validity. Kanungo (1982b) reports the Alpha coefficients for three Job Involvement measures (semantic differential, questionnaire and graphic items) used in the development of his scale to be 0.81, 0.87 and 0.70 respectively. He reported test-retest coefficients of 0.74, 0.85 and 0.82 respectively. Kanungo (1982b) also stated that the Job Involvement scale showed both convergent and discriminant validity. He concluded that his factor analysis proved Job Involvement to be a uni-dimensional construct. Blau (1985) as well as Reddy and Rahman (1984) report a high validity and reliability of the job and work involvement questionnaire developed by Kanungo. Kaplan, Boshoff and Kellerman (1991) verify a factorial distinctness of the “Job Involvement” and “Job satisfaction” constructs measured by Kanungo’s Job Involvement questionnaire. Kaplan (1990) concludes from his research on a South African sample of fourteen professional groups, that the Kanungo Job Involvement Scale is a robust and uni-dimensional measure, seeing that all the job involvement items loaded well above the 0.30 criterion on the single job involvement factor. These results support Blau’s (1985a) view

SAJEMS SS No 1 (1999)
S - 17
that the factor structure of the Kanungo Job Involvement Scale is not only stable across samples but also across cultures. Kamfer, Venter & Boshoff (1998) report from a sample of 237 employees of the South African Department of Correctional Services that eight of the original 10 items could be retained after factor analysis (discarding the two negatively phrased items numbers 2 and 7). These authors confirm that the Job Involvement single-factor solution has good internal consistency. Kamfer et al. (1998) suggest a one-factor solution for the Kanungo Job Involvement scale with a Cronbach Alpha of 0.86, that explains 47.95% of the total variance. The Confirmatory Factor Analysis done by these authors showed this to represent a good model-data fit. Kamfer et al. (1998) conclude that the scale could be considered highly applicable to non-native English speakers in South Africa. The re-analysis by Boshoff and Hoole (1998b) of Kaplan’s (1990) data based on a sample of 1791 white collar South African professionals, shows an acceptable internal consistency (Cronbach Alpha 0.83) of the Kanungo Job Involvement Questionnaire. One factor was measured accounting for 44.1% of the total variance. Only one item (no 7) was eliminated in this analysis. These authors conclude that this scale is probably uni-dimensional. They further state that the Job Involvement Questionnaire could be used with a great deal of confidence in South African samples and regard the construct to be quite portable between the USA and South Africa. Job Satisfaction: The short form of the Minnesota Satisfaction Questionnaire (MSQ) was used in this study. This consists of twenty items responded to on a five-point Likert-type scale, which varies from “very dissatisfied” to “very satisfied”. Weiss et al. (1967) reported internal reliability coefficient medians of 0.86 for intrinsic satisfaction, 0.80 for extrinsic satisfaction and 0.90 for general satisfaction. According to the authors, the Minnesota Satisfaction Questionnaire provides in a sound measure of overall job satisfaction. Kaplan (1990) investigated the responses of a South African sample of fourteen professional groups and found the three sub-scales of the MSQ to be highly correlated, sharing at least 32% common variance. Kaplan nevertheless retained the three-factor structure, arguing that it is conceptually meaningful and has a distinct appearance. This author reasons that the correlation between the sub-scales implies that the individual job facets are to some extent coloured by one’s view of the job as a whole. A two-factor solution for the Minnesota Satisfaction Questionnaire is suggested by Kamfer et al. (1998), who argue that all the original 20 items are retained by

SAJEMS SS No 1 (1999)
S - 18
this procedure. In the case of non-aggregated analysis, Cronbach Alpha is reported as 0.87 and 0.75 for factors one and two respectively. These two factors explained 40.62% of the total variance. Whereas factor one explains 31.51% of the total and 77.57% of the common variance, factor two accounts for 9.11% of the total and 22.43% of the common variance. The correlation between factors one and two is reported to be 0.41. In the case of aggregated analysis, Kamfer et al. (1998) report a Cronbach Alpha of 0.86 for factor one and 0.73 for factor two, the two factors explaining 71.58% of the total variance. Factor one explained 55.72% and factor two 15.86% of the total variance; whereas the first factor accounted for 77.84% and the second for 22.16% of the common variance. These factors correlate 0.55 when based on aggregated item scores. Boshoff and Hoole (1998b) report that the different items of the Minnesota Satisfaction Questionnaire seem to belong to one scale in a South African sample of 1791 professional people. The Cronbach Alpha coefficient is reported as 0.90 with the single factor containing 36.3% of the total variance. In this case, the authors argue that the MSQ was probably essentially one-dimensional. This conclusion was reached by Boshoff and Hoole (1998b) after a re-analysis of the data on which Kaplan based his view of the dimensionality of the Minnesota Satisfaction Questionnaire. Self-Concept: The Six-Factor Self-Concept Scale for Adults (Stake, 1994) was used, reportedly a carefully researched, easily administered and widely applicable instrument. The Six-Factor Self-Concept Scale for Adults consists of thirty-six items. This seven-point Likert-type response scale varied from “if it is never or almost never true of you” to “if it is always or almost always true of you”. This scale measures six factors, namely Likeability, Morality, and the four aspects of “agentic” functioning, namely Task Accomplishment, Giftedness, Power and Vulnerability. Stake (1994) associates “agentic” functioning with ability and performance, as seen in the four factors of Task Accomplishment, Giftedness, Power and Vulnerability. Stake (1994) also reports the test-retest reliabilities of the sub-scales of the Six-Factor Self-Concept Scale for Adults as: Power 0.84; Morality 0.88; Likeability 0.74; Task Accomplishment 0.78; Vulnerability 0.80; and Giftedness 0.82. The Cronbach coefficient of composite scores has an internal consistency of 0.97. This author states that in order to prove the validity of this instrument, the Self-Concept sub-scales should correlate higher with a Self-Esteem measure than a measure of Social Desirability. She further explains that the correlation with a Well-Being measure should fall between a Self-Esteem and a Social Desirability measure.

SAJEMS SS No 1 (1999)
S - 19
Convergent and discriminant validity of the sub-scales were tested as a set, as well as individually, by means of three studies consisting of 216 undergraduates, with the Rosenberg Self-Esteem Scale, the Ford Social Desirability Scale and the Monge Well-Being Scale. Stake (1994) reports correlation patterns to be consistent with expectations. Correlation among the Global Self-Esteem and sub-scales ranged from - 0.38 to + 0.42 with vulnerability yielding the only negative coefficient. The median absolute value is 0.38. All the correlations were significant at the 0.0001 probability level except for the Morality sub-scale (r = 0.19, p < 0.01). The reported multiple correlation between the six sub-scales and Global Self-Esteem is 0.62 (p < 0.001). The different correlations between Social Desirability and the Self-Concept sub-scales ranged between - 0.18 to + 0.32. The median absolute value is 0.16. Only the Morality sub-scale was reported to correlate higher with Social Desirability (r = 0.32) than Global Self-Esteem (r = 0.19). Social Desirability scores correlated between 0.23 with the Rosenberg and 0.20 with the Monge scales. The well-being correlations fell between the self-esteem and social desirability measures with coefficients ranging between - 0.33 and + 0.37. The median absolute value is given as 0.24. According to Stake (1994) three sub-scale validity tests provide substantive support for the convergent and discriminant validity of each of the sub-scales. She concludes that the sub-scales of the instrument are internally consistent and congruent across gender and age groups. These sub-scales should therefore be able to predict different variables. Entrepreneurial Attitude: The Entrepreneurial Attitude Orientation Scale [Robinson et al. (1991)] as used in the present study consists of seventy-five items responded to on a five-point Likert-type scale. The response scale varies between “strongly agree” to “strongly disagree”. The constructs measured are: attitudes to Economic Innovation, Achievement, Locus of Control and Self-Esteem in business. Robinson et al. (1991) report on the internal consistency of their scales in terms of Cronbach Alpha coefficients as follows: Achievement (0.84); Self-Esteem (0.73); Personal Control (0.70); and Economic Innovation (0.90). The test-retest reliabilities of the attitudinal sub-scales are reported as: Innovation (0.85); Achievement (0.76); Personal Control (0.71); and Self-Esteem (0.76). The test-retest reliability and Alpha coefficients for the machiavellianism sub-scale are not available and this sub-scale was not used in the present study. Robinson et al. (1991) measured the discriminatory validity of their scale by comparing the means of entrepreneur and non-entrepreneur scores with MANOVA. The authors report a significant overall difference and also significant differences in the total score as well as the different sub-scale scores. On each of the sub-scales, the univariate test showed a significant difference between entrepreneurs and non-entrepreneurs, with the former scoring significantly higher. A Stepwise Discriminant Analysis was utilised in the estimation of the predictive value of the four sub-scales. With the exception of

SAJEMS SS No 1 (1999)
S - 20
the achievement sub-scale, the sub-scales contributed significantly to the discriminant function. A 77% overall accuracy was shown by the classification coefficients in the prediction of group membership. Statistically significant correlations between the sub-scales are reported, indicating a common variance of between 20.5% and 51.4%. This shows a higher degree of redundancy than expected between the sub-scales. The correlations were however not high enough to combine the sub-scales. Robinson et al. (1991) regard the psychometric qualities of the Enterpreneural Attitude Orientation sub-scales as satisfactory when applied to North American respondents. Hoole and Boshoff (1997) report a three-factor solution when the instrument is applied to a South African sample (N = 299), consisting of entrepreneurs, engineers and managers. According to them, the factors in the three-factor solution may be interpreted as attitudes to Innovation, Achievement and Self-Esteem in business. To determine the discriminant validity of the Entrepreneurial Attitude Orientation Scale these authors used MANOVA, which showed the three sub-scales to have some degree of discriminant attribute. Hoole and Boshoff (1997) reported the scores of the three occupational groups to differ significantly on the scales measuring attitudes to Innovation and Achievement, but the scores of the three groups did not differ on attitude to Self-Esteem in business. These authors come to the conclusion that there is some justification for using an attitude-based approach for distinguishing entrepreneurs from non-entrepreneurs in the South African context. Boshoff and HooIe (1998a) evaluated the construct validity of the longer Entrepreneurial Attitude Orientation Scale, which included the machiavellianism sub-scale. This study was done on the same South African sample as in their 1997 study of three occupational groups, namely entrepreneurs (N = 110), engineers (N = 113) and individuals in managerial positions (N = 76). Boshoff and HooIe (1998a) report that the four-factor structure envisaged by Robinson et al. (1991) could not be replicated on this sample. In this study, a three-factor structure (containing interpretable factors) was seen as the best fit on the data. Boshoff and Hoole (1998a) explain that in their study, 40 items were left out of consideration in their factor analysis, representing a loss of 44.9% of the items. These authors accepted a three-factor solution containing items that measure Attitudes to Innovation, Assertiveness and Achievement, reasoning that this shows slightly better fit indices than the four-factor structure. Boshoff and Hoole (1998a) warn that the portability of at least two or probably three of the five constructs that were originally embodied in the Entrepreneurial Attitude Orientation Scale, must be called into question. They argue that the items included in the original United States factor scales of Personal Control, Self-Esteem and Machiavellianism disappear when applied to South Africa. It is therefore vital to consider the portability of a construct used in intercultural

SAJEMS SS No 1 (1999)
S - 21
research in an international context. Boshoff and Hoole (1998a) admit that their study has its limitations, as they did not investigate the predictive and discriminatory validity of the instrument. They also acknowledge that the sample on which the study was carried out was somewhat too small. 5 PROCEDURE Two methods of probability sampling were used in this survey, as expressed by Kerlinger (1986): (a) stratified sampling and (b) systematic sampling. Stratified sampling was used, by dividing the population into the two strata of professional groups (societies), respectively chartered accountants and pharmacists in the Gauteng Province of South Africa – the country’s economic heartland. Systematic sampling was used by dividing the total number of listed professionals (pharmacists and accountants respectively) by the size of each sample. The total number of individuals on the professional lists of accountants and pharmacists was divided by 60. The result was used as the interval from which sixty persons from each profession were initially selected in the Gauteng area. A questionnaire was mailed to every individual selected in this way. The questionnaire consisted of a covering letter (in English), a section eliciting biographic/demographic information and a section containing the psychometric tests. A pre-addressed, pre-stamped envelope was enclosed for the return of the questionnaire. From this selection a total of only 42 questionnaires were received back, which was inadequate for the purposes of the present study. A second sample of 50 persons was then selected from the two professions, accountants and pharmacists, omitting the previously selected participants. A total of 35 questionnaires were received back, which brought the total number of received questionnaires to 97. Twenty-nine questionnaires completed by individuals in the pharmacy and auditing professions were simultaneously gathered in the Western Cape. These individuals were randomly selected from the same professional lists as the members of the Gauteng sample and represented 29% of the 100 questionnaires distributed in a similar fashion in the Western Cape. It was decided on reconsideration that the sample of 137 respondents was still too small. A further random selection of 500 participants was made from each profession by means of systematic sampling. The total number of registered professionals was divided by 500 and this number was used as interval in the selection of 500 individuals from each professional registrar omitting the previous selected individuals. A letter informing selected persons about the research project was sent to them, and the participants were told that a questionnaire would follow. Three days later the questionnaires were posted. Each questionnaire contained a covering letter and a pre-addressed and pre-

SAJEMS SS No 1 (1999)
S - 22
stamped return envelope. The questionnaires were completed anonymously and participation was voluntarily, however, if participants requested feedback of the research results, they willingly identified themselves. Participants were reminded of the questionnaire and asked to forward it as soon as possible by means of a letter posted one week after the questionnaire. Three weeks after the reminder letter, yet another letter was posted as a last attempt to get co-operation. A total of 273 of these questionnaires were returned in addition to the previous 137 responses. Of the total number of 410 questionnaires only 375 were regarded as usable, that is, all the psychometric items of the questionnaires had been completed. The analysis of the responses was planned and directed by the present authors and the statistical analysis carried out at the Information Technology Department of the University of Pretoria. The structure and internal reliability of each instrument used was revalidated by means of factor analysis. These structures were then compared to the structures of the original questionnaires. The following steps were executed. Eigenvalues > 1.00 were identified. “Clear” breaks between the eigenvalues > 1.00 were identified by means of a Scree test. These identified breaks were taken as indications of the number of possible factors. A Principal Factor Analysis with Direct Quartimin rotation was done according to the number of determined factors. The BMDP 4M programme was used for this purpose. For example, if the Scree test identifies that potentially three, four and five factors are present, than a Principal Factor Analysis is done on all the items specifying three, four and five factor solutions. The results of the Principal Factor Analysis is evaluated by taking the following into account: (a) items are identified which do not load ≥ 0.25 on any factor in any solution, as well as (b) those items loading ≥ 0.25 on more than one factor in any of the solutions. These identified items are left out of the following round of Principal Factor Analysis again carried out for the three, four and five factor solutions. With the results of this subsequent round of Principal Factor Analysis, the same decision rules are followed as in the previous round: should an item not load ≥ 0.25 on any factor in any solution or load ≥ 0.25 on more than one factor in any solution, these factors are removed from further analysis. The process is repeated until no “problematic” items remain on any factor according to the described evaluative procedure. In order to choose the best solution, Confirmatory Factor Analysis is done using SAS (Proc Callis) on the “clean” structures obtained. The purpose of Principal and Confirmatory Factor Analysis is to eliminate error variance in the measurements, as far as possible.

SAJEMS SS No 1 (1999)
S - 23
Bagozzi and Heatherton (1994) indicated that the indices obtained from a Confirmatory Factor Analysis could be an underestimation of the quality of the fit between a measurement model and the data on which it is based. This could happen when the factors included in the analysis contain a large number of items. Bagozzi and Heatherton (1994) suggest that aggregation of factor scores can be used to reduce the problem, and to obtain more accurate estimates of the value of the indices generated by Confirmatory Factor Analysis. The analysis carried out leads to a revalidation of the constructs and measurements of the responses of this South African sample. The results of the statistical analysis of the different instruments used for measuring the variables included in the study are next presented. 6 TYPE A BEHAVIOUR PATTERN In order to determine the acceptability of the psychometric qualities of the shortened version of the Jenkins Activity Type A Survey (1979) when applied to a South African sample, the factor analytical procedure as described above was followed. This analysis of 13 items identified four eigenvalues > 1. The eigenvalues were respectively 2.48, 1.73, 1.45 and 1.048. It seemed that there were clear “breaks” between the third and fourth and the fourth and fifth eigenvalues. It was therefore decided to extract both three and four factors during the first round of analysis. (The existence of two factors would be in agreement with the findings of the authors of the shortened version of the Jenkins Activity Survey.) Principal Factor Analysis was used to analyse the responses of the total sample (N = 375) with Direct Quartimin rotation of the axes. In the four-factor solution two factors consisted of only two items each. Moreover, seeing that the Cronbach Alpha coefficient for the third factor was only 0.41 and for the fourth factor only 0.48 in the four-factor solution, it was decided not to pursue this solution any further. The four-factor structure obtained is shown in Table 8. Table 8 Rotated Factor Loading Pattern in the four-factor solution of
the shortened form of the Jenkins activity survey (N = 375)
Item Factor 1 Factor 2 Factor 3 Factor 4 Jenkins 5 0.722 Jenkins 6 0.728 Jenkins 8 0.402 Jenkins 2 0.819 Jenkins 3 0.445

SAJEMS SS No 1 (1999)
S - 24
Table 8 continued Item Factor 1 Factor 2 Factor 3 Factor 4 Jenkins 4 0.401 Jenkins 9 0.553 Jenkins 10 0.521 Jenkins 13 0.374 Jenkins 11 0.488 Jenkins 12 0.554
Factor 1 Factor 2 Factor 3 Factor 4 Cronbach Alpha 0.66 0.52 0.41 0.48 Total variance 14.92 7.65 6.50 2.27 Common variance 47.60 24.39 20.75 7.26 The intercorrelation between the four factors is shown in Table 9: Table 9 Intercorrelation of the Jenkins Activity Scale four-factor solution
Factor 1 Factor 2 Factor 3 Factor 4 Factor 1 1.000 Factor 2 0.318 1.000 Factor 3 0.166 0.134 1.000 Factor 4 0.262 -0.283 -0.126 1.000
Item B4 did not load on any factor in the three-factor solution. A loading of ≥ 0.30 was found for each of the remaining items of the three factors. The three-factor structure obtained is shown in Table 10. Table 10 Rotated Factor Loading Pattern in the three-factor solution of the Shortened Form of the Jenkins Activity Survey (N = 375)
Item Factor 1 Factor 2 Factor 3 Jenkins 5 0.621 Jenkins 6 0.734 Jenkins 8 0.391 Jenkins 11 0.374 Jenkins 12 0.524 Jenkins 7 0.401 Jenkins 9 0.584 Jenkins 10 0.490 Jenkins 13 0.362

SAJEMS SS No 1 (1999)
S - 25
Table 10 continued
Item Factor 1 Factor 2 Factor 3 Jenkins 1 0.326 Jenkins 2 0.689 Jenkins 3 0.502
Factor 1 Factor 2 Factor 3 Cronbach Alpha 0.65 0.53 0.49 Total variance 15.90 7.96 6.42 Common variance 52.52 26.27 21.21 The intercorrelation between the factors is shown in Table 11. Table 11 Intercorrelation of the Jenkins Activity Scale three-factor solution
Factor 1 Factor 2 Factor 3 Factor 1 1.000 Factor 2 0.041 1.000 Factor 3 0.050 0.216 1.000
The Confirmatory Factor Analysis carried out on the three-factor structure yielded the indices shown in Table12. Table 12 Results of Confirmatory Factor Analysis of the Shortened Form
of the Jenkins Activity Survey on the three-factor model (N = 375)
Indices Value Fit criterion 0.4138 Goodness of Fit Index (GFI) 0.9337 GFI Adjusted for Degrees of Freedom (AGFI) 0.9043 Root Mean Square Residual (RMR) 0.0883 Parsimonious GFI (PGFI) 0.7640 Chi-square (df = 54, p > Chi² = 0.0001) 154.7617 Null Model Chi² (df = 66) 589.8012 RMSEA Estimate (90% CI = 0.0577 to 0.0838) 0.0706 Probability of Close Fit 0.0050 ECVI Estimate (90% C I = 0.4564 to 0.6584) 0.5468 Bentler’s Comparative Fit Index 0.8076 Normal Theory Reweighted LS Chi-square 159.2797 Akaike’s Information Criterion 46.7617

SAJEMS SS No 1 (1999)
S - 26
Table 12 continued Indices Value Bozdogan’s (1987) CAIC -219.2923 Schwarz’s Bayesian Criterion -165.2923 McDonald’s (1989) Centrality 0.8743 Bentler & Bonett’s (1980) non-normed Index 0.7649 Bentler & Bonett’s (1980) NFI 0.7376 James, Mulaik, & Brett (1982) Parsimonious NFI 0.6035 Z-Test of Wilson & Hilferty (1931) 6.6182 Bollen (1986) Normed Index Rhoi 0.6793 Bollen (1988) non-normed Index Delta2 0.8119 Hoelter’s (1983) Critical N 176 RNI 0.8076
From the above Confirmatory Factor Analysis, it is concluded that the three-factor structure seems to represent an inadequate to reasonable fit on the data. The three factors identified were respectively: Achievement (factor 1), Hard Driving/Competitive (factor 2) and Impatience/Irritability (factor 3). Following the argument by Bagozzi and Heatherton (1994), an aggregation of the factors and Confirmatory Factor Analysis of the three-factor solution was carried out. The results of the Confirmatory Factor Analysis are shown in Table 13. Table 13 Confirmatory Factor Analysis of the three factor model of the Jenkins Activity Survey with Item Aggregation (N = 375)
Indices Value Fit criterion 0.0756 Goodness of Fit Index (GFI) 0.9793 GFI Adjusted for Degrees of Freedom (AGFI) 0.9585 Root Mean Square Residual (RMR) 0.0633 Parsimonious GFI (PGFI) 0.6528 Chi-square (df = 14, p > Chi² = 0.0131) 28.2742 Null Model Chi² (df = 21) 296.2957 RMSEA Estimate (90% CI = 0.0232 to 0.0800) 0.0522 Probability of Close Fit 0.4095 ECVI Estimate (90% C I = 0.1214 to 0.2040) 0.1521 Bentler’s Comparative Fit Index 0.9481 Normal Theory Reweighted LS Chi-square 27.7207 Akaike’s Information Criterion 0.2742 Bozdogan’s (1987) CAIC -68.7027

SAJEMS SS No 1 (1999)
S - 27
Table 13 continued Indices Value Schwarz’s Bayesian Criterion -54.7027 McDonald’s (1989) Centrality 0.9811 Bentler & Bonett’s (1980) non-normed Index 0.9222 Bentler & Bonett’s (1980) NFI 0.9046 James, Mulaik, & Brett (1982) Parsimonious NFI 0.6030 Z-Test of Wilson & Hilferty (1931) 2.2216 Bollen (1986) Normed Index Rhoi 0.8569 Bollen (1988) non-normed Index Delta2 0.9494 Hoelter’s (1983) Critical N 315 RNI 0.9481
The indices shown in Table 13 indicate a good fit of the measurement model on the data. The result must however be interpreted with caution as the indices shown may represent an overestimation of the quality of the fit. This could be the case due to the relatively short factor scales shown in Table 10. 7 STATISTICAL PROPERTIES OF THE LOCUS OF CONTROL
QUESTIONNAIRE The current analysis included all 80 items of the original questionnaire and produced 23 eigenvalues > 1. These eigenvalues were: 11.73, 5.89, 3.15, 2.53, 2.18, 2.04, 1.93, 1.77, 1.66, 1.56, 1.50, 1.48, 1.39, 1.35, 1.29, 1.26, 1.23, 1.21, 1.16, 1.13, 1.05, 1.03, and 1.03. Clear “breaks” were evident between the second and third, and the third and fourth eigenvalues. Both two and three factors were extracted during the first round of the analysis. (The existence of three factors would be in agreement with the findings of the author of the instrument.) The responses of the total sample (N = 375) for this Locus of Control scale were analysed by means of Principal Factor Analysis with Direct Quartimin rotation of the axes. A Principal Factor Analysis was done to develop two- and three-factor models and the factor loadings obtained for the two solutions shown in the following two tables.

SAJEMS SS No 1 (1999)
S - 28
Table 14 Rotated Factor Loading Pattern in two-factor solution of the Locus of Control Questionnaire (N = 375)
Item Factor 1 Factor 2 LC1 0.366 LC2 0.439 LC3 0.319 LC5 0.538 LC6 0.298 LC7 0.260 LC8 0.299 LC10 0.369 LC11 0.282 LC13 0.644 LC14 0.603 LC15 0.419 LC16 0.253 LC17 0.479 LC18 0.251 LC19 0.350 LC22 0.537 LC24 0.497 LC25 0.463 LC27 0.536 LC28 0.606 LC29 0.463 LC30 0.610 LC31 0.307 LC37 0.485 LC40 0.393 LC42 0.390 LC44 0.560 LC46 0.488 LC48 0.320 LC49 0.267 LC54 0.371 LC55 0.517 LC60 0.488 LC62 0.361 LC63 0.335 LC66 0.602 LC67 0.503 LC68 0.491

SAJEMS SS No 1 (1999)
S - 29
Table 14 continued
Item Factor 1 Factor 2 LC69 0.529 LC70 0.550 LC73 0.516 LC74 0.640 LC75 0.437 LC76 0.286 LC9 0.339 LC12 0.577 LC20 0.394 LC26 0.253 LC34 0.564 LC35 0.527 LC36 0.664 LC38 0.270 LC39 0.396 LC41 0.648 LC43 0.417 LC45 0.468 LC47 0.364 LC50 0.278 LC51 0.454 LC52 0.383 LC53 0.509 LC56 0.524 LC57 0.526 LC58 0.306 LC59 0.300 LC65 0.364 LC72 0.250 LC79 0.604 LC80 0.519
Factor 1 Factor 2 Cronbach Alpha 0.92 0.85 Total variance 15.13 7.01 Common variance 68.31 31.69 The two factors correlated –0.164 with each other. Of the 80 items 62 were included in this solution.

SAJEMS SS No 1 (1999)
S - 30
Table 15 Rotated Factor Loading Pattern of the three-factor solution of the Locus of Control Questionnaire (N = 375)
Item Factor 1 Factor 2 Factor 3 LC1 0.386 LC2 0.486 LC3 0.342 LC5 0.570 LC8 0.306 LC10 0.341 LC11 0.264 LC13 0.657 LC14 0.606 LC15 0.417 LC17 0.491 LC22 0.582 LC24 0.527 LC25 0.465 LC27 0.532 LC28 0.630 LC29 0.505 LC30 0.643 LC37 0.464 LC39 0.258 LC40 0.379 LC42 0.381 LC44 0.558 LC46 0.454 LC48 0.283 LC54 0.344 LC55 0.482 LC60 0.440 LC63 0.285 LC67 0.496 LC68 0.484 LC69 0.511 LC70 0.559 LC71 0.271 LC73 0.533 LC74 0.658 LC75 0.425 LC76 0.260 LC9 0.364

SAJEMS SS No 1 (1999)
S - 31
Table 15 continued Item Factor 1 Factor 2 Factor 3 LC20 0.378 LC26 0.273 LC43 0.378 LC45 0.434 LC47 0.328 LC50 0.336 LC51 0.515 LC52 0.382 LC53 0.535 LC56 0.652 LC57 0.610 LC58 0.519 LC59 0.350 LC12 0.693 LC34 0.726 LC36 0.782 LC41 0.688 LC79 0.538
Factor 1 Factor 2 Factor 3 Cronbach Alpha 0.91 0.78 0.84 Total variance 17.12 7.04 3.11 Common variance 62.75 25,84 11.4 In the three-factor structure 23 of the 80 items in the questionnaire were excluded. The three-factor structure produced factors which were named as: Factor 1: Internal Locus of Control; Factor 2: External Locus of Control and Factor 3: Vicissitudes in Life. The correlations between the factors are shown in Table 16: Table 16 Intercorrelation of the Locus of Control Questionnaire three- factor solution
Factor 1 Factor 2 Factor 3 Factor 1 1.000 Factor 2 -0.250 1.000 Factor 3 -0.093 0.300 1.000
Confirmatory Factor Analysis was carried out on the two- and three-factor structures yielding the indices shown in Table 17.

SAJEMS SS No 1 (1999)
S - 32
Table 17 Results of Confirmatory Factor Analysis of the Locus of Control three-factor model (N = 375)
Indices Two Three Fit criterion 16.0170 8.6544 Goodness of Fit Index (GFI) 0.6588 0.7610 GFI Adjusted for Degrees of Freedom (AGFI)
0.6395 0.7433
Root Mean Square Residual (RMR) 0.0892 0.0944 Parsimonious GFI (PGFI) 0.6407 0.7339 Chi-square (p > Chi² = 0.0001) 5990.3632
(df = 2627) 3236.7345
(df = 1539) Null Model Chi² 10686.9806
(df = 2701) 7534.4831
(df = 1596) RMSEA Estimate (90% CI) 0.0585
(0.0566 to 0.0605)
0.0543 (0.0517
to 0.0569) Probability of Close Fit 0.0000 0.0035 ECVI Estimate (90% C I) 17.0070
(16.3714 to 17.6688)
9.3759 (8.9268 to
9.8499) Bentler’s Comparative Fit Index 0.5788 0.7141 Normal Theory Reweighted LS Chi-square
7167.9204 3346.9316
Akaike’s Information Criterion 736.3632 158.7345 Bozdogan’s (1987) CAIC -12206.671 -7423.8046 Schwarz’s Bayesian Criterion -9579.6715 -5884.8046 McDonald’s (1989) Centrality 0.0113 0.1040 Bentler & Bonett’s (1980) non-normed Index
0.5670 0.7035
Bentler & Bonett’s (1980) NFI 0.4395 0.5704 James, Mulaik, & Brett (1982) Parsimonious NFI
0.4274 0.5500
Z-Test of Wilson & Hilferty (1931) 34.3916 23.4148 Bollen (1986) Normed Index Rhoi 0.4237 0.5545 Bollen (1988) non-normed Index Delta2
0.5827 0.7168
Hoelter’s (1983) Critical N 173 190 RNI 0.5788 0.7141
The indices obtained from the two-factor solution of the Confirmatory Factor Analysis do not seem to represent as good a fit as the three-factor solution. The
SAJEMS SS No 1 (1999)
S - 33
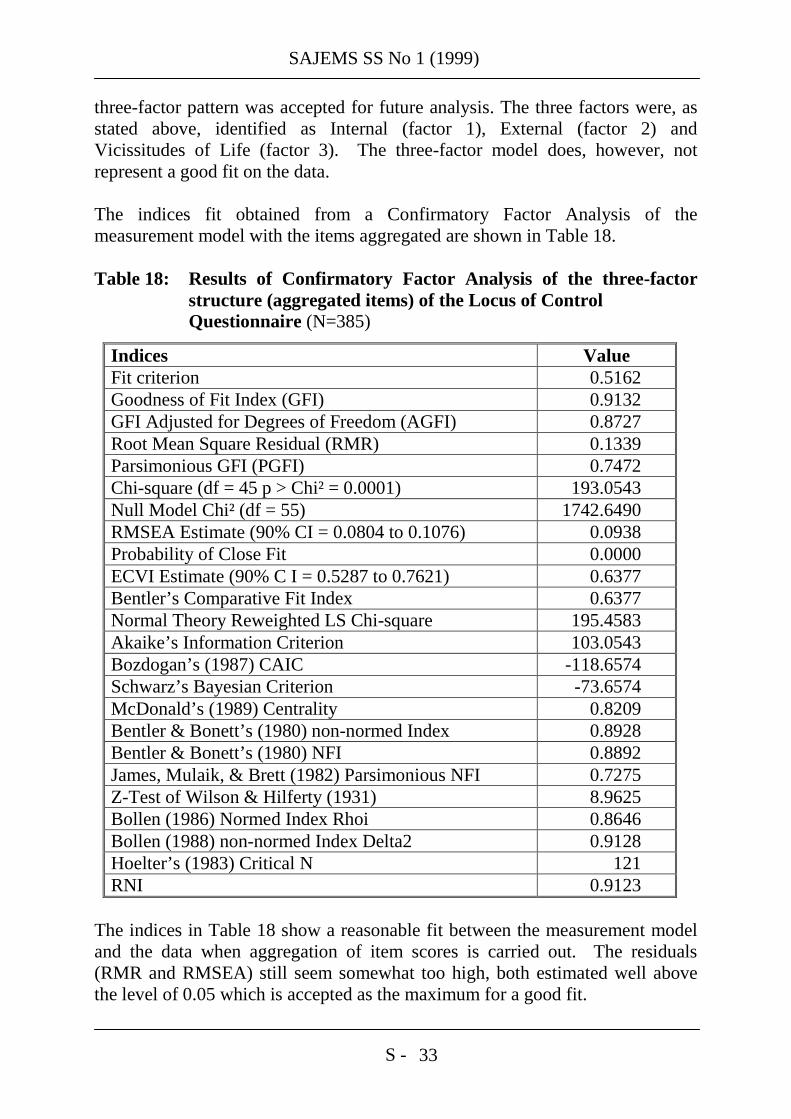
three-factor pattern was accepted for future analysis. The three factors were, as stated above, identified as Internal (factor 1), External (factor 2) and Vicissitudes of Life (factor 3). The three-factor model does, however, not represent a good fit on the data. The indices fit obtained from a Confirmatory Factor Analysis of the measurement model with the items aggregated are shown in Table 18. Table 18: Results of Confirmatory Factor Analysis of the three-factor
structure (aggregated items) of the Locus of Control Questionnaire (N=385)
Indices Value Fit criterion 0.5162 Goodness of Fit Index (GFI) 0.9132 GFI Adjusted for Degrees of Freedom (AGFI) 0.8727 Root Mean Square Residual (RMR) 0.1339 Parsimonious GFI (PGFI) 0.7472 Chi-square (df = 45 p > Chi² = 0.0001) 193.0543 Null Model Chi² (df = 55) 1742.6490 RMSEA Estimate (90% CI = 0.0804 to 0.1076) 0.0938 Probability of Close Fit 0.0000 ECVI Estimate (90% C I = 0.5287 to 0.7621) 0.6377 Bentler’s Comparative Fit Index 0.6377 Normal Theory Reweighted LS Chi-square 195.4583 Akaike’s Information Criterion 103.0543 Bozdogan’s (1987) CAIC -118.6574 Schwarz’s Bayesian Criterion -73.6574 McDonald’s (1989) Centrality 0.8209 Bentler & Bonett’s (1980) non-normed Index 0.8928 Bentler & Bonett’s (1980) NFI 0.8892 James, Mulaik, & Brett (1982) Parsimonious NFI 0.7275 Z-Test of Wilson & Hilferty (1931) 8.9625 Bollen (1986) Normed Index Rhoi 0.8646 Bollen (1988) non-normed Index Delta2 0.9128 Hoelter’s (1983) Critical N 121 RNI 0.9123
The indices in Table 18 show a reasonable fit between the measurement model and the data when aggregation of item scores is carried out. The residuals (RMR and RMSEA) still seem somewhat too high, both estimated well above the level of 0.05 which is accepted as the maximum for a good fit.

SAJEMS SS No 1 (1999)
S - 34
8 CAREER ORIENTATION INVENTORY A Principal Factor Analysis of the responses to the Career Orientation Inventory was again done as an exploratory process (as described above) followed by Direct Quartimin rotation of the axes based on the sample of N = 375 professionals. Nine eigenvalues > 1.00 were obtained, namely 8.80517, 4.22710, 2.92523, 2.48958, 1.61871, 1.54380, 1.35776, 1.14745 and 1.11325. A clear “break” was present between the fourth and fifth eigenvalues. [Schein (1995) the author of the revised instrument, indicates the existence of eight factors.] The factor loadings in the final four-factor solution are presented in Table 19. Table 19 Rotated Factor Loading Pattern of the four-factor solution of the Career Orientation Inventory (N = 375)
Item Factor 1 Factor 2 Factor 3 Factor 4 CO1 0.568 CO 2 0.581 CO 6 0.348 CO 7 0.719 CO 9 0.550 CO 10 0.636 CO 14 0.268 CO 15 0.723 CO 23 0.691 CO 31 0.762 CO 39 0.515 CO 4 0.746 CO 12 0.430 CO 20 0.745 CO 28 0.701 CO 36 0.738 CO 5 0.743 CO 13 0.776 CO 19 0.384 CO 35 0.286 CO 37 0.948 CO 16 0.399 CO 24 0.649 CO 32 0.876

SAJEMS SS No 1 (1999)
S - 35
Factor 1 Factor 2 Factor 3 Factor 4 Cronbach Alpha 0.80 0.81 0.80 0.72 Total variance 20.57 11.9 7.68 4.87 Common variance 45.70 26.42 17.06 10.82 In this solution 24 of the original 40 items in the instrument are retained. The four-factor structure consisted of factors interpreted as Factor 1: Service, Factor 2: Security, Factor 3: Entrepreneurial and Factor 4: Lifestyle integration. Table 20 shows the intercorrelation between the four factors. Table 20 Intercorrelation of the Career Orientations Inventory four- factor solution
Factor 1 Factor 2 Factor 3 Factor 4 Factor 1 1.000 Factor 2 0.169 1.000 Factor 3 0.412 -0.073 1.000 Factor 4 0.224 0.264 0.198 1.000
Confirmatory Factor Analysis carried out on the four-factor structure yielded the indices shown in Table 21. Table 21 Results of Confirmatory Factor Analysis of the Career Orientations Inventory of the four-factor model (N = 375)
Indices Value Fit criterion 2.3580 Goodness of Fit Index (GFI) 0.8273 GFI Adjusted for Degrees of Freedom (AGFI) 0.7944 Root Mean Square Residual (RMR) 0.1321 Parsimonious GFI (PGFI) 0.7554 Chi-square (df = 252, p > Chi² = 0.0001) 881.9063 Null Model Chi² (df = 276) 3562.6298 RMSEA Estimate (90% CI 0.0759 to 0.0877) 0.0818 Probability of Close Fit 0.0000 ECVI Estimate (90% C I 2.3951 to 2.8929) 2.6331 Bentler’s Comparative Fit Index 0.8083 Normal Theory Reweighted LS Chi-square 936.6995 Akaike’s Information Criterion 377.9063 Bozdogan’s (1987) CAIC -863.6791 Schwarz’s Bayesian Criterion -611.6791

SAJEMS SS No 1 (1999)
S - 36
Table 21 continued Indices Value McDonald’s (1989) Centrality 0.4318 Bentler & Bonett’s (1980) non-normed Index 0.7901 Bentler & Bonett’s (1980) NFI 0.7525 James, Mulaik, & Brett (1982) Parsimonious NFI 0.6870 Z-Test of Wilson & Hilferty (1931) 17.4814 Bollen (1986) Normed Index Rhoi 0.7289 Bollen (1988) non-normed Index Delta2 0.8097 Hoelter’s (1983) Critical N 124 RNI 0.8083
The indices in Table 21 point to an unsatisfactory fit between the data and the four-factor structure. It was decided to aggregate the items in the different factors again, in order to determine whether reduction of item error variance would improve the fit between the measurement model and the data. The results of the Confirmatory Factor Analysis carried out on the four-factor structure with item scores aggregated are shown Table 22. Table 22 Results of Confirmatory Factor Analysis of the four-factor structure with Aggregation of Item Scores (N = 375)
Indices Value Fit criterion 0.7022 Goodness of Fit Index (GFI) 0.8871 GFI Adjusted for Degrees of Freedom (AGFI) 0.8306 Root Mean Square Residual (RMR) 0.1612 Parsimonious GFI (PGFI) 0.7096 Chi-square (df = 44 p > Chi² = 0.0001) 262.6245 Null Model Chi² (df = 55) 1546.9906 RMSEA Estimate (90% CI = 0.1020 to 0.1289) 0.1153 Probability of Close Fit 0.0000 ECVI Estimate (90% C I = 0.6955 to 0.9728) 0.8238 Bentler’s Comparative Fit Index 0.8535 Normal Theory Reweighted LS Chi-square 261.8997 Akaike’s Information Criterion 174.6245 Bozdogan’s (1987) CAIC -42.1603 Schwarz’s Bayesian Criterion 1.8397 McDonald’s (1989) Centrality 0.7471 Bentler & Bonett’s (1980) non-normed Index 0.8168

SAJEMS SS No 1 (1999)
S - 37
Table 22 continued Indices Value Bentler & Bonett’s (1980) NFI 0.8302 James, Mulaik, & Brett (1982) Parsimonious NFI 0.6642 Z-Test of Wilson & Hilferty (1931) 11.5245 Bollen (1986) Normed Index Rhoi 0.7878 Bollen (1988) non-normed Index Delta2 0.8545 Hoelter’s (1983) Critical N 88 RNI 0.8535
The indices shown in Table 22 still reflect a relatively poor fit between the data and the four-factor structure. 9 KANUNGO JOB INVOLVEMENT QUESTIONNAIRE Principal Factor Analysis followed by a Direct Quartimin rotation was carried out on the underlying dimensions of Job Involvement as manifested in the responses of the present sample members. The analysis of the 10 items yielded one eigenvalue > 1 of 5.03021. A clear “break” existed between the first and second eigenvalues, suggesting a one-factor solution. This is in agreement with the findings of the instrument’s authors. All ten items loaded ≥ 0.25 on the one factor. The Principal Factor Analysis results for the one-factor solution is shown in Table 23: Table 23 Factor Loading Pattern in one-factor solution of the Kanungo Job Involvement Questionnaire (N = 375)
Item Factor 1 Kanungo 1 0.376 Kanungo 2 0.548 Kanungo 3 0.740 Kanungo 4 0.692 Kanungo 5 0.785 Kanungo 6 0.812 Kanungo 7 0.353 Kanungo 8 0.740 Kanungo 9 0.789 Kanungo 10 0.719
Cronbach Alpha 0.88 Total variance 45.55% Common variance 100%

SAJEMS SS No 1 (1999)
S - 38
Confirmatory Factor Analysis was carried out on the one-factor structure yielding the indices shown in Table 24. Table 24 Results of Confirmatory Factor Analysis of the Kanungo Job Involvement Questionnaire of the One-Factor Model (N=375)
Indices Value Fit criterion 0.4272 Goodness of Fit Index (GFI) 0.9174 GFI Adjusted for Degrees of Freedom (AGFI) 0.8701 Root Mean Square Residual (RMR) 0.0463 Parsimonious GFI (PGFI) 0.7135 Chi-square (df = 35, p > Chi² = 0.0001) 159.7838 Null Model Chi² (df = 45) 1726.6639 RMSEA Estimate (90% CI 0.0826 to 0.1132) 0.0976 Probability of Close Fit 0.0000 ECVI Estimate (90% CI 0.4413 to 0.6543) 0.5374 Bentler’s Comparative Fit Index 0.9258 Normal Theory Reweighted LS Chi-square 168.4456 Akaike’s Information Criterion 89.7838 Bozdogan’s (1987) CAIC -82.6587 Schwarz’s Bayesian Criterion -47.6587 McDonald’s (1989) Centrality 0.8467 Bentler & Bonett’s (1980) non-normed Index 0.9046 Bentler & Bonett’s (1980) NFI 0.9075 James, Mulaik, & Brett (1982) Parsimonious NFI 0.7058 Z-Test of Wilson & Hilferty (1931) 8.3489 Bollen (1986) Normed Index Rhoi 0.8810 Bollen (1988) non-normed Index Delta2 0.9262 Hoelter’s (1983) Critical N 118 RNI 0.9258
The indices in Table 24 show a good fit between the data and the one-factor structure. Due to the finding that the Job Involvement construct was uni-dimensional, it was decided not to aggregate the item scores and not to do further Confirmatory Factor Analysis on the factor structure.

SAJEMS SS No 1 (1999)
S - 39
10 MINNESOTA SATISFACTION QUESTIONNAIRE The Principal Factor Analysis of the participants’ responses in the present study yielded four eigenvalues > 1 of the 20 items in the Minnesota Satisfaction Questionnaire (MSQ). These eigenvalues were respectively 7.97, 1.75, 1.29 and 1.10. Clear “breaks” seemed to exist between the first and second, second and third, third and fourth as well as fourth and fifth eigenvalues. One, two, three and four factors were extracted during the first round of the Principal Factor Analysis. The existence of two factors would be in agreement with the findings of the authors of the instrument. A Principal Factor Analysis was done with Direct Quartimin rotation of the axes extracting the stated numbers of factors. The inspection of the final factor patterns showed that all the items in the questionnaire loaded ≥ 0.25 on the one factor in the one-factor solution. Due to the relatively low Cronbach Alpha coefficients (0.81, 0.68, 0.85 and 0.71 respectively) obtained during the first round of Principal Factor Analysis, it was decided to leave out the four-factor solution from further analysis. The factor loadings obtained in the different solutions of Principal Factor Analysis are shown Tables 25, 26 and 27: Table 25 Rotated Factor Loading Pattern of the one-factor solution of the Minnesota Satisfaction Questionnaire (N = 375)
Item Factor 1 MSQ 1 0.581 MSQ 2 0.485 MSQ 3 0.642 MSQ 4 0.603 MSQ 5 0.471 MSQ 6 0.444 MSQ 7 0.486 MSQ 8 0.587 MSQ 9 0.509 MSQ 10 0.590 MSQ 11 0.732 MSQ 12 0.569 MSQ 13 0.510 MSQ 14 0.579 MSQ 15 0.752 MSQ 16 0.755 MSQ 17 0.680 MSQ 18 0.535 MSQ 19 0.678 MSQ 20 0.780

SAJEMS SS No 1 (1999)
S - 40
Cronbach Alpha 0.9182 Total variance 36.82 The two-factor solution pattern loading is shown in Table 26. Three items did not load satisfactorily in this solution and were excluded from the factor structure. Table 26 Rotated Factor Loading Pattern of the two-factor solution of the Minnesota Satisfaction Questionnaire (N = 375)
Item Factor 1 Factor 2 MSQ 1 0.589 MSQ 2 0.521 MSQ 3 0.690 MSQ 4 0.604 MSQ 7 0.480 MSQ 8 0.562 MSQ 9 0.597 MSQ 10 0.610 MSQ 11 0.782 MSQ 13 0.445 MSQ 14 0.506 MSQ 15 0.740 MSQ 16 0.777 MSQ 17 0.563 MSQ 20 0.786 MSQ 5 0.818 MSQ 6 0.868
Factor 1 Factor 2 Cronbach Alpha 0.90 0.85 Total variance 36.74 7.54 Common variance 82.97 17.03 The first factor correlated 0.40 with the second factor. The loadings acquired in the three-factor solution are shown in Table 27.

SAJEMS SS No 1 (1999)
S - 41
Table 27 Rotated Factor Loading Pattern of the three-factor solution of the Minnesota Satisfaction Questionnaire (N = 375)
Item Factor 1 Factor 2 Factor 3 MSQ 2 0.369 MSQ 13 0.579 MSQ 14 0.542 MSQ 15 0.772 MSQ 16 0.847 MSQ 17 0.594 MSQ 1 0.542 MSQ 4 0.440 MSQ 7 0.514 MSQ 8 0.656 MSQ 9 0.808 MSQ 11 0.619 MSQ 5 0.809 MSQ 6 0.876
Factor 1 Factor 2 Factor 3 Cronbach Alpha 0.82 0.82 0.85 Total variance 35.31 8.67 5.41 Common variance 71.49 17.54 10.97 In this three-factor solution six items were excluded. Table 28 shows the intercorrelation between the three factors. Table 28 Intercorrelation of the Minnesota Satisfaction Questionnaire three-factor solution
Factor 1 Factor 2 Factor 3 Factor 1 1.000 Factor 2 0.626 1.000 Factor 3 0.419 0.288 1.000
Confirmatory Factor Analysis was carried out on the one-, two- and three-factor structures yielding the indices shown in Table 29.

SAJEMS SS No 1 (1999)
S - 42
Table 29 Results of Confirmatory Factor Analysis of the Minnesota Satisfaction Questionnaire of the three-factor model (N = 375)
Factors Indices One Two Three Fit criterion 2.5727 2.1861 1.3535 Goodness of Fit Index (GFI)
0.7777 0.8080 0.8435
GFI adjusted for degrees of freedom (AGFI)
0.7254 0.7628 0.7866
Root Mean Square Residual (RMR)
0.0775 0.1322 0.2324
Parsimonious GFI (PGFI) 0.6958 0.7229 0.7138 Chi-square (p>Chi² = 0.0001)
962.1736 (df = 170)
817.5978 (df = 170)
506.2220 (df = 77)
Null Model Chi² 3566.5807 (df = 190)
3566.5807 (df = 190)
2146.3463 (df = 91)
RMSEA estimate (90% CI) 0.1116 (0.1048 to
0.1185)
0.1009 (0.0940 to
0.1079)
0.1221 (0.1121 to
0.1323) Probability of Close Fit 0.0000 0.0000 0.0000 ECVI Estimate (90% CI) 2.7993
(2.5425 to 3.0774)
2.4127 (2.1791 to
2.6677)
1.5095 (1.3260 to
1.7139) Bentler’s Comparative Fit Index
0.7654 0.8082 0.7912
Normal Theory Reweighted LS Chi-square
1069.1413 888.7726 485.6472
Akaike’s Information Criterion
622.1736 477.5978 352.2220
Bozdogan’s (1987) CAIC -215.4038 -359.9796 -27.1514 Schwarz’s Bayesian Criterion
-45.4038 -189.9796 49.8486
McDonald’s (1989) Centrality
0.3478 0.4217 0.5642
Bentler & Bonett’s (1980) non-normed index
0.7378 0.7856 0.76532
Bentler & Bonett’s (1980) NFI
0.7302 0.7708 0.7641
James, Mulaik, & Brett (1982) Parsim NFI
0.6534 0.6896 0.6466

SAJEMS SS No 1 (1999)
S - 43
Table 29 continued Factors Indices One Two Three Z-Test of Wilson & Hilferty (1931)
21.6683 19.0643 16.3105
Bollen (1986) Normed Index Rhoi
0.6985 0.7438 0.7213
Bollen (1988) non-normed Index Delta 2
0.7668 0.8093 0.7926
Hoelter’s (1983) Critical N 80 94 74 RNI 0.7654 0.8082 0.7912 None of the three measurement models represents a good fit with the data. Given the results of the Confirmatory Factor Analysis, a three-factor solution can possibly be the preferred choice. Both the two- and the three-factor solutions, however, contained a factor in which only two items were included. These solutions did not really seem psychometrically acceptable. The three-factor model did not fit the data well, although it consisted of three factors that all had acceptable internal consistency. The three factors of the three-factor solution were identified as factor 1: General satisfaction, factor 2: Intrinsic satisfaction and factor 3: Supervision. The items were aggregated to determine whether aggregation of item scores could be useful in identifying the quality of fit between the measurement model and the data. The results of the Confirmatory Factor Analysis are shown in Table 30. Table 30 Results of Confirmatory Factor Analysis of the three-factor
structure of the Minnesota Satisfaction Questionnaire after Item Aggregation (N = 375)
Indices Value Fit criterion 0.7033 Goodness of Fit Index (GFI) 0.8145 GFI Adjusted for Degrees of Freedom (AGFI) 0.5671 Root Mean Square Residual (RMR) 0.2945 Parsimonious GFI (PGFI) 0.4887 Chi-square (df = 9, p > Chi² = 0.0001) 263.0445 Null Model Chi² (df = 15) 1010.6723 RMSEA Estimate (90% CI 0.2467 to 0.3038) 0.2747 Probability of Close Fit 0.0000 ECVI Estimate (90% CI 0.6360 to 0.9217) 0.7687

SAJEMS SS No 1 (1999)
S - 44
Table 30 continued Indices Value Bentler’s Comparative Fit Index 0.7449 Normal Theory Reweighted LS Chi-square 255.5488 Akaike’s Information Criterion 245.0445 Bozdogan’s (1987) CAIC 200.7022 Schwarz’s Bayesian Criterion 209.7022 McDonald’s (1989) Centrality 0.7127 Bentler & Bonett’s (1980) non-normed Index 0.5748 Bentler & Bonett’s (1980) NFI 0.7397 James, Mulaik, & Brett (1982) Parsimonious NFI 0.4438 Z-Test of Wilson & Hilferty (1931) 13.3962 Bollen (1986) Normed Index Rhoi 0.5662 Bollen (1988) non-normed Index Delta2 0.7464 Hoelter’s (1983) Critical N 26 RNI 0.7449
The results shown in Table 30 indicate a poor fit between the measurement model and the data. It seems that the factor structure of the Minnesota Satisfaction Questionnaire is still unclear when applied to the sample in the present study. 11 SIX-FACTOR SELF-CONCEPT SCALE FOR ADULTS The analysis of the responses in the present sample (N = 375) revealed eight eigenvalues > 1 of the 36 items in the questionnaire. These eigenvalues were 8.19, 3.85, 2.64, 2.55, 1.46, 1.33, 1.19, 1.01. Clear “breaks” were shown between the second and third, third and fourth as well as the fourth and fifth eigenvalues. The existence of six factors would be in agreement with the findings of the author of the instrument. Principal Factor Analysis with Direct Quartimin rotation of the axes were done for two, three and four factors. The process of evaluation and elimination of items, described earlier, was followed. The results of the final Principal Factor Analysis on the two-, three and four-factor models are shown in Tables 31, 32 and 33.
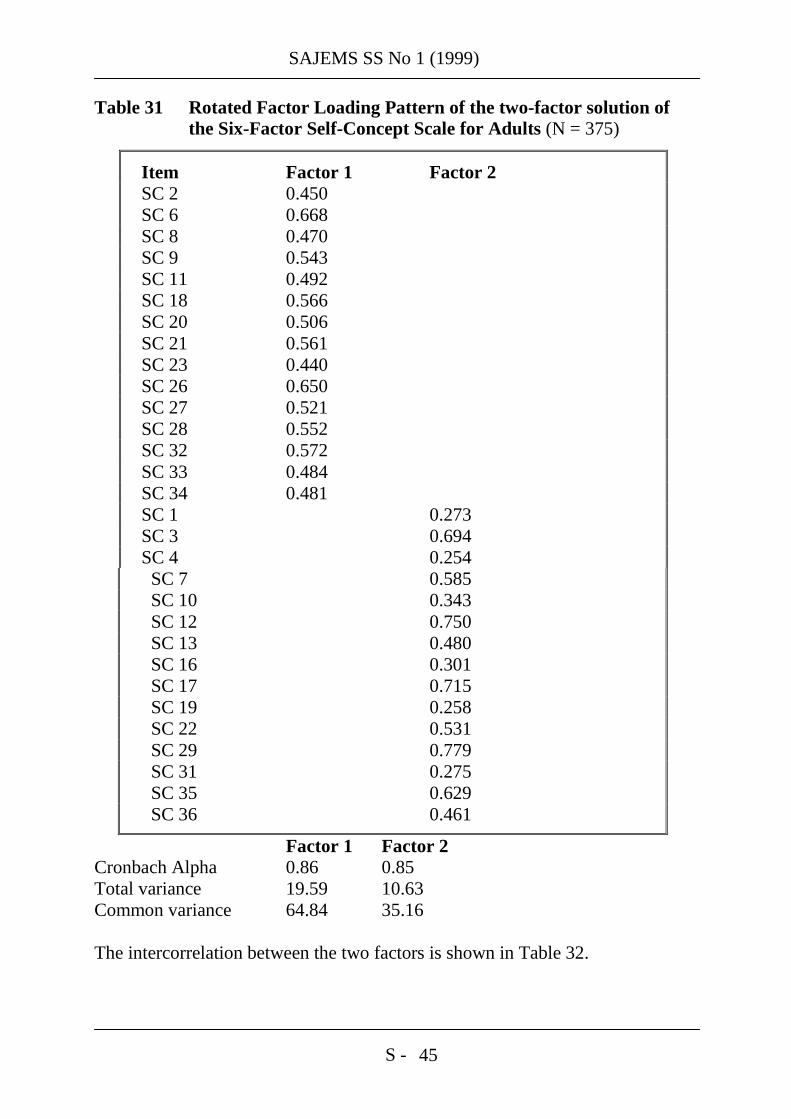
SAJEMS SS No 1 (1999)
S - 45
Table 31 Rotated Factor Loading Pattern of the two-factor solution of the Six-Factor Self-Concept Scale for Adults (N = 375)
Item Factor 1 Factor 2 SC 2 0.450 SC 6 0.668 SC 8 0.470 SC 9 0.543 SC 11 0.492 SC 18 0.566 SC 20 0.506 SC 21 0.561 SC 23 0.440 SC 26 0.650 SC 27 0.521 SC 28 0.552 SC 32 0.572 SC 33 0.484 SC 34 0.481 SC 1 0.273 SC 3 0.694 SC 4 0.254
SC 7 0.585 SC 10 0.343 SC 12 0.750 SC 13 0.480 SC 16 0.301 SC 17 0.715 SC 19 0.258 SC 22 0.531 SC 29 0.779 SC 31 0.275 SC 35 0.629 SC 36 0.461
Factor 1 Factor 2 Cronbach Alpha 0.86 0.85 Total variance 19.59 10.63 Common variance 64.84 35.16 The intercorrelation between the two factors is shown in Table 32.

SAJEMS SS No 1 (1999)
S - 46
Table 32 Intercorrelation of the Six-Factor Self-Concept Scale for Adults two-factor solution
Factor 1 Factor 2 Factor 1 1.000 Factor 2 0.203 1.000
Six items were excluded in the two-factor structure. Factor loadings obtained for the three-factor solution are shown in Table 33. Table 33 Rotated Factor Loading Pattern of the three-factor solution of the Six-Factor Self-Concept Scale for Adults ( N = 375)
Item Factor 1 Factor 2 Factor 3 SC 3 0.732 SC 7 0.545 SC 10 0.357 SC 12 0.755 SC 13 0.465 SC 16 0.305 SC 17 0.698 SC 19 0.257 SC 22 0.545 SC 29 0.755 SC 30 0.436 SC 31 0.279 SC 35 0.618 SC 36 0.444 SC 2 0.488 SC 6 0.647 SC 9 0.551 SC 11 0.461 SC 18 0.693 SC 20 0.498 SC 21 0.622 SC 26 0.676 SC 27 0.510 SC 32 0.595 SC 33 0.400 SC 1 0.567 SC 8 0.793
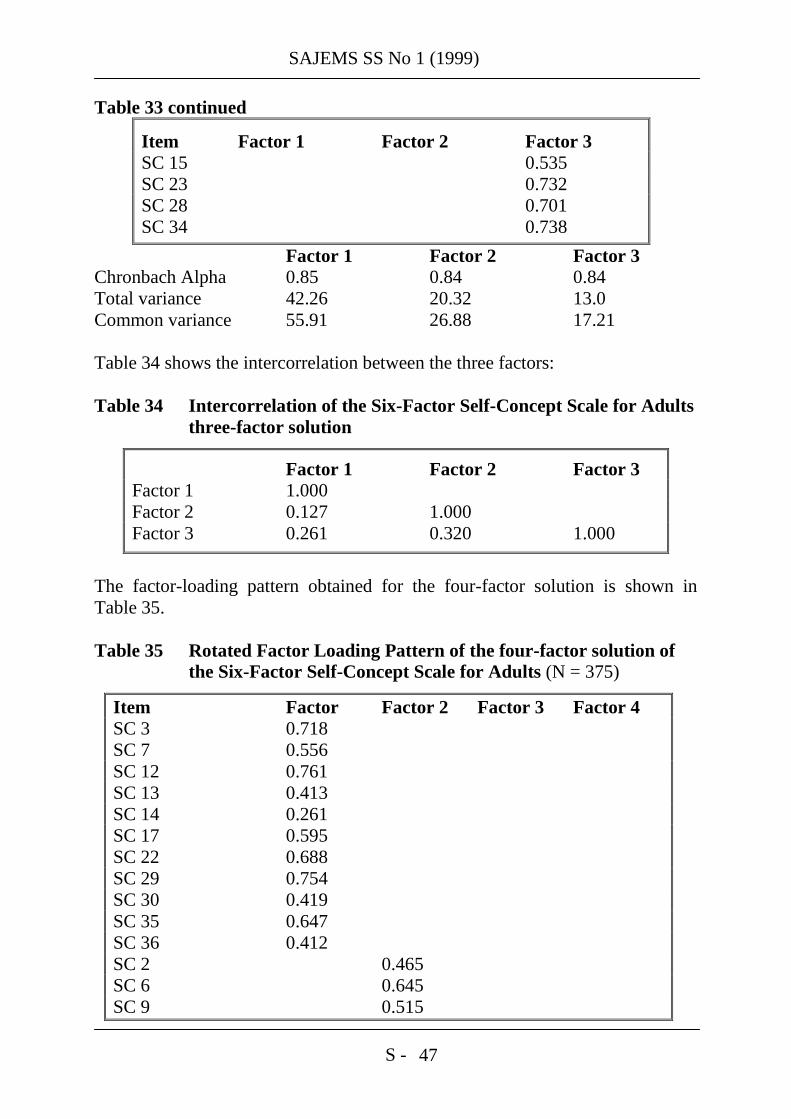
SAJEMS SS No 1 (1999)
S - 47
Table 33 continued
Item Factor 1 Factor 2 Factor 3 SC 15 0.535 SC 23 0.732 SC 28 0.701 SC 34 0.738
Factor 1 Factor 2 Factor 3 Chronbach Alpha 0.85 0.84 0.84 Total variance 42.26 20.32 13.0 Common variance 55.91 26.88 17.21 Table 34 shows the intercorrelation between the three factors: Table 34 Intercorrelation of the Six-Factor Self-Concept Scale for Adults three-factor solution
Factor 1 Factor 2 Factor 3 Factor 1 1.000 Factor 2 0.127 1.000 Factor 3 0.261 0.320 1.000
The factor-loading pattern obtained for the four-factor solution is shown in Table 35. Table 35 Rotated Factor Loading Pattern of the four-factor solution of the Six-Factor Self-Concept Scale for Adults (N = 375)
Item Factor Factor 2 Factor 3 Factor 4 SC 3 0.718 SC 7 0.556 SC 12 0.761 SC 13 0.413 SC 14 0.261 SC 17 0.595 SC 22 0.688 SC 29 0.754 SC 30 0.419 SC 35 0.647 SC 36 0.412 SC 2 0.465 SC 6 0.645 SC 9 0.515

SAJEMS SS No 1 (1999)
S - 48
Table 35 continued
Item Factor Factor 2 Factor 3 Factor 4 SC 11 0.479 SC 18 0.713 SC 20 0.472 SC 21 0.634 SC 26 0.699 SC 27 0.498 SC 32 0.599 SC 33 0.372 SC 1 0.558 SC 8 0.805 SC 15 0.528 SC 23 0.741 SC 28 0.726 SC 34 0.752 SC 4 0.638 SC 10 0.552 SC 16 0.649 SC 19 0.684 SC 25 0.555 SC 31 0.589
Factor 1 Factor 2 Factor 3 Factor 4 Cronbach Alpha 0.85 0.84 0.84 0.79 Total variance 20.09 9.38 6.27 5.98 Common variance 48.15 22.48 15.03 14.34 Table 36 shows the intercorrelation between the four factors: Table 36 Intercorrelation of the Six-Factor Self-Concept Scale for Adults four-factor solution
Factor 1 Factor 2 Factor 3 Factor 4
Factor 1 1.000 Factor 2 0.185 1.000 Factor 3 0.280 0.327 1.000 Factor 4 0.215 -0.073 -0.148 1.000

SAJEMS SS No 1 (1999)
S - 49
Only two items were excluded from the final Principal Factor Analysis. Confirmatory Factor Analysis were carried out on the two-, three-, and four-factor structures. The results are shown in Table 37. Table 37 Results of the Confirmatory Factor Analysis for the Six-Factor
Self-Concept Scale for Adults on the two-, three- and four- factor models (N = 375)
Factors Indices Two Three Four Fit criterion 2.6295 2.5158 3.0029 Goodness of Fit Index (GFI) 0.8247 0.8377 0.8420 GFI adjusted for degrees of freedom (AGFI)
0.7972 0.8123 0.8215
Root Mean Square Residual (RMR)
0.1733 0.1568 0.1286
Parsimonious GFI (PGFI) 0.7621 0.7728 0.7857 Chi-square (p>Chi² = 0.0001)
983.4179 (df = 402)
940.8941 (df = 429)
1117.0812 (df = 656)
Null Model Chi² 1234.1502 (df = 435)
1263.3151 (df = 465)
1326.7572 (df = 703)
RMSEA estimate (90% CI) 0.0622 (0.0573 to
0.0671)
0.0565 (0.0516 to
0.0614)
0.0435 (0.0391 to
0.0478) Probability of Close Fit 0.0000 0.0151 0.9939 ECVI Estimate (90% CI) 2.9664
(2.7305 to 3.2228)
2.8740 (2.6473 to
3.1215)
3.4653 (3.2247 to
2.7217) Bentler’s Comparative Fit Index
0.2725 0.3588 0.2608
Akaike’s Information Criterion
179.4179 82.8941 -194.9188
Bozdogan’s (1987) CAIC -1801.2064 -2030.7571 -3423.4742 Schwarz’s Bayesian Criterion
-1399.2064 -1601.7571 -2767.4742
McDonald’s (1989) Centrality
0.4606 0.5053 0.5390
Bentler & Bonett’s (1980) non-normed index
0.2127 0.3050 0.2078
Bentler & Bonett’s (1980) NFI
0.2032 0.2552 0.1580
James, Mulaik, & Brett (1982) Parsim NFI
0.1877 0.2355 0.1475

SAJEMS SS No 1 (1999)
S - 50
Table 37 continued Factors Indices Two Three Four Z-Test of Wilson & Hilferty (1931)
14.8002 13.1713 10.5672
Bollen (1986) Normed Index Rhoi
0.1377 0.1927 0.0977
Bollen (1988) non-normed Index Delta 2
0.3013 0.3864 0.3126
Hoelter’s (1983) Critical N 173 192 240 RNI 0.2725 0.3588 0.2608 The Confirmatory Factor Analysis of the two-, three-factor and four-factor solutions seem to show that the three-factor solution represents the best fit. The three factors were identified as factor 1: Power, factor 2: Task accomplishment/morality and factor 3: Likeablity. The model did not fit the data well. In order to determine whether aggregation of items would influence the quality of the fit between the three-factor measurement model and the data, they were also aggregated. Confirmatory Factor Analysis on the aggregated variables yielded the results shown in Table 38. Table 38 Results of Confirmatory Factor Analysis of Aggregated
Variables of the three-factor solution of the Six-Factor Self-Concept Scale for Adults (N = 375)
Indices Value Fit criterion 0.4066 Goodness of Fit Index (GFI) 0.9042 GFI Adjusted for Degrees of Freedom (AGFI) 0.8358 Root Mean Square Residual (RMR) 0.1682 Parsimonious GFI (PGFI) 0.6781 Chi-square (df = 21, p > Chi² = 0.0001) 152.0666 Null Model Chi² (df = 28) 1065.1250 RMSEA Estimate (90% CI 0.1103 to 0.1489) 0.1292 Probability of Close Fit 0.0000 ECVI Estimate (90% CI 0.3958 to 0.6078) 0.4943 Bentler’s Comparative Fit Index 0.8736 Normal Theory Reweighted LS Chi-square 158.5037 Akaike’s Information Criterion 110.0666 Bozdogan’s (1987) CAIC 6.6011

SAJEMS SS No 1 (1999)
S - 51
Table 38 continued Indices Value Schwarz’s Bayesian Criterion 27.6011 McDonald’s (1989) Centrality 0.8397 Bentler & Bonett’s (1980) non-normed Index 0.8315 Bentler & Bonett’s (1980) NFI 0.8572 James, Mulaik, & Brett (1982) Parsimonious NFI 0.6429 Z-Test of Wilson & Hilferty (1931) 9.1888 Bollen (1986) Normed Index Rhoi 0.8096 Bollen (1988) non-normed Index Delta2 0.8745 Hoelter’s (1983) Critical N 82 RNI 0.8736
The fit indices obtained, indicate a poor to promising fit between the three-factor measurement model and the data. 12 THE ENTREPRENEURIAL ATTITUDE ORIENTATION SCALE Principal Factor Analysis carried out in the present study on the responses to the 75 items of the Entrepreneurial Attitude Orientation Scale, yielded 19 eigenvalues of 14.08, 4.34, 3.46, 2.70, 2.14, 2.02, 1.70, 1.62, 1.46, 1.41, 1.35, 1.32, 1.28, 1.24, 1.21, 1.11, 1.10, 1.08 and 1.04 respectively. Clear “breaks” existed between the third and fourth as well as the fourth and fifth eigenvalues. Three and four factors were therefore extracted in the first round of analysis. (The existence of four factors is in agreement with the findings of the authors of the instrument.) Principal Factor Analysis was done for three and four factors with Direct Quartimin rotation of the axes. The process described earlier for the evaluation and elimination of items was followed. A final Principal Factor Analysis was carried out to determine the three- and four-factor structures. The factor loading patterns obtained from the analysis are shown in Tables 39 and 40. Table 39 Rotated Factor Loading Pattern of the three-factor solution of the Entrepreneurial Attitude Orientation Scale (N = 375)
Item Factor 1 Factor 2 Factor 3 EAO 2 0.304 EAO 8 0.416 EAO 9 0.384 EAO 13 0.603 EAO 17 0.406 EAO 20 0.398

SAJEMS SS No 1 (1999)
S - 52
Table 39 continued Item Factor 1 Factor 2 Factor 3 EAO 31 0.287 EAO 38 0.471 EAO 39 0.316 EAO 42 0.362 EAO 43 0.404 EAO 44 0.462 EAO 46 0.666 EAO 47 0.294 EAO 48 0.391 EAO 50 0.343 EAO 52 0.495 EAO 54 0.446 EAO 56 0.705 EAO 59 0.552 EAO 60 0.537 EAO 61 0.440 EAO 64 0.590 EAO 66 0.342 EAO 66 0.342 EAO 68 0.611 EAO 71 0.534 EAO 72 0.558 EAO 73 0.604 EAO 75 0.342 EAO 1 0.306 EAO 3 0.292 EAO 4 0.380 EAO 7 0.350 EAO 11 0.327 EAO 12 0.289 EAO 15 0.307 EAO 16 0.355 EAO 22 0.421 EAO 23 0.580 EAO 24 0.569 EAO 30 0.462 EAO 33 0.376 EAO 34 0.451 EAO 40 0.379 EAO 41 0.425

SAJEMS SS No 1 (1999)
S - 53
EAO 53 0.380 Table 39 continued
Item Factor 1 Factor 2 Factor 3 EAO 57 0.323 EAO 62 0.461 EAO 63 0.398 EAO 69 0.385 EAO 5 0.423 EAO 14 0.542 EAO 18 0.433 EAO 19 0.288 EAO 21 0.602 EAO 27 0.575 EAO 28 0.455 EAO 32 0.650 EAO 36 0.578 EAO 49 0.425 EAO 51 0.604 EAO 55 0.298
Factor 1 Factor 2 Factor 3 Cronbach Alpha 0.90 0.80 0.77 Total variance 17.33 5.06 3.96 Common variance 65.77 19.18 15.05 Table 40 Intercorrelation of the Entrepreneurial Attitude Orientation
Scale three-factor solution
Factor 1 Factor 2 Factor 3 Factor 1 1.000 Factor 2 0.324 1.000 Factor 3 -0.194 –0.104 1.000
Thirteen of the 75 items in the original instrument were eliminated to get to the final three-factor structure.

SAJEMS SS No 1 (1999)
S - 54
Table 41 Rotated Factor Loading Pattern of the four-factor solution of the Entrepreneurial Attitude Orientation Scale (N = 375)
Item Factor 1 Factor 2 Factor 3 Factor 4 EAOS 11 0.312 EAOS 13 0.504 EAOS 31 0.344 EAOS 39 0.300 EAOS 45 0.537 EAOS 50 0.462 EAOS 52 0.651 EAOS 54 0.299 EAOS 59 0.643 EAOS 60 0.580 EAOS 64 0.728 EAOS 65 0.767 EAOS 71 0.537 EAOS 72 0.529 EAOS 73 0.656 EAOS 74 0.622 EAOS 18 0.474 EAOS 21 0.547 EAOS 28 0.479 EAOS 32 0.665 EAOS 36 0.569 EAOS 48 0.286 EAOS 49 0.490 EAOS 51 0.646 EAOS 1 0.424 EAOS 4 0.462 EAOS 7 0.428 EAOS 8 0.418 EAOS 9 0.337 EAOS 10 0.340 EAOS 12 0.345 EAOS 15 0.416 EAOS 16 0.455 EAOS 34 0.600 EAOS 42 0.254 EAOS 2 0.362 EAOS 62 0.453 EAOS 69 0.452

SAJEMS SS No 1 (1999)
S - 55
Factor 1 Factor 2 Factor 3 Factor 4 Cronbach Alpha 0.87 0.76 0.7 0.45 Total variance 46.27 13.88 8.95 6.8 Common variance 60.96 18.29 11.80 8.95 The fourth factor in this solution yielded a Cronbach Alpha of 0.45, explaining only 6.8 and 8.95 per cent of the total and common variance respectively. Table 42 indicates the intercorrelation between the four factors. Table 42 Intercorrelation of the Entrepreneurial Attitude Orientation Scale four-factor solution
Factor 1 Factor 2 Factor 3 Factor 4 Factor 1 1.000 Factor 2 -0.271 1.000 Factor 3 0.440 –0.148 1.000 Factor 4 -0.080 –0.053 –0.010 1.000
Thirty-seven of the 75 items had to be rejected to come to the final four-factor structure. Confirmatory Factor Analysis was carried out on the three- and four-factor structures. The results are shown in Table 43. Table 43 Results of Confirmatory Factor Analysis for the
Entrepreneurial Attitude Orientation Scale of the three- and four-factor model (N = 375)
Indices Three Four Fit criterion 10.8603 3.0029 Goodness of Fit Index (GFI) 0.7275 0.8420 GFI Adjusted for Degrees of Freedom (AGFI)
0.7090 0.8215
Root Mean Square Residual (RMR) 0.1187 0.1286 Parsimonious GFI (PGFI) 0.7036 0.7857 Chi-square (p > Chi² = 0.0001) 4040.0478
(df = 1829) 1117.0812 (df = 656)
Null Model Chi² 8396.3482 (df = 1891)
1326.7572 (df = 703)

SAJEMS SS No 1 (1999)
S - 56
Table 43 continued Indices Three Four RMSEA Estimate (90% CI) 0.0570
(0.0546 to 0.0594)
0.0435 (0.0391 to
0.0478) Probability of Close Fit 0.0000 0.9939 ECVI Estimate (90% CI) 11.6629
(11.1495 to 12.2017)
3.4653 (3.2247 to
3.72171) Bentler’s Comparative Fit Index 0.6601 0.2608 Akaike’s Information Criterion 382.0478 -194.9188 Bozdogan’s (1987) CAIC -8619.5191 -3423.4742 Schwarz’s Bayesian Criterion -6790.5191 -2767.4742 McDonald’s (1989) Centrality 0.0516 0.5390 Bentler & Bonett’s (1980) non-normed Index
0.6486 0.2078
Bentler & Bonett’s (1980) NFI 0.5188 0.1580 James, Mulaik, & Brett (1982) Parsimonious NFI
0.5018 0.1475
Z-Test of Wilson & Hilferty (1931) 27.4399 10.5672 Bollen (1986) Normed Index Rhoi 0.5025 0.0977 Bollen (1988) non-normed Index Delta2
0.6633 0.3126
Hoelter’s (1983) Critical N 179 240 RNI 0.66012 0.2608
The three-factor solution seemed to represent the better fit in the Confirmatory Factor Analysis of the three- and four-factor solutions. The three factors were identified as factor 1: Economic Innovation, factor 2: Achievement/Personal Control and factor 3: Self-Esteem. Aggregation of item scores of the factors in the 3-factor solution was again done. Confirmatory Factor Analysis was carried out on the aggregate scores and is shown in Table 44.

SAJEMS SS No 1 (1999)
S - 57
Table 44 Results of Confirmatory Factor Analysis of the three-factor solution with Aggregated Variables of EAOS (N = 375)
Indices Value Fit criterion 0.7618 Goodness of Fit Index (GFI) 0.8864 GFI Adjusted for Degrees of Freedom (AGFI) 0.8295 Root Mean Square Residual (RMR) 0.1961 Parsimonious GFI (PGFI) 0.7091 Chi-square (df = 44, p > Chi² = .0001) 284.9047 Null Model Chi² (df = 55) 1811.1357 RMSEA Estimate (90% CI .1078 - .1346) 0.1210 Probability of Close Fit 0.0000 ECVI Estimate (90% CI 7488 - 1.0386) 0.8833 Bentler’s Comparative Fit Index 0.8628 Normal Theory Reweighted LS Chi-square 263.7514 Akaike’s Information Criterion 196.9047 Bozdogan’s (1987) CAIC -19.8800 Schwarz’s Bayesian Criterion 24.1200 McDonald’s (1989) Centrality 0.7253 Bentler & Bonett’s (1980) non-normed Index 0.8285 Bentler & Bonett’s (1980) NFI 0.8427 James, Mulaik, & Brett (1982) Parsimonious NFI 0.6742 Z-Test of Wilson & Hilferty (1931) 12.2268 Bollen (1986) Normed Index Rhoi 0.8034 Bollen (1988) non-normed Index Delta2 0.8637 Hoelter’s (1983) Critical N 81 RNI 0.8628
The indices in Table 44 show an inadequate fit between the three-factor model with aggregated scores and the data. 13 CONCLUSION Results of the above factor analysis indicate that certain items are factorially grouped together for each psychometric instrument. These factors are named and the items for each factor listed and compared with the factors and items of the original instruments in Tables 45 to 50.

SAJEMS SS No 1 (1999)
S - 58
Table 45 Jenkins Activity Survey
Item Present study Original instrument
Jenkins 1 Factor 3: I/I Factor 2: I/I Jenkins 2 Factor 3: I/I Factor 2: I/I Jenkins 3 Factor 3: I/I Factor 2: I/I Jenkins 4 Factor 2: I/I Jenkins 5 Factor 1: Ach Factor 1: Ach Jenkins 6 Factor 1: Ach Factor 1: Ach Jenkins 7 Factor 2: H/C Factor 1: Ach Jenkins 8 Factor 1: Ach Factor 2: I/I Jenkins 9 Factor 2: H/C Factor 1: Ach Jenkins 10 Factor 2: H/C Factor 1: Ach Jenkins 11 Factor 1: Ach Factor 1: Ach Jenkins 12 Factor 1: Ach Factor 1: Ach Jenkins 13 Factor 2: H/C Factor 1: Ach
Abbreviations: Ach: Achievement; H/C: Hard Driving/Competitive; I/I: Impatience/Irritability. The location of the items of the Locus of Control Scale according to the results of the analysis in the present study and the original scale, is shown in Table 46. Table 46 Locus of Control
Item Present study Original instrument LC 1 Factor 1: Internal Factor 3: Autonomy LC 2 Factor 1: Internal Factor 3: Autonomy LC 3 Factor 1: Internal Factor 3: Autonomy LC 4 Factor 1: External LC 5 Factor 1: Internal Factor 3: Autonomy LC 6 Factor 2: Internal LC 7 Factor 2: Internal LC 8 Factor 1: Internal Factor 2: Internal LC 9 Factor 2: External Factor 1: External LC 10 Factor 1: Internal Factor 2: Internal LC 11 Factor 1: Internal Factor 1: External LC 12 Factor 3: Vicissitudes Factor 1: External LC 13 Factor 1: Internal Factor 3: Autonomy LC 14 Factor 1: Internal Factor 3: Autonomy LC 15 Factor 1: Internal Factor 3: Autonomy LC 16 Factor 2: Internal

SAJEMS SS No 1 (1999)
S - 59
Table 46 continued
Item Present study Original instrument LC 17 Factor 1: Internal Factor 3: Autonomy LC 18 Factor 2: Internal LC 19 Factor 2: Internal LC 20 Factor 2: External Factor 1: External LC 21 Factor 1: External LC 22 Factor 1: Internal Factor 3: Autonomy LC 23 Factor 1: External LC 24 Factor 1: Internal Factor 3: Autonomy LC 25 Factor 1: Internal Factor 2: Internal LC 26 Factor 2: External Factor 2: Internal LC 27 Factor 1: Internal Factor 2: Internal LC 28 Factor 1: Internal Factor 3: Autonomy LC 29 Factor 1: Internal Factor 3: Autonomy LC 30 Factor 1: Internal Factor 3: Autonomy LC 31 Factor 2: Internal LC 32 Factor 2: Internal LC 33 Factor 3: Autonomy LC 34 Factor 3: Vicissitudes Factor 1: External LC 35 Factor 1: External LC 36 Factor 3: Vicissitudes Factor 1: External LC 37 Factor 1: Internal Factor 2: Internal LC 38 Factor 1: External LC 39 Factor 1: Internal Factor 3: Autonomy LC 40 Factor 1: Internal Factor 2: Internal LC 41 Factor 3: Vicissitudes Factor 1: External LC 42 Factor 1: Internal Factor 2: Internal LC 43 Factor 2: External Factor 1: External LC 44 Factor 1: Internal Factor 3: Autonomy LC 45 Factor 2: External Factor 1: External LC 46 Factor 1: Internal Factor 3: Autonomy LC 47 Factor 2: External Factor 1: External LC 48 Factor 1: Internal Factor 2: Internal LC 49 Factor 2: Internal LC 50 Factor 2: External Factor 1: External LC 51 Factor 2: External Factor 1: External LC 52 Factor 2: External Factor 1: External LC 53 Factor 2: External Factor 1: External LC 54 Factor 1: Internal Factor 2: Internal LC 55 Factor 1: Internal Factor 2: Internal LC 56 Factor 2: External Factor 1: External

SAJEMS SS No 1 (1999)
S - 60
Table 46 continued
Item Present study Original instrument LC 57 Factor 2: External Factor 1: External LC 58 Factor 2: External Factor 1: External LC 59 Factor 2: External Factor 2: Internal LC 60 Factor 1: Internal Factor 2: Internal LC 61 Factor 2: Internal LC 62 Factor 3: Autonomy LC 63 Factor 1: Internal Factor 2: Internal LC 64 Factor 3: Autonomy LC 65 Factor 1: External LC 66 Factor 3: Autonomy LC 67 Factor 1: Internal Factor 3: Autonomy LC 68 Factor 1: Internal Factor 3: Autonomy LC 69 Factor 1: Internal Factor 2: Internal LC 70 Factor 1: Internal Factor 3: Autonomy LC 71 Factor 1: Internal Factor 3: Autonomy LC 72 Factor 3: Autonomy LC 73 Factor 1: Internal Factor 3: Autonomy LC 74 Factor 1: Internal Factor 3: Autonomy LC 75 Factor 1: Internal Factor 2: Internal LC 76 Factor 1: Internal Factor 2: Internal LC 77 Factor 1: External LC 78 Factor 1: External LC 79 Factor 3: Vicissitudes Factor 1: External LC 80 Factor 1: External
In the analysis of the present study, the third factor is named Vicissitudes, as it typically represented matters related to unpredictable circumstances. The Autonomy factor identified by Schepers (1995) did not feature as a separate scale in this study. The item categorisation of the Career Orientations Inventory is shown in Table 47.

SAJEMS SS No 1 (1999)
S - 61
Table 47 Career Orientations Inventory
Item Present study Original instrument COI 1 Factor 1: Service Factor 1: Technical/functional COI 2 Factor 1: Service Factor 2: General management COI 3 Factor 3: Autonomy COI 4 Factor 2: Job security Factor 4: Security COI 5 Factor 3: Entrepreneurial Factor 5: Entrepreneurial COI 6 Factor 1: Service Factor 6: Service COI 7 Factor 1: Service Factor 7: Challenge COI 8 Factor 8: Lifestyle COI 9 Factor 1: Service Factor 1: Technical/functional COI 10 Factor 1: Service Factor 2: General management COI 11 Factor 3: Autonomy COI 12 Factor 2: Job security Factor 4: Security COI 13 Factor 3: Entrepreneurial Factor 5: Entrepreneurial COI 14 Factor 1: Service Factor 6: Service COI 15 Factor 1: Service Factor 7: Challenge COI 16 Factor 4: Lifestyle integration Factor 8: Lifestyle COI 17 Factor 1: Technical/functional COI 18 Factor 2: General management COI 19 Factor 3: Entrepreneurial Factor 3: Autonomy COI 20 Factor 2: Job security Factor 4: Security COI 21 Factor 5: Entrepreneurial COI 22 Factor 6: Service COI 23 Factor 1: Service Factor 7: Challenge COI 24 Factor 4: Lifestyle integration Factor 8: Lifestyle COI 25 Factor 1: Technical/functional COI 26 Factor 2: General management COI 27 Factor 3: Autonomy COI 28 Factor 2: Job security Factor 4: Security COI 29 Factor 5: Entrepreneurial COI 30 Factor 6: Service COI 31 Factor 1: Service Factor 7: Challenge COI 32 Factor 4: Lifestyle integration Factor 8: Lifestyle COI 33 Factor 1: Technical/functional COI 34 Factor 2: General management COI 35 Factor 3: Entrepreneurial Factor 3: Autonomy COI 36 Factor 2: Job security Factor 4: Security COI 37 Factor 3: Entrepreneurial Factor 5: Entrepreneurial COI 38 Factor 6: Service COI 39 Factor 1: Service Factor 7: Challenge COI 40 Factor 8: Lifestyle

SAJEMS SS No 1 (1999)
S - 62
Kanungo Job Involvement Questionnaire All the items in the Job Involvement questionnaire compiled by Kanungo (1982a) loaded on one factor – a result that replicates Kanungo’s finding. Table 48 represents the allocation of items according to the results of the present study and the original Minnesota Satisfaction Questionnaire. Table 48 Minnesota Satisfaction Questionnaire
Item Present study Original instrument MSQ 1 Factor 2: Intrinsic Factor 1: Internal MSQ 2 Factor 1: General Factor 1: Internal MSQ 3 Factor 1: Internal MSQ 4 Factor 2: Intrinsic Factor 2: External MSQ 5 Factor 3: Supervision Factor 2: External MSQ 6 Factor 3: Supervision Factor 2: External MSQ 7 Factor 2: Intrinsic Factor 1: Internal MSQ 8 Factor 2: Intrinsic Factor 2: External MSQ 9 Factor 2: Intrinsic Factor 1: Internal MSQ 10 Factor 1: Internal MSQ 11 Factor 2: Intrinsic Factor 1: Internal MSQ 12 Factor 2: External MSQ 13 Factor 1: General Factor 2: External MSQ 14 Factor 1: General Factor 2: External MSQ 15 Factor 1: General Factor 1: Internal MSQ 16 Factor 1: General Factor 1: Internal MSQ 17 Factor 1: General Factor 2: External MSQ 18 Factor 2: External MSQ 19 Factor 2: External MSQ 20 Factor 1: Internal
The allocation of items to factors, of the Six-Factor Self-Concept Scale for Adults as identified in the present and original studies, is shown in Table 49.

SAJEMS SS No 1 (1999)
S - 63
Table 49 Six-Factor Self-Concept Scale for Adults
Item Present study Original instrument SC 1 Factor 3: Likeable Factor 1: Likeability SC 2 Factor 2: Task Acc/Morality Factor 3: Task accomplishment SC 3 Factor 1: Power Factor 5: Power SC 4 Factor 6: Vulnerability SC 5 Factor 4: Giftedness SC 6 Factor 2: Task Acc/Morality Factor 2: Morality SC 7 Factor 1: Power Factor 5: Power SC 8 Factor 3: Likeable Factor 1: Likeability SC 9 Factor 2: Task Acc/Morality Factor 3: Task accomplishment SC 10 Factor 1: Power Factor 6: Vulnerability SC 11 Factor 2: Task Acc/Morality Factor 2: Morality SC 12 Factor 1: Power Factor 5: Power SC 13 Factor 1: Power Factor 4: Giftedness SC 14 Factor 3: Task accomplishment SC 15 Factor 3: Likeable Factor 1: Likeability SC 16 Factor 1: Power Factor 6: Vulnerability SC 17 Factor 1: Power Factor 4: Giftedness SC 18 Factor 2: Task Acc/Morality Factor 2: Morality SC 19 Factor 1: Power Factor 6: Vulnerability SC 20 Factor 2: Task Acc/Morality Factor 3: Task accomplishment SC 21 Factor 2: Task Acc/Morality Factor 2: Morality SC 22 Factor 1: Power Factor 5: Power SC 23 Factor 3: Likeable Factor 1: Likeability SC 24 Factor 4: Giftedness SC 25 Factor 6: Vulnerability SC 26 Factor 2: Task Acc/Morality Factor 2: Morality SC 27 Factor 2: Task Acc/Morality Factor 3: Task accomplishment SC 28 Factor 3: Likeable Factor 1: Likeability SC 29 Factor 1: Power Factor 5: Power SC 30 Factor 1: Power Factor 4: Giftedness SC 31 Factor 1: Power Factor 6: Vulnerability SC 32 Factor 2: Task Acc/Morality Factor 2: Morality SC 33 Factor 2: Task Acc/Morality Factor 3: Task accomplishment SC 34 Factor 3: Likeable Factor 1: Likeability SC 35 Factor 1: Power Factor 5: Power SC 36 Factor 1: Power Factor 4: Giftedness
Abbreviation: Acc: accomplishment

SAJEMS SS No 1 (1999)
S - 64
Table 50 shows the division of the items for the Entrepreneurial Attitude Orientation Scale according to the results of the present study and the original scale. Table 50 Entrepreneurial Attitude Orientation Scale
Item Present study Original instrument EAOS 1 Factor 2: Ach/personal cont. Factor 1: Achievement EAOS 2 Factor 1: Economic innov. Factor 2: Innovation EAOS 3 Factor 2: Ach/personal cont. Factor 1: Achievement EAOS 4 Factor 2: Ach/personal cont. Factor 3: Personal control EAOS 5 Factor 3: Self-esteem Factor 4: Self-esteem EAOS 6 Factor 2: Innovation EAOS 7 Factor 2: Ach/personal cont. Factor 1: Achievement EAOS 8 Factor 1: Economic innov. Factor 3: Personal control EAOS 9 Factor 1: Economic innov. Factor 1: Achievement EAOS 10 Factor 3: Personal control EAOS 11 Factor 2: Ach/personal cont. Factor 1: Achievement EAOS 12 Factor 2: Ach/personal cont. Factor 4: Self-esteem EAOS 13 Factor 1: Economic innov. Factor 2: Innovation EAOS 14 Factor 3: Self-esteem Factor 4: Self-esteem EAOS 15 Factor 2: Ach/personal cont. Factor 3: Personal control EAOS 16 Factor 2: Ach/personal cont. Factor 4: Self-esteem EAOS 17 Factor 1: Economic innov. Factor 2: Innovation EAOS 18 Factor 3: Self-esteem Factor 4: Self-esteem EAOS 19 Factor 3: Self-esteem Factor 2: Innovation EAOS 20 Factor 1: Economic innov. Factor 1: Achievement EAOS 21 Factor 3: Self-esteem Factor 4: Self-esteem EAOS 22 Factor 2: Ach/personal cont. Factor 4: Self-esteem EAOS 23 Factor 2: Ach/personal cont. Factor 1: Achievement EAOS 24 Factor 2: Ach/personal cont. Factor 1: Achievement EAOS 25 Factor 4: Self-esteem EAOS 26 Factor 1: Achievement EAOS 27 Factor 3: Self-esteem Factor 1: Achievement EAOS 28 Factor 3: Self-esteem Factor 4: Self-esteem EAOS 29 Factor 4: Self-esteem EAOS 30 Factor 2: Ach/personal cont. Factor 1: Achievement EAOS 31 Factor 1: Economic innov. Factor 1: Achievement EAOS 32 Factor 3: Self-esteem Factor 2: Innovation EAOS 33 Factor 2: Ach/personal cont. Factor 4: Self-esteem EAOS 34 Factor 2: Ach/personal cont. Factor 1: Achievement EAOS 35 Factor 1: Achievement EAOS 36 Factor 3: Self-esteem Factor 3: Personal control

SAJEMS SS No 1 (1999)
S - 65
Table 50 continued Item Present study Original instrument EAOS 37 Factor 3: Personal control EAOS 38 Factor 1: Economic innov. Factor 2: Innovation EAOS 39 Factor 1: Economic innov. Factor 2: Innovation EAOS 40 Factor 2: Ach/personal cont. Factor 1: Achievement EAOS 41 Factor 2: Ach/personal cont. Factor 2: Innovation EAOS 42 Factor 1: Economic innov. Factor 3: Personal control EAOS 43 Factor 1: Economic innov. Factor 2: Innovation EAOS 44 Factor 1: Economic innov. Factor 1: Achievement EAOS 45 Factor 3: Personal control EAOS 46 Factor 1: Economic innov. Factor 2: Innovation EAOS 47 Factor 1: Economic innov. Factor 3: Personal control EAOS 48 Factor 1: Economic innov. Factor 1: Achievement EAOS 49 Factor 3: Self-esteem Factor 2: Innovation EAOS 50 Factor 1: Economic innov. Factor 4: Self-esteem EAOS 51 Factor 3: Self-esteem Factor 3: Personal control EAOS 52 Factor 1: Economic innov. Factor 2: Innovation EAOS 53 Factor 2: Ach/personal cont. Factor 4: Self-esteem EAOS 54 Factor 1: Economic innov. Factor 2: Innovation EAOS 55 Factor 3: Self-esteem Factor 4: Self-esteem EAOS 56 Factor 1: Economic innov. Factor 2: Innovation EAOS 57 Factor 2: Ach/personal cont. Factor 1: Achievement EAOS 58 Factor 2: Innovation EAOS 59 Factor 1: Economic innov. Factor 1: Achievement EAOS 60 Factor 1: Economic innov. Factor 3: Personal control EAOS 61 Factor 1: Economic innov. Factor 1: Achievement EAOS 62 Factor 2: Ach/personal cont. Factor 2: Innovation EAOS 63 Factor 2: Ach/personal cont. Factor 2: Innovation EAOS 64 Factor 1: Economic innov. Factor 3: Personal control EAOS 65 Factor 1: Achievement EAOS 66 Factor 1: Economic innov. Factor 2: Innovation EAOS 67 Factor 1: Achievement EAOS 68 Factor 1: Economic innov. Factor 2: Innovation EAOS 69 Factor 2: Ach/personal cont. Factor 2: Innovation EAOS 70 Factor 1: Achievement EAOS 71 Factor 1: Economic innov. Factor 2: Innovation EAOS 72 Factor 1: Economic innov. Factor 2: Innovation EAOS 73 Factor 1: Economic innov. Factor 2: Innovation EAOS 74 Factor 2: Innovation EAOS 75 Factor 1: Economic innov. Factor 2: Innovation

SAJEMS SS No 1 (1999)
S - 66
Abbreviations: Ach: Achievement; innov: innovation 14 DISCUSSION The findings presented in the previous section of this monograph provide a great deal of information on the metric equivalence of measuring instruments developed (with one exception) in the United States of America, when applied to a various culture, in this case a South African sample. It is concluded that the percentage of the total variance explained by the factor structures obtained for the various instruments was rather low. Less than 30% of the total variance was explained by the factor structures of the Entrepreneurial Attitude Orientation and the Locus of Control scales. Only 30.28% of the total variance could be explained for the shortened Jenkins scale. For the factor structures of all the other scales, between 40% and 50% of the total variance could be explained. A very large percentage of the variance therefore remained unexplained. Much of the unexplained variance could be related to the argument of Bhagat and McQuid (1982), that subjective cultures may develop within groups. In this case it can be argued that the subjective culture of the South African sample differs from that of the United States sample in which the instruments were developed. Another difference in subjective culture seems to be present in the South African-developed Locus of Control instrument, seeing that the factors identified with the sample of professional people in the present study, differed from those of the original study done on first-year university students. Bhagat and McQuid (1982) explain that group characteristics develop with their own values, norms, belief systems and stereotype formations even when two national groups have a similar language, climate or ecology. The factor structures of the various measuring instruments identified in this study are, however, in most cases completely different from the structures found by the developers of these scales, with the exception of the Job Involvement Scale developed by Kanungo (1982b). Both the analysis in the present study and other South African studies cited in the introduction, indicate that the Job Involvement scale is to be seen as a robust measure with high portability to the South African situation. According to the results of the present study, the shortened Jenkins Activity Scale consists of three sub-scales or factors. The Alpha coefficients of these factor scales proved unacceptably low. This may be due to the small number of items making up each of the sub-scales. In the case of all the other instruments, the Alpha coefficients of the sub-scales in the final factor structure were at an acceptable level. If the shortened Jenkins Activity Scale is excluded, four of the factor scales of the different measuring instruments have Alpha coefficients

SAJEMS SS No 1 (1999)
S - 67
lower than 0.80. The other factor scales had Alpha coefficients above 0.80, with one sub-scale in the in the Entrepreneurial Attitude Orientation scale and another in the Locus of Control measurement having Alpha coefficients of 0.90 and 0.91 respectively. The factorial structure of the Locus of Control scale, which was developed in South Africa, was characterised by two out of the three factors identified by Schepers (1995), quite similar in terms of the validation and revalidation (the present) studies. The third factor (Autonomy) identified by Schepers (1995), however, differed considerably from the third factor (Vicissitudes of Life) yielded by the present application of the instrument. One should therefore be careful in applying an instrument developed in one sub-culture to another sub-culture without factor analysing the items, seeing that this study has shown that the factor structure may differ considerably. One scale which had a completely different factor structure from the one found in North American samples, is the Career Orientation Inventory. The finding that a four-factor solution seemed to provide the best measurement model is contrary to the findings of Kaplan (1990). The findings in respect of the structure of the Minnesota Satisfaction Questionnaire, do not agree with the findings of the previous South African studies by Kaplan (1990), Boshoff and Hoole(1998b) and Kamfer et al. (1998). The analysis of the responses to the Self-Concept Scale developed by Stake (1994), in the present study yielded four factors instead of the six identified during the development of the scale. The four factors did bear some resemblance to those identified by Stake (1995). Two of the factors identified by Stake (1995) could, however, not be replicated in the present study. The findings with regard to the factor structure of the Entrepreneurial Attitude Orientation Scale indicate, taking into account previous attempts to revalidate the scale on South African samples (Boshoff and Hoole, 1998b; Hoole and Boshoff, 1997), that the factor structure envisaged by the authors cannot be replicated in South African samples. The factor structure of the instrument must under the circumstances be in doubt, as Robinson et al. (1991) did not factor analyse the responses to the questionnaire when it was developed. The results of the Confirmatory Factor Analysis carried out on the factor structures of the various instruments, indicated that with the exception of Jenkins Activity Survey and the Job Involvement Scale, the measurement models developed in the present study did not represent good fits with the data. Under the circumstances, the portability of the Career Orientations Inventory,

SAJEMS SS No 1 (1999)
S - 68
Job Satisfaction Scale, Six-Factor Self-Concept Scale for Adults and the Entrepreneurial Attitude Orientation Scale must be seen as unacceptably low. The results of the present study seem to indicate, overall, that the metric qualities and the metric equivalence of the instruments developed in a culture different to the South African sample used in this study, appear to be unsatisfactory. To use these instruments for research, counselling or any organisational purpose must be seen as hazardous or irresponsible. The likelihood must be stressed that instruments developed in one culture or, as is the case of the Schepers (1995) Locus of Control instrument, standardised on one sample, may well be deemed invalid when applied to a sample in another culture or even to another demographic group in the same country. It is recommended that the present study should be extended, especially to other samples in South Africa and in other countries too. Other forms of validity should also be investigated. The results reported here seem to imply that a massive task lies ahead for psychometricians and psychologists working in an increasingly global environment and, at the least, the need to be cautious in the application of measuring instruments developed in one cultural environment to another culture or society. Even within the South African context, there is a large diversity of cultures due to different language and cultural background that may lead to the formation of subjective cultures, which necessitates the validation of psychometric instruments for these sub-cultures. In conclusion: the rich cultural diversity of the South African society provides great opportunities to do research on the measurement of variables commonly used in psychological and managerial research. It is hoped that the findings presented in this monograph will lead to more work in this area. REFERENCES 1 ANASTASI, A. (1990) Psychological Testing, Macmillan Publishing
Company: New York. 2 BAGOZZI, R.P. & HEATERTON, T.F. (1994) "A General Approach to
Presenting Multifaceted Personality Constructs: Application to State Self-Esteem", Structural Equation Modelling, 1, 35-67.
3 BHAGAT, R.S. & MCQUAID, S.J. (1982) "Role of Subjective Culture in Organisations: A Review and Directions for Future Research", Journal of Applied Psychology Monograph, 67, 653-85.
4 BHAGAT, R.S., KEDIA, B.C., CRAWFORD, S.E. & KAPLAN, M.R. (1990) "Cross-Cultural Issues in Organisational Psychology: Emergent Trends and Directions for Research in the 1990s", International Review of Industrial and Organisational Psychology, 5, 59-99.

SAJEMS SS No 1 (1999)
S - 69
5 BLAU, G.J. (1985) "A Multiple Study Investigation of the Dimensio-nality of Job Involvement", Journal of Vocational Behaviour, 27(1): 19-36.
6 BOSHOFF, A.B., KAPLAN, R.A.L. & KELLERMAN, A.M. (1988) "The Career Anchors of Members of Fourteen Professions in South Africa", Unpublished paper, University of Pretoria.
7 BOSHOFF, A.B., JULYAN, S. & BOTES, J.C. (1996) "Portability of the Job Involvement and Job Satisfaction Constructs between the United States of America and South Africa", South African Journal of Economic and Management Sciences.
8 BOSHOFF, A.B. & HOOLE, C. (1998) "Measuring Entrepreneurial Attitudes Interculturally – Is it Possible?" South African Journal of Economic and Management Sciences, NS 1(2), 234-53.
9 BOSHOFF, A.B. & HOOLE, C. (1998) "Portability of the Job Involvement and Job Satisfaction Constructs between the United States of America and South Africa", South African Journal of Economic and Management Sciences, NS 1(1), 73-84.
10 DE BEER, J.J., STEYN, M., ROSSOUW, J.E., FERREIRA, J.J., SWANEPOEL, A.S.P., NEL, E.M. & KOTZE, J.P. (1981) ‘n Gehooranalise van ‘n Voorligtingsprogramme met betrekking tot Tipe A-Gedrag: Bevindinge van ‘n Basislyn-opname in Suidwes-Kaapland, Raad vir Geesteswetenskaplike Navorsing: Pretoria.
11 DE LONG, T.J. (1982) "Re-examining the Career Anchor Model." Personnel, 59(3), 50-61.
12 De LONG, T.J. (1982) "The Career Orientation of MBA Alumni: A Multi-dimensional Model", In Katz, R. (ed.) Career Issues in Human Resource Management, Englewood Cliffs, Prentice-Hall, New York, 58-64.
13 EDWARDS, D. & LEGER, P. (1995) "Psychometric Properties of the Right Wing Authoritarianism Scale in Black and White South African Students", International Journal of Psychology, 30(1), 47-68.
14 EDWARDS, D. & RIORDAN, S. (1994) "Learned Resourcefulness in Black and White South African University Students", Journal of Social Psychology, 134(5), 665-75.
15 FRIEDMAN, M. & ROSENMAN, R.H. (1959) "Association of Specific Overt Behaviour Pattern with Blood and Cardiovascular Finding: Blood Cholesterol Level, Blood Clotting Time, Incidence of Arcus Senilis and Clinical Coronary Artery Disease", Journal of American Medical Association, 169, 1286-96.
16 HOOLE, C. & BOSHOFF, A.B. (1997) "Measurement Qualities of the Entrepreneurial Attitude Orientation Scale when Used Interculturally", South African Journal of Economic and Management Sciences, NS 2(1), 197-223.

SAJEMS SS No 1 (1999)
S - 70
17 JENKINS, C.D., ROSENMAN, R.H., & ZYZANSKI, S.J. (1974) "Prediction of Clinical Coronary Heart Disease by a Test for the Coronary-Prone Behavior Pattern", New England Journal of Medicine, 290, 1271-75.
18 JENKINS, C.D., ZYZANSKI, S.J. & ROSENMAN, R.H. (1979) Jenkins Activity Survey: JAS Manual, New York: The Psychological Corporation.
19 KAMFER, I., VENTER, D. & BOSHOFF, A.B. (1998) "The Portability of American Job Involvement and Job Satisfaction Scales to Non-English Speaking South Africans", South African Journal of Economic and Management Sciences, NS1(1), 85-107.
20 KANUNGO R.N. (1979), "The Concepts of Alienation and Involvement Revisited", Psychological Bulletin, 86(1), 119-38.
21 KANUNGO, R.N. (1982) "Measurement of Job and Work Involvement", Journal of Applied Psychology, 67(3), 341-49.
22 KANUNGO, R.N. (1982) Work Alienation: An Integrative Approach, Praeger: New York.
23 KAPLAN, R.A.L. (1990) "The Career Anchors, Job Involvement and Job Satisfaction of Professional People", Doctoral Dissertation: University of Cape Town.
24 KAPLAN, R.A.L, BOSHOFF, A.B. & KELLERMAN, A.M. (1991) "Job Involvement and Job Satisfaction of South African Nurses Compared with other Professions", Curationis, 14(1), 3-6.
25 KERLINGER, F.N. (1986) Foundations of Behavioral Research, 3rd (ed.), CBS Publishing Japan Ltd, New York.
26 LOEVINGER, J. (1966) "The Meaning and Measurement of Ego Development" American Psychologist, 21, 195-206.
27 LONNER, W.J. & BERRY, J.W. (1986) "Field Methods in Cross-Cultural Research. Vol. 8, Cross-Cultural Research and Methodology Series, Sage: Beverley Hills.
28 LANDY, F.J. (1985) Psychology of Work Behaviour, The Dorsey Press: Chicago.
29 MALPASS, R.S. & POORTINGA, V.H. (1986) "Strategies for Design and Analysis", In Lonner, W.J. & Berry, J.W. (eds.) "Field Methods in Cross-Cultural Research", Vol. 8, Cross-Cultural Research and Methodology Series, Sage: Beverley Hills.
30 McCORMICK, E.J. & ILGEN, D. (1985) Industrial and Organizational Psychology (8thed.) Allen & Unwin: London.
31 PLUG, C., MEYER, W.F., LOUW, D.A. & GOUWS, L.A. (1986) Psigologie Woordeboek, McGraw-Hill: Johannesburg.
32 PRED, R.S., SPENCE, J.T. & HELMREICH, R.L. (1986) "The Development of New Scales for the Jenkins Activity Survey Measure of the Type A Construct", Social and Behavioral Sciences Documents, 16(2, 51), 1-29.

SAJEMS SS No 1 (1999)
S - 71
33 REDDY, N.Y. & RAHMAN, M.A. (1984) "Relevance of Job Involvement and Work Involvement of Managerial Employees and Blue-Collar Workers to their Locus of Control", Journal of Human Stress, 13(1), 15-22.
34 ROBINSON, P.B., STIMPSON, D.V., HUEFNER, J.C. & HUNT, H.K. (1991) "An Attitude Approach to the Prediction of Entrepreneurship" Entrepreneurship: Theory and Practice, 15(4), 13-31.
35 ROSENMAN, R.H., SWAN, G.E. & CARMELLI, D. (1988) "Definition, Assessment and Evolution of the Type A Behavior Pattern" In Houston, B.K. & Snyder, C.R. (eds.) Type A Behaviour Pattern. Research, Theory and Intervention, John Wiley & Sons: New York, 8-31.
36 ROTTER, J.B. (1966) "Generalized Expectancies for Internal versus External Control of Reinforcement" Psychological Monographs, 80(1), no. 609.
37 SAMUDA, R.J. (1983) "Cross-Cultural Testing within a Multicultural Society.
38 SCHEIN, E.H. (1975) "How 'Career Anchors' Hold Executives to their Career Paths", Personnel, 52(3), 11-24.
39 SCHEIN, E.H. (1977) "Career Anchors and Career Paths: A Panel Study of Management School Graduates. In Van Maanen, J. (ed.) Organizational Careers: Some New Perspectives, John Wiley and Sons: London.
40 SCHEIN, E.H. (1995) Career Orientations Inventory, Englewood Cliffs, NJ: Prentice Hall.
41 SCHEPERS, J.M. (1995) Locus of Control Inventory, Unpublished Report: Rand Afrikaans University.
42 SHAVER, K.G. (1987) Principles of Social Psychology (3rd ed.) Winthrop: Cambrige, MA.
43 SPENCE, J.T., HELMREICH R.L., & PRED, R.S. (1987) "Impatience Versus Achievement Strivings in the Type A Pattern: Differential Effects on Students’ Health and Academic Achievement", Journal of Applied Psychology, 72(4), 522-8.
44 STAKE, J.E. (1994) "Development and Validation of the Six-Factor Self-Concept Scale for Adults", Educational and Psychological Measurement, 54(1), 56-72.
45 STIMPSON, D.V. (1993) Letter to A.B. Boshoff, March 1993. 46 TAYLOR, T.R. (1987) Test Bias: The Roles and Responsibilities of Test
User and Test Publisher, Human Sciences Research Council: Pretoria. 47 THORESEN, C.E. & ÖHMAN, A. (1987) "The Type A Behavior Pattern:
A Person-Environment Interaction Perspective", In Magnusson, D. & Öhman, A. (eds.) Psychopathology An Interactional Perspective (325-42), Academic Press: Orlando.

SAJEMS SS No 1 (1999)
S - 72
48 TRIANDIS, H.C., VASSILIOU, V., VASSILIOU, G., TANAKA, Y. & SHANMUGAM, A.V. The Analysis of Subjective Culture, John Wiley & Sons: New York.
49 WEISS, E.J., DAWIS, R.V., ENGLAND, G.W. & LOFQUIST, L.H. (1967) Manual for the Minnesota Saisfaction Questionnaire, St. Paul, University of Minnesota: Minnesota.