Measuring Environmental Strategy: Construct Development, Reliability, and Validity
46
http://bas.sagepub.com/ Business & Society http://bas.sagepub.com/content/50/1/71 The online version of this article can be found at: DOI: 10.1177/0007650310394427 2011 50: 71 Business Society Judith L. Walls, Phillip H. Phan and Pascual Berrone Reliability, and Validity Measuring Environmental Strategy: Construct Development, Published by: http://www.sagepublications.com On behalf of: International Association for Business and Society can be found at: Business & Society Additional services and information for http://bas.sagepub.com/cgi/alerts Email Alerts: http://bas.sagepub.com/subscriptions Subscriptions: http://www.sagepub.com/journalsReprints.nav Reprints: http://www.sagepub.com/journalsPermissions.nav Permissions: http://bas.sagepub.com/content/50/1/71.refs.html Citations: at Universidad de Navarra-Biblioteca on March 1, 2011 bas.sagepub.com Downloaded from
Transcript of Measuring Environmental Strategy: Construct Development, Reliability, and Validity
http://bas.sagepub.com/Business & Society
http://bas.sagepub.com/content/50/1/71The online version of this article can be found at:
DOI: 10.1177/0007650310394427
2011 50: 71Business SocietyJudith L. Walls, Phillip H. Phan and Pascual Berrone
Reliability, and ValidityMeasuring Environmental Strategy: Construct Development,
Published by:
http://www.sagepublications.com
On behalf of:
International Association for Business and Society
can be found at:Business & SocietyAdditional services and information for
http://bas.sagepub.com/cgi/alertsEmail Alerts:
http://bas.sagepub.com/subscriptionsSubscriptions:
http://www.sagepub.com/journalsReprints.navReprints:
http://www.sagepub.com/journalsPermissions.navPermissions:
http://bas.sagepub.com/content/50/1/71.refs.htmlCitations:
at Universidad de Navarra-Biblioteca on March 1, 2011bas.sagepub.comDownloaded from

Business & Society50(1) 71 –115
© 2011 SAGE PublicationsReprints and permission: http://www.sagepub.com/journalsPermissions.nav
DOI: 10.1177/0007650310394427http://bas.sagepub.com
394427 BAS50110.1177/0007650310394427Walls et al.Business & Society© 2011 SAGE Publications
Reprints and permission: http://www.sagepub.com/journalsPermissions.nav
1Concordia University, Montreal, Quebec, Canada2The Johns Hopkins University, Baltimore, MD3University of Navarra, Madrid, Spain
Corresponding Author:Judith L. Walls, Assistant Professor, John Molson School of Business, Concordia University, 1455 de Maisonneuve Blvd. W., Montreal, Quebec, Canada H3G 1M8 Email: [email protected]
Measuring Environmental Strategy: Construct Development, Reliability, and Validity
Judith L. Walls1, Phillip H. Phan2, and Pascual Berrone3
Abstract
Inconsistent results in prior work that link environmental strategy to com-petitive advantage may be due to the empirical difficulties of marrying the theoretical connection between a firm’s resource base and its environmental strategy. The authors contribute to the field by developing a measure that is congruent with the natural resource–based view, a dominant paradigm in this line of work. This article content analyses company reports and second-ary data to develop a measure of environmental strategy grounded in the natural resource–based view. They identify six environmental capabilities that form components of a reliable, multidimensional construct of proactive environmental strategy. They also identify a measure of reactive compliance strategy. They verify reliability of their new measure through exploratory and confirmatory factor analyses, establish convergent and discriminant validity via a multitrait, multimethod matrix and demonstrate superior
at Universidad de Navarra-Biblioteca on March 1, 2011bas.sagepub.comDownloaded from

72 Business & Society 50(1)
predictive validity of their measure compared to two others commonly used in the literature. In the conclusion, they discuss implications for research and practice.
Keywords
environmental strategy, competitive advantage, environmental capabilities, measurement, reliability, validity
Introduction
Consideration of the natural environment has become a critical element in a firm’s long-term strategy. Changes in the regulatory and institutional envi-ronment as well as more fundamental changes in managerial and consumer perception has driven many companies to shift from a reactive to proactive approach to address environmental issues (Hoffman, 1999). Accordingly, firms are building unique environmental capabilities that drive competitive advantage in the manner put forth by the natural resource–based view, or NRBV (Hart, 1995).
As research in this area has proliferated, a variety of measures of environ-mental strategy has emerged. As a result, theoretical and empirical approaches to studying environmental strategy are wide-ranging and generate inconsis-tent results. For instance, studies tend to blur the lines between environmental management and environmental performance (Claver-Cortés, Molina-Azorín, Tarí-Guilló, & López-Gamero, 2005). As a result, studies often proxy envi-ronmental strategy with environmental performance measures. Or, in the case of propriety measures, the operationalizations have not been validated. As a consequence, it has been difficult for researchers to compare results, replicate studies, and refine theory in the field.
The purpose of this article is to create a measure of environmental strategy that is consistent with theory. We focus on the construct, its definition, opera-tionalization, and measurement in a manner that is congruent with the NRBV. We develop a new measure of environmental strategy using content analysis, and assess its reliability and validity against two commonly used measures. Specifically, we identify six environmental capabilities that form a multidimen-sional construct of a firm’s “proactive” environmental strategy. In addition, we capture the dimensions of “reactive” compliance strategy via the content analysis. We establish construct reliability, convergent and discriminant valid-ities, and show that our measure has stronger predictive power than the other commonly used measures. We contribute to the environmental management
at Universidad de Navarra-Biblioteca on March 1, 2011bas.sagepub.comDownloaded from

Walls et al. 73
literature by closing the gap between the extant empirical approaches and theoretical underpinnings of the NRBV.
Environmental StrategyA corporate environmental strategy is a set of initiatives that mitigate a firm’s impact on the natural environment. Firms achieve such a strategy by implementing products, processes, and policies that reduce energy consump-tion and waste, use ecologically sustainable resources, and employ environ-mental management systems (Bansal & Roth, 2000). To understand how environmental strategy creates value for a firm, researchers have increas-ingly turned to the natural resource–based view (NRBV) as a dominant theo-retical paradigm (Hart, 1995; Sharma & Aragón-Correa, 2005). This view is an extension of the resource-based view of the firm, which emphasizes that internal resources and capabilities, when valuable, rare, inimitable, and with-out equivalent substitutes, can lead to sustainable competitive advantage (Barney, 1991).
Sustainable competitive advantage is achieved when resources and capa-bilities are path dependent, causally ambiguous, and socially complex (Barney, 1991). In the case of environmental strategy, related capabilities can take the form of continuous improvements that lower costs, integration of stakehold-ers to preempt competition, and developing a shared vision that secures a firm’s future position (Hart, 1995). A firm may build environmental capabili-ties sequentially due to the path dependence of capability development in general (Wernerfelt, 1984), or indeed concurrently because of the social embeddedness of environmental issues specifically (Hart, 1995).
A firm’s approach to environmental strategy may lie along a continuum of “reactive” to “proactive” (Aragón-Correa, 1998; Hart, 1995; Henriques & Sadorsky, 1999; Hunt & Auster, 1990; Klassen & Whybark, 1999; Russo & Fouts, 1997; Sharma & Vredenburg, 1998; Shrivastava, 1995). Reactive environmental strategies address environmental issues when they arise as a result of the firm’s activities. Such strategies are designed to comply with environmental regulation, and usually implement so-called “end-of-pipe” solutions that are corrective and emphasize the minimization of risk, liabili-ties, and costs (Roome, 1992).
In contrast, proactive environmental strategies emphasize prevention and are a unique combination of resources through which firms develop environ-mental capabilities. There is little systematic research on how firms acquire environmental capabilities but Marcus (2005) suggests that they can be developed from internal, external, or systemwide sources of the firm. Thus,
at Universidad de Navarra-Biblioteca on March 1, 2011bas.sagepub.comDownloaded from

74 Business & Society 50(1)
in addition to traditional resource–based perspectives in which firms generate capabilities as an incremental result of growth and expansion through under-lying skills and knowledge, environmental capabilities may also come from interfirm ties and networks (external), and public policies, values, and beliefs (systemwide; Marcus, 2005). Researchers suggest that to bestow a competi-tive advantage, proactive environmental strategies must (a) be future-oriented and go beyond regulatory compliance (Aragón-Correa, 1998); (b) implement pollution prevention technologies via product and process (re)design or adap-tation (Christmann, 2000; Marcus & Geffen, 1998); and, (c) be reflected in corporate and managerial values and integrated into management systems and business strategy (Hart, 1995; Russo & Fouts, 1997).
Whether environmental strategy indeed leads to competitive advantage is a topic that has been thoroughly studied. Evidence from several meta-analyses suggests a positive, though small, relationship between environmental and financial performance (Margolis, Elfenbein, & Walsh, 2007; Orlitzky, Schmidt, & Rynes, 2003). Yet studies that link environmental strategy to competitive advantage are often plagued with methodological problems such as omitted variables and endogeneity (Siegel, 2009). Thus the environmental strategy—competitive advantage relationship remains under much debate.
Moreover, empirical studies have often blurred the lines between environ-mental management and environmental performance (Claver-Cortés et al., 2005). Empirical work in this area relies on the NRBV to make an implicit assumption that environmental performance is a proxy for environmental strategy. Nevertheless, this approach conflates cause and effect and has led to a lack of consensus on the relationship between environmental strategy, envi-ronmental performance, and financial performance (Claver-Cortés et al., 2005). As a result, it has been difficult for researchers to compare studies, replicate results, and refine theoretical models in this field.
We propose that a better measure of environmental strategy is needed to address these concerns. This article is a first step toward developing a mea-sure of environmental strategy rooted in the theoretical underpinnings of the NRBV. A considerable body of work supports the notion that under some circumstances it pays to be green (Gladwin, 1993; King & Lenox, 2002; Orsata, 2006; Russo & Fouts, 1997). In particular, environmental strategy tends to pay when firms acquire green competencies (e.g., Marcus & Anderson, 2006; McEvily & Marcus, 2005). We show that our measure of environmental strategy, aligned with theoretical underpinnings of this body of work, has strong reliability and validity and better predictive validity than the extant measures.
at Universidad de Navarra-Biblioteca on March 1, 2011bas.sagepub.comDownloaded from
Walls et al. 75
Method
We studied large U.S. firms during 2003 in industries with high level of effluent in their production processes since environmental issues for these firms are salient (Hart & Ahuja, 1996). Our sample consisted of 184 firms in the S&P 500 index, covering 22 industries from primary and manufacturing industries with SIC codes below 5,000.
Our study was conducted in three phases. First, it was our goal to establish a new, reliable measure of environmental strategy that was consistent with theory, specifically the NRBV. Second, we wanted to compare our new mea-sure to other measures commonly used by researchers to assess the reliability and validity of our measure. Last, we aimed to establish whether our new measure predicted outcomes related to competitive advantage to determine whether our measure had stronger predictive power than other measures. We describe our data collection and analytical procedure for each phase below.
Phase I: Measuring Environmental StrategyData came from corporate environment (or social responsibility) reports, environmental pages from corporate web sites, and annual reports. Annual reports are useful to study organizational strategy because they are public, readily available, and provide comparable sets of data (e.g., Abbott & Monsen, 1979; Arndt & Bigelow, 2000; Bowman, 1984). Similarly, environ-mental reports provide comparable data on firm’s environmental activities (Morhardt, 2001), particularly with the emergence of standardized reporting systems such as the Global Reporting Initiative in 2000. We targeted reports for the year 2003. Since not all firms report annually on their environmental activities, if a report for 2003 was missing, we chose the report produced closest to that year. When an environmental report was not available or data was thin, we sourced additional information from environmental web pages and/or annual reports. In our sample, 83 firms produced environmental reports, 60 had environmental web sites and 106 stated environmental infor-mation in their annual reports.
To analyze the data, we used content analysis (Holsti, 1969; Miles & Huberman, 1994) in two stages, following the process of Arndt and Bigelow (2000). The initial stage consisted of developing a coding scheme to code text, pictures, and captions from all reports. The process was iterative, going back and forth between words/phrases in each report and topics that emerged (Glaser & Strauss, 1967; Miles & Huberman, 1994).
at Universidad de Navarra-Biblioteca on March 1, 2011bas.sagepub.comDownloaded from
76 Business & Society 50(1)
The second stage interpreted the content in reports through the lens of the NRBV. We wanted to identify specific resources and capabilities that organi-zations had developed to address environmental issues. Guided by a holistic literature review of the NRBV and through another iterative process, we identi-fied which topics were relevant and collated them into environmental capabil-ity categories. To avoid the possibility of capturing environmental performance instead of environmental strategy, we also coded statements about outcomes of environmental strategy such as new products, designs, or technologies firms developed, emissions and other key environmental indicators, and environ-mental awards won. We explicitly excluded these from our analysis.
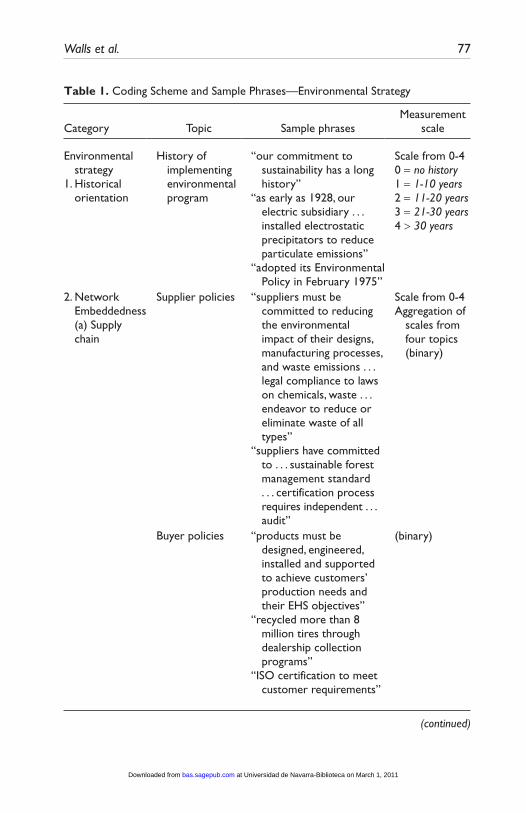
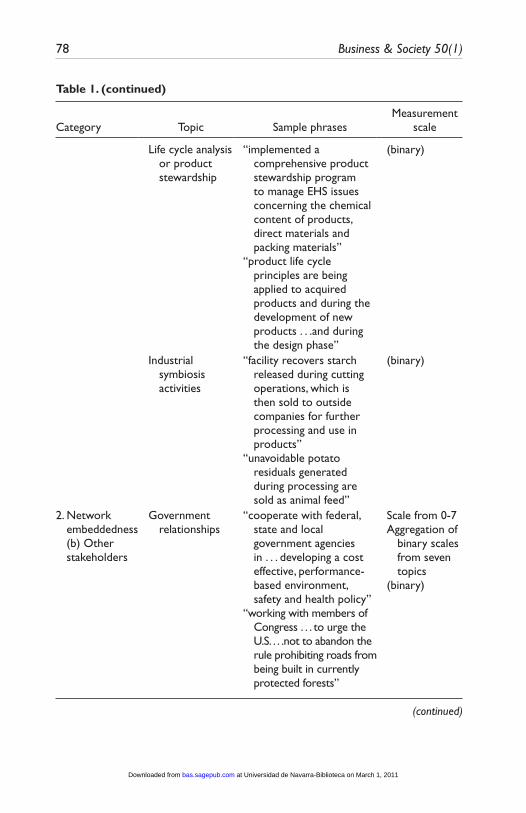
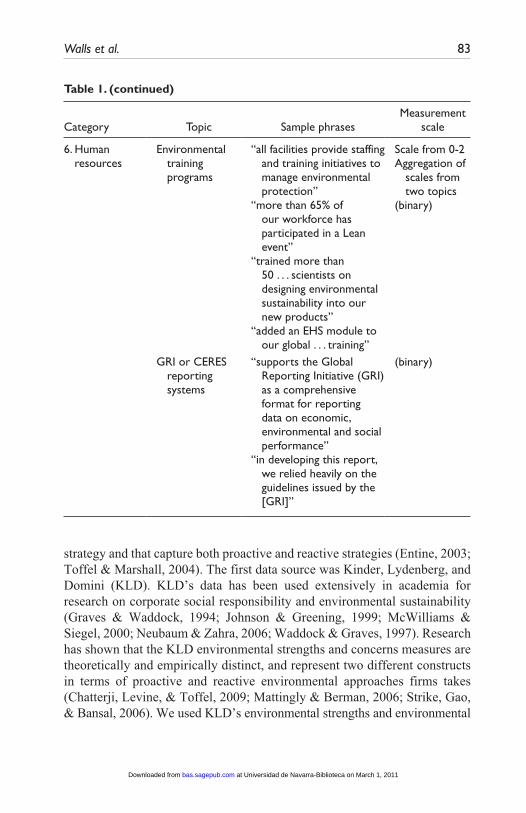
Since our goal was to develop a measure of environmental strategy, we developed a set of scales for each category that could be summed up (Abbott & Monsen, 1979). Topics were either coded as binary or converted to a sliding scale if the code referred to amounts (years, numbers, etc.) or level of inten-sity. The result was that categories were represented by scales and therefore captured the intensity and scope of a firm’s environmental capability as well as its presence. The final coding scheme consisted of 21 topics that fell into six major categories of “proactive” environmental strategy (Table 1) and one cat-egory of a “reactive” compliance strategy that contained two topics (Table 2).
We tested for reliability and validity to verify the congruence of the constructs with theoretical underpinnings of the NRBV (Hoskisson, Hitt, Johnson, & Moesel, 1993; Schwab, 1980; Venkatraman & Grant, 1986). Reliability of the content analysis and environmental strategy construct was measured in several ways. First, we assessed interrater agreement by asking a second researcher to code a random selection of reports. This procedure yielded a Cronbach’s alpha of 91.3%. Second, we established content validity by matching topics with theory through our iterative coding process (Nunnally & Bernstein, 1984). Third, we assessed construct validity by splitting our sample to conduct exploratory factor analysis on the first data set and confir-matory factor analysis on the second data set (Bollen, 1989). We used a factor-extraction method with quartimin oblique rotation to establish that the six capability categories were dimensions of an environmental strategy construct (Bartholomew, Steele, Moustaki, & Galbraith, 2002; Fabrigar, Wegener, MacCallum, & Strahan, 1999).1
Phase II: Evaluating the New Environmental Strategy MeasureTo evaluate our new environmental strategy measure, we compared it to data collected on two other measures often used as proxies for environmental
at Universidad de Navarra-Biblioteca on March 1, 2011bas.sagepub.comDownloaded from
Walls et al. 77
Table 1. Coding Scheme and Sample Phrases—Environmental Strategy
Category Topic Sample phrasesMeasurement
scale
Environmental strategy
1. Historical orientation
History of implementing environmental program
“our commitment to sustainability has a long history”
“as early as 1928, our electric subsidiary . . . installed electrostatic precipitators to reduce particulate emissions”
“adopted its Environmental Policy in February 1975”
Scale from 0-40 = no history1 = 1-10 years2 = 11-20 years3 = 21-30 years4 > 30 years
2. Network Embeddedness (a) Supply chain
Supplier policies “suppliers must be committed to reducing the environmental impact of their designs, manufacturing processes, and waste emissions . . . legal compliance to laws on chemicals, waste . . . endeavor to reduce or eliminate waste of all types”
“suppliers have committed to . . . sustainable forest management standard . . . certification process requires independent . . . audit”
Scale from 0-4 Aggregation of
scales from four topics (binary)
Buyer policies “products must be designed, engineered, installed and supported to achieve customers’ production needs and their EHS objectives”
“recycled more than 8 million tires through dealership collection programs”
“ISO certification to meet customer requirements”
(binary)
(continued)
at Universidad de Navarra-Biblioteca on March 1, 2011bas.sagepub.comDownloaded from
78 Business & Society 50(1)
Category Topic Sample phrasesMeasurement
scale
Life cycle analysis or product stewardship
“implemented a comprehensive product stewardship program to manage EHS issues concerning the chemical content of products, direct materials and packing materials”
“product life cycle principles are being applied to acquired products and during the development of new products . . .and during the design phase”
(binary)
Industrial symbiosis activities
“facility recovers starch released during cutting operations, which is then sold to outside companies for further processing and use in products”
“unavoidable potato residuals generated during processing are sold as animal feed”
(binary)
2. Network embeddedness (b) Other stakeholders
Government relationships
“cooperate with federal, state and local government agencies in . . . developing a cost effective, performance-based environment, safety and health policy”
“working with members of Congress . . . to urge the U.S. . . .not to abandon the rule prohibiting roads from being built in currently protected forests”
Scale from 0-7Aggregation of
binary scales from seven topics
(binary)
Table 1. (continued)
(continued)
at Universidad de Navarra-Biblioteca on March 1, 2011bas.sagepub.comDownloaded from

Walls et al. 79
Table 1. (continued)
Category Topic Sample phrasesMeasurement
scale
NGO relationships
“pipe was donated to three different wildlife refuges in California for use in watershed habitat maintenance”
“spent nearly US$300,000 to fund the installation of hack boxes and hack tower material to reintroduce peregrine falcons to the Big River habitats”
(binary)
Business/industry associations
“participate in the Global Roundtable on Climate Change”
“member of the Business for Social Responsibility (BSR)”
“participate in conferences, industry-working groups on specific projects such as cleaner transportation”
(binary)
Community programs
“a statewide initiative to teach young people about renewable energy technologies”
“community and environmental commitment through employee volunteerism programs, corporate donation campaigns, and environmental education and curriculum development programs”
(binary)
Employee programs
“instituted programs to reduce air emissions
(binary)
(continued)
at Universidad de Navarra-Biblioteca on March 1, 2011bas.sagepub.comDownloaded from

80 Business & Society 50(1)
Category Topic Sample phrasesMeasurement
scale
from employees’ vehicles traveling to and from work”
“more than 600 . . . environmental activities are being undertaken . . . by our employees”
“actively support employee volunteerism . . . donate US$10 for every qualifying hour of volunteer work”
Socially responsible shareholders
“proudly listed in the Dow Jones Sustainability Index, Calvert Social Index and the Domini 400 Social Index”
“met with 15 SRI firms,” “increased shareholder value through EHS commitment”
“CSR analyst meetings”
(binary)
Volunteer programs
“entered into voluntary cleanup agreements . . . with the Department of Environmental Conservation”
“joined U.S. EPA Climate Leaders Partnership to work towards a voluntary commitment to reduce greenhouse gases”
(binary)
3. Endowments
ISO certification “half of our locations are ISO14001 certified”
“all our facilities worldwide are expected to comply with our corporate
Scale from 0-5Aggregation of
scales from three topics
Table 1. (continued)
(continued)
at Universidad de Navarra-Biblioteca on March 1, 2011bas.sagepub.comDownloaded from

Walls et al. 81
Category Topic Sample phrasesMeasurement
scale
Environmental Protection Program, which is aligned with ISO 14001”
0 = No ISO1 = some sites
have ISO2 = all sites have
ISO(binary)
Environmental management system
“we are using Six Sigma to reduce the amount of wood waste from ‘cut direct’ saws by 50%”
“environmental management system being developed at facility by facility basis”
Environmental R&D
“investing US$1.5 billion over the next several years in environmental systems that will significantly reduce emissions of SO2 and NOx at our power plants”
“US$82million in environmental spending”
“invested more than US$4 million on research in the pursuit of a ‘zero-discharge’ water-recycling technology”
0 = US$0-US$399mil
1 = US$400-US$1.6bn
2 = > US$1.6bn
4. Managerial vision
Long-term commitment to environment
“we also set key milestones to be met by 2010”
“new voluntary program to reduce carbon intensity by 2012”
“life cycle management reviews of all existing products must be completed by 2010”
Scale from 0-3Aggregation of
scales from two topics
0 = no visionary statement
1 = statement is made
2 = vision is > 5 years
Table 1. (continued)
(continued)
at Universidad de Navarra-Biblioteca on March 1, 2011bas.sagepub.comDownloaded from

82 Business & Society 50(1)
Category Topic Sample phrasesMeasurement
scale
Global level of vision
“three regional sustainability reports were published in . . . Australia . . . Canada . . . Latin America”
“revised our sustainable forestry policies and practices to . . . promote sustainable forestry on a global level”
(binary)
5. Top management team skills
Senior environmental executive
“the vice president of the department . . . reports to our group president . . . who reports directly to Chairman and CEO”
“officers . . .Vice President-Environment, Health & Safety and Audit”
“we welcomed . . . as Vice President and Chief Sustainability Officer [reports directly to the board]”
Scale from 0-4Aggregation of
scales from two topics
(binary)
Reporting structure level
“senior managers are part of the environmental management reporting structure”
“independent assessments by external organizations”
“corporate responsibility committee at board level”
“local facilities are responsible for implementation”
0 = no reporting structure
1 = local/facility level
2 = senior management
3 = board/external auditors
Table 1. (continued)
(continued)
at Universidad de Navarra-Biblioteca on March 1, 2011bas.sagepub.comDownloaded from
Walls et al. 83
Table 1. (continued)
Category Topic Sample phrasesMeasurement
scale
6. Human resources
Environmental training programs
“all facilities provide staffing and training initiatives to manage environmental protection”
“more than 65% of our workforce has participated in a Lean event”
“trained more than 50 . . . scientists on designing environmental sustainability into our new products”
“added an EHS module to our global . . . training”
Scale from 0-2Aggregation of
scales from two topics
(binary)
GRI or CERES reporting systems
“supports the Global Reporting Initiative (GRI) as a comprehensive format for reporting data on economic, environmental and social performance”
“in developing this report, we relied heavily on the guidelines issued by the [GRI]”
(binary)
strategy and that capture both proactive and reactive strategies (Entine, 2003; Toffel & Marshall, 2004). The first data source was Kinder, Lydenberg, and Domini (KLD). KLD’s data has been used extensively in academia for research on corporate social responsibility and environmental sustainability (Graves & Waddock, 1994; Johnson & Greening, 1999; McWilliams & Siegel, 2000; Neubaum & Zahra, 2006; Waddock & Graves, 1997). Research has shown that the KLD environmental strengths and concerns measures are theoretically and empirically distinct, and represent two different constructs in terms of proactive and reactive environmental approaches firms takes (Chatterji, Levine, & Toffel, 2009; Mattingly & Berman, 2006; Strike, Gao, & Bansal, 2006). We used KLD’s environmental strengths and environmental
at Universidad de Navarra-Biblioteca on March 1, 2011bas.sagepub.comDownloaded from

84 Business & Society 50(1)
Table 2. Coding Scheme and Sample Phrases—Environmental Compliance
Category Topic Sample phrasesMeasurement
scale
Environmental Compliance
Violations “12 noncompliance orders for seven facilities”
“21 violations in 331 inspection”
“123 noncompliance events and accidental releases in 2003”
Scale from 0-6Aggregation of
scales from two topics
0 = no violations1 = at least 1
violation Remediation
costs and/ or fines
“[we] companies paid US$151,250 in environmental fines or penalties”
“environmental fines totaled US$16,200 for violations at five locations worldwide”
“we have determined that the recorded liability for environmental matters . . . is approximately US$337.4 million”
“[we are investigating] several current and former manufacturing facilities, in both the United States and abroad, to investigate and remediate environmental contamination resulting from past operations up to possibly US$578.8 mil”
0 = no remediation costs or fines
1 < US$100mil2 = US$100mil-
US$399mil3 = US$400mil-
US$899mil4 = US$900mil-
US$1.6bn5 = > US$1.6bn
concerns categories (appendix).2 Each category was binary to indicate whether the firm performed the activity. We aggregated the category scores for a total respective score of KLD strengths as a measure of “proactive” environmental strategy and KLD concerns as a measure of “reactive” environmental strat-egy, attributing equal weights to the categories. The maximum possible score was 6 for KLD strengths and 7 for KLD concerns. In our sample, 32.1% of firms had at least one KLD strength and 40.8% had at least one KLD con-cern. The most frequent KLD strength was for KLD’s “pollution prevention”
at Universidad de Navarra-Biblioteca on March 1, 2011bas.sagepub.comDownloaded from
Walls et al. 85
category (12.5% of our sample) and the most frequent KLD concern was for “hazardous waste” (26.6%).
TRI data was a second oft-used measure of environmental strategy (King & Lenox, 2002; Klassen & Whybark, 1999; Russo & Harrison, 2005). TRI data consisted of toxic emissions via air, water, land, or underground injection that must be reported to the Environmental Protection Agency (EPA). To account for risks associated to human health, we weighted chemicals using the Human Toxicity Potential Factor (HTP) developed by Hertwich, Mateles, Pease, and McKone (2001), which measures toxicity in terms of benzene equivalence (for carcinogens) or toluene equivalence (for noncarcinogens). Each measure was aggregated across chemicals at facility level and then to parent company. We next calculated the predicted value of pollution by esti-mating total waste generation levels using production ratios in the prior year reported by TRI and compared these against actual levels (King & Lenox, 2000, 2002). If actual waste was lower than predicted, this pollution preven-tion measure would yield positive results. We aggregated the carcinogenic and noncarcinogenic measures (Berrone & Gomez-Mejia, 2009) to capture “proactive” environmental strategy. “Reactive” environmental strategy mea-sure was calculated in the form of end-of-pipe pollution control. This measure was calculated as a ratio of the sum of chemicals recycled, treated on-site, and transferred to other locations for further treatment divided by the total waste generated by the firm (King & Lenox, 2001, 2002, 2004; Sarkis & Cordeiro, 2001). TRI data was available for about three quarters of our sample.
While both the KLD and TRI measures clearly say something about a firm’s environmental activities, neither is rooted explicitly in theory. Yet, they are often used as proxies for environmental strategy. Therefore, we compared the KLD and TRI measures against our new environmental strategy measure, developed with theoretical alignment in mind, to test convergent and discrimi-nant validity. To do so, we used a multitrait, multimethod matrix (Campbell & Fiske, 1959). This procedure allowed us to check that correlations converged between different methods of capturing the same trait, for instance proactive environmental strategy, and that these could be discriminated from traits intended to differ, in our case reactive environmental strategy. In addition, the matrix assessed internal reliability scores for each measure.
Phase III: Environmental Strategy and Competitive AdvantageThe third phase of our analysis was to assess the relationship between our environmental strategy measure and a competitive advantage outcome for
at Universidad de Navarra-Biblioteca on March 1, 2011bas.sagepub.comDownloaded from
86 Business & Society 50(1)
firms. Our goal was to establish the predictive validity of our new measure and compare the predictive power of our measure to other measures often used in the literature.
We considered competitive advantage in terms of two firm-level outcomes: environmental and financial. We used two different outcomes because we wanted to delineate between environmental strategy, in the form of manage-ment practices, certification, initiatives, and technologies, and environ-mental performance in the form of the impact of a firm’s activities on the natural environment (Claver-Cortés et al., 2005). Past research has largely considered the relationship of environmental performance (not strategy) with financial performance (e.g., Hart & Ahuja, 1996; King & Lenox, 2002; Russo & Fouts, 1997). Yet the relationship between environmental and finan-cial performance may be explained by environmental strategy (Claver-Cortés et al., 2005). For instance, there is evidence that firms with developed environmental capabilities in manufacturing or supplier networks have stronger environmental performance (Klassen & Whybark, 1999; Marcus & Geffen, 1998).
To avoid common method bias, data on environmental performance was collected from a source unrelated to our measures. We collected data from RiskMetrics’ Innovest Strategic Value. This database establishes ratings on firm’s environmental activities based on company data, in-depth sector anal-ysis, and interviews.3 We used Innovest’s environmental score with a 5-year lag (i.e., data from 2008) to capture future environmental performance of a firm based on its environmental strategy in 2003.
Financial performance was measured as Tobin’s Q using Compustat data (King & Lenox, 2002). Tobin’s Q captures a firm’s market value based on expectations of future cash flow, such as those gained from environmental initiatives. Therefore, we assessed Tobin’s Q in 2003 and did not use lags in the financial performance analysis.
Predictive validity on both outcomes of competitive advantage was assessed using regression analysis, as a form of criterion-related validity of a new measure (Kerlinger & Lee, 2000). To avoid omitted variable bias, we included a number of controls that are known to affect financial performance and typically used in environmental management research (McWilliams & Siegel, 2000; King & Lenox, 2002). These controls were collected using Compustat data and included firm size as a log of assets, sales growth as change of sales over the last 3 years, R&D intensity as R&D expenditure over sales, capital intensity as capital expense over sales, and leverage as total debt over total assets. We added an industry control in the form of pol-lution intensity that ranked 2-digit SIC industries by total amount of toxic
at Universidad de Navarra-Biblioteca on March 1, 2011bas.sagepub.comDownloaded from
Walls et al. 87
emissions, from most (highest score) to least (lowest score) polluting sector (Berrone & Gomez-Mejia, 2009).
ResultsWe present our results in four sections. First, we provide a detailed overview of our findings of the content analysis, and the six environmental capabilities that emerged. We link these capabilities to the literature the NRBV and describe how we operationalized them. Next, we review the reliability of our environmental strategy construct based on these six capabilities. Third, we demonstrate the results of the multitrait, multimethod matrix analysis that compares our measures with those of KLD and TRI. Finally, we show the results of the predictive validity of the construct.
Content AnalysisEven though there is a trend toward standardized global environmental reporting, reports in our sample varied in many respects. They differed in length, type of information reported, and style; some reports emphasized pictures, others graphs and tables. Data on environmental resources and capabilities were found in various sections or aspects of reports—sometimes in formal descriptive text, other times in diagrams or stories. In spite of these differences, reports were fairly consistent in what they reported. In our sample, 83.2% contained information on proactive environmental strategy in the form of capabilities, and 34.2% contained information of reactive envi-ronmental strategy in the form of compliance issues.
In terms of proactive environmental strategy, the content analysis revealed six categories of environmental capabilities. These included historical orien-tation (52.2% of firms), network embeddedness including supply chain net-works (53.8%), and stakeholder engagement (64.7%), endowments (69.0%), managerial vision (75.0%), top management team skills (51.1%), and human resource systems (42.4%). Each capability is rooted in theoretical paradigm of the natural resource–based view and identified through the iterative coding process we described earlier. We describe the capabilities and how they were operationalized.
Historical orientation. A company’s path through time and space and the unique historical conditions of its establishment dictates how it acquires and exploits resources and therefore how well it performs in the future (Arthur, 1989; Barney, 1991). History can bestow firms with competitive advantage: preferential locations, founding conditions, scientific breakthroughs, and values
at Universidad de Navarra-Biblioteca on March 1, 2011bas.sagepub.comDownloaded from
88 Business & Society 50(1)
and beliefs that dominate the period all contribute to the development of firm specific capabilities.
Environmental capabilities are no different. For example, the develop-ment of environmental capabilities often begins as a reflection of the institu-tional environment at a point in history with a reactive approach of pollution control that later builds up toward a proactive goal of sustainable develop-ment (Hart, 1995; Hoffman, 1999). By forming a reactive approach, firms build a foundational capability to address ongoing environmental issues. Having a “foot-in-the-door” in dealing with the natural environment makes it easier to gain support for future environmental projects, especially if past experiences were successful (Cordano & Frieze, 2000). In addition, actively seeking opportunities to improve environmental performance becomes a part of the corporate culture and identity (Sharma, 2000). Firms with a strong his-tory in environmental strategy are more likely to consider the environmental impact of new strategies, products, and processes. They are also more likely to spread environmental values throughout their supply chain in their rela-tionships with buyers, suppliers, consumers, and peers. Therefore, the longer a firm’s history of having an environmental strategy, the more likely it is to have built environmental capabilities. In our content analysis, “historical ori-entation” was coded as a scale based on the years since a firm implemented an environmental program.
Network embeddedness. A network is a set of linkages among organizations characterized by specified relationships based on (a) resource transfers such as money, information, power, commitment, or personnel or (b) interpenetra-tion of organizational boundaries through shared interest groups (Laumann, Galaskiewicz, & Marsden, 1978). Networks are strategically important because they allow firms to respond to their interdependence with the general external environment (Pfeffer & Salancik, 1978; Uzzi, 1999) by having access to the right resources, identifying opportunities, matching expectations, and gaining control over information (Burt, 1997; Lenz, 1980). The ability of organiza-tions to generate resources is partly determined by their networks (Lenz, 1980). Because networks evolve over time, they are path dependent and become a capability of the firm (Freeman & Barley, 1990; Lenz, 1980). Net-works are furthermore socially complex and difficult to imitate.
Access to networks is particularly critical for corporate environmental strategy because environmental issues are extremely complex and thus require firms to have interdisciplinary skills and coordinate their environ-mental response with others (Roome, 1992). Moreover, networks and exter-nal ties are a source of environmental capability acquisition in the form of
at Universidad de Navarra-Biblioteca on March 1, 2011bas.sagepub.comDownloaded from
Walls et al. 89
information sharing, trust, and joint problem solving (McEvily & Marcus, 2005). In terms of environmental strategy, networks fall into two groups: firms along the product supply chain acting as suppliers and buyers, and other stakeholders such as governments, employees, NGOs, or “any group or indi-vidual who can affect or is affected by the attainment of the organization’s objectives” (Freeman, 1984, p. 46). The “supply chain network” has a direct impact on a firm’s production process and therefore also on its environmental performance through engaging with outsiders and sharing information along the product supply chain (Cerin & Karlson, 2002; Marcus & Geffen, 1998). The “other stakeholder network,” on the other hand, influences environmental strategy through social pressure and can determine the type of environmental strategy a firm pursues (Delmas & Toffel, 2008). In response to stakeholder influence, firms can develop specific environmental strategies such as eco-design and ecosystem stewardship (Sharma & Henriques, 2005). By address-ing stakeholder concerns, companies develop trust and credibility and build a good corporate reputation, an intangible resource (Sharma & Vredenburg, 1998; Russo & Fouts, 1997). Networking thus represents a socially complex environmental skill that forms a competitive advantage for environmental strategy (Delmas & Toffel, 2004; Hart, 1995; Henriques & Sadorksy, 1999). Our content analysis suggests that “supply chain network” can be measured as a reflection of companies’ engagement with suppliers, buyers, conduct product stewardship efforts, or engage in material exchange (industrial symbiosis) with other companies. In turn, the “other stakeholder network” is a reflection of a firm’s association with governments, NGOs, industry associations, communities, employees, socially responsible investors, and voluntary programs.
Endowments. Firms can build competitive advantage through the accumu-lation of assets over time. Such endowments become an asset stock for the firm when the resource flows form a consistent pattern of appropriate choices on expenditure to build resources and skills (Dierickx & Cool, 1989). This path-dependent process is usually causally ambiguous and can allow firms to achieve strategic goals more quickly than competitors. Asset stocks are also interconnected with other stocks and subject to continual reinvestment to forestall erosion (Dierickx & Cool, 1989). Endowments can appear in the form of physical assets or structures in the form of organizational slack. Organizational slack is the cushion of actual or potentially accessible resources that allows organizations to respond to pressure, initiate strategic change, champion causes, and facilitate innovative or creative behavior (Bourgeois, 1981; Singh, 1986). Slack allows firms to retain earnings for
at Universidad de Navarra-Biblioteca on March 1, 2011bas.sagepub.comDownloaded from
90 Business & Society 50(1)
reinvestment, particularly useful if the firm wants to invest in long-term proj-ects such as environmental strategy.
An effective environmental strategy requires continual and considerable reinvestment (Darnall & Edwards, 2006). Firms that possess long-term endowments can more easily build environmental capabilities because it allows them to invest in technological leadership and exploit opportunities (Aragón-Correa, 1998). In particular, the greater the degree of discretionary slack—that which is within the latitude of managerial action—the more likely it is that managers can address environmental issues (Sharma, 2000). Slack allows flexibility and firms with slack respond in a timelier manner to changes in environmental technologies (Aragón-Correa, Matías-Reche, & Senise-Barrio, 2004). Thus, endowments and related slack allow firms to build proactive environmental strategies. “Endowments,” in our analysis, is a combination of the amount of money a firm invests in environmental research and development (scale) and supporting structures such as an environmental management system or an ISO-14001 certified environmental process that would create the necessary slack to maximize the endowment.
Managerial vision. “Visioning” is the process of projecting a desired future organizational state that, when effectively communicated, empowers follow-ers to enact the vision (see Westley & Mintzberg, 1989). Visionary leadership may result from an individual’s capacity for imagination, inspiration, insight, foresight, or sagacity and can be directed to focus on products, processes, the market, the organization, or ideals (Westley & Mintzberg, 1989). Visionary leadership benefits company performance, attitudes of followers, creates cohesion among the top management team, and has a positive influence on corporate citizenship (see Groves, 2006). Visionary leadership furthermore positively influences values of social corporate responsibility toward share-holders, stakeholders, and the community at large (Waldman et al., 2006). Managerial vision is also important for building internal interdependencies and interrelationship within organizations (Dierickx & Cool, 1989). Vision is particularly important when uncertainty is high and actions are difficult to contract, and managers with strong visions will tend to attract employees with similar beliefs (Van den Steen, 2005).
Visionary leadership is a unique capability because it is not clear if such leaders can be trained. In addition, a complex or internally interdependent organization is difficult for competitors to copy because it cannot be system-atically managed or influenced (Barney, 1991; Child, 1972). Environmental strategies require visionary leadership because the success of environmental strategies depends on long-term commitment and investment (Hart, 1995).
at Universidad de Navarra-Biblioteca on March 1, 2011bas.sagepub.comDownloaded from
Walls et al. 91
A corporate mission that embeds social goals allows firms to develop envi-ronmental capabilities (Marcus & Andersson, 2006). Vision prioritizes the environment on the corporate agenda; managers champion and direct functional, department and production processes toward environmental goals (Andersson & Bateman, 2000). Our analysis indicates that managerial vision of environ-mental strategy can be measured in terms of the time dimension of the envi-ronmental vision (short- or long-term goals have been set) and the depth of the vision across the organization (global or not).
Top management skills. Managerial skills may be generic (transferable), industry specific, and firm specific (such as know-how) used to make opera-tional and strategic decisions that build competitive advantage (Castanias & Helfat, 1991). Superior management skills are a source of economic rent (Penrose, 1959) and difficult for competitors to imitate as they are firm-specific (Barney, 1991). The competitive advantage of top managers comes not just from within the firm but also through the managers’ connections within the business environment. Evidence suggests, for example, that the ability to network along the supply chain and stakeholders through reciprocal relationships based on trust confers competitive advantage (Tsang, 1998).
A successful environmental strategy is likely to require managerial com-petencies in combination with other firm-specific capabilities (Russo & Fouts, 1997). Implementing environmental strategic initiatives requires tight internal integration and coordination as well as stable external partnerships (Dechant & Altman, 1994), which require a talented top management team. The role of managers in environmental strategy is one of central coordina-tion, integration, and connections with others to source for talent, ideas, and technologies (Marcus & Geffen, 1998). To do so, environmental managers must have some tenure with the firm and relevant functional experience in environmental issues (Aragón-Correa et al., 2004). In our content analysis “top management team” environmental skills are assessed by whether the environmental manager is on the executive team and by the reporting level of the environmental manager (a scale of local or facility level) to senior man-agement team or the board.
Human resources. Human resources are firm-specific capabilities that can also bestow competitive advantage (Barney, 1991). Particularly, human resources can be a unique capability if a firm’s HR practices differ from most of its peers were developed through trial-and-error (path-dependent), consist of continual investment, and are highly integrated with other firm resources (socially complex), and cannot be substituted by planning systems (non-substitutable; Lee, Phan, & Chan, 2005).
at Universidad de Navarra-Biblioteca on March 1, 2011bas.sagepub.comDownloaded from

92 Business & Society 50(1)
Human resources are an important capability for the development of envi-ronmental strategies because dealing with environmental issues requires expert knowledge and specific incentives (Wehrmeyer, 1996). Such experi-ence may not necessarily rest within the firm but can be brought in by hiring professionals or experts. Indeed, the more firms search for talent and ideas externally, the more likely they will be able to build environmental capabili-ties if they can harmonize the external learning within the firm (Marcus & Geffen, 1998). In addition, firms that evaluate managers on environmental performance criteria are more likely to develop environmental capabilities (Sharma, 2000). In our analysis, two processes that firms have in place rele-vant to “human resources” skills for environmental strategy are formal envi-ronmental training programs and formal environmental performance reporting systems.
Content was also analyzed for reactive environmental strategy. These were captured in the form of noncompliance with environmental regulation. Two topics were captured for this category that we labeled environmental compliance: an indication of violation of environmental regulation, that may or may not have involved a penalty in the form of a fine, and costs in terms of fines or remediation costs the company reported.
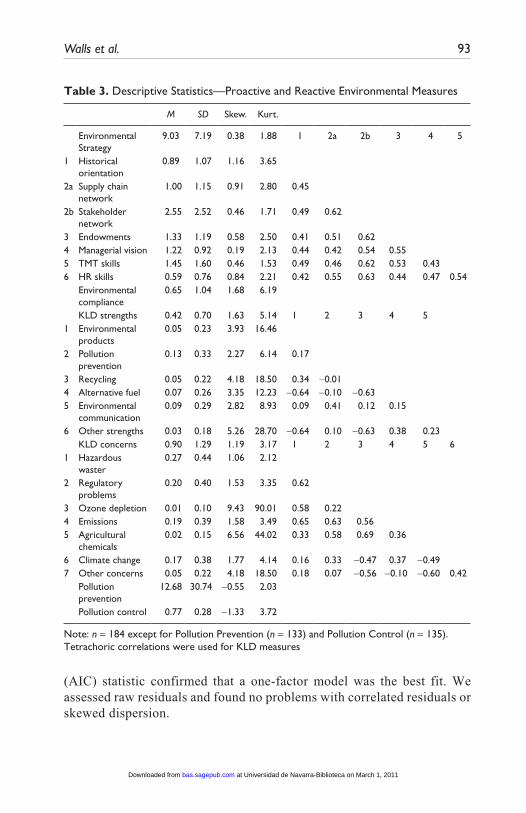
Construct ReliabilityWe assessed the reliability of our environmental strategy construct, based on six environmental capabilities using factor analysis. Table 3 indicates that all capabilities are positively correlated with one another. It appears that firms develop environmental capabilities in parallel as suggested by Hart (1995).
The reliability analysis was done using both exploratory and confirmatory factor analysis. We split the data into two random samples, one containing 122 observations and a smaller one with 62 observations, to cross-validate our model (Bollen, 1989). The larger sample was used in an exploratory fac-tor analysis using a factor extraction method, in case reliabilities were low (Fabrigar et al., 1999). We used oblique quartimin rotation, allowing factors to correlate (Fabrigar et al., 1999), based on the evidence that firms build environmental capabilities in parallel.
Results are given in Table 4 and show that all environmental capabili-ties loaded onto a single factor with loadings ranging from 0.52 to 0.81, above the 0.40 cutoff point typically used in strategic management litera-ture (e.g., Finkelstein, 1992). Loadings on additional factors were below the 0.40 cutoff point. The eigenvalue of the first factor was 3.42 (Chi-square = 355.78), and a scree plot and Akaike Information Criterion
at Universidad de Navarra-Biblioteca on March 1, 2011bas.sagepub.comDownloaded from
Walls et al. 93
Table 3. Descriptive Statistics—Proactive and Reactive Environmental Measures
M SD Skew. Kurt.
Environmental Strategy
9.03 7.19 0.38 1.88 1 2a 2b 3 4 5
1 Historical orientation
0.89 1.07 1.16 3.65
2a Supply chain network
1.00 1.15 0.91 2.80 0.45
2b Stakeholder network
2.55 2.52 0.46 1.71 0.49 0.62
3 Endowments 1.33 1.19 0.58 2.50 0.41 0.51 0.62 4 Managerial vision 1.22 0.92 0.19 2.13 0.44 0.42 0.54 0.55 5 TMT skills 1.45 1.60 0.46 1.53 0.49 0.46 0.62 0.53 0.43 6 HR skills 0.59 0.76 0.84 2.21 0.42 0.55 0.63 0.44 0.47 0.54 Environmental
compliance 0.65 1.04 1.68 6.19
KLD strengths 0.42 0.70 1.63 5.14 1 2 3 4 5 1 Environmental
products 0.05 0.23 3.93 16.46
2 Pollution prevention
0.13 0.33 2.27 6.14 0.17
3 Recycling 0.05 0.22 4.18 18.50 0.34 −0.01 4 Alternative fuel 0.07 0.26 3.35 12.23 −0.64 −0.10 −0.63 5 Environmental
communication 0.09 0.29 2.82 8.93 0.09 0.41 0.12 0.15
6 Other strengths 0.03 0.18 5.26 28.70 −0.64 0.10 −0.63 0.38 0.23 KLD concerns 0.90 1.29 1.19 3.17 1 2 3 4 5 61 Hazardous
waster 0.27 0.44 1.06 2.12
2 Regulatory problems
0.20 0.40 1.53 3.35 0.62
3 Ozone depletion 0.01 0.10 9.43 90.01 0.58 0.22 4 Emissions 0.19 0.39 1.58 3.49 0.65 0.63 0.56 5 Agricultural
chemicals 0.02 0.15 6.56 44.02 0.33 0.58 0.69 0.36
6 Climate change 0.17 0.38 1.77 4.14 0.16 0.33 −0.47 0.37 −0.49 7 Other concerns 0.05 0.22 4.18 18.50 0.18 0.07 −0.56 −0.10 −0.60 0.42 Pollution
prevention12.68 30.74 −0.55 2.03
Pollution control 0.77 0.28 −1.33 3.72
Note: n = 184 except for Pollution Prevention (n = 133) and Pollution Control (n = 135).Tetrachoric correlations were used for KLD measures
(AIC) statistic confirmed that a one-factor model was the best fit. We assessed raw residuals and found no problems with correlated residuals or skewed dispersion.
at Universidad de Navarra-Biblioteca on March 1, 2011bas.sagepub.comDownloaded from

94 Business & Society 50(1)
Table 4. Exploratory Factor Analysis
Variables Factor 1 Factor 2 Factor 3
1. Historical orientation 0.693 −0.039 0.1252a. Supply chain network 0.759 −0.022 −0.1602b. Stakeholder network 0.810 0.033 −0.020 3. Endowments 0.581 0.305 −0.041 4. Managerial vision 0.520 0.235 −0.003 5. TMT skills 0.655 0.014 0.207 6. Human resources 0.723 −0.152 −0.012Eigenvalues 3.42 0.68 0.10
Note: factor extraction (principal factor) method was used with oblique quartimin rotation. n = 122, Chi-square = 355.78, degrees of freedom = 21, Cronbach’s alpha = 0.86.
The single-factor construct had a high reliability score with a Cronbach’s alpha of 0.86 and a reliability coefficient Rho of 0.84, well above the 0.70 cutoff point that is considered acceptable for early stage construct validation (Nunnally & Bernstein, 1994).
We then used the smaller sample to run a confirmatory factor analysis. We used a factor extraction method but restricted the analysis to one factor. The results were closely aligned with those of the exploratory factor analysis (Table 5), indicating that our measure appeared appropriate.4
Results of the factor analyses suggest that all environmental capabilities were a component of the environmental strategy measure we developed
Table 5. Confirmatory Factor Analysis
Variables Factor 1
1. Historical orientation 0.5052a. Supply chain network 0.6462b. Stakeholder network 0.857 3. Endowments 0.761 4. Managerial vision 0.738 5. TMT skills 0.806 6. Human resources 0.804Eigenvalue 3.83
Note: factor extraction (principal factor) method was used, constrained to one factor. n = 62, Chi-square = 220.71, degrees of freedom = 21, Cronbach’s alpha = .964.
at Universidad de Navarra-Biblioteca on March 1, 2011bas.sagepub.comDownloaded from

Walls et al. 95
through our content analysis. Thus our environmental strategy measure was a formative (aggregated) construct (Edwards, 2001) that consisted of six environmental capabilities.5
Construct Validity: The Multitrait Multimethod MatrixWe tested the validity of our environmental strategy construct using a multi-trait, multimethod matrix analysis (Table 6). This analysis provides informa-tion on internal reliabilities of the measures (in parentheses), discriminant validity between correlations of different constructs using the same measure-ment instruments (superscript “a”), convergent validity of correlations of the same constructs using different measurement instruments (superscript “b”), and discriminant validity between correlations of different constructs using different measures (Campbell & Fiske, 1959).
Internal reliability scores were calculated through Cronbach’s alpha, and were not available for the environmental compliance measure constructed in our content analysis or TRI’s pollution control measure as these were single-item constructs. Internal reliabilities were strong for our environmental strat-egy measure (0.86), KLD concerns (0.65) and TRI pollution prevention (0.63). The KLD strengths reliability score was only 0.24. Since this measure is based on an unsystematic categorization of firm’s environmental initiatives
Table 6. Multitrait Multimethod Matrix of Environmental Measures
A1 B1 A2 B2 A3 B3
Environmental strategy A1 (0.86) Environmental compliance B1 −0.06a ( )
KLD strengths A2 0.51b 0.04 (0.24) KLD concerns B2 0.17 0.11b 0.31a (0.65)
Pollution prevention A3 −0.02b 0.03 0.10b −0.03 (0.63) Pollution control B3 0.03 0.13b 0.13 −0.18b 0.38a ( )
Note: Cronbach’s alpha not available for “Compliance” and “Pollution Control.” n = 127, correlations greater than 0.16 are significant at a 5% level. Internal reliabilities of the measures are shown within parenthesesa. Discriminant validity between correlations of different constructs using the same measurement instruments.b. Convergent validity of correlations of the same constructs using different measurement instruments.
at Universidad de Navarra-Biblioteca on March 1, 2011bas.sagepub.comDownloaded from

96 Business & Society 50(1)
without sound theoretical grounding, however, there was no a priori expecta-tion for strong internal reliability.
Discriminant validity of different constructs using the same method (hetero-trait mono-method) was marked with superscript “a”, and should have been close to zero. These correlations were between the “proactive” and “reactive” environmental strategy constructs in our content analysis, KLD, and TRI. Our environmental strategy construct had a very low correlation with envi-ronmental compliance (–0.06), suggesting strong discriminant validity. In contrast, convergent validity was less strong for KLD (0.31) and TRI (0.38) where proactive and reactive constructs correlated moderately.
Convergent validity of similar constructs measured in different ways (homo-trait hetero-method) was marked with superscript “b”. These correla-tions should have been significantly different from zero. Among the proac-tive constructs, convergent validity was strong between our measure of environmental strategy and KLD strengths (0.51). In contrast, the TRI pollu-tion prevention measure did not correlate significantly with the environmen-tal strategy nor KLD strengths.
Among the reactive constructs, convergent validity did not take place—none of the correlations were statistically significant. Qualitatively, the envi-ronmental compliance measure from our content analysis was weakly positively correlated with both KLD concerns and TRI pollution control. However, the correlation among the latter two reactive measures was signifi-cant but negative. This relationship suggests that firms that have implemented fewer pollution control techniques have higher KLD concerns. Thus, while both of these variables are considered “reactive” environmental approaches in our analysis, there appears to be a difference between them. Future research may need to reconsider “reactive” approaches along a continuum that distin-guishes between minimal compliance to environmental regulation (in the form of pollution control) versus failure to comply (in the form of KLD con-cerns). Our environmental compliance measure appears to capture both these types of reactive approaches. Furthermore, the KLD concerns measure may be artificially inflated because a firm with one environmental problem could be captured in several of the KLD concerns categories. For example, a firm that has “substantial emissions” may also have “regulatory problems” for which it would score a double hit in the KLD concerns measure. Such infla-tion could partly explain why the convergence between our environmental compliance measure and KLD concerns, although positively correlated, is not statistically significant.
A final discriminant validity check assessed correlations of different con-structs measured in different ways (hetero-trait hetero-method). In this analysis,
at Universidad de Navarra-Biblioteca on March 1, 2011bas.sagepub.comDownloaded from
Walls et al. 97
superscript “b” diagonal values should have been higher than adjacent values in normal font. We found discriminant validity in the case of our content analysis measures and KLD measures. Evidence was inconsistent for the TRI measures. The pollution control measure could be discriminated from our content analysis measures, but the pollution prevention measure could not be. The TRI measures could also not be sufficiently discriminated from either of the KLD measures. This circumstance would suggest that TRI pollution pre-vention (a proactive construct) does not discriminate enough from reactive constructs. Again, future researchers may wish to consider different levels of proactive approaches firms take when dealing with environmental issues.
Predictive ValidityThe final stage of our analysis was to test for predictive validity. The purpose was to examine how our measure of environmental strategy, developed from content analysis and aligned with the theory of the NRBV, improved the predictability of competitive advantage outcomes. Specifically, we studied the association of all proactive and reactive environmental measures with two types of outcomes: environmental performance and financial perfor-mance. The regression models were run in stages. We first ran a base model that included only controls. Subsequently we ran models for each proactive and reactive environmental measure to separately assess the association with the performance outcome and predictive power. Table 7 shows descriptive statistics of the variables used in the regressions.
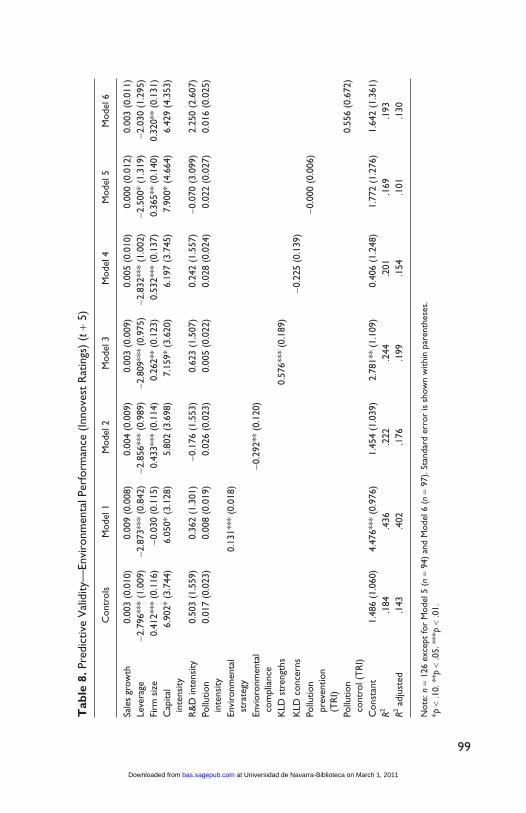
We first ran these models on the environmental performance outcome (t + 5), to assess the association of a firm’s proactive and reactive environ-mental approaches on actual environmental performance 5 years down the line (Table 8). The basic model including controls indicates that leverage is negatively associated with environmental performance. Firm size is posi-tively associated with environmental performance, as is capital intensity (weakly so). Models 1 and 2 show that our environmental strategy and envi-ronmental compliance measures predicted environmental performance. Environmental strategy is positively associated with environmental perfor-mance and environmental compliance is negatively associated. The KLD strengths measure was also positively associated with environmental perfor-mance (Model 3). In contrast, no association was found for KLD concerns or either of TRI measures. The KLD strengths measures explained an additional 5.6% of variance (adjusted R2) compared to the base model. Our environmen-tal compliance measure explained an additional 3.3% of variance. Our envi-ronmental strategy measure almost tripled explanatory power for environmental
at Universidad de Navarra-Biblioteca on March 1, 2011bas.sagepub.comDownloaded from

98
Tab
le 7
. Des
crip
tive
Stat
istic
s—D
epen
dent
and
Inde
pend
ent
Var
iabl
es
MSD
Skew
.K
urt.
12
34
56
78
910
1112
13
1En
viro
nmen
tal
perf
orm
ance
5.20
1.51
−0.0
92.
43
2To
bin’
s Q
1.75
1.22
1.47
5.19
0.19
3
Envi
ronm
enta
l st
rate
gy9.
037.
190.
381.
880.
650.
15
4En
viro
nmen
tal
com
plia
nce
0.65
1.04
1.68
6.19
−0.2
6−0
.18−0
.07
5K
LD s
tren
gths
0.42
0.70
1.63
5.14
0.49
−0.0
90.
560.
07
6K
LD c
once
rns
0.90
1.29
1.19
3.18
0.11
−0.2
60.
200.
270.
40
7Po
llutio
n pr
even
tion
12.6
830
.74−0
.55
2.03
0.05
0.02
0.09
0.08
0.00
0.19
8Po
llutio
n co
ntro
l0.
770.
28−1
.33
3.72
0.13
0.23
0.20
0.07
0.19
0.02
0.16
9Sa
les
grow
th14
.63
15.7
31.
536.
600.
040.
01−0
.18
0.00
0.07
0.11
−0.0
80.
00
10Le
v era
ge0.
250.
150.
132.
48−0
.17−0
.38−0
.02−0
.03−0
.01
0.01
0.04
−0.2
7−0
.12
11
Firm
siz
e9.
161.
110.
363.
250.
350.
000.
480.
080.
360.
530.
290.
09−0
.05
0.00
12
Cap
ital i
nten
sity
0.06
0.05
1.77
6.37
0.28
0.32
0.14
−0.1
90.
05−0
.05
0.15
0.14
0.20
−0.1
40.
09
13R
&D
inte
nsity
0.09
0.12
3.20
16.8
00.
260.
540.
16−0
.20−0
.01−0
.16−0
.08
0.21
0.07
−0.4
20.
090.
53
14Po
llutio
n in
tens
ity17
.90
6.48
−0.1
31.
640.
150.
120.
190.
120.
250.
310.
320.
07−0
.21
0.13
0.20
0.13
0.00
Not
e: n
= 8
4.
at Universidad de Navarra-Biblioteca on March 1, 2011bas.sagepub.comDownloaded from
99
Tab
le 8
. Pre
dict
ive
Val
idity
—En
viro
nmen
tal P
erfo
rman
ce (
Inno
vest
Rat
ings
) (t
+ 5
)
Con
trol
sM
odel
1M
odel
2M
odel
3M
odel
4M
odel
5M
odel
6
Sale
s gr
owth
0.00
3 (0
.010
)0.
009
(0.0
08)
0.00
4 (0
.009
)0.
003
(0.0
09)
0.00
5 (0
.010
)0.
000
(0.0
12)
0.00
3 (0
.011
)Le
vera
ge−2
.796
***
(1.0
09)
−2.8
73**
* (0
.842
)−2
.856
***
(0.9
89)
−2.8
09**
* (0
.975
)−2
.832
***
(1.0
02)
−2.5
00*
(1.3
19)
−2.0
30 (
1.29
5)Fi
rm s
ize
0.41
2***
(0.
116)
−0.0
30 (
0.11
5)0.
433*
** (
0.11
4)0.
262*
* (0
.123
)0.
532*
** (
0.13
7)0.
365*
* (0
.140
)0.
320*
* (0
.131
)C
apita
l i
nten
sity
6.90
2* (
3.74
4)6.
050*
(3.
128)
5.80
2 (3
.698
)7.
159*
(3.
620)
6.19
7 (3
.745
)7.
900*
(4.
664)
6.42
9 (4
.353
)
R&
D in
tens
ity0.
503
(1.5
59)
0.36
2 (1
.301
)−0
.176
(1.
553)
0.62
3 (1
.507
)0.
242
(1.5
57)
−0.0
70 (
3.09
9)2.
250
(2.6
07)
Pollu
tion
int
ensi
ty0.
017
(0.0
23)
0.00
8 (0
.019
)0.
026
(0.0
23)
0.00
5 (0
.022
)0.
028
(0.0
24)
0.02
2 (0
.027
)0.
016
(0.0
25)
Envi
ronm
enta
l s
trat
egy
0.13
1***
(0.
018)
Envi
oron
men
tal
com
plia
nce
−0.2
92**
(0.
120)
KLD
str
engt
hs0.
576*
** (
0.18
9)
KLD
con
cern
s−0
.225
(0.
139)
Po
llutio
n p
reve
ntio
n (
TR
I)
−0.0
00 (
0.00
6)
Pollu
tion
con
trol
(T
RI)
0.55
6 (0
.672
)
Con
stan
t1.
486
(1.0
60)
4.47
6***
(0.
976)
1.45
4 (1
.039
)2.
781*
* (1
.109
)0.
406
(1.2
48)
1.77
2 (1
.276
)1.
642
(1.3
61)
R2.1
84.4
36.2
22.2
44.2
01.1
69.1
93R2 a
djus
ted
.143
.402
.176
.199
.154
.101
.130
Not
e: n
= 1
26 e
xcep
t fo
r M
odel
5 (
n =
94)
and
Mod
el 6
(n
= 97
). St
anda
rd e
rror
is s
how
n w
ithin
par
enth
eses
.*p
< .1
0. *
*p <
.05.
***
p <
.01.
at Universidad de Navarra-Biblioteca on March 1, 2011bas.sagepub.comDownloaded from
100 Business & Society 50(1)
performance increasing adjusted R2 from 14.3% to 40.2%, an additional 25.9% of variance explained. These results suggest that an environmental strategy measure developed in close alignment with the natural resource–based theoretical perspective has a much stronger predictive ability for future environmental performance, a form of competitive advantage, than other measures often used by researchers.
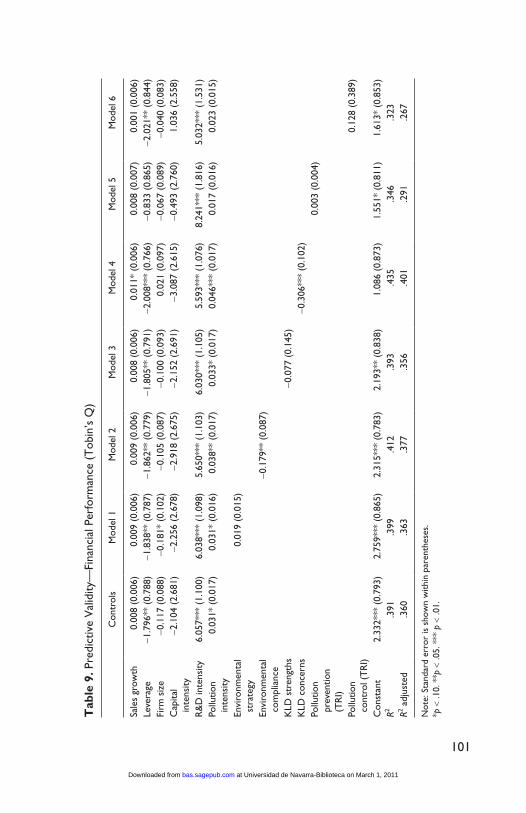
We next ran the environmental measures on the financial performance outcome, to assess the association of proactive and reactive environmental approaches on the (future) market value of the firm (Table 9). The base model indicates that, as in the environmental performance regression, lever-age has a significant negative association with financial performance. In addition, R&D intensity was positively associated with financial perfor-mance, as was pollution intensity (weakly so). Models 2 and 4 show that two types of reactive environmental measures were negatively associated with financial performance (environmental compliance and KLD concerns). None of the other measures were significantly associated with financial perfor-mance. Environmental compliance explained an additional 1.7% of variance (adjusted R2) over the base model, and KLD concerns explained an addi-tional 4.1% of variance. These modest predictive powers are not unexpected since many factors affect firm performance. What is surprising is that none of the proactive environmental measures appear to affect firm performance, a finding that contradicts results found in several meta-analyses (Margolis et al., 2007; Orlitzky et al., 2003). This lack of relationship may be because we included several controls such as R&D intensity, which appear to mediate the relationship between firm’s social strategies and financial performance (McWilliams & Siegel, 2000). Our results suggest that firms are not rewarded by the market for implementing more proactive types of environmental strat-egies. However, when firms fail to meet basic environmental regulatory requirements, the market appears to punish them perhaps viewing such a strategy as excessively risky.
DiscussionThis article represents a first step toward developing a measure of environ-mental strategy that is coherent with the natural resource–based view of the firm. In the past, scholars have used a variety of measures that blurred the lines between environmental strategy and environmental performance to pre-dict competitive advantage, with inconsistent results. This article addresses these concerns by using a content analysis approach to develop a measure of environmental strategy rooted in theory, a major contribution of our work.
at Universidad de Navarra-Biblioteca on March 1, 2011bas.sagepub.comDownloaded from
101
Tab
le 9
. Pre
dict
ive
Val
idity
—Fi
nanc
ial P
erfo
rman
ce (
Tob
in’s
Q)
Con
trol
sM
odel
1M
odel
2M
odel
3M
odel
4M
odel
5M
odel
6
Sale
s gr
owth
0.00
8 (0
.006
)0.
009
(0.0
06)
0.00
9 (0
.006
)0.
008
(0.0
06)
0.01
1* (
0.00
6)0.
008
(0.0
07)
0.00
1 (0
.006
)Le
vera
ge−1
.796
** (
0.78
8)−1
.838
** (
0.78
7)−1
.862
** (
0.77
9)−1
.805
** (
0.79
1)−2
.008
***
(0.7
66)
−0.8
33 (
0.86
5)−2
.021
** (
0.84
4)Fi
rm s
ize
−0.1
17 (
0.08
8)−0
.181
* (0
.102
)−0
.105
(0.
087)
−0.1
00 (
0.09
3)0.
021
(0.0
97)
−0.0
67 (
0.08
9)−0
.040
(0.
083)
Cap
ital
int
ensi
ty−2
.104
(2.
681)
−2.2
56 (
2.67
8)−2
.918
(2.
675)
−2.1
52 (
2.69
1)−3
.087
(2.
615)
−0.4
93 (
2.76
0)1.
036
(2.5
58)
R&
D in
tens
ity6.
057*
** (
1.10
0)6.
038*
** (
1.09
8)5.
650*
** (
1.10
3)6.
030*
** (
1.10
5)5.
593*
** (
1.07
6)8.
241*
** (
1.81
6)5.
032*
** (
1.53
1)Po
llutio
n i
nten
sity
0.03
1* (
0.01
7)0.
031*
(0.
016)
0.03
8**
(0.0
17)
0.03
3* (
0.01
7)0.
046*
** (
0.01
7)0.
017
(0.0
16)
0.02
3 (0
.015
)
Envi
ronm
enta
l s
trat
egy
0.01
9 (0
.015
)
Envi
ronm
enta
l c
ompl
ianc
e−0
.179
** (
0.08
7)
KLD
str
engt
hs−0
.077
(0.
145)
K
LD c
once
rns
−0.3
06**
* (0
.102
)
Pollu
tion
pre
vent
ion
(T
RI)
0.00
3 (0
.004
)
Pollu
tion
con
trol
(T
RI)
0.12
8 (0
.389
)
Con
stan
t2.
332*
** (
0.79
3)2.
759*
** (
0.86
5)2.
315*
** (
0.78
3)2.
193*
* (0
.838
)1.
086
(0.8
73)
1.55
1* (
0.81
1)1.
613*
(0.
853)
R2.3
91.3
99.4
12.3
93.4
35.3
46.3
23R2 a
djus
ted
.360
.363
.377
.356
.401
.291
.267
Not
e: S
tand
ard
erro
r is
sho
wn
with
in p
aren
thes
es.
*p <
.10.
**p
< .0
5. *
** p
< .0
1.
at Universidad de Navarra-Biblioteca on March 1, 2011bas.sagepub.comDownloaded from

102 Business & Society 50(1)
We find that our environmental strategy measure, which captures firm’s proactive environmental initiatives, has strong reliability and validity. Our content analysis shows that firms develop up to six specific environmental capabilities. Taken together, these capabilities form a firm’s proactive environ-mental strategy that converges with another measure of proactive envi-ronmental strategy (by KLD) and can be distinguished from various measures of reactive environmental strategy in the form of noncompliance or minimal compliance. Moreover, the predictive validity of our measure is strong. Our environmental strategy measure explains an additional 25.9% of variance over a base model, and double the variance of the KLD strengths measure, to predict future environmental performance. Our reactive envi-ronmental compliance measure shows weak convergence with other reac-tive measures. Nevertheless, environmental compliance predicts both future environmental performance and future financial performance, with modest additional variance explained at 3.3% and 1.7% over base models, respec-tively. Our conclusion is that our new measure of environmental strategy, rooted in theory, is better able to capture firms’ environmental capability development and environmental noncompliance than other measures often used as proxies.
While the main purpose of this article is to evaluate our newly developed measures, we also simultaneously assessed reactive and proactive environ-mental strategy measures using KLD and TRI data. Some results from these external measures are worth noting. For instance, internal reliability is low for KLD strengths. Convergent validity is statistically insignificant for KLD concerns and the TRI pollution prevention and pollution control measures. There could be several reasons. First, part of the problem may lie in the nature of the TRI data, which is captured at facility level and then aggregated to company level, which means that environmental effects may be averaged out. Second, the TRI pollution prevention measure may be an insufficient method to capture underlying environmental capability development. Third, there may be a need to distinguish between noncompliance and minimal compliance as discussed earlier. Reactive environmental strategies may need further refinement and be coded along a continuum (Newman & Hanna, 1996). In addition to these issues, both KLD’s and TRI’s proactive and reac-tive measures correlate significantly and therefore do not discriminate suffi-ciently between proactive and reactive environmental strategies. It is possible that firms use a combination of reactive and proactive approaches (Aragón-Correa, 1998) and continue to pollute, for instance, when in the process of being more proactive. Nevertheless, the lack of discriminant validity is
at Universidad de Navarra-Biblioteca on March 1, 2011bas.sagepub.comDownloaded from
Walls et al. 103
reflected in the lack of predictive power: TRI measures are not associated with either performance outcome, nor is KLD concerns associated with envi-ronmental performance. These troublesome results highlight the importance of developing (and using) measures that are aligned with theoretical perspec-tives of the NRBV.
One implication of our findings is that a firm’s environmental strategy can be identified by underlying environmental capabilities. In particular, six capabilities (in which network embeddedness is split into two types) appear valuable to firms. In aggregation, these form a firm’s environmen-tal strategy. The combinations of capabilities are unique between firms although some patterns appear. For instance, among firms with only one capability, managerial vision is the most common. Firms with two capabilities most often combined vision with environmental endowments. Engagement with organizational stakeholders is the most common addition for firms with three capabilities. Firms next develop top management team skills and then relationships supply chain stakeholders. Firms with six capabilities tend to have long historical orientations toward environmental strategy. The least common capability is human resources; perhaps this capability requires the most intense integration of environmental strategy with the company’s operations. These patterns seem to suggest that some capabili-ties, such as involving top levels of management, cooperating with external organizations, and setting up human resources systems, are more difficult to develop or require more commitment and integration. This suggestion reso-nates with other work that shows firms often begin by building “easier” environmental capabilities and later integrate more complex ones (Marcus & Anderson, 2006). Implications for future research are that not all capa-bilities are equal, and it may be interesting to investigate the combination of capabilities and their impact on competitive advantage. For practice, these patterns suggest that firms can create a more valuable environmental strat-egy when they combine several types of environmental capabilities and integrate these with management systems. Certainly, firms that combine more capabilities appear to benefit from a competitive advantage in terms of environmental performance.
Our findings on reactive environmental strategies also have implications. Our compliance strategy measure is negatively associated with both environ-mental performance and financial performance. This negative association suggests that firms with reactive environmental strategies suffer with respect to both competitive advantage outcomes. Firms with these kinds of strategies appear to be lagging behind their peers and may face double costs: first, they
at Universidad de Navarra-Biblioteca on March 1, 2011bas.sagepub.comDownloaded from
104 Business & Society 50(1)
have fines associated with violations or remediation costs; second, they are behind the curve in terms of investing in environmental capabilities. Not only do these firms have worse environmental performance, they also have lower financial performance. Thus, while a definitive positive association between proactive environmental strategy and financial performance was not present in our work, it appears that investors place lower value on reac-tive compliance strategies.
The results of the financial performance regressions warrant additional comment. We find that reactive environmental strategy is negatively associ-ated with financial performance but do not find a positive association for proactive environmental strategy. This latter finding does not conform to results from many other studies (Margolis et al., 2007; Orlitzky et al., 2003). We speculate that one reason is that some studies suffer from omitted vari-able bias. Certainly, moderating, mediating, and other confounding factors affect outcomes in studies that link corporate social performance to financial performance (McWilliams & Siegel, 2000; Orlitzky, 2008). Our work included a number of control variables in our regression to account for such effects. A second explanation could be that many factors affect financial performance. Environmental strategy, rather than explain a large amount of variance in financial performance, may play a more critical role in general corporate strategy for outcomes such as market share, productivity, human capital, product differentiation, cost reduction, and more (Ambec & Lanoie, 2008; Siegel, 2009). As the mechanisms of these relationships are still poorly understood, a contribution of our work is in identifying the underlying capa-bilities of environmental strategy that could pave the path for understanding these theoretical mechanisms. Future research that seeks on whether it pays to be green may need to consider alternative types of competitive advantage outcomes, rather than focus on financial performance.
This study, like any other, has its limitations. For instance, our study is not a panel data and we can therefore say little about how companies develop capabilities over time, an area that remains open for future research. Rather than assess changes over time, our purpose was foremost to develop a new measure of environmental strategy. The measure we developed is better able to capture capability development than proxy measures such as KLD and TRI, since it is aligned with theoretical perspectives. In addition, it is more refined since it aggregates several capability scales, rather than simply being a combination of arbitrary categories or a reflection of pollution output. Yet, it is simple enough to be replicated. As a result, future researchers who wish to understand the process of environmental capability development can use our measure.
at Universidad de Navarra-Biblioteca on March 1, 2011bas.sagepub.comDownloaded from
Walls et al. 105
Another limitation of our work is that we say little about “how” firms develop or implement environmental capabilities. Our work focuses on find-ing commonalities in terms of what types of capabilities firms develop. However, two firms may implement the same capability in very different ways. The implementation and integration of a supply chain network capabil-ity, for instance, may determine how much value it creates. Our work simply identifies that the firm has the capability and how to measure it. This finding, in itself, is a contribution to the field since NRBV stresses that competitive advantage may erode over time. Building on our work, future research may observe new capabilities developed for environmental strategy, or discover unique combinations and integration of capabilities.
Our work has implications for future research. While we conducted our content analysis at firm level, our work hints at cross-level theorizing. For instance, human resources, visionary leadership, and top management skills are important capabilities. We believe that more work can be done at a micro- and meso-level organizational behavior to tease out individual and group level effects in the development of environmental capabilities. In addition, the network-embedded nature of environmental capabilities suggests that extraorganizational factors are important. Future work on environmental strategy needs to investigate issues such as interfirm relationships and part-nerships across supply chains, industries, and stakeholders. Such work may need to draw on stakeholder views and network analysis, as well as agency theory and resource-dependence perspectives. Finally, capability develop-ment also appears related to regulation and policy in the form of voluntary initiatives and external auditing. Research can explore the development of such capabilities in the context of public policy.
This work also has implications for practice. We have identified six key capabilities that firms develop to implement an environmental strategy. While the combination and integration of these capabilities may differ between firms, managers may find these results useful. Our work can guide managerial planning on where to invest and what to develop in terms of envi-ronmental strategy. We also show that some capabilities may be more easily attained than others, so our work provides managers a handhold on where to start. These types of practical steps may prove useful to firms who have not yet developed a proactive environmental strategy. More advanced firms may benefit from understanding that integration of more difficult capabilities such as expertise at the top level of the firm, or implementing human resource systems, improves environmental performance further.
Environmental capabilities create value for firms. Our work is a first step to identifying where that value is created and how to measure it.
at Universidad de Navarra-Biblioteca on March 1, 2011bas.sagepub.comDownloaded from

106 Business & Society 50(1)
AppendixKLD Measures
KLD Environmental Strengths Categories
1. Beneficial Products and Services. The company derives substantial revenues from innovative remediation products, environmental ser-vices, or products that promote the efficient use of energy, or it has developed innovative products with environmental benefits.
2. Pollution Prevention. The company has notably strong pollution prevention programs including emissions reductions and toxic-use reduction programs.
3. Recycling. The company either is a substantial user of recycled materials as raw materials in its manufacturing processes or a major factor in the recycling industry.
4. Alternative Fuels. The company derives substantial revenues from alternative fuels. The term “alternative fuels” includes natural gas, wind power, and solar energy. The company has demonstrated an exceptional commitment to energy efficiency programs or the pro-motion of energy efficiency.
5. Communications. The company is a signatory to the CERES Prin-ciples, publishes a notably substantive environmental report, or has notably effective internal communications systems in place for environmental best practices.
6. Other Strengths. The company demonstrates a strong environmental attribute not addressed by KLD’s ratings categories.
KLD Environmental Concerns categories
1. Hazardous Waste. The company’s liabilities for hazardous waste sites exceed US$50 million, or the company has recently paid sub-stantial fines or civil penalties for waste management violations.
2. Regulatory Problems. The company has recently paid substantial fines or civil penalties for violations of air, water, or other environ-mental regulations, or it has a pattern of regulatory controversies under the Clean Air Act, Clean Water Act, or other major environ-mental regulations.
3. Ozone Depleting Chemicals. The company is among the top manu-facturers of ozone depleting chemicals such as HCFCs, methyl chloro-form, methylene chloride, or bromines.
at Universidad de Navarra-Biblioteca on March 1, 2011bas.sagepub.comDownloaded from

Walls et al. 107
4. Substantial Emissions. The company’s legal emissions of toxic chemicals (as defined by and reported to the EPA) from individual plants into the air and water are among the highest of the companies followed by KLD.
5. Agricultural Chemicals. The company is a substantial producer of agricultural chemicals, i.e., pesticides or chemical fertilizers.
6. Climate Change. The company derives substantial revenues from the sale of coal or oil and its derivative fuel products, or the com-pany derives substantial revenues indirectly from the combustion of coal or oil and its derivative fuel products. Such companies include electric utilities, transportation companies with fleets of vehicles, auto and truck manufacturers, and other transportation equipment companies. KLD began assigning concerns for this issue in 1999.
7. Other Concerns. The company has environmental problem not specifi-cally covered in KLD’s categories, usually an environmental accident.
Acknowledgments
The authors would like to thank Andy Hoffman, Jim Walsh, the editors, anonymous reviewers, and participants at the Special Issue workshop for insightful comments. We are especially grateful to Steve Walls and Katy DeCelles for technical assistance.
Declaration of Conflicting Interests
The author(s) declared that they had no conflicts of interest with respect to their authorship or the publication of this article.
Funding
The author(s) disclosed that they received the following support for their research and/or authorship of this article: We would also like to acknowledge the support of the Alcoa Foundation Conservation and Sustainability Fellowship Program and the Frederick A. and Barbara M. Erb Institute for Global Sustainable Enterprise at the University of Michigan. We are indebted as well to the Spanish Minister of Science and Innovation (ECO 2009-08799, ECO2009-08446 and ECO2010-09370-E) and the Generalitat de Catalunya (2009 SGR 919) for providing financial support.
Notes
1. We used oblique rotation rather than orthogonal (Varimax) to relax the assump-tion that latent variables be uncorrelated. This is a reasonable expectation in the case of environmental capabilities, which are often developed sequentially within firms.
at Universidad de Navarra-Biblioteca on March 1, 2011bas.sagepub.comDownloaded from
108 Business & Society 50(1)
2. KLD also provides data on a number of other social responsibility measures. We used only the measures related to environmental initiatives of firms: “environ-mental strengths” and “environmental concerns.”
3. In addition to environmental rating, Innovest’s data also rates other components. We only used the environmental rating, which is based on board and executive oversight, risk management systems, disclosure/verification, process (“eco-”) efficiencies, health and safety, new product development, and climate risk.
4. We used a factor extraction method as it was appropriate for our data, but this method does not provide goodness-of-fit measures. Post hoc robustness tests show our results are consistent with a maximum likelihood confirmatory factor analysis run in EQS. This gave a Comparative Fit Index (CFI) of 0.988 and a Root Mean Square Error of Approximation (RMSEA) of 0.051 confirming that the one factor model is a good fit (Fabrigar et al., 1999).
5. Since environmental strategy is a multidimensional construct, broader than each of the capabilities, we reported an overall reliability coefficient rather than any of the subscales, which would expected to be lower than the overall construct (e.g., Hanisch, Hulin & Roznowski, 1998; Ones & Viswesvaran, 1996).
References
Abbott, W. F., & Monsen, R. J. (1979). On the measurement of corporate social responsibility: Self-reported disclosures as a method of measuring corporate social involvement. Academy of Management Journal, 22, 501-515.
Ambec, S., & Lanoie, P. (2008). Does it pay to be green? A systematic overview. Academy of Management Perspectives, 22(4), 45-62.
Andersson, L. M., & Bateman, T. S. (2000). Individual environmental initiative, championing natural environmental issues in U.S. business organizations. Acad-emy of Management Journal, 43, 548-570.
Aragón-Correa, J. A. (1998). Strategic proactivity and firm approach to the natural environment. Academy of Management Journal, 41, 556-567.
Aragón-Correa, J. A., Matías-Reche, F., & Senise-Barrio, M. E. (2004). Managerial discretion and corporate commitment to the natural environment. Journal of Busi-ness Research, 57, 964-975.
Arndt, M., & Bigelow, B. (2000). Presenting structural innovation in an institutional environment, hospitals’ use of impression management. Administrative Science Quarterly, 45, 494-522.
Arthur, W. B. (1989). Competing technologies, increasing returns and lock-in by his-torical events. Economic Journal, 99(394), March, 116-131.
Bansal, P., & Roth, K. (2000). Why companies go green. A model of ecological responsiveness. Academy of Management Journal, 43, 717-736
Barney, J. B. (1991). Firm resources and sustained competitive advantage. Journal of Management, 11, 408-427.
at Universidad de Navarra-Biblioteca on March 1, 2011bas.sagepub.comDownloaded from

Walls et al. 109
Bartholomew, D. J., Steele, F., Moustaki, I., & Galbraith, J. I. (2002). The analy-sis and interpretation of multivariate data for social scientists. New York, NY: Chapman & Hall/CRC.
Berrone, P., & Gomez-Mejia, L. R. (2009). Do firms compensate their CEO’s for environmental performance? An empirical analysis of U.S. polluting industries. Academy of Management Journal, 52(1), 103-126.
Bollen, K. A. (1989). Structural equations with latent variables. New York, NY: John Wiley.
Bourgeois, III, L. J. (1981). On the measurement of organizational slack. Academy of Management Review, 6, 29-39.
Bowman, E. H. (1984). Content analysis of annual reports for corporate strategy and risk. Interfaces, 14(1), 61-71.
Burt, R. S. (1997). The contingent value of social capital. Administrative Science Quarterly, 42, 339-365.
Campbell, D. T., & Fiske, D. W. (1959). Convergent and discriminant validation by the multitrait-multimethod matrix. Psychological Bulletin, 56(2), 81-105.
Castanias, R. P., & Helfat, C. E. (1991). Managerial resources and rents. Journal of Management, 17, 155-171.
Cerin, P., & Karlson, L. (2002). Business incentives for sustainability, a property rights approach. Ecological Economics, 40(1), 13-22.
Chatterji, A. K., Levine, D. I., & Toffel, M. W. (2009, Spring). How well do social ratings actually measure corporate social responsibility? Journal of Economics and Management Strategy, 18, 125-169.
Child, J. (1972). Organization structure, environment and performance, the role of strategic choice. Sociology, 6, 1-22.
Christmann, P. (2000). Effects of “best practices” of environmental management on cost advantage: The role of complementary assets. Academy of Management Journal, 43, 663-681.
Claver-Cortés, E., Molina-Azorín, J. F., Tarí-Guilló, J. J., & López-Gamero, M. D. (2005). Environmental management, quality management and firm performance, a review of empirical studies. In S. Sharma & J. A. Aragón-Correa (Eds.), Corpo-rate environmental strategy and competitive advantage (pp. 157-182). Northampton, MA: Edward Elgar.
Cordano, M., & Frieze, I. H. (2000). Pollution reduction preferences of U.S. envi-ronmental managers, applying Azjens theory of planned behavior. Academy of Management Journal, 43, 627-641.
Darnall, N., & Edwards, D. (2006). Predicting the cost of environmental management system adoption, the role of capabilities, resources and ownership structure. Stra-tegic Management Journal, 27, 301-320.
Dechant, K., & Altman, B. (1994). Environmental leadership, from compliance to competitive advantage. Academy of Management Executive, 8(3), 7-27.
at Universidad de Navarra-Biblioteca on March 1, 2011bas.sagepub.comDownloaded from
110 Business & Society 50(1)
Delmas, M., & Toffel, M. W. (2004). Stakeholders and environmental management practices: An institutional framework. Business Strategy and the Environment, 13, 209-222.
Delmas, M., & Toffel, M. W. (2008). Organizational responses to environmental demands: Opening the black box. Strategic Management Journal, 29, 1027-1055.
Dierickx, I., & Cool, K. (1989). Asset stock accumulation and sustainability of com-petitive advantage. Management Science, 35, 1504-1511.
Edwards, J. R. (2001). Multidimensional constructs in organizational behavior research. Organizational Research Methods, 4, 144-192.
Entine, J. (2003). The myth of social investing, a critique of its practice and conse-quences for corporate social performance research. Organization and Environ-ment, 16, 352-368.
Fabrigar, L. R., Wegener, D. T., MacCallum, R. C., & Strahan, E. J. (1999). Evaluat-ing the use of exploratory factor analysis in psychological research. Psychological Methods, 4, 272-299.
Finkelstein, S. (1992). Power in top management teams, dimensions, measurement and validation. Academy of Management Journal, 35, 505-538.
Freeman, J., & Barley, S .R. (1990). The strategic analysis of inter-organizational relations in biotechnology. In R. Loveridge & M. Pitts (Eds.), The strategic man-agement of technological innovations (pp. 127-156). Chichester, UK: Wiley.
Freeman, R. (1984). Strategic management: A stakeholder perspective. Boston, MA: Pitman.
Gladwin, T. (1993). The meaning of greening: A plea for organizational theory. In J. Schot & K. Fischer (Eds.), Environmental strategies for industry (pp. 37-61). Washington, DC: Island Press.
Glaser, B. G., & Strauss, A. L. (1967). The discovery of grounded theory. New York, NY: de Gruyter.
Graves, S. B., & Waddock, S. A. (1994). Institutional owners and corporate social performance. Academy of Management Journal, 37, 1034-1046.
Groves, K. S. (2006). Leader emotional expressivity, visionary leadership, and organizational change. Leadership & Organization Development Journal, 27, 566-583.
Hanisch, K. A., Hulin, C. L., & Roznowski, M. (1998). The importance of individu-als’ repertoires of behaviors, the scientific appropriation of studying multiple behaviors and general attitudes. Journal of Organizational Behavior, 19, 463-480.
Hart, S. L. (1995). A natural-resource-based view of the firm. Academy of Manage-ment Review, 20, 986-1014.
Hart, S. L., & Ahuja, G. (1996). Does it pay to be green? An empirical examination of the relationship between pollution prevention and firm performance. Business Strategy and the Environment, 5(1), 30-37.
at Universidad de Navarra-Biblioteca on March 1, 2011bas.sagepub.comDownloaded from
Walls et al. 111
Henriques, I., & Sadorsky, P. (1999). The relationship between environmental com-mitment and managerial perceptions of stakeholder importance. Academy of Man-agement Journal, 42(1), 87-99.
Hertwich, E. G., Mateles, S. F., Pease, W. S., & McKone, T. E. (2001). Human toxic-ity potentials for life-cycle assessment and toxics release inventory risk screening. Environmental Toxicology and Chemistry, 20, 928-939.
Hoffman, A. (1999). Institutional evolution and change, environmentalism and the U.S. chemical industry. Academy of Management Journal, 42, 351-371.
Holsti, O. R. (1969). Content analysis for the social sciences and humanities. Reading, MA, Addison-Wesley.
Hoskisson, R. E., Hitt, M. A., Johnson, R. A., & Moesel, D. D. (1993). Construct validity of an objective (entropy) categorical measure of diversification strategy. Strategic Management Journal, 14, 215-235.
Hunt, C. B., & Auster, E. R. 1990. Proactive environmental management: Avoiding the toxic trap. MIT Sloan Management Review, 31(2), 7-18.
Johnson, R. A., & Greening, D. W. (1999). The effects of corporate governance and institutional ownership types on corporate social performance. Academy of Man-agement Journal, 42, 564-576.
Kerlinger, F.,N., & Lee, H.B. (2000). Foundations of behavioral research (4th ed.). Fort Worth, TX: Harcourt College.
King, A. A., & Lenox, M. J. (2000). Industry self-regulation without sanctions, the chemical industry’s responsible care program. Academy of Management Journal, 43, 698-716.
King, A. A., & Lenox, M. J. (2001). Lean and green? An empirical examination of the relationship between lean production and environmental performance. Produc-tion and Operations Management, 10, 244-256.
King, A. A., & Lenox, M. J. (2002). Exploring the locus of profitable pollution reduc-tion. Management Science, 48, 289-299.
King, A. A., & Lenox, M. J. (2004). Prospects for developing absorptive capac-ity through internal information provision. Strategic Management Journal, 25, 331-345.
Klassen, R. D., & Whybark, D. C. (1999). The impact of environmental technologies on manufacturing performance. Academy of Management Journal, 42, 599-615.
Laumann, E. O., Galaskiewicz, J., & Marsden, P. V. (1978). Community structure as interorganizational linkages. Annual Review of Sociology, 4, 455-484.
Lee, S. H., Phan, P. H., & Chan, E. (2005). The impact of HR configuration on firm performance in Singapore, a resource-based explanation. International Journal of Human Resource Management, 16, 1740-1758.
Lenz, R. T. (1980). Strategic capability, a concept and framework for analysis. Academy of Management Review, 5, 225-234.
at Universidad de Navarra-Biblioteca on March 1, 2011bas.sagepub.comDownloaded from

112 Business & Society 50(1)
Marcus, A. A. (2005). Research in strategic environmental management. In S. Sharma & J. A. Aragón-Correa (Eds.), Corporate environmental strategy and competitive advantage (pp. 27-48). Northampton, MA: Edward Elgar.
Marcus, A. A., & Anderson, M. H. (2006). A general dynamic capability: Does it propagate business and social competencies in the retail food industry. Journal of Management Studies, 43(1), 19-46.
Marcus, A., & Geffen, D. (1998). The dialectics of competency acquisition, pol-lution prevention in electric generation. Strategic Management Journal, 19, 1145-1168.
Mattingly, J. E., & Berman, S. L. (2006). Measurement of corporate social action. Business & Society, 45(1), 20-46.
McWilliams, A., & Siegel, D. (2000). Corporate social responsibility and financial performance, correlation or misspecification. Strategic Management Journal, 21, 603-609.
Miles, M. B., & Huberman, A. M. (1994). Qualitative data analysis (2nd ed.). Thousand Oaks, CA: Sage.
Margolis, J. D., Elfenbein, H. A., & Walsh, J. P. (2007). Does it pay to be good? A meta-analysis and redirection of research on corporate social and financial per-formance (Working Paper). Boston, MA: Harvard Business School.
McEvily, W., & Marcus, A. A. (2005). Embeddedness and the acquisition of competi-tive capabilities. Strategic Management Journal, 26, 1033-1055.
Morhardt, J. E. (2001). Scoring corporate environmental reports for comprehensive-ness, a comparison of three systems. Environmental Management, 27, 881-892.
Neubaum, D. O., & Zahra, S. A. (2006). Institutional ownership and corporate social performance: The moderating effects of investment horizon, activism, and coor-dination. Journal of Management, 32(1), 108-131.
Newman, W. R., & Hanna, M. D. (1996). An empirical exploration of the relationship between manufacturing strategy and environmental management. International Journal of Operations & Production Management, 16(4), 69-87.
Nunnally, J. C., & Bernstein, I. H. (1994). Psychometric theory (3rd ed.). New York, NY: McGraw-Hill.
Ones, D. S., & Viswesvaran, C. (1996). Bandwidth-fidelity dilemma in personality measurement for personnel selection. Journal of Organizational Behavior, 17, 609-626.
Orlitzky, M. (2008). Corporate social performance and financial performance: A research synthesis. In A. Crane, A. McWilliams, D. Matten, J. Moon, & D. Siegel (Eds.), The Oxford Handbook of CSR (pp. 113-134). Oxford, UK: Oxford University Press.
Orlitzky, M., Schmidt, F. L., & Rynes, S. L. (2003). Corporate social and financial performance: A meta-analysis. Organization Studies, 24, 403-441.
at Universidad de Navarra-Biblioteca on March 1, 2011bas.sagepub.comDownloaded from

Walls et al. 113
Orsata, R. J. (2006). Competitive environmental strategies: When does it pay to be green? California Management Review, 48(2), 127-145.
Penrose, E. T. (1959). The theory of the growth of the firm. Oxford, UK: Basil Blackwood.Pfeffer, J., & Salancik, G. R. (1978). The external control of organizations. New York,
NY: Harper & Row.Roome, N. (1992). Developing environmental management strategies. Business Strat-
egy and the Environment, 1(1), 11-24.Russo, M. V., & Fouts, P. A. (1997). A resource-based perspective on corporate envi-
ronmental performance and profitability. Academy of Management Journal, 40, 534-559.
Russo, M. V., & Harrison, N. S. (2005). Organizational design and environmental per-formance, clues from the electronics industry. Academy of Management Journal, 48, 582-593.
Sarkis, J., & Cordeiro, J. J. (2001). An empirical evaluation of environmental effi-ciencies and firm performance, Pollution prevention versus end-of-pipe practice. European Journal of Operational Research, 135, 102-113.
Schwab, D. (1980). Construct validity in organizational behavior. In B. M. Staw & L. L. Cummings (Eds.), Research in Organizational Behavior (Vol. 2, pp. 3-43). Greenwich, CT: JAI.
Sharma, S. (2000). Managerial interpretations and organizational context as predic-tors of corporate choice of environmental strategy. Academy of Management Journal, 43, 681-697.
Sharma, S., & Aragón-Correa, J. A. (2005). Corporate environmental strategy and competitive advantage. Northampton, MA: Edward Elgar.
Sharma, S., & Henriques, I. (2005). Stakeholder influences on sustainability practices in the Canadian forest products industry. Strategic Management Journal, 26,159-180.
Sharma, S., & Vredenburg, H. (1998). Proactive corporate environmental strategy and the development of competitively valuable organizational capabilities [Special Issue]. Strategic Management Journal, 19, 729-753.
Shrivastava, P. (1995). Environmental technologies and competitive advantage. Strategic Management Journal, 16, 183-201.
Siegel, D. (2009, August). Green matters only if it yields more green: An economic/strategic perspective. Academy of Management Perspectives, 23(3), 5-16.
Singh, J. V. (1986). Performance, slack, and risk taking in organizational decision making. Academy of Management Journal, 29, 562-585.
Strike, V. M., Gao, J., & Bansal, P. (2006). Being good while being bad: Social responsibility and the international diversification of U.S. firms. Journal of Inter-national Business Studies, 37, 850-862.
at Universidad de Navarra-Biblioteca on March 1, 2011bas.sagepub.comDownloaded from
114 Business & Society 50(1)
Toffel, M. W., & Marshall, J. D. (2004). Improving environmental performance assessment, Comparative analysis of weighting methods used to evaluate chemi-cal release inventories. Journal of Industrial Ecology, 8, 143-172.
Tsang, E. W. K. (1998). Can guanxi be a source of sustained competitive advan-tage for doing business in China? Academy of Management Executive, 12(3), 64-73.
Uzzi, B. (1999). Embeddedness in the making of financial capital, how social relations and networks benefit firms seeking financing. American Sociological Review, 64, 481-505.
Van den Steen, E. (2005). Organizational beliefs and managerial vision. Journal of Law Economics & Organization, 21, 256-283.
Venkatraman, N., & Grant, J. H. (1986). Construct measurement in organizational strategy research: A critique and proposal. Academy of Management Review, 11, 71-87.
Waddock, S. A., & Graves, S. B. (1997). The corporate social performance – financial performance link. Strategic Management Journal, 18, 303-319.
Waldman, D. A., Sully de Luque, M., Washburn, N., House, R. J., Adetoun, B., Barrasa, A., . . .Wilderom, C. P. M. (2006). Cultural and leadership predictors of corporate social responsibility values of top management: A GLOBE study of 15 countries. Journal of International Business, 37, 823-837.
Wehrmeyer, W. (1996). Greening people. Sheffield, UK: Greenleaf.Wernerfelt, B. (1984). A resource-based view of the firm. Strategic Management
Journal, 5, 171-180.Westley, F., & Mintzberg, H. (1989). Visionary leadership and strategic management.
Strategic Management Journal, 10, 17-32.
Bios
Judith L. Walls is an assistant professor at the John Molson School of Business, Concordia University. Her research investigates the role of corporate governance in corporate social responsibility and how firms develop capabilities to manage their environmental outcomes, both within the firm and along its supply chain. She com-pleted her PhD at Rensselaer’s Lally School of Management and Technology, and a postdoctoral fellowship at the University of Michigan’s Erb Institute for Sustainable Enterprise.
Phillip H. Phan (PhD, University of Washington) is professor and executive vice dean at the Johns Hopkins University Carey Business School. His research includes corporate governance and technology entrepreneurship and he has published more than 80 research articles.
at Universidad de Navarra-Biblioteca on March 1, 2011bas.sagepub.comDownloaded from

Walls et al. 115
Pascual Berrone (PhD, Universidad Carlos III) is an assistant professor of strategic management at IESE Business School. His research interests focus on various aspects of the interface between corporate governance and corporate social responsibility, with particular emphasis on the impact of incentives schemes and ownership struc-tures over environmental performance of firms. His research also examines sustain-able innovation and how external factors affect the environmental-related innovation propensity of firms. In addition, his research investigates the extent to which sym-bolic and substantive environmental strategies are effective in achieving both social acceptance and economic performance. His work has been published in international journals like Academy of Management Journal, Administrative Science Quarterly, Human Resource Management, Journal of Business Ethics, International Journal of Human Resource Management, Journal of Business Research, Corporate Governance: An international review among others.
at Universidad de Navarra-Biblioteca on March 1, 2011bas.sagepub.comDownloaded from