Reliability and Predictive Validity of a Consensus-Based Risk Assessment Tool
Upload
independentCategory
view
1download
0
METHODOLOGICAL ISSUES IN NURSING RESEARCH
A risk assessment scale for the prediction of pressure sore development:
reliability and validity
Margareta Lindgren MScN PhD RN
Student, Department of Medicine and Care, Division of Nursing Science, Faculty of Health Sciences, Linkoping, Sweden
Mitra Unosson PhD RN
Senior Lecturer, Department of Medicine and Care, Division of Nursing Science, Faculty of Health Sciences, Linkoping,
Sweden
Ann-Margret Krantz MScN RN
Lecturer, Department of Medicine and Care, Division of Nursing Science, Faculty of Health Sciences, Linkoping, Sweden
and Anna-Christina Ek PhD RN
Professor, Department of Medicine and Care, Division of Nursing Science, Faculty of Health Sciences, Linkoping, Sweden
Submitted for publication 5 July 2001
Accepted for publication 7 January 2002
190 � 2002 Blackwell Science Ltd
Correspondence:
Margareta Lindgren,
Department of Medicine and Care,
Division of Nursing Science,
Faculty of Health Sciences,
Linkopings Universitet,
SE-581 85 Linkoping,
Sweden.
E-mail: [email protected]
L I N D G R E N M U N O S S O N M K R A N T Z A N & E K A C ( 2 0 0 2 )L I N D G R E N M., U N O S S O N M., K R A N T Z A.N. & E K A.C. (2 00 2 ) Journal of
Advanced Nursing 38(2), 190–199
A risk assessment scale for the prediction of pressure sore development: reliability
and validity
Background. The ability to assess the risk of a patient developing pressure sores is a
major issue in pressure sore prevention. Risk assessment scales should be valid,
reliable and easy to use in clinical practice.
Aim. To develop further a risk assessment scale, for predicting pressure sore
development and, in addition, to present the validity and reliability of this scale.
Methods. The risk assessment pressure sore (RAPS) scale, includes 12 variables, five
from the re-modified Norton scale, three from the Braden scale and three from other
research results. Five hundred and thirty patients without pressure sores on
admission were included in the study and assessed over a maximum period of
12 weeks. Internal consistency was examined by item analysis and equivalence by
interrater reliability. To estimate equivalence, 10 pairs of nurses assessed a total of
116 patients. The underlying dimensions of the scale were examined by factor
analysis. The predictive validity was examined by determination of sensitivity,
specificity and predictive value.
Results. Two variables were excluded as a result of low item–item and item–total
correlations. The average percentage of agreement and the intraclass correlation
between raters were 70% and 0Æ83, respectively. The factor analysis gave three
factors, with a total variance explained of 65Æ1%. Sensitivity, specificity and
predictive value were high among patients at medical and infection wards.
Conclusions. The RAPS scale is a reliable scale for predicting pressure sore
development. The validity is especially good for patients undergoing treatment in
medical wards and wards for infectious diseases. This indicates that the RAPS scale
may be useful in clinical practice for these groups of patients. For patients
undergoing surgical treatment, further analysis will be performed.

Introduction
Pressure sore development constitutes a major problem,
which causes excessive pain and suffering in affected patients.
Problems with pressure sores are also associated with signi-
ficant costs for society (Davies 1994, Smith et al. 1995).
Studies carried out in various care settings show a prevalence
of pressure sores among inpatients ranging between 3Æ75%
and 42% (Barrois 1995, Unosson et al. 1995, Lindgren et al.
2000).
Identification of patients at risk of pressure sore develop-
ment is perhaps the most important issue in pressure sore
prevention (Davies 1994, Smith et al. 1995). Prediction of a
health problem should be possible at an early stage and it is
essential that preventive methods should be available (Larson
1986), the problem with patients developing pressure sores
stresses both these criteria. A useful instrument for the
prediction of pressure sore development requires high sensi-
tivity and specificity, good predictive value, and should be
easy to use in clinical practice (Edwards 1996, Streiner &
Norman 1998).
Research concerning the identification of patients at risk of
developing pressure sores has been in progress since the early
1960s when the Norton scale was developed (Norton et al.
1979). Assessment scales frequently used in clinical practice
and research are the Norton scale (Norton et al. 1979) and
the Braden scale (Bergstrom et al. 1987, Braden & Bergstrom
1987). In the United Kingdom, the Waterlow scale
(Waterlow 1987), and in Sweden, a modified and re-modified
version of the Norton scale (Ek & Bjurulf 1987, Ek et al.
1991) are used.
The Norton scale
In the early 1960s, Norton et al. (1979) presented a risk
assessment scale for prediction of pressure sore development
among elderly patients. The scale was developed from clinical
experience and included five variables (Table 1). The
maximum score on the scale is 20. A cut-off score of £14
(Norton et al. 1979) or £16 (Norton 1987) has been used for
prediction of patients at risk of developing pressure sores.
Norton et al. (1979) found an almost linear relationship
between the initial assessment score and the incidence of
pressure sores among 250 geriatric patients (Norton et al.
1979). The predictive validity of the scale has been examined
in different settings. A sensitivity ranging from 63% to 100%,
a specificity from 26% to 89%, a predictive value positive test
(PVP) ranging from 9% to 70%, and a predictive value
negative test (PVN) from 35% to 93% have been presented in
different studies (Goldstone & Goldstone 1982, Bergstrom
et al. 1987, Dealey 1989, Wardman 1991, Bridel 1993,
Wai-Han et al. 1997, Mei-che Pang & Kwok-shing Wong
1998) (Table 2). The Norton scale has been criticized both
for over prediction and under prediction of patients at risk
Keywords: pressure sore, risk assessment, prevention, validity, reliability, instru-
ment development
Table 1 Variables included in the Norton scale, the re-modified Norton scale, the Braden scale and the RAPS scale
Variable The Norton scale* The re-modified Norton scale� The Braden scale� The RAPS scale
General physical condition þ þ þMental state þ þActivity þ þ þ þMobility þ þ þ þIncontinence þ þFood intake þ þFluid intake þ þNutritional status þMoisture þ þSensory perception þ þFriction and shear þ þSkin type (þ)
Bodily constitution (þ)
Body temperature þSerum albumin þ
*Norton et al. (1979); �Ek et al. (1991); �Braden and Bergstrom (1987).
Methodological issues in nursing research Prediction of pressure sore development
� 2002 Blackwell Science Ltd, Journal of Advanced Nursing, 38(2), 190–199 191

of developing pressure sores (Goldstone & Goldstone 1982,
Bridel 1993). The reliability of the Norton scale is not
considered in these studies.
The modified Norton scale
A modified version of the Norton scale was introduced for
the first time in Sweden in 1987. In a study of 515 long-term
care patients, additional factors consisting of food and fluid
intake, body temperature and social activity were incorpor-
ated into the original Norton scale with a maximum score of
32. By multiple regression analysis, s-albumin, mobility,
activity and general physical condition emerged as risk
factors in this study. The predictive validity of this version,
when measured by sensitivity and specificity, was 52% and
65%, respectively, and the PVP was 12% (Ek 1987). The
scale was further developed from these results. Variables
such as social activity and body temperature were excluded
as they did not appear to be specific risk factors, while the
variable food and fluid intake was divided into two variables
as s-albumin and delayed hypersensitivity tests (Purified
Protein Derivate, PPD) both indicated nutrition as a signi-
ficant risk factor (Table 1). The maximum score for the
re-modified version was 28, and patients with a total score
of £21 were considered to be at risk of developing pressure
sores (Ek & Bjurulf 1987, Ek et al. 1991). Both sensitivity
and specificity for the re-modified version were 69%, and
the PVP and PVN were 32% and 91%, respectively
(unpublished data).
Gunningberg et al. (1999) examined the predictive validity
of the re-modified Norton scale among 81 hip fracture
patients at time of admission to the acute and emergency
Table 2 Validity data of the Norton scale, the modified Norton scale and the Braden scale
Scale/authors n
Type of
ward/unit
Cut-off
point
Sensitivity
(%)
Specificity
(%)
PVP
(%)
PVN
(%)
Patients
with sores
The Norton scale (maximum score 20)
Goldstone and Goldstone (1982) 40 Orthopaedic £14 89 64 18
Bergstrom et al. (1987) 40 Orthopaedic £14 89 36 53 80 18
Retrospective from Goldstone and
Goldstone (1982)
Dealey (1989) 175 88 26 37 81
Vardman (1991) 32 Nursing home 100 82 66 69 10
At risk patients
Bridel (1993) 250 Geriatric £14 63 70 39 86 59
Retrospective from
Norton et al. (1962)
Wai-Han et al. (1997) 185 Eldercare £14 75 8
Mei-che Pang and Kwok-shing
Wong (1998)
106 Medical and
orthopaedic
£16 81 59 33 93 21
The modified Norton scale
Ek (1987) (maximum score 32) 515 Long-term care £25 51 65 13 39
Ek (unpublished data) 501 Long-term care £21 69 69 32 91 50
Re-modified (maximum score 28)
Gunningberg et al. (1991) 81 Hip fracture
patients
<21 71 44 35 78 24
The Braden scale (maximum score 23)
Bergstrom et al. (1987) 99/100 Medical-surgical £16 100/100 90/64 7/9
Barnes and Payton (1993) 361 Acute-care £16 73 91 22
Braden and Bergstrom (1994) 102 Nursing-home £18 79 74 54 90 28
VandenBosch et al. (1996) 103 Tertiary care £17 59 69 29
Bergstrom and Braden (1998) 843 Tertiary care £16 38 92 31 94 108
Medical-surgical £19 50 82 17 96
Long-term care £18 74 60 37 88
Halfens et al. (2000) 320 Medical, surgical,
neurological,
orthopaedic
£20 73 74 47
M. Lindgren et al.
192 � 2002 Blackwell Science Ltd, Journal of Advanced Nursing, 38(2), 190–199

department. The results measured sensitivity at 71%, the-
specificity at 44%, the PVP at 35%, and PVN was 78%
(Table 2).
The re-modified version of the Norton scale was examined
with regard to interrater variability: 110 patients were
evaluated by 22 registered nurses and 22 practical nurses.
The percentage of agreement between registered nurses
ranged from 55% for incontinence to 86% for activity. The
corresponding figures for practical nurses ranged from 51%
for general physical condition to 87% for food intake. From
this analysis it was concluded that only one category of
nurses should perform the risk assessment, as there were
some differences in assessments between registered nurses
and practical nurses (Ek & Bjurulf 1987).
The Braden scale
The Braden scale, based on an overview of the literature,
was first presented by Braden and Bergstrom (1987). Two
fundamental causes of pressure sores are described: the
duration and intensity of the pressure, and the tissue
tolerance to pressure. The scale is composed of six
subscales (Table 1). The maximum score is 23, and cut-
off scores between £14 and £18 have been used in different
studies (Bergstrom et al. 1987, 1998, Braden & Bergstrom
1987). The predictive validity of the Braden scale has been
examined in different studies with various populations. In
these studies the sensitivity ranged between 38% and 100%
and the specificity between 60% and 92% (Bergstrom et al.
1987, 1998, Bergstrom & Braden 1992, Barnes & Payton
1993, Braden & Bergstrom 1994, VandenBosch et al.
1996, Halfens et al. 2000). The PVP and the PVN were
54% and 90%, respectively (Braden & Bergstrom 1994)
(Table 2).
The interrater reliability has been examined by a compar-
ison of different categories of personnel. The reliability
coefficient between registered nurses and graduate students
was high (r¼ 99), and the percentage of agreement measuring
88%. It was significantly lower (11–38%) when comparison
was applied to less well-educated carers (Bergstrom et al.
1987).
Halfens et al. (2000) used the Braden scale in a prospective
multicentre study, adding several other risk factors to the
scale. The original Braden scale was found to be both reliable
and valid (Table 2). However, the authors also suggested that
the nutrition variable be reformulated so as to take the
nutritional condition, and not only the nutritional intake,
into consideration (Halfens et al. 2000).
The Norton scale, the re-modified Norton scale, and the
Braden scale are additive ordinal scales. Each variable is rated
from 1 to 4 except for friction and shear, which is rated from
1 to 3. The lower the score, the greater the risk of pressure
sore development. The variables activity (ability to move) and
mobility (ability to change body position) were included and
defined in the same way as in the above-mentioned risk
assessment scales. In the Braden scale, the variable nutrition
includes both food and fluid intake while in the re-modified
Norton scale, food and fluid intake are separated into two
variables. Incontinence is included in the three scales, but in
the Braden scale, the variable perspiration, here termed
moisture, is added. Sensory perception and friction and shear
are not included in the Norton scale nor in the re-modified
Norton scale (Table 1) (Norton et al. 1979, Braden &
Bergstrom 1987, Ek et al. 1991).
The reliability of risk assessment scales has not been
adequately assessed in a Swedish context. The results from
validity studies of risk assessment scales are difficult to
compare, as definitions of pressure sores, the demographics of
the patients included, sample size and data collection vary
between studies and the results are not conclusive (Table 2).
Some studies are prospective and some retrospective. Thus,
there is a need for a further development of risk assessment
scales in order to create a scale that is useful in different units
or wards.
The study
Aim
The aim of this study was to develop further a risk assessment
scale, the re-modified Norton scale, for the prediction of
pressure sore development. The aim was also to present the
validity and the reliability of this scale.
Method
This prospective study was performed at one university
hospital and one county hospital in Sweden from 1996 to
1998. Data for the interrater reliability were collected at the
same two hospitals in 1999. The Research Ethical Committee
of the Faculty of Health Sciences, Linkoping University,
approved the study.
Instrument
A pressure sore is defined as a sore or skin damage appearing
after a prolonged period of ischameia in the skin (Ek 1987).
The pressure sore grading system used in this study was as
follows: Stage 1, persistent discoloration, with intact skin
surface; Stage 2, epithelial damage (abrasion or blister);
Stage 3, damage to the full thickness of the skin without a
Methodological issues in nursing research Prediction of pressure sore development
� 2002 Blackwell Science Ltd, Journal of Advanced Nursing, 38(2), 190–199 193
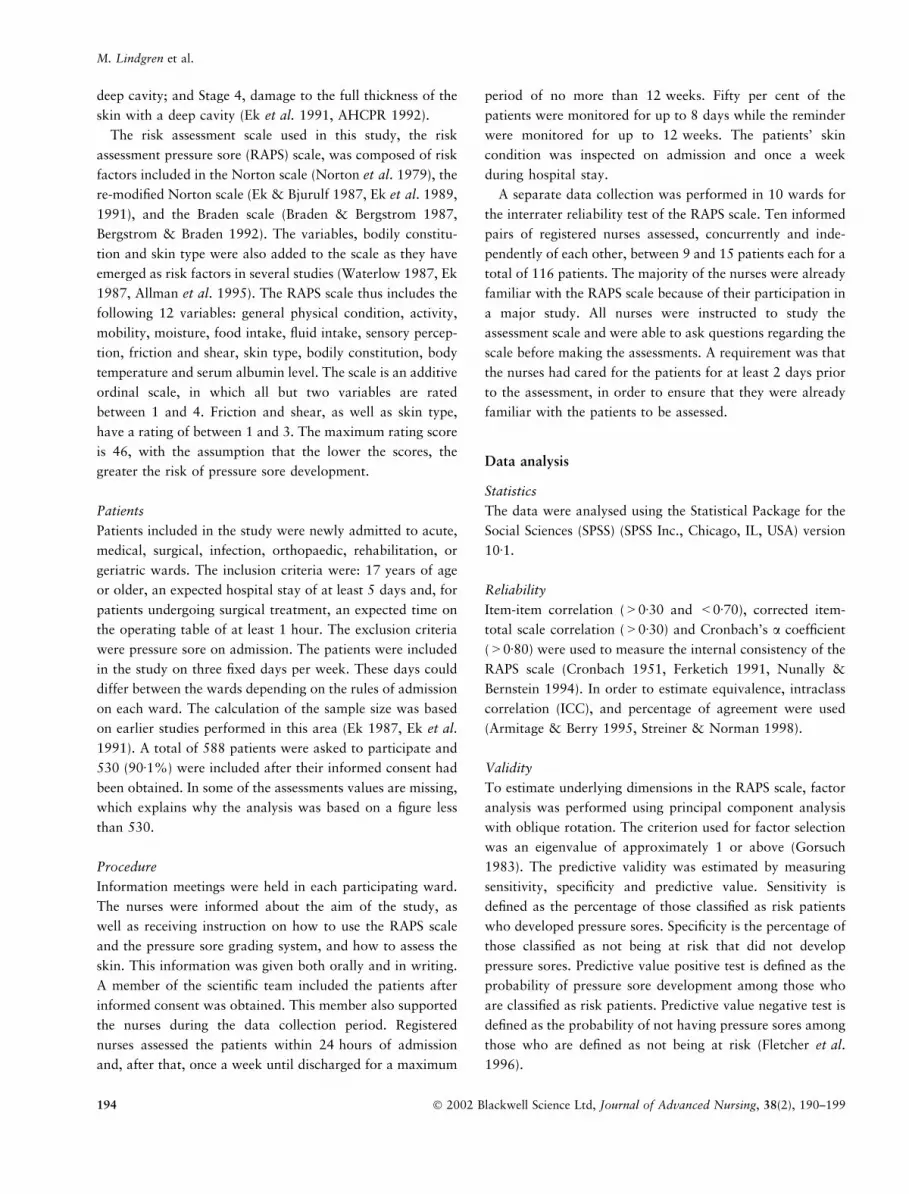
deep cavity; and Stage 4, damage to the full thickness of the
skin with a deep cavity (Ek et al. 1991, AHCPR 1992).
The risk assessment scale used in this study, the risk
assessment pressure sore (RAPS) scale, was composed of risk
factors included in the Norton scale (Norton et al. 1979), the
re-modified Norton scale (Ek & Bjurulf 1987, Ek et al. 1989,
1991), and the Braden scale (Braden & Bergstrom 1987,
Bergstrom & Braden 1992). The variables, bodily constitu-
tion and skin type were also added to the scale as they have
emerged as risk factors in several studies (Waterlow 1987, Ek
1987, Allman et al. 1995). The RAPS scale thus includes the
following 12 variables: general physical condition, activity,
mobility, moisture, food intake, fluid intake, sensory percep-
tion, friction and shear, skin type, bodily constitution, body
temperature and serum albumin level. The scale is an additive
ordinal scale, in which all but two variables are rated
between 1 and 4. Friction and shear, as well as skin type,
have a rating of between 1 and 3. The maximum rating score
is 46, with the assumption that the lower the scores, the
greater the risk of pressure sore development.
Patients
Patients included in the study were newly admitted to acute,
medical, surgical, infection, orthopaedic, rehabilitation, or
geriatric wards. The inclusion criteria were: 17 years of age
or older, an expected hospital stay of at least 5 days and, for
patients undergoing surgical treatment, an expected time on
the operating table of at least 1 hour. The exclusion criteria
were pressure sore on admission. The patients were included
in the study on three fixed days per week. These days could
differ between the wards depending on the rules of admission
on each ward. The calculation of the sample size was based
on earlier studies performed in this area (Ek 1987, Ek et al.
1991). A total of 588 patients were asked to participate and
530 (90Æ1%) were included after their informed consent had
been obtained. In some of the assessments values are missing,
which explains why the analysis was based on a figure less
than 530.
Procedure
Information meetings were held in each participating ward.
The nurses were informed about the aim of the study, as
well as receiving instruction on how to use the RAPS scale
and the pressure sore grading system, and how to assess the
skin. This information was given both orally and in writing.
A member of the scientific team included the patients after
informed consent was obtained. This member also supported
the nurses during the data collection period. Registered
nurses assessed the patients within 24 hours of admission
and, after that, once a week until discharged for a maximum
period of no more than 12 weeks. Fifty per cent of the
patients were monitored for up to 8 days while the reminder
were monitored for up to 12 weeks. The patients’ skin
condition was inspected on admission and once a week
during hospital stay.
A separate data collection was performed in 10 wards for
the interrater reliability test of the RAPS scale. Ten informed
pairs of registered nurses assessed, concurrently and inde-
pendently of each other, between 9 and 15 patients each for a
total of 116 patients. The majority of the nurses were already
familiar with the RAPS scale because of their participation in
a major study. All nurses were instructed to study the
assessment scale and were able to ask questions regarding the
scale before making the assessments. A requirement was that
the nurses had cared for the patients for at least 2 days prior
to the assessment, in order to ensure that they were already
familiar with the patients to be assessed.
Data analysis
Statistics
The data were analysed using the Statistical Package for the
Social Sciences (SPSS) (SPSS Inc., Chicago, IL, USA) version
10Æ1.
Reliability
Item-item correlation (>0Æ30 and <0Æ70), corrected item-
total scale correlation (>0Æ30) and Cronbach’s a coefficient
(>0Æ80) were used to measure the internal consistency of the
RAPS scale (Cronbach 1951, Ferketich 1991, Nunally &
Bernstein 1994). In order to estimate equivalence, intraclass
correlation (ICC), and percentage of agreement were used
(Armitage & Berry 1995, Streiner & Norman 1998).
Validity
To estimate underlying dimensions in the RAPS scale, factor
analysis was performed using principal component analysis
with oblique rotation. The criterion used for factor selection
was an eigenvalue of approximately 1 or above (Gorsuch
1983). The predictive validity was estimated by measuring
sensitivity, specificity and predictive value. Sensitivity is
defined as the percentage of those classified as risk patients
who developed pressure sores. Specificity is the percentage of
those classified as not being at risk that did not develop
pressure sores. Predictive value positive test is defined as the
probability of pressure sore development among those who
are classified as risk patients. Predictive value negative test is
defined as the probability of not having pressure sores among
those who are defined as not being at risk (Fletcher et al.
1996).
M. Lindgren et al.
194 � 2002 Blackwell Science Ltd, Journal of Advanced Nursing, 38(2), 190–199

Results
The major study included 530 patients, 265 men and 265
women, of which 62 (11Æ7%) patients developed pressure
sores. The mean age of the group was 69Æ25 ± 14Æ39 years.
The men were younger than the women, 67Æ1 ± 13Æ9 and
71Æ4 ± 14Æ6 years, respectively (P¼ 0Æ001). The patients
were admitted to 21 different wards: 286 to surgical wards
and 244 to medical wards.
Reliability
For two items, bodily constitution and skin type, the
correlation with the remaining items was less than 0Æ30.
For mobility, the correlation with friction and shear was
above 0Æ70 (Table 3). The corrected item–total correlation
ranged from 0Æ21 for bodily constitution and 0Æ25 for skin
type to 0Æ70 for mobility. All correlations were significant
(P < 0Æ001) (Table 4). After exclusion of skin type and
bodily constitution, mean item–item correlation increased
from 0Æ28 to 0Æ34 and Cronbach’s a coefficient from 0Æ82 to
0Æ83. The maximum score for the RAPS scale, after exclusion
of skin type and bodily constitution was 39. The average
percentage of agreement and the intraclass correlation (ICC)
between raters for the total sample (n¼ 116) were 70% and
0Æ83, respectively (bodily constitution and skin type
excluded).
Validity
The factor analysis, with eigenvalue of approximately 1Æ0 and
above, resulted in three factors. Factor one, termed mobility,
included: physical activity, mobility, moisture, sensory
perception, and friction and shear. Factor two, termed
physical condition, included: general physical condition,
temperature and s-albumin. Factor three, termed nutrition,
included: food and fluid intake (Table 5). The total variance
explained was 65Æ1%.
Sensitivity, specificity, PVP, and PVN for the RAPS scale
were performed on data collected on admission (n¼ 488). At
a cut-off point of £36, sensitivity was 57Æ4% and specificity,
57Æ6%, whereas PVP was 14Æ4% and PVN 91Æ6% (Table 6).
Sensitivity, specificity and predictive values for medical and
surgical patients were also calculated. At a cut-off point of
£36, sensitivity for medical patients was 90Æ0%, specificity
28Æ6%, PVP 10Æ7%, and PVN 96Æ8%. The corresponding
figures for surgical patients were 38Æ2%, 84Æ8%, 27Æ7% and
90Æ0%, respectively. At a cut-off point of 31, the best balance
between sensitivity and specificity was achieved for medical
patients; sensitivity was 75%, specificity, 70%, PVP 19Æ2%,
and PVN 96Æ7% (Table 6). The same analysis was performed
with the two largest groups of patients, namely patients from
Table 3 Spearman rank correlation coefficient between items on the RAPS scale
Items 1 2 3 4 5 6 7 8 9 10 11 12
1. General physical condition
2. Activity 0Æ51**
3. Mobility 0Æ46** 0Æ67**
4. Moisture 0Æ36** 0Æ49** 0Æ49**
5. Food intake 0Æ51** 0Æ42** 0Æ40** 0Æ33**
6. Fluid intake 0Æ25** 0Æ24** 0Æ26** 0Æ18** 0Æ42**
7. Sensory perception 0Æ25** 0Æ35** 0Æ41** 0Æ35** 0Æ23** 0Æ11*
8. Friction and shear 0Æ42** 0Æ62** 0Æ78** 0Æ48** 0Æ36** 0Æ20** 0Æ39**
9. Skin type 0Æ18** 0Æ18** 0Æ13** 0Æ13** 0Æ20** 0Æ20** 0Æ00 0Æ15**
10. Bodily constitution 0Æ14** 0Æ05 0Æ09* 0Æ09 0Æ17** 0Æ16** 0Æ02 0Æ05 0Æ12**
11. Body temperature 0Æ45** 0Æ22** 0Æ20** 0Æ24** 0Æ26** 0Æ10* 0Æ07 0Æ22** �0Æ02 �0Æ00
12. Serum albumin 0Æ37** 0Æ25** 0Æ22** 0Æ21** 0Æ34** 0Æ24** 0Æ11* 0Æ21** 0Æ06 0Æ20** 0Æ24**
*P < 0Æ05; **P < 0Æ01 (two-tailed).
Table 4 Corrected item–total scale correlation (n ¼ 488)
Items r
1. General physical condition 0Æ66*
2. Activity 0Æ65*
3. Mobility 0Æ70*
4. Moisture 0Æ50*
5. Food intake 0Æ63*
6. Fluid intake 0Æ40*
7. Sensory perception 0Æ39*
8. Friction and shear 0Æ68*
9. Skin type 0Æ25*
10. Bodily constitution 0Æ21*
11. Body temperature 0Æ34*
12. Serum albumin 0Æ36*
*P < 0Æ001.
Methodological issues in nursing research Prediction of pressure sore development
� 2002 Blackwell Science Ltd, Journal of Advanced Nursing, 38(2), 190–199 195

wards for infectious diseases (n¼ 76) and orthopaedic
patients (n¼ 99). At a cut-off point £36, for patients from
wards for infectious diseases, the sensitivity was 90Æ0%,
specificity 28Æ8%, PVP 16Æ1%, and PVN 95Æ0%. For ortho-
paedic patients, the results at the same cut-off point were
47Æ8%, 85Æ5%, 50Æ0% and 84Æ4%, respectively. At a lower
cut-off point of 31, sensitivity was 80%, whereas specificity,
PVP, and PVN were 69Æ7%, 28Æ6%, and 95Æ8%, respectively,
for patients from wards for infectious diseases (Table 6).
Sensitivity, specificity, PVP and PVN were calculated exclu-
ding s-albumin (n¼ 508) as data were missing in 20 cases.
The results did not differ from those obtained in the analysis
presented above.
Discussion
The RAPS scale is a further development of the modified and
re-modified Norton scale (Ek 1987, Ek et al. 1991). One of
the intentions of adding variables to these scales was to
increase the predictive validity. In this study, this has been
achieved to some extent, but the result varies a great deal
among different categories of patients.
Risk assessment is recommended as the first step in the
prevention of pressure sore development in nursing care
(AHCPR 1992, EPUAP 1998). Assessment has to be
performed on admission, and must be re-assessed whenever
there is a significant change in the patients’ condition. A risk
assessment scale will help the nurses to make a systematic
assessment of the patients’ condition and risk of pressure sore
development. This can become an important foundation for
prevention and quality assurance, helping nurses to work
more professionally (Ek et al. 2001). To improve the predic-
tion and prevention of pressure sore development, risk
assessment scales with high degree of sensitivity, specificity
and predictive values are needed. The risk assessment scale,
the RAPS scale, used in this study includes variables from the
Norton scale, the re-modified Norton scale and the Braden
scale (Braden & Bergstrom 1987, Ek 1987, Ek et al. 1991).
These scales have been examined, although not fully and not
in Sweden, for validity and reliability in different care settings
(Edwards 1994, Ek 1987, Mei-che Pang & Kwok-shing
Wong 1998). Thus, risk assessment scales need to be further
developed for Swedish conditions in order to improve the
prediction of pressure sore development.
In this study, analysis of the reliability of the RAPS scale
consists of internal consistency and equivalence. The
internal consistency of the scale was measured by item–
item correlation and corrected item–total correlation. It is
recommended that the items in a scale should be correlated
with the total scale above 0Æ30. The higher the correlation,
the better the item (Nunally & Bernstein 1994). The item-
item correlation should be moderate, between 0Æ30 and
0Æ70. Ferketich (1991) points out that an item–item corre-
lation below 0Æ30 may indicate that the item does not relate
to the problem measured and that an item–item correlation
above 0Æ70 indicates that the item may be unnecessary
(Ferketich 1991). As bodily constitution and skin type were
weakly correlated with the scale as a whole, and very
weakly correlated with the other items, they were excluded.
After the exclusion, item–item correlation varied moder-
ately, and the mean item–item correlation increased to a
level above 0Æ30, as recommended (Nunally & Bernstein
1994). The item friction and shear correlated with mobility
above 0Æ70 and may be an unnecessary item. However, this
Table 5 Principal component analysis with oblique rotation for the RAPS scale
Factor Variable Mobility Loading Physical condition Loading Nutrition Loading Communalities h2
1. General physical condition 0Æ40 0Æ54 0Æ13 0Æ65
2. Physical activity 0Æ74 0Æ11 <0Æ1 0Æ66
3. Mobility 0Æ87 <0Æ1 <0Æ1 0Æ81
4. Moisture 0Æ66 <0Æ1 <0Æ1 0Æ46
5. Food intake 0Æ25 0Æ23 0Æ60 0Æ67
6. Fluid intake <0Æ1 �0Æ15 0Æ92 0Æ80
7. Sensory perception 0Æ73 �0Æ16 <0Æ1 0Æ47
8. Friction and shear 0Æ85 0Æ11 <0Æ1 0Æ76
9. Body temperature <0Æ1 0Æ89 �0Æ18 0Æ74
10. s-Albumin �0Æ10 0Æ53 0Æ38 0Æ48
Eigenvalue 4Æ27 1Æ27 0Æ96
Percentage of variance 42Æ74 12Æ71 9Æ62
Cumulative percentage 42Æ74 55Æ46 65Æ08
a Coefficient 0Æ83 0Æ59 0Æ57
The variables finally included in the respective factors are in bold type.
M. Lindgren et al.
196 � 2002 Blackwell Science Ltd, Journal of Advanced Nursing, 38(2), 190–199

item is of major importance from a clinical perspective and
was therefore not excluded. A sample size of at least
200–300 subjects is recommended in order to minimize the
risk of false results based on chance (Ferketich 1991). In this
study, 530 patients were included. Taken together, the
results show that the internal consistency of the RAPS scale
is sufficient.
The percentage of agreement among nurses was 70%. As
this calculation does not consider chance influence, intraclass
correlation was calculated (Armitage & Berry 1995). The
Table 6 Sensitivity, specificity, predictive value positive test (PVP), and predictive value negative test (PVN). Numbers in brackets are the
number of patients with pressure sores
Cut-off point Sensitivity (%) Specificity (%) PVP (%) PVN (%)
Total sample, n ¼ 488 (54)
£38 77Æ8 34Æ8 12Æ9 92Æ6£37 70Æ4 46Æ5 14Æ1 92Æ7£36 57Æ4 57Æ6 14Æ4 91Æ6£35 50Æ0 64Æ3 14Æ8 91Æ2£34 46Æ3 69Æ4 15Æ8 91Æ2£33 38Æ9 75Æ3 16Æ4 90Æ8£32 33Æ3 80Æ2 17Æ3 90Æ6£31 31Æ5 84Æ6 20Æ2 90Æ8
Medical patients, n ¼ 230 (20)
£38 95Æ0 8Æ1 9Æ0 94Æ4£37 90Æ0 16Æ7 9Æ3 94Æ6£36 90Æ0 28Æ6 10Æ7 96Æ8£35 85Æ0 38Æ6 11Æ6 96Æ4£34 80Æ0 45Æ2 12Æ2 96Æ0£33 75Æ0 54Æ8 13Æ6 95Æ8£32 75Æ0 62Æ9 19Æ2 96Æ4£31 75Æ0 70Æ0 19Æ2 96Æ7
Surgical patients, n ¼ 258 (34)
£38 67Æ6 59Æ8 20Æ4 92Æ4£37 58Æ9 74Æ6 26Æ0 92Æ3£36 38Æ2 84Æ8 27Æ7 90Æ0£35 29Æ4 88Æ4 27Æ8 89Æ2£34 26Æ5 92Æ0 33Æ3 89Æ2£33 17Æ6 95Æ1 35Æ3 87Æ3£32 8Æ8 96Æ4 27Æ3 87Æ4£31 5Æ9 98Æ2 33Æ3 87Æ3
Patients in wards for infectious diseases, n ¼ 76 (10)
£38 90Æ0 3Æ0 12Æ3 66Æ7£37 90Æ0 13Æ5 13Æ6 90Æ0£36 90Æ0 28Æ8 16Æ1 95Æ0£35 90Æ0 33Æ3 17Æ0 95Æ7£34 90Æ0 54Æ5 21Æ1 95Æ6£33 80Æ0 54Æ5 21Æ1 94Æ7£32 80Æ0 62Æ1 24Æ2 95Æ3£31 80Æ0 69Æ7 28Æ6 95Æ8
Orthopaedic patients, n ¼ 99 (23)
£38 82Æ6 50Æ0 33Æ3 90Æ5£37 69Æ6 69Æ7 41Æ0 88Æ3£36 47Æ8 85Æ5 50Æ0 84Æ4£35 39Æ1 89Æ5 52Æ9 82Æ9£34 34Æ8 93Æ4 61Æ5 82Æ6£33 21Æ7 97Æ4 71Æ4 80Æ4£32 13Æ0 97Æ4 60Æ0 78Æ7£31 8Æ7 100Æ0 100Æ0 78Æ4
Methodological issues in nursing research Prediction of pressure sore development
� 2002 Blackwell Science Ltd, Journal of Advanced Nursing, 38(2), 190–199 197

intraclass correlation between nurses was high, 0Æ83, indica-
ting that the equivalence of the RAPS scale is good.
Factor analysis was used to examine underlying dimensions
of the RAPS scale, which is an ordinal scale. However, the
use of factor analysis is justified, as the analysis is based on
correlation, which will not be affected by the scaling (Kim &
Mueller 1978). The factor analysis gave three factors, and no
cross-linking was found. The variables included in the three
factors appear to be coherent, and the factors were desig-
nated mobility, physical status and nutrition. The distribution
of variables into three factors seems to be logical and
indicates that the RAPS scale measures three clusters of
variables: mobility, physical condition, and nutrition. The
total variance explained was 65Æ1%, which is satisfactory for
a new scale (Gorsuch 1983). The total variance indicates,
however, that there are some additional variables to be
considered beyond those included in the RAPS scale when
measuring the risk of pressure sore development. Future
studies need to investigate whether these factors be identified
and assessed, or can all changes be related to the body’s
adjustment to immobility and bed rest, which is clinically
more complicated and comprehensive to observe and to
measure (Rosseau 1993).
The sample in this study is a very heterogeneous group of
patients. According to the results concerning sensitivity,
specificity and predictive value, it seems preferable to use the
RAPS scale among patients in medical wards and wards for
infectious diseases. The sensitivity among medical patients
and patients treated in wards for infectious diseases was high,
but the specificity at a cut-off point of £36 was low. The
optimal cut-off point for these groups of patients seems to be
£31. At this point, the best relationship between sensitivity
and specificity was achieved. Bergstrom & Braden (1998)
used the Braden scale among patients from tertiary-care,
medical–surgical wards and long-term care. The predictive
value for the Braden scale varied considerably for the
different patient groups. This indicates that there may be
some other risk factors to be considered when assessing the
risk of pressure sore development among patients undergoing
surgical treatment. Some of these factors may be hypotensive
episodes during surgical treatment, serum albumin level,
extra corporeal circulation, preoperative immobility time, as
well as the length and type of surgery (Kemp et al. 1990, Ek
et al. 1991, Allman et al. 1995, Nixon et al. 2000). These are
some factors that have to be studied in future in the attempt
to find an optimal risk assessment tool for surgical patients.
As there are many factors that are complicated to observe
and measure and which may alter the risk of pressure sore
development, we may have to accept some level of over-
prediction, despite increased costs.
Study limitations
Focusing on a certain problem, such as pressure sores, can be
one source of error in the data collection. In this study,
preventive measures were not excluded because of ethical
considerations, but there is a risk that intensified use of
preventive measures could interfere with and influence the
results. The sensitivity of the scale may be poorer because of
the better care given to the patients. No evidence of
preventive measures having been performed to a higher
degree than usual were, however, been observed.
The inclusion of patients took place on 3 days per week.
Precautions were taken to ensure that no groups of patients
were systematically excluded. There was, however, a small
risk of exclusion of some patient categories as the sampling
was not random. Another limitation of this study may be
the fact that the nurses who made the risk assessments also
made, in some cases, the skin inspections. It is possible
that the assessment of the skin may have influenced the
scoring of the RAPS scale, which is a problem in clinical
studies.
Conclusion
In conclusion, the RAPS scale is reliable concerning internal
consistency and has achieved the necessary level of equival-
ence. The predictive validity was especially good for medical
patients and those with infectious diseases at a cut-off point
of £31. This indicates that the RAPS scale may be useful in
clinical practice for these patients, and the scale may be
possible to use in clinical practice for these groups of patients.
For patients undergoing surgical treatment further analysis
will be performed.
Acknowledgements
Grants from the Research Fund of the County of Ostergot-
land and Vardalstiftelsen, no. V 96-142 and V 98-360 are
gratefully acknowledged.
References
Agency for Health Care Policy and Research (1992) Pressure Ulcers
in Adults: Prediction and Prevention. Clinical Practice Guideline,
Number 3, AHCPR Publication No. 92-0047. US Department of
Health and Human Services, Rockville, MD.
Allman R.M., Goode P.S., Patrick M.M., Burst N. & Bartolucci A.A.
(1995) Pressure ulcer risk factors among hospitalized patients with
activity limitation. JAMA 273, 865–870.
Armitage P. & Berry G. (1995) Statistical Methods in Medical
Research, 3rd edn. University Press, Cambridge.
M. Lindgren et al.
198 � 2002 Blackwell Science Ltd, Journal of Advanced Nursing, 38(2), 190–199

Barnes D. & Payton R.G. (1993) Clinical application of the Braden
scale in the acute-care setting. Dermatology Nursing 5, 386–388.
Barrois B. (1995) A survey of pressure sore prevalence in hospitals in
the greater Paris region. Journal of Wound Care 5, 234–236.
Bergstrom N. & Braden B. (1992) A Prospective Study of Pressure
Sore Risk Among Institutionalized Elderly JAGS 40, 747–758.
Bergstrom N., Braden B., Laguzza A. & Holman V. (1987) The
Braden scale for predicting pressure sore risk. Nursing Research
36, 205–210.
Bergstrom N., Braden B., Kemp M., Champagen M. & Ruby E.
(1998) Predicting pressure ulcer risk, a multisite study of the
predictive validity of the Braden scale. Nursing Research 47,
261–269.
Braden B. & Bergstrom B. (1987) A conceptual schema for the study
of the etiology of pressure sores. Rehabilitation Nursing 12, 8–16.
Braden B. & Bergstrom N. (1994) Predictive validity of the Braden
scale for pressure sore risk in a nursing home population. Research
in Nursing and Heath 17, 459–470.
Bridel J. (1993) Assessing the risk of pressure sores. Nursing Standard
7, 32–35.
Cronbach L.J. (1951) Coefficient alpha and the internal structure of
tests. Psychometrica 3, 297–334.
Davies K. (1994) Pressure sores: aetiology, risk factors and assess-
ment scales. British Journal of Nursing 3, 256–262.
Dealey C. (1989) Risk assessment of pressure sores: a comparative
study of Norton and Waterlow scores. Nursing Standard 3 (Suppl.)
11–12.
Edwards M. (1994) The rationale for the use of risk calculators in
pressure sore prevention and the evidence of the reliability and
validity of published scales. Journal of Advanced Nursing 20,
288–296.
Edwards M. (1996) Pressure sore risk calculators: some methodolo-
gical issues. Journal of Clinical Nursing 5, 307–312.
Ek A.C. (1987) Prediction of pressure sore development. Scandina-
vian Journal of Caring Sciences 1, 77–84.
Ek A.C., Unosson M. & Bjurulf P. (1989) The Modified Norton Scale
and the Nutritional State. Scandinavian Journal of Caring Sciences
3, 183–187.
Ek A.C., Unosson M. & Larsson J. (1991) The development and
healing of pressure sore related to the nutritional state. Clinical
Nutrition 5, 99–103.
Ek A.C., Nordstrom G. & Lindgren M. (2001) Quality indicators for
patients at risk for pressure sore development. In Quality Indica-
tors in Nursing Care (Idvall E. ed.), SPRI Publication no. 9,
Stockholm, pp. 11–27.
EPUAP. European Pressure Ulcer Advisory Panel. (1998) Pressure
ulcer prevention guidelines. EPUAP Review 1, 7–8.
Ferketich S. (1991) Aspects of item analysis. Research in Nursing and
Health 14, 165–168.
Fletcher H.R., Fletcher S.W. & Wagner E.H. (1996) Clinical Epidemi-
ology, The Essentials. Victor Graphics Inc., Baltimore, MD.
Goldstone L.A. & Goldstone J. (1982) The Norton score: an early
warning of pressure sores? Journal of Advanced Nursing 7,
419–426.
Gorsuch R. (1983) Factor Analysis, 2nd edn. Lawrence Erlbaum
Associates, Hillsdale, NJ.
Gunningberg L., Lindholm C., Carlsson M. & Sjoden P.-O. (1991)
Implementation of risk assessment and classification of pressure
ulcers as quality indicators for patients with hip fractures. Journal
of Clinical Nursing 8, 396–406.
Halfens R.J.G., Van Achterberg T. & Bal R.H. (2000) Validity and
reliability of the Braden scale and the influence of risk factors: a
multi-centre prospective study. International Journal of Nursing
Studies 37, 313–319.
Kemp M.G., Keithley J.K., Smith D.W. & Morreale B. (1990)
Factors that contribute to pressure sores in surgical patients.
Research in Nursing and Health 13, 293–301.
Kim J.O. & Mueller C.W. (1978) Factor Analysis. Statistical Methods
and Practical Issues. SAGE Publications, Beverly Hills, CA.
Larson E. (1986) Evaluating validity of screening tests. Nursing
Research 35, 186–188.
Lindgren M., Unosson M. & Ek A.C. (2000) Pressure sore prevalence
within a public health services area. International Journal of
Nursing Practice 6, 333–337.
Mei-che Pang S. & Kwok-shing Wong T. (1998) Predicting pressure
sore risk with the Norton, Braden, and Waterlow scales in a Hong
Kong rehabilitation Hospital. Nursing Research 47, 147–153.
Nixon J., Brown J., McElvenny D., Mason S. & Bond S. (2000)
Prognostic factors associated with pressure sore development in the
immediate post-operative period. International Journal of Nursing
Studies 37, 279–289.
Norton D. (1987) Norton revised risk scores. Nursing Times 83, 6.
Norton D., McLaren R. & Exton-Smith A.N. (1979) An Investiga-
tion of Geriatric Problems in Hospital, 3rd edn. Churchill Living-
stone, London.
Nunally J.C. & Bernstein I.H. (1994) Psychometric Theory, 3rd edn.
McGraw-Hill Inc., New York.
Rosseau P. (1993) Immobility in the aged. Archives of Family
Medicine 2, 169–177.
Smith L.N., Booth N., Douglas D., Robertson W.R., Walker A.,
Durie M., Fraser A., Hillan E.H. & Swaffield J. (1995) A critique
of ‘at risk’ pressure sore assessment tools. Journal of Clinical
Nursing 4, 153–159.
Streiner D.L. & Norman G.R. (1998) Health Measurement Scales.
Oxford University Press, New York.
Unosson M., Ek A.C., Bjurulf P., Von Schenk H. & Larsson J. (1995)
Influence of macronutrient status on recovery after hip fracture.
Journal of Nutritional and Environmental Medicine 5, 23–34.
VandenBosch T., Montoye C., Satwicz M., Durkee-Leonard K. &
Boylan-Lewis B. (1996) Predictive validity of the Braden scale and
nurses’ perception in identifying pressure ulcer risk. Applied
Nursing Research 9, 80–86.
Vardman C. (1991) Norton v. Waterlow. Nursing Times 87, 74–78.
Wai-Han C., Kit-Wai C., French P., Yim-Sheung L. & Lai-Kwan T.
(1997) Which pressure sore risk calculator? A study of the
effectiveness of the Norton scale in Hong Kong. International
Journal of Nursing Studies 34, 165–169.
Waterlow J. (1987) Calculating the risk. Nursing Times 83, 58–60.
Methodological issues in nursing research Prediction of pressure sore development
� 2002 Blackwell Science Ltd, Journal of Advanced Nursing, 38(2), 190–199 199
Copyright © 2022 FDOKUMEN


![[Validity and reliability of the nursing organizational health questionnaire]](https://static.fdokumen.com/doc/165x107/633a0d90a730b4837d007338/validity-and-reliability-of-the-nursing-organizational-health-questionnaire.jpg)