The development, validity and reliability of TPACK-deep: A technological pedagogical content...
14
The development, validity and reliability of TPACK-deep: A technological pedagogical content knowledge scale Isil Kabakci Yurdakul a, * ,1 , Hatice Ferhan Odabasi a , Kerem Kilicer a , Ahmet Naci Coklar b , Gurkay Birinci a , Adile Askim Kurt a a Anadolu University, Department of Computer Education and Instructional Technologies, Yunusemre Campus, Eskisehir, Turkey b Selcuk University, Department of Computer Education and Instructional Technologies, Konya, Turkey article info Article history: Received 11 April 2011 Received in revised form 18 October 2011 Accepted 21 October 2011 Keyword: Pedagogical issues abstract The purpose of this study is to develop a TPACK (technological pedagogical content knowledge) scale based on the centered component of TPACK framework in order to measure preservice teachers’ TPACK. A systematic and step-by-step approach was followed for the development of the scale. The validity and reliability studies of the scale were carried out with 995 Turkish preservice teachers. The sample was split into two subsamples on random basis (n1 ¼ 498, n2 ¼ 497). The first sample was used for Exploratory Factor Analysis (EFA) and the second sample for Confirmatory Factor Analysis (CFA). After the EFA, the TPACK-deep scale included 33 items and had four factors. These factors were design, exertion, ethics and proficiency. The Cronbach’s alpha coefficient for the whole scale was found to be .95, whereas the values of Cronbach’s alpha coefficient for individual factors of the scale ranged between .85 and .92. The CFA was conducted within the scope of the validity study of the scale. In this way, this structure of the 4-factor scale was confirmed. In addition, the test-retest reliability coefficient of the scale was calculated as .80. The findings revealed that the TPACK-deep scale was a valid and reliable instrument for measuring TPACK. Consequently, various suggestions were put forward regarding the use the TPACK- deep scale for applied research and for future studies. Crown Copyright Ó 2011 Published by Elsevier Ltd. All rights reserved. 1. Introduction The lack of teacher knowledge, skills, abilities, or competencies related to use of technology in teaching process have been identified as the major barriers to technology integration (Belland, 2009; Bingimlas, 2009; Brinkerhoff, 2006; Chen, Looi, & Chen, 2009; Ertmer, 1999; Lim, 2007; Lim & Khine, 2006; Hew & Brush, 2007; Oncu, Delialioglu, & Brown, 2008; Ozdemir & Kilic, 2007; Shuldman, 2004; Yalin, Karadeniz, & Sahin, 2007; Zhao, 2007).The technology integration barriers include not only the lack of specific technology knowledge and skills but also the lack of technology-supported pedagogical and technology-related-classroom management knowledge and skills (Hew & Brush, 2007). Therefore, the approaches related to technology integration in education have changed from techno centric inte- gration to techno-pedagogical integration. The techno centric integration approach focuses on technology and aims at helping teachers gain the skills and knowledge necessary to use various technologies. On the other hand, the techno-pedagogical integration approach is based on pedagogy and puts pedagogy as well as technology into practice in the integration process. One of the techno-pedagogical integration approaches in the field of technology integration in education is the framework of Technological Pedagogical Content Knowledge (TPACK or TPCK). Technological Pedagogical Content Knowledge is referred to as TPACK today. However, it was used as TPCK in earlier publications in the literature. TPACK is a teacher knowledge framework developed by including technology knowledge into the teacher knowledge framework that Shulman (1986) basically determined as “pedagogical content knowledge”. This structure was created as a result of a five-year research program focused on teacher professional development and faculty development, and was carried out by using design based experimental research method (Koehler & Mishra, 2005; Mishra & Koehler, 2006). * Corresponding author. Tel.: þ90 222 3350580; fax: þ90 222 335 0579. E-mail addresses: [email protected], [email protected] (I. Kabakci Yurdakul). 1 Center for Technology in Learning and Teaching, College of Human Science, Lagomarcino Hall, Iowa State University, Ames, IA 50011, USA. Tel.: þ1 515 294 6840. Contents lists available at SciVerse ScienceDirect Computers & Education journal homepage: www.elsevier.com/locate/compedu 0360-1315/$ – see front matter Crown Copyright Ó 2011 Published by Elsevier Ltd. All rights reserved. doi:10.1016/j.compedu.2011.10.012 Computers & Education 58 (2012) 964–977
-
Upload
independent -
Category
Documents
-
view
1 -
download
0
Transcript of The development, validity and reliability of TPACK-deep: A technological pedagogical content...

Computers & Education 58 (2012) 964–977
Contents lists available at SciVerse ScienceDirect
Computers & Education
journal homepage: www.elsevier .com/locate/compedu
The development, validity and reliability of TPACK-deep: A technologicalpedagogical content knowledge scale
Isil Kabakci Yurdakul a,*,1, Hatice Ferhan Odabasi a, Kerem Kilicer a, Ahmet Naci Coklar b,Gurkay Birinci a, Adile Askim Kurt a
aAnadolu University, Department of Computer Education and Instructional Technologies, Yunusemre Campus, Eskisehir, Turkeyb Selcuk University, Department of Computer Education and Instructional Technologies, Konya, Turkey
a r t i c l e i n f o
Article history:Received 11 April 2011Received in revised form18 October 2011Accepted 21 October 2011
Keyword:Pedagogical issues
* Corresponding author. Tel.: þ90 222 3350580; faE-mail addresses: [email protected], isilk@iasta
1 Center for Technology in Learning and Teaching,
0360-1315/$ – see front matter Crown Copyright � 2doi:10.1016/j.compedu.2011.10.012
a b s t r a c t
The purpose of this study is to develop a TPACK (technological pedagogical content knowledge) scalebased on the centered component of TPACK framework in order to measure preservice teachers’ TPACK. Asystematic and step-by-step approach was followed for the development of the scale. The validity andreliability studies of the scale were carried out with 995 Turkish preservice teachers. The sample wassplit into two subsamples on random basis (n1 ¼ 498, n2 ¼ 497). The first sample was used forExploratory Factor Analysis (EFA) and the second sample for Confirmatory Factor Analysis (CFA). After theEFA, the TPACK-deep scale included 33 items and had four factors. These factors were design, exertion,ethics and proficiency. The Cronbach’s alpha coefficient for the whole scale was found to be .95, whereasthe values of Cronbach’s alpha coefficient for individual factors of the scale ranged between .85 and .92.The CFA was conducted within the scope of the validity study of the scale. In this way, this structure ofthe 4-factor scale was confirmed. In addition, the test-retest reliability coefficient of the scale wascalculated as .80. The findings revealed that the TPACK-deep scale was a valid and reliable instrument formeasuring TPACK. Consequently, various suggestions were put forward regarding the use the TPACK-deep scale for applied research and for future studies.
Crown Copyright � 2011 Published by Elsevier Ltd. All rights reserved.
1. Introduction
The lack of teacher knowledge, skills, abilities, or competencies related to use of technology in teaching process have been identified asthe major barriers to technology integration (Belland, 2009; Bingimlas, 2009; Brinkerhoff, 2006; Chen, Looi, & Chen, 2009; Ertmer, 1999;Lim, 2007; Lim & Khine, 2006; Hew & Brush, 2007; Oncu, Delialioglu, & Brown, 2008; Ozdemir & Kilic, 2007; Shuldman, 2004; Yalin,Karadeniz, & Sahin, 2007; Zhao, 2007).The technology integration barriers include not only the lack of specific technology knowledgeand skills but also the lack of technology-supported pedagogical and technology-related-classroom management knowledge and skills(Hew & Brush, 2007). Therefore, the approaches related to technology integration in education have changed from techno centric inte-gration to techno-pedagogical integration. The techno centric integration approach focuses on technology and aims at helping teachers gainthe skills and knowledge necessary to use various technologies. On the other hand, the techno-pedagogical integration approach is based onpedagogy and puts pedagogy as well as technology into practice in the integration process. One of the techno-pedagogical integrationapproaches in the field of technology integration in education is the framework of Technological Pedagogical Content Knowledge (TPACK orTPCK). Technological Pedagogical Content Knowledge is referred to as TPACK today. However, it was used as TPCK in earlier publications inthe literature.
TPACK is a teacher knowledge framework developed by including technology knowledge into the teacher knowledge framework thatShulman (1986) basically determined as “pedagogical content knowledge”. This structure was created as a result of a five-year researchprogram focused on teacher professional development and faculty development, and was carried out by using design based experimentalresearch method (Koehler & Mishra, 2005; Mishra & Koehler, 2006).
x: þ90 222 335 0579.te.edu (I. Kabakci Yurdakul).College of Human Science, Lagomarcino Hall, Iowa State University, Ames, IA 50011, USA. Tel.: þ1 515 294 6840.
011 Published by Elsevier Ltd. All rights reserved.

Fig. 1. The TPACK framework and its components.
I. Kabakci Yurdakul et al. / Computers & Education 58 (2012) 964–977 965
Although TPACK is new as a term, it is a concept previously studied by different researchers as an idea. It could be stated that the studyconducted by Keating and Evans (2001) was one of the first studies in which the concept of TPCK was used. The term defined by Guerrero(2005) as Pedagogical Technology Knowledge (PTK) has a meaning similar to TPACK. Pedagogical Technology Knowledge (PTK) was definedas technology-related instructional knowledge and emphasized as a new domain of expertise in the organizational schemes of teacherknowledge. In addition, such concepts reported in related literature as ‘a Pedagogical Content Knowledge of Technology’ (Margerum-Leys &Marx, 2002), ‘techno-pedagogical skills in preservice teachers’ (Beaudin & Hadden, 2004), ‘Information And Communication Technology(ICT)-related Pedagogical Content Knowledge (PCK)’(Angeli & Valanides, 2005) and ‘Technology Pedagogical Content Knowledge’ (Niess,2005) demonstrate that TPCK is semantically not a new concept.
TPACK is a concept developed from Pedagogical Content Knowledge (PCK) put forward by Shulman (1987). Shulman (1987) stated thatthe concepts of Pedagogy, Content and Knowledge should be considered as independent of each other in the teacher education process andacquired interactively. TPACK is a philosophical approach that takes PCK as a basis in technology integration. Examining the concept of PCK,Koehler and Mishra (2009) stated that technology should be taken into consideration together with PCK and put forward the concept ofTechnological Pedagogical Content Knowledge (TPCK, TPACK). TPACK has been taken into consideration in the present study since itconstitutes the basis of a number of recent studies as a model of technology integration into education (Angeline &Valanides, 2009; Cox &Graham, 2009; Niess, 2005; Sahin, 2011; So & Kim, 2009).
Technological Pedagogical Content Knowledge (TPACK) is basically defined as a framework of teacher knowledge for technology inte-gration. Teacher knowledge is defined as a complex interaction and intersection among three bodies of knowledge within the framework ofTPACK: content, pedagogy and technology (Koehler &Mishra, 2008; Mishra & Koehler, 2006). Fig. 1 represents the TPACK framework and itscomponents (Koehler amp Mishra, 2008, p. 12; Koehler amp Mishra, 2009).
The three main components of teacher knowledge in the TPACK framework are Content Knowledge (CK), Pedagogical Knowledge (PK)and Technological Knowledge (TK) as seen in Fig. 1. The other components of the framework consist of the interactions between andamong these bodies of knowledge. These components are PCK (Pedagogical Content Knowledge), TCK (Technological Content Knowledge),TPK (Technological Pedagogical Knowledge), and TPACK (Technological Pedagogical Content Knowledge) (Koehler & Mishra, 2005; Koehler& Mishra, 2008, 2009; Mishra & Koehler, 2006). Among all these, TPACK component is the basis of the framework since it is found in theintersection of all the components. TPACK component is not simply adding the usage of technology to the existing teaching and contentdomain (Koehler & Mishra, 2005). Therefore, TPACK component has a broader and deeper meaning. With this feature, TPACK componentcan be defined as combined knowledge that a teacher should have regarding the use of pedagogical and technological knowledge togetherin teaching a certain content area for educational technology integration (Schmidt et al., 2009; Koehler & Mishra, 2005, 2008). Accordingto the elaborative model of TPACK framework, the TPACK component is defined as a transformation of PCK including subject-specificactivities and topic-specific activities. In other words, TPACK component refers to ‘a teacher’s knowledge of how to coordinate andcombine the use of subject-specific activities and topic-specific activities using emerging technologies to facilitate student learning’ (Cox &Graham, 2009). In the study conducted by So and Kim (2009), TPACK component is defined as ‘knowing how to represent subject matterwith technology in pedagogically sound ways’.
Generally, TPACK framework is one of the technology integration models that focus on effective technology integration in the teachingprocess with respect to teacher competencies. TPACK framework also focuses on technology integration not only with respect to theteachers’ knowledge about technology use but also with respect to the interaction and combination of teachers’ knowledge in the field oftechnology, pedagogy and content.
2. Literature review
Studies on TPACK in related literature mostly focused on preservice and inservice teachers depending on the idea that TPACK hassignificant implications for teacher education and teachers’ professional development (Koehler & Mishra, 2005). Based on the literaturereview, it is possible to examine these TPACK studies in three main categories: (i) Definition and measurement of TPACK, (ii) Effects ofprofessional development on TPACK, and (iii) Evolution of the TPACK model.

I. Kabakci Yurdakul et al. / Computers & Education 58 (2012) 964–977966
TPACK framework was initially defined by Koehler, Mishra, Yahya, and Yadav (2004). This qualitative study aimed at determining theparticipants’ TPACK development as a result of a design based activity. This study enabled researchers put forward the idea that developingTPACK is a multigenerational process, involving the development of deeper understandings of the complex web of relationships betweencontent, pedagogy and technology and the contexts inwhich they function (Koehler et al., 2004). This idea led to the development of the firstsurvey of its kind based on the TPACK framework as a result of another study conducted by Koehler andMishra (2005). One of the objectivesof that study was to evaluate to a faculty development design seminar in which faculty members worked together with master students todevelop online courses. It was found out that the participants’ knowledge of technology application as well as their TPACK developedsignificantly (Koehler & Mishra, 2005). One other study on the measurement of TPACK was carried out by Archambault and Crippen (2009).This study focused on examining teachers’ knowledge with respect to each one of the components described by the TPACK framework. Thegoal of one other survey study conducted by Schmidt et al. (2009) was to assess TPACK for preservice teachers. In that study, the researchersdeveloped a survey specifically for preservice teachers’ TPCAK in the field of early childhood and elementary education. Therefore, thecontent areas in the surveywere determined asmath, science, social studies and literacy for content knowledge (Schmidt et al., 2009). In oneof the recent studies for measuring TPACK, the TPACK self-efficacy instrument was developed (Burgoyne et al., 2010). A TPACK survey wasdeveloped to investigate the profiles of Singaporean preservice teachers in terms of their TPACK (Chai, Koh, & Tsai, 2010). Another study ondeveloping a TPACK survey was carried out by Sahin (2011). This survey included seven subscales based on the seven components of TPACKframework (TK, PK, CK, TPK, TCK, PCK and TPACK). That survey was developed by considering preservice teachers. The said study can beconsidered as one of recent studies in literature carried out to assess TPCAK for preservice teachers. In addition, Archambault and Barnett(2010) carried out a study to examine the nature and validity of TPACK framework. They concluded in their study that the TPACK frameworkis helpful from an organizational standpoint, however, it is difficult to separate out each one of the components potentially and similarly,measuring each of these components is complicated and convoluted.
There are a number of experimental studies carried out to examine the development of TPACK in parallel with the studies constitutingthe basis of TPACK definition and measurement. The common objective of those studies was to determine how professional developmentprograms influenced teachers’ development of TPACK. In those studies, it was generally found out that professional development programshad positive influence on teachers’ TPACK development (Doering, Veletsianos, Scharber, & Miller, 2009; Graham et al., 2009; Jang, 2010;Guzey & Roehrig, 2009; Jimoyiannis, 2010; Richardson, 2009; Shin et al., 2009). The most comprehensive study examining TPACK interms of teacher professional development was carried out by Wilson and Wright (2010). In their study, they demonstrated TPACKdevelopment of two social studies teachers’ for a period of time that covered preservice to inservice teaching.
Several studies exist in the literatures thatwere concentrated on the development of the TPACKmodel. In this respect, an enhanced TPACKmodelwas formed for teacher education by including assistive technology into the TPACK framework (Marino, Sameshima, & Beecher, 2009).Similarly, in another study, the ICT–TPCKmodel was developed (Angeli & Valanides, 2009). Their model was essentially based on the TPACKframework. Furthermore this advanced modeled pedagogy approach formed the ICT-TPCK of the intersection of content, learners, context,and ICTcomponents. One other study combined the pedagogical content knowledgewith theweb knowledge in order to form the frameworkof Technological Pedagogical Content Knowledge-Web (Lee & Tsai, 2010). An integrated model called Technological Pedagogical ScienceKnowledge (TPASK) based on the TPACK model and the authentic learning approach was developed for science teachers’ professionaldevelopment (Jimoyiannis, 2010).Majority of the studies on the development of the TPACKmodel generally involved either the integration ofCK (Content Knowledge) based on a certain content area or the integration of TK (Technology Knowledge) based on a certain technology.
A general review of literature related to TPACK reveals that, although there are studies carried out to measure each component of TPACK,the number of studies focused on determining the interactions between these components is limited (Archambault & Crippen, 2009). It wasnoticed in studies on the development of TPACK-related surveys that each one of the components of TPACK framework was examinedindividually. In addition, there are fewer studies conducted to measure the TPACK component that explains their interactions and combi-nation of each component within the TPACK model, which is there are no data collection tools such as surveys, questionnaires or scalesrelated to themeasurement of the TPACK component. It was also pointed out in literature that further studying is needed with the emphasisthat the TPACK framework should be perfectly clear and comprehensible (Archambault & Crippen, 2009; Cox & Graham, 2009). Conse-quently, the objective of this study is to develop a scale for the measurement of TPACK. In other words, this study focuses on developinga TPACK scale based on the TPACK components found within the TPACK framework in order to measure preservice teachers’ TPACK.
3. Research method
The objective of this study is to develop a scale for measuring TPACK as a whole entity by means of a systematic and step-by-stepapproach as follows:
3.1. Item pool phase
Technological Pedagogical Content Knowledge (TPACK) competencies and indicators were determined prior to the process of preparingthe items for the scale. These competencies and indicators are technology integration standards for teachers conducting the teaching andlearning process based on TPACK. The purpose in developing these standards is to define and determine a teacher’s knowledge, skills andattitudes of TPACK according to the views of the field experts. Another purpose is to create a scientific basis for use in the item pool phase ofthe TPACK scale development. In order to determine these competencies and indicators determined by educational technology experts, theresearchers followed a two-phase process. This process included both pre-workshop and workshop phase. The purpose of the workshopswas to benefit from the group’s ideas and experiences as well as obtain a range of opinions from experts who focused on different subjectareas in the field of educational technology.
In the pre-workshop phase, the researchers organized nine faculty members who were experts in the field of educational technology.The TPACK framework was explained at the beginning of the pre-workshop with a presentation. Next the participants in the pre-workshopphase wrote and discussed some indicators and components of the TPACK framework. As a result of this workshop, 72 indicators related tothe components of TPACK framework were determined. The pre-workshop was conducted as a pilot study for the workshop phase.

I. Kabakci Yurdakul et al. / Computers & Education 58 (2012) 964–977 967
The workshop was held within the scope of an International Instructional Technologies Symposium in 2009 in Turkey. Twenty-fourfaculty members from nine different higher educational institutions in Turkey were invited to participate in this workshop. A presenta-tion of the TPACK framework was given to the participants at the beginning of the workshop. In the workshop, participants were given anopportunity to discuss and list TPACK indicators. At the end of this workshop, a total of 146 indicators were determined.
Data collected during the pre-workshop and workshop included video records, audio records and documents. The inductive contentanalysis approach was taken as a basis for the analysis of the indicators. The themes obtained as a result of the data analysis were called asthe competency area and the sub-themes as competency. The resulting indicators were placed under the related competencies in thecompetency area. Taking these indicators as a basis, a booklet of “Technological Pedagogical Content Knowledge (TPACK) Competenciesand Indicators” was prepared. In the booklet, a total of 20 competencies and 120 indicators were listed within six competency areas(designing instruction, implementing instruction, innovativeness, ethical awareness, problem solving and field specialization) (Kabakci-Yurdakul et al., 2011). All competency areas and examples from competencies and indicators are presented in Table 1 below:
The booklet mentioned previously was used as a basis to create the item pool for the TPACK scale. Since the TPACK Competencies andIndicators were developed based on the views and experiences of faculty members specialized in the field of educational technology whowere teaching in higher education teacher training institutions, the item pool to develop the scale was created by using all of the TPACKCompetencies and Indicators. A total of 40 items were written down in the item pool. Following this step, the statements were simplifiedand combinedwith the items which overlappedwith each other. As a result of this preliminary step, the number of items from the item poolwas reduced to 38. Lastly the scale form was prepared by using items from the item pool.
In order to determine the face and content validity of the scale form prepared, the educational technology experts were asked for theirviews prior to the implementation process. For this purpose, the TPACK scale formwas presented to a total of 10 experts (one professor, twoassistant professors, one teaching assistant and six research assistants) their views were requested. Based on the feedback received fromthose experts, three items were removed from the scale due to their similarities in their contents, whereas a new itemwas included in thescale as recommended by the experts. Consequently, the number of items in the pool was modified as 36.
Table 1All TPACK competency areas, competencies and some examples from indicators.
Competency Areas Competencies Indicators
Designing Instruction Analyzing of the current situation prior to theteaching process
Conducting needs analysis regarding the technologiesto be used in the teaching process
Determining of appropriate methods, techniquesand technologies to be used in the teaching process
Choosing the most appropriate technology to preparean educational environment to present up-to-date information
Developing of the materials, environments,activities and the measurement tools to beused in the teaching process
Developing interactive teaching materials appropriateto different learning theories
Organizing the environments and materialsto be used in teaching
Updating the design and content of a digital educationalmaterial with respect to the learning levels of students
Planning the teaching conditions Using search strategies to access online sources in theplanning of the content to be taught
Implementing Instruction Conducting teaching Using technology to motivate students in theteaching-learning process
Measuring and evaluating the effectivenessof the teaching process
Executing a technology-based evaluation processin evaluating students’ success
Innovativeness Following up-to-date information aboutthe content
Using technology in the process of updating theknowledge and skills regarding the content area
Following up-to-date information abouttechnology
Updating the knowledge about technology usedin the process of teaching the content area
Following up-to-date information aboutthe teaching process
Using technology in updating the knowledge andskills regarding the process of measurement and evaluation
Integrating innovations in real life intothe teaching process
Benefiting from new online environments to supportthe teaching-learning process (facebook, blogs, wiki,twitter, podcasting, etc.)
Ethical Awareness Paying attention to the access right intechnology use
Behaving ethically regarding students’ accessto technological sources (software, e-book,video, etc.) in the teaching-learning process
Paying attention to issues of technology-basedintellectual property
Paying attention to copy-right issues regardingdigital sources used while designing instructional materials
Paying attention to the correctnessof technology-based information
Guiding students toward reliable Internet sourcesin the teaching-learning process
Paying attention to the issuesof the safety and privacy oftechnology-based information
Obeying ethical norms in obtaining special informationvia technology while preparing an teaching activity
Paying attention to the ethicsof the teaching profession
Behaving ethically during the technology-based evaluationprocess for the evaluation of students’ achievement
Problem Solving Solving technology-related problems Solving the basic problems with technological tools usedin the teaching process
Solving the problems regardingthe teaching process
Using technology for solving the problems that are likelyto occur in the teaching-learning process
Solving the problems regardingthe content information
Using technology for producing solutions to the problemsexperienced while structuring the content
Field Specialization Becoming a leader in the subject field Guiding colleagues regarding the use of technology to solvethe problems experienced in the process of presenting the content

I. Kabakci Yurdakul et al. / Computers & Education 58 (2012) 964–977968
The scale form prepared before the application included a total of 36 items in six dimensions to measure the preservice teachers’ TPACK.Therewere 10 items in the dimension of designing the instruction, 10 items in the dimension of implementing the instruction, four items in thedimension of innovativeness, six items in the dimension of ethical awareness, four items of in the dimension of problem solving and two itemsin the dimension of specialization in the field. For each item, five-point Likert type scale (“I can easily do it”, “I can do it”, “I can partly do it”, “Ican’t do it” and “I certainly can’t do it”) was used.
3.2. Validity-reliability phase
The scale formwas first appliedwithin the study group in order to implement the validity and the reliability of the study. The participantsconsisted of 995 preservice teachers attending the colleges of education the higher education institutions in Turkey for the academic year of2009–2010. The preservice teachers constituting the study group attended the following departments: Second Language (20.4%), ComputerEducation and Instructional Technologies (11.9%), Biology Education (6.7%), Geography Education (2.8%), Science Education (%2.5),Elementary School Mathematics (8.9%), Hearing Impaired Education (2.6%), Chemistry Education (6.0%), Mathematics Education (3.2%),Preschool Education (4.6%), Arts and Crafts Education (5.6%), Elementary Education (15.4%), Social Sciences Education (3.1%), HistoryEducation (2.2%) and Special Education (3.6%). Three of the participants did not respond to the question regarding the department theyattended. The preservice teachers constituting the study group consisted of 69.1%females, and 30.5% males. Of all the participants, fourpreservice teachers did not respond to the gender-related question. The data obtained from 995 teacher candidates were divided into twogroups for CFA as n1 ¼ 498 and for EFA as n2 ¼ 497.
After applying the scale form, the researchers investigatedwhether the scores obtained via the scale had a normal distribution or not. Forthis, the Kolmogrov Smirnow test was applied to both sample groups (n1 and n2) separately. Both the Kolmogorov Smirnov test results forthe sample group of EFA (n1 ¼ 498) [D(498) ¼ .896, p > .05] and those for the sample group of CFA (n2 ¼ 498) [D(497) ¼ .798, p > .05]demonstrated that the samples had normal distributions (Miles & Shevlin, 2001; Pallant, 2007).
3.2.1. Validity phaseA construct validity and item validity was carried out for the TPACK scale form. The exploratory and confirmatory factor analysis for the
construct validity studyhelped examine the structure of the TPACK scale form; in addition, itwas determinedhowwell the itemsdiscriminatebetween individuals with high competency and individuals with low competency in terms of TPACK with the help of item validity.
3.2.1.1. Construct validity. In order to examine the structure of the TPACK scale form, exploratory and confirmatory factor analysis wasconducted. Considering the relationships between variables, the purpose for running factor analysis is to find a small number of new andconceptually-meaningful variables (factors) by gathering a certain number of interrelated variables (Field, 2005). This way, it would bepossible to explain how the structure obtained was formed depending on the results obtained via the measurement tool created tomeasurean unknown structure.
The principal components analysis was applied as an exploratory factor analysis factor extraction technique. In order to reset thecorrelations between factors and to help interpret the factors, Varimax vertical axis rotationwas used. The number of factors, the lower limitof the item eigenvalue was taken as 1.00 to determine the number of factors. Moreover, the factor load lower limit of each itemwas taken as.40 (DeVellis, 2003; Field, 2005; Netemeyer, Bearden, & Sharma, 2003), and the lower limit of the differences of each itemwithin the factorswas taken as .10 (Coombs & Schroeder, 1988; R. B. Kline, 2005; Tabachnick & Fidell, 1996).
It was attempted to find out whether the data matrix obtained from the sample is appropriate for factor analysis and for factor extractionfor exploratory factor analysis. The size of the sample, the Kaiser-Meyer-Olkin (KMO) value and Bartlett’s Test of Sphericity (BTS) were takeninto account for that purpose. In literature, it is reported that factor analysis required at least 300 people (Field, 2005; Tabachnick & Fidell,1996). Based on this assertion, the TPACK scale form was applied to participating 498 preservice teachers. Following the application, theKMO sample competency was measured in order to test the validity of the size of the sample statistically. The KMO value, which can havea value between 0 and 1,is interpreted as normal if it is between .5 and .7, as good if it is between .7 and .8, as very good if it is between .8 and.9 and as excellent if it is higher than .9 (Field, 2005). As a result of that process, the KMO value was calculated as .964. Since the calculatedKMO value was higher than .9, it was considered that the size of the sample was highly acceptable. In addition, the sample size and thecorrelation matrix is said to be good and to be appropriate for factor analysis if the result of Bartlett’s Test of Sphericity is significant (Field,2005; Tabachnick & Fidell, 1996). In the present study, when the results of Bartlett’s Test of Sphericity test were examined (chi-square ¼ 10,889.070; df ¼ 630; p < .05), it is seen that the data are appropriate for the factor analysis.
The 15th, 16th and 31st items were removed from the scale during the factor analysis applied in accordance with the 36-item scale formsince those items failed to meet the requirement for the value of .40 – which was determined as the lower limit of the factor load values –and for the value of .10 –which was determined as the lower limit of the differences of each item between the factor load values. As a result,it was found out that the revised scale form including 33 items had a four-factor structure, that the total variance explainedwas 59.082%, andthat the factor load values ranged between .491 and .738.
The cumulative variance, the total variances explained, and the eigenvalues for each of the four factors determined as a result of factoranalysis is presented in Table 2 below:
Based on the results presented in Table 2, it could be stated that the eigenvalue of the first factorwith the highest variance is 6.152 and thetotal variance explained is 18.642%; that the eigenvalue of the second factor is 5.782 and the total variance explained is 17.521%; that theeigenvalue of the third factor is 4.539 and the total variance explained is 13.753%; and that the eigenvalue of the fourth factor is 3.025 andthe total variance explained is 9.166%.
The value of variance between 40% and 60% is claimed to be sufficient for social science studies (Dunteman, 1989; Gorsuch, 1983;Netemeyer et al., 2003). Therefore, the total variance explained found over 50% in this study could be said to be within the acceptablelimits. In addition, it is stated that for any factor to be meaningful, at least 5% of the total variance explained should be attributable to thatfactor (Hair, Anderson, Tatham, & Black,1998; Netemeyer et al., 2003). As a result of the factor analysis, it was seen that the TPACK scale formhas a four-factor structure. These factors are named in accordance with the literature as follows: design, exertion, ethics and proficiency.

Table 2Total variance explained after rotation.
Factor Eigenvalues Percentage of Variance (%) Cumulative Variance (%)
1 6.152 18.642 18.6422 5.782 17.521 36.1633 4.539 13.753 49.9164 3.025 9.166 59.082
I. Kabakci Yurdakul et al. / Computers & Education 58 (2012) 964–977 969
The design factor is one of the most important factors of the scale. This factor refers to preservice teachers’ competencies in designingteaching to enrich the teaching process with the help of their technological and pedagogical knowledge about the content to be taughtbefore the teaching process of the content. Table 3 shows the calculated item load values for the TPACK scale form, where 10 items werefound to be in the design factor (i.e. item numbers: 1–10). All of the items found in this factor addressed each of the phases of the teachingdesign process. These phases include analysis of the current situation prior to the teaching process, the selection of the methods, techniquesand technologies, preparation of the activities, materials and measurement tools to be used in the teaching process and teaching plan. Theexamples of some items related to design factor are as follows:
Item 4: To plan the teaching and learning process according to available technological resourcesItem 10: To organize the educational environment in an appropriate way to use technology.Item 7: To develop appropriate assessment tools by using technology
The second most important factor of the scale is exertion. This factor refers to preservice teachers’ competencies in using technology forthe execution of the teaching process and for the measurement and evaluation of the effectiveness of the process. Table 3 lists a total of 12items included in this factor (item numbers: 11–14, and 17–24). The items are found in this factor addressed the active learning process byutilizing the phases of rich teaching environment. These phases include active learning, and the measurement and evaluation of theeffectiveness of the teaching process. The examples of some items related exertion factor are as follows: Item 11: To implement effectiveclassroom management in the teaching and learning process in which technology is used
Item 20: To guide students in the process of designing technology-based products (presentations, games, films, and etc.)Item 21: To use innovative technologies (Facebook, blogs, twitter, podcasting, etc.) to support the teaching and learning process
Table 3Means of the items, standard deviations, item total correlations, common factor load, and rotated factor load.
Factors and Item Numbers X sd Item Total Correlation Common Factor Load Rotated Factor Load
Factor 1 Design (a ¼ .92)2 4.05 .776 .597 .654 .7754 3.98 .803 .685 .678 .7693 4.06 .801 .675 .660 .7521 3.99 .873 .597 .631 .7229 3.98 .829 .621 .670 .71510 3.88 .838 .620 .691 .6878 3.90 .770 .547 .649 .6555 3.71 .800 .517 .610 .6537 3.78 .825 .523 .657 .6206 3.54 .906 .523 .634 .564Factor 2 Exertion (a ¼ .91)13 3.84 .786 .552 .623 .67911 4.01 .688 .491 .603 .64017 4.04 .892 .554 .697 .61414 4.16 .788 .509 .645 .61322 3.99 .797 .603 .731 .61221 4.10 .907 .569 .682 .59924 3.95 .803 .590 .738 .59423 3.93 .813 .582 .725 .58918 3.92 .801 .556 .720 .57112 3.84 .735 .495 .614 .56419 3.99 .867 .608 .714 .51120 4.11 .837 .568 .710 .494Factor 3 Ethics (a ¼ .86)30 4.05 .797 .661 .626 .75028 3.92 .949 .615 .569 .73227 3.76 .945 .554 .510 .70226 4.09 .905 .602 .610 .70025 3.90 .872 .590 .624 .65929 3.99 .842 .606 .723 .576Factor 4. Proficiency (a ¼ .85)32 3.40 .978 .738 .525 .82333 3.52 .895 .677 .618 .72334 3.68 .872 .648 .703 .59936 3.76 .906 .563 .687 .50435 3.71 .897 .583 .691 .486

I. Kabakci Yurdakul et al. / Computers & Education 58 (2012) 964–977970
Another important factor of the scale is ethics. This factor referred not only to preservice teachers’ competencies in ethics regardingteaching profession but also to such technology-related ethical issues as privacy, accuracy, property and accessibility. As can be seen in Table3 shows that there are six items in this factor (item numbers: 25–30). The items in this factor addressed the execution of the teachingprocess as appropriate to ethical issues considering the teaching profession ethics in environments in which technology is used. Thesephases include compliance with right of access to technology, technology-based intellectual property issues, reliability and validity oftechnology-based information, privacy and safety of technology-based information, and with the ethics of teaching profession. Theexamples of some items related to ethics factor are as follows:
Item 28: To follow the teaching profession’s codes of ethics in online educational environments (WebCT, Moodle, etc.).Item 29: To provide guidance to students by leading them to valid and reliable digital sources.
The last factor of the scale was proficiency. This factor refers to preservice teachers’ leadership ability to integrate technology into contentand pedagogy by becoming experts in the teaching profession, to put forward suggestions for solving problems related to the subject area,the teaching process and technology, and to choose themost appropriate one among these suggested solutions. Table 3 shows that there arefive items in this factor (item numbers: 32–36). The items found in this factor included not only solving the problems related to the contentinformation, the teaching process and technology but also taking the leading role to guide others. The examples of some items related to thefactor of proficiency are as follows:
Item 32: To troubleshoot problems that could be encountered with online educational environments (WebCT, Moodle, etc.)Item 36: To cooperate with other disciplines regarding the use of technology to solve problems encountered in the process of presentingcontent.
Confirmatory factor analysis was conducted to confirm the factor structure of the scale. Among the data set divided into two for CFA thedata obtained from the second group teacher candidates (n2 ¼ 497) were used. In scale development studies, more than one latent variableconsidered to be structured by the scale items are assumed to be another latent variable, and the appropriateness of this assumption istested (T. J. B Kline, 2005). In the study, Confirmatory Factor Analysis (CFA) was conducted with the LISREL 8.8 (Linear Structural RelationStatistics Package Program) program in line with the structural equality model in order to determine whether variable groups contributingto the factor in the 4-dimension TPACK Scale as a result of the exploratory factor analysis were efficiently represented by these factors or not.Table 4 presents the fit values of the suggested model and the acceptable limit values of the most frequently used fit indexes (T. J. B Kline,2005; Schermelleh-Engel &Moosbrugger, 2003).
Table 4 demonstrates the results of the confirmatory factor analysis. As a result of the confirmative factor analysis, the Root Mean SquareError of Approximation (RMSEA) was found as .078; the Standardized Root Mean Square Residual (SRMR) as .048; the Goodness of Fit Index(GFI) as .94; the Adjusted Goodness of Fit Index (AGFI) as .89; the Normed Fit Index (NFI) as .91; the Non-Normed Fit Index (NNFI) as .94 andthe Comparative Fit Index (CFI) was found as .95. In addition, the value of c2/df, an important indicator in structural equation modeling, wasexamined and calculated as c2/df ¼ 1947.90/486 ¼ 3.981.
The RMSEAvalues lower than .05 demonstrated that the model fitness was perfect, and the value of .08 showed that it was an acceptablelimit (Browne & Cudeck, 1993; Schermelleh-Engel & Moosbrugger, 2003). As a result of the CFA, the RMSEA value was found as .078. Thisvalue is in the reference range of goodness of fit values of the model appropriateness. Also, the Standardized Root Mean Square Residual(SRMR) was found as .048; the Comparative Fit Index (CFI) as .95; and the Non-Normed Fit Index (NNFI) was found as .94. The results of theanalysis had perfect or acceptable fitness values. Although the values of Goodness of Fit Index (GFI) of .94 and the Adjusted Goodness of FitIndex (AGFI) of .89 were not perfect fitness values, it could be stated that theywere between acceptable limits. All these values show that themodel was appropriate and was confired.
3.2.1.2. Item validity. It was aimed to determine how well the items discriminate between individuals with high competency and indi-viduals with low competency in terms of TPACK within the scope of the item validity of the TPACK scale form. In order to accomplish thisgoal, item discrimination statistics were calculated based on the differences between the lowest group means of 27% and the highest groupmeans of 27% of the participants (n1 ¼ 498) determined according to the scores of each item and to the total scores of the scale. Therefore,first, the total scores for each individual were calculated by using the scale. This was followed by the calculation of total scores that werethen ranked from the highest to the lowest. Of all the participants constituting the study group (n1 ¼ 498), 27% (134) of themwho had thehighest scores were determined as the higher group, and 27% of all the participants who had the lowest scoreswere determined as the lowergroup. Independent samples t-test was applied for the purpose of statistically testing the difference between the mean scores of the twogroups. The results obtained are presented in Table 5 below:
Table 4The fit values of the suggested model and the standard fit criteria.
Fit Values Good Fit Values Acceptable Fit Values TPACK-deepScale Fit Values
c2/df .00 < c2/df < 3 3.01 < c2/df < 5.00 3.981RMSEA .00 < RMSEA < .05 .05 < RMSEA < .10 .078SRMR .00 < SRMR < .05 .05 < SRMR < .10 .048GFI .95 < GFI < 1.00 .90 < GFI < .95 .94AGFI .90 < AGFI < 1.00 .85 < AGFI < .90 .89NFI .95 < NFI < 1.00 .90 < NFI < .95 .91NNFI .95 < NNFI < 1.00 .90 < NNFI < .95 .94CFI .95 < CFI < 1.00 .90 < CFI < .95 .95

Table 5t-test results regarding the item means of the high-low-27-percent group.
Item number N X sd df t p
Item 1 Lower Group 134 3.31 .87 266 15.31 .001Higher Group 134 4.66 .52
Item 2 Lower Group 134 3.49 .65 266 15.79 .001Higher Group 134 4.66 .56
Item 3 Lower Group 134 3.41 .76 266 15.86 .001Higher Group 134 4.69 .52
Item 4 Lower Group 134 3.32 .68 266 18.22 .001Higher Group 134 4.69 .52
Item 5 Lower Group 134 3.14 .71 266 14.73 .001Higher Group 134 4.34 .61
Item 6 Lower Group 134 2.91 .78 266 15.68 .001Higher Group 134 4.32 .68
Item 7 Lower Group 134 3.11 .75 266 14.87 .001Higher Group 134 4.41 .67
Item 8 Lower Group 134 3.33 .71 266 14.73 .001Higher Group 134 4.52 .61
Item 9 Lower Group 134 3.34 .77 266 15.94 .001Higher Group 134 4.67 .57
Item 10 Lower Group 134 3.16 .76 266 16.22 .001Higher Group 134 4.54 .60
Item 11 Lower Group 134 3.48 .69 266 13.25 .001Higher Group 134 4.49 .54
Item 12 Lower Group 134 3.28 .70 266 13.21 .001Higher Group 134 4.34 .60
Item 13 Lower Group 134 3.22 .76 266 13.54 .001Higher Group 134 4.40 .64
Item 14 Lower Group 134 3.49 .80 266 15.35 .001Higher Group 134 4.74 .48
Item 15 Lower Group 134 3.18 .78 266 19.20 .001Higher Group 134 4.74 .51
Item 16 Lower Group 134 3.17 .69 266 18.14 .001Higher Group 134 4.58 .56
Item 17 Lower Group 134 3.17 .77 266 18.15 .001Higher Group 134 4.66 .55
Item 18 Lower Group 134 3.39 .83 266 17.36 .001Higher Group 134 4.82 .45
Item 19 Lower Group 134 3.25 .89 266 17.15 .001Higher Group 134 4.75 .47
Item 20 Lower Group 134 3.24 .70 266 19.39 .001Higher Group 134 4.66 .47
Item 21 Lower Group 134 3.20 .73 266 19.07 .001Higher Group 134 4.66 .49
Item 22 Lower Group 134 3.24 .68 266 19.60 .001Higher Group 134 4.69 .51
Item 23 Lower Group 134 3.17 .72 266 15.28 .001Higher Group 134 4.50 .70
Item 24 Lower Group 134 3.40 .91 266 13.58 .001Higher Group 134 4.69 .60
Item 25 Lower Group 134 3.07 .81 266 11.17 .001Higher Group 134 4.28 .93
Item 26 Lower Group 134 3.19 .94 266 14.00 .001Higher Group 134 4.55 .62
Item 27 Lower Group 134 3.22 .75 266 19.31 .001Higher Group 134 4.71 .48
Item 28 Lower Group 134 3.39 .74 266 15.36 .001Higher Group 134 4.64 .58
Item 29 Lower Group 134 2.78 .87 266 12.69 .001Higher Group 134 4.10 .83
Item 30 Lower Group 134 2.86 .73 266 15.93 .001Higher Group 134 4.28 .71
Item 31 Lower Group 134 2.99 .64 266 18.78 .001Higher Group 134 4.47 .64
Item 32 Lower Group 134 2.94 .74 266 18.33 .001Higher Group 134 4.46 .60
Item 33 Lower Group 134 2.98 .82 266 17.52 .001Higher Group 134 4.50 .57
Total Lower Group 134 105.80 10.82 266 38.49 .001Higher Group 134 150.16 7.81
I. Kabakci Yurdakul et al. / Computers & Education 58 (2012) 964–977 971

I. Kabakci Yurdakul et al. / Computers & Education 58 (2012) 964–977972
Table 5 summarizes that there is significant difference between the lower and higher groups in terms of the total scores and the scores foreach item calculated by using the scale. In other words, each item in the scale significantly discriminated the individuals belonging to thelower and higher groups.
3.2.2. Reliability studyCronbach’s alpha coefficient was calculated to test the consistency of the items of the scale within the scope of the reliability study of the
TPACK scale form, and test-retest reliability coefficient was found to determine the consistency of a measure from one time to another.
3.2.2.1. Internal consistency. The internal consistency values (Cronbach’s alpha coefficient) regarding the 33 items constituting the TPACKscale formwas calculated as a¼ .95. When the internal consistencies were examinedwith respect to the factors constituting the scale, it wasfound out that the Cronbach’s alpha coefficient related to the 10 items constituting the design factor was calculated as a ¼ .92; that theCronbach’s alpha coefficient related to the 12 items constituting the exertion factor was calculated as a ¼ .91; that the Cronbach’s alphacoefficient related to the six items constituting the ethics factorwas calculated as a¼ .86; and that the Cronbach’s alpha coefficient related tothe five items constituting the proficiency factorwas calculated as a¼ .85. Cronbach’s alpha coefficient values higher than .70 are consideredas good, and when the value is close to 1.00, it is considered very good (Fraenkel & Wallen, 2003; Gay, Mills & Airasian, 2000). Thus, theinternal consistency values calculated can be interpreted as very good.
3.2.2.2. Test-retest reliability. The test-retest reliability coefficient was calculated in order to determine the consistency of the measurementof performance. For this purpose, the scale formwas applied to teacher candidates from a different higher education institution which wasnot involved in the validity study. The scale form was applied to these preservice teachers twice in three weeks. The relationship betweenthe two applications was calculated by using the Pearson’s Product Moment Correlation Coefficient. This analysis revealed a highly positiverelationship between the two applications [r(26) ¼ .80; p < .05].In other words, the scale proved consistently measure the performanceindependent of the time frame the tests took place.
3.3. Scoring phase
There were no items in the scale that required reverse coding, because all items of the scale were positive. The distribution of the scaleitems under four factors is as follows:
� Design: Items 1–10.� Exertion: Items 11–14, and 17–24.� Ethics: Items 25–30.� Proficiency: Items 32–36.
The mean for the study group (n1 ¼ 458) was calculated as 128.53, and the standard deviationwas found to be 18.17. The lowest score tobe calculated with the help of the scale developed was 33 and the highest was 165. Therefore, the difference between the highest score andthe lowest score calculated as 132. The level of TPACK increased as the score calculated by using the scale was closer to 165 and the level ofTPACK decreased as the scorewas closer to 33. Based on the scores obtained for the lower-higher groups of 27% subjective, it can be said thatthe scores calculated to be lower than 95 by using the scale were considered to have a low level of TPACK; those between 96 and 130 wereconsidered to have an average level of TPACK; and those higher than 131 were considered to have a high level of TPACK.
4. Discussion
TPACK framework, in terms of both theoretical and practical aspects, has a commonly accepted structure for effective technologyintegration. However, the need to understand, clarify and expand the TPACK framework has been emphasized in related literature(Archambault & Crippen, 2009; Cox & Graham, 2009; Jimoyiannis, 2010). Moreover, most of the studies related to the measurement ofTPACK are focused on separate TPACK components. It has been that TPACK components are at the heart of TPCK framework (Koehler &Mishra, 2008; Koehler, Mishra, & Yahya, 2007). The present study was designed and carried out depending on the lack of similarresearch in the related literature.
The objective of the present study is to develop a TPACK scale based on the centered component of TPACK framework in order tomeasurepreservice teachers’ TPACK. A systematic and step-by-step approach was followed for the development of the scale. In this respect, theTPACK-deep scale includes 33 items and has a four-factor structure. These factors are named in accordance with the literature as follows:design, exertion, ethics and proficiency.
The booklet, “Technological Pedagogical Content Knowledge (TPACK) Competencies and Indicators”, used to create the item pool for theTPACK scale, includes six competencies as follows: designing instruction, implementing instruction, innovativeness, ethical awareness, problemsolving andfield specialization.These competencies and indicatorsweredevelopedbasedon theviewsandexperiences of the facultymembersspecialized in the field of educational technologywhowere teaching in high education teacher training institutions (Kabakci-Yurdakul et al.,2011). The fact that the TPACK-deep scale was developed based on these competencies and indicators is a factor increasing the originalityvalue of the scale in related literature. In addition, these competencies and the factors of the TPACK-deep scale are similar. The design factor inthe TPACK-deep scale corresponds to designing instruction in TPACK competencies; the exertion factor to implementing instruction compe-tency; and the ethics factor to ethical awareness. Moreover, it is seen that in TPACK-deep scale, the innovativeness, problem solving and fieldspecialization competencies are combined in the proficiency factor. This similarity provides a confirmative feature to the scale developmentprocess. The framework and factors of the TPACK-deep scale based developed TPACK framework is figured out by Fig. 2.
As shown in Fig. 2, the TPACK-deep scale is based on the TPACK framework developed by Koehler and Mishra (2005). This scale is alsofocused on the TPACK component of the TPACK framework. The factors of the TPACK-deep scale determinedwith explanatory factor analysis
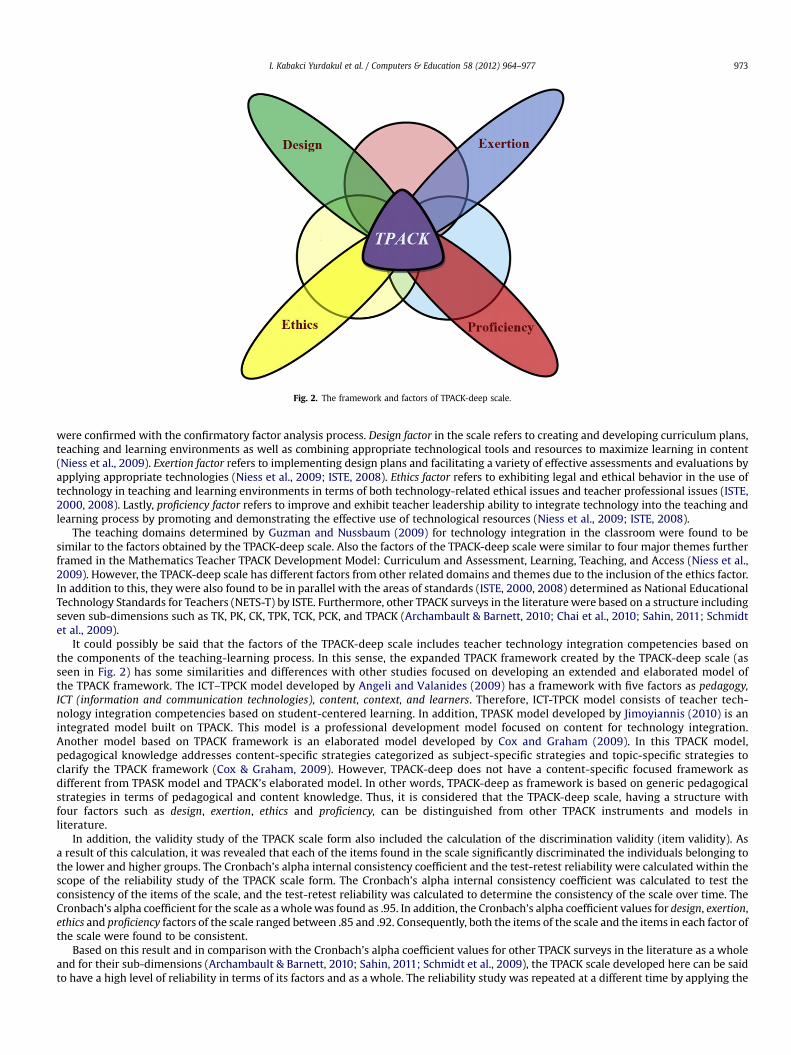
Fig. 2. The framework and factors of TPACK-deep scale.
I. Kabakci Yurdakul et al. / Computers & Education 58 (2012) 964–977 973
were confirmed with the confirmatory factor analysis process. Design factor in the scale refers to creating and developing curriculum plans,teaching and learning environments as well as combining appropriate technological tools and resources to maximize learning in content(Niess et al., 2009). Exertion factor refers to implementing design plans and facilitating a variety of effective assessments and evaluations byapplying appropriate technologies (Niess et al., 2009; ISTE, 2008). Ethics factor refers to exhibiting legal and ethical behavior in the use oftechnology in teaching and learning environments in terms of both technology-related ethical issues and teacher professional issues (ISTE,2000, 2008). Lastly, proficiency factor refers to improve and exhibit teacher leadership ability to integrate technology into the teaching andlearning process by promoting and demonstrating the effective use of technological resources (Niess et al., 2009; ISTE, 2008).
The teaching domains determined by Guzman and Nussbaum (2009) for technology integration in the classroom were found to besimilar to the factors obtained by the TPACK-deep scale. Also the factors of the TPACK-deep scale were similar to four major themes furtherframed in the Mathematics Teacher TPACK Development Model: Curriculum and Assessment, Learning, Teaching, and Access (Niess et al.,2009). However, the TPACK-deep scale has different factors from other related domains and themes due to the inclusion of the ethics factor.In addition to this, they were also found to be in parallel with the areas of standards (ISTE, 2000, 2008) determined as National EducationalTechnology Standards for Teachers (NETS-T) by ISTE. Furthermore, other TPACK surveys in the literaturewere based on a structure includingseven sub-dimensions such as TK, PK, CK, TPK, TCK, PCK, and TPACK (Archambault & Barnett, 2010; Chai et al., 2010; Sahin, 2011; Schmidtet al., 2009).
It could possibly be said that the factors of the TPACK-deep scale includes teacher technology integration competencies based onthe components of the teaching-learning process. In this sense, the expanded TPACK framework created by the TPACK-deep scale (asseen in Fig. 2) has some similarities and differences with other studies focused on developing an extended and elaborated model ofthe TPACK framework. The ICT–TPCK model developed by Angeli and Valanides (2009) has a framework with five factors as pedagogy,ICT (information and communication technologies), content, context, and learners. Therefore, ICT-TPCK model consists of teacher tech-nology integration competencies based on student-centered learning. In addition, TPASK model developed by Jimoyiannis (2010) is anintegrated model built on TPACK. This model is a professional development model focused on content for technology integration.Another model based on TPACK framework is an elaborated model developed by Cox and Graham (2009). In this TPACK model,pedagogical knowledge addresses content-specific strategies categorized as subject-specific strategies and topic-specific strategies toclarify the TPACK framework (Cox & Graham, 2009). However, TPACK-deep does not have a content-specific focused framework asdifferent from TPASK model and TPACK’s elaborated model. In other words, TPACK-deep as framework is based on generic pedagogicalstrategies in terms of pedagogical and content knowledge. Thus, it is considered that the TPACK-deep scale, having a structure withfour factors such as design, exertion, ethics and proficiency, can be distinguished from other TPACK instruments and models inliterature.
In addition, the validity study of the TPACK scale form also included the calculation of the discrimination validity (item validity). Asa result of this calculation, it was revealed that each of the items found in the scale significantly discriminated the individuals belonging tothe lower and higher groups. The Cronbach’s alpha internal consistency coefficient and the test-retest reliability were calculated within thescope of the reliability study of the TPACK scale form. The Cronbach’s alpha internal consistency coefficient was calculated to test theconsistency of the items of the scale, and the test-retest reliability was calculated to determine the consistency of the scale over time. TheCronbach’s alpha coefficient for the scale as awholewas found as .95. In addition, the Cronbach’s alpha coefficient values for design, exertion,ethics and proficiency factors of the scale ranged between .85 and .92. Consequently, both the items of the scale and the items in each factor ofthe scale were found to be consistent.
Based on this result and in comparison with the Cronbach’s alpha coefficient values for other TPACK surveys in the literature as a wholeand for their sub-dimensions (Archambault & Barnett, 2010; Sahin, 2011; Schmidt et al., 2009), the TPACK scale developed here can be saidto have a high level of reliability in terms of its factors and as a whole. The reliability study was repeated at a different time by applying the

I. Kabakci Yurdakul et al. / Computers & Education 58 (2012) 964–977974
scale to other preservice teachers in three weeks in order to determine the test-retest reliability. As a result of these applications, the test-retest reliability coefficient of the scale was calculated as .80. Thus, the scale was found to be consistent in measuring the performanceindependent of time.
The results obtained in the present study demonstrated that the developed TPACK-deep scale (Appendix 1) could be a powerfulinstrument for measuring the preservice teachers’ TPACK. This scale, with its higher level of validity and reliability, could be an instrumentthat would lead to the trusted measurement of TPACK.
4.1. Limitations
This study presents a step-by-step and systematic approach followed for the validity and reliability of the scale. Although, the TPACK-deepscale developed in this study is a large size and nationalwide scale, this study also includes somedrawbacks. Firstly, this studywas conductedwith a survey research model and gathered research data with a scale form. Although a survey methodology is appropriate to examinecharacteristics from a population, it is not as accurate as observing behavior and perception (Archambault & Barnett, 2010). In surveyresearches, the responds of participants are also limitedwith the survey tool. The process of scale development could be stronger to this scaledevelopment process to support with qualitative data gathering fromnot only educational technology experts, but also pre-service teachers.
Secondly, although sample size is rich, the participants in present study were also predominantly female. However, the result of 2002year and later researches in literature was pointed that there is no gender differences in preservice teachers with respect to computer oranother technology attitudes, ability, and use (Aust, Newberry, O’Brien, & Thomas, 2005; Kay, 2006; Teo, 2008, 2010; Shapka & Ferrari, 2003;Yuen & Ma, 2002). Also one of other recent studies in the literature is emphasized that the variable of gender and computer attitudes werenot found to be related to ICT use (Rahimi & Yadollahi, 2011). For all that in the survey study conducted with preservice teachers by Schmidtet al. (2009), 93.5% of the participants consisted of female. It was noticed in a part of the experimental studies carried out to examine thedevelopment of preservice teachers’ TPACK that There were slightly more female respondents (Chai et al., 2010; Lee & Tsai, 2010; So & Kim,2009). Therefore, it could be said that the gender-rate of participants would be not influence the results of this study.
Lastly, with the present study, it was developed a four-dimensional scale based on TPACK component of TPACK framework. The otherphase in a scale development process is to propose a model by using structural equational modeling (SEM) (Netemeyer et al., 2003).Although this study did not include of creating a model from the developed scale, this study represents an important step in beginning toreach TPACK-deep model.
5. Conclusion
The TPACK-deep scale developed in the present study is structurally quite different from other TPACK scales in literature. First, this scaledevelopment study is the first study carried out focusing on the TPCK component found in the intersection of three main components (TK,PK and CK) of the TPACK framework in the international literature. The fact that such factors as design, exertion, ethics and proficiencyregarding the TPACK component in this framework were determined is quite an important step for the development of the TPACKframework. However, the TPACK-scale developed by the present study is a transformative approach to TPACK framework, but it does notpresent an alternative approach. Furthermore, the development of the TPACK-deep scale was carried out based on the data gathered innation-wide teacher training higher education institutions. In this respect, it could be stated that this scale covers the national literature andhas a broad perspective.
TPACK should be one of the critical goals of teacher training for effective educational technology integration, developing both preserviceand inservice teachers (Mishra & Koehler, 2006). In this respect, TPACK-deep scale may allow questioning and developing teacher training interms of technology integration, thus allows determining the TPACK levels of preservice teachers during the teacher training process.Applied research could be conducted to help preservice teachers gain the necessary knowledge and skills regarding educational technologyintegration. Moreover, the use of the scale in this way as well as its application to different preservice teachers will contribute to thereliability of the scale. This scale could also be used for the evaluation of professional development studies on educational technologyintegration with respect to teacher TPACK knowledge.
In literature, there are various data collection tools regarding TPACK (Archambault & Crippen, 2009; Burgoyne et al., 2010; Chai et al.,2010; Niess et al., 2009; Sahin, 2011; Schmidt et al., 2009). The components of the TPACK framework are taken into consideration sepa-rately in these data collection tools. In other words, in these data collection tools, such components of the TPACK framework as ContentKnowledge (CK), Pedagogical Knowledge (PK), Technological Knowledge (TK), PCK (Pedagogical Content Knowledge), TCK (TechnologicalContent Knowledge), TPK (Technological Pedagogical Knowledge) and TPACK (Technological Pedagogical Content Knowledge) aremeasuredseparately. Considering the philosophy and structure of the TPACK framework, this situation is a limitation for measuring TPACK. In thisrespect, the TPACK-deep scale differs from other TPACK data collection tools and allows measuring and examining TPACK competenciescorrectly.
The present study has a quantitative research design that aims at developing a TPACK scale. As a follow-up of to this study, experimentalstudies could be conducted to determine the preservice teachers’ TPACK developments. Based on the items of the scale created in thepresent study, case studies based on qualitative research that aim at further investigation of preservice teachers’ TPACK can be developed. Inorder to examine preservice teachers’ TPACK developments in detail and in a longer period of time, various follow-up research studies maybe designed by using both qualitative and quantitative research methods. The findings obtained via such applications and studies willprovide a scientific insight for further development of the TPACK framework.
Acknowledgments
The present study was based on a part of a scientific research project funded by The Scientific and Technological Research Council ofTurkey (TUBITAK) – number 109K191 – called ‘Effect of The Techno-Pedagogical Education on Pre-service Teacher and a Framework forTechno-Pedagogical Education’.

I. Kabakci Yurdakul et al. / Computers & Education 58 (2012) 964–977 975
Appendix
TPACK-deep scale.

I. Kabakci Yurdakul et al. / Computers & Education 58 (2012) 964–977976
References
Angeli, C., & Valanides, N. (2005). Preservice elementary teachers as information and communication technology designer: an instructional systems design model based on anexpanded view of pedagogical content knowledge. Journal of Computer-Assisted Learning, 21(4), 292–302.
Angeli, C., & Valanides, N. (2009). Epistemological and methodological issues for the conceptualization, development, and assessment of ICT–TPCK: advances in technologicalpedagogical content knowledge (TPCK). Computers & Education, 52(1), 154–168.
Archambault, L. M., & Barnett, J. H. (2010). Revisiting technological pedagogical content knowledge: exploring the TPACK framework. Computers & Education, 55(4), 1656–1662.
Archambault, L., & Crippen, K. (2009). Examining TPACK among K-12 online distance educators in the United States. Contemporary Issues in Technology and Teacher Education,9(1), 71–88.
Aust, R., Newberry, B., O’Brien, J., & Thomas, J. (2005). Learning generation: fostering innovation with tomorrow’s teachers and technology. Journal of Technology and TeacherEducation, 13(2), 167–195.
Beaudin, L., & Hadden, C. (2004). Developing technopedagogical skills in preservice teachers. In J. Nall, & R. Robson (Eds.), Proceedings of world conference on e-learning incorporate, government, healthcare, and higher education 2004 (pp. 492–498). Norfolk, VA: Association for the Advancement of Computing in Education.
Belland, B. R. (2009). Using the theory of habitus to move beyond the study of barriers to technology integration. Computers & Education, 52(2), 353–364.Bingimlas, K. (2009). Barriers to the successful integration of ICT in teaching and learning environments: a review of the literature. Eurasia Journal of Mathematics, Science &
Technology Education, 5(3), 235–245.Brinkerhoff, J. (2006). Effects of a long-duration, professional development academy on technology skills, computer self-efficacy, and technology integration beliefs and
practices. Journal of Research on Technology in Education, 39(1), 22–43.Browne, M. W., & Cudeck, R. (1993). Alternative ways of assessing model fit. In K. A. Bollen, & J. S. Long (Eds.), Testing structural equation models (pp. 136–162). Newbury Park,
CA: Sage.Burgoyne, N., Graham, C. R., & Sudweeks, R. (2010). The validation of an instrument measuring TPACK. In D. Gibson, & B. Dodge (Eds.), Proceedings of society for information
technology & teacher education international conference 2010 (pp. 3787–3794). Chesapeake, VA: AACE.Chai, C. S., Koh, J. H. L., & Tsai, C. C. (2010). Facilitating preservice teachers’ development of technological, pedagogical, and content knowledge (TPACK). Educational Technology
& Society, 13(4), 63–73.Chen, F., Looi, C., & Chen, W. (2009). Integrating technology in the classroom: a visual conceptualization of teachers’ knowledge, goals and beliefs. Journal of Computer Assisted
Learning, 25(5), 470–488.Coombs, W., & Schroeder, H. (1988). An analysis of factor analytic data. Personality and Individual Differences, 9(1), 79–85.Cox, S., & Graham, C. R. (2009). Diagramming TPACK in practice: using an elaborated model of the TPACK framework to analyze and depict teacher knowledge. Tech Trends,
53(5), 60–69.DeVellis, R. (2003). Scale development: Theory and applications (2nd ed.). Thousand Oaks, CA: Sage.Doering, A., Veletsianos, G., Scharber, C., & Miller, C. (2009). Using the technological, pedagogical, and content knowledge framework to design online learning environments
and professional development. Journal of Educational Computing Research, 41(3), 319–346.Dunteman, G. H. (1989). Principal components analysis. Newbury Park, CA: Sage Publications.Ertmer, P. A. (1999). Addressing first- and second-order barriers to change: strategies for technology integration. Educational Technology Research and Development, 47(4), 47–
61.Field, A. (2005). Discovering statistics using SPSS (2nd ed.). London: Sage Publications Ltd.Fraenkel, J. R., & Wallen, N. E. (2003). How to design and evaluate research in education. New York: McGraw Hill.Gay, L. R., Mills, E., & Airasian, P. (2000). Educational research: Competencies for analysis and application. Upper Saddle River, N.J: Merrill.Gorsuch, R. L. (1983). Factor analysis. Hillsdale, NJ: Lawrence Erlbaum.Graham, C. R., Burgoyne, N., Cantrell, P., Smith, L., St. Clair, L., & Harris, R. (2009). TPACK development in science teaching: measuring the TPCK confidence of inservice science
teachers. Tech Trends, 53(5), 70–79.

I. Kabakci Yurdakul et al. / Computers & Education 58 (2012) 964–977 977
Guerrero, S. M. (2005). Teacher knowledge and a new domain of expertise: pedagogical technology knowledge. Journal of Educational Computing Research, 33(3), 249–267.Guzey, S. S., & Roehrig, G. H. (2009). Teaching science with technology: case studies of science teachers’ development of technology, pedagogy, and content knowledge.
Contemporary Issues in Technology and Teacher Education, 9(1), 25–45.Guzman, A., & Nussbaum, M. (2009). Teaching competencies for technology integration in the classroom. Journal of Computer Assisted Learning, 25, 453–469.Hair, J. F., Jr., Anderson, R. E., Tatham, R. L., & Black, W. C. (1998). Multivariate data analysis (5thed).. Upper Saddle River, NJ: Prentice Hall.Hew, K., & Brush, T. (2007). Integrating technology into K-12 teaching and learning: current knowledge gaps and recommendations for future research. Educational Technology
Research and Development, 55(3), 223–252.International Society for Technology in Education ([ISTE]. (2000). ISTE National Educational Technology Standards (NETS) and performance indicators for teachers, NETS for
teachers. Retrieved from. http://www.iste.org.International Society for Technology in Education ([ISTE]. (2008). The ISTE NETS and performance indicators for teachers (NETS-T), NETS for teachers. Retrieved. http://www.iste.
org.Jang, S. J. (2010). Integrating the interactive whiteboard and peer coaching to develop the TPACK of secondary science teachers. Computers & Education, 55(4), 1744–1751.Jimoyiannis, A. (2010). Designing and implementing an integrated technological pedagogical science knowledge framework for science teachers’ professional development.
Computers & Education, 55(3), 1259–1269.Kabakci-Yurdakul, I., Odabasi, H. F., Coklar, A. N., Kilicer, K., Kurt, A. A., & Birinci, G. (2011). The professional competencies and indicators of techno-pedagogical education for
teachers. International Educational Technology Conference (IETC 2012). May 25–27, Turkey: Istanbul [Oral Presentation].Kay, R. H. (2006). Evaluating strategies used to incorporate technology into pre-service education: a review of the literature. Journal of Research on Technology in Education,
38(4), 383–408.Keating, T., & Evans, E. (2001). Three computers in the back of the classroom: preservice teachers’ conceptions of technology integration. In J. Price, et al. (Eds.), Proceedings of
society for information technology & teacher education international conference 2001 (pp. 1671–1676). Chesapeake, VA: AACE.Kline, R. B. (2005). Principles and practice of structural equation modeling (2nd ed.).. New York.Kline, T. J. B. (2005). Psychological testing: A practical approach to design and evaluation. Thousand Oaks, London, New Delhi: Sage Publications.Koehler, M. J., & Mishra, P. (2005). What happens when teachers design educational technology? The development of technological pedagogical content knowledge. Journal of
Educational Computing Research, 32(2), 131–152.Koehler, M. J., & Mishra, P. (2008). Introducing technological pedagogical knowledge. In AACTE. (Ed.), The Handbook of technological pedagogical content knowledge for
educators. Routledge/Taylor & Francis Group for the American Association of Colleges for Teacher Education.Koehler, M. J., & Mishra, P. (2009). What Is technological pedagogical content knowledge? Contemporary Issues in Technology and Teacher Education, 9(1), 60–70.Koehler, M. J., Mishra, P., & Yahya, K. (2007). Tracing the development of teacher knowledge in a design seminar: integrating content, pedagogy, & technology. Computers and
Education, 49(3), 740–762.Koehler, M. J., Mishra, R., Yahya, K., & Yadav, A. (2004). Successful teaching with technology: the complex interplay of content, pedagogy, and technology. In Proceedings from
the Annual meeting of the Sociey for information technology & teacher education, Atlanta, GA. Charlottesville, VA: Association for the Advancement of Computing inEducation.
Lee, M. H., & Tsai, C. C. (2010). Exploring teachers’ perceived self-efficacy and technological pedagogical content knowledge with respect to educational use of the World WideWeb. Instructional Science, 38(1), 1–21.
Lim, C. P. (2007). Effective integration of ICT in Singapore schools: pedagogical and policy implications. Education Technology Research & Development, 55(1), 83–116.Lim, C. P., & Khine, M. (2006). Managing teachers’ barriers to ICT integration in Singapore schools. Journal of Technology and Teacher Education, 14(1), 97–125.Margerum-Leys, J., & Marx, R. (2002). Teacher knowledge of educational technology: a study of student teacher/mentor teacher pairs. Journal of Educational Computing
Research, 26(4), 427–462.Marino, M. T., Sameshima, P., & Beecher, C. C. (2009). Enhancing TPACK with assistive technology: promoting inclusive practices in preservice teacher education. Contem-
porary Issues in Technology and Teacher Education, 9(2), 186–207.Miles, J., & Shevlin, M. (2001). Applying regression & correlation: A guide for students and researchers. London: Thousand Oaks, Calif.: Sage Publications.Mishra, P., & Koehler, M. J. (2006). Technological pedagogical content knowledge: a framework for teacher knowledge. Teachers College Record, 108(6), 1017–1054.Netemeyer, R., Bearden, W., & Sharma, S. (2003). Scaling procedures. Thousand Oaks, CA: Sage Publications.Niess, M. L. (2005). Preparing teachers to teach science and mathematics with technology: developing a technology pedagogical content knowledge. Teaching and Teacher
Education, 21, 509–523.Niess, M. L., Ronau, R. N., Shafer, K. G., Driskell, S. O., Harper, S. R., Johnston, C., et al. (2009). Mathematics teacher TPACK standards and development model. Contemporary
Issues in Technology and Teacher Education, 9(1), 4–24.Oncu, S., Delialioglu, O., & Brown, C. A. (2008). Critical components for technology integration: how do instructors make decisions? Journal of Computers in Mathematics and
Science Teaching, 27(1), 19–46.Ozdemir, S., & Kilic, E. (2007). Integrating information and communication technologies in the Turkish primary school system. British Journal of Educational Technology, 38(5),
907–916.Pallant, J. (2007). SPSS survival manual: A step by step guide to data analysis using SPSS for windows (3rd ed.). Maidenhead, Berkshire: Open University Press.Rahimi, M., & Yadollahi, S. (2011). Computer anxiety and ICT integration in English classes among Iranian EFL teachers. Procedia Computer Science, 3, 203–209.Richardson, S. (2009). Mathematics teachers’ development, exploration, and advancement of technological pedagogical content knowledge in the teaching and learning of
algebra. Contemporary Issues in Technology and Teacher Education, 9(2), 117–130.Sahin, I. (2011). Development of survey of technological pedagogical and content knowledge (TPACK). TOJET-The Turkish Online Journal of Educational Technology, 10(1), 97–
105.Schermelleh-Engel, K., Moosbrugger, H., & Müller, H. (2003). Evaluating the fit of structural equation models: test of significance and descriptive goodness-of-fit measures.
Methods of Psychological Research - Online, 8(2), 23–74.Schmidt, D. A., Baran, E., Thompson, A. D., Koehler, M. J., Mishra, P., & Shin, T. (2009). Technological pedagogical content knowledge (TPACK): the development and validation
of an assessment instrument for preservice teachers. Journal of Research on Technology in Education, 42(2), 123–149.Shapka, J. D., & Ferrari, M. (2003). Computer-related attitudes and actions of teacher candidates. Computers in Human Behaviour, 19(3), 319–334.Shin, T., Koehler, M., Mishra, P., Schmidt, D., Baran, E., & Thompson, A. (2009). Changing technological pedagogical content knowledge (TPACK) through course experiences. In
C. Crawford, et al. (Eds.), Proceedings of society for information technology and teacher education international conference 2009 (pp. 4152–4159). Chesapeake, VA: AACE.Shuldman, M. (2004). Superintendent conceptions of institutional conditions that impact teacher technology integration. Journal of Research on Technology in Education, 36(4),
319–343.Shulman, L. S. (1986). Those who understand: knowledge growth in teaching. Educational Researcher, 15(2), 4–14.Shulman, L. S. (1987). Knowledge and teaching: foundations of the new reform. Harvard Educational Review, 57, 1–22.So, H., & Kim, B. (2009). Learning about problem based learning: student teachers integrating technology, pedagogy and content knowledge. Australasian Journal of
Educational Technology, 25(1), 101–116.Tabachnick, B. G., & Fidell, L. S. (1996). Using multivariate statistics. New York: HarperCollins College.Teo, T. (2008). Pre-service teachers’ attitude towards computer use: a Singapore survey. Australasian Journal of Educational Technology, 24, 413–424.Teo, T. (2010). Measuring the effect of gender on computer attitudes among pre-service teachers: a multiple indicators, multiple causes (MIMIC) modeling. Campus-Wide
Information Systems, 27(4), 227–239.Wilson, E., & Wright, V. (2010). Images over time: the intersection of social studies through technology, content, and pedagogy. Contemporary Issues in Technology and Teacher
Education, 10(2), 220–233.Yalin, H. I., Karadeniz, S., & Sahin, S. (2007). Barriers to information and communication technologies integration into elementary schools in Turkey. Journal of Applied Sciences,
7(24), 4036–4039.Yuen, A., & Ma, W. (2002). Gender differences in teacher computer acceptance. Journal of Technology in Teacher Education, 10(3), 365–382.Zhao, Y. (2007). Social studies teachers’ perspectives of technology integration. Journal of Technology and Teacher Education, 15(3), 311–333.