Affinity for Political Humor: An Assessment of Internal Factor Structure, Reliability, and Validity...
23
DOI 10.1515/humor-2013-0034 Humor 2013; 26(4): 551 – 572 R. Lance Holbert*, Jayeon Lee, Sarah Esralew, Whitney O. Walther, Jay D. Hmielowski and Kristen D. Landreville Affinity for political humor: An assessment of internal factor structure, reliability, and validity Abstract: An 11-item Affinity for Political Humor (AFPH) scale is theorized as a higher-order latent factor with four lower-order latent factors (incongruity, su- periority, anxiety reduction, and social connection). The theorized measurement model and several alternative models are tested using confirmatory factor analy- sis (CFA). In addition, reliability and validity assessments are provided. Analyses are conducted using four data sets collected between December 2009 and March 2011 (total N = 1860). Results reveal the theorized model to fit the data well, but also indicate that an alternative model (four lower-order latent variables only) retains the strongest and most consistent fit across all four data sets. Reliability assessments reveal strong internal consistency for the 11-item AFPH scale, as well as for each of the four sub-dimensions. In addition, correlational analyses reveal the AFPH measures to retain strong validity (i.e., statistically significant and pos- itive correlations with political TV satire consumption). Keywords: political humor, measurement, incongruity, superiority, anxiety, satirical television *Corresponding author: R. Lance Holbert: The Ohio State University, USA. E-mail: [email protected] Jayeon Lee: Lehigh University, Bethlehem, PA, USA Sarah Esralew: RCC Associates in Boulder, CO, USA Whitney O. Walther: University of Minnesota, USA Jay D. Hmielowski: University of Arizona, USA Kristen D. Landreville: University of Wyoming, USA Scholarship focused on political entertainment media in general, and political satire in particular, is at a critical juncture. While a substantive body of work now exists detailing the nature of the messages provided within this type of media content (see Baym 2005; Fox et al. 2007), as well as concerning a range of effects (see Holbert et al. 2007; LaMarre et al. 2009), there is far less understanding re- garding what is leading people to seek out such media experiences. Initial inves- tigations into the audience of political entertainment television reveal age to be a Brought to you by | EP Ipswich Authenticated | 10.248.254.158 Download Date | 9/17/14 8:43 PM
-
Upload
independent -
Category
Documents
-
view
0 -
download
0
Transcript of Affinity for Political Humor: An Assessment of Internal Factor Structure, Reliability, and Validity...

DOI 10.1515/humor-2013-0034 Humor 2013; 26(4): 551 – 572
R. Lance Holbert*, Jayeon Lee, Sarah Esralew, Whitney O. Walther, Jay D. Hmielowski and Kristen D. Landreville
Affinity for political humor: An assessment of internal factor structure, reliability, and validity
Abstract: An 11-item Affinity for Political Humor (AFPH) scale is theorized as a higher-order latent factor with four lower-order latent factors (incongruity, su-periority, anxiety reduction, and social connection). The theorized measurement model and several alternative models are tested using confirmatory factor analy-sis (CFA). In addition, reliability and validity assessments are provided. Analyses are conducted using four data sets collected between December 2009 and March 2011 (total N = 1860). Results reveal the theorized model to fit the data well, but also indicate that an alternative model (four lower-order latent variables only) retains the strongest and most consistent fit across all four data sets. Reliability assessments reveal strong internal consistency for the 11-item AFPH scale, as well as for each of the four sub-dimensions. In addition, correlational analyses reveal the AFPH measures to retain strong validity (i.e., statistically significant and pos-itive correlations with political TV satire consumption).
Keywords: political humor, measurement, incongruity, superiority, anxiety, satirical television
*Corresponding author: R. Lance Holbert: The Ohio State University, USA. E-mail: [email protected] Lee: Lehigh University, Bethlehem, PA, USASarah Esralew: RCC Associates in Boulder, CO, USAWhitney O. Walther: University of Minnesota, USAJay D. Hmielowski: University of Arizona, USAKristen D. Landreville: University of Wyoming, USA
Scholarship focused on political entertainment media in general, and political satire in particular, is at a critical juncture. While a substantive body of work now exists detailing the nature of the messages provided within this type of media content (see Baym 2005; Fox et al. 2007), as well as concerning a range of effects (see Holbert et al. 2007; LaMarre et al. 2009), there is far less understanding re-garding what is leading people to seek out such media experiences. Initial inves-tigations into the audience of political entertainment television reveal age to be a
Brought to you by | EP IpswichAuthenticated | 10.248.254.158
Download Date | 9/17/14 8:43 PM

552 R. Lance Holbert et al.
strong predictor of consumption (Young and Tisinger 2006), but that is about the extent of our knowledge on the matter. Understanding who is consuming politi-cal entertainment is fundamental to placing the influence of any one media outlet in its proper context. To gain insight into the true effects of media we must have a solid sense of who is consuming specific messages, and also know why they are choosing to seek out a specific type of mass communication product.
In response to this lack of understanding, an 11-item affinity for political humor (AFPH) scale was created. The AFPH scale is an individual-difference vari-able designed for the specific task of better explaining why people are drawn to content such as The Daily Show with Jon Stewart, The Colbert Report, or The Onion – to name just a few examples (Hmielowski et al. 2011). Although there are sev-eral humor-related individual-difference measures in the extant literature (e.g., Cline et al. 2003; Svebak 1974; Thorson and Powell 1993), they either lack suffi-cient validity or are not appropriate for the study of political humor. Conversely, the 11-item AFPH scale retains strong and unique predictive power in accounting for why people tune in to consume traditional TV satire (see Hmielowski et al. 2011). The present study addresses the core measurement issues related to the 11-item AFPH scale, assessing a hypothesized AFPH model using four different data sets collected over sixteen months, from December 2009 to March 2011. The samples within the data sets represent distinct populations: two student-based, one random sample from one US state, and one national representative sample of the American population.
1 Affinity for Political Humor (AFPH) dimensionsThe AFPH measure consists of four lower-order constructs, each reflecting a reason someone can experience this affinity: incongruity, superiority, anxiety reduction, and social connection. A basic theoretical foundation for each dimen-sion is provided below.
1.1 Incongruity
Incongruity, the difference between what people expect and what actually occurs, has served as the basis for many comedic traditions (Young 2008). Incongruent situations cause people to experience mirth as a result of the shift between their working framework (the situation presented in front of them) and their long-term memory (Attardo 1997). When engaged in frame-shifting, people must exert cog-nitive effort in order to process and understand the humor.
Brought to you by | EP IpswichAuthenticated | 10.248.254.158
Download Date | 9/17/14 8:43 PM

Affinity for political humor 553
Incongruities can be achieved in two ways. First, incongruities will occur if the audience does not expect the punch line until it is delivered, and being caught off guard, finds the message funny. Second, there might be semantic or linguis-tic mismatches within a message, and therefore the rhetoric of the joke could be perceived as inconsistent. The disconnection takes place between the real, or factual, versus the unreal, or imagined. Possible forms of this disconnection in-clude good vs. bad, life vs. death, normal vs. abnormal, possible vs. impossible, and high status vs. low status. The good versus bad dichotomy is especially well suited for politics since jokes are often made in comparing our democratic ideals (perceived as good) to the formal actions of our governmental bodies or leaders (perceived as bad). The element of incongruity, then, explains one reason indi-viduals could be attracted to humorous content focused on politics.
1.2 Superiority
Superiority refers to situations in which people experience humor through feel-ings of dominance or by feeling above those at whom they laugh (Berger and Wildavsky 1994). For example, when a sex scandal about a political leader is made public and a joke is made at the politician’s expense, an individual might find the joke amusing. Knight (2004) focused on a triad consisting of the receiver (the satiree), the humorist (the satirist), and the target of the joke (the satirized) when assessing whether a biting piece of political humor could be influential. In order for the receiver to laugh, and potentially be influenced, by a piece of satire the receiver must find that the target of the message is worthy of disparagement (Highet 1962). In the above example the receiver must agree with the humorist that the politician is a worthy and appropriate target in order to find the message humorous. Two elements, then, must be present when this type of humor is uti-lized. First, the receiver must view the target of the joke in a negative manner. Second, enjoyment of the joke depends on the act of comparison. The receiver must first assess his or her own position and then compare him or herself to the target of the joke (Zillman 2000). These two steps result in the receiver finding the message humorous. In addition to incongruity, feelings of superiority might also be a reason an individual comes to appreciate political humor.
1.3 Anxiety reduction
The anxiety reduction dimension is tied to socially awkward or tense situations. When people are placed in stressful situations, they often use humor to cope, or to
Brought to you by | EP IpswichAuthenticated | 10.248.254.158
Download Date | 9/17/14 8:43 PM

554 R. Lance Holbert et al.
reduce tension (Meyer 2000). As implied by the old song title “let a smile be your umbrella,” humor and laughter in general have long been known as remedies for relieving tension and coping with anxiety. A line of studies has supported the moderating effect of humor in the relationship between stressful experiences and overall mood disturbance (Martin and Lefcourt 1983; Martin et al. 1993). When humor is high, the positive relationship between stress and anxiety disappears (Abel 1998). Humor affords people an opportunity to explore cognitive alterna-tives in response to stressful encounters or to restructure the situation so that it is less threatening (Dixon 1980). That is why this process is also described as a “de-fense” mechanism (Ziv 1984). Humor allows people to distance themselves from stressful situations, view them from a different perspective, manage emotions, and ultimately reduce feelings of anxiety (Yovetich et al. 1990).
This tension-reducing role is also important in political humor. People often take political matters very seriously, causing the subject to be taboo in many social circles (Cegala 1981) and in many social situations (such as office parties or neighborhood gatherings), where people grow uncomfortable when the topic of politics arises spontaneously in conversation. People may also become anxious observing competing campaigns between political candidates or waiting for the outcome of a particular election. In these circumstances, humor could be used as a way to reduce stress and create a positive emotional state. Humor enables people to “laugh off” their anxiety and so could be one more way in which people come to gain an affinity for political humor.
1.4 Social connectedness
The final AFPH construct concerns the potential social functions of political humor. People can use humor to connect with others (Ziv 1984) and to attain social goals (Thorson and Powell 1993). In fact, acting as a social lubricant might be one of the most common uses of humor (Thorson and Powell 1993). Sharing a sense of humor with a particular group helps people integrate socially. Research suggests that social relations can be enhanced, group communication facilitated, and group cohesiveness, solidarity, and a sense of belonging engendered through the use of humor (Duncan and Feisal 1989).
One of the remarkable aspects of political humor as social lubricant is that it works not only within homogeneous groups, but also within heterogeneous groups. Among individuals who retain similar ideological worldviews, humor can create even stronger bonds. By joking about policies they oppose or making fun of politicians or political parties they do not support, people often form or reconfirm a sense of belonging. In a homogeneous group, even jokes about pol-
Brought to you by | EP IpswichAuthenticated | 10.248.254.158
Download Date | 9/17/14 8:43 PM

Affinity for political humor 555
iticians the group members support are freely enjoyed because they know such jokes are not malicious.
Humor also serves a social function in situations where individuals interact with those who maintain opposing political views. Such situations generally lead people to feel distant from one another, and a sense of estrangement can be ex-acerbated during politically sensitive times such as election periods. But even in a heterogeneous group, humor can narrow the gap between people by allowing them to laugh together and feel friendlier with one another, for instance through jokes about politicians as a common enemy. Laughter also has a positive impact on people’s reactions to interpersonal encounters between strangers (Grammer 1990), and shared laughter can overcome an otherwise negative reaction to a dis-similar other (Cann et al. 1997). Those with differing views, then, may be able to connect through the experience of watching a funny comedy show together. People recognize the usefulness of such political humor when dealing with others with both similar and dissimilar political views.
2 Hypothesized and competing models
2.1 Hypothesized model
In the theorized model (see Figure 1), AFPH is a higher-order latent factor that di-rectly influences four lower-order latent factors (incongruity, superiority, anxiety relief, and social connectedness). There are a total of 11 observable indicators (see Appendix) – two associated with incongruity and three with each of the other lower-order factors. AFPH items 1–3 are representative of the superiority dimen-sion: “I appreciate political humor because it can reveal the weaknesses of our political leaders and institutions.”; “I appreciate political humor because it can make me feel more knowledgeable about politics.”; “I appreciate political humor because it can aid me in reinforcing my political beliefs.” AFPH items 4 and 7 are associated with the incongruity dimension: “I appreciate political humor when it makes me aware that our political system is dysfunctional.”; “I appreciate politi-cal humor when it helps me make better sense of why our political system is dys-functional.” AFPH items 6, 8 and 9 represent the operation of the anxiety dimen-sion: “I appreciate political humor because it can reduce the anxiety I feel toward politics.”; “I appreciate political humor because it can help me better cope with awkward situations.”; “I appreciate political humor because it can help me effec-tively criticize politics and politicians.” AFPH items 5, 10 and 11 are associated with the social cohesion dimension: “I appreciate political humor because it can
Brought to you by | EP IpswichAuthenticated | 10.248.254.158
Download Date | 9/17/14 8:43 PM

556 R. Lance Holbert et al.
Fig. 1: Competing affinity for political humor CFA models
Brought to you by | EP IpswichAuthenticated | 10.248.254.158
Download Date | 9/17/14 8:43 PM

Affinity for political humor 557
help me express my political opinions.”; “I appreciate political humor because it allows me to be friendly with people who hold political views that are different from my own.”; “I appreciate political humor because it allows me to form stronger bonds with people who hold similar political views as my own.”
2.2 Competing models
In addition to the theorized model, we put forward three theoretically-grounded or empirically-grounded competing models in order to provide the proper context in which to judge the status of the hypothesized model discussed above. Assess-ing the fit of a given hypothesized model provides one level of understanding, but an assessment of how well a hypothesized model stacks up against a series of competing models provides a stricter test (Muliak 2004). The first competing model reflects what could potentially be derived from the initial exploratory factor analyses (EFA) on the AFPH items conducted by Hmielowski et al. (2011). This hypothesized model consists of a single latent variable (affinity for political humor) with 11 observable variable indicators (see Figure 1, Competing Model #1).
A second competing model (see Figure 1, Competing Model #2) is broken down by internal rationales, (e.g., knowledge gain, personal belief reinforce-ment) versus social rationales (e.g., forging stronger ties to likeminded others, expressing opinions to others) for why someone may appreciate political humor. When looking at the 11 AFPH items (see Appendix), items 1, 2, 3, 4, 6 and 7 speak to such internal conditions. The remaining five items (5, 8, 9, 10 and 11) repre-sent more socially-grounded aspects of why someone might appreciate political humor.
A third competing model (see Figure 1, Competing Model #3) removes the higher-order factor (affinity for political humor) and retains only the four lower- order latent factors as distinct latent variables. The affinity for political humor is being presented as an overarching force that has an impact upon the apprecia-tion any one individual feels for the various aspects of political humor. However, each of the four underlying components of the AFPH scale derive from unique humor literatures. It is equally plausible that each AFPH sub-dimension could stand on its own relative to the other three dimensions, and therefore it is import-ant to assess this possibility as an alternative model.
Brought to you by | EP IpswichAuthenticated | 10.248.254.158
Download Date | 9/17/14 8:43 PM

558 R. Lance Holbert et al.
3 Method
3.1 Data
3.1.1 Data set 1
The first data set was collected by a private research firm, which was hired by the authors to conduct a phone survey of a large Midwestern U.S. political battleground state. The survey was conducted during December 2009 and Janu-ary 2010, with the firm using a random sample of cellular and landline numbers (Nlandline = 153, Ncellular = 152). The research firm used a computer-generated random sample of phone numbers for the appropriate area codes and landline/cellular exchanges.
Descriptive statistics for this survey provide evidence that the use of a cell phone stratum within the single-cell survey design was fruitful given that there was a mean age difference of almost 17 years between the two sampling strata (landline M age = 57.51 years; cellular M age = 40.81 years). Biological sex balances out in the sample to 51% male, 49% female. The racial breakdown for the sample was Cau-casian, 81.4% of sample (N = 241) and other, 18.6% of sample (N = 55). Educa tion (highest level completed) was measured on a 9-point scale ranging from middle school to doctorate. The descriptive statistics place the sample squarely between some college experience and a bachelor’s degree. Political party identification breakdowns were as follows: Democrat (N = 98, 33.1% of sample); Republican (N = 78, 24% of sample). In addition, political ideology was measured on a 5-point scale, ranging from extremely liberal (coded low) to extremely conservative. The sample mean (M = 3.20, SD = 0.92) rested near the middle response of moderate.
3.1.2 Data set 2
The second data set was collected in March, 2010 as part of the final co-author’s dissertation (N = 229), and consists of responses from students enrolled at a large public university located in the American Midwest. The AFPH items were col-lected as part of the study (in the pre-stimulus phase), but not utilized in any of the core analyses for the dissertation. The basic descriptives for this data set are as follows: 54.2% female; age (M = 20.88, SD = 3.72); political party identification (35.1% Democrat, 37.3% Republican); and mean ratings on 1–7 scales (extremely liberal coded high) for ideological stances both economic (M = 3.68, SD = 1.60) and social (M = 4.19, SD = 1.72) residing closest to the middle rating of moderate.
Brought to you by | EP IpswichAuthenticated | 10.248.254.158
Download Date | 9/17/14 8:43 PM

Affinity for political humor 559
3.1.3 Data set 3
The third data set was collected from May 2010 through November 2010 and con-sists of responses from students enrolled in the same large Midwestern university as detailed for data set 2 (N = 294). The basis for this experimental study was to look at differential impacts of two types of satire, juvenalian and horatian. The AFPH items were collected in the pre-stimulus phase of the study. The AFPH items collected from this data set have not been utilized in any research to date. The basic descriptives for this data set are as follows: 47.6% female; age (M = 21.64, SD = 3.92); political party identification (47.9% Democrat, 37.9% Republican); and mean ratings on 1–7 scales (extremely liberal coded high) for ideological stances both economic (M = 3.74, SD = 1.46) and social (M = 4.15, SD = 1.41) residing closest to the middle rating of moderate.
3.1.4 Data set 4
The fourth data set was collected in March 2011 as part of a dissertation that fo-cused on the formation of social groups that could have an impact on political attitudes and behaviors, and consists of responses from a national on-line opt-in voluntary panel recruited by a private research firm (N = 1,032). The AFPH items were not utilized in any of the core analyses for the dissertation. The descrip-tives for this data set are as follows: age (M = 46.30; SD = 16.61); 47% male and 53% female; political party identification (33.8% Democrat, 24.8% Republican, 24% Independent, and 17.4% none). Education (highest level completed) was measured on a 5-point scale ranging from no diploma to advanced degree. The descriptive statistics place the sample squarely between high school diploma and college degree. The racial breakdown for this sample was 75.8% Caucasian, 10.5% Black, and 13.7% other.
3.2 AFPH Item Scaling
For data sets 1 and 4, personal agreement for each of the 11 items was assessed using 5-point scales ranging from 1 (strongly disagree) to 5 (strongly agree), with the higher end of each scale indicating a greater affinity for political humor. For data sets 2 and 3, 7-point scales ranging from 1 (strongly disagree) to 7 (strongly agree) were employed (see Table 1 for descriptive statistics).
Brought to you by | EP IpswichAuthenticated | 10.248.254.158
Download Date | 9/17/14 8:43 PM

560 R. Lance Holbert et al.
Tabl
e 1:
AFP
H ite
ms
– de
scrip
tive
stat
istic
s
Item
St
udy
1 St
udy
2 St
udy
3St
udy
4
MSD
SkK
MSD
SkK
MSD
SkK
MSD
SkK
13.
501.
08−.
731
−.22
24.
671.
53−.
48−.
194.
441.
49−.
39−.
533.
191.
27−.
340
−.83
23.
121.
04−.
133
−1.0
104.
441.
48−.
19−.
434.
351.
41−.
40−.
342.
941.
23−.
100
−.88
33.
001.
07−.
039
−.99
84.
201.
44−.
01−.
244.
031.
37−.
23−.
342.
801.
22.0
40−.
904
3.28
1.07
−.44
3−.
807
4.38
1.45
−.28
−.18
4.30
1.37
−.23
−.40
3.15
1.28
−.24
0−.
925
3.30
1.03
−.51
9−.
690
4.39
1.51
−.34
−.23
4.21
1.39
−.25
−.41
2.99
1.24
−.13
0−.
896
3.22
1.08
−.30
8−.
898
4.16
1.57
−.02
−.49
4.04
1.45
−.22
−.63
2.82
1.27
.060
−1.0
37
3.23
1.03
−.49
6−.
726
4.21
1.36
−.18
.07
4.18
1.42
−.39
−.40
3.09
1.25
−.23
0−.
888
3.01
1.01
−.04
6−.
962
3.99
1.52
−.04
−.47
3.85
1.45
−.07
−.65
2.69
1.19
.106
−.82
93.
111.
07−.
170
−.97
34.
061.
53.0
0−.
413.
961.
46−.
14−.
742.
971.
29−.
070
−1.0
410
3.41
0.96
−.69
5−.
329
4.32
1.44
−.34
−.04
4.18
1.37
−.42
−.44
2.97
1.24
−.10
0−.
9211
3.52
0.98
−.61
8−.
222
4.47
1.45
−.28
−.22
4.24
1.34
−.39
−.15
2.95
1.25
−.10
0−.
98
Note
: Stu
dies
1 a
nd 4
use
d a
1–5
Like
rt sc
ale.
Stu
dies
2 a
nd 3
use
d 1–
7 Li
kert
scal
es. F
ull r
ange
of s
cale
use
d fo
r eac
h ite
m in
eac
h st
udy.
Brought to you by | EP IpswichAuthenticated | 10.248.254.158
Download Date | 9/17/14 8:43 PM

Affinity for political humor 561
3.3 Analyses
The analyses unfold in four phases. The first phase involved the use of structural equation modeling-based confirmatory factor analysis (CFA) using AMOS 18. The core theoretical AFPH model consisting of a single higher-order latent factor, four lower-order latent factors (incongruity, superiority, anxiety reduction, and social connection) and eleven observable variable models was tested. In addition, the three alternative theoretical models (a single latent variable, two lower-order latent variables, and four lower-order latent variables) were also assessed for model fit (see Figure 1 for representations of all four models). As recommended by Holbert and Stephenson (2002), the standardized root mean square residual (SRMR) was used as an absolute fit statistic and the confirmatory fit index (CFI) was used as an incremental fit statistic for all models. The recommended levels for each statistic as indications for solid model fit are as follows: SRMR [.06 or lower] and CFI [.95 or greater] (Hu and Bentler 1999).
Phase two focuses on a formal comparison of the competing models. The four CFA models being tested within each data set are a reflection of nested models, so there can be a direct assessment of relative model fit using the D in the χ2-distributed test statistic (Schumacker and Lomax 2004). The χ2 estimate was obtained for each model and the difference in degrees of freedom between models was used as a base from which to assess whether the change in the χ2 estimate from one model to another was statistically significant. The model with the lowest χ2 estimate that is also found to be lower in a statistically significant fashion can be judged to be a better fit with the data than alternative models.
The third phase consists of reliability assessments of the indices that fit well with our data. The reliability assessments were conducted using Cronbach’s α. Finally, the fourth phase focused on a validity assessment of all appropriate mul-tiple-item indices produced from analyses stages one through four. The validity assessment focuses on the ability of any multiple-item AFPH-related indices to predict political TV satire exposure. Data sets 1 and 4 each contained individual measures of exposure to The Daily Show with Jon Stewart and The Colbert Report. A two-item political TV satire index consisting of these items was found to be reli-able in each of the two data sets: Study 1, Cronbach’s α = .86 (M = 1.74, SD = 1.13); Study 4, Cronbach’s α = .92 (M = 1.74, SD = 1.11). Both data sets utilized 1–5 scales for each media exposure measure.
Brought to you by | EP IpswichAuthenticated | 10.248.254.158
Download Date | 9/17/14 8:43 PM

562 R. Lance Holbert et al.
4 Results
4.1 Confirmatory factor analyses (CFAs) and reliability assessment
4.1.1 Data set 1
Theoretical model. Once again, the theoretical model outlined involves 11 observ-able variables, 4 lower-order factors (superiority, incongruity, anxiety, and social connectedness), and a single higher-order latent variable (affinity for political humor). This model fits the data well: χ2(40, 305) = 117.36, p < .001; CFI = .943 and the SRMR = .05 (see Table 2). The CFI was just slightly below the .95 threshold, but the SRMR is at a more than comfortable level in pointing to a solid fit with the data. We employed the use of an additional absolute fit index, the goodness of fit index (GFI), to add to our assessment of this model. As with the CFI, the desired
Table 2: Competing models – fit and Dχ2 estimates
χ2 (df) Dχ2 (df) CFI SRMR
Study 1Hypothesized 117.36 (40) – (4)* .94 .05Competing 1 135.04 (44) +17.68 (4)* .93 .05Competing 2 128.07 (43) +10.71 (3)* .94 .05Competing 3 108.36 (38) − 9.00 (2)* .95 .04Study 2Hypothesized 127.82 (40) – (4)* .94 .05Competing 1 192.78 (44) +64.96 (4)* .89 .06Competing 2 176.26 (43) +48.44 (3)* .91 .05Competing 3 116.24 (38) −11.58 (2)* .95 .04Study 3Hypothesized 164.68 (40) – (4)* .94 .05Competing 1 234.12 (44) +69.44 (4)* .91 .05Competing 2 198.59 (43) +33.91 (3)* .93 .05Competing 3 146.81 (38) − 17.87 (2)* .95 .04Study 4Hypothesized 439.42 (40) – (4)* .96 .03Competing 1 744.50 (44) +305.08 (4)* .92 .04Competing 2 690.20 (43) +250.78 (3)* .93 .04Competing 3 421.66 (38) −17.76 (2)* .96 .03
Note: Critical χ2 values for the p < .05 α level are as follows: df (2) = 5.99; df (3) = 7.81; df (4) = 9.49 (Arkin and Colton, 1963). * p < .05. All Dχ2 tests run against the hypothesized model.
Brought to you by | EP IpswichAuthenticated | 10.248.254.158
Download Date | 9/17/14 8:43 PM

Affinity for political humor 563
threshold for the GFI is .95 or above, and the GFI estimate for this model is .96. The combination of these results points to the theoretical model fitting the data well.
The standardized path estimates calculated for the hypothesized model are also indicative of a well-fitting model. Overall, the factor loadings are solidly in the .60 to .80 range (see Table 3). In addition, the four factor loadings leading from the higher-order affinity for political humor latent variable to the four lower- order factors are all strong at a level of .91 or higher.
Competing models. The first two competing models, consisting of a single lower- order AFPH factor and two lower-order factors (internal and external), respec-tively, do not fit the data as well. While the CFI and SRMR fit indices indicate the potential for a more than reasonable fit with the data, the Dχ2 estimates indicate a poorer fit with the data than what is provided by the theorized model detailed above (see Table 2). It is particularly important to note that the competing model consisting of the single latent variable does not fit the data as well despite what is reported by Hmielowski et al. (2011), who reported EFA results that revealed a single factor structure. It is now clear that such a model is inferior to what is truly theorized by the authors. The relatively crude EFA technique was unable to
Table 3: Standardized path estimates – hypothesized model
Estimated path Standardized estimates
Study 1 Study 2 Study 3 Study 4
Superiority → AFPH1 .66 .70 .78 .83 Superiority → AFPH2 .68 .86 .85 .89 Superiority → AFPH3 .65 .85 .85 .87Incongruity → AFPH4 .68 .81 .83 .90 Incongruity → AFPH7 .80 .85 .84 .87 Anxiety → AFPH6 .62 .74 .70 .75Anxiety → AFPH8 .71 .75 .74 .75Anxiety → AFPH9 .74 .72 .76 .83 Social → AFPH5 .72 .78 .86 .83Social → AFPH10 .57 .71 .58 .78Social → AFPH11 .76 .72 .77 .81 AFPH → Superiority .91 .90 .92 .95AFPH → Incongruity .92 .83 .91 .88AFPH → Anxiety .97 .98 .93 .99AFPH → Social .97 .98 .99 .99
Note: Standardized loadings of .60 or greater are considered strong (Bryant and Yarnold 2001). Loadings falling below this level are marked in bold.
Brought to you by | EP IpswichAuthenticated | 10.248.254.158
Download Date | 9/17/14 8:43 PM

564 R. Lance Holbert et al.
detect the presence of a lower-order factor structure that is grounded in theory and nested within the more powerful higher-order factor, AFPH. The EFA results could only detect the most powerful level within the factor structure, when both levels appear to be present and reflective of what is theorized by Hmielowski et al. (2011).
The model that fits the data best is the third competing model, which consists of four lower-order latent variables: Dχ2 (df = 2) = −9.00, p < .05; CFI = .95, SRMR = .04 (see Table 2). While the theorized model with the addition of the higher-order AFPH variable fits the data well, scholars could use the items as representative of four distinct elements in their various research efforts. They have shown a uni-dimensionality that allows for the treatment of the superiority, incongruity, an-xiety reduction, and social connectedness dimensions as distinct entities. We feel this is an important potential advancement for research on political humor. Com-peting model #3 achieving a desired level of model fit provides empirical valida-tion of the use of distinct dimensions within the proposed affinity for political humor scale. However, the finding of a solid model fit for the originally theorized model also points to researchers having the ability to retain use of the full AFPH index.
Reliability. The full 11-item AFPH index retains a very strong reliability (Cron-bach’s α = .90). As for the individual indices associated with the four lower-order factors, there was also solid evidence of quality reliability levels being achieved: superiority (Cronbach’s α = .70), incongruity (Cronbach’s α = .70), anxiety (Cron-bach’s α = .73), and social connectedness (Cronbach’s α = .73).
4.1.2. Data set 2
Theoretical model. The theoretical model achieved almost an identical level of fit as found in Study 1: χ2 (40, 229) = 127.82, p < .001; CFI = .94; SRMR = .05; GFI = .96 (see Table 2), indicating a solid fit with the data. As for the standardized path estimates, they range from .71 to .86 for the lower-order factors leading to the observable variables (see Table 3). In addition, all of the loadings connecting the higher-order AFPH measure with the four lower-order latent variables are very solid (indicative of what was found in Study 1).
Competing models. The first two competing models are far worse fits with the Study 2 data than was even indicated in the Study 1 testing: Competing Model 1, χ2 (44, 229) = 192.78 , p < .001; CFI = .89; SRMR = .06; Competing Model 2, χ2 (43, 229) = 176.26, p < .001; CFI = .91; SRMR = .05. The CFI estimates are a clear repre-
Brought to you by | EP IpswichAuthenticated | 10.248.254.158
Download Date | 9/17/14 8:43 PM

Affinity for political humor 565
sentation of a lack of fit with the Study 2 data, and the χ2-distributed test statistics for these models are far higher than the hypothesized model: Competing Model 1, Dχ2(4) = 64.96, p < .05; Competing Model 2, Dχ2 (3) = 48.44, p < .05 (see Table 2).
However, as found in Study 1, the best fit with these data is the model with four lower-order latent variables only and no higher-order AFPH latent construct: χ2 (38, 229) = 116.24 , p < .001; CFI = .95; SRMR = .04. These statistics reveal a supe-rior fit with the Study 2 data (Dχ2[2] = −11.58, p < .05).
Reliability. The 11-item AFPH scale retains a strong reliability (Cronbach’s α = .92), and the same can be stated for the four AFPH sub-indices: Superiority (Cron-bach’s α = .84), incongruity (Cronbach’s α = .82), anxiety (Cronbach’s α = .78), and social connectedness (Cronbach’s α = .78). As with Study 1, the various indices are strong in terms of internal consistency.
4.1.3. Data set 3
Theoretical model. The hypothesized model retains a very similar pattern of fit statistics as found in the first two studies: χ2 (40, 294) = 164.68, p < .001; CFI = .94; SRMR = .05; GFI = .95 (see Table 2). These statistics point to a solid fit.
As for the standardized path estimates, 10 of the 11 paths connecting the observable AFPH items to their respective lower-order latent variables are .70 or higher (see Table 3). In addition, all of the loadings from the higher-order AFPH latent variable to the four lower-order latent variables are all above the .90 level.
Competing models. As with the first two studies, competing models 1 and 2 repre-sent models that do not fit the data as well as the hypothesized model: Competing model 1, χ2 (44, 294) = 234.12, p < .001; CFI = .91; SRMR = .05; Competing model 2, χ2 (43, 294) = 198.59, p < .001; CFI = .93; SRMR = .05 (see Table 2). The Dχ2 tests provide clear empirical evidence that these two models are inferior to the hypoth-esized model: Competing model 1, Dχ2 (4) = 69.44, p < .05; competing model 2, Dχ2 (3) = 33.91, p < .05. However, the third competing model retains the strongest fit with the data: χ2 (38, 294) = 146.81, p < .001; CFI = .95; SRMR = .04. The Dχ2 (2) = −17.87, p < .05 is indicative of a model that retains a stronger fit than the hypothe-sized model.
Reliability. The reliabilities obtained for Study 3 are equivalent with those found in Studies 1 and 2: 11-item AFPH (Cronbach’s α = .93), superiority (Cronbach’s α = .86), incongruity (Cronbach’s α = .82), anxiety (Cronbach’s α = .78), and social connectedness (Cronbach’s α = .78). These tests, along with the estimates
Brought to you by | EP IpswichAuthenticated | 10.248.254.158
Download Date | 9/17/14 8:43 PM

566 R. Lance Holbert et al.
obtained from the first two studies, indicate a consistent pattern of highly reliable indices.
4.1.4. Data set 4
Theoretical model. The theoretical model in Study 4 was similar in fit to the first three studies: χ2 (40, 1032) = 439.42, p < .001; CFI = .96; SRMR = .03 (see Table 2). These statistics point to a solid fit. As for the standardized path estimates, they range from .75 to .90 for the lower-order factors leading to the observable variables (see Table 3). These estimates are solidly above the .60 level. Additionally, the loadings connecting the higher-order AFPH measure with the four lower-order latent variables are very strong, as seen in the first three studies (.88 or higher).
Competing models. As with the first three studies, competing models 1 and 2 do not fit as well as the hypothesized model: Competing model 1, χ2 (44, 1032) = 744.50, p < .001; CFI = .92; SRMR = .04; Competing model 2, χ2 (43, 1032) = 690.20, p < .001; CFI = .92; SRMR = .04 (see Table 2). The Dχ2 tests provide clear empirical evidence that these two models are inferior to the hypothesized model: Compet-ing model 1, Dχ2 (4) = 305.08, p < .05; competing model 2, Dχ2 (3) = 250.78, p < .05. However, the third competing model retains a fit with the data similar to that of the hypothesized model: χ2 (38, 1032) = 421.66, p < .001; CFI = .96; SRMR = .03. The Dχ2 (2) = −17.76, p < .05 indicate that the competing model indeed retains a stronger fit than the hypothesized model.
Reliability. The 11-item AFPH scale retains a strong reliability (Cronbach’s α = .95). The reliability estimates for the four AFPH sub-indices are as follows: Superiority (Cronbach’s α = .90), incongruity (Cronbach’s α = .88), anxiety (Cronbach’s α = .83), and social connectedness (Cronbach’s α = .83). These reliability estimates suggest that both the sub-indices, as well as the entire scale, are highly reliable.
4.2 Validity assessment
As stated earlier, the focus of the validity assessment is on the ability of the vari-ous multiple-item AFPH-related indices to positively correlate with the consump-tion of political satire. Two of the four data sets, data sets 1 and 4, utilized for the CFA and reliability analyses detailed above, retain measures of political satire consumption (combination of The Daily Show and The Colbert Report). The fol-lowing is an overview of the correlational analyses:
Brought to you by | EP IpswichAuthenticated | 10.248.254.158
Download Date | 9/17/14 8:43 PM

Affinity for political humor 567
4.2.1 Study 1
The 11-item AFPH index retains a strong positive correlation with the two-item political satire TV consumption index, zero-order r = .34, p < .001. The superior-ity dimension retains a correlation with political TV satire viewing that is in-line with the full 11-item AFPH scale, zero-order r = .35, p < .001. The relation between the satire consumption measure and the two-item incongruity measure is also at about the same level, zero-order r = .31, p < .001. However, the anxiety (zero-order r = .22, p < .001) and social connection (zero-order r = .21, p < .001) are substan-tially lower than the other two AFPH dimensions.
4.2.2 Study 4
The 11-item AFPH index is able to maintain a zero-order correlation of relatively the same magnitude as found in the Study 1 data, r = .38, p < .001. However, it is the superiority (zero-order r = .38, p < .001), anxiety reduction (zero-order r = .37, p < .001), and social connectedness (zero-order r = .34, p < .001) dimensions that retain the strongest relationships with the political satire TV consumption index. It is the incongruity dimension (zero-order r = .29, p < .001) that retains the lowest correlation with the political satire TV variable in this latter study.
5 DiscussionThe hypothesized AFPH model consisting of a single higher-order latent variable (AFPH) and four lower-order latent variables (incongruity, superiority, anxiety reduction, and social connectedness) fits the data well. It is clear that researchers can employ this type of structure when using the individual-difference measure of AFPH as a predictor of political humor consumption. For example, there are large media audiences for political satire (e.g., The Daily Show with Jon Stewart), entertainment talk shows (e.g., David Letterman, Jay Leno) and satirical situa-tional comedies (e.g., Family Guy) that offer political humor. The AFPH scale can be used to better understand why people are drawn to this content, and allow for the effects of these types of messages to be placed in their proper context. If we assess the influence of media in a vacuum relative to the social, psychological, and contextual factors influencing media consumption, then it is inevitable that too much weight is given to media producing a wide range of effects. The only way we can gain a better understanding of political satire’s influence is to have
Brought to you by | EP IpswichAuthenticated | 10.248.254.158
Download Date | 9/17/14 8:43 PM

568 R. Lance Holbert et al.
a more fundamental knowledge of what is leading people to media messages of this kind as well.
The AFPH measure proved more versatile than originally theorized, with an alternative model consisting of just the four lower-order latent variables fitting the data best across all four data sets utilized for this study. This finding allows political communication researchers to employ the four AFPH dimensions as sep-arate entities or to use any one single dimension (e.g., incongruency) in a given research effort. There may be instances when researchers would feel compelled by their theoretical arguments to posit potentially unique or even competing in-fluences for the various AFPH dimensions on a given political outcome. In addi-tion, there may be a specific AFPH dimension that fits particularly well with the study of certain types of humor. For example, the superiority dimension may be particularly appropriate when analyzing content that employs sarcasm. Sarcasm in a political context is common to segments of The Daily Show, and The Rachel Maddow Show is another program where sarcasm can be used quite heavily at times. Alternately, the incongruity dimension could align with media content such as the Hardball Sideshow segment of Hardball with Chris Matthews, which humorously offers specific instances when our political actions often do not match well with our values. These are just a few examples of how distinct AFPH dimensions may be of specific interest to the study of unique pieces of political content in the media environment.
The social cohesion dimension may be of particular interest for the study of new media or social media (e.g., Facebook, LinkedIn) – many political enter-tainment programs have Facebook groups for fans or encourage viewers to share interests and opinions on their official websites (e.g., The Onion, The Colbert Report). The digital media environment may hold much evidence of cases in which people come together around political humor as a means through which to forge social bonds. Additionally, the anxiety reduction dimension provides in-sight into whether viewers perceive various forms of political entertainment as making political matters more palatable. Future studies could explore this di-mension in tandem with programs such as Parks and Recreation, which portrays local politics in a generally positive light and offers commentary regarding larger political themes while remaining humorous. In short, the four lower-order latent variable model fitting the data well offers researchers a tremendous degree of freedom when thinking through how best to employ the AFPH items for a specific research project.
Future work should examine who might retain proclivities for particular AFPH dimensions, or retain higher versus lower levels of AFPH in general. For ex-ample, might individuals who are more extreme in their partisanship or political ideology be strongly tied to the superiority dimension? Those who retain a deep
Brought to you by | EP IpswichAuthenticated | 10.248.254.158
Download Date | 9/17/14 8:43 PM

Affinity for political humor 569
emotional connection to politics may be appreciative of political humor used to eviscerate an opposing group. Along these same lines, might individuals who are high in need for cognition (Cacioppo and Petty 1982) or political knowledge (Eveland et al. 2005) be drawn to the incongruity dimension? The presentation of incongruent information may require a certain level of motivation or ability for it to be appreciated. As for AFPH in general, are younger citizens more likely to rate themselves higher on the AFPH scale? If so, is age as a negative predictor of AFPH reflective of a cohort or life cycle effect? If a cohort effect, what is it about today’s youth that has allowed them to be socialized to politics in a manner that brings humor more into the fold? If a life cycle effect, what leads those who are younger to ranking higher in AFPH and what leads to a gradual decline in AFPH as someone becomes older? By addressing questions of this kind, we may be in a better position to understand who is consuming political entertainment media, why they are doing so, and with what effect. It is our hope that the expanded use of the AFPH items will lead to the creation of several additional individual- difference measures that will be of particular interest to the study of entertain-ment media and politics (and politics in general).
ReferencesAbel, Millie H. 1998. Interaction of humor and gender in moderating relationships between
stress and outcomes. The Journal of Psychology 132(3). 267–276.Arkin, Herbert & Raymond R. Colton. 1963. Tables for statisticians . New York: Barnes & Noble.Attardo, Salvatore. 1997. The semantic foundations of cognitive theories of humor. Humor:
International Journal of Humor Research 10(4). 395–420. Baym, Geoffrey. 2005. The Daily Show: Discursive integration and the reinvention of political
journalism. Political Communication 22(3). 259–276.Berger, Arthur Asa & Aaron Wildavsky. 1994. Who laughs at what? Society 31(6). 82–86. Bryant, Fred B. & Paul R. Yarnold. 2001. Principle-components analysis and exploratory and
confirmatory factor analysis. In Laurence G. Grimm & Paul R. Yarnold (eds.), Reading and understanding multivariate statistics, 99–136. Washington, DC: American Psychological Association.
Cacioppo, John T. & Richard E. Petty. 1982. The need for cognition. Journal of Personality and Social Psychology 42(1). 116–131.
Cann, Arnie, Lawrence G. Calhoun & Janet S. Banks. 1997. On the role of humor appreciation in interpersonal attraction: It’s no joking matter. Humor: International Journal of Humor Research 10(1). 77–89.
Cegala, Donald J. 1981. Interaction involvement: A cognitive dimension of communicative competence. Communication Education 30(2). 109–121.
Cline, Thomas W., Moses B. Altsech & James J. Kellaris. 2003. When does humor enhance or inhibit ad response? The moderating role of need for humor. Journal of Advertising 32(3). 31–45.
Brought to you by | EP IpswichAuthenticated | 10.248.254.158
Download Date | 9/17/14 8:43 PM

570 R. Lance Holbert et al.
Dixon, Norman F. 1980. Humor: A cognitive alternative to stress. In Charles D. Spielberger & Irwin G. Sarason (eds.), Stress and anxiety (Volume 7), 281–289. Washington, DC: Hemosphere.
Duncan, W. Jack & J. Philip Feisal. 1989. No laughing matter: Patterns of humour in the workplace. Organizational Dynamics 17(4). 18–30.
Eveland, William P., Andrew F. Hayes, Dhavan V. Shah, and Nojin Kwak. 2005. Understanding the relationship between communication and political knowledge: A model comparison approach using panel data. Political Communication 22(4). 423–446.
Fox, Julia R., Glory Koloen & Volkan Sahin. 2007. No joke: A comparison of substance in The Daily Show with Jon Stewart and broadcast network television coverage of the 2004 presidential election campaign . Journal of Broadcasting & Electronic Media 51(2). 213–227.
Grammer, Karl. 1990. Strangers meet: Laughter and nonverbal signs of interest in opposite-sex encounters. Journal of Nonverbal Behavior 14(4). 209–236.
Highet, Gilbert.1962. The anatomy of satire . Princeton, NJ: Princeton University Press. Hmielowski, Jay, R. Lance Holbert & Janey Lee. 2011. Predicting the consumption of political TV
satire: Affinity for political humor, The Daily Show , and The Colbert Report . Communication Monographs 78(1). 96–114.
Holbert, R. Lance, Jennifer L. Lambe, Anthony D. Dudo, and Kristen A. Carlton. 2007. Primacy effects of The Daily Show and national news viewing: Young viewers, political gratification, and internal political self-efficacy. Journal of Broadcasting & Electronic Media 51(1). 20–38.
Holbert, R. Lance & Michael T. Stephenson. 2002. Structural equation modeling in the communication sciences, 1995–2000. Human Communication Research 28(4). 531–551.
Hu, Li-tze & Peter M. Bentler. 1999. Cutoff criteria for fit indexes in covariance structure analysis: Conventional criteria versus new alternatives. Structural Equation Modeling 6(1). 1–55.
Knight, Charles A. 2004. The literature of satire . New York: Cambridge University Press. LaMarre, Heather L., Kristen D. Landreville & Michael A. Beam. 2009. The irony of satire:
Political ideology and the motivation to see what you want to see in The Colbert Report. International Journal of Press/Politics 14(2). 212–231.
Martin, Rod A. & Herbert M. Lefcourt. 1983. Sense of humor as a moderator of the relation between stressors and moods. Journal of Personality and Social Psychology 45(6). 1313–1324.
Martin, Rod A., Nicholas A. Kuiper, L. Joan Olinger & Kathryn A. Dance. 1993. Humor, coping with stress, self-concept, and psychological well-being. Humor: International Journal of Humor Research 6(1). 89–104.
Meyer, John C. 2000. Humor as a double-edged sword: Four functions of humor in communication. Communication Theory 10(3). 310–331.
Muliak, Stanley A. 2004. Objectivity in science and structural equation modeling. In David Kaplan (ed.), The SAGE handbook of quantitative methodology for the social sciences , 425–446. Thousand Oaks, CA: Sage.
Schumacker, Randall E. & Richard G. Lomax. 2004. A beginner’s guide to structural equation modeling (2nd edn). Mahwah, NJ: Lawrence Erlbaum.
Svebak, Sven. 1974. Revised questionnaire on the sense of humor. Scandinavian Journal of Psychology 15(1). 328–331.
Thorson, James A. & F. C. Powell. 1993. Development and validation of a multidimensional sense of humor scale. Journal of Clinical Psychology 49(1). 13–23.
Brought to you by | EP IpswichAuthenticated | 10.248.254.158
Download Date | 9/17/14 8:43 PM
Affinity for political humor 571
Young, Dannagal G. 2008. The privileged role of the late-night joke: Exploring humor’s role in disrupting argument scrutiny. Media Psychology 11(2). 119–142.
Young, Dannagal G. & Russell M. Tisinger. 2006. Dispelling late-night myths: News consumption among late-night comedy viewers and the predictors of exposure to various late-night shows. Harvard International Journal of Press-Politics 11(3). 113–134.
Yovetich, Nancy A., J. Alexander Dale & Mary A. Hudak. 1990. Benefits of humor in reduction of threat-induced anxiety. Psychological Reports 66(1). 51–58.
Zillmann, Dolf. 2000. Humor and comedy. In Dolf Zilllmann and Peter Vorderer (eds.), Media entertainment: The psychology of its appeal , 37–57. Mahwah, NJ: Lawrence Erlbaum Associates.
Ziv, Avner. 1984. Personality and sense of humor . New York, NY: Singer Publishing Company.
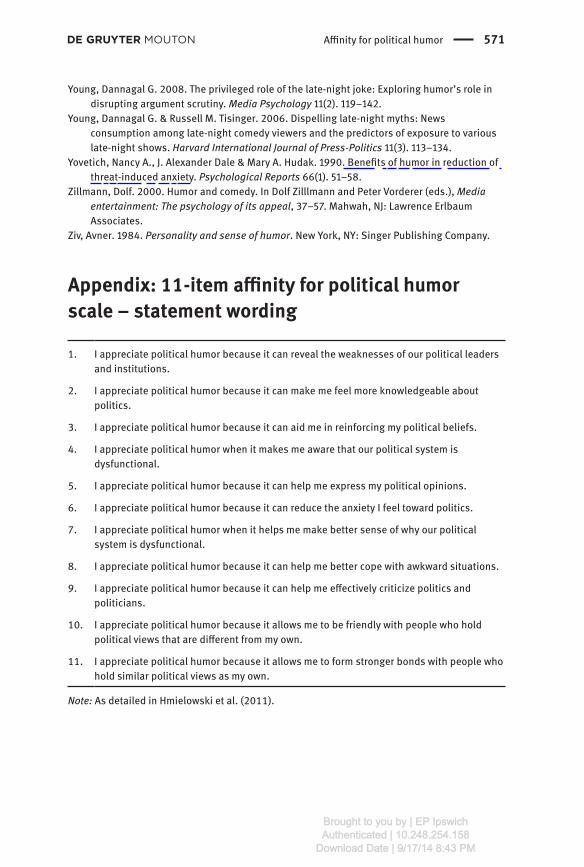
Appendix: 11-item affinity for political humor scale – statement wording
1. I appreciate political humor because it can reveal the weaknesses of our political leaders and institutions.
2. I appreciate political humor because it can make me feel more knowledgeable about politics.
3. I appreciate political humor because it can aid me in reinforcing my political beliefs.
4. I appreciate political humor when it makes me aware that our political system is dysfunctional.
5. I appreciate political humor because it can help me express my political opinions.
6. I appreciate political humor because it can reduce the anxiety I feel toward politics.
7. I appreciate political humor when it helps me make better sense of why our political system is dysfunctional.
8. I appreciate political humor because it can help me better cope with awkward situations.
9. I appreciate political humor because it can help me effectively criticize politics and politicians.
10. I appreciate political humor because it allows me to be friendly with people who hold political views that are different from my own.
11. I appreciate political humor because it allows me to form stronger bonds with people who hold similar political views as my own.
Note: As detailed in Hmielowski et al. (2011).
Brought to you by | EP IpswichAuthenticated | 10.248.254.158
Download Date | 9/17/14 8:43 PM

572 R. Lance Holbert et al.
BionotesR. Lance Holbert (PhD, University of Wisconsin-Madison, 2000), Associate Profes-sor, School of Communication, The Ohio State University.
Jayeon Lee (MA, University of Texas-Austin, 2008) and Sarah Esralew (BA, Univer-sity of Delaware, 2010) are graduate students in the same unit.
Whitney O. Walther (MA, The Ohio State University, 2011), doctoral student, School of Journalism & Mass Communication, University of Minnesota.
Jay D. Hmielowski (PhD, The Ohio State University, 2011), Assistant Professor, De-partment of Communication, University of Arizona.
Kristen D. Landreville (PhD, The Ohio State University, 2010), Assistant Professor, Department of Communication and Journalism, University of Wyoming.
Brought to you by | EP IpswichAuthenticated | 10.248.254.158
Download Date | 9/17/14 8:43 PM

Copyright of Humor: International Journal of Humor Research is the property of De Gruyterand its content may not be copied or emailed to multiple sites or posted to a listserv withoutthe copyright holder's express written permission. However, users may print, download, oremail articles for individual use.